Table of Contents
UNITED STATES
SECURITIES AND EXCHANGE COMMISSION
Washington, D.C. 20549
FORM N-CSR
CERTIFIED SHAREHOLDER REPORT OF
REGISTERED MANAGEMENT INVESTMENT COMPANIES
Investment Company Act file number 811-03732
MFS VARIABLE INSURANCE TRUST II
(Exact name of registrant as specified in charter)
500 Boylston Street, Boston, Massachusetts 02116
(Address of principal executive offices) (Zip code)
Susan S. Newton
Massachusetts Financial Services Company
500 Boylston Street
Boston, Massachusetts 02116
(Name and address of agents for service)
Registrant’s telephone number, including area code: (617) 954-5000
Date of fiscal year end: December 31
Date of reporting period: December 31, 2011
Table of Contents
| ITEM 1. | REPORTS TO STOCKHOLDERS. |
Table of Contents

MFS® International Growth Portfolio
MFS® Variable Insurance Trust II

ANNUAL REPORT
December 31, 2011
FCI-ANN
Table of Contents
MFS® INTERNATIONAL GROWTH PORTFOLIO
The report is prepared for the general information of contract owners.
It is authorized for distribution to prospective investors only when preceded or accompanied by a current prospectus.
NOT FDIC INSURED Ÿ MAY LOSE VALUE Ÿ NO BANK OR CREDIT UNION GUARANTEE Ÿ NOT A DEPOSIT Ÿ NOT INSURED BY ANY FEDERAL GOVERNMENT AGENCY OR NCUA/NCUSIF
Table of Contents
MFS International Growth Portfolio
LETTER FROM THE CHAIRMAN AND CEO

Dear Contract Owners:
We are indeed living through some volatile times. Economic uncertainty is everywhere, as it seems no place in the world has been unmoved by crisis. We have seen a devastating earthquake and tsunami that have led to disruptions in the Japanese markets
and supply chains. Protests have changed the face of the Middle East and left in their wake lingering tensions and resultant higher oil prices. We have seen debt limits tested in Europe and the United States and policymakers grappling to craft often unpopular monetary and fiscal responses at a time when consumers and businesses struggle with what appears to be a slowing global economy. On top of all of that, we have seen long-term U.S. debt lose its Standard & Poor’s AAA rating and the long-term debt ratings of 15 eurozone nations put on negative watch.
When markets become volatile, managing risk becomes a top priority for investors and their advisors. At MFS® risk management is foremost in our minds in all market climates. Our analysts and portfolio managers keep risks firmly in mind when evaluating securities. Additionally, we have a team of quantitative analysts that measures and assesses the risk profiles of our portfolios and securities on an ongoing basis. The chief investment risk officer, who oversees the team, reports directly to the firm’s president and chief investment officer so the risk associated with each portfolio can be assessed objectively and independently of the portfolio management team.
As always, we continue to be mindful of the many economic challenges faced at the local, national, and international levels. It is in times such as these that we want to remind investors of the merits of maintaining a long-term view, adhering to basic investing principles such as asset allocation and diversification, and working closely with their advisors to research and identify appropriate investment opportunities.
Respectfully,

Robert J. Manning
Chairman and Chief Executive Officer
MFS Investment Management®
February 15, 2012
The opinions expressed in this letter are subject to change, may not be relied upon for investment advice, and no forecasts can be guaranteed.
1
Table of Contents
MFS International Growth Portfolio
Portfolio structure

| Top ten holdings | ||||
| Groupe Danone | 2.7% | |||
| LVMH Moet Hennessy Louis Vuitton S.A. | 2.6% | |||
| Linde AG | 2.3% | |||
| Taiwan Semiconductor Manufacturing Co. Ltd., ADR | 2.1% | |||
| Compass Group PLC | 2.0% | |||
| Diageo PLC | 1.8% | |||
| BHP Billiton Ltd. | 1.8% | |||
| ASML Holding N.V. | 1.8% | |||
| Uni-Charm Corp. | 1.8% | |||
| Reckitt Benckiser Group PLC | 1.7% | |||
| Equity sectors | ||||
| Consumer Staples | 14.1% | |||
| Basic Materials | 11.6% | |||
| Retailing | 11.3% | |||
| Technology | 11.2% | |||
| Financial Services | 10.9% | |||
| Health Care | 10.7% | |||
| Special Products & Services | 7.6% | |||
| Industrial Goods & Services | 6.4% | |||
| Energy | 5.3% | |||
| Transportation | 3.6% | |||
| Utilities & Communications | 2.9% | |||
| Autos & Housing | 2.1% | |||
| Leisure | 1.4% | |||
| Issuer country weightings (x) | ||||
| France | 15.3% | |||
| United Kingdom | 14.8% | |||
| Switzerland | 10.7% | |||
| Japan | 9.4% | |||
| Germany | 8.7% | |||
| Netherlands | 4.5% | |||
| Brazil | 4.5% | |||
| Australia | 4.1% | |||
| Israel | 2.9% | |||
| Other Countries | 25.1% | |||
| Currency exposure weightings (y) | ||||
| Euro | 30.7% | |||
| British Pound Sterling | 14.8% | |||
| United States Dollar | 11.5% | |||
| Swiss Franc | 10.7% | |||
| Japanese Yen | 9.4% | |||
| Hong Kong Dollar | 4.2% | |||
| Australian Dollar | 4.1% | |||
| Brazilian Real | 3.5% | |||
| Taiwan Dollar | 2.1% | |||
| Other Currencies | 9.0% | |||
| (x) | Represents the portfolio’s exposure to issuer countries as a percentage of a portfolio’s total net assets. |
| (y) | Represents the portfolio’s exposure to a particular currency as a percentage of a portfolio’s total net assets. |
Percentages are based on net assets as of 12/31/11.
The portfolio is actively managed and current holdings may be different.
2
Table of Contents
MFS International Growth Portfolio
Summary of Results
For the twelve months ended December 31, 2011, Initial Class shares of the MFS International Growth Portfolio (the “fund”) provided a total return of –10.89%, while Service Class shares of the fund provided a total return of –11.11%. These compare with a return of –13.93% for the fund’s benchmark, the Morgan Stanley Capital International (MSCI) All Country World (ex-U.S.) Growth Index.
Market Environment
Early in the period, the U.S. Federal Reserve (the “Fed”) responded to weak economic growth by loosening monetary policy further. More easing by the Fed improved market sentiment and drove risk-asset prices markedly higher. The December 2010 agreement on a surprisingly large (relative to expectations) expansionary U.S. fiscal package also boosted sentiment. During the subsequent several months, the renewed positive market sentiment, coupled with better indications of global macroeconomic activity, pushed many asset valuations to post-crisis highs. At the same time, the yields of the perceived “safest” global sovereign credits rose, indicating a renewed risk-seeking environment.
However, towards the middle of the period, a weakening macroeconomic backdrop and renewed concerns over peripheral euro zone sovereign debt caused a flight-to-quality move that pushed high-quality sovereign bond yields lower. In the U.S., concerns about sovereign debt default and the long-term sustainability of the trend in U.S. fiscal policy resulted in one agency downgrading U.S. credit quality. Amidst this turmoil, global equity markets declined sharply. As a result of these developments, global consumer and producer sentiment indicators fell precipitously and highly-rated sovereign bond yields hit multi-decade lows. Towards the end of the reporting period, uncertainty in financial markets spiked higher as markets more seriously contemplated the possible failure of the euro zone.
Contributors to Performance
A combination of stock selection and an underweight position in the basic materials sector was a primary driver of performance relative to the MSCI All Country World (ex-U.S.) Growth Index. Holdings of strong-performing mining company Iluka Resources (Australia) benefited relative results over the reporting period.
Stock selection in the technology and industrial goods & services sectors was another factor that aided relative performance. Within the technology sector, the fund’s holdings of semiconductor manufacturer Taiwan Semiconductor (Taiwan) and software solutions and consulting services provider Dassault Systems (France) boosted relative returns. Shares of Taiwan Semiconductor rallied as the company forecast higher-than-anticipated sales projections for the fourth quarter. There were no individual stocks within the industrial goods & services sector that were among the fund’s top relative contributors.
Stocks in other sectors that benefited relative performance included Hong Kong-based telecommunications service provider China Unicom (Hong Kong) Ltd., global consulting and outsourcing company Accenture (b), personal care products maker Uni-Charm (Japan), catering company Compass Group (United Kingdom), fashion distributor Industria de Diseno Textil S.A. (Spain), financial services company Credicorp (b) (Peru), and alcoholic beverage producer Diageo (United Kingdom). Shares of Diageo appreciated significantly in the second half of 2011 after management reported a 5% increase in full-year operating profit and forecasted a medium-term goal of 6% organic revenue growth.
Detractors from Performance
Stock selection and, to a lesser extent, an underweight position in the consumer staples sector hindered relative performance. Not holding shares of strong-performing tobacco company British American Tobacco (United Kingdom) and global consumer products provider Unilever (United Kingdom) detracted from relative results.
Security selection in the autos & housing sector also weakened relative performance. There were no securities within this sector that were among the fund’s top relative detractors for the reporting period.
Elsewhere, holdings of Brazilian financial services firm Banco Santander (Brasil), Austrian financial services company Erste Group Bank (h), diversified mining company Teck Resources (h) (Canada), information technology products and electronics maker Acer (h) (Taiwan), financial services firm Credit Suisse (b) (Switzerland), recruiting firm Michael Page (b) (United Kingdom), recruitment and human resources provider Hays (b)(h) (United Kingdom), and banking services firm Akbank T.A.S (h) (Turkey) held back relative results. Shares of Erste Group Bank declined in the second part of the reporting period due, in part, to investors’ concerns about the bank’s exposure to European sovereign debt as well as the bank’s potential losses on non-performing loans issued to Hungarian borrowers.
3
Table of Contents
MFS International Growth Portfolio
Management Review – continued
During the reporting period, the fund’s currency exposure, resulting primarily from holdings of foreign currency denominated securities, was a detractor from relative performance. All of MFS’ investment decisions are driven by the fundamentals of each individual opportunity and as such, it is common for our portfolios to have different currency exposure than the benchmark.
Respecfully,
David Antonelli
Portfolio Manager
| (b) | Security is not a benchmark constituent. |
| (h) | Security was not held in the fund at period end. |
The views expressed in this report are those of the portfolio manager only through the end of the period of the report as stated on the cover and do not necessarily reflect the views of MFS or any other person in the MFS organization. These views are subject to change at any time based on market or other conditions, and MFS disclaims any responsibility to update such views. These views may not be relied upon as investment advice or an indication of trading intent on behalf of any MFS portfolio. References to specific securities are not recommendations of such securities, and may not be representative of any MFS portfolio’s current or future investments.
4
Table of Contents
MFS International Growth Portfolio
PERFORMANCE SUMMARY THROUGH 12/31/11
The following chart illustrates the historical performance of the fund in comparison to its benchmark(s). Benchmarks are unmanaged and may not be invested in directly. Benchmark returns do not reflect any fees or expenses. The performance of other share classes will be greater than or less than that of the class depicted below. (See Notes to Performance Summary.)
Performance data shown represents past performance and is no guarantee of future results. Investment return and principal value fluctuate so your units, when sold, may be worth more or less than the original cost; current performance may be lower or higher than quoted. The performance shown does not reflect the deduction of taxes, if any, that a contract holder would pay on fund distributions or the redemption of contract units. The returns for the fund shown also do not reflect the deduction of expenses associated with variable products, such as mortality and expense risk charges, separate account charges, and sales charges imposed by the insurance company separate accounts. Such expenses would reduce the overall returns shown.
Growth of a Hypothetical $10,000 Investment
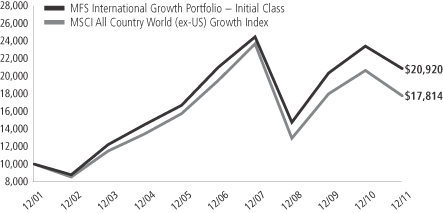
Total Returns through 12/31/11
Average annual total returns
| Share class | Class inception date | 1-yr | 5-yr | 10-yr | ||||||||
| Initial Class | 6/03/96 | (10.89)% | (0.12)% | 7.66% | ||||||||
| Service Class | 8/24/01 | (11.11)% | (0.38)% | 7.40% | ||||||||
| Comparative benchmark | ||||||||||||
| MSCI All Country World (ex-US) Growth Index (f) | (13.93)% | (1.84)% | 5.94% | |||||||||
| (f) | Source: FactSet Research Systems Inc. |
Benchmark Definition
MSCI All Country World (ex-US) Growth Index – a market capitalization-weighted index that is designed to measure equity market performance for growth securities in the global developed and emerging markets, excluding the U.S.
It is not possible to invest directly in an index.
Notes to Performance Summary
Average annual total return represents the average annual change in value for each share class for the periods presented.
Performance results reflect any applicable expense subsidies and waivers in effect during the periods shown. Without such subsidies and waivers the fund’s performance results would be less favorable. Please see the prospectus and financial statements for complete details. All results are historical and assume the reinvestment of any dividends and capital gains distributions.
Performance results do not include adjustments made for financial reporting purposes in accordance with U.S. generally accepted accounting principles and may differ from amounts reported in the financial highlights.
From time to time the fund may receive proceeds from litigation settlements, without which performance would be lower.
5
Table of Contents
MFS International Growth Portfolio
Fund Expenses Borne by the Contract Holders During the Period,
July 1, 2011 through December 31, 2011
As a contract holder of the fund, you incur ongoing costs, including management fees; distribution and/or service (12b-1) fees; and other fund expenses. This example is intended to help you understand your ongoing costs (in dollars) of investing in the fund and to compare these costs with the ongoing costs of investing in other mutual funds.
The example is based on an investment of $1,000 invested at the beginning of the period and held for the entire period July 1, 2011 through December 31, 2011.
Actual Expenses
The first line for each share class in the following table provides information about actual account values and actual expenses. You may use the information in this line, together with the amount you invested, to estimate the expenses that you paid over the period. Simply divide your account value by $1,000 (for example, an $8,600 account value divided by $1,000 = 8.6), then multiply the result by the number in the first line under the heading entitled “Expenses Paid During Period” to estimate the expenses you paid on your account during this period.
Hypothetical Example for Comparison Purposes
The second line for each share class in the following table provides information about hypothetical account values and hypothetical expenses based on the fund’s actual expense ratio and an assumed rate of return of 5% per year before expenses, which is not the fund’s actual return. The hypothetical account values and expenses may not be used to estimate the actual ending account balance or expenses you paid for the period. You may use this information to compare the ongoing costs of investing in the fund and other funds. To do so, compare this 5% hypothetical example with the 5% hypothetical examples that appear in the shareholder reports of the other funds.
Please note that the expenses shown in the table are meant to highlight the fund’s ongoing costs only and do not take into account the fees and expenses imposed under the variable contracts through which your investment in the fund is made. Therefore, the second line for each share class in the table is useful in comparing ongoing costs associated with an investment in vehicles (such as the fund) which fund benefits under variable annuity and variable life insurance contracts and to qualified pension and retirement plans only, and will not help you determine the relative total costs of investing in the fund through variable annuity and variable life insurance contracts. If the fees and expenses imposed under the variable contracts were included, your costs would have been higher.
| Share Class | Annualized Expense Ratio | Beginning Account Value 7/01/11 | Ending Account Value | Expenses Paid During Period (p) 7/01/11-12/31/11 | ||||||||||||||
| Initial Class | Actual | 1.06% | $1,000.00 | $852.29 | $4.95 | |||||||||||||
| Hypothetical (h) | 1.06% | $1,000.00 | $1,019.86 | $5.40 | ||||||||||||||
| Service Class | Actual | 1.31% | $1,000.00 | $851.14 | $6.11 | |||||||||||||
| Hypothetical (h) | 1.31% | $1,000.00 | $1,018.60 | $6.67 | ||||||||||||||
| (h) | 5% class return per year before expenses. |
| (p) | Expenses paid is equal to each class’ annualized expense ratio, as shown above, multiplied by the average account value over the period, multiplied by the number of days in the period, divided by the number of days in the year. |
6
Table of Contents
MFS International Growth Portfolio
PORTFOLIO OF INVESTMENTS – 12/31/11
The Portfolio of Investments is a complete list of all securities owned by your fund. It is categorized by broad-based asset classes.
| Issuer | Shares/Par | Value ($) | ||||||
| COMMON STOCKS – 99.1% | ||||||||
| Airlines – 1.0% | ||||||||
| Copa Holdings S.A., “A” | 36,060 | $ | 2,115,640 | |||||
|
| |||||||
| Alcoholic Beverages – 5.7% | ||||||||
| Carlsberg A.S., “B” | 26,923 | $ | 1,898,528 | |||||
| Diageo PLC | 181,120 | 3,956,194 | ||||||
| Heineken N.V. | 68,694 | 3,171,288 | ||||||
| Pernod Ricard S.A. | 36,645 | 3,391,716 | ||||||
|
| |||||||
| $ | 12,417,726 | |||||||
|
| |||||||
| Apparel Manufacturers – 5.3% | ||||||||
| Compagnie Financiere Richemont S.A. | 38,612 | $ | 1,944,217 | |||||
| Li & Fung Ltd. | 1,553,200 | 2,875,778 | ||||||
| LVMH Moet Hennessy Louis Vuitton S.A. | 40,398 | 5,691,616 | ||||||
| Swatch Group Ltd. | 2,770 | 1,032,052 | ||||||
|
| |||||||
| $ | 11,543,663 | |||||||
|
| |||||||
| Automotive – 1.7% | ||||||||
| Bayerische Motoren Werke AG | 32,464 | $ | 2,170,388 | |||||
| Honda Motor Co. Ltd. | 47,800 | 1,458,158 | ||||||
|
| |||||||
| $ | 3,628,546 | |||||||
|
| |||||||
| Broadcasting – 1.4% | ||||||||
| Publicis Groupe S.A. | 67,215 | $ | 3,084,811 | |||||
|
| |||||||
| Brokerage & Asset Managers – 0.8% | ||||||||
| Aberdeen Asset Management PLC | 371,098 | $ | 1,217,440 | |||||
| BM&F Bovespa S.A. | 117,100 | 615,242 | ||||||
|
| |||||||
| $ | 1,832,682 | |||||||
|
| |||||||
| Business Services – 7.6% | ||||||||
| Accenture PLC, “A” | 58,290 | $ | 3,102,777 | |||||
| Amadeus IT Holding S.A. | 89,876 | 1,451,900 | ||||||
| Capita Group PLC | 185,657 | 1,812,125 | ||||||
| Compass Group PLC | 463,980 | 4,393,157 | ||||||
| Experian Group Ltd. | 110,183 | 1,498,105 | ||||||
| Intertek Group PLC | 68,684 | 2,162,399 | ||||||
| LPS Brasil – Consultoria de Imoveis S.A. | 40,300 | 561,748 | ||||||
| Michael Page International PLC | 268,967 | 1,451,968 | ||||||
|
| |||||||
| $ | 16,434,179 | |||||||
|
| |||||||
| Computer Software – 3.6% | ||||||||
| Check Point Software Technologies Ltd. (a) | 39,030 | $ | 2,050,636 | |||||
| Dassault Systems S.A. | 41,602 | 3,334,522 | ||||||
| SAP AG | 46,466 | 2,456,663 | ||||||
|
| |||||||
| $ | 7,841,821 | |||||||
|
| |||||||
| Computer Software – Systems – 1.0% | ||||||||
| NICE Systems Ltd., ADR (a) | 62,850 | $ | 2,165,183 | |||||
|
| |||||||
| Construction – 0.4% | ||||||||
| Bellway PLC | 79,483 | $ | 879,489 | |||||
|
| |||||||
| Consumer Products – 3.5% | ||||||||
| Reckitt Benckiser Group PLC | 76,770 | $ | 3,783,098 | |||||
| Uni-Charm Corp. | 77,200 | 3,806,340 | ||||||
|
| |||||||
| $ | 7,589,438 | |||||||
|
| |||||||
| Issuer | Shares/Par | Value ($) | ||||||
| COMMON STOCKS – continued | ||||||||
| Electrical Equipment – 3.1% | ||||||||
| Legrand S.A. | 108,048 | $ | 3,461,368 | |||||
| Schneider Electric S.A. | 60,924 | 3,183,938 | ||||||
|
| |||||||
| $ | 6,645,306 | |||||||
|
| |||||||
| Electronics – 5.9% | ||||||||
| ASML Holding N.V. | 92,250 | $ | 3,855,128 | |||||
| Infineon Technologies AG | 230,869 | 1,737,834 | ||||||
| Samsung Electronics Co. Ltd. | 2,683 | 2,464,075 | ||||||
| Taiwan Semiconductor Manufacturing Co. Ltd., ADR | 359,180 | 4,637,014 | ||||||
|
| |||||||
| $ | 12,694,051 | |||||||
|
| |||||||
| Energy – Independent – 1.5% | ||||||||
| CNOOC Ltd. | 989,000 | $ | 1,729,279 | |||||
| INPEX Corp. | 241 | 1,518,579 | ||||||
|
| |||||||
| $ | 3,247,858 | |||||||
|
| |||||||
| Energy – Integrated – 2.8% | ||||||||
| BG Group PLC | 125,034 | $ | 2,666,640 | |||||
| OAO Gazprom, ADR | 161,540 | 1,722,016 | ||||||
| Suncor Energy, Inc. | 60,163 | 1,735,057 | ||||||
|
| |||||||
| $ | 6,123,713 | |||||||
|
| |||||||
| Engineering – Construction – 1.1% | ||||||||
| JGC Corp. | 101,000 | $ | 2,424,945 | |||||
|
| |||||||
| Food & Beverages – 4.4% | ||||||||
| Groupe Danone | 93,341 | $ | 5,867,578 | |||||
| Nestle S.A. | 65,883 | 3,782,528 | ||||||
|
| |||||||
| $ | 9,650,106 | |||||||
|
| |||||||
| Food & Drug Stores – 3.3% | ||||||||
| Dairy Farm International Holdings Ltd. | 194,400 | $ | 1,813,752 | |||||
| Lawson, Inc. | 39,400 | 2,459,621 | ||||||
| Tesco PLC | 449,042 | 2,813,508 | ||||||
|
| |||||||
| $ | 7,086,881 | |||||||
|
| |||||||
| General Merchandise – 0.5% | ||||||||
| Lojas Renner S.A. | 39,100 | $ | 1,014,787 | |||||
|
| |||||||
| Insurance – 0.5% | ||||||||
| AIA Group Ltd. | 359,800 | $ | 1,123,419 | |||||
|
| |||||||
| Internet – 0.7% | ||||||||
| Yahoo Japan Corp. | 4,886 | $ | 1,573,651 | |||||
|
| |||||||
| Machinery & Tools – 2.2% | ||||||||
| KONE Oyj “B” | 39,032 | $ | 2,019,013 | |||||
| Schindler Holding AG | 22,734 | 2,647,822 | ||||||
|
| |||||||
| $ | 4,666,835 | |||||||
|
| |||||||
| Major Banks – 4.7% | ||||||||
| Credit Suisse Group AG | 89,601 | $ | 2,105,285 | |||||
| HSBC Holdings PLC | 333,744 | 2,533,523 | ||||||
| Julius Baer Group Ltd. | 67,655 | 2,631,237 | ||||||
| Standard Chartered PLC | 134,630 | 2,931,234 | ||||||
|
| |||||||
| $ | 10,201,279 | |||||||
|
| |||||||
7
Table of Contents
MFS International Growth Portfolio
Portfolio of Investments – continued
| Issuer | Shares/Par | Value ($) | ||||||
| COMMON STOCKS – continued | ||||||||
| Medical & Health Technology & Services – 2.1% | ||||||||
| Diagnosticos da America S.A. | 150,200 | $ | 1,248,144 | |||||
| Fleury S.A. | 83,600 | 959,142 | ||||||
| Fresenius Medical Care AG & Co. KGaA | 34,759 | 2,361,810 | ||||||
|
| |||||||
| $ | 4,569,096 | |||||||
|
| |||||||
| Medical Equipment – 2.9% | ||||||||
| Essilor International S.A. | 30,205 | $ | 2,129,573 | |||||
| Sonova Holding AG | 34,188 | 3,576,036 | ||||||
| Synthes, Inc. (n) | 3,565 | 596,747 | ||||||
|
| |||||||
| $ | 6,302,356 | |||||||
|
| |||||||
| Metals & Mining – 3.3% | ||||||||
| BHP Billiton Ltd. | 111,521 | $ | 3,926,073 | |||||
| Iluka Resources Ltd. | 75,456 | 1,196,234 | ||||||
| Rio Tinto Ltd. | 34,712 | 2,140,858 | ||||||
|
| |||||||
| $ | 7,263,165 | |||||||
|
| |||||||
| Oil Services – 1.0% | ||||||||
| Saipem S.p.A. | 37,142 | $ | 1,569,863 | |||||
| Technip | 7,350 | 686,953 | ||||||
|
| |||||||
| $ | 2,256,816 | |||||||
|
| |||||||
| Other Banks & Diversified Financials – 4.6% | ||||||||
| Banco Santander Brasil S.A., ADR | 129,640 | $ | 1,055,270 | |||||
| Banco Santander Chile, ADR | 8,910 | 674,487 | ||||||
| Bank Rakyat Indonesia | 1,493,500 | 1,111,787 | ||||||
| China Construction Bank | 1,364,410 | 952,167 | ||||||
| Credicorp Ltd. | 22,360 | 2,447,749 | ||||||
| HDFC Bank Ltd. | 156,683 | 1,259,394 | ||||||
| Itau Unibanco Multiplo S.A., ADR | 59,520 | 1,104,691 | ||||||
| Siam Commercial Bank Co. Ltd. | 357,200 | 1,301,997 | ||||||
|
| |||||||
| $ | 9,907,542 | |||||||
|
| |||||||
| Pharmaceuticals – 5.7% | ||||||||
| Bayer AG | 45,853 | $ | 2,931,656 | |||||
| Novo Nordisk A/S, “B” | 19,785 | 2,273,623 | ||||||
| Roche Holding AG | 18,026 | 3,048,514 | ||||||
| Santen Pharmaceutical Co. Ltd. | 48,300 | 1,989,230 | ||||||
| Teva Pharmaceutical Industries Ltd., ADR | 50,140 | 2,023,650 | ||||||
|
| |||||||
| $ | 12,266,673 | |||||||
|
| |||||||
| Precious Metals & Minerals – 0.7% | ||||||||
| Newcrest Mining Ltd. | 51,854 | $ | 1,569,874 | |||||
|
| |||||||
| Railroad & Shipping – 2.6% | ||||||||
| Canadian National Railway Co. | 47,160 | $ | 3,704,890 | |||||
| Kuehne & Nagel, Inc. AG | 16,550 | 1,852,333 | ||||||
|
| |||||||
| $ | 5,557,223 | |||||||
|
| |||||||
| Real Estate – 0.3% | ||||||||
| Brasil Brokers Participacoes | 226,700 | $ | 678,186 | |||||
|
| |||||||
| Issuer | Shares/Par | Value ($) | ||||||
| COMMON STOCKS – continued | ||||||||
| Specialty Chemicals – 7.6% | ||||||||
| Akzo Nobel N.V. | 60,035 | $ | 2,888,582 | |||||
| L’Air Liquide S.A. | 18,630 | 2,304,855 | ||||||
| Linde AG | 33,229 | 4,943,614 | ||||||
| Nitto Denko Corp. | 39,000 | 1,395,427 | ||||||
| Shin-Etsu Chemical Co. Ltd. | 54,300 | 2,673,730 | ||||||
| Symrise AG | 86,402 | 2,305,848 | ||||||
|
| |||||||
| $ | 16,512,056 | |||||||
|
| |||||||
| Specialty Stores – 2.2% | ||||||||
| Hennes & Mauritz AB, “B” | 43,760 | $ | 1,404,112 | |||||
| Industria de Diseno Textil S.A. | 41,378 | 3,380,708 | ||||||
|
| |||||||
| $ | 4,784,820 | |||||||
|
| |||||||
| Telecommunications – Wireless – 1.7% | ||||||||
| MTN Group Ltd. | 65,351 | $ | 1,160,679 | |||||
| Tim Participacoes S.A., ADR | 98,590 | 2,543,622 | ||||||
|
| |||||||
| $ | 3,704,301 | |||||||
|
| |||||||
| Telephone Services – 1.2% | ||||||||
| China Unicom Ltd. | 1,196,000 | $ | 2,516,241 | |||||
|
| |||||||
| Tobacco – 0.5% | ||||||||
| Japan Tobacco, Inc. | 230 | $ | 1,081,720 | |||||
|
| |||||||
| Total Common Stocks (Identified Cost, $207,284,984) | $ | 214,956,078 | ||||||
|
| |||||||
| MONEY MARKET FUNDS – 0.8% | ||||||||
| MFS Institutional Money Market Portfolio, 0.05%, at Cost and Net Asset Value (v) | 1,785,076 | $ | 1,785,076 | |||||
|
| |||||||
| Total Investments (Identified Cost, $209,070,060) | $ | 216,741,154 | ||||||
|
| |||||||
| OTHER ASSETS, LESS LIABILITIES – 0.1% | 234,418 | |||||||
|
| |||||||
| Net Assets – 100.0% | $ | 216,975,572 | ||||||
|
| |||||||
| (a) | Non-income producing security. |
| (n) | Securities exempt from registration under Rule 144A of the Securities Act of 1933. These securities may be sold in the ordinary course of business in transactions exempt from registration, normally to qualified institutional buyers. At period end, the aggregate value of these securities was $596,747 representing 0.3% of net assets. |
| (v) | Underlying affiliated fund that is available only to investment companies managed by MFS. The rate quoted for the MFS Institutional Money Market Portfolio is the annualized seven-day yield of the fund at period end. |
The following abbreviations are used in this report and are defined:
| ADR | American Depository Receipt |
| PLC | Public Limited Company |
See Notes to Financial Statements
8
Table of Contents
MFS International Growth Portfolio
FINANCIAL STATEMENTS | STATEMENT OF ASSETS AND LIABILITIES
This statement represents your fund’s balance sheet, which details the assets and liabilities comprising the total value of the fund.
At 12/31/11 | ||||||||
Assets | ||||||||
Investments – | ||||||||
Non-affiliated issuers, at value (identified cost, $207,284,984) | $214,956,078 | |||||||
Underlying affiliated funds, at cost and value | 1,785,076 | |||||||
Total investments, at value (identified cost, $209,070,060) | $216,741,154 | |||||||
Cash | 13,021 | |||||||
Foreign currency, at value (identified cost, $2,424) | 2,424 | |||||||
Receivables for | ||||||||
Fund shares sold | 236,673 | |||||||
Interest and dividends | 258,220 | |||||||
Other assets | 6,595 | |||||||
Total assets | $217,258,087 | |||||||
Liabilities | ||||||||
Payables for | ||||||||
Investments purchased | $83,190 | |||||||
Fund shares reacquired | 79,550 | |||||||
Payable to affiliates | ||||||||
Investment adviser | 16,533 | |||||||
Shareholder servicing costs | 159 | |||||||
Distribution and/or service fees | 591 | |||||||
Payable for Trustees’ compensation | 460 | |||||||
Deferred country tax expense payable | 13,064 | |||||||
Accrued expenses and other liabilities | 88,968 | |||||||
Total liabilities | $282,515 | |||||||
Net assets | $216,975,572 | |||||||
Net assets consist of | ||||||||
Paid-in capital | $209,937,764 | |||||||
Unrealized appreciation (depreciation) on investments and translation of assets and liabilities in foreign currencies (net of $13,064 deferred country tax) | 7,652,535 | |||||||
Accumulated distributions in excess of net realized gain on investments and foreign currency transactions | (3,115,725 | ) | ||||||
Undistributed net investment income | 2,500,998 | |||||||
Net assets | $216,975,572 | |||||||
Shares of beneficial interest outstanding | 19,595,602 |
| Net assets | Shares outstanding | Net asset value per share | ||||||||||
Initial Class | $188,065,689 | 16,968,457 | $11.08 | |||||||||
Service Class | 28,909,883 | 2,627,145 | 11.00 | |||||||||
See Notes to Financial Statements
9
Table of Contents
MFS International Growth Portfolio
FINANCIAL STATEMENTS | STATEMENT OF OPERATIONS
This statement describes how much your fund earned in investment income and accrued in expenses. It also describes any gains and/or losses generated by fund operations.
Year ended 12/31/11 | ||||||||
Net investment income | ||||||||
Income | ||||||||
Dividends | $5,703,311 | |||||||
Interest | 93,315 | |||||||
Dividends from underlying affiliated funds | 4,719 | |||||||
Foreign taxes withheld | (505,469 | ) | ||||||
Total investment income | $5,295,876 | |||||||
Expenses | ||||||||
Management fee | $2,150,516 | |||||||
Distribution and/or service fees | 77,233 | |||||||
Shareholder servicing costs | 25,953 | |||||||
Administrative services fee | 79,850 | |||||||
Trustees’ compensation | 29,047 | |||||||
Custodian fee | 139,364 | |||||||
Shareholder communications | 6,831 | |||||||
Auditing fees | 55,827 | |||||||
Legal fees | 5,457 | |||||||
Miscellaneous | 37,909 | |||||||
Total expenses | $2,607,987 | |||||||
Fees paid indirectly | (27 | ) | ||||||
Net expenses | $2,607,960 | |||||||
Net investment income | $2,687,916 | |||||||
Realized and unrealized gain (loss) on investments and foreign currency transactions | ||||||||
Realized gain (loss) (identified cost basis) | ||||||||
Investment transactions (net of $6,085 country tax) | $(2,444,103 | ) | ||||||
Foreign currency transactions | (163,505 | ) | ||||||
Net realized gain (loss) on investments and foreign currency transactions | $(2,607,608 | ) | ||||||
Change in unrealized appreciation (depreciation) | ||||||||
Investments (net of $30,742 decrease in deferred country tax) | $(25,331,030 | ) | ||||||
Translation of assets and liabilities in foreign currencies | (23,831 | ) | ||||||
Net unrealized gain (loss) on investments and foreign currency translation | $(25,354,861 | ) | ||||||
Net realized and unrealized gain (loss) on investments and foreign currency | $(27,962,469 | ) | ||||||
Change in net assets from operations | $(25,274,553 | ) |
See Notes to Financial Statements
10
Table of Contents
MFS International Growth Portfolio
FINANCIAL STATEMENTS | STATEMENTS OF CHANGES IN NET ASSETS
These statements describe the increases and/or decreases in net assets resulting from operations, any distributions, and any shareholder transactions.
For years ended 12/31 | 2011 | 2010 | ||||||
Change in net assets | ||||||||
From operations | ||||||||
Net investment income | $2,687,916 | $2,797,449 | ||||||
Net realized gain (loss) on investments and foreign currency transactions | (2,607,608 | ) | 27,881,035 | |||||
Net unrealized gain (loss) on investments and foreign currency translation | (25,354,861 | ) | 7,205,823 | |||||
Change in net assets from operations | $(25,274,553 | ) | $37,884,307 | |||||
| Distributions declared to shareholders | ||||||||
From net investment income | $(2,595,452 | ) | $(1,936,143 | ) | ||||
From net realized gain on investments | (20,352,060 | ) | — | |||||
Total distributions declared to shareholders | $(22,947,512 | ) | $(1,936,143 | ) | ||||
Change in net assets from fund share transactions | $12,393,444 | $9,593,366 | ||||||
Total change in net assets | $(35,828,621 | ) | $45,541,530 | |||||
Net assets | ||||||||
At beginning of period | 252,804,193 | 207,262,663 | ||||||
At end of period (including undistributed net investment income of $2,500,998 and | $216,975,572 | $252,804,193 |
See Notes to Financial Statements
11
Table of Contents
MFS International Growth Portfolio
FINANCIAL STATEMENTS | FINANCIAL HIGHLIGHTS
The financial highlights table is intended to help you understand the fund’s financial performance for the past 5 years. Certain information reflects financial results for a single fund share. The total returns in the table represent the rate by which an investor would have earned (or lost) on an investment in the fund share class (assuming reinvestment of all distributions) held for the entire period.
| Initial Class | Years ended 12/31 | |||||||||||||||||||
| 2011 | 2010 | 2009 | 2008 | 2007 | ||||||||||||||||
Net asset value, beginning of period | $13.85 | $12.13 | $8.90 | $17.63 | $17.93 | |||||||||||||||
| Income (loss) from investment operations | ||||||||||||||||||||
Net investment income (d) | $0.15 | $0.15 | $0.14 | $0.16 | $0.21 | |||||||||||||||
Net realized and unrealized gain (loss) on investments | (1.60 | ) | 1.68 | 3.20 | (6.04 | ) | 2.57 | |||||||||||||
Total from investment operations | $(1.45 | ) | $1.83 | $3.34 | $(5.88 | ) | $2.78 | |||||||||||||
| Less distributions declared to shareholders | ||||||||||||||||||||
From net investment income | $(0.15 | ) | $(0.11 | ) | $(0.11 | ) | $(0.19 | ) | $(0.27 | ) | ||||||||||
From net realized gain on investments | (1.17 | ) | — | — | (2.66 | ) | (2.81 | ) | ||||||||||||
Total distributions declared to shareholders | $(1.32 | ) | $(0.11 | ) | $(0.11 | ) | �� | $(2.85 | ) | $(3.08 | ) | |||||||||
Net asset value, end of period (x) | $11.08 | $13.85 | $12.13 | $8.90 | $17.63 | |||||||||||||||
Total return (%) (k)(s)(x) | (10.89 | ) | 15.16 | 38.06 | (39.82 | ) | 16.58 | |||||||||||||
| Ratios (%) (to average net assets) and Supplemental data: | ||||||||||||||||||||
Expenses (f) | 1.06 | 1.09 | 1.25 | 1.22 | 1.11 | |||||||||||||||
Net investment income | 1.16 | 1.21 | 1.39 | 1.25 | 1.16 | |||||||||||||||
Portfolio turnover | 52 | 66 | 56 | 73 | 56 | |||||||||||||||
Net assets at end of period (000 omitted) | $188,066 | $221,456 | $179,925 | $87,034 | $139,633 | |||||||||||||||
| Service Class | Years ended 12/31 | |||||||||||||||||||
| 2011 | 2010 | 2009 | 2008 | 2007 | ||||||||||||||||
Net asset value, beginning of period | $13.76 | $12.06 | $8.84 | $17.53 | $17.85 | |||||||||||||||
| Income (loss) from investment operations | ||||||||||||||||||||
Net investment income (d) | $0.11 | $0.11 | $0.12 | $0.13 | $0.15 | |||||||||||||||
Net realized and unrealized gain (loss) on investments | (1.58 | ) | 1.67 | 3.18 | (6.00 | ) | 2.56 | |||||||||||||
Total from investment operations | $(1.47 | ) | $1.78 | $3.30 | $(5.87 | ) | $2.71 | |||||||||||||
| Less distributions declared to shareholders | ||||||||||||||||||||
From net investment income | $(0.12 | ) | $(0.08 | ) | $(0.08 | ) | $(0.16 | ) | $(0.22 | ) | ||||||||||
From net realized gain on investments | (1.17 | ) | — | — | (2.66 | ) | (2.81 | ) | ||||||||||||
Total distributions declared to shareholders | $(1.29 | ) | $(0.08 | ) | $(0.08 | ) | $(2.82 | ) | $(3.03 | ) | ||||||||||
Net asset value, end of period (x) | $11.00 | $13.76 | $12.06 | $8.84 | $17.53 | |||||||||||||||
Total return (%) (k)(s)(x) | (11.11 | ) | 14.86 | 37.69 | (39.96 | ) | 16.26 | |||||||||||||
| Ratios (%) (to average net assets) and Supplemental data: | ||||||||||||||||||||
Expenses (f) | 1.31 | 1.34 | 1.50 | 1.46 | 1.37 | |||||||||||||||
Net investment income | 0.89 | 0.94 | 1.17 | 1.04 | 0.85 | |||||||||||||||
Portfolio turnover | 52 | 66 | 56 | 73 | 56 | |||||||||||||||
Net assets at end of period (000 omitted) | $28,910 | $31,348 | $27,338 | $18,056 | $28,689 | |||||||||||||||
| (d) | Per share data is based on average shares outstanding. |
| (f) | Ratios do not reflect reductions from fees paid indirectly, if applicable. |
| (k) | The total return does not reflect expenses that apply to separate accounts. Inclusion of these charges would reduce the total return figures for all periods shown. |
| (s) | From time to time the fund may receive proceeds from litigation settlements, without which performance would be lower. |
| (x) | The net asset values per share and total returns have been calculated on net assets which include adjustments made in accordance with U.S. generally accepted accounting principles required at period end for financial reporting purposes. |
See Notes to Financial Statements
12
Table of Contents
MFS International Growth Portfolio
| (1) | Business and Organization |
MFS International Growth Portfolio (the fund) is a series of MFS Variable Insurance Trust II (the trust). The trust is organized as a Massachusetts business trust and is registered under the Investment Company Act of 1940, as amended, as an open-end management investment company. The shareholders of each series of the trust are separate accounts of insurance companies, which offer variable annuity and/or life insurance products, and qualified retirement and pension plans.
| (2) | Significant Accounting Policies |
General – The preparation of financial statements in conformity with U.S. generally accepted accounting principles requires management to make estimates and assumptions that affect the reported amounts of assets and liabilities, and disclosure of contingent assets and liabilities at the date of the financial statements and the reported amounts of revenues and expenses during the reporting period. Actual results could differ from those estimates. In the preparation of these financial statements, management has evaluated subsequent events occurring after the date of the fund’s Statement of Assets and Liabilities through the date that the financial statements were issued. The fund invests in foreign securities, including securities of emerging market issuers. Investments in foreign securities are vulnerable to the effects of changes in the relative values of the local currency and the U.S. dollar and to the effects of changes in each country’s legal, political, and economic environment. The markets of emerging markets countries are generally more volatile than the markets of developed countries with more mature economies. All of the risks of investing in foreign securities previously described are heightened when investing in emerging markets countries.
In December 2011, the Financial Accounting Standards Board issued Accounting Standards Update 2011-11, Balance Sheet (Topic 210) – Disclosures about Offsetting Assets and Liabilities (“ASU 2011-11”). Effective for annual reporting periods beginning on or after January 1, 2013 and interim periods within those annual periods, ASU 2011-11 is intended to enhance disclosure requirements on the offsetting of financial assets and liabilities. Although still evaluating the potential impacts of ASU 2011-11 to the fund, management expects that the impact of the fund’s adoption will be limited to additional financial statement disclosures.
Investment Valuations – Equity securities, including restricted equity securities, are generally valued at the last sale or official closing price as provided by a third-party pricing service on the market or exchange on which they are primarily traded. Equity securities, for which there were no sales reported that day, are generally valued at the last quoted daily bid quotation as provided by a third-party pricing service on the market or exchange on which such securities are primarily traded. Equity securities held short, for which there were no sales reported for that day, are generally valued at the last quoted daily ask quotation as provided by a third-party pricing service on the market or exchange on which such securities are primarily traded. Short-term instruments with a maturity at issuance of 60 days or less generally are valued at amortized cost, which approximates market value. Open-end investment companies are generally valued at net asset value per share. Securities and other assets generally valued on the basis of information from a third-party pricing service may also be valued at a broker/dealer bid quotation. Values obtained from third-party pricing services can utilize both transaction data and market information such as yield, quality, coupon rate, maturity, type of issue, trading characteristics, and other market data. The values of foreign securities and other assets and liabilities expressed in foreign currencies are converted to U.S. dollars using the mean of bid and asked prices for rates provided by a third-party pricing service.
The Board of Trustees has delegated primary responsibility for determining or causing to be determined the value of the fund’s investments (including any fair valuation) to the adviser pursuant to valuation policies and procedures approved by the Board. If the adviser determines that reliable market quotations are not readily available, investments are valued at fair value as determined in good faith by the adviser in accordance with such procedures under the oversight of the Board of Trustees. Under the fund’s valuation policies and procedures, market quotations are not considered to be readily available for most types of debt instruments and floating rate loans and many types of derivatives. These investments are generally valued at fair value based on information from third-party pricing services. In addition, investments may be valued at fair value if the adviser determines that an investment’s value has been materially affected by events occurring after the close of the exchange or market on which the investment is principally traded (such as foreign exchange or market) and prior to the determination of the fund’s net asset value, or after the halting of trading of a specific security where trading does not resume prior to the close of the exchange or market on which the security is principally traded. Events that occur on a frequent basis after foreign markets close (such as developments in foreign markets and significant movements in the U.S. markets) and prior to the determination of the fund’s net asset value may be deemed to have a material effect on the value of securities traded in foreign markets. Accordingly, the fund’s foreign equity securities may often be valued at fair value. The adviser generally relies on third-party pricing services or other information (such as the correlation with price movements of similar securities in the same or other markets; the type, cost and investment characteristics of the security; the business and financial condition of the
13
Table of Contents
MFS International Growth Portfolio
Notes to Financial Statements – continued
issuer; and trading and other market data) to assist in determining whether to fair value and at what value to fair value an investment. The value of an investment for purposes of calculating the fund’s net asset value can differ depending on the source and method used to determine value. When fair valuation is used, the value of an investment used to determine the fund’s net asset value may differ from quoted or published prices for the same investment. There can be no assurance that the fund could obtain the fair value assigned to an investment if it were to sell the investment at the same time at which the fund determines its net asset value per share.
Various inputs are used in determining the value of the fund’s assets or liabilities. These inputs are categorized into three broad levels. In certain cases, the inputs used to measure fair value may fall into different levels of the fair value hierarchy. In such cases, an investment’s level within the fair value hierarchy is based on the lowest level of input that is significant to the fair value measurement. The fund’s assessment of the significance of a particular input to the fair value measurement in its entirety requires judgment, and considers factors specific to the investment. Level 1 includes unadjusted quoted prices in active markets for identical assets or liabilities. Level 2 includes other significant observable market-based inputs (including quoted prices for similar securities, interest rates, prepayment speed, and credit risk). Level 3 includes unobservable inputs, which may include the adviser’s own assumptions in determining the fair value of investments. The following is a summary of the levels used as of December 31, 2011 in valuing the fund’s assets or liabilities:
| Investments at Value | Level 1 | Level 2 | Level 3 | Total | ||||||||||||
| Equity Securities: | ||||||||||||||||
France | $11,506,955 | $21,629,976 | $— | $33,136,931 | ||||||||||||
United Kingdom | 10,959,421 | 21,139,458 | — | 32,098,879 | ||||||||||||
Switzerland | 8,329,144 | 14,887,628 | — | 23,216,772 | ||||||||||||
Japan | 20,381,400 | — | — | 20,381,400 | ||||||||||||
Germany | 16,737,426 | 2,170,388 | — | 18,907,814 | ||||||||||||
Netherlands | 3,855,128 | 6,059,870 | — | 9,914,998 | ||||||||||||
Brazil | 9,780,831 | — | — | 9,780,831 | ||||||||||||
Australia | 8,833,039 | — | — | 8,833,039 | ||||||||||||
Israel | 6,239,469 | — | — | 6,239,469 | ||||||||||||
Other Countries | 41,459,669 | 10,986,276 | — | 52,445,945 | ||||||||||||
| Mutual Funds | 1,785,076 | — | — | 1,785,076 | ||||||||||||
| Total Investments | $139,867,558 | $76,873,596 | $— | $216,741,154 | ||||||||||||
For further information regarding security characteristics, see the Portfolio of Investments.
Of the level 2 investments presented above, equity investments amounting to $60,238,645 would have been considered level 1 investments at the beginning of the period. Of the level 1 investments presented above, equity investments amounting to $6,231,285 would have been considered level 2 investments at the beginning of the period. The primary reason for changes in the classifications between levels 1 and 2 occurs when foreign equity securities are fair valued using other observable market-based inputs in place of the closing exchange price due to events occurring after the close of the exchange or market on which the investment is principally traded. The fund’s foreign equity securities may often be valued at fair value. The fund’s policy is to recognize transfers between the levels as of the end of the period.
Foreign Currency Translation – Purchases and sales of foreign investments, income, and expenses are converted into U.S. dollars based upon currency exchange rates prevailing on the respective dates of such transactions or on the reporting date for foreign denominated receivables and payables. Gains and losses attributable to foreign currency exchange rates on sales of securities are recorded for financial statement purposes as net realized gains and losses on investments. Gains and losses attributable to foreign exchange rate movements on receivables, payables, income and expenses are recorded for financial statement purposes as foreign currency transaction gains and losses. That portion of both realized and unrealized gains and losses on investments that results from fluctuations in foreign currency exchange rates is not separately disclosed.
Security Loans – State Street Bank and Trust Company (“State Street”), as lending agent, loans the securities of the fund to certain qualified institutions (the “Borrowers”) approved by the fund. The loans are collateralized by cash and/or U.S. Treasury and federal agency obligations in an amount typically at least equal to the market value of the securities loaned. The market value of the loaned securities is determined at the close of business of the fund and any additional required collateral is delivered to the fund on the next business day. State Street provides the fund with indemnification against Borrower default. The fund bears the risk of loss with respect to the investment of cash collateral. On loans collateralized by cash, the cash collateral is invested in a money market fund or short-term securities. A portion of the income generated upon investment of the collateral is remitted to the Borrowers, and the remainder is allocated between the fund and the lending agent. On loans collateralized by U.S. Treasury and/or federal agency obligations, a fee is received from the Borrower, and is allocated between
14
Table of Contents
MFS International Growth Portfolio
Notes to Financial Statements – continued
the fund and the lending agent. Income from securities lending is included in interest income on the Statement of Operations. The dividend and interest income earned on the securities loaned is accounted for in the same manner as other dividend and interest income.
Indemnifications – Under the fund’s organizational documents, its officers and Trustees may be indemnified against certain liabilities and expenses arising out of the performance of their duties to the fund. Additionally, in the normal course of business, the fund enters into agreements with service providers that may contain indemnification clauses. The fund’s maximum exposure under these agreements is unknown as this would involve future claims that may be made against the fund that have not yet occurred.
Investment Transactions and Income – Investment transactions are recorded on the trade date. Interest income is recorded on the accrual basis. Dividends received in cash are recorded on the ex-dividend date. Certain dividends from foreign securities will be recorded when the fund is informed of the dividend if such information is obtained subsequent to the ex-dividend date. Dividend and interest payments received in additional securities are recorded on the ex-dividend or ex-interest date in an amount equal to the value of the security on such date.
The fund may receive proceeds from litigation settlements. Any proceeds received from litigation involving portfolio holdings are reflected in the Statement of Operations in realized gain/loss if the security has been disposed of by the fund or in unrealized gain/loss if the security is still held by the fund. Any other proceeds from litigation not related to portfolio holdings are reflected as other income in the Statement of Operations.
Fees Paid Indirectly – The fund’s custody fee may be reduced according to an arrangement that measures the value of cash deposited with the custodian by the fund. This amount, for the year ended December 31, 2011, is shown as a reduction of total expenses on the Statement of Operations.
Tax Matters and Distributions – The fund intends to qualify as a regulated investment company, as defined under Subchapter M of the Internal Revenue Code, and to distribute all of its taxable income, including realized capital gains. As a result, no provision for federal income tax is required. The fund’s federal tax returns for the prior three fiscal years remain subject to examination by the Internal Revenue Service. Foreign taxes have been accrued by the fund in the accompanying financial statements.
Distributions to shareholders are recorded on the ex-dividend date. Income and capital gain distributions are determined in accordance with income tax regulations, which may differ from U.S. generally accepted accounting principles. Certain capital accounts in the financial statements are periodically adjusted for permanent differences in order to reflect their tax character. These adjustments have no impact on net assets or net asset value per share. Temporary differences which arise from recognizing certain items of income, expense, gain or loss in different periods for financial statement and tax purposes will reverse at some time in the future. Distributions in excess of net investment income or net realized gains are temporary overdistributions for financial statement purposes resulting from differences in the recognition or classification of income or distributions for financial statement and tax purposes.
Book/tax differences primarily relate to wash sale loss deferrals.
The tax character of distributions declared to shareholders for the last two fiscal years is as follows:
| 12/31/11 | 12/31/10 | |||||||
| Ordinary income (including any short-term capital gains) | $4,599,059 | $1,936,143 | ||||||
| Long-term capital gains | 18,348,453 | — | ||||||
| Total distributions | $22,947,512 | $1,936,143 | ||||||
The federal tax cost and the tax basis components of distributable earnings were as follows:
| As of 12/31/11 | ||||
| Cost of investments | $212,056,240 | |||
| Gross appreciation | 18,070,877 | |||
| Gross depreciation | (13,385,963 | ) | ||
| Net unrealized appreciation (depreciation) | $4,684,914 | |||
| Undistributed ordinary income | 2,504,745 | |||
| Capital loss carryforwards | (129,545 | ) | ||
| Other temporary differences | (22,306 | ) |
As of December 31, 2011, the fund had capital loss carryforwards available to offset future realized gains. Such losses are characterized as follows:
| Short-term losses | $(129,545 | ) |
15
Table of Contents
MFS International Growth Portfolio
Notes to Financial Statements – continued
Under the Regulated Investment Company Modernization Act of 2010 (the “Act”), the above net capital losses may be carried forward indefinitely, and their character is retained as short-term and/or long-term losses. Previously, net capital losses were carried forward for eight years and treated as short-term losses.
Multiple Classes of Shares of Beneficial Interest – The fund offers multiple classes of shares, which differ in their respective distribution and/or service fees. The fund’s income, realized and unrealized gain (loss), and common expenses are allocated to shareholders based on the daily net assets of each class. Dividends are declared separately for each class. Differences in per share dividend rates are generally due to differences in separate class expenses. The fund’s distributions declared to shareholders as reported on the Statements of Changes in Net Assets are presented by class as follows:
| From net investment income | From net realized gain on investments | |||||||||||||||
| Year ended 12/31/11 | Year ended 12/31/10 | Year ended 12/31/11 | Year ended 12/31/10 | |||||||||||||
| Initial Class | $2,313,897 | $1,752,956 | $17,674,412 | $— | ||||||||||||
| Service Class | 281,555 | 183,187 | 2,677,648 | — | ||||||||||||
| Total | $2,595,452 | $1,936,143 | $20,352,060 | $— | ||||||||||||
| (3) | Transactions with Affiliates |
Investment Adviser – The fund has an investment advisory agreement with MFS to provide overall investment management and related administrative services and facilities to the fund. The management fee is computed daily and paid monthly at the following annual rates:
| First $1 billion of average daily net assets | 0.90% | |||
| Next $1 billion of average daily net assets | 0.80% | |||
| Average daily net assets in excess of $2 billion | 0.70% |
The management fee incurred for the year ended December 31, 2011 was equivalent to an annual effective rate of 0.90% of the fund’s average daily net assets.
The investment adviser has agreed in writing to pay a portion of the fund’s total annual operating expenses, exclusive of interest, taxes, extraordinary expenses, brokerage and transaction costs and investment-related expenses, such that total annual operating expenses do not exceed 1.35% of average daily net assets for the Initial Class shares and 1.60% of average daily net assets for the Service Class shares. This written agreement will continue until April 30, 2013. For the year ended December 31, 2011, the fund’s actual operating expenses did not exceed the limit and therefore, the investment adviser did not pay any portion of the fund’s expenses related to this agreement.
Distributor – MFS Fund Distributors, Inc. (MFD), a wholly-owned subsidiary of MFS, is the distributor of shares of the fund. The Trustees have adopted a distribution plan for the Service Class shares pursuant to Rule 12b-1 under the Investment Company Act of 1940.
The fund’s distribution plan provides that the fund will pay MFD distribution and/or service fees equal to 0.25% per annum of its average daily net assets attributable to Service Class shares as partial consideration for services performed and expenses incurred by MFD and financial intermediaries (including participating insurance companies that invest in the fund to fund variable annuity and variable life insurance contracts, sponsors of qualified retirement and pension plans that invest in the fund, and affiliates of these participating insurance companies and plan sponsors) in connection with the sale and distribution of the Service Class shares. MFD may subsequently pay all, or a portion, of the distribution and/or service fees to financial intermediaries.
Shareholder Servicing Agent – MFS Service Center, Inc. (MFSC), a wholly-owned subsidiary of MFS, receives a fee from the fund for its services as shareholder servicing agent. For the year ended December 31, 2011, the fee was $25,927, which equated to 0.0109% annually of the fund’s average daily net assets. MFSC also receives payment from the fund for out-of-pocket expenses paid by MFSC on behalf of the fund. For the year ended December 31, 2011, these costs amounted to $26.
Administrator – MFS provides certain financial, legal, shareholder communications, compliance, and other administrative services to the fund. Under an administrative services agreement, the fund partially reimburses MFS the costs incurred to provide these services. The fund is charged an annual fixed amount of $17,500 plus a fee based on average daily net assets. The administrative services fee incurred for the year ended December 31, 2011 was equivalent to an annual effective rate of 0.0334% of the fund’s average daily net assets.
Trustees’ and Officers’ Compensation – The fund pays compensation to Trustees in the form of a retainer, attendance fees, and additional compensation to the Board chairperson. The fund does not pay compensation directly to officers of the fund who are also officers of the investment adviser, all of whom receive remuneration for their services to the fund from MFS. Certain officers of the fund are officers or directors of MFS, MFD, and MFSC.
16
Table of Contents
MFS International Growth Portfolio
Notes to Financial Statements – continued
Other – This fund and certain other funds managed by MFS (the funds) have entered into services agreements (the Agreements) which provide for payment of fees by the funds to Tarantino LLC and Griffin Compliance LLC in return for the provision of services of an Independent Chief Compliance Officer (ICCO) and Assistant ICCO, respectively, for the funds. The ICCO and Assistant ICCO are officers of the funds and the sole members of Tarantino LLC and Griffin Compliance LLC, respectively. The funds can terminate the Agreements with Tarantino LLC and Griffin Compliance LLC at any time under the terms of the Agreements. MFS has agreed to bear all expenses associated with office space, other administrative support, and supplies provided to the ICCO and Assistant ICCO. For the year ended December 31, 2011, the aggregate fees paid by the fund to Tarantino LLC and Griffin Compliance LLC were $3,925 and are included in miscellaneous expense on the Statement of Operations.
The fund invests in the MFS Institutional Money Market Portfolio which is managed by MFS and seeks a high level of current income consistent with preservation of capital and liquidity. Income earned on this investment is included in dividends from underlying affiliated funds on the Statement of Operations. This money market fund does not pay a management fee to MFS.
| (4) | Portfolio Securities |
Purchases and sales of investments, other than U.S. Government securities, purchased option transactions, and short-term obligations, aggregated $124,061,638 and $130,515,161, respectively.
| (5) | Shares of Beneficial Interest |
The fund’s Declaration of Trust permits the Trustees to issue an unlimited number of full and fractional shares of beneficial interest. Transactions in fund shares were as follows:
| Year ended 12/31/11 | Year ended 12/31/10 | |||||||||||||||
| Shares | Amount | Shares | Amount | |||||||||||||
| Shares sold | ||||||||||||||||
Initial Class | 2,376,645 | $29,705,818 | 5,318,787 | $62,995,452 | ||||||||||||
Service Class | 529,083 | 6,566,825 | 529,150 | 6,406,687 | ||||||||||||
| 2,905,728 | $36,272,643 | 5,847,937 | $69,402,139 | |||||||||||||
| Shares issued to shareholders in reinvestment of distributions | ||||||||||||||||
Initial Class | 1,714,263 | $19,988,309 | 142,981 | $1,752,956 | ||||||||||||
Service Class | 255,323 | 2,959,203 | 15,004 | 183,187 | ||||||||||||
| 1,969,586 | $22,947,512 | 157,985 | $1,936,143 | |||||||||||||
| Shares reacquired | ||||||||||||||||
Initial Class | (3,115,040 | ) | $(41,294,745 | ) | (4,301,835 | ) | $(55,307,266 | ) | ||||||||
Service Class | (435,552 | ) | (5,531,966 | ) | (532,563 | ) | (6,437,650 | ) | ||||||||
| (3,550,592 | ) | $(46,826,711 | ) | (4,834,398 | ) | $(61,744,916 | ) | |||||||||
| Net change | ||||||||||||||||
Initial Class | 975,868 | $8,399,382 | 1,159,933 | $9,441,142 | ||||||||||||
Service Class | 348,854 | 3,994,062 | 11,591 | 152,224 | ||||||||||||
| 1,324,722 | $12,393,444 | 1,171,524 | $9,593,366 | |||||||||||||
| (6) | Line of Credit |
The fund and certain other funds managed by MFS participate in a $1.1 billion unsecured committed line of credit, subject to a $1 billion sublimit, provided by a syndication of banks under a credit agreement. Borrowings may be made for temporary financing needs. Interest is charged to each fund, based on its borrowings, generally at a rate equal to the higher of the Federal Reserve funds rate or one month LIBOR plus an agreed upon spread. A commitment fee, based on the average daily, unused portion of the committed line of credit, is allocated among the participating funds at the end of each calendar quarter. In addition, the fund and other funds managed by MFS have established unsecured uncommitted borrowing arrangements with certain banks for temporary financing needs. Interest is charged to each fund, based on its borrowings, at a rate equal to the Federal Reserve funds rate plus an agreed upon spread. For the year ended December 31, 2011, the fund’s commitment fee and interest expense were $1,825 and $0, respectively, and are included in miscellaneous expense on the Statement of Operations.
17
Table of Contents
MFS International Growth Portfolio
Notes to Financial Statements – continued
| (7) | Transactions in Underlying Affiliated Funds – Affiliated Issuers |
An affiliated issuer may be considered one in which the fund owns 5% or more of the outstanding voting securities, or a company which is under common control. For the purposes of this report, the fund assumes the following to be affiliated issuers:
| Underlying Affiliated Funds | Beginning Shares/Par Amount | Acquisitions Shares/Par Amount | Dispositions Shares/Par Amount | Ending Shares/Par Amount | ||||||||||||
| MFS Institutional Money Market Portfolio | 2,123,761 | 61,669,351 | (62,008,036 | ) | 1,785,076 | |||||||||||
| Underlying Affiliated Funds | Realized Gain (Loss) | Capital Gain Distributions | Dividend Income | Ending Value | ||||||||||||
| MFS Institutional Money Market Portfolio | $— | $— | $4,719 | $1,785,076 | ||||||||||||
18
Table of Contents
MFS International Growth Portfolio
REPORT OF INDEPENDENT REGISTERED PUBLIC ACCOUNTING FIRM
To the Board of Trustees of MFS Variable Insurance Trust II and the Shareholders of MFS International Growth Portfolio:
We have audited the accompanying statement of assets and liabilities, including the portfolio of investments, of MFS International Growth Portfolio (the “Fund”) (one of the portfolios comprising MFS Variable Insurance Trust II) as of December 31, 2011, and the related statement of operations for the year then ended, the statements of changes in net assets for each of the two years in the period then ended, and the financial highlights for each of the five years in the period then ended. These financial statements and financial highlights are the responsibility of the Fund’s management. Our responsibility is to express an opinion on these financial statements and financial highlights based on our audits.
We conducted our audits in accordance with the standards of the Public Company Accounting Oversight Board (United States). Those standards require that we plan and perform the audit to obtain reasonable assurance about whether the financial statements and financial highlights are free of material misstatement. The Fund is not required to have, nor were we engaged to perform, an audit of its internal control over financial reporting. Our audits included consideration of internal control over financial reporting as a basis for designing audit procedures that are appropriate in the circumstances, but not for the purpose of expressing an opinion on the effectiveness of the Fund’s internal control over financial reporting. Accordingly, we express no such opinion. An audit also includes examining, on a test basis, evidence supporting the amounts and disclosures in the financial statements, assessing the accounting principles used and significant estimates made by management, as well as evaluating the overall financial statement presentation. Our procedures included confirmation of securities owned as of December 31, 2011, by correspondence with the custodian and brokers; where replies were not received from brokers, we performed other auditing procedures. We believe that our audits provide a reasonable basis for our opinion.
In our opinion, the financial statements and financial highlights referred to above present fairly, in all material respects, the financial position of MFS International Growth Portfolio as of December 31, 2011, the results of its operations for the year then ended, the changes in its net assets for each of the two years in the period then ended, and the financial highlights for each of the five years in the period then ended, in conformity with accounting principles generally accepted in the United States of America.
DELOITTE & TOUCHE LLP
Boston, Massachusetts
February 15, 2012
19
Table of Contents
MFS International Growth Portfolio
RESULTS OF SHAREHOLDER MEETING (unaudited)
At a special meeting of shareholders of MFS International Growth Portfolio, which was held on December 1, 2011, the following actions were taken for which shareholders of all series of MFS Variable Insurance Trust II voted together as a single class with respect to Item 1 and shareholders of MFS International Growth Portfolio voted as a separate class with respect to Items 2 and 3:
Item 1: Election of ten Trustees as members of the Board of Trustees of the Trust effective January 1, 2012:
| Number of Shares | ||||||||
| For | Withheld Authority | |||||||
| Robert E. Butler | 681,916,712.8686 | 46,472,894.9218 | ||||||
| Maureen R. Goldfarb | 682,835,794.8512 | 45,553,812.9392 | ||||||
| David H. Gunning | 681,500,267.3085 | 46,889,340.4819 | ||||||
| William R. Gutow | 681,050,223.5547 | 47,339,384.2357 | ||||||
| Michael Hegarty | 682,477,088.8584 | 45,912,518.9320 | ||||||
| John P. Kavanaugh | 683,794,425.4269 | 44,595,182.3635 | ||||||
| Robert J. Manning | 682,699,559.7374 | 45,690,048.0530 | ||||||
| J. Dale Sherratt | 681,362,743.0513 | 47,026,864.7391 | ||||||
| Laurie J. Thomsen | 683,408,094.0000 | 44,981,513.7904 | ||||||
| Robert W. Uek | 681,424,852.0247 | 46,964,755.7657 | ||||||
Item 2: To approve a new investment advisory agreement dated January 1, 2012, between the Trust, on behalf of MFS International Growth Portfolio, and MFS:
| Number of Shares | ||||||||||||
| For | Against | Withheld Authority | ||||||||||
| 16,469,268.2422 | 484,757.3434 | 1,635,124.3846 | ||||||||||
Item 3: To approve revisions to and restatements of certain fundamental investment restrictions of MFS International Growth Portfolio effective January 1, 2012 as detailed below:
| Number of Shares | ||||||||||||||
| For | Against | Withheld Authority | ||||||||||||
| A. | Borrowing | 15,887,816.5161 | 890,538.7119 | 1,810,794.7422 | ||||||||||
| B. | Underwriting Securities | 16,149,501.4067 | 691,334.6627 | 1,748,313.9008 | ||||||||||
| C. | Issuance of Senior Securities | 16,154,543.5090 | 725,566.4789 | 1,709,039.9823 | ||||||||||
| D. | Lending of Money or Securities | 15,943,898.5164 | 827,295.5461 | 1,817,955.9077 | ||||||||||
| E. | Purchases or Sales of Real Estate; Interests in Oil, Gas or Mineral Leases; and Commodities | 16,338,888.8471 | 667,596.5620 | 1,582,664.5611 | ||||||||||
| F. | Industry Concentration | 16,327,873.0509 | 680,711.1367 | 1,580,565.7826 | ||||||||||
20
Table of Contents
MFS International Growth Portfolio
TRUSTEES AND OFFICERS – IDENTIFICATION AND BACKGROUND
The Trustees and officers of the Trust, as of February 1, 2012, are listed below, together with their principal occupations during the past five years. (Their titles may have varied during that period.) The address of each Trustee and officer is 500 Boylston Street, Boston, Massachusetts 02116.
Name, Age | Position(s) with Fund | Trustee/Officer Since (h) | Principal Occupations | Other Directorships (j) | ||||
| INTERESTED TRUSTEES | ||||||||
Robert J. Manning (k) (age 48) | Trustee | February 2004 | Massachusetts Financial Services Company, Chairman, Chief Executive Officer and Director; President (until December 2009); Chief Investment Officer (until July 2010) | N/A | ||||
| INDEPENDENT TRUSTEES | ||||||||
David H. Gunning (age 69) | Trustee and Chair of Trustees | January 2004 | Retired; Cleveland-Cliffs Inc. (mining products and service provider), Vice Chairman/Director (until May 2007) | Lincoln Electric Holdings, Inc. (welding equipment manufacturer), Director; Development Alternatives, Inc. (consulting), Director/Non-Executive Chairman; Portman Limited (mining), Director (until 2008) | ||||
Robert E. Butler (age 70) | Trustee | January 2006 | Consultant – investment company industry regulatory and compliance matters | N/A | ||||
Maureen R. Goldfarb (age 56) | Trustee | January 2009 | Private investor | N/A | ||||
William R. Gutow (age 70) | Trustee | December 1993 | Private investor and real estate consultant; Capitol Entertainment Management Company (video franchise), Vice Chairman | Atlantic Coast Tan (tanning salons), Vice Chairman (until 2007); Texas Donuts (donut franchise), Vice Chairman (until 2010) | ||||
Michael Hegarty (age 67) | Trustee | December 2004 | Private investor | N/A | ||||
John P. Kavanaugh (age 57) | Trustee | January 2009 | Private investor; The Hanover Insurance Group, Inc., Vice President and Chief Investment Officer (until 2006); Allmerica Investment Trust, Allmerica Securities Trust and Opus Investment Trust (investment companies), Chairman, President and Trustee (until 2006) | N/A | ||||
J. Dale Sherratt (age 73) | Trustee | June 1989 | Insight Resources, Inc. (acquisition planning specialists), President; Wellfleet Investments (investor in health care companies), Managing General Partner | N/A | ||||
Laurie J. Thomsen (age 54) | Trustee | March 2005 | Private investor; New Profit, Inc. (venture philanthropy), Executive Partner (until 2010) | The Travelers Companies (property and casualty insurance), Director | ||||
Robert W. Uek (age 70) | Trustee | January 2006 | Consultant to investment company industry | N/A | ||||
| OFFICERS | ||||||||
John M. Corcoran (k) (age 46) | President | October 2008 | Massachusetts Financial Services Company, Senior Vice President (since October 2008); State Street Bank and Trust (financial services provider), Senior Vice President, (until September 2008) | N/A | ||||
| Christopher R. Bohane (k) (age 38) | Assistant Secretary and Assistant Clerk | July 2005 | Massachusetts Financial Services Company, Vice President and Senior Counsel | N/A | ||||
Kino Clark (k) (age 43) | Assistant Treasurer | January 2012 | Massachusetts Financial Services Company, Assistant Vice President | N/A | ||||
21
Table of Contents
MFS International Growth Portfolio
Trustees and Officers – continued
Name, Age | Position(s) with Fund | Trustee/Officer Since (h) | Principal Occupations | Other Directorships (j) | ||||
Ethan D. Corey (k) (age 48) | Assistant Secretary and Assistant Clerk | July 2005 | Massachusetts Financial Services Company, Senior Vice President and Associate General Counsel | N/A | ||||
David L. DiLorenzo (k) (age 43) | Treasurer | July 2005 | Massachusetts Financial Services Company, Vice President | N/A | ||||
Robyn L. Griffin (age 36) | Assistant Independent Chief Compliance Officer | August 2008 | Griffin Compliance LLC (provider of compliance services), Principal (since August 2008); State Street Corporation (financial services provider), Mutual Fund Administration Assistant Vice President (October 2006 – July 2008); Liberty Mutual Group (insurance), Personal Market Assistant Controller (April 2006 – October 2006); Deloitte & Touche LLP (professional services firm). | N/A | ||||
Brian E. Langenfeld (k) (age 38) | Assistant Secretary and Assistant Clerk | June 2006 | Massachusetts Financial Services Company, Vice President and Senior Counsel | N/A | ||||
Ellen Moynihan (k) (age 54) | Assistant Treasurer | April 1997 | Massachusetts Financial Services Company, Senior Vice President | N/A | ||||
Susan S. Newton (k) (age 61) | Assistant Secretary and Assistant Clerk | May 2005 | Massachusetts Financial Services Company, Senior Vice President and Associate General Counsel | N/A | ||||
Susan A. Pereira (k) (age 41) | Assistant Secretary and Assistant Clerk | July 2005 | Massachusetts Financial Services Company, Vice President and Senior Counsel | N/A | ||||
Mark N. Polebaum (k) (age 59) | Secretary and Clerk | January 2006 | Massachusetts Financial Services Company, Executive Vice President, General Counsel and Secretary | N/A | ||||
Frank L. Tarantino (age 67) | Independent Chief Compliance Officer | June 2004 | Tarantino LLC (provider of compliance services), Principal | N/A | ||||
Richard S. Weitzel (k) (age 41) | Assistant Secretary and Assistant Clerk | October 2007 | Massachusetts Financial Services Company, Vice President and Assistant General Counsel | N/A | ||||
James O. Yost (k) (age 51) | Deputy Treasurer | September 1990 | Massachusetts Financial Services Company, Senior Vice President | N/A | ||||
| (h) | Date first appointed to serve as Trustee/officer of an MFS fund. Each Trustee has served continuously since appointment unless indicated otherwise. For the period from December 15, 2004 until February 22, 2005, Mr. Manning served as Advisory Trustee. For the period October 2008, until January 2012, Mr. Corcoran served as Treasurer of the Funds. Prior to January 2012, Messrs. DiLorenzo and Yost served as Assistant Treasurers of the Funds. |
| (j) | Directorships or trusteeships of companies required to report to the Securities and Exchange Commission (i.e., “public companies”). |
| (k) | “Interested person” of the Trust within the meaning of the Investment Company Act of 1940 (referred to as the 1940 Act), which is the principal federal law governing investment companies like the fund, as a result of position with MFS. The address of MFS is 500 Boylston Street, Boston, Massachusetts 02116. |
Each Trustee has been elected by shareholders and each Trustee and officer holds office until his or her successor is chosen and qualified or until his or her earlier death, resignation, retirement or removal. The Trust does not hold annual meetings for the purpose of electing Trustees, and Trustees are not elected for fixed terms. Messrs. Butler, Kavanaugh, Uek and Ms. Thomsen are members of the Trust’s Audit Committee.
Each of the Fund’s Trustees and officers holds comparable positions with certain other funds of which MFS or a subsidiary is the investment adviser or distributor, and, in the case of the officers, with certain affiliates of MFS. As of January 1, 2012, the Trustees served as board members of 131 funds within the MFS Family of Funds.
22
Table of Contents
MFS International Growth Portfolio
Trustees and Officers – continued
The Statement of Additional Information for the Fund includes further information about the Trustees and is available without charge upon request by calling 1-800-225-2606.
Investment Adviser Massachusetts Financial Services Company 500 Boylston Street, Boston, MA 02116-3741 | Custodian State Street Bank and Trust 1 Lincoln Street, Boston, MA 02111-2900 | |
Distributor MFS Distributors, Inc. 500 Boylston Street, Boston, MA 02116-3741 | Independent Registered Public Accounting Firm Deloitte & Touche LLP 200 Berkeley Street, Boston, MA 02116 | |
Portfolio Manager David Antonelli |
23
Table of Contents
MFS International Growth Portfolio
At a special meeting of shareholders of the MFS International Growth Portfolio (hereinafter referred to as the “Fund” or the “Portfolio”), which was held on December 1, 2011, the shareholders approved a new investment advisory agreement based on the recommendation of the Board of Trustees. At its July, 2011 meeting, the Board of Trustees (i) approved, and recommended for shareholder approval, the new investment advisory agreement effective January 1, 2012, and (ii) the continuation of the existing investment advisory agreement effective September 1, 2011. The following includes a description of the factors that the Board of Trustees considered and the conclusions that formed the basis of their approval of both the new investment advisory agreement and the continuation of the prior investment advisory agreement.
BOARD APPROVAL OF NEW INVESTMENT ADVISORY AGREEMENT
The Investment Company Act of 1940 requires that both the full Board of Trustees and a majority of the non-interested (“independent”) Trustees, voting separately, initially approve the new investment advisory agreement (the “New Agreement”) between Massachusetts Financial Services Company (“MFS”) and MFS Variable Insurance Trust II (the “Trust”) on behalf of the Portfolio and, beginning on the second anniversary of the initial effective date of the New Agreement, annually approve the continuation of the New Agreement. The Trustees have considered matters bearing on the Portfolio and the then current advisory arrangement at their meetings throughout the year, including a review of performance data at each regular meeting. In addition, the independent Trustees met in person in July 2011 to consider the initial approval of the New Agreement, and to recommend that shareholders approve the New Agreement. The independent Trustees were assisted in their evaluation of the New Agreement by independent legal counsel, from whom they received separate legal advice and with whom they met separately from MFS management. The independent Trustees were also assisted in this process by the Portfolio’s Independent Chief Compliance Officer, a full-time senior officer appointed by and reporting to the independent Trustees.
In connection with their deliberations regarding the initial approval of the New Agreement, the Trustees, including the independent Trustees, considered such information and factors as they believed, in light of the legal advice furnished to them and their own business judgment, to be relevant. The New Agreement was considered separately for the series of the Trust (collectively, the “Portfolios”), although the Trustees also took into account the common interests of all Portfolios in the Trust in their review. As described below, the Trustees considered the nature, quality, and extent of the various investment advisory, administrative, and/or shareholder services to be performed by MFS under the New Agreement and other arrangements with the Trust.
In connection with their initial review meeting, the Trustees received and relied upon materials that included, among other items: (i) information provided by MFS on the advisory fees of comparable portfolios of its other clients, including institutional separate account and other clients, (ii) information as to whether, and to what extent applicable, expense waivers, reimbursements or fee “breakpoints” would be observed for the Portfolio under the New Agreement, and (iii) a comparison and summary of the differences in the provisions in the New Agreement compared to those in each of the then current investment advisory agreements for the Portfolios. In addition, in connection with the independent Trustees’ meetings in May and July, 2011 (the “contract review meetings”) for the purpose of considering whether to approve the continuation of the then current investment advisory agreements for the Portfolio, the independent Trustees received: (1) information provided by Lipper Inc. (“Lipper”) on the investment performance of the Portfolio for various time periods ended December 31, 2010, compared to the investment performance of a group of funds with substantially similar investment classifications/objectives (the “Lipper performance universe”), (2) information provided by Lipper on the Portfolio’s advisory fees and other expenses compared to the advisory fees and other expenses of comparable funds identified by Lipper (the “Lipper expense group”), (3) information regarding MFS’ financial results and financial condition, including MFS’ and certain of its affiliates’ estimated profitability from services performed for the Portfolio, (4) MFS’ views regarding the outlook for the mutual fund industry and its strategic business plans, (5) descriptions of various functions performed by MFS for the Trust, such as compliance monitoring and portfolio trading practices, and (6) information regarding the overall organization of MFS, including information about MFS’ senior management and other personnel providing investment advisory, administrative and other services to the Portfolio. The comparative performance, fee and expense information prepared and provided by Lipper was not independently verified, and the independent Trustees did not independently verify any information provided to them by MFS.
The Trustees’ conclusion as to the initial approval of the New Agreement was based on comprehensive consideration of all information provided to the Trustees and was not the result of any single factor. Some of the factors that figured particularly in the Trustees’ deliberations are described below for the Portfolio, while individual Trustees may have given different weight to various factors and evaluated the information presented as a whole differently than another individual Trustee. The Trustees recognized that the fee arrangements for the Portfolio could reflect years of review and discussion between the independent Trustees and MFS, that certain aspects of such arrangements may receive greater scrutiny in some years than others, and that
24
Table of Contents
MFS International Growth Portfolio
Board Approval of New Investment Advisory Agreement – continued
the Trustees’ conclusions may be based, in part, on their consideration of these same arrangements during the course of the year and in prior years.
Because the portfolio management team managing the Portfolio’s investments under the then current investment advisory agreement will remain the same under the New Agreement for the Portfolio, the Trustees compared the Portfolio’s total return investment performance to the performance of its Lipper performance universe over various time periods, based on information provided by Lipper. The Trustees placed particular emphasis on the total return performance of the Portfolio’s Initial Class shares in comparison to the performance of funds in its Lipper performance universe over the one-, three- and five-year periods ended December 31, 2010. The Trustees did not rely on performance results for more recent periods.
The Trustees noted the performance of the Portfolio’s Initial Class shares was in the 2nd quintile relative to the other funds in the Lipper performance universe for the one-year period (the 1st quintile being the best performers and the 5th quintile being the worst performers). The total return performance of the Portfolio was in the 1st quintile for the three-year and the five-year periods ended December 31, 2010, relative to the Lipper performance universe. Based on the nature and quality of services provided by MFS, the Board of Trustees concluded that the Portfolio’s performance was satisfactory.
In the course of their deliberations, the Trustees took into account information provided by MFS during contract review meetings, as well as during investment review meetings conducted with portfolio management personnel during the course of the year. For Portfolios whose performance lagged their peer groups, they discussed the factors that contributed thereto and MFS’ efforts to improve such Portfolios’ performance. After reviewing this information, the Trustees concluded, within the context of their overall conclusions regarding the New Agreement, that they were satisfied with MFS’ responses and efforts relating to investment performance.
In assessing the reasonableness of the Portfolio’s advisory fee, the Trustees considered, among other information, the Portfolio’s advisory fee and the total expense ratio of the Portfolio’s Initial Class shares as a percentage of average daily net assets, compared to the advisory fee and total expense ratios of its peer group of funds based on information provided by Lipper. The Trustees also considered the advisory fees charged by MFS to institutional accounts. In comparing these fees, the Trustees considered the generally broader scope of services provided by MFS to the Trust than those provided to institutional accounts. The Trustees also considered the higher demands placed on MFS’ investment personnel and trading infrastructure as a result of the daily cash in-flows and out-flows of the Portfolio, and the impact on MFS and related expenses due to the more extensive regulatory regime to which the Portfolio is subject, compared to institutional accounts.
In considering the fees, the Trustees noted from the Lipper data that the Portfolio’s effective advisory fee rate and total expense ratio were each above the median of such fees and expenses of funds in the Lipper expense group. In addition, the Trustees accepted MFS’ offer to continue the expense limitation for the Portfolio. The Trustees further noted that the New Agreement would reflect MFS’ agreement to observe a lower advisory fee and to reduce the advisory fee on average daily net assets over $1 billion and over $2 billion on a permanent basis, and concluded that the breakpoints were sufficient to allow the Portfolio to benefit from economies of scale as its assets grow. The Trustees concluded that the fees were reasonable in light of the nature and quality of services provided.
The Trustees also considered whether the Portfolio is likely to benefit from any economies of scale due to future asset growth. In this regard, the Trustees reviewed the adequacy of breakpoints and discussed with MFS any adjustments necessary for the shareholders’ benefit.
The Trustees also considered information prepared by MFS relating to its costs and profits with respect to the Portfolio and other investment companies and accounts advised by MFS, as well as MFS’ methodologies used to determine and allocate its costs to the Portfolio and other accounts and products for purposes of estimating profitability.
The Trustees noted that there would be no increase to the net advisory fee arrangement for the Portfolio under the New Agreement when compared to the Portfolio’s then current investment advisory agreement. After reviewing these and other factors described below, the Trustees concluded that the advisory fees charged to the Portfolio under the New Agreement represent reasonable compensation in light of the nature and quality of the services being provided by MFS.
In addition, the Trustees considered MFS’ resources and related efforts to continue to retain, attract and motivate capable personnel to serve the Portfolio. The Trustees also considered the financial resources of MFS and its parent, Sun Life Financial Inc. The Trustees further considered any advantages and possible disadvantages of having an adviser which also serves other investment companies as well as institutional accounts.
25
Table of Contents
MFS International Growth Portfolio
Board Approval of New Investment Advisory Agreement – continued
The Trustees also considered the nature, quality, cost, and extent of administrative, transfer agency, and distribution services provided to the Trust by MFS and its affiliates under agreements and plans other than the New Agreement, including the 12b-1 fees the Portfolio pays to MFS Fund Distributors, Inc., an affiliate of MFS. The Trustees also considered the nature, extent and quality of certain other services MFS performs or arranges on the Portfolio’s behalf, which may include securities lending programs, directed expense payment programs, class action recovery programs, and MFS’ interaction with third-party service providers, principally custodians and sub-custodians. The Trustees concluded that the various non-advisory services provided by MFS and its affiliates on behalf of the Portfolio were satisfactory. The Trustees also considered the benefits to MFS from the use of the Portfolio’s portfolio brokerage commissions to pay for investment research and various other factors. Additionally, the Trustees considered so-called “fall-out benefits” to MFS such as reputational value derived from serving as investment manager to the Trust, and determined that any such benefits derived by MFS were reasonable and fair.
Based on their evaluation of factors that they deemed to be material, including those factors described above, the Board of Trustees, including a majority of the independent Trustees, concluded that the New Agreement should be approved for an initial two-year period, commencing upon its effective date, as set forth in the New Agreement.
BOARD APPROVAL OF CONTINUATION OF PRIOR INVESTMENT ADVISORY AGREEMENT
The Investment Company Act of 1940 requires that both the full Board of Trustees and a majority of the non-interested (“independent”) Trustees, voting separately, annually approve the continuation of the investment advisory agreement between MFS Variable Insurance Trust II (the “Trust”) and Massachusetts Financial Services Company (“MFS”) on behalf of the Fund. The Trustees consider matters bearing on the Fund and the advisory arrangements at their meetings throughout the year, including a review of performance data at each regular meeting. In addition, the independent Trustees met in person in May and again in July 2011 (“contract review meetings”) for the specific purpose of considering whether to approve the continuation of the investment advisory agreement for the Fund. The independent Trustees were assisted in their evaluation of the investment advisory agreement by independent legal counsel, from whom they received separate legal advice and with whom they met separately from MFS management during various contract review meetings. The independent Trustees were also assisted in this process by the Fund’s Independent Chief Compliance Officer, a full-time senior officer appointed by and reporting to the independent Trustees.
In connection with their deliberations, the Trustees, including the independent Trustees, considered such information and factors as they believed, in light of the legal advice furnished to them and their own business judgment, to be relevant. The investment advisory agreement was considered separately for the Fund, although the Trustees also took into account the common interests of all Funds in the Trust in their review. As described below, the Trustees considered the nature, quality, and extent of the various investment advisory, administrative, and shareholder services performed by MFS under the existing investment advisory agreement and other arrangements with the Trust.
In connection with their contract review meetings, the Trustees received and relied upon materials which included, among other items: (i) information provided by Lipper Inc. (“Lipper”) on the investment performance of the Fund for various time periods ended December 31, 2010, compared to the investment performance of a group of funds with substantially similar investment classifications/objectives (the “Lipper performance universe”), (ii) information provided by Lipper on the Fund’s advisory fees and other expenses compared to the advisory fees and other expenses of comparable funds identified by Lipper (the “Lipper expense group”), (iii) information provided by MFS on the advisory fees of comparable portfolios of its other clients, including institutional separate account and other clients, (iv) information as to whether, and to what extent applicable, expense waivers, reimbursements or fee “breakpoints” are observed for the Fund, (v) information regarding MFS’ financial results and financial condition, including MFS’ and certain of its affiliates’ estimated profitability from services performed for the Fund and other investment companies that the Board oversees as a whole, and for MFS’ institutional business, (vi) MFS’ views regarding the outlook for the mutual fund industry and its strategic business plans, (vii) descriptions of various functions performed by MFS for the Trust, such as compliance monitoring and portfolio trading practices, and (viii) information regarding the overall organization of MFS, including information about MFS’ senior management and other personnel providing investment advisory, administrative and other services to the Fund. The comparative performance, fee and expense information prepared and provided by Lipper was not independently verified, and the independent Trustees did not independently verify any information provided to them by MFS.
The Trustees’ conclusion as to the continuation of the investment advisory agreement was based on comprehensive consideration of all information provided to the Trustees and was not the result of any single factor. Some of the factors that figured particularly in the Trustees’ deliberations are described below for the Fund, while individual Trustees may have given different weight to various factors and evaluated the information presented as a whole differently than another individual
26
Table of Contents
MFS International Growth Portfolio
Board Approval of Continuation of Prior Investment Advisory Agreement – continued
Trustee. The Trustees recognized that the fee arrangements for the Fund reflect years of review and discussion between the independent Trustees and MFS, that certain aspects of such arrangements may receive greater scrutiny in some years than others, and that the Trustees’ conclusions may be based, in part, on their consideration of these same arrangements during the course of the year and in prior years.
Based on information provided by Lipper, the Trustees compared the Fund’s total return investment performance to the performance of the Lipper performance universe over various time periods. The Trustees placed particular emphasis on the total return performance of the Fund’s Initial Class shares in comparison to the performance of funds in its Lipper performance universe over the one-, three- and five -year periods ended December 31, 2010. The Trustees did not rely on performance results for more recent periods, including those shown elsewhere in this report.
The Trustees noted the performance of the Fund’s Initial Class shares was in the 2nd quintile relative to the other funds in the Lipper performance universe for the one-year period (the 1st quintile being the best performers and the 5th quintile being the worst performers). The total return performance of the Fund was in the 1st quintile for the three-year and the five-year periods ended December 31, 2010, relative to the Lipper performance universe. Based on the nature and quality of services provided by MFS, the Board of Trustees concluded that the Fund’s performance was satisfactory.
In the course of their deliberations, the Trustees took into account information provided by MFS during contract review meetings, as well as during investment review meetings conducted with portfolio management personnel during the course of the year.
In assessing the reasonableness of the Fund’s advisory fee, the Trustees considered, among other information, the Fund’s advisory fee and the total expense ratio of the Fund’s Initial Class shares as a percentage of average daily net assets, compared to the advisory fee and total expense ratios of its peer group of funds based on information provided by Lipper. The Trustees also considered the advisory fees charged by MFS to institutional accounts. In comparing these fees, the Trustees considered the generally broader scope of services provided by MFS to the Trust than those provided to institutional accounts. The Trustees also considered the higher demands placed on MFS’ investment personnel and trading infrastructure as a result of the daily cash in-flows and out-flows of the Fund, and the impact on MFS and related expenses due to the more extensive regulatory regime to which the Fund is subject, compared to institutional accounts.
In considering the fees, the Trustees noted from the Lipper data (which takes into account any reductions or expense limitations) that the Fund’s effective advisory fee rate and total expense ratio were each above the median of such fees and expenses of funds in the Lipper expense group. In addition, the Trustees accepted MFS’ offer to continue the expense limitation for the Fund, and concluded that the existing breakpoints were sufficient to allow the Fund to benefit from economies of scale as its assets grow. The Trustees concluded that the fees were reasonable in light of the nature and quality of services provided.
The Trustees also considered information prepared by MFS relating to its costs and profits with respect to the Fund and other investment companies and accounts advised by MFS, as well as MFS’ methodologies used to determine and allocate its costs to the Fund and other accounts and products for purposes of estimating profitability.
After reviewing these and other factors described below, the Trustees concluded that the advisory fees charged to the Fund represent reasonable compensation in light of the nature and quality of the services being provided by MFS.
In addition, the Trustees considered MFS’ resources and related efforts to continue to retain, attract and motivate capable personnel to serve the Fund. The Trustees also considered the financial resources of MFS and its parent, Sun Life Financial Inc. The Trustees further considered any advantages and possible disadvantages of having an adviser which also serves other investment companies as well as institutional accounts.
The Trustees also considered the nature, quality, cost, and extent of administrative, transfer agency, and distribution services provided to the Fund by MFS and its affiliates under agreements and plans other than the investment advisory agreement, including the 12b-1 fees the Fund pays to MFS Fund Distributors, Inc., an affiliate of MFS. The Trustees also considered the nature, extent and quality of certain other services MFS performs or arranges on the Fund’s behalf, which may include securities lending programs, directed expense payment programs, class action recovery programs, and MFS’ interaction with third-party service providers, principally custodians and sub-custodians. The Trustees concluded that the various non-advisory services provided by MFS and its affiliates on behalf of the Fund were satisfactory. The Trustees also considered the benefits to MFS from the use of the Fund’s portfolio brokerage commissions, if applicable, to pay for investment research and various other factors. Additionally, the Trustees considered so-called “fall-out benefits” to MFS such as reputational value derived from serving as investment manager to the Trust, and determined that any such benefits derived by MFS were reasonable and fair.
27
Table of Contents
MFS International Growth Portfolio
Board Approval of Continuation of Prior Investment Advisory Agreement – continued
Based on their evaluation of factors that they deemed to be material, including those factors described above, the Board of Trustees, including a majority of the independent Trustees, concluded that the investment advisory agreement should be continued for an additional one-year period, commencing September 1, 2011.
A discussion regarding the Board’s most recent review and renewal of the fund’s Investment Advisory Agreement with MFS is available by clicking on the fund’s name under “Variable Insurance Portfolios — VIT II” in the “Products and Performance” section of the MFS Web site (mfs.com).
28
Table of Contents
MFS International Growth Portfolio
PROXY VOTING POLICIES AND INFORMATION
A general description of the MFS funds’ proxy voting policies and procedures is available without charge, upon request, by calling
1-800-225-2606, by visiting the Proxy Voting section of mfs.com or by visiting the SEC’s Web site at http://www.sec.gov.
Information regarding how the fund voted proxies relating to portfolio securities during the most recent twelve-month period ended June 30 is available without charge by visiting the Proxy Voting section of mfs.com or by visiting the SEC’s Web site at http://www.sec.gov.
QUARTERLY PORTFOLIO DISCLOSURE
The fund will file a complete schedule of portfolio holdings with the Securities and Exchange Commission (the Commission) for the first and third quarters of each fiscal year on Form N-Q. The fund’s Form N-Q is available on the EDGAR database on the Commission’s Internet Web site at http://www.sec.gov and may be reviewed and copied at the:
Public Reference Room
Securities and Exchange Commission
100 F Street, NE, Room 1580
Washington, D.C. 20549
Information on the operation of the Public Reference Room may be obtained by calling the Commission at 1-800-SEC-0330. Copies of the fund’s Form N-Q also may be obtained, upon payment of a duplicating fee, by electronic request at the following e-mail address: publicinfo@sec.gov or by writing the Public Reference Section at the above address.
From time to time, MFS may post important information about the fund or the MFS funds on the MFS web site (mfs.com). This information is available by visiting the “News & Commentary” section of mfs.com or by clicking on the fund’s name under “Variable Insurance Portfolios — VIT II” in the “Products and Performance” section of mfs.com.
FEDERAL TAX INFORMATION (unaudited)
The following information is provided pursuant to provisions of the Internal Revenue Code.
The fund designates $20,184,000 as capital gain dividends paid during the fiscal year.
Income derived from foreign sources was $4,682,795. The fund intends to pass through foreign tax credits of $374,910 for the fiscal year.
29
Table of Contents
rev. 3/11

| Why? | Financial companies choose how they share your personal information. Federal law gives consumers the right to limit some but not all sharing. Federal law also requires us to tell you how we collect, share, and protect your personal information. Please read this notice carefully to understand what we do. |
| What? | The types of personal information we collect and share depend on the product or service you have with us. This information can include:
• Social Security number and account balances • Account transactions and transaction history • Checking account information and wire transfer instructions
When you are no longer our customer, we continue to share your information as described in this notice. |
| How? | All financial companies need to share customers’ personal information to run their everyday business. In the section below, we list the reasons financial companies can share their customers’ personal information; the reasons MFS chooses to share; and whether you can limit this sharing. |
| Reasons we can share your personal information | Does MFS share? | Can you limit this sharing? | ||
For our everyday business purposes – such as to process your transactions, maintain your account(s), respond to court orders and legal investigations, or report to credit bureaus | Yes | No | ||
For our marketing purposes – to offer our products and services to you | No | We don’t share | ||
| For joint marketing with other financial companies | No | We don’t share | ||
For our affiliates’ everyday business purposes – information about your transactions and experiences | No | We don’t share | ||
For our affiliates’ everyday business purposes – information about your creditworthiness | No | We don’t share | ||
| For nonaffiliates to market to you | No | We don’t share |
| Questions? | Call 800-225-2606 or go to mfs.com. |
30
Table of Contents
| Page 2 |
| Who we are | ||
| Who is providing this notice? | MFS Funds, MFS Investment Management, MFS Institutional Advisors, Inc., MFS Fund Distributors, Inc., MFS Heritage Trust Company, and MFS Service Center, Inc. | |
| What we do | ||
| How does MFS protect my personal information? | To protect your personal information from unauthorized access and use, we use security measures that comply with federal law. These measures include procedural, electronic, and physical safeguards for the protection of the personal information we collect about you. | |
| How does MFS collect my personal information? | We collect your personal information, for example, when you
• open an account or provide account information • direct us to buy securities or direct us to sell your securities • make a wire transfer
We also collect your personal information from others, such as credit bureaus, affiliates and other companies. | |
| Why can’t I limit all sharing? | Federal law gives you the right to limit only
• sharing for affiliates’ everyday business purposes – information about your creditworthiness • affiliates from using your information to market to you • sharing for nonaffiliates to market to you
State laws and individual companies may give you additional rights to limit sharing. | |
| Definitions | ||
| Affiliates | Companies related by common ownership or control. They can be financial and nonfinancial companies.
•MFS does not share personal information with affiliates, except for everyday business purposes as described on page one of this notice. | |
| Nonaffiliates | Companies not related by common ownership or control. They can be financial and nonfinancial companies.
•MFS does not share with nonaffiliates so they can market to you. | |
| Joint Marketing | A formal agreement between nonaffiliated financial companies that together market financial products or services to you.
•MFS doesn’t jointly market. | |
| Other important information | ||
| If you own an MFS product or receive an MFS service in the name of a third party such as a bank or broker-dealer, their privacy policy may apply to you instead of ours. | ||
31
Table of Contents

Table of Contents

MFS® Blended Research®
Core Equity Portfolio
MFS® Variable Insurance Trust II

ANNUAL REPORT
December 31, 2011
CGS-ANN
Table of Contents
MFS® BLENDED RESEARCH® CORE EQUITY PORTFOLIO
The report is prepared for the general information of contract owners.
It is authorized for distribution to prospective investors only when preceded or accompanied by a current prospectus.
NOT FDIC INSURED Ÿ MAY LOSE VALUE Ÿ NO BANK OR CREDIT UNION GUARANTEE Ÿ NOT A DEPOSIT Ÿ NOT INSURED BY ANY FEDERAL GOVERNMENT AGENCY OR NCUA/NCUSIF
Table of Contents
MFS Blended Research Core Equity Portfolio
LETTER FROM THE CHAIRMAN AND CEO

Dear Contract Owners:
We are indeed living through some volatile times. Economic uncertainty is everywhere, as it seems no place in the world has been unmoved by crisis. We have seen a devastating earthquake and tsunami that have led to disruptions in the Japanese markets
and supply chains. Protests have changed the face of the Middle East and left in their wake lingering tensions and resultant higher oil prices. We have seen debt limits tested in Europe and the United States and policymakers grappling to craft often unpopular monetary and fiscal responses at a time when consumers and businesses struggle with what appears to be a slowing global economy. On top of all of that, we have seen long-term U.S. debt lose its Standard & Poor’s AAA rating and the long-term debt ratings of 15 eurozone nations put on negative watch.
When markets become volatile, managing risk becomes a top priority for investors and their advisors. At MFS® risk management is foremost in our minds in all market climates. Our analysts and portfolio managers keep risks firmly in mind when evaluating securities. Additionally, we have a team of quantitative analysts that measures and assesses the risk profiles of our portfolios and securities on an ongoing basis. The chief investment risk officer, who oversees the team, reports directly to the firm’s president and chief investment officer so the risk associated with each portfolio can be assessed objectively and independently of the portfolio management team.
As always, we continue to be mindful of the many economic challenges faced at the local, national, and international levels. It is in times such as these that we want to remind investors of the merits of maintaining a long-term view, adhering to basic investing principles such as asset allocation and diversification, and working closely with their advisors to research and identify appropriate investment opportunities.
Respectfully,

Robert J. Manning
Chairman and Chief Executive Officer
MFS Investment Management®
February 15, 2012
The opinions expressed in this letter are subject to change, may not be relied upon for investment advice, and no forecasts can be guaranteed.
1
Table of Contents
MFS Blended Research Core Equity Portfolio
Portfolio structure

| Top ten holdings | ||||
| Exxon Mobil Corp. | 4.9% | |||
| Apple, Inc. | 4.3% | |||
| Chevron Corp. | 3.1% | |||
| Google, Inc., “A” | 2.7% | |||
| Intel Corp. | 2.2% | |||
| JPMorgan Chase & Co. | 2.2% | |||
| McDonald’s Corp. | 2.2% | |||
| Pfizer, Inc. | 2.1% | |||
| Procter & Gamble Co. | 2.0% | |||
| Abbott Laboratories | 1.9% |
| Equity sectors | ||||
| Technology | 16.7% | |||
| Financial Services | 14.2% | |||
| Energy | 12.2% | |||
| Health Care | 12.1% | |||
| Consumer Staples | 9.2% | |||
| Industrial Goods & Services | 7.4% | |||
| Retailing | 6.5% | |||
| Utilities & Communications | 6.1% | |||
| Leisure | 5.0% | |||
| Basic Materials | 4.4% | |||
| Autos & Housing | 2.1% | |||
| Transportation | 1.7% | |||
| Special Products & Services | 1.7% |
Percentages are based on net assets as of 12/31/11.
The portfolio is actively managed and current holdings may be different.
2
Table of Contents
MFS Blended Research Core Equity Portfolio
Summary of Results
For the twelve months ended December 31, 2011, Initial Class shares of the MFS Blended Research Core Equity Portfolio (the “fund”) provided a total return of 1.97%, while Service Class shares of the fund provided a total return of 1.74%. These compare with a return of 2.11% for the fund’s benchmark, the Standard & Poor’s 500 Stock Index (“S&P 500 Index”).
Market Environment
Early in the period, the U.S. Federal Reserve (the “Fed”) responded to weak economic growth by loosening monetary policy further. More easing by the Fed improved market sentiment and drove risk-asset prices markedly higher. The December 2010 agreement on a surprisingly large (relative to expectations) expansionary U.S. fiscal package also boosted sentiment. During the subsequent several months, the renewed positive market sentiment, coupled with better indications of global macroeconomic activity, pushed many asset valuations to post-crisis highs. At the same time, the yields of the perceived “safest” global sovereign credits rose, indicating a renewed risk-seeking environment.
However, towards the middle of the period, a weakening macroeconomic backdrop and renewed concerns over peripheral euro zone sovereign debt caused a flight-to-quality move that pushed high-quality sovereign bond yields lower. In the U.S., concerns about sovereign debt default and the long-term sustainability of the trend in U.S. fiscal policy resulted in one agency downgrading U.S. credit quality. Amidst this turmoil, global equity markets declined sharply. As a result of these developments, global consumer and producer sentiment indicators fell precipitously and highly-rated sovereign bond yields hit multi-decade lows. Towards the end of the reporting period, uncertainty in financial markets spiked higher as markets more seriously contemplated the possible failure of the euro zone.
Detractors from Performance
Stock selection in the utilities & communications sector had a negative impact on performance relative to the S&P 500 Index. The fund’s ownership in shares of weak-performing wireless telecommunications carrier Metro PCS (h) hindered relative results as the company faced heightened competition and management raised capital expenditure projections on the 3G data network due to increased Smartphone adoption.
Elsewhere, top relative detractors for the period included the fund’s holdings of financial services firm Citigroup, footwear company Crocs (b)(h), multi-line insurer Hartford Financial Services, for-profit education provider ITT Educational Services (b), supplemental health and life insurer Aflac, oilfield services provider Halliburton, multi-industrial company Johnson Controls, and cruise line operator Royal Caribbean Cruises (b)(h). Shares of Citigroup underperformed the market as investors appeared to have been concerned about the firm’s level of exposure to Europe and the potential impact from an uptick in U.S. residential mortgage delinquencies over the coming year. After appreciating steadily during the first three quarters of the year, Crocs reported revenue that came in slightly below expectations as management lowered revenue and earnings guidance for the fourth quarter. Shares of Hartford Financial Services declined throughout the period due, in part, to concerns about the capital adequacy of the company’s life and annuity businesses as well as the negative impacts from charges for workers compensation. The fund’s underweight position in strong-performing diversified technology products and services company International Business Machines (IBM) also weakened relative results.
Contributors to Performance
Stock selection in the energy, health care, and technology sectors contributed positively to relative performance. There were no individual stocks within the energy sector that were among the fund’s top relative contributors. In the health care sector, holding health insurance companies, Aetna and Humana (h), boosted relative results. Shares appreciated as both companies reported higher-than-expected earnings due to a trend in lower utilization rates, acquisition activity, and an increase in stock repurchases. In the technology sector, the timing of the fund’s ownership in shares of computer products and services provider Hewlett-Packard aided relative performance. Shares of Hewlett-Packard declined throughout the period as investor confidence of the weakening business appeared to have been further shaken by the board’s decision to fire CEO Leo Apotheker in September after only eleven months on the job and hire former eBay CEO, Meg Whitman, to take his place. Additionally, the company had been plagued by slower growth in its PC division, internal problems in its services division, and a weaker balance sheet primarily from prior acquisitions.
3
Table of Contents
MFS Blended Research Core Equity Portfolio
Management Review – continued
Elsewhere, the fund’s holdings of fast-food company giant McDonald’s, media company CBS (h), department stores operator Macy’s, gas pipeline company El Paso (h), and financial services company American Express (h) benefited relative performance as all five stocks outperformed the benchmark. Additionally, the timing of the fund’s ownership in shares of precious metals company Freeport-McMoRan (h) and investment banking firm Goldman Sachs (h) supported relative results. Freeport-McMoRan experienced lower copper and gold sales due to lower production from its open-pit Grasberg mine in Indonesia. Its shares were down substantially after a labor dispute at the Grasberg mine, that lasted from September to December, stalled production.
Respectfully,
Matthew Krummell
Portfolio Manager
| (b) | Security is not a benchmark constituent. |
| (h) | Security was not held in the fund at period end. |
The views expressed in this report are those of the portfolio manager only through the end of the period of the report as stated on the cover and do not necessarily reflect the views of MFS or any other person in the MFS organization. These views are subject to change at any time based on market or other conditions, and MFS disclaims any responsibility to update such views. These views may not be relied upon as investment advice or an indication of trading intent on behalf of any MFS portfolio. References to specific securities are not recommendations of such securities, and may not be representative of any MFS portfolio’s current or future investments.
4
Table of Contents
MFS Blended Research Core Equity Portfolio
PERFORMANCE SUMMARY THROUGH 12/31/11
The following chart illustrates the historical performance of the fund in comparison to its benchmark(s). Benchmarks are unmanaged and may not be invested in directly. Benchmark returns do not reflect any fees or expenses. The performance of other share classes will be greater than or less than that of the class depicted below. (See Notes to Performance Summary.)
Performance data shown represents past performance and is no guarantee of future results. Investment return and principal value fluctuate so your units, when sold, may be worth more or less than the original cost; current performance may be lower or higher than quoted. The performance shown does not reflect the deduction of taxes, if any, that a contract holder would pay on fund distributions or the redemption of contract units. The returns for the fund shown also do not reflect the deduction of expenses associated with variable products, such as mortality and expense risk charges, separate account charges, and sales charges imposed by the insurance company separate accounts. Such expenses would reduce the overall returns shown.
Growth of a Hypothetical $10,000 Investment
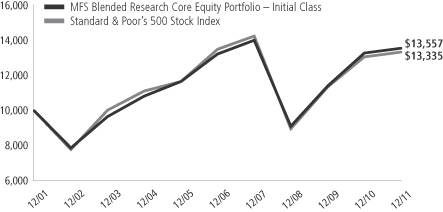
Total Returns through 12/31/11
Average annual total returns
| Share class | Class inception date | 1-yr | 5-yr | 10-yr | ||||||||
| Initial Class | 11/14/86 | 1.97% | 0.50% | 3.09% | ||||||||
| Service Class | 8/24/01 | 1.74% | 0.25% | 2.83% | ||||||||
| Comparative benchmark | ||||||||||||
| Standard & Poor’s 500 Stock Index (f) | 2.11% | (0.25)% | 2.92% | |||||||||
| (f) | Source: FactSet Research Systems Inc. |
Benchmark Definition
Standard & Poor’s 500 Stock Index – a market capitalization-weighted index of 500 widely held equity securities, designed to measure broad U.S. equity performance.
It is not possible to invest directly in an index.
Notes to Performance Summary
Average annual total return represents the average annual change in value for each share class for the periods presented.
Performance results reflect any applicable expense subsidies and waivers in effect during the periods shown. Without such subsidies and waivers the fund’s performance results would be less favorable. Please see the prospectus and financial statements for complete details. All results are historical and assume the reinvestment of any dividends and capital gains distributions.
Performance results do not include adjustments made for financial reporting purposes in accordance with U.S. generally accepted accounting principles and may differ from amounts reported in the financial highlights.
Prior to June 22, 2007, the fund’s investments were primarily selected based on fundamental analysis. Beginning June 22, 2007, the fund’s investments are selected based on fundamental and quantitative analysis.
From time to time the fund may receive proceeds from litigation settlements, without which performance would be lower.
5
Table of Contents
MFS Blended Research Core Equity Portfolio
Fund Expenses Borne by the Contract Holders During the Period,
July 1, 2011 through December 31, 2011
As a contract holder of the fund, you incur ongoing costs, including management fees; distribution and/or service (12b-1) fees; and other fund expenses. This example is intended to help you understand your ongoing costs (in dollars) of investing in the fund and to compare these costs with the ongoing costs of investing in other mutual funds.
The example is based on an investment of $1,000 invested at the beginning of the period and held for the entire period July 1, 2011 through December 31, 2011.
Actual Expenses
The first line for each share class in the following table provides information about actual account values and actual expenses. You may use the information in this line, together with the amount you invested, to estimate the expenses that you paid over the period. Simply divide your account value by $1,000 (for example, an $8,600 account value divided by $1,000 = 8.6), then multiply the result by the number in the first line under the heading entitled “Expenses Paid During Period” to estimate the expenses you paid on your account during this period.
Hypothetical Example for Comparison Purposes
The second line for each share class in the following table provides information about hypothetical account values and hypothetical expenses based on the fund’s actual expense ratio and an assumed rate of return of 5% per year before expenses, which is not the fund’s actual return. The hypothetical account values and expenses may not be used to estimate the actual ending account balance or expenses you paid for the period. You may use this information to compare the ongoing costs of investing in the fund and other funds. To do so, compare this 5% hypothetical example with the 5% hypothetical examples that appear in the shareholder reports of the other funds.
Please note that the expenses shown in the table are meant to highlight the fund’s ongoing costs only and do not take into account the fees and expenses imposed under the variable contracts through which your investment in the fund is made. Therefore, the second line for each share class in the table is useful in comparing ongoing costs associated with an investment in vehicles (such as the fund) which fund benefits under variable annuity and variable life insurance contracts and to qualified pension and retirement plans only, and will not help you determine the relative total costs of investing in the fund through variable annuity and variable life insurance contracts. If the fees and expenses imposed under the variable contracts were included, your costs would have been higher.
| Share Class | Annualized Expense Ratio | Beginning Account Value 7/01/11 | Ending Account Value 12/31/11 | Expenses Paid During Period (p) 7/01/11-12/31/11 | ||||||||||||||
| Initial Class | Actual | 0.60% | $1,000.00 | $943.13 | $2.94 | |||||||||||||
| Hypothetical (h) | 0.60% | $1,000.00 | $1,022.18 | $3.06 | ||||||||||||||
| Service Class | Actual | 0.85% | $1,000.00 | $942.10 | $4.16 | |||||||||||||
| Hypothetical (h) | 0.85% | $1,000.00 | $1,020.92 | $4.33 | ||||||||||||||
| (h) | 5% class return per year before expenses. |
| (p) | Expenses paid is equal to each class’ annualized expense ratio, as shown above, multiplied by the average account value over the period, multiplied by the number of days in the period, divided by the number of days in the year. |
6
Table of Contents
MFS Blended Research Core Equity Portfolio
PORTFOLIO OF INVESTMENTS – 12/31/11
The Portfolio of Investments is a complete list of all securities owned by your fund. It is categorized by broad-based asset classes.
| Issuer | Shares/Par | Value ($) | ||||||
| COMMON STOCKS – 99.3% | ||||||||
| Aerospace – 3.6% | ||||||||
| Lockheed Martin Corp. | 58,580 | $ | 4,739,114 | |||||
| Northrop Grumman Corp. | 90,850 | 5,312,908 | ||||||
| United Technologies Corp. | 87,480 | 6,393,913 | ||||||
|
| |||||||
| $ | 16,445,935 | |||||||
|
| |||||||
| Automotive – 1.2% | ||||||||
| Johnson Controls, Inc. | 181,010 | $ | 5,658,373 | |||||
|
| |||||||
| Biotechnology – 2.0% | ||||||||
| Amgen, Inc. | 119,220 | $ | 7,655,116 | |||||
| Gilead Sciences, Inc. (a) | 45,050 | 1,843,897 | ||||||
|
| |||||||
| $ | 9,499,013 | |||||||
|
| |||||||
| Broadcasting – 0.5% | ||||||||
| Viacom, Inc., “B” | 48,150 | $ | 2,186,492 | |||||
|
| |||||||
| Brokerage & Asset Managers – 0.5% | ||||||||
| CME Group, Inc. | 10,030 | $ | 2,444,010 | |||||
|
| |||||||
| Business Services – 1.1% | ||||||||
| Accenture PLC, “A” | 93,790 | $ | 4,992,442 | |||||
|
| |||||||
| Cable TV – 2.3% | ||||||||
| DIRECTV, “A” (a) | 123,910 | $ | 5,298,392 | |||||
| Time Warner Cable, Inc. | 83,690 | 5,320,173 | ||||||
|
| |||||||
| $ | 10,618,565 | |||||||
|
| |||||||
| Chemicals – 1.5% | ||||||||
| 3M Co. | 40,770 | $ | 3,332,132 | |||||
| CF Industries Holdings, Inc. | 23,740 | 3,441,825 | ||||||
|
| |||||||
| $ | 6,773,957 | |||||||
|
| |||||||
| Computer Software – 4.6% | ||||||||
| Microsoft Corp. | 167,180 | $ | 4,339,993 | |||||
| Nuance Communications, Inc. (a) | 185,180 | 4,659,129 | ||||||
| Oracle Corp. | 304,080 | 7,799,652 | ||||||
| Symantec Corp. (a) | 276,130 | 4,321,435 | ||||||
|
| |||||||
| $ | 21,120,209 | |||||||
|
| |||||||
| Computer Software – Systems – 6.4% | ||||||||
| Apple, Inc. (a) | 49,580 | $ | 20,079,900 | |||||
| Hewlett-Packard Co. | 185,360 | 4,774,874 | ||||||
| International Business Machines Corp. | 25,100 | 4,615,388 | ||||||
|
| |||||||
| $ | 29,470,162 | |||||||
|
| |||||||
| Construction – 0.9% | ||||||||
| Owens Corning (a) | 146,440 | $ | 4,205,757 | |||||
|
| |||||||
| Consumer Products – 2.0% | ||||||||
| Procter & Gamble Co. | 137,410 | $ | 9,166,621 | |||||
|
| |||||||
| Consumer Services – 0.6% | ||||||||
| ITT Educational Services, Inc. (a)(l) | 46,550 | $ | 2,648,230 | |||||
|
| |||||||
| Electrical Equipment – 1.8% | ||||||||
| General Electric Co. | 280,320 | $ | 5,020,531 | |||||
| Tyco International Ltd. | 73,900 | 3,451,869 | ||||||
|
| |||||||
| $ | 8,472,400 | |||||||
|
| |||||||
| Issuer | Shares/Par | Value ($) | ||||||
| COMMON STOCKS – continued | ||||||||
| Electronics – 2.2% | ||||||||
| Intel Corp. | 424,990 | $ | 10,306,008 | |||||
|
| |||||||
| Energy – Independent – 1.5% | ||||||||
| Apache Corp. | 43,600 | $ | 3,949,288 | |||||
| CVR Energy, Inc. (a) | 68,830 | 1,289,186 | ||||||
| HollyFrontier Corp. | 80,980 | 1,894,932 | ||||||
|
| |||||||
| $ | 7,133,406 | |||||||
|
| |||||||
| Energy – Integrated – 9.2% | ||||||||
| Chevron Corp. | 134,130 | $ | 14,271,432 | |||||
| ConocoPhillips | 74,720 | 5,444,846 | ||||||
| Exxon Mobil Corp. | 269,300 | 22,825,868 | ||||||
|
| |||||||
| $ | 42,542,146 | |||||||
|
| |||||||
| Food & Beverages – 4.6% | ||||||||
| Coca-Cola Co. | 21,500 | $ | 1,504,355 | |||||
| Coca-Cola Enterprises, Inc. | 192,970 | 4,974,767 | ||||||
| Dr Pepper Snapple Group, Inc. | 139,230 | 5,496,800 | ||||||
| General Mills, Inc. | 153,270 | 6,193,641 | ||||||
| PepsiCo, Inc. | 48,640 | 3,227,264 | ||||||
|
| |||||||
| $ | 21,396,827 | |||||||
|
| |||||||
| Food & Drug Stores – 2.7% | ||||||||
| CVS Caremark Corp. | 181,930 | $ | 7,419,105 | |||||
| Kroger Co. | 207,080 | 5,015,478 | ||||||
|
| |||||||
| $ | 12,434,583 | |||||||
|
| |||||||
| General Merchandise – 1.7% | ||||||||
| Kohl’s Corp. | 15,250 | $ | 752,588 | |||||
| Macy’s, Inc. | 215,810 | 6,944,766 | ||||||
|
| |||||||
| $ | 7,697,354 | |||||||
|
| |||||||
| Health Maintenance Organizations – 1.2% | ||||||||
| Aetna, Inc. | 131,350 | $ | 5,541,657 | |||||
|
| |||||||
| Insurance – 4.4% | ||||||||
| ACE Ltd. | 27,830 | $ | 1,951,440 | |||||
| Aflac, Inc. | 49,350 | 2,134,881 | ||||||
| Berkshire Hathaway, Inc., “B” (a) | 7,920 | 604,296 | ||||||
| Chubb Corp. | 36,370 | 2,517,531 | ||||||
| Hartford Financial Services Group, Inc. | 282,810 | 4,595,663 | ||||||
| Prudential Financial, Inc. | 101,560 | 5,090,187 | ||||||
| Travelers Cos., Inc. | 59,730 | 3,534,224 | ||||||
|
| |||||||
| $ | 20,428,222 | |||||||
|
| |||||||
| Internet – 2.7% | ||||||||
| Google, Inc., “A” (a) | 19,530 | $ | 12,614,427 | |||||
|
| |||||||
| Machinery & Tools – 1.1% | ||||||||
| Cummins, Inc. | 55,990 | $ | 4,928,240 | |||||
|
| |||||||
| Major Banks – 4.1% | ||||||||
| JPMorgan Chase & Co. | 305,840 | $ | 10,169,180 | |||||
| KeyCorp | 372,430 | 2,863,987 | ||||||
| PNC Financial Services Group, Inc. | 86,890 | 5,010,946 | ||||||
7
Table of Contents
MFS Blended Research Core Equity Portfolio
Portfolio of Investments – continued
| Issuer | Shares/Par | Value ($) | ||||||
| COMMON STOCKS – continued | ||||||||
| Major Banks – continued | ||||||||
| Wells Fargo & Co. | 37,180 | $ | 1,024,681 | |||||
|
| |||||||
| $ | 19,068,794 | |||||||
|
| |||||||
| Medical & Health Technology & Services – 1.9% | ||||||||
| HCA Holdings, Inc. (a) | 133,130 | $ | 2,932,854 | |||||
| McKesson Corp. | 73,250 | 5,706,908 | ||||||
|
| |||||||
| $ | 8,639,762 | |||||||
|
| |||||||
| Medical Equipment – 1.4% | ||||||||
| Medtronic, Inc. | 75,770 | $ | 2,898,203 | |||||
| Thermo Fisher Scientific, Inc. (a) | 75,680 | 3,403,330 | ||||||
|
| |||||||
| $ | 6,301,533 | |||||||
|
| |||||||
| Metals & Mining – 1.0% | ||||||||
| Cliffs Natural Resources, Inc. | 73,200 | $ | 4,564,020 | |||||
|
| |||||||
| Network & Telecom – 0.8% | ||||||||
| F5 Networks, Inc. (a) | 35,430 | $ | 3,759,832 | |||||
|
| |||||||
| Oil Services – 1.5% | ||||||||
| Halliburton Co. | 169,610 | $ | 5,853,241 | |||||
| National Oilwell Varco, Inc. | 19,030 | 1,293,850 | ||||||
|
| |||||||
| $ | 7,147,091 | |||||||
|
| |||||||
| Other Banks & Diversified Financials – 4.1% | ||||||||
| Capital One Financial Corp. | 124,420 | $ | 5,261,722 | |||||
| Citigroup, Inc. | 279,093 | 7,342,937 | ||||||
| Discover Financial Services | 224,910 | 5,397,840 | ||||||
| SLM Corp. | 89,120 | 1,194,208 | ||||||
|
| |||||||
| $ | 19,196,707 | |||||||
|
| |||||||
| Pharmaceuticals – 5.6% | ||||||||
| Abbott Laboratories | 156,910 | $ | 8,823,049 | |||||
| Johnson & Johnson | 108,340 | 7,104,937 | ||||||
| Pfizer, Inc. | 456,520 | 9,879,093 | ||||||
|
| |||||||
| $ | 25,807,079 | |||||||
|
| |||||||
| Pollution Control – 0.9% | ||||||||
| Republic Services, Inc. | 144,360 | $ | 3,977,118 | |||||
|
| |||||||
| Precious Metals & Minerals – 0.7% | ||||||||
| Coeur d’Alene Mines Corp. (a) | 133,550 | $ | 3,223,897 | |||||
|
| |||||||
| Railroad & Shipping – 0.9% | ||||||||
| CSX Corp. | 194,980 | $ | 4,106,279 | |||||
|
| |||||||
| Real Estate – 1.1% | ||||||||
| Annaly Mortgage Management, Inc., REIT | 258,520 | $ | 4,125,979 | |||||
| Public Storage, Inc., REIT | 8,870 | 1,192,660 | ||||||
|
| |||||||
| $ | 5,318,639 | |||||||
|
| |||||||
| Restaurants – 2.2% | ||||||||
| McDonald’s Corp. | 99,720 | $ | 10,004,908 | |||||
|
| |||||||
| Specialty Chemicals – 1.2% | ||||||||
| Airgas, Inc. | 71,430 | $ | 5,577,254 | |||||
|
| |||||||
| Issuer | Shares/Par | Value ($) | ||||||
| COMMON STOCKS – continued | ||||||||
| Specialty Stores – 2.1% | ||||||||
| IAC/InterActiveCorp | 75,300 | $ | 3,207,780 | |||||
| PetSmart, Inc. | 79,620 | 4,083,710 | ||||||
| Ross Stores, Inc. | 56,220 | 2,672,137 | ||||||
|
| |||||||
| $ | 9,963,627 | |||||||
|
| |||||||
| Telephone Services – 2.8% | ||||||||
| AT&T, Inc. | 113,700 | $ | 3,438,288 | |||||
| CenturyLink, Inc. | 135,980 | 5,058,456 | ||||||
| Verizon Communications, Inc. | 106,290 | 4,264,355 | ||||||
|
| |||||||
| $ | 12,761,099 | |||||||
|
| |||||||
| Tobacco – 2.6% | ||||||||
| Altria Group, Inc. | 208,330 | $ | 6,176,985 | |||||
| Philip Morris International, Inc. | 76,950 | 6,039,036 | ||||||
|
| |||||||
| $ | 12,216,021 | |||||||
|
| |||||||
| Trucking – 0.8% | ||||||||
| United Parcel Service, Inc., “B” | 53,330 | $ | 3,903,223 | |||||
|
| |||||||
| Utilities – Electric Power – 3.3% | ||||||||
| AES Corp. (a) | 427,810 | $ | 5,065,270 | |||||
| American Electric Power Co., Inc. | 111,920 | 4,623,415 | ||||||
| CenterPoint Energy, Inc. | 81,790 | 1,643,161 | ||||||
| PG&E Corp. | 95,310 | 3,928,678 | ||||||
|
| |||||||
| $ | 15,260,524 | |||||||
|
| |||||||
| Total Common Stocks (Identified Cost, $443,004,576) | $ | 459,522,443 | ||||||
|
| |||||||
| MONEY MARKET FUNDS – 0.1% | ||||||||
| MFS Institutional Money Market Portfolio, 0.05%, at Cost and Net Asset Value (v) | 632,653 | $ | 632,653 | |||||
|
| |||||||
| COLLATERAL FOR SECURITIES LOANED – 0.4% | ||||||||
| Navigator Securities Lending Prime Portfolio, 0.27%, at Cost and Net Asset Value (j) | 1,996,384 | $ | 1,996,384 | |||||
|
| |||||||
| Total Collateral for Securities Loaned (Identified Cost, $1,996,384) | $ | 1,996,384 | ||||||
|
| |||||||
| Total Investments (Identified Cost, $445,633,613) | $ | 462,151,480 | ||||||
|
| |||||||
| OTHER ASSETS, LESS LIABILITIES – 0.2% | 845,347 | |||||||
|
| |||||||
| Net Assets – 100.0% | $ | 462,996,827 | ||||||
|
| |||||||
| (a) | Non-income producing security. |
| (j) | The rate quoted is the annualized seven-day yield of the portfolio at period end. |
| (l) | A portion of this security is on loan. |
| (v) | Underlying affiliated fund that is available only to investment companies managed by MFS. The rate quoted for the MFS Institutional Money Market Portfolio is the annualized seven-day yield of the fund at period end. |
The following abbreviations are used in this report and are defined:
| PLC | Public Limited Company |
| REIT | Real Estate Investment Trust |
See Notes to Financial Statements
8
Table of Contents
MFS Blended Research Core Equity Portfolio
FINANCIAL STATEMENTS | STATEMENT OF ASSETS AND LIABILITIES
This statement represents your fund’s balance sheet, which details the assets and liabilities comprising the total value of the fund.
At 12/31/11 | ||||||||
Assets | ||||||||
Investments – | ||||||||
Non-affiliated issuers, at value (identified cost, $445,000,960) | $461,518,827 | |||||||
Underlying affiliated funds, at cost and value | 632,653 | |||||||
Total investments, at value, including $1,933,179 of securities on loan (identified cost, $445,633,613) | $462,151,480 | |||||||
Receivables for | ||||||||
Investments sold | 2,763,688 | |||||||
Fund shares sold | 57,483 | |||||||
Interest and dividends | 693,790 | |||||||
Other assets | 13,299 | |||||||
Total assets | $465,679,740 | |||||||
Liabilities | ||||||||
Payable for fund shares reacquired | $562,624 | |||||||
Collateral for securities loaned, at value | 1,996,384 | |||||||
Payable to affiliates | ||||||||
Investment adviser | 21,818 | |||||||
Shareholder servicing costs | 343 | |||||||
Distribution and/or service fees | 3,046 | |||||||
Payable for Trustees’ compensation | 1,009 | |||||||
Accrued expenses and other liabilities | 97,689 | |||||||
Total liabilities | $2,682,913 | |||||||
Net assets | $462,996,827 | |||||||
Net assets consist of | ||||||||
Paid-in capital | $557,007,368 | |||||||
Unrealized appreciation (depreciation) on investments | 16,517,867 | |||||||
Accumulated net realized gain (loss) on investments | (117,871,377 | ) | ||||||
Undistributed net investment income | 7,342,969 | |||||||
Net assets | $462,996,827 | |||||||
Shares of beneficial interest outstanding | 14,564,409 |
| Net assets | Shares outstanding | Net asset value per share | ||||||||||
Initial Class | $315,114,853 | 9,891,634 | $31.86 | |||||||||
Service Class | 147,881,974 | 4,672,775 | 31.65 | |||||||||
See Notes to Financial Statements
9
Table of Contents
MFS Blended Research Core Equity Portfolio
FINANCIAL STATEMENTS | STATEMENT OF OPERATIONS
This statement describes how much your fund earned in investment income and accrued in expenses. It also describes any gains and/or losses generated by fund operations.
| Year ended 12/31/11 | ||||||||
Net investment income | ||||||||
Income | ||||||||
Dividends | $10,835,002 | |||||||
Interest | 10,604 | |||||||
Dividends from underlying affiliated funds | 2,888 | |||||||
Total investment income | $10,848,494 | |||||||
Expenses | ||||||||
Management fee | $2,819,160 | |||||||
Distribution and/or service fees | 424,029 | |||||||
Shareholder servicing costs | 55,617 | |||||||
Administrative services fee | 170,473 | |||||||
Trustees’ compensation | 57,278 | |||||||
Custodian fee | 45,661 | |||||||
Shareholder communications | 19,683 | |||||||
Auditing fees | 46,202 | |||||||
Legal fees | 5,590 | |||||||
Miscellaneous | 40,287 | |||||||
Total expenses | $3,683,980 | |||||||
Fees paid indirectly | (4 | ) | ||||||
Reduction of expenses by investment adviser | (179,574 | ) | ||||||
Net expenses | $3,504,402 | |||||||
Net investment income | $7,344,092 | |||||||
Realized and unrealized gain (loss) on investments | ||||||||
Realized gain (loss) on investment transactions (identified cost basis) | $30,452,125 | |||||||
Change in unrealized appreciation (depreciation) on investments | $(26,479,652 | ) | ||||||
Net realized and unrealized gain (loss) on investments | $3,972,473 | |||||||
Change in net assets from operations | $11,316,565 |
See Notes to Financial Statements
10
Table of Contents
MFS Blended Research Core Equity Portfolio
FINANCIAL STATEMENTS | STATEMENTS OF CHANGES IN NET ASSETS
These statements describe the increases and/or decreases in net assets resulting from operations, any distributions, and any shareholder transactions.
For years ended 12/31 | 2011 | 2010 | ||||||
Change in net assets | ||||||||
| From operations | ||||||||
Net investment income | $7,344,092 | $9,058,282 | ||||||
Net realized gain (loss) on investments | 30,452,125 | 30,651,867 | ||||||
Net unrealized gain (loss) on investments | (26,479,652 | ) | 41,875,927 | |||||
Change in net assets from operations | $11,316,565 | $81,586,076 | ||||||
Distributions declared to shareholders | ||||||||
From net investment income | $(9,057,199 | ) | $(9,141,057 | ) | ||||
Change in net assets from fund share transactions | $(84,728,511 | ) | $(87,431,906 | ) | ||||
Total change in net assets | $(82,469,145 | ) | $(14,986,887 | ) | ||||
| Net assets | ||||||||
At beginning of period | 545,465,972 | 560,452,859 | ||||||
At end of period (including undistributed net investment income of $7,342,969 and | $462,996,827 | $545,465,972 |
See Notes to Financial Statements
11
Table of Contents
MFS Blended Research Core Equity Portfolio
FINANCIAL STATEMENTS | FINANCIAL HIGHLIGHTS
The financial highlights table is intended to help you understand the fund’s financial performance for the past 5 years. Certain information reflects financial results for a single fund share. The total returns in the table represent the rate by which an investor would have earned (or lost) on an investment in the fund share class (assuming reinvestment of all distributions) held for the entire period.
| Initial Class | Years ended 12/31 | |||||||||||||||||||
| 2011 | 2010 | 2009 | 2008 | 2007 | ||||||||||||||||
Net asset value, beginning of period | $31.89 | $27.84 | $22.80 | $35.51 | $33.89 | |||||||||||||||
| Income (loss) from investment operations | ||||||||||||||||||||
Net investment income (d) | $0.49 | $0.51 | $0.43 | $0.48 | $0.38 | |||||||||||||||
Net realized and unrealized gain (loss) on investments | 0.10 | 4.05 | 5.16 | (12.74 | ) | 1.64 | ||||||||||||||
Total from investment operations | $0.59 | $4.56 | $5.59 | $(12.26 | ) | $2.02 | ||||||||||||||
| Less distributions declared to shareholders | ||||||||||||||||||||
From net investment income | $(0.62 | ) | $(0.51 | ) | $(0.55 | ) | $(0.45 | ) | $(0.40 | ) | ||||||||||
Net asset value, end of period (x) | $31.86 | $31.89 | $27.84 | $22.80 | $35.51 | |||||||||||||||
Total return (%) (k)(r)(s)(x) | 1.97 | 16.46 | 25.26 | (34.95 | ) | 5.95 | ||||||||||||||
| Ratios (%) (to average net assets) and Supplemental data: | ||||||||||||||||||||
Expenses before expense reductions (f) | 0.64 | 0.65 | 0.66 | 0.64 | 0.62 | |||||||||||||||
Expenses after expense reductions (f) | 0.60 | 0.60 | 0.60 | 0.60 | 0.61 | |||||||||||||||
Net investment income | 1.52 | 1.77 | 1.81 | 1.60 | 1.07 | |||||||||||||||
Portfolio turnover | 77 | 68 | 74 | 76 | 102 | |||||||||||||||
Net assets at end of period (000 omitted) | $315,115 | $360,667 | $361,105 | $342,241 | $673,008 | |||||||||||||||
| Service Class | Years ended 12/31 | |||||||||||||||||||
| 2011 | 2010 | 2009 | 2008 | 2007 | ||||||||||||||||
Net asset value, beginning of period | $31.66 | $27.66 | $22.62 | $35.23 | $33.65 | |||||||||||||||
| Income (loss) from investment operations | ||||||||||||||||||||
Net investment income (d) | $0.41 | $0.44 | $0.37 | $0.41 | $0.29 | |||||||||||||||
Net realized and unrealized gain (loss) on investments | 0.11 | 4.00 | 5.14 | (12.66 | ) | 1.63 | ||||||||||||||
Total from investment operations | $0.52 | $4.44 | $5.51 | $(12.25 | ) | $1.92 | ||||||||||||||
| Less distributions declared to shareholders | ||||||||||||||||||||
From net investment income | $(0.53 | ) | $(0.44 | ) | $(0.47 | ) | $(0.36 | ) | $(0.34 | ) | ||||||||||
Net asset value, end of period (x) | $31.65 | $31.66 | $27.66 | $22.62 | $35.23 | |||||||||||||||
Total return (%) (k)(r)(s)(x) | 1.74 | 16.12 | 25.00 | (35.12 | ) | 5.69 | ||||||||||||||
| Ratios (%) (to average net assets) and Supplemental data: | ||||||||||||||||||||
Expenses before expense reductions (f) | 0.89 | 0.90 | 0.91 | 0.90 | 0.87 | |||||||||||||||
Expenses after expense reductions (f) | 0.85 | 0.85 | 0.85 | 0.85 | 0.86 | |||||||||||||||
Net investment income | 1.26 | 1.52 | 1.57 | 1.35 | 0.84 | |||||||||||||||
Portfolio turnover | 77 | 68 | 74 | 76 | 102 | |||||||||||||||
Net assets at end of period (000 omitted) | $147,882 | $184,799 | $199,348 | $193,658 | $338,647 | |||||||||||||||
| (d) | Per share data is based on average shares outstanding. |
| (f) | Ratios do not reflect reductions from fees paid indirectly, if applicable. |
| (k) | The total return does not reflect expenses that apply to separate accounts. Inclusion of these charges would reduce the total return figures for all periods shown. |
| (r) | Certain expenses have been reduced without which performance would have been lower. |
| (s) | From time to time the fund may receive proceeds from litigation settlements, without which performance would be lower. |
| (x) | The net asset values per share and total returns have been calculated on net assets which include adjustments made in accordance with U.S. generally accepted accounting principles required at period end for financial reporting purposes. |
See Notes to Financial Statements
12
Table of Contents
MFS Blended Research Core Equity Portfolio
| (1) | Business and Organization |
MFS Blended Research Core Equity Portfolio (the fund) is a series of MFS Variable Insurance Trust II (the trust). The trust is organized as a Massachusetts business trust and is registered under the Investment Company Act of 1940, as amended, as an open-end management investment company. The shareholders of each series of the trust are separate accounts of insurance companies, which offer variable annuity and/or life insurance products, and qualified retirement and pension plans.
| (2) | Significant Accounting Policies |
General – The preparation of financial statements in conformity with U.S. generally accepted accounting principles requires management to make estimates and assumptions that affect the reported amounts of assets and liabilities, and disclosure of contingent assets and liabilities at the date of the financial statements and the reported amounts of revenues and expenses during the reporting period. Actual results could differ from those estimates. In the preparation of these financial statements, management has evaluated subsequent events occurring after the date of the fund’s Statement of Assets and Liabilities through the date that the financial statements were issued.
In December 2011, the Financial Accounting Standards Board issued Accounting Standards Update 2011-11, Balance Sheet (Topic 210) – Disclosures about Offsetting Assets and Liabilities (“ASU 2011-11”). Effective for annual reporting periods beginning on or after January 1, 2013 and interim periods within those annual periods, ASU 2011-11 is intended to enhance disclosure requirements on the offsetting of financial assets and liabilities. Although still evaluating the potential impacts of ASU 2011-11 to the fund, management expects that the impact of the fund’s adoption will be limited to additional financial statement disclosures.
Investment Valuations – Equity securities, including restricted equity securities, are generally valued at the last sale or official closing price as provided by a third-party pricing service on the market or exchange on which they are primarily traded. Equity securities, for which there were no sales reported that day, are generally valued at the last quoted daily bid quotation as provided by a third-party pricing service on the market or exchange on which such securities are primarily traded. Equity securities held short, for which there were no sales reported for that day, are generally valued at the last quoted daily ask quotation as provided by a third-party pricing service on the market or exchange on which such securities are primarily traded. Short-term instruments with a maturity at issuance of 60 days or less generally are valued at amortized cost, which approximates market value. Open-end investment companies are generally valued at net asset value per share. Securities and other assets generally valued on the basis of information from a third-party pricing service may also be valued at a broker/dealer bid quotation. Values obtained from third-party pricing services can utilize both transaction data and market information such as yield, quality, coupon rate, maturity, type of issue, trading characteristics, and other market data.
The Board of Trustees has delegated primary responsibility for determining or causing to be determined the value of the fund’s investments (including any fair valuation) to the adviser pursuant to valuation policies and procedures approved by the Board. If the adviser determines that reliable market quotations are not readily available, investments are valued at fair value as determined in good faith by the adviser in accordance with such procedures under the oversight of the Board of Trustees. Under the fund’s valuation policies and procedures, market quotations are not considered to be readily available for most types of debt instruments and floating rate loans and many types of derivatives. These investments are generally valued at fair value based on information from third-party pricing services. In addition, investments may be valued at fair value if the adviser determines that an investment’s value has been materially affected by events occurring after the close of the exchange or market on which the investment is principally traded (such as foreign exchange or market) and prior to the determination of the fund’s net asset value, or after the halting of trading of a specific security where trading does not resume prior to the close of the exchange or market on which the security is principally traded. Events that occur on a frequent basis after foreign markets close (such as developments in foreign markets and significant movements in the U.S. markets) and prior to the determination of the fund’s net asset value may be deemed to have a material effect on the value of securities traded in foreign markets. Accordingly, the fund’s foreign equity securities may often be valued at fair value. The adviser generally relies on third-party pricing services or other information (such as the correlation with price movements of similar securities in the same or other markets; the type, cost and investment characteristics of the security; the business and financial condition of the issuer; and trading and other market data) to assist in determining whether to fair value and at what value to fair value an investment. The value of an investment for purposes of calculating the fund’s net asset value can differ depending on the source and method used to determine value. When fair valuation is used, the value of an investment used to determine the fund’s net asset value may differ from quoted or published prices for the same investment. There can be no assurance that the fund could obtain the fair value assigned to an investment if it were to sell the investment at the same time at which the fund determines its net asset value per share.
13
Table of Contents
MFS Blended Research Core Equity Portfolio
Notes to Financial Statements – continued
Various inputs are used in determining the value of the fund’s assets or liabilities. These inputs are categorized into three broad levels. In certain cases, the inputs used to measure fair value may fall into different levels of the fair value hierarchy. In such cases, an investment’s level within the fair value hierarchy is based on the lowest level of input that is significant to the fair value measurement. The fund’s assessment of the significance of a particular input to the fair value measurement in its entirety requires judgment, and considers factors specific to the investment. Level 1 includes unadjusted quoted prices in active markets for identical assets or liabilities. Level 2 includes other significant observable market-based inputs (including quoted prices for similar securities, interest rates, prepayment speed, and credit risk). Level 3 includes unobservable inputs, which may include the adviser’s own assumptions in determining the fair value of investments. The following is a summary of the levels used as of December 31, 2011 in valuing the fund’s assets or liabilities:
| Investments at Value | Level 1 | Level 2 | Level 3 | Total | ||||||||||||
| Equity Securities | $459,522,443 | $— | $— | $459,522,443 | ||||||||||||
| Mutual Funds | 2,629,037 | — | — | 2,629,037 | ||||||||||||
| Total Investments | $462,151,480 | $— | $— | $462,151,480 | ||||||||||||
For further information regarding security characteristics, see the Portfolio of Investments.
Security Loans – State Street Bank and Trust Company (“State Street”), as lending agent, loans the securities of the fund to certain qualified institutions (the “Borrowers”) approved by the fund. The loans are collateralized by cash and/or U.S. Treasury and federal agency obligations in an amount typically at least equal to the market value of the securities loaned. The market value of the loaned securities is determined at the close of business of the fund and any additional required collateral is delivered to the fund on the next business day. State Street provides the fund with indemnification against Borrower default. The fund bears the risk of loss with respect to the investment of cash collateral. On loans collateralized by cash, the cash collateral is invested in a money market fund or short-term securities. A portion of the income generated upon investment of the collateral is remitted to the Borrowers, and the remainder is allocated between the fund and the lending agent. On loans collateralized by U.S. Treasury and/or federal agency obligations, a fee is received from the Borrower, and is allocated between the fund and the lending agent. Income from securities lending is included in interest income on the Statement of Operations. The dividend and interest income earned on the securities loaned is accounted for in the same manner as other dividend and interest income.
Indemnifications – Under the fund’s organizational documents, its officers and Trustees may be indemnified against certain liabilities and expenses arising out of the performance of their duties to the fund. Additionally, in the normal course of business, the fund enters into agreements with service providers that may contain indemnification clauses. The fund’s maximum exposure under these agreements is unknown as this would involve future claims that may be made against the fund that have not yet occurred.
Investment Transactions and Income – Investment transactions are recorded on the trade date. Interest income is recorded on the accrual basis. Dividends received in cash are recorded on the ex-dividend date. Certain dividends from foreign securities will be recorded when the fund is informed of the dividend if such information is obtained subsequent to the ex-dividend date. Dividend and interest payments received in additional securities are recorded on the ex-dividend or ex-interest date in an amount equal to the value of the security on such date.
The fund may receive proceeds from litigation settlements. Any proceeds received from litigation involving portfolio holdings are reflected in the Statement of Operations in realized gain/loss if the security has been disposed of by the fund or in unrealized gain/loss if the security is still held by the fund. Any other proceeds from litigation not related to portfolio holdings are reflected as other income in the Statement of Operations.
Fees Paid Indirectly – The fund’s custody fee may be reduced according to an arrangement that measures the value of cash deposited with the custodian by the fund. This amount, for the year ended December 31, 2011, is shown as a reduction of total expenses on the Statement of Operations.
Tax Matters and Distributions – The fund intends to qualify as a regulated investment company, as defined under Subchapter M of the Internal Revenue Code, and to distribute all of its taxable income, including realized capital gains. As a result, no provision for federal income tax is required. The fund’s federal tax returns for the prior three fiscal years remain subject to examination by the Internal Revenue Service.
Distributions to shareholders are recorded on the ex-dividend date. Income and capital gain distributions are determined in accordance with income tax regulations, which may differ from U.S. generally accepted accounting principles. Certain capital accounts in the financial statements are periodically adjusted for permanent differences in order to reflect their tax character. These adjustments have no impact on net assets or net asset value per share. Temporary differences which arise from
14
Table of Contents
MFS Blended Research Core Equity Portfolio
Notes to Financial Statements – continued
recognizing certain items of income, expense, gain or loss in different periods for financial statement and tax purposes will reverse at some time in the future. Distributions in excess of net investment income or net realized gains are temporary overdistributions for financial statement purposes resulting from differences in the recognition or classification of income or distributions for financial statement and tax purposes.
Book/tax differences primarily relate to wash sale loss deferrals.
The tax character of distributions declared to shareholders for the last two fiscal years is as follows:
| 12/31/11 | 12/31/10 | |||||||
| Ordinary income (including any short-term capital gains) | $9,057,199 | $9,141,057 | ||||||
The federal tax cost and the tax basis components of distributable earnings were as follows:
| As of 12/31/11 | ||||
| Cost of investments | $445,839,034 | |||
| Gross appreciation | 44,693,552 | |||
| Gross depreciation | (28,381,106 | ) | ||
| Net unrealized appreciation (depreciation) | $16,312,446 | |||
| Undistributed ordinary income | 7,342,969 | |||
| Capital loss carryforwards | (117,665,956 | ) |
Under the Regulated Investment Company Modernization Act of 2010 (the “Act”), net capital losses recognized after December 31, 2010 may be carried forward indefinitely, and their character is retained as short-term and/or long-term losses. Previously, net capital losses were carried forward for eight years and treated as short-term losses. As a transition rule, the Act requires that post-enactment net capital losses be used before pre-enactment net capital losses.
As of December 31, 2011, the fund had capital loss carryforwards available to offset future realized gains. Such losses expire as follows:
| Pre-enactment losses: | ||||
| 12/31/16 | $(45,841,291 | ) | ||
| 12/31/17 | (71,824,665 | ) | ||
| Total | $(117,665,956 | ) |
Multiple Classes of Shares of Beneficial Interest – The fund offers multiple classes of shares, which differ in their respective distribution and/or service fees. The fund’s income, realized and unrealized gain (loss), and common expenses are allocated to shareholders based on the daily net assets of each class. Dividends are declared separately for each class. Differences in per share dividend rates are generally due to differences in separate class expenses. The fund’s distributions declared to shareholders as reported on the Statements of Changes in Net Assets are presented by class as follows:
| From net investment income | ||||||||
| Year ended 12/31/11 | Year ended 12/31/10 | |||||||
| Initial Class | $6,388,464 | $6,266,489 | ||||||
| Service Class | 2,668,735 | 2,874,568 | ||||||
| Total | $9,057,199 | $9,141,057 | ||||||
| (3) | Transactions with Affiliates |
Investment Adviser – The fund has an investment advisory agreement with MFS to provide overall investment management and related administrative services and facilities to the fund. The management fee is computed daily and paid monthly at an annual rate of 0.55% of the fund’s average daily net assets.
The investment adviser has agreed in writing to pay a portion of the fund’s total annual operating expenses, exclusive of interest, taxes, extraordinary expenses, and brokerage commissions, such that total annual fund operating expenses do not exceed 1.25% of the fund’s average daily net assets. MFS’ agreement to limit the fund’s total annual operating expenses is contained in the investment advisory agreement between MFS and the fund and may not be rescinded without shareholder approval. This agreement terminated on December 31, 2011 in connection with shareholder approval on December 1, 2011 of a new investment advisory agreement between the trust, on behalf of the fund, and MFS effective January 1, 2012. In addition, the investment adviser has agreed in writing to pay a portion of the fund’s total annual operating expenses, exclusive of interest, taxes, extraordinary expenses, brokerage and transaction costs and investment-related expenses, such that total annual operating expenses do not exceed 0.60% of average daily net assets for the Initial Class shares and 0.85% of average daily net assets for the Service Class shares. This written agreement will continue until April 30, 2013.
15
Table of Contents
MFS Blended Research Core Equity Portfolio
Notes to Financial Statements – continued
For the year ended December 31, 2011, this reduction amounted to $179,574 and is reflected as a reduction of total expenses in the Statement of Operations.
Distributor – MFS Fund Distributors, Inc. (MFD), a wholly-owned subsidiary of MFS, is the distributor of shares of the fund. The Trustees have adopted a distribution plan for the Service Class shares pursuant to Rule 12b-1 under the Investment Company Act of 1940.
The fund’s distribution plan provides that the fund will pay MFD distribution and/or service fees equal to 0.25% per annum of its average daily net assets attributable to Service Class shares as partial consideration for services performed and expenses incurred by MFD and financial intermediaries (including participating insurance companies that invest in the fund to fund variable annuity and variable life insurance contracts, sponsors of qualified retirement and pension plans that invest in the fund, and affiliates of these participating insurance companies and plan sponsors) in connection with the sale and distribution of the Service Class shares. MFD may subsequently pay all, or a portion, of the distribution and/or service fees to financial intermediaries.
Shareholder Servicing Agent – MFS Service Center, Inc. (MFSC), a wholly-owned subsidiary of MFS, receives a fee from the fund for its services as shareholder servicing agent. For the year ended December 31, 2011, the fee was $55,598, which equated to 0.0108% annually of the fund’s average daily net assets. MFSC also receives payment from the fund for out-of-pocket expenses paid by MFSC on behalf of the fund. For the year ended December 31, 2011, these costs amounted to $19.
Administrator – MFS provides certain financial, legal, shareholder communications, compliance, and other administrative services to the fund. Under an administrative services agreement, the fund partially reimburses MFS the costs incurred to provide these services. The fund is charged an annual fixed amount of $17,500 plus a fee based on average daily net assets. The administrative services fee incurred for the year ended December 31, 2011 was equivalent to an annual effective rate of 0.0333% of the fund’s average daily net assets.
Trustees’ and Officers’ Compensation – The fund pays compensation to Trustees in the form of a retainer, attendance fees, and additional compensation to the Board chairperson. The fund does not pay compensation directly to officers of the fund who are also officers of the investment adviser, all of whom receive remuneration for their services to the fund from MFS. Certain officers of the fund are officers or directors of MFS, MFD, and MFSC.
Other – This fund and certain other funds managed by MFS (the funds) have entered into services agreements (the Agreements) which provide for payment of fees by the funds to Tarantino LLC and Griffin Compliance LLC in return for the provision of services of an Independent Chief Compliance Officer (ICCO) and Assistant ICCO, respectively, for the funds. The ICCO and Assistant ICCO are officers of the funds and the sole members of Tarantino LLC and Griffin Compliance LLC, respectively. The funds can terminate the Agreements with Tarantino LLC and Griffin Compliance LLC at any time under the terms of the Agreements. MFS has agreed to bear all expenses associated with office space, other administrative support, and supplies provided to the ICCO and Assistant ICCO. For the year ended December 31, 2011, the aggregate fees paid by the fund to Tarantino LLC and Griffin Compliance LLC were $8,557 and are included in miscellaneous expense on the Statement of Operations.
The fund invests in the MFS Institutional Money Market Portfolio which is managed by MFS and seeks a high level of current income consistent with preservation of capital and liquidity. Income earned on this investment is included in dividends from underlying affiliated funds on the Statement of Operations. This money market fund does not pay a management fee to MFS.
The investment adviser reimbursed the fund $676,490 for an operational issue. This amount is included in the realized gain (loss) on investment transactions on the Statement of Operations.
| (4) | Portfolio Securities |
Purchases and sales of investments, other than U.S. Government securities, purchased option transactions, and short-term obligations, aggregated $394,092,361 and $480,120,800, respectively.
| (5) | Shares of Beneficial Interest |
The fund’s Declaration of Trust permits the Trustees to issue an unlimited number of full and fractional shares of beneficial interest. Transactions in fund shares were as follows:
| Year ended 12/31/11 | Year ended 12/31/10 | |||||||||||||||
| Shares | Amount | Shares | Amount | |||||||||||||
| Shares sold | ||||||||||||||||
Initial Class | 101,422 | $3,234,643 | 51,684 | $1,484,658 | ||||||||||||
Service Class | 107,431 | 3,177,466 | 146,260 | 4,101,313 | ||||||||||||
| 208,853 | $6,412,109 | 197,944 | $5,585,971 | |||||||||||||
16
Table of Contents
MFS Blended Research Core Equity Portfolio
Notes to Financial Statements – continued
| Year ended 12/31/11 | Year ended 12/31/10 | |||||||||||||||
| Shares | Amount | Shares | Amount | |||||||||||||
| Shares issued to shareholders in reinvestment of distributions | ||||||||||||||||
Initial Class | 212,171 | $6,388,464 | 206,526 | $6,266,489 | ||||||||||||
Service Class | 89,136 | 2,668,735 | 95,345 | 2,874,568 | ||||||||||||
| 301,307 | $9,057,199 | 301,871 | $9,141,057 | |||||||||||||
| Shares reacquired | ||||||||||||||||
Initial Class | (1,733,153 | ) | $(56,314,858 | ) | (1,916,648 | ) | $(55,333,836 | ) | ||||||||
Service Class | (1,360,219 | ) | (43,882,961 | ) | (1,613,548 | ) | (46,825,098 | ) | ||||||||
| (3,093,372 | ) | $(100,197,819 | ) | (3,530,196 | ) | $(102,158,934 | ) | |||||||||
| Net change | ||||||||||||||||
Initial Class | (1,419,560 | ) | $(46,691,751 | ) | (1,658,438 | ) | $(47,582,689 | ) | ||||||||
Service Class | (1,163,652 | ) | (38,036,760 | ) | (1,371,943 | ) | (39,849,217 | ) | ||||||||
| (2,583,212 | ) | $(84,728,511 | ) | (3,030,381 | ) | $(87,431,906 | ) | |||||||||
| (6) | Line of Credit |
The fund and certain other funds managed by MFS participate in a $1.1 billion unsecured committed line of credit, subject to a $1 billion sublimit, provided by a syndication of banks under a credit agreement. Borrowings may be made for temporary financing needs. Interest is charged to each fund, based on its borrowings, generally at a rate equal to the higher of the Federal Reserve funds rate or one month LIBOR plus an agreed upon spread. A commitment fee, based on the average daily, unused portion of the committed line of credit, is allocated among the participating funds at the end of each calendar quarter. In addition, the fund and other funds managed by MFS have established unsecured uncommitted borrowing arrangements with certain banks for temporary financing needs. Interest is charged to each fund, based on its borrowings, at a rate equal to the Federal Reserve funds rate plus an agreed upon spread. For the year ended December 31, 2011, the fund’s commitment fee and interest expense were $3,988 and $0, respectively, and are included in miscellaneous expense on the Statement of Operations.
| (7) | Transactions in Underlying Affiliated Funds – Affiliated Issuers |
An affiliated issuer may be considered one in which the fund owns 5% or more of the outstanding voting securities, or a company which is under common control. For the purposes of this report, the fund assumes the following to be affiliated issuers:
| Underlying Affiliated Funds | Beginning Shares/Par Amount | Acquisitions Shares/Par Amount | Dispositions Shares/Par Amount | Ending Shares/Par Amount | ||||||||||||
| MFS Institutional Money Market Portfolio | 1,951,910 | 79,299,696 | (80,618,953 | ) | 632,653 | |||||||||||
| Underlying Affiliated Funds | Realized Gain (Loss) | Capital Gain Distributions | Dividend Income | Ending Value | ||||||||||||
| MFS Institutional Money Market Portfolio | $— | $— | $2,888 | $632,653 | ||||||||||||
17
Table of Contents
MFS Blended Research Core Equity Portfolio
REPORT OF INDEPENDENT REGISTERED PUBLIC ACCOUNTING FIRM
To the Board of Trustees of MFS Variable Insurance Trust II and the Shareholders of
MFS Blended Research Core Equity Portfolio:
We have audited the accompanying statement of assets and liabilities, including the portfolio of investments, of MFS Blended Research Core Equity Portfolio (the “Fund”) (one of the portfolios comprising MFS Variable Insurance Trust II) as of December 31, 2011, and the related statement of operations for the year then ended, the statements of changes in net assets for each of the two years in the period then ended, and the financial highlights for each of the five years in the period then ended. These financial statements and financial highlights are the responsibility of the Fund’s management. Our responsibility is to express an opinion on these financial statements and financial highlights based on our audits.
We conducted our audits in accordance with the standards of the Public Company Accounting Oversight Board (United States). Those standards require that we plan and perform the audit to obtain reasonable assurance about whether the financial statements and financial highlights are free of material misstatement. The Fund is not required to have, nor were we engaged to perform, an audit of its internal control over financial reporting. Our audits included consideration of internal control over financial reporting as a basis for designing audit procedures that are appropriate in the circumstances, but not for the purpose of expressing an opinion on the effectiveness of the Fund’s internal control over financial reporting. Accordingly, we express no such opinion. An audit also includes examining, on a test basis, evidence supporting the amounts and disclosures in the financial statements, assessing the accounting principles used and significant estimates made by management, as well as evaluating the overall financial statement presentation. Our procedures included confirmation of securities owned as of December 31, 2011, by correspondence with the custodian. We believe that our audits provide a reasonable basis for our opinion.
In our opinion, the financial statements and financial highlights referred to above present fairly, in all material respects, the financial position of MFS Blended Research Core Equity Portfolio as of December 31, 2011, the results of its operations for the year then ended, the changes in its net assets for each of the two years in the period then ended, and the financial highlights for each of the five years in the period then ended, in conformity with accounting principles generally accepted in the United States of America.
DELOITTE & TOUCHE LLP
Boston, Massachusetts
February 15, 2012
18
Table of Contents
MFS Blended Research Core Equity Portfolio
RESULTS OF SHAREHOLDER MEETING (unaudited)
At a special meeting of shareholders of MFS Blended Research Core Equity Portfolio, which was held on December 1, 2011, the following actions were taken for which shareholders of all series of MFS Variable Insurance Trust II voted together as a single class with respect to Item 1 and shareholders of MFS Blended Research Core Equity Portfolio voted as a separate class with respect to Items 2 and 3:
Item 1: Election of ten Trustees as members of the Board of Trustees of the Trust effective January 1, 2012:
| Number of Shares | ||||||||
| For | Withheld Authority | |||||||
| Robert E. Butler | 681,916,712.8686 | 46,472,894.9218 | ||||||
| Maureen R. Goldfarb | 682,835,794.8512 | 45,553,812.9392 | ||||||
| David H. Gunning | 681,500,267.3085 | 46,889,340.4819 | ||||||
| William R. Gutow | 681,050,223.5547 | 47,339,384.2357 | ||||||
| Michael Hegarty | 682,477,088.8584 | 45,912,518.9320 | ||||||
| John P. Kavanaugh | 683,794,425.4269 | 44,595,182.3635 | ||||||
| Robert J. Manning | 682,699,559.7374 | 45,690,048.0530 | ||||||
| J. Dale Sherratt | 681,362,743.0513 | 47,026,864.7391 | ||||||
| Laurie J. Thomsen | 683,408,094.0000 | 44,981,513.7904 | ||||||
| Robert W. Uek | 681,424,852.0247 | 46,964,755.7657 | ||||||
Item 2: To approve a new investment advisory agreement dated January 1, 2012, between the Trust, on behalf of MFS Blended Research Core Equity Portfolio, and MFS:
| Number of Shares | ||||||||||||
| For | Against | Withheld Authority | ||||||||||
| 13,604,695.5471 | 483,155.5947 | 1,358,547.7854 | ||||||||||
Item 3: To approve revisions to and restatements of certain fundamental investment restrictions of MFS Blended Research Core Equity Portfolio effective January 1, 2012 as detailed below:
| Number of Shares | ||||||||||||||
| For | Against | Withheld Authority | ||||||||||||
| A. | Borrowing | 13,031,969.3674 | 830,864.0911 | 1,583,565.4687 | ||||||||||
| B. | Underwriting Securities | 13,251,399.9022 | 605,115.5307 | 1,589,883.4943 | ||||||||||
| C. | Issuance of Senior Securities | 13,299,297.8434 | 605,924.9783 | 1,541,176.1055 | ||||||||||
| D. | Lending of Money or Securities | 12,970,886.4709 | 884,399.9399 | 1,591,112.5164 | ||||||||||
| E. | Purchases or Sales of Real Estate; Interests in Oil, Gas or Mineral Leases; and Commodities | 13,386,643.5891 | 544,701.3937 | 1,515,053.9444 | ||||||||||
| F. | Industry Concentration | 13,346,658.6796 | 513,389.9714 | 1,586,350.2762 | ||||||||||
19
Table of Contents
MFS Blended Research Core Equity Portfolio
TRUSTEES AND OFFICERS – IDENTIFICATION AND BACKGROUND
The Trustees and officers of the Trust, as of February 1, 2012, are listed below, together with their principal occupations during the past five years. (Their titles may have varied during that period.) The address of each Trustee and officer is 500 Boylston Street, Boston, Massachusetts 02116.
Name, Age | Position(s) with Fund | Trustee/Officer Since (h) | Principal Occupations | Other Directorships (j) | ||||
| INTERESTED TRUSTEES | ||||||||
Robert J. Manning (k) (age 48) | Trustee | February 2004 | Massachusetts Financial Services Company, Chairman, Chief Executive Officer and Director; President (until December 2009); Chief Investment Officer (until July 2010) | N/A | ||||
| INDEPENDENT TRUSTEES | ||||||||
David H. Gunning (age 69) | Trustee and Chair of Trustees | January 2004 | Retired; Cleveland-Cliffs Inc. (mining products and service provider), Vice Chairman/Director (until May 2007) | Lincoln Electric Holdings, Inc. (welding equipment manufacturer), Director; Development Alternatives, Inc. (consulting), Director/Non-Executive Chairman; Portman Limited (mining), Director (until 2008) | ||||
Robert E. Butler (age 70) | Trustee | January 2006 | Consultant – investment company industry regulatory and compliance matters | N/A | ||||
Maureen R. Goldfarb (age 56) | Trustee | January 2009 | Private investor | N/A | ||||
William R. Gutow (age 70) | Trustee | December 1993 | Private investor and real estate consultant; Capitol Entertainment Management Company (video franchise), Vice Chairman | Atlantic Coast Tan (tanning salons), Vice Chairman (until 2007); Texas Donuts (donut franchise), Vice Chairman (until 2010) | ||||
Michael Hegarty (age 67) | Trustee | December 2004 | Private investor | N/A | ||||
John P. Kavanaugh (age 57) | Trustee | January 2009 | Private investor; The Hanover Insurance Group, Inc., Vice President and Chief Investment Officer (until 2006); Allmerica Investment Trust, Allmerica Securities Trust and Opus Investment Trust (investment companies), Chairman, President and Trustee (until 2006) | N/A | ||||
J. Dale Sherratt (age 73) | Trustee | June 1989 | Insight Resources, Inc. (acquisition planning specialists), President; Wellfleet Investments (investor in health care companies), Managing General Partner | N/A | ||||
Laurie J. Thomsen (age 54) | Trustee | March 2005 | Private investor; New Profit, Inc. (venture philanthropy), Executive Partner (until 2010) | The Travelers Companies (property and casualty insurance), Director | ||||
Robert W. Uek (age 70) | Trustee | January 2006 | Consultant to investment company industry | N/A | ||||
| OFFICERS | ||||||||
John M. Corcoran (k) (age 46) | President | October 2008 | Massachusetts Financial Services Company, Senior Vice President (since October 2008); State Street Bank and Trust (financial services provider), Senior Vice President, (until September 2008) | N/A | ||||
| Christopher R. Bohane (k) (age 38) | Assistant Secretary and Assistant Clerk | July 2005 | Massachusetts Financial Services Company, Vice President and Senior Counsel | N/A | ||||
Kino Clark (k) (age 43) | Assistant Treasurer | January 2012 | Massachusetts Financial Services Company, Assistant Vice President | N/A | ||||
20
Table of Contents
MFS Blended Research Core Equity Portfolio
Trustees and Officers – continued
Name, Age | Position(s) with Fund | Trustee/Officer Since (h) | Principal Occupations | Other Directorships (j) | ||||
Ethan D. Corey (k) (age 48) | Assistant Secretary and Assistant Clerk | July 2005 | Massachusetts Financial Services Company, Senior Vice President and Associate General Counsel | N/A | ||||
David L. DiLorenzo (k) (age 43) | Treasurer | July 2005 | Massachusetts Financial Services Company, Vice President | N/A | ||||
Robyn L. Griffin (age 36) | Assistant Independent Chief Compliance Officer | August 2008 | Griffin Compliance LLC (provider of compliance services), Principal (since August 2008); State Street Corporation (financial services provider), Mutual Fund Administration Assistant Vice President (October 2006 – July 2008); Liberty Mutual Group (insurance), Personal Market Assistant Controller (April 2006 – October 2006); Deloitte & Touche LLP (professional services firm). | N/A | ||||
Brian E. Langenfeld (k) (age 38) | Assistant Secretary and Assistant Clerk | June 2006 | Massachusetts Financial Services Company, Vice President and Senior Counsel | N/A | ||||
Ellen Moynihan (k) (age 54) | Assistant Treasurer | April 1997 | Massachusetts Financial Services Company, Senior Vice President | N/A | ||||
Susan S. Newton (k) (age 61) | Assistant Secretary and Assistant Clerk | May 2005 | Massachusetts Financial Services Company, Senior Vice President and Associate General Counsel | N/A | ||||
Susan A. Pereira (k) (age 41) | Assistant Secretary and Assistant Clerk | July 2005 | Massachusetts Financial Services Company, Vice President and Senior Counsel | N/A | ||||
Mark N. Polebaum (k) (age 59) | Secretary and Clerk | January 2006 | Massachusetts Financial Services Company, Executive Vice President, General Counsel and Secretary | N/A | ||||
Frank L. Tarantino (age 67) | Independent Chief Compliance Officer | June 2004 | Tarantino LLC (provider of compliance services), Principal | N/A | ||||
Richard S. Weitzel (k) (age 41) | Assistant Secretary and Assistant Clerk | October 2007 | Massachusetts Financial Services Company, Vice President and Assistant General Counsel | N/A | ||||
James O. Yost (k) (age 51) | Deputy Treasurer | September 1990 | Massachusetts Financial Services Company, Senior Vice President | N/A | ||||
| (h) | Date first appointed to serve as Trustee/officer of an MFS fund. Each Trustee has served continuously since appointment unless indicated otherwise. For the period from December 15, 2004 until February 22, 2005, Mr. Manning served as Advisory Trustee. For the period October 2008, until January 2012, Mr. Corcoran served as Treasurer of the Funds. Prior to January 2012, Messrs. DiLorenzo and Yost served as Assistant Treasurers of the Funds. |
| (j) | Directorships or trusteeships of companies required to report to the Securities and Exchange Commission (i.e., “public companies”). |
| (k) | “Interested person” of the Trust within the meaning of the Investment Company Act of 1940 (referred to as the 1940 Act), which is the principal federal law governing investment companies like the fund, as a result of position with MFS. The address of MFS is 500 Boylston Street, Boston, Massachusetts 02116. |
Each Trustee has been elected by shareholders and each Trustee and officer holds office until his or her successor is chosen and qualified or until his or her earlier death, resignation, retirement or removal. The Trust does not hold annual meetings for the purpose of electing Trustees, and Trustees are not elected for fixed terms. Messrs. Butler, Kavanaugh, Uek and Ms. Thomsen are members of the Trust’s Audit Committee.
Each of the Fund’s Trustees and officers holds comparable positions with certain other funds of which MFS or a subsidiary is the investment adviser or distributor, and, in the case of the officers, with certain affiliates of MFS. As of January 1, 2012, the Trustees served as board members of 131 funds within the MFS Family of Funds.
21
Table of Contents
MFS Blended Research Core Equity Portfolio
Trustees and Officers – continued
The Statement of Additional Information for the Fund includes further information about the Trustees and is available without charge upon request by calling 1-800-225-2606.
Investment Adviser Massachusetts Financial Services Company 500 Boylston Street, Boston, MA 02116-3741 | Custodian State Street Bank and Trust 1 Lincoln Street, Boston, MA 02111-2900 | |
Distributor MFS Fund Distributors, Inc. 500 Boylston Street, Boston, MA 02116-3741 | Independent Registered Public Accounting Firm Deloitte & Touche LLP 200 Berkeley Street, Boston, MA 02116 | |
Portfolio Manager Matthew Krummell |
22
Table of Contents
MFS Blended Research Core Equity Portfolio
At a special meeting of shareholders of the MFS Blended Research Core Equity Portfolio (hereinafter referred to as the “Fund” or the “Portfolio”), which was held on December 1, 2011, the shareholders approved a new investment advisory agreement based on the recommendation of the Board of Trustees. At its July, 2011 meeting, the Board of Trustees (i) approved, and recommended for shareholder approval, the new investment advisory agreement effective January 1, 2012, and (ii) the continuation of the existing investment advisory agreement effective September 1, 2011. The following includes a description of the factors that the Board of Trustees considered and the conclusions that formed the basis of their approval of both the new investment advisory agreement and the continuation of the prior investment advisory agreement.
BOARD APPROVAL OF NEW INVESTMENT ADVISORY AGREEMENT
The Investment Company Act of 1940 requires that both the full Board of Trustees and a majority of the non-interested (“independent”) Trustees, voting separately, initially approve the new investment advisory agreement (the “New Agreement”) between Massachusetts Financial Services Company (“MFS”) and MFS Variable Insurance Trust II (the “Trust”) on behalf of the Portfolio and, beginning on the second anniversary of the initial effective date of the New Agreement, annually approve the continuation of the New Agreement. The Trustees have considered matters bearing on the Portfolio and the then current advisory arrangement at their meetings throughout the year, including a review of performance data at each regular meeting. In addition, the independent Trustees met in person in July 2011 to consider the initial approval of the New Agreement, and to recommend that shareholders approve the New Agreement. The independent Trustees were assisted in their evaluation of the New Agreement by independent legal counsel, from whom they received separate legal advice and with whom they met separately from MFS management. The independent Trustees were also assisted in this process by the Portfolio’s Independent Chief Compliance Officer, a full-time senior officer appointed by and reporting to the independent Trustees.
In connection with their deliberations regarding the initial approval of the New Agreement, the Trustees, including the independent Trustees, considered such information and factors as they believed, in light of the legal advice furnished to them and their own business judgment, to be relevant. The New Agreement was considered separately for the series of the Trust (collectively, the “Portfolios”), although the Trustees also took into account the common interests of all Portfolios in the Trust in their review. As described below, the Trustees considered the nature, quality, and extent of the various investment advisory, administrative, and/or shareholder services to be performed by MFS under the New Agreement and other arrangements with the Trust.
In connection with their initial review meeting, the Trustees received and relied upon materials that included, among other items: (i) information provided by MFS on the advisory fees of comparable portfolios of its other clients, including institutional separate account and other clients, (ii) information as to whether, and to what extent applicable, expense waivers, reimbursements or fee “breakpoints” would be observed for the Portfolio under the New Agreement, and (iii) a comparison and summary of the differences in the provisions in the New Agreement compared to those in each of the then current investment advisory agreements for the Portfolios. In addition, in connection with the independent Trustees’ meetings in May and July, 2011 (the “contract review meetings”) for the purpose of considering whether to approve the continuation of the then current investment advisory agreements for the Portfolio, the independent Trustees received: (1) information provided by Lipper Inc. (“Lipper”) on the investment performance of the Portfolio for various time periods ended December 31, 2010, compared to the investment performance of a group of funds with substantially similar investment classifications/objectives (the “Lipper performance universe”), (2) information provided by Lipper on the Portfolio’s advisory fees and other expenses compared to the advisory fees and other expenses of comparable funds identified by Lipper (the “Lipper expense group”), (3) information regarding MFS’ financial results and financial condition, including MFS’ and certain of its affiliates’ estimated profitability from services performed for the Portfolio, (4) MFS’ views regarding the outlook for the mutual fund industry and its strategic business plans, (5) descriptions of various functions performed by MFS for the Trust, such as compliance monitoring and portfolio trading practices, and (6) information regarding the overall organization of MFS, including information about MFS’ senior management and other personnel providing investment advisory, administrative and other services to the Portfolio. The comparative performance, fee and expense information prepared and provided by Lipper was not independently verified, and the independent Trustees did not independently verify any information provided to them by MFS.
The Trustees’ conclusion as to the initial approval of the New Agreement was based on comprehensive consideration of all information provided to the Trustees and was not the result of any single factor. Some of the factors that figured particularly in the Trustees’ deliberations are described below for the Portfolio, while individual Trustees may have given different weight to various factors and evaluated the information presented as a whole differently than another individual Trustee. The Trustees recognized that the fee arrangements for the Portfolio could reflect years of review and discussion between the independent
23
Table of Contents
MFS Blended Research Core Equity Portfolio
Board Approval of New Investment Advisory Agreement – continued
Trustees and MFS, that certain aspects of such arrangements may receive greater scrutiny in some years than others, and that the Trustees’ conclusions may be based, in part, on their consideration of these same arrangements during the course of the year and in prior years.
Because the portfolio management team managing the Portfolio’s investments under the then current investment advisory agreement will remain the same under the New Agreement for the Portfolio, the Trustees compared the Portfolio’s total return investment performance to the performance of its Lipper performance universe over various time periods, based on information provided by Lipper. The Trustees placed particular emphasis on the total return performance of the Portfolio’s Initial Class shares in comparison to the performance of funds in its Lipper performance universe over the one-, three- and five-year periods ended December 31, 2010. The Trustees did not rely on performance results for more recent periods.
The Trustees noted the performance of the Portfolio’s Initial Class shares was in the 1st quintile relative to the other funds in the Lipper performance universe for the one-year period (the 1st quintile being the best performers and the 5th quintile being the worst performers). The total return performance of the Portfolio was also in the 1st quintile for the three-year period and the 2nd quintile for the five-year period ended December 31, 2010, relative to the Lipper performance universe. Based on the nature and quality of services provided by MFS, the Board of Trustees concluded that the Portfolio’s performance was satisfactory.
In the course of their deliberations, the Trustees took into account information provided by MFS during contract review meetings, as well as during investment review meetings conducted with portfolio management personnel during the course of the year. For Portfolios whose performance lagged their peer groups, they discussed the factors that contributed thereto and MFS’ efforts to improve such Portfolios’ performance. After reviewing this information, the Trustees concluded, within the context of their overall conclusions regarding the New Agreement, that they were satisfied with MFS’ responses and efforts relating to investment performance.
In assessing the reasonableness of the Portfolio’s advisory fee, the Trustees considered, among other information, the Portfolio’s advisory fee and the total expense ratio of the Portfolio’s Initial Class shares as a percentage of average daily net assets, compared to the advisory fee and total expense ratios of its peer group of funds based on information provided by Lipper. The Trustees also considered the advisory fees charged by MFS to institutional accounts. In comparing these fees, the Trustees considered the generally broader scope of services provided by MFS to the Trust than those provided to institutional accounts. The Trustees also considered the higher demands placed on MFS’ investment personnel and trading infrastructure as a result of the daily cash in-flows and out-flows of the Portfolio, and the impact on MFS and related expenses due to the more extensive regulatory regime to which the Portfolio is subject, compared to institutional accounts.
In considering the fees, the Trustees noted from the Lipper data that the Portfolio’s effective advisory fee rate and total expense ratio were each below the median of such fees and expenses of funds in the Lipper expense group. In addition, the Trustees accepted MFS’ offer to continue the expense limitation for the Portfolio. They noted that the Portfolio’s advisory fee rate schedule is not currently subject to any breakpoints. However, the Trustees concluded that the fees were reasonable in light of the nature and quality of services provided by MFS, and determined not to recommend any advisory fee breakpoints for the Portfolio at this time.
The Trustees also considered whether the Portfolio is likely to benefit from any economies of scale due to future asset growth. In this regard, the Trustees reviewed the adequacy of breakpoints and discussed with MFS any adjustments necessary for the shareholders’ benefit.
The Trustees also considered information prepared by MFS relating to its costs and profits with respect to the Portfolio and other investment companies and accounts advised by MFS, as well as MFS’ methodologies used to determine and allocate its costs to the Portfolio and other accounts and products for purposes of estimating profitability.
The Trustees noted that there would be no increase to the net advisory fee arrangement for the Portfolio under the New Agreement when compared to the Portfolio’s then current investment advisory agreement. After reviewing these and other factors described below, the Trustees concluded that the advisory fees charged to the Portfolio under the New Agreement represent reasonable compensation in light of the nature and quality of the services being provided by MFS.
In addition, the Trustees considered MFS’ resources and related efforts to continue to retain, attract and motivate capable personnel to serve the Portfolio. The Trustees also considered the financial resources of MFS and its parent, Sun Life Financial Inc. The Trustees further considered any advantages and possible disadvantages of having an adviser which also serves other investment companies as well as institutional accounts.
24
Table of Contents
MFS Blended Research Core Equity Portfolio
Board Approval of New Investment Advisory Agreement – continued
The Trustees also considered the nature, quality, cost, and extent of administrative, transfer agency, and distribution services provided to the Trust by MFS and its affiliates under agreements and plans other than the New Agreement, including the 12b-1 fees the Portfolio pays to MFS Fund Distributors, Inc., an affiliate of MFS. The Trustees also considered the nature, extent and quality of certain other services MFS performs or arranges on the Portfolio’s behalf, which may include securities lending programs, directed expense payment programs, class action recovery programs, and MFS’ interaction with third-party service providers, principally custodians and sub-custodians. The Trustees concluded that the various non-advisory services provided by MFS and its affiliates on behalf of the Portfolio were satisfactory. The Trustees also considered the benefits to MFS from the use of the Portfolio’s portfolio brokerage commissions to pay for investment research and various other factors. Additionally, the Trustees considered so-called “fall-out benefits” to MFS such as reputational value derived from serving as investment manager to the Trust, and determined that any such benefits derived by MFS were reasonable and fair.
Based on their evaluation of factors that they deemed to be material, including those factors described above, the Board of Trustees, including a majority of the independent Trustees, concluded that the New Agreement should be approved for an initial two-year period, commencing upon its effective date, as set forth in the New Agreement.
BOARD APPROVAL OF CONTINUATION OF PRIOR INVESTMENT ADVISORY AGREEMENT
The Investment Company Act of 1940 requires that both the full Board of Trustees and a majority of the non-interested (“independent”) Trustees, voting separately, annually approve the continuation of the investment advisory agreement between MFS Variable Insurance Trust II (the “Trust”) and Massachusetts Financial Services Company (“MFS”) on behalf of the Fund. The Trustees consider matters bearing on the Fund and the advisory arrangements at their meetings throughout the year, including a review of performance data at each regular meeting. In addition, the independent Trustees met in person in May and again in July 2011 (“contract review meetings”) for the specific purpose of considering whether to approve the continuation of the investment advisory agreement for the Fund. The independent Trustees were assisted in their evaluation of the investment advisory agreement by independent legal counsel, from whom they received separate legal advice and with whom they met separately from MFS management during various contract review meetings. The independent Trustees were also assisted in this process by the Fund’s Independent Chief Compliance Officer, a full-time senior officer appointed by and reporting to the independent Trustees.
In connection with their deliberations, the Trustees, including the independent Trustees, considered such information and factors as they believed, in light of the legal advice furnished to them and their own business judgment, to be relevant. The investment advisory agreement was considered separately for the Fund, although the Trustees also took into account the common interests of all Funds in the Trust in their review. As described below, the Trustees considered the nature, quality, and extent of the various investment advisory, administrative, and shareholder services performed by MFS under the existing investment advisory agreement and other arrangements with the Trust.
In connection with their contract review meetings, the Trustees received and relied upon materials which included, among other items: (i) information provided by Lipper Inc. (“Lipper”) on the investment performance of the Fund for various time periods ended December 31, 2010, compared to the investment performance of a group of funds with substantially similar investment classifications/objectives (the “Lipper performance universe”), (ii) information provided by Lipper on the Fund’s advisory fees and other expenses compared to the advisory fees and other expenses of comparable funds identified by Lipper (the “Lipper expense group”), (iii) information provided by MFS on the advisory fees of comparable portfolios of its other clients, including institutional separate account and other clients, (iv) information as to whether, and to what extent applicable, expense waivers, reimbursements or fee “breakpoints” are observed for the Fund, (v) information regarding MFS’ financial results and financial condition, including MFS’ and certain of its affiliates’ estimated profitability from services performed for the Fund and other investment companies that the Board oversees as a whole, and for MFS’ institutional business, (vi) MFS’ views regarding the outlook for the mutual fund industry and its strategic business plans, (vii) descriptions of various functions performed by MFS for the Trust, such as compliance monitoring and portfolio trading practices, and (viii) information regarding the overall organization of MFS, including information about MFS’ senior management and other personnel providing investment advisory, administrative and other services to the Fund. The comparative performance, fee and expense information prepared and provided by Lipper was not independently verified, and the independent Trustees did not independently verify any information provided to them by MFS.
The Trustees’ conclusion as to the continuation of the investment advisory agreement was based on comprehensive consideration of all information provided to the Trustees and was not the result of any single factor. Some of the factors that figured particularly in the Trustees’ deliberations are described below for the Fund, while individual Trustees may have given different weight to various factors and evaluated the information presented as a whole differently than another individual
25
Table of Contents
MFS Blended Research Core Equity Portfolio
Board Approval of Continuation of Prior Investment Advisory Agreement – continued
Trustee. The Trustees recognized that the fee arrangements for the Fund reflect years of review and discussion between the independent Trustees and MFS, that certain aspects of such arrangements may receive greater scrutiny in some years than others, and that the Trustees’ conclusions may be based, in part, on their consideration of these same arrangements during the course of the year and in prior years.
Based on information provided by Lipper, the Trustees compared the Fund’s total return investment performance to the performance of the Lipper performance universe over various time periods. The Trustees placed particular emphasis on the total return performance of the Fund’s Initial Class shares in comparison to the performance of funds in its Lipper performance universe over the one-, three- and five-year periods ended December 31, 2010. The Trustees did not rely on performance results for more recent periods, including those shown elsewhere in this report.
The Trustees noted the performance of the Fund’s Initial Class shares was in the 1st quintile relative to the other funds in the Lipper performance universe for the one-year period (the 1st quintile being the best performers and the 5th quintile being the worst performers). The total return performance of the Fund was also in the 1st quintile for the three-year period and the 2nd quintile for the five-year period ended December 31, 2010, relative to the Lipper performance universe. Based on the nature and quality of services provided by MFS, the Board of Trustees concluded that the Fund’s performance was satisfactory.
In the course of their deliberations, the Trustees took into account information provided by MFS during contract review meetings, as well as during investment review meetings conducted with portfolio management personnel during the course of the year.
In assessing the reasonableness of the Fund’s advisory fee, the Trustees considered, among other information, the Fund’s advisory fee and the total expense ratio of the Fund’s Initial Class shares as a percentage of average daily net assets, compared to the advisory fee and total expense ratios of its peer group of funds based on information provided by Lipper. The Trustees also considered the advisory fees charged by MFS to institutional accounts. In comparing these fees, the Trustees considered the generally broader scope of services provided by MFS to the Trust than those provided to institutional accounts. The Trustees also considered the higher demands placed on MFS’ investment personnel and trading infrastructure as a result of the daily cash in-flows and out-flows of the Fund, and the impact on MFS and related expenses due to the more extensive regulatory regime to which the Fund is subject, compared to institutional accounts.
In considering the fees, the Trustees noted from the Lipper data (which takes into account any reductions or expense limitations) that the Fund’s effective advisory fee rate and total expense ratio were each below the median of such fees and expenses of funds in the Lipper expense group. In addition, the Trustees accepted MFS’ offer to continue the expense limitation for the Fund. They noted that the Fund’s advisory fee rate schedule is not currently subject to any breakpoints. However, the Trustees concluded that the fees were reasonable in light of the nature and quality of services provided by MFS, and determined not to recommend any advisory fee breakpoints for the Fund at this time.
The Trustees also considered information prepared by MFS relating to its costs and profits with respect to the Fund and other investment companies and accounts advised by MFS, as well as MFS’ methodologies used to determine and allocate its costs to the Fund and other accounts and products for purposes of estimating profitability.
After reviewing these and other factors described below, the Trustees concluded that the advisory fees charged to the Fund represent reasonable compensation in light of the nature and quality of the services being provided by MFS.
In addition, the Trustees considered MFS’ resources and related efforts to continue to retain, attract and motivate capable personnel to serve the Fund. The Trustees also considered the financial resources of MFS and its parent, Sun Life Financial Inc. The Trustees further considered any advantages and possible disadvantages of having an adviser which also serves other investment companies as well as institutional accounts.
The Trustees also considered the nature, quality, cost, and extent of administrative, transfer agency, and distribution services provided to the Fund by MFS and its affiliates under agreements and plans other than the investment advisory agreement, including the 12b-1 fees the Fund pays to MFS Fund Distributors, Inc., an affiliate of MFS. The Trustees also considered the nature, extent and quality of certain other services MFS performs or arranges on the Fund’s behalf, which may include securities lending programs, directed expense payment programs, class action recovery programs, and MFS’ interaction with third-party service providers, principally custodians and sub-custodians. The Trustees concluded that the various non-advisory services provided by MFS and its affiliates on behalf of the Fund were satisfactory. The Trustees also considered the benefits to MFS from the use of the Fund’s portfolio brokerage commissions, if applicable, to pay for investment research and various other factors. Additionally, the Trustees considered so-called “fall-out benefits” to MFS such as reputational value derived from serving as investment manager to the Trust, and determined that any such benefits derived by MFS were reasonable and fair.
26
Table of Contents
MFS Blended Research Core Equity Portfolio
Board Approval of Continuation of Prior Investment Advisory Agreement – continued
Based on their evaluation of factors that they deemed to be material, including those factors described above, the Board of Trustees, including a majority of the independent Trustees, concluded that the investment advisory agreement should be continued for an additional one-year period, commencing September 1, 2011.
A discussion regarding the Board’s most recent review and renewal of the fund’s Investment Advisory Agreement with MFS is available by clicking on the fund’s name under “Variable Insurance Portfolios — VIT II” in the “Products and Performance” section of the MFS Web site (mfs.com).
27
Table of Contents
MFS Blended Research Core Equity Portfolio
PROXY VOTING POLICIES AND INFORMATION
A general description of the MFS funds’ proxy voting policies and procedures is available without charge, upon request, by calling 1-800-225-2606, by visiting the Proxy Voting section of mfs.com or by visiting the SEC’s Web site at http://www.sec.gov.
Information regarding how the fund voted proxies relating to portfolio securities during the most recent twelve-month period ended June 30 is available without charge by visiting the Proxy Voting section of mfs.com or by visiting the SEC’s Web site at http://www.sec.gov.
QUARTERLY PORTFOLIO DISCLOSURE
The fund will file a complete schedule of portfolio holdings with the Securities and Exchange Commission (the Commission) for the first and third quarters of each fiscal year on Form N-Q. The fund’s Form N-Q is available on the EDGAR database on the Commission’s Internet Web site at http://www.sec.gov and may be reviewed and copied at the:
Public Reference Room
Securities and Exchange Commission
100 F Street, NE, Room 1580
Washington, D.C. 20549
Information on the operation of the Public Reference Room may be obtained by calling the Commission at 1-800-SEC-0330. Copies of the fund’s Form N-Q also may be obtained, upon payment of a duplicating fee, by electronic request at the following e-mail address: publicinfo@sec.gov or by writing the Public Reference Section at the above address.
From time to time, MFS may post important information about the fund or the MFS funds on the MFS web site (mfs.com). This information is available by visiting the “News & Commentary” section of mfs.com or by clicking on the fund’s name under “Variable Insurance Portfolios — VIT II” in the “Products and Performance” section of mfs.com.
FEDERAL TAX INFORMATION (unaudited)
The following information is provided pursuant to provisions of the Internal Revenue Code.
For corporate shareholders, 100% of the ordinary income dividends paid during the fiscal year qualify for the corporate dividends received deduction.
28
Table of Contents
rev. 3/11

| Why? | Financial companies choose how they share your personal information. Federal law gives consumers the right to limit some but not all sharing. Federal law also requires us to tell you how we collect, share, and protect your personal information. Please read this notice carefully to understand what we do. |
| What? | The types of personal information we collect and share depend on the product or service you have with us. This information can include:
• Social Security number and account balances • Account transactions and transaction history • Checking account information and wire transfer instructions
When you are no longer our customer, we continue to share your information as described in this notice. |
| How? | All financial companies need to share customers’ personal information to run their everyday business. In the section below, we list the reasons financial companies can share their customers’ personal information; the reasons MFS chooses to share; and whether you can limit this sharing. |
| Reasons we can share your personal information | Does MFS share? | Can you limit this sharing? | ||
For our everyday business purposes – such as to process your transactions, maintain your account(s), respond to court orders and legal investigations, or report to credit bureaus | Yes | No | ||
For our marketing purposes – to offer our products and services to you | No | We don’t share | ||
| For joint marketing with other financial companies | No | We don’t share | ||
For our affiliates’ everyday business purposes – information about your transactions and experiences | No | We don’t share | ||
For our affiliates’ everyday business purposes – information about your creditworthiness | No | We don’t share | ||
| For nonaffiliates to market to you | No | We don’t share |
| Questions? | Call 800-225-2606 or go to mfs.com. |
29
Table of Contents
| Page 2 |
| Who we are | ||
| Who is providing this notice? | MFS Funds, MFS Investment Management, MFS Institutional Advisors, Inc., MFS Fund Distributors, Inc., MFS Heritage Trust Company, and MFS Service Center, Inc. | |
| What we do | ||
| How does MFS protect my personal information? | To protect your personal information from unauthorized access and use, we use security measures that comply with federal law. These measures include procedural, electronic, and physical safeguards for the protection of the personal information we collect about you. | |
| How does MFS collect my personal information? | We collect your personal information, for example, when you
• open an account or provide account information • direct us to buy securities or direct us to sell your securities • make a wire transfer
We also collect your personal information from others, such as credit bureaus, affiliates and other companies. | |
| Why can’t I limit all sharing? | Federal law gives you the right to limit only
• sharing for affiliates’ everyday business purposes – information about your creditworthiness • affiliates from using your information to market to you • sharing for nonaffiliates to market to you
State laws and individual companies may give you additional rights to limit sharing. | |
| Definitions | ||
| Affiliates | Companies related by common ownership or control. They can be financial and nonfinancial companies.
• MFS does not share personal information with affiliates, except for everyday business purposes as described on page one of this notice. | |
| Nonaffiliates | Companies not related by common ownership or control. They can be financial and nonfinancial companies.
• MFS does not share with nonaffiliates so they can market to you. | |
| Joint Marketing | A formal agreement between nonaffiliated financial companies that together market financial products or services to you.
• MFS doesn’t jointly market. | |
| Other important information | ||
| If you own an MFS product or receive an MFS service in the name of a third party such as a bank or broker-dealer, their privacy policy may apply to you instead of ours. | ||
30
Table of Contents

Table of Contents

MFS® Global Research Portfolio
MFS® Variable Insurance Trust II

ANNUAL REPORT
December 31, 2011
RES-ANN
Table of Contents
MFS® GLOBAL RESEARCH PORTFOLIO
The report is prepared for the general information of contract owners.
It is authorized for distribution to prospective investors only when preceded or accompanied by a current prospectus.
NOT FDIC INSURED Ÿ MAY LOSE VALUE Ÿ NO BANK OR CREDIT UNION GUARANTEE Ÿ NOT A DEPOSIT Ÿ NOT INSURED BY ANY FEDERAL GOVERNMENT AGENCY OR NCUA/NCUSIF
Table of Contents
MFS Global Research Portfolio
LETTER FROM THE CHAIRMAN AND CEO

Dear Contract Owners:
We are indeed living through some volatile times. Economic uncertainty is everywhere, as it seems no place in the world has been unmoved by crisis. We have seen a devastating earthquake and tsunami that have led to disruptions in the Japanese markets
and supply chains. Protests have changed the face of the Middle East and left in their wake lingering tensions and resultant higher oil prices. We have seen debt limits tested in Europe and the United States and policymakers grappling to craft often unpopular monetary and fiscal responses at a time when consumers and businesses struggle with what appears to be a slowing global economy. On top of all of that, we have seen long-term U.S. debt lose its Standard & Poor’s AAA rating and the long-term debt ratings of 15 eurozone nations put on negative watch.
When markets become volatile, managing risk becomes a top priority for investors and their advisors. At MFS® risk management is foremost in our minds in all market climates. Our analysts and portfolio managers keep risks firmly in mind when evaluating securities. Additionally, we have a team of quantitative analysts that measures and assesses the risk profiles of our portfolios and securities on an ongoing basis. The chief investment risk officer, who oversees the team, reports directly to the firm’s president and chief investment officer so the risk associated with each portfolio can be assessed objectively and independently of the portfolio management team.
As always, we continue to be mindful of the many economic challenges faced at the local, national, and international levels. It is in times such as these that we want to remind investors of the merits of maintaining a long-term view, adhering to basic investing principles such as asset allocation and diversification, and working closely with their advisors to research and identify appropriate investment opportunities.
Respectfully,

Robert J. Manning
Chairman and Chief Executive Officer
MFS Investment Management®
February 15, 2012
The opinions expressed in this letter are subject to change, may not be relied upon for investment advice, and no forecasts can be guaranteed.
1
Table of Contents
MFS Global Research Portfolio
Portfolio structure (i)

| Top ten holdings (i) | ||||
| Apple, Inc. | 3.8% | |||
| Royal Dutch Shell PLC, “A” | 2.0% | |||
| Target Corp. | 2.0% | |||
| Exxon Mobil Corp. | 1.9% | |||
| Oracle Corp. | 1.7% | |||
| Groupe Danone | 1.6% | |||
| Google, Inc., “A” | 1.4% | |||
| Visa, Inc., “A” | 1.4% | |||
| Vodafone Group PLC | 1.3% | |||
| Danaher Corp. | 1.2% |
| Global equity sectors (i) | ||||
| Capital Goods (s) | 19.8% | |||
| Financial Services | 18.8% | |||
| Energy | 16.5% | |||
| Technology (s) | 13.1% | |||
| Consumer Cyclicals | 9.0% | |||
| Health Care | 8.9% | |||
| Consumer Staples | 7.7% | |||
| Telecommunications/Cable Television | 5.9% |
| Issuer country weightings (i)(x) | ||||
| United States | 50.3% | |||
| United Kingdom | 10.6% | |||
| Japan | 5.6% | |||
| Switzerland | 4.5% | |||
| Netherlands | 3.8% | |||
| Germany | 3.6% | |||
| France | 3.2% | |||
| Australia | 3.1% | |||
| Brazil | 2.3% | |||
| Other Countries | 13.0% |
| Currency exposure weightings (i)(y) | ||||
| United States Dollar | 51.6% | |||
| Euro | 11.5% | |||
| British Pound Sterling | 10.6% | |||
| Japanese Yen | 5.6% | |||
| Swiss Franc | 4.4% | |||
| Hong Kong Dollar | 4.1% | |||
| Australian Dollar | 3.1% | |||
| Brazilian Real | 2.3% | |||
| Indian Rupee | 1.5% | |||
| Other Currencies | 5.3% |
| (i) | For purposes of this presentation, the components include the market value of securities, less any securities sold short, and reflect the impact of the equivalent exposure of derivative positions. These amounts may be negative from time to time. Equivalent exposure is a calculated amount that translates the derivative position into a reasonable approximation of the amount of the underlying asset that the portfolio would have to hold at a given point in time to have the same price sensitivity that results from the portfolio’s ownership of the derivative contract. When dealing with derivatives, equivalent exposure is a more representative measure of the potential impact of a position on portfolio performance than market value. |
| (s) | Global equity sector includes securities sold short. |
| (x) | Represents the portfolio’s exposure to issuer countries as a percentage of a portfolio’s total net assets. |
| (y) | Represents the portfolio’s exposure to a particular currency as a percentage of a portfolio’s total net assets. |
Percentages are based on net assets as of 12/31/11.
The portfolio is actively managed and current holdings may be different.
2
Table of Contents
MFS Global Research Portfolio
Summary of Results
For the twelve months ended December 31, 2011, Initial Class shares of the MFS Global Research Portfolio (the “fund”) provided a total return of –6.73%, while Service Class shares of the fund provided a total return of –7.00%. These compare with a return of –6.86% for the fund’s benchmark, the Morgan Stanley Capital International (MSCI) All Country World Index.
Market Environment
Early in the period, the U.S. Federal Reserve (the “Fed”) responded to weak economic growth by loosening monetary policy further. More easing by the Fed improved market sentiment and drove risk-asset prices markedly higher. The December 2010 agreement on a surprisingly large (relative to expectations) expansionary U.S. fiscal package also boosted sentiment. During the subsequent several months, the renewed positive market sentiment, coupled with better indications of global macroeconomic activity, pushed many asset valuations to post-crisis highs. At the same time, the yields of the perceived “safest” global sovereign credits rose, indicating a renewed risk-seeking environment.
However, towards the middle of the period, a weakening macroeconomic backdrop and renewed concerns over peripheral euro zone sovereign debt caused a flight-to-quality move that pushed high-quality sovereign bond yields lower. In the U.S., concerns about sovereign debt default and the long-term sustainability of the trend in U.S. fiscal policy resulted in one agency downgrading U.S. credit quality. Amidst this turmoil, global equity markets declined sharply. As a result of these developments, global consumer and producer sentiment indicators fell precipitously and highly-rated sovereign bond yields hit multi-decade lows. Towards the end of the reporting period, uncertainty in financial markets spiked higher as markets more seriously contemplated the possible failure of the euro zone.
Detractors from Performance
Security selection in the consumer staples sector detracted from performance relative to the MSCI All Country World Index. The fund’s holdings of cosmetics and beauty supply company Avon Products (h) dampened relative returns. Lower-than-expected earnings, primarily attributable to declining organic revenue growth in North America, caused the stock to decline during the period.
Stock selection in the health care sector also held back relative returns. There were no individual stocks within this sector that were among the fund’s top relative detractors.
Stocks in other sectors that weakened relative performance included the fund’s holdings of diversified mining company Teck Resources (Canada) and information technology products and electronics maker Acer (h) (Taiwan). Shares of Teck Resources declined as the company trimmed its volume guidance, sighting the volatile market as the culprit. Acer’s stock declined significantly during the first half of the year due to inventory build-up in Europe and lower revenues in a weak personal computer market. The fund’s holdings of financial services firms, ICICI Bank (India), Erste Group Bank (h) (Austria), Banco Santander (Brasil) (h) (Brazil), Credit Suisse (Switzerland), Goldman Sachs Group, and BNP Paribas (France) also weakened relative performance. Europe’s mounting sovereign debt crisis put downward pressure on the shares of most financial companies. Shares of ICICI Bank declined during the period on negative macroeconomic news in the country, including rising non-performing loans and inflation, as well as fears of a global economic slowdown. Holdings of petrochemical firm Reliance Industries (India) was another top relative detractor for the reporting period.
Contributors to Performance
Stock selection in the capital goods sector was a primary contributor to relative performance. The timing of the fund’s ownership in shares of mining company Iluka Resources (Australia) aided relative results. Shares rose throughout the first half of the year due to stable price increases in zircon, used in the production of ceramics, including tiles, sanitary ware and tableware, and a positive outlook for the firm’s other main product, titanium dioxide minerals, which are the principal feedstock for pigment production. Holdings of industrial, medical, and specialty gases distributor Airgas, which turned in strong performance over the period, also helped.
Stock selection in the energy sector was another factor that benefited relative returns. Holdings of oil and gas exploration company Cabot Oil & Gas, electric and gas utility company CMS Energy (b), and global energy and petrochemicals company Royal Dutch Shell (United Kingdom/Netherlands) boosted relative performance as all three stocks outperformed the benchmark. Shares of Cabot Oil & Gas appreciated during the period primarily due to positive production forecasts for its Marcellus natural gas shale.
3
Table of Contents
MFS Global Research Portfolio
Management Review – continued
Stock selection in the telecom/CATV sector also supported relative performance. There were no individual stocks within this sector that were among the fund’s top relative contributors for the reporting period.
Elsewhere, the fund’s holdings of computer and personal electronics maker Apple, global payments technology company Visa, fast-food company giant McDonald’s, food and beverage producer Danone (France), and pharmaceutical and medical products maker Abbott Laboratories, all of which outperformed the benchmark, bolstered relative performance. Shares of Apple outperformed as record sales of iPhones and iPads helped the company deliver revenue and earnings above expectations. Shares of Visa increased throughout the period due to higher profits which spurred management to repurchase shares and increase the stock’s dividend.
Respectfully,
| Michael Cantara | Ben Kottler | |
| Portfolio Manager | Portfolio Manager |
Note to Contract Owners: Effective May 1, 2011, Ben Kottler became a co-manager of the fund.
| (b) | Security is not a benchmark constituent. |
| (h) | Security was not held in the fund at period end. |
The views expressed in this report are those of the portfolio managers only through the end of the period of the report as stated on the cover and do not necessarily reflect the views of MFS or any other person in the MFS organization. These views are subject to change at any time based on market or other conditions, and MFS disclaims any responsibility to update such views. These views may not be relied upon as investment advice or an indication of trading intent on behalf of any MFS portfolio. References to specific securities are not recommendations of such securities, and may not be representative of any MFS portfolio’s current or future investments.
4
Table of Contents
MFS Global Research Portfolio
PERFORMANCE SUMMARY THROUGH 12/31/11
The following chart illustrates the historical performance of the fund in comparison to its benchmark(s). Benchmarks are unmanaged and may not be invested in directly. Benchmark returns do not reflect any fees or expenses. The performance of other share classes will be greater than or less than that of the class depicted below. (See Notes to Performance Summary.)
Performance data shown represents past performance and is no guarantee of future results. Investment return and principal value fluctuate so your units, when sold, may be worth more or less than the original cost; current performance may be lower or higher than quoted. The performance shown does not reflect the deduction of taxes, if any, that a contract holder would pay on fund distributions or the redemption of contract units. The returns for the fund shown also do not reflect the deduction of expenses associated with variable products, such as mortality and expense risk charges, separate account charges, and sales charges imposed by the insurance company separate accounts. Such expenses would reduce the overall returns shown.
Growth of a Hypothetical $10,000 Investment
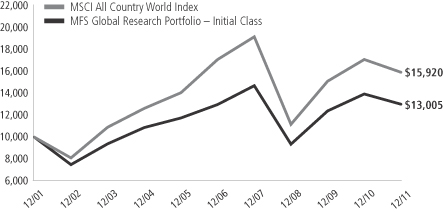
Total Returns through 12/31/11
Average annual total returns
| Share class | Class inception date | 1-yr | 5-yr | 10-yr | ||||||||
| Initial Class | 11/07/94 | (6.73)% | 0.04% | 2.66% | ||||||||
| Service Class | 8/24/01 | (7.00)% | (0.22)% | 2.40% | ||||||||
| Comparative benchmark | ||||||||||||
| MSCI All Country World Index (f) | (6.86)% | (1.41)% | 4.76% | |||||||||
| (f) | Source: FactSet Research Systems Inc. |
Benchmark Definition
MSCI All Country World Index – a market capitalization-weighted index that is designed to measure equity market performance in the global developed and emerging markets.
It is not possible to invest directly in an index.
Notes to Performance Summary
Average annual total return represents the average annual change in value for each share class for the periods presented.
Performance results reflect any applicable expense subsidies and waivers in effect during the periods shown. Without such subsidies and waivers the fund’s performance results would be less favorable. Please see the prospectus and financial statements for complete details. All results are historical and assume the reinvestment of any dividends and capital gains distributions.
Performance results do not include adjustments made for financial reporting purposes in accordance with U.S. generally accepted accounting principles and may differ from amounts reported in the financial highlights.
Prior to October 6, 2008, MFS primarily invested the fund’s assets in U.S. equity securities. Effective October 6, 2008, MFS primarily invests the fund’s assets in U.S. and foreign equity securities, including emerging market equity securities.
From time to time the fund may receive proceeds from litigation settlements, without which performance would be lower.
5
Table of Contents
MFS Global Research Portfolio
Fund Expenses Borne by the Contract Holders During the Period,
July 1, 2011 through December 31, 2011
As a contract holder of the fund, you incur ongoing costs, including management fees; distribution and/or service (12b-1) fees; and other fund expenses. This example is intended to help you understand your ongoing costs (in dollars) of investing in the fund and to compare these costs with the ongoing costs of investing in other mutual funds.
The example is based on an investment of $1,000 invested at the beginning of the period and held for the entire period July 1, 2011 through December 31, 2011.
Actual Expenses
The first line for each share class in the following table provides information about actual account values and actual expenses. You may use the information in this line, together with the amount you invested, to estimate the expenses that you paid over the period. Simply divide your account value by $1,000 (for example, an $8,600 account value divided by $1,000 = 8.6), then multiply the result by the number in the first line under the heading entitled “Expenses Paid During Period” to estimate the expenses you paid on your account during this period.
Hypothetical Example for Comparison Purposes
The second line for each share class in the following table provides information about hypothetical account values and hypothetical expenses based on the fund’s actual expense ratio and an assumed rate of return of 5% per year before expenses, which is not the fund’s actual return. The hypothetical account values and expenses may not be used to estimate the actual ending account balance or expenses you paid for the period. You may use this information to compare the ongoing costs of investing in the fund and other funds. To do so, compare this 5% hypothetical example with the 5% hypothetical examples that appear in the shareholder reports of the other funds.
Please note that the expenses shown in the table are meant to highlight the fund’s ongoing costs only and do not take into account the fees and expenses imposed under the variable contracts through which your investment in the fund is made. Therefore, the second line for each share class in the table is useful in comparing ongoing costs associated with an investment in vehicles (such as the fund) which fund benefits under variable annuity and variable life insurance contracts and to qualified pension and retirement plans only, and will not help you determine the relative total costs of investing in the fund through variable annuity and variable life insurance contracts. If the fees and expenses imposed under the variable contracts were included, your costs would have been higher.
| Share Class | Annualized Expense Ratio | Beginning Account Value 7/01/11 | Ending Account Value 12/31/11 | Expenses Paid During Period (p) 7/01/11-12/31/11 | ||||||||||||||
| Initial Class | Actual | 1.00% | $1,000.00 | $875.79 | $4.73 | |||||||||||||
| Hypothetical (h) | 1.00% | $1,000.00 | $1,020.16 | $5.09 | ||||||||||||||
| Service Class | Actual | 1.25% | $1,000.00 | $874.18 | $5.90 | |||||||||||||
| Hypothetical (h) | 1.25% | $1,000.00 | $1,018.90 | $6.36 | ||||||||||||||
| (h) | 5% class return per year before expenses. |
| (p) | Expenses paid is equal to each class’ annualized expense ratio, as shown above, multiplied by the average account value over the period, multiplied by the number of days in the period, divided by the number of days in the year. |
Expenses Impacting Table
Expense ratios include 0.01% of investment related expenses from short sale dividend and interest expenses.
6
Table of Contents
MFS Global Research Portfolio
PORTFOLIO OF INVESTMENTS – 12/31/11
The Portfolio of Investments is a complete list of all securities owned by your fund. It is categorized by broad-based asset classes.
| Issuer | Shares/Par | Value ($) | ||||||
| COMMON STOCKS – 100.3% | ||||||||
| Aerospace – 1.9% | ||||||||
| Honeywell International, Inc. | 14,470 | $ | 786,445 | |||||
| Precision Castparts Corp. | 3,940 | 649,273 | ||||||
| Rolls-Royce Holdings PLC | 43,065 | 497,421 | ||||||
| United Technologies Corp. | 7,010 | 512,361 | ||||||
|
| |||||||
| $ | 2,445,500 | |||||||
|
| |||||||
| Alcoholic Beverages – 1.1% | ||||||||
| Heineken N.V. | 31,606 | $ | 1,459,105 | |||||
|
| |||||||
| Apparel Manufacturers – 1.4% | ||||||||
| Li & Fung Ltd. | 336,000 | $ | 622,110 | |||||
| LVMH Moet Hennessy Louis Vuitton S.A. | 2,664 | 375,327 | ||||||
| NIKE, Inc., “B” | 8,050 | 775,779 | ||||||
|
| |||||||
| $ | 1,773,216 | |||||||
|
| |||||||
| Automotive – 2.1% | ||||||||
| Bayerische Motoren Werke AG | 11,026 | $ | 737,146 | |||||
| DENSO Corp. | 15,300 | 422,604 | ||||||
| GKN PLC | 162,261 | 458,521 | ||||||
| Honda Motor Co. Ltd. | 20,800 | 634,512 | ||||||
| Johnson Controls, Inc. | 9,000 | 281,340 | ||||||
| Kia Motors Corp. (a) | 3,270 | 189,581 | ||||||
|
| |||||||
| $ | 2,723,704 | |||||||
|
| |||||||
| Biotechnology – 0.6% | ||||||||
| Gilead Sciences, Inc. (a) | 19,160 | $ | 784,219 | |||||
|
| |||||||
| Broadcasting – 1.5% | ||||||||
| Nippon Television Network Corp. | 3,290 | $ | 503,523 | |||||
| Publicis Groupe S.A. | 9,664 | 443,526 | ||||||
| Viacom, Inc., “B” | 21,850 | 992,209 | ||||||
|
| |||||||
| $ | 1,939,258 | |||||||
|
| |||||||
| Brokerage & Asset Managers – 1.2% | ||||||||
| Affiliated Managers Group, Inc. (a) | 7,520 | $ | 721,544 | |||||
| Franklin Resources, Inc. | 8,630 | 828,998 | ||||||
|
| |||||||
| $ | 1,550,542 | |||||||
|
| |||||||
| Business Services – 1.4% | ||||||||
| Accenture PLC, “A” | 19,740 | $ | 1,050,760 | |||||
| Cognizant Technology Solutions Corp., “A” (a) | 7,470 | 480,396 | ||||||
| Mitsubishi Corp. | 16,400 | 331,324 | ||||||
|
| |||||||
| $ | 1,862,480 | |||||||
|
| |||||||
| Cable TV – 1.3% | ||||||||
| Comcast Corp., “Special A” | 39,850 | $ | 938,866 | |||||
| DIRECTV, “A” (a) | 8,500 | 363,460 | ||||||
| Virgin Media, Inc. | 21,380 | 457,104 | ||||||
|
| |||||||
| $ | 1,759,430 | |||||||
|
| |||||||
| Chemicals – 1.4% | ||||||||
| 3M Co. | 11,560 | $ | 944,799 | |||||
| Celanese Corp. | 13,570 | 600,744 | ||||||
| Nufarm Ltd. (a) | 61,814 | 263,009 | ||||||
|
| |||||||
| $ | 1,808,552 | |||||||
|
| |||||||
| Issuer | Shares/Par | Value ($) | ||||||
| COMMON STOCKS – continued | ||||||||
| Computer Software – 2.7% | ||||||||
| Autodesk, Inc. (a) | 16,740 | $ | 507,724 | |||||
| Check Point Software Technologies Ltd. (a) | 15,300 | 803,862 | ||||||
| Oracle Corp. | 86,110 | 2,208,722 | ||||||
|
| |||||||
| $ | 3,520,308 | |||||||
|
| |||||||
| Computer Software – Systems – 5.1% | ||||||||
| Apple, Inc. (a)(s) | 12,250 | $ | 4,961,250 | |||||
| EMC Corp. (a) | 64,750 | 1,394,715 | ||||||
| International Business Machines Corp. | 1,900 | 349,372 | ||||||
|
| |||||||
| $ | 6,705,337 | |||||||
|
| |||||||
| Conglomerates – 0.2% | ||||||||
| Hutchison Whampoa Ltd. | 35,000 | $ | 293,146 | |||||
|
| |||||||
| Construction – 1.0% | ||||||||
| Anhui Conch Cement Co. Ltd. | 135,000 | $ | 400,658 | |||||
| Owens Corning (a) | 17,020 | 488,814 | ||||||
| Urbi Desarrollos Urbanos S.A. de C.V. (a) | 332,650 | 378,545 | ||||||
|
| |||||||
| $ | 1,268,017 | |||||||
|
| |||||||
| Consumer Products – 0.5% | ||||||||
| Reckitt Benckiser Group PLC | 14,748 | $ | 726,757 | |||||
|
| |||||||
| Electrical Equipment – 2.3% | ||||||||
| Danaher Corp. (s) | 33,120 | $ | 1,557,965 | |||||
| Schneider Electric S.A. | 10,345 | 540,638 | ||||||
| Siemens AG | 9,310 | 890,938 | ||||||
|
| |||||||
| $ | 2,989,541 | |||||||
|
| |||||||
| Electronics – 1.9% | ||||||||
| Altera Corp. | 11,450 | $ | 424,795 | |||||
| ASML Holding N.V. | 19,147 | 800,153 | ||||||
| Microchip Technology, Inc. | 22,800 | 835,164 | ||||||
| Taiwan Semiconductor Manufacturing Co. Ltd. | 181,000 | 453,113 | ||||||
|
| |||||||
| $ | 2,513,225 | |||||||
|
| |||||||
| Energy – Independent – 4.9% | ||||||||
| Apache Corp. | 9,720 | $ | 880,438 | |||||
| Bankers Petroleum Ltd. (a) | 67,506 | 294,210 | ||||||
| Cabot Oil & Gas Corp. | 12,990 | 985,941 | ||||||
| Cairn Energy PLC (a) | 96,288 | 396,717 | ||||||
| EOG Resources, Inc. | 8,210 | 808,767 | ||||||
| INPEX Corp. | 115 | 724,633 | ||||||
| Occidental Petroleum Corp. | 14,810 | 1,387,697 | ||||||
| Reliance Industries Ltd. | 67,624 | 882,404 | ||||||
|
| |||||||
| $ | 6,360,807 | |||||||
|
| |||||||
| Energy – Integrated – 5.4% | ||||||||
| BG Group PLC | 31,924 | $ | 680,853 | |||||
| BP PLC | 169,356 | 1,207,721 | ||||||
| Exxon Mobil Corp. (s) | 29,510 | 2,501,268 | ||||||
| Royal Dutch Shell PLC, “A” | 70,734 | 2,600,369 | ||||||
|
| |||||||
| $ | 6,990,211 | |||||||
|
| |||||||
7
Table of Contents
MFS Global Research Portfolio
Portfolio of Investments – continued
| Issuer | Shares/Par | Value ($) | ||||||
| COMMON STOCKS – continued | ||||||||
| Engineering – Construction – 1.9% | ||||||||
| Fluor Corp. | 22,230 | $ | 1,117,058 | |||||
| JGC Corp. | 40,000 | 960,374 | ||||||
| Keppel Corp. Ltd. | 56,400 | 404,395 | ||||||
|
| |||||||
| $ | 2,481,827 | |||||||
|
| |||||||
| Food & Beverages – 4.4% | ||||||||
| Bunge Ltd. | 6,160 | $ | 352,352 | |||||
| General Mills, Inc. | 23,630 | 954,888 | ||||||
| Groupe Danone | 33,739 | 2,120,892 | ||||||
| Kraft Foods, Inc., “A” | 15,410 | 575,718 | ||||||
| Nestle S.A. | 24,834 | 1,425,790 | ||||||
| Want Want China Holdings Ltd. | 260,000 | 259,444 | ||||||
|
| |||||||
| $ | 5,689,084 | |||||||
|
| |||||||
| Food & Drug Stores – 1.1% | ||||||||
| Lawson, Inc. | 4,000 | $ | 249,708 | |||||
| Tesco PLC | 183,881 | 1,152,121 | ||||||
|
| |||||||
| $ | 1,401,829 | |||||||
|
| |||||||
| Gaming & Lodging – 0.3% | ||||||||
| Sands China Ltd. (a) | 135,200 | $ | 382,103 | |||||
|
| |||||||
| General Merchandise – 2.7% | ||||||||
| Kohl’s Corp. | 19,420 | $ | 958,377 | |||||
| Target Corp. | 49,660 | 2,543,585 | ||||||
|
| |||||||
| $ | 3,501,962 | |||||||
|
| |||||||
| Insurance – 4.5% | ||||||||
| ACE Ltd. | 20,030 | $ | 1,404,504 | |||||
| AIA Group Ltd. | 258,600 | 807,438 | ||||||
| Hiscox Ltd. | 145,465 | 841,268 | ||||||
| ING Groep N.V. (a) | 87,893 | 626,346 | ||||||
| MetLife, Inc. | 15,820 | 493,268 | ||||||
| QBE Insurance Group Ltd. | 45,957 | 608,713 | ||||||
| Swiss Re Ltd. | 20,727 | 1,056,320 | ||||||
|
| |||||||
| $ | 5,837,857 | |||||||
|
| |||||||
| Internet – 1.8% | ||||||||
| eBay, Inc. (a) | 17,050 | $ | 517,127 | |||||
| Google, Inc., “A” (a) | 2,900 | 1,873,110 | ||||||
|
| |||||||
| $ | 2,390,237 | |||||||
|
| |||||||
| Machinery & Tools – 2.3% | ||||||||
| Cummins, Inc. | 4,560 | $ | 401,371 | |||||
| Glory Ltd. | 19,600 | 421,946 | ||||||
| Joy Global, Inc. | 15,440 | 1,157,537 | ||||||
| Schindler Holding AG | 6,400 | 745,406 | ||||||
| Sinotruk Hong Kong Ltd. | 500,000 | 279,402 | ||||||
|
| |||||||
| $ | 3,005,662 | |||||||
|
| |||||||
| Major Banks – 6.2% | ||||||||
| BNP Paribas | 9,346 | $ | 367,116 | |||||
| Credit Suisse Group AG | 22,389 | 526,057 | ||||||
| Goldman Sachs Group, Inc. | 6,240 | 564,283 | ||||||
| JPMorgan Chase & Co. | 42,600 | 1,416,450 | ||||||
| Julius Baer Group Ltd. | 17,473 | 679,560 | ||||||
| National Australia Bank Ltd. | 43,258 | 1,033,547 | ||||||
| Issuer | Shares/Par | Value ($) | ||||||
| COMMON STOCKS – continued | ||||||||
| Major Banks – continued | ||||||||
| Standard Chartered PLC | 70,966 | $ | 1,545,108 | |||||
| Toronto-Dominion Bank | 11,789 | 882,830 | ||||||
| Westpac Banking Corp. | 51,010 | 1,043,461 | ||||||
|
| |||||||
| $ | 8,058,412 | |||||||
|
| |||||||
| Medical & Health Technology & Services – 0.9% | ||||||||
| Diagnosticos da America S.A. | 88,300 | $ | 733,762 | |||||
| Rhoen-Klinikum AG | 20,530 | 391,125 | ||||||
|
| |||||||
| $ | 1,124,887 | |||||||
|
| |||||||
| Medical Equipment – 2.7% | ||||||||
| Covidien PLC | 18,800 | $ | 846,188 | |||||
| Medtronic, Inc. | 26,710 | 1,021,658 | ||||||
| St. Jude Medical, Inc. | 14,650 | 502,495 | ||||||
| Thermo Fisher Scientific, Inc. (a) | 24,650 | 1,108,511 | ||||||
|
| |||||||
| $ | 3,478,852 | |||||||
|
| |||||||
| Metals & Mining – 2.2% | ||||||||
| Iluka Resources Ltd. | 29,049 | $ | 460,526 | |||||
| Rio Tinto Ltd. | 21,140 | 1,023,060 | ||||||
| Steel Authority of India Ltd. | 237,725 | 364,835 | ||||||
| Sumitomo Metal Industries Ltd. | 278,000 | 505,652 | ||||||
| Teck Resources Ltd., “B” | 14,770 | 520,629 | ||||||
|
| |||||||
| $ | 2,874,702 | |||||||
|
| |||||||
| Natural Gas – Distribution – 0.3% | ||||||||
| Tokyo Gas Co. Ltd. | 83,000 | $ | 381,733 | |||||
|
| |||||||
| Network & Telecom – 0.4% | ||||||||
| Acme Packet, Inc. (a) | 5,900 | $ | 182,369 | |||||
| Finisar Corp. (a) | 17,260 | 289,019 | ||||||
|
| |||||||
| $ | 471,388 | |||||||
|
| |||||||
| Oil Services – 1.7% | ||||||||
| AMEC PLC | 19,700 | $ | 276,396 | |||||
| Halliburton Co. | 26,840 | 926,248 | ||||||
| Schlumberger Ltd. | 9,730 | 664,656 | ||||||
| Technip | 3,700 | 345,813 | ||||||
|
| |||||||
| $ | 2,213,113 | |||||||
|
| |||||||
| Other Banks & Diversified Financials – 6.1% | ||||||||
| Bank Rakyat Indonesia | 930,500 | $ | 692,680 | |||||
| China Construction Bank | 1,351,860 | 943,409 | ||||||
| Discover Financial Services | 26,220 | 629,280 | ||||||
| Federal Bank Ltd. | 55,183 | 349,979 | ||||||
| Fifth Third Bancorp | 56,280 | 715,882 | ||||||
| ICICI Bank Ltd. | 27,077 | 349,087 | ||||||
| Itau Unibanco Holding S.A., IPS | 56,600 | 1,031,408 | ||||||
| Komercni Banka A.S. | 4,430 | 746,682 | ||||||
| Siam Commercial Bank Co. Ltd. | 176,900 | 644,802 | ||||||
| Visa, Inc., “A” | 17,730 | 1,800,127 | ||||||
|
| |||||||
| $ | 7,903,336 | |||||||
|
| |||||||
| Pharmaceuticals – 4.7% | ||||||||
| Abbott Laboratories | 22,170 | $ | 1,246,619 | |||||
| Bayer AG | 20,709 | 1,324,050 | ||||||
| Pfizer, Inc. | 64,010 | 1,385,176 | ||||||
8
Table of Contents
MFS Global Research Portfolio
Portfolio of Investments – continued
| Issuer | Shares/Par | Value ($) | ||||||
| COMMON STOCKS – continued | ||||||||
| Pharmaceuticals – continued | ||||||||
| Roche Holding AG | 8,123 | $ | 1,373,742 | |||||
| Santen Pharmaceutical Co. Ltd. | 6,800 | 280,057 | ||||||
| Teva Pharmaceutical Industries Ltd., ADR | 13,210 | 533,156 | ||||||
|
| |||||||
| $ | 6,142,800 | |||||||
|
| |||||||
| Precious Metals & Minerals – 0.5% | ||||||||
| Newcrest Mining Ltd. | 20,480 | $ | 620,030 | |||||
|
| |||||||
| Railroad & Shipping – 0.9% | ||||||||
| East Japan Railway Co. | 5,600 | $ | 356,503 | |||||
| Union Pacific Corp. | 7,830 | 829,510 | ||||||
|
| |||||||
| $ | 1,186,013 | |||||||
|
| |||||||
| Real Estate – 0.8% | ||||||||
| GSW Immobilien AG (a) | 12,605 | $ | 364,859 | |||||
| Hang Lung Properties Ltd. | 222,000 | 631,705 | ||||||
|
| |||||||
| $ | 996,564 | |||||||
|
| |||||||
| Restaurants – 0.8% | ||||||||
| Ajisen China Holdings Ltd. | 145,000 | $ | 159,626 | |||||
| McDonald’s Corp. | 8,740 | 876,884 | ||||||
|
| |||||||
| $ | 1,036,510 | |||||||
|
| |||||||
| Specialty Chemicals – 2.6% | ||||||||
| Airgas, Inc. | 13,590 | $ | 1,061,107 | |||||
| Akzo Nobel N.V. | 23,798 | 1,145,040 | ||||||
| Formosa Plastics Corp. | 87,000 | 232,161 | ||||||
| Linde AG | 6,376 | 948,584 | ||||||
|
| |||||||
| $ | 3,386,892 | |||||||
|
| |||||||
| Specialty Stores – 1.2% | ||||||||
| Industria de Diseno Textil S.A. | 7,052 | $ | 576,170 | |||||
| Tiffany & Co. | 6,810 | 451,231 | ||||||
| Urban Outfitters, Inc. (a) | 21,790 | 600,532 | ||||||
|
| |||||||
| $ | 1,627,933 | |||||||
|
| |||||||
| Telecommunications – Wireless – 1.8% | ||||||||
| Tim Participacoes S.A., ADR | 28,580 | $ | 737,364 | |||||
| Vodafone Group PLC | 602,486 | 1,673,897 | ||||||
|
| |||||||
| $ | 2,411,261 | |||||||
|
| |||||||
| Telephone Services – 2.8% | ||||||||
| American Tower Corp., “A” (a) | 8,940 | $ | 536,489 | |||||
| AT&T, Inc. | 31,910 | 964,958 | ||||||
| China Unicom (Hong Kong) Ltd. | 272,000 | 572,256 | ||||||
| Royal KPN N.V. | 74,498 | 889,429 | ||||||
| Telecom Italia S.p.A. | 317,731 | 339,261 | ||||||
| Telecom Italia S.p.A. | 442,769 | 395,101 | ||||||
|
| |||||||
| $ | 3,697,494 | |||||||
|
| |||||||
| Tobacco – 1.7% | ||||||||
| Japan Tobacco, Inc. | 188 | $ | 884,189 | |||||
| Philip Morris International, Inc. | 17,780 | 1,395,374 | ||||||
|
| |||||||
| $ | 2,279,563 | |||||||
|
| |||||||
| Issuer | Shares/Par | Value ($) | ||||||
| COMMON STOCKS – continued | ||||||||
| Trucking – 0.9% | ||||||||
| Expeditors International of Washington, Inc. | 15,180 | $ | 621,773 | |||||
| Yamato Holdings Co. Ltd. | 36,300 | 611,681 | ||||||
|
| |||||||
| $ | 1,233,454 | |||||||
|
| |||||||
| Utilities – Electric Power – 4.2% | ||||||||
| American Electric Power Co., Inc. | 17,250 | $ | 712,598 | |||||
| CEZ A.S. | 22,750 | 905,080 | ||||||
| CMS Energy Corp. | 54,790 | 1,209,763 | ||||||
| Edison International | 15,640 | 647,496 | ||||||
| Fortum Corp. | 32,199 | 685,061 | ||||||
| International Power PLC | 150,733 | 789,346 | ||||||
| Tractebel Energia S.A. | 30,770 | 494,234 | ||||||
|
| |||||||
| $ | 5,443,578 | |||||||
|
| |||||||
| Total Common Stocks (Identified Cost, $128,218,515) | $ | 130,732,431 | ||||||
|
| |||||||
| MONEY MARKET FUNDS – 0.2% | ||||||||
| MFS Institutional Money Market Portfolio, 0.05%, at Cost and Net Asset Value (v) | 316,413 | $ | 316,413 | |||||
|
| |||||||
| Total Investments (Identified Cost, $128,534,928) | $ | 131,048,844 | ||||||
|
| |||||||
| Issuer/Expiration Date/Strike Price | ||||||||
| PUT OPTIONS WRITTEN – 0.0% | ||||||||
| Computer Software – 0.0% | ||||||||
| Red Hat, Inc. – January 2012 @ $39 (Premium Received, $2,369) | (32 | ) | $ | (1,696 | ) | |||
|
| |||||||
| SECURITIES SOLD SHORT – (0.6)% | ||||||||
| Computer Software – Systems – (0.2)% | ||||||||
| Dell, Inc. (a) | (19,440 | ) | $ | (284,407 | ) | |||
|
| |||||||
| Machinery & Tools – (0.4)% | ||||||||
| Caterpillar, Inc. | (5,300 | ) | $ | (480,180 | ) | |||
|
| |||||||
| Total Securities Sold Short (Proceeds Received, $624,649) | $ | (764,587 | ) | |||||
|
| |||||||
| OTHER ASSETS, LESS LIABILITIES – 0.1% | 102,540 | |||||||
|
| |||||||
| Net Assets – 100.0% | $ | 130,385,101 | ||||||
|
| |||||||
| (a) | Non-income producing security. |
| (s) | Security or a portion of the security was pledged to cover collateral requirements for securities sold short and/or certain derivative transactions. At December 31, 2011, the value of securities pledged amounted to $1,460,926. |
| (v) | Underlying affiliated fund that is available only to investment companies managed by MFS. The rate quoted for the MFS Institutional Money Market Portfolio is the annualized seven-day yield of the fund at period end. |
The following abbreviations are used in this report and are defined:
| ADR | American Depository Receipt |
| IPS | International Preference Stock |
| PLC | Public Limited Company |
See Notes to Financial Statements
9
Table of Contents
MFS Global Research Portfolio
FINANCIAL STATEMENTS | STATEMENT OF ASSETS AND LIABILITIES
This statement represents your fund’s balance sheet, which details the assets and liabilities comprising the total value of the fund.
At 12/31/11 | ||||||||
Assets | ||||||||
Investments – | ||||||||
Non-affiliated issuers, at value (identified cost, $128,218,515) | $130,732,431 | |||||||
Underlying affiliated funds, at cost and value | 316,413 | |||||||
Total investments, at value (identified cost, $128,534,928) | $131,048,844 | |||||||
Cash | 17,260 | |||||||
Deposits with brokers | 57,028 | |||||||
Receivables for | ||||||||
Investments sold | 4,706 | |||||||
Fund shares sold | 34,280 | |||||||
Interest and dividends | 205,287 | |||||||
Other assets | 4,233 | |||||||
Total assets | $131,371,638 | |||||||
Liabilities | ||||||||
Payables for | ||||||||
Securities sold short, at value (proceeds received, $624,649) | $764,587 | |||||||
Fund shares reacquired | 119,217 | |||||||
Written options outstanding, at value (premiums received, $2,369) | 1,696 | |||||||
Payable to affiliates | ||||||||
Investment adviser | 8,384 | |||||||
Shareholder servicing costs | 96 | |||||||
Distribution and/or service fees | 268 | |||||||
Payable for Trustees’ compensation | 313 | |||||||
Accrued expenses and other liabilities | 91,976 | |||||||
Total liabilities | $986,537 | |||||||
Net assets | $130,385,101 | |||||||
Net assets consist of | ||||||||
Paid-in capital | $172,357,263 | |||||||
Unrealized appreciation (depreciation) on investments and translation of assets and liabilities in foreign currencies | 2,368,958 | |||||||
Accumulated net realized gain (loss) on investments and foreign currency transactions | (46,380,112 | ) | ||||||
Undistributed net investment income | 2,038,992 | |||||||
Net assets | $130,385,101 | |||||||
Shares of beneficial interest outstanding | 7,368,600 |
| Net assets | Shares outstanding | Net asset value per share | ||||||||||
Initial Class | $117,311,847 | 6,625,860 | $17.71 | |||||||||
Service Class | 13,073,254 | 742,740 | 17.60 | |||||||||
See Notes to Financial Statements
10
Table of Contents
MFS Global Research Portfolio
FINANCIAL STATEMENTS | STATEMENT OF OPERATIONS
This statement describes how much your fund earned in investment income and accrued in expenses. It also describes any gains and/or losses generated by fund operations.
| Year ended 12/31/11 | ||||||||
Net investment income | ||||||||
Income | ||||||||
Dividends | $3,721,511 | |||||||
Interest | 52,814 | |||||||
Dividends from other affiliated issuers | 370 | |||||||
Foreign taxes withheld | (241,291 | ) | ||||||
Total investment income | $3,533,404 | |||||||
Expenses | ||||||||
Management fee | $1,126,337 | |||||||
Distribution and/or service fees | 38,257 | |||||||
Shareholder servicing costs | 16,306 | |||||||
Administrative services fee | 50,609 | |||||||
Trustees’ compensation | 18,388 | |||||||
Custodian fee | 121,686 | |||||||
Shareholder communications | 11,196 | |||||||
Auditing fees | 59,589 | |||||||
Legal fees | 5,417 | |||||||
Dividend and interest expense on securities sold short | 18,550 | |||||||
Miscellaneous | 29,300 | |||||||
Total expenses | $1,495,635 | |||||||
Fees paid indirectly | (13 | ) | ||||||
Net expenses | $1,495,622 | |||||||
Net investment income | $2,037,782 | |||||||
Realized and unrealized gain (loss) on investments and foreign currency transactions | ||||||||
Realized gain (loss) (identified cost basis) | ||||||||
Investment transactions (net of $159 country tax) | $6,883,757 | |||||||
Written option transactions | 8,998 | |||||||
Securities sold short | 60,035 | |||||||
Foreign currency transactions | 2,426 | |||||||
Net realized gain (loss) on investments and foreign currency transactions | $6,955,216 | |||||||
Change in unrealized appreciation (depreciation) | ||||||||
Investments (net of $16,123 decrease in deferred country tax) | $(18,349,429 | ) | ||||||
Written options | 673 | |||||||
Securities sold short | 59,917 | |||||||
Translation of assets and liabilities in foreign currencies | (21,185 | ) | ||||||
Net unrealized gain (loss) on investments and foreign currency translation | $(18,310,024 | ) | ||||||
Net realized and unrealized gain (loss) on investments and foreign currency | $(11,354,808 | ) | ||||||
Change in net assets from operations | $(9,317,026 | ) |
See Notes to Financial Statements
11
Table of Contents
MFS Global Research Portfolio
FINANCIAL STATEMENTS | STATEMENTS OF CHANGES IN NET ASSETS
These statements describe the increases and/or decreases in net assets resulting from operations, any distributions, and any shareholder transactions.
For years ended 12/31 | 2011 | 2010 | ||||||
Change in net assets | ||||||||
From operations | ||||||||
Net investment income | $2,037,782 | $1,800,366 | ||||||
Net realized gain (loss) on investments and foreign currency transactions | 6,955,216 | 10,963,173 | ||||||
Net unrealized gain (loss) on investments and foreign currency translation | (18,310,024 | ) | 5,583,187 | |||||
Change in net assets from operations | $(9,317,026 | ) | $18,346,726 | |||||
Distributions declared to shareholders | ||||||||
From net investment income | $(1,734,310 | ) | $(2,115,081 | ) | ||||
Change in net assets from fund share transactions | $(19,755,648 | ) | $(22,699,043 | ) | ||||
Total change in net assets | $(30,806,984 | ) | $(6,467,398 | ) | ||||
Net assets | ||||||||
At beginning of period | 161,192,085 | 167,659,483 | ||||||
At end of period (including undistributed net investment income of $2,038,992 and | $130,385,101 | $161,192,085 |
See Notes to Financial Statements
12
Table of Contents
MFS Global Research Portfolio
FINANCIAL STATEMENTS | FINANCIAL HIGHLIGHTS
The financial highlights table is intended to help you understand the fund’s financial performance for the past 5 years. Certain information reflects financial results for a single fund share. The total returns in the table represent the rate by which an investor would have earned (or lost) on an investment in the fund share class (assuming reinvestment of all distributions) held for the entire period.
| Initial Class | Years ended 12/31 | |||||||||||||||||||
| 2011 | 2010 | 2009 | 2008 | 2007 | ||||||||||||||||
Net asset value, beginning of period | $19.23 | $17.29 | $13.30 | $21.04 | $18.73 | |||||||||||||||
| Income (loss) from investment operations | ||||||||||||||||||||
Net investment income (d) | $0.27 | $0.20 | $0.20 | $0.19 | $0.10 | |||||||||||||||
Net realized and unrealized gain (loss) on investments | (1.56 | ) | 1.97 | 4.03 | (7.81 | ) | 2.37 | |||||||||||||
Total from investment operations | $(1.29 | ) | $2.17 | $4.23 | $(7.62 | ) | $2.47 | |||||||||||||
| Less distributions declared to shareholders | ||||||||||||||||||||
From net investment income | $(0.23 | ) | $(0.23 | ) | $(0.24 | ) | $(0.12 | ) | $(0.16 | ) | ||||||||||
Net asset value, end of period (x) | $17.71 | $19.23 | $17.29 | $13.30 | $21.04 | |||||||||||||||
Total return (%) (k)(s)(x) | (6.73 | ) | 12.66 | 32.44 | (36.43 | ) | 13.24 | |||||||||||||
| Ratios (%) (to average net assets) and Supplemental data: | ||||||||||||||||||||
Expenses (f) | 0.97 | 0.97 | 0.98 | 0.87 | 0.83 | |||||||||||||||
Net investment income | 1.38 | 1.18 | 1.42 | 1.06 | 0.48 | |||||||||||||||
Portfolio turnover | 54 | 59 | 63 | 144 | 84 | |||||||||||||||
Net assets at end of period (000 omitted) | $117,312 | $144,156 | $149,758 | $134,672 | $268,217 | |||||||||||||||
| Supplemental Ratios (%): | ||||||||||||||||||||
Ratio of expenses to average net assets excluding short sale dividend and interest expense (f) | 0.96 | 0.96 | 0.98 | N/A | N/A | |||||||||||||||
See Notes to Financial Statements
13
Table of Contents
MFS Global Research Portfolio
Financial Highlights – continued
| Service Class | Years ended 12/31 | |||||||||||||||||||
| 2011 | 2010 | 2009 | 2008 | 2007 | ||||||||||||||||
Net asset value, beginning of period | $19.11 | $17.18 | $13.21 | $20.89 | $18.60 | |||||||||||||||
| Income (loss) from investment operations | ||||||||||||||||||||
Net investment income (d) | $0.22 | $0.16 | $0.17 | $0.14 | $0.05 | |||||||||||||||
Net realized and unrealized gain (loss) on investments | (1.55 | ) | 1.96 | 3.99 | (7.76 | ) | 2.36 | |||||||||||||
Total from investment operations | $(1.33 | ) | $2.12 | $4.16 | $(7.62 | ) | $2.41 | |||||||||||||
| Less distributions declared to shareholders | ||||||||||||||||||||
From net investment income | $(0.18 | ) | $(0.19 | ) | $(0.19 | ) | $(0.06 | ) | $(0.12 | ) | ||||||||||
Net asset value, end of period (x) | $17.60 | $19.11 | $17.18 | $13.21 | $20.89 | |||||||||||||||
Total return (%) (k)(s)(x) | (7.00 | ) | 12.42 | 32.03 | (36.57 | ) | 12.97 | |||||||||||||
| Ratios (%) (to average net assets) and Supplemental data: | ||||||||||||||||||||
Expenses (f) | 1.22 | 1.22 | 1.23 | 1.12 | 1.08 | |||||||||||||||
Net investment income | 1.13 | 0.93 | 1.21 | 0.81 | 0.23 | |||||||||||||||
Portfolio turnover | 54 | 59 | 63 | 144 | 84 | |||||||||||||||
Net assets at end of period (000 omitted) | $13,073 | $17,036 | $17,901 | $18,199 | $28,832 | |||||||||||||||
| Supplemental Ratios (%): | ||||||||||||||||||||
Ratio of expenses to average net assets excluding short sale dividend | 1.21 | 1.21 | 1.23 | N/A | N/A | |||||||||||||||
| (d) | Per share data is based on average shares outstanding. |
| (f) | Ratios do not reflect reductions from fees paid indirectly, if applicable. |
| (k) | The total return does not reflect expenses that apply to separate accounts. Inclusion of these charges would reduce the total return figures for all periods shown. |
| (s) | From time to time the fund may receive proceeds from litigation settlements, without which performance would be lower. Excluding the effect of the proceeds received from a non-recurring litigation settlement against Enron Corp., the Initial Class and Service Class total returns for the year ended December 31, 2008 would have each been lower by approximately 0.86%. Excluding the effect of the proceeds received from a non-recurring litigation settlement against Tyco International Ltd., the Initial Class and Service Class total returns for the year ended December 31, 2010 would have been lower by approximately 0.71% and 0.70%, respectively. |
| (x) | The net asset values per share and total returns have been calculated on net assets which include adjustments made in accordance with U.S. generally accepted accounting principles required at period end for financial reporting purposes. |
See Notes to Financial Statements
14
Table of Contents
MFS Global Research Portfolio
| (1) | Business and Organization |
MFS Global Research Portfolio (the fund) is a series of MFS Variable Insurance Trust II (the trust). The trust is organized as a Massachusetts business trust and is registered under the Investment Company Act of 1940, as amended, as an open-end management investment company. The shareholders of each series of the trust are separate accounts of insurance companies, which offer variable annuity and/or life insurance products, and qualified retirement and pension plans.
| (2) | Significant Accounting Policies |
General – The preparation of financial statements in conformity with U.S. generally accepted accounting principles requires management to make estimates and assumptions that affect the reported amounts of assets and liabilities, and disclosure of contingent assets and liabilities at the date of the financial statements and the reported amounts of revenues and expenses during the reporting period. Actual results could differ from those estimates. In the preparation of these financial statements, management has evaluated subsequent events occurring after the date of the fund’s Statement of Assets and Liabilities through the date that the financial statements were issued. The fund invests in foreign securities. Investments in foreign securities are vulnerable to the effects of changes in the relative values of the local currency and the U.S. dollar and to the effects of changes in each country’s legal, political, and economic environment.
In December 2011, the Financial Accounting Standards Board issued Accounting Standards Update 2011-11, Balance Sheet (Topic 210) – Disclosures about Offsetting Assets and Liabilities (“ASU 2011-11”). Effective for annual reporting periods beginning on or after January 1, 2013 and interim periods within those annual periods, ASU 2011-11 is intended to enhance disclosure requirements on the offsetting of financial assets and liabilities. Although still evaluating the potential impacts of ASU 2011-11 to the fund, management expects that the impact of the fund’s adoption will be limited to additional financial statement disclosures.
Investment Valuations – Equity securities, including restricted equity securities, are generally valued at the last sale or official closing price as provided by a third-party pricing service on the market or exchange on which they are primarily traded. Equity securities, for which there were no sales reported that day, are generally valued at the last quoted daily bid quotation as provided by a third-party pricing service on the market or exchange on which such securities are primarily traded. Equity securities held short, for which there were no sales reported for that day, are generally valued at the last quoted daily ask quotation as provided by a third-party pricing service on the market or exchange on which such securities are primarily traded. Short-term instruments with a maturity at issuance of 60 days or less generally are valued at amortized cost, which approximates market value. Exchange-traded options are generally valued at the last sale or official closing price as provided by a third-party pricing service on the exchange on which such options are primarily traded. Exchange-traded options for which there were no sales reported that day are generally valued at the last daily bid quotation as provided by a third-party pricing service on the exchange on which such options are primarily traded. Options not traded on an exchange are generally valued at a broker/dealer bid quotation. Foreign currency options are generally valued at valuations provided by a third-party pricing service. Open-end investment companies are generally valued at net asset value per share. Securities and other assets generally valued on the basis of information from a third-party pricing service may also be valued at a broker/dealer bid quotation. Values obtained from third-party pricing services can utilize both transaction data and market information such as yield, quality, coupon rate, maturity, type of issue, trading characteristics, and other market data. The values of foreign securities and other assets and liabilities expressed in foreign currencies are converted to U.S. dollars using the mean of bid and asked prices for rates provided by a third-party pricing service.
The Board of Trustees has delegated primary responsibility for determining or causing to be determined the value of the fund’s investments (including any fair valuation) to the adviser pursuant to valuation policies and procedures approved by the Board. If the adviser determines that reliable market quotations are not readily available, investments are valued at fair value as determined in good faith by the adviser in accordance with such procedures under the oversight of the Board of Trustees. Under the fund’s valuation policies and procedures, market quotations are not considered to be readily available for most types of debt instruments and floating rate loans and many types of derivatives. These investments are generally valued at fair value based on information from third-party pricing services. In addition, investments may be valued at fair value if the adviser determines that an investment’s value has been materially affected by events occurring after the close of the exchange or market on which the investment is principally traded (such as foreign exchange or market) and prior to the determination of the fund’s net asset value, or after the halting of trading of a specific security where trading does not resume prior to the close of the exchange or market on which the security is principally traded. Events that occur on a frequent basis after foreign markets close (such as developments in foreign markets and significant movements in the U.S. markets) and prior to the determination of the fund’s net asset value may be deemed to have a material effect on the value of securities traded in foreign markets. Accordingly, the fund’s foreign equity securities may often be valued at fair value. The adviser generally relies on third-party pricing services or other information (such as the correlation with price movements of similar securities in the same
15
Table of Contents
MFS Global Research Portfolio
Notes to Financial Statements – continued
or other markets; the type, cost and investment characteristics of the security; the business and financial condition of the issuer; and trading and other market data) to assist in determining whether to fair value and at what value to fair value an investment. The value of an investment for purposes of calculating the fund’s net asset value can differ depending on the source and method used to determine value. When fair valuation is used, the value of an investment used to determine the fund’s net asset value may differ from quoted or published prices for the same investment. There can be no assurance that the fund could obtain the fair value assigned to an investment if it were to sell the investment at the same time at which the fund determines its net asset value per share.
Various inputs are used in determining the value of the fund’s assets or liabilities. These inputs are categorized into three broad levels. In certain cases, the inputs used to measure fair value may fall into different levels of the fair value hierarchy. In such cases, an investment’s level within the fair value hierarchy is based on the lowest level of input that is significant to the fair value measurement. The fund’s assessment of the significance of a particular input to the fair value measurement in its entirety requires judgment, and considers factors specific to the investment. Level 1 includes unadjusted quoted prices in active markets for identical assets or liabilities. Level 2 includes other significant observable market-based inputs (including quoted prices for similar securities, interest rates, prepayment speed, and credit risk). Level 3 includes unobservable inputs, which may include the adviser’s own assumptions in determining the fair value of investments. Other financial instruments are derivative instruments not reflected in total investments, such as written options. The following is a summary of the levels used as of December 31, 2011 in valuing the fund’s assets or liabilities:
| Investments at Value | Level 1 | Level 2 | Level 3 | Total | ||||||||||||
| Equity Securities: | ||||||||||||||||
United States | $66,016,496 | $— | $— | $66,016,496 | ||||||||||||
United Kingdom | 4,012,081 | 9,857,474 | — | 13,869,555 | ||||||||||||
Japan | 7,268,438 | — | — | 7,268,438 | ||||||||||||
Switzerland | 2,327,783 | 3,479,092 | — | 5,806,875 | ||||||||||||
Netherlands | 800,153 | 4,119,919 | — | 4,920,072 | ||||||||||||
Germany | 3,554,696 | 1,102,004 | — | 4,656,700 | ||||||||||||
France | 2,488,008 | 1,705,304 | — | 4,193,312 | ||||||||||||
Australia | 4,029,285 | — | — | 4,029,285 | ||||||||||||
Brazil | 2,996,768 | — | — | 2,996,768 | ||||||||||||
Other Countries | 14,789,756 | 2,185,174 | — | 16,974,930 | ||||||||||||
| Mutual Funds | 316,413 | — | — | 316,413 | ||||||||||||
| Total Investments | $108,599,877 | $22,448,967 | $— | $131,048,844 | ||||||||||||
| Short Sales | $(764,587 | ) | $— | $— | $(764,587 | ) | ||||||||||
| Other Financial Instruments | ||||||||||||||||
| Written Options | (1,696 | ) | — | — | (1,696 | ) | ||||||||||
For further information regarding security characteristics, see the Portfolio of Investments.
Of the level 2 investments presented above, equity investments amounting to $15,811,626 would have been considered level 1 investments at the beginning of the period. Of the level 1 investments presented above, equity investments amounting to $960,374, would have been considered level 2 investments at the beginning of the period. The primary reason for changes in the classifications between levels 1 and 2 occurs when foreign equity securities are fair valued using other observable market-based inputs in place of the closing exchange price due to events occurring after the close of the exchange or market on which the investment is principally traded. The fund’s foreign equity securities may often be valued at fair value. The fund’s policy is to recognize transfers between the levels as of the end of the period.
Foreign Currency Translation – Purchases and sales of foreign investments, income, and expenses are converted into U.S. dollars based upon currency exchange rates prevailing on the respective dates of such transactions or on the reporting date for foreign denominated receivables and payables. Gains and losses attributable to foreign currency exchange rates on sales of securities are recorded for financial statement purposes as net realized gains and losses on investments. Gains and losses attributable to foreign exchange rate movements on receivables, payables, income and expenses are recorded for financial statement purposes as foreign currency transaction gains and losses. That portion of both realized and unrealized gains and losses on investments that results from fluctuations in foreign currency exchange rates is not separately disclosed.
Derivatives – The fund uses derivatives for different purposes, primarily to increase or decrease exposure to a particular market or segment of the market, or security, to increase or decrease interest rate or currency exposure, or as alternatives to direct investments. Derivatives are used for hedging or non-hedging purposes. While hedging can reduce or eliminate losses, it can also reduce or eliminate gains. When the fund uses derivatives as an investment to increase market exposure, or for hedging purposes, gains and losses from derivative instruments may be substantially greater than the derivative’s original cost.
16
Table of Contents
MFS Global Research Portfolio
Notes to Financial Statements – continued
The derivative instruments used by the fund were written options and purchased options. The fund’s period end derivatives, as presented in the Portfolio of Investments and the associated Derivative Contract Tables, generally are indicative of the volume of its derivative activity during the period.
The following table presents, by major type of derivative contract, the fair value, on a gross basis, of the asset and liability components of derivatives held by the fund at December 31, 2011 as reported in the Statement of Assets and Liabilities:
| Fair Value | ||||||||||
| Risk | Derivative Contracts | Asset Derivatives | Liability Derivatives | |||||||
| Equity | Written Equity Options | $— | $(1,696 | ) | ||||||
The following table presents, by major type of derivative contract, the realized gain (loss) on derivatives held by the fund for the year ended December 31, 2011 as reported in the Statement of Operations:
| Risk | Investment Transactions | Written Options | ||||||
| Equity | $(21,617 | ) | $8,998 | |||||
The following table presents, by major type of derivative contract, the change in unrealized appreciation (depreciation) on derivatives held by the fund for the year ended December 31, 2011 as reported in the Statement of Operations:
| Risk | Written Options | |||
| Equity | $673 | |||
Derivative counterparty credit risk is managed through formal evaluation of the creditworthiness of all potential counterparties. On certain over-the-counter derivatives, the fund attempts to reduce its exposure to counterparty credit risk whenever possible by entering into an International Swaps and Derivatives Association (ISDA) Master Agreement on a bilateral basis with each of the counterparties with whom it undertakes a significant volume of transactions. The ISDA Master Agreement gives each party to the agreement the right to terminate all transactions traded under such agreement if there is a certain deterioration in the credit quality of the other party. The ISDA Master Agreement gives the fund the right, upon an event of default by the applicable counterparty or a termination of the agreement, to close out all transactions traded under such agreement and to net amounts owed under each transaction to one net amount payable by one party to the other. This right to close out and net payments across all transactions traded under the ISDA Master Agreement could result in a reduction of the fund’s credit risk to such counterparty equal to any amounts payable by the fund under the applicable transactions, if any. However, absent an event of default by the counterparty or a termination of the agreement, the ISDA Master Agreement does not result in an offset of reported amounts of assets and liabilities in the Statement of Assets and Liabilities across transactions between the fund and the applicable counterparty.
Collateral requirements differ by type of derivative. Collateral or margin requirements are set by the broker or exchange clearing house for exchange traded derivatives (i.e., futures and exchange-traded options) while collateral terms are contract specific for over-the-counter traded derivatives (i.e., forward foreign currency exchange contracts, swaps and over-the-counter options). For derivatives traded under an ISDA Master Agreement, the collateral requirements are netted across all transactions traded under such agreement and one amount is posted from one party to the other to collateralize such obligations. Cash collateral that has been pledged to cover obligations of the fund under derivative contracts, if any, will be reported separately on the Statement of Assets and Liabilities as restricted cash. Securities collateral pledged for the same purpose, if any, is noted in the Portfolio of Investments.
Written Options – In exchange for a premium, the fund wrote call options on securities that it anticipated the price would decline and also wrote put options on securities that it anticipated the price would increase. At the time the option was written, the fund believed the premium received exceeded the potential loss that could result from adverse price changes in the options’ underlying securities. In a written option, the fund as the option writer grants the buyer the right to purchase from, or sell to, the fund a specified number of shares or units of a particular security, currency or index at a specified price within a specified period of time.
The premium received is initially recorded as a liability on the Statement of Assets and Liabilities. The option is subsequently marked-to-market daily with the difference between the premium received and the market value of the written option being recorded as unrealized appreciation or depreciation. When a written option expires, the fund realizes a gain equal to the amount of the premium received. The difference between the premium received and the amount paid on effecting a closing
17
Table of Contents
MFS Global Research Portfolio
Notes to Financial Statements – continued
transaction is considered a realized gain or loss. When a written call option is exercised, the premium received is offset against the proceeds to determine the realized gain or loss. When a written put option is exercised, the premium reduces the cost basis of the security purchased by the fund.
At the initiation of the written option contract, for exchange traded options, the fund is required to deposit securities or cash as collateral with the custodian for the benefit of the broker. For over-the-counter options, the fund may post collateral subject to the terms of an ISDA Master Agreement as generally described above if the market value of the options contract moves against it. The fund, as writer of an option, may have no control over whether the underlying securities may be sold (call) or purchased (put) and, as a result, bears the market risk of an unfavorable change in the price of the securities underlying the written option. Losses from writing options can exceed the premium received and can exceed the potential loss from an ordinary buy and sell transaction. Although the fund’s market risk may be significant, the maximum counterparty credit risk to the fund is equal to the market value of any collateral posted to the broker. For over-the-counter options, this risk is mitigated in cases where there is an ISDA Master Agreement between the fund and the counterparty providing for netting as described above.
Written Option Transactions
| Number of contracts | Premiums received | |||||||
| Outstanding, beginning of period | — | $— | ||||||
| Options written | 430 | 11,408 | ||||||
| Options expired | (398 | ) | (9,039 | ) | ||||
| Outstanding, end of period | 32 | $2,369 | ||||||
Purchased Options – The fund purchased call and put options for a premium. Purchased call and put options entitle the holder to buy and sell a specified number of shares or units of a particular security, currency or index at a specified price at a specified date or within a specified period of time. Purchasing call options may be used to hedge against an anticipated increase in the dollar cost of securities or currency to be acquired or to increase the fund’s exposure to an underlying instrument. Purchasing put options may hedge against a decline in the value of portfolio securities or currency.
The premium paid is initially recorded as an investment in the Statement of Assets and Liabilities. That investment is subsequently marked-to-market daily with the difference between the premium paid and the market value of the purchased option being recorded as unrealized appreciation or depreciation. Premiums paid for purchased call and put options which have expired are treated as realized losses on investments in the Statement of Operations. Upon the exercise or closing of a purchased call option, the premium paid is added to the cost of the security or financial instrument. Upon the exercise or closing of a purchased put option, the premium paid is offset against the proceeds on the sale of the underlying security or financial instrument in order to determine the realized gain or loss on investments.
The risk in purchasing an option is that the fund pays a premium whether or not the option is exercised. The fund’s maximum risk of loss due to counterparty credit risk is limited to the market value of the option. For over-the-counter options, this risk is mitigated in cases where there is an ISDA Master Agreement between the fund and the counterparty providing for netting as described above and for posting of collateral by the counterparty to the fund to cover the fund’s exposure to the counterparty under such ISDA Master Agreement.
Short Sales – The fund entered into short sales whereby it sells a security it does not own in anticipation of a decline in the value of that security. The fund will realize a gain if the security price decreases and a loss if the security price increases between the date of the short sale and the date on which the fund replaces the borrowed security. Losses from short sales can exceed the proceeds of the security sold; and they can also exceed the potential loss from an ordinary buy and sell transaction. The amount of any premium, dividends, or interest the fund may be required to pay in connection with a short sale will be recognized as a fund expense. During the year ended December 31, 2011, this expense amounted to $18,550. The fund segregates cash or marketable securities in an amount that, when combined with the amount of proceeds from the short sale deposited with the broker, at least equals the current market value of the security sold short.
Security Loans – State Street Bank and Trust Company (“State Street”), as lending agent, loans the securities of the fund to certain qualified institutions (the “Borrowers”) approved by the fund. The loans are collateralized by cash and/or U.S. Treasury and federal agency obligations in an amount typically at least equal to the market value of the securities loaned. The market value of the loaned securities is determined at the close of business of the fund and any additional required collateral is delivered to the fund on the next business day. State Street provides the fund with indemnification against Borrower default. The fund bears the risk of loss with respect to the investment of cash collateral. On loans collateralized by cash, the cash collateral is invested in a money market fund or short-term securities. A portion of the income generated upon investment of the collateral is remitted to the Borrowers, and the remainder is allocated between the fund and the lending agent. On loans collateralized by U.S. Treasury and/or
18
Table of Contents
MFS Global Research Portfolio
Notes to Financial Statements – continued
federal agency obligations, a fee is received from the Borrower, and is allocated between the fund and the lending agent. Income from securities lending is included in interest income on the Statement of Operations. The dividend and interest income earned on the securities loaned is accounted for in the same manner as other dividend and interest income.
Indemnifications – Under the fund’s organizational documents, its officers and Trustees may be indemnified against certain liabilities and expenses arising out of the performance of their duties to the fund. Additionally, in the normal course of business, the fund enters into agreements with service providers that may contain indemnification clauses. The fund’s maximum exposure under these agreements is unknown as this would involve future claims that may be made against the fund that have not yet occurred.
Investment Transactions and Income – Investment transactions are recorded on the trade date. Interest income is recorded on the accrual basis. Dividends received in cash are recorded on the ex-dividend date. Certain dividends from foreign securities will be recorded when the fund is informed of the dividend if such information is obtained subsequent to the ex-dividend date. Dividend and interest payments received in additional securities are recorded on the ex-dividend or ex-interest date in an amount equal to the value of the security on such date.
The fund may receive proceeds from litigation settlements. Any proceeds received from litigation involving portfolio holdings are reflected in the Statement of Operations in realized gain/loss if the security has been disposed of by the fund or in unrealized gain/loss if the security is still held by the fund. Any other proceeds from litigation not related to portfolio holdings are reflected as other income in the Statement of Operations.
Fees Paid Indirectly – The fund’s custody fee may be reduced according to an arrangement that measures the value of cash deposited with the custodian by the fund. This amount, for the year ended December 31, 2011, is shown as a reduction of total expenses on the Statement of Operations.
Tax Matters and Distributions – The fund intends to qualify as a regulated investment company, as defined under Subchapter M of the Internal Revenue Code, and to distribute all of its taxable income, including realized capital gains. As a result, no provision for federal income tax is required. The fund’s federal tax returns for the prior three fiscal years remain subject to examination by the Internal Revenue Service. Foreign taxes have been accrued by the fund in the accompanying financial statements.
Distributions to shareholders are recorded on the ex-dividend date. Income and capital gain distributions are determined in accordance with income tax regulations, which may differ from U.S. generally accepted accounting principles. Certain capital accounts in the financial statements are periodically adjusted for permanent differences in order to reflect their tax character. These adjustments have no impact on net assets or net asset value per share. Temporary differences which arise from recognizing certain items of income, expense, gain or loss in different periods for financial statement and tax purposes will reverse at some time in the future. Distributions in excess of net investment income or net realized gains are temporary overdistributions for financial statement purposes resulting from differences in the recognition or classification of income or distributions for financial statement and tax purposes.
Book/tax differences primarily relate to wash sale loss deferrals.
The tax character of distributions declared to shareholders for the last two fiscal years is as follows:
| 12/31/11 | 12/31/10 | |||||||
| Ordinary income (including any short-term capital gains) | $1,734,310 | $2,115,081 | ||||||
The federal tax cost and the tax basis components of distributable earnings were as follows:
| As of 12/31/11 | ||||
| Cost of investments | $128,634,333 | |||
| Gross appreciation | 13,836,430 | |||
| Gross depreciation | (11,421,919 | ) | ||
| Net unrealized appreciation (depreciation) | $2,414,511 | |||
| Undistributed ordinary income | 2,038,992 | |||
| Capital loss carryforwards | (46,280,707 | ) | ||
| Other temporary differences | (144,958 | ) |
Under the Regulated Investment Company Modernization Act of 2010 (the “Act”), net capital losses recognized after December 31, 2010 may be carried forward indefinitely, and their character is retained as short-term and/or long-term losses. Previously, net capital losses were carried forward for eight years and treated as short-term losses. As a transition rule, the Act requires that post-enactment net capital losses be used before pre-enactment net capital losses.
19
Table of Contents
MFS Global Research Portfolio
Notes to Financial Statements – continued
As of December 31, 2011, the fund had capital loss carryforwards available to offset future realized gains. Such losses expire as follows:
| Pre-enactment losses: | ||||
| 12/31/16 | $(27,558,952 | ) | ||
| 12/31/17 | (18,721,755 | ) | ||
| Total | $(46,280,707 | ) |
Multiple Classes of Shares of Beneficial Interest – The fund offers multiple classes of shares, which differ in their respective distribution and/or service fees. The fund’s income, realized and unrealized gain (loss), and common expenses are allocated to shareholders based on the daily net assets of each class. Dividends are declared separately for each class. Differences in per share dividend rates are generally due to differences in separate class expenses. The fund’s distributions declared to shareholders as reported on the Statements of Changes in Net Assets are presented by class as follows:
| From net investment income | ||||||||
| Year ended 12/31/11 | Year ended 12/31/10 | |||||||
| Initial Class | $1,599,294 | $1,921,573 | ||||||
| Service Class | 135,016 | 193,508 | ||||||
| Total | $1,734,310 | $2,115,081 | ||||||
| (3) | Transactions with Affiliates |
Investment Adviser – The fund has an investment advisory agreement with MFS to provide overall investment management and related administrative services and facilities to the fund. The management fee is computed daily and paid monthly at the following annual rates:
| First $300 million of average daily net assets | 0.75% | |||
| Average daily net assets in excess of $300 million | 0.675% |
The management fee incurred for the year ended December 31, 2011 was equivalent to an annual effective rate of 0.75% of the fund’s average daily net assets.
Distributor – MFS Fund Distributors, Inc. (MFD), a wholly-owned subsidiary of MFS, is the distributor of shares of the fund. The Trustees have adopted a distribution plan for the Service Class shares pursuant to Rule 12b-1 under the Investment Company Act of 1940.
The fund’s distribution plan provides that the fund will pay MFD distribution and/or service fees equal to 0.25% per annum of its average daily net assets attributable to Service Class shares as partial consideration for services performed and expenses incurred by MFD and financial intermediaries (including participating insurance companies that invest in the fund to fund variable annuity and variable life insurance contracts, sponsors of qualified retirement and pension plans that invest in the fund, and affiliates of these participating insurance companies and plan sponsors) in connection with the sale and distribution of the Service Class shares. MFD may subsequently pay all, or a portion, of the distribution and/or service fees to financial intermediaries.
Shareholder Servicing Agent – MFS Service Center, Inc. (MFSC), a wholly-owned subsidiary of MFS, receives a fee from the fund for its services as shareholder servicing agent. For the year ended December 31, 2011, the fee was $16,296, which equated to 0.0109% annually of the fund’s average daily net assets. MFSC also receives payment from the fund for out-of-pocket expenses paid by MFSC on behalf of the fund. For the year ended December 31, 2011, these costs amounted to $10.
Administrator – MFS provides certain financial, legal, shareholder communications, compliance, and other administrative services to the fund. Under an administrative services agreement, the fund partially reimburses MFS the costs incurred to provide these services. The fund is charged an annual fixed amount of $17,500 plus a fee based on average daily net assets. The administrative services fee incurred for the year ended December 31, 2011 was equivalent to an annual effective rate of 0.0337% of the fund’s average daily net assets.
Trustees’ and Officers’ Compensation – The fund pays compensation to Trustees in the form of a retainer, attendance fees, and additional compensation to the Board chairperson. The fund does not pay compensation directly to officers of the fund who are also officers of the investment adviser, all of whom receive remuneration for their services to the fund from MFS. Certain officers of the fund are officers or directors of MFS, MFD, and MFSC.
Other – This fund and certain other funds managed by MFS (the funds) have entered into services agreements (the Agreements) which provide for payment of fees by the funds to Tarantino LLC and Griffin Compliance LLC in return for the provision of services of an Independent Chief Compliance Officer (ICCO) and Assistant ICCO, respectively, for the funds. The ICCO and Assistant ICCO are officers of the funds and the sole members of Tarantino LLC and Griffin Compliance LLC, respectively. The
20
Table of Contents
MFS Global Research Portfolio
Notes to Financial Statements – continued
funds can terminate the Agreements with Tarantino LLC and Griffin Compliance LLC at any time under the terms of the Agreements. MFS has agreed to bear all expenses associated with office space, other administrative support, and supplies provided to the ICCO and Assistant ICCO. For the year ended December 31, 2011, the aggregate fees paid by the fund to Tarantino LLC and Griffin Compliance LLC were $2,514 and are included in miscellaneous expense on the Statement of Operations.
The fund invests in the MFS Institutional Money Market Portfolio which is managed by MFS and seeks a high level of current income consistent with preservation of capital and liquidity. Income earned on this investment is included in dividends from underlying affiliated funds on the Statement of Operations. This money market fund does not pay a management fee to MFS.
| (4) | Portfolio Securities |
Purchases and sales of investments, other than U.S. Government securities, purchased option transactions, short sales, and short-term obligations, aggregated $82,101,420 and $100,604,886, respectively.
| (5) | Shares of Beneficial Interest |
The fund’s Declaration of Trust permits the Trustees to issue an unlimited number of full and fractional shares of beneficial interest. Transactions in fund shares were as follows:
| Year ended 12/31/11 | Year ended 12/31/10 | |||||||||||||||
| Shares | Amount | Shares | Amount | |||||||||||||
| Shares sold | ||||||||||||||||
Initial Class | 28,690 | $520,163 | 17,219 | $315,125 | ||||||||||||
Service Class | 74,343 | 1,365,536 | 76,615 | 1,283,428 | ||||||||||||
| 103,033 | $1,885,699 | 93,834 | $1,598,553 | |||||||||||||
| Shares issued to shareholders in reinvestment of distributions | ||||||||||||||||
Initial Class | 87,537 | $1,599,294 | 107,231 | $1,921,573 | ||||||||||||
Service Class | 7,427 | 135,016 | 10,847 | 193,508 | ||||||||||||
| 94,964 | $1,734,310 | 118,078 | $2,115,081 | |||||||||||||
| Shares reacquired | ||||||||||||||||
Initial Class | (985,079 | ) | $(18,958,720 | ) | (1,293,440 | ) | $(22,290,770 | ) | ||||||||
Service Class | (230,372 | ) | (4,416,937 | ) | (238,078 | ) | (4,121,907 | ) | ||||||||
| (1,215,451 | ) | $(23,375,657 | ) | (1,531,518 | ) | $(26,412,677 | ) | |||||||||
| Net change | ||||||||||||||||
Initial Class | (868,852 | ) | $(16,839,263 | ) | (1,168,990 | ) | $(20,054,072 | ) | ||||||||
Service Class | (148,602 | ) | (2,916,385 | ) | (150,616 | ) | (2,644,971 | ) | ||||||||
| (1,017,454 | ) | $(19,755,648 | ) | (1,319,606 | ) | $(22,699,043 | ) | |||||||||
| (6) | Line of Credit |
The fund and certain other funds managed by MFS participate in a $1.1 billion unsecured committed line of credit, subject to a $1 billion sublimit, provided by a syndication of banks under a credit agreement. Borrowings may be made for temporary financing needs. Interest is charged to each fund, based on its borrowings, generally at a rate equal to the higher of the Federal Reserve funds rate or one month LIBOR plus an agreed upon spread. A commitment fee, based on the average daily, unused portion of the committed line of credit, is allocated among the participating funds at the end of each calendar quarter. In addition, the fund and other funds managed by MFS have established unsecured uncommitted borrowing arrangements with certain banks for temporary financing needs. Interest is charged to each fund, based on its borrowings, at a rate equal to the Federal Reserve funds rate plus an agreed upon spread. For the year ended December 31, 2011, the fund’s commitment fee and interest expense were $1,171 and $0, respectively, and are included in miscellaneous expense on the Statement of Operations.
| (7) | Transactions in Underlying Affiliated Funds – Affiliated Issuers |
An affiliated issuer may be considered one in which the fund owns 5% or more of the outstanding voting securities, or a company which is under common control. For the purposes of this report, the fund assumes the following to be affiliated issuers:
| Underlying Affiliated Funds | Beginning Shares/Par Amount | Acquisitions Shares/Par Amount | Dispositions Shares/Par Amount | Ending Shares/Par Amount | ||||||||||||
| MFS Institutional Money Market Portfolio | 20 | 24,189,240 | (23,872,847 | ) | 316,413 | |||||||||||
| Underlying Affiliated Funds | Realized Gain (Loss) | Capital Gain Distributions | Dividend Income | Ending Value | ||||||||||||
| MFS Institutional Money Market Portfolio | $— | $— | $370 | $316,413 | ||||||||||||
21
Table of Contents
MFS Global Research Portfolio
REPORT OF INDEPENDENT REGISTERED PUBLIC ACCOUNTING FIRM
To the Board of Trustees of MFS Variable Insurance Trust II and the Shareholders of
MFS Global Research Portfolio:
We have audited the accompanying statement of assets and liabilities, including the portfolio of investments, of MFS Global Research Portfolio (the “Fund”) (one of the portfolios comprising MFS Variable Insurance Trust II) as of December 31, 2011, and the related statement of operations for the year then ended, the statements of changes in net assets for each of the two years in the period then ended, and the financial highlights for each of the five years in the period then ended. These financial statements and financial highlights are the responsibility of the Fund’s management. Our responsibility is to express an opinion on these financial statements and financial highlights based on our audits.
We conducted our audits in accordance with the standards of the Public Company Accounting Oversight Board (United States). Those standards require that we plan and perform the audit to obtain reasonable assurance about whether the financial statements and financial highlights are free of material misstatement. The Fund is not required to have, nor were we engaged to perform, an audit of its internal control over financial reporting. Our audits included consideration of internal control over financial reporting as a basis for designing audit procedures that are appropriate in the circumstances, but not for the purpose of expressing an opinion on the effectiveness of the Fund’s internal control over financial reporting. Accordingly, we express no such opinion. An audit also includes examining, on a test basis, evidence supporting the amounts and disclosures in the financial statements, assessing the accounting principles used and significant estimates made by management, as well as evaluating the overall financial statement presentation. Our procedures included confirmation of securities owned as of December 31, 2011, by correspondence with the custodian and brokers; where replies were not received from brokers, we performed other auditing procedures. We believe that our audits provide a reasonable basis for our opinion.
In our opinion, the financial statements and financial highlights referred to above present fairly, in all material respects, the financial position of MFS Global Research Portfolio as of December 31, 2011, the results of its operations for the year then ended, the changes in its net assets for each of the two years in the period then ended, and the financial highlights for each of the five years in the period then ended, in conformity with accounting principles generally accepted in the United States of America.
DELOITTE & TOUCHE LLP
Boston, Massachusetts
February 15, 2012
22
Table of Contents
MFS Global Research Portfolio
RESULTS OF SHAREHOLDER MEETING (unaudited)
At a special meeting of shareholders of MFS Global Research Portfolio, which was held on December 1, 2011, the following actions were taken for which shareholders of all series of MFS Variable Insurance Trust II voted together as a single class with respect to Item 1 and shareholders of MFS Global Research Portfolio voted as a separate class with respect to Items 2 and 3:
Item 1: Election of ten Trustees as members of the Board of Trustees of the Trust effective January 1, 2012:
| Number of Shares | ||||||||
| For | Withheld Authority | |||||||
| Robert E. Butler | 681,916,712.8686 | 46,472,894.9218 | ||||||
| Maureen R. Goldfarb | 682,835,794.8512 | 45,553,812.9392 | ||||||
| David H. Gunning | 681,500,267.3085 | 46,889,340.4819 | ||||||
| William R. Gutow | 681,050,223.5547 | 47,339,384.2357 | ||||||
| Michael Hegarty | 682,477,088.8584 | 45,912,518.9320 | ||||||
| John P. Kavanaugh | 683,794,425.4269 | 44,595,182.3635 | ||||||
| Robert J. Manning | 682,699,559.7374 | 45,690,048.0530 | ||||||
| J. Dale Sherratt | 681,362,743.0513 | 47,026,864.7391 | ||||||
| Laurie J. Thomsen | 683,408,094.0000 | 44,981,513.7904 | ||||||
| Robert W. Uek | 681,424,852.0247 | 46,964,755.7657 | ||||||
Item 2: To approve a new investment advisory agreement dated January 1, 2012, between the Trust, on behalf of MFS Global Research Portfolio, and MFS:
| Number of Shares | ||||||||||||
| For | Against | Withheld Authority | ||||||||||
| 6,541,349.5796 | 364,756.0961 | 672,094.4698 | ||||||||||
Item 3: To approve revisions to and restatements of certain fundamental investment restrictions of MFS Global Research Portfolio effective January 1, 2012 as detailed below:
| Number of Shares | ||||||||||||||
| For | Against | Withheld Authority | ||||||||||||
| A. | Borrowing | 6,155,440.0916 | 653,013.0708 | 769,746.9831 | ||||||||||
| B. | Underwriting Securities | 6,242,175.2705 | 571,286.8333 | 764,738.0417 | ||||||||||
| C. | Issuance of Senior Securities | 6,265,158.9125 | 558,431.9157 | 754,609.3173 | ||||||||||
| D. | Lending of Money or Securities | 6,195,789.1846 | 597,942.7818 | 784,468.1791 | ||||||||||
| E. | Purchases or Sales of Real Estate; Interests in Oil, Gas or Mineral Leases; and Commodities | 6,257,774.2599 | 566,750.3218 | 753,675.5638 | ||||||||||
| F. | Industry Concentration | 6,410,507.5239 | 413,682.8853 | 754,009.7363 | ||||||||||
23
Table of Contents
MFS Global Research Portfolio
TRUSTEES AND OFFICERS – IDENTIFICATION AND BACKGROUND
The Trustees and officers of the Trust, as of February 1, 2012, are listed below, together with their principal occupations during the past five years. (Their titles may have varied during that period.) The address of each Trustee and officer is 500 Boylston Street, Boston, Massachusetts 02116.
Name, Age | Position(s) with Fund | Trustee/Officer Since (h) | Principal Occupations | Other Directorships (j) | ||||
| INTERESTED TRUSTEES | ||||||||
Robert J. Manning (k) (age 48) | Trustee | February 2004 | Massachusetts Financial Services Company, Chairman, Chief Executive Officer and Director; President (until December 2009); Chief Investment Officer (until July 2010) | N/A | ||||
| INDEPENDENT TRUSTEES | ||||||||
David H. Gunning (age 69) | Trustee and Chair of Trustees | January 2004 | Retired; Cleveland-Cliffs Inc. (mining products and service provider), Vice Chairman/Director (until May 2007) | Lincoln Electric Holdings, Inc. (welding equipment manufacturer), Director; Development Alternatives, Inc. (consulting), Director/Non-Executive Chairman; Portman Limited (mining), Director (until 2008) | ||||
Robert E. Butler (age 70) | Trustee | January 2006 | Consultant – investment company industry regulatory and compliance matters | N/A | ||||
Maureen R. Goldfarb (age 56) | Trustee | January 2009 | Private investor | N/A | ||||
William R. Gutow (age 70) | Trustee | December 1993 | Private investor and real estate consultant; Capitol Entertainment Management Company (video franchise), Vice Chairman | Atlantic Coast Tan (tanning salons), Vice Chairman (until 2007); Texas Donuts (donut franchise), Vice Chairman (until 2010) | ||||
Michael Hegarty (age 67) | Trustee | December 2004 | Private investor | N/A | ||||
John P. Kavanaugh (age 57) | Trustee | January 2009 | Private investor; The Hanover Insurance Group, Inc., Vice President and Chief Investment Officer (until 2006); Allmerica Investment Trust, Allmerica Securities Trust and Opus Investment Trust (investment companies), Chairman, President and Trustee (until 2006) | N/A | ||||
J. Dale Sherratt (age 73) | Trustee | June 1989 | Insight Resources, Inc. (acquisition planning specialists), President; Wellfleet Investments (investor in health care companies), Managing General Partner | N/A | ||||
Laurie J. Thomsen (age 54) | Trustee | March 2005 | Private investor; New Profit, Inc. (venture philanthropy), Executive Partner (until 2010) | The Travelers Companies (property and casualty insurance), Director | ||||
Robert W. Uek (age 70) | Trustee | January 2006 | Consultant to investment company industry | N/A | ||||
| OFFICERS | ||||||||
John M. Corcoran (k) (age 46) | President | October 2008 | Massachusetts Financial Services Company, Senior Vice President (since October 2008); State Street Bank and Trust (financial services provider), Senior Vice President, (until September 2008) | N/A | ||||
| Christopher R. Bohane (k) (age 38) | Assistant Secretary and Assistant Clerk | July 2005 | Massachusetts Financial Services Company, Vice President and Senior Counsel | N/A | ||||
Kino Clark (k) (age 43) | Assistant Treasurer | January 2012 | Massachusetts Financial Services Company, Assistant Vice President | N/A | ||||
24
Table of Contents
MFS Global Research Portfolio
Trustees and Officers – continued
Name, Age | Position(s) with Fund | Trustee/Officer Since (h) | Principal Occupations | Other Directorships (j) | ||||
Ethan D. Corey (k) (age 48) | Assistant Secretary and Assistant Clerk | July 2005 | Massachusetts Financial Services Company, Senior Vice President and Associate General Counsel | N/A | ||||
David L. DiLorenzo (k) (age 43) | Treasurer | July 2005 | Massachusetts Financial Services Company, Vice President | N/A | ||||
Robyn L. Griffin (age 36) | Assistant Independent Chief Compliance Officer | August 2008 | Griffin Compliance LLC (provider of compliance services), Principal (since August 2008); State Street Corporation (financial services provider), Mutual Fund Administration Assistant Vice President (October 2006 – July 2008); Liberty Mutual Group (insurance), Personal Market Assistant Controller (April 2006 – October 2006); Deloitte & Touche LLP (professional services firm). | N/A | ||||
Brian E. Langenfeld (k) (age 38) | Assistant Secretary and Assistant Clerk | June 2006 | Massachusetts Financial Services Company, Vice President and Senior Counsel | N/A | ||||
Ellen Moynihan (k) (age 54) | Assistant Treasurer | April 1997 | Massachusetts Financial Services Company, Senior Vice President | N/A | ||||
Susan S. Newton (k) (age 61) | Assistant Secretary and Assistant Clerk | May 2005 | Massachusetts Financial Services Company, Senior Vice President and Associate General Counsel | N/A | ||||
Susan A. Pereira (k) (age 41) | Assistant Secretary and Assistant Clerk | July 2005 | Massachusetts Financial Services Company, Vice President and Senior Counsel | N/A | ||||
Mark N. Polebaum (k) (age 59) | Secretary and Clerk | January 2006 | Massachusetts Financial Services Company, Executive Vice President, General Counsel and Secretary | N/A | ||||
Frank L. Tarantino (age 67) | Independent Chief Compliance Officer | June 2004 | Tarantino LLC (provider of compliance services), Principal | N/A | ||||
Richard S. Weitzel (k) (age 41) | Assistant Secretary and Assistant Clerk | October 2007 | Massachusetts Financial Services Company, Vice President and Assistant General Counsel | N/A | ||||
James O. Yost (k) (age 51) | Deputy Treasurer | September 1990 | Massachusetts Financial Services Company, Senior Vice President | N/A | ||||
| (h) | Date first appointed to serve as Trustee/officer of an MFS fund. Each Trustee has served continuously since appointment unless indicated otherwise. For the period from December 15, 2004 until February 22, 2005, Mr. Manning served as Advisory Trustee. For the period October 2008, until January 2012, Mr. Corcoran served as Treasurer of the Funds. Prior to January 2012, Messrs. DiLorenzo and Yost served as Assistant Treasurers of the Funds. |
| (j) | Directorships or trusteeships of companies required to report to the Securities and Exchange Commission (i.e., “public companies”). |
| (k) | “Interested person” of the Trust within the meaning of the Investment Company Act of 1940 (referred to as the 1940 Act), which is the principal federal law governing investment companies like the fund, as a result of position with MFS. The address of MFS is 500 Boylston Street, Boston, Massachusetts 02116. |
Each Trustee has been elected by shareholders and each Trustee and officer holds office until his or her successor is chosen and qualified or until his or her earlier death, resignation, retirement or removal. The Trust does not hold annual meetings for the purpose of electing Trustees, and Trustees are not elected for fixed terms. Messrs. Butler, Kavanaugh, Uek and Ms. Thomsen are members of the Trust’s Audit Committee.
Each of the Fund’s Trustees and officers holds comparable positions with certain other funds of which MFS or a subsidiary is the investment adviser or distributor, and, in the case of the officers, with certain affiliates of MFS. As of January 1, 2012, the Trustees served as board members of 131 funds within the MFS Family of Funds.
25
Table of Contents
MFS Global Research Portfolio
Trustees and Officers – continued
The Statement of Additional Information for the Fund includes further information about the Trustees and is available without charge upon request by calling 1-800-225-2606.
Investment Adviser Massachusetts Financial Services Company 500 Boylston Street, Boston, MA 02116-3741 | Custodian State Street Bank and Trust 1 Lincoln Street, Boston, MA 02111-2900 | |
Distributor MFS Fund Distributors, Inc. 500 Boylston Street, Boston, MA 02116-3741 | Independent Registered Public Accounting Firm Deloitte & Touche LLP 200 Berkeley Street, Boston, MA 02116 | |
Portfolio Managers Michael Cantara Ben Kottler |
26
Table of Contents
MFS Global Research Portfolio
At a special meeting of shareholders of the MFS Global Research Portfolio (hereinafter referred to as the “Fund” or the “Portfolio”), which was held on December 1, 2011, the shareholders approved a new investment advisory agreement based on the recommendation of the Board of Trustees. At its July, 2011 meeting, the Board of Trustees (i) approved, and recommended for shareholder approval, the new investment advisory agreement effective January 1, 2012, and (ii) the continuation of the existing investment advisory agreement effective September 1, 2011. The following includes a description of the factors that the Board of Trustees considered and the conclusions that formed the basis of their approval of both the new investment advisory agreement and the continuation of the prior investment advisory agreement.
BOARD APPROVAL OF NEW INVESTMENT ADVISORY AGREEMENT
The Investment Company Act of 1940 requires that both the full Board of Trustees and a majority of the non-interested (“independent”) Trustees, voting separately, initially approve the new investment advisory agreement (the “New Agreement”) between Massachusetts Financial Services Company (“MFS”) and MFS Variable Insurance Trust II (the “Trust”) on behalf of the Portfolio and, beginning on the second anniversary of the initial effective date of the New Agreement, annually approve the continuation of the New Agreement. The Trustees have considered matters bearing on the Portfolio and the then current advisory arrangement at their meetings throughout the year, including a review of performance data at each regular meeting. In addition, the independent Trustees met in person in July 2011 to consider the initial approval of the New Agreement, and to recommend that shareholders approve the New Agreement. The independent Trustees were assisted in their evaluation of the New Agreement by independent legal counsel, from whom they received separate legal advice and with whom they met separately from MFS management. The independent Trustees were also assisted in this process by the Portfolio’s Independent Chief Compliance Officer, a full-time senior officer appointed by and reporting to the independent Trustees.
In connection with their deliberations regarding the initial approval of the New Agreement, the Trustees, including the independent Trustees, considered such information and factors as they believed, in light of the legal advice furnished to them and their own business judgment, to be relevant. The New Agreement was considered separately for the series of the Trust (collectively, the “Portfolios”), although the Trustees also took into account the common interests of all Portfolios in the Trust in their review. As described below, the Trustees considered the nature, quality, and extent of the various investment advisory, administrative, and/or shareholder services to be performed by MFS under the New Agreement and other arrangements with the Trust.
In connection with their initial review meeting, the Trustees received and relied upon materials that included, among other items: (i) information provided by MFS on the advisory fees of comparable portfolios of its other clients, including institutional separate account and other clients, (ii) information as to whether, and to what extent applicable, expense waivers, reimbursements or fee “breakpoints” would be observed for the Portfolio under the New Agreement, and (iii) a comparison and summary of the differences in the provisions in the New Agreement compared to those in each of the then current investment advisory agreements for the Portfolios. In addition, in connection with the independent Trustees’ meetings in May and July, 2011 (the “contract review meetings”) for the purpose of considering whether to approve the continuation of the then current investment advisory agreements for the Portfolio, the independent Trustees received: (1) information provided by Lipper Inc. (“Lipper”) on the investment performance of the Portfolio for various time periods ended December 31, 2010, compared to the investment performance of a group of funds with substantially similar investment classifications/objectives (the “Lipper performance universe”), (2) information provided by Lipper on the Portfolio’s advisory fees and other expenses compared to the advisory fees and other expenses of comparable funds identified by Lipper (the “Lipper expense group”), (3) information regarding MFS’ financial results and financial condition, including MFS’ and certain of its affiliates’ estimated profitability from services performed for the Portfolio, (4) MFS’ views regarding the outlook for the mutual fund industry and its strategic business plans, (5) descriptions of various functions performed by MFS for the Trust, such as compliance monitoring and portfolio trading practices, and (6) information regarding the overall organization of MFS, including information about MFS’ senior management and other personnel providing investment advisory, administrative and other services to the Portfolio. The comparative performance, fee and expense information prepared and provided by Lipper was not independently verified, and the independent Trustees did not independently verify any information provided to them by MFS.
The Trustees’ conclusion as to the initial approval of the New Agreement was based on comprehensive consideration of all information provided to the Trustees and was not the result of any single factor. Some of the factors that figured particularly in the Trustees’ deliberations are described below for the Portfolio, while individual Trustees may have given different weight to various factors and evaluated the information presented as a whole differently than another individual Trustee. The Trustees recognized that the fee arrangements for the Portfolio could reflect years of review and discussion between the independent Trustees and MFS, that certain aspects of such arrangements may receive greater scrutiny in some years than others, and that
27
Table of Contents
MFS Global Research Portfolio
Board Approval of New Investment Advisory Agreement – continued
the Trustees’ conclusions may be based, in part, on their consideration of these same arrangements during the course of the year and in prior years.
Because the portfolio management team managing the Portfolio’s investments under the then current investment advisory agreement will remain the same under the New Agreement for the Portfolio, the Trustees compared the Portfolio’s total return investment performance to the performance of its Lipper performance universe over various time periods, based on information provided by Lipper. The Trustees placed particular emphasis on the total return performance of the Portfolio’s Initial Class shares in comparison to the performance of funds in its Lipper performance universe over the one-, three- and five-year periods ended December 31, 2010. The Trustees did not rely on performance results for more recent periods.
The Trustees noted the performance of the Portfolio’s Initial Class shares was in the 3rd quintile relative to the other funds in the Lipper performance universe for the one-year period (the 1st quintile being the best performers and the 5th quintile being the worst performers). The total return performance of the Portfolio was in the 2nd quintile for the three-year period and the 3rd quintile for the five-year period ended December 31, 2010, relative to the Lipper performance universe. Based on the nature and quality of services provided by MFS, the Board of Trustees concluded that the Portfolio’s performance was satisfactory.
In the course of their deliberations, the Trustees took into account information provided by MFS during contract review meetings, as well as during investment review meetings conducted with portfolio management personnel during the course of the year. For Portfolios whose performance lagged their peer groups, they discussed the factors that contributed thereto and MFS’ efforts to improve such Portfolios’ performance. After reviewing this information, the Trustees concluded, within the context of their overall conclusions regarding the New Agreement, that they were satisfied with MFS’ responses and efforts relating to investment performance.
In assessing the reasonableness of the Portfolio’s advisory fee, the Trustees considered, among other information, the Portfolio’s advisory fee and the total expense ratio of the Portfolio’s Initial Class shares as a percentage of average daily net assets, compared to the advisory fee and total expense ratios of its peer group of funds based on information provided by Lipper. The Trustees also considered the advisory fees charged by MFS to institutional accounts. In comparing these fees, the Trustees considered the generally broader scope of services provided by MFS to the Trust than those provided to institutional accounts. The Trustees also considered the higher demands placed on MFS’ investment personnel and trading infrastructure as a result of the daily cash in-flows and out-flows of the Portfolio, and the impact on MFS and related expenses due to the more extensive regulatory regime to which the Portfolio is subject, compared to institutional accounts.
In considering the fees, the Trustees noted from the Lipper data that the Portfolio’s effective advisory fee rate was approximately at the median and the total expense ratio was below the median of such fees and expenses of funds in the Lipper expense group. The Trustees further concluded that the existing breakpoint was sufficient to allow the Portfolio to benefit from economies of scale as its assets grow. The Trustees concluded that the fees were reasonable in light of the nature and quality of services provided.
The Trustees also considered whether the Portfolio is likely to benefit from any economies of scale due to future asset growth. In this regard, the Trustees reviewed the adequacy of breakpoints and discussed with MFS any adjustments necessary for the shareholders’ benefit.
The Trustees also considered information prepared by MFS relating to its costs and profits with respect to the Portfolio and other investment companies and accounts advised by MFS, as well as MFS’ methodologies used to determine and allocate its costs to the Portfolio and other accounts and products for purposes of estimating profitability.
The Trustees noted that there would be no increase to the net advisory fee arrangement for the Portfolio under the New Agreement when compared to the Portfolio’s then current investment advisory agreement. After reviewing these and other factors described below, the Trustees concluded that the advisory fees charged to the Portfolio under the New Agreement represent reasonable compensation in light of the nature and quality of the services being provided by MFS.
In addition, the Trustees considered MFS’ resources and related efforts to continue to retain, attract and motivate capable personnel to serve the Portfolio. The Trustees also considered the financial resources of MFS and its parent, Sun Life Financial Inc. The Trustees further considered any advantages and possible disadvantages of having an adviser which also serves other investment companies as well as institutional accounts.
The Trustees also considered the nature, quality, cost, and extent of administrative, transfer agency, and distribution services provided to the Trust by MFS and its affiliates under agreements and plans other than the New Agreement, including the 12b-1 fees the Portfolio pays to MFS Fund Distributors, Inc., an affiliate of MFS. The Trustees also considered the nature, extent and quality of certain other services MFS performs or arranges on the Portfolio’s behalf, which may include securities lending programs, directed expense payment programs, class action recovery programs, and MFS’ interaction with third-party service
28
Table of Contents
MFS Global Research Portfolio
Board Approval of New Investment Advisory Agreement – continued
providers, principally custodians and sub-custodians. The Trustees concluded that the various non-advisory services provided by MFS and its affiliates on behalf of the Portfolio were satisfactory. The Trustees also considered the benefits to MFS from the use of the Portfolio’s portfolio brokerage commissions to pay for investment research and various other factors. Additionally, the Trustees considered so-called “fall-out benefits” to MFS such as reputational value derived from serving as investment manager to the Trust, and determined that any such benefits derived by MFS were reasonable and fair.
Based on their evaluation of factors that they deemed to be material, including those factors described above, the Board of Trustees, including a majority of the independent Trustees, concluded that the New Agreement should be approved for an initial two-year period, commencing upon its effective date, as set forth in the New Agreement.
BOARD APPROVAL OF CONTINUATION OF PRIOR INVESTMENT ADVISORY AGREEMENT
The Investment Company Act of 1940 requires that both the full Board of Trustees and a majority of the non-interested (“independent”) Trustees, voting separately, annually approve the continuation of the investment advisory agreement between MFS Variable Insurance Trust II (the “Trust”) and Massachusetts Financial Services Company (“MFS”) on behalf of the Fund. The Trustees consider matters bearing on the Fund and the advisory arrangements at their meetings throughout the year, including a review of performance data at each regular meeting. In addition, the independent Trustees met in person in May and again in July 2011 (“contract review meetings”) for the specific purpose of considering whether to approve the continuation of the investment advisory agreement for the Fund. The independent Trustees were assisted in their evaluation of the investment advisory agreement by independent legal counsel, from whom they received separate legal advice and with whom they met separately from MFS management during various contract review meetings. The independent Trustees were also assisted in this process by the Fund’s Independent Chief Compliance Officer, a full-time senior officer appointed by and reporting to the independent Trustees.
In connection with their deliberations, the Trustees, including the independent Trustees, considered such information and factors as they believed, in light of the legal advice furnished to them and their own business judgment, to be relevant. The investment advisory agreement was considered separately for the Fund, although the Trustees also took into account the common interests of all Funds in the Trust in their review. As described below, the Trustees considered the nature, quality, and extent of the various investment advisory, administrative, and shareholder services performed by MFS under the existing investment advisory agreement and other arrangements with the Trust.
In connection with their contract review meetings, the Trustees received and relied upon materials which included, among other items: (i) information provided by Lipper Inc. (“Lipper”) on the investment performance of the Fund for various time periods ended December 31, 2010, compared to the investment performance of a group of funds with substantially similar investment classifications/objectives (the “Lipper performance universe”), (ii) information provided by Lipper on the Fund’s advisory fees and other expenses compared to the advisory fees and other expenses of comparable funds identified by Lipper (the “Lipper expense group”), (iii) information provided by MFS on the advisory fees of comparable portfolios of its other clients, including institutional separate account and other clients, (iv) information as to whether, and to what extent applicable, expense waivers, reimbursements or fee “breakpoints” are observed for the Fund, (v) information regarding MFS’ financial results and financial condition, including MFS’ and certain of its affiliates’ estimated profitability from services performed for the Fund and other investment companies that the Board oversees as a whole, and for MFS’ institutional business, (vi) MFS’ views regarding the outlook for the mutual fund industry and its strategic business plans, (vii) descriptions of various functions performed by MFS for the Trust, such as compliance monitoring and portfolio trading practices, and (viii) information regarding the overall organization of MFS, including information about MFS’ senior management and other personnel providing investment advisory, administrative and other services to the Fund. The comparative performance, fee and expense information prepared and provided by Lipper was not independently verified, and the independent Trustees did not independently verify any information provided to them by MFS.
The Trustees’ conclusion as to the continuation of the investment advisory agreement was based on comprehensive consideration of all information provided to the Trustees and was not the result of any single factor. Some of the factors that figured particularly in the Trustees’ deliberations are described below for the Fund, while individual Trustees may have given different weight to various factors and evaluated the information presented as a whole differently than another individual Trustee. The Trustees recognized that the fee arrangements for the Fund reflect years of review and discussion between the independent Trustees and MFS, that certain aspects of such arrangements may receive greater scrutiny in some years than others, and that the Trustees’ conclusions may be based, in part, on their consideration of these same arrangements during the course of the year and in prior years.
29
Table of Contents
MFS Global Research Portfolio
Board Approval of Continuation Of Prior Investment Advisory Agreement – continued
Based on information provided by Lipper, the Trustees compared the Fund’s total return investment performance to the performance of the Lipper performance universe over various time periods. The Trustees placed particular emphasis on the total return performance of the Fund’s Initial Class shares in comparison to the performance of funds in its Lipper performance universe over the one-, three- and five-year periods ended December 31, 2010. The Trustees did not rely on performance results for more recent periods, including those shown elsewhere in this report.
The Trustees noted the performance of the Fund’s Initial Class shares was in the 3rd quintile relative to the other funds in the Lipper performance universe for the one-year period (the 1st quintile being the best performers and the 5th quintile being the worst performers). The total return performance of the Fund was in the 2nd quintile for the three-year period and the 3rd quintile for the five-year period ended December 31, 2010, relative to the Lipper performance universe. Based on the nature and quality of services provided by MFS, the Board of Trustees concluded that the Fund’s performance was satisfactory.
In the course of their deliberations, the Trustees took into account information provided by MFS during contract review meetings, as well as during investment review meetings conducted with portfolio management personnel during the course of the year.
In assessing the reasonableness of the Fund’s advisory fee, the Trustees considered, among other information, the Fund’s advisory fee and the total expense ratio of the Fund’s Initial Class shares as a percentage of average daily net assets, compared to the advisory fee and total expense ratios of its peer group of funds based on information provided by Lipper. The Trustees also considered the advisory fees charged by MFS to institutional accounts. In comparing these fees, the Trustees considered the generally broader scope of services provided by MFS to the Trust than those provided to institutional accounts. The Trustees also considered the higher demands placed on MFS’ investment personnel and trading infrastructure as a result of the daily cash in-flows and out-flows of the Fund, and the impact on MFS and related expenses due to the more extensive regulatory regime to which the Fund is subject, compared to institutional accounts.
In considering the fees, the Trustees noted from the Lipper data (which takes into account any reductions or expense limitations) that the Fund’s effective advisory fee rate was approximately at the median and the total expense ratio was below the median of such fees and expenses of funds in the Lipper expense group. The Trustees further concluded that the existing breakpoint was sufficient to allow the Fund to benefit from economies of scale as its assets grow. The Trustees concluded that the fees were reasonable in light of the nature and quality of services provided.
The Trustees also considered information prepared by MFS relating to its costs and profits with respect to the Fund and other investment companies and accounts advised by MFS, as well as MFS’ methodologies used to determine and allocate its costs to the Fund and other accounts and products for purposes of estimating profitability.
After reviewing these and other factors described below, the Trustees concluded that the advisory fees charged to the Fund represent reasonable compensation in light of the nature and quality of the services being provided by MFS.
In addition, the Trustees considered MFS’ resources and related efforts to continue to retain, attract and motivate capable personnel to serve the Fund. The Trustees also considered the financial resources of MFS and its parent, Sun Life Financial Inc. The Trustees further considered any advantages and possible disadvantages of having an adviser which also serves other investment companies as well as institutional accounts.
The Trustees also considered the nature, quality, cost, and extent of administrative, transfer agency, and distribution services provided to the Fund by MFS and its affiliates under agreements and plans other than the investment advisory agreement, including the 12b-1 fees the Fund pays to MFS Fund Distributors, Inc., an affiliate of MFS. The Trustees also considered the nature, extent and quality of certain other services MFS performs or arranges on the Fund’s behalf, which may include securities lending programs, directed expense payment programs, class action recovery programs, and MFS’ interaction with third-party service providers, principally custodians and sub-custodians. The Trustees concluded that the various non-advisory services provided by MFS and its affiliates on behalf of the Fund were satisfactory. The Trustees also considered the benefits to MFS from the use of the Fund’s portfolio brokerage commissions, if applicable, to pay for investment research and various other factors. Additionally, the Trustees considered so-called “fall-out benefits” to MFS such as reputational value derived from serving as investment manager to the Trust, and determined that any such benefits derived by MFS were reasonable and fair.
Based on their evaluation of factors that they deemed to be material, including those factors described above, the Board of Trustees, including a majority of the independent Trustees, concluded that the investment advisory agreement should be continued for an additional one-year period, commencing September 1, 2011.
A discussion regarding the Board’s most recent review and renewal of the fund’s Investment Advisory Agreement with MFS is available by clicking on the fund’s name under “Variable Insurance Portfolios — VIT II” in the “Products and Performance” section of the MFS Web site (mfs.com).
30
Table of Contents
MFS Global Research Portfolio
PROXY VOTING POLICIES AND INFORMATION
A general description of the MFS funds’ proxy voting policies and procedures is available without charge, upon request, by calling
1-800-225-2606, by visiting the Proxy Voting section of mfs.com or by visiting the SEC’s Web site at http://www.sec.gov.
Information regarding how the fund voted proxies relating to portfolio securities during the most recent twelve-month period ended June 30 is available without charge by visiting the Proxy Voting section of mfs.com or by visiting the SEC’s Web site at http://www.sec.gov.
QUARTERLY PORTFOLIO DISCLOSURE
The fund will file a complete schedule of portfolio holdings with the Securities and Exchange Commission (the Commission) for the first and third quarters of each fiscal year on Form N-Q. The fund’s Form N-Q is available on the EDGAR database on the Commission’s Internet Web site at http://www.sec.gov and may be reviewed and copied at the:
Public Reference Room
Securities and Exchange Commission
100 F Street, NE, Room 1580
Washington, D.C. 20549
Information on the operation of the Public Reference Room may be obtained by calling the Commission at 1-800-SEC-0330. Copies of the fund’s Form N-Q also may be obtained, upon payment of a duplicating fee, by electronic request at the following e-mail address: publicinfo@sec.gov or by writing the Public Reference Section at the above address.
From time to time, MFS may post important information about the fund or the MFS funds on the MFS web site (mfs.com). This information is available by visiting the “News & Commentary” section of mfs.com or by clicking on the fund’s name under “Variable Insurance Portfolios — VIT II” in the “Products and Performance” section of mfs.com.
FEDERAL TAX INFORMATION (unaudited)
The following information is provided pursuant to provisions of the Internal Revenue Code.
For corporate shareholders, 77.62% of the ordinary income dividends paid during the fiscal year qualify for the corporate dividends received deduction.
31
Table of Contents
rev. 3/11

| Why? | Financial companies choose how they share your personal information. Federal law gives consumers the right to limit some but not all sharing. Federal law also requires us to tell you how we collect, share, and protect your personal information. Please read this notice carefully to understand what we do. |
| What? | The types of personal information we collect and share depend on the product or service you have with us. This information can include:
• Social Security number and account balances • Account transactions and transaction history • Checking account information and wire transfer instructions
When you are no longer our customer, we continue to share your information as described in this notice. |
| How? | All financial companies need to share customers’ personal information to run their everyday business. In the section below, we list the reasons financial companies can share their customers’ personal information; the reasons MFS chooses to share; and whether you can limit this sharing. |
| Reasons we can share your personal information | Does MFS share? | Can you limit this sharing? | ||
For our everyday business purposes – such as to process your transactions, maintain your account(s), respond to court orders and legal investigations, or report to credit bureaus | Yes | No | ||
For our marketing purposes – to offer our products and services to you | No | We don’t share | ||
| For joint marketing with other financial companies | No | We don’t share | ||
For our affiliates’ everyday business purposes – information about your transactions and experiences | No | We don’t share | ||
For our affiliates’ everyday business purposes – information about your creditworthiness | No | We don’t share | ||
| For nonaffiliates to market to you | No | We don’t share |
| Questions? | Call 800-225-2606 or go to mfs.com. |
32
Table of Contents
| Page 2 |
| Who we are | ||
| Who is providing this notice? | MFS Funds, MFS Investment Management, MFS Institutional Advisors, Inc., MFS Fund Distributors, Inc., MFS Heritage Trust Company, and MFS Service Center, Inc. | |
| What we do | ||
| How does MFS protect my personal information? | To protect your personal information from unauthorized access and use, we use security measures that comply with federal law. These measures include procedural, electronic, and physical safeguards for the protection of the personal information we collect about you. | |
| How does MFS collect my personal information? | We collect your personal information, for example, when you
• open an account or provide account information • direct us to buy securities or direct us to sell your securities • make a wire transfer
We also collect your personal information from others, such as credit bureaus, affiliates and other companies. | |
| Why can’t I limit all sharing? | Federal law gives you the right to limit only
• sharing for affiliates’ everyday business purposes – information about your creditworthiness • affiliates from using your information to market to you • sharing for nonaffiliates to market to you
State laws and individual companies may give you additional rights to limit sharing. | |
| Definitions | ||
| Affiliates | Companies related by common ownership or control. They can be financial and nonfinancial companies.
•MFS does not share personal information with affiliates, except for everyday business purposes as described on page one of this notice. | |
| Nonaffiliates | Companies not related by common ownership or control. They can be financial and nonfinancial companies.
•MFS does not share with nonaffiliates so they can market to you. | |
| Joint Marketing | A formal agreement between nonaffiliated financial companies that together market financial products or services to you.
•MFS doesn’t jointly market. | |
| Other important information | ||
| If you own an MFS product or receive an MFS service in the name of a third party such as a bank or broker-dealer, their privacy policy may apply to you instead of ours. | ||
33
Table of Contents

Table of Contents

MFS® International Value Portfolio
MFS® Variable Insurance Trust II

ANNUAL REPORT
December 31, 2011
FCG-ANN
Table of Contents
MFS® INTERNATIONAL VALUE PORTFOLIO
The report is prepared for the general information of contract owners.
It is authorized for distribution to prospective investors only when preceded or accompanied by a current prospectus.
NOT FDIC INSURED Ÿ MAY LOSE VALUE Ÿ NO BANK OR CREDIT UNION GUARANTEE Ÿ NOT A DEPOSIT Ÿ NOT INSURED BY ANY FEDERAL GOVERNMENT AGENCY OR NCUA/NCUSIF
Table of Contents
MFS International Value Portfolio
LETTER FROM THE CHAIRMAN AND CEO

Dear Contract Owners:
We are indeed living through some volatile times. Economic uncertainty is everywhere, as it seems no place in the world has been unmoved by crisis. We have seen a devastating earthquake and tsunami that have led to disruptions in the Japanese markets
and supply chains. Protests have changed the face of the Middle East and left in their wake lingering tensions and resultant higher oil prices. We have seen debt limits tested in Europe and the United States and policymakers grappling to craft often unpopular monetary and fiscal responses at a time when consumers and businesses struggle with what appears to be a slowing global economy. On top of all of that, we have seen long-term U.S. debt lose its Standard & Poor’s AAA rating and the long-term debt ratings of 15 eurozone nations put on negative watch.
When markets become volatile, managing risk becomes a top priority for investors and their advisors. At MFS® risk management is foremost in our minds in all market climates. Our analysts and portfolio managers keep risks firmly in mind when evaluating securities. Additionally, we have a team of quantitative analysts that measures and assesses the risk profiles of our portfolios and securities on an ongoing basis. The chief investment risk officer, who oversees the team, reports directly to the firm’s president and chief investment officer so the risk associated with each portfolio can be assessed objectively and independently of the portfolio management team.
As always, we continue to be mindful of the many economic challenges faced at the local, national, and international levels. It is in times such as these that we want to remind investors of the merits of maintaining a long-term view, adhering to basic investing principles such as asset allocation and diversification, and working closely with their advisors to research and identify appropriate investment opportunities.
Respectfully,

Robert J. Manning
Chairman and Chief Executive Officer
MFS Investment Management®
February 15, 2012
The opinions expressed in this letter are subject to change, may not be relied upon for investment advice, and no forecasts can be guaranteed.
1
Table of Contents
MFS International Value Portfolio
Portfolio structure
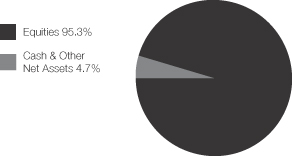
| Top ten holdings | ||||
| Royal Dutch Shell PLC, “A” | 3.1% | |||
| GlaxoSmithKline PLC | 3.1% | |||
| Nestle S.A. | 2.9% | |||
| Vodafone Group PLC | 2.9% | |||
| KDDI Corp. | 2.9% | |||
| British American Tobacco PLC | 2.7% | |||
| Kao Corp. | 2.7% | |||
| Heineken N.V. | 2.7% | |||
| BP PLC | 2.7% | |||
| Roche Holding AG | 2.5% |
| Equity sectors | ||||
| Consumer Staples | 19.4% | |||
| Health Care | 15.2% | |||
| Financial Services | 14.6% | |||
| Utilities & Communications | 8.6% | |||
| Technology | 7.6% | |||
| Energy | 7.6% | |||
| Special Products & Services | 5.6% | |||
| Industrial Goods & Services | 4.7% | |||
| Basic Materials | 3.4% | |||
| Retailing | 2.9% | |||
| Leisure | 2.6% | |||
| Autos & Housing | 1.6% | |||
| Transportation | 1.5% |
| Issuer country weightings (x) | ||||
| United Kingdom | 27.1% | |||
| Japan | 26.6% | |||
| Switzerland | 12.0% | |||
| Germany | 7.2% | |||
| France | 7.1% | |||
| Netherlands | 5.0% | |||
| United States | 4.7% | |||
| Taiwan | 1.7% | |||
| South Korea | 1.3% | |||
| Other Countries | 7.3% |
| Currency exposure weightings (i)(y) | ||||
| British Pound Sterling | 27.1% | |||
| Japanese Yen | 26.2% | |||
| Euro | 21.6% | |||
| Swiss Franc | 12.0% | |||
| United States Dollar | 5.1% | |||
| Taiwan Dollar | 1.7% | |||
| South Korean Won | 1.3% | |||
| Swedish Krona | 1.1% | |||
| Australian Dollar | 1.0% | |||
| Other Currencies | 2.9% |
| (i) | For purposes of this presentation, the components include the market value of securities, less any securities sold short, and reflect the impact of the equivalent exposure of derivative positions, if applicable. These amounts may be negative from time to time. Equivalent exposure is a calculated amount that translates the derivative position into a reasonable approximation of the amount of the underlying asset that the portfolio would have to hold at a given point in time to have the same price sensitivity that results from the portfolio’s ownership of the derivative contract. When dealing with derivatives, equivalent exposure is a more representative measure of the potential impact of a position on portfolio performance than market value. |
| (x) | Represents the portfolio’s exposure to issuer countries as a percentage of a portfolio’s total net assets. |
| (y) | Represents the portfolio’s exposure to a particular currency as a percentage of a portfolio’s total net assets. |
Percentages are based on net assets as of 12/31/11.
The portfolio is actively managed and current holdings may be different.
2
Table of Contents
MFS International Value Portfolio
Summary of Results
For the twelve months ended December 31, 2011, Initial Class shares of the MFS International Value Portfolio (the “fund”) provided a total return of –1.52%, while Service Class shares of the fund provided a total return of –1.78%. These compare with a return of –11.65% for the fund’s benchmark, the Morgan Stanley Capital International (MSCI) EAFE (Europe, Australasia, Far East) Value Index.
Market Environment
Early in the period, the U.S. Federal Reserve (the “Fed”) responded to weak economic growth by loosening monetary policy further. More easing by the Fed improved market sentiment and drove risk-asset prices markedly higher. The December 2010 agreement on a surprisingly large (relative to expectations) expansionary U.S. fiscal package also boosted sentiment. During the subsequent several months, the renewed positive market sentiment, coupled with better indications of global macroeconomic activity, pushed many asset valuations to post-crisis highs. At the same time, the yields of the perceived “safest” global sovereign credits rose, indicating a renewed risk-seeking environment.
However, towards the middle of the period, a weakening macroeconomic backdrop and renewed concerns over peripheral euro zone sovereign debt caused a flight-to-quality move that pushed high-quality sovereign bond yields lower. In the U.S., concerns about sovereign debt default and the long-term sustainability of the trend in U.S. fiscal policy resulted in one agency downgrading U.S. credit quality. Amidst this turmoil, global equity markets declined sharply. As a result of these developments, global consumer and producer sentiment indicators fell precipitously and highly-rated sovereign bond yields hit multi-decade lows. Towards the end of the reporting period, uncertainty in financial markets spiked higher as markets more seriously contemplated the possible failure of the euro zone.
Contributors to Performance
An overweight position in the consumer staples sector contributed to performance relative to the MSCI EAFE Value Index. Holdings of tobacco distributor British American Tobacco (b) (United Kingdom) and Japanese tobacco company Japan Tobacco (b) aided relative results as both stocks outperformed the benchmark over the reporting period. Shares of British American Tobacco rose throughout the period as the company benefited from increased sales volume due to their new Dunhill product launch and a reversal of a tax increase on cigarettes by the Turkish government.
A combination of stock selection and an underweight position in the financial services sector also aided relative performance. No individual securities within this sector were among the fund’s top relative contributors for the reporting period.
A combination of stock selection and an overweight position in the health care sector supported relative results. Holdings of Swiss pharmaceutical and diagnostic company Roche Holding (b) and pharmaceutical firm GlaxoSmithKline (United Kingdom) were top relative contributors within this sector. Shares of Roche Holding rose primarily due to positive results from the trial of their new cancer treatment drug Pertuzumab and a limited number of patents expiring in the upcoming year.
Stock selection in the utilities & communications and special products & services sectors also contributed to relative performance. Within utilities & communications, the fund’s overweight position in telecommunications company KDDI (Japan), and avoiding shares of poor-performing electric power company Tokyo Electric Power (Japan), helped relative returns. In the special products & services sector, holdings of distribution and outsourcing service provider Bunzl (b) (United Kingdom) also supported positive results.
Elsewhere, the fund’s holdings of convenience store chain Lawson (b) (Japan) and parcel delivery Yamato Holdings (Japan) were among the fund’s top relative contributors. Shares of Lawson rose due to robust revenue growth late in the reporting period driven by price increases on tobacco products in Japan. Management also raised full year dividend estimates by nearly 3% which further supported the stock’s performance.
The fund’s cash position was also a contributor to relative performance. The fund holds cash to buy new holdings and to provide liquidity. In a period when equity markets declined, as measured by the fund’s benchmark, holding cash helped performance versus the benchmark, which has no cash position.
Detractors from Performance
An underweight allocation to the energy sector held back relative performance. The timing of the fund’s ownership in shares of global energy and petrochemicals company Royal Dutch Shell (United Kingdom) detracted from relative results. Not holding integrated oil company Total (France) also dampened relative returns as the stock outperformed the benchmark during the reporting period. Shares of Total appreciated late in the period as the company reported profits that beat general consensus estimates, driven by better-than-expected downstream performance, higher prices, and improved refining results.
3
Table of Contents
MFS International Value Portfolio
Management Review – continued
Other individual stocks that hindered relative results included information technology products and electronics maker Acer (h) (Taiwan), investment banking firm Daiwa Securities Group (Japan), and Hong Kong-headquartered retailer Esprit Holdings. Not holding Swiss pharmaceutical company Novartis, pharmaceutical firm AstraZeneca (United Kingdom), and Australian financial services firm Commonwealth Bank of Australia also weakened relative performance as all three stocks outperformed the benchmark over the reporting period. Holdings of copy machine manufacturer Konica Minolta Holdings (Japan) and financial services firm HSBC Holdings (United Kingdom) were also among the top relative detractors for the period.
Respectfully,
| Benjamin Stone | Barnaby Wiener | |
| Portfolio Manager | Portfolio Manager |
| (b) | Security is not a benchmark constituent. |
| (h) | Security was not held in the fund at period end. |
The views expressed in this report are those of the portfolio managers only through the end of the period of the report as stated on the cover and do not necessarily reflect the views of MFS or any other person in the MFS organization. These views are subject to change at any time based on market or other conditions, and MFS disclaims any responsibility to update such views. These views may not be relied upon as investment advice or an indication of trading intent on behalf of any MFS portfolio. References to specific securities are not recommendations of such securities, and may not be representative of any MFS portfolio’s current or future investments.
4
Table of Contents
MFS International Value Portfolio
PERFORMANCE SUMMARY THROUGH 12/31/11
The following chart illustrates the historical performance of the fund in comparison to its benchmark(s). Benchmarks are unmanaged and may not be invested in directly. Benchmark returns do not reflect any fees or expenses. The performance of other share classes will be greater than or less than that of the class depicted below. (See Notes to Performance Summary.)
Performance data shown represents past performance and is no guarantee of future results. Investment return and principal value fluctuate so your units, when sold, may be worth more or less than the original cost; current performance may be lower or higher than quoted. The performance shown does not reflect the deduction of taxes, if any, that a contract holder would pay on fund distributions or the redemption of contract units. The returns for the fund shown also do not reflect the deduction of expenses associated with variable products, such as mortality and expense risk charges, separate account charges, and sales charges imposed by the insurance company separate accounts. Such expenses would reduce the overall returns shown.
Growth of a Hypothetical $10,000 Investment
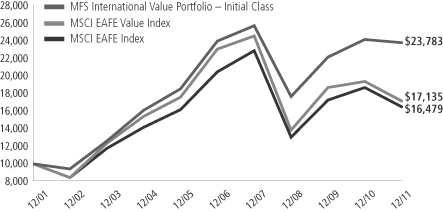
Total Returns through 12/31/11
Average annual total returns
| Share class | Class inception date | 1-yr | 5-yr | 10-yr | ||||||||
| Initial Class | 10/02/95 | (1.52)% | (0.16)% | 9.05% | ||||||||
| Service Class | 8/24/01 | (1.78)% | (0.42)% | 8.79% | ||||||||
| Comparative benchmarks | ||||||||||||
| MSCI EAFE Value Index (f) | (11.65)% | (5.77)% | 5.53% | |||||||||
| MSCI EAFE Index (f) | (11.73)% | (4.26)% | 5.12% | |||||||||
| (f) | Source: FactSet Research Systems Inc. |
Benchmark Definitions
MSCI EAFE (Europe, Australasia, Far East) Index – a market capitalization-weighted index that is designed to measure equity market performance in the developed markets, excluding the U.S. and Canada.
MSCI EAFE (Europe, Australasia, Far East) Value Index – a market capitalization-weighted index that is designed to measure equity market performance for value securities in the developed markets, excluding the U.S. and Canada.
It is not possible to invest directly in an index.
Notes to Performance Summary
Average annual total return represents the average annual change in value for each share class for the periods presented.
Performance results reflect any applicable expense subsidies and waivers in effect during the periods shown. Without such subsidies and waivers the fund’s performance results would be less favorable. Please see the prospectus and financial statements for complete details. All results are historical and assume the reinvestment of any dividends and capital gains distributions.
Performance results do not include adjustments made for financial reporting purposes in accordance with U.S. generally accepted accounting principles and may differ from amounts reported in the financial highlights.
From time to time the fund may receive proceeds from litigation settlements, without which performance would be lower.
5
Table of Contents
MFS International Value Portfolio
Fund Expenses Borne by the Contract Holders During the Period,
July 1, 2011 through December 31, 2011
As a contract holder of the fund, you incur ongoing costs, including management fees; distribution and/or service (12b-1) fees; and other fund expenses. This example is intended to help you understand your ongoing costs (in dollars) of investing in the fund and to compare these costs with the ongoing costs of investing in other mutual funds.
The example is based on an investment of $1,000 invested at the beginning of the period and held for the entire period July 1, 2011 through December 31, 2011.
Actual Expenses
The first line for each share class in the following table provides information about actual account values and actual expenses. You may use the information in this line, together with the amount you invested, to estimate the expenses that you paid over the period. Simply divide your account value by $1,000 (for example, an $8,600 account value divided by $1,000 = 8.6), then multiply the result by the number in the first line under the heading entitled “Expenses Paid During Period” to estimate the expenses you paid on your account during this period.
Hypothetical Example for Comparison Purposes
The second line for each share class in the following table provides information about hypothetical account values and hypothetical expenses based on the fund’s actual expense ratio and an assumed rate of return of 5% per year before expenses, which is not the fund’s actual return. The hypothetical account values and expenses may not be used to estimate the actual ending account balance or expenses you paid for the period. You may use this information to compare the ongoing costs of investing in the fund and other funds. To do so, compare this 5% hypothetical example with the 5% hypothetical examples that appear in the shareholder reports of the other funds.
Please note that the expenses shown in the table are meant to highlight the fund’s ongoing costs only and do not take into account the fees and expenses imposed under the variable contracts through which your investment in the fund is made. Therefore, the second line for each share class in the table is useful in comparing ongoing costs associated with an investment in vehicles (such as the fund) which fund benefits under variable annuity and variable life insurance contracts and to qualified pension and retirement plans only, and will not help you determine the relative total costs of investing in the fund through variable annuity and variable life insurance contracts. If the fees and expenses imposed under the variable contracts were included, your costs would have been higher.
| Share Class | Annualized Expense Ratio | Beginning Account Value 7/01/11 | Ending Account Value | Expenses Paid During Period (p) 7/01/11-12/31/11 | ||||||||||||||
| Initial Class | Actual | 1.01% | $1,000.00 | $922.10 | $4.89 | |||||||||||||
| Hypothetical (h) | 1.01% | $1,000.00 | $1,020.11 | $5.14 | ||||||||||||||
| Service Class | Actual | 1.26% | $1,000.00 | $920.21 | $6.10 | |||||||||||||
| Hypothetical (h) | 1.26% | $1,000.00 | $1,018.85 | $6.41 | ||||||||||||||
| (h) | 5% class return per year before expenses. |
| (p) | Expenses paid is equal to each class’ annualized expense ratio, as shown above, multiplied by the average account value over the period, multiplied by the number of days in the period, divided by the number of days in the year. |
6
Table of Contents
MFS International Value Portfolio
PORTFOLIO OF INVESTMENTS – 12/31/11
The Portfolio of Investments is a complete list of all securities owned by your fund. It is categorized by broad-based asset classes.
| Issuer | Shares/Par | Value ($) | ||||||
| COMMON STOCKS – 95.3% | ||||||||
| Aerospace – 1.0% | ||||||||
| Cobham PLC | 1,553,858 | $ | 4,408,959 | |||||
|
| |||||||
| Alcoholic Beverages – 2.7% | ||||||||
| Heineken N.V. | 260,955 | $ | 12,047,100 | |||||
|
| |||||||
| Automotive – 0.8% | ||||||||
| USS Co. Ltd. | 38,920 | $ | 3,519,335 | |||||
|
| |||||||
| Broadcasting – 1.9% | ||||||||
| Fuji Television Network, Inc. | 2,709 | $ | 4,107,318 | |||||
| Nippon Television Network Corp. | 27,470 | 4,204,191 | ||||||
|
| |||||||
| $ | 8,311,509 | |||||||
|
| |||||||
| Brokerage & Asset Managers – 1.4% | ||||||||
| Computershare Ltd. | 315,587 | $ | 2,585,488 | |||||
| Daiwa Securities Group, Inc. | 1,208,000 | 3,766,662 | ||||||
|
| |||||||
| $ | 6,352,150 | |||||||
|
| |||||||
| Business Services – 5.6% | ||||||||
| Amadeus IT Holding S.A. | 308,627 | $ | 4,985,708 | |||||
| Brenntag AG | 22,623 | 2,101,638 | ||||||
| Bunzl PLC | 405,403 | 5,547,272 | ||||||
| Compass Group PLC | 758,585 | 7,182,601 | ||||||
| Nomura Research, Inc. | 228,600 | 5,167,780 | ||||||
|
| |||||||
| $ | 24,984,999 | |||||||
|
| |||||||
| Chemicals – 1.2% | ||||||||
| Givaudan S.A. | 5,573 | $ | 5,289,505 | |||||
|
| |||||||
| Computer Software – 0.8% | ||||||||
| OBIC Co. Ltd. | 19,130 | $ | 3,660,971 | |||||
|
| |||||||
| Computer Software – Systems – 1.9% | ||||||||
| Asustek Computer, Inc. | 214,640 | $ | 1,527,624 | |||||
| Konica Minolta Holdings, Inc. | 428,500 | 3,195,518 | ||||||
| Nintendo Co. Ltd. | 14,500 | 1,996,882 | ||||||
| Venture Corp. Ltd. | 354,000 | 1,692,148 | ||||||
|
| |||||||
| $ | 8,412,172 | |||||||
|
| |||||||
| Construction – 0.8% | ||||||||
| Geberit AG | 18,741 | $ | 3,611,329 | |||||
|
| |||||||
| Consumer Products – 6.1% | ||||||||
| Henkel KGaA, IPS | 118,194 | $ | 6,821,050 | |||||
| Kao Corp. | 441,900 | 12,073,739 | ||||||
| KOSE Corp. | 97,800 | 2,451,035 | ||||||
| Reckitt Benckiser Group PLC | 115,548 | 5,694,013 | ||||||
|
| |||||||
| $ | 27,039,837 | |||||||
|
| |||||||
| Containers – 0.4% | ||||||||
| Brambles Ltd. | 253,454 | $ | 1,856,107 | |||||
|
| |||||||
| Electrical Equipment – 1.5% | ||||||||
| Legrand S.A. | 144,782 | $ | 4,638,159 | |||||
| Spectris PLC | 103,160 | 2,057,527 | ||||||
|
| |||||||
| $ | 6,695,686 | |||||||
|
| |||||||
| Issuer | Shares/Par | Value ($) | ||||||
| COMMON STOCKS – continued | ||||||||
| Electronics – 3.5% | ||||||||
| ASM International N.V. | 47,646 | $ | 1,398,447 | |||||
| Halma PLC | 510,641 | 2,611,415 | ||||||
| Samsung Electronics Co. Ltd. | 6,014 | 5,523,274 | ||||||
| Taiwan Semiconductor Manufacturing Co. Ltd., ADR | 463,237 | 5,980,390 | ||||||
|
| |||||||
| $ | 15,513,526 | |||||||
|
| |||||||
| Energy – Independent – 1.8% | ||||||||
| Cairn Energy PLC (a) | 1,010,137 | $ | 4,161,875 | |||||
| INPEX Corp. | 623 | 3,925,620 | ||||||
|
| |||||||
| $ | 8,087,495 | |||||||
|
| |||||||
| Energy – Integrated – 5.8% | ||||||||
| BP PLC | 1,656,569 | $ | 11,813,416 | |||||
| Royal Dutch Shell PLC, “A” | 375,661 | 13,810,291 | ||||||
|
| |||||||
| $ | 25,623,707 | |||||||
|
| |||||||
| Food & Beverages – 5.7% | ||||||||
| Barry Callebaut AG | 1,346 | $ | 1,326,225 | |||||
| Groupe Danone | 170,684 | 10,729,494 | ||||||
| Nestle S.A. | 225,850 | 12,966,684 | ||||||
|
| |||||||
| $ | 25,022,403 | |||||||
|
| |||||||
| Food & Drug Stores – 2.3% | ||||||||
| Lawson, Inc. | 102,200 | $ | 6,380,031 | |||||
| Tesco PLC | 583,895 | 3,658,440 | ||||||
|
| |||||||
| $ | 10,038,471 | |||||||
|
| |||||||
| General Merchandise – 0.2% | ||||||||
| Daiei, Inc. (a) | 228,450 | $ | 825,115 | |||||
|
| |||||||
| Insurance – 5.8% | ||||||||
| Amlin PLC | 280,214 | $ | 1,361,522 | |||||
| Catlin Group Ltd. | 281,944 | 1,739,588 | ||||||
| Euler Hermes | 19,390 | 1,148,120 | ||||||
| Hiscox Ltd. | 535,831 | 3,098,873 | ||||||
| ING Groep N.V. (a) | 499,203 | 3,557,436 | ||||||
| Jardine Lloyd Thompson Group PLC | 214,029 | 2,291,809 | ||||||
| Muenchener Ruckvers AG | 18,871 | 2,314,888 | ||||||
| SNS REAAL Groep N.V. (a) | 221,946 | 481,422 | ||||||
| Swiss Re Ltd. | 98,405 | 5,015,062 | ||||||
| Zurich Financial Services Ltd. | 20,795 | 4,695,830 | ||||||
|
| |||||||
| $ | 25,704,550 | |||||||
|
| |||||||
| Leisure & Toys – 0.4% | ||||||||
| Sankyo Co. Ltd. | 34,500 | $ | 1,745,842 | |||||
|
| |||||||
| Machinery & Tools – 2.2% | ||||||||
| Glory Ltd. | 103,400 | $ | 2,225,982 | |||||
| Neopost S.A. (l) | 67,887 | 4,560,830 | ||||||
| Schindler Holding AG | 24,107 | 2,807,735 | ||||||
|
| |||||||
| $ | 9,594,547 | |||||||
|
| |||||||
| Major Banks – 3.2% | ||||||||
| HSBC Holdings PLC | 956,988 | $ | 7,264,703 | |||||
7
Table of Contents
MFS International Value Portfolio
Portfolio of Investments – continued
| Issuer | Shares/Par | Value ($) | ||||||
| COMMON STOCKS – continued | ||||||||
| Major Banks – continued | ||||||||
| Julius Baer Group Ltd. | 52,745 | $ | 2,051,358 | |||||
| Sumitomo Mitsui Financial Group, Inc. | 144,600 | 4,027,834 | ||||||
| UniCredit S.p.A. | 104,625 | 862,583 | ||||||
|
| |||||||
| $ | 14,206,478 | |||||||
|
| |||||||
| Medical & Health Technology & Services – 2.0% | ||||||||
| Kobayashi Pharmaceutical Co. Ltd. | 78,500 | $ | 4,130,505 | |||||
| Miraca Holdings, Inc. | 80,600 | 3,209,549 | ||||||
| Rhoen-Klinikum AG | 84,308 | 1,606,183 | ||||||
|
| |||||||
| $ | 8,946,237 | |||||||
|
| |||||||
| Medical Equipment – 2.2% | ||||||||
| Nihon Kohden Corp. | 78,800 | $ | 1,944,150 | |||||
| Smith & Nephew PLC | 360,762 | 3,495,749 | ||||||
| Synthes, Inc. (n) | 26,803 | 4,486,563 | ||||||
|
| |||||||
| $ | 9,926,462 | |||||||
|
| |||||||
| Network & Telecom – 1.4% | ||||||||
| Ericsson, Inc., “B” | 486,841 | $ | 4,945,264 | |||||
| Nokia Oyj | 268,309 | 1,296,545 | ||||||
|
| |||||||
| $ | 6,241,809 | |||||||
|
| |||||||
| Other Banks & Diversified Financials – 2.3% | ||||||||
| Anglo Irish Bank Corp. PLC (a) | 249,800 | $ | 0 | |||||
| Chiba Bank Ltd. | 235,000 | 1,514,356 | ||||||
| DnB NOR A.S.A. | 293,641 | 2,874,622 | ||||||
| Hachijuni Bank Ltd. | 242,000 | 1,380,252 | ||||||
| Joyo Bank Ltd. | 354,000 | 1,563,726 | ||||||
| Jyske Bank A.S. (a) | 19,476 | 476,632 | ||||||
| Sapporo Hokuyo Holdings, Inc. | 280,900 | 1,007,255 | ||||||
| Sydbank A.S. | 35,344 | 554,471 | ||||||
| Unione di Banche Italiane ScpA | 166,234 | 677,334 | ||||||
|
| |||||||
| $ | 10,048,648 | |||||||
|
| |||||||
| Pharmaceuticals – 11.0% | ||||||||
| Bayer AG | 122,276 | $ | 7,817,835 | |||||
| GlaxoSmithKline PLC | 594,925 | 13,565,850 | ||||||
| Hisamitsu Pharmaceutical Co., Inc. | 40,200 | 1,702,637 | ||||||
| Roche Holding AG | 65,122 | 11,013,275 | ||||||
| Sanofi | 141,873 | 10,380,989 | ||||||
| Santen Pharmaceutical Co. Ltd. | 95,800 | 3,945,511 | ||||||
|
| |||||||
| $ | 48,426,097 | |||||||
|
| |||||||
| Printing & Publishing – 0.3% | ||||||||
| United Business Media Ltd. | 157,455 | $ | 1,163,065 | |||||
|
| |||||||
| Real Estate – 1.9% | ||||||||
| Deutsche Wohnen AG | 361,505 | $ | 4,802,768 | |||||
| GSW Immobilien AG (a) | 120,238 | 3,480,355 | ||||||
|
| |||||||
| $ | 8,283,123 | |||||||
|
| |||||||
| Specialty Chemicals – 1.8% | ||||||||
| Shin-Etsu Chemical Co. Ltd. | 99,600 | $ | 4,904,300 | |||||
| Symrise AG | 108,350 | 2,891,585 | ||||||
|
| |||||||
| $ | 7,795,885 | |||||||
|
| |||||||
| Issuer | Shares/Par | Value ($) | ||||||
| COMMON STOCKS – continued | ||||||||
| Specialty Stores – 0.4% | ||||||||
| Esprit Holdings Ltd. | 1,439,972 | $ | 1,857,765 | |||||
|
| |||||||
| Telecommunications – Wireless – 5.8% | ||||||||
| KDDI Corp. | 1,985 | $ | 12,765,688 | |||||
| Vodafone Group PLC | 4,599,040 | 12,777,591 | ||||||
|
| |||||||
| $ | 25,543,279 | |||||||
|
| |||||||
| Telephone Services – 2.8% | ||||||||
| China Unicom Ltd. | 1,166,000 | $ | 2,453,125 | |||||
| Royal KPN N.V. | 386,762 | 4,617,537 | ||||||
| TDC A.S. | 389,716 | 3,118,754 | ||||||
| Telecom Italia S.p.A. | 2,318,967 | 2,069,311 | ||||||
|
| |||||||
| $ | 12,258,727 | |||||||
|
| |||||||
| Tobacco – 4.9% | ||||||||
| British American Tobacco PLC | 255,469 | $ | 12,122,493 | |||||
| Japan Tobacco, Inc. | 2,004 | 9,425,075 | ||||||
|
| |||||||
| $ | 21,547,568 | |||||||
|
| |||||||
| Trucking – 1.5% | ||||||||
| Yamato Holdings Co. Ltd. | 403,400 | $ | 6,797,581 | |||||
|
| |||||||
| Total Common Stocks (Identified Cost, $434,170,861) | $ | 421,388,039 | ||||||
|
| |||||||
| Issuer/Expiration Date/Strike Price | Par Amount of Contracts | |||||||
| CALL OPTIONS PURCHASED – 0.0% | ||||||||
| EUR Currency – January 2012 @ JPY 121 (Premiums Paid, $72,968) | EUR | 2,395,591 | $ | 2 | ||||
|
| |||||||
| PUT OPTIONS PURCHASED – 0.0% | ||||||||
| JPY Currency – January 2012 @ $0.0110 | JPY | 289,346,781 | $ | 0 | ||||
| JPY Currency – August 2012 @ $0.0118 | JPY | 1,342,944,000 | 104,750 | |||||
|
| |||||||
| Total Put Options Purchased (Premiums Paid, $340,926) | $ | 104,750 | ||||||
|
| |||||||
| Issuer | Shares/Par | |||||||
| MONEY MARKET FUNDS – 4.5% | ||||||||
| MFS Institutional Money Market Portfolio, 0.05%, at Cost and Net Asset Value (v) | 19,740,443 | $ | 19,740,443 | |||||
|
| |||||||
| COLLATERAL FOR SECURITIES LOANED – 0.8% | ||||||||
| Navigator Securities Lending Prime Portfolio, 0.27%, at Cost and Net Asset Value (j) | 3,403,200 | $ | 3,403,200 | |||||
|
| |||||||
| Total Investments (Identified Cost, $457,728,398) | $ | 444,636,434 | ||||||
|
| |||||||
| OTHER ASSETS, LESS LIABILITIES – (0.6)% | (2,535,645 | ) | ||||||
|
| |||||||
| Net Assets – 100.0% | $ | 442,100,789 | ||||||
|
| |||||||
8
Table of Contents
MFS International Value Portfolio
Portfolio of Investments – continued
| (a) | Non-income producing security. |
| (j) | The rate quoted is the annualized seven-day yield of the portfolio at period end. |
| (l) | A portion of this security is on loan. |
| (n) | Securities exempt from registration under Rule 144A of the Securities Act of 1933. These securities may be sold in the ordinary course of business in transactions exempt from registration, normally to qualified institutional buyers. At period end, the aggregate value of these securities was $4,486,563, representing 1.0% of net assets. |
| (v) | Underlying affiliated fund that is available only to investment companies managed by MFS. The rate quoted for the MFS Institutional Money Market Portfolio is the annualized seven-day yield of the fund at period end. |
The following abbreviations are used in this report and are defined:
| ADR | American Depository Receipt |
| IPS | International Preference Stock |
| PLC | Public Limited Company |
Abbreviations indicate amounts shown in currencies other than the U.S. dollar. All amounts are stated in U.S. dollars unless otherwise indicated. A list of abbreviations is shown below:
| EUR | Euro |
| JPY | Japanese Yen |
See Notes to Financial Statements
9
Table of Contents
MFS International Value Portfolio
FINANCIAL STATEMENTS | STATEMENT OF ASSETS AND LIABILITIES
This statement represents your fund’s balance sheet, which details the assets and liabilities comprising the total value of the fund.
At 12/31/11 | ||||||||
| Assets | ||||||||
Investments – | ||||||||
Non-affiliated issuers, at value (identified cost, $437,987,955) | $424,895,991 | |||||||
Underlying affiliated funds, at cost and value | 19,740,443 | |||||||
Total investments, at value, including $3,233,926 of securities on loan (identified cost, $457,728,398) | $444,636,434 | |||||||
Foreign currency, at value (identified cost, $192) | 191 | |||||||
Receivables for | ||||||||
Fund shares sold | 581,908 | |||||||
Interest and dividends | 1,145,500 | |||||||
Other assets | 12,129 | |||||||
Total assets | $446,376,162 | |||||||
Liabilities | ||||||||
Payable for fund shares reacquired | $734,824 | |||||||
Collateral for securities loaned, at value | 3,403,200 | |||||||
Payable to affiliates | ||||||||
Investment adviser | 33,629 | |||||||
Shareholder servicing costs | 324 | |||||||
Distribution and/or service fees | 7,773 | |||||||
Payable for Trustees’ compensation | 433 | |||||||
Accrued expenses and other liabilities | 95,190 | |||||||
Total liabilities | $4,275,373 | |||||||
Net assets | $442,100,789 | |||||||
Net assets consist of | ||||||||
Paid-in capital | $471,841,254 | |||||||
Unrealized appreciation (depreciation) on investments and translation of assets and liabilities in foreign currencies | (13,117,394 | ) | ||||||
Accumulated net realized gain (loss) on investments and foreign currency transactions | (24,471,339 | ) | ||||||
Undistributed net investment income | 7,848,268 | |||||||
Net assets | $442,100,789 | |||||||
Shares of beneficial interest outstanding | 29,441,720 |
| Net assets | Shares outstanding | Net asset value per share | ||||||||||
Initial Class | $60,531,810 | 3,993,365 | $15.16 | |||||||||
Service Class | 381,568,979 | 25,448,355 | 14.99 | |||||||||
See Notes to Financial Statements
10
Table of Contents
MFS International Value Portfolio
FINANCIAL STATEMENTS | STATEMENT OF OPERATIONS
This statement describes how much your fund earned in investment income and accrued in expenses. It also describes any gains and/or losses generated by fund operations.
| Year ended 12/31/11 | ||||||||
| Net investment income | ||||||||
Income | ||||||||
Dividends | $14,673,252 | |||||||
Interest | 264,188 | |||||||
Dividends from underlying affiliated funds | 22,381 | |||||||
Foreign taxes withheld | (1,138,292 | ) | ||||||
Total investment income | $13,821,529 | |||||||
Expenses | ||||||||
Management fee | $3,822,790 | |||||||
Distribution and/or service fees | 899,321 | |||||||
Shareholder servicing costs | 46,000 | |||||||
Administrative services fee | 141,112 | |||||||
Trustees’ compensation | 45,541 | |||||||
Custodian fee | 132,203 | |||||||
Shareholder communications | 18,936 | |||||||
Auditing fees | 47,556 | |||||||
Legal fees | 5,513 | |||||||
Miscellaneous | 45,751 | |||||||
Total expenses | $5,204,723 | |||||||
Fees paid indirectly | (5 | ) | ||||||
Net expenses | $5,204,718 | |||||||
Net investment income | $8,616,811 | |||||||
Realized and unrealized gain (loss) on investments and foreign currency transactions | ||||||||
Realized gain (loss) (identified cost basis) | ||||||||
Investment transactions | $2,427,970 | |||||||
Foreign currency transactions | (106,285 | ) | ||||||
Net realized gain (loss) on investments and foreign currency transactions | $2,321,685 | |||||||
Change in unrealized appreciation (depreciation) | ||||||||
Investments | $(19,109,533 | ) | ||||||
Translation of assets and liabilities in foreign currencies | (46,628 | ) | ||||||
Net unrealized gain (loss) on investments and foreign currency translation | $(19,156,161 | ) | ||||||
Net realized and unrealized gain (loss) on investments and foreign currency | $(16,834,476 | ) | ||||||
Change in net assets from operations | $(8,217,665 | ) |
See Notes to Financial Statements
11
Table of Contents
MFS International Value Portfolio
FINANCIAL STATEMENTS | STATEMENTS OF CHANGES IN NET ASSETS
These statements describe the increases and/or decreases in net assets resulting from operations, any distributions, and any shareholder transactions.
For years ended 12/31 | 2011 | 2010 | ||||||
Change in net assets | ||||||||
From operations | ||||||||
Net investment income | $8,616,811 | $4,828,987 | ||||||
Net realized gain (loss) on investments and foreign currency transactions | 2,321,685 | (782,240 | ) | |||||
Net unrealized gain (loss) on investments and foreign currency translation | (19,156,161 | ) | 28,239,889 | |||||
Change in net assets from operations | $(8,217,665 | ) | $32,286,636 | |||||
Distributions declared to shareholders | ||||||||
From net investment income | $(4,742,528 | ) | $(4,425,164 | ) | ||||
Change in net assets from fund share transactions | $61,502,991 | $95,712,274 | ||||||
Total change in net assets | $48,542,798 | $123,573,746 | ||||||
Net assets | ||||||||
At beginning of period | 393,557,991 | 269,984,245 | ||||||
At end of period (including undistributed net investment income of $7,848,268 and | $442,100,789 | $393,557,991 |
See Notes to Financial Statements
12
Table of Contents
MFS International Value Portfolio
FINANCIAL STATEMENTS | FINANCIAL HIGHLIGHTS
The financial highlights table is intended to help you understand the fund’s financial performance for the past 5 years. Certain information reflects financial results for a single fund share. The total returns in the table represent the rate by which an investor would have earned (or lost) on an investment in the fund share class (assuming reinvestment of all distributions) held for the entire period.
| Initial Class | Years ended 12/31 | |||||||||||||||||||
| 2011 | 2010 | 2009 | 2008 | 2007 | ||||||||||||||||
Net asset value, beginning of period | $15.59 | $14.51 | $12.03 | $18.68 | $20.02 | |||||||||||||||
| Income (loss) from investment operations | ||||||||||||||||||||
Net investment income (d) | $0.36 | $0.26 | $0.25 | $0.44 | $0.33 | |||||||||||||||
Net realized and unrealized gain (loss) on investments | (0.59 | ) | 1.05 | 2.64 | (5.94 | ) | 1.13 | |||||||||||||
Total from investment operations | $(0.23 | ) | $1.31 | $2.89 | $(5.50 | ) | $1.46 | |||||||||||||
| Less distributions declared to shareholders | ||||||||||||||||||||
From net investment income | $(0.20 | ) | $(0.23 | ) | $(0.41 | ) | $(0.16 | ) | $(0.33 | ) | ||||||||||
From net realized gain on investments | — | — | — | (0.99 | ) | (2.47 | ) | |||||||||||||
Total distributions declared to shareholders | $(0.20 | ) | $(0.23 | ) | $(0.41 | ) | $(1.15 | ) | $(2.80 | ) | ||||||||||
Net asset value, end of period (x) | $15.16 | $15.59 | $14.51 | $12.03 | $18.68 | |||||||||||||||
Total return (%) (k)(s)(x) | (1.52 | ) | 9.11 | 25.37 | (31.41 | ) | 7.35 | |||||||||||||
| Ratios (%) (to average net assets) and Supplemental data: | ||||||||||||||||||||
Expenses (f) | 1.01 | 1.06 | 1.09 | 1.05 | 1.05 | |||||||||||||||
Net investment income | 2.28 | 1.79 | 2.00 | 2.82 | 1.67 | |||||||||||||||
Portfolio turnover | 16 | 28 | 49 | 44 | 44 | |||||||||||||||
Net assets at end of period (000 omitted) | $60,532 | $68,356 | $63,978 | $57,968 | $117,100 | |||||||||||||||
See Notes to Financial Statements
13
Table of Contents
MFS International Value Portfolio
Financial Highlights – continued
| Service Class | Years ended 12/31 | |||||||||||||||||||
| 2011 | 2010 | 2009 | 2008 | 2007 | ||||||||||||||||
Net asset value, beginning of period | $15.43 | $14.38 | $11.91 | $18.53 | $19.92 | |||||||||||||||
| Income (loss) from investment operations | ||||||||||||||||||||
Net investment income (d) | $0.31 | $0.20 | $0.23 | $0.39 | $0.16 | |||||||||||||||
Net realized and unrealized gain (loss) on investments | (0.58 | ) | 1.05 | 2.62 | (5.87 | ) | 1.24 | |||||||||||||
Total from investment operations | $(0.27 | ) | $1.25 | $2.85 | $(5.48 | ) | $1.40 | |||||||||||||
| Less distributions declared to shareholders | ||||||||||||||||||||
From net investment income | $(0.17 | ) | $(0.20 | ) | $(0.38 | ) | $(0.15 | ) | $(0.32 | ) | ||||||||||
From net realized gain on investments | — | — | — | (0.99 | ) | (2.47 | ) | |||||||||||||
Total distributions declared to shareholders | $(0.17 | ) | $(0.20 | ) | $(0.38 | ) | $(1.14 | ) | $(2.79 | ) | ||||||||||
Net asset value, end of period (x) | $14.99 | $15.43 | $14.38 | $11.91 | $18.53 | |||||||||||||||
Total return (%) (k)(s)(x) | (1.78 | ) | 8.78 | 25.11 | (31.58 | ) | 7.04 | |||||||||||||
| Ratios (%) (to average net assets) and Supplemental data: | ||||||||||||||||||||
Expenses (f) | 1.26 | 1.31 | 1.34 | 1.30 | 1.30 | |||||||||||||||
Net investment income | 1.98 | 1.43 | 1.83 | 2.52 | 0.87 | |||||||||||||||
Portfolio turnover | 16 | 28 | 49 | 44 | 44 | |||||||||||||||
Net assets at end of period (000 omitted) | $381,569 | $325,202 | $206,006 | $179,067 | $224,339 | |||||||||||||||
| (d) | Per share data is based on average shares outstanding. |
| (f) | Ratios do not reflect reductions from fees paid indirectly, if applicable. |
| (k) | The total return does not reflect expenses that apply to separate accounts. Inclusion of these charges would reduce the total return figures for all periods shown. |
| (s) | From time to time the fund may receive proceeds from litigation settlements, without which performance would be lower. |
| (x) | The net asset values per share and total returns have been calculated on net assets which include adjustments made in accordance with U.S. generally accepted accounting principles required at period end for financial reporting purposes. |
See Notes to Financial Statements
14
Table of Contents
MFS International Value Portfolio
| (1) | Business and Organization |
MFS International Value Portfolio (the fund) is a series of MFS Variable Insurance Trust II (the trust). The trust is organized as a Massachusetts business trust and is registered under the Investment Company Act of 1940, as amended, as an open-end management investment company. The shareholders of each series of the trust are separate accounts of insurance companies, which offer variable annuity and/or life insurance products, and qualified retirement and pension plans.
| (2) | Significant Accounting Policies |
General – The preparation of financial statements in conformity with U.S. generally accepted accounting principles requires management to make estimates and assumptions that affect the reported amounts of assets and liabilities, and disclosure of contingent assets and liabilities at the date of the financial statements and the reported amounts of revenues and expenses during the reporting period. Actual results could differ from those estimates. In the preparation of these financial statements, management has evaluated subsequent events occurring after the date of the fund’s Statement of Assets and Liabilities through the date that the financial statements were issued. The fund invests in foreign securities. Investments in foreign securities are vulnerable to the effects of changes in the relative values of the local currency and the U.S. dollar and to the effects of changes in each country’s legal, political, and economic environment.
In December 2011, the Financial Accounting Standards Board issued Accounting Standards Update 2011-11, Balance Sheet (Topic 210) – Disclosures about Offsetting Assets and Liabilities (“ASU 2011-11”). Effective for annual reporting periods beginning on or after January 1, 2013 and interim periods within those annual periods, ASU 2011-11 is intended to enhance disclosure requirements on the offsetting of financial assets and liabilities. Although still evaluating the potential impacts of ASU 2011-11 to the fund, management expects that the impact of the fund’s adoption will be limited to additional financial statement disclosures.
Investment Valuations – Equity securities, including restricted equity securities, are generally valued at the last sale or official closing price as provided by a third-party pricing service on the market or exchange on which they are primarily traded. Equity securities, for which there were no sales reported that day, are generally valued at the last quoted daily bid quotation as provided by a third-party pricing service on the market or exchange on which such securities are primarily traded. Equity securities held short, for which there were no sales reported for that day, are generally valued at the last quoted daily ask quotation as provided by a third-party pricing service on the market or exchange on which such securities are primarily traded. Short-term instruments with a maturity at issuance of 60 days or less generally are valued at amortized cost, which approximates market value. Exchange-traded options are generally valued at the last sale or official closing price as provided by a third-party pricing service on the exchange on which such options are primarily traded. Exchange-traded options for which there were no sales reported that day are generally valued at the last daily bid quotation as provided by a third-party pricing service on the exchange on which such options are primarily traded. Options not traded on an exchange are generally valued at a broker/dealer bid quotation. Foreign currency options are generally valued at valuations provided by a third-party pricing service. Open-end investment companies are generally valued at net asset value per share. Securities and other assets generally valued on the basis of information from a third-party pricing service may also be valued at a broker/dealer bid quotation. Values obtained from third-party pricing services can utilize both transaction data and market information such as yield, quality, coupon rate, maturity, type of issue, trading characteristics, and other market data. The values of foreign securities and other assets and liabilities expressed in foreign currencies are converted to U.S. dollars using the mean of bid and asked prices for rates provided by a third-party pricing service.
The Board of Trustees has delegated primary responsibility for determining or causing to be determined the value of the fund’s investments (including any fair valuation) to the adviser pursuant to valuation policies and procedures approved by the Board. If the adviser determines that reliable market quotations are not readily available, investments are valued at fair value as determined in good faith by the adviser in accordance with such procedures under the oversight of the Board of Trustees. Under the fund’s valuation policies and procedures, market quotations are not considered to be readily available for most types of debt instruments and floating rate loans and many types of derivatives. These investments are generally valued at fair value based on information from third-party pricing services. In addition, investments may be valued at fair value if the adviser determines that an investment’s value has been materially affected by events occurring after the close of the exchange or market on which the investment is principally traded (such as foreign exchange or market) and prior to the determination of the fund’s net asset value, or after the halting of trading of a specific security where trading does not resume prior to the close of the exchange or market on which the security is principally traded. Events that occur on a frequent basis after foreign markets close (such as developments in foreign markets and significant movements in the U.S. markets) and prior to the determination of the fund’s net asset value may be deemed to have a material effect on the value of securities traded in foreign markets. Accordingly, the fund’s foreign equity securities may often be valued at fair value. The adviser generally relies on third-party pricing services or other information (such as the correlation with price movements of similar securities in the same or other markets; the type, cost and investment characteristics of the security; the business and financial condition of the
15
Table of Contents
MFS International Value Portfolio
Notes to Financial Statements – continued
issuer; and trading and other market data) to assist in determining whether to fair value and at what value to fair value an investment. The value of an investment for purposes of calculating the fund’s net asset value can differ depending on the source and method used to determine value. When fair valuation is used, the value of an investment used to determine the fund’s net asset value may differ from quoted or published prices for the same investment. There can be no assurance that the fund could obtain the fair value assigned to an investment if it were to sell the investment at the same time at which the fund determines its net asset value per share.
Various inputs are used in determining the value of the fund’s assets or liabilities. These inputs are categorized into three broad levels. In certain cases, the inputs used to measure fair value may fall into different levels of the fair value hierarchy. In such cases, an investment’s level within the fair value hierarchy is based on the lowest level of input that is significant to the fair value measurement. The fund’s assessment of the significance of a particular input to the fair value measurement in its entirety requires judgment, and considers factors specific to the investment. Level 1 includes unadjusted quoted prices in active markets for identical assets or liabilities. Level 2 includes other significant observable market-based inputs (including quoted prices for similar securities, interest rates, prepayment speed, and credit risk). Level 3 includes unobservable inputs, which may include the adviser’s own assumptions in determining the fair value of investments. The following is a summary of the levels used as of December 31, 2011 in valuing the fund’s assets or liabilities:
| Investments at Value | Level 1 | Level 2 | Level 3 | Total | ||||||||||||
| Equity Securities: | ||||||||||||||||
United Kingdom | $35,012,207 | $84,814,845 | $— | $119,827,052 | ||||||||||||
Japan | 117,564,442 | — | — | 117,564,442 | ||||||||||||
Switzerland | 12,760,350 | 40,503,216 | — | 53,263,566 | ||||||||||||
Germany | 26,254,307 | 5,581,993 | — | 31,836,300 | ||||||||||||
France | 11,877,614 | 19,579,979 | — | 31,457,593 | ||||||||||||
Netherlands | — | 22,101,942 | — | 22,101,942 | ||||||||||||
Taiwan | 7,508,013 | — | — | 7,508,013 | ||||||||||||
South Korea | 5,523,274 | — | — | 5,523,274 | ||||||||||||
Spain | — | 4,985,708 | — | 4,985,708 | ||||||||||||
Other Countries | 13,873,725 | 13,446,424 | 0 | 27,320,149 | ||||||||||||
| Purchased Currency Options | — | 104,752 | — | 104,752 | ||||||||||||
| Mutual Funds | 23,143,643 | — | — | 23,143,643 | ||||||||||||
| Total Investments | $253,517,575 | $191,118,859 | $0 | $444,636,434 | ||||||||||||
For further information regarding security characteristics, see the Portfolio of Investments. At December 31, 2011, the fund held one level 3 security valued at $0, which was also held and valued at $0 at December 31, 2010.
Of the level 2 investments presented above, equity investments amounting to $180,914,912 would have been considered level 1 investments at the beginning of the period. Of the level 1 investments presented above, equity investments amounting to $9,298,285 would have been considered level 2 investments at the beginning of the period. The primary reason for changes in the classifications between levels 1 and 2 occurs when foreign equity securities are fair valued using other observable market-based inputs in place of the closing exchange price due to events occurring after the close of the exchange or market on which the investment is principally traded. The fund’s foreign equity securities may often be valued at fair value. The fund’s policy is to recognize transfers between the levels as of the end of the period.
Foreign Currency Translation – Purchases and sales of foreign investments, income, and expenses are converted into U.S. dollars based upon currency exchange rates prevailing on the respective dates of such transactions or on the reporting date for foreign denominated receivables and payables. Gains and losses attributable to foreign currency exchange rates on sales of securities are recorded for financial statement purposes as net realized gains and losses on investments. Gains and losses attributable to foreign exchange rate movements on receivables, payables, income and expenses are recorded for financial statement purposes as foreign currency transaction gains and losses. That portion of both realized and unrealized gains and losses on investments that results from fluctuations in foreign currency exchange rates is not separately disclosed.
Derivatives – The fund uses derivatives for different purposes, primarily to increase or decrease exposure to a particular market or segment of the market, or security, to increase or decrease interest rate or currency exposure, or as alternatives to direct investments. Derivatives are used for hedging or non-hedging purposes. While hedging can reduce or eliminate losses, it can also reduce or eliminate gains. When the fund uses derivatives as an investment to increase market exposure, or for hedging purposes, gains and losses from derivative instruments may be substantially greater than the derivative’s original cost.
The derivative instruments used by the fund were purchased options. The fund’s period end derivatives, as presented in the Portfolio of Investments, generally are indicative of the volume of its derivative activity during the period.
16
Table of Contents
MFS International Value Portfolio
Notes to Financial Statements – continued
The following table presents, by major type of derivative contract, the fair value, on a gross basis, of the asset and liability components of derivatives held by the fund at December 31, 2011 as reported in the Statement of Assets and Liabilities:
| Fair Value (a) | ||||||
| Risk | Derivative Contracts | Asset Derivatives | ||||
| Foreign Exchange | Purchased Currency Options | $104,752 | ||||
| (a) | The value of purchased options outstanding is included in total investments, at value, within the fund’s Statement of Assets and Liabilities. |
The following table presents, by major type of derivative contract, the realized gain (loss) on derivatives held by the fund for the year ended December 31, 2011 as reported in the Statement of Operations:
| Risk | Investment Transactions (Purchased Options) | |||
| Foreign Exchange | $(642,776 | ) | ||
The following table presents, by major type of derivative contract, the change in unrealized appreciation (depreciation) on derivatives held by the fund for the year ended December 31, 2011 as reported in the Statement of Operations:
| Risk | Investments (Purchased Options) | |||
| Foreign Exchange | $69,101 | |||
Derivative counterparty credit risk is managed through formal evaluation of the creditworthiness of all potential counterparties. On certain over-the-counter derivatives, the fund attempts to reduce its exposure to counterparty credit risk whenever possible by entering into an International Swaps and Derivatives Association (ISDA) Master Agreement on a bilateral basis with each of the counterparties with whom it undertakes a significant volume of transactions. The ISDA Master Agreement gives each party to the agreement the right to terminate all transactions traded under such agreement if there is a certain deterioration in the credit quality of the other party. The ISDA Master Agreement gives the fund the right, upon an event of default by the applicable counterparty or a termination of the agreement, to close out all transactions traded under such agreement and to net amounts owed under each transaction to one net amount payable by one party to the other. This right to close out and net payments across all transactions traded under the ISDA Master Agreement could result in a reduction of the fund’s credit risk to such counterparty equal to any amounts payable by the fund under the applicable transactions, if any. However, absent an event of default by the counterparty or a termination of the agreement, the ISDA Master Agreement does not result in an offset of reported amounts of assets and liabilities in the Statement of Assets and Liabilities across transactions between the fund and the applicable counterparty.
Collateral requirements differ by type of derivative. Collateral or margin requirements are set by the broker or exchange clearing house for exchange traded derivatives (i.e., futures and exchange-traded options) while collateral terms are contract specific for over-the-counter traded derivatives (i.e., forward foreign currency exchange contracts, swaps and over-the-counter options). For derivatives traded under an ISDA Master Agreement, the collateral requirements are netted across all transactions traded under such agreement and one amount is posted from one party to the other to collateralize such obligations. Cash collateral that has been pledged to cover obligations of the fund under derivative contracts, if any, will be reported separately on the Statement of Assets and Liabilities as restricted cash. Securities collateral pledged for the same purpose, if any, is noted in the Portfolio of Investments.
Purchased Options – The fund purchased call and put options for a premium. Purchased call and put options entitle the holder to buy and sell a specified number of shares or units of a particular security, currency or index at a specified price at a specified date or within a specified period of time. Purchasing call options may be used to hedge against an anticipated increase in the dollar cost of securities or currency to be acquired or to increase the fund’s exposure to an underlying instrument. Purchasing put options may hedge against a decline in the value of portfolio securities or currency.
The premium paid is initially recorded as an investment in the Statement of Assets and Liabilities. That investment is subsequently marked-to-market daily with the difference between the premium paid and the market value of the purchased option being recorded as unrealized appreciation or depreciation. Premiums paid for purchased call and put options which have expired are treated as realized losses on investments in the Statement of Operations. Upon the exercise or closing of a purchased call option, the premium paid is added to the cost of the security or financial instrument. Upon the exercise or closing of a purchased put option, the premium paid is offset against the proceeds on the sale of the underlying security or financial instrument in order to determine the realized gain or loss on investments.
17
Table of Contents
MFS International Value Portfolio
Notes to Financial Statements – continued
The risk in purchasing an option is that the fund pays a premium whether or not the option is exercised. The fund’s maximum risk of loss due to counterparty credit risk is limited to the market value of the option. For over-the-counter options, this risk is mitigated in cases where there is an ISDA Master Agreement between the fund and the counterparty providing for netting as described above and for posting of collateral by the counterparty to the fund to cover the fund’s exposure to the counterparty under such ISDA Master Agreement.
Security Loans – State Street Bank and Trust Company (“State Street”), as lending agent, loans the securities of the fund to certain qualified institutions (the “Borrowers”) approved by the fund. The loans are collateralized by cash and/or U.S. Treasury and federal agency obligations in an amount typically at least equal to the market value of the securities loaned. The market value of the loaned securities is determined at the close of business of the fund and any additional required collateral is delivered to the fund on the next business day. State Street provides the fund with indemnification against Borrower default. The fund bears the risk of loss with respect to the investment of cash collateral. On loans collateralized by cash, the cash collateral is invested in a money market fund or short-term securities. A portion of the income generated upon investment of the collateral is remitted to the Borrowers, and the remainder is allocated between the fund and the lending agent. On loans collateralized by U.S. Treasury and/or federal agency obligations, a fee is received from the Borrower, and is allocated between the fund and the lending agent. Income from securities lending is included in interest income on the Statement of Operations. The dividend and interest income earned on the securities loaned is accounted for in the same manner as other dividend and interest income.
Indemnifications – Under the fund’s organizational documents, its officers and Trustees may be indemnified against certain liabilities and expenses arising out of the performance of their duties to the fund. Additionally, in the normal course of business, the fund enters into agreements with service providers that may contain indemnification clauses. The fund’s maximum exposure under these agreements is unknown as this would involve future claims that may be made against the fund that have not yet occurred.
Investment Transactions and Income – Investment transactions are recorded on the trade date. Interest income is recorded on the accrual basis. Dividends received in cash are recorded on the ex-dividend date. Certain dividends from foreign securities will be recorded when the fund is informed of the dividend if such information is obtained subsequent to the ex-dividend date. Dividend and interest payments received in additional securities are recorded on the ex-dividend or ex-interest date in an amount equal to the value of the security on such date.
The fund may receive proceeds from litigation settlements. Any proceeds received from litigation involving portfolio holdings are reflected in the Statement of Operations in realized gain/loss if the security has been disposed of by the fund or in unrealized gain/loss if the security is still held by the fund. Any other proceeds from litigation not related to portfolio holdings are reflected as other income in the Statement of Operations.
Fees Paid Indirectly – The fund’s custody fee may be reduced according to an arrangement that measures the value of cash deposited with the custodian by the fund. This amount, for the year ended December 31, 2011, is shown as a reduction of total expenses on the Statement of Operations.
Tax Matters and Distributions – The fund intends to qualify as a regulated investment company, as defined under Subchapter M of the Internal Revenue Code, and to distribute all of its taxable income, including realized capital gains. As a result, no provision for federal income tax is required. The fund’s federal tax returns for the prior three fiscal years remain subject to examination by the Internal Revenue Service. Foreign taxes have been accrued by the fund in the accompanying financial statements.
Distributions to shareholders are recorded on the ex-dividend date. Income and capital gain distributions are determined in accordance with income tax regulations, which may differ from U.S. generally accepted accounting principles. Certain capital accounts in the financial statements are periodically adjusted for permanent differences in order to reflect their tax character. These adjustments have no impact on net assets or net asset value per share. Temporary differences which arise from recognizing certain items of income, expense, gain or loss in different periods for financial statement and tax purposes will reverse at some time in the future. Distributions in excess of net investment income or net realized gains are temporary overdistributions for financial statement purposes resulting from differences in the recognition or classification of income or distributions for financial statement and tax purposes.
Book/tax differences primarily relate to wash sale loss deferrals.
The tax character of distributions declared to shareholders for the last two fiscal years is as follows:
| 12/31/11 | 12/31/10 | |||||||
| Ordinary income (including any short-term capital gains) | $4,742,528 | $4,425,164 | ||||||
18
Table of Contents
MFS International Value Portfolio
Notes to Financial Statements – continued
The federal tax cost and the tax basis components of distributable earnings were as follows:
| As of 12/31/11 | ||||
| Cost of investments | $458,382,745 | |||
| Gross appreciation | 35,682,156 | |||
| Gross depreciation | (49,428,467 | ) | ||
| Net unrealized appreciation (depreciation) | $(13,746,311 | ) | ||
| Undistributed ordinary income | 7,872,137 | |||
| Capital loss carryforwards | (23,816,992 | ) | ||
| Other temporary differences | (49,299 | ) |
Under the Regulated Investment Company Modernization Act of 2010 (the “Act”), net capital losses recognized after December 31, 2010 may be carried forward indefinitely, and their character is retained as short-term and/or long-term losses. Previously, net capital losses were carried forward for eight years and treated as short-term losses. As a transition rule, the Act requires that post-enactment net capital losses be used before pre-enactment net capital losses.
As of December 31, 2011, the fund had capital loss carryforwards available to offset future realized gains. Such losses expire as follows:
| Pre-enactment losses: | ||||
| 12/31/16 | $(4,502,795 | ) | ||
| 12/31/17 | (18,221,256 | ) | ||
| 12/31/18 | (1,092,941 | ) | ||
| Total | $(23,816,992 | ) |
Multiple Classes of Shares of Beneficial Interest – The fund offers multiple classes of shares, which differ in their respective distribution and/or service fees. The fund’s income, realized and unrealized gain (loss), and common expenses are allocated to shareholders based on the daily net assets of each class. Dividends are declared separately for each class. Differences in per share dividend rates are generally due to differences in separate class expenses. The fund’s distributions declared to shareholders as reported on the Statements of Changes in Net Assets are presented by class as follows:
| From net investment income | ||||||||
| Year ended 12/31/11 | Year ended 12/31/10 | |||||||
| Initial Class | $789,091 | $1,040,282 | ||||||
| Service Class | 3,953,437 | 3,384,882 | ||||||
| Total | $4,742,528 | $4,425,164 | ||||||
| (3) | Transactions with Affiliates |
Investment Adviser – The fund has an investment advisory agreement with MFS to provide overall investment management and related administrative services and facilities to the fund. The management fee is computed daily and paid monthly at the following annual rates:
| First $1 billion of average daily net assets | 0.90% | |||
| Next $1 billion of average daily net assets | 0.80% | |||
| Average daily net assets in excess of $2 billion | 0.70% |
The management fee incurred for the year ended December 31, 2011 was equivalent to an annual effective rate of 0.90% of the fund’s average daily net assets.
Distributor – MFS Fund Distributors, Inc. (MFD), a wholly-owned subsidiary of MFS, is the distributor of shares of the fund. The Trustees have adopted a distribution plan for the Service Class shares pursuant to Rule 12b-1 under the Investment Company Act of 1940.
The fund’s distribution plan provides that the fund will pay MFD distribution and/or service fees equal to 0.25% per annum of its average daily net assets attributable to Service Class shares as partial consideration for services performed and expenses incurred by MFD and financial intermediaries (including participating insurance companies that invest in the fund to fund variable annuity and variable life insurance contracts, sponsors of qualified retirement and pension plans that invest in the fund, and affiliates of these participating insurance companies and plan sponsors) in connection with the sale and distribution of the Service Class shares. MFD may subsequently pay all, or a portion, of the distribution and/or service fees to financial intermediaries.
19
Table of Contents
MFS International Value Portfolio
Notes to Financial Statements – continued
Shareholder Servicing Agent – MFS Service Center, Inc. (MFSC), a wholly-owned subsidiary of MFS, receives a fee from the fund for its services as shareholder servicing agent. For the year ended December 31, 2011, the fee was $45,961, which equated to 0.0108% annually of the fund’s average daily net assets. MFSC also receives payment from the fund for out-of-pocket expenses paid by MFSC on behalf of the fund. For the year ended December 31, 2011, these costs amounted to $39.
Administrator – MFS provides certain financial, legal, shareholder communications, compliance, and other administrative services to the fund. Under an administrative services agreement, the fund partially reimburses MFS the costs incurred to provide these services. The fund is charged an annual fixed amount of $17,500 plus a fee based on average daily net assets. The administrative services fee incurred for the year ended December 31, 2011 was equivalent to an annual effective rate of 0.0332% of the fund’s average daily net assets.
Trustees’ and Officers’ Compensation – The fund pays compensation to Trustees in the form of a retainer, attendance fees, and additional compensation to the Board chairperson. The fund does not pay compensation directly to officers of the fund who are also officers of the investment adviser, all of whom receive remuneration for their services to the fund from MFS. Certain officers of the fund are officers or directors of MFS, MFD, and MFSC.
Other – This fund and certain other funds managed by MFS (the funds) have entered into services agreements (the Agreements) which provide for payment of fees by the funds to Tarantino LLC and Griffin Compliance LLC in return for the provision of services of an Independent Chief Compliance Officer (ICCO) and Assistant ICCO, respectively, for the funds. The ICCO and Assistant ICCO are officers of the funds and the sole members of Tarantino LLC and Griffin Compliance LLC, respectively. The funds can terminate the Agreements with Tarantino LLC and Griffin Compliance LLC at any time under the terms of the Agreements. MFS has agreed to bear all expenses associated with office space, other administrative support, and supplies provided to the ICCO and Assistant ICCO. For the year ended December 31, 2011, the aggregate fees paid by the fund to Tarantino LLC and Griffin Compliance LLC were $7,002 and are included in miscellaneous expense on the Statement of Operations.
The fund invests in the MFS Institutional Money Market Portfolio which is managed by MFS and seeks a high level of current income consistent with preservation of capital and liquidity. Income earned on this investment is included in dividends from underlying affiliated funds on the Statement of Operations. This money market fund does not pay a management fee to MFS.
| (4) | Portfolio Securities |
Purchases and sales of investments, other than U.S. Government securities, purchased option transactions, and short-term obligations, aggregated $124,811,922 and $64,504,983, respectively.
| (5) | Shares of Beneficial Interest |
The fund’s Declaration of Trust permits the Trustees to issue an unlimited number of full and fractional shares of beneficial interest. Transactions in fund shares were as follows:
| Year ended 12/31/11 | Year ended 12/31/10 | |||||||||||||||
| Shares | Amount | Shares | Amount | |||||||||||||
| Shares sold | ||||||||||||||||
Initial Class | 299,507 | $4,681,107 | 818,696 | $11,858,777 | ||||||||||||
Service Class | 8,945,525 | 139,378,085 | 9,375,648 | 133,038,501 | ||||||||||||
| 9,245,032 | $144,059,192 | 10,194,344 | $144,897,278 | |||||||||||||
| Shares issued to shareholders in reinvestment of distributions | ||||||||||||||||
Initial Class | 50,876 | $789,091 | 71,448 | $1,040,282 | ||||||||||||
Service Class | 257,385 | 3,953,437 | 234,410 | 3,384,882 | ||||||||||||
| 308,261 | $4,742,528 | 305,858 | $4,425,164 | |||||||||||||
| Shares reacquired | ||||||||||||||||
Initial Class | (741,692 | ) | $(11,743,882 | ) | (914,793 | ) | $(13,007,882 | ) | ||||||||
Service Class | (4,825,216 | ) | (75,554,847 | ) | (2,868,953 | ) | (40,602,286 | ) | ||||||||
| (5,566,908 | ) | $(87,298,729 | ) | (3,783,746 | ) | $(53,610,168 | ) | |||||||||
| Net change | ||||||||||||||||
Initial Class | (391,309 | ) | $(6,273,684 | ) | (24,649 | ) | $(108,823 | ) | ||||||||
Service Class | 4,377,694 | 67,776,675 | 6,741,105 | 95,821,097 | ||||||||||||
| 3,986,385 | $61,502,991 | 6,716,456 | $95,712,274 | |||||||||||||
| (6) | Line of Credit |
The fund and certain other funds managed by MFS participate in a $1.1 billion unsecured committed line of credit, subject to a $1 billion sublimit, provided by a syndication of banks under a credit agreement. Borrowings may be made for temporary
20
Table of Contents
MFS International Value Portfolio
Notes to Financial Statements – continued
financing needs. Interest is charged to each fund, based on its borrowings, generally at a rate equal to the higher of the Federal Reserve funds rate or one month LIBOR plus an agreed upon spread. A commitment fee, based on the average daily, unused portion of the committed line of credit, is allocated among the participating funds at the end of each calendar quarter. In addition, the fund and other funds managed by MFS have established unsecured uncommitted borrowing arrangements with certain banks for temporary financing needs. Interest is charged to each fund, based on its borrowings, at a rate equal to the Federal Reserve funds rate plus an agreed upon spread. For the year ended December 31, 2011, the fund’s commitment fee and interest expense were $3,268 and $0, respectively, and are included in miscellaneous expense on the Statement of Operations.
| (7) | Transactions in Underlying Affiliated Funds – Affiliated Issuers |
An affiliated issuer may be considered one in which the fund owns 5% or more of the outstanding voting securities, or a company which is under common control. For the purposes of this report, the fund assumes the following to be affiliated issuers:
| Underlying Affiliated Funds | Beginning Shares/Par Amount | Acquisitions Shares/Par Amount | Dispositions Shares/Par Amount | Ending Shares/Par Amount | ||||||||||||
| MFS Institutional Money Market Portfolio | 18,785,164 | 112,731,610 | (111,776,331 | ) | 19,740,443 | |||||||||||
| Underlying Affiliated Funds | Realized Gain (Loss) | Capital Gain Distributions | Dividend Income | Ending Value | ||||||||||||
| MFS Institutional Money Market Portfolio | $— | $— | $22,381 | $19,740,443 | ||||||||||||
21
Table of Contents
MFS International Value Portfolio
REPORT OF INDEPENDENT REGISTERED PUBLIC ACCOUNTING FIRM
To the Board of Trustees of MFS Variable Insurance Trust II and the Shareholders of
MFS International Value Portfolio:
We have audited the accompanying statement of assets and liabilities, including the portfolio of investments, of MFS International Value Portfolio (the “Fund”) (one of the portfolios comprising MFS Variable Insurance Trust II) as of December 31, 2011, and the related statement of operations for the year then ended, the statements of changes in net assets for each of the two years in the period then ended, and the financial highlights for each of the five years in the period then ended. These financial statements and financial highlights are the responsibility of the Fund’s management. Our responsibility is to express an opinion on these financial statements and financial highlights based on our audits.
We conducted our audits in accordance with the standards of the Public Company Accounting Oversight Board (United States). Those standards require that we plan and perform the audit to obtain reasonable assurance about whether the financial statements and financial highlights are free of material misstatement. The Fund is not required to have, nor were we engaged to perform, an audit of its internal control over financial reporting. Our audits included consideration of internal control over financial reporting as a basis for designing audit procedures that are appropriate in the circumstances, but not for the purpose of expressing an opinion on the effectiveness of the Fund’s internal control over financial reporting. Accordingly, we express no such opinion. An audit also includes examining, on a test basis, evidence supporting the amounts and disclosures in the financial statements, assessing the accounting principles used and significant estimates made by management, as well as evaluating the overall financial statement presentation. Our procedures included confirmation of securities owned as of December 31, 2011, by correspondence with the custodian and brokers; where replies were not received from brokers, we performed other auditing procedures. We believe that our audits provide a reasonable basis for our opinion.
In our opinion, the financial statements and financial highlights referred to above present fairly, in all material respects, the financial position of MFS International Value Portfolio as of December 31, 2011, the results of its operations for the year then ended, the changes in its net assets for each of the two years in the period then ended, and the financial highlights for each of the five years in the period then ended, in conformity with accounting principles generally accepted in the United States of America.
DELOITTE & TOUCHE LLP
Boston, Massachusetts
February 15, 2012
22
Table of Contents
MFS International Value Portfolio
RESULTS OF SHAREHOLDER MEETING (unaudited)
At a special meeting of shareholders of MFS International Value Portfolio, which was held on December 1, 2011, the following actions were taken for which shareholders of all series of MFS Variable Insurance Trust II voted together as a single class with respect to Item 1 and shareholders of MFS International Value Portfolio voted as a separate class with respect to Items 2 and 3:
Item 1: Election of ten Trustees as members of the Board of Trustees of the Trust effective January 1, 2012:
| Number of Shares | ||||||||
| For | Withheld Authority | |||||||
| Robert E. Butler | 681,916,712.8686 | 46,472,894.9218 | ||||||
| Maureen R. Goldfarb | 682,835,794.8512 | 45,553,812.9392 | ||||||
| David H. Gunning | 681,500,267.3085 | 46,889,340.4819 | ||||||
| William R. Gutow | 681,050,223.5547 | 47,339,384.2357 | ||||||
| Michael Hegarty | 682,477,088.8584 | 45,912,518.9320 | ||||||
| John P. Kavanaugh | 683,794,425.4269 | 44,595,182.3635 | ||||||
| Robert J. Manning | 682,699,559.7374 | 45,690,048.0530 | ||||||
| J. Dale Sherratt | 681,362,743.0513 | 47,026,864.7391 | ||||||
| Laurie J. Thomsen | 683,408,094.0000 | 44,981,513.7904 | ||||||
| Robert W. Uek | 681,424,852.0247 | 46,964,755.7657 | ||||||
Item 2: To approve a new investment advisory agreement dated January 1, 2012, between the Trust, on behalf of MFS International Value Portfolio, and MFS:
| Number of Shares | ||||||||||||
| For | Against | Withheld Authority | ||||||||||
| 23,025,889.5028 | 901,767.8175 | 1,983,127.7715 | ||||||||||
Item 3: To approve revisions to and restatements of certain fundamental investment restrictions of MFS International Value Portfolio effective January 1, 2012 as detailed below:
| Number of Shares | ||||||||||||||
| For | Against | Withheld Authority | ||||||||||||
| A. | Borrowing | 22,160,161.7278 | 1,437,193.7376 | 2,313,429.6264 | ||||||||||
| B. | Underwriting Securities | 22,437,121.4514 | 1,153,798.2944 | 2,319,865.3460 | ||||||||||
| C. | Issuance of Senior Securities | 22,546,868.0921 | 1,012,377.9097 | 2,351,539.0900 | ||||||||||
| D. | Lending of Money or Securities | 22,270,979.8609 | 1,377,803.2561 | 2,262,001.9748 | ||||||||||
| E. | Purchases or Sales of Real Estate; Interests in Oil, Gas or Mineral Leases; and Commodities | 22,721,499.2298 | 986,939.4869 | 2,202,346.3751 | ||||||||||
| F. | Industry Concentration | 22,688,292.4216 | 945,781.2166 | 2,276,711.4536 | ||||||||||
23
Table of Contents
MFS International Value Portfolio
TRUSTEES AND OFFICERS – IDENTIFICATION AND BACKGROUND
The Trustees and officers of the Trust, as of February 1, 2012, are listed below, together with their principal occupations during the past five years. (Their titles may have varied during that period.) The address of each Trustee and officer is 500 Boylston Street, Boston, Massachusetts 02116.
Name, Age | Position(s) with Fund | Trustee/Officer Since (h) | Principal Occupations | Other Directorships (j) | ||||
| INTERESTED TRUSTEES | ||||||||
Robert J. Manning (k) (age 48) | Trustee | February 2004 | Massachusetts Financial Services Company, Chairman, Chief Executive Officer and Director; President (until December 2009); Chief Investment Officer (until July 2010) | N/A | ||||
| INDEPENDENT TRUSTEES | ||||||||
David H. Gunning (age 69) | Trustee and Chair of Trustees | January 2004 | Retired; Cleveland-Cliffs Inc. (mining products and service provider), Vice Chairman/Director (until May 2007) | Lincoln Electric Holdings, Inc. (welding equipment manufacturer), Director; Development Alternatives, Inc. (consulting), Director/Non-Executive Chairman; Portman Limited (mining), Director (until 2008) | ||||
Robert E. Butler (age 70) | Trustee | January 2006 | Consultant – investment company industry regulatory and compliance matters | N/A | ||||
Maureen R. Goldfarb (age 56) | Trustee | January 2009 | Private investor | N/A | ||||
William R. Gutow (age 70) | Trustee | December 1993 | Private investor and real estate consultant; Capitol Entertainment Management Company (video franchise), Vice Chairman | Atlantic Coast Tan (tanning salons), Vice Chairman (until 2007); Texas Donuts (donut franchise), Vice Chairman (until 2010) | ||||
Michael Hegarty (age 67) | Trustee | December 2004 | Private investor | N/A | ||||
John P. Kavanaugh (age 57) | Trustee | January 2009 | Private investor; The Hanover Insurance Group, Inc., Vice President and Chief Investment Officer (until 2006); Allmerica Investment Trust, Allmerica Securities Trust and Opus Investment Trust (investment companies), Chairman, President and Trustee (until 2006) | N/A | ||||
J. Dale Sherratt (age 73) | Trustee | June 1989 | Insight Resources, Inc. (acquisition planning specialists), President; Wellfleet Investments (investor in health care companies), Managing General Partner | N/A | ||||
Laurie J. Thomsen (age 54) | Trustee | March 2005 | Private investor; New Profit, Inc. (venture philanthropy), Executive Partner (until 2010) | The Travelers Companies (property and casualty insurance), Director | ||||
Robert W. Uek (age 70) | Trustee | January 2006 | Consultant to investment company industry | N/A | ||||
| OFFICERS | ||||||||
John M. Corcoran (k) (age 46) | President | October 2008 | Massachusetts Financial Services Company, Senior Vice President (since October 2008); State Street Bank and Trust (financial services provider), Senior Vice President, (until September 2008) | N/A | ||||
| Christopher R. Bohane (k) (age 38) | Assistant Secretary and Assistant Clerk | July 2005 | Massachusetts Financial Services Company, Vice President and Senior Counsel | N/A | ||||
Kino Clark (k) (age 43) | Assistant Treasurer | January 2012 | Massachusetts Financial Services Company, Assistant Vice President | N/A | ||||
24
Table of Contents
MFS International Value Portfolio
Trustees and Officers – continued
Name, Age | Position(s) with Fund | Trustee/Officer Since (h) | Principal Occupations | Other Directorships (j) | ||||
Ethan D. Corey (k) (age 48) | Assistant Secretary and Assistant Clerk | July 2005 | Massachusetts Financial Services Company, Senior Vice President and Associate General Counsel | N/A | ||||
David L. DiLorenzo (k) (age 43) | Treasurer | July 2005 | Massachusetts Financial Services Company, Vice President | N/A | ||||
Robyn L. Griffin (age 36) | Assistant Independent Chief Compliance Officer | August 2008 | Griffin Compliance LLC (provider of compliance services), Principal (since August 2008); State Street Corporation (financial services provider), Mutual Fund Administration Assistant Vice President (October 2006 – July 2008); Liberty Mutual Group (insurance), Personal Market Assistant Controller (April 2006 – October 2006); Deloitte & Touche LLP (professional services firm). | N/A | ||||
Brian E. Langenfeld (k) (age 38) | Assistant Secretary and Assistant Clerk | June 2006 | Massachusetts Financial Services Company, Vice President and Senior Counsel | N/A | ||||
Ellen Moynihan (k) (age 54) | Assistant Treasurer | April 1997 | Massachusetts Financial Services Company, Senior Vice President | N/A | ||||
Susan S. Newton (k) (age 61) | Assistant Secretary and Assistant Clerk | May 2005 | Massachusetts Financial Services Company, Senior Vice President and Associate General Counsel | N/A | ||||
Susan A. Pereira (k) (age 41) | Assistant Secretary and Assistant Clerk | July 2005 | Massachusetts Financial Services Company, Vice President and Senior Counsel | N/A | ||||
Mark N. Polebaum (k) (age 59) | Secretary and Clerk | January 2006 | Massachusetts Financial Services Company, Executive Vice President, General Counsel and Secretary | N/A | ||||
Frank L. Tarantino (age 67) | Independent Chief Compliance Officer | June 2004 | Tarantino LLC (provider of compliance services), Principal | N/A | ||||
Richard S. Weitzel (k) (age 41) | Assistant Secretary and Assistant Clerk | October 2007 | Massachusetts Financial Services Company, Vice President and Assistant General Counsel | N/A | ||||
James O. Yost (k) (age 51) | Deputy Treasurer | September 1990 | Massachusetts Financial Services Company, Senior Vice President | N/A | ||||
| (h) | Date first appointed to serve as Trustee/officer of an MFS fund. Each Trustee has served continuously since appointment unless indicated otherwise. For the period from December 15, 2004 until February 22, 2005, Mr. Manning served as Advisory Trustee. For the period October 2008, until January 2012, Mr. Corcoran served as Treasurer of the Funds. Prior to January 2012, Messrs. DiLorenzo and Yost served as Assistant Treasurers of the Funds. |
| (j) | Directorships or trusteeships of companies required to report to the Securities and Exchange Commission (i.e., “public companies”). |
| (k) | “Interested person” of the Trust within the meaning of the Investment Company Act of 1940 (referred to as the 1940 Act), which is the principal federal law governing investment companies like the fund, as a result of position with MFS. The address of MFS is 500 Boylston Street, Boston, Massachusetts 02116. |
Each Trustee has been elected by shareholders and each Trustee and officer holds office until his or her successor is chosen and qualified or until his or her earlier death, resignation, retirement or removal. The Trust does not hold annual meetings for the purpose of electing Trustees, and Trustees are not elected for fixed terms. Messrs. Butler, Kavanaugh, Uek and Ms. Thomsen are members of the Trust’s Audit Committee.
Each of the Fund’s Trustees and officers holds comparable positions with certain other funds of which MFS or a subsidiary is the investment adviser or distributor, and, in the case of the officers, with certain affiliates of MFS. As of January 1, 2012, the Trustees served as board members of 131 funds within the MFS Family of Funds.
25
Table of Contents
MFS International Value Portfolio
Trustees and Officers – continued
The Statement of Additional Information for the Fund includes further information about the Trustees and is available without charge upon request by calling 1-800-225-2606.
Investment Adviser Massachusetts Financial Services Company 500 Boylston Street, Boston, MA 02116-3741 | Custodian State Street Bank and Trust 1 Lincoln Street, Boston, MA 02111-2900 | |
Distributor MFS Fund Distributors, Inc. 500 Boylston Street, Boston, MA 02116-3741 | Independent Registered Public Accounting Firm Deloitte & Touche LLP 200 Berkeley Street, Boston, MA 02116 | |
Portfolio Managers Benjamin Stone Barnaby Wiener |
26
Table of Contents
MFS International Value Portfolio
At a special meeting of shareholders of the MFS International Value Portfolio (hereinafter referred to as the “Fund” or the “Portfolio”), which was held on December 1, 2011, the shareholders approved a new investment advisory agreement based on the recommendation of the Board of Trustees. At its July, 2011 meeting, the Board of Trustees (i) approved, and recommended for shareholder approval, the new investment advisory agreement effective January 1, 2012, and (ii) the continuation of the existing investment advisory agreement effective September 1, 2011. The following includes a description of the factors that the Board of Trustees considered and the conclusions that formed the basis of their approval of both the new investment advisory agreement and the continuation of the prior investment advisory agreement.
BOARD APPROVAL OF NEW INVESTMENT ADVISORY AGREEMENT
The Investment Company Act of 1940 requires that both the full Board of Trustees and a majority of the non-interested (“independent”) Trustees, voting separately, initially approve the new investment advisory agreement (the “New Agreement”) between Massachusetts Financial Services Company (“MFS”) and MFS Variable Insurance Trust II (the “Trust”) on behalf of the Portfolio and, beginning on the second anniversary of the initial effective date of the New Agreement, annually approve the continuation of the New Agreement. The Trustees have considered matters bearing on the Portfolio and the then current advisory arrangement at their meetings throughout the year, including a review of performance data at each regular meeting. In addition, the independent Trustees met in person in July 2011 to consider the initial approval of the New Agreement, and to recommend that shareholders approve the New Agreement. The independent Trustees were assisted in their evaluation of the New Agreement by independent legal counsel, from whom they received separate legal advice and with whom they met separately from MFS management. The independent Trustees were also assisted in this process by the Portfolio’s Independent Chief Compliance Officer, a full-time senior officer appointed by and reporting to the independent Trustees.
In connection with their deliberations regarding the initial approval of the New Agreement, the Trustees, including the independent Trustees, considered such information and factors as they believed, in light of the legal advice furnished to them and their own business judgment, to be relevant. The New Agreement was considered separately for the series of the Trust (collectively, the “Portfolios”), although the Trustees also took into account the common interests of all Portfolios in the Trust in their review. As described below, the Trustees considered the nature, quality, and extent of the various investment advisory, administrative, and/or shareholder services to be performed by MFS under the New Agreement and other arrangements with the Trust.
In connection with their initial review meeting, the Trustees received and relied upon materials that included, among other items: (i) information provided by MFS on the advisory fees of comparable portfolios of its other clients, including institutional separate account and other clients, (ii) information as to whether, and to what extent applicable, expense waivers, reimbursements or fee “breakpoints” would be observed for the Portfolio under the New Agreement, and (iii) a comparison and summary of the differences in the provisions in the New Agreement compared to those in each of the then current investment advisory agreements for the Portfolios. In addition, in connection with the independent Trustees’ meetings in May and July, 2011 (the “contract review meetings”) for the purpose of considering whether to approve the continuation of the then current investment advisory agreements for the Portfolio, the independent Trustees received: (1) information provided by Lipper Inc. (“Lipper”) on the investment performance of the Portfolio for various time periods ended December 31, 2010, compared to the investment performance of a group of funds with substantially similar investment classifications/objectives (the “Lipper performance universe”), (2) information provided by Lipper on the Portfolio’s advisory fees and other expenses compared to the advisory fees and other expenses of comparable funds identified by Lipper (the “Lipper expense group”), (3) information regarding MFS’ financial results and financial condition, including MFS’ and certain of its affiliates’ estimated profitability from services performed for the Portfolio, (4) MFS’ views regarding the outlook for the mutual fund industry and its strategic business plans, (5) descriptions of various functions performed by MFS for the Trust, such as compliance monitoring and portfolio trading practices, and (6) information regarding the overall organization of MFS, including information about MFS’ senior management and other personnel providing investment advisory, administrative and other services to the Portfolio. The comparative performance, fee and expense information prepared and provided by Lipper was not independently verified, and the independent Trustees did not independently verify any information provided to them by MFS.
The Trustees’ conclusion as to the initial approval of the New Agreement was based on comprehensive consideration of all information provided to the Trustees and was not the result of any single factor. Some of the factors that figured particularly in the Trustees’ deliberations are described below for the Portfolio, while individual Trustees may have given different weight to various factors and evaluated the information presented as a whole differently than another individual Trustee. The Trustees recognized that the fee arrangements for the Portfolio could reflect years of review and discussion between the independent Trustees and MFS, that certain aspects of such arrangements may receive greater scrutiny in some years than others, and that
27
Table of Contents
MFS International Value Portfolio
Board Approval of New Investment Advisory Agreement – continued
the Trustees’ conclusions may be based, in part, on their consideration of these same arrangements during the course of the year and in prior years.
Because the portfolio management team managing the Portfolio’s investments under the then current investment advisory agreement will remain the same under the New Agreement for the Portfolio, the Trustees compared the Portfolio’s total return investment performance to the performance of its Lipper performance universe over various time periods, based on information provided by Lipper. The Trustees placed particular emphasis on the total return performance of the Portfolio’s Initial Class shares in comparison to the performance of funds in its Lipper performance universe over the one-, three- and five-year periods ended December 31, 2010. The Trustees did not rely on performance results for more recent periods.
The Trustees noted the performance of the Portfolio’s Initial Class shares was in the 1st quintile relative to the other funds in the Lipper performance universe for the one-year period (the 1st quintile being the best performers and the 5th quintile being the worst performers). The total return performance of the Portfolio was also in the 1st quintile for the three-year and five-year periods ended December 31, 2010, relative to the Lipper performance universe. Based on the nature and quality of services historically provided by MFS, the Board of Trustees concluded that the Portfolio’s performance was satisfactory.
In the course of their deliberations, the Trustees took into account information provided by MFS during contract review meetings, as well as during investment review meetings conducted with portfolio management personnel during the course of the year. For Portfolios whose performance lagged their peer groups, they discussed the factors that contributed thereto and MFS’ efforts to improve such Portfolios’ performance. After reviewing this information, the Trustees concluded, within the context of their overall conclusions regarding the New Agreement, that they were satisfied with MFS’ responses and efforts relating to investment performance.
In assessing the reasonableness of the Portfolio’s advisory fee, the Trustees considered, among other information, the Portfolio’s advisory fee and the total expense ratio of the Portfolio’s Initial Class shares as a percentage of average daily net assets, compared to the advisory fee and total expense ratios of its peer group of funds based on information provided by Lipper. The Trustees also considered the advisory fees charged by MFS to institutional accounts. In comparing these fees, the Trustees considered the generally broader scope of services provided by MFS to the Trust than those provided to institutional accounts. The Trustees also considered the higher demands placed on MFS’ investment personnel and trading infrastructure as a result of the daily cash in-flows and out-flows of the Portfolio, and the impact on MFS and related expenses due to the more extensive regulatory regime to which the Portfolio is subject, compared to institutional accounts.
In considering the fees, the Trustees noted from the Lipper data that the Portfolio’s effective advisory fee rate and total expense ratio were each above the median of such fees and expenses of funds in the Lipper expense group. The Trustees further noted that the New Agreement would reflect MFS’ agreement to observe a lower advisory fee and to reduce the advisory fee on average daily net assets over $1 billion and over $2 billion on a permanent basis, and concluded that the breakpoints were sufficient to allow the Portfolio to benefit from economies of scale as its assets grow. The Trustees concluded that the fees were reasonable in light of the nature and quality of services provided.
The Trustees also considered whether the Portfolio is likely to benefit from any economies of scale due to future asset growth. In this regard, the Trustees reviewed the adequacy of breakpoints and discussed with MFS any adjustments necessary for the shareholders’ benefit.
The Trustees also considered information prepared by MFS relating to its costs and profits with respect to the Portfolio and other investment companies and accounts advised by MFS, as well as MFS’ methodologies used to determine and allocate its costs to the Portfolio and other accounts and products for purposes of estimating profitability.
The Trustees noted that there would be no increase to the net advisory fee arrangement for the Portfolio under the New Agreement when compared to the Portfolio’s then current investment advisory agreement. After reviewing these and other factors described below, the Trustees concluded that the advisory fees charged to the Portfolio under the New Agreement represent reasonable compensation in light of the nature and quality of the services being provided by MFS.
In addition, the Trustees considered MFS’ resources and related efforts to continue to retain, attract and motivate capable personnel to serve the Portfolio. The Trustees also considered the financial resources of MFS and its parent, Sun Life Financial Inc. The Trustees further considered any advantages and possible disadvantages of having an adviser which also serves other investment companies as well as institutional accounts.
The Trustees also considered the nature, quality, cost, and extent of administrative, transfer agency, and distribution services provided to the Trust by MFS and its affiliates under agreements and plans other than the New Agreement, including the 12b-1 fees the Portfolio pays to MFS Fund Distributors, Inc., an affiliate of MFS. The Trustees also considered the nature, extent and quality of certain other services MFS performs or arranges on the Portfolio’s behalf, which may include securities lending
28
Table of Contents
MFS International Value Portfolio
Board Approval of New Investment Advisory Agreement – continued
programs, directed expense payment programs, class action recovery programs, and MFS’ interaction with third-party service providers, principally custodians and sub-custodians. The Trustees concluded that the various non-advisory services provided by MFS and its affiliates on behalf of the Portfolio were satisfactory. The Trustees also considered the benefits to MFS from the use of the Portfolio’s portfolio brokerage commissions to pay for investment research and various other factors. Additionally, the Trustees considered so-called “fall-out benefits” to MFS such as reputational value derived from serving as investment manager to the Trust, and determined that any such benefits derived by MFS were reasonable and fair.
Based on their evaluation of factors that they deemed to be material, including those factors described above, the Board of Trustees, including a majority of the independent Trustees, concluded that the New Agreement should be approved for an initial two-year period, commencing upon its effective date, as set forth in the New Agreement.
BOARD APPROVAL OF CONTINUATION OF PRIOR INVESTMENT ADVISORY AGREEMENT
The Investment Company Act of 1940 requires that both the full Board of Trustees and a majority of the non-interested (“independent”) Trustees, voting separately, annually approve the continuation of the investment advisory agreement between MFS Variable Insurance Trust II (the “Trust”) and Massachusetts Financial Services Company (“MFS”) on behalf of the Fund. The Trustees consider matters bearing on the Fund and the advisory arrangements at their meetings throughout the year, including a review of performance data at each regular meeting. In addition, the independent Trustees met in person in May and again in July 2011 (“contract review meetings”) for the specific purpose of considering whether to approve the continuation of the investment advisory agreement for the Fund. The independent Trustees were assisted in their evaluation of the investment advisory agreement by independent legal counsel, from whom they received separate legal advice and with whom they met separately from MFS management during various contract review meetings. The independent Trustees were also assisted in this process by the Fund’s Independent Chief Compliance Officer, a full-time senior officer appointed by and reporting to the independent Trustees.
In connection with their deliberations, the Trustees, including the independent Trustees, considered such information and factors as they believed, in light of the legal advice furnished to them and their own business judgment, to be relevant. The investment advisory agreement was considered separately for the Fund, although the Trustees also took into account the common interests of all Funds in the Trust in their review. As described below, the Trustees considered the nature, quality, and extent of the various investment advisory, administrative, and shareholder services performed by MFS under the existing investment advisory agreement and other arrangements with the Trust.
In connection with their contract review meetings, the Trustees received and relied upon materials which included, among other items: (i) information provided by Lipper Inc. (“Lipper”) on the investment performance of the Fund for various time periods ended December 31, 2010, compared to the investment performance of a group of funds with substantially similar investment classifications/objectives (the “Lipper performance universe”), (ii) information provided by Lipper on the Fund’s advisory fees and other expenses compared to the advisory fees and other expenses of comparable funds identified by Lipper (the “Lipper expense group”), (iii) information provided by MFS on the advisory fees of comparable portfolios of its other clients, including institutional separate account and other clients, (iv) information as to whether, and to what extent applicable, expense waivers, reimbursements or fee “breakpoints” are observed for the Fund, (v) information regarding MFS’ financial results and financial condition, including MFS’ and certain of its affiliates’ estimated profitability from services performed for the Fund and other investment companies that the Board oversees as a whole, and for MFS’ institutional business, (vi) MFS’ views regarding the outlook for the mutual fund industry and its strategic business plans, (vii) descriptions of various functions performed by MFS for the Trust, such as compliance monitoring and portfolio trading practices, and (viii) information regarding the overall organization of MFS, including information about MFS’ senior management and other personnel providing investment advisory, administrative and other services to the Fund. The comparative performance, fee and expense information prepared and provided by Lipper was not independently verified, and the independent Trustees did not independently verify any information provided to them by MFS.
The Trustees’ conclusion as to the continuation of the investment advisory agreement was based on comprehensive consideration of all information provided to the Trustees and was not the result of any single factor. Some of the factors that figured particularly in the Trustees’ deliberations are described below for the Fund, while individual Trustees may have given different weight to various factors and evaluated the information presented as a whole differently than another individual Trustee. The Trustees recognized that the fee arrangements for the Fund reflect years of review and discussion between the independent Trustees and MFS, that certain aspects of such arrangements may receive greater scrutiny in some years than others, and that the Trustees’ conclusions may be based, in part, on their consideration of these same arrangements during the course of the year and in prior years.
29
Table of Contents
MFS International Value Portfolio
Board Approval of Continuation of Prior Investment Advisory Agreement – continued
Based on information provided by Lipper, the Trustees compared the Fund’s total return investment performance to the performance of the Lipper performance universe over various time periods. The Trustees placed particular emphasis on the total return performance of the Fund’s Initial Class shares in comparison to the performance of funds in its Lipper performance universe over the one-, three- and five-year periods ended December 31, 2010. The Trustees did not rely on performance results for more recent periods, including those shown elsewhere in this report.
The Trustees noted the performance of the Fund’s Initial Class shares was in the 1st quintile relative to the other funds in the Lipper performance universe for the one-year period (the 1st quintile being the best performers and the 5th quintile being the worst performers). The total return performance of the Fund was also in the 1st quintile for the three-year and the five-year periods ended December 31, 2010, relative to the Lipper performance universe. Based on the nature and quality of services provided by MFS, the Board of Trustees concluded that the Fund’s performance was satisfactory.
In the course of their deliberations, the Trustees took into account information provided by MFS during contract review meetings, as well as during investment review meetings conducted with portfolio management personnel during the course of the year.
In assessing the reasonableness of the Fund’s advisory fee, the Trustees considered, among other information, the Fund’s advisory fee and the total expense ratio of the Fund’s Initial Class shares as a percentage of average daily net assets, compared to the advisory fee and total expense ratios of its peer group of funds based on information provided by Lipper. The Trustees also considered the advisory fees charged by MFS to institutional accounts. In comparing these fees, the Trustees considered the generally broader scope of services provided by MFS to the Trust than those provided to institutional accounts. The Trustees also considered the higher demands placed on MFS’ investment personnel and trading infrastructure as a result of the daily cash in-flows and out-flows of the Fund, and the impact on MFS and related expenses due to the more extensive regulatory regime to which the Fund is subject, compared to institutional accounts.
In considering the fees, the Trustees noted from the Lipper data (which takes into account any reductions or expense limitations) that the Fund’s effective advisory fee rate and total expense ratio were each above the median of such fees and expenses of funds in the Lipper expense group. The Trustees further concluded that the existing breakpoints were sufficient to allow the Fund to benefit from economies of scale as its assets grow. The Trustees concluded that the fees were reasonable in light of the nature and quality of services provided.
The Trustees also considered information prepared by MFS relating to its costs and profits with respect to the Fund and other investment companies and accounts advised by MFS, as well as MFS’ methodologies used to determine and allocate its costs to the Fund and other accounts and products for purposes of estimating profitability.
After reviewing these and other factors described below, the Trustees concluded that the advisory fees charged to the Fund represent reasonable compensation in light of the nature and quality of the services being provided by MFS.
In addition, the Trustees considered MFS’ resources and related efforts to continue to retain, attract and motivate capable personnel to serve the Fund. The Trustees also considered the financial resources of MFS and its parent, Sun Life Financial Inc. The Trustees further considered any advantages and possible disadvantages of having an adviser which also serves other investment companies as well as institutional accounts.
The Trustees also considered the nature, quality, cost, and extent of administrative, transfer agency, and distribution services provided to the Fund by MFS and its affiliates under agreements and plans other than the investment advisory agreement, including the 12b-1 fees the Fund pays to MFS Fund Distributors, Inc., an affiliate of MFS. The Trustees also considered the nature, extent and quality of certain other services MFS performs or arranges on the Fund’s behalf, which may include securities lending programs, directed expense payment programs, class action recovery programs, and MFS’ interaction with third-party service providers, principally custodians and sub-custodians. The Trustees concluded that the various non-advisory services provided by MFS and its affiliates on behalf of the Fund were satisfactory. The Trustees also considered the benefits to MFS from the use of the Fund’s portfolio brokerage commissions, if applicable, to pay for investment research and various other factors. Additionally, the Trustees considered so-called “fall-out benefits” to MFS such as reputational value derived from serving as investment manager to the Trust, and determined that any such benefits derived by MFS were reasonable and fair.
Based on their evaluation of factors that they deemed to be material, including those factors described above, the Board of Trustees, including a majority of the independent Trustees, concluded that the investment advisory agreement should be continued for an additional one-year period, commencing September 1, 2011.
A discussion regarding the Board’s most recent review and renewal of the fund’s Investment Advisory Agreement with MFS is available by clicking on the fund’s name under “Variable Insurance Portfolios — VIT II” in the “Products and Performance” section of the MFS Web site (mfs.com).
30
Table of Contents
MFS International Value Portfolio
PROXY VOTING POLICIES AND INFORMATION
A general description of the MFS funds’ proxy voting policies and procedures is available without charge, upon request, by calling
1-800-225-2606, by visiting the Proxy Voting section of mfs.com or by visiting the SEC’s Web site at http://www.sec.gov.
Information regarding how the fund voted proxies relating to portfolio securities during the most recent twelve-month period ended June 30 is available without charge by visiting the Proxy Voting section of mfs.com or by visiting the SEC’s Web site at http://www.sec.gov.
QUARTERLY PORTFOLIO DISCLOSURE
The fund will file a complete schedule of portfolio holdings with the Securities and Exchange Commission (the Commission) for the first and third quarters of each fiscal year on Form N-Q. The fund’s Form N-Q is available on the EDGAR database on the Commission’s Internet Web site at http://www.sec.gov and may be reviewed and copied at the:
Public Reference Room
Securities and Exchange Commission
100 F Street, NE, Room 1580
Washington, D.C. 20549
Information on the operation of the Public Reference Room may be obtained by calling the Commission at 1-800-SEC-0330. Copies of the fund’s Form N-Q also may be obtained, upon payment of a duplicating fee, by electronic request at the following e-mail address: publicinfo@sec.gov or by writing the Public Reference Section at the above address.
From time to time, MFS may post important information about the fund or the MFS funds on the MFS web site (mfs.com). This information is available by visiting the “News & Commentary” section of mfs.com or by clicking on the fund’s name under “Variable Insurance Portfolios — VIT II” in the “Products and Performance” section of mfs.com.
FEDERAL TAX INFORMATION (unaudited)
The following information is provided pursuant to provisions of the Internal Revenue Code.
Income derived from foreign sources was $12,846,430. The fund intends to pass through foreign tax credits of $853,857 for the fiscal year.
31
Table of Contents
rev. 3/11

| Why? | Financial companies choose how they share your personal information. Federal law gives consumers the right to limit some but not all sharing. Federal law also requires us to tell you how we collect, share, and protect your personal information. Please read this notice carefully to understand what we do. |
| What? | The types of personal information we collect and share depend on the product or service you have with us. This information can include:
• Social Security number and account balances • Account transactions and transaction history • Checking account information and wire transfer instructions
When you are no longer our customer, we continue to share your information as described in this notice. |
| How? | All financial companies need to share customers’ personal information to run their everyday business. In the section below, we list the reasons financial companies can share their customers’ personal information; the reasons MFS chooses to share; and whether you can limit this sharing. |
| Reasons we can share your personal information | Does MFS share? | Can you limit this sharing? | ||
For our everyday business purposes – such as to process your transactions, maintain your account(s), respond to court orders and legal investigations, or report to credit bureaus | Yes | No | ||
For our marketing purposes – to offer our products and services to you | No | We don’t share | ||
| For joint marketing with other financial companies | No | We don’t share | ||
For our affiliates’ everyday business purposes – information about your transactions and experiences | No | We don’t share | ||
For our affiliates’ everyday business purposes – information about your creditworthiness | No | We don’t share | ||
| For nonaffiliates to market to you | No | We don’t share |
| Questions? | Call 800-225-2606 or go to mfs.com. |
32
Table of Contents
| Page 2 |
| Who we are | ||
| Who is providing this notice? | MFS Funds, MFS Investment Management, MFS Institutional Advisors, Inc., MFS Fund Distributors, Inc., MFS Heritage Trust Company, and MFS Service Center, Inc. | |
| What we do | ||
| How does MFS protect my personal information? | To protect your personal information from unauthorized access and use, we use security measures that comply with federal law. These measures include procedural, electronic, and physical safeguards for the protection of the personal information we collect about you. | |
| How does MFS collect my personal information? | We collect your personal information, for example, when you
• open an account or provide account information • direct us to buy securities or direct us to sell your securities • make a wire transfer
We also collect your personal information from others, such as credit bureaus, affiliates and other companies. | |
| Why can’t I limit all sharing? | Federal law gives you the right to limit only
• sharing for affiliates’ everyday business purposes – information about your creditworthiness • affiliates from using your information to market to you • sharing for nonaffiliates to market to you
State laws and individual companies may give you additional rights to limit sharing. | |
| Definitions | ||
| Affiliates | Companies related by common ownership or control. They can be financial and nonfinancial companies.
• MFS does not share personal information with affiliates, except for everyday business purposes as described on page one of this notice. | |
| Nonaffiliates | Companies not related by common ownership or control. They can be financial and nonfinancial companies.
• MFS does not share with nonaffiliates so they can market to you. | |
| Joint Marketing | A formal agreement between nonaffiliated financial companies that together market financial products or services to you.
• MFS doesn’t jointly market. | |
| Other important information | ||
| If you own an MFS product or receive an MFS service in the name of a third party such as a bank or broker-dealer, their privacy policy may apply to you instead of ours. | ||
33
Table of Contents

Table of Contents

MFS® Blended Research® Growth Portfolio
MFS® Variable Insurance Trust II

ANNUAL REPORT
December 31, 2011
BRG-ANN
Table of Contents
MFS® BLENDED RESEARCH® GROWTH PORTFOLIO
The report is prepared for the general information of contract owners.
It is authorized for distribution to prospective investors only when preceded or accompanied by a current prospectus.
NOT FDIC INSURED Ÿ MAY LOSE VALUE Ÿ NO BANK OR CREDIT UNION GUARANTEE Ÿ NOT A DEPOSIT Ÿ NOT INSURED BY ANY FEDERAL GOVERNMENT AGENCY OR NCUA/NCUSIF
Table of Contents
MFS Blended Research Growth Portfolio
LETTER FROM THE CHAIRMAN AND CEO

Dear Contract Owners:
We are indeed living through some volatile times. Economic uncertainty is everywhere, as it seems no place in the world has been unmoved by crisis. We have seen a devastating earthquake and tsunami that have led to disruptions in the Japanese markets
and supply chains. Protests have changed the face of the Middle East and left in their wake lingering tensions and resultant higher oil prices. We have seen debt limits tested in Europe and the United States and policymakers grappling to craft often unpopular monetary and fiscal responses at a time when consumers and businesses struggle with what appears to be a slowing global economy. On top of all of that, we have seen long-term U.S. debt lose its Standard & Poor’s AAA rating and the long-term debt ratings of 15 eurozone nations put on negative watch.
When markets become volatile, managing risk becomes a top priority for investors and their advisors. At MFS® risk management is foremost in our minds in all market climates. Our analysts and portfolio managers keep risks firmly in mind when evaluating securities. Additionally, we have a team of quantitative analysts that measures and assesses the risk profiles of our portfolios and securities on an ongoing basis. The chief investment risk officer, who oversees the team, reports directly to the firm’s president and chief investment officer so the risk associated with each portfolio can be assessed objectively and independently of the portfolio management team.
As always, we continue to be mindful of the many economic challenges faced at the local, national, and international levels. It is in times such as these that we want to remind investors of the merits of maintaining a long-term view, adhering to basic investing principles such as asset allocation and diversification, and working closely with their advisors to research and identify appropriate investment opportunities.
Respectfully,

Robert J. Manning
Chairman and Chief Executive Officer
MFS Investment Management®
February 15, 2012
The opinions expressed in this letter are subject to change, may not be relied upon for investment advice, and no forecasts can be guaranteed.
1
Table of Contents
MFS Blended Research Growth Portfolio
Portfolio structure

| Top ten holdings | ||||
| Apple, Inc. | 6.6% | |||
| Exxon Mobil Corp. | 5.7% | |||
| Google, Inc., “A” | 3.6% | |||
| Philip Morris International, Inc. | 3.1% | |||
| McDonald’s Corp. | 2.8% | |||
| International Business Machines Corp. | 2.3% | |||
| Abbott Laboratories | 2.3% | |||
| Oracle Corp. | 2.1% | |||
| PepsiCo, Inc. | 1.9% | |||
| Microsoft Corp. | 1.9% |
| Equity sectors | ||||
| Technology | 25.9% | |||
| Health Care | 11.1% | |||
| Energy | 10.6% | |||
| Consumer Staples | 9.9% | |||
| Industrial Goods & Services | 8.6% | |||
| Retailing | 8.1% | |||
| Leisure | 6.4% | |||
| Basic Materials | 5.9% | |||
| Financial Services | 5.3% | |||
| Special Products & Services | 2.6% | |||
| Transportation | 1.8% | |||
| Utilities & Communications | 1.5% | |||
| Autos & Housing | 1.0% |
Percentages are based on net assets as of 12/31/11.
The portfolio is actively managed and current holdings may be different.
2
Table of Contents
MFS Blended Research Growth Portfolio
Summary of Results
For the twelve months ended December 31, 2011, Initial Class shares of the MFS Blended Research Growth Portfolio (the “fund”) provided a total return of 1.96%, while Service Class shares of the fund provided a total return of 1.78%. These compare with a return of 2.64% for the fund’s benchmark, the Russell 1000 Growth Index.
Market Environment
Early in the period, the U.S. Federal Reserve (the “Fed”) responded to weak economic growth by loosening monetary policy further. More easing by the Fed improved market sentiment and drove risk-asset prices markedly higher. The December 2010 agreement on a surprisingly large (relative to expectations) expansionary U.S. fiscal package also boosted sentiment. During the subsequent several months, the renewed positive market sentiment, coupled with better indications of global macroeconomic activity, pushed many asset valuations to post-crisis highs. At the same time, the yields of the perceived “safest” global sovereign credits rose, indicating a renewed risk-seeking environment.
However, towards the middle of the period, a weakening macroeconomic backdrop and renewed concerns over peripheral euro zone sovereign debt caused a flight-to-quality move that pushed high-quality sovereign bond yields lower. In the U.S., concerns about sovereign debt default and the long-term sustainability of the trend in U.S. fiscal policy resulted in one agency downgrading U.S. credit quality. Amidst this turmoil, global equity markets declined sharply. As a result of these developments, global consumer and producer sentiment indicators fell precipitously and highly-rated sovereign bond yields hit multi-decade lows. Towards the end of the reporting period, uncertainty in financial markets spiked higher as markets more seriously contemplated the possible failure of the euro zone.
Detractors from Performance
Stock selection in the industrial goods & services sector detracted from the fund’s performance relative to the Russell 1000 Growth Index. Within this sector, holdings of diversified conglomerate Textron (h) held back relative performance as the stock underperformed the benchmark during the reporting period. Shares declined primarily due to weak demand for the company’s Cessnas, order cancellations, and macroeconomic uncertainty.
Stock selection in the consumer staples sector was another negative area of relative performance. No individual holdings within this sector were among the fund’s top relative detractors.
Individual securities in other sectors that hindered relative results included session border controllers Acme Packet, oilfield services provider Weatherford International, internet retailer Netflix (h), networks storage products company F5 Networks, titanium dioxide producer Kronos Worldwide, and diversified metals and mining company Molycorp (h). The fund’s underweight position in computer and personal electronics maker Apple also held back relative performance as its shares outperformed the benchmark. Shares of Apple climbed throughout the reporting period as the company benefited from record iPhone and iPad sales. Additionally, the fund’s overweight position in poor-performing oilfield services provider Halliburton weighed on relative performance.
The fund’s cash position was also a detractor from relative performance. The fund holds cash to buy new holdings and to provide liquidity. In a period when equity markets rose, as measured by the fund’s benchmark, holding cash hurt performance versus the benchmark, which has no cash position.
Contributors to Performance
Favorable stock selection in the health care sector contributed to the fund’s relative performance. The fund’s ownership in shares of health insurance and Medicare/Medicaid operator UnitedHealth Group (b)(h) contributed to relative returns. Shares of UnitedHealth Group appreciated during the reporting period due to increased market share and contract negotiations that had a higher starting point than their competitors. Additionally, organic growth from the company’s Optum services and physician management segment supported the stock’s positive performance.
Security selection in the energy sector also boosted relative returns during the reporting period. The fund’s underweight position in oilfield services company Schlumberger supported relative results as the stock underperformed the benchmark. Shares of Schlumberger declined as the company reported decreased revenue due to a flattening of pumping prices and overall macroeconomic uncertainty.
Stock selection in the retailing sector aided relative results. The fund’s overweight positions in shares of natural and organic food supermarket Whole Foods Market and department store operator Macy’s were among the top relative contributors. Additionally, holdings of discount retailer Dollar General boosted relative returns during the reporting period.
3
Table of Contents
MFS Blended Research Growth Portfolio
Management Review – continued
Elsewhere, the fund’s holdings of fast food company McDonald’s, media company CBS (h), tobacco company Philip Morris, and speech and imaging software firm Nuance Communications strengthened relative returns. The timing of the fund’s ownership in shares of precious metal company Freeport-McMoRan further supported relative performance.
Respectfully,
Matthew Krummell
Portfolio Manager
| (b) | Security is not a benchmark constituent. |
| (h) | Security was not held in the fund at period end. |
The views expressed in this report are those of the portfolio manager only through the end of the period of the report as stated on the cover and do not necessarily reflect the views of MFS or any other person in the MFS organization. These views are subject to change at any time based on market or other conditions, and MFS disclaims any responsibility to update such views. These views may not be relied upon as investment advice or an indication of trading intent on behalf of any MFS portfolio. References to specific securities are not recommendations of such securities, and may not be representative of any MFS portfolio’s current or future investments.
4
Table of Contents
MFS Blended Research Growth Portfolio
PERFORMANCE SUMMARY THROUGH 12/31/11
The following chart illustrates the historical performance of the fund in comparison to its benchmark(s). Benchmarks are unmanaged and may not be invested in directly. Benchmark returns do not reflect any fees or expenses. The performance of other share classes will be greater than or less than that of the class depicted below. (See Notes to Performance Summary.)
Performance data shown represents past performance and is no guarantee of future results. Investment return and principal value fluctuate so your units, when sold, may be worth more or less than the original cost; current performance may be lower or higher than quoted. The performance shown does not reflect the deduction of taxes, if any, that a contract holder would pay on fund distributions or the redemption of contract units. The returns for the fund shown also do not reflect the deduction of expenses associated with variable products, such as mortality and expense risk charges, separate account charges, and sales charges imposed by the insurance company separate accounts. Such expenses would reduce the overall returns shown.
Growth of a Hypothetical $10,000 Investment (t)
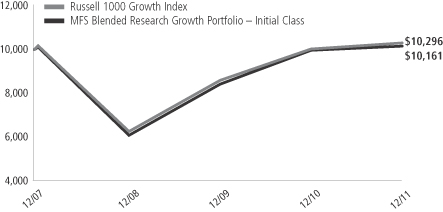
Total Returns through 12/31/11
Average annual total returns
| Share class | Class inception date | 1-yr | Life (t) | |||||||
| Initial Class | 12/18/07 | 1.96% | 0.40% | |||||||
| Service Class | 12/18/07 | 1.78% | 0.16% | |||||||
| Comparative benchmark | ||||||||||
| Russell 1000 Growth Index (f) | 2.64% | 0.72% | ||||||||
| (f) | Source: FactSet Research Systems Inc. |
| (t) | For the period from the class inception date through the stated period end. (See Notes to Performance Summary.) |
Benchmark Definition
Russell 1000 Growth Index – constructed to provide a comprehensive barometer for growth securities in the large-cap segment of the U.S. equity universe. Companies in this index generally have higher price-to-book ratios and higher forecasted growth values.
It is not possible to invest directly in an index.
Notes to Performance Summary
Average annual total return represents the average annual change in value for each share class for the periods presented. Life returns are presented where the share class has less than 10 years of performance history and represent the average annual total return from the class inception date to the stated period end date.
Performance results reflect any applicable expense subsidies and waivers in effect during the periods shown. Without such subsidies and waivers the fund’s performance results would be less favorable. Please see the prospectus and financial statements for complete details. All results are historical and assume the reinvestment of any dividends and capital gains distributions.
Performance results do not include adjustments made for financial reporting purposes in accordance with U.S. generally accepted accounting principles and may differ from amounts reported in the financial highlights.
From time to time the fund may receive proceeds from litigation settlements, without which performance would be lower.
5
Table of Contents
MFS Blended Research Growth Portfolio
Fund Expenses Borne by the Contract Holders During the Period,
July 1, 2011 through December 31, 2011
As a contract holder of the fund, you incur ongoing costs, including management fees; distribution and/or service (12b-1) fees; and other fund expenses. This example is intended to help you understand your ongoing costs (in dollars) of investing in the fund and to compare these costs with the ongoing costs of investing in other mutual funds.
The example is based on an investment of $1,000 invested at the beginning of the period and held for the entire period July 1, 2011 through December 31, 2011.
Actual Expenses
The first line for each share class in the following table provides information about actual account values and actual expenses. You may use the information in this line, together with the amount you invested, to estimate the expenses that you paid over the period. Simply divide your account value by $1,000 (for example, an $8,600 account value divided by $1,000 = 8.6), then multiply the result by the number in the first line under the heading entitled “Expenses Paid During Period” to estimate the expenses you paid on your account during this period.
Hypothetical Example for Comparison Purposes
The second line for each share class in the following table provides information about hypothetical account values and hypothetical expenses based on the fund’s actual expense ratio and an assumed rate of return of 5% per year before expenses, which is not the fund’s actual return. The hypothetical account values and expenses may not be used to estimate the actual ending account balance or expenses you paid for the period. You may use this information to compare the ongoing costs of investing in the fund and other funds. To do so, compare this 5% hypothetical example with the 5% hypothetical examples that appear in the shareholder reports of the other funds.
Please note that the expenses shown in the table are meant to highlight the fund’s ongoing costs only and do not take into account the fees and expenses imposed under the variable contracts through which your investment in the fund is made. Therefore, the second line for each share class in the table is useful in comparing ongoing costs associated with an investment in vehicles (such as the fund) which fund benefits under variable annuity and variable life insurance contracts and to qualified pension and retirement plans only, and will not help you determine the relative total costs of investing in the fund through variable annuity and variable life insurance contracts. If the fees and expenses imposed under the variable contracts were included, your costs would have been higher.
| Share Class | Annualized Expense Ratio | Beginning Account Value 7/01/11 | Ending Account Value | Expenses Paid During Period (p) 7/01/11-12/31/11 | ||||||||||||||
| Initial Class | Actual | 0.60% | $1,000.00 | $944.98 | $2.94 | |||||||||||||
| Hypothetical (h) | 0.60% | $1,000.00 | $1,022.18 | $3.06 | ||||||||||||||
| Service Class | Actual | 0.85% | $1,000.00 | $944.22 | $4.17 | |||||||||||||
| Hypothetical (h) | 0.85% | $1,000.00 | $1,020.92 | $4.33 | ||||||||||||||
| (h) | 5% class return per year before expenses. |
| (p) | Expenses paid is equal to each class’ annualized expense ratio, as shown above, multiplied by the average account value over the period, multiplied by the number of days in the period, divided by the number of days in the year. |
6
Table of Contents
MFS Blended Research Growth Portfolio
PORTFOLIO OF INVESTMENTS – 12/31/11
The Portfolio of Investments is a complete list of all securities owned by your fund. It is categorized by broad-based asset classes.
| Issuer | Shares/Par | Value ($) | ||||||
| COMMON STOCKS – 98.7% | ||||||||
| Aerospace – 2.6% | ||||||||
| Lockheed Martin Corp. | 490 | $ | 39,641 | |||||
| Northrop Grumman Corp. | 509 | 29,766 | ||||||
| United Technologies Corp. | 124 | 9,063 | ||||||
|
| |||||||
| $ | 78,470 | |||||||
|
| |||||||
| Apparel Manufacturers – 0.3% | ||||||||
| Polo Ralph Lauren Corp. | 58 | $ | 8,009 | |||||
|
| |||||||
| Automotive – 1.0% | ||||||||
| LKQ Corp. (a) | 986 | $ | 29,659 | |||||
|
| |||||||
| Biotechnology – 2.6% | ||||||||
| Amgen, Inc. | 551 | $ | 35,380 | |||||
| Gilead Sciences, Inc. (a) | 1,061 | 43,427 | ||||||
|
| |||||||
| $ | 78,807 | |||||||
|
| |||||||
| Brokerage & Asset Managers – 0.6% | ||||||||
| NASDAQ OMX Group, Inc. (a) | 781 | $ | 19,142 | |||||
|
| |||||||
| Business Services – 1.9% | ||||||||
| Accenture PLC, “A” | 640 | $ | 34,067 | |||||
| Alliance Data Systems Corp. (a) | 158 | 16,407 | ||||||
| Cognizant Technology Solutions Corp., “A” (a) | 98 | 6,302 | ||||||
|
| |||||||
| $ | 56,776 | |||||||
|
| |||||||
| Cable TV – 2.4% | ||||||||
| DIRECTV, “A” (a) | 570 | $ | 24,373 | |||||
| Time Warner Cable, Inc. | 429 | 27,272 | ||||||
| Virgin Media, Inc. | 986 | 21,081 | ||||||
|
| |||||||
| $ | 72,726 | |||||||
|
| |||||||
| Chemicals – 2.5% | ||||||||
| 3M Co. | 259 | $ | 21,168 | |||||
| CF Industries Holdings, Inc. | 161 | 23,342 | ||||||
| PPG Industries, Inc. | 365 | 30,474 | ||||||
|
| |||||||
| $ | 74,984 | |||||||
|
| |||||||
| Computer Software – 8.2% | ||||||||
| Autodesk, Inc. (a) | 383 | $ | 11,616 | |||||
| Microsoft Corp. | 2,192 | 56,904 | ||||||
| Nuance Communications, Inc. (a) | 1,690 | 42,520 | ||||||
| Oracle Corp. | 2,419 | 62,047 | ||||||
| Red Hat, Inc. (a) | 612 | 25,269 | ||||||
| TIBCO Software, Inc. (a) | 391 | 9,349 | ||||||
| VeriSign, Inc. | 1,035 | 36,970 | ||||||
|
| |||||||
| $ | 244,675 | |||||||
|
| |||||||
| Computer Software – Systems – 8.9% | ||||||||
| Apple, Inc. (a) | 482 | $ | 195,210 | |||||
| International Business Machines Corp. | 378 | 69,507 | ||||||
|
| |||||||
| $ | 264,717 | |||||||
|
| |||||||
| Consumer Products – 0.7% | ||||||||
| Avon Products, Inc. | 783 | $ | 13,679 | |||||
| Colgate-Palmolive Co. | 62 | 5,728 | ||||||
|
| |||||||
| $ | 19,407 | |||||||
|
| |||||||
| Issuer | Shares/Par | Value ($) | ||||||
| COMMON STOCKS – continued | ||||||||
| Consumer Services – 0.7% | ||||||||
| Apollo Group, Inc., “A” (a) | 405 | $ | 21,817 | |||||
|
| |||||||
| Electrical Equipment – 0.8% | ||||||||
| Danaher Corp. | 338 | $ | 15,900 | |||||
| Tyco International Ltd. | 196 | 9,155 | ||||||
|
| |||||||
| $ | 25,055 | |||||||
|
| |||||||
| Electronics – 2.6% | ||||||||
| Intel Corp. | 1,382 | $ | 33,514 | |||||
| Jabil Circuit, Inc. | 1,045 | 20,545 | ||||||
| Microchip Technology, Inc. | 630 | 23,077 | ||||||
|
| |||||||
| $ | 77,136 | |||||||
|
| |||||||
| Energy – Independent – 1.4% | ||||||||
| Cabot Oil & Gas Corp. | 379 | $ | 28,766 | |||||
| HollyFrontier Corp. | 511 | 11,957 | ||||||
|
| |||||||
| $ | 40,723 | |||||||
|
| |||||||
| Energy – Integrated – 6.9% | ||||||||
| Chevron Corp. | 330 | $ | 35,112 | |||||
| Exxon Mobil Corp. | 2,013 | 170,622 | ||||||
|
| |||||||
| $ | 205,734 | |||||||
|
| |||||||
| Engineering – Construction – 0.8% | ||||||||
| Fluor Corp. | 478 | $ | 24,020 | |||||
|
| |||||||
| Food & Beverages – 6.1% | ||||||||
| Coca-Cola Co. | 462 | $ | 32,326 | |||||
| Coca-Cola Enterprises, Inc. | 1,191 | 30,704 | ||||||
| Dr Pepper Snapple Group, Inc. | 806 | 31,821 | ||||||
| General Mills, Inc. | 692 | 27,964 | ||||||
| PepsiCo, Inc. | 869 | 57,658 | ||||||
|
| |||||||
| $ | 180,473 | |||||||
|
| |||||||
| Food & Drug Stores – 2.2% | ||||||||
| CVS Caremark Corp. | 782 | $ | 31,890 | |||||
| Whole Foods Market, Inc. | 468 | 32,563 | ||||||
|
| |||||||
| $ | 64,453 | |||||||
|
| |||||||
| Gaming & Lodging – 0.7% | ||||||||
| Wynn Resorts Ltd. | 190 | $ | 20,993 | |||||
|
| |||||||
| General Merchandise – 2.9% | ||||||||
| Dollar General Corp. (a) | 692 | $ | 28,469 | |||||
| Kohl’s Corp. | 280 | 13,818 | ||||||
| Macy’s, Inc. | 1,378 | 44,344 | ||||||
|
| |||||||
| $ | 86,631 | |||||||
|
| |||||||
| Health Maintenance Organizations – 1.1% | ||||||||
| Aetna, Inc. | 768 | $ | 32,402 | |||||
|
| |||||||
| Insurance – 1.2% | ||||||||
| Aflac, Inc. | 292 | $ | 12,632 | |||||
| Everest Re Group Ltd. | 153 | 12,866 | ||||||
| Hartford Financial Services Group, Inc. | 597 | 9,701 | ||||||
|
| |||||||
| $ | 35,199 | |||||||
|
| |||||||
7
Table of Contents
MFS Blended Research Growth Portfolio
Portfolio of Investments – continued
| Issuer | Shares/Par | Value ($) | ||||||
| COMMON STOCKS – continued | ||||||||
| Internet - 3.6% | ||||||||
| Google, Inc., “A” (a) | 168 | $ | 108,511 | |||||
|
| |||||||
| Leisure & Toys – 0.5% | ||||||||
| Mattel, Inc. | 500 | $ | 13,880 | |||||
|
| |||||||
| Machinery & Tools – 3.7% | ||||||||
| Cummins, Inc. | 402 | $ | 35,384 | |||||
| Joy Global, Inc. | 337 | 25,265 | ||||||
| Kennametal, Inc. | 461 | 16,836 | ||||||
| Pitney Bowes, Inc. | 1,009 | 18,707 | ||||||
| Sauer-Danfoss, Inc. (a) | 362 | 13,108 | ||||||
|
| |||||||
| $ | 109,300 | |||||||
|
| |||||||
| Medical & Health Technology & Services – 1.6% | ||||||||
| HCA Holdings, Inc. (a) | 755 | $ | 16,633 | |||||
| McKesson Corp. | 411 | 32,021 | ||||||
|
| |||||||
| $ | 48,654 | |||||||
|
| |||||||
| Medical Equipment – 2.0% | ||||||||
| Medtronic, Inc. | 784 | $ | 29,988 | |||||
| St. Jude Medical, Inc. | 147 | 5,042 | ||||||
| Thermo Fisher Scientific, Inc. (a) | 532 | 23,924 | ||||||
|
| |||||||
| $ | 58,954 | |||||||
|
| |||||||
| Metals & Mining – 1.3% | ||||||||
| Cliffs Natural Resources, Inc. | 551 | $ | 34,355 | |||||
| Freeport-McMoRan Copper & Gold, Inc. | 157 | 5,776 | ||||||
|
| |||||||
| $ | 40,131 | |||||||
|
| |||||||
| Network & Telecom – 2.6% | ||||||||
| Acme Packet, Inc. (a) | 346 | $ | 10,695 | |||||
| F5 Networks, Inc. (a) | 262 | 27,803 | ||||||
| Fortinet, Inc. (a) | 767 | 16,728 | ||||||
| Polycom, Inc. (a) | 1,102 | 17,963 | ||||||
| Qualcomm, Inc. | 81 | 4,431 | ||||||
|
| |||||||
| $ | 77,620 | |||||||
|
| |||||||
| Oil Services – 2.3% | ||||||||
| Halliburton Co. | 983 | $ | 33,923 | |||||
| Schlumberger Ltd. | 218 | 14,892 | ||||||
| Weatherford International Ltd. (a) | 1,269 | 18,578 | ||||||
|
| |||||||
| $ | 67,393 | |||||||
|
| |||||||
| Other Banks & Diversified Financials – 2.5% | ||||||||
| Citigroup, Inc. | 1,029 | $ | 27,073 | |||||
| Discover Financial Services | 1,232 | 29,568 | ||||||
| MasterCard, Inc., “A” | 47 | 17,523 | ||||||
|
| |||||||
| $ | 74,164 | |||||||
|
| |||||||
| Issuer | Shares/Par | Value ($) | ||||||
| COMMON STOCKS – continued | ||||||||
| Pharmaceuticals – 3.8% | ||||||||
| Abbott Laboratories | 1,223 | $ | 68,769 | |||||
| Johnson & Johnson | 661 | 43,348 | ||||||
|
| |||||||
| $ | 112,117 | |||||||
|
| |||||||
| Pollution Control – 0.7% | ||||||||
| Republic Services, Inc. | 781 | $ | 21,517 | |||||
|
| |||||||
| Real Estate – 1.0% | ||||||||
| Public Storage, Inc., REIT | 231 | $ | 31,060 | |||||
|
| |||||||
| Restaurants – 2.8% | ||||||||
| McDonald’s Corp. | 838 | $ | 84,077 | |||||
|
| |||||||
| Specialty Chemicals – 2.1% | ||||||||
| Air Products & Chemicals, Inc. | 140 | $ | 11,927 | |||||
| Airgas, Inc. | 473 | 36,932 | ||||||
| Kronos Worldwide, Inc. | 784 | 14,143 | ||||||
|
| |||||||
| $ | 63,002 | |||||||
|
| |||||||
| Specialty Stores – 2.7% | ||||||||
| IAC/InterActiveCorp | 264 | $ | 11,246 | |||||
| O’Reilly Automotive, Inc. (a) | 197 | 15,750 | ||||||
| Ross Stores, Inc. | 340 | 16,160 | ||||||
| Tractor Supply Co. | 510 | 35,777 | ||||||
|
| |||||||
| $ | 78,933 | |||||||
|
| |||||||
| Telephone Services – 0.9% | ||||||||
| American Tower Corp., “A” (a) | 436 | $ | 26,164 | |||||
|
| |||||||
| Tobacco – 3.1% | ||||||||
| Philip Morris International, Inc. | 1,184 | $ | 92,920 | |||||
|
| |||||||
| Trucking – 1.8% | ||||||||
| United Parcel Service, Inc., “B” | 717 | $ | 52,477 | |||||
|
| |||||||
| Utilities – Electric Power – 0.6% | ||||||||
| AES Corp. (a) | 1,459 | $ | 17,275 | |||||
|
| |||||||
| Total Common Stocks (Identified Cost, $2,758,253) | $ | 2,940,157 | ||||||
|
| |||||||
| MONEY MARKET FUNDS – 2.1% | ||||||||
| MFS Institutional Money Market Portfolio, 0.05%, at Cost and Net Asset Value (v) | 64,047 | $ | 64,047 | |||||
|
| |||||||
| Total Investments (Identified Cost, $2,822,300) | $ | 3,004,204 | ||||||
|
| |||||||
| OTHER ASSETS, LESS LIABILITIES – (0.8)% | (24,066 | ) | ||||||
|
| |||||||
| Net Assets – 100.0% | $ | 2,980,138 | ||||||
|
| |||||||
| (a) | Non-income producing security. |
| (v) | Underlying affiliated fund that is available only to investment companies managed by MFS. The rate quoted for the MFS Institutional Money Market Portfolio is the annualized seven-day yield of the fund at period end. |
The following abbreviations are used in this report and are defined:
| PLC | Public Limited Company |
| REIT | Real Estate Investment Trust |
See Notes to Financial Statements
8
Table of Contents
MFS Blended Research Growth Portfolio
FINANCIAL STATEMENTS | STATEMENT OF ASSETS AND LIABILITIES
This statement represents your fund’s balance sheet, which details the assets and liabilities comprising the total value of the fund.
At 12/31/11 | ||||||||
Assets | ||||||||
Investments – | ||||||||
Non-affiliated issuers, at value (identified cost, $2,758,253) | $2,940,157 | |||||||
Underlying affiliated funds, at cost and value | 64,047 | |||||||
Total investments, at value (identified cost, $2,822,300) | $3,004,204 | |||||||
Receivable for dividends | 2,596 | |||||||
Receivable from investment adviser | 4,517 | |||||||
Other assets | 232 | |||||||
Total assets | $3,011,549 | |||||||
Liabilities | ||||||||
Payable to affiliates | ||||||||
Shareholder servicing costs | $2 | |||||||
Distribution and/or service fees | 9 | |||||||
Payable for Trustees’ compensation | 14 | |||||||
Accrued expenses and other liabilities | 31,386 | |||||||
Total liabilities | $31,411 | |||||||
Net assets | $2,980,138 | |||||||
Net assets consist of | ||||||||
Paid-in capital | $3,160,013 | |||||||
Unrealized appreciation (depreciation) on investments | 181,904 | |||||||
Accumulated net realized gain (loss) on investments | (361,779 | ) | ||||||
Net assets | $2,980,138 | |||||||
Shares of beneficial interest outstanding | 308,038 |
| Net assets | Shares outstanding | Net asset value per share | ||||||||||
Initial Class | $2,540,603 | 262,975 | $9.66 | |||||||||
Service Class | 439,535 | 45,063 | 9.75 | |||||||||
See Notes to Financial Statements
9
Table of Contents
MFS Blended Research Growth Portfolio
FINANCIAL STATEMENTS | STATEMENT OF OPERATIONS
This statement describes how much your fund earned in investment income and accrued in expenses. It also describes any gains and/or losses generated by fund operations.
Year ended 12/31/11 | ||||||||
Net investment income | ||||||||
Income | ||||||||
Dividends | $69,320 | |||||||
Dividends from underlying affiliated funds | 72 | |||||||
Total investment income | $69,392 | |||||||
Expenses | ||||||||
Management fee | $26,986 | |||||||
Distribution and/or service fees | 4,845 | |||||||
Shareholder servicing costs | 493 | |||||||
Administrative services fee | 17,500 | |||||||
Trustees’ compensation | 571 | |||||||
Custodian fee | 2,811 | |||||||
Shareholder communications | 4,580 | |||||||
Auditing fees | 45,408 | |||||||
Legal fees | 5,348 | |||||||
Miscellaneous | 8,433 | |||||||
Total expenses | $116,975 | |||||||
Fees paid indirectly | (1 | ) | ||||||
Reduction of expenses by investment adviser | (85,111 | ) | ||||||
Net expenses | $31,863 | |||||||
Net investment income | $37,529 | |||||||
Realized and unrealized gain (loss) on investments | ||||||||
Realized gain (loss) on investment transactions (identified cost basis) | $499,120 | |||||||
Change in unrealized appreciation (depreciation) on investments | $(519,809 | ) | ||||||
Net realized and unrealized gain (loss) on investments | $(20,689 | ) | ||||||
Change in net assets from operations | $16,840 |
See Notes to Financial Statements
10
Table of Contents
MFS Blended Research Growth Portfolio
FINANCIAL STATEMENTS | STATEMENTS OF CHANGES IN NET ASSETS
These statements describe the increases and/or decreases in net assets resulting from operations, any distributions, and any shareholder transactions.
For years ended 12/31 | 2011 | 2010 | ||||||
Change in net assets | ||||||||
From operations | ||||||||
Net investment income | $37,529 | $50,689 | ||||||
Net realized gain (loss) on investments | 499,120 | 259,981 | ||||||
Net unrealized gain (loss) on investments | (519,809 | ) | 452,163 | |||||
Change in net assets from operations | $16,840 | $762,833 | ||||||
Distributions declared to shareholders | ||||||||
From net investment income | $(43,605 | ) | $(50,602 | ) | ||||
Total distributions declared to shareholders | $(43,605 | ) | $(50,602 | ) | ||||
Change in net assets from fund share transactions | $(1,956,395 | ) | $50,602 | |||||
Total change in net assets | $(1,983,160 | ) | $762,833 | |||||
Net assets | ||||||||
At beginning of period | 4,963,298 | 4,200,465 | ||||||
At end of period (including undistributed net investment income of $0 and | $2,980,138 | $4,963,298 |
See Notes to Financial Statements
11
Table of Contents
MFS Blended Research Growth Portfolio
FINANCIAL STATEMENTS | FINANCIAL HIGHLIGHTS
The financial highlights table is intended to help you understand the fund’s financial performance for the past 5 years (or life of a particular share class, if shorter). Certain information reflects financial results for a single fund share. The total returns in the table represent the rate by which an investor would have earned (or lost) on an investment in the fund share class (assuming reinvestment of all distributions) held for the entire period.
| Initial Class | Years ended 12/31 | |||||||||||||||||||
| 2011 | 2010 | 2009 | 2008 | 2007 (c) | ||||||||||||||||
Net asset value, beginning of period | $9.63 | $8.23 | $6.01 | $10.11 | $10.00 | |||||||||||||||
| Income (loss) from investment operations | ||||||||||||||||||||
Net investment income (d) | $0.09 | $0.11 | $0.09 | $0.07 | $0.00 | (w) | ||||||||||||||
Net realized and unrealized gain (loss) on investments | 0.10 | 1.40 | 2.22 | (4.10 | ) | 0.11 | ||||||||||||||
Total from investment operations | $0.19 | $1.51 | $2.31 | $(4.03 | ) | $0.11 | ||||||||||||||
| Less distributions declared to shareholders | ||||||||||||||||||||
From net investment income | $(0.16 | ) | $(0.11 | ) | $(0.09 | ) | $(0.07 | ) | $(0.00 | )(w) | ||||||||||
From tax return of capital | — | — | (0.00 | )(w) | (0.00 | )(w) | (0.00 | )(w) | ||||||||||||
Total distributions declared to shareholders | $(0.16 | ) | $(0.11 | ) | $(0.09 | ) | $(0.07 | ) | $(0.00 | )(w) | ||||||||||
Net asset value, end of period (x) | $9.66 | $9.63 | $8.23 | $6.01 | $10.11 | |||||||||||||||
Total return (%) (k)(r)(s)(x) | 1.96 | 18.35 | 38.42 | (39.84 | ) | 1.13 | (n) | |||||||||||||
| Ratios (%) (to average net assets) and Supplemental data: | ||||||||||||||||||||
Expenses before expense reductions (f) | 2.57 | 2.52 | 2.85 | 2.87 | 10.74 | (a) | ||||||||||||||
Expenses after expense reductions (f) | 0.60 | 0.60 | 0.60 | 0.60 | 0.60 | (a) | ||||||||||||||
Net investment income | 0.94 | 1.28 | 1.30 | 0.83 | 0.81 | (a) | ||||||||||||||
Portfolio turnover | 76 | 83 | 74 | 50 | 0 | |||||||||||||||
Net assets at end of period (000 omitted) | $2,541 | $2,491 | $2,106 | $1,521 | $2,528 | |||||||||||||||
See Notes to Financial Statements
12
Table of Contents
MFS Blended Research Growth Portfolio
Financial Highlights – continued
| Service Class | Years ended 12/31 | |||||||||||||||||||
| 2011 | 2010 | 2009 | 2008 | 2007 (c) | ||||||||||||||||
Net asset value, beginning of period | $9.63 | $8.24 | $6.02 | $10.11 | $10.00 | |||||||||||||||
| Income (loss) from investment operations | ||||||||||||||||||||
Net investment income (d) | $0.07 | $0.09 | $0.07 | $0.05 | $0.00 | (w) | ||||||||||||||
Net realized and unrealized gain (loss) on investments | 0.10 | 1.39 | 2.22 | (4.09 | ) | 0.11 | ||||||||||||||
Total from investment operations | $0.17 | $1.48 | $2.29 | $(4.04 | ) | $0.11 | ||||||||||||||
| Less distributions declared to shareholders | ||||||||||||||||||||
From net investment income | $(0.05 | ) | $(0.09 | ) | $(0.07 | ) | $(0.05 | ) | $(0.00 | )(w) | ||||||||||
From tax return of capital | — | — | (0.00 | )(w) | (0.00 | )(w) | (0.00 | )(w) | ||||||||||||
Total distributions declared to shareholders | $(0.05 | ) | $(0.09 | ) | $(0.07 | ) | $(0.05 | ) | $(0.00 | )(w) | ||||||||||
Net asset value, end of period (x) | $9.75 | $9.63 | $8.24 | $6.02 | $10.11 | |||||||||||||||
Total return (%) (k)(r)(s)(x) | 1.78 | 17.94 | 38.07 | (39.96 | ) | 1.13 | (n) | |||||||||||||
| Ratios (%) (to average net assets) and Supplemental data: | ||||||||||||||||||||
Expenses before expense reductions (f) | 2.65 | 2.77 | 3.10 | 3.12 | 10.99 | (a) | ||||||||||||||
Expenses after expense reductions (f) | 0.85 | 0.85 | 0.85 | 0.85 | 0.85 | (a) | ||||||||||||||
Net investment income | 0.70 | 1.03 | 1.05 | 0.58 | 0.56 | (a) | ||||||||||||||
Portfolio turnover | 76 | 83 | 74 | 50 | 0 | |||||||||||||||
Net assets at end of period (000 omitted) | $440 | $2,472 | $2,095 | $1,517 | $2,528 | |||||||||||||||
| (a) | Annualized. |
| (c) | For the period from the commencement of the fund’s investment operations, December 18, 2007, through the stated period end. |
| (d) | Per share data is based on average shares outstanding. |
| (f) | Ratios do not reflect reductions from fees paid indirectly, if applicable. |
| (k) | The total return does not reflect expenses that apply to separate accounts. Inclusion of these charges would reduce the total return figures for all periods shown. |
| (n) | Not annualized. |
| (r) | Certain expenses have been reduced without which performance would have been lower. |
| (s) | From time to time the fund may receive proceeds from litigation settlements, without which performance would be lower. |
| (w) | Per share amount was less than $0.01. |
| (x) | The net asset values per share and total returns have been calculated on net assets which include adjustments made in accordance with U.S. generally accepted accounting principles required at period end for financial reporting purposes. |
See Notes to Financial Statements
13
Table of Contents
MFS Blended Research Growth Portfolio
| (1) | Business and Organization |
MFS Blended Research Growth Portfolio (the fund) is a series of MFS Variable Insurance Trust II (the trust). The trust is organized as a Massachusetts business trust and is registered under the Investment Company Act of 1940, as amended, as an open-end management investment company. The shareholders of each series of the trust are separate accounts of insurance companies, which offer variable annuity and/or life insurance products, and qualified retirement and pension plans.
| (2) | Significant Accounting Policies |
General – The preparation of financial statements in conformity with U.S. generally accepted accounting principles requires management to make estimates and assumptions that affect the reported amounts of assets and liabilities, and disclosure of contingent assets and liabilities at the date of the financial statements and the reported amounts of revenues and expenses during the reporting period. Actual results could differ from those estimates. In the preparation of these financial statements, management has evaluated subsequent events occurring after the date of the fund’s Statement of Assets and Liabilities through the date that the financial statements were issued.
In December 2011, the Financial Accounting Standards Board issued Accounting Standards Update 2011-11, Balance Sheet (Topic 210) – Disclosures about Offsetting Assets and Liabilities (“ASU 2011-11”). Effective for annual reporting periods beginning on or after January 1, 2013 and interim periods within those annual periods, ASU 2011-11 is intended to enhance disclosure requirements on the offsetting of financial assets and liabilities. Although still evaluating the potential impacts of ASU 2011-11 to the fund, management expects that the impact of the fund’s adoption will be limited to additional financial statement disclosures.
Investment Valuations – Equity securities, including restricted equity securities, are generally valued at the last sale or official closing price as provided by a third-party pricing service on the market or exchange on which they are primarily traded. Equity securities, for which there were no sales reported that day, are generally valued at the last quoted daily bid quotation as provided by a third-party pricing service on the market or exchange on which such securities are primarily traded. Equity securities held short, for which there were no sales reported for that day, are generally valued at the last quoted daily ask quotation as provided by a third-party pricing service on the market or exchange on which such securities are primarily traded. Short-term instruments with a maturity at issuance of 60 days or less generally are valued at amortized cost, which approximates market value. Open-end investment companies are generally valued at net asset value per share. Securities and other assets generally valued on the basis of information from a third-party pricing service may also be valued at a broker/dealer bid quotation. Values obtained from third-party pricing services can utilize both transaction data and market information such as yield, quality, coupon rate, maturity, type of issue, trading characteristics, and other market data.
The Board of Trustees has delegated primary responsibility for determining or causing to be determined the value of the fund’s investments (including any fair valuation) to the adviser pursuant to valuation policies and procedures approved by the Board. If the adviser determines that reliable market quotations are not readily available, investments are valued at fair value as determined in good faith by the adviser in accordance with such procedures under the oversight of the Board of Trustees. Under the fund’s valuation policies and procedures, market quotations are not considered to be readily available for most types of debt instruments and floating rate loans and many types of derivatives. These investments are generally valued at fair value based on information from third-party pricing services. In addition, investments may be valued at fair value if the adviser determines that an investment’s value has been materially affected by events occurring after the close of the exchange or market on which the investment is principally traded (such as foreign exchange or market) and prior to the determination of the fund’s net asset value, or after the halting of trading of a specific security where trading does not resume prior to the close of the exchange or market on which the security is principally traded. Events that occur on a frequent basis after foreign markets close (such as developments in foreign markets and significant movements in the U.S. markets) and prior to the determination of the fund’s net asset value may be deemed to have a material effect on the value of securities traded in foreign markets. Accordingly, the fund’s foreign equity securities may often be valued at fair value. The adviser generally relies on third-party pricing services or other information (such as the correlation with price movements of similar securities in the same or other markets; the type, cost and investment characteristics of the security; the business and financial condition of the issuer; and trading and other market data) to assist in determining whether to fair value and at what value to fair value an investment. The value of an investment for purposes of calculating the fund’s net asset value can differ depending on the source and method used to determine value. When fair valuation is used, the value of an investment used to determine the fund’s net asset value may differ from quoted or published prices for the same investment. There can be no assurance that the fund could obtain the fair value assigned to an investment if it were to sell the investment at the same time at which the fund determines its net asset value per share.
14
Table of Contents
MFS Blended Research Growth Portfolio
Notes to Financial Statements – continued
Various inputs are used in determining the value of the fund’s assets or liabilities. These inputs are categorized into three broad levels. In certain cases, the inputs used to measure fair value may fall into different levels of the fair value hierarchy. In such cases, an investment’s level within the fair value hierarchy is based on the lowest level of input that is significant to the fair value measurement. The fund’s assessment of the significance of a particular input to the fair value measurement in its entirety requires judgment, and considers factors specific to the investment. Level 1 includes unadjusted quoted prices in active markets for identical assets or liabilities. Level 2 includes other significant observable market-based inputs (including quoted prices for similar securities, interest rates, prepayment speed, and credit risk). Level 3 includes unobservable inputs, which may include the adviser’s own assumptions in determining the fair value of investments. The following is a summary of the levels used as of December 31, 2011 in valuing the fund’s assets or liabilities:
| Investments at Value | Level 1 | Level 2 | Level 3 | Total | ||||||||||||
| Equity Securities | $2,940,157 | $— | $— | $2,940,157 | ||||||||||||
| Mutual Funds | 64,047 | — | — | 64,047 | ||||||||||||
| Total Investments | $3,004,204 | $— | $— | $3,004,204 | ||||||||||||
For further information regarding security characteristics, see the Portfolio of Investments.
Indemnifications – Under the fund’s organizational documents, its officers and Trustees may be indemnified against certain liabilities and expenses arising out of the performance of their duties to the fund. Additionally, in the normal course of business, the fund enters into agreements with service providers that may contain indemnification clauses. The fund’s maximum exposure under these agreements is unknown as this would involve future claims that may be made against the fund that have not yet occurred.
Investment Transactions and Income – Investment transactions are recorded on the trade date. Dividends received in cash are recorded on the ex-dividend date. Certain dividends from foreign securities will be recorded when the fund is informed of the dividend if such information is obtained subsequent to the ex-dividend date. Dividend and interest payments received in additional securities are recorded on the ex-dividend or ex-interest date in an amount equal to the value of the security on such date.
The fund may receive proceeds from litigation settlements. Any proceeds received from litigation involving portfolio holdings are reflected in the Statement of Operations in realized gain/loss if the security has been disposed of by the fund or in unrealized gain/loss if the security is still held by the fund. Any other proceeds from litigation not related to portfolio holdings are reflected as other income in the Statement of Operations.
Fees Paid Indirectly – The fund’s custody fee may be reduced according to an arrangement that measures the value of cash deposited with the custodian by the fund. This amount, for the year ended December 31, 2011, is shown as a reduction of total expenses on the Statement of Operations.
Tax Matters and Distributions – The fund intends to qualify as a regulated investment company, as defined under Subchapter M of the Internal Revenue Code, and to distribute all of its taxable income, including realized capital gains. As a result, no provision for federal income tax is required. The fund’s federal tax returns for the prior three fiscal years remain subject to examination by the Internal Revenue Service.
Distributions to shareholders are recorded on the ex-dividend date. Income and capital gain distributions are determined in accordance with income tax regulations, which may differ from U.S. generally accepted accounting principles. Certain capital accounts in the financial statements are periodically adjusted for permanent differences in order to reflect their tax character. These adjustments have no impact on net assets or net asset value per share. Temporary differences which arise from recognizing certain items of income, expense, gain or loss in different periods for financial statement and tax purposes will reverse at some time in the future. Distributions in excess of net investment income or net realized gains are temporary overdistributions for financial statement purposes resulting from differences in the recognition or classification of income or distributions for financial statement and tax purposes.
Book/tax differences primarily relate to wash sale loss deferrals.
The tax character of distributions declared to shareholders for the last two fiscal years is as follows:
| 12/31/11 | 12/31/10 | |||||||
| Ordinary income (including any short-term capital gains) (a) | $43,605 | $50,602 | ||||||
| (a) | Included in the fund’s distribution from ordinary income for the year ended December 31, 2011 is $5,989 in excess of investment company taxable income which, in accordance with applicable U.S. tax law, is taxable to shareholders as ordinary income distributions. |
15
Table of Contents
MFS Blended Research Growth Portfolio
Notes to Financial Statements – continued
The federal tax cost and the tax basis components of distributable earnings were as follows:
| As of 12/31/11 | ||||
| Cost of investments | $2,825,620 | |||
| Gross appreciation | 362,978 | |||
| Gross depreciation | (184,394 | ) | ||
| Net unrealized appreciation (depreciation) | $178,584 | |||
| Capital loss carryforwards | (334,170 | ) | ||
| Post-October capital loss deferral | (24,289 | ) |
Under the Regulated Investment Company Modernization Act of 2010 (the “Act”), net capital losses recognized after December 31, 2010 may be carried forward indefinitely, and their character is retained as short-term and/or long-term losses. Previously, net capital losses were carried forward for eight years and treated as short-term losses. As a transition rule, the Act requires that post-enactment net capital losses be used before pre-enactment net capital losses.
As of December 31, 2011, the fund had capital loss carryforwards available to offset future realized gains. Such losses expire as follows:
| Pre-enactment losses: | ||||
| 12/31/17 | $(334,170 | ) |
Multiple Classes of Shares of Beneficial Interest – The fund offers multiple classes of shares, which differ in their respective distribution and/or service fees. The fund’s income, realized and unrealized gain (loss), and common expenses are allocated to shareholders based on the daily net assets of each class. Dividends are declared separately for each class. Differences in per share dividend rates are generally due to differences in separate class expenses. The fund’s distributions declared to shareholders as reported on the Statements of Changes in Net Assets are presented by class as follows:
| From net investment income | ||||||||
| Year ended 12/31/11 | Year ended 12/31/10 | |||||||
| Initial Class | $41,259 | $28,122 | ||||||
| Service Class | 2,346 | 22,480 | ||||||
| Total | $43,605 | $50,602 | ||||||
| (3) | Transactions with Affiliates |
Investment Adviser – The fund has an investment advisory agreement with MFS to provide overall investment management and related administrative services and facilities to the fund. The management fee is computed daily and paid monthly at an annual rate of 0.60% of the fund’s average daily net assets.
The investment adviser has agreed in writing to pay a portion of the fund’s total annual operating expenses, exclusive of interest, taxes, extraordinary expenses, brokerage and transaction costs and investment-related expenses, such that total annual operating expenses do not exceed 0.60% of average daily net assets for the Initial Class shares and 0.85% of average daily net assets for the Service Class shares. This written agreement will continue until April 30, 2013. For the year ended December 31,2011, this reduction amounted to $85,111 and is reflected as a reduction of total expenses in the Statements of Operations.
Distributor – MFS Fund Distributors, Inc. (MFD), a wholly-owned subsidiary of MFS, is the distributor of shares of the fund. The Trustees have adopted a distribution plan for the Service Class shares pursuant to Rule 12b-1 under the Investment Company Act of 1940.
The fund’s distribution plan provides that the fund will pay MFD distribution and/or service fees equal to 0.25% per annum of its average daily net assets attributable to Service Class shares as partial consideration for services performed and expenses incurred by MFD and financial intermediaries (including participating insurance companies that invest in the fund to fund variable annuity and variable life insurance contracts, sponsors of qualified retirement and pension plans that invest in the fund, and affiliates of these participating insurance companies and plan sponsors) in connection with the sale and distribution of the Service Class shares. MFD may subsequently pay all, or a portion, of the distribution and/or service fees to financial intermediaries.
Shareholder Servicing Agent – MFS Service Center, Inc. (MFSC), a wholly-owned subsidiary of MFS, receives a fee from the fund for its services as shareholder servicing agent. For the year ended December 31, 2011, the fee was $489, which equated to
16
Table of Contents
MFS Blended Research Growth Portfolio
Notes to Financial Statements – continued
0.0109% annually of the fund’s average daily net assets. MFSC also receives payment from the fund for out-of-pocket expenses paid by MFSC on behalf of the fund. For the year ended December 31, 2011, these costs amounted to $4.
Administrator – MFS provides certain financial, legal, shareholder communications, compliance, and other administrative services to the fund. Under an administrative services agreement, the fund partially reimburses MFS the costs incurred to provide these services. The fund is charged an annual fixed amount of $17,500 plus a fee based on average daily net assets. The administrative services fee incurred for the year ended December 31, 2011 was equivalent to an annual effective rate of 0.3891% of the fund’s average daily net assets.
Trustees’ and Officers’ Compensation – The fund pays compensation to Trustees in the form of a retainer, attendance fees, and additional compensation to the Board chairperson. The fund does not pay compensation directly to officers of the fund who are also officers of the investment adviser, all of whom receive remuneration for their services to the fund from MFS. Certain officers of the fund are officers or directors of MFS, MFD, and MFSC.
Other – This fund and certain other funds managed by MFS (the funds) have entered into services agreements (the Agreements) which provide for payment of fees by the funds to Tarantino LLC and Griffin Compliance LLC in return for the provision of services of an Independent Chief Compliance Officer (ICCO) and Assistant ICCO, respectively, for the funds. The ICCO and Assistant ICCO are officers of the funds and the sole members of Tarantino LLC and Griffin Compliance LLC, respectively. The funds can terminate the Agreements with Tarantino LLC and Griffin Compliance LLC at any time under the terms of the Agreements. MFS has agreed to bear all expenses associated with office space, other administrative support, and supplies provided to the ICCO and Assistant ICCO. For the year ended December 31, 2011, the aggregate fees paid by the fund to Tarantino LLC and Griffin Compliance LLC were $74 and are included in miscellaneous expense on the Statement of Operations.
The fund invests in the MFS Institutional Money Market Portfolio which is managed by MFS and seeks a high level of current income consistent with preservation of capital and liquidity. Income earned on this investment is included in dividends from underlying affiliated funds on the Statement of Operations. This money market fund does not pay a management fee to MFS.
On September 14, 2011, MFS redeemed 211,865 shares of the Service Class for an aggregate amount of $2,000,000. At December 31, 2011, MFS was the sole shareholder of both classes.
| (4) | Portfolio Securities |
Purchases and sales of investments, other than U.S. Government securities, purchased option transactions, and short-term obligations, aggregated $3,402,857 and $5,343,809, respectively.
| (5) | Shares of Beneficial Interest |
The fund’s Declaration of Trust permits the Trustees to issue an unlimited number of full and fractional shares of beneficial interest. Transactions in fund shares were as follows:
| Year ended 12/31/11 | Year ended 12/31/10 | |||||||||||||||
| Shares | Amount | Shares | Amount | |||||||||||||
| Shares issued to shareholders in reinvestment of distributions | ||||||||||||||||
Initial Class | 4,241 | $41,259 | 2,917 | $28,122 | ||||||||||||
Service Class | 239 | 2,346 | 2,332 | 22,480 | ||||||||||||
| 4,480 | $43,605 | 5,249 | $50,602 | |||||||||||||
| Shares reacquired | ||||||||||||||||
Service Class | (211,865 | ) | $(2,000,000 | ) | — | $— | ||||||||||
| (211,865 | ) | $(2,000,000 | ) | — | $— | |||||||||||
| Net change | ||||||||||||||||
Initial Class | 4,241 | $41,259 | 2,917 | $28,122 | ||||||||||||
Service Class | (211,626 | ) | (1,997,654 | ) | 2,332 | 22,480 | ||||||||||
| (207,385 | ) | $(1,956,395 | ) | 5,249 | $50,602 | |||||||||||
| (6) | Line of Credit |
The fund and certain other funds managed by MFS participate in a $1.1 billion unsecured committed line of credit, subject to a $1 billion sublimit, provided by a syndication of banks under a credit agreement. Borrowings may be made for temporary financing needs. Interest is charged to each fund, based on its borrowings, generally at a rate equal to the higher of the Federal Reserve funds rate or one month LIBOR plus an agreed upon spread. A commitment fee, based on the average daily, unused portion of the committed line of credit, is allocated among the participating funds at the end of each calendar quarter. In addition, the fund and other funds managed by MFS have established unsecured uncommitted borrowing arrangements with certain banks for temporary financing needs. Interest is charged to each fund, based on its borrowings, at a rate equal to the
17
Table of Contents
MFS Blended Research Growth Portfolio
Notes to Financial Statements – continued
Federal Reserve funds rate plus an agreed upon spread. For the year ended December 31, 2011, the fund’s commitment fee and interest expense were $43 and $0, respectively, and are included in miscellaneous expense on the Statement of Operations.
| (7) | Transactions in Underlying Affiliated Funds – Affiliated Issuers |
An affiliated issuer may be considered one in which the fund owns 5% or more of the outstanding voting securities, or a company which is under common control. For the purposes of this report, the fund assumes the following to be affiliated issuers:
| Underlying Affiliated Funds | Beginning Shares/Par Amount | Acquisitions Shares/Par Amount | Dispositions Shares/Par Amount | Ending Shares/Par Amount | ||||||||||||
| MFS Institutional Money Market Portfolio | 73,664 | 251,343 | (260,960 | ) | 64,047 | |||||||||||
| Underlying Affiliated Funds | Realized Gain (Loss) | Capital Gain Distributions | Dividend Income | Ending Value | ||||||||||||
| MFS Institutional Money Market Portfolio | $— | $— | $72 | $64,047 | ||||||||||||
18
Table of Contents
MFS Blended Research Growth Portfolio
REPORT OF INDEPENDENT REGISTERED PUBLIC ACCOUNTING FIRM
To the Board of Trustees of MFS Variable Insurance Trust II and the Shareholder of
MFS Blended Research Growth Portfolio:
We have audited the accompanying statement of assets and liabilities, including the portfolio of investments, of MFS Blended Research Growth Portfolio (the “Fund”) (one of the portfolios comprising MFS Variable Insurance Trust II) as of December 31, 2011, and the related statement of operations for the year then ended, the statements of changes in net assets for each of the two years in the period then ended, and the financial highlights for each of the five years in the period then ended. These financial statements and financial highlights are the responsibility of the Fund’s management. Our responsibility is to express an opinion on these financial statements and financial highlights based on our audits.
We conducted our audits in accordance with the standards of the Public Company Accounting Oversight Board (United States). Those standards require that we plan and perform the audit to obtain reasonable assurance about whether the financial statements and financial highlights are free of material misstatement. The Fund is not required to have, nor were we engaged to perform, an audit of its internal control over financial reporting. Our audits included consideration of internal control over financial reporting as a basis for designing audit procedures that are appropriate in the circumstances, but not for the purpose of expressing an opinion on the effectiveness of the Fund’s internal control over financial reporting. Accordingly, we express no such opinion. An audit also includes examining, on a test basis, evidence supporting the amounts and disclosures in the financial statements, assessing the accounting principles used and significant estimates made by management, as well as evaluating the overall financial statement presentation. Our procedures included confirmation of securities owned as of December 31, 2011, by correspondence with the custodian. We believe that our audits provide a reasonable basis for our opinion.
In our opinion, the financial statements and financial highlights referred to above present fairly, in all material respects, the financial position of MFS Blended Research Growth Portfolio as of December 31, 2011, the results of its operations for the year then ended, the changes in its net assets for each of the two years in the period then ended, and the financial highlights for each of the five years in the period then ended, in conformity with accounting principles generally accepted in the United States of America.
DELOITTE & TOUCHE LLP
Boston, Massachusetts
February 15, 2012
19
Table of Contents
MFS Blended Research Growth Portfolio
RESULTS OF SHAREHOLDER MEETING (unaudited)
At a special meeting of shareholders of MFS Blended Research Growth Portfolio, which was held on December 1, 2011, the following actions were taken for which shareholders of all series of MFS Variable Insurance Trust II voted together as a single class with respect to Item 1 and shareholders of MFS Blended Research Growth Portfolio voted as a separate class with respect to Items 2 and 3:
Item 1: Election of ten Trustees as members of the Board of Trustees of the Trust effective January 1, 2012:
| Number of Shares | ||||||||
| For | Withheld Authority | |||||||
| Robert E. Butler | 681,916,712.8686 | 46,472,894.9218 | ||||||
| Maureen R. Goldfarb | 682,835,794.8512 | 45,553,812.9392 | ||||||
| David H. Gunning | 681,500,267.3085 | 46,889,340.4819 | ||||||
| William R. Gutow | 681,050,223.5547 | 47,339,384.2357 | ||||||
| Michael Hegarty | 682,477,088.8584 | 45,912,518.9320 | ||||||
| John P. Kavanaugh | 683,794,425.4269 | 44,595,182.3635 | ||||||
| Robert J. Manning | 682,699,559.7374 | 45,690,048.0530 | ||||||
| J. Dale Sherratt | 681,362,743.0513 | 47,026,864.7391 | ||||||
| Laurie J. Thomsen | 683,408,094.0000 | 44,981,513.7904 | ||||||
| Robert W. Uek | 681,424,852.0247 | 46,964,755.7657 | ||||||
Item 2: To approve a new investment advisory agreement dated January 1, 2012, between the Trust, on behalf of MFS Blended Research Growth Portfolio, and MFS:
| Number of Shares | ||||||||||||
| For | Against | Withheld Authority | ||||||||||
| 303,569.3940 | — | — | ||||||||||
Item 3: To approve revisions to and restatements of certain fundamental investment restrictions of MFS Blended Research Growth Portfolio effective January 1, 2012 as detailed below:
| Number of Shares | ||||||||||||||
| For | Against | Withheld Authority | ||||||||||||
| A. | Borrowing | 303,659.3940 | — | — | ||||||||||
| B. | Underwriting Securities | 303,659.3940 | — | — | ||||||||||
| C. | Issuance of Senior Securities | 303,659.3940 | — | — | ||||||||||
| D. | Lending of Money or Securities | 303,659.3940 | — | — | ||||||||||
| E. | Purchases or Sales of Real Estate; Interests in Oil, Gas or Mineral Leases; and Commodities | 303,659.3940 | — | — | ||||||||||
| F. | Industry Concentration | 303,659.3940 | — | — | ||||||||||
20
Table of Contents
MFS Blended Research Growth Portfolio
TRUSTEES AND OFFICERS – IDENTIFICATION AND BACKGROUND
The Trustees and officers of the Trust, as of February 1, 2012, are listed below, together with their principal occupations during the past five years. (Their titles may have varied during that period.) The address of each Trustee and officer is 500 Boylston Street, Boston, Massachusetts 02116.
Name, Age | Position(s) with Fund | Trustee/Officer Since (h) | Principal Occupations | Other Directorships (j) | ||||
| INTERESTED TRUSTEES | ||||||||
Robert J. Manning (k) (age 48) | Trustee | February 2004 | Massachusetts Financial Services Company, Chairman, Chief Executive Officer and Director; President (until December 2009); Chief Investment Officer (until July 2010) | N/A | ||||
| INDEPENDENT TRUSTEES | ||||||||
David H. Gunning (age 69) | Trustee and Chair of Trustees | January 2004 | Retired; Cleveland-Cliffs Inc. (mining products and service provider), Vice Chairman/Director (until May 2007) | Lincoln Electric Holdings, Inc. (welding equipment manufacturer), Director; Development Alternatives, Inc. (consulting), Director/Non-Executive Chairman; Portman Limited (mining), Director (until 2008) | ||||
Robert E. Butler (age 70) | Trustee | January 2006 | Consultant – investment company industry regulatory and compliance matters | N/A | ||||
Maureen R. Goldfarb (age 56) | Trustee | January 2009 | Private investor | N/A | ||||
William R. Gutow (age 70) | Trustee | December 1993 | Private investor and real estate consultant; Capitol Entertainment Management Company (video franchise), Vice Chairman | Atlantic Coast Tan (tanning salons), Vice Chairman (until 2007); Texas Donuts (donut franchise), Vice Chairman (until 2010) | ||||
Michael Hegarty (age 67) | Trustee | December 2004 | Private investor | N/A | ||||
John P. Kavanaugh (age 57) | Trustee | January 2009 | Private investor; The Hanover Insurance Group, Inc., Vice President and Chief Investment Officer (until 2006); Allmerica Investment Trust, Allmerica Securities Trust and Opus Investment Trust (investment companies), Chairman, President and Trustee (until 2006) | N/A | ||||
J. Dale Sherratt (age 73) | Trustee | June 1989 | Insight Resources, Inc. (acquisition planning specialists), President; Wellfleet Investments (investor in health care companies), Managing General Partner | N/A | ||||
Laurie J. Thomsen (age 54) | Trustee | March 2005 | Private investor; New Profit, Inc. (venture philanthropy), Executive Partner (until 2010) | The Travelers Companies (property and casualty insurance), Director | ||||
Robert W. Uek (age 70) | Trustee | January 2006 | Consultant to investment company industry | N/A | ||||
| OFFICERS | ||||||||
John M. Corcoran (k) (age 46) | President | October 2008 | Massachusetts Financial Services Company, Senior Vice President (since October 2008); State Street Bank and Trust (financial services provider), Senior Vice President, (until September 2008) | N/A | ||||
| Christopher R. Bohane (k) (age 38) | Assistant Secretary and Assistant Clerk | July 2005 | Massachusetts Financial Services Company, Vice President and Senior Counsel | N/A | ||||
Kino Clark (k) (age 43) | Assistant Treasurer | January 2012 | Massachusetts Financial Services Company, Assistant Vice President | N/A | ||||
21
Table of Contents
MFS Blended Research Growth Portfolio
Trustees and Officers – continued
Name, Age | Position(s) with Fund | Trustee/Officer Since (h) | Principal Occupations | Other Directorships (j) | ||||
Ethan D. Corey (k) (age 48) | Assistant Secretary and Assistant Clerk | July 2005 | Massachusetts Financial Services Company, Senior Vice President and Associate General Counsel | N/A | ||||
David L. DiLorenzo (k) (age 43) | Treasurer | July 2005 | Massachusetts Financial Services Company, Vice President | N/A | ||||
Robyn L. Griffin (age 36) | Assistant Independent Chief Compliance Officer | August 2008 | Griffin Compliance LLC (provider of compliance services), Principal (since August 2008); State Street Corporation (financial services provider), Mutual Fund Administration Assistant Vice President (October 2006 – July 2008); Liberty Mutual Group (insurance), Personal Market Assistant Controller (April 2006 – October 2006); Deloitte & Touche LLP (professional services firm). | N/A | ||||
Brian E. Langenfeld (k) (age 38) | Assistant Secretary and Assistant Clerk | June 2006 | Massachusetts Financial Services Company, Vice President and Senior Counsel | N/A | ||||
Ellen Moynihan (k) (age 54) | Assistant Treasurer | April 1997 | Massachusetts Financial Services Company, Senior Vice President | N/A | ||||
Susan S. Newton (k) (age 61) | Assistant Secretary and Assistant Clerk | May 2005 | Massachusetts Financial Services Company, Senior Vice President and Associate General Counsel | N/A | ||||
Susan A. Pereira (k) (age 41) | Assistant Secretary and Assistant Clerk | July 2005 | Massachusetts Financial Services Company, Vice President and Senior Counsel | N/A | ||||
Mark N. Polebaum (k) (age 59) | Secretary and Clerk | January 2006 | Massachusetts Financial Services Company, Executive Vice President, General Counsel and Secretary | N/A | ||||
Frank L. Tarantino (age 67) | Independent Chief Compliance Officer | June 2004 | Tarantino LLC (provider of compliance services), Principal | N/A | ||||
Richard S. Weitzel (k) (age 41) | Assistant Secretary and Assistant Clerk | October 2007 | Massachusetts Financial Services Company, Vice President and Assistant General Counsel | N/A | ||||
James O. Yost (k) (age 51) | Deputy Treasurer | September 1990 | Massachusetts Financial Services Company, Senior Vice President | N/A | ||||
| (h) | Date first appointed to serve as Trustee/officer of an MFS fund. Each Trustee has served continuously since appointment unless indicated otherwise. For the period from December 15, 2004 until February 22, 2005, Mr. Manning served as Advisory Trustee. For the period October 2008, until January 2012, Mr. Corcoran served as Treasurer of the Funds. Prior to January 2012, Messrs. DiLorenzo and Yost served as Assistant Treasurers of the Funds. |
| (j) | Directorships or trusteeships of companies required to report to the Securities and Exchange Commission (i.e., “public companies”). |
| (k) | “Interested person” of the Trust within the meaning of the Investment Company Act of 1940 (referred to as the 1940 Act), which is the principal federal law governing investment companies like the fund, as a result of position with MFS. The address of MFS is 500 Boylston Street, Boston, Massachusetts 02116. |
Each Trustee has been elected by shareholders and each Trustee and officer holds office until his or her successor is chosen and qualified or until his or her earlier death, resignation, retirement or removal. The Trust does not hold annual meetings for the purpose of electing Trustees, and Trustees are not elected for fixed terms. Messrs. Butler, Kavanaugh, Uek and Ms. Thomsen are members of the Trust’s Audit Committee.
Each of the Fund’s Trustees and officers holds comparable positions with certain other funds of which MFS or a subsidiary is the investment adviser or distributor, and, in the case of the officers, with certain affiliates of MFS. As of January 1, 2012, the Trustees served as board members of 131 funds within the MFS Family of Funds.
22
Table of Contents
MFS Blended Research Growth Portfolio
Trustees and Officers – continued
The Statement of Additional Information for the Fund includes further information about the Trustees and is available without charge upon request by calling 1-800-225-2606.
Investment Adviser Massachusetts Financial Services Company 500 Boylston Street, Boston, MA 02116-3741 | Custodian State Street Bank and Trust 1 Lincoln Street, Boston, MA 02111-2900 | |
Distributor MFS Distributors, Inc. 500 Boylston Street, Boston, MA 02116-3741 | Independent Registered Public Accounting Firm Deloitte & Touche LLP 200 Berkeley Street, Boston, MA 02116 | |
Portfolio Manager Matthew Krummell |
23
Table of Contents
MFS Blended Research Growth Portfolio
At a special meeting of shareholders of the MFS Blended Research Growth Portfolio (hereinafter referred to as the “Fund” or the “Portfolio”), which was held on December 1, 2011, the shareholders approved a new investment advisory agreement based on the recommendation of the Board of Trustees. At its July, 2011 meeting, the Board of Trustees (i) approved, and recommended for shareholder approval, the new investment advisory agreement effective January 1, 2012, and (ii) the continuation of the existing investment advisory agreement effective September 1, 2011. The following includes a description of the factors that the Board of Trustees considered and the conclusions that formed the basis of their approval of both the new investment advisory agreement and the continuation of the prior investment advisory agreement.
BOARD APPROVAL OF NEW INVESTMENT ADVISORY AGREEMENT
The Investment Company Act of 1940 requires that both the full Board of Trustees and a majority of the non-interested (“independent”) Trustees, voting separately, initially approve the new investment advisory agreement (the “New Agreement”) between Massachusetts Financial Services Company (“MFS”) and MFS Variable Insurance Trust II (the “Trust”) on behalf of the Portfolio and, beginning on the second anniversary of the initial effective date of the New Agreement, annually approve the continuation of the New Agreement. The Trustees have considered matters bearing on the Portfolio and the then current advisory arrangement at their meetings throughout the year, including a review of performance data at each regular meeting. In addition, the independent Trustees met in person in July 2011 to consider the initial approval of the New Agreement, and to recommend that shareholders approve the New Agreement. The independent Trustees were assisted in their evaluation of the New Agreement by independent legal counsel, from whom they received separate legal advice and with whom they met separately from MFS management. The independent Trustees were also assisted in this process by the Portfolio’s Independent Chief Compliance Officer, a full-time senior officer appointed by and reporting to the independent Trustees.
In connection with their deliberations regarding the initial approval of the New Agreement, the Trustees, including the independent Trustees, considered such information and factors as they believed, in light of the legal advice furnished to them and their own business judgment, to be relevant. The New Agreement was considered separately for the series of the Trust (collectively, the “Portfolios”), although the Trustees also took into account the common interests of all Portfolios in the Trust in their review. As described below, the Trustees considered the nature, quality, and extent of the various investment advisory, administrative, and/or shareholder services to be performed by MFS under the New Agreement and other arrangements with the Trust.
In connection with their initial review meeting, the Trustees received and relied upon materials that included, among other items: (i) information provided by MFS on the advisory fees of comparable portfolios of its other clients, including institutional separate account and other clients, (ii) information as to whether, and to what extent applicable, expense waivers, reimbursements or fee “breakpoints” would be observed for the Portfolio under the New Agreement, and (iii) a comparison and summary of the differences in the provisions in the New Agreement compared to those in each of the then current investment advisory agreements for the Portfolios. In addition, in connection with the independent Trustees’ meetings in May and July, 2011 (the “contract review meetings”) for the purpose of considering whether to approve the continuation of the then current investment advisory agreements for the Portfolio, the independent Trustees received: (1) information provided by Lipper Inc. (“Lipper”) on the investment performance of the Portfolio for various time periods ended December 31, 2010, compared to the investment performance of a group of funds with substantially similar investment classifications/objectives (the “Lipper performance universe”), (2) information provided by Lipper on the Portfolio’s advisory fees and other expenses compared to the advisory fees and other expenses of comparable funds identified by Lipper (the “Lipper expense group”), (3) information regarding MFS’ financial results and financial condition, including MFS’ and certain of its affiliates’ estimated profitability from services performed for the Portfolio, (4) MFS’ views regarding the outlook for the mutual fund industry and its strategic business plans, (5) descriptions of various functions performed by MFS for the Trust, such as compliance monitoring and portfolio trading practices, and (6) information regarding the overall organization of MFS, including information about MFS’ senior management and other personnel providing investment advisory, administrative and other services to the Portfolio. The comparative performance, fee and expense information prepared and provided by Lipper was not independently verified, and the independent Trustees did not independently verify any information provided to them by MFS.
The Trustees’ conclusion as to the initial approval of the New Agreement was based on comprehensive consideration of all information provided to the Trustees and was not the result of any single factor. Some of the factors that figured particularly in the Trustees’ deliberations are described below for the Portfolio, while individual Trustees may have given different weight to various factors and evaluated the information presented as a whole differently than another individual Trustee. The Trustees recognized that the fee arrangements for the Portfolio could reflect years of review and discussion between the independent Trustees and MFS, that certain aspects of such arrangements may receive greater scrutiny in some years than others, and that
24
Table of Contents
MFS Blended Research Growth Portfolio
Board Approval of New Investment Advisory Agreement – continued
the Trustees’ conclusions may be based, in part, on their consideration of these same arrangements during the course of the year and in prior years.
Because the portfolio management team managing the Portfolio’s investments under the then current investment advisory agreement will remain the same under the New Agreement for the Portfolio, the Trustees compared the Portfolio’s total return investment performance to the performance of its Lipper performance universe over various time periods, based on information provided by Lipper. The Trustees placed particular emphasis on the total return performance of the Portfolio’s Initial Class shares in comparison to the performance of funds in its Lipper performance universe over the one-, three- and five-year periods ended December 31, 2010. The Trustees did not rely on performance results for more recent periods.
The Trustees noted the performance of the Portfolio’s Initial Class shares was in the 2nd quintile relative to the other funds in the Lipper performance universe for the one-year period (the 1st quintile being the best performers and the 5th quintile being the worst performers). The total return performance of the Portfolio was also in the 2nd quintile for the three-year period ended December 31, 2010, relative to the Lipper performance universe. Based on the nature and quality of services provided by MFS, the Board of Trustees concluded that the Portfolio’s performance was satisfactory.
In the course of their deliberations, the Trustees took into account information provided by MFS during contract review meetings, as well as during investment review meetings conducted with portfolio management personnel during the course of the year. For Portfolios whose performance lagged their peer groups, they discussed the factors that contributed thereto and MFS’ efforts to improve such Portfolios’ performance. After reviewing this information, the Trustees concluded, within the context of their overall conclusions regarding the New Agreement, that they were satisfied with MFS’ responses and efforts relating to investment performance.
In assessing the reasonableness of the Portfolio’s advisory fee, the Trustees considered, among other information, the Portfolio’s advisory fee and the total expense ratio of the Portfolio’s Initial Class shares as a percentage of average daily net assets, compared to the advisory fee and total expense ratios of its peer group of funds based on information provided by Lipper. The Trustees also considered the advisory fees charged by MFS to institutional accounts. In comparing these fees, the Trustees considered the generally broader scope of services provided by MFS to the Trust than those provided to institutional accounts. The Trustees also considered the higher demands placed on MFS’ investment personnel and trading infrastructure as a result of the daily cash in-flows and out-flows of the Portfolio, and the impact on MFS and related expenses due to the more extensive regulatory regime to which the Portfolio is subject, compared to institutional accounts.
In considering the fees, the Trustees noted from the Lipper data that the Portfolio’s effective advisory fee rate and total expense ratio were each below the median of such fees and expenses of funds in the Lipper expense group. In addition, the Trustees accepted MFS’ offer to continue the expense limitation for the Portfolio. They noted that the Portfolio’s advisory fee rate schedule is not currently subject to any breakpoints. However, the Trustees concluded that the Portfolio had not garnered sufficient assets to achieve economies of scale and that the fees were reasonable in light of the nature and quality of services provided by MFS.
The Trustees also considered whether the Portfolio is likely to benefit from any economies of scale due to future asset growth. In this regard, the Trustees reviewed the adequacy of breakpoints and discussed with MFS any adjustments necessary for the shareholders’ benefit.
The Trustees also considered information prepared by MFS relating to its costs and profits with respect to the Portfolio and other investment companies and accounts advised by MFS, as well as MFS’ methodologies used to determine and allocate its costs to the Portfolio and other accounts and products for purposes of estimating profitability.
The Trustees noted that there would be no increase to the net advisory fee arrangement for the Portfolio under the New Agreement when compared to the Portfolio’s then current investment advisory agreement. After reviewing these and other factors described below, the Trustees concluded that the advisory fees charged to the Portfolio under the New Agreement represent reasonable compensation in light of the nature and quality of the services being provided by MFS.
In addition, the Trustees considered MFS’ resources and related efforts to continue to retain, attract and motivate capable personnel to serve the Portfolio. The Trustees also considered the financial resources of MFS and its parent, Sun Life Financial Inc. The Trustees further considered any advantages and possible disadvantages of having an adviser which also serves other investment companies as well as institutional accounts.
The Trustees also considered the nature, quality, cost, and extent of administrative, transfer agency, and distribution services provided to the Trust by MFS and its affiliates under agreements and plans other than the New Agreement, including the 12b-1 fees the Portfolio pays to MFS Fund Distributors, Inc., an affiliate of MFS. The Trustees also considered the nature, extent and quality of certain other services MFS performs or arranges on the Portfolio’s behalf, which may include securities lending
25
Table of Contents
MFS Blended Research Growth Portfolio
Board Approval of New Investment Advisory Agreement – continued
programs, directed expense payment programs, class action recovery programs, and MFS’ interaction with third-party service providers, principally custodians and sub-custodians. The Trustees concluded that the various non-advisory services provided by MFS and its affiliates on behalf of the Portfolio were satisfactory. The Trustees also considered the benefits to MFS from the use of the Portfolio’s portfolio brokerage commissions to pay for investment research and various other factors. Additionally, the Trustees considered so-called “fall-out benefits” to MFS such as reputational value derived from serving as investment manager to the Trust, and determined that any such benefits derived by MFS were reasonable and fair.
Based on their evaluation of factors that they deemed to be material, including those factors described above, the Board of Trustees, including a majority of the independent Trustees, concluded that the New Agreement should be approved for an initial two-year period, commencing upon its effective date, as set forth in the New Agreement.
BOARD APPROVAL OF CONTINUATION OF PRIOR INVESTMENT ADVISORY AGREEMENT
The Investment Company Act of 1940 requires that both the full Board of Trustees and a majority of the non-interested (“independent”) Trustees, voting separately, annually approve the continuation of the investment advisory agreement between MFS Variable Insurance Trust II (the “Trust”) and Massachusetts Financial Services Company (“MFS”) on behalf of the Fund. The Trustees consider matters bearing on the Fund and the advisory arrangements at their meetings throughout the year, including a review of performance data at each regular meeting. In addition, the independent Trustees met in person in May and again in July 2011 (“contract review meetings”) for the specific purpose of considering whether to approve the continuation of the investment advisory agreement for the Fund. The independent Trustees were assisted in their evaluation of the investment advisory agreement by independent legal counsel, from whom they received separate legal advice and with whom they met separately from MFS management during various contract review meetings. The independent Trustees were also assisted in this process by the Fund’s Independent Chief Compliance Officer, a full-time senior officer appointed by and reporting to the independent Trustees.
In connection with their deliberations, the Trustees, including the independent Trustees, considered such information and factors as they believed, in light of the legal advice furnished to them and their own business judgment, to be relevant. The investment advisory agreement was considered separately for the Fund, although the Trustees also took into account the common interests of all Funds in the Trust in their review. As described below, the Trustees considered the nature, quality, and extent of the various investment advisory, administrative, and shareholder services performed by MFS under the existing investment advisory agreement and other arrangements with the Trust.
In connection with their contract review meetings, the Trustees received and relied upon materials which included, among other items: (i) information provided by Lipper Inc. (“Lipper”) on the investment performance of the Fund for various time periods ended December 31, 2010, compared to the investment performance of a group of funds with substantially similar investment classifications/objectives (the “Lipper performance universe”), (ii) information provided by Lipper on the Fund’s advisory fees and other expenses compared to the advisory fees and other expenses of comparable funds identified by Lipper (the “Lipper expense group”), (iii) information provided by MFS on the advisory fees of comparable portfolios of its other clients, including institutional separate account and other clients, (iv) information as to whether, and to what extent applicable, expense waivers, reimbursements or fee “breakpoints” are observed for the Fund, (v) information regarding MFS’ financial results and financial condition, including MFS’ and certain of its affiliates’ estimated profitability from services performed for the Fund and other investment companies that the Board oversees as a whole, and for MFS’ institutional business, (vi) MFS’ views regarding the outlook for the mutual fund industry and its strategic business plans, (vii) descriptions of various functions performed by MFS for the Trust, such as compliance monitoring and portfolio trading practices, and (viii) information regarding the overall organization of MFS, including information about MFS’ senior management and other personnel providing investment advisory, administrative and other services to the Fund. The comparative performance, fee and expense information prepared and provided by Lipper was not independently verified, and the independent Trustees did not independently verify any information provided to them by MFS.
The Trustees’ conclusion as to the continuation of the investment advisory agreement was based on comprehensive consideration of all information provided to the Trustees and was not the result of any single factor. Some of the factors that figured particularly in the Trustees’ deliberations are described below for the Fund, while individual Trustees may have given different weight to various factors and evaluated the information presented as a whole differently than another individual Trustee. The Trustees recognized that the fee arrangements for the Fund reflect years of review and discussion between the independent Trustees and MFS, that certain aspects of such arrangements may receive greater scrutiny in some years than others, and that the Trustees’ conclusions may be based, in part, on their consideration of these same arrangements during the course of the year and in prior years.
26
Table of Contents
MFS Blended Research Growth Portfolio
Board Approval of Continuation of Prior Investment Advisory Agreement – continued
Based on information provided by Lipper, the Trustees compared the Fund’s total return investment performance to the performance of the Lipper performance universe over various time periods. The Trustees placed particular emphasis on the total return performance of the Fund’s Initial Class shares in comparison to the performance of funds in its Lipper performance universe over the one- and three-year periods ended December 31, 2010. (The Fund commenced operations in December 2007.) The Trustees did not rely on performance results for more recent periods, including those shown elsewhere in this report.
The Trustees noted the performance of the Fund’s Initial Class shares was in the 2nd quintile relative to the other funds in the Lipper performance universe for the one-year period (the 1st quintile being the best performers and the 5th quintile being the worst performers). The total return performance of the Fund was also in the 2nd quintile for the three-year period ended December 31, 2010, relative to the Lipper performance universe. Based on the nature and quality of services provided by MFS, the Board of Trustees concluded that the Fund’s performance was satisfactory.
In the course of their deliberations, the Trustees took into account information provided by MFS during contract review meetings, as well as during investment review meetings conducted with portfolio management personnel during the course of the year.
In assessing the reasonableness of the Fund’s advisory fee, the Trustees considered, among other information, the Fund’s advisory fee and the total expense ratio of the Fund’s Initial Class shares as a percentage of average daily net assets, compared to the advisory fee and total expense ratios of its peer group of funds based on information provided by Lipper. The Trustees also considered the advisory fees charged by MFS to institutional accounts. In comparing these fees, the Trustees considered the generally broader scope of services provided by MFS to the Trust than those provided to institutional accounts. The Trustees also considered the higher demands placed on MFS’ investment personnel and trading infrastructure as a result of the daily cash in-flows and out-flows of the Fund, and the impact on MFS and related expenses due to the more extensive regulatory regime to which the Fund is subject, compared to institutional accounts.
In considering the fees, the Trustees noted from the Lipper data (which takes into account any reductions or expense limitations) that the Fund’s effective advisory fee rate and total expense ratio were each below the median of such fees and expenses of funds in the Lipper expense group. In addition, the Trustees accepted MFS’ offer to continue the expense limitation for the Fund. They noted that the Fund’s advisory fee rate schedule is not currently subject to any breakpoints. However, the Trustees concluded that the Fund had not garnered sufficient assets to achieve economies of scale and that the fees were reasonable in light of the nature and quality of services provided by MFS.
The Trustees also considered information prepared by MFS relating to its costs and profits with respect to the Fund and other investment companies and accounts advised by MFS, as well as MFS’ methodologies used to determine and allocate its costs to the Fund and other accounts and products for purposes of estimating profitability.
After reviewing these and other factors described below, the Trustees concluded that the advisory fees charged to the Fund represent reasonable compensation in light of the nature and quality of the services being provided by MFS.
In addition, the Trustees considered MFS’ resources and related efforts to continue to retain, attract and motivate capable personnel to serve the Fund. The Trustees also considered the financial resources of MFS and its parent, Sun Life Financial Inc. The Trustees further considered any advantages and possible disadvantages of having an adviser which also serves other investment companies as well as institutional accounts.
The Trustees also considered the nature, quality, cost, and extent of administrative, transfer agency, and distribution services provided to the Fund by MFS and its affiliates under agreements and plans other than the investment advisory agreement, including the 12b-1 fees the Fund pays to MFS Fund Distributors, Inc., an affiliate of MFS. The Trustees also considered the nature, extent and quality of certain other services MFS performs or arranges on the Fund’s behalf, which may include securities lending programs, directed expense payment programs, class action recovery programs, and MFS’ interaction with third-party service providers, principally custodians and sub-custodians. The Trustees concluded that the various non-advisory services provided by MFS and its affiliates on behalf of the Fund were satisfactory. The Trustees also considered the benefits to MFS from the use of the Fund’s portfolio brokerage commissions, if applicable, to pay for investment research and various other factors. Additionally, the Trustees considered so-called “fall-out benefits” to MFS such as reputational value derived from serving as investment manager to the Trust, and determined that any such benefits derived by MFS were reasonable and fair.
Based on their evaluation of factors that they deemed to be material, including those factors described above, the Board of Trustees, including a majority of the independent Trustees, concluded that the investment advisory agreement should be continued for an additional one-year period, commencing September 1, 2011.
A discussion regarding the Board’s most recent review and renewal of the fund’s Investment Advisory Agreement with MFS is available by clicking on the fund’s name under “Variable Insurance Portfolios — VIT II” in the “Products and Performance” section of the MFS Web site (mfs.com).
27
Table of Contents
MFS Blended Research Growth Portfolio
PROXY VOTING POLICIES AND INFORMATION
A general description of the MFS funds’ proxy voting policies and procedures is available without charge, upon request, by calling 1-800-225-2606, by visiting the Proxy Voting section of mfs.com or by visiting the SEC’s Web site at http://www.sec.gov.
Information regarding how the fund voted proxies relating to portfolio securities during the most recent twelve-month period ended June 30 is available without charge by visiting the Proxy Voting section of mfs.com or by visiting the SEC’s Web site at http://www.sec.gov.
QUARTERLY PORTFOLIO DISCLOSURE
The fund will file a complete schedule of portfolio holdings with the Securities and Exchange Commission (the Commission) for the first and third quarters of each fiscal year on Form N-Q. The fund’s Form N-Q is available on the EDGAR database on the Commission’s Internet Web site at http://www.sec.gov and may be reviewed and copied at the:
Public Reference Room
Securities and Exchange Commission
100 F Street, NE, Room 1580
Washington, D.C. 20549
Information on the operation of the Public Reference Room may be obtained by calling the Commission at 1-800-SEC-0330. Copies of the fund’s Form N-Q also may be obtained, upon payment of a duplicating fee, by electronic request at the following e-mail address: publicinfo@sec.gov or by writing the Public Reference Section at the above address.
From time to time, MFS may post important information about the fund or the MFS funds on the MFS web site (mfs.com). This information is available by visiting the “News & Commentary” section of mfs.com or by clicking on the fund’s name under “Variable Insurance Portfolios — VIT II” in the “Products and Performance” section of mfs.com.
FEDERAL TAX INFORMATION (unaudited)
The following information is provided pursuant to provisions of the Internal Revenue Code.
For corporate shareholders 100% of the ordinary income dividends paid during the fiscal year qualify for the corporate dividends received deduction.
28
Table of Contents
rev. 3/11

| Why? | Financial companies choose how they share your personal information. Federal law gives consumers the right to limit some but not all sharing. Federal law also requires us to tell you how we collect, share, and protect your personal information. Please read this notice carefully to understand what we do. |
| What? | The types of personal information we collect and share depend on the product or service you have with us. This information can include:
• Social Security number and account balances • Account transactions and transaction history • Checking account information and wire transfer instructions
When you are no longer our customer, we continue to share your information as described in this notice. |
| How? | All financial companies need to share customers’ personal information to run their everyday business. In the section below, we list the reasons financial companies can share their customers’ personal information; the reasons MFS chooses to share; and whether you can limit this sharing. |
| Reasons we can share your personal information | Does MFS share? | Can you limit this sharing? | ||
For our everyday business purposes – such as to process your transactions, maintain your account(s), respond to court orders and legal investigations, or report to credit bureaus | Yes | No | ||
For our marketing purposes – to offer our products and services to you | No | We don’t share | ||
| For joint marketing with other financial companies | No | We don’t share | ||
For our affiliates’ everyday business purposes – information about your transactions and experiences | No | We don’t share | ||
For our affiliates’ everyday business purposes – information about your creditworthiness | No | We don’t share | ||
| For nonaffiliates to market to you | No | We don’t share |
| Questions? | Call 800-225-2606 or go to mfs.com. |
29
Table of Contents
| Page 2 |
| Who we are | ||
| Who is providing this notice? | MFS Funds, MFS Investment Management, MFS Institutional Advisors, Inc., MFS Fund Distributors, Inc., MFS Heritage Trust Company, and MFS Service Center, Inc. | |
| What we do | ||
| How does MFS protect my personal information? | To protect your personal information from unauthorized access and use, we use security measures that comply with federal law. These measures include procedural, electronic, and physical safeguards for the protection of the personal information we collect about you. | |
| How does MFS collect my personal information? | We collect your personal information, for example, when you
• open an account or provide account information • direct us to buy securities or direct us to sell your securities • make a wire transfer
We also collect your personal information from others, such as credit bureaus, affiliates and other companies. | |
| Why can’t I limit all sharing? | Federal law gives you the right to limit only
• sharing for affiliates’ everyday business purposes – information about your creditworthiness • affiliates from using your information to market to you • sharing for nonaffiliates to market to you
State laws and individual companies may give you additional rights to limit sharing. | |
| Definitions | ||
| Affiliates | Companies related by common ownership or control. They can be financial and nonfinancial companies.
•MFS does not share personal information with affiliates, except for everyday business purposes as described on page one of this notice. | |
| Nonaffiliates | Companies not related by common ownership or control. They can be financial and nonfinancial companies.
•MFS does not share with nonaffiliates so they can market to you. | |
| Joint Marketing | A formal agreement between nonaffiliated financial companies that together market financial products or services to you.
•MFS doesn’t jointly market. | |
| Other important information | ||
| If you own an MFS product or receive an MFS service in the name of a third party such as a bank or broker-dealer, their privacy policy may apply to you instead of ours. | ||
30
Table of Contents

Table of Contents

MFS® Blended Research®
Value Portfolio
MFS® Variable Insurance Trust II

ANNUAL REPORT
December 31, 2011
BRV-ANN
Table of Contents
MFS® BLENDED RESEARCH® VALUE PORTFOLIO
The report is prepared for the general information of contract owners.
It is authorized for distribution to prospective investors only when preceded or accompanied by a current prospectus.
NOT FDIC INSURED Ÿ MAY LOSE VALUE Ÿ NO BANK OR CREDIT UNION GUARANTEE Ÿ NOT A DEPOSIT Ÿ NOT INSURED BY ANY FEDERAL GOVERNMENT AGENCY OR NCUA/NCUSIF
Table of Contents
MFS Blended Research Value Portfolio
LETTER FROM THE CHAIRMAN AND CEO

Dear Contract Owners:
We are indeed living through some volatile times. Economic uncertainty is everywhere, as it seems no place in the world has been unmoved by crisis. We have seen a devastating earthquake and tsunami that have led to disruptions in the Japanese markets
and supply chains. Protests have changed the face of the Middle East and left in their wake lingering tensions and resultant higher oil prices. We have seen debt limits tested in Europe and the United States and policymakers grappling to craft often unpopular monetary and fiscal responses at a time when consumers and businesses struggle with what appears to be a slowing global economy. On top of all of that, we have seen long-term U.S. debt lose its Standard & Poor’s AAA rating and the long-term debt ratings of 15 eurozone nations put on negative watch.
When markets become volatile, managing risk becomes a top priority for investors and their advisors. At MFS® risk management is foremost in our minds in all market climates. Our analysts and portfolio managers keep risks firmly in mind when evaluating securities. Additionally, we have a team of quantitative analysts that measures and assesses the risk profiles of our portfolios and securities on an ongoing basis. The chief investment risk officer, who oversees the team, reports directly to the firm’s president and chief investment officer so the risk associated with each portfolio can be assessed objectively and independently of the portfolio management team.
As always, we continue to be mindful of the many economic challenges faced at the local, national, and international levels. It is in times such as these that we want to remind investors of the merits of maintaining a long-term view, adhering to basic investing principles such as asset allocation and diversification, and working closely with their advisors to research and identify appropriate investment opportunities.
Respectfully,

Robert J. Manning
Chairman and Chief Executive Officer
MFS Investment Management®
February 15, 2012
The opinions expressed in this letter are subject to change, may not be relied upon for investment advice, and no forecasts can be guaranteed.
1
Table of Contents
MFS Blended Research Value Portfolio
Portfolio structure

| Top ten holdings | ||||
| Chevron Corp. | 3.5% | |||
| JPMorgan Chase & Co. | 3.1% | |||
| Pfizer, Inc. | 3.0% | |||
| AT&T, Inc. | 2.9% | |||
| Exxon Mobil Corp. | 2.3% | |||
| Johnson & Johnson | 2.3% | |||
| Procter & Gamble Co. | 2.3% | |||
| General Electric Co. | 2.1% | |||
| Citigroup, Inc. | 2.0% | |||
| CVS Caremark Corp. | 2.0% |
| Equity sectors | ||||
| Financial Services | 25.0% | |||
| Utilities & Communications | 13.9% | |||
| Health Care | 12.8% | |||
| Energy | 10.2% | |||
| Consumer Staples | 7.4% | |||
| Technology | 6.1% | |||
| Industrial Goods & Services | 5.4% | |||
| Retailing | 5.3% | |||
| Leisure | 5.3% | |||
| Autos & Housing | 3.5% | |||
| Basic Materials | 2.3% | |||
| Transportation | 1.5% | |||
| Special Products & Services | 0.3% |
Percentages are based on net assets as of 12/31/11.
The portfolio is actively managed and current holdings may be different.
2
Table of Contents
MFS Blended Research Value Portfolio
Summary of Results
For the twelve months ended December 31, 2011, Initial Class shares of the MFS Blended Research Value Portfolio (the “fund”) provided a total return of 0.95%, while Service Class shares of the fund provided a total return of 0.54%. These compare with a return of 0.39% for the fund’s benchmark, the Russell 1000 Value Index.
Market Environment
Early in the period, the U.S. Federal Reserve (the “Fed”) responded to weak economic growth by loosening monetary policy further. More easing by the Fed improved market sentiment and drove risk-asset prices markedly higher. The December 2010 agreement on a surprisingly large (relative to expectations) expansionary U.S. fiscal package also boosted sentiment. During the subsequent several months, the renewed positive market sentiment, coupled with better indications of global macroeconomic activity, pushed many asset valuations to post-crisis highs. At the same time, the yields of the perceived “safest” global sovereign credits rose, indicating a renewed risk-seeking environment.
However, towards the middle of the period, a weakening macroeconomic backdrop and renewed concerns over peripheral euro zone sovereign debt caused a flight-to-quality move that pushed high-quality sovereign bond yields lower. In the U.S., concerns about sovereign debt default and the long-term sustainability of the trend in U.S. fiscal policy resulted in one agency downgrading U.S. credit quality. Amidst this turmoil, global equity markets declined sharply. As a result of these developments, global consumer and producer sentiment indicators fell precipitously and highly-rated sovereign bond yields hit multi-decade lows. Towards the end of the reporting period, uncertainty in financial markets spiked higher as markets more seriously contemplated the possible failure of the euro zone.
Contributors to Performance
Stock selection in the energy sector boosted performance relative to the Russell 1000 Value Index. The fund’s overweight position in shares of integrated energy company Chevron supported relative performance as the stock turned in strong performance for the reporting period. Shares rose late in the period due to strong earnings driven by increased production volumes, increased international demand, and a favorable currency environment. Holdings of oil and gas refining company Marathon Petroleum were also among the fund’s top relative contributors.
Stock selection in the technology sector was another positive factor for relative returns. Not holding shares of poor-performing computer products and services provider Hewlett-Packard boosted relative performance. Shares of Hewlett-Packard declined throughout the reporting period as investor confidence of the weakening business appeared to have been further shaken by the board’s decision to fire CEO Leo Apotheker in September after only eleven months on the job and hire former eBay CEO, Meg Whitman, to take his place. Additionally, the company had been plagued by slower growth in its PC division, internal problems in its services division, and a weaker balance sheet primarily from prior acquisitions.
Elsewhere, the fund’s holdings of media company CBS, investment banking firm Goldman Sachs (h), department store operator Macy’s, and tobacco company Reynolds American benefited relative performance. Overweight positions in strong-performing health care providers Humana and Aetna,and not holding shares of poor-performing financial services firm Morgan Stanley, also helped.
Detractors from Performance
Stock selection in the utilities & communications sector detracted from relative performance. Within this sector, holdings of power generation company NRG hindered relative results. Shares of NRG depreciated during the period due primarily to hot weather in Texas which increased demand and forced the company to buy power in the spot market at higher prices to cover its short position.
Elsewhere, the fund’s overweight positions in shares of financial services firm Bank of America, cruise line operator Royal Caribbean Cruises, financial services firm Citigroup, oil and gas exploration and production company Apache, and not holding global pharmaceutical company Bristol Myers Squibb held back relative performance. Holdings of diversified conglomerate Textron, and the timing of our ownership in shares of strong-performing health insurance and Medicare/Medicaid provider UnitedHealth Group (h), also detracted from relative returns. Additionally, the fund’s overweight positions in insurance company Aflac and global financial services firm JPMorgan Chase dampened relative results.
Respectfully,
Jonathan Sage
Portfolio Manager
| (h) | Security was not held in the fund at period end. |
3
Table of Contents
MFS Blended Research Value Portfolio
Management Review – continued
The views expressed in this report are those of the portfolio manager only through the end of the period of the report as stated on the cover and do not necessarily reflect the views of MFS or any other person in the MFS organization. These views are subject to change at any time based on market or other conditions, and MFS disclaims any responsibility to update such views. These views may not be relied upon as investment advice or an indication of trading intent on behalf of any MFS portfolio. References to specific securities are not recommendations of such securities, and may not be representative of any MFS portfolio’s current or future investments.
4
Table of Contents
MFS Blended Research Value Portfolio
PERFORMANCE SUMMARY THROUGH 12/31/11
The following chart illustrates the historical performance of the fund in comparison to its benchmark(s). Benchmarks are unmanaged and may not be invested in directly. Benchmark returns do not reflect any fees or expenses. The performance of other share classes will be greater than or less than that of the class depicted below. (See Notes to Performance Summary.)
Performance data shown represents past performance and is no guarantee of future results. Investment return and principal value fluctuate so your units, when sold, may be worth more or less than the original cost; current performance may be lower or higher than quoted. The performance shown does not reflect the deduction of taxes, if any, that a contract holder would pay on fund distributions or the redemption of contract units. The returns for the fund shown also do not reflect the deduction of expenses associated with variable products, such as mortality and expense risk charges, separate account charges, and sales charges imposed by the insurance company separate accounts. Such expenses would reduce the overall returns shown.
Growth of a Hypothetical $10,000 Investment (t)
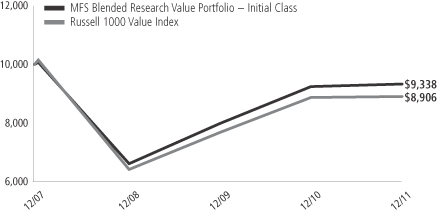
Total Returns through 12/31/11
Average annual total returns
| Share class | Class inception date | 1-yr | Life (t) | |||||||
| Initial Class | 12/18/07 | 0.95% | (1.68)% | |||||||
| Service Class | 12/18/07 | 0.54% | (1.97)% | |||||||
| Comparative benchmark | ||||||||||
| Russell 1000 Value Index (f) | 0.39% | (2.82)% | ||||||||
| (f) | Source: FactSet Research Systems Inc. |
| (t) | For the period from the class inception date through the stated period end. (See Notes to Performance Summary.) |
Benchmark Definition
Russell 1000 Value Index – constructed to provide a comprehensive barometer for the value securities in the large-cap segment of the U.S. equity universe. Companies in this index generally have lower price-to-book ratios and lower forecasted growth values.
It is not possible to invest directly in an index.
Notes to Performance Summary
Average annual total return represents the average annual change in value for each share class for the periods presented. Life returns are presented where the share class has less than 10 years of performance history and represent the average annual total return from the class inception date to the stated period end date.
Performance results reflect any applicable expense subsidies and waivers in effect during the periods shown. Without such subsidies and waivers the fund’s performance results would be less favorable. Please see the prospectus and financial statements for complete details. All results are historical and assume the reinvestment of any dividends and capital gains distributions.
Performance results do not include adjustments made for financial reporting purposes in accordance with U.S. generally accepted accounting principles and may differ from amounts reported in the financial highlights.
From time to time the fund may receive proceeds from litigation settlements, without which performance would be lower.
5
Table of Contents
MFS Blended Research Value Portfolio
Fund Expenses Borne by the Contract Holders During the Period,
July 1, 2011 through December 31, 2011
As a contract holder of the fund, you incur ongoing costs, including management fees; distribution and/or service (12b-1) fees; and other fund expenses. This example is intended to help you understand your ongoing costs (in dollars) of investing in the fund and to compare these costs with the ongoing costs of investing in other mutual funds.
The example is based on an investment of $1,000 invested at the beginning of the period and held for the entire period July 1, 2011 through December 31, 2011.
Actual Expenses
The first line for each share class in the following table provides information about actual account values and actual expenses. You may use the information in this line, together with the amount you invested, to estimate the expenses that you paid over the period. Simply divide your account value by $1,000 (for example, an $8,600 account value divided by $1,000 = 8.6), then multiply the result by the number in the first line under the heading entitled “Expenses Paid During Period” to estimate the expenses you paid on your account during this period.
Hypothetical Example for Comparison Purposes
The second line for each share class in the following table provides information about hypothetical account values and hypothetical expenses based on the fund’s actual expense ratio and an assumed rate of return of 5% per year before expenses, which is not the fund’s actual return. The hypothetical account values and expenses may not be used to estimate the actual ending account balance or expenses you paid for the period. You may use this information to compare the ongoing costs of investing in the fund and other funds. To do so, compare this 5% hypothetical example with the 5% hypothetical examples that appear in the shareholder reports of the other funds.
Please note that the expenses shown in the table are meant to highlight the fund’s ongoing costs only and do not take into account the fees and expenses imposed under the variable contracts through which your investment in the fund is made. Therefore, the second line for each share class in the table is useful in comparing ongoing costs associated with an investment in vehicles (such as the fund) which fund benefits under variable annuity and variable life insurance contracts and to qualified pension and retirement plans only, and will not help you determine the relative total costs of investing in the fund through variable annuity and variable life insurance contracts. If the fees and expenses imposed under the variable contracts were included, your costs would have been higher.
| Share Class | Annualized Expense Ratio | Beginning 7/01/11 | Ending 12/31/11 | Expenses Paid 7/01/11-12/31/11 | ||||||||||||||
| Initial Class | Actual | 0.60% | $1,000.00 | $939.93 | $2.93 | |||||||||||||
| Hypothetical (h) | 0.60% | $1,000.00 | $1,022.18 | $3.06 | ||||||||||||||
| Service Class | Actual | 0.85% | $1,000.00 | $936.11 | $4.15 | |||||||||||||
| Hypothetical (h) | 0.85% | $1,000.00 | $1,020.92 | $4.33 | ||||||||||||||
| (h) | 5% class return per year before expenses. |
| (p) | Expenses paid is equal to each class’ annualized expense ratio, as shown above, multiplied by the average account value over the period, multiplied by the number of days in the period, divided by the number of days in the year. |
6
Table of Contents
MFS Blended Research Value Portfolio
PORTFOLIO OF INVESTMENTS – 12/31/11
The Portfolio of Investments is a complete list of all securities owned by your fund. It is categorized by broad-based asset classes.
| Issuer | Shares/Par | Value ($) | ||||||
| COMMON STOCKS – 99.0% | ||||||||
| Aerospace – 2.4% | ||||||||
| Lockheed Martin Corp. | 300 | $ | 24,268 | |||||
| Northrop Grumman Corp. | 350 | 20,468 | ||||||
| Textron, Inc. | 810 | 14,977 | ||||||
|
| |||||||
| $ | 59,713 | |||||||
|
| |||||||
| Automotive – 1.4% | ||||||||
| General Motors Co. (a) | 740 | $ | 15,000 | |||||
| Johnson Controls, Inc. | 620 | 19,381 | ||||||
|
| |||||||
| $ | 34,381 | |||||||
|
| |||||||
| Biotechnology – 1.6% | ||||||||
| Amgen, Inc. | 630 | $ | 40,452 | |||||
|
| |||||||
| Broadcasting – 1.4% | ||||||||
| CBS Corp., “B” | 630 | $ | 17,098 | |||||
| Viacom, Inc., “B” | 330 | 14,985 | ||||||
| Walt Disney Co. | 100 | 3,750 | ||||||
|
| |||||||
| $ | 35,833 | |||||||
|
| |||||||
| Brokerage & Asset Managers – 1.8% | ||||||||
| CME Group, Inc. | 70 | $ | 17,057 | |||||
| NASDAQ OMX Group, Inc. (a) | 1,105 | 27,084 | ||||||
|
| |||||||
| $ | 44,141 | |||||||
|
| |||||||
| Business Services – 0.3% | ||||||||
| Towers Watson & Co. | 120 | $ | 7,192 | |||||
|
| |||||||
| Cable TV – 2.0% | ||||||||
| Comcast Corp., “A” | 600 | $ | 14,226 | |||||
| Time Warner Cable, Inc. | 300 | 19,071 | ||||||
| Virgin Media, Inc. | 750 | 16,035 | ||||||
|
| |||||||
| $ | 49,332 | |||||||
|
| |||||||
| Chemicals – 0.7% | ||||||||
| CF Industries Holdings, Inc. | 130 | $ | 18,847 | |||||
|
| |||||||
| Computer Software – Systems – 1.0% | ||||||||
| Apple, Inc. (a) | 60 | $ | 24,300 | |||||
|
| |||||||
| Construction – 2.1% | ||||||||
| Owens Corning (a) | 1,040 | $ | 29,869 | |||||
| Stanley Black & Decker, Inc. | 330 | 22,308 | ||||||
|
| |||||||
| $ | 52,177 | |||||||
|
| |||||||
| Consumer Products – 2.7% | ||||||||
| Newell Rubbermaid, Inc. | 690 | $ | 11,144 | |||||
| Procter & Gamble Co. | 850 | 56,704 | ||||||
|
| |||||||
| $ | 67,848 | |||||||
|
| |||||||
| Electrical Equipment – 2.1% | ||||||||
| General Electric Co. | 2,920 | $ | 52,297 | |||||
|
| |||||||
| Electronics – 3.1% | ||||||||
| Intel Corp. | 1,420 | $ | 34,435 | |||||
| Microchip Technology, Inc. | 710 | 26,007 | ||||||
| SanDisk Corp. (a) | 360 | 17,716 | ||||||
|
| |||||||
| $ | 78,158 | |||||||
|
| |||||||
| Issuer | Shares/Par | Value ($) | ||||||
| COMMON STOCKS – continued | ||||||||
| Energy – Independent – 3.0% | ||||||||
| Apache Corp. | 320 | $ | 28,986 | |||||
| Marathon Oil Corp. | 600 | 17,562 | ||||||
| Occidental Petroleum Corp. | 320 | 29,984 | ||||||
|
| |||||||
| $ | 76,532 | |||||||
|
| |||||||
| Energy – Integrated – 6.7% | ||||||||
| Chevron Corp. | 820 | $ | 87,248 | |||||
| ConocoPhillips | 320 | 23,318 | ||||||
| Exxon Mobil Corp. | 690 | 58,484 | ||||||
|
| |||||||
| $ | 169,050 | |||||||
|
| |||||||
| Food & Beverages – 3.3% | ||||||||
| Bunge Ltd. | 170 | $ | 9,724 | |||||
| Coca-Cola Enterprises, Inc. | 430 | 11,085 | ||||||
| Dr Pepper Snapple Group, Inc. | 510 | 20,135 | ||||||
| General Mills, Inc. | 610 | 24,650 | ||||||
| Smithfield Foods, Inc. (a) | 700 | 16,996 | ||||||
|
| |||||||
| $ | 82,590 | |||||||
|
| |||||||
| Food & Drug Stores – 2.9% | ||||||||
| CVS Caremark Corp. | 1,220 | $ | 49,752 | |||||
| Kroger Co. | 930 | 22,525 | ||||||
|
| |||||||
| $ | 72,277 | |||||||
|
| |||||||
| Forest & Paper Products – 0.7% | ||||||||
| Domtar Corp. | 230 | $ | 18,391 | |||||
|
| |||||||
| Gaming & Lodging – 0.5% | ||||||||
| Royal Caribbean Cruises Ltd. | 480 | $ | 11,890 | |||||
|
| |||||||
| General Merchandise – 1.4% | ||||||||
| Macy’s, Inc. | 1,110 | $ | 35,720 | |||||
|
| |||||||
| Health Maintenance Organizations – 2.4% | ||||||||
| Aetna, Inc. | 1,020 | $ | 43,034 | |||||
| Humana, Inc. | 190 | 16,646 | ||||||
|
| |||||||
| $ | 59,680 | |||||||
|
| |||||||
| Insurance – 7.6% | ||||||||
| ACE Ltd. | 320 | $ | 22,438 | |||||
| Aflac, Inc. | 900 | 38,934 | ||||||
| Allied World Assurance Co. | 430 | 27,060 | ||||||
| Berkshire Hathaway, Inc., “B” (a) | 330 | 25,179 | ||||||
| Everest Re Group Ltd. | 260 | 21,863 | ||||||
| Prudential Financial, Inc. | 620 | 31,074 | ||||||
| Travelers Cos., Inc. | 420 | 24,851 | ||||||
|
| |||||||
| $ | 191,399 | |||||||
|
| |||||||
| Leisure & Toys – 1.4% | ||||||||
| Activision Blizzard, Inc. | 1,480 | $ | 18,234 | |||||
| Mattel, Inc. | 580 | 16,101 | ||||||
|
| |||||||
| $ | 34,335 | |||||||
|
| |||||||
| Machinery & Tools – 0.3% | ||||||||
| Cummins, Inc. | 90 | $ | 7,922 | |||||
|
| |||||||
7
Table of Contents
MFS Blended Research Value Portfolio
Portfolio of Investments – continued
| Issuer | Shares/Par | Value ($) | ||||||
| COMMON STOCKS – continued | ||||||||
| Major Banks – 8.1% | ||||||||
| Bank of America Corp. | 5,572 | $ | 30,980 | |||||
| Bank of New York Mellon Corp. | 590 | 11,747 | ||||||
| Comerica, Inc. | 510 | 13,158 | ||||||
| JPMorgan Chase & Co. | 2,310 | 76,808 | ||||||
| PNC Financial Services Group, Inc. | 740 | 42,676 | ||||||
| Wells Fargo & Co. | 970 | 26,733 | ||||||
|
| |||||||
| $ | 202,102 | |||||||
|
| |||||||
| Medical Equipment – 0.6% | ||||||||
| Thermo Fisher Scientific, Inc. (a) | 360 | $ | 16,189 | |||||
|
| |||||||
| Metals & Mining – 0.9% | ||||||||
| Cliffs Natural Resources, Inc. | 360 | $ | 22,446 | |||||
|
| |||||||
| Natural Gas – Distribution – 2.3% | ||||||||
| ONEOK, Inc. | 380 | $ | 32,942 | |||||
| Sempra Energy | 440 | 24,200 | ||||||
|
| |||||||
| $ | 57,142 | |||||||
|
| |||||||
| Natural Gas – Pipeline – 0.8% | ||||||||
| Williams Cos., Inc. (a) | 620 | $ | 16,746 | |||||
| WPX Energy, Inc. (a) | 206 | 3,743 | ||||||
|
| |||||||
| $ | 20,489 | |||||||
|
| |||||||
| Network & Telecom – 2.0% | ||||||||
| Cisco Systems, Inc. | 1,780 | $ | 32,182 | |||||
| Garmin Ltd. | 450 | 17,915 | ||||||
|
| |||||||
| $ | 50,097 | |||||||
|
| |||||||
| Oil Services – 0.5% | ||||||||
| National Oilwell Varco, Inc. | 190 | $ | 12,918 | |||||
|
| |||||||
| Other Banks & Diversified Financials – 4.6% | ||||||||
| Capital One Financial Corp. | 710 | $ | 30,026 | |||||
| Citigroup, Inc. | 1,938 | 50,989 | ||||||
| Discover Financial Services | 1,420 | 34,080 | ||||||
|
| |||||||
| $ | 115,095 | |||||||
|
| |||||||
| Pharmaceuticals – 8.2% | ||||||||
| Abbott Laboratories | 530 | $ | 29,802 | |||||
| Johnson & Johnson | 890 | 58,366 | ||||||
| Merck & Co., Inc. | 1,110 | 41,847 | ||||||
| Pfizer, Inc. | 3,510 | 75,956 | ||||||
|
| |||||||
| $ | 205,971 | |||||||
|
| |||||||
| Pollution Control – 0.6% | ||||||||
| Republic Services, Inc. | 552 | $ | 15,208 | |||||
|
| |||||||
| Railroad & Shipping – 1.5% | ||||||||
| CSX Corp. | 980 | $ | 20,639 | |||||
| Union Pacific Corp. | 170 | 18,010 | ||||||
|
| |||||||
| $ | 38,649 | |||||||
|
| |||||||
| Real Estate – 2.9% | ||||||||
| Equity Residential, REIT | 340 | $ | 19,390 | |||||
| Federal Realty Investment Trust, REIT | 250 | 22,688 | ||||||
| Issuer | Shares/Par | Value ($) | ||||||
| COMMON STOCKS – continued | ||||||||
| Real Estate – continued | ||||||||
| Public Storage, Inc., REIT | 100 | $ | 13,446 | |||||
| Simon Property Group, Inc., REIT | 130 | 16,762 | ||||||
|
| |||||||
| $ | 72,286 | |||||||
|
| |||||||
| Specialty Stores – 1.0% | ||||||||
| Best Buy Co., Inc. | 430 | $ | 10,049 | |||||
| IAC/InterActiveCorp | 340 | 14,484 | ||||||
|
| |||||||
| $ | 24,533 | |||||||
|
| |||||||
| Telephone Services – 5.0% | ||||||||
| AT&T, Inc. | 2,390 | $ | 72,274 | |||||
| CenturyLink, Inc. | 910 | 33,852 | ||||||
| Verizon Communications, Inc. | 460 | 18,455 | ||||||
|
| |||||||
| $ | 124,581 | |||||||
|
| |||||||
| Tobacco – 1.4% | ||||||||
| Reynolds American, Inc. | 860 | $ | 35,621 | |||||
|
| |||||||
| Utilities – Electric Power – 5.8% | ||||||||
| AES Corp. (a) | 2,840 | $ | 33,626 | |||||
| Alliant Energy Corp. | 290 | 12,792 | ||||||
| American Electric Power Co., Inc. | 400 | 16,524 | ||||||
| Edison International | 280 | 11,592 | ||||||
| Exelon Corp. | 760 | 32,961 | ||||||
| NRG Energy, Inc. (a) | 1,410 | 25,549 | ||||||
| PPL Corp. | 390 | 11,474 | ||||||
|
| |||||||
| $ | 144,518 | |||||||
|
| |||||||
| Total Common Stocks (Identified Cost, $2,700,321) | $ | 2,482,302 | ||||||
|
| |||||||
| MONEY MARKET FUNDS – 1.9% | ||||||||
| MFS Institutional Money Market Portfolio, 0.05%, at Cost and Net Asset Value (v) | 48,455 | $ | 48,455 | |||||
|
| |||||||
| Total Investments (Identified Cost, $2,748,776) | $ | 2,530,757 | ||||||
|
| |||||||
| OTHER ASSETS, LESS LIABILITIES – (0.9)% | (22,804 | ) | ||||||
|
| |||||||
| Net Assets – 100.0% | $ | 2,507,953 | ||||||
|
| |||||||
| (a) | Non-income producing security. |
| (v) | Underlying affiliated fund that is available only to investment companies managed by MFS. The rate quoted for the MFS Institutional Money Market Portfolio is the annualized seven-day yield of the fund at period end. |
The following abbreviations are used in this report and are defined:
| REIT | Real Estate Investment Trust |
See Notes to Financial Statements
8
Table of Contents
MFS Blended Research Value Portfolio
FINANCIAL STATEMENTS | STATEMENT OF ASSETS AND LIABILITIES
This statement represents your fund’s balance sheet, which details the assets and liabilities comprising the total value of the fund.
At 12/31/11 | ||||||||
Assets | ||||||||
Investments – | ||||||||
Non-affiliated issuers, at value (identified cost, $2,700,321) | $2,482,302 | |||||||
Underlying affiliated funds, at cost and value | 48,455 | |||||||
Total investments, at value (identified cost, $2,748,776) | $2,530,757 | |||||||
Cash | 180 | |||||||
Receivable for dividends | 3,802 | |||||||
Receivable from investment adviser | 4,645 | |||||||
Other assets | 188 | |||||||
Total assets | $2,539,572 | |||||||
Liabilities | ||||||||
Payable to affiliates | ||||||||
Shareholder servicing costs | $2 | |||||||
Distribution and/or service fees | 4 | |||||||
Payable for Trustees’ compensation | 14 | |||||||
Accrued expenses and other liabilities | 31,599 | |||||||
Total liabilities | $31,619 | |||||||
Net assets | $2,507,953 | |||||||
Net assets consist of | ||||||||
Paid-in capital | $3,288,495 | |||||||
Unrealized appreciation (depreciation) on investments and translation of assets and liabilities in foreign currency | (218,019 | ) | ||||||
Accumulated net realized gain (loss) on investments and foreign currency transactions | (562,523 | ) | ||||||
Net assets | $2,507,953 | |||||||
Shares of beneficial interest outstanding | 294,869 |
| Net assets | Shares outstanding | Net asset value per share | ||||||||||
Initial Class | $2,335,449 | 274,978 | $8.49 | |||||||||
Service Class | 172,504 | 19,891 | 8.67 | |||||||||
See Notes to Financial Statements
9
Table of Contents
MFS Blended Research Value Portfolio
FINANCIAL STATEMENTS | STATEMENT OF OPERATIONS
This statement describes how much your fund earned in investment income and accrued in expenses. It also describes any gains and/or losses generated by fund operations.
| Year ended 12/31/11 | ||||||||
| Net investment income | ||||||||
Income | ||||||||
Dividends | $88,908 | |||||||
Dividends from underlying affiliated funds | 66 | |||||||
Foreign taxes withheld | (24 | ) | ||||||
Total investment income | $88,950 | |||||||
Expenses | ||||||||
Management fee | $24,430 | |||||||
Distribution and/or service fees | 4,308 | |||||||
Shareholder servicing costs | 445 | |||||||
Administrative services fee | 17,500 | |||||||
Trustees’ compensation | 530 | |||||||
Custodian fee | 2,980 | |||||||
Shareholder communications | 4,725 | |||||||
Auditing fees | 45,407 | |||||||
Legal fees | 5,348 | |||||||
Miscellaneous | 8,347 | |||||||
Total expenses | $114,020 | |||||||
Fees paid indirectly | (1 | ) | ||||||
Reduction of expenses by investment adviser | (85,259 | ) | ||||||
Net expenses | $28,760 | |||||||
Net investment income | $60,190 | |||||||
Realized and unrealized gain (loss) on investments | ||||||||
Realized gain (loss) on investment transactions (identified cost basis) | $176,366 | |||||||
Change in unrealized appreciation (depreciation) on investments | $(336,543 | ) | ||||||
Net realized and unrealized gain (loss) on investments | $(160,177 | ) | ||||||
Change in net assets from operations | $(99,987 | ) |
See Notes to Financial Statements
10
Table of Contents
MFS Blended Research Value Portfolio
FINANCIAL STATEMENTS | STATEMENTS OF CHANGES IN NET ASSETS
These statements describe the increases and/or decreases in net assets resulting from operations, any distributions, and any shareholder transactions.
For years ended 12/31 | 2011 | 2010 | ||||||
Change in net assets | ||||||||
From operations | ||||||||
Net investment income | $60,190 | $70,637 | ||||||
Net realized gain (loss) on investments | 176,366 | 214,305 | ||||||
Net unrealized gain (loss) on investments | (336,543 | ) | 339,872 | |||||
Change in net assets from operations | $(99,987 | ) | $624,814 | |||||
Distributions declared to shareholders | ||||||||
From net investment income | $(63,011 | ) | $(72,000 | ) | ||||
Change in net assets from fund share transactions | $(1,936,989 | ) | $72,000 | |||||
Total change in net assets | $(2,099,987 | ) | $624,814 | |||||
Net assets | ||||||||
At beginning of period | 4,607,940 | 3,983,126 | ||||||
At end of period | $2,507,953 | $4,607,940 |
See Notes to Financial Statements
11
Table of Contents
MFS Blended Research Value Portfolio
FINANCIAL STATEMENTS | FINANCIAL HIGHLIGHTS
The financial highlights table is intended to help you understand the fund’s financial performance for the past 5 years (or life of a particular share class, if shorter). Certain information reflects financial results for a single fund share. The total returns in the table represent the rate by which an investor would have earned (or lost) on an investment in the fund share class (assuming reinvestment of all distributions) held for the entire period.
| Initial Class | Years ended 12/31 | |||||||||||||||||||
| 2011 | 2010 | 2009 | 2008 | 2007 (c) | ||||||||||||||||
Net asset value, beginning of period | $8.64 | $7.59 | $6.40 | $10.07 | $10.00 | |||||||||||||||
| Income (loss) from investment operations | ||||||||||||||||||||
Net investment income (d) | $0.14 | $0.14 | $0.14 | $0.18 | $0.01 | |||||||||||||||
Net realized and unrealized gain (loss) on investments | (0.06 | ) | 1.06 | 1.20 | (3.66 | ) | 0.07 | |||||||||||||
Total from investment operations | $0.08 | $1.20 | $1.34 | $(3.48 | ) | $0.08 | ||||||||||||||
| Less distributions declared to shareholders | ||||||||||||||||||||
From net investment income | $(0.23 | ) | $(0.15 | ) | $(0.14 | ) | $(0.17 | ) | $(0.01 | ) | ||||||||||
From net realized gain on investments | — | — | — | — | (0.00 | )(w) | ||||||||||||||
From tax return of capital | — | — | (0.01 | ) | (0.02 | ) | (0.00 | )(w) | ||||||||||||
Total distributions declared to shareholders | $(0.23 | ) | $(0.15 | ) | $(0.15 | ) | $(0.19 | ) | $(0.01 | ) | ||||||||||
Net asset value, end of period (x) | $8.49 | $8.64 | $7.59 | $6.40 | $10.07 | |||||||||||||||
Total return (%) (k)(r)(s)(x) | 0.95 | 15.77 | 20.90 | (34.44 | ) | 0.80 | (n) | |||||||||||||
| Ratios (%) (to average net assets) and Supplemental data: | ||||||||||||||||||||
Expenses before expense reductions (f) | 2.82 | 2.67 | 2.96 | 2.79 | 10.80 | (a) | ||||||||||||||
Expenses after expense reductions (f) | 0.60 | 0.60 | 0.60 | 0.60 | 0.60 | (a) | ||||||||||||||
Net investment income | 1.60 | 1.82 | 2.17 | 2.10 | 2.22 | (a) | ||||||||||||||
Portfolio turnover | 64 | 65 | 50 | 49 | 0 | |||||||||||||||
Net assets at end of period (000 omitted) | $2,335 | $2,313 | $1,997 | $1,651 | $2,519 | |||||||||||||||
See Notes to Financial Statements
12
Table of Contents
MFS Blended Research Value Portfolio
Financial Highlights – continued
| Service Class | Years ended 12/31 | |||||||||||||||||||
| 2011 | 2010 | 2009 | 2008 | 2007 (c) | ||||||||||||||||
Net asset value, beginning of period | $8.64 | $7.59 | $6.40 | $10.07 | $10.00 | |||||||||||||||
| Income (loss) from investment operations | ||||||||||||||||||||
Net investment income (d) | $0.12 | $0.12 | $0.13 | $0.16 | $0.01 | |||||||||||||||
Net realized and unrealized gain (loss) on investments | (0.07 | ) | 1.06 | 1.19 | (3.66 | ) | 0.07 | |||||||||||||
Total from investment operations | $0.05 | $1.18 | $1.32 | $(3.50 | ) | $0.08 | ||||||||||||||
| Less distributions declared to shareholders | ||||||||||||||||||||
From net investment income | $(0.02 | ) | $(0.13 | ) | $(0.13 | ) | $(0.16 | ) | $(0.01 | ) | ||||||||||
From net realized gain on investments | — | — | — | — | (0.00 | )(w) | ||||||||||||||
From tax return of capital | — | — | (0.00 | )(w) | (0.01 | ) | (0.00 | )(w) | ||||||||||||
Total distributions declared to shareholders | $(0.02 | ) | $(0.13 | ) | $(0.13 | ) | $(0.17 | ) | $(0.01 | ) | ||||||||||
Net asset value, end of period (x) | $8.67 | $8.64 | $7.59 | $6.40 | $10.07 | |||||||||||||||
Total return (%) (k)(r)(s)(x) | 0.54 | 15.51 | 20.64 | (34.66 | ) | 0.80 | (n) | |||||||||||||
| Ratios (%) (to average net assets) and Supplemental data: | ||||||||||||||||||||
Expenses before expense reductions (f) | 2.78 | 2.92 | 3.21 | 3.04 | 11.05 | (a) | ||||||||||||||
Expenses after expense reductions (f) | 0.85 | 0.85 | 0.85 | 0.85 | 0.85 | (a) | ||||||||||||||
Net investment income | 1.31 | 1.57 | 1.95 | 1.85 | 1.97 | (a) | ||||||||||||||
Portfolio turnover | 64 | 65 | 50 | 49 | 0 | |||||||||||||||
Net assets at end of period (000 omitted) | $173 | $2,295 | $1,986 | $1,647 | $2,519 | |||||||||||||||
| (a) | Annualized. |
| (c) | For the period from the commencement of the fund’s investment operations, December 18, 2007, through the stated period end. |
| (d) | Per share data is based on average shares outstanding. |
| (f) | Ratios do not reflect reductions from fees paid indirectly, if applicable. |
| (k) | The total return does not reflect expenses that apply to separate accounts. Inclusion of these charges would reduce the total return figures for all periods shown. |
| (n) | Not annualized. |
| (r) | Certain expenses have been reduced without which performance would have been lower. |
| (s) | From time to time the fund may receive proceeds from litigation settlements, without which performance would be lower. |
| (w) | Per share amount was less than $0.01. |
| (x) | The net asset values per share and total returns have been calculated on net assets which include adjustments made in accordance with U.S. generally accepted accounting principles required at period end for financial reporting purposes. |
See Notes to Financial Statements
13
Table of Contents
MFS Blended Research Value Portfolio
| (1) | Business and Organization |
MFS Blended Research Value Portfolio (the fund) is a series of MFS Variable Insurance Trust II (the trust). The trust is organized as a Massachusetts business trust and is registered under the Investment Company Act of 1940, as amended, as an open-end management investment company. The shareholders of each series of the trust are separate accounts of insurance companies, which offer variable annuity and/or life insurance products, and qualified retirement and pension plans.
| (2) | Significant Accounting Policies |
General – The preparation of financial statements in conformity with U.S. generally accepted accounting principles requires management to make estimates and assumptions that affect the reported amounts of assets and liabilities, and disclosure of contingent assets and liabilities at the date of the financial statements and the reported amounts of revenues and expenses during the reporting period. Actual results could differ from those estimates. In the preparation of these financial statements, management has evaluated subsequent events occurring after the date of the fund’s Statement of Assets and Liabilities through the date that the financial statements were issued. The fund invests in foreign securities, including securities of emerging market issuers. Investments in foreign securities are vulnerable to the effects of changes in the relative values of the local currency and the U.S. dollar and to the effects of changes in each country’s legal, political, and economic environment. The markets of emerging markets countries are generally more volatile than the markets of developed countries with more mature economies. All of the risks of investing in foreign securities previously described are heightened when investing in emerging markets countries.
In December 2011, the Financial Accounting Standards Board issued Accounting Standards Update 2011-11, Balance Sheet (Topic 210) – Disclosures about Offsetting Assets and Liabilities (“ASU 2011-11”). Effective for annual reporting periods beginning on or after January 1, 2013 and interim periods within those annual periods, ASU 2011-11 is intended to enhance disclosure requirements on the offsetting of financial assets and liabilities. Although still evaluating the potential impacts of ASU 2011-11 to the fund, management expects that the impact of the fund’s adoption will be limited to additional financial statement disclosures.
Investment Valuations – Equity securities, including restricted equity securities, are generally valued at the last sale or official closing price as provided by a third-party pricing service on the market or exchange on which they are primarily traded. Equity securities, for which there were no sales reported that day, are generally valued at the last quoted daily bid quotation as provided by a third-party pricing service on the market or exchange on which such securities are primarily traded. Equity securities held short, for which there were no sales reported for that day, are generally valued at the last quoted daily ask quotation as provided by a third-party pricing service on the market or exchange on which such securities are primarily traded. Short-term instruments with a maturity at issuance of 60 days or less generally are valued at amortized cost, which approximates market value. Open-end investment companies are generally valued at net asset value per share. Securities and other assets generally valued on the basis of information from a third-party pricing service may also be valued at a broker/dealer bid quotation. Values obtained from third-party pricing services can utilize both transaction data and market information such as yield, quality, coupon rate, maturity, type of issue, trading characteristics, and other market data. The values of foreign securities and other assets and liabilities expressed in foreign currencies are converted to U.S. dollars using the mean of bid and asked prices for rates provided by a third-party pricing service.
The Board of Trustees has delegated primary responsibility for determining or causing to be determined the value of the fund’s investments (including any fair valuation) to the adviser pursuant to valuation policies and procedures approved by the Board. If the adviser determines that reliable market quotations are not readily available, investments are valued at fair value as determined in good faith by the adviser in accordance with such procedures under the oversight of the Board of Trustees. Under the fund’s valuation policies and procedures, market quotations are not considered to be readily available for most types of debt instruments and floating rate loans and many types of derivatives. These investments are generally valued at fair value based on information from third-party pricing services. In addition, investments may be valued at fair value if the adviser determines that an investment’s value has been materially affected by events occurring after the close of the exchange or market on which the investment is principally traded (such as foreign exchange or market) and prior to the determination of the fund’s net asset value, or after the halting of trading of a specific security where trading does not resume prior to the close of the exchange or market on which the security is principally traded. Events that occur on a frequent basis after foreign markets close (such as developments in foreign markets and significant movements in the U.S. markets) and prior to the determination of the fund’s net asset value may be deemed to have a material effect on the value of securities traded in foreign markets. Accordingly, the fund’s foreign equity securities may often be valued at fair value. The adviser generally relies on third-party pricing services or other information (such as the correlation with price movements of similar securities in the same or other markets; the type, cost and investment characteristics of the security; the business and financial condition of the issuer; and trading and other market data) to assist in determining whether to fair value and at what value to fair value an
14
Table of Contents
MFS Blended Research Value Portfolio
Notes to Financial Statements – continued
investment. The value of an investment for purposes of calculating the fund’s net asset value can differ depending on the source and method used to determine value. When fair valuation is used, the value of an investment used to determine the fund’s net asset value may differ from quoted or published prices for the same investment. There can be no assurance that the fund could obtain the fair value assigned to an investment if it were to sell the investment at the same time at which the fund determines its net asset value per share.
Various inputs are used in determining the value of the fund’s assets or liabilities. These inputs are categorized into three broad levels. In certain cases, the inputs used to measure fair value may fall into different levels of the fair value hierarchy. In such cases, an investment’s level within the fair value hierarchy is based on the lowest level of input that is significant to the fair value measurement. The fund’s assessment of the significance of a particular input to the fair value measurement in its entirety requires judgment, and considers factors specific to the investment. Level 1 includes unadjusted quoted prices in active markets for identical assets or liabilities. Level 2 includes other significant observable market-based inputs (including quoted prices for similar securities, interest rates, prepayment speed, and credit risk). Level 3 includes unobservable inputs, which may include the adviser’s own assumptions in determining the fair value of investments. The following is a summary of the levels used as of December 31, 2011 in valuing the fund’s assets or liabilities:
| Investments at Value | Level 1 | Level 2 | Level 3 | Total | ||||||||||||
| Equity Securities | $2,482,302 | $— | $— | $2,482,302 | ||||||||||||
| Mutual Funds | 48,455 | — | — | 48,455 | ||||||||||||
| Total Investments | $2,530,757 | $— | $— | $2,530,757 | ||||||||||||
For further information regarding security characteristics, see the Portfolio of Investments.
Foreign Currency Translation – Purchases and sales of foreign investments, income, and expenses are converted into U.S. dollars based upon currency exchange rates prevailing on the respective dates of such transactions or on the reporting date for foreign denominated receivables and payables. Gains and losses attributable to foreign currency exchange rates on sales of securities are recorded for financial statement purposes as net realized gains and losses on investments. Gains and losses attributable to foreign exchange rate movements on receivables, payables, income and expenses are recorded for financial statement purposes as foreign currency transaction gains and losses. That portion of both realized and unrealized gains and losses on investments that results from fluctuations in foreign currency exchange rates is not separately disclosed.
Indemnifications – Under the fund’s organizational documents, its officers and Trustees may be indemnified against certain liabilities and expenses arising out of the performance of their duties to the fund. Additionally, in the normal course of business, the fund enters into agreements with service providers that may contain indemnification clauses. The fund’s maximum exposure under these agreements is unknown as this would involve future claims that may be made against the fund that have not yet occurred.
Investment Transactions and Income – Investment transactions are recorded on the trade date. Dividends received in cash are recorded on the ex-dividend date. Certain dividends from foreign securities will be recorded when the fund is informed of the dividend if such information is obtained subsequent to the ex-dividend date. Dividend and interest payments received in additional securities are recorded on the ex-dividend or ex-interest date in an amount equal to the value of the security on such date. The fund may receive proceeds from litigation settlements. Any proceeds received from litigation involving portfolio holdings are reflected in the Statement of Operations in realized gain/loss if the security has been disposed of by the fund or in unrealized gain/loss if the security is still held by the fund. Any other proceeds from litigation not related to portfolio holdings are reflected as other income in the Statement of Operations.
Fees Paid Indirectly – The fund’s custody fee may be reduced according to an arrangement that measures the value of cash deposited with the custodian by the fund. This amount, for the year ended December 31, 2011, is shown as a reduction of total expenses on the Statement of Operations.
Tax Matters and Distributions – The fund intends to qualify as a regulated investment company, as defined under Subchapter M of the Internal Revenue Code, and to distribute all of its taxable income, including realized capital gains. As a result, no provision for federal income tax is required. The fund’s federal tax returns for the prior three fiscal years remain subject to examination by the Internal Revenue Service. Foreign taxes have been accrued by the fund in the accompanying financial statements.
Distributions to shareholders are recorded on the ex-dividend date. Income and capital gain distributions are determined in accordance with income tax regulations, which may differ from U.S. generally accepted accounting principles. Certain capital accounts in the financial statements are periodically adjusted for permanent differences in order to reflect their tax character. These adjustments have no impact on net assets or net asset value per share. Temporary differences which arise from recognizing certain items of income, expense, gain or loss in different periods for financial statement and tax purposes will
15
Table of Contents
MFS Blended Research Value Portfolio
Notes to Financial Statements – continued
reverse at some time in the future. Distributions in excess of net investment income or net realized gains are temporary overdistributions for financial statement purposes resulting from differences in the recognition or classification of income or distributions for financial statement and tax purposes.
During the year ended December 31, 2011, there were no significant adjustments due to differences between book and tax accounting.
The tax character of distributions declared to shareholders for the last two fiscal years is as follows:
| 12/31/11 | 12/31/10 | |||||||
| Ordinary income (including any short-term capital gains) (a) | $63,011 | $72,000 | ||||||
| (a) | Included in the fund’s 2011 and 2010 distributions from ordinary income is $2,821 and $1,363, respectively, in excess of investment company taxable income which, in accordance with applicable U.S. tax law, is taxable to shareholders as ordinary income distributions. |
The federal tax cost and the tax basis components of distributable earnings were as follows:
| As of 12/31/11 | ||||
| Cost of investments | $2,748,776 | |||
| Gross appreciation | 172,016 | |||
| Gross depreciation | (390,035 | ) | ||
| Net unrealized appreciation (depreciation) | $(218,019 | ) | ||
| Capital loss carryforwards | (551,601 | ) | ||
| Post-October capital loss deferral | (10,922 | ) |
Under the Regulated Investment Company Modernization Act of 2010 (the “Act”), net capital losses recognized after December 31, 2010 may be carried forward indefinitely, and their character is retained as short-term and/or long-term losses. Previously, net capital losses were carried forward for eight years and treated as short-term losses. As a transition rule, the Act requires that post-enactment net capital losses be used before pre-enactment net capital losses.
As of December 31, 2011, the fund had capital loss carryforwards available to offset future realized gains. Such losses expire as follows:
| Pre-enactment losses: | ||||
| 12/31/17 | $(551,601 | ) |
Multiple Classes of Shares of Beneficial Interest – The fund offers multiple classes of shares, which differ in their respective distribution and/or service fees. The fund’s income, realized and unrealized gain (loss), and common expenses are allocated to shareholders based on the daily net assets of each class. Dividends are declared separately for each class. Differences in per share dividend rates are generally due to differences in separate class expenses. The fund’s distributions declared to shareholders as reported on the Statements of Changes in Net Assets are presented by class as follows:
| From net investment income | ||||||||
| Year ended 12/31/11 | Year ended 12/31/10 | |||||||
| Initial Class | $62,670 | $38,696 | ||||||
| Service Class | 341 | 33,304 | ||||||
| Total | $63,011 | $72,000 | ||||||
| (3) | Transactions with Affiliates |
Investment Adviser – The fund has an investment advisory agreement with MFS to provide overall investment management and related administrative services and facilities to the fund. The management fee is computed daily and paid monthly at an annual rate of 0.60% of the fund’s average daily net assets.
The investment adviser has agreed in writing to pay a portion of the fund’s total annual operating expenses, exclusive of interest, taxes, extraordinary expenses, brokerage and transaction costs and investment-related expenses, such that total annual operating expenses do not exceed 0.60% of average daily net assets for the Initial Class shares and 0.85% of average daily net assets for the Service Class shares. This written agreement will continue until April 30, 2013. For the year ended December 31, 2011, this reduction amounted to $85,259 and is reflected as a reduction of total expenses in the Statement of Operations.
Distributor – MFS Fund Distributors, Inc. (MFD), a wholly-owned subsidiary of MFS, is the distributor of shares of the fund. The Trustees have adopted a distribution plan for the Service Class shares pursuant to Rule 12b-1 under the Investment Company Act of 1940.
16
Table of Contents
MFS Blended Research Value Portfolio
Notes to Financial Statements – continued
The fund’s distribution plan provides that the fund will pay MFD distribution and/or service fees equal to 0.25% per annum of its average daily net assets attributable to Service Class shares as partial consideration for services performed and expenses incurred by MFD and financial intermediaries (including participating insurance companies that invest in the fund to fund variable annuity and variable life insurance contracts, sponsors of qualified retirement and pension plans that invest in the fund, and affiliates of these participating insurance companies and plan sponsors) in connection with the sale and distribution of the Service Class shares. MFD may subsequently pay all, or a portion, of the distribution and/or service fees to financial intermediaries.
Shareholder Servicing Agent – MFS Service Center, Inc. (MFSC), a wholly-owned subsidiary of MFS, receives a fee from the fund for its services as shareholder servicing agent. For the year ended December 31, 2011, the fee was $443, which equated to 0.0109% annually of the fund’s average daily net assets. MFSC also receives payment from the fund for out-of-pocket expenses paid by MFSC on behalf of the fund. For the year ended December 31, 2011, these costs amounted to $2.
Administrator – MFS provides certain financial, legal, shareholder communications, compliance, and other administrative services to the fund. Under an administrative services agreement, the fund partially reimburses MFS the costs incurred to provide these services. The fund is charged an annual fixed amount of $17,500 plus a fee based on average daily net assets. The administrative services fee incurred for the year ended December 31, 2011 was equivalent to an annual effective rate of 0.4298% of the fund’s average daily net assets.
Trustees’ and Officers’ Compensation – The fund pays compensation to Trustees in the form of a retainer, attendance fees, and additional compensation to the Board chairperson. The fund does not pay compensation directly to officers of the fund who are also officers of the investment adviser, all of whom receive remuneration for their services to the fund from MFS. Certain officers of the fund are officers or directors of MFS, MFD, and MFSC.
Other – This fund and certain other funds managed by MFS (the funds) have entered into services agreements (the Agreements) which provide for payment of fees by the funds to Tarantino LLC and Griffin Compliance LLC in return for the provision of services of an Independent Chief Compliance Officer (ICCO) and Assistant ICCO, respectively, for the funds. The ICCO and Assistant ICCO are officers of the funds and the sole members of Tarantino LLC and Griffin Compliance LLC, respectively. The funds can terminate the Agreements with Tarantino LLC and Griffin Compliance LLC at any time under the terms of the Agreements. MFS has agreed to bear all expenses associated with office space, other administrative support, and supplies provided to the ICCO and Assistant ICCO. For the year ended December 31, 2011, the aggregate fees paid by the fund to Tarantino LLC and Griffin Compliance LLC were $67 and are included in miscellaneous expense on the Statement of Operations.
The fund invests in the MFS Institutional Money Market Portfolio which is managed by MFS and seeks a high level of current income consistent with preservation of capital and liquidity. Income earned on this investment is included in dividends from underlying affiliated funds on the Statement of Operations. This money market fund does not pay a management fee to MFS.
On September 14, 2011, MFS redeemed 245,700 shares of the Service Class for an aggregate amount of $2,000,000. At December 31, 2011, MFS was the sole shareholder of both classes.
| (4) | Portfolio Securities |
Purchases and sales of investments, other than U.S. Government securities, purchased option transactions, and short-term obligations, aggregated $2,590,402 and $4,516,598, respectively.
| (5) | Shares of Beneficial Interest |
The fund’s Declaration of Trust permits the Trustees to issue an unlimited number of full and fractional shares of beneficial interest. Transactions in fund shares were as follows:
| Year ended 12/31/11 | Year ended 12/31/10 | |||||||||||||||
| Shares | Amount | Shares | Amount | |||||||||||||
| Shares issued to shareholders in reinvestment of distributions | ||||||||||||||||
Initial Class | 7,330 | $62,670 | 4,479 | $38,696 | ||||||||||||
Service Class | 38 | 341 | 3,855 | 33,304 | ||||||||||||
| 7,368 | $63,011 | 8,334 | $72,000 | |||||||||||||
| Shares reacquired | ||||||||||||||||
Service Class | (245,700 | ) | $(2,000,000 | ) | — | $— | ||||||||||
| Net change | ||||||||||||||||
Initial Class | 7,330 | $62,670 | 4,479 | $38,696 | ||||||||||||
Service Class | (245,662 | ) | (1,999,659 | ) | 3,855 | 33,304 | ||||||||||
| (238,332 | ) | $(1,936,989 | ) | 8,334 | $72,000 | |||||||||||
17
Table of Contents
MFS Blended Research Value Portfolio
Notes to Financial Statements – continued
| (6) | Line of Credit |
The fund and certain other funds managed by MFS participate in a $1.1 billion unsecured committed line of credit, subject to a $1 billion sublimit, provided by a syndication of banks under a credit agreement. Borrowings may be made for temporary financing needs. Interest is charged to each fund, based on its borrowings, generally at a rate equal to the higher of the Federal Reserve funds rate or one month LIBOR plus an agreed upon spread. A commitment fee, based on the average daily, unused portion of the committed line of credit, is allocated among the participating funds at the end of each calendar quarter. In addition, the fund and other funds managed by MFS have established unsecured uncommitted borrowing arrangements with certain banks for temporary financing needs. Interest is charged to each fund, based on its borrowings, at a rate equal to the Federal Reserve funds rate plus an agreed upon spread. For the year ended December 31, 2011, the fund’s commitment fee and interest expense were $33 and $0, respectively, and are included in miscellaneous expense on the Statement of Operations.
| (7) | Transactions in Underlying Affiliated Funds – Affiliated Issuers |
An affiliated issuer may be considered one in which the fund owns 5% or more of the outstanding voting securities, or a company which is under common control. For the purposes of this report, the fund assumes the following to be affiliated issuers:
| Underlying Affiliated Funds | Beginning Shares/Par Amount | Acquisitions Shares/Par Amount | Dispositions Shares/Par Amount | Ending Shares/Par Amount | ||||||||||||
| MFS Institutional Money Market Portfolio | 51,719 | 218,200 | (221,464 | ) | 48,455 | |||||||||||
| Underlying Affiliated Funds | Realized Gain (Loss) | Capital Gain Distributions | Dividend Income | Ending Value | ||||||||||||
| MFS Institutional Money Market Portfolio | $— | $— | $66 | $48,455 | ||||||||||||
18
Table of Contents
MFS Blended Research Value Portfolio
REPORT OF INDEPENDENT REGISTERED PUBLIC ACCOUNTING FIRM
To the Board of Trustees of MFS Variable Insurance Trust II and the Shareholder of
MFS Blended Research Value Portfolio:
We have audited the accompanying statement of assets and liabilities, including the portfolio of investments, of MFS Blended Research Value Portfolio (the “Fund”) (one of the portfolios comprising MFS Variable Insurance Trust II) as of December 31, 2011, and the related statement of operations for the year then ended, the statements of changes in net assets for each of the two years in the period then ended, and the financial highlights for each of the five years in the period then ended. These financial statements and financial highlights are the responsibility of the Fund’s management. Our responsibility is to express an opinion on these financial statements and financial highlights based on our audits.
We conducted our audits in accordance with the standards of the Public Company Accounting Oversight Board (United States). Those standards require that we plan and perform the audit to obtain reasonable assurance about whether the financial statements and financial highlights are free of material misstatement. The Fund is not required to have, nor were we engaged to perform, an audit of its internal control over financial reporting. Our audits included consideration of internal control over financial reporting as a basis for designing audit procedures that are appropriate in the circumstances, but not for the purpose of expressing an opinion on the effectiveness of the Fund’s internal control over financial reporting. Accordingly, we express no such opinion. An audit also includes examining, on a test basis, evidence supporting the amounts and disclosures in the financial statements, assessing the accounting principles used and significant estimates made by management, as well as evaluating the overall financial statement presentation. Our procedures included confirmation of securities owned as of December 31, 2011, by correspondence with the custodian. We believe that our audits provide a reasonable basis for our opinion.
In our opinion, the financial statements and financial highlights referred to above present fairly, in all material respects, the financial position of MFS Blended Research Value Portfolio as of December 31, 2011, the results of its operations for the year then ended, the changes in its net assets for each of the two years in the period then ended, and the financial highlights for each of the five years in the period then ended, in conformity with accounting principles generally accepted in the United States of America.
DELOITTE & TOUCHE LLP
Boston, Massachusetts
February 15, 2012
19
Table of Contents
MFS Blended Research Value Portfolio
RESULTS OF SHAREHOLDER MEETING (unaudited)
At a special meeting of shareholders of MFS Blended Research Value Portfolio, which was held on December 1, 2011, the following actions were taken for which shareholders of all series of MFS Variable Insurance Trust II voted together as a single class with respect to Item 1 and shareholders of MFS Blended Research Value Portfolio voted as a separate class with respect to Items 2 and 3:
Item 1: Election of ten Trustees as members of the Board of Trustees of the Trust effective January 1, 2012:
| Number of Shares | ||||||||
| For | Withheld Authority | |||||||
| Robert E. Butler | 681,916,712.8686 | 46,472,894.9218 | ||||||
| Maureen R. Goldfarb | 682,835,794.8512 | 45,553,812.9392 | ||||||
| David H. Gunning | 681,500,267.3085 | 46,889,340.4819 | ||||||
| William R. Gutow | 681,050,223.5547 | 47,339,384.2357 | ||||||
| Michael Hegarty | 682,477,088.8584 | 45,912,518.9320 | ||||||
| John P. Kavanaugh | 683,794,425.4269 | 44,595,182.3635 | ||||||
| Robert J. Manning | 682,699,559.7374 | 45,690,048.0530 | ||||||
| J. Dale Sherratt | 681,362,743.0513 | 47,026,864.7391 | ||||||
| Laurie J. Thomsen | 683,408,094.0000 | 44,981,513.7904 | ||||||
| Robert W. Uek | 681,424,852.0247 | 46,964,755.7657 | ||||||
Item 2: To approve a new investment advisory agreement dated January 1, 2012, between the Trust, on behalf of MFS Blended Research Value Portfolio, and MFS:
| Number of Shares | ||||||||||||
| For | Against | Withheld Authority | ||||||||||
| 287,500.4660 | — | — | ||||||||||
Item 3: To approve revisions to and restatements of certain fundamental investment restrictions of MFS Blended Research Value Portfolio effective January 1, 2012 as detailed below:
| Number of Shares | ||||||||||||||
| For | Against | Withheld Authority | ||||||||||||
| A. | Borrowing | 287,500.4660 | — | — | ||||||||||
| B. | Underwriting Securities | 287,500.4660 | — | — | ||||||||||
| C. | Issuance of Senior Securities | 287,500.4660 | — | — | ||||||||||
| D. | Lending of Money or Securities | 287,500.4660 | — | — | ||||||||||
| E. | Purchases or Sales of Real Estate; Interests in Oil, Gas or Mineral Leases; and Commodities | 287,500.4660 | — | — | ||||||||||
| F. | Industry Concentration | 287,500.4660 | — | — | ||||||||||
20
Table of Contents
MFS Blended Research Value Portfolio
TRUSTEES AND OFFICERS – IDENTIFICATION AND BACKGROUND
The Trustees and officers of the Trust, as of February 1, 2012, are listed below, together with their principal occupations during the past five years. (Their titles may have varied during that period.) The address of each Trustee and officer is 500 Boylston Street, Boston, Massachusetts 02116.
Name, Age | Position(s) with Fund | Trustee/Officer Since (h) | Principal Occupations | Other Directorships (j) | ||||
| INTERESTED TRUSTEES | ||||||||
Robert J. Manning (k) (age 48) | Trustee | February 2004 | Massachusetts Financial Services Company, Chairman, Chief Executive Officer and Director; President (until December 2009); Chief Investment Officer (until July 2010) | N/A | ||||
| INDEPENDENT TRUSTEES | ||||||||
David H. Gunning (age 69) | Trustee and Chair of Trustees | January 2004 | Retired; Cleveland-Cliffs Inc. (mining products and service provider), Vice Chairman/Director (until May 2007) | Lincoln Electric Holdings, Inc. (welding equipment manufacturer), Director; Development Alternatives, Inc. (consulting), Director/Non-Executive Chairman; Portman Limited (mining), Director (until 2008) | ||||
Robert E. Butler (age 70) | Trustee | January 2006 | Consultant – investment company industry regulatory and compliance matters | N/A | ||||
Maureen R. Goldfarb (age 56) | Trustee | January 2009 | Private investor | N/A | ||||
William R. Gutow (age 70) | Trustee | December 1993 | Private investor and real estate consultant; Capitol Entertainment Management Company (video franchise), Vice Chairman | Atlantic Coast Tan (tanning salons), Vice Chairman (until 2007); Texas Donuts (donut franchise), Vice Chairman (until 2010) | ||||
Michael Hegarty (age 67) | Trustee | December 2004 | Private investor | N/A | ||||
John P. Kavanaugh (age 57) | Trustee | January 2009 | Private investor; The Hanover Insurance Group, Inc., Vice President and Chief Investment Officer (until 2006); Allmerica Investment Trust, Allmerica Securities Trust and Opus Investment Trust (investment companies), Chairman, President and Trustee (until 2006) | N/A | ||||
J. Dale Sherratt (age 73) | Trustee | June 1989 | Insight Resources, Inc. (acquisition planning specialists), President; Wellfleet Investments (investor in health care companies), Managing General Partner | N/A | ||||
Laurie J. Thomsen (age 54) | Trustee | March 2005 | Private investor; New Profit, Inc. (venture philanthropy), Executive Partner (until 2010) | The Travelers Companies (property and casualty insurance), Director | ||||
Robert W. Uek (age 70) | Trustee | January 2006 | Consultant to investment company industry | N/A | ||||
| OFFICERS | ||||||||
John M. Corcoran (k) (age 46) | President | October 2008 | Massachusetts Financial Services Company, Senior Vice President (since October 2008); State Street Bank and Trust (financial services provider), Senior Vice President, (until September 2008) | N/A | ||||
| Christopher R. Bohane (k) (age 38) | Assistant Secretary and Assistant Clerk | July 2005 | Massachusetts Financial Services Company, Vice President and Senior Counsel | N/A | ||||
Kino Clark (k) (age 43) | Assistant Treasurer | January 2012 | Massachusetts Financial Services Company, Assistant Vice President | N/A | ||||
21
Table of Contents
MFS Blended Research Value Portfolio
Trustees and Officers – continued
Name, Age | Position(s) with Fund | Trustee/Officer Since (h) | Principal Occupations | Other Directorships (j) | ||||
Ethan D. Corey (k) (age 48) | Assistant Secretary and Assistant Clerk | July 2005 | Massachusetts Financial Services Company, Senior Vice President and Associate General Counsel | N/A | ||||
David L. DiLorenzo (k) (age 43) | Treasurer | July 2005 | Massachusetts Financial Services Company, Vice President | N/A | ||||
Robyn L. Griffin (age 36) | Assistant Independent Chief Compliance Officer | August 2008 | Griffin Compliance LLC (provider of compliance services), Principal (since August 2008); State Street Corporation (financial services provider), Mutual Fund Administration Assistant Vice President (October 2006 – July 2008); Liberty Mutual Group (insurance), Personal Market Assistant Controller (April 2006 – October 2006); Deloitte & Touche LLP (professional services firm). | N/A | ||||
Brian E. Langenfeld (k) (age 38) | Assistant Secretary and Assistant Clerk | June 2006 | Massachusetts Financial Services Company, Vice President and Senior Counsel | N/A | ||||
Ellen Moynihan (k) (age 54) | Assistant Treasurer | April 1997 | Massachusetts Financial Services Company, Senior Vice President | N/A | ||||
Susan S. Newton (k) (age 61) | Assistant Secretary and Assistant Clerk | May 2005 | Massachusetts Financial Services Company, Senior Vice President and Associate General Counsel | N/A | ||||
Susan A. Pereira (k) (age 41) | Assistant Secretary and Assistant Clerk | July 2005 | Massachusetts Financial Services Company, Vice President and Senior Counsel | N/A | ||||
Mark N. Polebaum (k) (age 59) | Secretary and Clerk | January 2006 | Massachusetts Financial Services Company, Executive Vice President, General Counsel and Secretary | N/A | ||||
Frank L. Tarantino (age 67) | Independent Chief Compliance Officer | June 2004 | Tarantino LLC (provider of compliance services), Principal | N/A | ||||
Richard S. Weitzel (k) (age 41) | Assistant Secretary and Assistant Clerk | October 2007 | Massachusetts Financial Services Company, Vice President and Assistant General Counsel | N/A | ||||
James O. Yost (k) (age 51) | Deputy Treasurer | September 1990 | Massachusetts Financial Services Company, Senior Vice President | N/A | ||||
| (h) | Date first appointed to serve as Trustee/officer of an MFS fund. Each Trustee has served continuously since appointment unless indicated otherwise. For the period from December 15, 2004 until February 22, 2005, Mr. Manning served as Advisory Trustee. For the period October 2008, until January 2012, Mr. Corcoran served as Treasurer of the Funds. Prior to January 2012, Messrs. DiLorenzo and Yost served as Assistant Treasurers of the Funds. |
| (j) | Directorships or trusteeships of companies required to report to the Securities and Exchange Commission (i.e., “public companies”). |
| (k) | “Interested person” of the Trust within the meaning of the Investment Company Act of 1940 (referred to as the 1940 Act), which is the principal federal law governing investment companies like the fund, as a result of position with MFS. The address of MFS is 500 Boylston Street, Boston, Massachusetts 02116. |
Each Trustee has been elected by shareholders and each Trustee and officer holds office until his or her successor is chosen and qualified or until his or her earlier death, resignation, retirement or removal. The Trust does not hold annual meetings for the purpose of electing Trustees, and Trustees are not elected for fixed terms. Messrs. Butler, Kavanaugh, Uek and Ms. Thomsen are members of the Trust’s Audit Committee.
Each of the Fund’s Trustees and officers holds comparable positions with certain other funds of which MFS or a subsidiary is the investment adviser or distributor, and, in the case of the officers, with certain affiliates of MFS. As of January 1, 2012, the Trustees served as board members of 131 funds within the MFS Family of Funds.
22
Table of Contents
MFS Blended Research Value Portfolio
Trustees and Officers – continued
The Statement of Additional Information for the Fund includes further information about the Trustees and is available without charge upon request by calling 1-800-225-2606.
Investment Adviser Massachusetts Financial Services Company 500 Boylston Street, Boston, MA 02116-3741 | Custodian State Street Bank and Trust 1 Lincoln Street, Boston, MA 02111-2900 | |
Distributor MFS Fund Distributors, Inc. 500 Boylston Street, Boston, MA 02116-3741 | Independent Registered Public Accounting Firm Deloitte & Touche LLP 200 Berkeley Street, Boston, MA 02116 | |
Portfolio Manager Jonathan Sage |
23
Table of Contents
MFS Blended Research Value Portfolio
At a special meeting of shareholders of the MFS Blended Research Value Portfolio (hereinafter referred to as the “Fund” or the “Portfolio”), which was held on December 1, 2011, the shareholders approved a new investment advisory agreement based on the recommendation of the Board of Trustees. At its July, 2011 meeting, the Board of Trustees (i) approved, and recommended for shareholder approval, the new investment advisory agreement effective January 1, 2012, and (ii) the continuation of the existing investment advisory agreement effective September 1, 2011. The following includes a description of the factors that the Board of Trustees considered and the conclusions that formed the basis of their approval of both the new investment advisory agreement and the continuation of the prior investment advisory agreement.
BOARD APPROVAL OF NEW INVESTMENT ADVISORY AGREEMENT
The Investment Company Act of 1940 requires that both the full Board of Trustees and a majority of the non-interested (“independent”) Trustees, voting separately, initially approve the new investment advisory agreement (the “New Agreement”) between Massachusetts Financial Services Company (“MFS”) and MFS Variable Insurance Trust II (the “Trust”) on behalf of the Portfolio and, beginning on the second anniversary of the initial effective date of the New Agreement, annually approve the continuation of the New Agreement. The Trustees have considered matters bearing on the Portfolio and the then current advisory arrangement at their meetings throughout the year, including a review of performance data at each regular meeting. In addition, the independent Trustees met in person in July 2011 to consider the initial approval of the New Agreement, and to recommend that shareholders approve the New Agreement. The independent Trustees were assisted in their evaluation of the New Agreement by independent legal counsel, from whom they received separate legal advice and with whom they met separately from MFS management. The independent Trustees were also assisted in this process by the Portfolio’s Independent Chief Compliance Officer, a full-time senior officer appointed by and reporting to the independent Trustees.
In connection with their deliberations regarding the initial approval of the New Agreement, the Trustees, including the independent Trustees, considered such information and factors as they believed, in light of the legal advice furnished to them and their own business judgment, to be relevant. The New Agreement was considered separately for the series of the Trust (collectively, the “Portfolios”), although the Trustees also took into account the common interests of all Portfolios in the Trust in their review. As described below, the Trustees considered the nature, quality, and extent of the various investment advisory, administrative, and/or shareholder services to be performed by MFS under the New Agreement and other arrangements with the Trust.
In connection with their initial review meeting, the Trustees received and relied upon materials that included, among other items: (i) information provided by MFS on the advisory fees of comparable portfolios of its other clients, including institutional separate account and other clients, (ii) information as to whether, and to what extent applicable, expense waivers, reimbursements or fee “breakpoints” would be observed for the Portfolio under the New Agreement, and (iii) a comparison and summary of the differences in the provisions in the New Agreement compared to those in each of the then current investment advisory agreements for the Portfolios. In addition, in connection with the independent Trustees’ meetings in May and July, 2011 (the “contract review meetings”) for the purpose of considering whether to approve the continuation of the then current investment advisory agreements for the Portfolio, the independent Trustees received: (1) information provided by Lipper Inc. (“Lipper”) on the investment performance of the Portfolio for various time periods ended December 31, 2010, compared to the investment performance of a group of funds with substantially similar investment classifications/objectives (the “Lipper performance universe”), (2) information provided by Lipper on the Portfolio’s advisory fees and other expenses compared to the advisory fees and other expenses of comparable funds identified by Lipper (the “Lipper expense group”), (3) information regarding MFS’ financial results and financial condition, including MFS’ and certain of its affiliates’ estimated profitability from services performed for the Portfolio, (4) MFS’ views regarding the outlook for the mutual fund industry and its strategic business plans, (5) descriptions of various functions performed by MFS for the Trust, such as compliance monitoring and portfolio trading practices, and (6) information regarding the overall organization of MFS, including information about MFS’ senior management and other personnel providing investment advisory, administrative and other services to the Portfolio. The comparative performance, fee and expense information prepared and provided by Lipper was not independently verified, and the independent Trustees did not independently verify any information provided to them by MFS.
The Trustees’ conclusion as to the initial approval of the New Agreement was based on comprehensive consideration of all information provided to the Trustees and was not the result of any single factor. Some of the factors that figured particularly in the Trustees’ deliberations are described below for the Portfolio, while individual Trustees may have given different weight to various factors and evaluated the information presented as a whole differently than another individual Trustee. The Trustees recognized that the fee arrangements for the Portfolio could reflect years of review and discussion between the independent Trustees and MFS, that certain aspects of such arrangements may receive greater scrutiny in some years than others, and that
24
Table of Contents
MFS Blended Research Value Portfolio
Board Approval of New Investment Advisory Agreement – continued
the Trustees’ conclusions may be based, in part, on their consideration of these same arrangements during the course of the year and in prior years.
Because the portfolio management team managing the Portfolio’s investments under the then current investment advisory agreement will remain the same under the New Agreement for the Portfolio, the Trustees compared the Portfolio’s total return investment performance to the performance of its Lipper performance universe over various time periods, based on information provided by Lipper. The Trustees placed particular emphasis on the total return performance of the Portfolio’s Initial Class shares in comparison to the performance of funds in its Lipper performance universe over the one-, three- and five-year periods ended December 31, 2010. The Trustees did not rely on performance results for more recent periods.
The Trustees noted the performance of the Portfolio’s Initial Class shares was in the 1st quintile relative to the other funds in the Lipper performance universe for the one-year period (the 1st quintile being the best performers and the 5th quintile being the worst performers). The total return performance of the Portfolio was in the 2nd quintile for the three-year period ended December 31, 2010, relative to the Lipper performance universe. Based on the nature and quality of services provided by MFS, the Board of Trustees concluded that the Portfolio’s performance was satisfactory.
In the course of their deliberations, the Trustees took into account information provided by MFS during contract review meetings, as well as during investment review meetings conducted with portfolio management personnel during the course of the year. For Portfolios whose performance lagged their peer groups, they discussed the factors that contributed thereto and MFS’ efforts to improve such Portfolios’ performance. After reviewing this information, the Trustees concluded, within the context of their overall conclusions regarding the New Agreement, that they were satisfied with MFS’ responses and efforts relating to investment performance.
In assessing the reasonableness of the Portfolio’s advisory fee, the Trustees considered, among other information, the Portfolio’s advisory fee and the total expense ratio of the Portfolio’s Initial Class shares as a percentage of average daily net assets, compared to the advisory fee and total expense ratios of its peer group of funds based on information provided by Lipper. The Trustees also considered the advisory fees charged by MFS to institutional accounts. In comparing these fees, the Trustees considered the generally broader scope of services provided by MFS to the Trust than those provided to institutional accounts. The Trustees also considered the higher demands placed on MFS’ investment personnel and trading infrastructure as a result of the daily cash in-flows and out-flows of the Portfolio, and the impact on MFS and related expenses due to the more extensive regulatory regime to which the Portfolio is subject, compared to institutional accounts.
In considering the fees, the Trustees noted from the Lipper data that the Portfolio’s effective advisory fee rate and total expense ratio were each below the median of such fees and expenses of funds in the Lipper expense group. In addition, the Trustees accepted MFS’ offer to continue the expense limitation for the Portfolio. They noted that the Portfolio’s advisory fee rate schedule is not currently subject to any breakpoints. However, the Trustees concluded that the Portfolio had not garnered sufficient assets to achieve economies of scale and that the fees were reasonable in light of the nature and quality of services provided by MFS.
The Trustees also considered whether the Portfolio is likely to benefit from any economies of scale due to future asset growth. In this regard, the Trustees reviewed the adequacy of breakpoints and discussed with MFS any adjustments necessary for the shareholders’ benefit.
The Trustees also considered information prepared by MFS relating to its costs and profits with respect to the Portfolio and other investment companies and accounts advised by MFS, as well as MFS’ methodologies used to determine and allocate its costs to the Portfolio and other accounts and products for purposes of estimating profitability.
The Trustees noted that there would be no increase to the net advisory fee arrangement for the Portfolio under the New Agreement when compared to the Portfolio’s then current investment advisory agreement. After reviewing these and other factors described below, the Trustees concluded that the advisory fees charged to the Portfolio under the New Agreement represent reasonable compensation in light of the nature and quality of the services being provided by MFS.
In addition, the Trustees considered MFS’ resources and related efforts to continue to retain, attract and motivate capable personnel to serve the Portfolio. The Trustees also considered the financial resources of MFS and its parent, Sun Life Financial Inc. The Trustees further considered any advantages and possible disadvantages of having an adviser which also serves other investment companies as well as institutional accounts.
The Trustees also considered the nature, quality, cost, and extent of administrative, transfer agency, and distribution services provided to the Trust by MFS and its affiliates under agreements and plans other than the New Agreement, including the 12b-1 fees the Portfolio pays to MFS Fund Distributors, Inc., an affiliate of MFS. The Trustees also considered the nature, extent and
25
Table of Contents
MFS Blended Research Value Portfolio
Board Approval of New Investment Advisory Agreement – continued
quality of certain other services MFS performs or arranges on the Portfolio’s behalf, which may include securities lending programs, directed expense payment programs, class action recovery programs, and MFS’ interaction with third-party service providers, principally custodians and sub-custodians. The Trustees concluded that the various non-advisory services provided by MFS and its affiliates on behalf of the Portfolio were satisfactory. The Trustees also considered the benefits to MFS from the use of the Portfolio’s portfolio brokerage commissions to pay for investment research and various other factors. Additionally, the Trustees considered so-called “fall-out benefits” to MFS such as reputational value derived from serving as investment manager to the Trust, and determined that any such benefits derived by MFS were reasonable and fair.
Based on their evaluation of factors that they deemed to be material, including those factors described above, the Board of Trustees, including a majority of the independent Trustees, concluded that the New Agreement should be approved for an initial two-year period, commencing upon its effective date, as set forth in the New Agreement.
BOARD APPROVAL OF CONTINUATION OF PRIOR INVESTMENT ADVISORY AGREEMENT
The Investment Company Act of 1940 requires that both the full Board of Trustees and a majority of the non-interested (“independent”) Trustees, voting separately, annually approve the continuation of the investment advisory agreement between MFS Variable Insurance Trust II (the “Trust”) and Massachusetts Financial Services Company (“MFS”) on behalf of the Fund. The Trustees consider matters bearing on the Fund and the advisory arrangements at their meetings throughout the year, including a review of performance data at each regular meeting. In addition, the independent Trustees met in person in May and again in July 2011 (“contract review meetings”) for the specific purpose of considering whether to approve the continuation of the investment advisory agreement for the Fund. The independent Trustees were assisted in their evaluation of the investment advisory agreement by independent legal counsel, from whom they received separate legal advice and with whom they met separately from MFS management during various contract review meetings. The independent Trustees were also assisted in this process by the Fund’s Independent Chief Compliance Officer, a full-time senior officer appointed by and reporting to the independent Trustees.
In connection with their deliberations, the Trustees, including the independent Trustees, considered such information and factors as they believed, in light of the legal advice furnished to them and their own business judgment, to be relevant. The investment advisory agreement was considered separately for the Fund, although the Trustees also took into account the common interests of all Funds in the Trust in their review. As described below, the Trustees considered the nature, quality, and extent of the various investment advisory, administrative, and shareholder services performed by MFS under the existing investment advisory agreement and other arrangements with the Trust.
In connection with their contract review meetings, the Trustees received and relied upon materials which included, among other items: (i) information provided by Lipper Inc. (“Lipper”) on the investment performance of the Fund for various time periods ended December 31, 2010, compared to the investment performance of a group of funds with substantially similar investment classifications/objectives (the “Lipper performance universe”), (ii) information provided by Lipper on the Fund’s advisory fees and other expenses compared to the advisory fees and other expenses of comparable funds identified by Lipper (the “Lipper expense group”), (iii) information provided by MFS on the advisory fees of comparable portfolios of its other clients, including institutional separate account and other clients, (iv) information as to whether, and to what extent applicable, expense waivers, reimbursements or fee “breakpoints” are observed for the Fund, (v) information regarding MFS’ financial results and financial condition, including MFS’ and certain of its affiliates’ estimated profitability from services performed for the Fund and other investment companies that the Board oversees as a whole, and for MFS’ institutional business, (vi) MFS’ views regarding the outlook for the mutual fund industry and its strategic business plans, (vii) descriptions of various functions performed by MFS for the Trust, such as compliance monitoring and portfolio trading practices, and (viii) information regarding the overall organization of MFS, including information about MFS’ senior management and other personnel providing investment advisory, administrative and other services to the Fund. The comparative performance, fee and expense information prepared and provided by Lipper was not independently verified, and the independent Trustees did not independently verify any information provided to them by MFS.
The Trustees’ conclusion as to the continuation of the investment advisory agreement was based on comprehensive consideration of all information provided to the Trustees and was not the result of any single factor. Some of the factors that figured particularly in the Trustees’ deliberations are described below for the Fund, while individual Trustees may have given different weight to various factors and evaluated the information presented as a whole differently than another individual Trustee. The Trustees recognized that the fee arrangements for the Fund reflect years of review and discussion between the independent Trustees and MFS, that certain aspects of such arrangements may receive greater scrutiny in some years than others, and that the Trustees’ conclusions may be based, in part, on their consideration of these same arrangements during the course of the year and in prior years.
26
Table of Contents
MFS Blended Research Value Portfolio
Board Approval of Continuation of Prior Investment Advisory Agreement – continued
Based on information provided by Lipper, the Trustees compared the Fund’s total return investment performance to the performance of the Lipper performance universe over various time periods. The Trustees placed particular emphasis on the total return performance of the Fund’s Initial Class shares in comparison to the performance of funds in its Lipper performance universe over the one- and three-year periods ended December 31, 2010. (The Fund commenced operations in December 2007.) The Trustees did not rely on performance results for more recent periods, including those shown elsewhere in this report.
The Trustees noted the performance of the Fund’s Initial Class shares was in the 1st quintile relative to the other funds in the Lipper performance universe for the one-year period (the 1st quintile being the best performers and the 5th quintile being the worst performers). The total return performance of the Fund was in the 2nd quintile for the three-year period ended December 31, 2010, relative to the Lipper performance universe. Based on the nature and quality of services provided by MFS, the Board of Trustees concluded that the Fund’s performance was satisfactory.
In the course of their deliberations, the Trustees took into account information provided by MFS during contract review meetings, as well as during investment review meetings conducted with portfolio management personnel during the course of the year.
In assessing the reasonableness of the Fund’s advisory fee, the Trustees considered, among other information, the Fund’s advisory fee and the total expense ratio of the Fund’s Initial Class shares as a percentage of average daily net assets, compared to the advisory fee and total expense ratios of its peer group of funds based on information provided by Lipper. The Trustees also considered the advisory fees charged by MFS to institutional accounts. In comparing these fees, the Trustees considered the generally broader scope of services provided by MFS to the Trust than those provided to institutional accounts. The Trustees also considered the higher demands placed on MFS’ investment personnel and trading infrastructure as a result of the daily cash in-flows and out-flows of the Fund, and the impact on MFS and related expenses due to the more extensive regulatory regime to which the Fund is subject, compared to institutional accounts.
In considering the fees, the Trustees noted from the Lipper data (which takes into account any reductions or expense limitations) that the Fund’s effective advisory fee rate and total expense ratio were each below the median of such fees and expenses of funds in the Lipper expense group. In addition, the Trustees accepted MFS’ offer to continue the expense limitation for the Fund. They noted that the Fund’s advisory fee rate schedule is not currently subject to any breakpoints. However, the Trustees concluded that the Fund had not garnered sufficient assets to achieve economies of scale and that the fees were reasonable in light of the nature and quality of services provided by MFS.
The Trustees also considered information prepared by MFS relating to its costs and profits with respect to the Fund and other investment companies and accounts advised by MFS, as well as MFS’ methodologies used to determine and allocate its costs to the Fund and other accounts and products for purposes of estimating profitability.
After reviewing these and other factors described below, the Trustees concluded that the advisory fees charged to the Fund represent reasonable compensation in light of the nature and quality of the services being provided by MFS.
In addition, the Trustees considered MFS’ resources and related efforts to continue to retain, attract and motivate capable personnel to serve the Fund. The Trustees also considered the financial resources of MFS and its parent, Sun Life Financial Inc. The Trustees further considered any advantages and possible disadvantages of having an adviser which also serves other investment companies as well as institutional accounts.
The Trustees also considered the nature, quality, cost, and extent of administrative, transfer agency, and distribution services provided to the Fund by MFS and its affiliates under agreements and plans other than the investment advisory agreement, including the 12b-1 fees the Fund pays to MFS Fund Distributors, Inc., an affiliate of MFS. The Trustees also considered the nature, extent and quality of certain other services MFS performs or arranges on the Fund’s behalf, which may include securities lending programs, directed expense payment programs, class action recovery programs, and MFS’ interaction with third-party service providers, principally custodians and sub-custodians. The Trustees concluded that the various non-advisory services provided by MFS and its affiliates on behalf of the Fund were satisfactory. The Trustees also considered the benefits to MFS from the use of the Fund’s portfolio brokerage commissions, if applicable, to pay for investment research and various other factors. Additionally, the Trustees considered so-called “fall-out benefits” to MFS such as reputational value derived from serving as investment manager to the Trust, and determined that any such benefits derived by MFS were reasonable and fair.
Based on their evaluation of factors that they deemed to be material, including those factors described above, the Board of Trustees, including a majority of the independent Trustees, concluded that the investment advisory agreement should be continued for an additional one-year period, commencing September 1, 2011.
A discussion regarding the Board’s most recent review and renewal of the fund’s Investment Advisory Agreement with MFS is available by clicking on the fund’s name under “Variable Insurance Portfolios — VIT II” in the “Products and Performance” section of the MFS Web site (mfs.com).
27
Table of Contents
MFS Blended Research Value Portfolio
PROXY VOTING POLICIES AND INFORMATION
A general description of the MFS funds’ proxy voting policies and procedures is available without charge, upon request, by calling
1-800-225-2606, by visiting the Proxy Voting section of mfs.com or by visiting the SEC’s Web site at http://www.sec.gov.
Information regarding how the fund voted proxies relating to portfolio securities during the most recent twelve-month period ended June 30 is available without charge by visiting the Proxy Voting section of mfs.com or by visiting the SEC’s Web site at http://www.sec.gov.
QUARTERLY PORTFOLIO DISCLOSURE
The fund will file a complete schedule of portfolio holdings with the Securities and Exchange Commission (the Commission) for the first and third quarters of each fiscal year on Form N-Q. The fund’s Form N-Q is available on the EDGAR database on the Commission’s Internet Web site at http://www.sec.gov and may be reviewed and copied at the:
Public Reference Room
Securities and Exchange Commission
100 F Street, NE, Room 1580
Washington, D.C. 20549
Information on the operation of the Public Reference Room may be obtained by calling the Commission at 1-800-SEC-0330. Copies of the fund’s Form N-Q also may be obtained, upon payment of a duplicating fee, by electronic request at the following e-mail address: publicinfo@sec.gov or by writing the Public Reference Section at the above address.
From time to time, MFS may post important information about the fund or the MFS funds on the MFS web site (mfs.com). This information is available by visiting the “News & Commentary” section of mfs.com or by clicking on the fund’s name under “Variable Insurance Portfolios — VIT II” in the “Products and Performance” section of mfs.com.
FEDERAL TAX INFORMATION (unaudited)
The following information is provided pursuant to provisions of the Internal Revenue Code.
For corporate shareholders, 100% of the ordinary income dividends paid during the fiscal year qualify for the corporate dividends received deduction.
28
Table of Contents
rev. 3/11

| Why? | Financial companies choose how they share your personal information. Federal law gives consumers the right to limit some but not all sharing. Federal law also requires us to tell you how we collect, share, and protect your personal information. Please read this notice carefully to understand what we do. |
| What? | The types of personal information we collect and share depend on the product or service you have with us. This information can include:
• Social Security number and account balances • Account transactions and transaction history • Checking account information and wire transfer instructions
When you are no longer our customer, we continue to share your information as described in this notice. |
| How? | All financial companies need to share customers’ personal information to run their everyday business. In the section below, we list the reasons financial companies can share their customers’ personal information; the reasons MFS chooses to share; and whether you can limit this sharing. |
| Reasons we can share your personal information | Does MFS share? | Can you limit this sharing? | ||
For our everyday business purposes – such as to process your transactions, maintain your account(s), respond to court orders and legal investigations, or report to credit bureaus | Yes | No | ||
For our marketing purposes – to offer our products and services to you | No | We don’t share | ||
| For joint marketing with other financial companies | No | We don’t share | ||
For our affiliates’ everyday business purposes – information about your transactions and experiences | No | We don’t share | ||
For our affiliates’ everyday business purposes – information about your creditworthiness | No | We don’t share | ||
| For nonaffiliates to market to you | No | We don’t share |
| Questions? | Call 800-225-2606 or go to mfs.com. |
29
Table of Contents
| Page 2 |
| Who we are | ||
| Who is providing this notice? | MFS Funds, MFS Investment Management, MFS Institutional Advisors, Inc., MFS Fund Distributors, Inc., MFS Heritage Trust Company, and MFS Service Center, Inc. | |
| What we do | ||
| How does MFS protect my personal information? | To protect your personal information from unauthorized access and use, we use security measures that comply with federal law. These measures include procedural, electronic, and physical safeguards for the protection of the personal information we collect about you. | |
| How does MFS collect my personal information? | We collect your personal information, for example, when you
• open an account or provide account information • direct us to buy securities or direct us to sell your securities • make a wire transfer
We also collect your personal information from others, such as credit bureaus, affiliates and other companies. | |
| Why can’t I limit all sharing? | Federal law gives you the right to limit only
• sharing for affiliates’ everyday business purposes – information about your creditworthiness • affiliates from using your information to market to you • sharing for nonaffiliates to market to you
State laws and individual companies may give you additional rights to limit sharing. | |
| Definitions | ||
| Affiliates | Companies related by common ownership or control. They can be financial and nonfinancial companies.
• MFS does not share personal information with affiliates, except for everyday business purposes as described on page one of this notice. | |
| Nonaffiliates | Companies not related by common ownership or control. They can be financial and nonfinancial companies.
• MFS does not share with nonaffiliates so they can market to you. | |
| Joint Marketing | A formal agreement between nonaffiliated financial companies that together market financial products or services to you.
• MFS doesn’t jointly market. | |
| Other important information | ||
| If you own an MFS product or receive an MFS service in the name of a third party such as a bank or broker-dealer, their privacy policy may apply to you instead of ours. | ||
30
Table of Contents

Table of Contents

MFS® Global Growth Portfolio
MFS® Variable Insurance Trust II

ANNUAL REPORT
December 31, 2011
WGO-ANN
Table of Contents
MFS® GLOBAL GROWTH PORTFOLIO
The report is prepared for the general information of contract owners.
It is authorized for distribution to prospective investors only when preceded or accompanied by a current prospectus.
NOT FDIC INSURED Ÿ MAY LOSE VALUE Ÿ NO BANK OR CREDIT UNION GUARANTEE Ÿ NOT A DEPOSIT Ÿ NOT INSURED BY ANY FEDERAL GOVERNMENT AGENCY OR NCUA/NCUSIF
Table of Contents
MFS Global Growth Portfolio
LETTER FROM THE CHAIRMAN AND CEO

Dear Contract Owners:
We are indeed living through some volatile times. Economic uncertainty is everywhere, as it seems no place in the world has been unmoved by crisis. We have seen a devastating earthquake and tsunami that have led to disruptions in the Japanese markets
and supply chains. Protests have changed the face of the Middle East and left in their wake lingering tensions and resultant higher oil prices. We have seen debt limits tested in Europe and the United States and policymakers grappling to craft often unpopular monetary and fiscal responses at a time when consumers and businesses struggle with what appears to be a slowing global economy. On top of all of that, we have seen long-term U.S. debt lose its Standard & Poor’s AAA rating and the long-term debt ratings of 15 eurozone nations put on negative watch.
When markets become volatile, managing risk becomes a top priority for investors and their advisors. At MFS® risk management is foremost in our minds in all market climates. Our analysts and portfolio managers keep risks firmly in mind when evaluating securities. Additionally, we have a team of quantitative analysts that measures and assesses the risk profiles of our portfolios and securities on an ongoing basis. The chief investment risk officer, who oversees the team, reports directly to the firm’s president and chief investment officer so the risk associated with each portfolio can be assessed objectively and independently of the portfolio management team.
As always, we continue to be mindful of the many economic challenges faced at the local, national, and international levels. It is in times such as these that we want to remind investors of the merits of maintaining a long-term view, adhering to basic investing principles such as asset allocation and diversification, and working closely with their advisors to research and identify appropriate investment opportunities.
Respectfully,

Robert J. Manning
Chairman and Chief Executive Officer
MFS Investment Management®
February 15, 2012
The opinions expressed in this letter are subject to change, may not be relied upon for investment advice, and no forecasts can be guaranteed.
1
Table of Contents
MFS Global Growth Portfolio
Portfolio structure

| Top ten holdings | ||||
| Google, Inc., “A” | 2.2% | |||
| Danaher Corp. | 2.1% | |||
| Taiwan Semiconductor Manufacturing Co. Ltd., ADR | 2.1% | |||
| Groupe Danone | 2.0% | |||
| Oracle Corp. | 2.0% | |||
| Apple, Inc. | 1.8% | |||
| Pernod Ricard S.A. | 1.8% | |||
| LVMH Moet Hennessy Louis Vuitton S.A. | 1.7% | |||
| BHP Billiton PLC | 1.7% | |||
| PepsiCo, Inc. | 1.7% | |||
| Equity sectors | ||||
| Technology | 16.6% | |||
| Consumer Staples | 13.0% | |||
| Financial Services | 12.8% | |||
| Health Care | 11.4% | |||
| Industrial Goods & Services | 10.4% | |||
| Retailing | 10.0% | |||
| Basic Materials | 8.2% | |||
| Special Products & Services | 7.5% | |||
| Energy | 4.8% | |||
| Leisure | 2.0% | |||
| Transportation | 1.1% | |||
| Autos & Housing | 1.0% | |||
| Utilities & Communications | 0.5% | |||
| Issuer country weightings (x) | ||||
| United States | 47.8% | |||
| France | 11.1% | |||
| United Kingdom | 10.9% | |||
| Switzerland | 7.8% | |||
| Brazil | 4.3% | |||
| Germany | 3.9% | |||
| Netherlands | 2.5% | |||
| Taiwan | 2.1% | |||
| Israel | 1.7% | |||
| Other Countries | 7.9% | |||
| Currency exposure weightings (y) | ||||
| United States Dollar | 51.3% | |||
| Euro | 17.9% | |||
| British Pound Sterling | 10.9% | |||
| Swiss Franc | 7.8% | |||
| Brazilian Real | 3.1% | |||
| Taiwan Dollar | 2.1% | |||
| Japanese Yen | 1.6% | |||
| Israeli Shekel | 1.1% | |||
| South Korean Won | 1.0% | |||
| Other Currencies | 3.2% | |||
| (x) | Represents the portfolio’s exposure to issuer countries as a percentage of a portfolio’s total net assets. |
| (y) | Represents the portfolio’s exposure to a particular currency as a percentage of a portfolio’s total net assets. |
Percentages are based on net assets as of 12/31/11.
The portfolio is actively managed and current holdings may be different.
2
Table of Contents
MFS Global Growth Portfolio
Summary of Results
For the twelve months ended December 31, 2011, Initial Class shares of the MFS Global Growth Portfolio (the “fund”) provided a total return of –6.38%, while Service Class shares of the fund provided a total return of –6.67%. These returns compare with a return of –7.04% for the fund’s benchmark, the Morgan Stanley Capital International (MSCI) All Country World Growth Index.
Market Environment
Early in the period, the U.S. Federal Reserve (the “Fed”) responded to weak economic growth by loosening monetary policy further. More easing by the Fed improved market sentiment and drove risk-asset prices markedly higher. The December 2010 agreement on a surprisingly large (relative to expectations) expansionary U.S. fiscal package also boosted sentiment. During the subsequent several months, the renewed positive market sentiment, coupled with better indications of global macroeconomic activity, pushed many asset valuations to post-crisis highs. At the same time, the yields of the perceived “safest” global sovereign credits rose, indicating a renewed risk-seeking environment.
However, towards the middle of the period, a weakening macroeconomic backdrop and renewed concerns over peripheral euro zone sovereign debt caused a flight-to-quality move that pushed high-quality sovereign bond yields lower. In the U.S., concerns about sovereign debt default and the long-term sustainability of the trend in U.S. fiscal policy resulted in one agency downgrading U.S. credit quality. Amidst this turmoil, global equity markets declined sharply. As a result of these developments, global consumer and producer sentiment indicators fell precipitously and highly-rated sovereign bond yields hit multi-decade lows. Towards the end of the reporting period, uncertainty in financial markets spiked higher as markets more seriously contemplated the possible failure of the euro zone.
Contributors to Performance
Stock selection and underweight positions in both the basic materials and energy sectors contributed to performance relative to the MSCI All Country World Growth Index. There were no stocks within either sector that were among the fund’s top relative contributors.
Security selection in the technology sector was another positive factor for relative performance. Holdings of semiconductor equipment manufacturer Microchip Technology (b), semiconductor manufacturer Taiwan Semiconductor (Taiwan), and Internet search giant Google benefited relative results as all three stocks turned in strong performance over the period. Shares of Taiwan Semiconductor rallied as the company forecast higher-than-anticipated sales projections for the fourth quarter.
Elsewhere, the fund’s overweight positions in global payments technology companies, Visa and MasterCard, diversified consumer products company Colgate-Palmolive, alcoholic beverage producer Diageo, athletic shoes and apparel manufacturer NIKE, and fashion distributor Industria de Diseno Textil S.A. (h) (Spain) benefited relative performance. Holding shares of strong-performing facilities maintenance products supplier Grainger (W.W.) also strengthened relative results. Shares of Diageo appreciated significantly in the second half of 2011 after management reported a 5% increase in full-year operating profit and forecasted a medium-term goal of 6% organic revenue growth.
Detractors from Performance
An underweight allocation to the leisure sector detracted from relative performance. Not holding shares of strong-performing fast-food company McDonald’s held back relative performance.
Stock selection in the health care sector was another factor that negatively impacted relative returns. The fund’s overweight position in poor-performing medical diagnostics company Diagnosticos da America (Brazil) weakened relative performance.
Stocks in other sectors that detracted from relative performance included Brazilian financial services firm Banco Santander (Brasil), information technology products and electronics maker Acer (h) (Taiwan), financial services firm Credit Suisse (b) (Switzerland), derivative trading systems provider BM&F Bovespa (b) (Brazil), network equipment company Cisco Systems, and real estate brokerage firm LPS Brasil – Consultoria de Imóveis (b) (Brazil). Shares of Cisco Systems depreciated during the first half of the reporting period as the company lowered future gross margin guidance and growth projections amidst a weakening economic environment. In addition, not holding strong-performing tobacco companies, Phillip Morris International and British American Tobacco, held back relative performance.
3
Table of Contents
MFS Global Growth Portfolio
Management Review – continued
During the reporting period, the fund’s currency exposure, resulting primarily from holdings of foreign currency denominated securities, was also a detractor from relative performance. All of MFS’ investment decisions are driven by the fundamentals of each individual opportunity and as such, it is common for our portfolios to have different currency exposures than the benchmark.
Respectfully,
| David Antonelli | Jeffrey Constantino | |
| Portfolio Manager | Portfolio Manager |
| (b) | Security is not a benchmark constituent. |
| (h) | Security was not held in the fund at period end. |
The views expressed in this report are those of the portfolio managers only through the end of the period of the report as stated on the cover and do not necessarily reflect the views of MFS or any other person in the MFS organization. These views are subject to change at any time based on market or other conditions, and MFS disclaims any responsibility to update such views. These views may not be relied upon as investment advice or an indication of trading intent on behalf of any MFS portfolio. References to specific securities are not recommendations of such securities, and may not be representative of any MFS portfolio’s current or future investments.
4
Table of Contents
MFS Global Growth Portfolio
PERFORMANCE SUMMARY THROUGH 12/31/11
The following chart illustrates the historical performance of the fund in comparison to its benchmark(s). Benchmarks are unmanaged and may not be invested in directly. Benchmark returns do not reflect any fees or expenses. The performance of other share classes will be greater than or less than that of the class depicted below. (See Notes to Performance Summary.)
Performance data shown represents past performance and is no guarantee of future results. Investment return and principal value fluctuate so your units, when sold, may be worth more or less than the original cost; current performance may be lower or higher than quoted. The performance shown does not reflect the deduction of taxes, if any, that a contract holder would pay on fund distributions or the redemption of contract units. The returns for the fund shown also do not reflect the deduction of expenses associated with variable products, such as mortality and expense risk charges, separate account charges, and sales charges imposed by the insurance company separate accounts. Such expenses would reduce the overall returns shown.
Growth of a Hypothetical $10,000 Investment
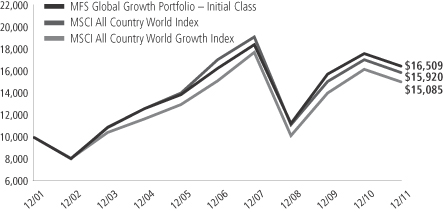
Total Returns through 12/31/11
Average annual total returns
| Share class | Class inception date | 1-yr | 5-yr | 10-yr | ||||||||
| Initial Class | 11/16/93 | (6.38)% | 0.24% | 5.14% | ||||||||
| Service Class | 8/24/01 | (6.67)% | 0.00% | 4.87% | ||||||||
| Comparative benchmarks | ||||||||||||
| MSCI All Country World Growth Index (f) | (7.04)% | (0.11)% | 4.20% | |||||||||
| MSCI All Country World Index (f) | (6.86)% | (1.41)% | 4.76% | |||||||||
| (f) | Source: FactSet Research Systems Inc. |
Benchmark Definitions
MSCI All Country World Growth Index – a market capitalization-weighted index that is designed to measure equity market performance for growth securities in the global developed and emerging markets.
MSCI All Country World Index – a market capitalization-weighted index that is designed to measure equity market performance in the global developed and emerging markets.
It is not possible to invest directly in an index.
Notes to Performance Summary
Average annual total return represents the average annual change in value for each share class for the periods presented.
Performance results reflect any applicable expense subsidies and waivers in effect during the periods shown. Without such subsidies and waivers the fund’s performance results would be less favorable. Please see the prospectus and financial statements for complete details. All results are historical and assume the reinvestment of any dividends and capital gains distributions.
5
Table of Contents
MFS Global Growth Portfolio
Performance Summary – continued
Performance results do not include adjustments made for financial reporting purposes in accordance with U.S. generally accepted accounting principles and may differ from amounts reported in the financial highlights.
From time to time the fund may receive proceeds from litigation settlements, without which performance would be lower.
6
Table of Contents
MFS Global Growth Portfolio
Fund Expenses Borne by the Contract Holders During the Period,
July 1, 2011 through December 31, 2011
As a contract holder of the fund, you incur ongoing costs, including management fees; distribution and/or service (12b-1) fees; and other fund expenses. This example is intended to help you understand your ongoing costs (in dollars) of investing in the fund and to compare these costs with the ongoing costs of investing in other mutual funds.
The example is based on an investment of $1,000 invested at the beginning of the period and held for the entire period July 1, 2011 through December 31, 2011.
Actual Expenses
The first line for each share class in the following table provides information about actual account values and actual expenses. You may use the information in this line, together with the amount you invested, to estimate the expenses that you paid over the period. Simply divide your account value by $1,000 (for example, an $8,600 account value divided by $1,000 = 8.6), then multiply the result by the number in the first line under the heading entitled “Expenses Paid During Period” to estimate the expenses you paid on your account during this period.
Hypothetical Example for Comparison Purposes
The second line for each share class in the following table provides information about hypothetical account values and hypothetical expenses based on the fund’s actual expense ratio and an assumed rate of return of 5% per year before expenses, which is not the fund’s actual return. The hypothetical account values and expenses may not be used to estimate the actual ending account balance or expenses you paid for the period. You may use this information to compare the ongoing costs of investing in the fund and other funds. To do so, compare this 5% hypothetical example with the 5% hypothetical examples that appear in the shareholder reports of the other funds.
Please note that the expenses shown in the table are meant to highlight the fund’s ongoing costs only and do not take into account the fees and expenses imposed under the variable contracts through which your investment in the fund is made.
Therefore, the second line for each share class in the table is useful in comparing ongoing costs associated with an investment in vehicles (such as the fund) which fund benefits under variable annuity and variable life insurance contracts and to qualified pension and retirement plans only, and will not help you determine the relative total costs of investing in the fund through variable annuity and variable life insurance contracts. If the fees and expenses imposed under the variable contracts were included, your costs would have been higher.
| Share Class | Annualized Expense Ratio | Beginning Account Value 7/01/11 | Ending Account Value | Expenses Paid During Period (p) 7/01/11-12/31/11 | ||||||||||||||
| Initial Class | Actual | 1.27% | $1,000.00 | $894.89 | $6.07 | |||||||||||||
| Hypothetical (h) | 1.27% | $1,000.00 | $1,018.80 | $6.46 | ||||||||||||||
| Service Class | Actual | 1.52% | $1,000.00 | $893.05 | $7.25 | |||||||||||||
| Hypothetical (h) | 1.52% | $1,000.00 | $1,017.54 | $7.73 | ||||||||||||||
| (h) | 5% class return per year before expenses. |
| (p) | Expenses paid is equal to each class’ annualized expense ratio, as shown above, multiplied by the average account value over the period, multiplied by the number of days in the period, divided by the number of days in the year. |
7
Table of Contents
MFS Global Growth Portfolio
PORTFOLIO OF INVESTMENTS – 12/31/11
The Portfolio of Investments is a complete list of all securities owned by your fund. It is categorized by broad-based asset classes.
| Issuer | Shares/Par | Value ($) | ||||||
| COMMON STOCKS – 99.3% | ||||||||
| Aerospace – 1.6% | ||||||||
| United Technologies Corp. | 12,770 | $ | 933,358 | |||||
|
| |||||||
| Alcoholic Beverages – 3.8% | ||||||||
| Diageo PLC | 37,769 | $ | 824,985 | |||||
| Heineken N.V. | 7,885 | 364,013 | ||||||
| Pernod Ricard S.A. | 11,569 | 1,070,781 | ||||||
|
| |||||||
| $ | 2,259,779 | |||||||
|
| |||||||
| Apparel Manufacturers – 4.3% | ||||||||
| Compagnie Financiere Richemont S.A. | 8,315 | $ | 418,682 | |||||
| Li & Fung Ltd. | 321,600 | 595,448 | ||||||
| LVMH Moet Hennessy Louis Vuitton S.A. | 7,230 | 1,018,624 | ||||||
| NIKE, Inc., “B” | 5,520 | 531,962 | ||||||
|
| |||||||
| $ | 2,564,716 | |||||||
|
| |||||||
| Automotive – 1.0% | ||||||||
| Johnson Controls, Inc. | 18,410 | $ | 575,497 | |||||
|
| |||||||
| Broadcasting – 2.0% | ||||||||
| Publicis Groupe S.A. | 17,181 | $ | 788,517 | |||||
| Viacom, Inc., “B” | 8,970 | 407,328 | ||||||
|
| |||||||
| $ | 1,195,845 | |||||||
|
| |||||||
| Brokerage & Asset Managers – 3.0% | ||||||||
| BM&F Bovespa S.A. | 90,200 | $ | 473,910 | |||||
| Charles Schwab Corp. | 29,100 | 327,666 | ||||||
| CME Group, Inc. | 1,190 | 289,967 | ||||||
| Franklin Resources, Inc. | 7,230 | 694,514 | ||||||
|
| |||||||
| $ | 1,786,057 | |||||||
|
| |||||||
| Business Services – 7.5% | ||||||||
| Accenture PLC, “A” | 13,540 | $ | 720,734 | |||||
| Cognizant Technology Solutions Corp., “A” (a) | 3,950 | 254,025 | ||||||
| Compass Group PLC | 102,960 | 974,868 | ||||||
| Dun & Bradstreet Corp. | 9,640 | 721,361 | ||||||
| Intertek Group PLC | 9,103 | 286,592 | ||||||
| LPS Brasil – Consultoria de Imoveis S.A. | 17,300 | 241,147 | ||||||
| Michael Page International PLC | 69,167 | 373,385 | ||||||
| MSCI, Inc., “A” (a) | 13,920 | 458,386 | ||||||
| Verisk Analytics, Inc., “A” (a) | 10,840 | 435,009 | ||||||
|
| |||||||
| $ | 4,465,507 | |||||||
|
| |||||||
| Chemicals – 0.5% | ||||||||
| Monsanto Co. | 4,050 | $ | 283,784 | |||||
|
| |||||||
| Computer Software – 4.2% | ||||||||
| Autodesk, Inc. (a) | 16,310 | $ | 494,682 | |||||
| Check Point Software Technologies Ltd. (a) | 7,370 | 387,220 | ||||||
| Dassault Systems S.A. | 4,986 | 399,643 | ||||||
| Oracle Corp. | 46,370 | 1,189,391 | ||||||
|
| |||||||
| $ | 2,470,936 | |||||||
|
| |||||||
| Computer Software – Systems – 3.9% | ||||||||
| Apple, Inc. (a) | 2,680 | $ | 1,085,400 | |||||
| EMC Corp. (a) | 26,390 | 568,441 | ||||||
| Issuer | Shares/Par | Value ($) | ||||||
| COMMON STOCKS – continued | ||||||||
| Computer Software – Systems – continued | ||||||||
| International Business Machines Corp. | 3,500 | $ | 643,580 | |||||
|
| |||||||
| $ | 2,297,421 | |||||||
|
| |||||||
| Consumer Products – 4.4% | ||||||||
| Colgate-Palmolive Co. | 9,830 | $ | 908,194 | |||||
| Procter & Gamble Co. | 11,700 | 780,507 | ||||||
| Reckitt Benckiser Group PLC | 18,600 | 916,577 | ||||||
|
| |||||||
| $ | 2,605,278 | |||||||
|
| |||||||
| Electrical Equipment – 7.4% | ||||||||
| Amphenol Corp., “A” | 10,830 | $ | 491,574 | |||||
| Danaher Corp. | 27,110 | 1,275,254 | ||||||
| Legrand S.A. | 27,459 | 879,662 | ||||||
| Schneider Electric S.A. | 11,472 | 599,536 | ||||||
| Sensata Technologies Holding B.V. (a) | 23,870 | 627,304 | ||||||
| W.W. Grainger, Inc. | 2,710 | 507,285 | ||||||
|
| |||||||
| $ | 4,380,615 | |||||||
|
| |||||||
| Electronics – 5.4% | ||||||||
| ASML Holding N.V. | 12,600 | $ | 526,554 | |||||
| Microchip Technology, Inc. | 22,500 | 824,175 | ||||||
| Samsung Electronics Co. Ltd. | 661 | 607,064 | ||||||
| Taiwan Semiconductor Manufacturing Co. Ltd., ADR | 94,958 | 1,225,908 | ||||||
|
| |||||||
| $ | 3,183,701 | |||||||
|
| |||||||
| Energy – Independent – 0.8% | ||||||||
| Occidental Petroleum Corp. | 5,120 | $ | 479,744 | |||||
|
| |||||||
| Energy – Integrated – 1.6% | ||||||||
| Chevron Corp. | 5,140 | $ | 546,896 | |||||
| Suncor Energy, Inc. | 14,459 | 416,987 | ||||||
|
| |||||||
| $ | 963,883 | |||||||
|
| |||||||
| Food & Beverages – 4.8% | ||||||||
| Groupe Danone | 19,298 | $ | 1,213,106 | |||||
| Mead Johnson Nutrition Co., “A” | 5,100 | 350,523 | ||||||
| Nestle S.A. | 5,698 | 327,138 | ||||||
| PepsiCo, Inc. | 14,870 | 986,625 | ||||||
|
| |||||||
| $ | 2,877,392 | |||||||
|
| |||||||
| Food & Drug Stores – 1.4% | ||||||||
| Tesco PLC | 136,155 | $ | 853,090 | |||||
|
| |||||||
| General Merchandise – 2.5% | ||||||||
| Kohl’s Corp. | 7,800 | $ | 384,930 | |||||
| Lojas Renner S.A. | 20,700 | 537,240 | ||||||
| Target Corp. | 11,070 | 567,005 | ||||||
|
| |||||||
| $ | 1,489,175 | |||||||
|
| |||||||
| Internet – 2.5% | ||||||||
| Google, Inc., “A” (a) | 1,980 | $ | 1,278,882 | |||||
| Yahoo Japan Corp. | 693 | 223,197 | ||||||
|
| |||||||
| $ | 1,502,079 | |||||||
|
| |||||||
8
Table of Contents
MFS Global Growth Portfolio
Portfolio of Investments – continued
| Issuer | Shares/Par | Value ($) | ||||||
| COMMON STOCKS – continued | ||||||||
| Machinery & Tools – 1.4% | ||||||||
| Schindler Holding AG | 7,038 | $ | 819,714 | |||||
|
| |||||||
| Major Banks – 4.7% | ||||||||
| Bank of New York Mellon Corp. | 12,110 | $ | 241,110 | |||||
| Credit Suisse Group AG | 18,871 | 443,397 | ||||||
| HSBC Holdings PLC | 65,991 | 500,952 | ||||||
| Julius Baer Group Ltd. | 22,260 | 865,736 | ||||||
| Standard Chartered PLC | 34,379 | 748,517 | ||||||
|
| |||||||
| $ | 2,799,712 | |||||||
|
| |||||||
| Medical & Health Technology & Services – 2.1% | ||||||||
| Diagnosticos da America S.A. | 51,700 | $ | 429,621 | |||||
| Fresenius Medical Care AG & Co. KGaA | 4,421 | 300,399 | ||||||
| Patterson Cos., Inc. | 17,360 | 512,467 | ||||||
|
| |||||||
| $ | 1,242,487 | |||||||
|
| |||||||
| Medical Equipment – 5.9% | ||||||||
| Becton, Dickinson & Co. | 5,980 | $ | 446,826 | |||||
| DENTSPLY International, Inc. | 8,770 | 306,862 | ||||||
| Essilor International S.A. | 4,752 | 335,035 | ||||||
| Sonova Holding AG | 8,114 | 848,718 | ||||||
| St. Jude Medical, Inc. | 8,000 | 274,400 | ||||||
| Synthes, Inc. (n) | 1,363 | 228,153 | ||||||
| Thermo Fisher Scientific, Inc. (a) | 16,530 | 743,354 | ||||||
| Waters Corp. (a) | 4,380 | 324,339 | ||||||
|
| |||||||
| $ | 3,507,687 | |||||||
|
| |||||||
| Metals & Mining – 1.7% | ||||||||
| BHP Billiton PLC | 34,256 | $ | 996,030 | |||||
|
| |||||||
| Network & Telecom – 0.6% | ||||||||
| Cisco Systems, Inc. | 20,020 | $ | 361,962 | |||||
|
| |||||||
| Oil Services – 2.4% | ||||||||
| National Oilwell Varco, Inc. | 7,540 | $ | 512,645 | |||||
| Schlumberger Ltd. | 13,290 | 907,840 | ||||||
|
| |||||||
| $ | 1,420,485 | |||||||
|
| |||||||
| Other Banks & Diversified Financials – 4.9% | ||||||||
| Banco Santander Brasil S.A., ADR | 86,240 | $ | 701,994 | |||||
| Credicorp Ltd. | 4,430 | 484,952 | ||||||
| HDFC Bank Ltd. | 35,868 | 288,302 | ||||||
| MasterCard, Inc., “A” | 1,540 | 574,143 | ||||||
| Visa, Inc., “A” | 8,470 | 859,959 | ||||||
|
| |||||||
| $ | 2,909,350 | |||||||
|
| |||||||
| Pharmaceuticals – 3.4% | ||||||||
| Allergan, Inc. | 3,750 | $ | 329,025 | |||||
| Bayer AG | 10,900 | 696,902 | ||||||
| Johnson & Johnson | 4,890 | 320,686 | ||||||
| Teva Pharmaceutical Industries Ltd., ADR | 16,230 | 655,043 | ||||||
|
| |||||||
| $ | 2,001,656 | |||||||
|
| |||||||
| Issuer | Shares/Par | Value ($) | ||||||
| COMMON STOCKS – continued | ||||||||
| Railroad & Shipping – 1.1% | ||||||||
| Kuehne & Nagel, Inc. AG | 5,970 | $ | 668,183 | |||||
|
| |||||||
| Real Estate – 0.2% | ||||||||
| Brasil Brokers Participacoes | 48,500 | $ | 145,090 | |||||
|
| |||||||
| Specialty Chemicals – 6.0% | ||||||||
| Akzo Nobel N.V. | 12,218 | $ | 587,869 | |||||
| L’Air Liquide S.A. | 2,460 | 304,345 | ||||||
| Linde AG | 6,103 | 907,968 | ||||||
| Praxair, Inc. | 5,930 | 633,917 | ||||||
| Shin-Etsu Chemical Co. Ltd. | 15,300 | 753,371 | ||||||
| Symrise AG | 15,290 | 408,051 | ||||||
|
| |||||||
| $ | 3,595,521 | |||||||
|
| |||||||
| Specialty Stores – 1.8% | ||||||||
| Hennes & Mauritz AB, “B” | 9,610 | $ | 308,353 | |||||
| Industria de Diseno Textil S.A. | 8,985 | 734,102 | ||||||
|
| |||||||
| $ | 1,042,455 | |||||||
|
| |||||||
| Telecommunications – Wireless – 0.5% | ||||||||
| MTN Group Ltd. | 17,218 | $ | 305,804 | |||||
|
| |||||||
Total Common Stocks (Identified Cost, $59,367,104) | $ | 58,983,993 | ||||||
|
| |||||||
| MONEY MARKET FUNDS – 0.7% | ||||||||
| MFS Institutional Money Market Portfolio, 0.05%, at Cost and Net Asset Value (v) | 432,111 | $ | 432,111 | |||||
|
| |||||||
Total Investments (Identified Cost, $59,799,215) | $ | 59,416,104 | ||||||
|
| |||||||
| OTHER ASSETS, LESS LIABILITIES – (0.0)% | (5,922 | ) | ||||||
|
| |||||||
| Net Assets – 100.0% | $ | 59,410,182 | ||||||
|
| |||||||
| (a) | Non-income producing security. |
| (n) | Securities exempt from registration under Rule 144A of the Securities Act of 1933. These securities may be sold in the ordinary course of business in transactions exempt from registration, normally to qualified institutional buyers. At period end, the aggregate value of these securities was $228,153, representing 0.4% of net assets. |
| (v) | Underlying affiliated fund that is available only to investment companies managed by MFS. The rate quoted for the MFS Institutional Money Market Portfolio is the annualized seven-day yield of the fund at period end. |
The following abbreviations are used in this report and are defined:
| ADR | American Depository Receipt |
| PLC | Public Limited Company |
See Notes to Financial Statements
9
Table of Contents
MFS Global Growth Portfolio
FINANCIAL STATEMENTS | STATEMENT OF ASSETS AND LIABILITIES
This statement represents your fund’s balance sheet, which details the assets and liabilities comprising the total value of the fund.
At 12/31/11 | ||||||||
Assets | ||||||||
Investments – | ||||||||
Non-affiliated issuers, at value (identified cost, $59,367,104) | $58,983,993 | |||||||
Underlying affiliated funds, at cost and value | 432,111 | |||||||
Total investments, at value (identified cost, $59,799,215) | $59,416,104 | |||||||
Cash | 14,560 | |||||||
Receivables for | ||||||||
Fund shares sold | 54 | |||||||
Interest and dividends | 77,527 | |||||||
Other assets | 2,137 | |||||||
Total assets | $59,510,382 | |||||||
Liabilities | ||||||||
Payable for fund shares reacquired | $27,168 | |||||||
Payable to affiliates | ||||||||
Investment adviser | 4,552 | |||||||
Shareholder servicing costs | 44 | |||||||
Distribution and/or service fees | 64 | |||||||
Payable for Trustees’ compensation | 153 | |||||||
Accrued expenses and other liabilities | 68,219 | |||||||
Total liabilities | $100,200 | |||||||
Net assets | $59,410,182 | |||||||
Net assets consist of | ||||||||
Paid-in capital | $68,905,456 | |||||||
Unrealized appreciation (depreciation) on investments and translation of assets and liabilities in foreign currencies | (384,430 | ) | ||||||
Accumulated net realized gain (loss) on investments and foreign currency transactions | (9,537,268 | ) | ||||||
Undistributed net investment income | 426,424 | |||||||
Net assets | $59,410,182 | |||||||
Shares of beneficial interest outstanding | 3,933,639 |
| Net assets | Shares outstanding | Net asset value per share | ||||||||||
Initial Class | $56,309,007 | 3,727,469 | $15.11 | |||||||||
Service Class | 3,101,175 | 206,170 | 15.04 | |||||||||
See Notes to Financial Statements
10
Table of Contents
MFS Global Growth Portfolio
FINANCIAL STATEMENTS | STATEMENT OF OPERATIONS
This statement describes how much your fund earned in investment income and accrued in expenses. It also describes any gains and/or losses generated by fund operations.
| Year ended 12/31/11 | ||||||||
| Net investment income | ||||||||
Income | ||||||||
Dividends | $1,394,571 | |||||||
Interest | 12,883 | |||||||
Dividends from underlying affiliated funds | 777 | |||||||
Foreign taxes withheld | (89,897 | ) | ||||||
Total investment income | $1,318,334 | |||||||
Expenses | ||||||||
Management fee | $612,213 | |||||||
Distribution and/or service fees | 9,235 | |||||||
Shareholder servicing costs | 7,397 | |||||||
Administrative services fee | 23,466 | |||||||
Trustees’ compensation | 8,597 | |||||||
Custodian fee | 77,382 | |||||||
Shareholder communications | 7,033 | |||||||
Auditing fees | 69,327 | |||||||
Legal fees | 5,379 | |||||||
Miscellaneous | 18,738 | |||||||
Total expenses | $838,767 | |||||||
Fees paid indirectly | (1 | ) | ||||||
Net expenses | $838,766 | |||||||
Net investment income | $479,568 | |||||||
Realized and unrealized gain (loss) on investments and foreign currency transactions | ||||||||
Realized gain (loss) (identified cost basis) | ||||||||
Investment transactions | $3,110,512 | |||||||
Foreign currency transactions | (51,645 | ) | ||||||
Net realized gain (loss) on investments and foreign currency transactions | $3,058,867 | |||||||
Change in unrealized appreciation (depreciation) | ||||||||
Investments | $(7,683,943 | ) | ||||||
Translation of assets and liabilities in foreign currencies | (5,042 | ) | ||||||
Net unrealized gain (loss) on investments and foreign currency translation | $(7,688,985 | ) | ||||||
Net realized and unrealized gain (loss) on investments and foreign currency | $(4,630,118 | ) | ||||||
Change in net assets from operations | $(4,150,550 | ) |
See Notes to Financial Statements
11
Table of Contents
MFS Global Growth Portfolio
FINANCIAL STATEMENTS | STATEMENTS OF CHANGES IN NET ASSETS
These statements describe the increases and/or decreases in net assets resulting from operations, any distributions, and any shareholder transactions.
For years ended 12/31 | 2011 | 2010 | ||||||
Change in net assets | ||||||||
From operations | ||||||||
Net investment income | $479,568 | $474,497 | ||||||
Net realized gain (loss) on investments and foreign currency transactions | 3,058,867 | 2,811,532 | ||||||
Net unrealized gain (loss) on investments and foreign currency translation | (7,688,985 | ) | 4,579,723 | |||||
Change in net assets from operations | $(4,150,550 | ) | $7,865,752 | |||||
Distributions declared to shareholders | ||||||||
From net investment income | $(453,630 | ) | $(565,546 | ) | ||||
Change in net assets from fund share transactions | $(11,628,987 | ) | $(11,830,037 | ) | ||||
Total change in net assets | $(16,233,167 | ) | $(4,529,831 | ) | ||||
| Net assets | ||||||||
At beginning of period | 75,643,349 | 80,173,180 | ||||||
At end of period (including undistributed net investment income of $426,424 and | $59,410,182 | $75,643,349 |
See Notes to Financial Statements
12
Table of Contents
MFS Global Growth Portfolio
FINANCIAL STATEMENTS | FINANCIAL HIGHLIGHTS
The financial highlights table is intended to help you understand the fund’s financial performance for the past 5 years. Certain information reflects financial results for a single fund share. The total returns in the table represent the rate by which an investor would have earned (or lost) on an investment in the fund share class (assuming reinvestment of all distributions) held for the entire period.
| Initial Class | Years ended 12/31 | |||||||||||||||||||
| 2011 | 2010 | 2009 | 2008 | 2007 | ||||||||||||||||
Net asset value, beginning of period | $16.26 | $14.65 | $10.62 | $17.54 | $15.74 | |||||||||||||||
| Income (loss) from investment operations | ||||||||||||||||||||
Net investment income (d) | $0.11 | $0.10 | $0.10 | $0.13 | $0.14 | |||||||||||||||
Net realized and unrealized gain (loss) on investments | (1.15 | ) | 1.62 | 4.07 | (6.90 | ) | 1.94 | |||||||||||||
Total from investment operations | $(1.04 | ) | $1.72 | $4.17 | $(6.77 | ) | $2.08 | |||||||||||||
| Less distributions declared to shareholders | ||||||||||||||||||||
From net investment income | $(0.11 | ) | $(0.11 | ) | $(0.14 | ) | $(0.15 | ) | $(0.28 | ) | ||||||||||
Net asset value, end of period (x) | $15.11 | $16.26 | $14.65 | $10.62 | $17.54 | |||||||||||||||
Total return (%) (k)(s)(x) | (6.38 | ) | 11.80 | 39.81 | (38.93 | ) | 13.27 | |||||||||||||
| Ratios (%) (to average net assets) and Supplemental data: | ||||||||||||||||||||
Expenses (f) | 1.22 | 1.19 | 1.34 | 1.25 | 1.10 | |||||||||||||||
Net investment income | 0.72 | 0.66 | 0.85 | 0.90 | 0.83 | |||||||||||||||
Portfolio turnover | 36 | 61 | 76 | 81 | 76 | |||||||||||||||
Net assets at end of period (000 omitted) | $56,309 | $71,546 | $75,171 | $62,289 | $131,870 | |||||||||||||||
| Service Class | Years ended 12/31 | |||||||||||||||||||
| 2011 | 2010 | 2009 | 2008 | 2007 | ||||||||||||||||
Net asset value, beginning of period | $16.18 | $14.58 | $10.55 | $17.42 | $15.63 | |||||||||||||||
| Income (loss) from investment operations | ||||||||||||||||||||
Net investment income (d) | $0.08 | $0.06 | $0.07 | $0.10 | $0.09 | |||||||||||||||
Net realized and unrealized gain (loss) on investments | (1.16 | ) | 1.62 | 4.05 | (6.86 | ) | 1.94 | |||||||||||||
Total from investment operations | $(1.08 | ) | $1.68 | $4.12 | $(6.76 | ) | $2.03 | |||||||||||||
| Less distributions declared to shareholders | ||||||||||||||||||||
From net investment income | $(0.06 | ) | $(0.08 | ) | $(0.09 | ) | $(0.11 | ) | $(0.24 | ) | ||||||||||
Net asset value, end of period (x) | $15.04 | $16.18 | $14.58 | $10.55 | $17.42 | |||||||||||||||
Total return (%) (k)(s)(x) | (6.67 | ) | 11.53 | 39.43 | (39.07 | ) | 13.04 | |||||||||||||
| Ratios (%) (to average net assets) and Supplemental data: | ||||||||||||||||||||
Expenses (f) | 1.47 | 1.44 | 1.59 | 1.49 | 1.35 | |||||||||||||||
Net investment income | 0.49 | 0.42 | 0.58 | 0.67 | 0.56 | |||||||||||||||
Portfolio turnover | 36 | 61 | 76 | 81 | 76 | |||||||||||||||
Net assets at end of period (000 omitted) | $3,101 | $4,098 | $5,002 | $4,670 | $8,716 | |||||||||||||||
| (d) | Per share data is based on average shares outstanding. |
| (f) | Ratios do not reflect reductions from fees paid indirectly, if applicable. |
| (k) | The total return does not reflect expenses that apply to separate accounts. Inclusion of these charges would reduce the total return figures for all periods shown. |
| (s) | From time to time the fund may receive proceeds from litigation settlements, without which performance would be lower. |
| (x) | The net asset values per share and total returns have been calculated on net assets which include adjustments made in accordance with U.S. generally accepted accounting principles required at period end for financial reporting purposes. |
See Notes to Financial Statements
13
Table of Contents
MFS Global Growth Portfolio
| (1) | Business and Organization |
MFS Global Growth Portfolio (the fund) is a series of MFS Variable Insurance Trust II (the trust). The trust is organized as a Massachusetts business trust and is registered under the Investment Company Act of 1940, as amended, as an open-end management investment company. The shareholders of each series of the trust are separate accounts of insurance companies, which offer variable annuity and/or life insurance products, and qualified retirement and pension plans.
| (2) | Significant Accounting Policies |
General – The preparation of financial statements in conformity with U.S. generally accepted accounting principles requires management to make estimates and assumptions that affect the reported amounts of assets and liabilities, and disclosure of contingent assets and liabilities at the date of the financial statements and the reported amounts of revenues and expenses during the reporting period. Actual results could differ from those estimates. In the preparation of these financial statements, management has evaluated subsequent events occurring after the date of the fund’s Statement of Assets and Liabilities through the date that the financial statements were issued. The fund invests in foreign securities, including securities of emerging market issuers. Investments in foreign securities are vulnerable to the effects of changes in the relative values of the local currency and the U.S. dollar and to the effects of changes in each country’s legal, political, and economic environment. The markets of emerging markets countries are generally more volatile than the markets of developed countries with more mature economies. All of the risks of investing in foreign securities previously described are heightened when investing in emerging markets countries.
In December 2011, the Financial Accounting Standards Board issued Accounting Standards Update 2011-11, Balance Sheet (Topic 210) – Disclosures about Offsetting Assets and Liabilities (“ASU 2011-11”). Effective for annual reporting periods beginning on or after January 1, 2013 and interim periods within those annual periods, ASU 2011-11 is intended to enhance disclosure requirements on the offsetting of financial assets and liabilities. Although still evaluating the potential impacts of ASU 2011-11 to the fund, management expects that the impact of the fund’s adoption will be limited to additional financial statement disclosures.
Investment Valuations – Equity securities, including restricted equity securities, are generally valued at the last sale or official closing price as provided by a third-party pricing service on the market or exchange on which they are primarily traded. Equity securities, for which there were no sales reported that day, are generally valued at the last quoted daily bid quotation as provided by a third-party pricing service on the market or exchange on which such securities are primarily traded. Equity securities held short, for which there were no sales reported for that day, are generally valued at the last quoted daily ask quotation as provided by a third-party pricing service on the market or exchange on which such securities are primarily traded. Short-term instruments with a maturity at issuance of 60 days or less generally are valued at amortized cost, which approximates market value. Open-end investment companies are generally valued at net asset value per share. Securities and other assets generally valued on the basis of information from a third-party pricing service may also be valued at a broker/dealer bid quotation. Values obtained from third-party pricing services can utilize both transaction data and market information such as yield, quality, coupon rate, maturity, type of issue, trading characteristics, and other market data. The values of foreign securities and other assets and liabilities expressed in foreign currencies are converted to U.S. dollars using the mean of bid and asked prices for rates provided by a third-party pricing service.
The Board of Trustees has delegated primary responsibility for determining or causing to be determined the value of the fund’s investments (including any fair valuation) to the adviser pursuant to valuation policies and procedures approved by the Board. If the adviser determines that reliable market quotations are not readily available, investments are valued at fair value as determined in good faith by the adviser in accordance with such procedures under the oversight of the Board of Trustees. Under the fund’s valuation policies and procedures, market quotations are not considered to be readily available for most types of debt instruments and floating rate loans and many types of derivatives. These investments are generally valued at fair value based on information from third-party pricing services. In addition, investments may be valued at fair value if the adviser determines that an investment’s value has been materially affected by events occurring after the close of the exchange or market on which the investment is principally traded (such as foreign exchange or market) and prior to the determination of the fund’s net asset value, or after the halting of trading of a specific security where trading does not resume prior to the close of the exchange or market on which the security is principally traded. Events that occur on a frequent basis after foreign markets close (such as developments in foreign markets and significant movements in the U.S. markets) and prior to the determination of the fund’s net asset value may be deemed to have a material effect on the value of securities traded in foreign markets. Accordingly, the fund’s foreign equity securities may often be valued at fair value. The adviser generally relies on third-party pricing services or other information (such as the correlation with price movements of similar securities in the same or other markets; the type, cost and investment characteristics of the security; the business and financial condition of the issuer; and trading and other market data) to assist in determining whether to fair value and at what value to fair value an investment. The value of an investment for purposes of calculating the fund’s net asset value can differ depending on the
14
Table of Contents
MFS Global Growth Portfolio
Notes to Financial Statements – continued
source and method used to determine value. When fair valuation is used, the value of an investment used to determine the fund’s net asset value may differ from quoted or published prices for the same investment. There can be no assurance that the fund could obtain the fair value assigned to an investment if it were to sell the investment at the same time at which the fund determines its net asset value per share.
Various inputs are used in determining the value of the fund’s assets or liabilities. These inputs are categorized into three broad levels. In certain cases, the inputs used to measure fair value may fall into different levels of the fair value hierarchy. In such cases, an investment’s level within the fair value hierarchy is based on the lowest level of input that is significant to the fair value measurement. The fund’s assessment of the significance of a particular input to the fair value measurement in its entirety requires judgment, and considers factors specific to the investment. Level 1 includes unadjusted quoted prices in active markets for identical assets or liabilities. Level 2 includes other significant observable market-based inputs (including quoted prices for similar securities, interest rates, prepayment speed, and credit risk). Level 3 includes unobservable inputs, which may include the adviser’s own assumptions in determining the fair value of investments. The following is a summary of the levels used as of December 31, 2011 in valuing the fund’s assets or liabilities:
| Investments at Value | Level 1 | Level 2 | Level 3 | Total | ||||||||||||
| Equity Securities: | ||||||||||||||||
United States | $27,973,516 | $— | $— | $27,973,516 | ||||||||||||
France | 1,917,093 | 4,692,156 | — | 6,609,249 | ||||||||||||
United Kingdom | 1,678,076 | 4,796,922 | — | 6,474,998 | ||||||||||||
Switzerland | 2,111,829 | 2,507,892 | — | 4,619,721 | ||||||||||||
Brazil | 2,529,002 | — | — | 2,529,002 | ||||||||||||
Germany | 2,313,320 | — | — | 2,313,320 | ||||||||||||
Netherlands | 526,554 | 951,883 | — | 1,478,437 | ||||||||||||
Taiwan | 1,225,908 | — | — | 1,225,908 | ||||||||||||
Israel | 1,042,263 | — | — | 1,042,263 | ||||||||||||
Other Countries | 3,369,321 | 1,348,258 | — | 4,717,579 | ||||||||||||
| Mutual Funds | 432,111 | — | — | 432,111 | ||||||||||||
| Total Investments | $45,118,993 | $14,297,111 | $— | $59,416,104 | ||||||||||||
For further information regarding security characteristics, see the Portfolio of Investments.
Of the level 2 investments presented above, equity investments amounting to $ 11,092,659 would have been considered level 1 investments at the beginning of the period. The primary reason for changes in the classifications between levels 1 and 2 occurs when foreign equity securities are fair valued using other observable market-based inputs in place of the closing exchange price due to events occurring after the close of the exchange or market on which the investment is principally traded. The fund’s foreign equity securities may often be valued at fair value. The fund’s policy is to recognize transfers between the levels as of the end of the period.
Foreign Currency Translation – Purchases and sales of foreign investments, income, and expenses are converted into U.S. dollars based upon currency exchange rates prevailing on the respective dates of such transactions or on the reporting date for foreign denominated receivables and payables. Gains and losses attributable to foreign currency exchange rates on sales of securities are recorded for financial statement purposes as net realized gains and losses on investments. Gains and losses attributable to foreign exchange rate movements on receivables, payables, income and expenses are recorded for financial statement purposes as foreign currency transaction gains and losses. That portion of both realized and unrealized gains and losses on investments that results from fluctuations in foreign currency exchange rates is not separately disclosed.
Security Loans – State Street Bank and Trust Company (“State Street”), as lending agent, loans the securities of the fund to certain qualified institutions (the “Borrowers”) approved by the fund. The loans are collateralized by cash and/or U.S. Treasury and federal agency obligations in an amount typically at least equal to the market value of the securities loaned. The market value of the loaned securities is determined at the close of business of the fund and any additional required collateral is delivered to the fund on the next business day. State Street provides the fund with indemnification against Borrower default. The fund bears the risk of loss with respect to the investment of cash collateral. On loans collateralized by cash, the cash collateral is invested in a money market fund or short-term securities. A portion of the income generated upon investment of the collateral is remitted to the Borrowers, and the remainder is allocated between the fund and the lending agent. On loans collateralized by U.S. Treasury and/or federal agency obligations, a fee is received from the Borrower, and is allocated between the fund and the lending agent. Income from securities lending is included in interest income on the Statement of Operations. The dividend and interest income earned on the securities loaned is accounted for in the same manner as other dividend and interest income.
Indemnifications – Under the fund’s organizational documents, its officers and Trustees may be indemnified against certain liabilities and expenses arising out of the performance of their duties to the fund. Additionally, in the normal course of business, the fund enters into agreements with service providers that may contain indemnification clauses. The fund’s
15
Table of Contents
MFS Global Growth Portfolio
Notes to Financial Statements – continued
maximum exposure under these agreements is unknown as this would involve future claims that may be made against the fund that have not yet occurred.
Investment Transactions and Income – Investment transactions are recorded on the trade date. Interest income is recorded on the accrual basis. Dividends received in cash are recorded on the ex-dividend date. Certain dividends from foreign securities will be recorded when the fund is informed of the dividend if such information is obtained subsequent to the ex-dividend date. Dividend and interest payments received in additional securities are recorded on the ex-dividend or ex-interest date in an amount equal to the value of the security on such date.
The fund may receive proceeds from litigation settlements. Any proceeds received from litigation involving portfolio holdings are reflected in the Statement of Operations in realized gain/loss if the security has been disposed of by the fund or in unrealized gain/loss if the security is still held by the fund. Any other proceeds from litigation not related to portfolio holdings are reflected as other income in the Statement of Operations.
Fees Paid Indirectly – The fund’s custody fee may be reduced according to an arrangement that measures the value of cash deposited with the custodian by the fund. This amount, for the year ended December 31, 2011, is shown as a reduction of total expenses on the Statement of Operations.
Tax Matters and Distributions – The fund intends to qualify as a regulated investment company, as defined under Subchapter M of the Internal Revenue Code, and to distribute all of its taxable income, including realized capital gains. As a result, no provision for federal income tax is required. The fund’s federal tax returns for the prior three fiscal years remain subject to examination by the Internal Revenue Service. Foreign taxes have been accrued by the fund in the accompanying financial statements.
Distributions to shareholders are recorded on the ex-dividend date. Income and capital gain distributions are determined in accordance with income tax regulations, which may differ from U.S. generally accepted accounting principles. Certain capital accounts in the financial statements are periodically adjusted for permanent differences in order to reflect their tax character. These adjustments have no impact on net assets or net asset value per share. Temporary differences which arise from recognizing certain items of income, expense, gain or loss in different periods for financial statement and tax purposes will reverse at some time in the future. Distributions in excess of net investment income or net realized gains are temporary overdistributions for financial statement purposes resulting from differences in the recognition or classification of income or distributions for financial statement and tax purposes.
Book/tax differences primarily relate to wash sale loss deferrals.
The tax character of distributions declared to shareholders for the last two fiscal years is as follows:
| 12/31/11 | 12/31/10 | |||||||
| Ordinary income (including any short-term capital gains) | $453,630 | $565,546 | ||||||
The federal tax cost and the tax basis components of distributable earnings were as follows:
| As of 12/31/11 | ||||
| Cost of investments | $59,827,978 | |||
| Gross appreciation | 5,486,509 | |||
| Gross depreciation | (5,898,383 | ) | ||
| Net unrealized appreciation (depreciation) | $(411,874 | ) | ||
| Undistributed ordinary income | 427,717 | |||
| Capital loss carryforwards | (9,508,505 | ) | ||
| Other temporary differences | (2,612 | ) |
Under the Regulated Investment Company Modernization Act of 2010 (the “Act”), net capital losses recognized after December 31, 2010 may be carried forward indefinitely, and their character is retained as short-term and/or long-term losses. Previously, net capital losses were carried forward for eight years and treated as short-term losses. As a transition rule, the Act requires that post-enactment net capital losses be used before pre-enactment net capital losses.
As of December 31, 2011, the fund had capital loss carryforwards available to offset future realized gains. Such losses expire as follows:
| Pre-enactment losses: | ||||
| 12/31/16 | $(4,185,178 | ) | ||
| 12/31/17 | (5,323,327 | ) | ||
| Total | $(9,508,505 | ) |
Multiple Classes of Shares of Beneficial Interest – The fund offers multiple classes of shares, which differ in their respective distribution and/or service fees. The fund’s income, realized and unrealized gain (loss), and common expenses are allocated to
16
Table of Contents
MFS Global Growth Portfolio
Notes to Financial Statements – continued
shareholders based on the daily net assets of each class. Dividends are declared separately for each class. Differences in per share dividend rates are generally due to differences in separate class expenses. The fund’s distributions declared to shareholders as reported on the Statements of Changes in Net Assets are presented by class as follows:
| From net investment income | ||||||||
| Year ended 12/31/11 | Year ended 12/31/10 | |||||||
| Initial Class | $440,257 | $541,002 | ||||||
| Service Class | 13,373 | 24,544 | ||||||
| Total | $453,630 | $565,546 | ||||||
| (3) | Transactions with Affiliates |
Investment Adviser – The fund has an investment advisory agreement with MFS to provide overall investment management and related administrative services and facilities to the fund.
The management fee is computed daily and paid monthly at the following annual rates:
| First $1 billion of average daily net assets | 0.90% | |||
| Next $1 billion of average daily net assets | 0.75% | |||
| Average daily net assets in excess of $2 billion | 0.65% |
The management fee incurred for the year ended December 31, 2011 was equivalent to an annual effective rate of 0.90% of the fund’s average daily net assets.
The investment adviser has agreed in writing to pay a portion of the fund’s total annual operating expenses, exclusive of interest, taxes, extraordinary expenses, brokerage and transaction costs and investment-related expenses such that total annual operating expenses do not exceed 1.40% of average daily net assets for the Initial Class shares and 1.65% of average daily net assets for the Service Class shares. This written agreement will continue until April 30, 2013. For the year ended December 31, 2011 the fund’s actual operating expenses did not exceed the limit and therefore, the investment adviser did not pay any portion of the fund’s expenses.
Distributor – MFS Fund Distributors, Inc. (MFD), a wholly-owned subsidiary of MFS, is the distributor of shares of the fund. The Trustees have adopted a distribution plan for the Service Class shares pursuant to Rule 12b-1 under the Investment Company Act of 1940.
The fund’s distribution plan provides that the fund will pay MFD distribution and/or service fees equal to 0.25% per annum of its average daily net assets attributable to Service Class shares as partial consideration for services performed and expenses incurred by MFD and financial intermediaries (including participating insurance companies that invest in the fund to fund variable annuity and variable life insurance contracts, sponsors of qualified retirement and pension plans that invest in the fund, and affiliates of these participating insurance companies and plan sponsors) in connection with the sale and distribution of the Service Class shares. MFD may subsequently pay all, or a portion, of the distribution and/or service fees to financial intermediaries.
Shareholder Servicing Agent – MFS Service Center, Inc. (MFSC), a wholly-owned subsidiary of MFS, receives a fee from the fund for its services as shareholder servicing agent. For the year ended December 31, 2011, the fee was $7,381, which equated to 0.0108% annually of the fund’s average daily net assets. MFSC also receives payment from the fund for out-of-pocket expenses paid by MFSC on behalf of the fund. For the year ended December 31, 2011, these costs amounted to $16.
Administrator – MFS provides certain financial, legal, shareholder communications, compliance, and other administrative services to the fund. Under an administrative services agreement, the fund partially reimburses MFS the costs incurred to provide these services. The fund is charged an annual fixed amount of $17,500 plus a fee based on average daily net assets. The administrative services fee incurred for the year ended December 31, 2011 was equivalent to an annual effective rate of 0.0345% of the fund’s average daily net assets.
Trustees’ and Officers’ Compensation – The fund pays compensation to Trustees in the form of a retainer, attendance fees, and additional compensation to the Board chairperson. The fund does not pay compensation directly to officers of the fund who are also officers of the investment adviser, all of whom receive remuneration for their services to the fund from MFS. Certain officers of the fund are officers or directors of MFS, MFD, and MFSC.
Other – This fund and certain other funds managed by MFS (the funds) have entered into services agreements (the Agreements) which provide for payment of fees by the funds to Tarantino LLC and Griffin Compliance LLC in return for the provision of services of an Independent Chief Compliance Officer (ICCO) and Assistant ICCO, respectively, for the funds. The ICCO and Assistant ICCO are officers of the funds and the sole members of Tarantino LLC and Griffin Compliance LLC,
17
Table of Contents
MFS Global Growth Portfolio
Notes to Financial Statements – continued
respectively. The funds can terminate the Agreements with Tarantino LLC and Griffin Compliance LLC at any time under the terms of the Agreements. MFS has agreed to bear all expenses associated with office space, other administrative support, and supplies provided to the ICCO and Assistant ICCO. For the year ended December 31, 2011, the aggregate fees paid by the fund to Tarantino LLC and Griffin Compliance LLC were $1,142 and are included in miscellaneous expense on the Statement of Operations.
The fund invests in the MFS Institutional Money Market Portfolio which is managed by MFS and seeks a high level of current income consistent with preservation of capital and liquidity. Income earned on this investment is included in dividends from underlying affiliated funds on the Statement of Operations. This money market fund does not pay a management fee to MFS.
| (4) | Portfolio Securities |
Purchases and sales of investments, other than U.S. Government securities, purchased option transactions, and short-term obligations, aggregated $24,658,161 and $36,049,136, respectively.
| (5) | Shares of Beneficial Interest |
The fund’s Declaration of Trust permits the Trustees to issue an unlimited number of full and fractional shares of beneficial interest. Transactions in fund shares were as follows:
| Year ended 12/31/11 | Year ended 12/31/10 | |||||||||||||||
| Shares | Amount | Shares | Amount | |||||||||||||
| Shares sold | ||||||||||||||||
Initial Class | 27,519 | $426,605 | 47,368 | $708,923 | ||||||||||||
Service Class | 13,987 | 220,430 | 16,148 | 235,445 | ||||||||||||
| 41,506 | $647,035 | 63,516 | $944,368 | |||||||||||||
| Shares issued to shareholders in reinvestment of distributions | ||||||||||||||||
Initial Class | 28,813 | $440,257 | 35,899 | $541,002 | ||||||||||||
Service Class | 878 | 13,373 | 1,634 | 24,544 | ||||||||||||
| 29,691 | $453,630 | 37,533 | $565,546 | |||||||||||||
| Shares reacquired | ||||||||||||||||
Initial Class | (728,901 | ) | $(11,745,204 | ) | (813,422 | ) | $(11,782,957 | ) | ||||||||
Service Class | (61,974 | ) | (984,448 | ) | (107,508 | ) | (1,556,994 | ) | ||||||||
| (790,875 | ) | $(12,729,652 | ) | (920,930 | ) | $(13,339,951 | ) | |||||||||
| Net change | ||||||||||||||||
Initial Class | (672,569 | ) | $(10,878,342 | ) | (730,155 | ) | $(10,533,032 | ) | ||||||||
Service Class | (47,109 | ) | (750,645 | ) | (89,726 | ) | (1,297,005 | ) | ||||||||
| (719,678 | ) | $(11,628,987 | ) | (819,881 | ) | $(11,830,037 | ) | |||||||||
| (6) | Line of Credit |
The fund and certain other funds managed by MFS participate in a $1.1 billion unsecured committed line of credit, subject to a $1 billion sublimit, provided by a syndication of banks under a credit agreement. Borrowings may be made for temporary financing needs. Interest is charged to each fund, based on its borrowings, generally at a rate equal to the higher of the Federal Reserve funds rate or one month LIBOR plus an agreed upon spread. A commitment fee, based on the average daily, unused portion of the committed line of credit, is allocated among the participating funds at the end of each calendar quarter. In addition, the fund and other funds managed by MFS have established unsecured uncommitted borrowing arrangements with certain banks for temporary financing needs. Interest is charged to each fund, based on its borrowings, at a rate equal to the Federal Reserve funds rate plus an agreed upon spread. For the year ended December 31, 2011, the fund’s commitment fee and interest expense were $530 and $0, respectively, and are included in miscellaneous expense on the Statement of Operations.
| (7) | Transactions in Underlying Affiliated Funds – Affiliated Issuers |
An affiliated issuer may be considered one in which the fund owns 5% or more of the outstanding voting securities, or a company which is under common control. For the purposes of this report, the fund assumes the following to be affiliated issuers:
| Underlying Affiliated Funds | Beginning Shares/Par Amount | Acquisitions Shares/Par Amount | Dispositions Shares/Par Amount | Ending Shares/Par Amount | ||||||||||||
| MFS Institutional Money Market Portfolio | 683,229 | 13,942,553 | (14,193,671 | ) | 432,111 | |||||||||||
| Underlying Affiliated Funds | Realized Gain (Loss) | Capital Gain Distributions | Dividend Income | Ending Value | ||||||||||||
| MFS Institutional Money Market Portfolio | $— | $— | $777 | $432,111 | ||||||||||||
18
Table of Contents
MFS Global Growth Portfolio
REPORT OF INDEPENDENT REGISTERED PUBLIC ACCOUNTING FIRM
To the Board of Trustees of MFS Variable Insurance Trust II and the Shareholders of
MFS Global Growth Portfolio:
We have audited the accompanying statement of assets and liabilities, including the portfolio of investments, of MFS Global Growth Portfolio (the “Fund”) (one of the portfolios comprising MFS Variable Insurance Trust II) as of December 31, 2011, and the related statement of operations for the year then ended, the statements of changes in net assets for each of the two years in the period then ended, and the financial highlights for each of the five years in the period then ended. These financial statements and financial highlights are the responsibility of the Fund’s management. Our responsibility is to express an opinion on these financial statements and financial highlights based on our audits.
We conducted our audits in accordance with the standards of the Public Company Accounting Oversight Board (United States). Those standards require that we plan and perform the audit to obtain reasonable assurance about whether the financial statements and financial highlights are free of material misstatement. The Fund is not required to have, nor were we engaged to perform, an audit of its internal control over financial reporting. Our audits included consideration of internal control over financial reporting as a basis for designing audit procedures that are appropriate in the circumstances, but not for the purpose of expressing an opinion on the effectiveness of the Fund’s internal control over financial reporting. Accordingly, we express no such opinion. An audit also includes examining, on a test basis, evidence supporting the amounts and disclosures in the financial statements, assessing the accounting principles used and significant estimates made by management, as well as evaluating the overall financial statement presentation. Our procedures included confirmation of securities owned as of December 31, 2011, by correspondence with the custodian. We believe that our audits provide a reasonable basis for our opinion.
In our opinion, the financial statements and financial highlights referred to above present fairly, in all material respects, the financial position of MFS Global Growth Portfolio as of December 31, 2011, the results of its operations for the year then ended, the changes in its net assets for each of the two years in the period then ended, and the financial highlights for each of the five years in the period then ended, in conformity with accounting principles generally accepted in the United States of America.
DELOITTE & TOUCHE LLP
Boston, Massachusetts
February 15, 2012
19
Table of Contents
MFS Global Growth Portfolio
RESULTS OF SHAREHOLDER MEETING (unaudited)
At a special meeting of shareholders of MFS Global Growth Portfolio, which was held on December 1, 2011, the following actions were taken for which shareholders of all series of MFS Variable Insurance Trust II voted together as a single class with respect to Item 1 and shareholders of MFS Global Growth Portfolio voted as a separate class with respect to Items 2 and 3:
Item 1: Election of ten Trustees as members of the Board of Trustees of the Trust effective January 1, 2012:
| Number of Shares | ||||||||
| For | Withheld Authority | |||||||
| Robert E. Butler | 681,916,712.8686 | 46,472,894.9218 | ||||||
| Maureen R. Goldfarb | 682,835,794.8512 | 45,553,812.9392 | ||||||
| David H. Gunning | 681,500,267.3085 | 46,889,340.4819 | ||||||
| William R. Gutow | 681,050,223.5547 | 47,339,384.2357 | ||||||
| Michael Hegarty | 682,477,088.8584 | 45,912,518.9320 | ||||||
| John P. Kavanaugh | 683,794,425.4269 | 44,595,182.3635 | ||||||
| Robert J. Manning | 682,699,559.7374 | 45,690,048.0530 | ||||||
| J. Dale Sherratt | 681,362,743.0513 | 47,026,864.7391 | ||||||
| Laurie J. Thomsen | 683,408,094.0000 | 44,981,513.7904 | ||||||
| Robert W. Uek | 681,424,852.0247 | 46,964,755.7657 | ||||||
Item 2: To approve a new investment advisory agreement dated January 1, 2012, between the Trust, on behalf of MFS Global Growth Portfolio, and MFS:
| Number of Shares | ||||||||||||
| For | Against | Withheld Authority | ||||||||||
| 3,589,286.6584 | 120,953.1866 | 367,343.9107 | ||||||||||
Item 3: To approve revisions to and restatements of certain fundamental investment restrictions of MFS Global Growth Portfolio effective January 1, 2012 as detailed below:
| Number of Shares | ||||||||||||||
| For | Against | Withheld Authority | ||||||||||||
| A. | Borrowing | 3,433,840.3162 | 249,483.2154 | 394,260.2241 | ||||||||||
| B. | Underwriting Securities | 3,495,469.7768 | 196,481.5005 | 385,632.4784 | ||||||||||
| C. | Issuance of Senior Securities | 3,511,899.3515 | 178,954.6260 | 386,729.7782 | ||||||||||
| D. | Lending of Money or Securities | 3,461,931.0306 | 235,747.0235 | 379,905.7016 | ||||||||||
| E. | Purchases or Sales of Real Estate; Interests in Oil, Gas or Mineral Leases; and Commodities | 3,585,348.4943 | 157,332.4609 | 334,902.8005 | ||||||||||
| F. | Industry Concentration | 3,534,472.1718 | 136,558.4367 | 406,553.1472 | ||||||||||
20
Table of Contents
MFS Global Growth Portfolio
TRUSTEES AND OFFICERS – IDENTIFICATION AND BACKGROUND
The Trustees and officers of the Trust, as of February 1, 2012, are listed below, together with their principal occupations during the past five years. (Their titles may have varied during that period.) The address of each Trustee and officer is 500 Boylston Street, Boston, Massachusetts 02116.
Name, Age | Position(s) with Fund | Trustee/Officer Since (h) | Principal Occupations | Other Directorships (j) | ||||
| INTERESTED TRUSTEES | ||||||||
Robert J. Manning (k) (age 48) | Trustee | February 2004 | Massachusetts Financial Services Company, Chairman, Chief Executive Officer and Director; President (until December 2009); Chief Investment Officer (until July 2010) | N/A | ||||
| INDEPENDENT TRUSTEES | ||||||||
David H. Gunning (age 69) | Trustee and Chair of Trustees | January 2004 | Retired; Cleveland-Cliffs Inc. (mining products and service provider), Vice Chairman/Director (until May 2007) | Lincoln Electric Holdings, Inc. (welding equipment manufacturer), Director; Development Alternatives, Inc. (consulting), Director/Non-Executive Chairman; Portman Limited (mining), Director (until 2008) | ||||
Robert E. Butler (age 70) | Trustee | January 2006 | Consultant – investment company industry regulatory and compliance matters | N/A | ||||
Maureen R. Goldfarb (age 56) | Trustee | January 2009 | Private investor | N/A | ||||
William R. Gutow (age 70) | Trustee | December 1993 | Private investor and real estate consultant; Capitol Entertainment Management Company (video franchise), Vice Chairman | Atlantic Coast Tan (tanning salons), Vice Chairman (until 2007); Texas Donuts (donut franchise), Vice Chairman (until 2010) | ||||
Michael Hegarty (age 67) | Trustee | December 2004 | Private investor | N/A | ||||
John P. Kavanaugh (age 57) | Trustee | January 2009 | Private investor; The Hanover Insurance Group, Inc., Vice President and Chief Investment Officer (until 2006); Allmerica Investment Trust, Allmerica Securities Trust and Opus Investment Trust (investment companies), Chairman, President and Trustee (until 2006) | N/A | ||||
J. Dale Sherratt (age 73) | Trustee | June 1989 | Insight Resources, Inc. (acquisition planning specialists), President; Wellfleet Investments (investor in health care companies), Managing General Partner | N/A | ||||
Laurie J. Thomsen (age 54) | Trustee | March 2005 | Private investor; New Profit, Inc. (venture philanthropy), Executive Partner (until 2010) | The Travelers Companies (property and casualty insurance), Director | ||||
Robert W. Uek (age 70) | Trustee | January 2006 | Consultant to investment company industry | N/A | ||||
| OFFICERS | ||||||||
John M. Corcoran (k) (age 46) | President | October 2008 | Massachusetts Financial Services Company, Senior Vice President (since October 2008); State Street Bank and Trust (financial services provider), Senior Vice President, (until September 2008) | N/A | ||||
| Christopher R. Bohane (k) (age 38) | Assistant Secretary and Assistant Clerk | July 2005 | Massachusetts Financial Services Company, Vice President and Senior Counsel | N/A | ||||
Kino Clark (k) (age 43) | Assistant Treasurer | January 2012 | Massachusetts Financial Services Company, Assistant Vice President | N/A | ||||
21
Table of Contents
MFS Global Growth Portfolio
Trustees and Officers – continued
Name, Age | Position(s) with Fund | Trustee/Officer Since (h) | Principal Occupations | Other Directorships (j) | ||||
Ethan D. Corey (k) (age 48) | Assistant Secretary and Assistant Clerk | July 2005 | Massachusetts Financial Services Company, Senior Vice President and Associate General Counsel | N/A | ||||
David L. DiLorenzo (k) (age 43) | Treasurer | July 2005 | Massachusetts Financial Services Company, Vice President | N/A | ||||
Robyn L. Griffin (age 36) | Assistant Independent Chief Compliance Officer | August 2008 | Griffin Compliance LLC (provider of compliance services), Principal (since August 2008); State Street Corporation (financial services provider), Mutual Fund Administration Assistant Vice President (October 2006 – July 2008); Liberty Mutual Group (insurance), Personal Market Assistant Controller (April 2006 – October 2006); Deloitte & Touche LLP (professional services firm). | N/A | ||||
Brian E. Langenfeld (k) (age 38) | Assistant Secretary and Assistant Clerk | June 2006 | Massachusetts Financial Services Company, Vice President and Senior Counsel | N/A | ||||
Ellen Moynihan (k) (age 54) | Assistant Treasurer | April 1997 | Massachusetts Financial Services Company, Senior Vice President | N/A | ||||
Susan S. Newton (k) (age 61) | Assistant Secretary and Assistant Clerk | May 2005 | Massachusetts Financial Services Company, Senior Vice President and Associate General Counsel | N/A | ||||
Susan A. Pereira (k) (age 41) | Assistant Secretary and Assistant Clerk | July 2005 | Massachusetts Financial Services Company, Vice President and Senior Counsel | N/A | ||||
Mark N. Polebaum (k) (age 59) | Secretary and Clerk | January 2006 | Massachusetts Financial Services Company, Executive Vice President, General Counsel and Secretary | N/A | ||||
Frank L. Tarantino (age 67) | Independent Chief Compliance Officer | June 2004 | Tarantino LLC (provider of compliance services), Principal | N/A | ||||
Richard S. Weitzel (k) (age 41) | Assistant Secretary and Assistant Clerk | October 2007 | Massachusetts Financial Services Company, Vice President and Assistant General Counsel | N/A | ||||
James O. Yost (k) (age 51) | Deputy Treasurer | September 1990 | Massachusetts Financial Services Company, Senior Vice President | N/A | ||||
| (h) | Date first appointed to serve as Trustee/officer of an MFS fund. Each Trustee has served continuously since appointment unless indicated otherwise. For the period from December 15, 2004 until February 22, 2005, Mr. Manning served as Advisory Trustee. For the period October 2008, until January 2012, Mr. Corcoran served as Treasurer of the Funds. Prior to January 2012, Messrs. DiLorenzo and Yost served as Assistant Treasurers of the Funds. |
| (j) | Directorships or trusteeships of companies required to report to the Securities and Exchange Commission (i.e., “public companies”). |
| (k) | “Interested person” of the Trust within the meaning of the Investment Company Act of 1940 (referred to as the 1940 Act), which is the principal federal law governing investment companies like the fund, as a result of position with MFS. The address of MFS is 500 Boylston Street, Boston, Massachusetts 02116. |
Each Trustee has been elected by shareholders and each Trustee and officer holds office until his or her successor is chosen and qualified or until his or her earlier death, resignation, retirement or removal. The Trust does not hold annual meetings for the purpose of electing Trustees, and Trustees are not elected for fixed terms. Messrs. Butler, Kavanaugh, Uek and Ms. Thomsen are members of the Trust’s Audit Committee.
Each of the Fund’s Trustees and officers holds comparable positions with certain other funds of which MFS or a subsidiary is the investment adviser or distributor, and, in the case of the officers, with certain affiliates of MFS. As of January 1, 2012, the Trustees served as board members of 131 funds within the MFS Family of Funds.
22
Table of Contents
MFS Global Growth Portfolio
Trustees and Officers – continued
The Statement of Additional Information for the Fund includes further information about the Trustees and is available without charge upon request by calling 1-800-225-2606.
Investment Adviser Massachusetts Financial Services Company 500 Boylston Street, Boston, MA 02116-3741 | Custodian State Street Bank and Trust 1 Lincoln Street, Boston, MA 02111-2900 | |
Distributor MFS Fund Distributors, Inc. 500 Boylston Street, Boston, MA 02116-3741 | Independent Registered Public Accounting Firm Deloitte & Touche LLP 200 Berkeley Street, Boston, MA 02116 | |
Portfolio Managers David Antonelli Jeffrey Constantino |
23
Table of Contents
MFS Global Growth Portfolio
At a special meeting of shareholders of the MFS Global Growth Portfolio (hereinafter referred to as the “Fund” or the “Portfolio”), which was held on December 1, 2011, the shareholders approved a new investment advisory agreement based on the recommendation of the Board of Trustees. At its July, 2011 meeting, the Board of Trustees (i) approved, and recommended for shareholder approval, the new investment advisory agreement effective January 1, 2012, and (ii) the continuation of the existing investment advisory agreement effective September 1, 2011. The following includes a description of the factors that the Board of Trustees considered and the conclusions that formed the basis of their approval of both the new investment advisory agreement and the continuation of the prior investment advisory agreement.
BOARD APPROVAL OF NEW INVESTMENT ADVISORY AGREEMENT
The Investment Company Act of 1940 requires that both the full Board of Trustees and a majority of the non-interested (“independent”) Trustees, voting separately, initially approve the new investment advisory agreement (the “New Agreement”) between Massachusetts Financial Services Company (“MFS”) and MFS Variable Insurance Trust II (the “Trust”) on behalf of the Portfolio and, beginning on the second anniversary of the initial effective date of the New Agreement, annually approve the continuation of the New Agreement. The Trustees have considered matters bearing on the Portfolio and the then current advisory arrangement at their meetings throughout the year, including a review of performance data at each regular meeting. In addition, the independent Trustees met in person in July 2011 to consider the initial approval of the New Agreement, and to recommend that shareholders approve the New Agreement. The independent Trustees were assisted in their evaluation of the New Agreement by independent legal counsel, from whom they received separate legal advice and with whom they met separately from MFS management. The independent Trustees were also assisted in this process by the Portfolio’s Independent Chief Compliance Officer, a full-time senior officer appointed by and reporting to the independent Trustees.
In connection with their deliberations regarding the initial approval of the New Agreement, the Trustees, including the independent Trustees, considered such information and factors as they believed, in light of the legal advice furnished to them and their own business judgment, to be relevant. The New Agreement was considered separately for the series of the Trust (collectively, the “Portfolios”), although the Trustees also took into account the common interests of all Portfolios in the Trust in their review. As described below, the Trustees considered the nature, quality, and extent of the various investment advisory, administrative, and/or shareholder services to be performed by MFS under the New Agreement and other arrangements with the Trust.
In connection with their initial review meeting, the Trustees received and relied upon materials that included, among other items: (i) information provided by MFS on the advisory fees of comparable portfolios of its other clients, including institutional separate account and other clients, (ii) information as to whether, and to what extent applicable, expense waivers, reimbursements or fee “breakpoints” would be observed for the Portfolio under the New Agreement, and (iii) a comparison and summary of the differences in the provisions in the New Agreement compared to those in each of the then current investment advisory agreements for the Portfolios. In addition, in connection with the independent Trustees’ meetings in May and July, 2011 (the “contract review meetings”) for the purpose of considering whether to approve the continuation of the then current investment advisory agreements for the Portfolio, the independent Trustees received: (1) information provided by Lipper Inc. (“Lipper”) on the investment performance of the Portfolio for various time periods ended December 31, 2010, compared to the investment performance of a group of funds with substantially similar investment classifications/objectives (the “Lipper performance universe”), (2) information provided by Lipper on the Portfolio’s advisory fees and other expenses compared to the advisory fees and other expenses of comparable funds identified by Lipper (the “Lipper expense group”), (3) information regarding MFS’ financial results and financial condition, including MFS’ and certain of its affiliates’ estimated profitability from services performed for the Portfolio, (4) MFS’ views regarding the outlook for the mutual fund industry and its strategic business plans, (5) descriptions of various functions performed by MFS for the Trust, such as compliance monitoring and portfolio trading practices, and (6) information regarding the overall organization of MFS, including information about MFS’ senior management and other personnel providing investment advisory, administrative and other services to the Portfolio. The comparative performance, fee and expense information prepared and provided by Lipper was not independently verified, and the independent Trustees did not independently verify any information provided to them by MFS.
The Trustees’ conclusion as to the initial approval of the New Agreement was based on comprehensive consideration of all information provided to the Trustees and was not the result of any single factor. Some of the factors that figured particularly in the Trustees’ deliberations are described below for the Portfolio, while individual Trustees may have given different weight to various factors and evaluated the information presented as a whole differently than another individual Trustee. The Trustees recognized that the fee arrangements for the Portfolio could reflect years of review and discussion between the independent Trustees and MFS, that certain aspects of such arrangements may receive greater scrutiny in some years than others, and that
24
Table of Contents
MFS Global Growth Portfolio
Board Approval of New Investment Advisory Agreement – continued
the Trustees’ conclusions may be based, in part, on their consideration of these same arrangements during the course of the year and in prior years.
Because the portfolio management team managing the Portfolio’s investments under the then current investment advisory agreement will remain the same under the New Agreement for the Portfolio, the Trustees compared the Portfolio’s total return investment performance to the performance of its Lipper performance universe over various time periods, based on information provided by Lipper. The Trustees placed particular emphasis on the total return performance of the Portfolio’s Initial Class shares in comparison to the performance of funds in its Lipper performance universe over the one-, three- and five-year periods ended December 31, 2010. The Trustees did not rely on performance results for more recent periods.
The Trustees noted the performance of the Portfolio’s Initial Class shares was in the 4th quintile relative to the other funds in the Lipper performance universe for the one-year period (the 1st quintile being the best performers and the 5th quintile being the worst performers). The total return performance of the Portfolio was in the 3rd quintile for the three-year period and in the 2nd quintile for the five-year period ended December 31, 2010, relative to the Lipper performance universe. Based on the nature and quality of services provided by MFS and MFS’ explanation of steps taken to improve performance, the Board of Trustees concluded that the Portfolio’s performance was adequate.
In the course of their deliberations, the Trustees took into account information provided by MFS during contract review meetings, as well as during investment review meetings conducted with portfolio management personnel during the course of the year. For Portfolios whose performance lagged their peer groups, they discussed the factors that contributed thereto and MFS’ efforts to improve such Portfolios’ performance. After reviewing this information, the Trustees concluded, within the context of their overall conclusions regarding the New Agreement, that they were satisfied with MFS’ responses and efforts relating to investment performance.
In assessing the reasonableness of the Portfolio’s advisory fee, the Trustees considered, among other information, the Portfolio’s advisory fee and the total expense ratio of the Portfolio’s Initial Class shares as a percentage of average daily net assets, compared to the advisory fee and total expense ratios of its peer group of funds based on information provided by Lipper. The Trustees also considered the advisory fees charged by MFS to institutional accounts. In comparing these fees, the Trustees considered the generally broader scope of services provided by MFS to the Trust than those provided to institutional accounts. The Trustees also considered the higher demands placed on MFS’ investment personnel and trading infrastructure as a result of the daily cash in-flows and out-flows of the Portfolio, and the impact on MFS and related expenses due to the more extensive regulatory regime to which the Portfolio is subject, compared to institutional accounts.
In considering the fees, the Trustees noted from the Lipper data that the Portfolio’s effective advisory fee rate and total expense ratio were each above the median of such fees and expenses of funds in the Lipper expense group. In addition, the Trustees accepted MFS’ offer to continue the expense limitation for the Portfolio. The Trustees further noted that the New Agreement would reflect MFS’ agreement to reduce the advisory fee on average daily net assets over $1 billion and over $2 billion on a permanent basis, and concluded that the breakpoints were sufficient to allow the Portfolio to benefit from economies of scale as its assets grow. The Trustees concluded that the fees were reasonable in light of the nature and quality of services provided.
The Trustees also considered whether the Portfolio is likely to benefit from any economies of scale due to future asset growth. In this regard, the Trustees reviewed the adequacy of breakpoints and discussed with MFS any adjustments necessary for the shareholders’ benefit.
The Trustees also considered information prepared by MFS relating to its costs and profits with respect to the Portfolio and other investment companies and accounts advised by MFS, as well as MFS’ methodologies used to determine and allocate its costs to the Portfolio and other accounts and products for purposes of estimating profitability.
The Trustees noted that there would be no increase to the net advisory fee arrangement for the Portfolio under the New Agreement when compared to the Portfolio’s then current investment advisory agreement. After reviewing these and other factors described below, the Trustees concluded that the advisory fees charged to the Portfolio under the New Agreement represent reasonable compensation in light of the nature and quality of the services being provided by MFS.
In addition, the Trustees considered MFS’ resources and related efforts to continue to retain, attract and motivate capable personnel to serve the Portfolio. The Trustees also considered the financial resources of MFS and its parent, Sun Life Financial Inc. The Trustees further considered any advantages and possible disadvantages of having an adviser which also serves other investment companies as well as institutional accounts.
The Trustees also considered the nature, quality, cost, and extent of administrative, transfer agency, and distribution services provided to the Trust by MFS and its affiliates under agreements and plans other than the New Agreement, including the 12b-1
25
Table of Contents
MFS Global Growth Portfolio
Board Approval of New Investment Advisory Agreement – continued
fees the Portfolio pays to MFS Fund Distributors, Inc., an affiliate of MFS. The Trustees also considered the nature, extent and quality of certain other services MFS performs or arranges on the Portfolio’s behalf, which may include securities lending programs, directed expense payment programs, class action recovery programs, and MFS’ interaction with third-party service providers, principally custodians and sub-custodians. The Trustees concluded that the various non-advisory services provided by MFS and its affiliates on behalf of the Portfolio were satisfactory. The Trustees also considered the benefits to MFS from the use of the Portfolio’s portfolio brokerage commissions to pay for investment research and various other factors. Additionally, the Trustees considered so-called “fall-out benefits” to MFS such as reputational value derived from serving as investment manager to the Trust, and determined that any such benefits derived by MFS were reasonable and fair.
Based on their evaluation of factors that they deemed to be material, including those factors described above, the Board of Trustees, including a majority of the independent Trustees, concluded that the New Agreement should be approved for an initial two-year period, commencing upon its effective date, as set forth in the New Agreement.
BOARD APPROVAL OF CONTINUATION OF PRIOR INVESTMENT ADVISORY AGREEMENT
The Investment Company Act of 1940 requires that both the full Board of Trustees and a majority of the non-interested (“independent”) Trustees, voting separately, annually approve the continuation of the investment advisory agreement between MFS Variable Insurance Trust II (the “Trust”) and Massachusetts Financial Services Company (“MFS”) on behalf of the Fund. The Trustees consider matters bearing on the Fund and the advisory arrangements at their meetings throughout the year, including a review of performance data at each regular meeting. In addition, the independent Trustees met in person in May and again in July 2011 (“contract review meetings”) for the specific purpose of considering whether to approve the continuation of the investment advisory agreement for the Fund. The independent Trustees were assisted in their evaluation of the investment advisory agreement by independent legal counsel, from whom they received separate legal advice and with whom they met separately from MFS management during various contract review meetings. The independent Trustees were also assisted in this process by the Fund’s Independent Chief Compliance Officer, a full-time senior officer appointed by and reporting to the independent Trustees.
In connection with their deliberations, the Trustees, including the independent Trustees, considered such information and factors as they believed, in light of the legal advice furnished to them and their own business judgment, to be relevant. The investment advisory agreement was considered separately for the Fund, although the Trustees also took into account the common interests of all Funds in the Trust in their review. As described below, the Trustees considered the nature, quality, and extent of the various investment advisory, administrative, and shareholder services performed by MFS under the existing investment advisory agreement and other arrangements with the Trust.
In connection with their contract review meetings, the Trustees received and relied upon materials which included, among other items: (i) information provided by Lipper Inc. (“Lipper”) on the investment performance of the Fund for various time periods ended December 31, 2010, compared to the investment performance of a group of funds with substantially similar investment classifications/objectives (the “Lipper performance universe”), (ii) information provided by Lipper on the Fund’s advisory fees and other expenses compared to the advisory fees and other expenses of comparable funds identified by Lipper (the “Lipper expense group”), (iii) information provided by MFS on the advisory fees of comparable portfolios of its other clients, including institutional separate account and other clients, (iv) information as to whether, and to what extent applicable, expense waivers, reimbursements or fee “breakpoints” are observed for the Fund, (v) information regarding MFS’ financial results and financial condition, including MFS’ and certain of its affiliates’ estimated profitability from services performed for the Fund and other investment companies that the Board oversees as a whole, and for MFS’ institutional business, (vi) MFS’ views regarding the outlook for the mutual fund industry and its strategic business plans, (vii) descriptions of various functions performed by MFS for the Trust, such as compliance monitoring and portfolio trading practices, and (viii) information regarding the overall organization of MFS, including information about MFS’ senior management and other personnel providing investment advisory, administrative and other services to the Fund. The comparative performance, fee and expense information prepared and provided by Lipper was not independently verified, and the independent Trustees did not independently verify any information provided to them by MFS.
The Trustees’ conclusion as to the continuation of the investment advisory agreement was based on comprehensive consideration of all information provided to the Trustees and was not the result of any single factor. Some of the factors that figured particularly in the Trustees’ deliberations are described below for the Fund, while individual Trustees may have given different weight to various factors and evaluated the information presented as a whole differently than another individual Trustee. The Trustees recognized that the fee arrangements for the Fund reflect years of review and discussion between the independent Trustees and MFS, that certain aspects of such arrangements may receive greater scrutiny in some years than
26
Table of Contents
MFS Global Growth Portfolio
Board Approval of Continuation of Prior Investment Advisory Agreement – continued
others, and that the Trustees’ conclusions may be based, in part, on their consideration of these same arrangements during the course of the year and in prior years.
Based on information provided by Lipper, the Trustees compared the Fund’s total return investment performance to the performance of the Lipper performance universe over various time periods. The Trustees placed particular emphasis on the total return performance of the Fund’s Initial Class shares in comparison to the performance of funds in its Lipper performance universe over the one-, three- and five -year periods ended December 31, 2010. The Trustees did not rely on performance results for more recent periods, including those shown elsewhere in this report.
The Trustees noted the performance of the Fund’s Initial Class shares was in the 4th quintile relative to the other funds in the Lipper performance universe for the one-year period (the 1st quintile being the best performers and the 5th quintile being the worst performers). The total return performance of the Fund was in the 3rd quintile for the three-year period and in the 2nd quintile for the five-year period ended December 31, 2010, relative to the Lipper performance universe. Based on the nature and quality of services provided by MFS, the Board of Trustees concluded that the Fund’s performance was satisfactory.
In the course of their deliberations, the Trustees took into account information provided by MFS during contract review meetings, as well as during investment review meetings conducted with portfolio management personnel during the course of the year.
In assessing the reasonableness of the Fund’s advisory fee, the Trustees considered, among other information, the Fund’s advisory fee and the total expense ratio of the Fund’s Initial Class shares as a percentage of average daily net assets, compared to the advisory fee and total expense ratios of its peer group of funds based on information provided by Lipper. The Trustees also considered the advisory fees charged by MFS to institutional accounts. In comparing these fees, the Trustees considered the generally broader scope of services provided by MFS to the Trust than those provided to institutional accounts. The Trustees also considered the higher demands placed on MFS’ investment personnel and trading infrastructure as a result of the daily cash in-flows and out-flows of the Fund, and the impact on MFS and related expenses due to the more extensive regulatory regime to which the Fund is subject, compared to institutional accounts.
In considering the fees, the Trustees noted from the Lipper data (which takes into account any reductions or expense limitations) that the Fund’s effective advisory fee rate and total expense ratio were each above the median of such fees and expenses of funds in the Lipper expense group. In addition, the Trustees accepted MFS’ offer to continue the expense limitation for the Fund. The Trustees further concluded that the existing breakpoints were sufficient to allow the Fund to benefit from economies of scale as its assets grow. The Trustees concluded that the fees were reasonable in light of the nature and quality of services provided.
The Trustees also considered information prepared by MFS relating to its costs and profits with respect to the Fund and other investment companies and accounts advised by MFS, as well as MFS’ methodologies used to determine and allocate its costs to the Fund and other accounts and products for purposes of estimating profitability.
After reviewing these and other factors described below, the Trustees concluded that the advisory fees charged to the Fund represent reasonable compensation in light of the nature and quality of the services being provided by MFS.
In addition, the Trustees considered MFS’ resources and related efforts to continue to retain, attract and motivate capable personnel to serve the Fund. The Trustees also considered the financial resources of MFS and its parent, Sun Life Financial Inc. The Trustees further considered any advantages and possible disadvantages of having an adviser which also serves other investment companies as well as institutional accounts.
The Trustees also considered the nature, quality, cost, and extent of administrative, transfer agency, and distribution services provided to the Fund by MFS and its affiliates under agreements and plans other than the investment advisory agreement, including the 12b-1 fees the Fund pays to MFS Fund Distributors, Inc., an affiliate of MFS. The Trustees also considered the nature, extent and quality of certain other services MFS performs or arranges on the Fund’s behalf, which may include securities lending programs, directed expense payment programs, class action recovery programs, and MFS’ interaction with third-party service providers, principally custodians and sub-custodians. The Trustees concluded that the various non-advisory services provided by MFS and its affiliates on behalf of the Fund were satisfactory. The Trustees also considered the benefits to MFS from the use of the Fund’s portfolio brokerage commissions, if applicable, to pay for investment research and various other factors. Additionally, the Trustees considered so-called “fall-out benefits” to MFS such as reputational value derived from serving as investment manager to the Trust, and determined that any such benefits derived by MFS were reasonable and fair.
Based on their evaluation of factors that they deemed to be material, including those factors described above, the Board of Trustees, including a majority of the independent Trustees, concluded that the investment advisory agreement should be continued for an additional one-year period, commencing September 1, 2011.
27
Table of Contents
MFS Global Growth Portfolio
Board Approval of Continuation of Prior Investment Advisory Agreement – continued
A discussion regarding the Board’s most recent review and renewal of the fund’s Investment Advisory Agreement with MFS is available by clicking on the fund’s name under “Variable Insurance Portfolios — VIT II” in the “Products and Performance” section of the MFS Web site (mfs.com).
28
Table of Contents
MFS Global Growth Portfolio
PROXY VOTING POLICIES AND INFORMATION
A general description of the MFS funds’ proxy voting policies and procedures is available without charge, upon request, by calling
1-800-225-2606, by visiting the Proxy Voting section of mfs.com or by visiting the SEC’s Web site at http://www.sec.gov.
Information regarding how the fund voted proxies relating to portfolio securities during the most recent twelve-month period ended June 30 is available without charge by visiting the Proxy Voting section of mfs.com or by visiting the SEC’s Web site at http://www.sec.gov.
QUARTERLY PORTFOLIO DISCLOSURE
The fund will file a complete schedule of portfolio holdings with the Securities and Exchange Commission (the Commission) for the first and third quarters of each fiscal year on Form N-Q. The fund’s Form N-Q is available on the EDGAR database on the Commission’s Internet Web site at http://www.sec.gov and may be reviewed and copied at the:
Public Reference Room
Securities and Exchange Commission
100 F Street, NE, Room 1580
Washington, D.C. 20549
Information on the operation of the Public Reference Room may be obtained by calling the Commission at 1-800-SEC-0330. Copies of the fund’s Form N-Q also may be obtained, upon payment of a duplicating fee, by electronic request at the following e-mail address: publicinfo@sec.gov or by writing the Public Reference Section at the above address.
From time to time, MFS may post important information about the fund or the MFS funds on the MFS web site (mfs.com). This information is available by visiting the “News & Commentary” section of mfs.com or by clicking on the fund’s name under “Variable Insurance Portfolios — VIT II” in the “Products and Performance” section of mfs.com.
FEDERAL TAX INFORMATION (unaudited)
The following information is provided pursuant to provisions of the Internal Revenue Code.
For corporate shareholders, 74.27% of the ordinary income dividends paid during the fiscal year qualify for the corporate dividends received deduction.
Income derived from foreign sources was $937,665. The fund intends to pass through foreign tax credits of $68,845 for the fiscal year.
29
Table of Contents
rev. 3/11

| Why? | Financial companies choose how they share your personal information. Federal law gives consumers the right to limit some but not all sharing. Federal law also requires us to tell you how we collect, share, and protect your personal information. Please read this notice carefully to understand what we do. |
| What? | The types of personal information we collect and share depend on the product or service you have with us. This information can include:
• Social Security number and account balances • Account transactions and transaction history • Checking account information and wire transfer instructions
When you are no longer our customer, we continue to share your information as described in this notice. |
| How? | All financial companies need to share customers’ personal information to run their everyday business. In the section below, we list the reasons financial companies can share their customers’ personal information; the reasons MFS chooses to share; and whether you can limit this sharing. |
| Reasons we can share your personal information | Does MFS share? | Can you limit this sharing? | ||
For our everyday business purposes – such as to process your transactions, maintain your account(s), respond to court orders and legal investigations, or report to credit bureaus | Yes | No | ||
For our marketing purposes – to offer our products and services to you | No | We don’t share | ||
| For joint marketing with other financial companies | No | We don’t share | ||
For our affiliates’ everyday business purposes – information about your transactions and experiences | No | We don’t share | ||
For our affiliates’ everyday business purposes – information about your creditworthiness | No | We don’t share | ||
| For nonaffiliates to market to you | No | We don’t share |
| Questions? | Call 800-225-2606 or go to mfs.com. |
30
Table of Contents
| Page 2 |
| Who we are | ||
| Who is providing this notice? | MFS Funds, MFS Investment Management, MFS Institutional Advisors, Inc., MFS Fund Distributors, Inc., MFS Heritage Trust Company, and MFS Service Center, Inc. | |
| What we do | ||
| How does MFS protect my personal information? | To protect your personal information from unauthorized access and use, we use security measures that comply with federal law. These measures include procedural, electronic, and physical safeguards for the protection of the personal information we collect about you. | |
| How does MFS collect my personal information? | We collect your personal information, for example, when you
• open an account or provide account information • direct us to buy securities or direct us to sell your securities • make a wire transfer
We also collect your personal information from others, such as credit bureaus, affiliates and other companies. | |
| Why can’t I limit all sharing? | Federal law gives you the right to limit only
• sharing for affiliates’ everyday business purposes – information about your creditworthiness • affiliates from using your information to market to you • sharing for nonaffiliates to market to you
State laws and individual companies may give you additional rights to limit sharing. | |
| Definitions | ||
| Affiliates | Companies related by common ownership or control. They can be financial and nonfinancial companies.
• MFS does not share personal information with affiliates, except for everyday business purposes as described on page one of this notice. | |
| Nonaffiliates | Companies not related by common ownership or control. They can be financial and nonfinancial companies.
• MFS does not share with nonaffiliates so they can market to you. | |
| Joint Marketing | A formal agreement between nonaffiliated financial companies that together market financial products or services to you.
• MFS doesn’t jointly market. | |
| Other important information | ||
| If you own an MFS product or receive an MFS service in the name of a third party such as a bank or broker-dealer, their privacy policy may apply to you instead of ours. | ||
31
Table of Contents

Table of Contents

MFS® Research International Portfolio
MFS® Variable Insurance Trust II

ANNUAL REPORT
December 31, 2011
RSS-ANN
Table of Contents
MFS® RESEARCH INTERNATIONAL PORTFOLIO
The report is prepared for the general information of contract owners.
It is authorized for distribution to prospective investors only when preceded or accompanied by a current prospectus.
NOT FDIC INSURED Ÿ MAY LOSE VALUE Ÿ NO BANK OR CREDIT UNION GUARANTEE Ÿ NOT A DEPOSIT Ÿ NOT INSURED BY ANY FEDERAL GOVERNMENT AGENCY OR NCUA/NCUSIF
Table of Contents
MFS Research International Portfolio
LETTER FROM THE CHAIRMAN AND CEO

Dear Contract Owners:
We are indeed living through some volatile times. Economic uncertainty is everywhere, as it seems no place in the world has been unmoved by crisis. We have seen a devastating earthquake and tsunami that have led to disruptions in the Japanese markets
and supply chains. Protests have changed the face of the Middle East and left in their wake lingering tensions and resultant higher oil prices. We have seen debt limits tested in Europe and the United States and policymakers grappling to craft often unpopular monetary and fiscal responses at a time when consumers and businesses struggle with what appears to be a slowing global economy. On top of all of that, we have seen long-term U.S. debt lose its Standard & Poor’s AAA rating and the long-term debt ratings of 15 eurozone nations put on negative watch.
When markets become volatile, managing risk becomes a top priority for investors and their advisors. At MFS® risk management is foremost in our minds in all market climates. Our analysts and portfolio managers keep risks firmly in mind when evaluating securities. Additionally, we have a team of quantitative analysts that measures and assesses the risk profiles of our portfolios and securities on an ongoing basis. The chief investment risk officer, who oversees the team, reports directly to the firm’s president and chief investment officer so the risk associated with each portfolio can be assessed objectively and independently of the portfolio management team.
As always, we continue to be mindful of the many economic challenges faced at the local, national, and international levels. It is in times such as these that we want to remind investors of the merits of maintaining a long-term view, adhering to basic investing principles such as asset allocation and diversification, and working closely with their advisors to research and identify appropriate investment opportunities.
Respectfully,

Robert J. Manning
Chairman and Chief Executive Officer
MFS Investment Management®
February 15, 2012
The opinions expressed in this letter are subject to change, may not be relied upon for investment advice, and no forecasts can be guaranteed.
1
Table of Contents
MFS Research International Portfolio
Portfolio structure

| Top ten holdings | ||||
| Royal Dutch Shell PLC, “A” | 3.2% | |||
| Nestle S.A. | 3.1% | |||
| Roche Holding AG | 2.5% | |||
| Bayer AG | 2.1% | |||
| Vodafone Group PLC | 2.0% | |||
| Standard Chartered PLC | 1.9% | |||
| Westpac Banking Corp. | 1.9% | |||
| Groupe Danone | 1.8% | |||
| BP PLC | 1.8% | |||
| Rio Tinto Ltd. | 1.7% | |||
| Global equity sectors | ||||
| Capital Goods | 24.0% | |||
| Financial Services | 21.6% | |||
| Energy | 13.4% | |||
| Health Care | 10.0% | |||
| Consumer Staples | 9.1% | |||
| Technology | 7.9% | |||
| Consumer Cyclicals | 7.2% | |||
| Telecommunications/Cable Television | 6.3% | |||
| Issuer country weightings (x) | ||||
| Japan | 22.5% | |||
| United Kingdom | 19.8% | |||
| Switzerland | 10.4% | |||
| Germany | 8.1% | |||
| France | 7.7% | |||
| Australia | 6.1% | |||
| Netherlands | 5.3% | |||
| Hong Kong | 3.4% | |||
| Brazil | 2.3% | |||
| Other Countries | 14.4% | |||
| Currency exposure weightings (y) | ||||
| Euro | 23.9% | |||
| Japanese Yen | 22.5% | |||
| British Pound Sterling | 19.8% | |||
| Swiss Franc | 10.4% | |||
| Australian Dollar | 6.1% | |||
| Hong Kong Dollar | 5.0% | |||
| United States Dollar | 2.5% | |||
| Brazilian Real | 1.7% | |||
| Swedish Krona | 1.7% | |||
| Other Countries | 6.4% | |||
| (x) | Represents the portfolio’s exposure to issuer countries as a percentage of a portfolio’s total net assets. |
| (y) | Represents the portfolio’s exposure to a particular currency as a percentage of a portfolio’s total net assets. |
Percentages are based on net assets as of 12/31/11.
The portfolio is actively managed and current holdings may be different.
2
Table of Contents
MFS Research International Portfolio
Summary of Results
For the twelve months ended December 31, 2011, Initial Class shares of the MFS Research International Portfolio (the “fund”) provided a total return of –10.88%, while Service Class shares of the fund provided a total return of –11.06%. These compare with a return of –11.73% for the fund’s benchmark, the Morgan Stanley Capital International (MSCI) EAFE (Europe, Australasia, Far East) Index.
Market Environment
Early in the period, the U.S. Federal Reserve (the “Fed”) responded to weak economic growth by loosening monetary policy further. More easing by the Fed improved market sentiment and drove risk-asset prices markedly higher. The December 2010 agreement on a surprisingly large (relative to expectations) expansionary U.S. fiscal package also boosted sentiment. During the subsequent several months, the renewed positive market sentiment, coupled with better indications of global macroeconomic activity, pushed many asset valuations to post-crisis highs. At the same time, the yields of the perceived “safest” global sovereign credits rose, indicating a renewed risk-seeking environment.
However, towards the middle of the period, a weakening macroeconomic backdrop and renewed concerns over peripheral euro zone sovereign debt caused a flight-to-quality move that pushed high-quality sovereign bond yields lower. In the U.S., concerns about sovereign debt default and the long-term sustainability of the trend in U.S. fiscal policy resulted in one agency downgrading U.S. credit quality. Amidst this turmoil, global equity markets declined sharply. As a result of these developments, global consumer and producer sentiment indicators fell precipitously and highly-rated sovereign bond yields hit multi-decade lows. Towards the end of the reporting period, uncertainty in financial markets spiked higher as markets more seriously contemplated the possible failure of the euro zone.
Contributors to Performance
Stock selection in the capital goods sector contributed to performance relative to the MSCI EAFE Index. Holdings of mining company Iluka Resources (Australia), which the benchmark did not hold until the middle of the reporting period, and parcel delivery services company Yamato Holdings (Japan), benefited relative results as both stocks outperformed the benchmark during the reporting period. Shares of Iluka Resources rose throughout the first half of the year due to stable price increases in zircon, used in the production of ceramics, including tiles, sanitary ware and tableware, and a positive outlook for the firm’s other main product, titanium dioxide minerals, which are the principal feedstock for pigment production. The timing of the fund’s ownership in shares of Australian mining giant BHP Billiton (h) was another positive factor for relative returns.
Stock selection in the consumer cyclicals sector also aided relative results. Holdings of convenience store chain Lawson (Japan) were among the fund’s top relative contributors for the reporting period. Shares of Lawson rose as the company benefited from increased cigarette sales, a recovery in same-store sales trends, an expansion in their customer base, and increased pricing on tobacco products in Japan.
Securities in other sectors that benefited relative performance included Hong Kong-based telecommunications services provider China Unicom (Hong Kong) Ltd. (b), pharmaceutical and diagnostic company Roche Holding (Switzerland), ophthalmic and anti-rheumatic pharmaceutical firm Santen Pharmaceutical (Japan), tobacco products company Japan Tobacco (Japan), and oil and gas exploration company INPEX (Japan). Shares of Roche Holding appreciated during the period following the European regulatory backing of Avastin, a breast cancer treatment drug, for broader use. The fund’s avoidance of Japanese electric power company Tokyo Electric Power also helped relative performance as the stock significantly underperformed the benchmark during the reporting period.
Detractors from Performance
Stock selection in the financial services sector detracted from relative performance. Holdings of financial services firms, Erste Group Bank (h) (Austria) and Banco Santander (Brasil) (b)(h) (Brazil), banking and treasury management firm ICICI Bank (b) (India), and global banking group BNP Paribas (France) dampened relative returns. Shares of BNP appeared to have declined on fears that the company, which holds Greek government debt on its balance sheet, may have to further write down its holdings. The shares of many French financial firms, including BNP, which had significant exposure to public and private debt in Greece, Italy, Portugal, and Spain, were under pressure during the reporting period.
Top relative detractors in other sectors included the fund’s holdings of information technology products and electronics maker Acer (b)(h) (Taiwan), diversified mining company Teck Resources (b) (Canada), and Japanese copy machine manufacturer Konica Minolta Holdings. Shares of Konica Minolta were negatively impacted as management lowered guidance due to decreased printer and copier sales. Increased competition and intensified promotional efforts in the photocopier business were key drivers of poor earnings results. Additionally, along with other Japanese companies, shares fell immediately following the earthquake/tsunami in Japan. Not holding shares of pharmaceutical firm GlaxoSmithKline (United Kingdom), tobacco
3
Table of Contents
MFS Research International Portfolio
Management Review – continued
distributor British American Tobacco (United Kingdom), and global consumer products provider Unilever (United Kingdom) also held back relative performance as all three stocks outperformed the benchmark during the reporting period.
During the reporting period, the fund’s currency exposure, resulting primarily from holdings of foreign currency denominated securities, detracted from relative performance. All of MFS’ investment decisions are driven by the fundamentals of each individual opportunity and as such, it is common for our portfolios to have different currency exposure than the benchmark.
Respectfully,
| Jose Luis Garcia | Thomas Melendez | |
| Portfolio Manager | Portfolio Manager |
| (b) | Security is not a benchmark constituent. |
| (h) | Security was not held in the fund at period end. |
The views expressed in this report are those of the portfolio managers only through the end of the period of the report as stated on the cover and do not necessarily reflect the views of MFS or any other person in the MFS organization. These views are subject to change at any time based on market or other conditions, and MFS disclaims any responsibility to update such views. These views may not be relied upon as investment advice or an indication of trading intent on behalf of any MFS portfolio. References to specific securities are not recommendations of such securities, and may not be representative of any MFS portfolio’s current or future investments.
4
Table of Contents
MFS Research International Portfolio
PERFORMANCE SUMMARY THROUGH 12/31/11
The following chart illustrates the historical performance of the fund in comparison to its benchmark(s). Benchmarks are unmanaged and may not be invested in directly. Benchmark returns do not reflect any fees or expenses. The performance of other share classes will be greater than or less than that of the class depicted below. (See Notes to Performance Summary.)
Performance data shown represents past performance and is no guarantee of future results. Investment return and principal value fluctuate so your units, when sold, may be worth more or less than the original cost; current performance may be lower or higher than quoted. The performance shown does not reflect the deduction of taxes, if any, that a contract holder would pay on fund distributions or the redemption of contract units. The returns for the fund shown also do not reflect the deduction of expenses associated with variable products, such as mortality and expense risk charges, separate account charges, and sales charges imposed by the insurance company separate accounts. Such expenses would reduce the overall returns shown.
Growth of a Hypothetical $10,000 Investment
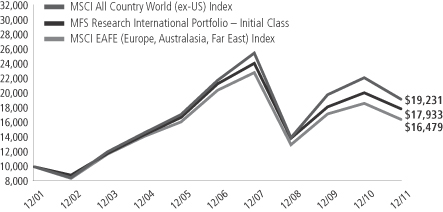
Total Returns through 12/31/11
Average annual total returns
| Share class | Class inception date | 1-yr | 5-yr | 10-yr | ||||||||
| Initial Class | 5/06/98 | (10.88)% | (3.43)% | 6.01% | ||||||||
| Service Class | 8/24/01 | (11.06)% | (3.67)% | 5.74% | ||||||||
| Comparative benchmarks | ||||||||||||
| MSCI EAFE (Europe, Australasia, Far East) Index (f) | (11.73)% | (4.26)% | 5.12% | |||||||||
| MSCI All Country World (ex-US) Index (f) | (13.33)% | (2.48)% | 6.76% | |||||||||
| (f) | Source: FactSet Research Systems Inc. |
Benchmark Definitions
MSCI All Country World (ex-US) Index – a market capitalization-weighted index that is designed to measure equity market performance in the developed and emerging markets, excluding the U.S.
MSCI EAFE (Europe, Australasia, Far East) Index – a market capitalization-weighted index that is designed to measure equity market performance in the developed markets, excluding the U.S. and Canada.
It is not possible to invest directly in an index.
Notes to Performance Summary
Average annual total return represents the average annual change in value for each share class for the periods presented.
Performance results reflect any applicable expense subsidies and waivers in effect during the periods shown. Without such subsidies and waivers the fund’s performance results would be less favorable. Please see the prospectus and financial statements for complete details. All results are historical and assume the reinvestment of any dividends and capital gains distributions.
Performance results do not include adjustments made for financial reporting purposes in accordance with U.S. generally accepted accounting principles and may differ from amounts reported in the financial highlights.
From time to time the fund may receive proceeds from litigation settlements, without which performance would be lower.
5
Table of Contents
MFS Research International Portfolio
Fund Expenses Borne by the Contract Holders During the Period,
July 1, 2011 through December 31, 2011
As a contract holder of the fund, you incur ongoing costs, including management fees; distribution and/or service (12b-1) fees; and other fund expenses. This example is intended to help you understand your ongoing costs (in dollars) of investing in the fund and to compare these costs with the ongoing costs of investing in other mutual funds.
The example is based on an investment of $1,000 invested at the beginning of the period and held for the entire period July 1, 2011 through December 31, 2011.
Actual Expenses
The first line for each share class in the following table provides information about actual account values and actual expenses. You may use the information in this line, together with the amount you invested, to estimate the expenses that you paid over the period. Simply divide your account value by $1,000 (for example, an $8,600 account value divided by $1,000 = 8.6), then multiply the result by the number in the first line under the heading entitled “Expenses Paid During Period” to estimate the expenses you paid on your account during this period.
Hypothetical Example for Comparison Purposes
The second line for each share class in the following table provides information about hypothetical account values and hypothetical expenses based on the fund’s actual expense ratio and an assumed rate of return of 5% per year before expenses, which is not the fund’s actual return. The hypothetical account values and expenses may not be used to estimate the actual ending account balance or expenses you paid for the period. You may use this information to compare the ongoing costs of investing in the fund and other funds. To do so, compare this 5% hypothetical example with the 5% hypothetical examples that appear in the shareholder reports of the other funds.
Please note that the expenses shown in the table are meant to highlight the fund’s ongoing costs only and do not take into account the fees and expenses imposed under the variable contracts through which your investment in the fund is made. Therefore, the second line for each share class in the table is useful in comparing ongoing costs associated with an investment in vehicles (such as the fund) which fund benefits under variable annuity and variable life insurance contracts and to qualified pension and retirement plans only, and will not help you determine the relative total costs of investing in the fund through variable annuity and variable life insurance contracts. If the fees and expenses imposed under the variable contracts were included, your costs would have been higher.
| Share Class | Annualized Expense Ratio | Beginning Account Value 7/01/11 | Ending Account Value 12/31/11 | Expenses Paid During Period (p) 7/01/11-12/31/11 | ||||||||||||||
| Initial Class | Actual | 1.10% | $1,000.00 | $836.77 | $5.09 | |||||||||||||
| Hypothetical (h) | 1.10% | $1,000.00 | $1,019.66 | $5.60 | ||||||||||||||
| Service Class | Actual | 1.35% | $1,000.00 | $835.63 | $6.25 | |||||||||||||
| Hypothetical (h) | 1.35% | $1,000.00 | $1,018.40 | $6.87 | ||||||||||||||
| (h) | 5% class return per year before expenses. |
| (p) | Expenses paid is equal to each class’ annualized expense ratio, as shown above, multiplied by the average account value over the period, multiplied by the number of days in the period, divided by the number of days in the year. |
6
Table of Contents
MFS Research International Portfolio
PORTFOLIO OF INVESTMENTS – 12/31/11
The Portfolio of Investments is a complete list of all securities owned by your fund. It is categorized by broad-based asset classes.
| Issuer | Shares/Par | Value ($) | ||||||
| COMMON STOCKS – 99.5% | ||||||||
| Aerospace – 0.9% | ||||||||
| Rolls-Royce Holdings PLC | 101,561 | $ | 1,173,076 | |||||
|
| |||||||
| Alcoholic Beverages – 1.5% | ||||||||
| Heineken N.V. | 45,749 | $ | 2,112,022 | |||||
|
| |||||||
| Apparel Manufacturers – 1.5% | ||||||||
| Li & Fung Ltd. | 478,000 | $ | 885,026 | |||||
| LVMH Moet Hennessy Louis Vuitton S.A. | 8,763 | 1,234,606 | ||||||
|
| |||||||
| $ | 2,119,632 | |||||||
|
| |||||||
| Automotive – 3.3% | ||||||||
| Bayerische Motoren Werke AG | 22,353 | $ | 1,494,415 | |||||
| DENSO Corp. | 39,900 | 1,102,084 | ||||||
| GKN PLC | 234,155 | 661,681 | ||||||
| Honda Motor Co. Ltd. | 43,400 | 1,323,934 | ||||||
|
| |||||||
| $ | 4,582,114 | |||||||
|
| |||||||
| Broadcasting – 1.5% | ||||||||
| Nippon Television Network Corp. | 7,160 | $ | 1,095,814 | |||||
| Publicis Groupe S.A. | 21,917 | 1,005,874 | ||||||
|
| |||||||
| $ | 2,101,688 | |||||||
|
| |||||||
| Brokerage & Asset Managers – 0.3% | ||||||||
| Deutsche Boerse AG (a) | 8,424 | $ | 441,671 | |||||
|
| |||||||
| Business Services – 2.3% | ||||||||
| Cognizant Technology Solutions Corp., “A” (a) | 11,440 | $ | 735,706 | |||||
| Compass Group PLC | 59,940 | 567,537 | ||||||
| Mitsubishi Corp. | 54,600 | 1,103,066 | ||||||
| Nomura Research, Inc. | 33,900 | 766,351 | ||||||
|
| |||||||
| $ | 3,172,660 | |||||||
|
| |||||||
| Chemicals – 0.5% | ||||||||
| Nufarm Ltd. (a) | 156,437 | $ | 665,616 | |||||
|
| |||||||
| Computer Software – 0.9% | ||||||||
| Dassault Systems S.A. | 14,480 | $ | 1,160,614 | |||||
|
| |||||||
| Computer Software – Systems – 1.9% | ||||||||
| Canon, Inc. | 37,300 | $ | 1,652,501 | |||||
| Konica Minolta Holdings, Inc. | 129,000 | 962,011 | ||||||
|
| |||||||
| $ | 2,614,512 | |||||||
|
| |||||||
| Conglomerates – 0.5% | ||||||||
| Hutchison Whampoa Ltd. | 83,000 | $ | 695,176 | |||||
|
| |||||||
| Consumer Products – 1.5% | ||||||||
| Kimberly-Clark de Mexico S.A. de C.V., “A” | 106,760 | $ | 575,774 | |||||
| Reckitt Benckiser Group PLC | 30,819 | 1,518,709 | ||||||
|
| |||||||
| $ | 2,094,483 | |||||||
|
| |||||||
| Electrical Equipment – 3.0% | ||||||||
| Legrand S.A. | 13,117 | $ | 420,209 | |||||
| Schneider Electric S.A. | 26,934 | 1,407,593 | ||||||
| Siemens AG | 24,305 | 2,325,913 | ||||||
|
| |||||||
| $ | 4,153,715 | |||||||
|
| |||||||
| Issuer | Shares/Par | Value ($) | ||||||
| COMMON STOCKS – continued | ||||||||
| Electronics – 1.7% | ||||||||
| ASML Holding N.V. | 13,181 | $ | 552,404 | |||||
| Samsung Electronics Co. Ltd. | 765 | 702,578 | ||||||
| Taiwan Semiconductor Manufacturing Co. Ltd. | 454,804 | 1,138,550 | ||||||
|
| |||||||
| $ | 2,393,532 | |||||||
|
| |||||||
| Energy – Independent – 2.7% | ||||||||
| Bankers Petroleum Ltd. (a) | 70,877 | $ | 308,902 | |||||
| Cairn Energy PLC (a) | 138,312 | 569,861 | ||||||
| INPEX Corp. | 314 | 1,978,563 | ||||||
| Reliance Industries Ltd. | 62,984 | 821,858 | ||||||
|
| |||||||
| $ | 3,679,184 | |||||||
|
| |||||||
| Energy – Integrated – 5.9% | ||||||||
| BG Group PLC | 62,860 | $ | 1,340,635 | |||||
| BP PLC | 346,244 | 2,469,154 | ||||||
| Royal Dutch Shell PLC, “A” | 118,051 | 4,339,867 | ||||||
|
| |||||||
| $ | 8,149,656 | |||||||
|
| |||||||
| Engineering – Construction – 2.1% | ||||||||
| JGC Corp. | 68,000 | $ | 1,632,636 | |||||
| Keppel Corp. Ltd. | 105,600 | 757,164 | ||||||
| Outotec Oyj | 11,400 | 533,688 | ||||||
|
| |||||||
| $ | 2,923,488 | |||||||
|
| |||||||
| Food & Beverages – 4.9% | ||||||||
| Groupe Danone | 39,886 | $ | 2,507,303 | |||||
| Nestle S.A. | 73,205 | 4,202,905 | ||||||
|
| |||||||
| $ | 6,710,208 | |||||||
|
| |||||||
| Food & Drug Stores – 2.2% | ||||||||
| Lawson, Inc. | 25,500 | $ | 1,591,886 | |||||
| Tesco PLC | 221,848 | 1,390,006 | ||||||
|
| |||||||
| $ | 2,981,892 | |||||||
|
| |||||||
| Gaming & Lodging – 0.6% | ||||||||
| Sands China Ltd. (a) | 308,800 | $ | 872,732 | |||||
|
| |||||||
| Insurance – 4.9% | ||||||||
| AIA Group Ltd. | 430,800 | $ | 1,345,106 | |||||
| Amlin PLC | 15,211 | 73,908 | ||||||
| Hiscox Ltd. | 96,666 | 559,049 | ||||||
| ING Groep N.V. (a) | 156,957 | 1,118,512 | ||||||
| QBE Insurance Group Ltd. | 67,779 | 897,751 | ||||||
| SNS REAAL Groep N.V. (a) | 117,229 | 254,281 | ||||||
| Sony Financial Holdings, Inc. | 42,300 | 623,206 | ||||||
| Swiss Re Ltd. | 36,846 | 1,877,801 | ||||||
|
| |||||||
| $ | 6,749,614 | |||||||
|
| |||||||
| Machinery & Tools – 3.0% | ||||||||
| Glory Ltd. | 51,500 | $ | 1,108,685 | |||||
| Joy Global, Inc. | 15,150 | 1,135,796 | ||||||
| Schindler Holding AG | 13,871 | 1,615,551 | ||||||
| Sinotruk Hong Kong Ltd. | 483,000 | 269,902 | ||||||
|
| |||||||
| $ | 4,129,934 | |||||||
|
| |||||||
7
Table of Contents
MFS Research International Portfolio
Portfolio of Investments – continued
| Issuer | Shares/Par | Value ($) | ||||||
| COMMON STOCKS – continued | ||||||||
| Major Banks – 12.2% | ||||||||
| Barclays PLC | 464,389 | $ | 1,258,016 | |||||
| BNP Paribas | 31,315 | 1,230,069 | ||||||
| Credit Suisse Group AG | 38,940 | 914,943 | ||||||
| HSBC Holdings PLC | 221,229 | 1,679,397 | ||||||
| Julius Baer Group Ltd. | 24,867 | 967,127 | ||||||
| Mitsubishi UFJ Financial Group, Inc. | 310,200 | 1,317,856 | ||||||
| National Australia Bank Ltd. | 90,515 | 2,162,640 | ||||||
| Standard Chartered PLC | 122,484 | 2,666,785 | ||||||
| Sumitomo Mitsui Financial Group, Inc. | 72,200 | 2,011,132 | ||||||
| Westpac Banking Corp. | 125,120 | 2,559,455 | ||||||
|
| |||||||
| $ | 16,767,420 | |||||||
|
| |||||||
| Medical & Health Technology & Services – 2.5% | ||||||||
| Diagnosticos da America S.A. | 100,200 | $ | 832,650 | |||||
| Miraca Holdings, Inc. | 42,000 | 1,672,470 | ||||||
| Rhoen-Klinikum AG | 46,318 | 882,421 | ||||||
|
| |||||||
| $ | 3,387,541 | |||||||
|
| |||||||
| Medical Equipment – 1.0% | ||||||||
| Sonova Holding AG | 7,540 | $ | 788,678 | |||||
| Synthes, Inc. (n) | 3,317 | 555,234 | ||||||
|
| |||||||
| $ | 1,343,912 | |||||||
|
| |||||||
| Metals & Mining – 3.9% | ||||||||
| Iluka Resources Ltd. | 75,959 | $ | 1,204,209 | |||||
| Rio Tinto Ltd. | 48,260 | 2,335,518 | ||||||
| Steel Authority of India Ltd. | 108,812 | 166,993 | ||||||
| Sumitomo Metal Industries Ltd. | 183,000 | 332,857 | ||||||
| Teck Resources Ltd., “B” | 35,080 | 1,236,538 | ||||||
|
| |||||||
| $ | 5,276,115 | |||||||
|
| |||||||
| Natural Gas – Distribution – 1.0% | ||||||||
| Tokyo Gas Co. Ltd. | 283,000 | $ | 1,301,572 | |||||
|
| |||||||
| Network & Telecom – 1.1% | ||||||||
| Ericsson, Inc., “B” | 147,562 | $ | 1,498,915 | |||||
|
| |||||||
| Oil Services – 0.9% | ||||||||
| AMEC PLC | 43,800 | $ | 614,526 | |||||
| Technip | 7,050 | 658,914 | ||||||
|
| |||||||
| $ | 1,273,440 | |||||||
|
| |||||||
| Other Banks & Diversified Financials – 3.3% | ||||||||
| Aeon Credit Service Co. Ltd. | 61,400 | $ | 970,019 | |||||
| China Construction Bank | 1,039,880 | 725,691 | ||||||
| HDFC Bank Ltd., ADR | 17,580 | 462,002 | ||||||
| ICICI Bank Ltd. | 28,254 | 364,261 | ||||||
| Itau Unibanco Multiplo S.A., ADR | 47,810 | 887,354 | ||||||
| Komercni Banka A.S. | 4,937 | 832,138 | ||||||
| Siam Commercial Bank Co. Ltd. | 79,100 | 288,320 | ||||||
|
| |||||||
| $ | 4,529,785 | |||||||
|
| |||||||
| Pharmaceuticals – 6.5% | ||||||||
| Bayer AG | 44,155 | $ | 2,823,093 | |||||
| Roche Holding AG | 20,008 | 3,383,705 | ||||||
| Sanofi | 13,368 | 978,150 | ||||||
| Santen Pharmaceutical Co. Ltd. | 40,200 | 1,655,632 | ||||||
|
| |||||||
| $ | 8,840,580 | |||||||
|
| |||||||
| Issuer | Shares/Par | Value ($) | ||||||
| COMMON STOCKS – continued | ||||||||
| Precious Metals & Minerals – 0.6% | ||||||||
| Newcrest Mining Ltd. | 27,072 | $ | 819,602 | |||||
|
| |||||||
| Railroad & Shipping – 0.7% | ||||||||
| East Japan Railway Co. | 14,400 | $ | 916,721 | |||||
|
| |||||||
| Real Estate – 0.9% | ||||||||
| GSW Immobilien AG (a) | 13,406 | $ | 388,044 | |||||
| Hang Lung Properties Ltd. | 294,000 | 836,582 | ||||||
|
| |||||||
| $ | 1,224,626 | |||||||
|
| |||||||
| Specialty Chemicals – 4.1% | ||||||||
| Akzo Nobel N.V. | 41,557 | $ | 1,999,513 | |||||
| Chugoku Marine Paints Ltd. | 56,000 | 347,044 | ||||||
| Linde AG | 15,530 | 2,310,462 | ||||||
| Nippon Paint Co. Ltd. | 61,000 | 422,411 | ||||||
| Symrise AG | 19,006 | 507,222 | ||||||
|
| |||||||
| $ | 5,586,652 | |||||||
|
| |||||||
| Specialty Stores – 1.4% | ||||||||
| Hennes & Mauritz AB, “B” | 25,220 | $ | 809,226 | |||||
| Industria de Diseno Textil S.A. | 13,105 | 1,070,718 | ||||||
|
| |||||||
| $ | 1,879,944 | |||||||
|
| |||||||
| Telecommunications – Wireless – 3.7% | ||||||||
| KDDI Corp. | 226 | $ | 1,453,423 | |||||
| Tim Participacoes S.A., ADR | 32,934 | 849,697 | ||||||
| Vodafone Group PLC | 1,004,362 | 2,790,436 | ||||||
|
| |||||||
| $ | 5,093,556 | |||||||
|
| |||||||
| Telephone Services – 2.6% | ||||||||
| China Unicom Ltd. | 590,000 | $ | 1,241,290 | |||||
| Royal KPN N.V. | 97,983 | 1,169,815 | ||||||
| Telecom Italia S.p.A. | 327,681 | 349,885 | ||||||
| Telecom Italia S.p.A. | 923,246 | 823,851 | ||||||
|
| |||||||
| $ | 3,584,841 | |||||||
|
| |||||||
| Tobacco – 1.2% | ||||||||
| Japan Tobacco, Inc. | 341 | $ | 1,603,768 | |||||
|
| |||||||
| Trucking – 1.4% | ||||||||
| Yamato Holdings Co. Ltd. | 112,800 | $ | 1,900,761 | |||||
|
| |||||||
| Utilities – Electric Power – 2.9% | ||||||||
| CEZ A.S. | 28,790 | $ | 1,145,386 | |||||
| Fortum Corp. | 47,696 | 1,014,773 | ||||||
| International Power PLC | 211,328 | 1,106,665 | ||||||
| Tractebel Energia S.A. | 40,340 | 647,949 | ||||||
|
| |||||||
| $ | 3,914,773 | |||||||
|
| |||||||
| Total Common Stocks (Identified Cost, $150,849,572) | $ | 136,421,743 | ||||||
|
| |||||||
| MONEY MARKET FUNDS – 0.2% | ||||||||
| MFS Institutional Money Market Portfolio, 0.05%, at Cost and Net Asset Value (v) | 301,201 | $ | 301,201 | |||||
|
| |||||||
| Total Investments (Identified Cost, $151,150,773) | $ | 136,722,944 | ||||||
|
| |||||||
| OTHER ASSETS, LESS LIABILITIES – 0.3% | 379,941 | |||||||
|
| |||||||
| Net Assets – 100.0% | $ | 137,102,885 | ||||||
|
| |||||||
8
Table of Contents
MFS Research International Portfolio
Portfolio of Investments – continued
| (a) | Non-income producing security. |
| (n) | Securities exempt from registration under Rule 144A of the Securities Act of 1933. These securities may be sold in the ordinary course of business in transactions exempt from registration, normally to qualified institutional buyers. At period end, the aggregate value of these securities was $555,234, representing 0.4% of net assets. |
| (v) | Underlying affiliated fund that is available only to investment companies managed by MFS. The rate quoted for the MFS Institutional Money Market Portfolio is the annualized seven-day yield of the fund at period end. |
The following abbreviations are used in this report and are defined:
| ADR | American Depository Receipt |
| PLC | Public Limited Company |
See Notes to Financial Statements
9
Table of Contents
MFS Research International Portfolio
FINANCIAL STATEMENTS | STATEMENT OF ASSETS AND LIABILITIES
This statement represents your fund’s balance sheet, which details the assets and liabilities comprising the total value of the fund.
At 12/31/11 | ||||||||
Assets | ||||||||
Investments – | ||||||||
Non-affiliated issuers, at value (identified cost, $150,849,572) | $136,421,743 | |||||||
Underlying affiliated funds, at cost and value | 301,201 | |||||||
Total investments, at value (identified cost, $151,150,773) | $136,722,944 | |||||||
Receivables for | ||||||||
Investments sold | 362,022 | |||||||
Interest and dividends | 292,195 | |||||||
Other assets | 4,382 | |||||||
Total assets | $137,381,543 | |||||||
Liabilities | ||||||||
Payables for | ||||||||
Investments purchased | $15,857 | |||||||
Fund shares reacquired | 137,670 | |||||||
Payable to affiliates | ||||||||
Investment adviser | 15,024 | |||||||
Shareholder servicing costs | 101 | |||||||
Distribution and/or service fees | 1,977 | |||||||
Payable for Trustees’ compensation | 346 | |||||||
Accrued expenses and other liabilities | 107,683 | |||||||
Total liabilities | $278,658 | |||||||
Net assets | $137,102,885 | |||||||
Net assets consist of | ||||||||
Paid-in capital | $172,364,443 | |||||||
Unrealized appreciation (depreciation) on investments and translation of assets and liabilities in foreign currencies (net of $4,118 deferred country tax) | (14,436,519 | ) | ||||||
Accumulated net realized gain (loss) on investments and foreign currency transactions | (23,528,096 | ) | ||||||
Undistributed net investment income | 2,703,057 | |||||||
Net assets | $137,102,885 | |||||||
Shares of beneficial interest outstanding | 11,576,635 |
| Net assets | Shares outstanding | Net asset value per share | ||||||||||
Initial Class | $40,134,156 | 3,360,661 | $11.94 | |||||||||
Service Class | 96,968,729 | 8,215,974 | 11.80 | |||||||||
See Notes to Financial Statements
10
Table of Contents
MFS Research International Portfolio
FINANCIAL STATEMENTS | STATEMENT OF OPERATIONS
This statement describes how much your fund earned in investment income and accrued in expenses. It also describes any gains and/or losses generated by fund operations.
Year ended 12/31/11 | ||||||||
Net investment income | ||||||||
Income | ||||||||
Dividends | $5,119,715 | |||||||
Interest | 94,393 | |||||||
Dividends from underlying affiliated funds | 916 | |||||||
Foreign taxes withheld | (471,986 | ) | ||||||
Total investment income | $4,743,038 | |||||||
Expenses | ||||||||
Management fee | $1,426,496 | |||||||
Distribution and/or service fees | 277,582 | |||||||
Shareholder servicing costs | 17,222 | |||||||
Administrative services fee | 53,355 | |||||||
Trustees’ compensation | 19,775 | |||||||
Custodian fee | 175,283 | |||||||
Shareholder communications | 15,635 | |||||||
Auditing fees | 53,823 | |||||||
Legal fees | 5,435 | |||||||
Miscellaneous | 36,873 | |||||||
Total expenses | $2,081,479 | |||||||
Fees paid indirectly | (8 | ) | ||||||
Reduction of expenses by investment adviser | (59,334 | ) | ||||||
Net expenses | $2,022,137 | |||||||
Net investment income | $2,720,901 | |||||||
Realized and unrealized gain (loss) on investments and foreign currency transactions | ||||||||
Realized gain (loss) (identified cost basis) | ||||||||
Investment transactions (net of $9,176 country tax) | $5,670,838 | |||||||
Foreign currency transactions | (21,472 | ) | ||||||
Net realized gain (loss) on investments and foreign currency transactions | $5,649,366 | |||||||
Change in unrealized appreciation (depreciation) | ||||||||
Investments (net of $4,118 increase in deferred country tax) | $(24,527,245 | ) | ||||||
Translation of assets and liabilities in foreign currencies | (31,156 | ) | ||||||
Net unrealized gain (loss) on investments and foreign currency translation | $(24,558,401 | ) | ||||||
Net realized and unrealized gain (loss) on investments and foreign currency | $(18,909,035 | ) | ||||||
Change in net assets from operations | $(16,188,134 | ) |
See Notes to Financial Statements
11
Table of Contents
MFS Research International Portfolio
FINANCIAL STATEMENTS | STATEMENTS OF CHANGES IN NET ASSETS
These statements describe the increases and/or decreases in net assets resulting from operations, any distributions, and any shareholder transactions.
For years ended 12/31 | 2011 | 2010 | ||||||
Change in net assets | ||||||||
From operations | ||||||||
Net investment income | $2,720,901 | $3,244,393 | ||||||
Net realized gain (loss) on investments and foreign currency transactions | 5,649,366 | 18,866,023 | ||||||
Net unrealized gain (loss) on investments and foreign currency translation | (24,558,401 | ) | 2,233,951 | |||||
Change in net assets from operations | $(16,188,134 | ) | $24,344,367 | |||||
Distributions declared to shareholders | ||||||||
From net investment income | $(2,878,963 | ) | $(2,780,628 | ) | ||||
Change in net assets from fund share transactions | $(17,547,891 | ) | $(67,615,217 | ) | ||||
Total change in net assets | $(36,614,988 | ) | $(46,051,478 | ) | ||||
Net assets | ||||||||
At beginning of period | 173,717,873 | 219,769,351 | ||||||
At end of period (including undistributed net investment income of $2,703,057 and | $137,102,885 | $173,717,873 |
See Notes to Financial Statements
12
Table of Contents
MFS Research International Portfolio
FINANCIAL STATEMENTS | FINANCIAL HIGHLIGHTS
The financial highlights table is intended to help you understand the fund’s financial performance for the past 5 years (or life of a particular share class, if shorter). Certain information reflects financial results for a single fund share. The total returns in the table represent the rate by which an investor would have earned (or lost) on an investment in the fund share class (assuming reinvestment of all distributions) held for the entire period.
| Initial Class | Years ended 12/31 | |||||||||||||||||||
| 2011 | 2010 | 2009 | 2008 | 2007 | ||||||||||||||||
Net asset value, beginning of period | $13.69 | $12.54 | $9.94 | $19.92 | $19.94 | |||||||||||||||
| Income (loss) from investment operations | ||||||||||||||||||||
Net investment income (d) | $0.25 | $0.20 | $0.17 | $0.37 | $0.30 | |||||||||||||||
Net realized and unrealized gain (loss) on investments | (1.72 | ) | 1.12 | 2.77 | (7.71 | ) | 2.21 | |||||||||||||
Total from investment operations | $(1.47 | ) | $1.32 | $2.94 | $(7.34 | ) | $2.51 | |||||||||||||
| Less distributions declared to shareholders | ||||||||||||||||||||
From net investment income | $(0.28 | ) | $(0.17 | ) | $(0.34 | ) | $(0.29 | ) | $(0.23 | ) | ||||||||||
From net realized gain on investments | — | — | — | (2.35 | ) | (2.30 | ) | |||||||||||||
Total distributions declared to shareholders | $(0.28 | ) | $(0.17 | ) | $(0.34 | ) | $(2.64 | ) | $(2.53 | ) | ||||||||||
Net asset value, end of period (x) | $11.94 | $13.69 | $12.54 | $9.94 | $19.92 | |||||||||||||||
Total return (%) (k)(r)(s)(x) | (10.88 | ) | 10.63 | 30.94 | (42.49 | ) | 13.15 | |||||||||||||
| Ratios (%) (to average net assets) and Supplemental data: | ||||||||||||||||||||
Expenses before expense reductions (f) | 1.14 | 1.12 | 1.18 | 1.17 | 1.06 | |||||||||||||||
Expenses after expense reductions (f) | 1.10 | 1.10 | 1.10 | 1.11 | 1.06 | |||||||||||||||
Net investment income | 1.89 | 1.66 | 1.62 | 2.43 | 1.51 | |||||||||||||||
Portfolio turnover | 45 | 60 | 75 | 82 | 68 | |||||||||||||||
Net assets at end of period (000 omitted) | $40,134 | $52,239 | $93,714 | $45,835 | $108,167 | |||||||||||||||
See Notes to Financial Statements
13
Table of Contents
MFS Research International Portfolio
Financial Highlights – continued
| Service Class | Years ended 12/31 | |||||||||||||||||||
| 2011 | 2010 | 2009 | 2008 | 2007 | ||||||||||||||||
Net asset value, beginning of period | $13.52 | $12.39 | $9.82 | $19.70 | $19.77 | |||||||||||||||
| Income (loss) from investment operations | ||||||||||||||||||||
Net investment income (d) | $0.22 | $0.16 | $0.17 | $0.32 | $0.23 | |||||||||||||||
Net realized and unrealized gain (loss) on investments | (1.70 | ) | 1.11 | 2.70 | (7.61 | ) | 2.20 | |||||||||||||
Total from investment operations | $(1.48 | ) | $1.27 | $2.87 | $(7.29 | ) | $2.43 | |||||||||||||
| Less distributions declared to shareholders | ||||||||||||||||||||
From net investment income | $(0.24 | ) | $(0.14 | ) | $(0.30 | ) | $(0.24 | ) | $(0.20 | ) | ||||||||||
From net realized gain on investments | — | — | — | (2.35 | ) | (2.30 | ) | |||||||||||||
Total distributions declared to shareholders | $(0.24 | ) | $(0.14 | ) | $(0.30 | ) | $(2.59 | ) | $(2.50 | ) | ||||||||||
Net asset value, end of period (x) | $11.80 | $13.52 | $12.39 | $9.82 | $19.70 | |||||||||||||||
Total return (%) (k)(r)(s)(x) | (11.06 | ) | 10.34 | 30.50 | (42.60 | ) | 12.81 | |||||||||||||
| Ratios (%) (to average net assets) and Supplemental data: | ||||||||||||||||||||
Expenses before expense reductions (f) | 1.39 | 1.37 | 1.43 | 1.42 | 1.31 | |||||||||||||||
Expenses after expense reductions (f) | 1.35 | 1.35 | 1.35 | 1.36 | 1.31 | |||||||||||||||
Net investment income | 1.64 | 1.31 | 1.64 | 2.17 | 1.19 | |||||||||||||||
Portfolio turnover | 45 | 60 | 75 | 82 | 68 | |||||||||||||||
Net assets at end of period (000 omitted) | $96,969 | $121,479 | $126,055 | $113,966 | $202,567 | |||||||||||||||
| (d) | Per share data is based on average shares outstanding. |
| (f) | Ratios do not reflect reductions from fees paid indirectly, if applicable. |
| (k) | The total return does not reflect expenses that apply to separate accounts. Inclusion of these charges would reduce the total return figures for all periods shown. |
| (r) | Certain expenses have been reduced without which performance would have been lower. |
| (s) | From time to time the fund may receive proceeds from litigation settlements, without which performance would be lower. |
| (x) | The net asset values per share and total returns have been calculated on net assets which include adjustments made in accordance with U.S. generally accepted accounting principles required at period end for financial reporting purposes. |
See Notes to Financial Statements
14
Table of Contents
MFS Research International Portfolio
| (1) | Business and Organization |
MFS Research International Portfolio (the fund) is a series of MFS Variable Insurance Trust II (the trust). The trust is organized as a Massachusetts business trust and is registered under the Investment Company Act of 1940, as amended, as an open-end management investment company. The shareholders of each series of the trust are separate accounts of insurance companies, which offer variable annuity and/or life insurance products, and qualified retirement and pension plans.
| (2) | Significant Accounting Policies |
General – The preparation of financial statements in conformity with U.S. generally accepted accounting principles requires management to make estimates and assumptions that affect the reported amounts of assets and liabilities, and disclosure of contingent assets and liabilities at the date of the financial statements and the reported amounts of revenues and expenses during the reporting period. Actual results could differ from those estimates. In the preparation of these financial statements, management has evaluated subsequent events occurring after the date of the fund’s Statement of Assets and Liabilities through the date that the financial statements were issued. The fund invests in foreign securities. Investments in foreign securities are vulnerable to the effects of changes in the relative values of the local currency and the U.S. dollar and to the effects of changes in each country’s legal, political, and economic environment.
In December 2011, the Financial Accounting Standards Board issued Accounting Standards Update 2011-11, Balance Sheet (Topic 210) – Disclosures about Offsetting Assets and Liabilities (“ASU 2011-11”). Effective for annual reporting periods beginning on or after January 1, 2013 and interim periods within those annual periods, ASU 2011-11 is intended to enhance disclosure requirements on the offsetting of financial assets and liabilities. Although still evaluating the potential impacts of ASU 2011-11 to the fund, management expects that the impact of the fund’s adoption will be limited to additional financial statement disclosures.
Investment Valuations – Equity securities, including restricted equity securities, are generally valued at the last sale or official closing price as provided by a third-party pricing service on the market or exchange on which they are primarily traded. Equity securities, for which there were no sales reported that day, are generally valued at the last quoted daily bid quotation as provided by a third-party pricing service on the market or exchange on which such securities are primarily traded. Equity securities held short, for which there were no sales reported for that day, are generally valued at the last quoted daily ask quotation as provided by a third-party pricing service on the market or exchange on which such securities are primarily traded. Short-term instruments with a maturity at issuance of 60 days or less generally are valued at amortized cost, which approximates market value. Open-end investment companies are generally valued at net asset value per share. Securities and other assets generally valued on the basis of information from a third-party pricing service may also be valued at a broker/dealer bid quotation. Values obtained from third-party pricing services can utilize both transaction data and market information such as yield, quality, coupon rate, maturity, type of issue, trading characteristics, and other market data. The values of foreign securities and other assets and liabilities expressed in foreign currencies are converted to U.S. dollars using the mean of bid and asked prices for rates provided by a third-party pricing service.
The Board of Trustees has delegated primary responsibility for determining or causing to be determined the value of the fund’s investments (including any fair valuation) to the adviser pursuant to valuation policies and procedures approved by the Board. If the adviser determines that reliable market quotations are not readily available, investments are valued at fair value as determined in good faith by the adviser in accordance with such procedures under the oversight of the Board of Trustees. Under the fund’s valuation policies and procedures, market quotations are not considered to be readily available for most types of debt instruments and floating rate loans and many types of derivatives. These investments are generally valued at fair value based on information from third-party pricing services. In addition, investments may be valued at fair value if the adviser determines that an investment’s value has been materially affected by events occurring after the close of the exchange or market on which the investment is principally traded (such as foreign exchange or market) and prior to the determination of the fund’s net asset value, or after the halting of trading of a specific security where trading does not resume prior to the close of the exchange or market on which the security is principally traded. Events that occur on a frequent basis after foreign markets close (such as developments in foreign markets and significant movements in the U.S. markets) and prior to the determination of the fund’s net asset value may be deemed to have a material effect on the value of securities traded in foreign markets. Accordingly, the fund’s foreign equity securities may often be valued at fair value. The adviser generally relies on third-party pricing services or other information (such as the correlation with price movements of similar securities in the same or other markets; the type, cost and investment characteristics of the security; the business and financial condition of the issuer; and trading and other market data) to assist in determining whether to fair value and at what value to fair value an investment. The value of an investment for purposes of calculating the fund’s net asset value can differ depending on the source and method used to determine value. When fair valuation is used, the value of an investment used to determine the fund’s net asset value may differ from quoted or published prices for the same investment. There can be no assurance that the
15
Table of Contents
MFS Research International Portfolio
Notes to Financial Statements – continued
fund could obtain the fair value assigned to an investment if it were to sell the investment at the same time at which the fund determines its net asset value per share.
Various inputs are used in determining the value of the fund’s assets or liabilities. These inputs are categorized into three broad levels. In certain cases, the inputs used to measure fair value may fall into different levels of the fair value hierarchy. In such cases, an investment’s level within the fair value hierarchy is based on the lowest level of input that is significant to the fair value measurement. The fund’s assessment of the significance of a particular input to the fair value measurement in its entirety requires judgment, and considers factors specific to the investment. Level 1 includes unadjusted quoted prices in active markets for identical assets or liabilities. Level 2 includes other significant observable market-based inputs (including quoted prices for similar securities, interest rates, prepayment speed, and credit risk). Level 3 includes unobservable inputs, which may include the adviser’s own assumptions in determining the fair value of investments. The following is a summary of the levels used as of December 31, 2011 in valuing the fund’s assets or liabilities:
| Investments at Value | Level 1 | Level 2 | Level 3 | Total | ||||||||||||
| Equity Securities: | ||||||||||||||||
Japan | $30,846,403 | $— | $— | $30,846,403 | ||||||||||||
United Kingdom | 5,856,968 | 21,257,858 | — | 27,114,826 | ||||||||||||
Switzerland | 5,196,973 | 9,108,971 | — | 14,305,944 | ||||||||||||
Germany | 9,290,782 | 1,882,459 | — | 11,173,241 | ||||||||||||
France | 4,897,986 | 5,705,346 | — | 10,603,332 | ||||||||||||
Australia | 8,309,273 | — | — | 8,309,273 | ||||||||||||
Netherlands | — | 7,206,547 | — | 7,206,547 | ||||||||||||
Hong Kong | 4,634,622 | — | — | 4,634,622 | ||||||||||||
Brazil | 3,217,650 | — | — | 3,217,650 | ||||||||||||
Other Countries | 12,908,849 | 6,101,056 | — | 19,009,905 | ||||||||||||
| Mutual Funds | 301,201 | — | — | 301,201 | ||||||||||||
| Total Investments | $85,460,707 | $51,262,237 | $— | $136,722,944 | ||||||||||||
For further information regarding security characteristics, see the Portfolio of Investments.
Of the level 2 investments presented above, equity investments amounting to $40,834,527 would have been considered level 1 investments at the beginning of the period. Of the level 1 investments presented above, equity investments amounting to $2,398,987 would have been considered level 2 investments at the beginning of the period. The primary reason for changes in the classifications between levels 1 and 2 occurs when foreign equity securities are fair valued using other observable market-based inputs in place of the closing exchange price due to events occurring after the close of the exchange or market on which the investment is principally traded. The fund’s foreign equity securities may often be valued at fair value. The fund’s policy is to recognize transfers between the levels as of the end of the period.
Foreign Currency Translation – Purchases and sales of foreign investments, income, and expenses are converted into U.S. dollars based upon currency exchange rates prevailing on the respective dates of such transactions or on the reporting date for foreign denominated receivables and payables. Gains and losses attributable to foreign currency exchange rates on sales of securities are recorded for financial statement purposes as net realized gains and losses on investments. Gains and losses attributable to foreign exchange rate movements on receivables, payables, income and expenses are recorded for financial statement purposes as foreign currency transaction gains and losses. That portion of both realized and unrealized gains and losses on investments that results from fluctuations in foreign currency exchange rates is not separately disclosed.
Security Loans – State Street Bank and Trust Company (“State Street”), as lending agent, loans the securities of the fund to certain qualified institutions (the “Borrowers”) approved by the fund. The loans are collateralized by cash and/or U.S. Treasury and federal agency obligations in an amount typically at least equal to the market value of the securities loaned. The market value of the loaned securities is determined at the close of business of the fund and any additional required collateral is delivered to the fund on the next business day. State Street provides the fund with indemnification against Borrower default. The fund bears the risk of loss with respect to the investment of cash collateral. On loans collateralized by cash, the cash collateral is invested in a money market fund or short-term securities. A portion of the income generated upon investment of the collateral is remitted to the Borrowers, and the remainder is allocated between the fund and the lending agent. On loans collateralized by U.S. Treasury and/or federal agency obligations, a fee is received from the Borrower, and is allocated between the fund and the lending agent. Income from securities lending is included in interest income on the Statement of Operations. The dividend and interest income earned on the securities loaned is accounted for in the same manner as other dividend and interest income.
Indemnifications – Under the fund’s organizational documents, its officers and Trustees may be indemnified against certain liabilities and expenses arising out of the performance of their duties to the fund. Additionally, in the normal course of
16
Table of Contents
MFS Research International Portfolio
Notes to Financial Statements – continued
business, the fund enters into agreements with service providers that may contain indemnification clauses. The fund’s maximum exposure under these agreements is unknown as this would involve future claims that may be made against the fund that have not yet occurred.
Investment Transactions and Income – Investment transactions are recorded on the trade date. Interest income is recorded on the accrual basis. Dividends received in cash are recorded on the ex-dividend date. Certain dividends from foreign securities will be recorded when the fund is informed of the dividend if such information is obtained subsequent to the ex-dividend date. Dividend and interest payments received in additional securities are recorded on the ex-dividend or ex-interest date in an amount equal to the value of the security on such date.
The fund may receive proceeds from litigation settlements. Any proceeds received from litigation involving portfolio holdings are reflected in the Statement of Operations in realized gain/loss if the security has been disposed of by the fund or in unrealized gain/loss if the security is still held by the fund. Any other proceeds from litigation not related to portfolio holdings are reflected as other income in the Statement of Operations.
Fees Paid Indirectly – The fund’s custody fee may be reduced according to an arrangement that measures the value of cash deposited with the custodian by the fund. This amount, for the year ended December 31, 2011, is shown as a reduction of total expenses on the Statement of Operations.
Tax Matters and Distributions – The fund intends to qualify as a regulated investment company, as defined under Subchapter M of the Internal Revenue Code, and to distribute all of its taxable income, including realized capital gains. As a result, no provision for federal income tax is required. The fund’s federal tax returns for the prior three fiscal years remain subject to examination by the Internal Revenue Service. Foreign taxes have been accrued by the fund in the accompanying financial statements.
Distributions to shareholders are recorded on the ex-dividend date. Income and capital gain distributions are determined in accordance with income tax regulations, which may differ from U.S. generally accepted accounting principles. Certain capital accounts in the financial statements are periodically adjusted for permanent differences in order to reflect their tax character. These adjustments have no impact on net assets or net asset value per share. Temporary differences which arise from recognizing certain items of income, expense, gain or loss in different periods for financial statement and tax purposes will reverse at some time in the future. Distributions in excess of net investment income or net realized gains are temporary overdistributions for financial statement purposes resulting from differences in the recognition or classification of income or distributions for financial statement and tax purposes.
Book/tax differences primarily relate to wash sale loss deferrals.
The tax character of distributions declared to shareholders for the last two fiscal years is as follows:
| 12/31/11 | 12/31/10 | |||||||
| Ordinary income (including any short-term capital gains) (a) | $2,878,963 | $2,780,628 | ||||||
The federal tax cost and the tax basis components of distributable earnings were as follows:
| As of 12/31/11 | ||||
| Cost of investments | $152,342,008 | |||
| Gross appreciation | 6,870,058 | |||
| Gross depreciation | (22,489,122 | ) | ||
| Net unrealized appreciation (depreciation) | $(15,619,064 | ) | ||
| Undistributed ordinary income | 2,709,587 | |||
| Capital loss carryforwards | (22,336,861 | ) | ||
| Other temporary differences | (15,220 | ) |
Under the Regulated Investment Company Modernization Act of 2010 (the “Act”), net capital losses recognized after December 31, 2010 may be carried forward indefinitely, and their character is retained as short-term and/or long-term losses. Previously, net capital losses were carried forward for eight years and treated as short-term losses. As a transition rule, the Act requires that post-enactment net capital losses be used before pre-enactment net capital losses.
As of December 31, 2011, the fund had capital loss carryforwards available to offset future realized gains. Such losses expire as follows:
| Pre-enactment losses: | ||||
| 12/31/16 | $(10,292,409 | ) | ||
| 12/31/17 | (12,044,452 | ) | ||
| Total | $(22,336,861 | ) |
17
Table of Contents
MFS Research International Portfolio
Notes to Financial Statements – continued
Multiple Classes of Shares of Beneficial Interest – The fund offers multiple classes of shares, which differ in their respective distribution and/or service fees. The fund’s income, realized and unrealized gain (loss), and common expenses are allocated to shareholders based on the daily net assets of each class. Dividends are declared separately for each class. Differences in per share dividend rates are generally due to differences in separate class expenses. The fund’s distributions declared to shareholders as reported on the Statements of Changes in Net Assets are presented by class as follows:
| From net investment income | ||||||||
| Year ended 12/31/11 | Year ended 12/31/10 | |||||||
| Initial Class | $962,485 | $1,407,840 | ||||||
| Service Class | 1,916,478 | 1,372,788 | ||||||
| Total | $2,878,963 | $2,780,628 | ||||||
| (3) | Transactions with Affiliates |
Investment Adviser – The fund has an investment advisory agreement with MFS to provide overall investment management and related administrative services and facilities to the fund. The management fee is computed daily and paid monthly at the following annual rates:
| First $1 billion of average daily net assets | 0.90% | |||
| Next $1 billion of average daily net assets | 0.80% | |||
| Average daily net assets in excess of $2 billion | 0.70% |
The management fee incurred for the year ended December 31, 2011 was equivalent to an annual effective rate of 0.90% of the fund’s average daily net assets.
The investment adviser has agreed in writing to pay a portion of the fund’s total annual operating expenses, exclusive of interest, taxes, extraordinary expenses, brokerage and transaction costs and investment-related expenses, such that total annual operating expenses do not exceed 1.10% of average daily net assets for the Initial Class shares and 1.35% of average daily net assets for the Service Class shares. This written agreement will continue until April 30, 2013. For the year ended December 31, 2011, this reduction amounted to $59,334 and is reflected as a reduction of total expenses in the Statement of Operations.
Distributor – MFS Fund Distributors, Inc. (MFD), a wholly-owned subsidiary of MFS, is the distributor of shares of the fund. The Trustees have adopted a distribution plan for the Service Class shares pursuant to Rule 12b-1 under the Investment Company Act of 1940.
The fund’s distribution plan provides that the fund will pay MFD distribution and/or service fees equal to 0.25% per annum of its average daily net assets attributable to Service Class shares as partial consideration for services performed and expenses incurred by MFD and financial intermediaries (including participating insurance companies that invest in the fund to fund variable annuity and variable life insurance contracts, sponsors of qualified retirement and pension plans that invest in the fund, and affiliates of these participating insurance companies and plan sponsors) in connection with the sale and distribution of the Service Class shares. MFD may subsequently pay all, or a portion, of the distribution and/or service fees to financial intermediaries.
Shareholder Servicing Agent – MFS Service Center, Inc. (MFSC), a wholly-owned subsidiary of MFS, receives a fee from the fund for its services as shareholder servicing agent. For the year ended December 31, 2011, the fee was $17,205, which equated to 0.0109% annually of the fund’s average daily net assets. MFSC also receives payment from the fund for out-of-pocket expenses paid by MFSC on behalf of the fund. For the year ended December 31, 2011, these costs amounted to $17.
Administrator – MFS provides certain financial, legal, shareholder communications, compliance, and other administrative services to the fund. Under an administrative services agreement, the fund partially reimburses MFS the costs incurred to provide these services. The fund is charged an annual fixed amount of $17,500 plus a fee based on average daily net assets. The administrative services fee incurred for the year ended December 31, 2011, was equivalent to an annual effective rate of 0.0337% of the fund’s average daily net assets.
Trustees’ and Officers’ Compensation – The fund pays compensation to Trustees in the form of a retainer, attendance fees, and additional compensation to the Board chairperson. The fund does not pay compensation directly to officers of the fund who are also officers of the investment adviser, all of whom receive remuneration for their services to the fund from MFS. Certain officers of the fund are officers or directors of MFS, MFD, and MFSC.
Other – This fund and certain other funds managed by MFS (the funds) have entered into services agreements (the Agreements) which provide for payment of fees by the funds to Tarantino LLC and Griffin Compliance LLC in return for the provision of services of an Independent Chief Compliance Officer (ICCO) and Assistant ICCO, respectively, for the funds. The ICCO and Assistant ICCO are officers of the funds and the sole members of Tarantino LLC and Griffin Compliance LLC, respectively. The
18
Table of Contents
MFS Research International Portfolio
Notes to Financial Statements – continued
funds can terminate the Agreements with Tarantino LLC and Griffin Compliance LLC at any time under the terms of the Agreements. MFS has agreed to bear all expenses associated with office space, other administrative support, and supplies provided to the ICCO and Assistant ICCO. For the year ended December 31, 2011, the aggregate fees paid by the fund to Tarantino LLC and Griffin Compliance LLC were $2,565 and are included in miscellaneous expense on the Statement of Operations.
The fund invests in the MFS Institutional Money Market Portfolio which is managed by MFS and seeks a high level of current income consistent with preservation of capital and liquidity. Income earned on this investment is included in dividends from underlying affiliated funds on the Statement of Operations. This money market fund does not pay a management fee to MFS.
| (4) | Portfolio Securities |
Purchases and sales of investments, other than U.S. Government securities, purchased option transactions, and short-term obligations, aggregated $71,086,172 and $89,076,768, respectively.
| (5) | Shares of Beneficial Interest |
The fund’s Declaration of Trust permits the Trustees to issue an unlimited number of full and fractional shares of beneficial interest. Transactions in fund shares were as follows:
| Year ended 12/31/11 | Year ended 12/31/10 | |||||||||||||||
| Shares | Amount | Shares | Amount | |||||||||||||
| Shares sold | ||||||||||||||||
Initial Class | 190,579 | $2,456,622 | 2,749,140 | $32,862,902 | ||||||||||||
Service Class | 833,151 | 10,165,576 | 941,744 | 10,940,634 | ||||||||||||
| 1,023,730 | $12,622,198 | 3,690,884 | $43,803,536 | |||||||||||||
| Shares issued to shareholders in reinvestment of distributions | ||||||||||||||||
Initial Class | 74,902 | $962,485 | 113,261 | $1,407,840 | ||||||||||||
Service Class | 150,785 | 1,916,478 | 111,518 | 1,372,788 | ||||||||||||
| 225,687 | $2,878,963 | 224,779 | $2,780,628 | |||||||||||||
| Shares reacquired | ||||||||||||||||
Initial Class | (721,768 | ) | $(9,666,839 | ) | (6,520,132 | ) | $(86,865,256 | ) | ||||||||
Service Class | (1,750,964 | ) | (23,382,213 | ) | (2,242,265 | ) | (27,334,125 | ) | ||||||||
| (2,472,732 | ) | $(33,049,052 | ) | (8,762,397 | ) | $(114,199,381 | ) | |||||||||
| Net change | ||||||||||||||||
Initial Class | (456,287 | ) | $(6,247,732 | ) | (3,657,731 | ) | $(52,594,514 | ) | ||||||||
Service Class | (767,028 | ) | (11,300,159 | ) | (1,189,003 | ) | (15,020,703 | ) | ||||||||
| (1,223,315 | ) | $(17,547,891 | ) | (4,846,734 | ) | $(67,615,217 | ) | |||||||||
| (6) | Line of Credit |
The fund and certain other funds managed by MFS participate in a $1.1 billion unsecured committed line of credit, subject to a $1 billion sublimit, provided by a syndication of banks under a credit agreement. Borrowings may be made for temporary financing needs. Interest is charged to each fund, based on its borrowings, generally at a rate equal to the higher of the Federal Reserve funds rate or one month LIBOR plus an agreed upon spread. A commitment fee, based on the average daily, unused portion of the committed line of credit, is allocated among the participating funds at the end of each calendar quarter. In addition, the fund and other funds managed by MFS have established unsecured uncommitted borrowing arrangements with certain banks for temporary financing needs. Interest is charged to each fund, based on its borrowings, at a rate equal to the Federal Reserve funds rate plus an agreed upon spread. For the year ended December 31, 2011, the fund’s commitment fee and interest expense were $1,166 and $0, respectively, and are included in miscellaneous expense on the Statement of Operations.
| (7) | Transactions in Underlying Affiliated Funds – Affiliated Issuers |
An affiliated issuer may be considered one in which the fund owns 5% or more of the outstanding voting securities, or a company which is under common control. For the purposes of this report, the fund assumes the following to be affiliated issuers:
| Underlying Affiliated Funds | Beginning Shares/Par Amount | Acquisitions Shares/Par Amount | Dispositions Shares/Par Amount | Ending Shares/Par Amount | ||||||||||||
| MFS Institutional Money Market Portfolio | 101 | 40,057,131 | (39,756,031 | ) | 301,201 | |||||||||||
| Underlying Affiliated Funds | Realized Gain (Loss) | Capital Gain Distributions | Dividend Income | Ending Value | ||||||||||||
| MFS Institutional Money Market Portfolio | $— | $— | $916 | $301,201 | ||||||||||||
19
Table of Contents
MFS Research International Portfolio
REPORT OF INDEPENDENT REGISTERED PUBLIC ACCOUNTING FIRM
To the Board of Trustees of MFS Variable Insurance Trust II and the Shareholders of
MFS Research International Portfolio:
We have audited the accompanying statement of assets and liabilities, including the portfolio of investments, of MFS Research International Portfolio (the “Fund”) (one of the portfolios comprising MFS Variable Insurance Trust II) as of December 31, 2011, and the related statement of operations for the year then ended, the statements of changes in net assets for each of the two years in the period then ended, and the financial highlights for each of the five years in the period then ended. These financial statements and financial highlights are the responsibility of the Fund’s management. Our responsibility is to express an opinion on these financial statements and financial highlights based on our audits.
We conducted our audits in accordance with the standards of the Public Company Accounting Oversight Board (United States). Those standards require that we plan and perform the audit to obtain reasonable assurance about whether the financial statements and financial highlights are free of material misstatement. The Fund is not required to have, nor were we engaged to perform, an audit of its internal control over financial reporting. Our audits included consideration of internal control over financial reporting as a basis for designing audit procedures that are appropriate in the circumstances, but not for the purpose of expressing an opinion on the effectiveness of the Fund’s internal control over financial reporting. Accordingly, we express no such opinion. An audit also includes examining, on a test basis, evidence supporting the amounts and disclosures in the financial statements, assessing the accounting principles used and significant estimates made by management, as well as evaluating the overall financial statement presentation. Our procedures included confirmation of securities owned as of December 31, 2011, by correspondence with the custodian and brokers; where replies were not received from brokers, we performed other auditing procedures. We believe that our audits provide a reasonable basis for our opinion.
In our opinion, the financial statements and financial highlights referred to above present fairly, in all material respects, the financial position of MFS Research International Portfolio as of December 31, 2011, the results of its operations for the year then ended, the changes in its net assets for each of the two years in the period then ended, and the financial highlights for each of the five years in the period then ended, in conformity with accounting principles generally accepted in the United States of America.
DELOITTE & TOUCHE LLP
Boston, Massachusetts
February 15, 2012
20
Table of Contents
MFS Research International Portfolio
RESULTS OF SHAREHOLDER MEETING (unaudited)
At a special meeting of shareholders of MFS Research International Portfolio, which was held on December 1, 2011, the following actions were taken for which shareholders of all series of MFS Variable Insurance Trust II voted together as a single class with respect to Item 1 and shareholders of MFS Research International Portfolio voted as a separate class with respect to Items 2 and 3:
Item 1: Election of ten Trustees as members of the Board of Trustees of the Trust effective January 1, 2012:
| Number of Shares | ||||||||
| For | Withheld Authority | |||||||
| Robert E. Butler | 681,916,712.8686 | 46,472,894.9218 | ||||||
| Maureen R. Goldfarb | 682,835,794.8512 | 45,553,812.9392 | ||||||
| David H. Gunning | 681,500,267.3085 | 46,889,340.4819 | ||||||
| William R. Gutow | 681,050,223.5547 | 47,339,384.2357 | ||||||
| Michael Hegarty | 682,477,088.8584 | 45,912,518.9320 | ||||||
| John P. Kavanaugh | 683,794,425.4269 | 44,595,182.3635 | ||||||
| Robert J. Manning | 682,699,559.7374 | 45,690,048.0530 | ||||||
| J. Dale Sherratt | 681,362,743.0513 | 47,026,864.7391 | ||||||
| Laurie J. Thomsen | 683,408,094.0000 | 44,981,513.7904 | ||||||
| Robert W. Uek | 681,424,852.0247 | 46,964,755.7657 | ||||||
Item 2: To approve a new investment advisory agreement dated January 1, 2012, between the Trust, on behalf of MFS Research International Portfolio, and MFS:
| Number of Shares | ||||||||||||
| For | Against | Withheld Authority | ||||||||||
| 9,403,083.3449 | 328,742.5433 | 1,140,186.7276 | ||||||||||
Item 3: To approve revisions to and restatements of certain fundamental investment restrictions of MFS Research International Portfolio effective January 1, 2012 as detailed below:
| For | Against | Withheld Authority | ||||||||||||
| A. | Borrowing | 9,050,168.5603 | 585,572.6011 | 1,236,271.4544 | ||||||||||
| B. | Underwriting Securities | 9,273,734.8790 | 354,763.1372 | 1,243,514.5996 | ||||||||||
| C. | Issuance of Senior Securities | 9,258,542.9259 | 348,558.2667 | 1,264,911.4232 | ||||||||||
| D. | Lending of Money or Securities | 9,049,127.6933 | 579,015.1622 | 1,243,869.7603 | ||||||||||
| E. | Purchases or Sales of Real Estate; Interests in Oil, Gas or Mineral Leases; and Commodities | 9,207,512.7302 | 428,055.1982 | 1,236,444.6874 | ||||||||||
| F. | Industry Concentration | 9,222,024.2698 | 368,784.3787 | 1,281,203.9673 | ||||||||||
21
Table of Contents
MFS Research International Portfolio
TRUSTEES AND OFFICERS – IDENTIFICATION AND BACKGROUND
The Trustees and officers of the Trust, as of February 1, 2012, are listed below, together with their principal occupations during the past five years. (Their titles may have varied during that period.) The address of each Trustee and officer is 500 Boylston Street, Boston, Massachusetts 02116.
Name, Age | Position(s) with Fund | Trustee/Officer Since (h) | Principal Occupations | Other Directorships (j) | ||||
| INTERESTED TRUSTEES | ||||||||
Robert J. Manning (k) (age 48) | Trustee | February 2004 | Massachusetts Financial Services Company, Chairman, Chief Executive Officer and Director; President (until December 2009); Chief Investment Officer (until July 2010) | N/A | ||||
| INDEPENDENT TRUSTEES | ||||||||
David H. Gunning (age 69) | Trustee and Chair of Trustees | January 2004 | Retired; Cleveland-Cliffs Inc. (mining products and service provider), Vice Chairman/Director (until May 2007) | Lincoln Electric Holdings, Inc. (welding equipment manufacturer), Director; Development Alternatives, Inc. (consulting), Director/Non-Executive Chairman; Portman Limited (mining), Director (until 2008) | ||||
Robert E. Butler (age 70) | Trustee | January 2006 | Consultant – investment company industry regulatory and compliance matters | N/A | ||||
Maureen R. Goldfarb (age 56) | Trustee | January 2009 | Private investor | N/A | ||||
William R. Gutow (age 70) | Trustee | December 1993 | Private investor and real estate consultant; Capitol Entertainment Management Company (video franchise), Vice Chairman | Atlantic Coast Tan (tanning salons), Vice Chairman (until 2007); Texas Donuts (donut franchise), Vice Chairman (until 2010) | ||||
Michael Hegarty (age 67) | Trustee | December 2004 | Private investor | N/A | ||||
John P. Kavanaugh (age 57) | Trustee | January 2009 | Private investor; The Hanover Insurance Group, Inc., Vice President and Chief Investment Officer (until 2006); Allmerica Investment Trust, Allmerica Securities Trust and Opus Investment Trust (investment companies), Chairman, President and Trustee (until 2006) | N/A | ||||
J. Dale Sherratt (age 73) | Trustee | June 1989 | Insight Resources, Inc. (acquisition planning specialists), President; Wellfleet Investments (investor in health care companies), Managing General Partner | N/A | ||||
Laurie J. Thomsen (age 54) | Trustee | March 2005 | Private investor; New Profit, Inc. (venture philanthropy), Executive Partner (until 2010) | The Travelers Companies (property and casualty insurance), Director | ||||
Robert W. Uek (age 70) | Trustee | January 2006 | Consultant to investment company industry | N/A | ||||
| OFFICERS | ||||||||
John M. Corcoran (k) (age 46) | President | October 2008 | Massachusetts Financial Services Company, Senior Vice President (since October 2008); State Street Bank and Trust (financial services provider), Senior Vice President, (until September 2008) | N/A | ||||
| Christopher R. Bohane (k) (age 38) | Assistant Secretary and Assistant Clerk | July 2005 | Massachusetts Financial Services Company, Vice President and Senior Counsel | N/A | ||||
Kino Clark (k) (age 43) | Assistant Treasurer | January 2012 | Massachusetts Financial Services Company, Assistant Vice President | N/A | ||||
22
Table of Contents
MFS Research International Portfolio
Trustees and Officers – continued
Name, Age | Position(s) with Fund | Trustee/Officer Since (h) | Principal Occupations | Other Directorships (j) | ||||
Ethan D. Corey (k) (age 48) | Assistant Secretary and Assistant Clerk | July 2005 | Massachusetts Financial Services Company, Senior Vice President and Associate General Counsel | N/A | ||||
David L. DiLorenzo (k) (age 43) | Treasurer | July 2005 | Massachusetts Financial Services Company, Vice President | N/A | ||||
Robyn L. Griffin (age 36) | Assistant Independent Chief Compliance Officer | August 2008 | Griffin Compliance LLC (provider of compliance services), Principal (since August 2008); State Street Corporation (financial services provider), Mutual Fund Administration Assistant Vice President (October 2006 – July 2008); Liberty Mutual Group (insurance), Personal Market Assistant Controller (April 2006 – October 2006); Deloitte & Touche LLP (professional services firm). | N/A | ||||
Brian E. Langenfeld (k) (age 38) | Assistant Secretary and Assistant Clerk | June 2006 | Massachusetts Financial Services Company, Vice President and Senior Counsel | N/A | ||||
Ellen Moynihan (k) (age 54) | Assistant Treasurer | April 1997 | Massachusetts Financial Services Company, Senior Vice President | N/A | ||||
Susan S. Newton (k) (age 61) | Assistant Secretary and Assistant Clerk | May 2005 | Massachusetts Financial Services Company, Senior Vice President and Associate General Counsel | N/A | ||||
Susan A. Pereira (k) (age 41) | Assistant Secretary and Assistant Clerk | July 2005 | Massachusetts Financial Services Company, Vice President and Senior Counsel | N/A | ||||
Mark N. Polebaum (k) (age 59) | Secretary and Clerk | January 2006 | Massachusetts Financial Services Company, Executive Vice President, General Counsel and Secretary | N/A | ||||
Frank L. Tarantino (age 67) | Independent Chief Compliance Officer | June 2004 | Tarantino LLC (provider of compliance services), Principal | N/A | ||||
Richard S. Weitzel (k) (age 41) | Assistant Secretary and Assistant Clerk | October 2007 | Massachusetts Financial Services Company, Vice President and Assistant General Counsel | N/A | ||||
James O. Yost (k) (age 51) | Deputy Treasurer | September 1990 | Massachusetts Financial Services Company, Senior Vice President | N/A | ||||
| (h) | Date first appointed to serve as Trustee/officer of an MFS fund. Each Trustee has served continuously since appointment unless indicated otherwise. For the period from December 15, 2004 until February 22, 2005, Mr. Manning served as Advisory Trustee. For the period October 2008, until January 2012, Mr. Corcoran served as Treasurer of the Funds. Prior to January 2012, Messrs. DiLorenzo and Yost served as Assistant Treasurers of the Funds. |
| (j) | Directorships or trusteeships of companies required to report to the Securities and Exchange Commission (i.e., “public companies”). |
| (k) | “Interested person” of the Trust within the meaning of the Investment Company Act of 1940 (referred to as the 1940 Act), which is the principal federal law governing investment companies like the fund, as a result of position with MFS. The address of MFS is 500 Boylston Street, Boston, Massachusetts 02116. |
Each Trustee has been elected by shareholders and each Trustee and officer holds office until his or her successor is chosen and qualified or until his or her earlier death, resignation, retirement or removal. The Trust does not hold annual meetings for the purpose of electing Trustees, and Trustees are not elected for fixed terms. Messrs. Butler, Kavanaugh, Uek and Ms. Thomsen are members of the Trust’s Audit Committee.
Each of the Fund’s Trustees and officers holds comparable positions with certain other funds of which MFS or a subsidiary is the investment adviser or distributor, and, in the case of the officers, with certain affiliates of MFS. As of January 1, 2012, the Trustees served as board members of 131 funds within the MFS Family of Funds.
23
Table of Contents
MFS Research International Portfolio
Trustees and Officers – continued
The Statement of Additional Information for the Fund includes further information about the Trustees and is available without charge upon request by calling 1-800-225-2606.
Investment Adviser Massachusetts Financial Services Company 500 Boylston Street, Boston, MA 02116-3741 | Custodian State Street Bank and Trust 1 Lincoln Street, Boston, MA 02111-2900 | |
Distributor MFS Fund Distributors, Inc. 500 Boylston Street, Boston, MA 02116-3741 | Independent Registered Public Accounting Firm Deloitte & Touche LLP 200 Berkeley Street, Boston, MA 02116 | |
Portfolio Managers Jose Luis Garcia Thomas Melendez |
24
Table of Contents
MFS Research International Portfolio
At a special meeting of shareholders of the MFS Research International Portfolio (hereinafter referred to as the “Fund” or the “Portfolio”), which was held on December 1, 2011, the shareholders approved a new investment advisory agreement based on the recommendation of the Board of Trustees. At its July, 2011 meeting, the Board of Trustees (i) approved, and recommended for shareholder approval, the new investment advisory agreement effective January 1, 2012, and (ii) the continuation of the existing investment advisory agreement effective September 1, 2011. The following includes a description of the factors that the Board of Trustees considered and the conclusions that formed the basis of their approval of both the new investment advisory agreement and the continuation of the prior investment advisory agreement.
BOARD APPROVAL OF NEW INVESTMENT ADVISORY AGREEMENT
The Investment Company Act of 1940 requires that both the full Board of Trustees and a majority of the non-interested (“independent”) Trustees, voting separately, initially approve the new investment advisory agreement (the “New Agreement”) between Massachusetts Financial Services Company (“MFS”) and MFS Variable Insurance Trust II (the “Trust”) on behalf of the Portfolio and, beginning on the second anniversary of the initial effective date of the New Agreement, annually approve the continuation of the New Agreement. The Trustees have considered matters bearing on the Portfolio and the then current advisory arrangement at their meetings throughout the year, including a review of performance data at each regular meeting. In addition, the independent Trustees met in person in July 2011 to consider the initial approval of the New Agreement, and to recommend that shareholders approve the New Agreement. The independent Trustees were assisted in their evaluation of the New Agreement by independent legal counsel, from whom they received separate legal advice and with whom they met separately from MFS management. The independent Trustees were also assisted in this process by the Portfolio’s Independent Chief Compliance Officer, a full-time senior officer appointed by and reporting to the independent Trustees.
In connection with their deliberations regarding the initial approval of the New Agreement, the Trustees, including the independent Trustees, considered such information and factors as they believed, in light of the legal advice furnished to them and their own business judgment, to be relevant. The New Agreement was considered separately for the series of the Trust (collectively, the “Portfolios”), although the Trustees also took into account the common interests of all Portfolios in the Trust in their review. As described below, the Trustees considered the nature, quality, and extent of the various investment advisory, administrative, and/or shareholder services to be performed by MFS under the New Agreement and other arrangements with the Trust.
In connection with their initial review meeting, the Trustees received and relied upon materials that included, among other items: (i) information provided by MFS on the advisory fees of comparable portfolios of its other clients, including institutional separate account and other clients, (ii) information as to whether, and to what extent applicable, expense waivers, reimbursements or fee “breakpoints” would be observed for the Portfolio under the New Agreement, and (iii) a comparison and summary of the differences in the provisions in the New Agreement compared to those in each of the then current investment advisory agreements for the Portfolios. In addition, in connection with the independent Trustees’ meetings in May and July, 2011 (the “contract review meetings”) for the purpose of considering whether to approve the continuation of the then current investment advisory agreements for the Portfolio, the independent Trustees received: (1) information provided by Lipper Inc. (“Lipper”) on the investment performance of the Portfolio for various time periods ended December 31, 2010, compared to the investment performance of a group of funds with substantially similar investment classifications/objectives (the “Lipper performance universe”), (2) information provided by Lipper on the Portfolio’s advisory fees and other expenses compared to the advisory fees and other expenses of comparable funds identified by Lipper (the “Lipper expense group”), (3) information regarding MFS’ financial results and financial condition, including MFS’ and certain of its affiliates’ estimated profitability from services performed for the Portfolio, (4) MFS’ views regarding the outlook for the mutual fund industry and its strategic business plans, (5) descriptions of various functions performed by MFS for the Trust, such as compliance monitoring and portfolio trading practices, and (6) information regarding the overall organization of MFS, including information about MFS’ senior management and other personnel providing investment advisory, administrative and other services to the Portfolio. The comparative performance, fee and expense information prepared and provided by Lipper was not independently verified, and the independent Trustees did not independently verify any information provided to them by MFS.
The Trustees’ conclusion as to the initial approval of the New Agreement was based on comprehensive consideration of all information provided to the Trustees and was not the result of any single factor. Some of the factors that figured particularly in the Trustees’ deliberations are described below for the Portfolio, while individual Trustees may have given different weight to various factors and evaluated the information presented as a whole differently than another individual Trustee. The Trustees recognized that the fee arrangements for the Portfolio could reflect years of review and discussion between the independent Trustees and MFS, that certain aspects of such arrangements may receive greater scrutiny in some years than others, and that
25
Table of Contents
MFS Research International Portfolio
Board Approval of New Investment Advisory Agreement – continued
the Trustees’ conclusions may be based, in part, on their consideration of these same arrangements during the course of the year and in prior years.
Because the portfolio management team managing the Portfolio’s investments under the then current investment advisory agreement will remain the same under the New Agreement for the Portfolio, the Trustees compared the Portfolio’s total return investment performance to the performance of its Lipper performance universe over various time periods, based on information provided by Lipper. The Trustees placed particular emphasis on the total return performance of the Portfolio’s Initial Class shares in comparison to the performance of funds in its Lipper performance universe over the one-, three- and five-year periods ended December 31, 2010. The Trustees did not rely on performance results for more recent periods.
The Trustees noted the performance of the Portfolio’s Initial Class shares was in the 2nd quintile relative to the other funds in the Lipper performance universe for the one-year period (the 1st quintile being the best performers and the 5th quintile being the worst performers). The total return performance of the Portfolio was in the 3rd quintile for the three-year period and in the 2nd quintile for the five-year period ended December 31, 2010, relative to the Lipper performance universe. Based on the nature and quality of services provided by MFS, the Board of Trustees concluded that the Portfolio’s performance was satisfactory.
In the course of their deliberations, the Trustees took into account information provided by MFS during contract review meetings, as well as during investment review meetings conducted with portfolio management personnel during the course of the year. For Portfolios whose performance lagged their peer groups, they discussed the factors that contributed thereto and MFS’ efforts to improve such Portfolios’ performance. After reviewing this information, the Trustees concluded, within the context of their overall conclusions regarding the New Agreement, that they were satisfied with MFS’ responses and efforts relating to investment performance.
In assessing the reasonableness of the Portfolio’s advisory fee, the Trustees considered, among other information, the Portfolio’s advisory fee and the total expense ratio of the Portfolio’s Initial Class shares as a percentage of average daily net assets, compared to the advisory fee and total expense ratios of its peer group of funds based on information provided by Lipper. The Trustees also considered the advisory fees charged by MFS to institutional accounts. In comparing these fees, the Trustees considered the generally broader scope of services provided by MFS to the Trust than those provided to institutional accounts. The Trustees also considered the higher demands placed on MFS’ investment personnel and trading infrastructure as a result of the daily cash in-flows and out-flows of the Portfolio, and the impact on MFS and related expenses due to the more extensive regulatory regime to which the Portfolio is subject, compared to institutional accounts.
In considering the fees, the Trustees noted from the Lipper data that the Portfolio’s effective advisory fee rate was approximately at the median and total expense ratio was above the median of such fees and expenses of funds in the Lipper expense group. In addition, the Trustees accepted MFS’ offer to continue the expense limitation for the Portfolio. The Trustees further noted that the New Agreement would reflect MFS’ agreement to observe a lower advisory fee and to reduce the advisory fee on average daily net assets over $1 billion and over $2 billion on a permanent basis, and concluded that the breakpoints were sufficient to allow the Portfolio to benefit from economies of scale as its assets grow. The Trustees concluded that the fees were reasonable in light of the nature and quality of services provided.
The Trustees also considered whether the Portfolio is likely to benefit from any economies of scale due to future asset growth. In this regard, the Trustees reviewed the adequacy of breakpoints and discussed with MFS any adjustments necessary for the shareholders’ benefit.
The Trustees also considered information prepared by MFS relating to its costs and profits with respect to the Portfolio and other investment companies and accounts advised by MFS, as well as MFS’ methodologies used to determine and allocate its costs to the Portfolio and other accounts and products for purposes of estimating profitability.
The Trustees noted that there would be no increase to the net advisory fee arrangement for the Portfolio under the New Agreement when compared to the Portfolio’s then current investment advisory agreement. After reviewing these and other factors described below, the Trustees concluded that the advisory fees charged to the Portfolio under the New Agreement represent reasonable compensation in light of the nature and quality of the services being provided by MFS.
In addition, the Trustees considered MFS’ resources and related efforts to continue to retain, attract and motivate capable personnel to serve the Portfolio. The Trustees also considered the financial resources of MFS and its parent, Sun Life Financial Inc. The Trustees further considered any advantages and possible disadvantages of having an adviser which also serves other investment companies as well as institutional accounts.
The Trustees also considered the nature, quality, cost, and extent of administrative, transfer agency, and distribution services provided to the Trust by MFS and its affiliates under agreements and plans other than the New Agreement, including the 12b-1
26
Table of Contents
MFS Research International Portfolio
Board Approval of New Investment Advisory Agreement – continued
fees the Portfolio pays to MFS Fund Distributors, Inc., an affiliate of MFS. The Trustees also considered the nature, extent and quality of certain other services MFS performs or arranges on the Portfolio’s behalf, which may include securities lending programs, directed expense payment programs, class action recovery programs, and MFS’ interaction with third-party service providers, principally custodians and sub-custodians. The Trustees concluded that the various non-advisory services provided by MFS and its affiliates on behalf of the Portfolio were satisfactory. The Trustees also considered the benefits to MFS from the use of the Portfolio’s portfolio brokerage commissions to pay for investment research and various other factors. Additionally, the Trustees considered so-called “fall-out benefits” to MFS such as reputational value derived from serving as investment manager to the Trust, and determined that any such benefits derived by MFS were reasonable and fair.
Based on their evaluation of factors that they deemed to be material, including those factors described above, the Board of Trustees, including a majority of the independent Trustees, concluded that the New Agreement should be approved for an initial two-year period, commencing upon its effective date, as set forth in the New Agreement.
BOARD APPROVAL OF CONTINUATION OF PRIOR INVESTMENT ADVISORY AGREEMENT
The Investment Company Act of 1940 requires that both the full Board of Trustees and a majority of the non-interested (“independent”) Trustees, voting separately, annually approve the continuation of the investment advisory agreement between MFS Variable Insurance Trust II (the “Trust”) and Massachusetts Financial Services Company (“MFS”) on behalf of the Fund. The Trustees consider matters bearing on the Fund and the advisory arrangements at their meetings throughout the year, including a review of performance data at each regular meeting. In addition, the independent Trustees met in person in May and again in July 2011 (“contract review meetings”) for the specific purpose of considering whether to approve the continuation of the investment advisory agreement for the Fund. The independent Trustees were assisted in their evaluation of the investment advisory agreement by independent legal counsel, from whom they received separate legal advice and with whom they met separately from MFS management during various contract review meetings. The independent Trustees were also assisted in this process by the Fund’s Independent Chief Compliance Officer, a full-time senior officer appointed by and reporting to the independent Trustees.
In connection with their deliberations, the Trustees, including the independent Trustees, considered such information and factors as they believed, in light of the legal advice furnished to them and their own business judgment, to be relevant. The investment advisory agreement was considered separately for the Fund, although the Trustees also took into account the common interests of all Funds in the Trust in their review. As described below, the Trustees considered the nature, quality, and extent of the various investment advisory, administrative, and shareholder services performed by MFS under the existing investment advisory agreement and other arrangements with the Trust.
In connection with their contract review meetings, the Trustees received and relied upon materials which included, among other items: (i) information provided by Lipper Inc. (“Lipper”) on the investment performance of the Fund for various time periods ended December 31, 2010, compared to the investment performance of a group of funds with substantially similar investment classifications/objectives (the “Lipper performance universe”), (ii) information provided by Lipper on the Fund’s advisory fees and other expenses compared to the advisory fees and other expenses of comparable funds identified by Lipper (the “Lipper expense group”), (iii) information provided by MFS on the advisory fees of comparable portfolios of its other clients, including institutional separate account and other clients, (iv) information as to whether, and to what extent applicable, expense waivers, reimbursements or fee “breakpoints” are observed for the Fund, (v) information regarding MFS’ financial results and financial condition, including MFS’ and certain of its affiliates’ estimated profitability from services performed for the Fund and other investment companies that the Board oversees as a whole, and for MFS’ institutional business, (vi) MFS’ views regarding the outlook for the mutual fund industry and its strategic business plans, (vii) descriptions of various functions performed by MFS for the Trust, such as compliance monitoring and portfolio trading practices, and (viii) information regarding the overall organization of MFS, including information about MFS’ senior management and other personnel providing investment advisory, administrative and other services to the Fund. The comparative performance, fee and expense information prepared and provided by Lipper was not independently verified, and the independent Trustees did not independently verify any information provided to them by MFS.
The Trustees’ conclusion as to the continuation of the investment advisory agreement was based on comprehensive consideration of all information provided to the Trustees and was not the result of any single factor. Some of the factors that figured particularly in the Trustees’ deliberations are described below for the Fund, while individual Trustees may have given different weight to various factors and evaluated the information presented as a whole differently than another individual Trustee. The Trustees recognized that the fee arrangements for the Fund reflect years of review and discussion between the independent Trustees and MFS, that certain aspects of such arrangements may receive greater scrutiny in some years than
27
Table of Contents
MFS Research International Portfolio
Board Approval of Continuation Of Prior Investment Advisory Agreement – continued
others, and that the Trustees’ conclusions may be based, in part, on their consideration of these same arrangements during the course of the year and in prior years.
Based on information provided by Lipper, the Trustees compared the Fund’s total return investment performance to the performance of the Lipper performance universe over various time periods. The Trustees placed particular emphasis on the total return performance of the Fund’s Initial Class shares in comparison to the performance of funds in its Lipper performance universe over the one-, three- and five -year periods ended December 31, 2010. The Trustees did not rely on performance results for more recent periods, including those shown elsewhere in this report.
The Trustees noted the performance of the Fund’s Initial Class shares was in the 2nd quintile relative to the other funds in the Lipper performance universe for the one-year period (the 1st quintile being the best performers and the 5th quintile being the worst performers). The total return performance of the Fund was in the 3rd quintile for the three-year period and in the 2nd quintile for the five-year period ended December 31, 2010, relative to the Lipper performance universe. Based on the nature and quality of services provided by MFS, the Board of Trustees concluded that the Fund’s performance was satisfactory.
In the course of their deliberations, the Trustees took into account information provided by MFS during contract review meetings, as well as during investment review meetings conducted with portfolio management personnel during the course of the year.
In assessing the reasonableness of the Fund’s advisory fee, the Trustees considered, among other information, the Fund’s advisory fee and the total expense ratio of the Fund’s Initial Class shares as a percentage of average daily net assets, compared to the advisory fee and total expense ratios of its peer group of funds based on information provided by Lipper. The Trustees also considered the advisory fees charged by MFS to institutional accounts. In comparing these fees, the Trustees considered the generally broader scope of services provided by MFS to the Trust than those provided to institutional accounts. The Trustees also considered the higher demands placed on MFS’ investment personnel and trading infrastructure as a result of the daily cash in-flows and out-flows of the Fund, and the impact on MFS and related expenses due to the more extensive regulatory regime to which the Fund is subject, compared to institutional accounts.
In considering the fees, the Trustees noted from the Lipper data (which takes into account any reductions or expense limitations) that the Fund’s effective advisory fee rate was approximately at the median and total expense ratio was above the median of such fees and expenses of funds in the Lipper expense group. In addition, the Trustees accepted MFS’ offer to continue the expense limitation for the Fund. The Trustees further concluded that the existing breakpoints were sufficient to allow the Fund to benefit from economies of scale as its assets grow. The Trustees concluded that the fees were reasonable in light of the nature and quality of services provided.
The Trustees also considered information prepared by MFS relating to its costs and profits with respect to the Fund and other investment companies and accounts advised by MFS, as well as MFS’ methodologies used to determine and allocate its costs to the Fund and other accounts and products for purposes of estimating profitability.
After reviewing these and other factors described below, the Trustees concluded that the advisory fees charged to the Fund represent reasonable compensation in light of the nature and quality of the services being provided by MFS.
In addition, the Trustees considered MFS’ resources and related efforts to continue to retain, attract and motivate capable personnel to serve the Fund. The Trustees also considered the financial resources of MFS and its parent, Sun Life Financial Inc. The Trustees further considered any advantages and possible disadvantages of having an adviser which also serves other investment companies as well as institutional accounts.
The Trustees also considered the nature, quality, cost, and extent of administrative, transfer agency, and distribution services provided to the Fund by MFS and its affiliates under agreements and plans other than the investment advisory agreement, including the 12b-1 fees the Fund pays to MFS Fund Distributors, Inc., an affiliate of MFS. The Trustees also considered the nature, extent and quality of certain other services MFS performs or arranges on the Fund’s behalf, which may include securities lending programs, directed expense payment programs, class action recovery programs, and MFS’ interaction with third-party service providers, principally custodians and sub-custodians. The Trustees concluded that the various non-advisory services provided by MFS and its affiliates on behalf of the Fund were satisfactory. The Trustees also considered the benefits to MFS from the use of the Fund’s portfolio brokerage commissions, if applicable, to pay for investment research and various other factors. Additionally, the Trustees considered so-called “fall-out benefits” to MFS such as reputational value derived from serving as investment manager to the Trust, and determined that any such benefits derived by MFS were reasonable and fair.
Based on their evaluation of factors that they deemed to be material, including those factors described above, the Board of Trustees, including a majority of the independent Trustees, concluded that the investment advisory agreement should be continued for an additional one-year period, commencing September 1, 2011.
28
Table of Contents
MFS Research International Portfolio
Board Approval of Continuation Of Prior Investment Advisory Agreement – continued
A discussion regarding the Board’s most recent review and renewal of the fund’s Investment Advisory Agreement with MFS is available by clicking on the fund’s name under “Variable Insurance Portfolios — VIT II” in the “Products and Performance” section of the MFS Web site (mfs.com).
29
Table of Contents
MFS Research International Portfolio
PROXY VOTING POLICIES AND INFORMATION
A general description of the MFS funds’ proxy voting policies and procedures is available without charge, upon request, by calling
1-800-225-2606, by visiting the Proxy Voting section of mfs.com or by visiting the SEC’s Web site at http://www.sec.gov.
Information regarding how the fund voted proxies relating to portfolio securities during the most recent twelve-month period ended June 30 is available without charge by visiting the Proxy Voting section of mfs.com or by visiting the SEC’s Web site at http://www.sec.gov.
QUARTERLY PORTFOLIO DISCLOSURE
The fund will file a complete schedule of portfolio holdings with the Securities and Exchange Commission (the Commission) for the first and third quarters of each fiscal year on Form N-Q. The fund’s Form N-Q is available on the EDGAR database on the Commission’s Internet Web site at http://www.sec.gov and may be reviewed and copied at the:
Public Reference Room
Securities and Exchange Commission
100 F Street, NE, Room 1580
Washington, D.C. 20549
Information on the operation of the Public Reference Room may be obtained by calling the Commission at 1-800-SEC-0330. Copies of the fund’s Form N-Q also may be obtained, upon payment of a duplicating fee, by electronic request at the following e-mail address: publicinfo@sec.gov or by writing the Public Reference Section at the above address.
From time to time, MFS may post important information about the fund or the MFS funds on the MFS web site (mfs.com). This information is available by visiting the “News & Commentary” section of mfs.com or by clicking on the fund’s name under “Variable Insurance Portfolios — VIT II” in the “Products and Performance” section of mfs.com.
FEDERAL TAX INFORMATION (unaudited)
The following information is provided pursuant to provisions of the Internal Revenue Code.
Income derived from foreign sources was $4,176,168. The fund intends to pass through foreign tax credits of $333,532 for the fiscal year.
30
Table of Contents
rev. 3/11

| Why? | Financial companies choose how they share your personal information. Federal law gives consumers the right to limit some but not all sharing. Federal law also requires us to tell you how we collect, share, and protect your personal information. Please read this notice carefully to understand what we do. |
| What? | The types of personal information we collect and share depend on the product or service you have with us. This information can include:
• Social Security number and account balances • Account transactions and transaction history • Checking account information and wire transfer instructions
When you are no longer our customer, we continue to share your information as described in this notice. |
| How? | All financial companies need to share customers’ personal information to run their everyday business. In the section below, we list the reasons financial companies can share their customers’ personal information; the reasons MFS chooses to share; and whether you can limit this sharing. |
| Reasons we can share your personal information | Does MFS share? | Can you limit this sharing? | ||
For our everyday business purposes – such as to process your transactions, maintain your account(s), respond to court orders and legal investigations, or report to credit bureaus | Yes | No | ||
For our marketing purposes – to offer our products and services to you | No | We don’t share | ||
| For joint marketing with other financial companies | No | We don’t share | ||
For our affiliates’ everyday business purposes – information about your transactions and experiences | No | We don’t share | ||
For our affiliates’ everyday business purposes – information about your creditworthiness | No | We don’t share | ||
| For nonaffiliates to market to you | No | We don’t share |
| Questions? | Call 800-225-2606 or go to mfs.com. |
31
Table of Contents
| Page 2 |
| Who we are | ||
| Who is providing this notice? | MFS Funds, MFS Investment Management, MFS Institutional Advisors, Inc., MFS Fund Distributors, Inc., MFS Heritage Trust Company, and MFS Service Center, Inc. | |
| What we do | ||
| How does MFS protect my personal information? | To protect your personal information from unauthorized access and use, we use security measures that comply with federal law. These measures include procedural, electronic, and physical safeguards for the protection of the personal information we collect about you. | |
| How does MFS collect my personal information? | We collect your personal information, for example, when you
• open an account or provide account information • direct us to buy securities or direct us to sell your securities • make a wire transfer
We also collect your personal information from others, such as credit bureaus, affiliates and other companies. | |
| Why can’t I limit all sharing? | Federal law gives you the right to limit only
• sharing for affiliates’ everyday business purposes – information about your creditworthiness • affiliates from using your information to market to you • sharing for nonaffiliates to market to you
State laws and individual companies may give you additional rights to limit sharing. | |
| Definitions | ||
| Affiliates | Companies related by common ownership or control. They can be financial and nonfinancial companies.
•MFS does not share personal information with affiliates, except for everyday business purposes as described on page one of this notice. | |
| Nonaffiliates | Companies not related by common ownership or control. They can be financial and nonfinancial companies.
•MFS does not share with nonaffiliates so they can market to you. | |
| Joint Marketing | A formal agreement between nonaffiliated financial companies that together market financial products or services to you.
•MFS doesn’t jointly market. | |
| Other important information | ||
| If you own an MFS product or receive an MFS service in the name of a third party such as a bank or broker-dealer, their privacy policy may apply to you instead of ours. | ||
32
Table of Contents

Table of Contents

MFS® Technology Portfolio
MFS® Variable Insurance Trust II

ANNUAL REPORT
December 31, 2011
TKS-ANN
Table of Contents
MFS® TECHNOLOGY PORTFOLIO
The report is prepared for the general information of contract owners.
It is authorized for distribution to prospective investors only when preceded or accompanied by a current prospectus.
NOT FDIC INSURED Ÿ MAY LOSE VALUE Ÿ NO BANK OR CREDIT UNION GUARANTEE Ÿ NOT A DEPOSIT Ÿ NOT INSURED BY ANY FEDERAL GOVERNMENT AGENCY OR NCUA/NCUSIF
Table of Contents
MFS Technology Portfolio
LETTER FROM THE CHAIRMAN AND CEO

Dear Contract Owners:
We are indeed living through some volatile times. Economic uncertainty is everywhere, as it seems no place in the world has been unmoved by crisis. We have seen a devastating earthquake and tsunami that have led to disruptions in the Japanese markets
and supply chains. Protests have changed the face of the Middle East and left in their wake lingering tensions and resultant higher oil prices. We have seen debt limits tested in Europe and the United States and policymakers grappling to craft often unpopular monetary and fiscal responses at a time when consumers and businesses struggle with what appears to be a slowing global economy. On top of all of that, we have seen long-term U.S. debt lose its Standard & Poor’s AAA rating and the long-term debt ratings of 15 eurozone nations put on negative watch.
When markets become volatile, managing risk becomes a top priority for investors and their advisors. At MFS® risk management is foremost in our minds in all market climates. Our analysts and portfolio managers keep risks firmly in mind when evaluating securities. Additionally, we have a team of quantitative analysts that measures and assesses the risk profiles of our portfolios and securities on an ongoing basis. The chief investment risk officer, who oversees the team, reports directly to the firm’s president and chief investment officer so the risk associated with each portfolio can be assessed objectively and independently of the portfolio management team.
As always, we continue to be mindful of the many economic challenges faced at the local, national, and international levels. It is in times such as these that we want to remind investors of the merits of maintaining a long-term view, adhering to basic investing principles such as asset allocation and diversification, and working closely with their advisors to research and identify appropriate investment opportunities.
Respectfully,

Robert J. Manning
Chairman and Chief Executive Officer
MFS Investment Management®
February 15, 2012
The opinions expressed in this letter are subject to change, may not be relied upon for investment advice, and no forecasts can be guaranteed.
1
Table of Contents
MFS Technology Portfolio
Portfolio structure (i)
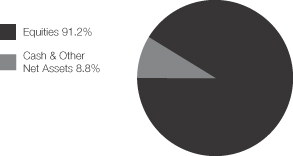
| Top ten holdings (i) | ||||
| Apple, Inc. | 12.6% | |||
| Google, Inc., “A” | 10.3% | |||
| Oracle Corp. | 7.3% | |||
| Amazon.com, Inc. | 4.5% | |||
| Qualcomm, Inc. | 4.0% | |||
| Visa, Inc., “A” | 3.8% | |||
| EMC Corp. | 3.7% | |||
| MasterCard, Inc., “A” | 3.1% | |||
| Red Hat, Inc. | 2.6% | |||
| Microchip Technology, Inc. | 2.3% |
| Top five industries (i) | ||||
| Computer Software – Systems (s) | 19.5% | |||
| Computer Software | 18.5% | |||
| Internet (s) | 13.1% | |||
| Electronics (s) | 9.5% | |||
| Network & Telecom | 8.6% |
| (i) | For purposes of this presentation, the components include the market value of securities, less any securities sold short, and reflect the impact of the equivalent exposure of derivative positions. These amounts may be negative from time to time. Equivalent exposure is a calculated amount that translates the derivative position into a reasonable approximation of the amount of the underlying asset that the portfolio would have to hold at a given point in time to have the same price sensitivity that results from the portfolio’s ownership of the derivative contract. When dealing with derivatives, equivalent exposure is a more representative measure of the potential impact of a position on portfolio performance than market value. |
| (s) | Top five industry includes securities sold short. |
Percentages are based on net assets as of 12/31/11.
The portfolio is actively managed and current holdings may be different.
2
Table of Contents
MFS Technology Portfolio
Summary of Results
For the twelve months ended December 31, 2011, Initial Class shares of the MFS Technology Portfolio (the “fund”) provided a total return of 1.17%, while Service Class shares of the fund provided a total return of 1.05%. These compare with a return of 2.11% for the fund’s benchmark, the Standard & Poor’s 500 Stock Index, and a return of –0.88% for the fund’s other benchmark, the Standard & Poor’s North American Technology Sector Index.
Market Environment
Early in the period, the U.S. Federal Reserve (the “Fed”) responded to weak economic growth by loosening monetary policy further. More easing by the Fed improved market sentiment and drove risk-asset prices markedly higher. The December 2010 agreement on a surprisingly large (relative to expectations) expansionary U.S. fiscal package also boosted sentiment. During the subsequent several months, the renewed positive market sentiment, coupled with better indications of global macroeconomic activity, pushed many asset valuations to post-crisis highs. At the same time, the yields of the perceived “safest” global sovereign credits rose, indicating a renewed risk-seeking environment.
However, towards the middle of the period, a weakening macroeconomic backdrop and renewed concerns over peripheral euro zone sovereign debt caused a flight-to-quality move that pushed high-quality sovereign bond yields lower. In the U.S., concerns about sovereign debt default and the long-term sustainability of the trend in U.S. fiscal policy resulted in one agency downgrading U.S. credit quality. Amidst this turmoil, global equity markets declined sharply. As a result of these developments, global consumer and producer sentiment indicators fell precipitously and highly-rated sovereign bond yields hit multi-decade lows. Towards the end of the reporting period, uncertainty in financial markets spiked higher as markets more seriously contemplated the possible failure of the euro zone.
Detractors from Performance
Stock selection in the leisure & toys industry detracted from performance relative to the Standard & Poor’s North American Technology Sector Index. The fund’s holdings of interactive entertainment software company THQ (b)(h) held back relative results as the stock turned in poor performance over the reporting period.
Security selection in the electronics industry was another factor that negatively impacted relative performance. The fund’s timing of ownership in the common stock and, to a lesser extent, the holdings of put options in semiconductor company Intel weakened relative returns. Overweight positions in semiconductor manufacturer Advanced Micro Devices and telecommunications service provider JDS Uniphase also held back relative performance. Shares of Advanced Micro Devices faced downward pressure towards the end of the period as management lowered guidance citing a shortfall in supply of one of its microprocessors.
Elsewhere, an underweight position in strong-performing diversified technology products and services company International Business Machines (IBM) detracted from relative returns. Holdings of enterprise software products maker Oracle, social media company Demand Media (b)(h), and customer information software manager Salesforce.com weakened relative performance. Shares of Oracle depreciated towards the end of the period as the company announced quarterly earnings results that missed expectations, primarily attributable to worse-than-expected revenues from delayed sales closures that negatively affected most of the company’s business segments. The timing of the fund’s ownership in shares of network equipment company Cisco Systems (h) and wireless communications software company Qualcomm, Inc. was also a negative factor for relative performance.
Contributors to Performance
Stock selection in the computer systems industry contributed to relative performance. The timing of the fund’s ownership in shares of computer products and services provider Hewlett-Packard Co. (h), and an overweight position in computer and personal electronics maker Apple, were among the fund’s top relative contributors during the reporting period. Shares of Hewlett-Packard declined throughout the period as investor confidence of the weakening business appeared to have been further shaken by the board’s decision to fire CEO Leo Apotheker in September after only eleven months on the job and hire former eBay CEO, Meg Whitman, to take his place. Additionally, the company had been plagued by slower growth in its PC division, internal problems in its services division, and a weaker balance sheet primarily from prior acquisitions. Shares of Apple climbed throughout the reporting period as the company benefited from record iPhone and iPad sales.
The combination of an overweight position and stock selection in the diversified financials industry contributed to relative returns. The fund’s overweight allocations to strong-performing global payments technology companies, MasterCard and Visa, aided relative performance as both stocks turned in strong performance over the period. Shares of the MasterCard and Visa reacted favorably to news that the regulation of interchange rates, or the fees that these companies and other banks can charge merchants when consumers pay for goods with debit cards, may be less onerous than previously expected.
3
Table of Contents
MFS Technology Portfolio
Management Review – continued
An underweight position and stock selection in the network & telecom industry was another positive factor for relative performance. Short positions in Canadian wireless solutions provider Research in Motion (h) and wireless solution provider Sierra Wireless (b)(h) (Canada) benefited relative performance as both stocks depreciated during the reporting period.
Security selection in the computer software and business services industries also contributed to relative returns. In the computer software industry, the fund’s holdings of strong-performing software developer Autonomy (b)(h), and the timing of the fund’s ownership in shares of digital entertainment technology solution provider Rovi (h), strengthened relative performance. Within the business services industry, the combination of a short position and holdings of put options in information technology service provider Computer Sciences also boosted relative performance.
Elsewhere, the fund’s short position in electronic display device maker Cree (h) boosted relative results as the stock was a relative underperformer for the reporting period.
Respectfully,
Matthew Sabel
Portfolio Manager
Note to Contract Owners: Effective May, 1, 2011, Matthew Sabel replaced Joseph MacDougall as the manager of the fund.
| (b) | Security is not a benchmark constituent. |
| (h) | Security was not held in the fund at period end. |
The views expressed in this report are those of the portfolio manager only through the end of the period of the report as stated on the cover and do not necessarily reflect the views of MFS or any other person in the MFS organization. These views are subject to change at any time based on market or other conditions, and MFS disclaims any responsibility to update such views. These views may not be relied upon as investment advice or an indication of trading intent on behalf of any MFS portfolio. References to specific securities are not recommendations of such securities, and may not be representative of any MFS portfolio’s current or future investments.
4
Table of Contents
MFS Technology Portfolio
PERFORMANCE SUMMARY THROUGH 12/31/11
The following chart illustrates the historical performance of the fund in comparison to its benchmark(s). Benchmarks are unmanaged and may not be invested in directly. Benchmark returns do not reflect any fees or expenses. The performance of other share classes will be greater than or less than that of the class depicted below. (See Notes to Performance Summary.)
Performance data shown represents past performance and is no guarantee of future results. Investment return and principal value fluctuate so your units, when sold, may be worth more or less than the original cost; current performance may be lower or higher than quoted. The performance shown does not reflect the deduction of taxes, if any, that a contract holder would pay on fund distributions or the redemption of contract units. The returns for the fund shown also do not reflect the deduction of expenses associated with variable products, such as mortality and expense risk charges, separate account charges, and sales charges imposed by the insurance company separate accounts. Such expenses would reduce the overall returns shown.
Growth of a Hypothetical $10,000 Investment
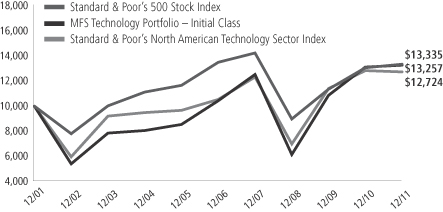
Total Returns through 12/31/11
Average annual total returns
| Share class | Class inception date | 1-yr | 5-yr | 10-yr | ||||||||
| Initial Class | 6/16/00 | 1.17% | 4.93% | 2.86% | ||||||||
| Service Class | 8/24/01 | 1.05% | 4.70% | 2.57% | ||||||||
| Comparative benchmarks | ||||||||||||
| Standard & Poor’s 500 Stock Index (f) | 2.11% | (0.25)% | 2.92% | |||||||||
| Standard & Poor’s North American Technology Sector Index (f) | (0.88)% | 3.84% | 2.44% | |||||||||
| (f) | Source: FactSet Research Systems Inc. |
Benchmark Definitions
Standard & Poor’s 500 Stock Index – a market capitalization-weighted index of 500 widely held equity securities, designed to measure broad U.S. equity performance.
Standard & Poor’s North American Technology Sector Index – a modified market capitalization-weighted index that measures the performance of selected technology stocks.
It is not possible to invest directly in an index.
Notes to Performance Summary
Average annual total return represents the average annual change in value for each share class for the periods presented.
Performance results reflect any applicable expense subsidies and waivers in effect during the periods shown. Without such subsidies and waivers the fund’s performance results would be less favorable. Please see the prospectus and financial statements for complete details. All results are historical and assume the reinvestment of any dividends and capital gains distributions.
Performance results do not include adjustments made for financial reporting purposes in accordance with U.S. generally accepted accounting principles and may differ from amounts reported in the financial highlights.
From time to time the fund may receive proceeds from litigation settlements, without which performance would be lower.
5
Table of Contents
MFS Technology Portfolio
Fund Expenses Borne by the Contract Holders During the Period,
July 1, 2011 through December 31, 2011
As a contract holder of the fund, you incur ongoing costs, including management fees; distribution and/or service (12b-1) fees; and other fund expenses. This example is intended to help you understand your ongoing costs (in dollars) of investing in the fund and to compare these costs with the ongoing costs of investing in other mutual funds.
The example is based on an investment of $1,000 invested at the beginning of the period and held for the entire period July 1, 2011 through December 31, 2011.
Actual Expenses
The first line for each share class in the following table provides information about actual account values and actual expenses. You may use the information in this line, together with the amount you invested, to estimate the expenses that you paid over the period. Simply divide your account value by $1,000 (for example, an $8,600 account value divided by $1,000 = 8.6), then multiply the result by the number in the first line under the heading entitled “Expenses Paid During Period” to estimate the expenses you paid on your account during this period.
Hypothetical Example for Comparison Purposes
The second line for each share class in the following table provides information about hypothetical account values and hypothetical expenses based on the fund’s actual expense ratio and an assumed rate of return of 5% per year before expenses, which is not the fund’s actual return. The hypothetical account values and expenses may not be used to estimate the actual ending account balance or expenses you paid for the period. You may use this information to compare the ongoing costs of investing in the fund and other funds. To do so, compare this 5% hypothetical example with the 5% hypothetical examples that appear in the shareholder reports of the other funds.
Please note that the expenses shown in the table are meant to highlight the fund’s ongoing costs only and do not take into account the fees and expenses imposed under the variable contracts through which your investment in the fund is made. Therefore, the second line for each share class in the table is useful in comparing ongoing costs associated with an investment in vehicles (such as the fund) which fund benefits under variable annuity and variable life insurance contracts and to qualified pension and retirement plans only, and will not help you determine the relative total costs of investing in the fund through variable annuity and variable life insurance contracts. If the fees and expenses imposed under the variable contracts were included, your costs would have been higher.
| Share Class | Annualized Expense Ratio | Beginning Account Value 7/01/11 | Ending Account Value 12/31/11 | Expenses Paid During Period (p) 7/01/11-12/31/11 | ||||||||||||||
| Initial Class | Actual | 1.08% | $1,000.00 | $980.17 | $5.39 | |||||||||||||
| Hypothetical (h) | 1.08% | $1,000.00 | $1,019.76 | $5.50 | ||||||||||||||
| Service Class | Actual | 1.33% | $1,000.00 | $978.20 | $6.63 | |||||||||||||
| Hypothetical (h) | 1.33% | $1,000.00 | $1,018.50 | $6.77 | ||||||||||||||
| (h) | 5% class return per year before expenses. |
| (p) | Expenses paid is equal to each class’ annualized expense ratio, as shown above, multiplied by the average account value over the period, multiplied by the number of days in the period, divided by the number of days in the year. |
Expenses Impacting Table
Expense ratios include 0.08% of investment related expenses from short sale dividend and interest expenses that are outside of the expense cap arrangement (See Note 3 of the Notes to Financial Statements).
6
Table of Contents
MFS Technology Portfolio
PORTFOLIO OF INVESTMENTS – 12/31/11
The Portfolio of Investments is a complete list of all securities owned by your fund. It is categorized by broad-based asset classes.
| Issuer | Shares/Par | Value ($) | ||||||
| COMMON STOCKS – 98.5% | ||||||||
| Broadcasting – 1.8% | ||||||||
| Viacom, Inc., “B” | 11,510 | $ | 522,669 | |||||
|
| |||||||
| Business Services – 5.7% | ||||||||
| Accenture PLC, “A” | 7,450 | $ | 396,564 | |||||
| Cognizant Technology Solutions Corp., “A” (a) | 6,720 | 432,163 | ||||||
| Constant Contact, Inc. (a) | 7,290 | 169,201 | ||||||
| FleetCor Technologies, Inc. (a) | 14,860 | 443,868 | ||||||
| MSCI, Inc., “A” (a) | 6,790 | 223,595 | ||||||
|
| |||||||
| $ | 1,665,391 | |||||||
|
| |||||||
| Computer Software – 18.6% | ||||||||
| Autodesk, Inc. (a) | 17,220 | $ | 522,283 | |||||
| Check Point Software Technologies Ltd. (a) | 3,620 | 190,195 | ||||||
| Citrix Systems, Inc. (a) | 4,510 | 273,847 | ||||||
| Nuance Communications, Inc. (a) | 4,020 | 101,143 | ||||||
| Oracle Corp. (s) | 82,810 | 2,124,077 | ||||||
| Parametric Technology Corp. (a) | 8,330 | 152,106 | ||||||
| Red Hat, Inc. (a) | 18,400 | 759,736 | ||||||
| Salesforce.com, Inc. (a) | 3,890 | 394,679 | ||||||
| Symantec Corp. (a) | 24,240 | 379,356 | ||||||
| TIBCO Software, Inc. (a) | 3,060 | 73,165 | ||||||
| VeriSign, Inc. | 13,740 | 490,793 | ||||||
|
| |||||||
| $ | 5,461,380 | |||||||
|
| |||||||
| Computer Software – Systems – 21.8% | ||||||||
| Active Network, Inc. (a) | 10,310 | $ | 140,216 | |||||
| Apple, Inc. (a)(s) | 9,090 | 3,681,450 | ||||||
| BroadSoft, Inc. (a) | 4,350 | 131,370 | ||||||
| EMC Corp. (a) | 49,620 | 1,068,815 | ||||||
| Fusion-io, Inc. (a) | 1,520 | 36,784 | ||||||
| International Business Machines Corp. | 3,630 | 667,484 | ||||||
| NetApp, Inc. (a) | 4,530 | 164,303 | ||||||
| Qlik Technologies, Inc. (a) | 4,770 | 115,434 | ||||||
| Quantum Corp. (a) | 28,460 | 68,304 | ||||||
| Tangoe, Inc. (a) | 9,970 | 153,538 | ||||||
| Verifone Systems, Inc. (a) | 4,090 | 145,277 | ||||||
|
| |||||||
| $ | 6,372,975 | |||||||
|
| |||||||
| Consumer Services – 1.8% | ||||||||
| HomeAway, Inc. (a) | 3,570 | $ | 83,003 | |||||
| Priceline.com, Inc. (a) | 930 | 434,970 | ||||||
|
| |||||||
| $ | 517,973 | |||||||
|
| |||||||
| Electrical Equipment – 0.7% | ||||||||
| Amphenol Corp., “A” | 4,660 | $ | 211,517 | |||||
|
| |||||||
| Electronics – 12.5% | ||||||||
| Advanced Micro Devices, Inc. (a) | 64,279 | $ | 347,107 | |||||
| Aeroflex Holding Corp. (a) | 7,910 | 80,998 | ||||||
| Altera Corp. | 6,050 | 224,455 | ||||||
| ASML Holding N.V. | 3,110 | 129,967 | ||||||
| Broadcom Corp., “A” | 8,710 | 255,726 | ||||||
| Hittite Microwave Corp. (a) | 900 | 44,442 | ||||||
| International Rectifier Corp. (a) | 7,130 | 138,465 | ||||||
| JDS Uniphase Corp. (a) | 64,520 | 673,589 | ||||||
| Issuer | Shares/Par | Value ($) | ||||||
| COMMON STOCKS – continued | ||||||||
| Electronics – continued | ||||||||
| KLA-Tencor Corp. | 5,940 | $ | 286,605 | |||||
| Microchip Technology, Inc. | 18,740 | 686,446 | ||||||
| Monolithic Power Systems, Inc. (a) | 6,900 | 103,983 | ||||||
| NetLogic Microsystems, Inc. (a) | 7,140 | 353,930 | ||||||
| SanDisk Corp. (a) | 1,890 | 93,007 | ||||||
| Stratasys, Inc. (a) | 2,480 | 75,417 | ||||||
| Vishay Intertechnology, Inc. (a) | 18,630 | 167,484 | ||||||
|
| |||||||
| $ | 3,661,621 | |||||||
|
| |||||||
| Internet – 14.0% | ||||||||
| eBay, Inc. (a) | 17,320 | $ | 525,316 | |||||
| Google, Inc., “A” (a)(s) | 4,650 | 3,003,435 | ||||||
| WebMD Health Corp. (a) | 2,600 | 97,630 | ||||||
| Yahoo!, Inc. (a) | 24,960 | 402,605 | ||||||
| Zynga, Inc. (a) | 6,290 | 59,189 | ||||||
|
| |||||||
| $ | 4,088,175 | |||||||
|
| |||||||
| Medical & Health Technology & Services – 0.4% | ||||||||
| athenahealth, Inc. (a) | 1,070 | $ | 52,558 | |||||
| Cerner Corp. (a) | 1,030 | 63,088 | ||||||
|
| |||||||
| $ | 115,646 | |||||||
|
| |||||||
| Network & Telecom – 8.6% | ||||||||
| Acme Packet, Inc. (a) | 8,520 | $ | 263,353 | |||||
| F5 Networks, Inc. (a) | 1,860 | 197,383 | ||||||
| Finisar Corp. (a) | 11,830 | 198,090 | ||||||
| Fortinet, Inc. (a) | 14,080 | 307,085 | ||||||
| Juniper Networks, Inc. (a) | 4,210 | 85,926 | ||||||
| Qualcomm, Inc. | 21,310 | 1,165,657 | ||||||
| Radware Ltd. (a) | 6,220 | 181,935 | ||||||
| Riverbed Technology, Inc. (a) | 4,740 | 111,390 | ||||||
|
| |||||||
| $ | 2,510,819 | |||||||
|
| |||||||
| Other Banks & Diversified Financials – 6.9% | ||||||||
| MasterCard, Inc., “A” | 2,440 | $ | 909,681 | |||||
| Visa, Inc., “A” | 11,070 | 1,123,937 | ||||||
|
| |||||||
| $ | 2,033,618 | |||||||
|
| |||||||
| Specialty Stores – 4.5% | ||||||||
| Amazon.com, Inc. (a) | 7,610 | $ | 1,317,291 | |||||
|
| |||||||
| Telecommunications – Wireless – 0.9% | ||||||||
| SBA Communications Corp. (a) | 6,200 | $ | 266,352 | |||||
|
| |||||||
| Telephone Services – 0.3% | ||||||||
| Cogent Communications Group, Inc. (a) | 6,210 | $ | 104,887 | |||||
|
| |||||||
| Total Common Stocks (Identified Cost, $28,611,090) | $ | 28,850,314 | ||||||
|
| |||||||
| Issuer/Expiration Date/Strike Price | Number of Contracts | |||||||
| PUT OPTIONS PURCHASED – 0.3% | ||||||||
| Business Services – 0.1% | ||||||||
| Equinix Inc. – February 2012 @ $105 | 18 | $ | 13,140 | |||||
|
| |||||||
7
Table of Contents
MFS Technology Portfolio
Portfolio of Investments – continued
| Issuer/Expiration Date/Strike Price | | Number of Contracts | | Value ($) | ||||
| PUT OPTIONS PURCHASED – continued | ||||||||
| Computer Software – 0.0% | ||||||||
| CA Inc. – February 2012 @ $22 | 59 | $ | 11,800 | |||||
|
| |||||||
| Computer Software – Systems – 0.1% | ||||||||
| International Business Machinces Corp. – February 2012 @ $185 | 30 | $ | 21,000 | |||||
| Lexmark International Inc. – February 2012 @ $35 | 31 | 10,230 | ||||||
| Teradata Corp. – February 2012 @ $50 | 30 | 10,800 | ||||||
|
| |||||||
| $ | 42,030 | |||||||
|
| |||||||
| Electronics – 0.1% | ||||||||
| Intel Corp. – January 2012 @ $26 | 106 | $ | 19,186 | |||||
|
| |||||||
| Total Put Options Purchased (Premiums Paid, $95,808) | $ | 86,156 | ||||||
|
| |||||||
| Issuer | Shares/Par | |||||||
| MONEY MARKET FUNDS – 1.9% | ||||||||
| MFS Institutional Money Market Portfolio, 0.05%, at Cost and Net Asset Value (v) | 543,876 | $ | 543,876 | |||||
|
| |||||||
| Total Investments (Identified Cost, $29,250,774) | $ | 29,480,346 | ||||||
|
| |||||||
| Issuer/Expiration Date/Strike Price | Number of Contracts | |||||||
| CALL OPTIONS WRITTEN – 0.0% | ||||||||
| Computer Software – 0.0% | ||||||||
| Oracle Corp. – January 2012 @ $27 | (49 | ) | $ | (980 | ) | |||
| Oracle Corp. – January 2012 @ $28 | (149 | ) | (1,192 | ) | ||||
| Red Hat Inc. – January 2012 @ $45 | (18 | ) | (630 | ) | ||||
|
| |||||||
| $ | (2,802 | ) | ||||||
|
| |||||||
| Electronics – 0.0% | ||||||||
| Advanced Micro Devices – January 2012 @ $5.50 | (204 | ) | $ | (4,284 | ) | |||
| Altera Corp. – January 2012 @ $38 | (16 | ) | (1,440 | ) | ||||
| KLA-Tencor Corp. – January 2012 @ $49 | (31 | ) | (3,410 | ) | ||||
| Sandisk Corp. – January 2012 @ $52.50 | (18 | ) | (1,170 | ) | ||||
|
| |||||||
| $ | (10,304 | ) | ||||||
|
| |||||||
| Total Call Options Written (Premium Received, $(15,233) | $ | (13,106 | ) | |||||
|
| |||||||
| Issuer/Expiration Date/Strike Price | | Number of Contracts | | Value ($) | ||||
| PUT OPTIONS WRITTEN – 0.0% | ||||||||
| Computer Software – 0.0% | ||||||||
| Oracle Corp. – January 2012 @ $27 | (49 | ) | $ | (7,350 | ) | |||
| Red Hat, Inc. – January 2012 @ $39 | (21 | ) | (1,113 | ) | ||||
|
| |||||||
| Total Put Options Written (Premium Received, $(3,561) | $ | (8,463 | ) | |||||
|
| |||||||
| Issuer | Shares/Par | |||||||
| SECURITIES SOLD SHORT – (4.1)% | ||||||||
| Business Services – (0.7)% | ||||||||
| Computer Sciences Corp. | (8,690 | ) | $ | (205,953 | ) | |||
|
| |||||||
| Computer Software – Systems – (0.8)% | ||||||||
| Dell, Inc. (a) | (15,570 | ) | $ | (227,789 | ) | |||
|
| |||||||
| Electronics – (1.7)% | ||||||||
| Freescale Semiconductor Holdings I Ltd. (a) | (29,200 | ) | $ | (369,380 | ) | |||
| Volterra Semiconductor Corp. (a) | (5,300 | ) | (135,733 | ) | ||||
|
| |||||||
| $ | (505,113 | ) | ||||||
|
| |||||||
| Internet – (0.9)% | ||||||||
| Sohu.com, Inc. (a) | (5,060 | ) | $ | (253,000 | ) | |||
|
| |||||||
| Total Securities Sold Short (Proceeds Received, $(1,169,403) | $ | (1,191,855 | ) | |||||
|
| |||||||
| OTHER ASSETS, LESS LIABILITIES – 3.4% | 1,012,269 | |||||||
|
| |||||||
| Net Assets – 100.0% | $ | 29,279,191 | ||||||
|
| |||||||
| (a) | Non-income producing security. |
| (s) | Security or a portion of the security was pledged to cover collateral requirements for securities sold short and/or certain derivative transactions. At December 31, 2011, the value of securities pledged amounted to $1,026,126. |
| (v) | Underlying affiliated fund that is available only to investment companies managed by MFS. The rate quoted for the MFS Institutional Money Market Portfolio is the annualized seven-day yield of the fund at period end. |
The following abbreviations are used in this report and are defined:
| PLC | Public Limited Company |
See Notes to Financial Statements
8
Table of Contents
MFS Technology Portfolio
FINANCIAL STATEMENTS | STATEMENT OF ASSETS AND LIABILITIES
This statement represents your fund’s balance sheet, which details the assets and liabilities comprising the total value of the fund.
At 12/31/11 | ||||||||
Assets | ||||||||
Investments – | ||||||||
Non-affiliated issuers, at value (identified cost, $28,706,898) | $28,936,470 | |||||||
Underlying affiliated funds, at cost and value | 543,876 | |||||||
Total investments, at value (identified cost, $29,250,774) | $29,480,346 | |||||||
Deposits with brokers | 1,210,163 | |||||||
Receivables for | ||||||||
Fund shares sold | 197,184 | |||||||
Dividends | 2,864 | |||||||
Receivable from investment adviser | 955 | |||||||
Other assets | 1,117 | |||||||
Total assets | $30,892,629 | |||||||
Liabilities | ||||||||
Payable to custodian | $300,000 | |||||||
Payables for | ||||||||
Dividends on securities sold short | 1,978 | |||||||
Securities sold short, at value (proceeds received, $1,169,403) | 1,191,855 | |||||||
Fund shares reacquired | 55,048 | |||||||
Written options outstanding, at value (premiums received, $18,794) | 21,569 | |||||||
Payable to affiliates | ||||||||
Shareholder servicing costs | 22 | |||||||
Distribution and/or service fees | 299 | |||||||
Payable for Trustees’ compensation | 11 | |||||||
Accrued expenses and other liabilities | 42,656 | |||||||
Total liabilities | $1,613,438 | |||||||
Net assets | $29,279,191 | |||||||
Net assets consist of | ||||||||
Paid-in capital | $31,320,784 | |||||||
Unrealized appreciation (depreciation) on investments | 204,345 | |||||||
Accumulated net realized gain (loss) on investments and foreign currency transactions | (2,245,938 | ) | ||||||
Net assets | $29,279,191 | |||||||
Shares of beneficial interest outstanding | 4,289,157 |
| Net assets | Shares outstanding | Net asset value per share | ||||||||||
Initial Class | $14,597,989 | 2,108,149 | $6.92 | |||||||||
Service Class | 14,681,202 | 2,181,008 | 6.73 | |||||||||
See Notes to Financial Statements
9
Table of Contents
MFS Technology Portfolio
FINANCIAL STATEMENTS | STATEMENT OF OPERATIONS
This statement describes how much your fund earned in investment income and accrued in expenses. It also describes any gains and/or losses generated by fund operations.
| Year ended 12/31/11 | ||||||||
| Net investment loss | ||||||||
Income | ||||||||
Dividends | $62,577 | |||||||
Interest | 6,318 | |||||||
Dividends from underlying affiliated funds | 289 | |||||||
Foreign taxes withheld | (553 | ) | ||||||
Total investment income | $68,631 | |||||||
Expenses | ||||||||
Management fee | $195,703 | |||||||
Distribution and/or service fees | 26,314 | |||||||
Shareholder servicing costs | 2,828 | |||||||
Administrative services fee | 17,500 | |||||||
Trustees’ compensation | 2,499 | |||||||
Custodian fee | 15,415 | |||||||
Shareholder communications | 6,421 | |||||||
Auditing fees | 56,836 | |||||||
Legal fees | 5,355 | |||||||
Dividend and interest expense on securities sold short | 20,086 | |||||||
Miscellaneous | 11,400 | |||||||
Total expenses | $360,357 | |||||||
Fees paid indirectly | (18 | ) | ||||||
Reduction of expenses by investment adviser | (52,953 | ) | ||||||
Net expenses | $307,386 | |||||||
Net investment loss | $(238,755 | ) | ||||||
Realized and unrealized gain (loss) on investments and foreign currency transactions | ||||||||
Realized gain (loss) (identified cost basis) | ||||||||
Investment transactions | $1,508,542 | |||||||
Written option transactions | 225,005 | |||||||
Securities sold short | 77,648 | |||||||
Foreign currency transactions | (1,652 | ) | ||||||
Net realized gain (loss) on investments and foreign currency transactions | $1,809,543 | |||||||
Change in unrealized appreciation (depreciation) | ||||||||
Investments | $(1,660,637 | ) | ||||||
Written options | (8,800 | ) | ||||||
Securities sold short | 190,424 | |||||||
Net unrealized gain (loss) on investments | $(1,479,013 | ) | ||||||
Net realized and unrealized gain (loss) on investments | $330,530 | |||||||
Change in net assets from operations | $91,775 |
See Notes to Financial Statements
10
Table of Contents
MFS Technology Portfolio
FINANCIAL STATEMENTS | STATEMENTS OF CHANGES IN NET ASSETS
These statements describe the increases and/or decreases in net assets resulting from operations, any distributions, and any shareholder transactions.
For years ended 12/31 | 2011 | 2010 | ||||||
Change in net assets | ||||||||
From operations | ||||||||
Net investment loss | $(238,755 | ) | $(10,781 | ) | ||||
Net realized gain (loss) on investments and foreign currency transactions | 1,809,543 | 1,919,750 | ||||||
Net unrealized gain (loss) on investments | (1,479,013 | ) | 1,377,709 | |||||
Change in net assets from operations | $91,775 | $3,286,678 | ||||||
Change in net assets from fund share transactions | $7,691,444 | $1,890,876 | ||||||
Total change in net assets | $7,783,219 | $5,177,554 | ||||||
Net assets | ||||||||
At beginning of period | 21,495,972 | 16,318,418 | ||||||
At end of period | $29,279,191 | $21,495,972 |
See Notes to Financial Statements
11
Table of Contents
MFS Technology Portfolio
FINANCIAL STATEMENTS | FINANCIAL HIGHLIGHTS
The financial highlights table is intended to help you understand the fund’s financial performance for the past 5 years. Certain information reflects financial results for a single fund share. The total returns in the table represent the rate by which an investor would have earned (or lost) on an investment in the fund share class (assuming reinvestment of all distributions) held for the entire period.
| Initial Class | Years ended 12/31 | |||||||||||||||||||
| 2011 | 2010 | 2009 | 2008 | 2007 | ||||||||||||||||
Net asset value, beginning of period | $6.84 | $5.67 | $3.21 | $6.54 | $5.44 | |||||||||||||||
| Income (loss) from investment operations | ||||||||||||||||||||
Net investment income (loss) (d) | $(0.05 | ) | $(0.00 | )(w) | $(0.00 | )(w) | $(0.00 | )(w) | $(0.02 | ) | ||||||||||
Net realized and unrealized gain (loss) on investments | 0.13 | 1.17 | 2.46 | (3.33 | ) | 1.12 | ||||||||||||||
Total from investment operations | $0.08 | $1.17 | $2.46 | $(3.33 | ) | $1.10 | ||||||||||||||
Net asset value, end of period (x) | $6.92 | $6.84 | $5.67 | $3.21 | $6.54 | |||||||||||||||
Total return (%) (k)(r)(s)(x) | 1.17 | 20.63 | 76.64 | (50.92 | ) | 20.22 | ||||||||||||||
| Ratios (%) (to average net assets) and Supplemental data: | ||||||||||||||||||||
Expenses before expense reductions (f) | 1.28 | 1.38 | 1.60 | 1.39 | 1.21 | |||||||||||||||
Expenses after expense reductions (f) | 1.08 | 1.07 | 1.04 | 1.02 | 1.00 | |||||||||||||||
Net investment loss | (0.77 | ) | (0.07 | ) | (0.05 | ) | (0.00 | )(w) | (0.31 | ) | ||||||||||
Portfolio turnover | 90 | 140 | 227 | 244 | 249 | |||||||||||||||
Net assets at end of period (000 omitted) | $14,598 | $15,844 | $14,542 | $8,051 | $21,184 | |||||||||||||||
| Supplemental Ratios (%): | ||||||||||||||||||||
Ratio of expenses to average net assets after expense reductions excluding short sale dividend and interest expense (f) | 1.00 | 1.00 | 1.00 | 1.00 | N/A | |||||||||||||||
See Notes to Financial Statements
12
Table of Contents
MFS Technology Portfolio
Financial Highlights – continued
| Service Class | Years ended 12/31 | |||||||||||||||||||
| 2011 | 2010 | 2009 | 2008 | 2007 | ||||||||||||||||
Net asset value, beginning of period | $6.66 | $5.54 | $3.14 | $6.42 | $5.35 | |||||||||||||||
| Income (loss) from investment operations | ||||||||||||||||||||
Net investment income (loss) (d) | $(0.08 | ) | $(0.00 | )(w) | $(0.01 | ) | $(0.02 | ) | $(0.03 | ) | ||||||||||
Net realized and unrealized gain (loss) on investments | 0.15 | 1.12 | 2.41 | (3.26 | ) | 1.10 | ||||||||||||||
Total from investment operations | $0.07 | $1.12 | $2.40 | $(3.28 | ) | $1.07 | ||||||||||||||
Net asset value, end of period (x) | $6.73 | $6.66 | $5.54 | $3.14 | $6.42 | |||||||||||||||
Total return (%) (k)(r)(s)(x) | 1.05 | 20.22 | 76.43 | (51.09 | ) | 20.00 | ||||||||||||||
| Ratios (%) (to average net assets) and Supplemental data: | ||||||||||||||||||||
Expenses before expense reductions (f) | 1.53 | 1.63 | 1.85 | 1.62 | 1.46 | |||||||||||||||
Expenses after expense reductions (f) | 1.33 | 1.32 | 1.29 | 1.27 | 1.25 | |||||||||||||||
Net investment loss | (1.13 | ) | (0.04 | ) | (0.32 | ) | (0.29 | ) | (0.56 | ) | ||||||||||
Portfolio turnover | 90 | 140 | 227 | 244 | 249 | |||||||||||||||
Net assets at end of period (000 omitted) | $14,681 | $5,652 | $1,776 | $990 | $3,555 | |||||||||||||||
| Supplemental Ratios (%): | ||||||||||||||||||||
Ratio of expenses to average net assets after expense reductions excluding short sale dividend and interest expense (f) | 1.25 | 1.25 | 1.25 | 1.25 | N/A | |||||||||||||||
| (d) | Per share data is based on average shares outstanding. |
| (f) | Ratios do not reflect reductions from fees paid indirectly, if applicable. |
| (k) | The total return does not reflect expenses that apply to separate accounts. Inclusion of these charges would reduce the total return figures for all periods shown. |
| (r) | Certain expenses have been reduced without which performance would have been lower. |
| (s) | From time to time the fund may receive proceeds from litigation settlements, without which performance would be lower. Excluding the effect of the proceeds received from a non-recurring litigation settlement against Nortel Networks Corp., the total returns for the year ended December 31, 2008 would have been lower by approximately 0.58%. |
| (x) | The net asset values per share and total returns have been calculated on net assets which include adjustments made in accordance with U.S. generally accepted accounting principles required at period end for financial reporting purposes. |
| (w) | Per share amount was less than $0.01. |
See Notes to Financial Statements
13
Table of Contents
MFS Technology Portfolio
| (1) | Business and Organization |
MFS Technology Portfolio (the fund) is a series of MFS Variable Insurance Trust II (the trust). The trust is organized as a Massachusetts business trust and is registered under the Investment Company Act of 1940, as amended, as an open-end management investment company. The shareholders of each series of the trust are separate accounts of insurance companies, which offer variable annuity and/or life insurance products, and qualified retirement and pension plans.
| (2) | Significant Accounting Policies |
General – The preparation of financial statements in conformity with U.S. generally accepted accounting principles requires management to make estimates and assumptions that affect the reported amounts of assets and liabilities, and disclosure of contingent assets and liabilities at the date of the financial statements and the reported amounts of revenues and expenses during the reporting period. Actual results could differ from those estimates. In the preparation of these financial statements, management has evaluated subsequent events occurring after the date of the fund’s Statement of Assets and Liabilities through the date that the financial statements were issued. The fund invests primarily in securities of issuers in the technology industry. Issuers in a single industry can react similarly to market, economic, political and regulatory conditions and developments.
In December 2011, the Financial Accounting Standards Board issued Accounting Standards Update 2011-11, Balance Sheet (Topic 210) – Disclosures about Offsetting Assets and Liabilities (“ASU 2011-11”). Effective for annual reporting periods beginning on or after January 1, 2013 and interim periods within those annual periods, ASU 2011-11 is intended to enhance disclosure requirements on the offsetting of financial assets and liabilities. Although still evaluating the potential impacts of ASU 2011-11 to the fund, management expects that the impact of the fund’s adoption will be limited to additional financial statement disclosures.
Investment Valuations – Equity securities, including restricted equity securities, are generally valued at the last sale or official closing price as provided by a third-party pricing service on the market or exchange on which they are primarily traded. Equity securities, for which there were no sales reported that day, are generally valued at the last quoted daily bid quotation as provided by a third-party pricing service on the market or exchange on which such securities are primarily traded. Equity securities held short, for which there were no sales reported for that day, are generally valued at the last quoted daily ask quotation as provided by a third-party pricing service on the market or exchange on which such securities are primarily traded. Debt instruments and floating rate loans (other than short-term instruments), including restricted debt instruments, are generally valued at an evaluated or composite bid as provided by a third-party pricing service. Short-term instruments with a maturity at issuance of 60 days or less generally are valued at amortized cost, which approximates market value. Exchange-traded options are generally valued at the last sale or official closing price as provided by a third-party pricing service on the exchange on which such options are primarily traded. Exchange-traded options for which there were no sales reported that day are generally valued at the last daily bid quotation as provided by a third-party pricing service on the exchange on which such options are primarily traded. Options not traded on an exchange are generally valued at a broker/dealer bid quotation. Foreign currency options are generally valued at valuations provided by a third-party pricing service. Open-end investment companies are generally valued at net asset value per share. Securities and other assets generally valued on the basis of information from a third-party pricing service may also be valued at a broker/dealer bid quotation. Values obtained from third-party pricing services can utilize both transaction data and market information such as yield, quality, coupon rate, maturity, type of issue, trading characteristics, and other market data. The values of foreign securities and other assets and liabilities expressed in foreign currencies are converted to U.S. dollars using the mean of bid and asked prices for rates provided by a third-party pricing service.
The Board of Trustees has delegated primary responsibility for determining or causing to be determined the value of the fund’s investments (including any fair valuation) to the adviser pursuant to valuation policies and procedures approved by the Board. If the adviser determines that reliable market quotations are not readily available, investments are valued at fair value as determined in good faith by the adviser in accordance with such procedures under the oversight of the Board of Trustees. Under the fund’s valuation policies and procedures, market quotations are not considered to be readily available for most types of debt instruments and floating rate loans and many types of derivatives. These investments are generally valued at fair value based on information from third-party pricing services. In addition, investments may be valued at fair value if the adviser determines that an investment’s value has been materially affected by events occurring after the close of the exchange or market on which the investment is principally traded (such as foreign exchange or market) and prior to the determination of the fund’s net asset value, or after the halting of trading of a specific security where trading does not resume prior to the close of the exchange or market on which the security is principally traded. Events that occur on a frequent basis after foreign markets close (such as developments in foreign markets and significant movements in the U.S. markets) and prior to the determination of the fund’s net asset value may be deemed to have a material effect on the value of securities traded in foreign
14
Table of Contents
MFS Technology Portfolio
Notes to Financial Statements – continued
markets. Accordingly, the fund’s foreign equity securities may often be valued at fair value. The adviser generally relies on third-party pricing services or other information (such as the correlation with price movements of similar securities in the same or other markets; the type, cost and investment characteristics of the security; the business and financial condition of the issuer; and trading and other market data) to assist in determining whether to fair value and at what value to fair value an investment. The value of an investment for purposes of calculating the fund’s net asset value can differ depending on the source and method used to determine value. When fair valuation is used, the value of an investment used to determine the fund’s net asset value may differ from quoted or published prices for the same investment. There can be no assurance that the fund could obtain the fair value assigned to an investment if it were to sell the investment at the same time at which the fund determines its net asset value per share.
Various inputs are used in determining the value of the fund’s assets or liabilities. These inputs are categorized into three broad levels. In certain cases, the inputs used to measure fair value may fall into different levels of the fair value hierarchy. In such cases, an investment’s level within the fair value hierarchy is based on the lowest level of input that is significant to the fair value measurement. The fund’s assessment of the significance of a particular input to the fair value measurement in its entirety requires judgment, and considers factors specific to the investment. Level 1 includes unadjusted quoted prices in active markets for identical assets or liabilities. Level 2 includes other significant observable market-based inputs (including quoted prices for similar securities, interest rates, prepayment speed, and credit risk). Level 3 includes unobservable inputs, which may include the adviser’s own assumptions in determining the fair value of investments. Other financial instruments are derivative instruments not reflected in total investments, such as written options. The following is a summary of the levels used as of December 31, 2011 in valuing the fund’s assets or liabilities:
| Investments at Value | Level 1 | Level 2 | Level 3 | Total | ||||||||||||
| Equity Securities | $28,936,470 | $— | $— | $28,936,470 | ||||||||||||
| Mutual Funds | 543,876 | — | — | 543,876 | ||||||||||||
| Total Investments | $29,480,346 | $— | $— | $29,480,346 | ||||||||||||
| Short Sales | $(1,191,855 | ) | $— | $— | $(1,191,855 | ) | ||||||||||
| Other Financial Instruments | ||||||||||||||||
| Written Options | $(21,569 | ) | $— | $— | $(21,569 | ) | ||||||||||
For further information regarding security characteristics, see the Portfolio of Investments.
Foreign Currency Translation – Purchases and sales of foreign investments, income, and expenses are converted into U.S. dollars based upon currency exchange rates prevailing on the respective dates of such transactions or on the reporting date for foreign denominated receivables and payables. Gains and losses attributable to foreign currency exchange rates on sales of securities are recorded for financial statement purposes as net realized gains and losses on investments. Gains and losses attributable to foreign exchange rate movements on receivables, payables, income and expenses are recorded for financial statement purposes as foreign currency transaction gains and losses. That portion of both realized and unrealized gains and losses on investments that results from fluctuations in foreign currency exchange rates is not separately disclosed.
Derivatives – The fund uses derivatives for different purposes, primarily to increase or decrease exposure to a particular market or segment of the market, or security, to increase or decrease interest rate or currency exposure, or as alternatives to direct investments. Derivatives are used for hedging or non-hedging purposes. While hedging can reduce or eliminate losses, it can also reduce or eliminate gains. When the fund uses derivatives as an investment to increase market exposure, or for hedging purposes, gains and losses from derivative instruments may be substantially greater than the derivative’s original cost.
The derivative instruments used by the fund were written options and purchased options. The fund’s period end derivatives, as presented in the Portfolio of Investments and the associated Derivative Contract Tables, generally are indicative of the volume of its derivative activity during the period.
The following table presents, by major type of derivative contract, the fair value, on a gross basis, of the asset and liability components of derivatives held by the fund at December 31, 2011 as reported in the Statement of Assets and Liabilities:
| Fair Value (a) | ||||||||||
| Risk | Derivative Contracts | Asset Derivatives | Liability Derivatives | |||||||
| Equity | Purchased Equity Options | $86,156 | $— | |||||||
| Equity | Written Equity Options | — | (21,569 | ) | ||||||
| Total | $86,156 | $(21,569 | ) | |||||||
| (a) | The value of purchased options outstanding is included in total investments, at value, within the fund’s Statement of Assets and Liabilities. |
15
Table of Contents
MFS Technology Portfolio
Notes to Financial Statements – continued
The following table presents, by major type of derivative contract, the realized gain (loss) on derivatives held by the fund for the year ended December 31, 2011 as reported in the Statement of Operations:
| Risk | Investment Transactions (Purchased Options) | Written Options | ||||||
| Equity | $149,269 | $225,005 | ||||||
The following table presents, by major type of derivative contract, the change in unrealized appreciation (depreciation) on derivatives held by the fund for the year ended December 31, 2011 as reported in the Statement of Operations:
| Risk | Investments (Purchased Options) | Written Options | ||||||
| Equity | $112,766 | $(8,800 | ) | |||||
Derivative counterparty credit risk is managed through formal evaluation of the creditworthiness of all potential counterparties. On certain over-the-counter derivatives, the fund attempts to reduce its exposure to counterparty credit risk whenever possible by entering into an International Swaps and Derivatives Association (ISDA) Master Agreement on a bilateral basis with each of the counterparties with whom it undertakes a significant volume of transactions. The ISDA Master Agreement gives each party to the agreement the right to terminate all transactions traded under such agreement if there is a certain deterioration in the credit quality of the other party. The ISDA Master Agreement gives the fund the right, upon an event of default by the applicable counterparty or a termination of the agreement, to close out all transactions traded under such agreement and to net amounts owed under each transaction to one net amount payable by one party to the other. This right to close out and net payments across all transactions traded under the ISDA Master Agreement could result in a reduction of the fund’s credit risk to such counterparty equal to any amounts payable by the fund under the applicable transactions, if any. However, absent an event of default by the counterparty or a termination of the agreement, the ISDA Master Agreement does not result in an offset of reported amounts of assets and liabilities in the Statement of Assets and Liabilities across transactions between the fund and the applicable counterparty.
Collateral requirements differ by type of derivative. Collateral or margin requirements are set by the broker or exchange clearing house for exchange traded derivatives (i.e., futures and exchange-traded options) while collateral terms are contract specific for over-the-counter traded derivatives (i.e., forward foreign currency exchange contracts, swaps and over-the-counter options). For derivatives traded under an ISDA Master Agreement, the collateral requirements are netted across all transactions traded under such agreement and one amount is posted from one party to the other to collateralize such obligations. Cash collateral that has been pledged to cover obligations of the fund under derivative contracts, if any, will be reported separately on the Statement of Assets and Liabilities as restricted cash. Securities collateral pledged for the same purpose, if any, is noted in the Portfolio of Investments.
Written Options – In exchange for a premium, the fund wrote call options on securities that it anticipated the price would decline and also wrote put options on securities that it anticipated the price would increase. At the time the option was written, the fund believed the premium received exceeded the potential loss that could result from adverse price changes in the options’ underlying securities. In a written option, the fund as the option writer grants the buyer the right to purchase from, or sell to, the fund a specified number of shares or units of a particular security, currency or index at a specified price within a specified period of time.
The premium received is initially recorded as a liability on the Statement of Assets and Liabilities. The option is subsequently marked-to-market daily with the difference between the premium received and the market value of the written option being recorded as unrealized appreciation or depreciation. When a written option expires, the fund realizes a gain equal to the amount of the premium received. The difference between the premium received and the amount paid on effecting a closing transaction is considered a realized gain or loss. When a written call option is exercised, the premium received is offset against the proceeds to determine the realized gain or loss. When a written put option is exercised, the premium reduces the cost basis of the security purchased by the fund.
At the initiation of the written option contract, for exchange traded options, the fund is required to deposit securities or cash as collateral with the custodian for the benefit of the broker. For over-the-counter options, the fund may post collateral subject to the terms of an ISDA Master Agreement as generally described above if the market value of the options contract moves against it. The fund, as writer of an option, may have no control over whether the underlying securities may be sold (call) or purchased (put) and, as a result, bears the market risk of an unfavorable change in the price of the securities underlying the written option. Losses from writing options can exceed the premium received and can exceed the potential loss from an ordinary buy
16
Table of Contents
MFS Technology Portfolio
Notes to Financial Statements – continued
and sell transaction. Although the fund’s market risk may be significant, the maximum counterparty credit risk to the fund is equal to the market value of any collateral posted to the broker. For over-the-counter options, this risk is mitigated in cases where there is an ISDA Master Agreement between the fund and the counterparty providing for netting as described above.
Written Option Transactions
| Number of contracts | Premiums received | |||||||
| Outstanding, beginning of period | 1,352 | $59,762 | ||||||
| Options written | 13,494 | 615,927 | ||||||
| Options closed | (4,533 | ) | (270,353 | ) | ||||
| Options exercised | (2,146 | ) | (105,584 | ) | ||||
| Options expired | (7,612 | ) | (280,958 | ) | ||||
| Outstanding, end of period | 555 | $18,794 | ||||||
Purchased Options – The fund purchased call and put options for a premium. Purchased call and put options entitle the holder to buy and sell a specified number of shares or units of a particular security, currency or index at a specified price at a specified date or within a specified period of time. Purchasing call options may be used to hedge against an anticipated increase in the dollar cost of securities or currency to be acquired or to increase the fund’s exposure to an underlying instrument. Purchasing put options may hedge against a decline in the value of portfolio securities or currency.
The premium paid is initially recorded as an investment in the Statement of Assets and Liabilities. That investment is subsequently marked-to-market daily with the difference between the premium paid and the market value of the purchased option being recorded as unrealized appreciation or depreciation. Premiums paid for purchased call and put options which have expired are treated as realized losses on investments in the Statement of Operations. Upon the exercise or closing of a purchased call option, the premium paid is added to the cost of the security or financial instrument. Upon the exercise or closing of a purchased put option, the premium paid is offset against the proceeds on the sale of the underlying security or financial instrument in order to determine the realized gain or loss on investments.
The risk in purchasing an option is that the fund pays a premium whether or not the option is exercised. The fund’s maximum risk of loss due to counterparty credit risk is limited to the market value of the option. For over-the-counter options, this risk is mitigated in cases where there is an ISDA Master Agreement between the fund and the counterparty providing for netting as described above and for posting of collateral by the counterparty to the fund to cover the fund’s exposure to the counterparty under such ISDA Master Agreement.
Short Sales – The fund entered into short sales whereby it sells a security it does not own in anticipation of a decline in the value of that security. The fund will realize a gain if the security price decreases and a loss if the security price increases between the date of the short sale and the date on which the fund replaces the borrowed security. Losses from short sales can exceed the proceeds of the security sold; and they can also exceed the potential loss from an ordinary buy and sell transaction. The amount of any premium, dividends, or interest the fund may be required to pay in connection with a short sale will be recognized as a fund expense. During the year ended December 31, 2011, this expense amounted to $20,086. The fund segregates cash or marketable securities in an amount that, when combined with the amount of proceeds from the short sale deposited with the broker, at least equals the current market value of the security sold short.
Indemnifications – Under the fund’s organizational documents, its officers and Trustees may be indemnified against certain liabilities and expenses arising out of the performance of their duties to the fund. Additionally, in the normal course of business, the fund enters into agreements with service providers that may contain indemnification clauses. The fund’s maximum exposure under these agreements is unknown as this would involve future claims that may be made against the fund that have not yet occurred.
Investment Transactions and Income – Investment transactions are recorded on the trade date. Interest income is recorded on the accrual basis. All premium and discount is amortized or accreted for financial statement purposes in accordance with U.S. generally accepted accounting principles. Dividends received in cash are recorded on the ex-dividend date. Certain dividends from foreign securities will be recorded when the fund is informed of the dividend if such information is obtained subsequent to the ex-dividend date. Dividend and interest payments received in additional securities are recorded on the ex-dividend or ex-interest date in an amount equal to the value of the security on such date.
The fund may receive proceeds from litigation settlements. Any proceeds received from litigation involving portfolio holdings are reflected in the Statement of Operations in realized gain/loss if the security has been disposed of by the fund or in unrealized gain/loss if the security is still held by the fund. Any other proceeds from litigation not related to portfolio holdings are reflected as other income in the Statement of Operations.
17
Table of Contents
MFS Technology Portfolio
Notes to Financial Statements – continued
Fees Paid Indirectly – The fund’s custody fee may be reduced according to an arrangement that measures the value of cash deposited with the custodian by the fund. This amount, for the year ended December 31, 2011, is shown as a reduction of total expenses on the Statement of Operations.
Tax Matters and Distributions – The fund intends to qualify as a regulated investment company, as defined under Subchapter M of the Internal Revenue Code, and to distribute all of its taxable income, including realized capital gains. As a result, no provision for federal income tax is required. The fund’s federal tax returns for the prior three fiscal years remain subject to examination by the Internal Revenue Service. Foreign taxes have been accrued by the fund in the accompanying financial statements.
Distributions to shareholders are recorded on the ex-dividend date. Income and capital gain distributions are determined in accordance with income tax regulations, which may differ from U.S. generally accepted accounting principles. Certain capital accounts in the financial statements are periodically adjusted for permanent differences in order to reflect their tax character. These adjustments have no impact on net assets or net asset value per share. Temporary differences which arise from recognizing certain items of income, expense, gain or loss in different periods for financial statement and tax purposes will reverse at some time in the future. Distributions in excess of net investment income or net realized gains are temporary overdistributions for financial statement purposes resulting from differences in the recognition or classification of income or distributions for financial statement and tax purposes.
Book/tax differences primarily relate to net operating losses, wash sale loss deferrals, and straddle loss deferrals.
The fund declared no distributions for the years ended December 31, 2011 and December 31, 2010.
The federal tax cost and the tax basis components of distributable earnings were as follows:
| As of 12/31/11 | ||||
| Cost of investments | $29,302,596 | |||
| Gross appreciation | 2,024,645 | |||
| Gross depreciation | (1,846,895 | ) | ||
| Net unrealized appreciation (depreciation) | $177,750 | |||
| Capital loss carryforwards | (2,154,117 | ) | ||
| Other temporary differences | (65,226 | ) |
Under the Regulated Investment Company Modernization Act of 2010 (the “Act”), net capital losses recognized after December 31, 2010 may be carried forward indefinitely, and their character is retained as short-term and/or long-term losses. Previously, net capital losses were carried forward for eight years and treated as short-term losses. As a transition rule, the Act requires that post-enactment net capital losses be used before pre-enactment net capital losses.
As of December 31, 2011, the fund had capital loss carryforwards available to offset future realized gains. Such losses expire as follows:
| Pre-enactment losses: | ||||
| 12/31/16 | $(1,010,091 | ) | ||
| 12/31/17 | (1,144,026 | ) | ||
| Total | $(2,154,117 | ) |
Multiple Classes of Shares of Beneficial Interest – The fund offers multiple classes of shares, which differ in their respective distribution and/or service fees. The fund’s income, realized and unrealized gain (loss), and common expenses are allocated to shareholders based on the daily net assets of each class. Dividends are declared separately for each class. Differences in per share dividend rates are generally due to differences in separate class expenses.
| (3) | Transactions with Affiliates |
Investment Adviser – The fund has an investment advisory agreement with MFS to provide overall investment management and related administrative services and facilities to the fund. The management fee is computed daily and paid monthly at the following annual rates:
| First $1 billion of average daily net assets | 0.75% | |||
| Average daily net assets in excess of $1 billion | 0.70% |
The management fee incurred for the year ended December 31, 2011 was equivalent to an annual effective rate of 0.75% of the fund’s average daily net assets.
The investment adviser has agreed in writing to pay a portion of the fund’s total annual operating expenses, exclusive of interest, taxes, extraordinary expenses, brokerage and transaction costs and investment-related expenses (such as short sale
18
Table of Contents
MFS Technology Portfolio
Notes to Financial Statements – continued
dividend and interest expenses incurred in connection with the fund’s investment activity), such that total annual operating expenses do not exceed 1.00% of average daily net assets for the Initial Class shares and 1.25% of average daily net assets for the Service Class shares. This written agreement will continue until April 30, 2013. For the year ended December 31, 2011, this reduction amounted to $52,953 and is reflected as a reduction of total expenses in the Statements of Operations.
Distributor – MFS Fund Distributors, Inc. (MFD), a wholly-owned subsidiary of MFS, is the distributor of shares of the fund. The Trustees have adopted a distribution plan for the Service Class shares pursuant to Rule 12b-1 under the Investment Company Act of 1940.
The fund’s distribution plan provides that the fund will pay MFD distribution and/or service fees equal to 0.25% per annum of its average daily net assets attributable to Service Class shares as partial consideration for services performed and expenses incurred by MFD and financial intermediaries (including participating insurance companies that invest in the fund to fund variable annuity and variable life insurance contracts, sponsors of qualified retirement and pension plans that invest in the fund, and affiliates of these participating insurance companies and plan sponsors) in connection with the sale and distribution of the Service Class shares. MFD may subsequently pay all, or a portion, of the distribution and/or service fees to financial intermediaries.
Shareholder Servicing Agent – MFS Service Center, Inc. (MFSC), a wholly-owned subsidiary of MFS, receives a fee from the fund for its services as shareholder servicing agent. For the year ended December 31, 2011, the fee was $2,821, which equated to 0.0108% annually of the fund’s average daily net assets. MFSC also receives payment from the fund for out-of-pocket expenses paid by MFSC on behalf of the fund. For the year ended December 31, 2011, these costs amounted to $7.
Administrator – MFS provides certain financial, legal, shareholder communications, compliance, and other administrative services to the fund. Under an administrative services agreement, the fund partially reimburses MFS the costs incurred to provide these services. The fund is charged an annual fixed amount of $17,500 plus a fee based on average daily net assets. The administrative services fee incurred for the year ended December 31, 2011 was equivalent to an annual effective rate of 0.0670% of the fund’s average daily net assets.
Trustees’ and Officers’ Compensation – The fund pays compensation to Trustees in the form of a retainer, attendance fees, and additional compensation to the Board chairperson. The fund does not pay compensation directly to officers of the fund who are also officers of the investment adviser, all of whom receive remuneration for their services to the fund from MFS. Certain officers of the fund are officers or directors of MFS, MFD, and MFSC.
Other – This fund and certain other funds managed by MFS (the funds) have entered into services agreements (the Agreements) which provide for payment of fees by the funds to Tarantino LLC and Griffin Compliance LLC in return for the provision of services of an Independent Chief Compliance Officer (ICCO) and Assistant ICCO, respectively, for the funds. The ICCO and Assistant ICCO are officers of the funds and the sole members of Tarantino LLC and Griffin Compliance LLC, respectively. The funds can terminate the Agreements with Tarantino LLC and Griffin Compliance LLC at any time under the terms of the Agreements. MFS has agreed to bear all expenses associated with office space, other administrative support, and supplies provided to the ICCO and Assistant ICCO. For the year ended December 31, 2011, the aggregate fees paid by the fund to Tarantino LLC and Griffin Compliance LLC were $429 and are included in miscellaneous expense on the Statement of Operations.
The fund invests in the MFS Institutional Money Market Portfolio which is managed by MFS and seeks a high level of current income consistent with preservation of capital and liquidity. Income earned on this investment is included in dividends from underlying affiliated funds on the Statement of Operations. This money market fund does not pay a management fee to MFS.
| (4) | Portfolio Securities |
Purchases and sales of investments, other than U.S. Government securities, purchased option transactions, short sales, and short-term obligations, aggregated $31,550,393 and $23,473,256, respectively.
19
Table of Contents
MFS Technology Portfolio
Notes to Financial Statements – continued
| (5) | Shares of Beneficial Interest |
The fund’s Declaration of Trust permits the Trustees to issue an unlimited number of full and fractional shares of beneficial interest. Transactions in fund shares were as follows:
| Year ended 12/31/11 | Year ended 12/31/10 | |||||||||||||||
| Shares | Amount | Shares | Amount | |||||||||||||
| Shares sold | ||||||||||||||||
Initial Class | 293,666 | $2,055,628 | 264,700 | $1,607,870 | ||||||||||||
Service Class | 1,982,378 | 13,664,728 | 719,608 | 4,429,714 | ||||||||||||
| 2,276,044 | $15,720,356 | 984,308 | $6,037,584 | |||||||||||||
| Shares reacquired | ||||||||||||||||
Initial Class | (502,515 | ) | $(3,535,100 | ) | (511,495 | ) | $(3,035,186 | ) | ||||||||
Service Class | (649,475 | ) | (4,493,812 | ) | (192,036 | ) | (1,111,522 | ) | ||||||||
| (1,151,990 | ) | $(8,028,912 | ) | (703,531 | ) | $(4,146,708 | ) | |||||||||
| Net change | ||||||||||||||||
Initial Class | (208,849 | ) | $(1,479,472 | ) | (246,795 | ) | $(1,427,316 | ) | ||||||||
Service Class | 1,332,903 | 9,170,916 | 527,572 | 3,318,192 | ||||||||||||
| 1,124,054 | $7,691,444 | 280,777 | $1,890,876 | |||||||||||||
| (6) | Line of Credit |
The fund and certain other funds managed by MFS participate in a $1.1 billion unsecured committed line of credit, subject to a $1 billion sublimit, provided by a syndication of banks under a credit agreement. Borrowings may be made for temporary financing needs. Interest is charged to each fund, based on its borrowings, generally at a rate equal to the higher of the Federal Reserve funds rate or one month LIBOR plus an agreed upon spread. A commitment fee, based on the average daily, unused portion of the committed line of credit, is allocated among the participating funds at the end of each calendar quarter. In addition, the fund and other funds managed by MFS have established unsecured uncommitted borrowing arrangements with certain banks for temporary financing needs. Interest is charged to each fund, based on its borrowings, at a rate equal to the Federal Reserve funds rate plus an agreed upon spread. For the year ended December 31, 2011, the fund’s commitment fee and interest expense were $198 and $0, respectively, and are included in miscellaneous expense on the Statement of Operations.
| (7) | Transactions in Underlying Affiliated Funds – Affiliated Issuers |
An affiliated issuer may be considered one in which the fund owns 5% or more of the outstanding voting securities, or a company which is under common control. For the purposes of this report, the fund assumes the following to be affiliated issuers:
| Underlying Affiliated Funds | Beginning Shares/Par Amount | Acquisitions Shares/Par Amount | Dispositions Shares/Par Amount | Ending Shares/Par Amount | ||||||||||||
| MFS Institutional Money Market Portfolio | 166,838 | 17,282,111 | (16,905,073 | ) | 543,876 | |||||||||||
| Underlying Affiliated Funds | Realized Gain (Loss) | Capital Gain Distributions | Dividend Income | Ending Value | ||||||||||||
| MFS Institutional Money Market Portfolio | $— | $— | $289 | $543,876 | ||||||||||||
20
Table of Contents
MFS Technology Portfolio
REPORT OF INDEPENDENT REGISTERED PUBLIC ACCOUNTING FIRM
To the Board of Trustees of MFS Variable Insurance Trust II and the Shareholders of
MFS Technology Portfolio:
We have audited the accompanying statement of assets and liabilities, including the portfolio of investments, of MFS Technology Portfolio (the “Fund”) (one of the portfolios comprising MFS Variable Insurance Trust II) as of December 31, 2011, and the related statement of operations for the year then ended, the statements of changes in net assets for each of the two years in the period then ended, and the financial highlights for each of the five years in the period then ended. These financial statements and financial highlights are the responsibility of the Fund’s management. Our responsibility is to express an opinion on these financial statements and financial highlights based on our audits.
We conducted our audits in accordance with the standards of the Public Company Accounting Oversight Board (United States). Those standards require that we plan and perform the audit to obtain reasonable assurance about whether the financial statements and financial highlights are free of material misstatement. The Fund is not required to have, nor were we engaged to perform, an audit of its internal control over financial reporting. Our audits included consideration of internal control over financial reporting as a basis for designing audit procedures that are appropriate in the circumstances, but not for the purpose of expressing an opinion on the effectiveness of the Fund’s internal control over financial reporting. Accordingly, we express no such opinion. An audit also includes examining, on a test basis, evidence supporting the amounts and disclosures in the financial statements, assessing the accounting principles used and significant estimates made by management, as well as evaluating the overall financial statement presentation. Our procedures included confirmation of securities owned as of December 31, 2011, by correspondence with the custodian and brokers; where replies were not received from brokers, we performed other auditing procedures. We believe that our audits provide a reasonable basis for our opinion.
In our opinion, the financial statements and financial highlights referred to above present fairly, in all material respects, the financial position of MFS Technology Portfolio as of December 31, 2011, the results of its operations for the year then ended, the changes in its net assets for each of the two years in the period then ended, and the financial highlights for each of the five years in the period then ended, in conformity with accounting principles generally accepted in the United States of America.
DELOITTE & TOUCHE LLP
Boston, Massachusetts
February 15, 2012
21
Table of Contents
MFS Technology Portfolio
RESULTS OF SHAREHOLDER MEETING (unaudited)
At a special meeting of shareholders of MFS Technology Portfolio, which was held on December 1, 2011, the following actions were taken for which shareholders of all series of MFS Variable Insurance Trust II voted together as a single class with respect to Item 1 and shareholders of MFS Technology Portfolio voted as a separate class with respect to Items 2 and 3:
Item 1: Election of ten Trustees as members of the Board of Trustees of the Trust effective January 1, 2012:
| Number of Shares | ||||||||
| For | Withheld Authority | |||||||
| Robert E. Butler | 681,916,712.8686 | 46,472,894.9218 | ||||||
| Maureen R. Goldfarb | 682,835,794.8512 | 45,553,812.9392 | ||||||
| David H. Gunning | 681,500,267.3085 | 46,889,340.4819 | ||||||
| William R. Gutow | 681,050,223.5547 | 47,339,384.2357 | ||||||
| Michael Hegarty | 682,477,088.8584 | 45,912,518.9320 | ||||||
| John P. Kavanaugh | 683,794,425.4269 | 44,595,182.3635 | ||||||
| Robert J. Manning | 682,699,559.7374 | 45,690,048.0530 | ||||||
| J. Dale Sherratt | 681,362,743.0513 | 47,026,864.7391 | ||||||
| Laurie J. Thomsen | 683,408,094.0000 | 44,981,513.7904 | ||||||
| Robert W. Uek | 681,424,852.0247 | 46,964,755.7657 | ||||||
Item 2: To approve a new investment advisory agreement dated January 1, 2012, between the Trust, on behalf of MFS Technology Portfolio, and MFS:
| Number of Shares | ||||||||||||
| For | Against | Withheld Authority | ||||||||||
| 3,311,824.9445 | 315,544.3581 | 200,347.4790 | ||||||||||
Item 3: To approve revisions to and restatements of certain fundamental investment restrictions of MFS Technology Portfolio effective January 1, 2012 as detailed below:
| Number of Shares | ||||||||||||||
| For | Against | Withheld Authority | ||||||||||||
| A. | Borrowing | 3,181,959.0400 | 408,797.3626 | 236,960.3790 | ||||||||||
| B. | Underwriting Securities | 3,307,329.5075 | 290,456.8125 | 229,930.4616 | ||||||||||
| C. | Issuance of Senior Securities | 3,368,522.9396 | 229,852.6923 | 229,341.1497 | ||||||||||
| D. | Lending of Money or Securities | 3,280,429.8087 | 314,390.7426 | 232,896.2303 | ||||||||||
| E. | Purchases or Sales of Real Estate; Interests in Oil, Gas or Mineral Leases; and Commodities | 3,388,705.0310 | 209,770.8818 | 229,240.8688 | ||||||||||
| F. | Industry Concentration | 3,374,644.7690 | 209,677.3260 | 243,394.6866 | ||||||||||
22
Table of Contents
MFS Technology Portfolio
TRUSTEES AND OFFICERS – IDENTIFICATION AND BACKGROUND
The Trustees and officers of the Trust, as of February 1, 2012, are listed below, together with their principal occupations during the past five years. (Their titles may have varied during that period.) The address of each Trustee and officer is 500 Boylston Street, Boston, Massachusetts 02116.
Name, Age | Position(s) with Fund | Trustee/Officer Since (h) | Principal Occupations | Other Directorships (j) | ||||
| INTERESTED TRUSTEES | ||||||||
Robert J. Manning (k) (age 48) | Trustee | February 2004 | Massachusetts Financial Services Company, Chairman, Chief Executive Officer and Director; President (until December 2009); Chief Investment Officer (until July 2010) | N/A | ||||
| INDEPENDENT TRUSTEES | ||||||||
David H. Gunning (age 69) | Trustee and Chair of Trustees | January 2004 | Retired; Cleveland-Cliffs Inc. (mining products and service provider), Vice Chairman/Director (until May 2007) | Lincoln Electric Holdings, Inc. (welding equipment manufacturer), Director; Development Alternatives, Inc. (consulting), Director/Non-Executive Chairman; Portman Limited (mining), Director (until 2008) | ||||
Robert E. Butler (age 70) | Trustee | January 2006 | Consultant – investment company industry regulatory and compliance matters | N/A | ||||
Maureen R. Goldfarb (age 56) | Trustee | January 2009 | Private investor | N/A | ||||
William R. Gutow (age 70) | Trustee | December 1993 | Private investor and real estate consultant; Capitol Entertainment Management Company (video franchise), Vice Chairman | Atlantic Coast Tan (tanning salons), Vice Chairman (until 2007); Texas Donuts (donut franchise), Vice Chairman (until 2010) | ||||
Michael Hegarty (age 67) | Trustee | December 2004 | Private investor | N/A | ||||
John P. Kavanaugh (age 57) | Trustee | January 2009 | Private investor; The Hanover Insurance Group, Inc., Vice President and Chief Investment Officer (until 2006); Allmerica Investment Trust, Allmerica Securities Trust and Opus Investment Trust (investment companies), Chairman, President and Trustee (until 2006) | N/A | ||||
J. Dale Sherratt (age 73) | Trustee | June 1989 | Insight Resources, Inc. (acquisition planning specialists), President; Wellfleet Investments (investor in health care companies), Managing General Partner | N/A | ||||
Laurie J. Thomsen (age 54) | Trustee | March 2005 | Private investor; New Profit, Inc. (venture philanthropy), Executive Partner (until 2010) | The Travelers Companies (property and casualty insurance), Director | ||||
Robert W. Uek (age 70) | Trustee | January 2006 | Consultant to investment company industry | N/A | ||||
| OFFICERS | ||||||||
John M. Corcoran (k) (age 46) | President | October 2008 | Massachusetts Financial Services Company, Senior Vice President (since October 2008); State Street Bank and Trust (financial services provider), Senior Vice President, (until September 2008) | N/A | ||||
| Christopher R. Bohane (k) (age 38) | Assistant Secretary and Assistant Clerk | July 2005 | Massachusetts Financial Services Company, Vice President and Senior Counsel | N/A | ||||
Kino Clark (k) (age 43) | Assistant Treasurer | January 2012 | Massachusetts Financial Services Company, Assistant Vice President | N/A | ||||
23
Table of Contents
MFS Technology Portfolio
Trustees and Officers – continued
Name, Age | Position(s) with Fund | Trustee/Officer Since (h) | Principal Occupations | Other Directorships (j) | ||||
Ethan D. Corey (k) (age 48) | Assistant Secretary and Assistant Clerk | July 2005 | Massachusetts Financial Services Company, Senior Vice President and Associate General Counsel | N/A | ||||
David L. DiLorenzo (k) (age 43) | Treasurer | July 2005 | Massachusetts Financial Services Company, Vice President | N/A | ||||
Robyn L. Griffin (age 36) | Assistant Independent Chief Compliance Officer | August 2008 | Griffin Compliance LLC (provider of compliance services), Principal (since August 2008); State Street Corporation (financial services provider), Mutual Fund Administration Assistant Vice President (October 2006 – July 2008); Liberty Mutual Group (insurance), Personal Market Assistant Controller (April 2006 – October 2006); Deloitte & Touche LLP (professional services firm). | N/A | ||||
Brian E. Langenfeld (k) (age 38) | Assistant Secretary and Assistant Clerk | June 2006 | Massachusetts Financial Services Company, Vice President and Senior Counsel | N/A | ||||
Ellen Moynihan (k) (age 54) | Assistant Treasurer | April 1997 | Massachusetts Financial Services Company, Senior Vice President | N/A | ||||
Susan S. Newton (k) (age 61) | Assistant Secretary and Assistant Clerk | May 2005 | Massachusetts Financial Services Company, Senior Vice President and Associate General Counsel | N/A | ||||
Susan A. Pereira (k) (age 41) | Assistant Secretary and Assistant Clerk | July 2005 | Massachusetts Financial Services Company, Vice President and Senior Counsel | N/A | ||||
Mark N. Polebaum (k) (age 59) | Secretary and Clerk | January 2006 | Massachusetts Financial Services Company, Executive Vice President, General Counsel and Secretary | N/A | ||||
Frank L. Tarantino (age 67) | Independent Chief Compliance Officer | June 2004 | Tarantino LLC (provider of compliance services), Principal | N/A | ||||
Richard S. Weitzel (k) (age 41) | Assistant Secretary and Assistant Clerk | October 2007 | Massachusetts Financial Services Company, Vice President and Assistant General Counsel | N/A | ||||
James O. Yost (k) (age 51) | Deputy Treasurer | September 1990 | Massachusetts Financial Services Company, Senior Vice President | N/A | ||||
| (h) | Date first appointed to serve as Trustee/officer of an MFS fund. Each Trustee has served continuously since appointment unless indicated otherwise. For the period from December 15, 2004 until February 22, 2005, Mr. Manning served as Advisory Trustee. For the period October 2008, until January 2012, Mr. Corcoran served as Treasurer of the Funds. Prior to January 2012, Messrs. DiLorenzo and Yost served as Assistant Treasurers of the Funds. |
| (j) | Directorships or trusteeships of companies required to report to the Securities and Exchange Commission (i.e., “public companies”). |
| (k) | “Interested person” of the Trust within the meaning of the Investment Company Act of 1940 (referred to as the 1940 Act), which is the principal federal law governing investment companies like the fund, as a result of position with MFS. The address of MFS is 500 Boylston Street, Boston, Massachusetts 02116. |
Each Trustee has been elected by shareholders and each Trustee and officer holds office until his or her successor is chosen and qualified or until his or her earlier death, resignation, retirement or removal. The Trust does not hold annual meetings for the purpose of electing Trustees, and Trustees are not elected for fixed terms. Messrs. Butler, Kavanaugh, Uek and Ms. Thomsen are members of the Trust’s Audit Committee.
Each of the Fund’s Trustees and officers holds comparable positions with certain other funds of which MFS or a subsidiary is the investment adviser or distributor, and, in the case of the officers, with certain affiliates of MFS. As of January 1, 2012, the Trustees served as board members of 131 funds within the MFS Family of Funds.
24
Table of Contents
MFS Technology Portfolio
Trustees and Officers – continued
The Statement of Additional Information for the Fund includes further information about the Trustees and is available without charge upon request by calling 1-800-225-2606.
Investment Adviser Massachusetts Financial Services Company 500 Boylston Street, Boston, MA 02116-3741 | Custodian State Street Bank and Trust 1 Lincoln Street, Boston, MA 02111-2900 | |
Distributor MFS Fund Distributors, Inc. 500 Boylston Street, Boston, MA 02116-3741 | Independent Registered Public Accounting Firm Deloitte & Touche LLP 200 Berkeley Street, Boston, MA 02116 | |
Portfolio Manager Matthew Sabel |
25
Table of Contents
MFS Technology Portfolio
At a special meeting of shareholders of the MFS Technology Portfolio (hereinafter referred to as the “Fund” or the “Portfolio”), which was held on December 1, 2011, the shareholders approved a new investment advisory agreement based on the recommendation of the Board of Trustees. At its July, 2011 meeting, the Board of Trustees (i) approved, and recommended for shareholder approval, the new investment advisory agreement effective January 1, 2012, and (ii) the continuation of the existing investment advisory agreement effective September 1, 2011. The following includes a description of the factors that the Board of Trustees considered and the conclusions that formed the basis of their approval of both the new investment advisory agreement and the continuation of the prior investment advisory agreement.
BOARD APPROVAL OF NEW INVESTMENT ADVISORY AGREEMENT
The Investment Company Act of 1940 requires that both the full Board of Trustees and a majority of the non-interested (“independent”) Trustees, voting separately, initially approve the new investment advisory agreement (the “New Agreement”) between Massachusetts Financial Services Company (“MFS”) and MFS Variable Insurance Trust II (the “Trust”) on behalf of the Portfolio and, beginning on the second anniversary of the initial effective date of the New Agreement, annually approve the continuation of the New Agreement. The Trustees have considered matters bearing on the Portfolio and the then current advisory arrangement at their meetings throughout the year, including a review of performance data at each regular meeting. In addition, the independent Trustees met in person in July 2011 to consider the initial approval of the New Agreement, and to recommend that shareholders approve the New Agreement. The independent Trustees were assisted in their evaluation of the New Agreement by independent legal counsel, from whom they received separate legal advice and with whom they met separately from MFS management. The independent Trustees were also assisted in this process by the Portfolio’s Independent Chief Compliance Officer, a full-time senior officer appointed by and reporting to the independent Trustees.
In connection with their deliberations regarding the initial approval of the New Agreement, the Trustees, including the independent Trustees, considered such information and factors as they believed, in light of the legal advice furnished to them and their own business judgment, to be relevant. The New Agreement was considered separately for the series of the Trust (collectively, the “Portfolios”), although the Trustees also took into account the common interests of all Portfolios in the Trust in their review. As described below, the Trustees considered the nature, quality, and extent of the various investment advisory, administrative, and/or shareholder services to be performed by MFS under the New Agreement and other arrangements with the Trust.
In connection with their initial review meeting, the Trustees received and relied upon materials that included, among other items: (i) information provided by MFS on the advisory fees of comparable portfolios of its other clients, including institutional separate account and other clients, (ii) information as to whether, and to what extent applicable, expense waivers, reimbursements or fee “breakpoints” would be observed for the Portfolio under the New Agreement, and (iii) a comparison and summary of the differences in the provisions in the New Agreement compared to those in each of the then current investment advisory agreements for the Portfolios. In addition, in connection with the independent Trustees’ meetings in May and July, 2011 (the “contract review meetings”) for the purpose of considering whether to approve the continuation of the then current investment advisory agreements for the Portfolio, the independent Trustees received: (1) information provided by Lipper Inc. (“Lipper”) on the investment performance of the Portfolio for various time periods ended December 31, 2010, compared to the investment performance of a group of funds with substantially similar investment classifications/objectives (the “Lipper performance universe”), (2) information provided by Lipper on the Portfolio’s advisory fees and other expenses compared to the advisory fees and other expenses of comparable funds identified by Lipper (the “Lipper expense group”), (3) information regarding MFS’ financial results and financial condition, including MFS’ and certain of its affiliates’ estimated profitability from services performed for the Portfolio, (4) MFS’ views regarding the outlook for the mutual fund industry and its strategic business plans, (5) descriptions of various functions performed by MFS for the Trust, such as compliance monitoring and portfolio trading practices, and (6) information regarding the overall organization of MFS, including information about MFS’ senior management and other personnel providing investment advisory, administrative and other services to the Portfolio. The comparative performance, fee and expense information prepared and provided by Lipper was not independently verified, and the independent Trustees did not independently verify any information provided to them by MFS.
The Trustees’ conclusion as to the initial approval of the New Agreement was based on comprehensive consideration of all information provided to the Trustees and was not the result of any single factor. Some of the factors that figured particularly in the Trustees’ deliberations are described below for the Portfolio, while individual Trustees may have given different weight to various factors and evaluated the information presented as a whole differently than another individual Trustee. The Trustees recognized that the fee arrangements for the Portfolio could reflect years of review and discussion between the independent Trustees and MFS, that certain aspects of such arrangements may receive greater scrutiny in some years than others, and that
26
Table of Contents
MFS Technology Portfolio
Board Approval of New Investment Advisory Agreement – continued
the Trustees’ conclusions may be based, in part, on their consideration of these same arrangements during the course of the year and in prior years.
Because the portfolio management team managing the Portfolio’s investments under the then current investment advisory agreement will remain the same under the New Agreement for the Portfolio, the Trustees compared the Portfolio’s total return investment performance to the performance of its Lipper performance universe over various time periods, based on information provided by Lipper. The Trustees placed particular emphasis on the total return performance of the Portfolio’s Initial Class shares in comparison to the performance of funds in its Lipper performance universe over the one-, three- and five-year periods ended December 31, 2010. The Trustees did not rely on performance results for more recent periods.
The Trustees noted the performance of the Portfolio’s Initial Class shares was in the 3rd quintile relative to the other funds in the Lipper performance universe for the one-year period (the 1st quintile being the best performers and the 5th quintile being the worst performers). The total return performance of the Portfolio was in the 3rd quintile for the three-year period and in the 1st quintile for the five-year period ended December 31, 2010, relative to the Lipper performance universe. Based on the nature and quality of services provided by MFS, the Board of Trustees concluded that the Portfolio’s performance was satisfactory.
In the course of their deliberations, the Trustees took into account information provided by MFS during contract review meetings, as well as during investment review meetings conducted with portfolio management personnel during the course of the year. For Portfolios whose performance lagged their peer groups, they discussed the factors that contributed thereto and MFS’ efforts to improve such Portfolios’ performance. After reviewing this information, the Trustees concluded, within the context of their overall conclusions regarding the New Agreement, that they were satisfied with MFS’ responses and efforts relating to investment performance.
In assessing the reasonableness of the Portfolio’s advisory fee, the Trustees considered, among other information, the Portfolio’s advisory fee and the total expense ratio of the Portfolio’s Initial Class shares as a percentage of average daily net assets, compared to the advisory fee and total expense ratios of its peer group of funds based on information provided by Lipper. The Trustees also considered the advisory fees charged by MFS to institutional accounts. In comparing these fees, the Trustees considered the generally broader scope of services provided by MFS to the Trust than those provided to institutional accounts. The Trustees also considered the higher demands placed on MFS’ investment personnel and trading infrastructure as a result of the daily cash in-flows and out-flows of the Portfolio, and the impact on MFS and related expenses due to the more extensive regulatory regime to which the Portfolio is subject, compared to institutional accounts.
In considering the fees, the Trustees noted from the Lipper data that the Portfolio’s effective advisory fee rate was below the median and total expense ratio was approximately at the median of such fees and expenses of funds in the Lipper expense group. In addition, the Trustees accepted MFS’ offer to continue the expense limitation for the Portfolio. The Trustees further noted that the New Agreement would reflect MFS’ agreement to reduce the advisory fee on average daily net assets over $1 billion on a permanent basis, and concluded that the breakpoint was sufficient to allow the Portfolio to benefit from economies of scale as its assets grow. The Trustees concluded that the fees were reasonable in light of the nature and quality of services provided.
The Trustees also considered whether the Portfolio is likely to benefit from any economies of scale due to future asset growth. In this regard, the Trustees reviewed the adequacy of breakpoints and discussed with MFS any adjustments necessary for the shareholders’ benefit.
The Trustees also considered information prepared by MFS relating to its costs and profits with respect to the Portfolio and other investment companies and accounts advised by MFS, as well as MFS’ methodologies used to determine and allocate its costs to the Portfolio and other accounts and products for purposes of estimating profitability.
The Trustees noted that there would be no increase to the net advisory fee arrangement for the Portfolio under the New Agreement when compared to the Portfolio’s then current investment advisory agreement. After reviewing these and other factors described below, the Trustees concluded that the advisory fees charged to the Portfolio under the New Agreement represent reasonable compensation in light of the nature and quality of the services being provided by MFS.
In addition, the Trustees considered MFS’ resources and related efforts to continue to retain, attract and motivate capable personnel to serve the Portfolio. The Trustees also considered the financial resources of MFS and its parent, Sun Life Financial Inc. The Trustees further considered any advantages and possible disadvantages of having an adviser which also serves other investment companies as well as institutional accounts.
The Trustees also considered the nature, quality, cost, and extent of administrative, transfer agency, and distribution services provided to the Trust by MFS and its affiliates under agreements and plans other than the New Agreement, including the 12b-1 fees the Portfolio pays to MFS Fund Distributors, Inc., an affiliate of MFS. The Trustees also considered the nature, extent and
27
Table of Contents
MFS Technology Portfolio
Board Approval of New Investment Advisory Agreement – continued
quality of certain other services MFS performs or arranges on the Portfolio’s behalf, which may include securities lending programs, directed expense payment programs, class action recovery programs, and MFS’ interaction with third-party service providers, principally custodians and sub-custodians. The Trustees concluded that the various non-advisory services provided by MFS and its affiliates on behalf of the Portfolio were satisfactory. The Trustees also considered the benefits to MFS from the use of the Portfolio’s portfolio brokerage commissions to pay for investment research and various other factors. Additionally, the Trustees considered so-called “fall-out benefits” to MFS such as reputational value derived from serving as investment manager to the Trust, and determined that any such benefits derived by MFS were reasonable and fair.
Based on their evaluation of factors that they deemed to be material, including those factors described above, the Board of Trustees, including a majority of the independent Trustees, concluded that the New Agreement should be approved for an initial two-year period, commencing upon its effective date, as set forth in the New Agreement.
BOARD APPROVAL OF CONTINUATION OF PRIOR INVESTMENT ADVISORY AGREEMENT
The Investment Company Act of 1940 requires that both the full Board of Trustees and a majority of the non-interested (“independent”) Trustees, voting separately, annually approve the continuation of the investment advisory agreement between MFS Variable Insurance Trust II (the “Trust”) and Massachusetts Financial Services Company (“MFS”) on behalf of the Fund. The Trustees consider matters bearing on the Fund and the advisory arrangements at their meetings throughout the year, including a review of performance data at each regular meeting. In addition, the independent Trustees met in person in May and again in July 2011 (“contract review meetings”) for the specific purpose of considering whether to approve the continuation of the investment advisory agreement for the Fund. The independent Trustees were assisted in their evaluation of the investment advisory agreement by independent legal counsel, from whom they received separate legal advice and with whom they met separately from MFS management during various contract review meetings. The independent Trustees were also assisted in this process by the Fund’s Independent Chief Compliance Officer, a full-time senior officer appointed by and reporting to the independent Trustees.
In connection with their deliberations, the Trustees, including the independent Trustees, considered such information and factors as they believed, in light of the legal advice furnished to them and their own business judgment, to be relevant. The investment advisory agreement was considered separately for the Fund, although the Trustees also took into account the common interests of all Funds in the Trust in their review. As described below, the Trustees considered the nature, quality, and extent of the various investment advisory, administrative, and shareholder services performed by MFS under the existing investment advisory agreement and other arrangements with the Trust.
In connection with their contract review meetings, the Trustees received and relied upon materials which included, among other items: (i) information provided by Lipper Inc. (“Lipper”) on the investment performance of the Fund for various time periods ended December 31, 2010, compared to the investment performance of a group of funds with substantially similar investment classifications/objectives (the “Lipper performance universe”), (ii) information provided by Lipper on the Fund’s advisory fees and other expenses compared to the advisory fees and other expenses of comparable funds identified by Lipper (the “Lipper expense group”), (iii) information provided by MFS on the advisory fees of comparable portfolios of its other clients, including institutional separate account and other clients, (iv) information as to whether, and to what extent applicable, expense waivers, reimbursements or fee “breakpoints” are observed for the Fund, (v) information regarding MFS’ financial results and financial condition, including MFS’ and certain of its affiliates’ estimated profitability from services performed for the Fund and other investment companies that the Board oversees as a whole, and for MFS’ institutional business, (vi) MFS’ views regarding the outlook for the mutual fund industry and its strategic business plans, (vii) descriptions of various functions performed by MFS for the Trust, such as compliance monitoring and portfolio trading practices, and (viii) information regarding the overall organization of MFS, including information about MFS’ senior management and other personnel providing investment advisory, administrative and other services to the Fund. The comparative performance, fee and expense information prepared and provided by Lipper was not independently verified, and the independent Trustees did not independently verify any information provided to them by MFS.
The Trustees’ conclusion as to the continuation of the investment advisory agreement was based on comprehensive consideration of all information provided to the Trustees and was not the result of any single factor. Some of the factors that figured particularly in the Trustees’ deliberations are described below for the Fund, while individual Trustees may have given different weight to various factors and evaluated the information presented as a whole differently than another individual Trustee. The Trustees recognized that the fee arrangements for the Fund reflect years of review and discussion between the independent Trustees and MFS, that certain aspects of such arrangements may receive greater scrutiny in some years than others, and that the Trustees’ conclusions may be based, in part, on their consideration of these same arrangements during the course of the year and in prior years.
28
Table of Contents
MFS Technology Portfolio
Board Approval of Continuation of Prior Investment Advisory Agreement – continued
Based on information provided by Lipper, the Trustees compared the Fund’s total return investment performance to the performance of the Lipper performance universe over various time periods. The Trustees placed particular emphasis on the total return performance of the Fund’s Initial Class shares in comparison to the performance of funds in its Lipper performance universe over the one-, three- and five -year periods ended December 31, 2010. The Trustees did not rely on performance results for more recent periods, including those shown elsewhere in this report.
The Trustees noted the performance of the Fund’s Initial Class shares was in the 3rd quintile relative to the other funds in the Lipper performance universe for the one-year period (the 1st quintile being the best performers and the 5th quintile being the worst performers). The total return performance of the Fund was in the 3rd quintile for the three-year period and in the 1st quintile for the five-year period ended December 31, 2010, relative to the Lipper performance universe. Based on the nature and quality of services provided by MFS, the Board of Trustees concluded that the Fund’s performance was satisfactory.
In the course of their deliberations, the Trustees took into account information provided by MFS during contract review meetings, as well as during investment review meetings conducted with portfolio management personnel during the course of the year.
In assessing the reasonableness of the Fund’s advisory fee, the Trustees considered, among other information, the Fund’s advisory fee and the total expense ratio of the Fund’s Initial Class shares as a percentage of average daily net assets, compared to the advisory fee and total expense ratios of its peer group of funds based on information provided by Lipper. The Trustees also considered the advisory fees charged by MFS to institutional accounts. In comparing these fees, the Trustees considered the generally broader scope of services provided by MFS to the Trust than those provided to institutional accounts. The Trustees also considered the higher demands placed on MFS’ investment personnel and trading infrastructure as a result of the daily cash in-flows and out-flows of the Fund, and the impact on MFS and related expenses due to the more extensive regulatory regime to which the Fund is subject, compared to institutional accounts.
In considering the fees, the Trustees noted from the Lipper data (which takes into account any reductions or expense limitations) that the Fund’s effective advisory fee rate was below the median and total expense ratio was approximately at the median of such fees and expenses of funds in the Lipper expense group. In addition, the Trustees accepted MFS’ offer to continue the expense limitation for the Fund. The Trustees further concluded that the existing breakpoint was sufficient to allow the Fund to benefit from economies of scale as its assets grow. The Trustees concluded that the fees were reasonable in light of the nature and quality of services provided.
The Trustees also considered information prepared by MFS relating to its costs and profits with respect to the Fund and other investment companies and accounts advised by MFS, as well as MFS’ methodologies used to determine and allocate its costs to the Fund and other accounts and products for purposes of estimating profitability.
After reviewing these and other factors described below, the Trustees concluded that the advisory fees charged to the Fund represent reasonable compensation in light of the nature and quality of the services being provided by MFS.
In addition, the Trustees considered MFS’ resources and related efforts to continue to retain, attract and motivate capable personnel to serve the Fund. The Trustees also considered the financial resources of MFS and its parent, Sun Life Financial Inc. The Trustees further considered any advantages and possible disadvantages of having an adviser which also serves other investment companies as well as institutional accounts.
The Trustees also considered the nature, quality, cost, and extent of administrative, transfer agency, and distribution services provided to the Fund by MFS and its affiliates under agreements and plans other than the investment advisory agreement, including the 12b-1 fees the Fund pays to MFS Fund Distributors, Inc., an affiliate of MFS. The Trustees also considered the nature, extent and quality of certain other services MFS performs or arranges on the Fund’s behalf, which may include securities lending programs, directed expense payment programs, class action recovery programs, and MFS’ interaction with third-party service providers, principally custodians and sub-custodians. The Trustees concluded that the various non-advisory services provided by MFS and its affiliates on behalf of the Fund were satisfactory. The Trustees also considered the benefits to MFS from the use of the Fund’s portfolio brokerage commissions, if applicable, to pay for investment research and various other factors. Additionally, the Trustees considered so-called “fall-out benefits” to MFS such as reputational value derived from serving as investment manager to the Trust, and determined that any such benefits derived by MFS were reasonable and fair.
Based on their evaluation of factors that they deemed to be material, including those factors described above, the Board of Trustees, including a majority of the independent Trustees, concluded that the investment advisory agreement should be continued for an additional one-year period, commencing September 1, 2011.
A discussion regarding the Board’s most recent review and renewal of the fund’s Investment Advisory Agreement with MFS is available by clicking on the fund’s name under “Variable Insurance Portfolios — VIT II” in the “Products and Performance” section of the MFS Web site (mfs.com).
29
Table of Contents
MFS Technology Portfolio
PROXY VOTING POLICIES AND INFORMATION
A general description of the MFS funds’ proxy voting policies and procedures is available without charge, upon request, by calling
1-800-225-2606, by visiting the Proxy Voting section of mfs.com or by visiting the SEC’s Web site at http://www.sec.gov.
Information regarding how the fund voted proxies relating to portfolio securities during the most recent twelve-month period ended June 30 is available without charge by visiting the Proxy Voting section of mfs.com or by visiting the SEC’s Web site at http://www.sec.gov.
QUARTERLY PORTFOLIO DISCLOSURE
The fund will file a complete schedule of portfolio holdings with the Securities and Exchange Commission (the Commission) for the first and third quarters of each fiscal year on Form N-Q. The fund’s Form N-Q is available on the EDGAR database on the Commission’s Internet Web site at http://www.sec.gov and may be reviewed and copied at the:
Public Reference Room
Securities and Exchange Commission
100 F Street, NE, Room 1580
Washington, D.C. 20549
Information on the operation of the Public Reference Room may be obtained by calling the Commission at 1-800-SEC-0330. Copies of the fund’s Form N-Q also may be obtained, upon payment of a duplicating fee, by electronic request at the following e-mail address: publicinfo@sec.gov or by writing the Public Reference Section at the above address.
From time to time, MFS may post important information about the fund or the MFS funds on the MFS web site (mfs.com). This information is available by visiting the “News & Commentary” section of mfs.com or by clicking on the fund’s name under “Variable Insurance Portfolios — VIT II” in the “Products and Performance” section of mfs.com.
30
Table of Contents
rev. 3/11

| Why? | Financial companies choose how they share your personal information. Federal law gives consumers the right to limit some but not all sharing. Federal law also requires us to tell you how we collect, share, and protect your personal information. Please read this notice carefully to understand what we do. |
| What? | The types of personal information we collect and share depend on the product or service you have with us. This information can include:
• Social Security number and account balances • Account transactions and transaction history • Checking account information and wire transfer instructions
When you are no longer our customer, we continue to share your information as described in this notice. |
| How? | All financial companies need to share customers’ personal information to run their everyday business. In the section below, we list the reasons financial companies can share their customers’ personal information; the reasons MFS chooses to share; and whether you can limit this sharing. |
| Reasons we can share your personal information | Does MFS share? | Can you limit this sharing? | ||
For our everyday business purposes – such as to process your transactions, maintain your account(s), respond to court orders and legal investigations, or report to credit bureaus | Yes | No | ||
For our marketing purposes – to offer our products and services to you | No | We don’t share | ||
| For joint marketing with other financial companies | No | We don’t share | ||
For our affiliates’ everyday business purposes – information about your transactions and experiences | No | We don’t share | ||
For our affiliates’ everyday business purposes – information about your creditworthiness | No | We don’t share | ||
| For nonaffiliates to market to you | No | We don’t share |
| Questions? | Call 800-225-2606 or go to mfs.com. |
31
Table of Contents
| Page 2 |
| Who we are | ||
| Who is providing this notice? | MFS Funds, MFS Investment Management, MFS Institutional Advisors, Inc., MFS Fund Distributors, Inc., MFS Heritage Trust Company, and MFS Service Center, Inc. | |
| What we do | ||
| How does MFS protect my personal information? | To protect your personal information from unauthorized access and use, we use security measures that comply with federal law. These measures include procedural, electronic, and physical safeguards for the protection of the personal information we collect about you. | |
| How does MFS collect my personal information? | We collect your personal information, for example, when you
• open an account or provide account information • direct us to buy securities or direct us to sell your securities • make a wire transfer
We also collect your personal information from others, such as credit bureaus, affiliates and other companies. | |
| Why can’t I limit all sharing? | Federal law gives you the right to limit only
• sharing for affiliates’ everyday business purposes – information about your creditworthiness • affiliates from using your information to market to you • sharing for nonaffiliates to market to you
State laws and individual companies may give you additional rights to limit sharing. | |
| Definitions | ||
| Affiliates | Companies related by common ownership or control. They can be financial and nonfinancial companies.
•MFS does not share personal information with affiliates, except for everyday business purposes as described on page one of this notice. | |
| Nonaffiliates | Companies not related by common ownership or control. They can be financial and nonfinancial companies.
•MFS does not share with nonaffiliates so they can market to you. | |
| Joint Marketing | A formal agreement between nonaffiliated financial companies that together market financial products or services to you.
•MFS doesn’t jointly market. | |
| Other important information | ||
| If you own an MFS product or receive an MFS service in the name of a third party such as a bank or broker-dealer, their privacy policy may apply to you instead of ours. | ||
32
Table of Contents

Table of Contents

MFS® Emerging Markets Equity Portfolio
MFS® Variable Insurance Trust II

ANNUAL REPORT
December 31, 2011
FCE-ANN
Table of Contents
MFS® EMERGING MARKETS EQUITY PORTFOLIO
The report is prepared for the general information of contract owners.
It is authorized for distribution to prospective investors only when preceded or accompanied by a current prospectus.
NOT FDIC INSURED Ÿ MAY LOSE VALUE Ÿ NO BANK OR CREDIT UNION GUARANTEE Ÿ NOT A DEPOSIT Ÿ NOT INSURED BY ANY FEDERAL GOVERNMENT AGENCY OR NCUA/NCUSIF
Table of Contents
MFS Emerging Markets Equity Portfolio
LETTER FROM THE CHAIRMAN AND CEO

Dear Contract Owners:
We are indeed living through some volatile times. Economic uncertainty is everywhere, as it seems no place in the world has been unmoved by crisis. We have seen a devastating earthquake and tsunami that have led to disruptions in the Japanese markets
and supply chains. Protests have changed the face of the Middle East and left in their wake lingering tensions and resultant higher oil prices. We have seen debt limits tested in Europe and the United States and policymakers grappling to craft often unpopular monetary and fiscal responses at a time when consumers and businesses struggle with what appears to be a slowing global economy. On top of all of that, we have seen long-term U.S. debt lose its Standard & Poor’s AAA rating and the long-term debt ratings of 15 eurozone nations put on negative watch.
When markets become volatile, managing risk becomes a top priority for investors and their advisors. At MFS® risk management is foremost in our minds in all market climates. Our analysts and portfolio managers keep risks firmly in mind when evaluating securities. Additionally, we have a team of quantitative analysts that measures and assesses the risk profiles of our portfolios and securities on an ongoing basis. The chief investment risk officer, who oversees the team, reports directly to the firm’s president and chief investment officer so the risk associated with each portfolio can be assessed objectively and independently of the portfolio management team.
As always, we continue to be mindful of the many economic challenges faced at the local, national, and international levels. It is in times such as these that we want to remind investors of the merits of maintaining a long-term view, adhering to basic investing principles such as asset allocation and diversification, and working closely with their advisors to research and identify appropriate investment opportunities.
Respectfully,

Robert J. Manning
Chairman and Chief Executive Officer
MFS Investment Management®
February 15, 2012
The opinions expressed in this letter are subject to change, may not be relied upon for investment advice, and no forecasts can be guaranteed.
1
Table of Contents
MFS Emerging Markets Equity Portfolio
Portfolio structure

| Top ten holdings | ||||
| Samsung Electronics Co. Ltd. | 5.4% | |||
| Taiwan Semiconductor Manufacturing Co. Ltd. | 2.8% | |||
| MTN Group Ltd. | 1.9% | |||
| Petroleo Brasileiro S.A., ADR | 1.8% | |||
| Vale S.A., ADR | 1.8% | |||
| China Construction Bank | 1.8% | |||
| OAO Gazprom, ADR | 1.8% | |||
| Mr. Price Group Ltd. | 1.6% | |||
| China Unicom Ltd., ADR | 1.6% | |||
| Hon Hai Precision Industry Co. Ltd. | 1.6% | |||
| Equity sectors | ||||
| Financial Services | 23.0% | |||
| Technology | 13.8% | |||
| Retailing | 11.6% | |||
| Energy | 10.4% | |||
| Utilities & Communications | 10.1% | |||
| Basic Materials | 7.3% | |||
| Special Products & Services | 5.4% | |||
| Consumer Staples | 4.9% | |||
| Autos & Housing | 4.9% | |||
| Leisure | 2.6% | |||
| Industrial Goods & Services | 2.4% | |||
| Health Care | 1.7% | |||
| Transportation | 0.7% | |||
| Issuer country weightings (x) | ||||
| Brazil | 17.5% | |||
| China | 12.7% | |||
| South Korea | 12.2% | |||
| Taiwan | 7.7% | |||
| South Africa | 7.4% | |||
| India | 7.0% | |||
| Hong Kong | 5.8% | |||
| Russia | 5.4% | |||
| Mexico | 5.0% | |||
| Other Countries | 19.3% | |||
| Currency exposure weightings (y) | ||||
| Hong Kong Dollar | 19.2% | |||
| Brazilian Real | 16.9% | |||
| South Korean Won | 12.2% | |||
| United States Dollar | 8.4% | |||
| Taiwan Dollar | 7.7% | |||
| South African Rand | 7.4% | |||
| Indian Rupee | 7.0% | |||
| Mexican Peso | 5.0% | |||
| Indonesian Rupiah | 2.3% | |||
| Other Currencies | 13.9% | |||
| (x) | Represents the portfolio’s exposure to issuer countries as a percentage of a portfolio’s total net assets. |
| (y) | Represents the portfolio’s exposure to a particular currency as a percentage of a portfolio’s total net assets. |
Percentages are based on net assets as of 12/31/11.
The portfolio is actively managed and current holdings may be different.
2
Table of Contents
MFS Emerging Markets Equity Portfolio
Summary of Results
For the twelve months ended December 31, 2011, Initial Class shares of the MFS Emerging Markets Equity Portfolio (the “fund”) provided a total return of –18.58%, while Service Class shares of the fund provided a total return of –18.77%. These compare with a return of –18.17% for the fund’s benchmark, the Morgan Stanley Capital International (MSCI) Emerging Markets Index.
Market Environment
Early in the period, the U.S. Federal Reserve (the “Fed”) responded to weak economic growth by loosening monetary policy further. More easing by the Fed improved market sentiment and drove risk-asset prices markedly higher. The December 2010 agreement on a surprisingly large (relative to expectations) expansionary U.S. fiscal package also boosted sentiment. During the subsequent several months, the renewed positive market sentiment, coupled with better indications of global macroeconomic activity, pushed many asset valuations to post-crisis highs. At the same time, the yields of the perceived “safest” global sovereign credits rose, indicating a renewed risk-seeking environment.
However, towards the middle of the period, a weakening macroeconomic backdrop and renewed concerns over peripheral euro zone sovereign debt caused a flight-to-quality move that pushed high-quality sovereign bond yields lower. In the U.S., concerns about sovereign debt default and the long-term sustainability of the trend in U.S. fiscal policy resulted in one agency downgrading U.S. credit quality. Amidst this turmoil, global equity markets declined sharply. As a result of these developments, global consumer and producer sentiment indicators fell precipitously and highly-rated sovereign bond yields hit multi-decade lows. Towards the end of the reporting period, uncertainty in financial markets spiked higher as markets more seriously contemplated the possible failure of the euro zone.
Detractors from Performance
Security selection in the basic materials sector was a primary factor that held back performance relative to the MSCI Emerging Markets Index. The fund’s holdings of India-based integrated iron and steel producer Steel Authority of India detracted from relative returns as the stock underperformed the benchmark over the reporting period.
Stock selection in the financial services sector also hindered relative results. Holdings of Russian commercial banking firm Sberbank of Russia, diversified financial services provider Commercial International Bank (Egypt), and Austrian financial services company Erste Group Bank (b) detracted from relative returns as all three stocks turned in weak performance over the reporting period. Shares of Erste Group Bank declined in the second part of the reporting period due, in part, to investors’ concerns about the bank’s exposure to European sovereign debt as well as the bank’s potential losses on non-performing loans issued to Hungarian borrowers.
Elsewhere, holdings of information technology products and electronics maker Acer (h) (Taiwan), Brazilian post-secondary education company Anhanguera Educacional Participacoes, automobile trader and manufacturer Geely Automobile Holdings (Hong Kong), and petrochemical firm Reliance Industries (India) weakened relative returns. Shares of Acer declined in the early portion of the reporting period on worries over weak revenue growth and margin pressure in the first quarter of 2011 as sales in the personal computer market continued to slow. Not holding shares of strong-performing global automaker Hyundai Motor (South Korea), and the timing of the fund’s ownership in shares of outperforming automobile manufacturer Kia Motors (South Korea), were additional factors that negatively impacted relative performance.
Contributors to Performance
Stock selection in the technology and utilities & communications sectors contributed to relative performance. Within the technology sector, the fund’s holdings of electronics company Samsung Electronics (Korea) and semiconductor manufacturer Taiwan Semiconductor Manufacturing (Taiwan) strengthened relative returns as both stocks turned in strong performance over the reporting period. Shares of Samsung Electronics rose as the company posted better-than-expected earnings results attributable to strong sales (surpassing Apple’s iPhone in market share) and operating margins in its Smartphone and semiconductor segments. In light of the firm’s strong performance, management provided positive guidance on revenue projections and its plans to add value through an improved product mix. Shares of Taiwan Semiconductor rallied as the company forecast higher-than-anticipated sales projections for the fourth quarter. Within the utilities & communications sector, holdings of strong-performing Hong Kong-based telecommunications service provider China Unicom (Hong Kong) Ltd. were among the fund’s top relative contributors.
An overweight allocation to the retailing sector also boosted relative performance. The fund’s holdings of footwear manufacturer Stella International Holdings (b) (Hong Kong) and discount store chain E-Mart (South Korea) benefited relative returns as both stocks appreciated over the reporting period.
3
Table of Contents
MFS Emerging Markets Equity Portfolio
Management Review – continued
Top relative contributors in other sectors included automotive parts manufacturer Mando Corp. (South Korea), conglomerate First Pacific Co. (b) (Hong Kong), casino resorts operator Sands China (b) (Hong Kong), and construction, concrete, and cement company Anhui Conch Cement (China).
The fund’s cash position was also a contributor to relative performance. The fund holds cash to buy new holdings and to provide liquidity. In a period when equity markets declined, as measured by the fund’s benchmark, holding cash helped performance versus the benchmark, which has no cash position.
Respectfully,
| Jose Luis Garcia | Robert Lau | |
| Portfolio Manager | Portfolio Manager |
| (b) | Security is not a benchmark constituent. |
| (h) | Security was not held in the fund at period end. |
The views expressed in this report are those of the portfolio managers only through the end of the period of the report as stated on the cover and do not necessarily reflect the views of MFS or any other person in the MFS organization. These views are subject to change at any time based on market or other conditions, and MFS disclaims any responsibility to update such views. These views may not be relied upon as investment advice or an indication of trading intent on behalf of any MFS portfolio. References to specific securities are not recommendations of such securities, and may not be representative of any MFS portfolio’s current or future investments.
4
Table of Contents
MFS Emerging Markets Equity Portfolio
PERFORMANCE SUMMARY THROUGH 12/31/11
The following chart illustrates the historical performance of the fund in comparison to its benchmark(s). Benchmarks are unmanaged and may not be invested in directly. Benchmark returns do not reflect any fees or expenses. The performance of other share classes will be greater than or less than that of the class depicted below. (See Notes to Performance Summary.)
Performance data shown represents past performance and is no guarantee of future results. Investment return and principal value fluctuate so your units, when sold, may be worth more or less than the original cost; current performance may be lower or higher than quoted. The performance shown does not reflect the deduction of taxes, if any, that a contract holder would pay on fund distributions or the redemption of contract units. The returns for the fund shown also do not reflect the deduction of expenses associated with variable products, such as mortality and expense risk charges, separate account charges, and sales charges imposed by the insurance company separate accounts. Such expenses would reduce the overall returns shown.
Growth of a Hypothetical $10,000 Investment
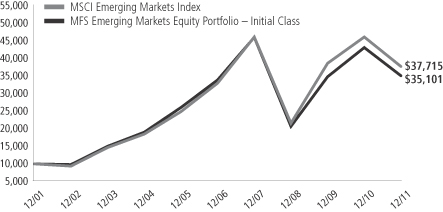
Total Returns through 12/31/11
Average annual total returns
| Share class | Class inception date | 1-yr | 5-yr | 10-yr | ||||||||
| Initial Class | 6/05/96 | (18.58)% | 0.70% | 13.38% | ||||||||
| Service Class | 8/24/01 | (18.77)% | 0.45% | 13.10% | ||||||||
| Comparative benchmark | ||||||||||||
| MSCI Emerging Markets Index (f) | (18.17)% | 2.70% | 14.20% | |||||||||
| (f) | Source: FactSet Research Systems Inc. |
Benchmark Definition
MSCI Emerging Markets Index – a market capitalization-weighted index that is designed to measure equity market performance in the global emerging markets.
It is not possible to invest directly in an index.
Notes to Performance Summary
Average annual total return represents the average annual change in value for each share class for the periods presented.
Performance results reflect any applicable expense subsidies and waivers in effect during the periods shown. Without such subsidies and waivers the fund’s performance results would be less favorable. Please see the prospectus and financial statements for complete details. All results are historical and assume the reinvestment of any dividends and capital gains distributions.
Performance results do not include adjustments made for financial reporting purposes in accordance with U.S. generally accepted accounting principles and may differ from amounts reported in the financial highlights.
From time to time the fund may receive proceeds from litigation settlements, without which performance would be lower.
5
Table of Contents
MFS Emerging Markets Equity Portfolio
Fund Expenses Borne by the Contract Holders During the Period,
July 1, 2011 through December 31, 2011
As a contract holder of the fund, you incur ongoing costs, including management fees; distribution and/or service (12b-1) fees; and other fund expenses. This example is intended to help you understand your ongoing costs (in dollars) of investing in the fund and to compare these costs with the ongoing costs of investing in other mutual funds.
The example is based on an investment of $1,000 invested at the beginning of the period and held for the entire period July 1, 2011 through December 31, 2011.
Actual Expenses
The first line for each share class in the following table provides information about actual account values and actual expenses. You may use the information in this line, together with the amount you invested, to estimate the expenses that you paid over the period. Simply divide your account value by $1,000 (for example, an $8,600 account value divided by $1,000 = 8.6), then multiply the result by the number in the first line under the heading entitled “Expenses Paid During Period” to estimate the expenses you paid on your account during this period.
Hypothetical Example for Comparison Purposes
The second line for each share class in the following table provides information about hypothetical account values and hypothetical expenses based on the fund’s actual expense ratio and an assumed rate of return of 5% per year before expenses, which is not the fund’s actual return. The hypothetical account values and expenses may not be used to estimate the actual ending account balance or expenses you paid for the period. You may use this information to compare the ongoing costs of investing in the fund and other funds. To do so, compare this 5% hypothetical example with the 5% hypothetical examples that appear in the shareholder reports of the other funds.
Please note that the expenses shown in the table are meant to highlight the fund’s ongoing costs only and do not take into account the fees and expenses imposed under the variable contracts through which your investment in the fund is made. Therefore, the second line for each share class in the table is useful in comparing ongoing costs associated with an investment in vehicles (such as the fund) which fund benefits under variable annuity and variable life insurance contracts and to qualified pension and retirement plans only, and will not help you determine the relative total costs of investing in the fund through variable annuity and variable life insurance contracts. If the fees and expenses imposed under the variable contracts were included, your costs would have been higher.
| Share Class | Annualized Expense Ratio | Beginning Account Value 7/01/11 | Ending Account Value | Expenses Paid During Period (p) 7/01/11-12/31/11 | ||||||||||||||
| Initial Class | Actual | 1.36% | $1,000.00 | $813.33 | $6.22 | |||||||||||||
| Hypothetical (h) | 1.36% | $1,000.00 | $1,018.35 | $6.92 | ||||||||||||||
| Service Class | Actual | 1.61% | $1,000.00 | $812.31 | $7.35 | |||||||||||||
| Hypothetical (h) | 1.61% | $1,000.00 | $1,017.09 | $8.19 | ||||||||||||||
| (h) | 5% class return per year before expenses. |
| (p) | Expenses paid is equal to each class’ annualized expense ratio, as shown above, multiplied by the average account value over the period, multiplied by the number of days in the period, divided by the number of days in the year. |
6
Table of Contents
MFS Emerging Markets Equity Portfolio
PORTFOLIO OF INVESTMENTS – 12/31/11
The Portfolio of Investments is a complete list of all securities owned by your fund. It is categorized by broad-based asset classes.
| Issuer | Shares/Par | Value ($) | ||||||
| COMMON STOCKS – 98.8% | ||||||||
| Aerospace – 0.4% | ||||||||
| Embraer S.A., ADR | 18,350 | $ | 462,787 | |||||
|
| |||||||
| Airlines – 0.7% | ||||||||
| Copa Holdings S.A., “A” | 6,047 | $ | 354,777 | |||||
| Grupo Aeroportuario del Sureste S.A. de C.V., ADR | 9,790 | 547,653 | ||||||
|
| |||||||
| $ | 902,430 | |||||||
|
| |||||||
| Alcoholic Beverages – 1.0% | ||||||||
| Companhia de Bebidas das Americas, ADR | 35,185 | $ | 1,269,827 | |||||
|
| |||||||
| Apparel Manufacturers – 4.7% | ||||||||
| Arezzo Industria e Comercio S.A. | 45,650 | $ | 567,795 | |||||
| Cia.Hering S.A. | 30,300 | 527,296 | ||||||
| Li & Fung Ltd. | 660,000 | 1,222,002 | ||||||
| O’Key Group S.A., GDR | 201,750 | 1,381,988 | ||||||
| Stella International Holdings | 680,500 | 1,479,005 | ||||||
| Top Glove Corp. | 450,700 | 710,883 | ||||||
|
| |||||||
| $ | 5,888,969 | |||||||
|
| |||||||
| Automotive – 3.2% | ||||||||
| Geely Automobile Holdings Ltd. | 2,280,000 | $ | 499,060 | |||||
| Guangzhou Automobile Group Co. Ltd., “H” | 612,000 | 510,617 | ||||||
| Kia Motors Corp. (a) | 30,130 | 1,746,816 | ||||||
| Mando Corp. (a) | 6,899 | 1,233,675 | ||||||
|
| |||||||
| $ | 3,990,168 | |||||||
|
| |||||||
| Brokerage & Asset Managers – 2.1% | ||||||||
| BM&F Bovespa S.A. | 240,200 | $ | 1,262,008 | |||||
| Bolsa Mexicana de Valores S.A. de C.V. | 435,100 | 699,979 | ||||||
| CETIP S.A.-Balcao Organizado de Ativos e Derivativos | 49,500 | 715,199 | ||||||
|
| |||||||
| $ | 2,677,186 | |||||||
|
| |||||||
| Business Services – 2.9% | ||||||||
| Cielo S.A. | 15,696 | $ | 405,601 | |||||
| Infosys Technologies Ltd., ADR | 38,359 | 1,970,885 | ||||||
| LPS Brasil-Consultoria de Imoveis S.A. | 41,300 | 575,687 | ||||||
| Multiplus S.A. | 20,520 | 354,789 | ||||||
| Redecard S.A. | 20,000 | 312,988 | ||||||
|
| |||||||
| $ | 3,619,950 | |||||||
|
| |||||||
| Cable TV – 1.7% | ||||||||
| Dish TV India Ltd. (a) | 433,266 | $ | 479,730 | |||||
| Naspers Ltd. | 38,668 | 1,685,838 | ||||||
|
| |||||||
| $ | 2,165,568 | |||||||
|
| |||||||
| Computer Software – 0.3% | ||||||||
| Totvs S.A. | 23,500 | $ | 419,038 | |||||
|
| |||||||
| Computer Software – Systems – 2.1% | ||||||||
| Hon Hai Precision Industry Co. Ltd. | 720,256 | $ | 1,971,968 | |||||
| NICE Systems Ltd., ADR (a) | 20,650 | 711,393 | ||||||
|
| |||||||
| $ | 2,683,361 | |||||||
|
| |||||||
| Issuer | Shares/Par | Value ($) | ||||||
| COMMON STOCKS – continued | ||||||||
| Conglomerates – 1.4% | ||||||||
| Alfa S.A de C.V., “A” | 18,920 | $ | 206,084 | |||||
| First Pacific Co. Ltd. | 1,508,800 | 1,569,684 | ||||||
|
| |||||||
| $ | 1,775,768 | |||||||
|
| |||||||
| Construction – 1.7% | ||||||||
| Anhui Conch Cement Co. Ltd. | 253,000 | $ | 750,863 | |||||
| Corporacion GEO S.A.B. de C.V., “B” (a) | 191,270 | 237,945 | ||||||
| Corporacion Moctezuma S.A. de C.V. | 195,900 | 400,372 | ||||||
| Duratex S.A. | 786 | 3,759 | ||||||
| PDG Realty S.A. | 105,200 | 332,760 | ||||||
| Urbi Desarrollos Urbanos S.A. de C.V. (a) | 361,179 | 411,010 | ||||||
|
| |||||||
| $ | 2,136,709 | |||||||
|
| |||||||
| Consumer Products – 2.3% | ||||||||
| Dabur India Ltd. | 737,321 | $ | 1,380,785 | |||||
| Hengan International Group Co. Ltd. | 118,500 | 1,108,468 | ||||||
| Kimberly-Clark de Mexico S.A. de C.V., “A” | 63,370 | 341,765 | ||||||
|
| |||||||
| $ | 2,831,018 | |||||||
|
| |||||||
| Consumer Services – 1.1% | ||||||||
| Anhanguera Educacional Participacoes S.A. | 80,300 | $ | 865,316 | |||||
| Kroton Educacional S.A., IEU (a) | 51,596 | 508,699 | ||||||
|
| |||||||
| $ | 1,374,015 | |||||||
|
| |||||||
| Electronics – 10.3% | ||||||||
| Samsung Electronics Co. Ltd. | 7,367 | $ | 6,765,873 | |||||
| Seoul Semiconductor Co. Ltd. (a) | 25,041 | 456,477 | ||||||
| Siliconware Precision Industries Co. Ltd. | 2,009,000 | 1,798,075 | ||||||
| Taiwan Semiconductor Manufacturing Co. Ltd. | 1,379,258 | 3,452,814 | ||||||
| Taiwan Semiconductor Manufacturing Co. Ltd., ADR | 31,911 | 411,971 | ||||||
|
| |||||||
| $ | 12,885,210 | |||||||
|
| |||||||
| Energy – Independent – 6.1% | ||||||||
| Bankers Petroleum Ltd. (a) | 111,307 | $ | 485,107 | |||||
| China Shenhua Energy Co. Ltd. | 282,000 | 1,223,624 | ||||||
| CNOOC Ltd. | 646,000 | 1,129,539 | ||||||
| INPEX Corp. | 178 | 1,121,606 | ||||||
| Oil & Natural Gas Corp. Ltd. | 70,703 | 341,632 | ||||||
| Reliance Industries Ltd. | 139,624 | 1,821,909 | ||||||
| Turkiye Petrol Rafinerileri AS | 72,936 | 1,540,562 | ||||||
|
| |||||||
| $ | 7,663,979 | |||||||
|
| |||||||
| Energy – Integrated – 3.6% | ||||||||
| OAO Gazprom, ADR | 206,944 | $ | 2,206,023 | |||||
| Petroleo Brasileiro S.A., ADR | 92,812 | 2,306,378 | ||||||
|
| |||||||
| $ | 4,512,401 | |||||||
|
| |||||||
7
Table of Contents
MFS Emerging Markets Equity Portfolio
Portfolio of Investments – continued
| Issuer | Shares/Par | Value ($) | ||||||
| COMMON STOCKS – continued | ||||||||
| Food & Beverages – 1.6% | ||||||||
| Embotelladoras Arca S.A. de C.V. | 67,076 | $ | 285,614 | |||||
| M. Dias Branco S.A. Industria e Comercio de Alimentos | 33,500 | 856,695 | ||||||
| Tiger Brands Ltd. | 29,878 | 926,984 | ||||||
|
| |||||||
| $ | 2,069,293 | |||||||
|
| |||||||
| Food & Drug Stores – 1.2% | ||||||||
| CP All PLC | 429,600 | $ | 704,653 | |||||
| Dairy Farm International Holdings Ltd. | 79,200 | 738,936 | ||||||
|
| |||||||
| $ | 1,443,589 | |||||||
|
| |||||||
| Gaming & Lodging – 0.5% | ||||||||
| Minor International PLC | 542,700 | $ | 192,654 | |||||
| Sands China Ltd. (a) | 173,600 | 490,629 | ||||||
|
| |||||||
| $ | 683,283 | |||||||
|
| |||||||
| General Merchandise – 5.1% | ||||||||
| Bim Birlesik Magazalar A.S. | 10,137 | $ | 281,026 | |||||
| Clicks Group Ltd. | 258,440 | 1,480,038 | ||||||
| E-Mart Co. Ltd. (a) | 6,379 | 1,544,914 | ||||||
| Lojas Renner S.A. | 19,900 | 516,477 | ||||||
| Mr. Price Group Ltd. | 206,558 | 2,041,899 | ||||||
| Shinsegae Co. Ltd. (a) | 2,263 | 481,280 | ||||||
|
| |||||||
| $ | 6,345,634 | |||||||
|
| |||||||
| Insurance – 1.9% | ||||||||
| Brazil Insurance Participacoes e Administracao S.A. | 106,700 | $ | 972,470 | |||||
| China Pacific Insurance Co. Ltd. | 488,600 | 1,390,320 | ||||||
|
| |||||||
| $ | 2,362,790 | |||||||
|
| |||||||
| Machinery & Tools – 2.0% | ||||||||
| BEML Ltd. | 20,062 | $ | 171,947 | |||||
| Glory Ltd. | 29,300 | 630,767 | ||||||
| Sinotruk Hong Kong Ltd. | 1,348,500 | 753,546 | ||||||
| TK Corp. (a) | 49,047 | 1,013,297 | ||||||
|
| |||||||
| $ | 2,569,557 | |||||||
|
| |||||||
| Major Banks – 3.0% | ||||||||
| Bank of China Ltd. | 4,968,000 | $ | 1,829,434 | |||||
| Erste Group Bank AG | 22,626 | 396,280 | ||||||
| Standard Chartered PLC | 69,493 | 1,520,210 | ||||||
|
| |||||||
| $ | 3,745,924 | |||||||
|
| |||||||
| Medical & Health Technology & Services – 1.2% | ||||||||
| Diagnosticos da America S.A. | 111,200 | $ | 924,058 | |||||
| Fleury S.A. | 52,200 | 598,890 | ||||||
|
| |||||||
| $ | 1,522,948 | |||||||
|
| |||||||
| Metals & Mining – 5.3% | ||||||||
| Companhia Siderurgica Nacional S.A., ADR | 42,790 | $ | 350,022 | |||||
| Gerdau S.A., ADR | 46,670 | 364,493 | ||||||
| Grupo Mexico S.A.B. de C.V., “B” | 188,917 | 493,726 | ||||||
| Maanshan Iron & Steel Co. Ltd. | 956,000 | 306,495 | ||||||
| Mining & Metallurgical Co. Norilsk Nickel, ADR | 47,686 | 730,073 | ||||||
| Issuer | Shares/Par | Value ($) | ||||||
| COMMON STOCKS – continued | ||||||||
| Metals & Mining – continued | ||||||||
| MOIL Ltd. | 112,749 | $ | 482,270 | |||||
| POSCO | 1,774 | 587,791 | ||||||
| Steel Authority of India Ltd. | 419,556 | 643,891 | ||||||
| Ternium S.A., ADR | 22,560 | 414,878 | ||||||
| Vale S.A., ADR | 105,998 | 2,273,657 | ||||||
|
| |||||||
| $ | 6,647,296 | |||||||
|
| |||||||
| Network & Telecom – 1.1% | ||||||||
| HTC Corp. | 32,253 | $ | 529,401 | |||||
| Vtech Holdings Ltd. | 89,500 | 896,544 | ||||||
|
| |||||||
| $ | 1,425,945 | |||||||
|
| |||||||
| Oil Services – 0.7% | ||||||||
| Tenaris S.A., ADR | 22,339 | $ | 830,564 | |||||
|
| |||||||
| Other Banks & Diversified Financials – 14.5% | ||||||||
| Banco Santander Chile, ADR | 3,770 | $ | 285,389 | |||||
| Banco Santander S.A., IEU | 105,900 | 849,357 | ||||||
| Bancolombia S.A., ADR | 4,811 | 286,543 | ||||||
| Bangkok Bank Public Co. Ltd. | 273,700 | 1,422,719 | ||||||
| Bank Negara Indonesia PT | 2,648,500 | 1,109,931 | ||||||
| China Construction Bank | 3,172,670 | 2,214,080 | ||||||
| Chinatrust Financial Holding Co. Ltd. | 1,557,088 | 971,927 | ||||||
| CIMB Group Holdings Berhad | 627,200 | 1,472,040 | ||||||
| Commercial International Bank, GDR | 163,050 | 490,781 | ||||||
| Credicorp Ltd. | 9,080 | 993,988 | ||||||
| CSU Cardsystem S.A. | 188,505 | 464,883 | ||||||
| Hana Financial Group, Inc. | 46,280 | 1,428,172 | ||||||
| Housing Development Finance Corp. Ltd. | 67,679 | 830,997 | ||||||
| ICICI Bank Ltd. | 50,491 | 650,949 | ||||||
| Itau Unibanco Multiplo S.A., ADR | 29,802 | 553,125 | ||||||
| Komercni Banka A.S. | 10,287 | 1,733,887 | ||||||
| Sberbank of Russia | 855,780 | 1,911,378 | ||||||
| Turkiye Garanti Bankasi A.S. | 171,033 | 532,855 | ||||||
|
| |||||||
| $ | 18,203,001 | |||||||
|
| |||||||
| Pharmaceuticals – 0.5% | ||||||||
| Genomma Lab Internacional S.A., “B” (a) | 316,800 | $ | 612,274 | |||||
|
| |||||||
| Precious Metals & Minerals – 0.7% | ||||||||
| Gold Fields Ltd. | 55,488 | $ | 851,070 | |||||
|
| |||||||
| Real Estate – 1.5% | ||||||||
| Asian Property Development PLC | 2,210,300 | $ | 347,483 | |||||
| Brasil Brokers Participacoes | 226,500 | 677,587 | ||||||
| Hang Lung Properties Ltd. | 305,000 | 867,883 | ||||||
|
| |||||||
| $ | 1,892,953 | |||||||
|
| |||||||
| Restaurants – 0.4% | ||||||||
| Ajisen China Holdings Ltd. | 424,000 | $ | 466,768 | |||||
|
| |||||||
| Specialty Chemicals – 1.3% | ||||||||
| Chugoku Marine Paints Ltd. | 124,000 | $ | 768,455 | |||||
| Formosa Plastics Corp. | 216,000 | 576,399 | ||||||
| Mexichem S.A.B de C.V. | 95,600 | 300,816 | ||||||
|
| |||||||
| $ | 1,645,670 | |||||||
|
| |||||||
8
Table of Contents
MFS Emerging Markets Equity Portfolio
Portfolio of Investments – continued
| Issuer | Shares/Par | Value ($) | ||||||
| COMMON STOCKS – continued | ||||||||
| Specialty Stores – 0.6% | ||||||||
| GOME Electrical Appliances Holdings Ltd. | 1,995,000 | $ | 462,364 | |||||
| PT Mitra Adiperkasa Tbk | 577,000 | 327,714 | ||||||
|
| |||||||
| $ | 790,078 | |||||||
|
| |||||||
| Telecommunications – Wireless – 4.6% | ||||||||
| America Movil S.A.B. de C.V., “L”, ADR | 76,304 | $ | 1,724,470 | |||||
| China Mobile Ltd. | 73,500 | 718,287 | ||||||
| Mobile TeleSystems OJSC, ADR | 39,012 | 572,696 | ||||||
| MTN Group Ltd. | 132,684 | 2,356,560 | ||||||
| Tim Participacoes S.A., ADR | 17,177 | 443,167 | ||||||
|
| |||||||
| $ | 5,815,180 | |||||||
|
| |||||||
| Telephone Services – 3.4% | ||||||||
| China Unicom Ltd. | 290,000 | $ | 610,125 | |||||
| China Unicom Ltd., ADR | 95,950 | 2,027,424 | ||||||
| Empresa Nacional de Telecomunicaciones S.A. | 14,069 | 261,339 | ||||||
| PT XL Axiata Tbk | 2,782,500 | 1,388,565 | ||||||
|
| |||||||
| $ | 4,287,453 | |||||||
|
| |||||||
| Utilities – Electric Power – 2.1% | ||||||||
| Aguas Andinas S.A. | 895,768 | $ | 513,838 | |||||
| Eletropaulo Metropolitana S.A., IPS | 22,320 | 436,767 | ||||||
| Enersis S.A., ADR | 23,732 | 418,395 | ||||||
| Manila Water Co., Inc. | 1,552,000 | 686,553 | ||||||
| Tractebel Energia S.A. | 34,880 | 560,249 | ||||||
|
| |||||||
| $ | 2,615,802 | |||||||
|
| |||||||
| Total Common Stocks (Identified Cost, $127,412,308) | $ | 124,085,456 | ||||||
|
| |||||||
| Issuer | Strike Price | First Exercise | Shares/Par | Value ($) | ||||||||||||
| RIGHTS – 0.0% | ||||||||||||||||
| Consumer Services – 0.0% | ||||||||||||||||
| Kroton Educacional S.A. (1 share for 1 right) (Identified Cost, $0) (a) | BRL | 17.50 | 12/19/11 | 20,440 | $ | 5,808 | ||||||||||
|
| |||||||||||||||
| MONEY MARKET FUNDS – 1.1% | ||||||||||||||||
| MFS Institutional Money Market Portfolio, 0.05%, at Cost and Net Asset Value (v) | 1,374,005 | $ | 1,374,005 | |||||||||||||
|
| |||||||||||||||
| Total Investments (Identified Cost, $128,786,313) | $ | 125,465,269 | ||||||||||||||
|
| |||||||||||||||
| OTHER ASSETS, LESS LIABILITIES – 0.1% | 80,961 | |||||||||||||||
|
| |||||||||||||||
| Net Assets – 100.0% | $ | 125,546,230 | ||||||||||||||
|
| |||||||||||||||
| (a) | Non-income producing security. |
| (v) | Underlying affiliated fund that is available only to investment companies managed by MFS. The rate quoted for the MFS Institutional Money Market Portfolio is the annualized seven-day yield of the fund at period end. |
The following abbreviations are used in this report and are defined:
| ADR | American Depository Receipt |
| GDR | Global Depository Receipt |
| IEU | International Equity Unit |
| IPS | International Preference Stock |
| PLC | Public Limited Company |
Abbreviations indicate amounts shown in currencies other than the U.S. dollar. All amounts are stated in U.S. dollars unless otherwise indicated. A list of abbreviations is shown below:
| BRL | Brazilian Real |
See Notes to Financial Statements
9
Table of Contents
MFS Emerging Markets Equity Portfolio
FINANCIAL STATEMENTS | STATEMENT OF ASSETS AND LIABILITIES
This statement represents your fund’s balance sheet, which details the assets and liabilities comprising the total value of the fund.
At 12/31/11 | ||||||||
Assets | ||||||||
Investments – | ||||||||
Non-affiliated issuers, at value (identified cost, $127,412,308) | $124,091,264 | |||||||
Underlying affiliated funds, at cost and value | 1,374,005 | |||||||
Total investments, at value (identified cost, $128,786,313) | $125,465,269 | |||||||
Cash | 1,339 | |||||||
Foreign currency, at value (identified cost, $2,899) | 2,899 | |||||||
Receivables for | ||||||||
Fund shares sold | 279,224 | |||||||
Interest and dividends | 97,123 | |||||||
Other assets | 4,033 | |||||||
Total assets | $125,849,887 | |||||||
Liabilities | ||||||||
Payables for | ||||||||
Investments purchased | $76,953 | |||||||
Fund shares reacquired | 70,367 | |||||||
Payable to affiliates | ||||||||
Investment adviser | 11,158 | |||||||
Shareholder servicing costs | 93 | |||||||
Distribution and/or service fees | 751 | |||||||
Payable for Trustees’ compensation | 233 | |||||||
Deferred country tax expense payable | 21,892 | |||||||
Accrued expenses and other liabilities | 122,210 | |||||||
Total liabilities | $303,657 | |||||||
Net assets | $125,546,230 | |||||||
Net assets consist of | ||||||||
Paid-in capital | $122,251,901 | |||||||
Unrealized appreciation (depreciation) on investments and translation of assets and liabilities in foreign currencies | (3,344,685 | ) | ||||||
Accumulated net realized gain (loss) on investments and foreign currency transactions | 5,255,504 | |||||||
Undistributed net investment income | 1,383,510 | |||||||
Net assets | $125,546,230 | |||||||
Shares of beneficial interest outstanding | 9,107,554 |
| Net assets | Shares outstanding | Net asset value per share | ||||||||||
Initial Class | $88,928,002 | 6,423,161 | $13.84 | |||||||||
Service Class | 36,618,228 | 2,684,393 | 13.64 | |||||||||
See Notes to Financial Statements
10
Table of Contents
MFS Emerging Markets Equity Portfolio
FINANCIAL STATEMENTS | STATEMENT OF OPERATIONS
This statement describes how much your fund earned in investment income and accrued in expenses. It also describes any gains and/or losses generated by fund operations.
| Year ended 12/31/11 | ||||||||
| Net investment income | ||||||||
Income | ||||||||
Dividends | $3,855,263 | |||||||
Interest | 1,482 | |||||||
Dividends from underlying affiliated funds | 1,810 | |||||||
Foreign taxes withheld | (323,183 | ) | ||||||
Total investment income | $3,535,372 | |||||||
Expenses | ||||||||
Management fee | $1,409,081 | |||||||
Distribution and/or service fees | 94,052 | |||||||
Shareholder servicing costs | 14,568 | |||||||
Administrative services fee | 45,266 | |||||||
Trustees’ compensation | 15,714 | |||||||
Custodian fee | 223,739 | |||||||
Shareholder communications | 7,211 | |||||||
Auditing fees | 70,483 | |||||||
Legal fees | 5,403 | |||||||
Miscellaneous | 32,166 | |||||||
Total expenses | $1,917,683 | |||||||
Fees paid indirectly | (32 | ) | ||||||
Net expenses | $1,917,651 | |||||||
Net investment income | $1,617,721 | |||||||
Realized and unrealized gain (loss) on investments and foreign currency transactions | ||||||||
Realized gain (loss) (identified cost basis) | ||||||||
Investment transactions (net of $17,913 country tax) | $5,394,355 | |||||||
Foreign currency transactions | (197,991 | ) | ||||||
Net realized gain (loss) on investments and foreign currency transactions | $5,196,364 | |||||||
Change in unrealized appreciation (depreciation) | ||||||||
Investments (net of $119,540 decrease in deferred country tax) | $(33,417,831 | ) | ||||||
Translation of assets and liabilities in foreign currencies | (2,566 | ) | ||||||
Net unrealized gain (loss) on investments and foreign currency translation | $(33,420,397 | ) | ||||||
Net realized and unrealized gain (loss) on investments and foreign currency | $(28,224,033 | ) | ||||||
Change in net assets from operations | $(26,606,312 | ) |
See Notes to Financial Statements
11
Table of Contents
MFS Emerging Markets Equity Portfolio
FINANCIAL STATEMENTS | STATEMENTS OF CHANGES IN NET ASSETS
These statements describe the increases and/or decreases in net assets resulting from operations, any distributions, and any shareholder transactions.
For years ended 12/31 | 2011 | 2010 | ||||||
Change in net assets | ||||||||
From operations | ||||||||
Net investment income | $1,617,721 | $877,095 | ||||||
Net realized gain (loss) on investments and foreign currency transactions | 5,196,364 | 11,148,151 | ||||||
Net unrealized gain (loss) on investments and foreign currency translation | (33,420,397 | ) | 13,172,678 | |||||
Change in net assets from operations | $(26,606,312 | ) | $25,197,924 | |||||
Distributions declared to shareholders | ||||||||
From net investment income | $(662,107 | ) | $(710,049 | ) | ||||
From net realized gain on investments | (5,626,393 | ) | — | |||||
Total distributions declared to shareholders | $(6,288,500 | ) | $(710,049 | ) | ||||
Change in net assets from fund share transactions | $21,979,094 | $15,585,410 | ||||||
Total change in net assets | $(10,915,718 | ) | $40,073,285 | |||||
Net assets | ||||||||
At beginning of period | 136,461,948 | 96,388,663 | ||||||
At end of period (including undistributed net investment income of $1,383,510 and | $125,546,230 | $136,461,948 |
See Notes to Financial Statements
12
Table of Contents
MFS Emerging Markets Equity Portfolio
FINANCIAL STATEMENTS | FINANCIAL HIGHLIGHTS
The financial highlights table is intended to help you understand the fund’s financial performance for the past 5 years. Certain information reflects financial results for a single fund share. The total returns in the table represent the rate by which an investor would have earned (or lost) on an investment in the fund share class (assuming reinvestment of all distributions) held for the entire period.
| Initial Class | Years ended 12/31 | |||||||||||||||||||
| 2011 | 2010 | 2009 | 2008 | 2007 | ||||||||||||||||
Net asset value, beginning of period | $17.88 | $14.54 | $8.88 | $26.15 | $24.52 | |||||||||||||||
| Income (loss) from investment operations | ||||||||||||||||||||
Net investment income (d) | $0.21 | $0.13 | $0.14 | $0.33 | $0.30 | |||||||||||||||
Net realized and unrealized gain (loss) on investments | (3.46 | ) | 3.31 | 5.80 | (11.19 | ) | 7.13 | |||||||||||||
Total from investment operations | $(3.25 | ) | $3.44 | $5.94 | $(10.86 | ) | $7.43 | |||||||||||||
| Less distributions declared to shareholders | ||||||||||||||||||||
From net investment income | $(0.09 | ) | $(0.10 | ) | $(0.28 | ) | $(0.27 | ) | $(0.55 | ) | ||||||||||
From net realized gain on investments | (0.70 | ) | — | — | (6.14 | ) | (5.25 | ) | ||||||||||||
Total distributions declared to shareholders | $(0.79 | ) | $(0.10 | ) | $(0.28 | ) | $(6.41 | ) | $(5.80 | ) | ||||||||||
Net asset value, end of period (x) | $13.84 | $17.88 | $14.54 | $8.88 | $26.15 | |||||||||||||||
Total return (%) (k)(r)(s)(x) | (18.58 | ) | 23.82 | 68.58 | (55.11 | ) | 35.71 | |||||||||||||
| Ratios (%) (to average net assets) and Supplemental data: | ||||||||||||||||||||
Expenses before expense reductions (f) | 1.36 | 1.55 | 1.71 | 1.85 | 1.55 | |||||||||||||||
Expenses after expense reductions (f) | 1.36 | 1.40 | 1.40 | 1.61 | N/A | |||||||||||||||
Net investment income | 1.28 | 0.86 | 1.24 | 1.94 | 1.22 | |||||||||||||||
Portfolio turnover | 34 | 39 | 66 | 93 | 96 | |||||||||||||||
Net assets at end of period (000 omitted) | $88,928 | $99,316 | $71,026 | $33,411 | $94,193 | |||||||||||||||
| Service Class | Years ended 12/31 | |||||||||||||||||||
| 2011 | 2010 | 2009 | 2008 | 2007 | ||||||||||||||||
Net asset value, beginning of period | $17.64 | $14.36 | $8.76 | $25.88 | $24.33 | |||||||||||||||
| Income (loss) from investment operations | ||||||||||||||||||||
Net investment income (d) | $0.16 | $0.09 | $0.11 | $0.29 | $0.23 | |||||||||||||||
Net realized and unrealized gain (loss) on investments | (3.40 | ) | 3.28 | 5.73 | (11.06 | ) | 7.07 | |||||||||||||
Total from investment operations | $(3.24 | ) | $3.37 | $5.84 | $(10.77 | ) | $7.30 | |||||||||||||
| Less distributions declared to shareholders | ||||||||||||||||||||
From net investment income | $(0.06 | ) | $(0.09 | ) | $(0.24 | ) | $(0.21 | ) | $(0.50 | ) | ||||||||||
From net realized gain on investments | (0.70 | ) | — | — | (6.14 | ) | (5.25 | ) | ||||||||||||
Total distributions declared to shareholders | $(0.76 | ) | $(0.09 | ) | $(0.24 | ) | $(6.35 | ) | $(5.75 | ) | ||||||||||
Net asset value, end of period (x) | $13.64 | $17.64 | $14.36 | $8.76 | $25.88 | |||||||||||||||
Total return (%) (k)(r)(s)(x) | (18.77 | ) | 23.54 | 68.13 | (55.23 | ) | 35.38 | |||||||||||||
| Ratios (%) (to average net assets) and Supplemental data: | ||||||||||||||||||||
Expenses before expense reductions (f) | 1.61 | 1.80 | 1.95 | 2.10 | 1.81 | |||||||||||||||
Expenses after expense reductions (f) | 1.61 | 1.65 | 1.65 | 1.86 | N/A | |||||||||||||||
Net investment income | 1.02 | 0.62 | 0.93 | 1.70 | 0.96 | |||||||||||||||
Portfolio turnover | 34 | 39 | 66 | 93 | 96 | |||||||||||||||
Net assets at end of period (000 omitted) | $36,618 | $37,146 | $25,363 | $9,342 | $23,614 | |||||||||||||||
| (d) | Per share data is based on average shares outstanding. |
| (f) | Ratios do not reflect reductions from fees paid indirectly, if applicable. |
| (k) | The total return does not reflect expenses that apply to separate accounts. Inclusion of these charges would reduce the total return figures for all periods shown. |
| (r) | Certain expenses have been reduced without which performance would have been lower. |
| (s) | From time to time the fund may receive proceeds from litigation settlements, without which performance would be lower. |
| (x) | The net asset values per share and total returns have been calculated on net assets which include adjustments made in accordance with U.S. generally accepted accounting principles required at period end for financial reporting purposes. |
See Notes to Financial Statements
13
Table of Contents
MFS Emerging Markets Equity Portfolio
| (1) | Business and Organization |
MFS Emerging Markets Equity Portfolio (the fund) is a series of MFS Variable Insurance Trust II (the trust). The trust is organized as a Massachusetts business trust and is registered under the Investment Company Act of 1940, as amended, as an open-end management investment company. The shareholders of each series of the trust are separate accounts of insurance companies, which offer variable annuity and/or life insurance products, and qualified retirement and pension plans.
| (2) | Significant Accounting Policies |
General – The preparation of financial statements in conformity with U.S. generally accepted accounting principles requires management to make estimates and assumptions that affect the reported amounts of assets and liabilities, and disclosure of contingent assets and liabilities at the date of the financial statements and the reported amounts of revenues and expenses during the reporting period. Actual results could differ from those estimates. In the preparation of these financial statements, management has evaluated subsequent events occurring after the date of the fund’s Statement of Assets and Liabilities through the date that the financial statements were issued. The fund invests in foreign securities, including securities of emerging market issuers. Investments in foreign securities are vulnerable to the effects of changes in the relative values of the local currency and the U.S. dollar and to the effects of changes in each country’s legal, political, and economic environment. The markets of emerging markets countries are generally more volatile than the markets of developed countries with more mature economies. All of the risks of investing in foreign securities previously described are heightened when investing in emerging markets countries.
In December 2011, the Financial Accounting Standards Board issued Accounting Standards Update 2011-11, Balance Sheet (Topic 210) – Disclosures about Offsetting Assets and Liabilities (“ASU 2011-11”). Effective for annual reporting periods beginning on or after January 1, 2013 and interim periods within those annual periods, ASU 2011-11 is intended to enhance disclosure requirements on the offsetting of financial assets and liabilities. Although still evaluating the potential impacts of ASU 2011-11 to the fund, management expects that the impact of the fund’s adoption will be limited to additional financial statement disclosures.
Investment Valuations – Equity securities, including restricted equity securities, are generally valued at the last sale or official closing price as provided by a third-party pricing service on the market or exchange on which they are primarily traded. Equity securities, for which there were no sales reported that day, are generally valued at the last quoted daily bid quotation as provided by a third-party pricing service on the market or exchange on which such securities are primarily traded. Equity securities held short, for which there were no sales reported for that day, are generally valued at the last quoted daily ask quotation as provided by a third-party pricing service on the market or exchange on which such securities are primarily traded. Short-term instruments with a maturity at issuance of 60 days or less generally are valued at amortized cost, which approximates market value. Open-end investment companies are generally valued at net asset value per share. Securities and other assets generally valued on the basis of information from a third-party pricing service may also be valued at a broker/dealer bid quotation. Values obtained from third-party pricing services can utilize both transaction data and market information such as yield, quality, coupon rate, maturity, type of issue, trading characteristics, and other market data. The values of foreign securities and other assets and liabilities expressed in foreign currencies are converted to U.S. dollars using the mean of bid and asked prices for rates provided by a third-party pricing service.
The Board of Trustees has delegated primary responsibility for determining or causing to be determined the value of the fund’s investments (including any fair valuation) to the adviser pursuant to valuation policies and procedures approved by the Board. If the adviser determines that reliable market quotations are not readily available, investments are valued at fair value as determined in good faith by the adviser in accordance with such procedures under the oversight of the Board of Trustees. Under the fund’s valuation policies and procedures, market quotations are not considered to be readily available for most types of debt instruments and floating rate loans and many types of derivatives. These investments are generally valued at fair value based on information from third-party pricing services. In addition, investments may be valued at fair value if the adviser determines that an investment’s value has been materially affected by events occurring after the close of the exchange or market on which the investment is principally traded (such as foreign exchange or market) and prior to the determination of the fund’s net asset value, or after the halting of trading of a specific security where trading does not resume prior to the close of the exchange or market on which the security is principally traded. Events that occur on a frequent basis after foreign markets close (such as developments in foreign markets and significant movements in the U.S. markets) and prior to the determination of the fund’s net asset value may be deemed to have a material effect on the value of securities traded in foreign markets. Accordingly, the fund’s foreign equity securities may often be valued at fair value. The adviser generally relies on third-party pricing services or other information (such as the correlation with price movements of similar securities in the same or other markets; the type, cost and investment characteristics of the security; the business and financial condition of the issuer; and trading and other market data) to assist in determining whether to fair value and at what value to fair value an
14
Table of Contents
MFS Emerging Markets Equity Portfolio
Notes to Financial Statements – continued
investment. The value of an investment for purposes of calculating the fund’s net asset value can differ depending on the source and method used to determine value. When fair valuation is used, the value of an investment used to determine the fund’s net asset value may differ from quoted or published prices for the same investment. There can be no assurance that the fund could obtain the fair value assigned to an investment if it were to sell the investment at the same time at which the fund determines its net asset value per share.
Various inputs are used in determining the value of the fund’s assets or liabilities. These inputs are categorized into three broad levels. In certain cases, the inputs used to measure fair value may fall into different levels of the fair value hierarchy. In such cases, an investment’s level within the fair value hierarchy is based on the lowest level of input that is significant to the fair value measurement. The fund’s assessment of the significance of a particular input to the fair value measurement in its entirety requires judgment, and considers factors specific to the investment. Level 1 includes unadjusted quoted prices in active markets for identical assets or liabilities. Level 2 includes other significant observable market-based inputs (including quoted prices for similar securities, interest rates, prepayment speed, and credit risk). Level 3 includes unobservable inputs, which may include the adviser’s own assumptions in determining the fair value of investments. The following is a summary of the levels used as of December 31, 2011 in valuing the fund’s assets or liabilities:
| Investments at Value | Level 1 | Level 2 | Level 3 | Total | ||||||||||||
| Equity Securities: | ||||||||||||||||
Brazil | $21,737,631 | $— | $— | $21,737,631 | ||||||||||||
China | 16,001,016 | — | — | 16,001,016 | ||||||||||||
South Korea | 12,923,689 | 2,334,606 | — | 15,258,295 | ||||||||||||
Taiwan | 9,712,555 | — | — | 9,712,555 | ||||||||||||
South Africa | 3,521,937 | 5,820,452 | — | 9,342,389 | ||||||||||||
India | 8,774,994 | — | — | 8,774,994 | ||||||||||||
Hong Kong | 7,264,683 | — | — | 7,264,683 | ||||||||||||
Russia | 4,890,779 | 1,911,378 | — | 6,802,157 | ||||||||||||
Mexico | 5,861,335 | 400,372 | — | 6,261,707 | ||||||||||||
Other Countries | 21,294,767 | 1,641,070 | — | 22,935,837 | ||||||||||||
| Mutual Funds | 1,374,005 | — | — | 1,374,005 | ||||||||||||
| Total Investments | $113,357,391 | $12,107,878 | $— | $125,465,269 | ||||||||||||
For further information regarding security characteristics, see the Portfolio of Investments.
Foreign Currency Translation – Purchases and sales of foreign investments, income, and expenses are converted into U.S. dollars based upon currency exchange rates prevailing on the respective dates of such transactions or on the reporting date for foreign denominated receivables and payables. Gains and losses attributable to foreign currency exchange rates on sales of securities are recorded for financial statement purposes as net realized gains and losses on investments. Gains and losses attributable to foreign exchange rate movements on receivables, payables, income and expenses are recorded for financial statement purposes as foreign currency transaction gains and losses. That portion of both realized and unrealized gains and losses on investments that results from fluctuations in foreign currency exchange rates is not separately disclosed.
Security Loans – State Street Bank and Trust Company (“State Street”), as lending agent, loans the securities of the fund to certain qualified institutions (the “Borrowers”) approved by the fund. The loans are collateralized by cash and/or U.S. Treasury and federal agency obligations in an amount typically at least equal to the market value of the securities loaned. The market value of the loaned securities is determined at the close of business of the fund and any additional required collateral is delivered to the fund on the next business day. State Street provides the fund with indemnification against Borrower default. The fund bears the risk of loss with respect to the investment of cash collateral. On loans collateralized by cash, the cash collateral is invested in a money market fund or short-term securities. A portion of the income generated upon investment of the collateral is remitted to the Borrowers, and the remainder is allocated between the fund and the lending agent. On loans collateralized by U.S. Treasury and/or federal agency obligations, a fee is received from the Borrower, and is allocated between the fund and the lending agent. Income from securities lending is included in interest income on the Statement of Operations. The dividend and interest income earned on the securities loaned is accounted for in the same manner as other dividend and interest income.
Indemnifications – Under the fund’s organizational documents, its officers and Trustees may be indemnified against certain liabilities and expenses arising out of the performance of their duties to the fund. Additionally, in the normal course of business, the fund enters into agreements with service providers that may contain indemnification clauses. The fund’s maximum exposure under these agreements is unknown as this would involve future claims that may be made against the fund that have not yet occurred.
15
Table of Contents
MFS Emerging Markets Equity Portfolio
Notes to Financial Statements – continued
Investment Transactions and Income – Investment transactions are recorded on the trade date. Interest income is recorded on the accrual basis. Dividends received in cash are recorded on the ex-dividend date. Certain dividends from foreign securities will be recorded when the fund is informed of the dividend if such information is obtained subsequent to the ex-dividend date. Dividend and interest payments received in additional securities are recorded on the ex-dividend or ex-interest date in an amount equal to the value of the security on such date.
The fund may receive proceeds from litigation settlements. Any proceeds received from litigation involving portfolio holdings are reflected in the Statement of Operations in realized gain/loss if the security has been disposed of by the fund or in unrealized gain/loss if the security is still held by the fund. Any other proceeds from litigation not related to portfolio holdings are reflected as other income in the Statement of Operations.
Fees Paid Indirectly – The fund’s custody fee may be reduced according to an arrangement that measures the value of cash deposited with the custodian by the fund. This amount, for the year ended December 31, 2011, is shown as a reduction of total expenses on the Statement of Operations.
Tax Matters and Distributions – The fund intends to qualify as a regulated investment company, as defined under Subchapter M of the Internal Revenue Code, and to distribute all of its taxable income, including realized capital gains. As a result, no provision for federal income tax is required. The fund’s federal tax returns for the prior three fiscal years remain subject to examination by the Internal Revenue Service. Foreign taxes have been accrued by the fund in the accompanying financial statements.
Distributions to shareholders are recorded on the ex-dividend date. Income and capital gain distributions are determined in accordance with income tax regulations, which may differ from U.S. generally accepted accounting principles. Certain capital accounts in the financial statements are periodically adjusted for permanent differences in order to reflect their tax character. These adjustments have no impact on net assets or net asset value per share. Temporary differences which arise from recognizing certain items of income, expense, gain or loss in different periods for financial statement and tax purposes will reverse at some time in the future. Distributions in excess of net investment income or net realized gains are temporary overdistributions for financial statement purposes resulting from differences in the recognition or classification of income or distributions for financial statement and tax purposes.
Book/tax differences primarily relate to wash sale loss deferrals.
The tax character of distributions declared to shareholders for the last two fiscal years is as follows:
| 12/31/11 | 12/31/10 | |||||||
| Ordinary income (including any short-term capital gains) | $810,319 | $710,049 | ||||||
| Long-term capital gain | 5,478,181 | — | ||||||
| Total distributions | $6,288,500 | $710,049 | ||||||
The federal tax cost and the tax basis components of distributable earnings were as follows:
| As of 12/31/11 | ||||
| Cost of investments | $129,152,091 | |||
| Gross appreciation | 14,415,884 | |||
| Gross depreciation | (18,102,706 | ) | ||
| Net unrealized appreciation (depreciation) | $(3,686,822 | ) | ||
| Undistributed ordinary income | 2,230,466 | |||
| Undistributed long-term capital gain | 4,785,127 | |||
| Other temporary differences | (34,442 | ) |
Multiple Classes of Shares of Beneficial Interest – The fund offers multiple classes of shares, which differ in their respective distribution and/or service fees. The fund’s income, realized and unrealized gain (loss), and common expenses are allocated to shareholders based on the daily net assets of each class. Dividends are declared separately for each class. Differences in per share dividend rates are generally due to differences in separate class expenses. The fund’s distributions declared to shareholders as reported on the Statements of Changes in Net Assets are presented by class as follows:
| From net investment income | From net realized gain on investments | |||||||||||||||
| Year ended 12/31/11 | Year ended 12/31/10 | Year ended 12/31/11 | Year ended 12/31/10 | |||||||||||||
| Initial Class | $526,690 | $542,071 | $4,031,341 | $— | ||||||||||||
| Service Class | 135,417 | 167,978 | 1,595,052 | — | ||||||||||||
| Total | $662,107 | $710,049 | $5,626,393 | $— | ||||||||||||
16
Table of Contents
MFS Emerging Markets Equity Portfolio
Notes to Financial Statements – continued
| (3) | Transactions with Affiliates |
Investment Adviser – The fund has an investment advisory agreement with MFS to provide overall investment management and related administrative services and facilities to the fund. The management fee is computed daily and paid monthly at the following annual rates:
| First $500 million of average daily net assets | 1.05% | |||
| Average daily net assets in excess of $500 million | 1.00% |
The management fee incurred for the year ended December 31, 2011 was equivalent to an annual effective rate of 1.05% of the fund’s average daily net assets.
The investment adviser has agreed in writing to pay a portion of the fund’s total annual operating expenses, exclusive of interest, taxes, extraordinary expenses, brokerage and transaction costs, and investment-related expenses, such that total annual operating expenses do not exceed 1.40% of average daily net assets for the Initial Class shares and 1.65% of average daily net assets for the Service Class shares. This written agreement will continue until April 30, 2013. For the year ended December 31, 2011, the fund’s actual operating expenses did not exceed the limit and therefore, the investment adviser did not pay any portion of the fund’s expenses related to this agreement.
Distributor – MFS Fund Distributors, Inc. (MFD), a wholly-owned subsidiary of MFS, is the distributor of shares of the fund. The Trustees have adopted a distribution plan for the Service Class shares pursuant to Rule 12b-1 under the Investment Company Act of 1940.
The fund’s distribution plan provides that the fund will pay MFD distribution and/or service fees equal to 0.25% per annum of its average daily net assets attributable to Service Class shares as partial consideration for services performed and expenses incurred by MFD and financial intermediaries (including participating insurance companies that invest in the fund to fund variable annuity and variable life insurance contracts, sponsors of qualified retirement and pension plans that invest in the fund, and affiliates of these participating insurance companies and plan sponsors) in connection with the sale and distribution of the Service Class shares. MFD may subsequently pay all, or a portion, of the distribution and/or service fees to financial intermediaries.
Shareholder Servicing Agent – MFS Service Center, Inc. (MFSC), a wholly-owned subsidiary of MFS, receives a fee from the fund for its services as shareholder servicing agent. For the year ended December 31, 2011, the fee was $14,546, which equated to 0.0108% annually of the fund’s average daily net assets. MFSC also receives payment from the fund for out-of-pocket expenses paid by MFSC on behalf of the fund. For the year ended December 31, 2011, these costs amounted to $22.
Administrator – MFS provides certain financial, legal, shareholder communications, compliance, and other administrative services to the fund. Under an administrative services agreement, the fund partially reimburses MFS the costs incurred to provide these services. The fund is charged an annual fixed amount of $17,500 plus a fee based on average daily net assets. The administrative services fee incurred for the year ended December 31, 2011 was equivalent to an annual effective rate of 0.0337% of the fund’s average daily net assets.
Trustees’ and Officers’ Compensation – The fund pays compensation to Trustees in the form of a retainer, attendance fees, and additional compensation to the Board chairperson. The fund does not pay compensation directly to officers of the fund who are also officers of the investment adviser, all of whom receive remuneration for their services to the fund from MFS. Certain officers of the fund are officers or directors of MFS, MFD, and MFSC.
Other – This fund and certain other funds managed by MFS (the funds) have entered into services agreements (the Agreements) which provide for payment of fees by the funds to Tarantino LLC and Griffin Compliance LLC in return for the provision of services of an Independent Chief Compliance Officer (ICCO) and Assistant ICCO, respectively, for the funds. The ICCO and Assistant ICCO are officers of the funds and the sole members of Tarantino LLC and Griffin Compliance LLC, respectively. The funds can terminate the Agreements with Tarantino LLC and Griffin Compliance LLC at any time under the terms of the Agreements. MFS has agreed to bear all expenses associated with office space, other administrative support, and supplies provided to the ICCO and Assistant ICCO. For the year ended December 31, 2011, the aggregate fees paid by the fund to Tarantino LLC and Griffin Compliance LLC were $2,228 and are included in miscellaneous expense on the Statement of Operations.
The fund invests in the MFS Institutional Money Market Portfolio which is managed by MFS and seeks a high level of current income consistent with preservation of capital and liquidity. Income earned on this investment is included in dividends from underlying affiliated funds on the Statement of Operations. This money market fund does not pay a management fee to MFS.
17
Table of Contents
MFS Emerging Markets Equity Portfolio
Notes to Financial Statements – continued
| (4) | Portfolio Securities |
Purchases and sales of investments, other than U.S. Government securities, purchased option transactions, and short-term obligations, aggregated $61,226,974 and $44,988,605, respectively.
| (5) | Shares of Beneficial Interest |
The fund’s Declaration of Trust permits the Trustees to issue an unlimited number of full and fractional shares of beneficial interest. Transactions in fund shares were as follows:
| Year ended 12/31/11 | Year ended 12/31/10 | |||||||||||||||
| Shares | Amount | Shares | Amount | |||||||||||||
| Shares sold | ||||||||||||||||
Initial Class | 1,330,112 | $21,129,082 | 1,292,090 | $19,587,990 | ||||||||||||
Service Class | 1,005,433 | 15,977,133 | 1,105,275 | 16,898,112 | ||||||||||||
| 2,335,545 | $37,106,215 | 2,397,365 | $36,486,102 | |||||||||||||
| Shares issued to shareholders in reinvestment of distributions | ||||||||||||||||
Initial Class | 300,463 | $4,558,031 | 35,546 | $542,071 | ||||||||||||
Service Class | 115,673 | 1,730,469 | 11,147 | 167,978 | ||||||||||||
| 416,136 | $6,288,500 | 46,693 | $710,049 | |||||||||||||
| Shares reacquired | ||||||||||||||||
Initial Class | (762,765 | ) | $(12,544,649 | ) | (657,613 | ) | $(9,982,626 | ) | ||||||||
Service Class | (542,955 | ) | (8,870,972 | ) | (776,271 | ) | (11,628,115 | ) | ||||||||
| (1,305,720 | ) | $(21,415,621 | ) | (1,433,884 | ) | $(21,610,741 | ) | |||||||||
| Net change | ||||||||||||||||
Initial Class | 867,810 | $13,142,464 | 670,023 | $10,147,435 | ||||||||||||
Service Class | 578,151 | 8,836,630 | 340,151 | 5,437,975 | ||||||||||||
| 1,445,961 | $21,979,094 | 1,010,174 | $15,585,410 | |||||||||||||
| (6) | Line of Credit |
The fund and certain other funds managed by MFS participate in a $1.1 billion unsecured committed line of credit, subject to a $1 billion sublimit, provided by a syndication of banks under a credit agreement. Borrowings may be made for temporary financing needs. Interest is charged to each fund, based on its borrowings, generally at a rate equal to the higher of the Federal Reserve funds rate or one month LIBOR plus an agreed upon spread. A commitment fee, based on the average daily, unused portion of the committed line of credit, is allocated among the participating funds at the end of each calendar quarter. In addition, the fund and other funds managed by MFS have established unsecured uncommitted borrowing arrangements with certain banks for temporary financing needs. Interest is charged to each fund, based on its borrowings, at a rate equal to the Federal Reserve funds rate plus an agreed upon spread. For the year ended December 31, 2011, the fund’s commitment fee and interest expense were $1,040 and $0, respectively, and are included in miscellaneous expense on the Statement of Operations.
| (7) | Transactions in Underlying Affiliated Funds – Affiliated Issuers |
An affiliated issuer may be considered one in which the fund owns 5% or more of the outstanding voting securities, or a company which is under common control. For the purposes of this report, the fund assumes the following to be affiliated issuers:
| Underlying Affiliated Funds | Beginning Shares/Par Amount | Acquisitions Shares/Par Amount | Dispositions Shares/Par Amount | Ending Shares/Par Amount | ||||||||||||
| MFS Institutional Money Market Portfolio | 717,813 | 37,740,568 | (37,084,376 | ) | 1,374,005 | |||||||||||
| Underlying Affiliated Funds | Realized Gain (Loss) | Capital Gain Distributions | Dividend Income | Ending Value | ||||||||||||
| MFS Institutional Money Market Portfolio | $— | $— | $1,810 | $1,374,005 | ||||||||||||
18
Table of Contents
MFS Emerging Markets Equity Portfolio
REPORT OF INDEPENDENT REGISTERED PUBLIC ACCOUNTING FIRM
To the Board of Trustees of MFS Variable Insurance Trust II and the Shareholders of
MFS Emerging Markets Equity Portfolio:
We have audited the accompanying statement of assets and liabilities, including the portfolio of investments, of MFS Emerging Markets Equity Portfolio (the “Fund”) (one of the portfolios comprising MFS Variable Insurance Trust II) as of December 31, 2011, and the related statement of operations for the year then ended, the statements of changes in net assets for each of the two years in the period then ended, and the financial highlights for each of the five years in the period then ended. These financial statements and financial highlights are the responsibility of the Fund’s management. Our responsibility is to express an opinion on these financial statements and financial highlights based on our audits.
We conducted our audits in accordance with the standards of the Public Company Accounting Oversight Board (United States). Those standards require that we plan and perform the audit to obtain reasonable assurance about whether the financial statements and financial highlights are free of material misstatement. The Fund is not required to have, nor were we engaged to perform, an audit of its internal control over financial reporting. Our audits included consideration of internal control over financial reporting as a basis for designing audit procedures that are appropriate in the circumstances, but not for the purpose of expressing an opinion on the effectiveness of the Fund’s internal control over financial reporting. Accordingly, we express no such opinion. An audit also includes examining, on a test basis, evidence supporting the amounts and disclosures in the financial statements, assessing the accounting principles used and significant estimates made by management, as well as evaluating the overall financial statement presentation. Our procedures included confirmation of securities owned as of December 31, 2011, by correspondence with the custodian and brokers; where replies were not received from brokers, we performed other auditing procedures. We believe that our audits provide a reasonable basis for our opinion.
In our opinion, the financial statements and financial highlights referred to above present fairly, in all material respects, the financial position of MFS Emerging Markets Equity Portfolio as of December 31, 2011, the results of its operations for the year then ended, the changes in its net assets for each of the two years in the period then ended, and the financial highlights for each of the five years in the period then ended, in conformity with accounting principles generally accepted in the United States of America.
DELOITTE & TOUCHE LLP
Boston, Massachusetts
February 15, 2012
19
Table of Contents
MFS Emerging Markets Equity Portfolio
RESULTS OF SHAREHOLDER MEETING (unaudited)
At a special meeting of shareholders of MFS Emerging Markets Equity Portfolio, which was held on December 1, 2011, the following actions were taken for which shareholders of all series of MFS Variable Insurance Trust II voted together as a single class with respect to Item 1 and shareholders of MFS Emerging Markets Equity Portfolio voted as a separate class with respect to Items 2 and 3:
Item 1: Election of ten Trustees as members of the Board of Trustees of the Trust effective January 1, 2012:
| Number of Shares | ||||||||
| For | Withheld Authority | |||||||
| Robert E. Butler | 681,916,712.8686 | 46,472,894.9218 | ||||||
| Maureen R. Goldfarb | 682,835,794.8512 | 45,553,812.9392 | ||||||
| David H. Gunning | 681,500,267.3085 | 46,889,340.4819 | ||||||
| William R. Gutow | 681,050,223.5547 | 47,339,384.2357 | ||||||
| Michael Hegarty | 682,477,088.8584 | 45,912,518.9320 | ||||||
| John P. Kavanaugh | 683,794,425.4269 | 44,595,182.3635 | ||||||
| Robert J. Manning | 682,699,559.7374 | 45,690,048.0530 | ||||||
| J. Dale Sherratt | 681,362,743.0513 | 47,026,864.7391 | ||||||
| Laurie J. Thomsen | 683,408,094.0000 | 44,981,513.7904 | ||||||
| Robert W. Uek | 681,424,852.0247 | 46,964,755.7657 | ||||||
Item 2: To approve a new investment advisory agreement dated January 1, 2012, between the Trust, on behalf of MFS Emerging Markets Equity Portfolio, and MFS:
| Number of Shares | ||||||||||||
| For | Against | Withheld Authority | ||||||||||
| 7,559,655.3393 | 345,911.7359 | 610,814.6511 | ||||||||||
Item 3: To approve revisions to and restatements of certain fundamental investment restrictions of MFS Emerging Markets Equity Portfolio effective January 1, 2012 as detailed below:
| Number of Shares | ||||||||||||||
| For | Against | Withheld Authority | ||||||||||||
| A. | Borrowing | 7,122,953.4945 | 640,963.9162 | 752,464.3156 | ||||||||||
| B. | Underwriting Securities | 7,406,491.8577 | 353,709.2829 | 756,180.5857 | ||||||||||
| C. | Issuance of Senior Securities | 7,521,744.0410 | 346,674.9782 | 647,962.7071 | ||||||||||
| D. | Lending of Money or Securities | 7,123,640.3524 | 646,427.1193 | 746,314.2546 | ||||||||||
| E. | Purchases or Sales of Real Estate; Interests in Oil, Gas or Mineral Leases; and Commodities | 7,652,756.3372 | 239,765.8718 | 623,859.5173 | ||||||||||
| F. | Industry Concentration | 7,529,553.2222 | 317,862.3950 | 668,966.1091 | ||||||||||
20
Table of Contents
MFS Emerging Markets Equity Portfolio
TRUSTEES AND OFFICERS – IDENTIFICATION AND BACKGROUND
The Trustees and officers of the Trust, as of February 1, 2012, are listed below, together with their principal occupations during the past five years. (Their titles may have varied during that period.) The address of each Trustee and officer is 500 Boylston Street, Boston, Massachusetts 02116.
Name, Age | Position(s) with Fund | Trustee/Officer Since (h) | Principal Occupations | Other Directorships (j) | ||||
| INTERESTED TRUSTEES | ||||||||
Robert J. Manning (k) (age 48) | Trustee | February 2004 | Massachusetts Financial Services Company, Chairman, Chief Executive Officer and Director; President (until December 2009); Chief Investment Officer (until July 2010) | N/A | ||||
| INDEPENDENT TRUSTEES | ||||||||
David H. Gunning (age 69) | Trustee and Chair of Trustees | January 2004 | Retired; Cleveland-Cliffs Inc. (mining products and service provider), Vice Chairman/Director (until May 2007) | Lincoln Electric Holdings, Inc. (welding equipment manufacturer), Director; Development Alternatives, Inc. (consulting), Director/Non-Executive Chairman; Portman Limited (mining), Director (until 2008) | ||||
Robert E. Butler (age 70) | Trustee | January 2006 | Consultant – investment company industry regulatory and compliance matters | N/A | ||||
Maureen R. Goldfarb (age 56) | Trustee | January 2009 | Private investor | N/A | ||||
William R. Gutow (age 70) | Trustee | December 1993 | Private investor and real estate consultant; Capitol Entertainment Management Company (video franchise), Vice Chairman | Atlantic Coast Tan (tanning salons), Vice Chairman (until 2007); Texas Donuts (donut franchise), Vice Chairman (until 2010) | ||||
Michael Hegarty (age 67) | Trustee | December 2004 | Private investor | N/A | ||||
John P. Kavanaugh (age 57) | Trustee | January 2009 | Private investor; The Hanover Insurance Group, Inc., Vice President and Chief Investment Officer (until 2006); Allmerica Investment Trust, Allmerica Securities Trust and Opus Investment Trust (investment companies), Chairman, President and Trustee (until 2006) | N/A | ||||
J. Dale Sherratt (age 73) | Trustee | June 1989 | Insight Resources, Inc. (acquisition planning specialists), President; Wellfleet Investments (investor in health care companies), Managing General Partner | N/A | ||||
Laurie J. Thomsen (age 54) | Trustee | March 2005 | Private investor; New Profit, Inc. (venture philanthropy), Executive Partner (until 2010) | The Travelers Companies (property and casualty insurance), Director | ||||
Robert W. Uek (age 70) | Trustee | January 2006 | Consultant to investment company industry | N/A | ||||
| OFFICERS | ||||||||
John M. Corcoran (k) (age 46) | President | October 2008 | Massachusetts Financial Services Company, Senior Vice President (since October 2008); State Street Bank and Trust (financial services provider), Senior Vice President, (until September 2008) | N/A | ||||
| Christopher R. Bohane (k) (age 38) | Assistant Secretary and Assistant Clerk | July 2005 | Massachusetts Financial Services Company, Vice President and Senior Counsel | N/A | ||||
Kino Clark (k) (age 43) | Assistant Treasurer | January 2012 | Massachusetts Financial Services Company, Assistant Vice President | N/A | ||||
21
Table of Contents
MFS Emerging Markets Equity Portfolio
Trustees and Officers – continued
Name, Age | Position(s) with Fund | Trustee/Officer Since (h) | Principal Occupations | Other Directorships (j) | ||||
Ethan D. Corey (k) (age 48) | Assistant Secretary and Assistant Clerk | July 2005 | Massachusetts Financial Services Company, Senior Vice President and Associate General Counsel | N/A | ||||
David L. DiLorenzo (k) (age 43) | Treasurer | July 2005 | Massachusetts Financial Services Company, Vice President | N/A | ||||
Robyn L. Griffin (age 36) | Assistant Independent Chief Compliance Officer | August 2008 | Griffin Compliance LLC (provider of compliance services), Principal (since August 2008); State Street Corporation (financial services provider), Mutual Fund Administration Assistant Vice President (October 2006 – July 2008); Liberty Mutual Group (insurance), Personal Market Assistant Controller (April 2006 – October 2006); Deloitte & Touche LLP (professional services firm). | N/A | ||||
Brian E. Langenfeld (k) (age 38) | Assistant Secretary and Assistant Clerk | June 2006 | Massachusetts Financial Services Company, Vice President and Senior Counsel | N/A | ||||
Ellen Moynihan (k) (age 54) | Assistant Treasurer | April 1997 | Massachusetts Financial Services Company, Senior Vice President | N/A | ||||
Susan S. Newton (k) (age 61) | Assistant Secretary and Assistant Clerk | May 2005 | Massachusetts Financial Services Company, Senior Vice President and Associate General Counsel | N/A | ||||
Susan A. Pereira (k) (age 41) | Assistant Secretary and Assistant Clerk | July 2005 | Massachusetts Financial Services Company, Vice President and Senior Counsel | N/A | ||||
Mark N. Polebaum (k) (age 59) | Secretary and Clerk | January 2006 | Massachusetts Financial Services Company, Executive Vice President, General Counsel and Secretary | N/A | ||||
Frank L. Tarantino (age 67) | Independent Chief Compliance Officer | June 2004 | Tarantino LLC (provider of compliance services), Principal | N/A | ||||
Richard S. Weitzel (k) (age 41) | Assistant Secretary and Assistant Clerk | October 2007 | Massachusetts Financial Services Company, Vice President and Assistant General Counsel | N/A | ||||
James O. Yost (k) (age 51) | Deputy Treasurer | September 1990 | Massachusetts Financial Services Company, Senior Vice President | N/A | ||||
| (h) | Date first appointed to serve as Trustee/officer of an MFS fund. Each Trustee has served continuously since appointment unless indicated otherwise. For the period from December 15, 2004 until February 22, 2005, Mr. Manning served as Advisory Trustee. For the period October 2008, until January 2012, Mr. Corcoran served as Treasurer of the Funds. Prior to January 2012, Messrs. DiLorenzo and Yost served as Assistant Treasurers of the Funds. |
| (j) | Directorships or trusteeships of companies required to report to the Securities and Exchange Commission (i.e., “public companies”). |
| (k) | “Interested person” of the Trust within the meaning of the Investment Company Act of 1940 (referred to as the 1940 Act), which is the principal federal law governing investment companies like the fund, as a result of position with MFS. The address of MFS is 500 Boylston Street, Boston, Massachusetts 02116. |
Each Trustee has been elected by shareholders and each Trustee and officer holds office until his or her successor is chosen and qualified or until his or her earlier death, resignation, retirement or removal. The Trust does not hold annual meetings for the purpose of electing Trustees, and Trustees are not elected for fixed terms. Messrs. Butler, Kavanaugh, Uek and Ms. Thomsen are members of the Trust’s Audit Committee.
Each of the Fund’s Trustees and officers holds comparable positions with certain other funds of which MFS or a subsidiary is the investment adviser or distributor, and, in the case of the officers, with certain affiliates of MFS. As of January 1, 2012, the Trustees served as board members of 131 funds within the MFS Family of Funds.
22
Table of Contents
MFS Emerging Markets Equity Portfolio
Trustees and Officers – continued
The Statement of Additional Information for the Fund includes further information about the Trustees and is available without charge upon request by calling 1-800-225-2606.
Investment Adviser Massachusetts Financial Services Company 500 Boylston Street, Boston, MA 02116-3741 | Custodian State Street Bank and Trust 1 Lincoln Street, Boston, MA 02111-2900 | |
Distributor MFS Fund Distributors, Inc. 500 Boylston Street, Boston, MA 02116-3741 | Independent Registered Public Accounting Firm Deloitte & Touche LLP 200 Berkeley Street, Boston, MA 02116 | |
Portfolio Managers Jose Luis Garcia Robert Lau |
23
Table of Contents
MFS Emerging Markets Equity Portfolio
At a special meeting of shareholders of the MFS Emerging Markets Equity Portfolio (hereinafter referred to as the “Fund” or the “Portfolio”), which was held on December 1, 2011, the shareholders approved a new investment advisory agreement based on the recommendation of the Board of Trustees. At its July, 2011 meeting, the Board of Trustees (i) approved, and recommended for shareholder approval, the new investment advisory agreement effective January 1, 2012, and (ii) the continuation of the existing investment advisory agreement effective September 1, 2011. The following includes a description of the factors that the Board of Trustees considered and the conclusions that formed the basis of their approval of both the new investment advisory agreement and the continuation of the prior investment advisory agreement.
BOARD APPROVAL OF NEW INVESTMENT ADVISORY AGREEMENT
The Investment Company Act of 1940 requires that both the full Board of Trustees and a majority of the non-interested (“independent”) Trustees, voting separately, initially approve the new investment advisory agreement (the “New Agreement”) between Massachusetts Financial Services Company (“MFS”) and MFS Variable Insurance Trust II (the “Trust”) on behalf of the Portfolio and, beginning on the second anniversary of the initial effective date of the New Agreement, annually approve the continuation of the New Agreement. The Trustees have considered matters bearing on the Portfolio and the then current advisory arrangement at their meetings throughout the year, including a review of performance data at each regular meeting. In addition, the independent Trustees met in person in July 2011 to consider the initial approval of the New Agreement, and to recommend that shareholders approve the New Agreement. The independent Trustees were assisted in their evaluation of the New Agreement by independent legal counsel, from whom they received separate legal advice and with whom they met separately from MFS management. The independent Trustees were also assisted in this process by the Portfolio’s Independent Chief Compliance Officer, a full-time senior officer appointed by and reporting to the independent Trustees.
In connection with their deliberations regarding the initial approval of the New Agreement, the Trustees, including the independent Trustees, considered such information and factors as they believed, in light of the legal advice furnished to them and their own business judgment, to be relevant. The New Agreement was considered separately for the series of the Trust (collectively, the “Portfolios”), although the Trustees also took into account the common interests of all Portfolios in the Trust in their review. As described below, the Trustees considered the nature, quality, and extent of the various investment advisory, administrative, and/or shareholder services to be performed by MFS under the New Agreement and other arrangements with the Trust.
In connection with their initial review meeting, the Trustees received and relied upon materials that included, among other items: (i) information provided by MFS on the advisory fees of comparable portfolios of its other clients, including institutional separate account and other clients, (ii) information as to whether, and to what extent applicable, expense waivers, reimbursements or fee “breakpoints” would be observed for the Portfolio under the New Agreement, and (iii) a comparison and summary of the differences in the provisions in the New Agreement compared to those in each of the then current investment advisory agreements for the Portfolios. In addition, in connection with the independent Trustees’ meetings in May and July, 2011 (the “contract review meetings”) for the purpose of considering whether to approve the continuation of the then current investment advisory agreements for the Portfolio, the independent Trustees received: (1) information provided by Lipper Inc. (“Lipper”) on the investment performance of the Portfolio for various time periods ended December 31, 2010, compared to the investment performance of a group of funds with substantially similar investment classifications/objectives (the “Lipper performance universe”), (2) information provided by Lipper on the Portfolio’s advisory fees and other expenses compared to the advisory fees and other expenses of comparable funds identified by Lipper (the “Lipper expense group”), (3) information regarding MFS’ financial results and financial condition, including MFS’ and certain of its affiliates’ estimated profitability from services performed for the Portfolio, (4) MFS’ views regarding the outlook for the mutual fund industry and its strategic business plans, (5) descriptions of various functions performed by MFS for the Trust, such as compliance monitoring and portfolio trading practices, and (6) information regarding the overall organization of MFS, including information about MFS’ senior management and other personnel providing investment advisory, administrative and other services to the Portfolio. The comparative performance, fee and expense information prepared and provided by Lipper was not independently verified, and the independent Trustees did not independently verify any information provided to them by MFS.
The Trustees’ conclusion as to the initial approval of the New Agreement was based on comprehensive consideration of all information provided to the Trustees and was not the result of any single factor. Some of the factors that figured particularly in the Trustees’ deliberations are described below for the Portfolio, while individual Trustees may have given different weight to various factors and evaluated the information presented as a whole differently than another individual Trustee. The Trustees recognized that the fee arrangements for the Portfolio could reflect years of review and discussion between the independent Trustees and MFS, that certain aspects of such arrangements may receive greater scrutiny in some years than others, and that
24
Table of Contents
MFS Emerging Markets Equity Portfolio
Board Approval of New Investment Advisory Agreement – continued
the Trustees’ conclusions may be based, in part, on their consideration of these same arrangements during the course of the year and in prior years.
Because the portfolio management team managing the Portfolio’s investments under the then current investment advisory agreement will remain the same under the New Agreement for the Portfolio, the Trustees compared the Portfolio’s total return investment performance to the performance of its Lipper performance universe over various time periods, based on information provided by Lipper. The Trustees placed particular emphasis on the total return performance of the Portfolio’s Initial Class shares in comparison to the performance of funds in its Lipper performance universe over the one-, three- and five-year periods ended December 31, 2010. The Trustees did not rely on performance results for more recent periods.
The Trustees noted the performance of the Portfolio’s Initial Class shares was in the 1st quintile relative to the other funds in the Lipper performance universe for the one-year period (the 1st quintile being the best performers and the 5th quintile being the worst performers). The total return performance of the Portfolio was in the 3rd quintile for the three-year period and in the 4th quintile for the five-year period ended December 31, 2010, relative to the Lipper performance universe. Based on the nature and quality of services provided by MFS, the Board of Trustees concluded that the Portfolio’s performance was satisfactory.
In the course of their deliberations, the Trustees took into account information provided by MFS during contract review meetings, as well as during investment review meetings conducted with portfolio management personnel during the course of the year. For Portfolios whose performance lagged their peer groups, they discussed the factors that contributed thereto and MFS’ efforts to improve such Portfolios’ performance. After reviewing this information, the Trustees concluded, within the context of their overall conclusions regarding the New Agreement, that they were satisfied with MFS’ responses and efforts relating to investment performance.
In assessing the reasonableness of the Portfolio’s advisory fee, the Trustees considered, among other information, the Portfolio’s advisory fee and the total expense ratio of the Portfolio’s Initial Class shares as a percentage of average daily net assets, compared to the advisory fee and total expense ratios of its peer group of funds based on information provided by Lipper. The Trustees also considered the advisory fees charged by MFS to institutional accounts. In comparing these fees, the Trustees considered the generally broader scope of services provided by MFS to the Trust than those provided to institutional accounts. The Trustees also considered the higher demands placed on MFS’ investment personnel and trading infrastructure as a result of the daily cash in-flows and out-flows of the Portfolio, and the impact on MFS and related expenses due to the more extensive regulatory regime to which the Portfolio is subject, compared to institutional accounts.
In considering the fees, the Trustees noted from the Lipper data that the Portfolio’s effective advisory fee rate was below the median and total expense ratio was above the median of such fees and expenses of funds in the Lipper expense group. In addition, the Trustees accepted MFS’ offer to continue the expense limitation for the Portfolio. The Trustees further noted that the New Agreement would reflect MFS’ agreement to observe a lower advisory fee and to reduce the advisory fee on average daily net assets over $500 million on a permanent basis, and concluded that the breakpoint was sufficient to allow the Portfolio to benefit from economies of scale as its assets grow. The Trustees concluded that the fees were reasonable in light of the nature and quality of services provided.
The Trustees also considered whether the Portfolio is likely to benefit from any economies of scale due to future asset growth. In this regard, the Trustees reviewed the adequacy of breakpoints and discussed with MFS any adjustments necessary for the shareholders’ benefit.
The Trustees also considered information prepared by MFS relating to its costs and profits with respect to the Portfolio and other investment companies and accounts advised by MFS, as well as MFS’ methodologies used to determine and allocate its costs to the Portfolio and other accounts and products for purposes of estimating profitability.
The Trustees noted that there would be no increase to the net advisory fee arrangement for the Portfolio under the New Agreement when compared to the Portfolio’s then current investment advisory agreement. After reviewing these and other factors described below, the Trustees concluded that the advisory fees charged to the Portfolio under the New Agreement represent reasonable compensation in light of the nature and quality of the services being provided by MFS.
In addition, the Trustees considered MFS’ resources and related efforts to continue to retain, attract and motivate capable personnel to serve the Portfolio. The Trustees also considered the financial resources of MFS and its parent, Sun Life Financial Inc. The Trustees further considered any advantages and possible disadvantages of having an adviser which also serves other investment companies as well as institutional accounts.
The Trustees also considered the nature, quality, cost, and extent of administrative, transfer agency, and distribution services provided to the Trust by MFS and its affiliates under agreements and plans other than the New Agreement, including the 12b-1
25
Table of Contents
MFS Emerging Markets Equity Portfolio
Board Approval of New Investment Advisory Agreement – continued
fees the Portfolio pays to MFS Fund Distributors, Inc., an affiliate of MFS. The Trustees also considered the nature, extent and quality of certain other services MFS performs or arranges on the Portfolio’s behalf, which may include securities lending programs, directed expense payment programs, class action recovery programs, and MFS’ interaction with third-party service providers, principally custodians and sub-custodians. The Trustees concluded that the various non-advisory services provided by MFS and its affiliates on behalf of the Portfolio were satisfactory. The Trustees also considered the benefits to MFS from the use of the Portfolio’s portfolio brokerage commissions to pay for investment research and various other factors. Additionally, the Trustees considered so-called “fall-out benefits” to MFS such as reputational value derived from serving as investment manager to the Trust, and determined that any such benefits derived by MFS were reasonable and fair.
Based on their evaluation of factors that they deemed to be material, including those factors described above, the Board of Trustees, including a majority of the independent Trustees, concluded that the New Agreement should be approved for an initial two-year period, commencing upon its effective date, as set forth in the New Agreement.
BOARD APPROVAL OF CONTINUATION OF PRIOR INVESTMENT ADVISORY AGREEMENT
The Investment Company Act of 1940 requires that both the full Board of Trustees and a majority of the non-interested (“independent”) Trustees, voting separately, annually approve the continuation of the investment advisory agreement between MFS Variable Insurance Trust II (the “Trust”) and Massachusetts Financial Services Company (“MFS”) on behalf of the Fund. The Trustees consider matters bearing on the Fund and the advisory arrangements at their meetings throughout the year, including a review of performance data at each regular meeting. In addition, the independent Trustees met in person in May and again in July 2011 (“contract review meetings”) for the specific purpose of considering whether to approve the continuation of the investment advisory agreement for the Fund. The independent Trustees were assisted in their evaluation of the investment advisory agreement by independent legal counsel, from whom they received separate legal advice and with whom they met separately from MFS management during various contract review meetings. The independent Trustees were also assisted in this process by the Fund’s Independent Chief Compliance Officer, a full-time senior officer appointed by and reporting to the independent Trustees.
In connection with their deliberations, the Trustees, including the independent Trustees, considered such information and factors as they believed, in light of the legal advice furnished to them and their own business judgment, to be relevant. The investment advisory agreement was considered separately for the Fund, although the Trustees also took into account the common interests of all Funds in the Trust in their review. As described below, the Trustees considered the nature, quality, and extent of the various investment advisory, administrative, and shareholder services performed by MFS under the existing investment advisory agreement and other arrangements with the Trust.
In connection with their contract review meetings, the Trustees received and relied upon materials which included, among other items: (i) information provided by Lipper Inc. (“Lipper”) on the investment performance of the Fund for various time periods ended December 31, 2010, compared to the investment performance of a group of funds with substantially similar investment classifications/objectives (the “Lipper performance universe”), (ii) information provided by Lipper on the Fund’s advisory fees and other expenses compared to the advisory fees and other expenses of comparable funds identified by Lipper (the “Lipper expense group”), (iii) information provided by MFS on the advisory fees of comparable portfolios of its other clients, including institutional separate account and other clients, (iv) information as to whether, and to what extent applicable, expense waivers, reimbursements or fee “breakpoints” are observed for the Fund, (v) information regarding MFS’ financial results and financial condition, including MFS’ and certain of its affiliates’ estimated profitability from services performed for the Fund and other investment companies that the Board oversees as a whole, and for MFS’ institutional business, (vi) MFS’ views regarding the outlook for the mutual fund industry and its strategic business plans, (vii) descriptions of various functions performed by MFS for the Trust, such as compliance monitoring and portfolio trading practices, and (viii) information regarding the overall organization of MFS, including information about MFS’ senior management and other personnel providing investment advisory, administrative and other services to the Fund. The comparative performance, fee and expense information prepared and provided by Lipper was not independently verified, and the independent Trustees did not independently verify any information provided to them by MFS.
The Trustees’ conclusion as to the continuation of the investment advisory agreement was based on comprehensive consideration of all information provided to the Trustees and was not the result of any single factor. Some of the factors that figured particularly in the Trustees’ deliberations are described below for the Fund, while individual Trustees may have given different weight to various factors and evaluated the information presented as a whole differently than another individual Trustee. The Trustees recognized that the fee arrangements for the Fund reflect years of review and discussion between the independent Trustees and MFS, that certain aspects of such arrangements may receive greater scrutiny in some years than
26
Table of Contents
MFS Emerging Markets Equity Portfolio
Board Approval of Continuation of Prior Investment Advisory Agreement – continued
others, and that the Trustees’ conclusions may be based, in part, on their consideration of these same arrangements during the course of the year and in prior years.
Based on information provided by Lipper, the Trustees compared the Fund’s total return investment performance to the performance of the Lipper performance universe over various time periods. The Trustees placed particular emphasis on the total return performance of the Fund’s Initial Class shares in comparison to the performance of funds in its Lipper performance universe over the one-, three- and five -year periods ended December 31, 2010. The Trustees did not rely on performance results for more recent periods, including those shown elsewhere in this report.
The Trustees noted the performance of the Fund’s Initial Class shares was in the 1st quintile relative to the other funds in the Lipper performance universe for the one-year period (the 1st quintile being the best performers and the 5th quintile being the worst performers). The total return performance of the Fund was in the 3rd quintile for the three-year period and in the 4th quintile for the five-year period ended December 31, 2010, relative to the Lipper performance universe. Based on the nature and quality of services provided by MFS, the Board of Trustees concluded that the Fund’s performance was satisfactory.
In the course of their deliberations, the Trustees took into account information provided by MFS during contract review meetings, as well as during investment review meetings conducted with portfolio management personnel during the course of the year.
In assessing the reasonableness of the Fund’s advisory fee, the Trustees considered, among other information, the Fund’s advisory fee and the total expense ratio of the Fund’s Initial Class shares as a percentage of average daily net assets, compared to the advisory fee and total expense ratios of its peer group of funds based on information provided by Lipper. The Trustees also considered the advisory fees charged by MFS to institutional accounts. In comparing these fees, the Trustees considered the generally broader scope of services provided by MFS to the Trust than those provided to institutional accounts. The Trustees also considered the higher demands placed on MFS’ investment personnel and trading infrastructure as a result of the daily cash in-flows and out-flows of the Fund, and the impact on MFS and related expenses due to the more extensive regulatory regime to which the Fund is subject, compared to institutional accounts.
In considering the fees, the Trustees noted from the Lipper data (which takes into account any reductions or expense limitations) that the Fund’s effective advisory fee rate was below the median and total expense ratio was above the median of such fees and expenses of funds in the Lipper expense group. In addition, the Trustees accepted MFS’ offer to continue the expense limitation for the Fund. The Trustees further concluded that the existing breakpoint was sufficient to allow the Fund to benefit from economies of scale as its assets grow. The Trustees concluded that the fees were reasonable in light of the nature and quality of services provided.
The Trustees also considered information prepared by MFS relating to its costs and profits with respect to the Fund and other investment companies and accounts advised by MFS, as well as MFS’ methodologies used to determine and allocate its costs to the Fund and other accounts and products for purposes of estimating profitability.
After reviewing these and other factors described below, the Trustees concluded that the advisory fees charged to the Fund represent reasonable compensation in light of the nature and quality of the services being provided by MFS.
In addition, the Trustees considered MFS’ resources and related efforts to continue to retain, attract and motivate capable personnel to serve the Fund. The Trustees also considered the financial resources of MFS and its parent, Sun Life Financial Inc. The Trustees further considered any advantages and possible disadvantages of having an adviser which also serves other investment companies as well as institutional accounts.
The Trustees also considered the nature, quality, cost, and extent of administrative, transfer agency, and distribution services provided to the Fund by MFS and its affiliates under agreements and plans other than the investment advisory agreement, including the 12b-1 fees the Fund pays to MFS Fund Distributors, Inc., an affiliate of MFS. The Trustees also considered the nature, extent and quality of certain other services MFS performs or arranges on the Fund’s behalf, which may include securities lending programs, directed expense payment programs, class action recovery programs, and MFS’ interaction with third-party service providers, principally custodians and sub-custodians. The Trustees concluded that the various non-advisory services provided by MFS and its affiliates on behalf of the Fund were satisfactory. The Trustees also considered the benefits to MFS from the use of the Fund’s portfolio brokerage commissions, if applicable, to pay for investment research and various other factors. Additionally, the Trustees considered so-called “fall-out benefits” to MFS such as reputational value derived from serving as investment manager to the Trust, and determined that any such benefits derived by MFS were reasonable and fair.
27
Table of Contents
MFS Emerging Markets Equity Portfolio
Board Approval of Continuation of Prior Investment Advisory Agreement – continued
Based on their evaluation of factors that they deemed to be material, including those factors described above, the Board of Trustees, including a majority of the independent Trustees, concluded that the investment advisory agreement should be continued for an additional one-year period, commencing September 1, 2011.
A discussion regarding the Board’s most recent review and renewal of the fund’s Investment Advisory Agreement with MFS is available by clicking on the fund’s name under “Variable Insurance Portfolios — VIT II” in the “Products and Performance” section of the MFS Web site (mfs.com).
28
Table of Contents
MFS Emerging Markets Equity Portfolio
PROXY VOTING POLICIES AND INFORMATION
A general description of the MFS funds’ proxy voting policies and procedures is available without charge, upon request, by calling 1-800-225-2606, by visiting the Proxy Voting section of mfs.com or by visiting the SEC’s Web site at http://www.sec.gov.
Information regarding how the fund voted proxies relating to portfolio securities during the most recent twelve-month period ended June 30 is available without charge by visiting the Proxy Voting section of mfs.com or by visiting the SEC’s Web site at http://www.sec.gov.
QUARTERLY PORTFOLIO DISCLOSURE
The fund will file a complete schedule of portfolio holdings with the Securities and Exchange Commission (the Commission) for the first and third quarters of each fiscal year on Form N-Q. The fund’s Form N-Q is available on the EDGAR database on the Commission’s Internet Web site at http://www.sec.gov and may be reviewed and copied at the:
Public Reference Room
Securities and Exchange Commission
100 F Street, NE, Room 1580
Washington, D.C. 20549
Information on the operation of the Public Reference Room may be obtained by calling the Commission at 1-800-SEC-0330. Copies of the fund’s Form N-Q also may be obtained, upon payment of a duplicating fee, by electronic request at the following e-mail address: publicinfo@sec.gov or by writing the Public Reference Section at the above address.
From time to time, MFS may post important information about the fund or the MFS funds on the MFS web site (mfs.com). This information is available by visiting the “News & Commentary” section of mfs.com or by clicking on the fund’s name under “Variable Insurance Portfolios — VIT II” in the “Products and Performance” section of mfs.com.
FEDERAL TAX INFORMATION (unaudited)
The following information is provided pursuant to provisions of the Internal Revenue Code.
The fund designates $6,026,000 as capital gain dividends paid during the fiscal year.
Income derived from foreign sources was $3,840,532. The fund intends to pass through foreign tax credits of $350,534 for the fiscal year.
29
Table of Contents
rev. 3/11

| Why? | Financial companies choose how they share your personal information. Federal law gives consumers the right to limit some but not all sharing. Federal law also requires us to tell you how we collect, share, and protect your personal information. Please read this notice carefully to understand what we do. |
| What? | The types of personal information we collect and share depend on the product or service you have with us. This information can include:
•Social Security number and account balances •Account transactions and transaction history •Checking account information and wire transfer instructions
When you are no longer our customer, we continue to share your information as described in this notice. |
| How? | All financial companies need to share customers’ personal information to run their everyday business. In the section below, we list the reasons financial companies can share their customers’ personal information; the reasons MFS chooses to share; and whether you can limit this sharing. |
| Reasons we can share your personal information | Does MFS share? | Can you limit this sharing? | ||
For our everyday business purposes – such as to process your transactions, maintain your account(s), respond to court orders and legal investigations, or report to credit bureaus | Yes | No | ||
For our marketing purposes – to offer our products and services to you | No | We don’t share | ||
| For joint marketing with other financial companies | No | We don’t share | ||
For our affiliates’ everyday business purposes – information about your transactions and experiences | No | We don’t share | ||
For our affiliates’ everyday business purposes – information about your creditworthiness | No | We don’t share | ||
| For nonaffiliates to market to you | No | We don’t share |
| Questions? | Call 800-225-2606 or go to mfs.com. |
30
Table of Contents
| Page 2 |
| Who we are | ||
| Who is providing this notice? | MFS Funds, MFS Investment Management, MFS Institutional Advisors, Inc., MFS Fund Distributors, Inc., MFS Heritage Trust Company, and MFS Service Center, Inc. | |
| What we do | ||
| How does MFS protect my personal information? | To protect your personal information from unauthorized access and use, we use security measures that comply with federal law. These measures include procedural, electronic, and physical safeguards for the protection of the personal information we collect about you. | |
| How does MFS collect my personal information? | We collect your personal information, for example, when you
•open an account or provide account information •direct us to buy securities or direct us to sell your securities •make a wire transfer
We also collect your personal information from others, such as credit bureaus, affiliates and other companies. | |
| Why can’t I limit all sharing? | Federal law gives you the right to limit only
•sharing for affiliates’ everyday business purposes – information about your creditworthiness •affiliates from using your information to market to you •sharing for nonaffiliates to market to you
State laws and individual companies may give you additional rights to limit sharing. | |
| Definitions | ||
| Affiliates | Companies related by common ownership or control. They can be financial and nonfinancial companies.
•MFS does not share personal information with affiliates, except for everyday business purposes as described on page one of this notice. | |
| Nonaffiliates | Companies not related by common ownership or control. They can be financial and nonfinancial companies.
•MFS does not share with nonaffiliates so they can market to you. | |
| Joint Marketing | A formal agreement between nonaffiliated financial companies that together market financial products or services to you.
•MFS doesn’t jointly market. | |
| Other important information | ||
| If you own an MFS product or receive an MFS service in the name of a third party such as a bank or broker-dealer, their privacy policy may apply to you instead of ours. | ||
31
Table of Contents

Table of Contents

MFS® Global Tactical
Allocation Portfolio
MFS® Variable Insurance Trust II

ANNUAL REPORT
December 31, 2011
WTS-ANN
Table of Contents
MFS® GLOBAL TACTICAL ALLOCATION PORTFOLIO
The report is prepared for the general information of contract owners.
It is authorized for distribution to prospective investors only when preceded or accompanied by a current prospectus.
NOT FDIC INSURED Ÿ MAY LOSE VALUE Ÿ NO BANK OR CREDIT UNION GUARANTEE Ÿ NOT A DEPOSIT Ÿ NOT INSURED BY ANY FEDERAL GOVERNMENT AGENCY OR NCUA/NCUSIF
Table of Contents
MFS Global Tactical Allocation Portfolio
LETTER FROM THE CHAIRMAN AND CEO

Dear Contract Owners:
We are indeed living through some volatile times. Economic uncertainty is everywhere, as it seems no place in the world has been unmoved by crisis. We have seen a devastating earthquake and tsunami that have led to disruptions in the Japanese markets
and supply chains. Protests have changed the face of the Middle East and left in their wake lingering tensions and resultant higher oil prices. We have seen debt limits tested in Europe and the United States and policymakers grappling to craft often unpopular monetary and fiscal responses at a time when consumers and businesses struggle with what appears to be a slowing global economy. On top of all of that, we have seen long-term U.S. debt lose its Standard & Poor’s AAA rating and the long-term debt ratings of 15 eurozone nations put on negative watch.
When markets become volatile, managing risk becomes a top priority for investors and their advisors. At MFS® risk management is foremost in our minds in all market climates. Our analysts and portfolio managers keep risks firmly in mind when evaluating securities. Additionally, we have a team of quantitative analysts that measures and assesses the risk profiles of our portfolios and securities on an ongoing basis. The chief investment risk officer, who oversees the team, reports directly to the firm’s president and chief investment officer so the risk associated with each portfolio can be assessed objectively and independently of the portfolio management team.
As always, we continue to be mindful of the many economic challenges faced at the local, national, and international levels. It is in times such as these that we want to remind investors of the merits of maintaining a long-term view, adhering to basic investing principles such as asset allocation and diversification, and working closely with their advisors to research and identify appropriate investment opportunities.
Respectfully,

Robert J. Manning
Chairman and Chief Executive Officer
MFS Investment Management®
February 15, 2012
The opinions expressed in this letter are subject to change, may not be relied upon for investment advice, and no forecasts can be guaranteed.
1
Table of Contents
MFS Global Tactical Allocation Portfolio
Portfolio structure
| Active Security Selection (a) | Tactical Overlay (b) | Net Market Exposure (c) | ||||||||||||
Fixed Income | U.S. | 19.5% | 0.8% | 20.3% | ||||||||||
United Kingdom | 4.8% | 4.2% | 9.0% | |||||||||||
Europe ex-U.K. | 14.7% | (10.1)% | 4.6% | |||||||||||
Japan | 7.2% | (3.3)% | 3.9% | |||||||||||
Emerging Markets | 3.3% | 0.0% | 3.3% | |||||||||||
North America ex-U.S. | 3.5% | (3.6)% | (0.1)% | |||||||||||
Asia/Pacific ex-Japan | 1.8% | (2.4)% | (0.6)% | |||||||||||
Total | 54.8% | (14.4)% | 40.4% | |||||||||||
Equity | U.S. Large Cap | 15.6% | (2.2)% | 13.4% | ||||||||||
Europe ex-U.K. | 6.7% | 5.2% | 11.9% | |||||||||||
United Kingdom | 5.4% | 2.7% | 8.1% | |||||||||||
Emerging Markets | 0.8% | 5.9% | 6.7% | |||||||||||
Japan | 4.7% | (0.3)% | 4.4% | |||||||||||
U.S. Small/Mid Cap | 0.8% | 0.0% | 0.8% | |||||||||||
North America ex-U.S. | 0.3% | (3.0)% | (2.7)% | |||||||||||
Asia/Pacific ex-Japan | 0.2% | (4.7)% | (4.5)% | |||||||||||
Total | 34.5% | 3.6% | 38.1% | |||||||||||
| Real Estate Related | Non-U.S. | 0.3% | 0.0% | 0.3% | ||||||||||
| U.S. | 0.3% | 0.0% | 0.3% | |||||||||||
| Total | 0.6% | 0.0% | 0.6% | |||||||||||
Cash | Cash & Equivalents (d) | 7.3% | 2.7% | 10.0% | ||||||||||
Derivative Offsets (e) | 0.0% | (o) | 10.9% | 10.9% | ||||||||||
| Total | 7.3% | 13.6% | 20.9% | |||||||||||
Total Net Exposure Summary | 97.2% | 2.8% | 100.0% | |||||||||||
Strategic Allocation Targets & Net Exposure Ranges |
| |||||||
| Asset Class | Target (w) | Ranges (z) | ||||||
Equities | 35% | 0 to 70% | ||||||
Fixed Income, Cash and Cash Equivalents | 65% | 30 to 100% | ||||||
| Top ten holdings (c) | ||||
| UK Long Gilt Bond 10 Yr Future MAR 2012 | 4.1% | |||
| IBEX 35 Index Future JAN 2012 | 2.7% | |||
| FTSE 100 Index Future MAR 2012 | 2.7% | |||
| Hang Seng Index Future JAN 2012 | (2.1)% | |||
| S&P 500 E-Mini Future MAR 2012 | (2.1)% | |||
| Australian Treasury 10 Yr Future MAR 2012 | (2.4)% | |||
| S&P TSE 60 Index Future MAR 2012 | (3.0)% | |||
| Japan Govt Bond 10 Yr Future MAR 2012 | (3.3)% | |||
| Govt of Canada Bond 10 Yr Future MAR 2012 | (3.6)% | |||
| German Bund 10 Yr Future MAR 2012 | (10.0)% |
| (a) | Represents the actively managed portion of the portfolio and for purposes of this presentation, components include the market value of securities, less any securities sold short. The bond component will include any accrued interest amounts. This also reflects the equivalent exposure of certain derivative positions. These amounts may be negative from time to time. |
| (b) | Represents the tactical overlay portion of the portfolio which is how the fund manages its exposure to markets and currencies through use of derivative positions. Percentages reflect the equivalent exposure of those derivative positions. |
| (c) | For purposes of this presentation, the components include the market value of securities, less any securities sold short, and reflect the impact of the equivalent exposure of derivative positions. These amounts may be negative from time to time. The bond component will include any accrued interest amounts. |
| (d) | Cash & Equivalents includes cash, other assets (excluding interest receivables) less liabilities, short term securities, and the unrealized gain or loss in connection with all forward currency exchange contracts. |
| (e) | Derivative Offsets represent the offsetting of the leverage produced by the fund’s derivative positions. |
| (o) | Less than 0.1%. |
| (w) | The strategic asset class allocations have been selected for investment over longer time periods. The actual strategic asset class weightings can deviate due to market movements and cash flows. |
| (z) | The fund’s net exposures to the asset classes referenced will normally fall within theses ranges after taking into account the tactical overlay. |
| Equivalent exposure is a calculated amount that translates the derivative position into a reasonable approximation of the amount of the underlying asset that the portfolio would have to hold at a given point in time to have the same price sensitivity that results from the portfolio’s ownership of the derivative contract. When dealing with derivatives, equivalent exposure is a more representative measure of the potential impact of a position on portfolio performance than market value. The market value of derivatives may be different. |
Where the fund holds convertible bonds, these are treated as part of the equity portion of the portfolio.
Percentages are based on net assets as of 12/31/11.
The portfolio is actively managed and current holdings may be different.
2
Table of Contents
MFS Global Tactical Allocation Portfolio
Summary of Results
For the twelve months ended December 31, 2011, Initial Class shares of the MFS Global Tactical Allocation Portfolio (the “fund”) provided a total return of 1.55%, while Service Class shares of the fund provided a total return of 1.29%. These compare with a return of 5.64% for the fund’s benchmark, the Barclays Capital Global Aggregate Bond Index. The fund’s other benchmarks, the Morgan Stanley Capital International (MSCI) World Index and the MFS Global Tactical Allocation Blended Index (the “Blended Index”), generated total returns of –5.02% and 2.01%, respectively. The Blended Index reflects the blended returns of equity and fixed income indices, with percentage allocations to each index designed to resemble the strategic allocations of the fund. The market indices and related percentage allocations used to compile the Blended Index are set forth in the Performance Summary.
The fund’s investment objective is to seek total return. MFS seeks to achieve the fund’s objective by generating returns from a combination of (1) individual security selection of a combination of debt instruments and equity securities and (2) a tactical asset allocation overlay primarily using derivative instruments to manage the fund’s exposure to asset classes (e.g. equity and fixed income), markets (e.g. U.S. and foreign countries), and currencies (e.g. U.S. dollar and Japanese yen). MFS may also use derivatives, such as futures, forward contracts, and options, to seek to limit the fund’s exposure to certain extreme market events.
Market Environment
Early in the period, the U.S. Federal Reserve (the “Fed”) responded to weak economic growth by loosening monetary policy further. More easing by the Fed improved market sentiment and drove risk-asset prices markedly higher. The December 2010 agreement on a surprisingly large (relative to expectations) expansionary U.S. fiscal package also boosted sentiment. During the subsequent several months, the renewed positive market sentiment, coupled with better indications of global macroeconomic activity, pushed many asset valuations to post-crisis highs. At the same time, the yields of the perceived “safest” global sovereign credits rose, indicating a renewed risk-seeking environment.
However, towards the middle of the period, a weakening macroeconomic backdrop and renewed concerns over peripheral euro zone sovereign debt caused a flight-to-quality move that pushed high-quality sovereign bond yields lower. In the U.S., concerns about sovereign debt default and the long-term sustainability of the trend in U.S. fiscal policy resulted in one agency downgrading U.S. credit quality. Amidst this turmoil, global equity markets declined sharply. As a result of these developments, global consumer and producer sentiment indicators fell precipitously and highly-rated sovereign bond yields hit multi-decade lows. Towards the end of the reporting period, uncertainty in financial markets spiked higher as markets more seriously contemplated the possible failure of the euro zone.
Detractors from Performance
Within the equity portion of the fund, stock selection in the technology sector, led by holdings of information technology products and electronics maker Acer(b)(h) (Taiwan), mobile phone maker Nokia (Finland), and Japanese copy machine manufacturer Konica Minolta Holdings, held back performance relative to the MSCI World Index. Other top individual detractors included holdings of global financial services provider Bank of New York Mellon, investment banking firm Goldman Sachs, insurance company MetLife, retailer Esprit Holdings (Hong Kong), securities brokerage firm Daiwa Securities (Japan), and Swiss offshore drilling contractor Transocean(b). Not holding shares of strong-performing computer maker Apple also dampened relative results.
Within the fixed income portion of the fund, a greater exposure to “BBB” and “BB” rated(r) securities detracted from returns relative to the Barclays Capital Global Aggregate Index as these credit quality sectors underperformed higher-rated securities over the reporting period.
During the reporting period, the fund’s tactical overlay held back relative performance led by negative contributions from currency allocation, particularly via holdings of currency forward contracts, and top-level allocation within stock and bond markets. Within currency allocation, short positions in both the Australian dollar and Japanese yen hurt results. The fund’s short position in the Swiss Franc in the third quarter was another relative detractor as the Franc rallied. During the fourth quarter, the fund’s long position in the New Zealand dollar also dampened results as the currency weakened relative to the U.S. dollar.
An overweight allocation to equity securities and an underweight allocation to bonds hindered performance. Within equities, the fund’s exposure to developed European countries dampened results as Europe’s mounting sovereign debt crisis put pressure on these developed nations.
3
Table of Contents
MFS Global Tactical Allocation Portfolio
Management Review – continued
Contributors to Performance
Within the equity portion of the fund, a combination of an underweight position and stock selection in the basic materials sector benefited performance relative to the MSCI World Index. No individual securities within this sector were among the fund’s top relative contributors during the reporting period.
An overweight position and stock selection in the health care sector were also positive factors for relative results. An overweight position in strong-performing pharmaceutical firm GlaxoSmithKline (United Kingdom) and pharmaceutical and medical products maker Abbott Laboratories helped relative performance.
The fund’s overweight position in the consumer staples sector bolstered relative results. Holdings of tobacco distributors Philip Morris International, Japan Tobacco (Japan), and British American Tobacco (United Kingdom) aided relative performance as all three stocks outperformed the benchmark over the reporting period.
Individual securities in other sectors that contributed to relative performance included defense contractor Lockheed Martin, voice and data communications services company Vodafone Group, telecommunications company KDDI (Japan), and global payments technology company MasterCard. The fund’s cash position was also a contributor to relative performance. The fund holds cash to buy new holdings and to provide liquidity. In a period when equity markets declined, as measured by the fund’s benchmark, holding cash helped performance versus the benchmark, which has no cash position.
Within the fixed income portion of the fund, yield curve(y) positioning in the United States, particularly a greater exposure to the middle (centered around maturities of 7 years) and long end (centered around maturities of 10 years or more) of the curve, benefited performance relative to the Barclays Capital Global Aggregate Bond Index as the yield curve flattened during the reporting period. The fund’s avoidance of Portugal-based securities, which underperformed the benchmark, also aided relative returns. The fund’s return from yield, which was greater than that of the benchmark, was another positive factor for relative results.
As part of the tactical overlay, short exposures to Canada, Australia, and Japan, via equity index futures, helped performance as all three equity markets performed poorly over the reporting period.
Respectfully,
| Nevin Chitkara | Steven Gorham | Richard Hawkins | Benjamin Nastou | |||
| Portfolio Manager | Portfolio Manager | Portfolio Manager | Portfolio Manager | |||
| Natalie Shapiro | Benjamin Stone | Erik Weisman | Barnaby Wiener | |||
| Portfolio Manager | Portfolio Manager | Portfolio Manager | Portfolio Manager | |||
| Linda Zhang | ||||||
| Portfolio Manager | ||||||
Note to Contract Owners: Effective May 1, 2011, Linda Zhang became a co-manager of the fund.
| (b) | Security is not a benchmark constituent. |
| (h) | Security was not held in the fund at period end. |
| (r) | Bonds rated “BBB”, “Baa”, or higher are considered investment grade; bonds rated “BB”, “Ba”, or below are considered non-investment grade. The source for bond quality ratings is Moody’s Investors Service, Standard & Poor’s and Fitch, Inc. and are applied using the following hierarchy: If all three agencies provide a rating, the middle rating (after dropping the highest and lowest ratings) is assigned; if two of the three agencies rate a security, the lower of the two is assigned. Ratings are shown in the S&P and Fitch scale (e.g., AAA). For securities which are not rated by any of the three agencies, the security is considered Not Rated. |
| (y) | A yield curve graphically depicts the yields of different maturity bonds of the same credit quality and type; a normal yield curve is upward sloping, with short-term rates lower than long-term rates. |
The views expressed in this report are those of the portfolio managers only through the end of the period of the report as stated on the cover and do not necessarily reflect the views of MFS or any other person in the MFS organization. These views are subject to change at any time based on market or other conditions, and MFS disclaims any responsibility to update such views. These views may not be relied upon as investment advice or an indication of trading intent on behalf of any MFS portfolio. References to specific securities are not recommendations of such securities, and may not be representative of any MFS portfolio’s current or future investments.
4
Table of Contents
MFS Global Tactical Allocation Portfolio
PERFORMANCE SUMMARY THROUGH 12/31/11
The following chart illustrates the historical performance of the fund in comparison to its benchmark(s). Benchmarks are unmanaged and may not be invested in directly. Benchmark returns do not reflect any fees or expenses. The performance of other share classes will be greater than or less than that of the class depicted below. (See Notes to Performance Summary.)
Performance data shown represents past performance and is no guarantee of future results. Investment return and principal value fluctuate so your units, when sold, may be worth more or less than the original cost; current performance may be lower or higher than quoted. The performance shown does not reflect the deduction of taxes, if any, that a contract holder would pay on fund distributions or the redemption of contract units. The returns for the fund shown also do not reflect the deduction of expenses associated with variable products, such as mortality and expense risk charges, separate account charges, and sales charges imposed by the insurance company separate accounts. Such expenses would reduce the overall returns shown.
Growth of a Hypothetical $10,000 Investment
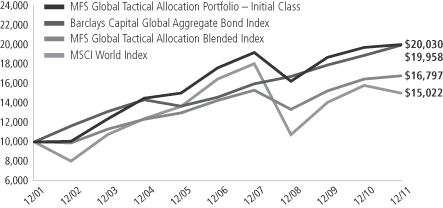
Total Returns through 12/31/11
Average annual total returns
| Share class | Class inception date | 1-yr | 5-yr | 10-yr | ||||||||
| Initial Class | 11/07/94 | 1.55% | 2.59% | 7.19% | ||||||||
| Service Class | 8/24/01 | 1.29% | 2.34% | 6.93% | ||||||||
| Comparative benchmarks | ||||||||||||
| Barclays Capital Global Aggregate Bond Index (f) | 5.64% | 6.46% | 7.16% | |||||||||
| MSCI World Index (f) | (5.02)% | (1.82)% | 4.15% | |||||||||
| MFS Global Tactical Allocation Blended Index (f)(y) | 2.01% | 3.33% | 5.32% | |||||||||
| Barclays Capital Global Aggregate Bond Index Hedged (f) | 5.40% | 5.20% | 5.03% | |||||||||
| (f) | Source: FactSet Research Systems Inc. |
| (y) | The MFS Global Tactical Allocation Blended Index is at a point in time and allocations during the period can change. As of December 31, 2011, the blended index was comprised of 35% MSCI World Index, 54% Barclays Capital Global Aggregate Bond Index Hedged, and 11% Barclays Capital Global Aggregate Bond Index. |
Benchmark Definitions
Barclays Capital Global Aggregate Bond Index – provides a broad-based measure of the global investment-grade fixed income markets. The three major components of this index are the U.S. Aggregate, the Pan-European Aggregate, and the Asian-Pacific Aggregate Indices. The index also includes Eurodollar and Euro-Yen corporate bonds, Canadian government, agency and corporate securities, and USD investment grade 144A securities.
Barclays Capital Global Aggregate Bond Index Hedged – provides a broad-based measure of the currency-hedged performance of global investment-grade fixed income markets. The three major components of this index are the U.S. Aggregate, the Pan-European Aggregate, and the Asian-Pacific Aggregate Indices. The index also includes Eurodollar and Euro-Yen corporate bonds, Canadian government, agency and corporate securities, and USD investment grade 144A securities.
MSCI World Index – a market capitalization-weighted index that is designed to measure equity market performance in the global developed markets.
5
Table of Contents
MFS Global Tactical Allocation Portfolio
Performance Summary – continued
It is not possible to invest directly in an index.
Notes to Performance Summary
Average annual total return represents the average annual change in value for each share class for the periods presented.
Performance results reflect any applicable expense subsidies and waivers in effect during the periods shown. Without such subsidies and waivers the fund’s performance results would be less favorable. Please see the prospectus and financial statements for complete details. All results are historical and assume the reinvestment of any dividends and capital gains distributions.
Performance results do not include adjustments made for financial reporting purposes in accordance with U.S. generally accepted accounting principles and may differ from amounts reported in the financial highlights.
From time to time the fund may receive proceeds from litigation settlements, without which performance would be lower.
6
Table of Contents
MFS Global Tactical Allocation Portfolio
Fund Expenses Borne by the Contract Holders During the Period,
July 1, 2011 through December 31, 2011
As a contract holder of the fund, you incur ongoing costs, including management fees; distribution and/or service (12b-1) fees; and other fund expenses. This example is intended to help you understand your ongoing costs (in dollars) of investing in the fund and to compare these costs with the ongoing costs of investing in other mutual funds.
The example is based on an investment of $1,000 invested at the beginning of the period and held for the entire period July 1, 2011 through December 31, 2011.
Actual Expenses
The first line for each share class in the following table provides information about actual account values and actual expenses. You may use the information in this line, together with the amount you invested, to estimate the expenses that you paid over the period. Simply divide your account value by $1,000 (for example, an $8,600 account value divided by $1,000 = 8.6), then multiply the result by the number in the first line under the heading entitled “Expenses Paid During Period” to estimate the expenses you paid on your account during this period.
Hypothetical Example for Comparison Purposes
The second line for each share class in the following table provides information about hypothetical account values and hypothetical expenses based on the fund’s actual expense ratio and an assumed rate of return of 5% per year before expenses, which is not the fund’s actual return. The hypothetical account values and expenses may not be used to estimate the actual ending account balance or expenses you paid for the period. You may use this information to compare the ongoing costs of investing in the fund and other funds. To do so, compare this 5% hypothetical example with the 5% hypothetical examples that appear in the shareholder reports of the other funds.
Please note that the expenses shown in the table are meant to highlight the fund’s ongoing costs only and do not take into account the fees and expenses imposed under the variable contracts through which your investment in the fund is made. Therefore, the second line for each share class in the table is useful in comparing ongoing costs associated with an investment in vehicles (such as the fund) which fund benefits under variable annuity and variable life insurance contracts and to qualified pension and retirement plans only, and will not help you determine the relative total costs of investing in the fund through variable annuity and variable life insurance contracts. If the fees and expenses imposed under the variable contracts were included, your costs would have been higher.
| Share Class | Annualized Expense Ratio | Beginning Account Value 7/01/11 | Ending Account Value 12/31/11 | Expenses Paid During Period (p) 7/01/11-12/31/11 | ||||||||||||||
| Initial Class | Actual | 0.79% | $1,000.00 | $969.72 | $3.92 | |||||||||||||
| Hypothetical (h) | 0.79% | $1,000.00 | $1,021.22 | $4.02 | ||||||||||||||
| Service Class | Actual | 1.04% | $1,000.00 | $968.17 | $5.16 | |||||||||||||
| Hypothetical (h) | 1.04% | $1,000.00 | $1,019.96 | $5.30 | ||||||||||||||
| (h) | 5% class return per year before expenses. |
| (p) | Expenses paid is equal to each class’ annualized expense ratio, as shown above, multiplied by the average account value over the period, multiplied by the number of days in the period, divided by the number of days in the year. |
7
Table of Contents
MFS Global Tactical Allocation Portfolio
PORTFOLIO OF INVESTMENTS – 12/31/11
The Portfolio of Investments is a complete list of all securities owned by your fund. It is categorized by broad-based asset classes.
| Issuer | Shares/Par | Value ($) | ||||||
| COMMON STOCKS – 34.7% | ||||||||
| Aerospace – 1.9% | ||||||||
| Cobham PLC | 616,217 | $ | 1,748,471 | |||||
| Honeywell International, Inc. | 73,650 | 4,002,878 | ||||||
| Lockheed Martin Corp. (s) | 99,160 | 8,022,044 | ||||||
| Northrop Grumman Corp. | 26,150 | 1,529,252 | ||||||
| United Technologies Corp. | 55,250 | 4,038,223 | ||||||
|
| |||||||
| $ | 19,340,868 | |||||||
|
| |||||||
| Alcoholic Beverages – 0.7% | ||||||||
| Heineken N.V. | 143,639 | $ | 6,631,157 | |||||
|
| |||||||
| Automotive – 0.3% | ||||||||
| Johnson Controls, Inc. | 53,430 | $ | 1,670,222 | |||||
| USS Co. Ltd. | 16,590 | 1,500,148 | ||||||
|
| |||||||
| $ | 3,170,370 | |||||||
|
| |||||||
| Broadcasting – 1.1% | ||||||||
| Fuji Television Network, Inc. | 1,068 | $ | 1,619,275 | |||||
| Nippon Television Network Corp. | 11,500 | 1,760,036 | ||||||
| Omnicom Group, Inc. | 57,180 | 2,549,084 | ||||||
| Viacom, Inc., “B” | 40,880 | 1,856,361 | ||||||
| Walt Disney Co. | 89,930 | 3,372,375 | ||||||
|
| |||||||
| $ | 11,157,131 | |||||||
|
| |||||||
| Brokerage & Asset Managers – 0.6% | ||||||||
| Blackrock, Inc. | 16,293 | $ | 2,904,064 | |||||
| Computershare Ltd. | 137,639 | 1,127,625 | ||||||
| Daiwa Securities Group, Inc. | 498,000 | 1,552,813 | ||||||
|
| |||||||
| $ | 5,584,502 | |||||||
|
| |||||||
| Business Services – 1.5% | ||||||||
| Accenture PLC, “A” | 70,150 | $ | 3,734,085 | |||||
| Amadeus IT Holding S.A. | 125,677 | 2,030,246 | ||||||
| Bunzl PLC | 168,466 | 2,305,180 | ||||||
| Compass Group PLC | 340,130 | 3,220,493 | ||||||
| Dun & Bradstreet Corp. | 22,440 | 1,679,185 | ||||||
| Nomura Research, Inc. | 83,200 | 1,880,837 | ||||||
|
| |||||||
| $ | 14,850,026 | |||||||
|
| |||||||
| Cable TV – 0.2% | ||||||||
| Comcast Corp., “Special A” | 81,240 | $ | 1,914,014 | |||||
|
| |||||||
| Chemicals – 0.8% | ||||||||
| 3M Co. | 46,010 | $ | 3,760,397 | |||||
| Givaudan S.A. | 2,464 | 2,338,658 | ||||||
| PPG Industries, Inc. | 27,380 | 2,285,956 | ||||||
|
| |||||||
| $ | 8,385,011 | |||||||
|
| |||||||
| Computer Software – 0.4% | ||||||||
| Oracle Corp. | 138,670 | $ | 3,556,886 | |||||
|
| |||||||
| Computer Software – Systems – 0.7% | ||||||||
| International Business Machines Corp. | 30,570 | $ | 5,621,212 | |||||
| Konica Minolta Holdings, Inc. | 246,500 | 1,838,262 | ||||||
|
| |||||||
| $ | 7,459,474 | |||||||
|
| |||||||
| Issuer | Shares/Par | Value ($) | ||||||
| COMMON STOCKS – continued | ||||||||
| Construction – 0.6% | ||||||||
| Geberit AG | 8,627 | $ | 1,662,394 | |||||
| Sherwin-Williams Co. | 21,700 | 1,937,159 | ||||||
| Stanley Black & Decker, Inc. | 42,040 | 2,841,904 | ||||||
|
| |||||||
| $ | 6,441,457 | |||||||
|
| |||||||
| Consumer Products – 1.2% | ||||||||
| Henkel KGaA, IPS | 62,384 | $ | 3,600,220 | |||||
| Kao Corp. | 156,500 | 4,275,945 | ||||||
| KOSE Corp. | 39,800 | 997,456 | ||||||
| Reckitt Benckiser Group PLC | 66,855 | 3,294,503 | ||||||
|
| |||||||
| $ | 12,168,124 | |||||||
|
| |||||||
| Electrical Equipment – 0.6% | ||||||||
| Danaher Corp. | 49,140 | $ | 2,311,546 | |||||
| Legrand S.A. | 81,880 | 2,623,064 | ||||||
| Spectris PLC | 49,177 | 980,835 | ||||||
|
| |||||||
| $ | 5,915,445 | |||||||
|
| |||||||
| Electronics – 0.9% | ||||||||
| Halma PLC | 222,307 | $ | 1,136,877 | |||||
| Intel Corp. | 56,800 | 1,377,400 | ||||||
| Samsung Electronics Co. Ltd. | 3,167 | 2,908,582 | ||||||
| Taiwan Semiconductor Manufacturing Co. Ltd., ADR | 278,518 | 3,595,667 | ||||||
|
| |||||||
| $ | 9,018,526 | |||||||
|
| |||||||
| Energy – Independent – 0.7% | ||||||||
| Apache Corp. | 25,180 | $ | 2,280,804 | |||||
| INPEX Corp. | 307 | 1,934,455 | ||||||
| Occidental Petroleum Corp. | 32,230 | 3,019,951 | ||||||
|
| |||||||
| $ | 7,235,210 | |||||||
|
| |||||||
| Energy – Integrated – 2.1% | ||||||||
| BP PLC | 776,237 | $ | 5,535,544 | |||||
| Chevron Corp. | 41,710 | 4,437,944 | ||||||
| Exxon Mobil Corp. | 56,220 | 4,765,207 | ||||||
| Royal Dutch Shell PLC, “A” | 166,592 | 6,124,362 | ||||||
|
| |||||||
| $ | 20,863,057 | |||||||
|
| |||||||
| Food & Beverages – 1.8% | ||||||||
| General Mills, Inc. | 74,230 | $ | 2,999,634 | |||||
| Groupe Danone | 77,275 | 4,857,641 | ||||||
| Nestle S.A. | 129,457 | 7,432,491 | ||||||
| PepsiCo, Inc. | 35,950 | 2,385,283 | ||||||
|
| |||||||
| $ | 17,675,049 | |||||||
|
| |||||||
| Food & Drug Stores – 0.5% | ||||||||
| Lawson, Inc. | 45,500 | $ | 2,840,425 | |||||
| Tesco PLC | 277,471 | 1,738,516 | ||||||
|
| |||||||
| $ | 4,578,941 | |||||||
|
| |||||||
| General Merchandise – 0.3% | ||||||||
| Target Corp. | 63,980 | $ | 3,277,056 | |||||
|
| |||||||
8
Table of Contents
MFS Global Tactical Allocation Portfolio
Portfolio of Investments – continued
| Issuer | Shares/Par | Value ($) | ||||||
| COMMON STOCKS – continued | ||||||||
| Insurance – 2.0% | ||||||||
| Aon Corp. | 46,400 | $ | 2,171,520 | |||||
| Hiscox Ltd. | 229,854 | 1,329,315 | ||||||
| ING Groep N.V. (a) | 248,883 | 1,773,598 | ||||||
| Jardine Lloyd Thompson Group PLC | 111,762 | 1,196,740 | ||||||
| MetLife, Inc. | 117,340 | 3,658,661 | ||||||
| Prudential Financial, Inc. | 41,950 | 2,102,534 | ||||||
| Swiss Re Ltd. | 50,418 | 2,569,477 | ||||||
| Travelers Cos., Inc. | 47,380 | 2,803,475 | ||||||
| Zurich Financial Services Ltd. | 9,987 | 2,255,218 | ||||||
|
| |||||||
| $ | 19,860,538 | |||||||
|
| |||||||
| Leisure & Toys – 0.2% | ||||||||
| Hasbro, Inc. | 49,280 | $ | 1,571,539 | |||||
|
| |||||||
| Machinery & Tools – 0.4% | ||||||||
| Glory Ltd. | 41,500 | $ | 893,407 | |||||
| Neopost S.A. (l) | 23,970 | 1,610,369 | ||||||
| Schindler Holding AG | 11,013 | 1,282,681 | ||||||
|
| |||||||
| $ | 3,786,457 | |||||||
|
| |||||||
| Major Banks – 2.2% | ||||||||
| Bank of America Corp. | 206,020 | $ | 1,145,471 | |||||
| Bank of New York Mellon Corp. | 160,081 | 3,187,213 | ||||||
| Goldman Sachs Group, Inc. | 25,250 | 2,283,358 | ||||||
| HSBC Holdings PLC | 434,000 | 3,294,588 | ||||||
| JPMorgan Chase & Co. | 136,080 | 4,524,660 | ||||||
| State Street Corp. | 48,330 | 1,948,182 | ||||||
| Sumitomo Mitsui Financial Group, Inc. | 38,800 | 1,080,774 | ||||||
| Toronto-Dominion Bank | 17,094 | 1,280,099 | ||||||
| Wells Fargo & Co. | 105,640 | 2,911,438 | ||||||
|
| |||||||
| $ | 21,655,783 | |||||||
|
| |||||||
| Medical & Health Technology & Services – 0.5% | ||||||||
| Kobayashi Pharmaceutical Co. Ltd. | 35,500 | $ | 1,867,936 | |||||
| Miraca Holdings, Inc. | 51,700 | 2,058,731 | ||||||
| Quest Diagnostics, Inc. | 26,910 | 1,562,395 | ||||||
|
| |||||||
| $ | 5,489,062 | |||||||
|
| |||||||
| Medical Equipment – 1.1% | ||||||||
| Becton, Dickinson & Co. | 32,400 | $ | 2,420,928 | |||||
| Medtronic, Inc. | 81,600 | 3,121,200 | ||||||
| Smith & Nephew PLC | 141,273 | 1,368,922 | ||||||
| St. Jude Medical, Inc. | 46,340 | 1,589,462 | ||||||
| Synthes, Inc. (n) | 12,148 | 2,033,458 | ||||||
|
| |||||||
| $ | 10,533,970 | |||||||
|
| |||||||
| Network & Telecom – 0.5% | ||||||||
| Cisco Systems, Inc. | 71,470 | $ | 1,292,178 | |||||
| Ericsson, Inc., “B” | 291,733 | 2,963,384 | ||||||
| Nokia Oyj | 218,805 | 1,057,328 | ||||||
|
| |||||||
| $ | 5,312,890 | |||||||
|
| |||||||
| Oil Services – 0.1% | ||||||||
| Transocean, Inc. | 35,440 | $ | 1,360,542 | |||||
|
| |||||||
| Other Banks & Diversified Financials – 0.5% | ||||||||
| DnB NOR A.S.A. | 200,795 | $ | 1,965,698 | |||||
| Hachijuni Bank Ltd. | 137,000 | 781,382 | ||||||
| Issuer | Shares/Par | Value ($) | ||||||
| COMMON STOCKS – continued | ||||||||
| Other Banks & Diversified Financials – continued | ||||||||
| MasterCard, Inc., “A” | 4,690 | $ | 1,748,526 | |||||
| Sapporo Hokuyo Holdings, Inc. | 169,700 | 608,512 | ||||||
|
| |||||||
| $ | 5,104,118 | |||||||
|
| |||||||
| Pharmaceuticals – 3.9% | ||||||||
| Abbott Laboratories | 94,180 | $ | 5,295,741 | |||||
| Bayer AG | 74,032 | 4,733,308 | ||||||
| GlaxoSmithKline PLC | 316,158 | 7,209,232 | ||||||
| Johnson & Johnson (s) | 113,080 | 7,415,786 | ||||||
| Pfizer, Inc. | 246,940 | 5,343,782 | ||||||
| Roche Holding AG | 27,617 | 4,670,520 | ||||||
| Sanofi | 41,230 | 3,016,840 | ||||||
| Santen Pharmaceutical Co. Ltd. | 40,200 | 1,655,632 | ||||||
|
| |||||||
| $ | 39,340,841 | |||||||
|
| |||||||
| Railroad & Shipping – 0.2% | ||||||||
| Canadian National Railway Co. | 26,290 | $ | 2,065,342 | |||||
|
| |||||||
| Real Estate – 0.3% | ||||||||
| Deutsche Wohnen AG | 144,424 | $ | 1,918,742 | |||||
| GSW Immobilien AG (a) | 39,134 | 1,132,755 | ||||||
|
| |||||||
| $ | 3,051,497 | |||||||
|
| |||||||
| Restaurants – 0.2% | ||||||||
| McDonald’s Corp. | 18,940 | $ | 1,900,250 | |||||
|
| |||||||
| Specialty Chemicals – 0.2% | ||||||||
| Shin-Etsu Chemical Co. Ltd. | 46,900 | $ | 2,309,354 | |||||
|
| |||||||
| Specialty Stores – 0.1% | ||||||||
| Esprit Holdings Ltd. | 643,900 | $ | 830,721 | |||||
|
| |||||||
| Telecommunications – Wireless – 1.6% | ||||||||
| KDDI Corp. | 1,097 | $ | 7,054,892 | |||||
| Vodafone Group PLC | 3,060,677 | 8,503,531 | ||||||
|
| |||||||
| $ | 15,558,423 | |||||||
|
| |||||||
| Telephone Services – 1.2% | ||||||||
| AT&T, Inc. | 160,670 | $ | 4,858,661 | |||||
| China Unicom (Hong Kong) Ltd. | 790,000 | 1,662,066 | ||||||
| Royal KPN N.V. | 242,963 | 2,900,726 | ||||||
| TDC A.S. | 176,250 | 1,410,464 | ||||||
| Telecom Italia S.p.A. | 1,275,815 | 1,138,463 | ||||||
|
| |||||||
| $ | 11,970,380 | |||||||
|
| |||||||
| Tobacco – 1.9% | ||||||||
| British American Tobacco PLC | 97,268 | $ | 4,615,553 | |||||
| Japan Tobacco, Inc. | 889 | 4,181,084 | ||||||
| Philip Morris International, Inc. (s) | 117,546 | 9,225,010 | ||||||
| Reynolds American, Inc. | 26,350 | 1,091,417 | ||||||
|
| |||||||
| $ | 19,113,064 | |||||||
|
| |||||||
| Trucking – 0.4% | ||||||||
| Yamato Holdings Co. Ltd. | 234,200 | $ | 3,946,439 | |||||
|
| |||||||
| Utilities – Electric Power – 0.3% | ||||||||
| PG&E Corp. | 71,710 | $ | 2,955,886 | |||||
|
| |||||||
| Total Common Stocks (Identified Cost, $345,589,087) | $ | 346,939,400 | ||||||
|
| |||||||
9
Table of Contents
MFS Global Tactical Allocation Portfolio
Portfolio of Investments – continued
| Issuer | Shares/Par | Value ($) | ||||||
| BONDS – 54.5% | ||||||||
| Aerospace – 0.1% | ||||||||
| Bombardier, Inc., 7.75%, 2020 (n) | $ | 1,170,000 | $ | 1,275,300 | ||||
|
| |||||||
| Asset-Backed & Securitized – 1.8% | ||||||||
| Bayview Commercial Asset Trust, FRN, 1.7%, 2023 (z) | CAD | 170,000 | $ | 155,159 | ||||
| Citigroup/Deutsche Bank Commercial Mortgage Trust, 5.322%, 2049 | $ | 3,479,018 | 3,690,031 | |||||
| Commercial Mortgage Asset Trust, FRN, 0.736%, 2032 (i)(z) | 2,089,928 | 24,283 | ||||||
| Commercial Mortgage Pass-Through Certificates, “A3”, 5.293%, 2049 | 532,759 | 566,668 | ||||||
| Commercial Mortgage Pass-Through Certificates, “A4”, 5.306%, 2046 | 3,032,759 | 3,288,751 | ||||||
| First Union National Bank Commercial Mortgage Trust, FRN, 1.504%, 2043 (i)(z) | 263,131 | 344 | ||||||
| G-Force LLC, CDO, “A2”, 4.83%, 2036 (z) | 541,762 | 515,351 | ||||||
| JPMorgan Chase Commercial Mortgage Securities Corp., FRN, 5.816%, 2049 | 1,230,759 | 1,295,810 | ||||||
| JPMorgan Chase Commercial Mortgage Securities Corp., FRN, 5.986%, 2051 | 1,808,573 | 1,924,226 | ||||||
| Merrill Lynch Mortgage Trust, FRN, 6.027%, 2050 | 3,310,000 | 3,568,918 | ||||||
| Merrill Lynch Mortgage Trust, FRN, “A3”, 5.833%, 2050 | 2,373,000 | 2,473,020 | ||||||
| Wachovia Bank Commercial Mortgage Trust, “A3”, FRN, 5.898%, 2051 | 620,000 | 657,165 | ||||||
|
| |||||||
| $ | 18,159,726 | |||||||
|
| |||||||
| Automotive – 0.2% | ||||||||
| Ford Motor Credit Co. LLC, 7.8%, 2012 | $ | 2,000,000 | $ | 2,042,600 | ||||
|
| |||||||
| Broadcasting – 0.1% | ||||||||
| NBCUniversal Media LLC, 5.15%, 2020 | $ | 1,166,000 | $ | 1,298,195 | ||||
|
| |||||||
| Building – 0.2% | ||||||||
| Mohawk Industries, Inc., 6.875%, 2016 | $ | 1,145,000 | $ | 1,230,875 | ||||
| Owens Corning, Inc., 6.5%, 2016 | 1,080,000 | 1,178,693 | ||||||
|
| |||||||
| $ | 2,409,568 | |||||||
|
| |||||||
| Cable TV – 0.3% | ||||||||
| DIRECTV Holdings LLC, 5.2%, 2020 | $ | 1,656,000 | $ | 1,784,860 | ||||
| Time Warner Cable, Inc., 5%, 2020 | 1,020,000 | 1,117,545 | ||||||
|
| |||||||
| $ | 2,902,405 | |||||||
|
| |||||||
| Chemicals – 0.3% | ||||||||
| Ashland, Inc., 9.125%, 2017 | $ | 1,310,000 | $ | 1,460,650 | ||||
| Dow Chemical Co., 8.55%, 2019 | 930,000 | 1,216,745 | ||||||
| Nalco Co., 8.25%, 2017 | 566,000 | 642,410 | ||||||
|
| |||||||
| $ | 3,319,805 | |||||||
|
| |||||||
| Consumer Products – 0.1% | ||||||||
| Whirlpool Corp., 8%, 2012 | $ | 970,000 | $ | 991,645 | ||||
|
| |||||||
| Containers – 0.1% | ||||||||
| Crown Americas LLC, 7.625%, 2017 | $ | 870,000 | $ | 949,388 | ||||
|
| |||||||
| Emerging Market Quasi-Sovereign – 1.6% | ||||||||
| Banco do Brasil (Cayman Branch), 6%, 2020 (n) | $ | 910,000 | $ | 991,900 | ||||
| Issuer | Shares/Par | Value ($) | ||||||
| BONDS – continued | ||||||||
| Emerging Market Quasi-Sovereign – continued | ||||||||
| Banco do Brasil S.A., 5.875%, 2022 (n) | $ | 3,195,000 | $ | 3,198,195 | ||||
| Banco do Nordeste do Brasil (BNB), 3.625%, 2015 (n) | 519,000 | 517,703 | ||||||
| BNDES Participacoes S.A., 6.5%, 2019 (n) | 700,000 | 798,000 | ||||||
| Centrais Eletricas Brasileiras S.A., 5.75%, 2021 (n) | 2,218,000 | 2,304,502 | ||||||
| CNPC (HK) Overseas Capital Ltd., 4.5%, 2021 (n) | 669,000 | 697,309 | ||||||
| Corporacion Nacional del Cobre de Chile, 3.75%, 2020 (n) | 474,000 | 481,369 | ||||||
| Empresa Nacional del Petroleo, 6.25%, 2019 | 619,000 | 692,702 | ||||||
| OJSC Russian Agricultural Bank, FRN, 6%, 2021 (n) | 902,000 | 789,250 | ||||||
| Pemex Project Funding Master Trust, 5.75%, 2018 | 1,003,000 | 1,103,300 | ||||||
| Petrobras International Finance Co., 5.375%, 2021 | 2,361,000 | 2,480,469 | ||||||
| Petroleos Mexicanos, 6%, 2020 | 600,000 | 666,180 | ||||||
| Petroleos Mexicanos, 5.5%, 2021 | 664,000 | 720,440 | ||||||
| SCF Capital Ltd., 5.375%, 2017 (n) | 531,000 | 456,660 | ||||||
|
| |||||||
| $ | 15,897,979 | |||||||
|
| |||||||
| Emerging Market Sovereign – 0.9% | ||||||||
| Federative Republic of Brazil, 5.625%, 2041 | $ | 1,255,000 | $ | 1,455,800 | ||||
| Republic of Peru, 7.35%, 2025 | 1,400,000 | 1,855,000 | ||||||
| Republic of Philippines, 5.5%, 2026 | 1,500,000 | 1,680,000 | ||||||
| Republic of Poland, 5%, 2022 | 160,000 | 160,800 | ||||||
| Republic of South Africa, 5.5%, 2020 | 900,000 | 1,008,000 | ||||||
| Republic of South Africa, 6.25%, 2041 | 483,000 | 561,488 | ||||||
| United Mexican States, 7.5%, 2027 | MXN | 33,700,000 | 2,497,503 | |||||
|
| |||||||
| $ | 9,218,591 | |||||||
|
| |||||||
| Energy – Independent – 0.1% | ||||||||
| Anadarko Petroleum Corp., 6.2%, 2040 | $ | 435,000 | $ | 484,107 | ||||
| Encana Corp., 3.9%, 2021 | 870,000 | 874,006 | ||||||
|
| |||||||
| $ | 1,358,113 | |||||||
|
| |||||||
| Energy – Integrated – 0.3% | ||||||||
| Hess Corp., 8.125%, 2019 | $ | 980,000 | $ | 1,257,990 | ||||
| LUKOIL International Finance B.V., 6.125%, 2020 (n) | 2,117,000 | 2,074,660 | ||||||
|
| |||||||
| $ | 3,332,650 | |||||||
|
| |||||||
| Financial Institutions – 0.2% | ||||||||
| General Electric Capital Corp., 4.625%, 2021 | $ | 900,000 | $ | 933,707 | ||||
| International Lease Finance Corp., 5.75%, 2016 | 974,000 | 903,426 | ||||||
| SLM Corp., 6.25%, 2016 | 493,000 | 479,432 | ||||||
|
| |||||||
| $ | 2,316,565 | |||||||
|
| |||||||
10
Table of Contents
MFS Global Tactical Allocation Portfolio
Portfolio of Investments – continued
| Issuer | Shares/Par | Value ($) | ||||||
| BONDS – continued | ||||||||
| Food & Beverages – 0.5% | ||||||||
| Anheuser-Busch InBev S.A., 5.375%, 2020 | $ | 1,310,000 | $ | 1,536,373 | ||||
| Kraft Foods, Inc., 6.125%, 2018 | 470,000 | 550,916 | ||||||
| Miller Brewing Co., 5.5%, 2013 (n) | 900,000 | 959,399 | ||||||
| Pernod-Ricard S.A., 4.45%, 2022 (n) | 241,000 | 252,468 | ||||||
| Tyson Foods, Inc., 6.85%, 2016 | 1,213,000 | 1,331,268 | ||||||
|
| |||||||
| $ | 4,630,424 | |||||||
|
| |||||||
| Food & Drug Stores – 0.1% | ||||||||
| CVS Caremark Corp., 5.75%, 2017 | $ | 910,000 | $ | 1,061,826 | ||||
|
| |||||||
| Forest & Paper Products – 0.1% | ||||||||
| Votorantim Participacoes S.A., 6.75%, 2021 (n) | $ | 600,000 | $ | 634,500 | ||||
|
| |||||||
| Insurance – 0.3% | ||||||||
| American International Group, Inc., 4.875%, 2016 | $ | 1,460,000 | $ | 1,381,613 | ||||
| Unum Group, 7.125%, 2016 | 800,000 | 912,886 | ||||||
| UnumProvident Corp., 6.85%, 2015 (n) | 696,000 | 770,574 | ||||||
|
| |||||||
| $ | 3,065,073 | |||||||
|
| |||||||
| Insurance – Property & Casualty – 0.6% | ||||||||
| AXIS Capital Holdings Ltd., 5.75%, 2014 | $ | 320,000 | $ | 336,457 | ||||
| Chubb Corp., 6.375% to 2017, FRN to 2067 | 1,010,000 | 997,375 | ||||||
| CNA Financial Corp., 5.875%, 2020 | 2,000,000 | 2,054,498 | ||||||
| QBE Capital Funding III Ltd., FRN, 7.25%, 2041 (n) | 1,089,000 | 958,906 | ||||||
| ZFS Finance USA Trust II, 6.45% to 2016, FRN to 2065 (n) | 2,000,000 | 1,820,000 | ||||||
|
| |||||||
| $ | 6,167,236 | |||||||
|
| |||||||
| International Market Quasi-Sovereign – 0.3% | ||||||||
| Eksportfinans A.S.A., 1.875%, 2013 | $ | 1,795,000 | $ | 1,692,392 | ||||
| Statoil A.S.A., 4.25%, 2041 | 1,260,000 | 1,315,945 | ||||||
|
| |||||||
| $ | 3,008,337 | |||||||
|
| |||||||
| International Market Sovereign – 29.1% | ||||||||
| Commonwealth of Australia, 5.75%, 2021 | AUD | 12,056,000 | $ | 14,341,060 | ||||
| Federal Republic of Germany, 3.75%, 2013 | EUR | 5,547,000 | 7,572,628 | |||||
| Federal Republic of Germany, 3.75%, 2015 | EUR | 8,251,000 | 11,746,746 | |||||
| Federal Republic of Germany, 3.25%, 2021 | EUR | 2,078,000 | 3,038,543 | |||||
| Federal Republic of Germany, 6.25%, 2030 | EUR | 4,860,000 | 9,672,221 | |||||
| Government of Canada, 4.5%, 2015 | CAD | 7,717,000 | 8,432,456 | |||||
| Government of Canada, 4.25%, 2018 | CAD | 12,217,000 | 13,994,236 | |||||
| Government of Canada, 3.25%, 2021 | CAD | 4,452,000 | 4,858,634 | |||||
| Issuer | Shares/Par | Value ($) | ||||||
| BONDS – continued | ||||||||
| International Market Sovereign – continued | ||||||||
| Government of Canada, 5.75%, 2033 | CAD | 2,792,000 | $ | 4,213,638 | ||||
| Government of Japan, 1.7%, 2017 | JPY | 1,400,900,000 | 19,437,474 | |||||
| Government of Japan, 1.1%, 2020 | JPY | 1,369,700,000 | 18,249,326 | |||||
| Government of Japan, 2.1%, 2024 | JPY | 1,121,200,000 | 15,994,806 | |||||
| Government of Japan, 2.2%, 2027 | JPY | 667,450,000 | 9,473,281 | |||||
| Government of Japan, 2.4%, 2037 | JPY | 512,200,000 | 7,414,889 | |||||
| Government of New Zealand, 6%, 2021 | NZD | 1,894,000 | 1,726,584 | |||||
| Government of Norway, 3.75%, 2021 | NOK | 26,421,000 | 4,898,234 | |||||
| Kingdom of Belgium, 4.25%, 2021 | EUR | 3,245,000 | 4,241,715 | |||||
| Kingdom of Denmark, 3%, 2021 | DKK | 9,278,000 | 1,809,883 | |||||
| Kingdom of Spain, 4.6%, 2019 | EUR | 7,872,000 | 10,150,642 | |||||
| Kingdom of Sweden, 5%, 2020 | SEK | 58,730,000 | 10,989,223 | |||||
| Kingdom of the Netherlands, 3.75%, 2014 | EUR | 8,345,000 | 11,667,802 | |||||
| Kingdom of the Netherlands, 3.5%, 2020 | EUR | 602,000 | 864,338 | |||||
| Kingdom of the Netherlands, 5.5%, 2028 | EUR | 1,387,000 | 2,480,289 | |||||
| Republic of Austria, 4.65%, 2018 | EUR | 1,816,000 | 2,631,227 | |||||
| Republic of Finland, 3.875%, 2017 | EUR | 1,557,000 | 2,243,928 | |||||
| Republic of France, 6%, 2025 | EUR | 3,986,000 | 6,568,289 | |||||
| Republic of France, 4.75%, 2035 | EUR | 5,430,000 | 8,196,500 | |||||
| Republic of Iceland, 4.875%, 2016 (n) | $ | 1,518,000 | 1,483,661 | |||||
| Republic of Italy, 4.75%, 2013 | EUR | 8,371,000 | 10,771,874 | |||||
| Republic of Italy, 5.25%, 2017 | EUR | 9,059,000 | 11,204,862 | |||||
| Republic of Italy, 3.75%, 2021 | EUR | 4,654,000 | 4,939,222 | |||||
| United Kingdom Treasury, 8%, 2015 | GBP | 5,661,000 | 11,303,186 | |||||
| United Kingdom Treasury, 5%, 2018 | GBP | 4,468,000 | 8,484,353 | |||||
| United Kingdom Treasury, 8%, 2021 | GBP | 4,705,000 | 11,198,794 | |||||
| United Kingdom Treasury, 4.25%, 2027 | GBP | 2,843,000 | 5,403,164 | |||||
| United Kingdom Treasury, 4.25%, 2036 | GBP | 4,584,000 | 8,735,666 | |||||
|
| |||||||
| $ | 290,433,374 | |||||||
|
| |||||||
| Machinery & Tools – 0.1% | ||||||||
| Case New Holland, Inc., 7.875%, 2017 | $ | 1,240,000 | $ | 1,401,200 | ||||
|
| |||||||
| Major Banks – 2.7% | ||||||||
| ABN Amro Bank N.V., FRN, 2.198%, 2014 (n) | $ | 1,400,000 | $ | 1,365,459 | ||||
| Bank of America Corp., 7.625%, 2019 | 2,225,000 | 2,301,133 | ||||||
| BB&T Corp., 3.95%, 2016 | 1,820,000 | 1,955,335 | ||||||
| BNP Paribas, 7.195% to 2037, FRN to 2049 (n) | 2,100,000 | 1,464,750 | ||||||
| Credit Suisse (USA), Inc., 6%, 2018 | 2,385,000 | 2,352,161 | ||||||
| HSBC USA, Inc., 4.875%, 2020 | 1,870,000 | 1,735,240 | ||||||
| ING Bank N.V., FRN, 1.94%, 2014 (n) | 1,900,000 | 1,819,803 | ||||||
11
Table of Contents
MFS Global Tactical Allocation Portfolio
Portfolio of Investments – continued
| Issuer | Shares/Par | Value ($) | ||||||
| BONDS – continued | ||||||||
| Major Banks – continued | ||||||||
| Intesa Sanpaolo S.p.A., FRN, 2.906%, 2014 (n) | $ | 2,230,000 | $ | 1,963,395 | ||||
| JPMorgan Chase & Co., 4.25%, 2020 | 2,760,000 | 2,779,383 | ||||||
| Macquarie Group Ltd., 6.25%, 2021 (n) | 980,000 | 936,240 | ||||||
| Morgan Stanley, 7.3%, 2019 | 1,772,000 | 1,804,692 | ||||||
| PNC Financial Services Group, Inc., 5.125%, 2020 | 1,670,000 | 1,887,053 | ||||||
| PNC Financial Services Group, Inc., FRN, 6.75%, 2049 | 860,000 | 841,020 | ||||||
| Royal Bank of Scotland PLC, 6.125%, 2021 | 1,710,000 | 1,686,965 | ||||||
| Sumitomo Mitsui Banking, 3.1%, 2016 (n) | 880,000 | 915,959 | ||||||
| SunTrust Banks, Inc., 3.5%, 2017 | 550,000 | 552,836 | ||||||
| UniCredito Luxembourg Finance S.A., 6%, 2017 (n) | 1,020,000 | 767,606 | ||||||
|
| |||||||
| $ | 27,129,030 | |||||||
|
| |||||||
| Metals & Mining – 0.6% | ||||||||
| ArcelorMittal, 9.85%, 2019 | $ | 767,000 | $ | 853,070 | ||||
| ArcelorMittal, 5.5%, 2021 | 970,000 | 890,372 | ||||||
| Gold Fields Orogen Holding Ltd., 4.875%, 2020 (n) | 2,197,000 | 1,939,821 | ||||||
| Southern Copper Corp., 6.75%, 2040 | 407,000 | 407,251 | ||||||
| Teck Resources Ltd., 10.75%, 2019 | 827,000 | 1,008,940 | ||||||
| Vale Overseas Ltd., 5.625%, 2019 | 149,000 | 164,139 | ||||||
| Vale Overseas Ltd., 4.625%, 2020 | 410,000 | 423,983 | ||||||
|
| |||||||
| $ | 5,687,576 | |||||||
|
| |||||||
| Mortgage-Backed – 7.2% | ||||||||
| Fannie Mae, 4.764%, 2012 | $ | 148,000 | $ | 149,286 | ||||
| Fannie Mae, 5.371%, 2013 | 137,827 | 141,303 | ||||||
| Fannie Mae, 4.563%, 2014 - 2015 | 737,402 | 785,801 | ||||||
| Fannie Mae, 4.61%, 2014 | 120,119 | 127,101 | ||||||
| Fannie Mae, 4.778%, 2014 | 426,181 | 446,851 | ||||||
| Fannie Mae, 4.78%, 2015 | 91,682 | 99,716 | ||||||
| Fannie Mae, 4.815%, 2015 | 239,856 | 260,204 | ||||||
| Fannie Mae, 4.856%, 2015 | 72,947 | 79,235 | ||||||
| Fannie Mae, 4.997%, 2015 | 288,528 | 315,079 | ||||||
| Fannie Mae, 5.466%, 2015 | 144,880 | 159,813 | ||||||
| Fannie Mae, 5.5%, 2015 - 2037 | 2,233,934 | 2,429,150 | ||||||
| Fannie Mae, 5.09%, 2016 | 99,000 | 109,862 | ||||||
| Fannie Mae, 5.273%, 2016 | 552,385 | 619,013 | ||||||
| Fannie Mae, 5.424%, 2016 | 96,773 | 108,972 | ||||||
| Fannie Mae, 5.725%, 2016 | 688,410 | 761,761 | ||||||
| Fannie Mae, 3.308%, 2017 | 1,680,770 | 1,786,048 | ||||||
| Fannie Mae, 4.989%, 2017 | 39,140 | 42,120 | ||||||
| Fannie Mae, 5.05%, 2017 | 487,341 | 541,376 | ||||||
| Fannie Mae, 2.578%, 2018 | 1,800,000 | 1,825,049 | ||||||
| Fannie Mae, 3.84%, 2018 | 495,117 | 536,274 | ||||||
| Fannie Mae, 3.849%, 2018 | 1,794,034 | 1,949,812 | ||||||
| Fannie Mae, 5.341%, 2018 | 608,339 | 696,105 | ||||||
| Fannie Mae, 4.45%, 2019 | 437,439 | 485,560 | ||||||
| Fannie Mae, 4.57%, 2019 | 241,316 | 268,511 | ||||||
| Fannie Mae, 4.6%, 2019 | 615,000 | 692,181 | ||||||
| Fannie Mae, 6.16%, 2019 | 65,591 | 74,942 | ||||||
| Fannie Mae, 4.5%, 2023 - 2041 | 9,752,955 | 10,394,788 | ||||||
| Fannie Mae, 5%, 2024 - 2040 | 7,604,287 | 8,253,974 | ||||||
| Issuer | Shares/Par | Value ($) | ||||||
| BONDS – continued | ||||||||
| Mortgage-Backed – continued | ||||||||
| Fannie Mae, 4%, 2025 | $ | 391,754 | $ | 419,533 | ||||
| Fannie Mae, 6%, 2037 - 2038 | 1,703,138 | 1,876,951 | ||||||
| Fannie Mae, 4%, 2040 (f) | 3,557,796 | 3,742,794 | ||||||
| Freddie Mac, 3.882%, 2017 | 1,357,000 | 1,482,517 | ||||||
| Freddie Mac, 2.412%, 2018 (n) | 2,482,000 | 2,519,620 | ||||||
| Freddie Mac, 2.699%, 2018 | 705,000 | 724,857 | ||||||
| Freddie Mac, 4.186%, 2019 | 650,000 | 723,707 | ||||||
| Freddie Mac, 5.085%, 2019 | 30,000 | 34,438 | ||||||
| Freddie Mac, 2.757%, 2020 | 330,039 | 344,343 | ||||||
| Freddie Mac, 3.32%, 2020 | 1,846,480 | 1,974,092 | ||||||
| Freddie Mac, 5%, 2022 - 2038 | 4,060,651 | 4,367,203 | ||||||
| Freddie Mac, 4%, 2025 | 1,103,154 | 1,158,109 | ||||||
| Freddie Mac, 5.5%, 2034 - 2037 | 463,247 | 506,195 | ||||||
| Freddie Mac, 4.5%, 2040 | 11,575,722 | 12,273,124 | ||||||
| Ginnie Mae, 5%, 2040 | 634,309 | 703,310 | ||||||
| Ginnie Mae, 4.5%, 2041 | 2,189,798 | 2,392,970 | ||||||
| Ginnie Mae, TBA, 5%, 2099 | 2,700,000 | 2,985,187 | ||||||
|
| |||||||
| $ | 72,368,837 | |||||||
|
| |||||||
| Natural Gas – Pipeline – 0.2% | ||||||||
| Energy Transfer Partners LP, 4.65%, 2021 | $ | 1,664,000 | $ | 1,630,048 | ||||
|
| |||||||
| Oil Services – 0.1% | ||||||||
| Transocean, Inc., 6.5%, 2020 | $ | 840,000 | $ | 867,713 | ||||
|
| |||||||
| Other Banks & Diversified Financials – 0.5% | ||||||||
| Banco Santander U.S. Debt S.A.U., 3.781%, 2015 (n) | $ | 1,300,000 | $ | 1,178,132 | ||||
| Capital One Financial Corp., 8.8%, 2019 | 815,000 | 932,352 | ||||||
| Citigroup, Inc., 6.125%, 2018 | 2,375,000 | 2,527,848 | ||||||
|
| |||||||
| $ | 4,638,332 | |||||||
|
| |||||||
| Real Estate – 0.3% | ||||||||
| Simon Property Group, Inc., REIT, 5.65%, 2020 | $ | 2,330,000 | $ | 2,670,315 | ||||
|
| |||||||
| Retailers – 0.3% | ||||||||
| Home Depot, Inc., 5.95%, 2041 | $ | 1,469,000 | $ | 1,895,280 | ||||
| Limited Brands, Inc., 7%, 2020 | 870,000 | 941,775 | ||||||
|
| |||||||
| $ | 2,837,055 | |||||||
|
| |||||||
| Specialty Chemicals – 0.0% | ||||||||
| Ecolab, Inc., 5.5%, 2041 | $ | 140,000 | $ | 155,140 | ||||
|
| |||||||
| Specialty Stores – 0.1% | ||||||||
| Best Buy Co., Inc., 6.75%, 2013 | $ | 490,000 | $ | 519,546 | ||||
|
| |||||||
| Telecommunications – Wireless – 0.3% | ||||||||
| America Movil S.A.B. de C.V., 2.375%, 2016 | $ | 242,000 | $ | 241,326 | ||||
| Crown Castle Towers LLC, 6.113%, 2020 (n) | 2,030,000 | 2,239,778 | ||||||
|
| |||||||
| $ | 2,481,104 | |||||||
|
| |||||||
| Tobacco – 0.2% | ||||||||
| Altria Group, Inc., 9.7%, 2018 | $ | 1,455,000 | $ | 1,957,576 | ||||
|
| |||||||
| U.S. Government Agencies and Equivalents – 0.3% | ||||||||
| Aid-Egypt, 4.45%, 2015 | $ | 649,000 | $ | 726,049 | ||||
| FDIC Structured Sale Guarantee Note, 0%, 2012 (n) | 131,000 | 129,964 | ||||||
12
Table of Contents
MFS Global Tactical Allocation Portfolio
Portfolio of Investments – continued
| Issuer | Shares/Par | Value ($) | ||||||
| BONDS – continued | ||||||||
| U.S. Government Agencies and Equivalents – continued | ||||||||
| Small Business Administration, 5.09%, 2025 | $ | 38,495 | $ | 42,590 | ||||
| Small Business Administration, 5.21%, 2026 | 1,315,584 | 1,459,580 | ||||||
| Small Business Administration, 5.31%, 2027 | 302,240 | 337,249 | ||||||
|
| |||||||
| $ | 2,695,432 | |||||||
|
| |||||||
| U.S. Treasury Obligations – 3.8% | ||||||||
| U.S. Treasury Bonds, 6.875%, 2025 (f) | $ | 11,878,000 | $ | 18,292,120 | ||||
| U.S. Treasury Bonds, 4.5%, 2039 (f) | 7,581,000 | 10,027,055 | ||||||
| U.S. Treasury Notes, 4.75%, 2017 | 61,000 | 73,448 | ||||||
| U.S. Treasury Notes, 3.5%, 2020 (f) | 8,118,000 | 9,338,874 | ||||||
|
| |||||||
| $ | 37,731,497 | |||||||
|
| |||||||
| Utilities – Electric Power – 0.5% | ||||||||
| Enel Finance International S.A., 6%, 2039 (n) | $ | 894,000 | $ | 719,532 | ||||
| Progress Energy, Inc., 7.05%, 2019 | 2,150,000 | 2,659,053 | ||||||
| TECO Energy, Inc., 6.572%, 2017 | 1,361,000 | 1,615,937 | ||||||
|
| |||||||
| $ | 4,994,522 | |||||||
|
| |||||||
| Total Bonds (Identified Cost, $535,364,902) | $ | 544,238,223 | ||||||
|
| |||||||
| Issuer/Expiration Date/Strike Price | Number of Contracts | Value ($) | ||||||
| PUT OPTIONS PURCHASED – 0.0% | ||||||||
| S&P 500 Index – March 2012 @ $800 (Premiums Paid, $1,226,712) | 433 | $ | 56,290 | |||||
|
| |||||||
| Issuer | Shares/Par | |||||||
| MONEY MARKET FUNDS – 10.2% | ||||||||
| MFS Institutional Money Market Portfolio, 0.05%, at Cost and Net Asset Value (v) | 101,959,847 | $ | 101,959,847 | |||||
|
| |||||||
| COLLATERAL FOR SECURITIES LOANED – 0.1% | ||||||||
| Navigator Securities Lending Prime Portfolio, 0.27%, at Cost and Net Asset Value (j) | 1,134,400 | $ | 1,134,400 | |||||
|
| |||||||
| Total Investments (Identified Cost, $985,274,948) | $ | 994,328,160 | ||||||
|
| |||||||
| OTHER ASSETS, LESS LIABILITIES – 0.5% | 5,369,416 | |||||||
|
| |||||||
| Net Assets – 100.0% | $ | 999,697,576 | ||||||
|
| |||||||
| (a) | Non-income producing security. |
| (f) | All or a portion of the security has been segregated as collateral for open futures contracts. |
| (i) | Interest only security for which the fund receives interest on notional principal (Par amount). Par amount shown is the notional principal and does not reflect the cost of the security. |
| (j) | The rate quoted is the annualized seven-day yield of the portfolio at period end. |
| (l) | A portion of this security is on loan. |
| (n) | Securities exempt from registration under Rule 144A of the Securities Act of 1933. These securities may be sold in the ordinary course of business in transactions exempt from registration, normally to qualified institutional buyers. At period end, the aggregate value of these securities was $40,457,873, representing 4.0% of net assets. |
| (s) | Security or a portion of the security was pledged to cover collateral requirements for certain derivative transactions. At December 31, 2011, the value of securities pledged amounted to $523,082. |
| (v) | Underlying affiliated fund that is available only to investment companies managed by MFS. The rate quoted for the MFS Institutional Money Market Portfolio is the annualized seven-day yield of the fund at period end. |
| (z) | Restricted securities are not registered under the Securities Act of 1933 and are subject to legal restrictions on resale. These securities generally may be resold in transactions exempt from registration or to the public if the securities are subsequently registered. Disposal of these securities may involve time-consuming negotiations and prompt sale at an acceptable price may be difficult. The fund holds the following restricted securities: |
| Restricted Securities | Acquisition Date | Cost | Value | |||||||
| Bayview Commercial Asset Trust, FRN, 1.7%, 2023 | 5/25/2006 | $170,247 | $155,159 | |||||||
| Commercial Mortgage Asset Trust, FRN, 0.736%, 2032 | 8/25/2003 | 32,327 | 24,283 | |||||||
| First Union National Bank Commercial Mortgage Trust, FRN, 1.504%, 2043 | 12/11/2003 | 334 | 344 | |||||||
| G-Force LLC, CDO, “A2”, 4.83%, 2036 | 1/20/2011 | 525,954 | 515,351 | |||||||
| Total Restricted Securities | $695,137 | |||||||||
| % of Net Assets | 0.1% | |||||||||
The following abbreviations are used in this report and are defined:
| ADR | American Depository Receipt |
| CDO | Collateralized Debt Obligation |
| FRN | Floating Rate Note. Interest rate resets periodically and may not be the rate reported at period end. |
| IPS | International Preference Stock |
13
Table of Contents
MFS Global Tactical Allocation Portfolio
Portfolio of Investments – continued
| PLC | Public Limited Company |
| REIT | Real Estate Investment Trust |
| TBA | To Be Announced |
Abbreviations indicate amounts shown in currencies other than the U.S. dollar. All amounts are stated in U.S. dollars unless otherwise indicated. A list of abbreviations is shown below:
| AUD | Australian Dollar |
| BRL | Brazilian Real |
| CAD | Canadian Dollar |
| CHF | Swiss Franc |
| CNY | Chinese Yuan Renminbi |
| CZK | Czech Koruna |
| DKK | Danish Krone |
| EUR | Euro |
| GBP | British Pound |
| HKD | Hong Kong Dollar |
| HUF | Hungarian Forint |
| JPY | Japanese Yen |
| KRW | Korean Won |
| MXN | Mexican Peso |
| MYR | Malaysian Ringgit |
| NOK | Norwegian Krone |
| NZD | New Zealand Dollar |
| PLN | Polish Zloty |
| SEK | Swedish Krona |
| SGD | Singapore Dollar |
| THB | Thailand Baht |
| TRY | Turkish Lira |
| TWD | Taiwan Dollar |
| ZAR | South African Rand |
Derivative Contracts at 12/31/11
Forward Foreign Currency Exchange Contracts at 12/31/11
| Type | Currency | Counterparty | Contracts to Deliver/Receive | Settlement Date Range | In Exchange For | Contracts at Value | Net Unrealized Appreciation (Depreciation) | |||||||||||||||||
| Asset Derivatives | ||||||||||||||||||||||||
| BUY | AUD | Credit Suisse Group | 180,000 | 1/12/12 | $ | 181,132 | $ | 183,937 | $ | 2,805 | ||||||||||||||
| BUY | AUD | Goldman Sachs International | 307,000 | 1/12/12 | 306,349 | 313,714 | 7,365 | |||||||||||||||||
| BUY | AUD | JPMorgan Chase Bank N.A. | 624,000 | 1/12/12 | 627,270 | 637,648 | 10,378 | |||||||||||||||||
| SELL | AUD | Citibank N.A. | 786,450 | 1/12/12 | 812,157 | 803,650 | 8,507 | |||||||||||||||||
| SELL | AUD | Goldman Sachs International | 4,323,660 | 2/09/12 | 4,438,583 | 4,404,233 | 34,350 | |||||||||||||||||
| SELL | AUD | JPMorgan Chase Bank N.A. | 7,157,502 | 1/12/12-2/09/12 | 7,351,842 | 7,290,937 | 60,905 | |||||||||||||||||
| SELL | AUD | Westpac Banking Corp. | 4,102,318 | 1/12/12 | 4,195,831 | 4,192,043 | 3,788 | |||||||||||||||||
| BUY | CAD | Barclays Bank PLC | 401,000 | 1/12/12 | 389,891 | 393,540 | 3,649 | |||||||||||||||||
| BUY | CAD | Brown Brothers Harriman | 292,000 | 1/12/12 | 286,264 | 286,568 | 304 | |||||||||||||||||
| BUY | CAD | Deutsche Bank AG | 191,000 | 1/12/12 | 187,057 | 187,447 | 390 | |||||||||||||||||
| BUY | CAD | Goldman Sachs International | 859,000 | 1/12/12 | 841,524 | 843,020 | 1,496 | |||||||||||||||||
| BUY | CAD | JPMorgan Chase Bank N.A. | 363,000 | 1/12/12 | 355,186 | 356,247 | 1,061 | |||||||||||||||||
| SELL | CAD | Goldman Sachs International | 34,416,746 | 2/09/12 | 33,912,300 | 33,755,358 | 156,942 | |||||||||||||||||
| SELL | CAD | JPMorgan Chase Bank N.A. | 31,354,260 | 2/09/12 | 30,898,507 | 30,751,725 | 146,782 | |||||||||||||||||
| SELL | CHF | Goldman Sachs International | 9,166,296 | 2/09/12 | 10,427,621 | 9,764,731 | 662,890 | |||||||||||||||||
| SELL | CHF | JPMorgan Chase Bank N.A. | 16,353,804 | 2/09/12 | 18,598,768 | 17,421,486 | 1,177,282 | |||||||||||||||||
| BUY | CNY | Barclays Bank PLC | 8,410,000 | 1/18/12 | 1,310,637 | 1,335,743 | 25,106 | |||||||||||||||||
| BUY | CNY | Goldman Sachs International | 713,000 | 1/18/12 | 111,305 | 113,244 | 1,939 | |||||||||||||||||
| SELL | CZK | Barclays Bank PLC | 656,000 | 1/12/12 | 34,147 | 33,205 | 942 | |||||||||||||||||
14
Table of Contents
MFS Global Tactical Allocation Portfolio
Portfolio of Investments – continued
Forward Foreign Currency Exchange Contracts at 12/31/11 – continued
| Type | Currency | Counterparty | Contracts to Deliver/Receive | Settlement Date Range | In Exchange For | Contracts at Value | Net Unrealized Appreciation (Depreciation) | |||||||||||||||||
| Asset Derivatives – continued | ||||||||||||||||||||||||
| SELL | CZK | Citibank N.A. | 10,953,000 | 1/12/12 | $ | 554,968 | $ | 554,422 | $ | 546 | ||||||||||||||
| SELL | DKK | Goldman Sachs International | 10,417,861 | 1/12/12-2/09/12 | 1,931,085 | 1,814,275 | 116,810 | |||||||||||||||||
| SELL | DKK | JPMorgan Chase Bank N.A. | 421,471 | 2/09/12 | 78,114 | 73,400 | 4,714 | |||||||||||||||||
| BUY | EUR | UBS AG | 330,000 | 1/12/12 | 426,184 | 427,124 | 940 | |||||||||||||||||
| SELL | EUR | Barclays Bank PLC | 7,012,605 | 1/12/12 | 9,505,123 | 9,076,509 | 428,614 | |||||||||||||||||
| SELL | EUR | Citibank N.A. | 10,737,776 | 1/12/12 | 14,167,403 | 13,898,048 | 269,355 | |||||||||||||||||
| SELL | EUR | Credit Suisse Group | 4,376,057 | 1/12/12 | 5,851,970 | 5,663,990 | 187,980 | |||||||||||||||||
| SELL | EUR | Goldman Sachs International | 60,024,695 | 2/09/12 | 82,771,653 | 77,705,036 | 5,066,617 | |||||||||||||||||
| SELL | EUR | JPMorgan Chase Bank N.A. | 16,916,744 | 2/09/12 | 23,329,627 | 21,899,589 | 1,430,038 | |||||||||||||||||
| SELL | EUR | Merrill Lynch International Bank | 3,256,178 | 1/12/12 | 4,385,583 | 4,214,515 | 171,068 | |||||||||||||||||
| SELL | EUR | Royal Bank of Scotland Group PLC | 870,000 | 1/12/12 | 1,165,352 | 1,126,052 | 39,300 | |||||||||||||||||
| SELL | EUR | UBS AG | 3,204,959 | 1/12/12 | 4,287,325 | 4,148,221 | 139,104 | |||||||||||||||||
| BUY | GBP | Citibank N.A. | 308,000 | 1/12/12 | 477,252 | 478,291 | 1,039 | |||||||||||||||||
| SELL | GBP | Barclays Bank PLC | 2,441,080 | 1/12/12 | 3,895,800 | 3,790,738 | 105,062 | |||||||||||||||||
| SELL | GBP | Credit Suisse Group | 3,060,737 | 1/12/12 | 4,796,699 | 4,752,999 | 43,700 | |||||||||||||||||
| SELL | GBP | JPMorgan Chase Bank N.A. | 3,311,650 | 2/09/12 | 5,286,798 | 5,141,376 | 145,422 | |||||||||||||||||
| SELL | HUF | Citibank N.A. | 119,477,000 | 2/09/12 | 497,184 | 489,258 | 7,926 | |||||||||||||||||
| BUY | JPY | Barclays Bank PLC | 106,731,000 | 1/12/12 | 1,370,610 | 1,386,798 | 16,188 | |||||||||||||||||
| BUY | JPY | Citibank N.A. | 288,443,000 | 1/12/12 | 3,706,598 | 3,747,854 | 41,256 | |||||||||||||||||
| BUY | JPY | Credit Suisse Group | 298,854,199 | 1/12/12 | 3,849,053 | 3,883,131 | 34,078 | |||||||||||||||||
| BUY | JPY | Deutsche Bank AG | 379,394,000 | 1/12/12 | 4,869,923 | 4,929,617 | 59,694 | |||||||||||||||||
| BUY | JPY | HSBC Bank | 97,883,000 | 1/12/12 | 1,261,330 | 1,271,834 | 10,504 | |||||||||||||||||
| BUY | JPY | Merrill Lynch International Bank | 79,864,000 | 1/12/12 | 1,027,584 | 1,037,705 | 10,121 | |||||||||||||||||
| BUY | JPY | UBS AG | 161,243,000 | 1/12/12 | 2,074,118 | 2,095,095 | 20,977 | |||||||||||||||||
| SELL | JPY | Credit Suisse Group | 261,495,252 | 1/12/12 | 3,422,407 | 3,397,712 | 24,695 | |||||||||||||||||
| BUY | KRW | Barclays Bank PLC | 778,617,000 | 1/20/12 | 672,497 | 675,130 | 2,633 | |||||||||||||||||
| BUY | KRW | JPMorgan Chase Bank N.A. | 5,852,441,000 | 1/20/12 | 5,041,296 | 5,074,584 | 33,288 | |||||||||||||||||
| SELL | KRW | JPMorgan Chase Bank N.A. | 965,580,000 | 1/20/12 | 847,000 | 837,243 | 9,757 | |||||||||||||||||
| SELL | MXN | JPMorgan Chase Bank N.A. | 27,561,206 | 1/12/12 | 2,027,379 | 1,973,783 | 53,596 | |||||||||||||||||
| SELL | MXN | UBS AG | 27,561,206 | 1/12/12 | 2,031,168 | 1,973,784 | 57,384 | |||||||||||||||||
| BUY | MYR | Barclays Bank PLC | 3,846,756 | 1/12/12-2/21/12 | 1,204,902 | 1,210,169 | 5,267 | |||||||||||||||||
| SELL | NOK | Barclays Bank PLC | 4,784,243 | 1/12/12 | 837,882 | 799,723 | 38,159 | |||||||||||||||||
| SELL | NOK | Citibank N.A. | 5,518,969 | 1/12/12 | 937,300 | 922,539 | 14,761 | |||||||||||||||||
| SELL | NOK | Credit Suisse Group | 16,022,885 | 1/12/12 | 2,724,146 | 2,678,351 | 45,795 | |||||||||||||||||
| BUY | NZD | Barclays Bank PLC | 736,000 | 1/12/12 | 561,583 | 572,629 | 11,046 | |||||||||||||||||
| BUY | NZD | Goldman Sachs International | 118,000 | 1/12/12 | 90,523 | 91,807 | 1,284 | |||||||||||||||||
| SELL | PLN | Citibank N.A. | 120,000 | 1/12/12 | 37,331 | 34,750 | 2,581 | |||||||||||||||||
| SELL | SEK | Barclays Bank PLC | 25,243,837 | 1/12/12 | 3,710,885 | 3,666,608 | 44,277 | |||||||||||||||||
| SELL | SEK | Citibank N.A. | 599,000 | 1/12/12 | 87,275 | 87,003 | 272 | |||||||||||||||||
| SELL | SEK | Deutsche Bank AG | 11,803,097 | 1/12/12 | 1,729,569 | 1,714,372 | 15,197 | |||||||||||||||||
| SELL | SEK | JPMorgan Chase Bank N.A. | 1,756,743 | 2/09/12 | 265,697 | 254,810 | 10,887 | |||||||||||||||||
| BUY | TWD | Barclays Bank PLC | 59,992,650 | 1/30/12 | 1,971,173 | 1,982,386 | 11,213 | |||||||||||||||||
| BUY | TWD | Royal Bank of Scotland Group PLC | 6,961,000 | 1/30/12 | 228,815 | 230,018 | 1,203 | |||||||||||||||||
|
| |||||||||||||||||||||||
| $ | 11,041,229 | |||||||||||||||||||||||
|
| |||||||||||||||||||||||
| Liability Derivatives | ||||||||||||||||||||||||
| BUY | AUD | Barclays Bank PLC | 212,000 | 1/12/12 | $ | 217,304 | $ | 216,636 | $ | (668 | ) | |||||||||||||
| SELL | AUD | Barclays Bank PLC | 182,000 | 1/12/12 | 175,357 | 185,981 | (10,624 | ) | ||||||||||||||||
| SELL | AUD | Citibank N.A. | 782,275 | 1/12/12 | 779,626 | 799,384 | (19,758 | ) | ||||||||||||||||
| SELL | AUD | Westpac Banking Corp. | 1,778,708 | 1/12/12 | 1,695,784 | 1,817,611 | (121,827 | ) | ||||||||||||||||
| BUY | CAD | Barclays Bank PLC | 291,000 | 1/12/12 | 287,178 | 285,587 | (1,591 | ) | ||||||||||||||||
| BUY | CAD | Citibank N.A. | 404,000 | 1/12/12 | 397,068 | 396,484 | (584 | ) | ||||||||||||||||
| SELL | CAD | Barclays Bank PLC | 92,000 | 1/12/12 | 88,790 | 90,288 | (1,498 | ) | ||||||||||||||||
15
Table of Contents
MFS Global Tactical Allocation Portfolio
Portfolio of Investments – continued
Forward Foreign Currency Exchange Contracts at 12/31/11 – continued
| Type | Currency | Counterparty | Contracts to Deliver/Receive | Settlement Date Range | In Exchange For | Contracts at Value | Net Unrealized Appreciation (Depreciation) | |||||||||||||||||
| Liability Derivatives – continued | ||||||||||||||||||||||||
| SELL | CAD | Citibank N.A. | 6,634,355 | 1/12/12 | $ | 6,439,520 | $ | 6,510,933 | $ | (71,413 | ) | |||||||||||||
| SELL | CAD | Goldman Sachs International | 8,456,368 | 1/12/12 | 8,081,096 | 8,299,050 | (217,954 | ) | ||||||||||||||||
| SELL | CAD | Merrill Lynch International Bank | 2,835,097 | 1/12/12 | 2,706,175 | 2,782,355 | (76,180 | ) | ||||||||||||||||
| BUY | CHF | Barclays Bank PLC | 163,000 | 1/12/12 | 175,095 | 173,557 | (1,538 | ) | ||||||||||||||||
| BUY | CHF | Brown Brothers Harriman | 141,000 | 1/12/12 | 157,877 | 150,132 | (7,745 | ) | ||||||||||||||||
| BUY | CHF | Citibank N.A. | 137,000 | 1/12/12 | 148,465 | 145,872 | (2,593 | ) | ||||||||||||||||
| BUY | CHF | Credit Suisse Group | 153,000 | 1/12/12 | 170,641 | 162,909 | (7,732 | ) | ||||||||||||||||
| BUY | CHF | Merrill Lynch International Bank | 3,734,000 | 1/12/12 | 4,038,953 | 3,975,834 | (63,119 | ) | ||||||||||||||||
| SELL | CNY | Barclays Bank PLC | 8,410,000 | 1/18/12 | 1,318,388 | 1,335,743 | (17,355 | ) | ||||||||||||||||
| SELL | CNY | Goldman Sachs International | 713,000 | 1/18/12 | 111,808 | 113,244 | (1,436 | ) | ||||||||||||||||
| BUY | CZK | Goldman Sachs International | 11,622,000 | 1/12/12 | 628,030 | 588,286 | (39,744 | ) | ||||||||||||||||
| BUY | DKK | Barclays Bank PLC | 1,097,000 | 1/12/12 | 193,022 | 191,013 | (2,009 | ) | ||||||||||||||||
| BUY | DKK | Goldman Sachs International | 1,192,000 | 1/12/12 | 220,179 | 207,554 | (12,625 | ) | ||||||||||||||||
| BUY | DKK | Merrill Lynch International Bank | 1,482,177 | 1/12/12 | 267,081 | 258,080 | (9,001 | ) | ||||||||||||||||
| BUY | EUR | Barclays Bank PLC | 7,942,000 | 1/12/12 | 10,811,024 | 10,279,437 | (531,587 | ) | ||||||||||||||||
| BUY | EUR | Citibank N.A. | 4,969,024 | 1/12/12 | 6,672,060 | 6,431,474 | (240,586 | ) | ||||||||||||||||
| BUY | EUR | Credit Suisse Group | 11,836,684 | 1/12/12 | 15,976,166 | 15,320,379 | (655,787 | ) | ||||||||||||||||
| BUY | EUR | Deutsche Bank AG | 3,882,000 | 1/12/12 | 5,307,898 | 5,024,525 | (283,373 | ) | ||||||||||||||||
| BUY | EUR | Goldman Sachs International | 4,541,125 | 1/12/12 | 6,246,746 | 5,877,638 | (369,108 | ) | ||||||||||||||||
| BUY | EUR | HSBC Bank | 7,269,684 | 1/12/12 | 9,802,296 | 9,409,249 | (393,047 | ) | ||||||||||||||||
| BUY | EUR | JPMorgan Chase Bank N.A. | 746,000 | 1/12/12 | 1,005,003 | 965,558 | (39,445 | ) | ||||||||||||||||
| BUY | EUR | UBS AG | 15,368,030 | 1/12/12-3/15/12 | 20,595,460 | 19,899,812 | (695,648 | ) | ||||||||||||||||
| BUY | GBP | Barclays Bank PLC | 2,433,000 | 1/12/12 | 3,830,139 | 3,778,189 | (51,950 | ) | ||||||||||||||||
| BUY | GBP | Citibank N.A. | 148,000 | 1/12/12 | 232,414 | 229,828 | (2,586 | ) | ||||||||||||||||
| BUY | GBP | Deutsche Bank AG | 563,000 | 1/12/12 | 879,929 | 874,278 | (5,651 | ) | ||||||||||||||||
| BUY | GBP | Goldman Sachs International | 719,000 | 1/12/12 | 1,137,192 | 1,116,530 | (20,662 | ) | ||||||||||||||||
| BUY | GBP | JPMorgan Chase Bank N.A. | 176,000 | 1/12/12 | 276,645 | 273,309 | (3,336 | ) | ||||||||||||||||
| BUY | GBP | Royal Bank of Scotland Group PLC | 100,000 | 1/12/12 | 156,922 | 155,289 | (1,633 | ) | ||||||||||||||||
| BUY | GBP | UBS AG | 144,000 | 1/12/12 | 230,509 | 223,616 | (6,893 | ) | ||||||||||||||||
| SELL | GBP | Barclays Bank PLC | 3,279,025 | 1/12/12 | 5,041,753 | 5,091,976 | (50,223 | ) | ||||||||||||||||
| SELL | GBP | Deutsche Bank AG | 2,815,025 | 1/12/12 | 4,327,270 | 4,371,433 | (44,163 | ) | ||||||||||||||||
| BUY | HUF | JPMorgan Chase Bank N.A. | 119,240,000 | 2/09/12 | 527,628 | 488,287 | (39,341 | ) | ||||||||||||||||
| BUY | JPY | Barclays Bank PLC | 77,278,000 | 1/12/12 | 1,005,139 | 1,004,104 | (1,035 | ) | ||||||||||||||||
| BUY | JPY | Brown Brothers Harriman | 42,582,000 | 1/12/12 | 555,002 | 553,285 | (1,717 | ) | ||||||||||||||||
| BUY | JPY | Citibank N.A. | 52,926,000 | 1/12/12 | 688,933 | 687,688 | (1,245 | ) | ||||||||||||||||
| BUY | JPY | Credit Suisse Group | 64,189,000 | 1/12/12 | 843,609 | 834,033 | (9,576 | ) | ||||||||||||||||
| BUY | JPY | Deutsche Bank AG | 115,083,000 | 1/12/12 | 1,499,683 | 1,495,319 | (4,364 | ) | ||||||||||||||||
| BUY | JPY | Goldman Sachs International | 1,666,252,995 | 1/12/12 | 21,732,471 | 21,650,286 | (82,185 | ) | ||||||||||||||||
| BUY | JPY | HSBC Bank | 1,609,664,995 | 1/12/12 | 20,993,075 | 20,915,016 | (78,059 | ) | ||||||||||||||||
| BUY | JPY | JPMorgan Chase Bank N.A. | 26,834,000 | 1/12/12 | 348,934 | 348,665 | (269 | ) | ||||||||||||||||
| BUY | JPY | Merrill Lynch International Bank | 54,523,000 | 1/12/12 | 711,457 | 708,439 | (3,018 | ) | ||||||||||||||||
| BUY | JPY | UBS AG | 137,621,000 | 1/12/12 | 1,805,840 | 1,788,164 | (17,676 | ) | ||||||||||||||||
| SELL | JPY | Barclays Bank PLC | 342,729,019 | 1/12/12 | 4,415,445 | 4,453,214 | (37,769 | ) | ||||||||||||||||
| SELL | JPY | Citibank N.A. | 168,926,000 | 1/12/12 | 2,171,055 | 2,194,923 | (23,868 | ) | ||||||||||||||||
| SELL | JPY | Credit Suisse Group | 34,612,000 | 1/12/12 | 445,529 | 449,727 | (4,198 | ) | ||||||||||||||||
| SELL | JPY | JPMorgan Chase Bank N.A. | 10,485,568,232 | 2/09/12 | 134,646,833 | 136,300,937 | (1,654,104 | ) | ||||||||||||||||
| SELL | JPY | UBS AG | 78,300,000 | 1/12/12 | 1,009,192 | 1,017,383 | (8,191 | ) | ||||||||||||||||
| BUY | KRW | Barclays Bank PLC | 337,480,000 | 1/20/12 | 297,845 | 292,625 | (5,220 | ) | ||||||||||||||||
| SELL | KRW | Barclays Bank PLC | 27,198,000 | 1/20/12 | 23,440 | 23,583 | (143 | ) | ||||||||||||||||
| SELL | KRW | JPMorgan Chase Bank N.A. | 4,636,350,800 | 1/20/12 | 3,993,756 | 4,020,127 | (26,371 | ) | ||||||||||||||||
| BUY | MXN | Barclays Bank PLC | 21,974,000 | 1/12/12 | 1,581,747 | 1,573,658 | (8,089 | ) | ||||||||||||||||
| BUY | MXN | JPMorgan Chase Bank N.A. | 19,541,000 | 1/12/12 | 1,493,910 | 1,399,420 | (94,490 | ) | ||||||||||||||||
| BUY | NOK | Citibank N.A. | 505,000 | 1/12/12 | 84,583 | 84,414 | (169 | ) | ||||||||||||||||
| BUY | NOK | Goldman Sachs International | 152,089,560 | 1/12/12-2/09/12 | 26,863,687 | 25,399,828 | (1,463,859 | ) | ||||||||||||||||
16
Table of Contents
MFS Global Tactical Allocation Portfolio
Portfolio of Investments – continued
Forward Foreign Currency Exchange Contracts at 12/31/11 – continued
| Type | Currency | Counterparty | Contracts to Deliver/Receive | Settlement Date Range | In Exchange For | Contracts at Value | Net Unrealized Appreciation (Depreciation) | |||||||||||||||||
| Liability Derivatives – continued | ||||||||||||||||||||||||
| BUY | NOK | JPMorgan Chase Bank N.A. | 83,483,930 | 2/09/12 | $ | 14,747,628 | $ | 13,942,196 | $ | (805,432 | ) | |||||||||||||
| BUY | NZD | Barclays Bank PLC | 127,000 | 1/12/12 | 100,342 | 98,809 | (1,533 | ) | ||||||||||||||||
| BUY | NZD | JPMorgan Chase Bank N.A. | 7,662,608 | 2/09/12 | 6,039,499 | 5,950,361 | (89,138 | ) | ||||||||||||||||
| SELL | NZD | JPMorgan Chase Bank N.A. | 21,000 | 1/12/12 | 15,693 | 16,339 | (646 | ) | ||||||||||||||||
| SELL | NZD | Royal Bank of Scotland Group PLC | 2,159,359 | 1/12/12 | 1,672,398 | 1,680,042 | (7,644 | ) | ||||||||||||||||
| BUY | PLN | Citibank N.A. | 419,000 | 1/12/12 | 130,670 | 121,334 | (9,336 | ) | ||||||||||||||||
| BUY | PLN | Deutsche Bank AG | 2,129,000 | 2/15/12 | 650,851 | 614,584 | (36,267 | ) | ||||||||||||||||
| BUY | PLN | Goldman Sachs International | 2,129,000 | 2/15/12 | 651,708 | 614,584 | (37,124 | ) | ||||||||||||||||
| SELL | PLN | Citibank N.A. | 2,490,000 | 1/12/12 | 707,247 | 721,058 | (13,811 | ) | ||||||||||||||||
| BUY | SEK | Citibank N.A. | 2,779,000 | 1/12/12 | 410,680 | 403,643 | (7,037 | ) | ||||||||||||||||
| BUY | SEK | Goldman Sachs International | 84,099,045 | 1/12/12-2/09/12 | 12,717,595 | 12,198,533 | (519,062 | ) | ||||||||||||||||
| BUY | SEK | Merrill Lynch International Bank | 924,000 | 1/12/12 | 139,004 | 134,208 | (4,796 | ) | ||||||||||||||||
| BUY | SEK | Royal Bank of Scotland Group PLC | 1,080,000 | 1/12/12 | 157,060 | 156,868 | (192 | ) | ||||||||||||||||
| SELL | SEK | Citibank N.A. | 7,731,367 | 1/12/12 | 1,102,699 | 1,122,963 | (20,264 | ) | ||||||||||||||||
| SELL | SEK | Deutsche Bank AG | 11,469,990 | 1/12/12 | 1,652,747 | 1,665,990 | (13,243 | ) | ||||||||||||||||
| SELL | SEK | UBS AG | 120,000 | 1/12/12 | 17,309 | 17,430 | (121 | ) | ||||||||||||||||
| BUY | SGD | Deutsche Bank AG | 1,079,000 | 1/12/12 | 832,755 | 831,868 | (887 | ) | ||||||||||||||||
| SELL | SGD | Credit Suisse Group | 22,000 | 1/12/12 | 16,773 | 16,962 | (189 | ) | ||||||||||||||||
| BUY | THB | HSBC Bank | 35,416,000 | 1/20/12 | 1,142,452 | 1,120,712 | (21,740 | ) | ||||||||||||||||
| SELL | TWD | Barclays Bank PLC | 66,915,000 | 1/30/12 | 2,207,687 | 2,211,127 | (3,440 | ) | ||||||||||||||||
| BUY | ZAR | Barclays Bank PLC | 1,378,000 | 1/12/12 | 172,039 | 170,480 | (1,559 | ) | ||||||||||||||||
| BUY | ZAR | Citibank N.A. | 37,141,178 | 1/12/12 | 4,619,654 | 4,594,927 | (24,727 | ) | ||||||||||||||||
| SELL | ZAR | Barclays Bank PLC | 13,631,522 | 1/12/12 | 1,609,712 | 1,686,426 | (76,714 | ) | ||||||||||||||||
| SELL | ZAR | Deutsche Bank AG | 13,631,522 | 1/12/12 | 1,609,446 | 1,686,426 | (76,980 | ) | ||||||||||||||||
|
| |||||||||||||||||||||||
| $ | (9,419,510 | ) | ||||||||||||||||||||||
|
| |||||||||||||||||||||||
Futures Contracts Outstanding at 12/31/11
| Description | Currency | Contracts | Value | Expiration Date | Unrealized Appreciation (Depreciation) | |||||||||
| Asset Derivatives | ||||||||||||||
| Equity Futures | ||||||||||||||
| AUST SPI 200 Index (Short) | AUD | 77 | $7,912,971 | March - 2012 | $ 271,390 | |||||||||
| CAC 40 Index (Long) | EUR | 210 | 8,590,009 | January - 2012 | 192,375 | |||||||||
| DAX Index (Long) | EUR | 43 | 8,168,281 | March - 2012 | 95,017 | |||||||||
| FTSE 100 Index (Long) | GBP | 312 | 26,783,194 | March - 2012 | 581,177 | |||||||||
| FTSE MIB Index (Long) | EUR | 177 | 17,266,014 | March - 2012 | 101,273 | |||||||||
| Hang Seng China ENT Index (Long) | HKD | 206 | 13,223,457 | January - 2012 | 135,251 | |||||||||
| IBEX 35 Index (Long) | EUR | 245 | 27,026,474 | January - 2012 | 719,380 | |||||||||
| MSCI Singapore Index (Short) | SGD | 397 | 18,383,116 | January - 2012 | 322,906 | |||||||||
| Nifty Index (Short) | USD | 449 | 4,154,148 | January - 2012 | 141,528 | |||||||||
| NIKKEI 225 Index (Short) | JPY | 26 | 2,854,359 | March - 2012 | 63,808 | |||||||||
| S&P 500 E-Mini Index (Short) | USD | 339 | 21,231,570 | March - 2012 | 4,061 | |||||||||
| S&P TSE 60 Index (Short) | CAD | 222 | 29,588,378 | March - 2012 | 93,274 | |||||||||
|
| |||||||||||||
| $2,721,440 | ||||||||||||||
|
| |||||||||||||
| Interest Rate Futures | ||||||||||||||
| UK Long Gilt Bond (Long) | GBP | 228 | $41,410,124 | March - 2012 | $570,773 | |||||||||
| U.S. Treasury Note 10 yr (Long) | USD | 64 | 8,392,000 | March - 2012 | 74,776 | |||||||||
|
| |||||||||||||
| 645,549 | ||||||||||||||
|
| |||||||||||||
| $3,366,989 | ||||||||||||||
|
| |||||||||||||
17
Table of Contents
MFS Global Tactical Allocation Portfolio
Portfolio of Investments – continued
Futures Contracts Outstanding at 12/31/11 – continued
| Description | Currency | Contracts | Value | Expiration Date | Unrealized Appreciation (Depreciation) | |||||||||
| Liability Derivatives | ||||||||||||||
| Equity Futures | ||||||||||||||
| Bovespa Index (Long) | BRL | 437 | $13,377,671 | February - 2012 | $ (206,122 | ) | ||||||||
| FTSE JSE Top 40 Index (Long) | ZAR | 328 | 11,554,346 | March - 2012 | (245,055 | ) | ||||||||
| Hang Seng Index (Short) | HKD | 175 | 20,792,882 | January - 2012 | (184,801 | ) | ||||||||
| KOSPI 200 Index (Long) | KRW | 31 | 3,213,248 | March - 2012 | (160,819 | ) | ||||||||
| MexBol Index (Long) | MXN | 161 | 4,315,770 | March - 2012 | (16,617 | ) | ||||||||
| MSCI Taiwan Index (Long) | USD | 511 | 12,953,850 | January - 2012 | (79,598 | ) | ||||||||
| OMX 30 Index (Short) | SEK | 670 | 9,611,868 | January - 2012 | (422,085 | ) | ||||||||
| TURKDEK ISE 30 Index (Long) | TRY | 1293 | 4,257,085 | February - 2012 | (131,227 | ) | ||||||||
|
| |||||||||||||
| $(1,446,324 | ) | |||||||||||||
|
| |||||||||||||
| Interest Rate Futures | ||||||||||||||
| Australian Treasury Bond 10 yr (Short) | AUD | 196 | $23,834,734 | March - 2012 | $ (266,535 | ) | ||||||||
| German Euro Bund (Short) | EUR | 557 | 100,233,586 | March - 2012 | (2,964,330 | ) | ||||||||
| Govt Of Canada Bond 10 yr (Short) | CAD | 276 | 36,259,966 | March - 2012 | (396,627 | ) | ||||||||
| Japan Govt Bond 10 yr (Short) | JPY | 18 | 33,303,625 | March - 2012 | (187,437 | ) | ||||||||
|
| |||||||||||||
| (3,814,929 | ) | |||||||||||||
|
| |||||||||||||
| $(5,261,253 | ) | |||||||||||||
|
| |||||||||||||
At December 31, 2011, the fund had sufficient cash and/or other liquid securities to cover any commitments under these derivative contracts.
See Notes to Financial Statements
18
Table of Contents
MFS Global Tactical Allocation Portfolio
FINANCIAL STATEMENTS | STATEMENT OF ASSETS AND LIABILITIES
This statement represents your fund’s balance sheet, which details the assets and liabilities comprising the total value of the fund.
At 12/31/11 | ||||||||
Assets | ||||||||
Investments – | ||||||||
Non-affiliated issuers, at value (identified cost, $883,315,101) | $892,368,313 | |||||||
Underlying affiliated funds, at cost and value | 101,959,847 | |||||||
Total investments, at value, including $1,077,975 of securities on loan (identified cost, $985,274,948) | $994,328,160 | |||||||
Cash | 30,764 | |||||||
Restricted cash | 410,000 | |||||||
Foreign currency, at value (identified cost, $255) | 256 | |||||||
Deposits with brokers | 24,212 | |||||||
Receivables for | ||||||||
Forward foreign currency exchange contracts | 11,041,229 | |||||||
Daily variation margin on open futures contracts | 345,609 | |||||||
Investments sold | 332,771 | |||||||
Fund shares sold | 4,591,013 | |||||||
Interest and dividends | 6,716,504 | |||||||
Other assets | 25,112 | |||||||
Total assets | $1,017,845,630 | |||||||
Liabilities | ||||||||
Payables for | ||||||||
Forward foreign currency exchange contracts | $9,419,510 | |||||||
Daily variation margin on open futures contracts | 230,525 | |||||||
Investments purchased | 4,192,323 | |||||||
TBA purchase commitments | 2,968,734 | |||||||
Fund shares reacquired | 6,903 | |||||||
Collateral for securities loaned, at value | 1,134,400 | |||||||
Payable to affiliates | ||||||||
Investment adviser | 59,716 | |||||||
Shareholder servicing costs | 735 | |||||||
Distribution and/or service fees | 18,836 | |||||||
Payable for Trustees’ compensation | 667 | |||||||
Accrued expenses and other liabilities | 115,705 | |||||||
Total liabilities | $18,148,054 | |||||||
Net assets | $999,697,576 | |||||||
Net assets consist of | ||||||||
Paid-in capital | $995,994,206 | |||||||
Unrealized appreciation (depreciation) on investments and translation of assets and liabilities in foreign currencies | 8,616,084 | |||||||
Accumulated distributions in excess of net realized gain on investments and foreign currency transactions | (9,997,388 | ) | ||||||
Undistributed net investment income | 5,084,674 | |||||||
Net assets | $999,697,576 | |||||||
Shares of beneficial interest outstanding | 71,046,559 |
| Net assets | Shares outstanding | Net asset value per share | ||||||||||
Initial Class | $77,255,223 | 5,433,216 | $14.22 | |||||||||
Service Class | 922,442,353 | 65,613,343 | 14.06 | |||||||||
See Notes to Financial Statements
19
Table of Contents
MFS Global Tactical Allocation Portfolio
FINANCIAL STATEMENTS | STATEMENT OF OPERATIONS
This statement describes how much your fund earned in investment income and accrued in expenses. It also describes any gains and/or losses generated by fund operations.
Year ended 12/31/11 | ||||||||
Net investment income | ||||||||
Income | ||||||||
Interest | $14,593,613 | |||||||
Dividends | 8,223,242 | |||||||
Dividends from underlying affiliated funds | 73,219 | |||||||
Foreign taxes withheld | (400,572 | ) | ||||||
Total investment income | $22,489,502 | |||||||
Expenses | ||||||||
Management fee | $5,333,725 | |||||||
Distribution and/or service fees | 1,684,720 | |||||||
Shareholder servicing costs | 81,466 | |||||||
Administrative services fee | 249,784 | |||||||
Trustees’ compensation | 58,435 | |||||||
Custodian fee | 178,378 | |||||||
Shareholder communications | 28,100 | |||||||
Auditing fees | 53,905 | |||||||
Legal fees | 5,548 | |||||||
Miscellaneous | 61,151 | |||||||
Total expenses | $7,735,212 | |||||||
Fees paid indirectly | (139 | ) | ||||||
Net expenses | $7,735,073 | |||||||
Net investment income | $14,754,429 | |||||||
Realized and unrealized gain (loss) on investments and foreign currency transactions | ||||||||
Realized gain (loss) (identified cost basis) | ||||||||
Investment transactions | $5,104,738 | |||||||
Futures contracts | (11,936,645 | ) | ||||||
Foreign currency transactions | (4,561,878 | ) | ||||||
Net realized gain (loss) on investments and foreign currency transactions | $(11,393,785 | ) | ||||||
Change in unrealized appreciation (depreciation) | ||||||||
Investments | $283,785 | |||||||
Futures contracts | (394,398 | ) | ||||||
Translation of assets and liabilities in foreign currencies | (1,058,493 | ) | ||||||
Net unrealized gain (loss) on investments and foreign currency translation | $(1,169,106 | ) | ||||||
Net realized and unrealized gain (loss) on investments and foreign currency | $(12,562,891 | ) | ||||||
Change in net assets from operations | $2,191,538 |
See Notes to Financial Statements
20
Table of Contents
MFS Global Tactical Allocation Portfolio
FINANCIAL STATEMENTS | STATEMENTS OF CHANGES IN NET ASSETS
These statements describe the increases and/or decreases in net assets resulting from operations, any distributions, and any shareholder transactions.
For years ended 12/31 | 2011 | 2010 | ||||||
Change in net assets | ||||||||
From operations | ||||||||
Net investment income | $14,754,429 | $4,046,543 | ||||||
Net realized gain (loss) on investments and foreign currency transactions | (11,393,785 | ) | 1,426,246 | |||||
Net unrealized gain (loss) on investments and foreign currency translation | (1,169,106 | ) | 13,269,644 | |||||
Change in net assets from operations | $2,191,538 | $18,742,433 | ||||||
Distributions declared to shareholders | ||||||||
From net investment income | $(7,688,343 | ) | $(1,262,023 | ) | ||||
From net realized gain on investments | (3,394,452 | ) | — | |||||
Total distributions declared to shareholders | $(11,082,795 | ) | $(1,262,023 | ) | ||||
Change in net assets from fund share transactions | $521,134,406 | $365,866,407 | ||||||
Total change in net assets | $512,243,149 | $383,346,817 | ||||||
Net assets | ||||||||
At beginning of period | 487,454,427 | 104,107,610 | ||||||
At end of period (including undistributed net investment income of $5,084,674 and | $999,697,576 | $487,454,427 |
See Notes to Financial Statements
21
Table of Contents
MFS Global Tactical Allocation Portfolio
FINANCIAL STATEMENTS | FINANCIAL HIGHLIGHTS
The financial highlights table is intended to help you understand the fund’s financial performance for the past 5 years. Certain information reflects financial results for a single fund share. The total returns in the table represent the rate by which an investor would have earned (or lost) on an investment in the fund share class (assuming reinvestment of all distributions) held for the entire period.
| Initial Class | Years ended 12/31 | |||||||||||||||||||
| 2011 | 2010 | 2009 | 2008 | 2007 | ||||||||||||||||
Net asset value, beginning of period | $14.20 | $13.56 | $12.89 | $17.59 | $18.11 | |||||||||||||||
| Income (loss) from investment operations | ||||||||||||||||||||
Net investment income (d) | $0.32 | $0.24 | $0.27 | $0.37 | $0.40 | |||||||||||||||
Net realized and unrealized gain (loss) on investments | (0.10 | ) | 0.51 | 1.44 | (2.68 | ) | 1.13 | |||||||||||||
Total from investment operations | $0.22 | $0.75 | $1.71 | $(2.31 | ) | $1.53 | ||||||||||||||
| Less distributions declared to shareholders | ||||||||||||||||||||
From net investment income | $(0.14 | ) | $(0.11 | ) | $(1.04 | ) | $(0.86 | ) | $(0.40 | ) | ||||||||||
From net realized gain on investments | (0.06 | ) | — | — | (1.53 | ) | (1.65 | ) | ||||||||||||
Total distributions declared to shareholders | $(0.20 | ) | $(0.11 | ) | $(1.04 | ) | $(2.39 | ) | $(2.05 | ) | ||||||||||
Net asset value, end of period (x) | $14.22 | $14.20 | $13.56 | $12.89 | $17.59 | |||||||||||||||
Total return (%) (k)(r)(s)(x) | 1.55 | 5.53 | 15.16 | (15.42 | ) | 8.87 | ||||||||||||||
| Ratios (%) (to average net assets) and Supplemental data: | ||||||||||||||||||||
Expenses (f) | 0.80 | 0.93 | 1.06 | 0.98 | 0.95 | |||||||||||||||
Expenses after expense reductions (f) | 0.80 | 0.90 | 0.90 | 0.90 | 0.93 | |||||||||||||||
Net investment income | 2.21 | 1.76 | 2.17 | 2.48 | 2.24 | |||||||||||||||
Portfolio turnover | 56 | 73 | 66 | 75 | 78 | |||||||||||||||
Net assets at end of period (000 omitted) | $77,255 | $87,137 | $92,880 | $93,254 | $145,113 | |||||||||||||||
| Service Class | Years ended 12/31 | |||||||||||||||||||
| 2011 | 2010 | 2009 | 2008 | 2007 | ||||||||||||||||
Net asset value, beginning of period | $14.07 | $13.46 | $12.79 | $17.46 | $17.99 | |||||||||||||||
| Income (loss) from investment operations | ||||||||||||||||||||
Net investment income (d) | $0.27 | $0.20 | $0.24 | $0.34 | $0.35 | |||||||||||||||
Net realized and unrealized gain (loss) on investments | (0.09 | ) | 0.51 | 1.42 | (2.66 | ) | 1.13 | |||||||||||||
Total from investment operations | $0.18 | $0.71 | $1.66 | $(2.32 | ) | $1.48 | ||||||||||||||
| Less distributions declared to shareholders | ||||||||||||||||||||
From net investment income | $(0.13 | ) | $(0.10 | ) | $(0.99 | ) | $(0.82 | ) | $(0.36 | ) | ||||||||||
From net realized gain on investments | (0.06 | ) | — | — | (1.53 | ) | (1.65 | ) | ||||||||||||
Total distributions declared to shareholders | $(0.19 | ) | $(0.10 | ) | $(0.99 | ) | $(2.35 | ) | $(2.01 | ) | ||||||||||
Net asset value, end of period (x) | $14.06 | $14.07 | $13.46 | $12.79 | $17.46 | |||||||||||||||
Total return (%) (k)(r)(s)(x) | 1.29 | 5.31 | 14.78 | (15.59 | ) | 8.62 | ||||||||||||||
| Ratios (%) (to average net assets) and Supplemental data: | ||||||||||||||||||||
Expenses (f) | 1.05 | 1.18 | 1.31 | 1.23 | 1.20 | |||||||||||||||
Expenses after expense reductions (f) | 1.05 | 1.15 | 1.15 | 1.15 | 1.18 | |||||||||||||||
Net investment income | 1.92 | 1.48 | 1.92 | 2.25 | 1.99 | |||||||||||||||
Portfolio turnover | 56 | 73 | 66 | 75 | 78 | |||||||||||||||
Net assets at end of period (000 omitted) | $922,442 | $400,318 | $11,228 | $12,451 | $20,109 | |||||||||||||||
| (d) | Per share data is based on average shares outstanding. |
| (f) | Ratios do not reflect reductions from fees paid indirectly, if applicable. |
| (k) | The total return does not reflect expenses that apply to separate accounts. Inclusion of these charges would reduce the total return figures for all periods shown. |
| (r) | Certain expenses have been reduced without which performance would have been lower. |
| (s) | From time to time the fund may receive proceeds from litigation settlements, without which performance would be lower. |
| (x) | The net asset values per share and total returns have been calculated on net assets which include adjustments made in accordance with U.S. generally accepted accounting principles required at period end for financial reporting purposes. |
See Notes to Financial Statements
22
Table of Contents
MFS Global Tactical Allocation Portfolio
| (1) | Business and Organization |
MFS Global Tactical Allocation Portfolio (the fund) is a series of MFS Variable Insurance Trust II (the trust). The trust is organized as a Massachusetts business trust and is registered under the Investment Company Act of 1940, as amended, as an open-end management investment company. The shareholders of each series of the trust are separate accounts of insurance companies, which offer variable annuity and/or life insurance products, and qualified retirement and pension plans.
| (2) | Significant Accounting Policies |
General – The preparation of financial statements in conformity with U.S. generally accepted accounting principles requires management to make estimates and assumptions that affect the reported amounts of assets and liabilities, and disclosure of contingent assets and liabilities at the date of the financial statements and the reported amounts of revenues and expenses during the reporting period. Actual results could differ from those estimates. In the preparation of these financial statements, management has evaluated subsequent events occurring after the date of the fund’s Statement of Assets and Liabilities through the date that the financial statements were issued. The fund invests in derivatives as part of its principal investment strategy. Derivatives can be highly volatile and involve risks in addition to the risks of the underlying indicators on which the derivative is based. The fund invests in foreign securities. Investments in foreign securities are vulnerable to the effects of changes in the relative values of the local currency and the U.S. dollar and to the effects of changes in each country’s legal, political, and economic environment.
In December 2011, the Financial Accounting Standards Board issued Accounting Standards Update 2011-11, Balance Sheet (Topic 210) – Disclosures about Offsetting Assets and Liabilities (“ASU 2011-11”). Effective for annual reporting periods beginning on or after January 1, 2013 and interim periods within those annual periods, ASU 2011-11 is intended to enhance disclosure requirements on the offsetting of financial assets and liabilities. Although still evaluating the potential impacts of ASU 2011-11 to the fund, management expects that the impact of the fund’s adoption will be limited to additional financial statement disclosures.
Investment Valuations – Equity securities, including restricted equity securities, are generally valued at the last sale or official closing price as provided by a third-party pricing service on the market or exchange on which they are primarily traded. Equity securities, for which there were no sales reported that day, are generally valued at the last quoted daily bid quotation as provided by a third-party pricing service on the market or exchange on which such securities are primarily traded. Equity securities held short, for which there were no sales reported for that day, are generally valued at the last quoted daily ask quotation as provided by a third-party pricing service on the market or exchange on which such securities are primarily traded. Debt instruments and floating rate loans (other than short-term instruments), including restricted debt instruments, are generally valued at an evaluated or composite bid as provided by a third-party pricing service. Short-term instruments with a maturity at issuance of 60 days or less generally are valued at amortized cost, which approximates market value. Exchange-traded options are generally valued at the last sale or official closing price as provided by a third-party pricing service on the exchange on which such options are primarily traded. Exchange-traded options for which there were no sales reported that day are generally valued at the last daily bid quotation as provided by a third-party pricing service on the exchange on which such options are primarily traded. Options not traded on an exchange are generally valued at a broker/dealer bid quotation. Foreign currency options are generally valued at valuations provided by a third-party pricing service. Futures contracts are generally valued at last posted settlement price as provided by a third-party pricing service on the market on which they are primarily traded. Futures contracts for which there were no trades that day for a particular position are generally valued at the closing bid quotation as provided by a third-party pricing service on the market on which such futures contracts are primarily traded. Forward foreign currency exchange contracts are generally valued at the mean of bid and asked prices for the time period interpolated from rates provided by a third-party pricing service for proximate time periods. Open-end investment companies are generally valued at net asset value per share. Securities and other assets generally valued on the basis of information from a third-party pricing service may also be valued at a broker/dealer bid quotation. Values obtained from third-party pricing services can utilize both transaction data and market information such as yield, quality, coupon rate, maturity, type of issue, trading characteristics, and other market data. The values of foreign securities and other assets and liabilities expressed in foreign currencies are converted to U.S. dollars using the mean of bid and asked prices for rates provided by a third-party pricing service.
The Board of Trustees has delegated primary responsibility for determining or causing to be determined the value of the fund’s investments (including any fair valuation) to the adviser pursuant to valuation policies and procedures approved by the Board. If the adviser determines that reliable market quotations are not readily available, investments are valued at fair value as determined in good faith by the adviser in accordance with such procedures under the oversight of the Board of Trustees. Under the fund’s valuation policies and procedures, market quotations are not considered to be readily available for most types of debt instruments and floating rate loans and many types of derivatives. These investments are generally valued at fair value
23
Table of Contents
MFS Global Tactical Allocation Portfolio
Notes to Financial Statements – continued
based on information from third-party pricing services. In addition, investments may be valued at fair value if the adviser determines that an investment’s value has been materially affected by events occurring after the close of the exchange or market on which the investment is principally traded (such as foreign exchange or market) and prior to the determination of the fund’s net asset value, or after the halting of trading of a specific security where trading does not resume prior to the close of the exchange or market on which the security is principally traded. Events that occur on a frequent basis after foreign markets close (such as developments in foreign markets and significant movements in the U.S. markets) and prior to the determination of the fund’s net asset value may be deemed to have a material effect on the value of securities traded in foreign markets. Accordingly, the fund’s foreign equity securities may often be valued at fair value. The adviser generally relies on third-party pricing services or other information (such as the correlation with price movements of similar securities in the same or other markets; the type, cost and investment characteristics of the security; the business and financial condition of the issuer; and trading and other market data) to assist in determining whether to fair value and at what value to fair value an investment. The value of an investment for purposes of calculating the fund’s net asset value can differ depending on the source and method used to determine value. When fair valuation is used, the value of an investment used to determine the fund’s net asset value may differ from quoted or published prices for the same investment. There can be no assurance that the fund could obtain the fair value assigned to an investment if it were to sell the investment at the same time at which the fund determines its net asset value per share.
Various inputs are used in determining the value of the fund’s assets or liabilities. These inputs are categorized into three broad levels. In certain cases, the inputs used to measure fair value may fall into different levels of the fair value hierarchy. In such cases, an investment’s level within the fair value hierarchy is based on the lowest level of input that is significant to the fair value measurement. The fund’s assessment of the significance of a particular input to the fair value measurement in its entirety requires judgment, and considers factors specific to the investment. Level 1 includes unadjusted quoted prices in active markets for identical assets or liabilities. Level 2 includes other significant observable market-based inputs (including quoted prices for similar securities, interest rates, prepayment speed, and credit risk). Level 3 includes unobservable inputs, which may include the adviser’s own assumptions in determining the fair value of investments. Other financial instruments are derivative instruments not reflected in total investments, such as futures and forward foreign currency exchange contracts. The following is a summary of the levels used as of December 31, 2011 in valuing the fund’s assets or liabilities:
| Investments at Value | Level 1 | Level 2 | Level 3 | Total | ||||||||||||
| Equity Securities: | ||||||||||||||||
United States | $163,676,229 | $— | $— | $163,676,229 | ||||||||||||
United Kingdom | 16,054,341 | 37,548,322 | — | 53,602,663 | ||||||||||||
Japan | 46,637,794 | — | — | 46,637,794 | ||||||||||||
Switzerland | 5,514,552 | 18,730,345 | — | 24,244,897 | ||||||||||||
France | 4,857,641 | 7,250,273 | — | 12,107,914 | ||||||||||||
Germany | 10,252,270 | 1,132,755 | — | 11,385,025 | ||||||||||||
Netherlands | — | 11,305,480 | — | 11,305,480 | ||||||||||||
Taiwan | 3,595,667 | — | — | 3,595,667 | ||||||||||||
Canada | 3,345,442 | — | — | 3,345,442 | ||||||||||||
Other Countries | 8,494,692 | 8,599,885 | — | 17,094,577 | ||||||||||||
| U.S. Treasury Bonds & U.S. Government Agency & Equivalents | — | 40,426,929 | — | 40,426,929 | ||||||||||||
| Non-U.S. Sovereign Debt | — | 318,558,281 | — | 318,558,281 | ||||||||||||
| Corporate Bonds | — | 64,776,318 | — | 64,776,318 | ||||||||||||
| Residential Mortgage-Backed Securities | — | 72,368,837 | — | 72,368,837 | ||||||||||||
| Commercial Mortgage-Backed Securities | — | 17,644,375 | — | 17,644,375 | ||||||||||||
| Asset-Backed Securities (including CDOs) | — | 515,351 | — | 515,351 | ||||||||||||
| Foreign Bonds | — | 29,948,134 | — | 29,948,134 | ||||||||||||
| Mutual Funds | 103,094,247 | — | — | 103,094,247 | ||||||||||||
| Total Investments | $365,522,875 | $628,805,285 | $— | $994,328,160 | ||||||||||||
| Other Financial Instruments | ||||||||||||||||
| Futures | $(2,755,528 | ) | $861,264 | $— | $(1,894,264 | ) | ||||||||||
| Forward Foreign Currency Exchange Contracts | — | 1,621,719 | — | 1,621,719 | ||||||||||||
For further information regarding security characteristics, see the Portfolio of Investments.
Inflation-Adjusted Debt Securities – The fund invests in inflation-adjusted debt securities issued by the U.S. Treasury. The fund may also invest in inflation-adjusted debt securities issued by U.S. Government agencies and instrumentalities other than the U.S. Treasury and by other entities such as U.S. and foreign corporations and foreign governments. The principal value of these debt securities is adjusted through income according to changes in the Consumer Price Index or another general price or
24
Table of Contents
MFS Global Tactical Allocation Portfolio
Notes to Financial Statements – continued
wage index. These debt securities typically pay a fixed rate of interest, but this fixed rate is applied to the inflation-adjusted principal amount. The principal paid at maturity of the debt security is typically equal to the inflation-adjusted principal amount, or the security’s original par value, whichever is greater. Other types of inflation-adjusted securities may use other methods to adjust for other measures of inflation.
Foreign Currency Translation – Purchases and sales of foreign investments, income, and expenses are converted into U.S. dollars based upon currency exchange rates prevailing on the respective dates of such transactions or on the reporting date for foreign denominated receivables and payables. Gains and losses attributable to foreign currency exchange rates on sales of securities are recorded for financial statement purposes as net realized gains and losses on investments. Gains and losses attributable to foreign exchange rate movements on receivables, payables, income and expenses are recorded for financial statement purposes as foreign currency transaction gains and losses. That portion of both realized and unrealized gains and losses on investments that results from fluctuations in foreign currency exchange rates is not separately disclosed.
Derivatives – The fund uses derivatives in an attempt to adjust exposure to markets, asset classes, and currencies based on the adviser’s assessment of the relative attractiveness of such markets, asset classes, and currencies. Derivatives are used to increase or decrease the fund’s exposure to markets, asset classes, or currencies resulting from the fund’s individual security selections, and to expose the fund to markets, asset classes, or currencies in which the fund’s individual security selection has resulted in little or no exposure. Derivatives are used for hedging or non-hedging purposes. While hedging can reduce or eliminate losses, it can also reduce or eliminate gains. When the fund uses derivatives as an investment to increase or decrease market exposure, or for hedging purposes, gains and losses from derivative instruments may be substantially greater than the derivative’s original cost.
The derivative instruments used by the fund were purchased options, futures contracts, and forward foreign currency exchange contracts. The fund’s period end derivatives, as presented in the Portfolio of Investments and the associated Derivative Contract Tables, generally are indicative of the volume of its derivative activity during the period.
The following table presents, by major type of derivative contract, the fair value, on a gross basis, of the asset and liability components of derivatives held by the fund at December 31, 2011 as reported in the Statement of Assets and Liabilities:
| Fair Value (a) | ||||||||||
| Risk | Derivative Contracts | Asset Derivatives | Liability Derivatives | |||||||
| Interest Rate | Interest Rate Futures | $645,549 | $(3,814,929 | ) | ||||||
| Foreign Exchange | Forward Foreign Currency Exchange | 11,041,229 | (9,419,510 | ) | ||||||
| Equity | Equity Futures | 2,721,440 | (1,446,324 | ) | ||||||
| Equity | Purchased Equity Options | 56,290 | — | |||||||
| Total | $14,464,508 | $(14,680,763 | ) | |||||||
| (a) | The value of purchased options outstanding is included in total investments, at value, within the fund’s Statement of Assets and Liabilities. The value of futures contracts outstanding includes cumulative appreciation (depreciation) as reported in the fund’s Portfolio of Investments. Only the current day variation margin for futures contracts is separately reported within the fund’s Statement of Assets and Liabilities. |
The following table presents, by major type of derivative contract, the realized gain (loss) on derivatives held by the fund for the year ended December 31, 2011 as reported in the Statement of Operations:
| Risk | Futures Contracts | Foreign Currency Transactions | Investment Transactions (Purchased Options) | |||||||||
| Interest Rate | $(2,560,463 | ) | $— | $(257,408 | ) | |||||||
| Foreign Exchange | — | (3,977,969 | ) | — | ||||||||
| Equity | (9,376,182 | ) | — | (1,292,758 | ) | |||||||
| Total | $(11,936,645 | ) | $(3,977,969 | ) | $(1,550,165 | ) | ||||||
The following table presents, by major type of derivative contract, the change in unrealized appreciation (depreciation) on derivatives held by the fund for the year ended December 31, 2011 as reported in the Statement of Operations:
| Risk | Futures Contracts | Translation of Assets and Liabilities in Foreign Currencies | Investments (Purchased Options) | |||||||||
| Interest Rate | $(2,152,915 | ) | $— | $— | ||||||||
| Foreign Exchange | — | (875,673 | ) | — | ||||||||
| Equity | 1,758,517 | — | (1,157,777 | ) | ||||||||
| Total | $(394,398 | ) | $(875,673 | ) | $(1,157,777 | ) | ||||||
25
Table of Contents
MFS Global Tactical Allocation Portfolio
Notes to Financial Statements – continued
Derivative counterparty credit risk is managed through formal evaluation of the creditworthiness of all potential counterparties. On certain over-the-counter derivatives, the fund attempts to reduce its exposure to counterparty credit risk whenever possible by entering into an International Swaps and Derivatives Association (ISDA) Master Agreement on a bilateral basis with each of the counterparties with whom it undertakes a significant volume of transactions. The ISDA Master Agreement gives each party to the agreement the right to terminate all transactions traded under such agreement if there is a certain deterioration in the credit quality of the other party. The ISDA Master Agreement gives the fund the right, upon an event of default by the applicable counterparty or a termination of the agreement, to close out all transactions traded under such agreement and to net amounts owed under each transaction to one net amount payable by one party to the other. This right to close out and net payments across all transactions traded under the ISDA Master Agreement could result in a reduction of the fund’s credit risk to such counterparty equal to any amounts payable by the fund under the applicable transactions, if any. However, absent an event of default by the counterparty or a termination of the agreement, the ISDA Master Agreement does not result in an offset of reported amounts of assets and liabilities in the Statement of Assets and Liabilities across transactions between the fund and the applicable counterparty.
Collateral requirements differ by type of derivative. Collateral or margin requirements are set by the broker or exchange clearing house for exchange traded derivatives (i.e., futures and exchange-traded options) while collateral terms are contract specific for over-the-counter traded derivatives (i.e., forward foreign currency exchange contracts, swaps and over-the-counter options). For derivatives traded under an ISDA Master Agreement, the collateral requirements are netted across all transactions traded under such agreement and one amount is posted from one party to the other to collateralize such obligations. Cash collateral that has been pledged to cover obligations of the fund under derivative contracts, if any, will be reported separately on the Statement of Assets and Liabilities as restricted cash. Securities collateral pledged for the same purpose, if any, is noted in the Portfolio of Investments.
Purchased Options – The fund purchased put options for a premium. Purchased put options entitle the holder to sell a specified number of shares or units of a particular security, currency or index at a specified price at a specified date or within a specified period of time. Purchasing put options may hedge against a decline in the value of portfolio securities or currency.
The premium paid is initially recorded as an investment in the Statement of Assets and Liabilities. That investment is subsequently marked-to-market daily with the difference between the premium paid and the market value of the purchased option being recorded as unrealized appreciation or depreciation. Premiums paid for purchased put options which have expired are treated as realized losses on investments in the Statement of Operations. Upon the exercise or closing of a purchased put option, the premium paid is offset against the proceeds on the sale of the underlying security or financial instrument in order to determine the realized gain or loss on investments.
The risk in purchasing an option is that the fund pays a premium whether or not the option is exercised. The fund’s maximum risk of loss due to counterparty credit risk is limited to the market value of the option. For over-the-counter options, this risk is mitigated in cases where there is an ISDA Master Agreement between the fund and the counterparty providing for netting as described above and for posting of collateral by the counterparty to the fund to cover the fund’s exposure to the counterparty under such ISDA Master Agreement.
Futures Contracts – The fund entered into futures contracts which may be used to hedge against or obtain broad market, interest rate or currency exposure. A futures contract represents a commitment for the future purchase or sale of an asset at a specified price on a specified date.
Upon entering into a futures contract, the fund is required to deposit with the broker, either in cash or securities, an initial margin in an amount equal to a certain percentage of the notional amount of the contract. Subsequent payments (variation margin) are made or received by the fund each day, depending on the daily fluctuations in the value of the contract, and are recorded for financial statement purposes as unrealized gain or loss by the fund until the contract is closed or expires at which point the gain or loss on futures is realized.
The fund bears the risk of interest rates, exchange rates or securities prices moving unexpectedly, in which case, the fund may not achieve the anticipated benefits of the futures contracts and may realize a loss. While futures may present less counterparty risk to the fund since the contracts are exchange traded and the exchange’s clearinghouse guarantees payments to the broker, there is still counterparty credit risk due to the insolvency of the broker. The fund’s maximum risk of loss due to counterparty credit risk is equal to the margin posted by the fund to the broker plus any gains or minus any losses on the outstanding futures contracts.
Forward Foreign Currency Exchange Contracts – The fund entered into forward foreign currency exchange contracts for the purchase or sale of a specific foreign currency at a fixed price on a future date. These contracts may be used to hedge the fund’s currency risk or for non-hedging purposes. For hedging purposes, the fund may enter into contracts to deliver or receive
26
Table of Contents
MFS Global Tactical Allocation Portfolio
Notes to Financial Statements – continued
foreign currency that the fund will receive from or use in its normal investment activities. The fund may also use contracts to hedge against declines in the value of foreign currency denominated securities due to unfavorable exchange rate movements. For non-hedging purposes, the fund may enter into contracts with the intent of changing the relative exposure of the fund’s portfolio of securities to different currencies to take advantage of anticipated exchange rate changes.
Forward foreign currency exchange contracts are adjusted by the daily exchange rate of the underlying currency and any unrealized gains or losses are recorded as a receivable or payable for forward foreign currency exchange contracts until the contract settlement date. On contract settlement date, any gain or loss on the contract is recorded as realized gains or losses on foreign currency transactions.
Risks may arise upon entering into these contracts from unanticipated movements in the value of the contract and from the potential inability of counterparties to meet the terms of their contracts. Generally, the fund’s maximum risk due to counterparty credit risk is the unrealized gain on the contract due to the use of Continuous Linked Settlement, an industry accepted settlement system. This risk is mitigated in cases where there is an ISDA Master Agreement between the fund and the counterparty providing for netting as described above and for posting of collateral by the counterparty to the fund to cover the fund’s exposure to the counterparty under such ISDA Master Agreement.
Security Loans – State Street Bank and Trust Company (“State Street”), as lending agent, loans the securities of the fund to certain qualified institutions (the “Borrowers”) approved by the fund. The loans are collateralized by cash and/or U.S. Treasury and federal agency obligations in an amount typically at least equal to the market value of the securities loaned. The market value of the loaned securities is determined at the close of business of the fund and any additional required collateral is delivered to the fund on the next business day. State Street provides the fund with indemnification against Borrower default. The fund bears the risk of loss with respect to the investment of cash collateral. On loans collateralized by cash, the cash collateral is invested in a money market fund or short-term securities. A portion of the income generated upon investment of the collateral is remitted to the Borrowers, and the remainder is allocated between the fund and the lending agent. On loans collateralized by U.S. Treasury and/or federal agency obligations, a fee is received from the Borrower, and is allocated between the fund and the lending agent. Income from securities lending is included in interest income on the Statement of Operations. The dividend and interest income earned on the securities loaned is accounted for in the same manner as other dividend and interest income.
Indemnifications – Under the fund’s organizational documents, its officers and Trustees may be indemnified against certain liabilities and expenses arising out of the performance of their duties to the fund. Additionally, in the normal course of business, the fund enters into agreements with service providers that may contain indemnification clauses. The fund’s maximum exposure under these agreements is unknown as this would involve future claims that may be made against the fund that have not yet occurred.
Investment Transactions and Income – Investment transactions are recorded on the trade date. Interest income is recorded on the accrual basis. All premium and discount is amortized or accreted for financial statement purposes in accordance with U.S. generally accepted accounting principles. Inflation-indexed bonds are fixed-income securities whose principal value is periodically adjusted upward or downward to the rate of inflation. Interest is accrued based on the principal value, which is adjusted for inflation. Any increase or decrease in the principal amount of an inflation-indexed bond is generally recorded as an increase or decrease in interest income, respectively, even though the adjusted principal is not received until maturity. Dividends received in cash are recorded on the ex-dividend date. Certain dividends from foreign securities will be recorded when the fund is informed of the dividend if such information is obtained subsequent to the ex-dividend date. Dividend and interest payments received in additional securities are recorded on the ex-dividend or ex-interest date in an amount equal to the value of the security on such date.
The fund may receive proceeds from litigation settlements. Any proceeds received from litigation involving portfolio holdings are reflected in the Statement of Operations in realized gain/loss if the security has been disposed of by the fund or in unrealized gain/loss if the security is still held by the fund. Any other proceeds from litigation not related to portfolio holdings are reflected as other income in the Statement of Operations.
The fund purchased or sold debt securities on a when-issued or delayed delivery basis, or in a “To Be Announced” (TBA) or “forward commitment” transaction with delivery or payment to occur at a later date beyond the normal settlement period. TBA securities resulting from these transactions are included in the Portfolio of Investments. At the time a fund enters into a commitment to purchase or sell a security, the transaction is recorded and the value of the security acquired is reflected in the fund’s net asset value. The price of such security and the date that the security will be delivered and paid for are fixed at the time the transaction is negotiated. The value of the security may vary with market fluctuations. No interest accrues to the fund
27
Table of Contents
MFS Global Tactical Allocation Portfolio
Notes to Financial Statements – continued
until payment takes place. At the time that a fund enters into this type of transaction, the fund is required to have sufficient cash and/or liquid securities to cover its commitments. Losses may arise due to changes in the value of the underlying securities or if the counterparty does not perform under the contract’s terms, or if the issuer does not issue the securities due to political, economic or other factors. Additionally, losses may arise due to declines in the value of the securities prior to settlement date.
Fees Paid Indirectly – The fund’s custody fee may be reduced according to an arrangement that measures the value of cash deposited with the custodian by the fund. This amount, for the year ended December 31, 2011, is shown as a reduction of total expenses on the Statement of Operations.
Tax Matters and Distributions – The fund intends to qualify as a regulated investment company, as defined under Subchapter M of the Internal Revenue Code, and to distribute all of its taxable income, including realized capital gains. As a result, no provision for federal income tax is required. The fund’s federal tax returns for the prior three fiscal years remain subject to examination by the Internal Revenue Service. Foreign taxes have been accrued by the fund in the accompanying financial statements.
Distributions to shareholders are recorded on the ex-dividend date. Income and capital gain distributions are determined in accordance with income tax regulations, which may differ from U.S. generally accepted accounting principles. Certain capital accounts in the financial statements are periodically adjusted for permanent differences in order to reflect their tax character. These adjustments have no impact on net assets or net asset value per share. Temporary differences which arise from recognizing certain items of income, expense, gain or loss in different periods for financial statement and tax purposes will reverse at some time in the future. Distributions in excess of net investment income or net realized gains are temporary overdistributions for financial statement purposes resulting from differences in the recognition or classification of income or distributions for financial statement and tax purposes.
Book/tax differences primarily relate to amortization and accretion of debt securities, wash sale loss deferrals, straddle loss deferrals, and derivative transactions.
The tax character of distributions declared to shareholders for the last two fiscal years is as follows:
| 12/31/11 | 12/31/10 | |||||||
| Ordinary income (including any short-term capital gains) | $10,385,167 | $1,262,023 | ||||||
| Long-term capital gain | 697,628 | — | ||||||
| $11,082,795 | $1,262,023 | |||||||
The federal tax cost and the tax basis components of distributable earnings were as follows:
| As of 12/31/11 | ||||
| Cost of investments | $989,782,125 | |||
| Gross appreciation | 37,304,481 | |||
| Gross depreciation | (32,758,446 | ) | ||
| Net unrealized appreciation (depreciation) | $4,546,035 | |||
| Undistributed ordinary income | 13,744,213 | |||
| Capital loss carryforwards | (4,892,433 | ) | ||
| Other temporary differences | (9,694,445 | ) |
As of December 31, 2011, the fund had capital loss carryforwards available to offset future realized gains. Such losses are characterized as follows:
| Short-term losses | $(4,892,433 | ) |
Under the Regulated Investment Company Modernization Act of 2010 (the “Act”), the above net capital losses may be carried forward indefinitely, and their character is retained as short-term and/or long-term losses. Previously, net capital losses were carried forward for eight years and treated as short-term losses.
28
Table of Contents
MFS Global Tactical Allocation Portfolio
Notes to Financial Statements – continued
Multiple Classes of Shares of Beneficial Interest – The fund offers multiple classes of shares, which differ in their respective distribution and/or service fees. The fund’s income, realized and unrealized gain (loss), and common expenses are allocated to shareholders based on the daily net assets of each class. Dividends are declared separately for each class. Differences in per share dividend rates are generally due to differences in separate class expenses. The fund’s distributions declared to shareholders as reported on the Statements of Changes in Net Assets are presented by class as follows:
| From net investment income | From net realized gain on investments | |||||||||||||||
| Year ended 12/31/11 | Year ended 12/31/10 | Year ended 12/31/11 | Year ended 12/31/10 | |||||||||||||
| Initial Class | $791,643 | $701,290 | $331,440 | $— | ||||||||||||
| Service Class | 6,896,700 | 560,733 | 3,063,012 | — | ||||||||||||
| Total | $7,688,343 | $1,262,023 | $3,394,452 | $— | ||||||||||||
| (3) | Transactions with Affiliates |
Investment Adviser – The fund has an investment advisory agreement with MFS to provide overall investment management and related administrative services and facilities to the fund. The management fee is computed daily and paid monthly at the following annual rates:
| First $300 million of average daily net assets | 0.75% | |||
| Average daily net assets in excess of $300 million | 0.675% |
The management fee incurred for the year ended December 31, 2011 was equivalent to an annual effective rate of 0.70% of the fund’s average daily net assets.
The investment adviser has agreed in writing to pay a portion of the fund’s total annual operating expenses, exclusive of interest, taxes, extraordinary expenses, brokerage and transaction costs and investment-related expenses, such that total annual operating expenses do not exceed 0.90% of average daily net assets for the Initial Class shares and 1.15% of average daily net assets for the Service Class shares. This written agreement will continue until April 30, 2013. For the year ended December 31, 2011, the fund’s actual operating expenses did not exceed the limit and therefore, the investment adviser did not pay any portion of the fund’s expenses related to this agreement.
Distributor – MFS Fund Distributors, Inc. (MFD), a wholly-owned subsidiary of MFS, is the distributor of shares of the fund. The Trustees have adopted a distribution plan for the Service Class shares pursuant to Rule 12b-1 under the Investment Company Act of 1940.
The fund’s distribution plan provides that the fund will pay MFD distribution and/or service fees equal to 0.25% per annum of its average daily net assets attributable to Service Class shares as partial consideration for services performed and expenses incurred by MFD and financial intermediaries (including participating insurance companies that invest in the fund to fund variable annuity and variable life insurance contracts, sponsors of qualified retirement and pension plans that invest in the fund, and affiliates of these participating insurance companies and plan sponsors) in connection with the sale and distribution of the Service Class shares. MFD may subsequently pay all, or a portion, of the distribution and/or service fees to financial intermediaries.
Shareholder Servicing Agent – MFS Service Center, Inc. (MFSC), a wholly-owned subsidiary of MFS, receives a fee from the fund for its services as shareholder servicing agent. For the year ended December 31, 2011, the fee was $81,453, which equated to 0.0108% annually of the fund’s average daily net assets. MFSC also receives payment from the fund for out-of-pocket expenses paid by MFSC on behalf of the fund. For the year ended December 31, 2011, these costs amounted to $13.
Administrator – MFS provides certain financial, legal, shareholder communications, compliance, and other administrative services to the fund. Under an administrative services agreement, the fund partially reimburses MFS the costs incurred to provide these services. The fund is charged an annual fixed amount of $17,500 plus a fee based on average daily net assets. The administrative services fee incurred for the year ended December 31, 2011 was equivalent to an annual effective rate of 0.0330% of the fund’s average daily net assets.
Trustees’ and Officers’ Compensation – The fund pays compensation to Trustees in the form of a retainer, attendance fees, and additional compensation to the Board chairperson. The fund does not pay compensation directly to officers of the fund who are also officers of the investment adviser, all of whom receive remuneration for their services to the fund from MFS. Certain officers of the fund are officers or directors of MFS, MFD, and MFSC.
Other – This fund and certain other funds managed by MFS (the funds) have entered into services agreements (the Agreements) which provide for payment of fees by the funds to Tarantino LLC and Griffin Compliance LLC in return for the provision of services of an Independent Chief Compliance Officer (ICCO) and Assistant ICCO, respectively, for the funds. The ICCO and Assistant ICCO are officers of the funds and the sole members of Tarantino LLC and Griffin Compliance LLC, respectively. The
29
Table of Contents
MFS Global Tactical Allocation Portfolio
Notes to Financial Statements – continued
funds can terminate the Agreements with Tarantino LLC and Griffin Compliance LLC at any time under the terms of the Agreements. MFS has agreed to bear all expenses associated with office space, other administrative support, and supplies provided to the ICCO and Assistant ICCO. For the year ended December 31, 2011, the aggregate fees paid by the fund to Tarantino LLC and Griffin Compliance LLC were $12,231 and are included in miscellaneous expense on the Statement of Operations.
The fund invests in the MFS Institutional Money Market Portfolio which is managed by MFS and seeks a high level of current income consistent with preservation of capital and liquidity. Income earned on this investment is included in dividends from underlying affiliated funds on the Statement of Operations. This money market fund does not pay a management fee to MFS.
| (4) | Portfolio Securities |
Purchases and sales of investments, other than purchased option transactions, and short-term obligations, were as follows:
| Purchases | Sales | |||||||
| U.S. Government securities | $89,856,911 | $196,721,605 | ||||||
| Investments (non-U.S. Government securities) | $753,871,241 | $189,252,075 | ||||||
| (5) | Shares of Beneficial Interest |
The fund’s Declaration of Trust permits the Trustees to issue an unlimited number of full and fractional shares of beneficial interest. Transactions in fund shares were as follows:
| Year ended 12/31/11 | Year ended 12/31/10 | |||||||||||||||
| Shares | Amount | Shares | Amount | |||||||||||||
| Shares sold | ||||||||||||||||
Initial Class | 110,258 | $1,587,233 | 160,971 | $2,205,593 | ||||||||||||
Service Class | 36,627,946 | 523,715,652 | 27,670,459 | 376,359,508 | ||||||||||||
| 36,738,204 | $525,302,885 | 27,831,430 | $378,565,101 | |||||||||||||
| Shares issued to shareholders in reinvestment of distributions | ||||||||||||||||
Initial Class | 78,758 | $1,123,083 | 51,377 | $701,290 | ||||||||||||
Service Class | 705,862 | 9,959,712 | 41,383 | 560,733 | ||||||||||||
| 784,620 | $11,082,795 | 92,760 | $1,262,023 | |||||||||||||
| Shares reacquired | ||||||||||||||||
Initial Class | (890,632 | ) | $(12,863,612 | ) | (927,827 | ) | $(12,618,417 | ) | ||||||||
Service Class | (166,320 | ) | (2,387,662 | ) | (99,957 | ) | (1,342,300 | ) | ||||||||
| (1,056,952 | ) | $(15,251,274 | ) | (1,027,784 | ) | $(13,960,717 | ) | |||||||||
| Net change | ||||||||||||||||
Initial Class | (701,616 | ) | $(10,153,296 | ) | (715,479 | ) | $(9,711,534 | ) | ||||||||
Service Class | 37,167,488 | 531,287,702 | 27,611,885 | 375,577,941 | ||||||||||||
| 36,465,872 | $521,134,406 | 26,896,406 | $365,866,407 | |||||||||||||
| (6) | Line of Credit |
The fund and certain other funds managed by MFS participate in a $1.1 billion unsecured committed line of credit, subject to a $1 billion sublimit, provided by a syndication of banks under a credit agreement. Borrowings may be made for temporary financing needs. Interest is charged to each fund, based on its borrowings, generally at a rate equal to the higher of the Federal Reserve funds rate or one month LIBOR plus an agreed upon spread. A commitment fee, based on the average daily, unused portion of the committed line of credit, is allocated among the participating funds at the end of each calendar quarter. In addition, the fund and other funds managed by MFS have established unsecured uncommitted borrowing arrangements with certain banks for temporary financing needs. Interest is charged to each fund, based on its borrowings, at a rate equal to the Federal Reserve funds rate plus an agreed upon spread. For the year ended December 31, 2011, the fund’s commitment fee and interest expense were $5,640 and $0, respectively, and are included in miscellaneous expense on the Statement of Operations.
| (7) | Transactions in Underlying Affiliated Funds – Affiliated Issuers |
An affiliated issuer may be considered one in which the fund owns 5% or more of the outstanding voting securities, or a company which is under common control. For the purposes of this report, the fund assumes the following to be affiliated issuers:
| Underlying Affiliated Funds | Beginning Shares/Par Amount | Acquisitions Shares/Par Amount | Dispositions Shares/Par Amount | Ending Shares/Par Amount | ||||||||||||
| MFS Institutional Money Market Portfolio | 51,691,815 | 478,203,623 | (427,935,591 | ) | 101,959,847 | |||||||||||
| Underlying Affiliated Funds | Realized Gain (Loss) | Capital Gain Distributions | Dividend Income | Ending Value | ||||||||||||
| MFS Institutional Money Market Portfolio | $— | $— | $73,219 | $101,959,847 | ||||||||||||
30
Table of Contents
MFS Global Tactical Allocation Portfolio
REPORT OF INDEPENDENT REGISTERED PUBLIC ACCOUNTING FIRM
To the Board of Trustees of MFS Variable Insurance Trust II and the Shareholders of
MFS Global Tactical Allocation Portfolio:
We have audited the accompanying statement of assets and liabilities, including the portfolio of investments, of MFS Global Tactical Allocation Portfolio (the “Fund”) (one of the portfolios comprising MFS Variable Insurance Trust II) as of December 31, 2011, and the related statement of operations for the year then ended, the statements of changes in net assets for each of the two years in the period then ended, and the financial highlights for each of the five years in the period then ended. These financial statements and financial highlights are the responsibility of the Fund’s management. Our responsibility is to express an opinion on these financial statements and financial highlights based on our audits.
We conducted our audits in accordance with the standards of the Public Company Accounting Oversight Board (United States). Those standards require that we plan and perform the audit to obtain reasonable assurance about whether the financial statements and financial highlights are free of material misstatement. The Fund is not required to have, nor were we engaged to perform, an audit of its internal control over financial reporting. Our audits included consideration of internal control over financial reporting as a basis for designing audit procedures that are appropriate in the circumstances, but not for the purpose of expressing an opinion on the effectiveness of the Fund’s internal control over financial reporting. Accordingly, we express no such opinion. An audit also includes examining, on a test basis, evidence supporting the amounts and disclosures in the financial statements, assessing the accounting principles used and significant estimates made by management, as well as evaluating the overall financial statement presentation. Our procedures included confirmation of securities owned as of December 31, 2011, by correspondence with the custodian and brokers; where replies were not received from brokers, we performed other auditing procedures. We believe that our audits provide a reasonable basis for our opinion.
In our opinion, the financial statements and financial highlights referred to above present fairly, in all material respects, the financial position of MFS Global Tactical Allocation Portfolio as of December 31, 2011, the results of its operations for the year then ended, the changes in its net assets for each of the two years in the period then ended, and the financial highlights for each of the five years in the period then ended, in conformity with accounting principles generally accepted in the United States of America.
DELOITTE & TOUCHE LLP
Boston, Massachusetts
February 15, 2012
31
Table of Contents
MFS Global Tactical Allocation Portfolio
RESULTS OF SHAREHOLDER MEETING (unaudited)
At a special meeting of shareholders of MFS Global Tactical Allocation Portfolio, which was held on December 1, 2011, the following actions were taken for which shareholders of all series of MFS Variable Insurance Trust II voted together as a single class with respect to Item 1 and shareholders of MFS Global Tactical Allocation Portfolio voted as a separate class with respect to Items 2 and 3:
Item 1: Election of ten Trustees as members of the Board of Trustees of the Trust effective January 1, 2012:
| Number of Shares | ||||||||
| For | Withheld Authority | |||||||
| Robert E. Butler | 681,916,712.8686 | 46,472,894.9218 | ||||||
| Maureen R. Goldfarb | 682,835,794.8512 | 45,553,812.9392 | ||||||
| David H. Gunning | 681,500,267.3085 | 46,889,340.4819 | ||||||
| William R. Gutow | 681,050,223.5547 | 47,339,384.2357 | ||||||
| Michael Hegarty | 682,477,088.8584 | 45,912,518.9320 | ||||||
| John P. Kavanaugh | 683,794,425.4269 | 44,595,182.3635 | ||||||
| Robert J. Manning | 682,699,559.7374 | 45,690,048.0530 | ||||||
| J. Dale Sherratt | 681,362,743.0513 | 47,026,864.7391 | ||||||
| Laurie J. Thomsen | 683,408,094.0000 | 44,981,513.7904 | ||||||
| Robert W. Uek | 681,424,852.0247 | 46,964,755.7657 | ||||||
Item 2: To approve a new investment advisory agreement dated January 1, 2012, between the Trust, on behalf of MFS Global Tactical Allocation Portfolio, and MFS:
| Number of Shares | ||||||||||||
| For | Against | Withheld Authority | ||||||||||
| 54,130,927.3746 | 1,435,388.1662 | 6,360,837.2392 | ||||||||||
Item 3: To approve revisions to and restatements of certain fundamental investment restrictions of MFS Global Tactical Allocation Portfolio effective January 1, 2012 as detailed below:
| Number of Shares | ||||||||||||||
| For | Against | Withheld Authority | ||||||||||||
| A. | Borrowing | 50,902,444.4441 | 2,970,324.0869 | 8,054,384.2490 | ||||||||||
| B. | Underwriting Securities | 51,651,933.4286 | 2,256,290.9805 | 8,018,928.3709 | ||||||||||
| C. | Issuance of Senior Securities | 51,739,528.6342 | 2,140,268.4137 | 8,047,355.7321 | ||||||||||
| D. | Lending of Money or Securities | 50,984,056.5134 | 2,811,777.2389 | 8,131,319.0277 | ||||||||||
| E. | Purchases or Sales of Real Estate; Interests in Oil, Gas or Mineral Leases; and Commodities | 52,381,303.0939 | 1,896,102.5976 | 7,649,747.0885 | ||||||||||
| F. | Industry Concentration | 52,147,557.2248 | 1,745,900.7204 | 8,033,694.8348 | ||||||||||
32
Table of Contents
MFS Global Tactical Allocation Portfolio
TRUSTEES AND OFFICERS – IDENTIFICATION AND BACKGROUND
The Trustees and officers of the Trust, as of February 1, 2012, are listed below, together with their principal occupations during the past five years. (Their titles may have varied during that period.) The address of each Trustee and officer is 500 Boylston Street, Boston, Massachusetts 02116.
Name, Age | Position(s) with Fund | Trustee/Officer Since (h) | Principal Occupations | Other Directorships (j) | ||||
| INTERESTED TRUSTEES | ||||||||
Robert J. Manning (k) (age 48) | Trustee | February 2004 | Massachusetts Financial Services Company, Chairman, Chief Executive Officer and Director; President (until December 2009); Chief Investment Officer (until July 2010) | N/A | ||||
| INDEPENDENT TRUSTEES | ||||||||
David H. Gunning (age 69) | Trustee and Chair of Trustees | January 2004 | Retired; Cleveland-Cliffs Inc. (mining products and service provider), Vice Chairman/Director (until May 2007) | Lincoln Electric Holdings, Inc. (welding equipment manufacturer), Director; Development Alternatives, Inc. (consulting), Director/Non-Executive Chairman; Portman Limited (mining), Director (until 2008) | ||||
Robert E. Butler (age 70) | Trustee | January 2006 | Consultant – investment company industry regulatory and compliance matters | N/A | ||||
Maureen R. Goldfarb (age 56) | Trustee | January 2009 | Private investor | N/A | ||||
William R. Gutow (age 70) | Trustee | December 1993 | Private investor and real estate consultant; Capitol Entertainment Management Company (video franchise), Vice Chairman | Atlantic Coast Tan (tanning salons), Vice Chairman (until 2007); Texas Donuts (donut franchise), Vice Chairman (until 2010) | ||||
Michael Hegarty (age 67) | Trustee | December 2004 | Private investor | N/A | ||||
John P. Kavanaugh (age 57) | Trustee | January 2009 | Private investor; The Hanover Insurance Group, Inc., Vice President and Chief Investment Officer (until 2006); Allmerica Investment Trust, Allmerica Securities Trust and Opus Investment Trust (investment companies), Chairman, President and Trustee (until 2006) | N/A | ||||
J. Dale Sherratt (age 73) | Trustee | June 1989 | Insight Resources, Inc. (acquisition planning specialists), President; Wellfleet Investments (investor in health care companies), Managing General Partner | N/A | ||||
Laurie J. Thomsen (age 54) | Trustee | March 2005 | Private investor; New Profit, Inc. (venture philanthropy), Executive Partner (until 2010) | The Travelers Companies (property and casualty insurance), Director | ||||
Robert W. Uek (age 70) | Trustee | January 2006 | Consultant to investment company industry | N/A | ||||
| OFFICERS | ||||||||
John M. Corcoran (k) (age 46) | President | October 2008 | Massachusetts Financial Services Company, Senior Vice President (since October 2008); State Street Bank and Trust (financial services provider), Senior Vice President, (until September 2008) | N/A | ||||
| Christopher R. Bohane (k) (age 38) | Assistant Secretary and Assistant Clerk | July 2005 | Massachusetts Financial Services Company, Vice President and Senior Counsel | N/A | ||||
Kino Clark (k) (age 43) | Assistant Treasurer | January 2012 | Massachusetts Financial Services Company, Assistant Vice President | N/A | ||||
33
Table of Contents
MFS Global Tactical Allocation Portfolio
Trustees and Officers – continued
Name, Age | Position(s) with Fund | Trustee/Officer Since (h) | Principal Occupations | Other Directorships (j) | ||||
Ethan D. Corey (k) (age 48) | Assistant Secretary and Assistant Clerk | July 2005 | Massachusetts Financial Services Company, Senior Vice President and Associate General Counsel | N/A | ||||
David L. DiLorenzo (k) (age 43) | Treasurer | July 2005 | Massachusetts Financial Services Company, Vice President | N/A | ||||
Robyn L. Griffin (age 36) | Assistant Independent Chief Compliance Officer | August 2008 | Griffin Compliance LLC (provider of compliance services), Principal (since August 2008); State Street Corporation (financial services provider), Mutual Fund Administration Assistant Vice President (October 2006 – July 2008); Liberty Mutual Group (insurance), Personal Market Assistant Controller (April 2006 – October 2006); Deloitte & Touche LLP (professional services firm). | N/A | ||||
Brian E. Langenfeld (k) (age 38) | Assistant Secretary and Assistant Clerk | June 2006 | Massachusetts Financial Services Company, Vice President and Senior Counsel | N/A | ||||
Ellen Moynihan (k) (age 54) | Assistant Treasurer | April 1997 | Massachusetts Financial Services Company, Senior Vice President | N/A | ||||
Susan S. Newton (k) (age 61) | Assistant Secretary and Assistant Clerk | May 2005 | Massachusetts Financial Services Company, Senior Vice President and Associate General Counsel | N/A | ||||
Susan A. Pereira (k) (age 41) | Assistant Secretary and Assistant Clerk | July 2005 | Massachusetts Financial Services Company, Vice President and Senior Counsel | N/A | ||||
Mark N. Polebaum (k) (age 59) | Secretary and Clerk | January 2006 | Massachusetts Financial Services Company, Executive Vice President, General Counsel and Secretary | N/A | ||||
Frank L. Tarantino (age 67) | Independent Chief Compliance Officer | June 2004 | Tarantino LLC (provider of compliance services), Principal | N/A | ||||
Richard S. Weitzel (k) (age 41) | Assistant Secretary and Assistant Clerk | October 2007 | Massachusetts Financial Services Company, Vice President and Assistant General Counsel | N/A | ||||
James O. Yost (k) (age 51) | Deputy Treasurer | September 1990 | Massachusetts Financial Services Company, Senior Vice President | N/A | ||||
| (h) | Date first appointed to serve as Trustee/officer of an MFS fund. Each Trustee has served continuously since appointment unless indicated otherwise. For the period from December 15, 2004 until February 22, 2005, Mr. Manning served as Advisory Trustee. For the period October 2008, until January 2012, Mr. Corcoran served as Treasurer of the Funds. Prior to January 2012, Messrs. DiLorenzo and Yost served as Assistant Treasurers of the Funds. |
| (j) | Directorships or trusteeships of companies required to report to the Securities and Exchange Commission (i.e., “public companies”). |
| (k) | “Interested person” of the Trust within the meaning of the Investment Company Act of 1940 (referred to as the 1940 Act), which is the principal federal law governing investment companies like the fund, as a result of position with MFS. The address of MFS is 500 Boylston Street, Boston, Massachusetts 02116. |
Each Trustee has been elected by shareholders and each Trustee and officer holds office until his or her successor is chosen and qualified or until his or her earlier death, resignation, retirement or removal. The Trust does not hold annual meetings for the purpose of electing Trustees, and Trustees are not elected for fixed terms. Messrs. Butler, Kavanaugh, Uek and Ms. Thomsen are members of the Trust’s Audit Committee.
Each of the Fund’s Trustees and officers holds comparable positions with certain other funds of which MFS or a subsidiary is the investment adviser or distributor, and, in the case of the officers, with certain affiliates of MFS. As of January 1, 2012, the Trustees served as board members of 131 funds within the MFS Family of Funds.
34
Table of Contents
MFS Global Tactical Allocation Portfolio
Trustees and Officers – continued
The Statement of Additional Information for the Fund includes further information about the Trustees and is available without charge upon request by calling 1-800-225-2606.
Investment Adviser Massachusetts Financial Services Company 500 Boylston Street, Boston, MA 02116-3741 | Custodian State Street Bank and Trust 1 Lincoln Street, Boston, MA 02111-2900 | |
Distributor MFS Fund Distributors, Inc. 500 Boylston Street, Boston, MA 02116-3741 | Independent Registered Public Accounting Firm Deloitte & Touche LLP 200 Berkeley Street, Boston, MA 02116 | |
Portfolio Managers Nevin Chitkara Steven Gorham Richard Hawkins Benjamin Nastou Natalie Shapiro Benjamin Stone Erik Weisman Barnaby Wiener Linda Zhang |
35
Table of Contents
MFS Global Tactical Allocation Portfolio
At a special meeting of shareholders of the MFS Global Tactical Allocation Portfolio (hereinafter referred to as the “Fund” or the “Portfolio”), which was held on December 1, 2011, the shareholders approved a new investment advisory agreement based on the recommendation of the Board of Trustees. At its July, 2011 meeting, the Board of Trustees (i) approved, and recommended for shareholder approval, the new investment advisory agreement effective January 1, 2012, and (ii) the continuation of the existing investment advisory agreement effective September 1, 2011. The following includes a description of the factors that the Board of Trustees considered and the conclusions that formed the basis of their approval of both the new investment advisory agreement and the continuation of the prior investment advisory agreement.
BOARD APPROVAL OF NEW INVESTMENT ADVISORY AGREEMENT
The Investment Company Act of 1940 requires that both the full Board of Trustees and a majority of the non-interested (“independent”) Trustees, voting separately, initially approve the new investment advisory agreement (the “New Agreement”) between Massachusetts Financial Services Company (“MFS”) and MFS Variable Insurance Trust II (the “Trust”) on behalf of the Portfolio and, beginning on the second anniversary of the initial effective date of the New Agreement, annually approve the continuation of the New Agreement. The Trustees have considered matters bearing on the Portfolio and the then current advisory arrangement at their meetings throughout the year, including a review of performance data at each regular meeting. In addition, the independent Trustees met in person in July 2011 to consider the initial approval of the New Agreement, and to recommend that shareholders approve the New Agreement. The independent Trustees were assisted in their evaluation of the New Agreement by independent legal counsel, from whom they received separate legal advice and with whom they met separately from MFS management. The independent Trustees were also assisted in this process by the Portfolio’s Independent Chief Compliance Officer, a full-time senior officer appointed by and reporting to the independent Trustees.
In connection with their deliberations regarding the initial approval of the New Agreement, the Trustees, including the independent Trustees, considered such information and factors as they believed, in light of the legal advice furnished to them and their own business judgment, to be relevant. The New Agreement was considered separately for the series of the Trust (collectively, the “Portfolios”), although the Trustees also took into account the common interests of all Portfolios in the Trust in their review. As described below, the Trustees considered the nature, quality, and extent of the various investment advisory, administrative, and/or shareholder services to be performed by MFS under the New Agreement and other arrangements with the Trust.
In connection with their initial review meeting, the Trustees received and relied upon materials that included, among other items: (i) information provided by MFS on the advisory fees of comparable portfolios of its other clients, including institutional separate account and other clients, (ii) information as to whether, and to what extent applicable, expense waivers, reimbursements or fee “breakpoints” would be observed for the Portfolio under the New Agreement, and (iii) a comparison and summary of the differences in the provisions in the New Agreement compared to those in each of the then current investment advisory agreements for the Portfolios. In addition, in connection with the independent Trustees’ meetings in May and July, 2011 (the “contract review meetings”) for the purpose of considering whether to approve the continuation of the then current investment advisory agreements for the Portfolio, the independent Trustees received: (1) information provided by Lipper Inc. (“Lipper”) on the investment performance of the Portfolio for various time periods ended December 31, 2010, compared to the investment performance of a group of funds with substantially similar investment classifications/objectives (the “Lipper performance universe”), (2) information provided by Lipper on the Portfolio’s advisory fees and other expenses compared to the advisory fees and other expenses of comparable funds identified by Lipper (the “Lipper expense group”), (3) information regarding MFS’ financial results and financial condition, including MFS’ and certain of its affiliates’ estimated profitability from services performed for the Portfolio, (4) MFS’ views regarding the outlook for the mutual fund industry and its strategic business plans, (5) descriptions of various functions performed by MFS for the Trust, such as compliance monitoring and portfolio trading practices, and (6) information regarding the overall organization of MFS, including information about MFS’ senior management and other personnel providing investment advisory, administrative and other services to the Portfolio. The comparative performance, fee and expense information prepared and provided by Lipper was not independently verified, and the independent Trustees did not independently verify any information provided to them by MFS.
The Trustees’ conclusion as to the initial approval of the New Agreement was based on comprehensive consideration of all information provided to the Trustees and was not the result of any single factor. Some of the factors that figured particularly in the Trustees’ deliberations are described below for the Portfolio, while individual Trustees may have given different weight to various factors and evaluated the information presented as a whole differently than another individual Trustee. The Trustees recognized that the fee arrangements for the Portfolio could reflect years of review and discussion between the independent Trustees and MFS, that certain aspects of such arrangements may receive greater scrutiny in some years than others, and that the Trustees’ conclusions may be based, in part, on their consideration of these same arrangements during the course of the year and in prior years.
36
Table of Contents
MFS Global Tactical Allocation Portfolio
Board Approval of New Investment Advisory Agreement – continued
Because the portfolio management team managing the Portfolio’s investments under the then current investment advisory agreement will remain the same under the New Agreement for the Portfolio, the Trustees compared the Portfolio’s total return investment performance to the performance of its Lipper performance universe over various time periods, based on information provided by Lipper. The Trustees placed particular emphasis on the total return performance of the Portfolio’s Initial Class shares in comparison to the performance of funds in its Lipper performance universe over the one-, three- and five-year periods ended December 31, 2010. The Trustees did not rely on performance results for more recent periods.
The Trustees noted the performance of the Portfolio’s Initial Class shares was in the 5th quintile relative to the other funds in the Lipper performance universe for the one-year period (the 1st quintile being the best performers and the 5th quintile being the worst performers). The total return performance of the Portfolio was in the 3rd quintile for the three-year period and in the 1st quintile for the five-year period ended December 31, 2010, relative to the Lipper performance universe. Based on the nature and quality of services historically provided by MFS and MFS’ explanation of steps taken to improve performance, the Board of Trustees concluded that the Portfolio’s performance was adequate.
In the course of their deliberations, the Trustees took into account information provided by MFS during contract review meetings, as well as during investment review meetings conducted with portfolio management personnel during the course of the year. For Portfolios whose performance lagged their peer groups, they discussed the factors that contributed thereto and MFS’ efforts to improve such Portfolios’ performance. After reviewing this information, the Trustees concluded, within the context of their overall conclusions regarding the New Agreement, that they were satisfied with MFS’ responses and efforts relating to investment performance.
In assessing the reasonableness of the Portfolio’s advisory fee, the Trustees considered, among other information, the Portfolio’s advisory fee and the total expense ratio of the Portfolio’s Initial Class shares as a percentage of average daily net assets, compared to the advisory fee and total expense ratios of its peer group of funds based on information provided by Lipper. The Trustees also considered the advisory fees charged by MFS to institutional accounts. In comparing these fees, the Trustees considered the generally broader scope of services provided by MFS to the Trust than those provided to institutional accounts. The Trustees also considered the higher demands placed on MFS’ investment personnel and trading infrastructure as a result of the daily cash in-flows and out-flows of the Portfolio, and the impact on MFS and related expenses due to the more extensive regulatory regime to which the Portfolio is subject, compared to institutional accounts.
In considering the fees, the Trustees noted from the Lipper data that the Portfolio’s effective advisory fee rate and total expense ratio were each above the median of such fees and expenses of funds in the Lipper expense group. In addition, the Trustees accepted MFS’ offer to continue the expense limitation for the Portfolio. The Trustees further concluded that the existing breakpoint was sufficient to allow the Portfolio to benefit from economies of scale as its assets grow. The Trustees concluded that the fees were reasonable in light of the nature and quality of services provided.
The Trustees also considered whether the Portfolio is likely to benefit from any economies of scale due to future asset growth. In this regard, the Trustees reviewed the adequacy of breakpoints and discussed with MFS any adjustments necessary for the shareholders’ benefit.
The Trustees also considered information prepared by MFS relating to its costs and profits with respect to the Portfolio and other investment companies and accounts advised by MFS, as well as MFS’ methodologies used to determine and allocate its costs to the Portfolio and other accounts and products for purposes of estimating profitability.
The Trustees noted that there would be no increase to the net advisory fee arrangement for the Portfolio under the New Agreement when compared to the Portfolio’s then current investment advisory agreement. After reviewing these and other factors described below, the Trustees concluded that the advisory fees charged to the Portfolio under the New Agreement represent reasonable compensation in light of the nature and quality of the services being provided by MFS.
In addition, the Trustees considered MFS’ resources and related efforts to continue to retain, attract and motivate capable personnel to serve the Portfolio. The Trustees also considered the financial resources of MFS and its parent, Sun Life Financial Inc. The Trustees further considered any advantages and possible disadvantages of having an adviser which also serves other investment companies as well as institutional accounts.
The Trustees also considered the nature, quality, cost, and extent of administrative, transfer agency, and distribution services provided to the Trust by MFS and its affiliates under agreements and plans other than the New Agreement, including the 12b-1 fees the Portfolio pays to MFS Fund Distributors, Inc., an affiliate of MFS. The Trustees also considered the nature, extent and quality of certain other services MFS performs or arranges on the Portfolio’s behalf, which may include securities lending programs, directed expense payment programs, class action recovery programs, and MFS’ interaction with third-party service providers, principally custodians and sub-custodians. The Trustees concluded that the various non-advisory services provided
37
Table of Contents
MFS Global Tactical Allocation Portfolio
Board Approval of New Investment Advisory Agreement – continued
by MFS and its affiliates on behalf of the Portfolio were satisfactory. The Trustees also considered the benefits to MFS from the use of the Portfolio’s portfolio brokerage commissions to pay for investment research and various other factors. Additionally, the Trustees considered so-called “fall-out benefits” to MFS such as reputational value derived from serving as investment manager to the Trust, and determined that any such benefits derived by MFS were reasonable and fair.
Based on their evaluation of factors that they deemed to be material, including those factors described above, the Board of Trustees, including a majority of the independent Trustees, concluded that the New Agreement should be approved for an initial two-year period, commencing upon its effective date, as set forth in the New Agreement.
BOARD APPROVAL OF CONTINUATION OF PRIOR INVESTMENT ADVISORY AGREEMENT
The Investment Company Act of 1940 requires that both the full Board of Trustees and a majority of the non-interested (“independent”) Trustees, voting separately, annually approve the continuation of the investment advisory agreement between MFS Variable Insurance Trust II (the “Trust”) and Massachusetts Financial Services Company (“MFS”) on behalf of the Fund. The Trustees consider matters bearing on the Fund and the advisory arrangements at their meetings throughout the year, including a review of performance data at each regular meeting. In addition, the independent Trustees met in person in May and again in July 2011 (“contract review meetings”) for the specific purpose of considering whether to approve the continuation of the investment advisory agreement for the Fund. The independent Trustees were assisted in their evaluation of the investment advisory agreement by independent legal counsel, from whom they received separate legal advice and with whom they met separately from MFS management during various contract review meetings. The independent Trustees were also assisted in this process by the Fund’s Independent Chief Compliance Officer, a full-time senior officer appointed by and reporting to the independent Trustees.
In connection with their deliberations, the Trustees, including the independent Trustees, considered such information and factors as they believed, in light of the legal advice furnished to them and their own business judgment, to be relevant. The investment advisory agreement was considered separately for the Fund, although the Trustees also took into account the common interests of all Funds in the Trust in their review. As described below, the Trustees considered the nature, quality, and extent of the various investment advisory, administrative, and shareholder services performed by MFS under the existing investment advisory agreement and other arrangements with the Trust.
In connection with their contract review meetings, the Trustees received and relied upon materials which included, among other items: (i) information provided by Lipper Inc. (“Lipper”) on the investment performance of the Fund for various time periods ended December 31, 2010, compared to the investment performance of a group of funds with substantially similar investment classifications/objectives (the “Lipper performance universe”), (ii) information provided by Lipper on the Fund’s advisory fees and other expenses compared to the advisory fees and other expenses of comparable funds identified by Lipper (the “Lipper expense group”), (iii) information provided by MFS on the advisory fees of comparable portfolios of its other clients, including institutional separate account and other clients, (iv) information as to whether, and to what extent applicable, expense waivers, reimbursements or fee “breakpoints” are observed for the Fund, (v) information regarding MFS’ financial results and financial condition, including MFS’ and certain of its affiliates’ estimated profitability from services performed for the Fund and other investment companies that the Board oversees as a whole, and for MFS’ institutional business, (vi) MFS’ views regarding the outlook for the mutual fund industry and its strategic business plans, (vii) descriptions of various functions performed by MFS for the Trust, such as compliance monitoring and portfolio trading practices, and (viii) information regarding the overall organization of MFS, including information about MFS’ senior management and other personnel providing investment advisory, administrative and other services to the Fund. The comparative performance, fee and expense information prepared and provided by Lipper was not independently verified, and the independent Trustees did not independently verify any information provided to them by MFS.
The Trustees’ conclusion as to the continuation of the investment advisory agreement was based on comprehensive consideration of all information provided to the Trustees and was not the result of any single factor. Some of the factors that figured particularly in the Trustees’ deliberations are described below for the Fund, while individual Trustees may have given different weight to various factors and evaluated the information presented as a whole differently than another individual Trustee. The Trustees recognized that the fee arrangements for the Fund reflect years of review and discussion between the independent Trustees and MFS, that certain aspects of such arrangements may receive greater scrutiny in some years than others, and that the Trustees’ conclusions may be based, in part, on their consideration of these same arrangements during the course of the year and in prior years.
Based on information provided by Lipper, the Trustees compared the Fund’s total return investment performance to the performance of the Lipper performance universe over various time periods. The Trustees placed particular emphasis on the
38
Table of Contents
MFS Global Tactical Allocation Portfolio
Board Approval of Continuation of Prior Investment Advisory Agreement – continued
total return performance of the Fund’s Initial Class shares in comparison to the performance of funds in its Lipper performance universe over the one-, three- and five-year periods ended December 31, 2010. The Trustees did not rely on performance results for more recent periods, including those shown elsewhere in this report.
The Trustees noted the performance of the Fund’s Initial Class shares was in the 5th quintile relative to the other funds in the Lipper performance universe for the one-year period (the 1st quintile being the best performers and the 5th quintile being the worst performers). The total return performance of the Fund was in the 3rd quintile for the three-year period and in the 1st quintile for the five-year period ended December 31, 2010, relative to the Lipper performance universe. Based on the nature and quality of services provided by MFS and MFS’ explanation of steps taken to improve performance, the Board of Trustees concluded that the Fund’s performance was adequate.
In the course of their deliberations, the Trustees took into account information provided by MFS during contract review meetings, as well as during investment review meetings conducted with portfolio management personnel during the course of the year.
In assessing the reasonableness of the Fund’s advisory fee, the Trustees considered, among other information, the Fund’s advisory fee and the total expense ratio of the Fund’s Initial Class shares as a percentage of average daily net assets, compared to the advisory fee and total expense ratios of its peer group of funds based on information provided by Lipper. The Trustees also considered the advisory fees charged by MFS to institutional accounts. In comparing these fees, the Trustees considered the generally broader scope of services provided by MFS to the Trust than those provided to institutional accounts. The Trustees also considered the higher demands placed on MFS’ investment personnel and trading infrastructure as a result of the daily cash in-flows and out-flows of the Fund, and the impact on MFS and related expenses due to the more extensive regulatory regime to which the Fund is subject, compared to institutional accounts.
In considering the fees, the Trustees noted from the Lipper data (which takes into account any reductions or expense limitations) that the Fund’s effective advisory fee rate and total expense ratio were each above the median of such fees and expenses of funds in the Lipper expense group. In addition, the Trustees accepted MFS’ offer to continue the expense limitation for the Fund. The Trustees further concluded that the existing breakpoint was sufficient to allow the Fund to benefit from economies of scale as its assets grow. The Trustees concluded that the fees were reasonable in light of the nature and quality of services provided.
The Trustees also considered information prepared by MFS relating to its costs and profits with respect to the Fund and other investment companies and accounts advised by MFS, as well as MFS’ methodologies used to determine and allocate its costs to the Fund and other accounts and products for purposes of estimating profitability.
After reviewing these and other factors described below, the Trustees concluded that the advisory fees charged to the Fund represent reasonable compensation in light of the nature and quality of the services being provided by MFS.
In addition, the Trustees considered MFS’ resources and related efforts to continue to retain, attract and motivate capable personnel to serve the Fund. The Trustees also considered the financial resources of MFS and its parent, Sun Life Financial Inc. The Trustees further considered any advantages and possible disadvantages of having an adviser which also serves other investment companies as well as institutional accounts.
The Trustees also considered the nature, quality, cost, and extent of administrative, transfer agency, and distribution services provided to the Fund by MFS and its affiliates under agreements and plans other than the investment advisory agreement, including the 12b-1 fees the Fund pays to MFS Fund Distributors, Inc., an affiliate of MFS. The Trustees also considered the nature, extent and quality of certain other services MFS performs or arranges on the Fund’s behalf, which may include securities lending programs, directed expense payment programs, class action recovery programs, and MFS’ interaction with third-party service providers, principally custodians and sub-custodians. The Trustees concluded that the various non-advisory services provided by MFS and its affiliates on behalf of the Fund were satisfactory. The Trustees also considered the benefits to MFS from the use of the Fund’s portfolio brokerage commissions, if applicable, to pay for investment research and various other factors. Additionally, the Trustees considered so-called “fall-out benefits” to MFS such as reputational value derived from serving as investment manager to the Trust, and determined that any such benefits derived by MFS were reasonable and fair.
Based on their evaluation of factors that they deemed to be material, including those factors described above, the Board of Trustees, including a majority of the independent Trustees, concluded that the investment advisory agreement should be continued for an additional one-year period, commencing September 1, 2011.
A discussion regarding the Board’s most recent review and renewal of the fund’s Investment Advisory Agreement with MFS is available by clicking on the fund’s name under “Variable Insurance Portfolios — VIT II” in the “Products and Performance” section of the MFS Web site (mfs.com).
39
Table of Contents
MFS Global Tactical Allocation Portfolio
PROXY VOTING POLICIES AND INFORMATION
A general description of the MFS funds’ proxy voting policies and procedures is available without charge, upon request, by calling 1-800-225-2606, by visiting the Proxy Voting section of mfs.com or by visiting the SEC’s Web site at http://www.sec.gov.
Information regarding how the fund voted proxies relating to portfolio securities during the most recent twelve-month period ended June 30 is available without charge by visiting the Proxy Voting section of mfs.com or by visiting the SEC’s Web site at http://www.sec.gov.
QUARTERLY PORTFOLIO DISCLOSURE
The fund will file a complete schedule of portfolio holdings with the Securities and Exchange Commission (the Commission) for the first and third quarters of each fiscal year on Form N-Q. The fund’s Form N-Q is available on the EDGAR database on the Commission’s Internet Web site at http://www.sec.gov and may be reviewed and copied at the:
Public Reference Room
Securities and Exchange Commission
100 F Street, NE, Room 1580
Washington, D.C. 20549
Information on the operation of the Public Reference Room may be obtained by calling the Commission at 1-800-SEC-0330. Copies of the fund’s Form N-Q also may be obtained, upon payment of a duplicating fee, by electronic request at the following e-mail address: publicinfo@sec.gov or by writing the Public Reference Section at the above address.
From time to time, MFS may post important information about the fund or the MFS funds on the MFS web site (mfs.com). This information is available by visiting the “News & Commentary” section of mfs.com or by clicking on the fund’s name under “Variable Insurance Portfolios — VIT II” in the “Products and Performance” section of mfs.com.
FEDERAL TAX INFORMATION (unaudited)
The following information is provided pursuant to provisions of the Internal Revenue Code.
The fund designates $768,000 as capital gain dividends paid during the fiscal year.
For corporate shareholders, 9.24% of the ordinary income dividends paid during the fiscal year qualify for the corporate dividends received deduction.
40
Table of Contents
rev. 3/11

| Why? | Financial companies choose how they share your personal information. Federal law gives consumers the right to limit some but not all sharing. Federal law also requires us to tell you how we collect, share, and protect your personal information. Please read this notice carefully to understand what we do. |
| What? | The types of personal information we collect and share depend on the product or service you have with us. This information can include:
• Social Security number and account balances • Account transactions and transaction history • Checking account information and wire transfer instructions
When you are no longer our customer, we continue to share your information as described in this notice. |
| How? | All financial companies need to share customers’ personal information to run their everyday business. In the section below, we list the reasons financial companies can share their customers’ personal information; the reasons MFS chooses to share; and whether you can limit this sharing. |
| Reasons we can share your personal information | Does MFS share? | Can you limit this sharing? | ||
For our everyday business purposes – such as to process your transactions, maintain your account(s), respond to court orders and legal investigations, or report to credit bureaus | Yes | No | ||
For our marketing purposes – to offer our products and services to you | No | We don’t share | ||
| For joint marketing with other financial companies | No | We don’t share | ||
For our affiliates’ everyday business purposes – information about your transactions and experiences | No | We don’t share | ||
For our affiliates’ everyday business purposes – information about your creditworthiness | No | We don’t share | ||
| For nonaffiliates to market to you | No | We don’t share |
| Questions? | Call 800-225-2606 or go to mfs.com. |
41
Table of Contents
| Page 2 |
| Who we are | ||
| Who is providing this notice? | MFS Funds, MFS Investment Management, MFS Institutional Advisors, Inc., MFS Fund Distributors, Inc., MFS Heritage Trust Company, and MFS Service Center, Inc. | |
| What we do | ||
| How does MFS protect my personal information? | To protect your personal information from unauthorized access and use, we use security measures that comply with federal law. These measures include procedural, electronic, and physical safeguards for the protection of the personal information we collect about you. | |
| How does MFS collect my personal information? | We collect your personal information, for example, when you
• open an account or provide account information • direct us to buy securities or direct us to sell your securities • make a wire transfer
We also collect your personal information from others, such as credit bureaus, affiliates and other companies. | |
| Why can’t I limit all sharing? | Federal law gives you the right to limit only
• sharing for affiliates’ everyday business purposes – information about your creditworthiness • affiliates from using your information to market to you • sharing for nonaffiliates to market to you
State laws and individual companies may give you additional rights to limit sharing. | |
| Definitions | ||
| Affiliates | Companies related by common ownership or control. They can be financial and nonfinancial companies.
• MFS does not share personal information with affiliates, except for everyday business purposes as described on page one of this notice. | |
| Nonaffiliates | Companies not related by common ownership or control. They can be financial and nonfinancial companies.
• MFS does not share with nonaffiliates so they can market to you. | |
| Joint Marketing | A formal agreement between nonaffiliated financial companies that together market financial products or services to you.
• MFS doesn’t jointly market. | |
| Other important information | ||
| If you own an MFS product or receive an MFS service in the name of a third party such as a bank or broker-dealer, their privacy policy may apply to you instead of ours. | ||
42
Table of Contents

Table of Contents

MFS® Money Market Portfolio
MFS® Variable Insurance Trust II

ANNUAL REPORT
December 31, 2011
MKS-ANN
Table of Contents
MFS® MONEY MARKET PORTFOLIO
The report is prepared for the general information of contract owners.
It is authorized for distribution to prospective investors only when preceded or accompanied by a current prospectus.
NOT FDIC INSURED Ÿ MAY LOSE VALUE Ÿ NO BANK OR CREDIT UNION GUARANTEE Ÿ NOT A DEPOSIT Ÿ NOT INSURED BY ANY FEDERAL GOVERNMENT AGENCY OR NCUA/NCUSIF
Table of Contents
MFS Money Market Portfolio
LETTER FROM THE CHAIRMAN AND CEO

Dear Contract Owners:
We are indeed living through some volatile times. Economic uncertainty is everywhere, as it seems no place in the world has been unmoved by crisis. We have seen a devastating earthquake and tsunami that have led to disruptions in the Japanese markets
and supply chains. Protests have changed the face of the Middle East and left in their wake lingering tensions and resultant higher oil prices. We have seen debt limits tested in Europe and the United States and policymakers grappling to craft often unpopular monetary and fiscal responses at a time when consumers and businesses struggle with what appears to be a slowing global economy. On top of all of that, we have seen long-term U.S. debt lose its Standard & Poor’s AAA rating and the long-term debt ratings of 15 eurozone nations put on negative watch.
When markets become volatile, managing risk becomes a top priority for investors and their advisors. At MFS® risk management is foremost in our minds in all market climates. Our analysts and portfolio managers keep risks firmly in mind when evaluating securities. Additionally, we have a team of quantitative analysts that measures and assesses the risk profiles of our portfolios and securities on an ongoing basis. The chief investment risk officer, who oversees the team, reports directly to the firm’s president and chief investment officer so the risk associated with each portfolio can be assessed objectively and independently of the portfolio management team.
As always, we continue to be mindful of the many economic challenges faced at the local, national, and international levels. It is in times such as these that we want to remind investors of the merits of maintaining a long-term view, adhering to basic investing principles such as asset allocation and diversification, and working closely with their advisors to research and identify appropriate investment opportunities.
Respectfully,

Robert J. Manning
Chairman and Chief Executive Officer
MFS Investment Management®
February 15, 2012
The opinions expressed in this letter are subject to change, may not be relied upon for investment advice, and no forecasts can be guaranteed.
1
Table of Contents
MFS Money Market Portfolio
Portfolio structure (u)
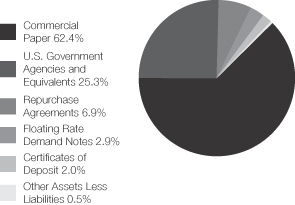
| Composition including fixed income credit quality (a)(u) | ||||
| A-1+ | 18.3% | |||
| A-1 | 81.2% | |||
| Cash & Other | 0.5% |
| Maturity breakdown (u) | ||||
| 0 - 7 days | 16.4% | |||
| 8 - 29 days | 46.3% | |||
| 30 - 59 days | 19.2% | |||
| 60 - 89 days | 7.3% | |||
| 90 - 365 days | 10.3% | |||
| Other Assets Less Liabilities | 0.5% |
| (a) | Ratings are assigned to portfolio securities utilizing ratings from Moody’s, Fitch, and Standard & Poor’s rating agencies and applying the following hierarchy: If all three agencies provide a rating, the middle rating (after dropping the highest and lowest ratings) is assigned; if two of the three agencies rate a security, the lower of the two is assigned. Cash & Other portfolio assets that are not securities are not included in the categories mentioned above. Ratings are shown in the S&P scale. All ratings are subject to change. The fund is not rated by these agencies. |
| (u) | For purposes of this presentation, accrued interest, where applicable, is included. |
Percentages are based on net assets as of 12/31/11.
The portfolio is actively managed and current holdings may be different.
2
Table of Contents
MFS Money Market Portfolio
PERFORMANCE SUMMARY THROUGH 12/31/11
Total returns as well as the current 7-day yield have been provided for the applicable time periods. Performance results reflect the percentage change in net asset value, including the reinvestment of any dividends and capital gains distributions. (See Notes to Performance Summary.) An investment in the portfolio is not insured or guaranteed by the Federal Deposit Insurance Corporation or any other government agency. Although the fund seeks to preserve the value of your investment at $1.00 per unit, it is possible to lose money by investing in the fund.
Performance data shown represents past performance and is no guarantee of future results. Investment return and principal value fluctuate so your units, when sold, may be worth more or less than the original cost; current performance may be lower or higher than quoted. The performance shown does not reflect the deduction of taxes, if any, that a contract holder would pay on fund distributions or the redemption of contract units. The returns for the fund shown also do not reflect the deduction of expenses associated with variable products, such as mortality and expense risk charges, separate account charges, and sales charges imposed by the insurance company separate accounts. Such expenses would reduce the overall returns shown.
| Share class | Inception | 1-Year Total Return | Current 7-day yield | |||||||
| Initial Class | 7/19/85 | 0.00% | 0.00% | |||||||
| Service Class | 8/24/01 | 0.00% | 0.00% |
Notes to Performance Summary
Yields quoted are based on the latest seven days ended as of December 31, 2011, with dividends annualized. The yield quotations more closely reflect the current earnings of the fund than the total return quotations.
Performance results reflect any applicable expense subsidies, waivers and adjustments in effect during the periods shown. Subsidies and fee waivers may be imposed to enhance a fund’s yield or to avoid a negative yield during periods when the fund’s operating expenses have a significant impact on the fund’s yield due to lower interest rates. Without such subsidies and waivers the fund’s performance results would be less favorable. Please see the prospectus and financial statements for complete details. All results are historical and assume the reinvestment of any dividends and capital gains distributions.
Performance results do not include adjustments made for financial reporting purposes in accordance with U.S. generally accepted accounting principles and may differ from amounts reported in the financial highlights.
3
Table of Contents
MFS Money Market Portfolio
Fund Expenses Borne by the Contract Holders During the Period,
July 1, 2011 through December 31, 2011
As a contract holder of the fund, you incur ongoing costs, including management fees; distribution and/or service (12b-1) fees; and other fund expenses. This example is intended to help you understand your ongoing costs (in dollars) of investing in the fund and to compare these costs with the ongoing costs of investing in other mutual funds.
The example is based on an investment of $1,000 invested at the beginning of the period and held for the entire period July 1, 2011 through December 31, 2011.
Actual Expenses
The first line for each share class in the following table provides information about actual account values and actual expenses. You may use the information in this line, together with the amount you invested, to estimate the expenses that you paid over the period. Simply divide your account value by $1,000 (for example, an $8,600 account value divided by $1,000 = 8.6), then multiply the result by the number in the first line under the heading entitled “Expenses Paid During Period” to estimate the expenses you paid on your account during this period.
Hypothetical Example for Comparison Purposes
The second line for each share class in the following table provides information about hypothetical account values and hypothetical expenses based on the fund’s actual expense ratio and an assumed rate of return of 5% per year before expenses, which is not the fund’s actual return. The hypothetical account values and expenses may not be used to estimate the actual ending account balance or expenses you paid for the period. You may use this information to compare the ongoing costs of investing in the fund and other funds. To do so, compare this 5% hypothetical example with the 5% hypothetical examples that appear in the shareholder reports of the other funds.
Please note that the expenses shown in the table are meant to highlight the fund’s ongoing costs only and do not take into account the fees and expenses imposed under the variable contracts through which your investment in the fund is made. Therefore, the second line for each share class in the table is useful in comparing ongoing costs associated with an investment in vehicles (such as the fund) which fund benefits under variable annuity and variable life insurance contracts and to qualified pension and retirement plans only, and will not help you determine the relative total costs of investing in the fund through variable annuity and variable life insurance contracts. If the fees and expenses imposed under the variable contracts were included, your costs would have been higher.
| Share Class | Annualized Expense Ratio | Beginning Account Value 7/01/11 | Ending Account Value | Expenses Paid During Period (p) | ||||||||||||||
| Initial Class | Actual | 0.11% | $1,000.00 | $1,000.00 | $0.55 | |||||||||||||
| Hypothetical (h) | 0.11% | $1,000.00 | $1,024.65 | $0.56 | ||||||||||||||
| Service Class | Actual | 0.11% | $1,000.00 | $1,000.00 | $0.55 | |||||||||||||
| Hypothetical (h) | 0.11% | $1,000.00 | $1,024.65 | $0.56 | ||||||||||||||
| (h) | 5% class return per year before expenses. |
| (p) | Expenses paid is equal to each class’ annualized expense ratio, as shown above, multiplied by the average account value over the period, multiplied by the number of days in the period, divided by the number of days in the year. |
Expense Changes Impacting Table
As more fully disclosed in footnote 3 to the financial statements, the expense ratios reported above include additional expense reductions to avoid a negative yield.
4
Table of Contents
MFS Money Market Portfolio
PORTFOLIO OF INVESTMENTS – 12/31/11
The Portfolio of Investments is a complete list of all securities owned by your fund. It is categorized by broad-based asset classes.
| Issuer | Shares/Par | Value ($) | ||||||
| COMMERCIAL PAPER (y) – 62.4% | ||||||||
| Automotive – 3.1% | ||||||||
| Toyota Motor Credit Corp., 0.32%, due 3/09/12 | $ | 1,322,000 | $ | 1,321,201 | ||||
| Toyota Motor Credit Corp., 0.35%, due 3/14/12 | 8,500,000 | 8,493,967 | ||||||
|
| |||||||
| $ | 9,815,168 | |||||||
|
| |||||||
| Computer Software – Systems – 3.0% | ||||||||
| International Business Machines Corp., 0.05%, due 1/09/12 (t) | $ | 9,705,000 | $ | 9,704,892 | ||||
|
| |||||||
| Consumer Products – 3.0% | ||||||||
| Procter & Gamble Co., 0.08%, due 1/24/12 (t) | $ | 6,625,000 | $ | 6,624,661 | ||||
| Procter & Gamble Co., 0.14%, due 5/07/12 (t) | 2,839,000 | 2,837,598 | ||||||
|
| |||||||
| $ | 9,462,259 | |||||||
|
| |||||||
| Electronics – 2.9% | ||||||||
| Emerson Electric Co., 0.05%, due 2/10/12 (t) | $ | 9,400,000 | $ | 9,399,478 | ||||
|
| |||||||
| Financial Institutions – 1.2% | ||||||||
| General Electric Capital Corp., 0.02%, due 1/20/12 | $ | 3,771,000 | $ | 3,770,960 | ||||
|
| |||||||
| Food & Beverages – 9.1% | ||||||||
| Coca-Cola Co., 0.15%, due 1/17/12 (t) | $ | 9,370,000 | $ | 9,369,375 | ||||
| Coca-Cola Co., 0.07%, due 2/09/12 (t) | 336,000 | 335,974 | ||||||
| Nestle Capital Corp., 0.13%, due 5/29/12 (t) | 9,660,000 | 9,654,802 | ||||||
| Pepsico, Inc., 0.06%, due 1/09/12 (t) | 8,480,000 | 8,479,887 | ||||||
| Pepsico, Inc., 0.05%, due 1/09/12 (t) | 426,000 | 425,995 | ||||||
| Pepsico, Inc., 0.06%, due 1/23/12 (t) | 700,000 | 699,974 | ||||||
|
| |||||||
| $ | 28,966,007 | |||||||
|
| |||||||
| Machinery & Tools – 3.0% | ||||||||
| Deere & Co., 0.07%, due 1/26/12 (t) | $ | 9,606,000 | $ | 9,605,533 | ||||
|
| |||||||
| Major Banks – 17.5% | ||||||||
| ANZ National (International) Ltd., 0.35%, due 1/20/12 (t) | $ | 8,750,000 | $ | 8,748,384 | ||||
| Barclays U.S. Funding Corp., 0.05%, due 1/04/12 | 6,384,000 | 6,383,973 | ||||||
| Credit Suisse First Boston, Inc., 0.22%, due 1/19/12 | 9,672,000 | 9,670,936 | ||||||
| HSBC USA, Inc., 0.26%, due 2/24/12 | 9,660,000 | 9,656,233 | ||||||
| JPMorgan Chase & Co., 0.01%, due 1/09/12 | 9,649,000 | 9,648,979 | ||||||
| Royal Bank of Canada, 0.1%, due 3/13/12 | 6,517,000 | 6,515,697 | ||||||
| Toronto Dominion Holdings (USA), Inc., 0.17%, due 4/26/12 (t) | 5,274,000 | 5,271,111 | ||||||
|
| |||||||
| $ | 55,895,313 | |||||||
|
| |||||||
| Other Banks & Diversified Financials – 6.0% | ||||||||
| Bank of Nova Scotia, 0.065%, due 1/18/12 | $ | 5,763,000 | $ | 5,762,823 | ||||
| Bank of Nova Scotia, 0.265%, due 1/10/12 | 3,886,000 | 3,885,743 | ||||||
| UBS Finance (Delaware) LLC, 0.19%, due 1/17/12 | 9,682,000 | 9,681,182 | ||||||
|
| |||||||
| $ | 19,329,748 | |||||||
|
| |||||||
| Issuer | Shares/Par | Value ($) | ||||||
| COMMERCIAL PAPER (y) – continued | ||||||||
| Pharmaceuticals – 11.6% | ||||||||
| Johnson & Johnson, 0.05%, due 1/12/12 (t) | $ | 9,774,000 | $ | 9,773,851 | ||||
| Novartis Finance Corp., 0.06%, due 1/03/12 (t) | 7,996,000 | 7,995,973 | ||||||
| Pfizer, Inc., 0.04%, due 1/23/12 (t) | 9,647,000 | 9,646,764 | ||||||
| Sanofi, 0.1%, due 1/13/12 (t) | 3,519,000 | 3,518,883 | ||||||
| Sanofi, 0.12%, due 1/13/12 (t) | 6,325,000 | 6,324,747 | ||||||
|
| |||||||
| $ | 37,260,218 | |||||||
|
| |||||||
| Tobacco – 2.0% | ||||||||
| Philip Morris International, Inc., 0.07%, due 1/19/12 (t) | $ | 6,410,000 | $ | 6,409,776 | ||||
|
| |||||||
| Total Commercial Paper, at Amortized Cost and Value | $ | 199,619,352 | ||||||
|
| |||||||
| U.S. GOVERNMENT AGENCIES AND EQUIVALENTS (y) – 25.3% | ||||||||
| Fannie Mae, 0.06%, due 2/15/12 | $ | 3,370,000 | $ | 3,369,747 | ||||
| Fannie Mae, 0.12%, due 7/02/12 | 5,700,000 | 5,696,523 | ||||||
| Farmer Mac, 0.14%, due 2/22/12 | 2,000,000 | 1,999,596 | ||||||
| Federal Home Loan Bank, 0.001%, due 1/11/12 | 7,338,000 | 7,337,998 | ||||||
| Federal Home Loan Bank, 0.01%, due 1/18/12 | 215,000 | 214,999 | ||||||
| Federal Home Loan Bank, 0.001%, due 1/20/12 | 1,800,000 | 1,799,999 | ||||||
| Federal Home Loan Bank, 0.005%, due 2/10/12 | 9,600,000 | 9,599,947 | ||||||
| Federal Home Loan Bank, 0.005%, due 2/17/12 | 5,879,000 | 5,878,962 | ||||||
| Federal Home Loan Bank, 0.005%, due 2/22/12 | 13,012,000 | 13,011,906 | ||||||
| Freddie Mac, 0.005%, due 1/23/12 | 6,945,000 | 6,944,979 | ||||||
| Freddie Mac, 0.13%, due 2/08/12 | 8,130,000 | 8,128,884 | ||||||
| Freddie Mac, 0.02%, due 3/26/12 | 7,201,000 | 7,200,660 | ||||||
| Freddie Mac, 0.1%, due 8/15/12 | 9,655,000 | 9,648,912 | ||||||
|
| |||||||
| Total U.S. Government Agencies and Equivalents, at Amortized Cost and Value | $ | 80,833,112 | ||||||
|
| |||||||
| CERTIFICATES OF DEPOSIT – 2.0% | ||||||||
| Major Banks – 2.0% | ||||||||
| Bank of Montreal/Chicago Branch, 0.07%, due 1/04/12, at Amortized Cost and Value | $ | 6,468,000 | $ | 6,468,000 | ||||
|
| |||||||
| FLOATING RATE DEMAND NOTES – 2.9% | ||||||||
| East Baton Rouge, LA, Pollution Control Rev. (Exxon Mobil Corp.), 0.01%, due 1/03/12 | $ | 3,300,000 | $ | 3,300,000 | ||||
| Lincoln County, WY, Pollution Control Rev. (Exxon Mobil Corp.), 0.01%, due 1/03/12 | 2,900,000 | 2,900,000 | ||||||
5
Table of Contents
MFS Money Market Portfolio
Portfolio of Investments – continued
| Issuer | Shares/Par | Value ($) | ||||||
| FLOATING RATE DEMAND NOTES – continued | ||||||||
| Lincoln County, WY, Pollution Control Rev. (Exxon Mobil Corp.), “C”, 0.01%, due 1/03/12 | $ | 3,200,000 | $ | 3,200,000 | ||||
|
| |||||||
| Total Floating Rate Demand Notes (Identified Cost, $9,400,000) | $ | 9,400,000 | ||||||
|
| |||||||
| REPURCHASE AGREEMENTS – 6.9% | ||||||||
| Merrill Lynch, Pierce, Fenner & Smith, Inc., 0.01%, dated 12/30/11, due 1/03/12, total to be received $22,184,025 (secured by U.S. Treasury and Federal Agency obligations valued at $22,627,689 in a jointly traded account), at Cost | $ | 22,184,000 | $ | 22,184,000 | ||||
|
| |||||||
| Total Investments, at Amortized Cost and Value | $ | 318,504,464 | ||||||
|
| |||||||
| OTHER ASSETS, LESS LIABILITIES – 0.5% | 1,525,602 | |||||||
|
| |||||||
| Net Assets – 100.0% | $ | 320,030,066 | ||||||
|
| |||||||
| (t) | Security exempt from registration with the U.S. Securities and Exchange Commission under Section 4(2) of the Securities Act of 1933. |
| (y) | The rate shown represents an annualized yield at time of purchase. |
See Notes to Financial Statements
6
Table of Contents
MFS Money Market Portfolio
FINANCIAL STATEMENTS | STATEMENT OF ASSETS AND LIABILITIES
This statement represents your fund’s balance sheet, which details the assets and liabilities comprising the total value of the fund.
At 12/31/11 | ||||||||
Assets | ||||||||
Investments, at amortized cost and value | $318,504,464 | |||||||
Cash | 243 | |||||||
Receivables for | ||||||||
Fund shares sold | 1,900,974 | |||||||
Interest | 352 | |||||||
Other assets | 9,048 | |||||||
Total assets | $320,415,081 | |||||||
Liabilities | ||||||||
Payable for fund shares reacquired | $338,750 | |||||||
Payable to investment adviser | 1,325 | |||||||
Payable for Trustees’ compensation | 518 | |||||||
Accrued expenses and other liabilities | 44,422 | |||||||
Total liabilities | $385,015 | |||||||
Net assets | $320,030,066 | |||||||
Net assets consist of | ||||||||
Paid-in capital | $320,253,511 | |||||||
Accumulated net realized gain (loss) on investments | (223,445 | ) | ||||||
Net assets | $320,030,066 | |||||||
Shares of beneficial interest outstanding | 320,254,606 |
| Net assets | Shares outstanding | Net asset value per share | ||||||||||
Initial Class | $188,106,071 | 188,231,699 | $1.00 | |||||||||
Service Class | 131,923,995 | 132,022,907 | 1.00 | |||||||||
See Notes to Financial Statements
7
Table of Contents
MFS Money Market Portfolio
FINANCIAL STATEMENTS | STATEMENT OF OPERATIONS
This statement describes how much your fund earned in investment income and accrued in expenses. It also describes any gains and/or losses generated by fund operations.
| Year ended 12/31/11 | ||||||||
| Net investment income | ||||||||
Interest income | $494,137 | |||||||
Expenses | ||||||||
Management fee | $1,606,484 | |||||||
Distribution and/or service fees | 370,056 | |||||||
Administrative services fee | 107,226 | |||||||
Trustees’ compensation | 38,657 | |||||||
Custodian fee | 27,534 | |||||||
Shareholder communications | 18,664 | |||||||
Auditing fees | 28,954 | |||||||
Legal fees | 5,502 | |||||||
Miscellaneous | 27,726 | |||||||
Total expenses | $2,230,803 | |||||||
Fees paid indirectly | (8 | ) | ||||||
Reduction of expenses by investment adviser and distributor | (1,736,658 | ) | ||||||
Net expenses | $494,137 | |||||||
Net investment income | $0 | |||||||
Net realized gain (loss) on investment transactions | $366 | |||||||
Change in net assets from operations | $366 |
See Notes to Financial Statements
8
Table of Contents
MFS Money Market Portfolio
FINANCIAL STATEMENTS | STATEMENTS OF CHANGES IN NET ASSETS
These statements describe the increases and/or decreases in net assets resulting from operations, any distributions, and any shareholder transactions.
For years ended 12/31 | 2011 | 2010 | ||||||
Change in net assets | ||||||||
From operations | ||||||||
Net investment income | $0 | $0 | ||||||
Net realized gain (loss) on investments | 366 | 732 | ||||||
Change in net assets from operations | $366 | $732 | ||||||
Change in net assets from fund share transactions | $(20,794,103 | ) | $(57,798,897 | ) | ||||
Total change in net assets | $(20,793,737 | ) | $(57,798,165 | ) | ||||
Net assets | ||||||||
At beginning of period | 340,823,803 | 398,621,968 | ||||||
At end of period | $320,030,066 | $340,823,803 |
See Notes to Financial Statements
9
Table of Contents
MFS Money Market Portfolio
FINANCIAL STATEMENTS | FINANCIAL HIGHLIGHTS
The financial highlights table is intended to help you understand the fund’s financial performance for the past 5 years. Certain information reflects financial results for a single fund share. The total returns in the table represent the rate by which an investor would have earned (or lost) on an investment in the fund share class (assuming reinvestment of all distributions) held for the entire period.
| Initial Class | Years ended 12/31 | |||||||||||||||||||
| 2011 | 2010 | 2009 | 2008 | 2007 | ||||||||||||||||
Net asset value, beginning of period | $1.00 | $1.00 | $1.00 | $1.00 | $1.00 | |||||||||||||||
| Income (loss) from investment operations | ||||||||||||||||||||
Net investment income (d) | $0.00 | $0.00 | $0.00 | (w) | $0.02 | $0.05 | ||||||||||||||
Net realized and unrealized gain (loss) on investments | 0.00 | (w) | 0.00 | (w) | 0.00 | (0.00 | )(w) | (0.00 | )(w) | |||||||||||
Total from investment operations | $0.00 | (w) | $0.00 | (w) | $0.00 | (w) | $0.02 | $0.05 | ||||||||||||
| Less distributions declared to shareholders | ||||||||||||||||||||
From net investment income | $— | $— | $(0.00 | )(w) | $(0.02 | ) | $(0.05 | ) | ||||||||||||
Net asset value, end of period (m) | $1.00 | $1.00 | $1.00 | $1.00 | $1.00 | |||||||||||||||
Total return (%) (k)(r)(m) | 0.00 | 0.00 | 0.00 | (x) | 2.03 | 4.84 | ||||||||||||||
| Ratios (%) (to average net assets) and Supplemental data: | ||||||||||||||||||||
Expenses before expense reductions (f) | 0.58 | 0.59 | 0.60 | 0.59 | 0.55 | |||||||||||||||
Expenses after expense reductions (f) | 0.15 | 0.27 | 0.33 | 0.57 | N/A | |||||||||||||||
Net investment income | 0.00 | 0.00 | 0.00 | 2.02 | 4.73 | |||||||||||||||
Net assets at end of period (000 omitted) | $188,106 | $172,365 | $206,513 | $322,980 | $320,807 | |||||||||||||||
| Service Class | Years ended 12/31 | |||||||||||||||||||
| 2011 | 2010 | 2009 | 2008 | 2007 | ||||||||||||||||
Net asset value, beginning of period | $1.00 | $1.00 | $1.00 | $1.00 | $1.00 | |||||||||||||||
| Income (loss) from investment operations | ||||||||||||||||||||
Net investment income (d) | $0.00 | $0.00 | $0.00 | $0.02 | $0.04 | |||||||||||||||
Net realized and unrealized gain (loss) on investments | 0.00 | (w) | 0.00 | (w) | 0.00 | (0.00 | )(w) | (0.00 | )(w) | |||||||||||
Total from investment operations | $0.00 | (w) | $0.00 | (w) | $0.00 | $0.02 | $0.04 | |||||||||||||
| Less distributions declared to shareholders | ||||||||||||||||||||
From net investment income | $— | $— | $(0.00 | )(w) | $(0.02 | ) | $(0.04 | ) | ||||||||||||
Net asset value, end of period (m) | $1.00 | $1.00 | $1.00 | $1.00 | $1.00 | |||||||||||||||
Total return (%) (k)(r)(m) | 0.00 | 0.00 | 0.00 | (x) | 1.80 | 4.58 | ||||||||||||||
| Ratios (%) (to average net assets) and Supplemental data: | ||||||||||||||||||||
Expenses before expense reductions (f) | 0.83 | 0.84 | 0.85 | 0.84 | 0.80 | |||||||||||||||
Expenses after expense reductions (f) | 0.16 | 0.27 | 0.33 | 0.80 | N/A | |||||||||||||||
Net investment income | 0.00 | 0.00 | 0.00 | 1.76 | 4.48 | |||||||||||||||
Net assets at end of period (000 omitted) | $131,924 | $168,459 | $192,109 | $241,404 | $233,523 | |||||||||||||||
| (d) | Per share data is based on average shares outstanding. |
| (f) | Ratios do not reflect reductions from fees paid indirectly, if applicable. |
| (k) | The total return does not reflect expenses that apply to separate accounts. Inclusion of these charges would reduce the total return figures for all periods shown. |
| (m) | The net asset values per share and total returns have been calculated on net assets which include adjustments made in accordance with U.S. generally accepted accounting principles required at period end for financial reporting purposes. |
| (r) | Certain expenses have been reduced without which performance would have been lower. |
| (w) | Per share amount was less than $0.01. |
| (x) | Total return was less than 0.01%. |
See Notes to Financial Statements
10
Table of Contents
MFS Money Market Portfolio
| (1) | Business and Organization |
MFS Money Market Portfolio (the fund) is a series of MFS Variable Insurance Trust II (the trust). The trust is organized as a Massachusetts business trust and is registered under the Investment Company Act of 1940, as amended, as an open-end management investment company. The shareholders of each series of the trust are separate accounts of insurance companies, which offer variable annuity and/or life insurance products, and qualified retirement and pension plans.
| (2) | Significant Accounting Policies |
General – The preparation of financial statements in conformity with U.S. generally accepted accounting principles requires management to make estimates and assumptions that affect the reported amounts of assets and liabilities, and disclosure of contingent assets and liabilities at the date of the financial statements and the reported amounts of revenues and expenses during the reporting period. Actual results could differ from those estimates. In the preparation of these financial statements, management has evaluated subsequent events occurring after the date of the fund’s Statement of Assets and Liabilities through the date that the financial statements were issued.
In December 2011, the Financial Accounting Standards Board issued Accounting Standards Update 2011-11, Balance Sheet (Topic 210) – Disclosures about Offsetting Assets and Liabilities (“ASU 2011-11”). Effective for annual reporting periods beginning on or after January 1, 2013 and interim periods within those annual periods, ASU 2011-11 is intended to enhance disclosure requirements on the offsetting of financial assets and liabilities. Although still evaluating the potential impacts of ASU 2011-11 to the fund, management expects that the impact of the fund’s adoption will be limited to additional financial statement disclosures.
Investment Valuations – Pursuant to procedures approved by the Board of Trustees, investments held by the fund are generally valued at amortized cost, which approximates market value. Amortized cost involves valuing an instrument at its cost as adjusted for amortization of premium or accretion of discount rather than its current market value. The amortized cost value of an instrument can be different from the market value of an instrument.
Various inputs are used in determining the value of the fund’s assets or liabilities. These inputs are categorized into three broad levels. In certain cases, the inputs used to measure fair value may fall into different levels of the fair value hierarchy. In such cases, an investment’s level within the fair value hierarchy is based on the lowest level of input that is significant to the fair value measurement. The fund’s assessment of the significance of a particular input to the fair value measurement in its entirety requires judgment, and considers factors specific to the investment. Level 1 includes unadjusted quoted prices in active markets for identical assets or liabilities. Level 2 includes other significant observable market-based inputs (including quoted prices for similar securities, interest rates, prepayment speed, and credit risk). Level 3 includes unobservable inputs, which may include the adviser’s own assumptions in determining the fair value of investments. The following is a summary of the levels used as of December 31, 2011 in valuing the fund’s assets or liabilities:
| Investments at Value | Level 1 | Level 2 | Level 3 | Total | ||||||||||||
| Short term securities | $— | $318,504,464 | $— | $318,504,464 | ||||||||||||
For further information regarding security characteristics, see the Portfolio of Investments.
Repurchase Agreements – The fund entered into repurchase agreements with approved counterparties. Each repurchase agreement is recorded at cost. The fund requires that the securities collateral in a repurchase transaction be transferred to a custodian. The fund monitors, on a daily basis, the value of the collateral to ensure that its value, including accrued interest, is greater than amounts owed to the fund under each such repurchase agreement. The fund and other funds managed by MFS may utilize a joint trading account for the purpose of entering into one or more repurchase agreements.
Indemnifications – Under the fund’s organizational documents, its officers and Trustees may be indemnified against certain liabilities and expenses arising out of the performance of their duties to the fund. Additionally, in the normal course of business, the fund enters into agreements with service providers that may contain indemnification clauses. The fund’s maximum exposure under these agreements is unknown as this would involve future claims that may be made against the fund that have not yet occurred.
Investment Transactions and Income – Investment transactions are recorded on the trade date. Interest income is recorded on the accrual basis. All premium and discount is amortized or accreted for financial statement purposes in accordance with U.S. generally accepted accounting principles.
Fees Paid Indirectly – The fund’s custody fee may be reduced according to an arrangement that measures the value of cash deposited with the custodian by the fund. This amount, for the year ended December 31, 2011, is shown as a reduction of total expenses on the Statement of Operations.
11
Table of Contents
MFS Money Market Portfolio
Notes to Financial Statements – continued
Tax Matters and Distributions – The fund intends to qualify as a regulated investment company, as defined under Subchapter M of the Internal Revenue Code, and to distribute all of its taxable income, including realized capital gains. As a result, no provision for federal income tax is required. The fund’s federal tax returns for the prior three fiscal years remain subject to examination by the Internal Revenue Service.
Distributions to shareholders are recorded on the ex-dividend date. Income and capital gain distributions are determined in accordance with income tax regulations, which may differ from U.S. generally accepted accounting principles. Certain capital accounts in the financial statements are periodically adjusted for permanent differences in order to reflect their tax character. These adjustments have no impact on net assets or net asset value per share. Temporary differences which arise from recognizing certain items of income, expense, gain or loss in different periods for financial statement and tax purposes will reverse at some time in the future. Distributions in excess of net investment income or net realized gains are temporary overdistributions for financial statement purposes resulting from differences in the recognition or classification of income or distributions for financial statement and tax purposes.
During the year ended December 31, 2011, there were no significant adjustments due to differences between book and tax accounting.
The fund declared no distributions for the years ended December 31, 2011 and December 31, 2010.
The federal tax cost and the tax basis components of distributable earnings were as follows:
| As of 12/31/11 | ||||
| Cost of investments | $318,504,464 | |||
| Capital loss carryforwards | (223,445 | ) |
Under the Regulated Investment Company Modernization Act of 2010 (the “Act”), net capital losses recognized after December 31, 2010 may be carried forward indefinitely, and their character is retained as short-term and/or long-term losses. Previously, net capital losses were carried forward for eight years and treated as short-term losses. As a transition rule, the Act requires that post-enactment net capital losses be used before pre-enactment net capital losses.
As of December 31, 2011, the fund had capital loss carryforwards available to offset future realized gains. Such losses expire as follows:
| Pre-enactment losses: | ||||
| 12/31/15 | $(30,520 | ) | ||
| 12/31/16 | (192,925 | ) | ||
| Total | $(223,445 | ) |
Multiple Classes of Shares of Beneficial Interest – The fund offers multiple classes of shares, which differ in their respective distribution and/or service fees. The fund’s income and common expenses are allocated to shareholders based on the value of settled shares outstanding of each class. The fund’s realized and unrealized gain (loss) are allocated to shareholders based on the daily net assets of each class. Dividends are declared separately for each class. Differences in per share dividend rates are generally due to differences in separate class expenses.
| (3) | Transactions with Affiliates |
Investment Adviser – The fund has an investment advisory agreement with MFS to provide overall investment management and related administrative services and facilities to the fund. The management fee is computed daily and paid monthly at an annual rate of 0.50% of the fund’s average daily net assets. The investment adviser has agreed in writing to reduce its management fee to 0.45% of average daily net assets in excess of $500 million. This written agreement terminated on December 31, 2011. For the year ended December 31, 2011, the fund’s average daily net assets did not exceed $500 million and therefore, the management fee was not reduced under this agreement. During the year ended December 31, 2011, MFS voluntarily waived receipt of $1,339,836 of the fund’s management fee in order to avoid a negative yield. For the year ended December 31, 2011, this voluntary waiver had the effect of reducing the management fee by 0.42% of average daily net assets on an annualized basis. The management fee incurred for the year ended December 31, 2011 was equivalent to an annual effective rate of 0.08% of the fund’s average daily net assets.
On December 1, 2011, shareholders of the fund approved a new investment advisory agreement between the trust, on behalf of the fund, and MFS. This new investment advisory agreement provides that effective January 1, 2012, the management fee is computed daily and paid monthly at the following annual rates:
| First $500 million of average daily net assets | 0.50% | |||
| Average daily net assets in excess of $500 million | 0.45% |
12
Table of Contents
MFS Money Market Portfolio
Notes to Financial Statements – continued
The investment adviser has agreed in writing to pay a portion of the fund’s total annual operating expenses, exclusive of interest, taxes, extraordinary expenses, and brokerage commissions, such that total annual fund operating expenses do not exceed 1.25% of the fund’s average daily net assets. MFS’ agreement to limit the fund’s total annual operating expenses is contained in the investment advisory agreement between MFS and the fund. This agreement terminated on December 31, 2011 in connection with shareholder approval of the new investment advisory agreement. The investment adviser has also agreed in writing to pay a portion of the fund’s total annual operating expenses, exclusive of interest, taxes, extraordinary expenses, brokerage and transaction costs and investment-related expenses, such that total annual operating expenses do not exceed 0.57% of average daily net assets for the Initial Class shares and 0.82% of average daily net assets for the Service Class shares. This written agreement will continue until April 30, 2013. For the year ended December 31, 2011, this reduction amounted to $26,766 and is reflected as a reduction of total expenses in the Statement of Operations.
Distributor – MFS Fund Distributors, Inc. (MFD), a wholly-owned subsidiary of MFS, is the distributor of shares of the fund. The Trustees have adopted a distribution plan for the Service Class shares pursuant to Rule 12b-1 under the Investment Company Act of 1940.
The fund’s distribution plan provides that the fund will pay MFD distribution and/or service fees equal to 0.25% per annum of its average daily net assets attributable to Service Class shares as partial consideration for services performed and expenses incurred by MFD and financial intermediaries (including participating insurance companies that invest in the fund to fund variable annuity and variable life insurance contracts, sponsors of qualified retirement and pension plans that invest in the fund, and affiliates of these participating insurance companies and plan sponsors) in connection with the sale and distribution of the Service Class shares. MFD may subsequently pay all, or a portion, of the distribution and/or service fees to financial intermediaries. During the year ended December 31, 2011, MFD voluntarily waived receipt of $370,056 of the fund’s distribution and/or service fees in order to avoid a negative yield. For the year ended December 31, 2011, this voluntary waiver had the effect of reducing the distribution and/or service fees by 0.25% of average daily net assets attributable to Service Class shares on an annualized basis. The distribution and/or service fees incurred for the year ended December 31, 2011 were equivalent to an annual effective rate of 0.00% of the average daily net assets attributable to Service Class shares.
Shareholder Servicing Agent – MFS Service Center, Inc. (MFSC), a wholly-owned subsidiary of MFS, has contracted to provide transfer agent and recordkeeping functions in connection with the issuance, transfer, and redemption of each class of shares of the fund under a Shareholder Servicing Agent Agreement. During the year ended December 31, 2011, the fund did not pay MFSC a fee for this service.
Administrator – MFS provides certain financial, legal, shareholder communications, compliance, and other administrative services to the fund. Under an administrative services agreement, the fund partially reimburses MFS the costs incurred to provide these services. The fund is charged an annual fixed amount of $17,500 plus a fee based on average daily net assets. The administrative services fee incurred for the year ended December 31, 2011 was equivalent to an annual effective rate of 0.0334% of the fund’s average daily net assets.
Trustees’ and Officers’ Compensation – The fund pays compensation to Trustees in the form of a retainer, attendance fees, and additional compensation to the Board chairperson. The fund does not pay compensation directly to officers of the fund who are also officers of the investment adviser, all of whom receive remuneration for their services to the fund from MFS. Certain officers of the fund are officers or directors of MFS, MFD, and MFSC.
Other – This fund and certain other funds managed by MFS (the funds) have entered into services agreements (the Agreements) which provide for payment of fees by the funds to Tarantino LLC and Griffin Compliance LLC in return for the provision of services of an Independent Chief Compliance Officer (ICCO) and Assistant ICCO, respectively, for the funds. The ICCO and Assistant ICCO are officers of the funds and the sole members of Tarantino LLC and Griffin Compliance LLC, respectively. The funds can terminate the Agreements with Tarantino LLC and Griffin Compliance LLC at any time under the terms of the Agreements. MFS has agreed to bear all expenses associated with office space, other administrative support, and supplies provided to the ICCO and Assistant ICCO. For the year ended December 31, 2011, the aggregate fees paid by the fund to Tarantino LLC and Griffin Compliance LLC were $5,321 and are included in miscellaneous expense on the Statement of Operations.
13
Table of Contents
MFS Money Market Portfolio
Notes to Financial Statements – continued
| (4) | Shares of Beneficial Interest |
The fund’s Declaration of Trust permits the Trustees to issue an unlimited number of full and fractional shares of beneficial interest. Transactions in fund shares were as follows:
| Year ended 12/31/11 | Year ended 12/31/10 | |||||||||||||||
| Shares | Amount | Shares | Amount | |||||||||||||
| Shares sold | ||||||||||||||||
Initial Class | 66,388,299 | $66,388,299 | 38,129,471 | $38,129,471 | ||||||||||||
Service Class | 52,062,057 | 52,062,056 | 52,206,382 | 52,206,383 | ||||||||||||
| 118,450,356 | $118,450,355 | 90,335,853 | $90,335,854 | |||||||||||||
| Shares issued in connection with acquisition of Money Market Variable Account | ||||||||||||||||
Initial Class | 24,205,785 | $24,205,785 | ||||||||||||||
| Shares reacquired | ||||||||||||||||
Initial Class | (74,853,361 | ) | $(74,853,361 | ) | (72,278,062 | ) | $(72,278,062 | ) | ||||||||
Service Class | (88,596,882 | ) | (88,596,882 | ) | (75,856,689 | ) | (75,856,689 | ) | ||||||||
| (163,450,243 | ) | $(163,450,243 | ) | (148,134,751 | ) | $(148,134,751 | ) | |||||||||
| Net change | ||||||||||||||||
Initial Class | 15,740,723 | $15,740,723 | (34,148,591 | ) | $(34,148,591 | ) | ||||||||||
Service Class | (36,534,825 | ) | (36,534,826 | ) | (23,650,307 | ) | (23,650,306 | ) | ||||||||
| (20,794,102 | ) | $(20,794,103 | ) | (57,798,898 | ) | $(57,798,897 | ) | |||||||||
| (5) | Line of Credit |
The fund and certain other funds managed by MFS participate in a $1.1 billion unsecured committed line of credit, subject to a $1 billion sublimit, provided by a syndication of banks under a credit agreement. Borrowings may be made for temporary financing needs. Interest is charged to each fund, based on its borrowings, generally at a rate equal to the higher of the Federal Reserve funds rate or one month LIBOR plus an agreed upon spread. A commitment fee, based on the average daily, unused portion of the committed line of credit, is allocated among the participating funds at the end of each calendar quarter. In addition, the fund and other funds managed by MFS have established unsecured uncommitted borrowing arrangements with certain banks for temporary financing needs. Interest is charged to each fund, based on its borrowings, at a rate equal to the Federal Reserve funds rate plus an agreed upon spread. For the year ended December 31, 2011, the fund’s commitment fee and interest expense were $2,501 and $0, respectively, and are included in miscellaneous expense on the Statement of Operations.
| (6) | Acquisitions |
At the close of business on December 2, 2011, the fund with net assets of $297,118,105, acquired all of the investment-related assets and liabilities of Money Market Variable Account. The acquisition was part of a transaction in which the Money Market Variable Account was converted into a unit investment trust (“UIT”) that invests in the fund (the acquisition of the Account’s assets and liabilities and subsequent conversion into a UIT hereinafter referred to as the “Reorganization”). The Reorganization provided the contract owners of the Money Market Variable Account with the opportunity to participate in a larger combined portfolio with an identical investment objective and similar investment policies and strategies. The acquisition was accomplished by a tax-free exchange of 24,205,785 shares of the fund (valued at $24,205,785) for all of the investment-related assets and liabilities of Money Market Variable Account. Money Market Variable Account’s net assets on that date were $24,205,785, including investments valued at $24,276,204 with a cost basis of $24,276,204. For financial reporting purposes, assets received and shares issued by the fund were recorded at fair value; however, the cost basis of the investments received from Money Market Variable Account were carried forward to align ongoing reporting of the fund’s realized and unrealized gains and losses with amounts distributable to shareholders for tax purposes. Because the combined investment portfolios have been managed as a single integrated portfolio since the acquisition was completed, it is not practicable to separate the amounts of revenue and earnings of Money Market Variable Account that have been included in MFS Money Market Portfolio’s Statement of Operations since December 2, 2011. No pro forma information is provided as it is not material to the combined fund results.
14
Table of Contents
MFS Money Market Portfolio
REPORT OF INDEPENDENT REGISTERED PUBLIC ACCOUNTING FIRM
To the Board of Trustees of MFS Variable Insurance Trust II and the Shareholders of
MFS Money Market Portfolio:
We have audited the accompanying statement of assets and liabilities, including the portfolio of investments, of MFS Money Market Portfolio (the “Fund”) (one of the portfolios comprising MFS Variable Insurance Trust II) as of December 31, 2011, and the related statement of operations for the year then ended, the statements of changes in net assets for each of the two years in the period then ended, and the financial highlights for each of the five years in the period then ended. These financial statements and financial highlights are the responsibility of the Fund’s management. Our responsibility is to express an opinion on these financial statements and financial highlights based on our audits.
We conducted our audits in accordance with the standards of the Public Company Accounting Oversight Board (United States). Those standards require that we plan and perform the audit to obtain reasonable assurance about whether the financial statements and financial highlights are free of material misstatement. The Fund is not required to have, nor were we engaged to perform, an audit of its internal control over financial reporting. Our audits included consideration of internal control over financial reporting as a basis for designing audit procedures that are appropriate in the circumstances, but not for the purpose of expressing an opinion on the effectiveness of the Fund’s internal control over financial reporting. Accordingly, we express no such opinion. An audit also includes examining, on a test basis, evidence supporting the amounts and disclosures in the financial statements, assessing the accounting principles used and significant estimates made by management, as well as evaluating the overall financial statement presentation. Our procedures included confirmation of securities owned as of December 31, 2011, by correspondence with the custodian and brokers; where replies were not received from brokers, we performed other auditing procedures. We believe that our audits provide a reasonable basis for our opinion.
In our opinion, the financial statements and financial highlights referred to above present fairly, in all material respects, the financial position of MFS Money Market Portfolio as of December 31, 2011, the results of its operations for the year then ended, the changes in its net assets for each of the two years in the period then ended, and the financial highlights for each of the five years in the period then ended, in conformity with accounting principles generally accepted in the United States of America.
DELOITTE & TOUCHE LLP
Boston, Massachusetts
February 15, 2012
15
Table of Contents
MFS Money Market Portfolio
RESULTS OF SHAREHOLDER MEETING (unaudited)
At a special meeting of shareholders of MFS Money Market Portfolio, which was held on December 1, 2011, the following actions were taken for which shareholders of all series of MFS Variable Insurance Trust II voted together as a single class with respect to Item 1 and shareholders of MFS Money Market Portfolio voted as a separate class with respect to Items 2 and 3:
Item 1: Election of ten Trustees as members of the Board of Trustees of the Trust effective January 1, 2012:
| Number of Shares | ||||||||
| For | Withheld Authority | |||||||
| Robert E. Butler | 681,916,712.8686 | 46,472,894.9218 | ||||||
| Maureen R. Goldfarb | 682,835,794.8512 | 45,553,812.9392 | ||||||
| David H. Gunning | 681,500,267.3085 | 46,889,340.4819 | ||||||
| William R. Gutow | 681,050,223.5547 | 47,339,384.2357 | ||||||
| Michael Hegarty | 682,477,088.8584 | 45,912,518.9320 | ||||||
| John P. Kavanaugh | 683,794,425.4269 | 44,595,182.3635 | ||||||
| Robert J. Manning | 682,699,559.7374 | 45,690,048.0530 | ||||||
| J. Dale Sherratt | 681,362,743.0513 | 47,026,864.7391 | ||||||
| Laurie J. Thomsen | 683,408,094.0000 | 44,981,513.7904 | ||||||
| Robert W. Uek | 681,424,852.0247 | 46,964,755.7657 | ||||||
Item 2: To approve a new investment advisory agreement dated January 1, 2012, between the Trust, on behalf of MFS Money Market Portfolio, and MFS:
| Number of Shares | ||||||||||||
| For | Against | Withheld Authority | ||||||||||
| 223,206,713.4187 | 5,360,347.9639 | 27,480,786.4273 | ||||||||||
Item 3: To approve revisions to and restatements of certain fundamental investment restrictions of MFS Money Market Portfolio effective January 1, 2012 as detailed below:
| Number of Shares | ||||||||||||||
| For | Against | Withheld Authority | ||||||||||||
| A. | Borrowing | 214,487,166.1478 | 10,274,065.3143 | 31,286,616.3478 | ||||||||||
| B. | Underwriting Securities | 216,123,773.9368 | 9,777,731.3005 | 30,146,342.5726 | ||||||||||
| C. | Issuance of Senior Securities | 218,811,701.0313 | 6,295,467.3139 | 30,940,679.4647 | ||||||||||
| D. | Lending of Money or Securities | 214,108,929.8040 | 11,105,913.0112 | 30,833,004.9947 | ||||||||||
| E. | Purchases or Sales of Real Estate; Interests in Oil, Gas or Mineral Leases; and Commodities | 217,712,580.9383 | 8,309,484.1527 | 30,025,782.7189 | ||||||||||
| F. | Industry Concentration | 217,571,154.3516 | 7,877,205.8565 | 30,599,487.6018 | ||||||||||
16
Table of Contents
MFS Money Market Portfolio
TRUSTEES AND OFFICERS – IDENTIFICATION AND BACKGROUND
The Trustees and officers of the Trust, as of February 1, 2012, are listed below, together with their principal occupations during the past five years. (Their titles may have varied during that period.) The address of each Trustee and officer is 500 Boylston Street, Boston, Massachusetts 02116.
Name, Age | Position(s) with Fund | Trustee/Officer Since (h) | Principal Occupations | Other Directorships (j) | ||||
| INTERESTED TRUSTEES | ||||||||
Robert J. Manning (k) (age 48) | Trustee | February 2004 | Massachusetts Financial Services Company, Chairman, Chief Executive Officer and Director; President (until December 2009); Chief Investment Officer (until July 2010) | N/A | ||||
| INDEPENDENT TRUSTEES | ||||||||
David H. Gunning (age 69) | Trustee and Chair of Trustees | January 2004 | Retired; Cleveland-Cliffs Inc. (mining products and service provider), Vice Chairman/Director (until May 2007) | Lincoln Electric Holdings, Inc. (welding equipment manufacturer), Director; Development Alternatives, Inc. (consulting), Director/Non-Executive Chairman; Portman Limited (mining), Director (until 2008) | ||||
Robert E. Butler (age 70) | Trustee | January 2006 | Consultant – investment company industry regulatory and compliance matters | N/A | ||||
Maureen R. Goldfarb (age 56) | Trustee | January 2009 | Private investor | N/A | ||||
William R. Gutow (age 70) | Trustee | December 1993 | Private investor and real estate consultant; Capitol Entertainment Management Company (video franchise), Vice Chairman | Atlantic Coast Tan (tanning salons), Vice Chairman (until 2007); Texas Donuts (donut franchise), Vice Chairman (until 2010) | ||||
Michael Hegarty (age 67) | Trustee | December 2004 | Private investor | N/A | ||||
John P. Kavanaugh (age 57) | Trustee | January 2009 | Private investor; The Hanover Insurance Group, Inc., Vice President and Chief Investment Officer (until 2006); Allmerica Investment Trust, Allmerica Securities Trust and Opus Investment Trust (investment companies), Chairman, President and Trustee (until 2006) | N/A | ||||
J. Dale Sherratt (age 73) | Trustee | June 1989 | Insight Resources, Inc. (acquisition planning specialists), President; Wellfleet Investments (investor in health care companies), Managing General Partner | N/A | ||||
Laurie J. Thomsen (age 54) | Trustee | March 2005 | Private investor; New Profit, Inc. (venture philanthropy), Executive Partner (until 2010) | The Travelers Companies (property and casualty insurance), Director | ||||
Robert W. Uek (age 70) | Trustee | January 2006 | Consultant to investment company industry | N/A | ||||
| OFFICERS | ||||||||
John M. Corcoran (k) (age 46) | President | October 2008 | Massachusetts Financial Services Company, Senior Vice President (since October 2008); State Street Bank and Trust (financial services provider), Senior Vice President, (until September 2008) | N/A | ||||
| Christopher R. Bohane (k) (age 38) | Assistant Secretary and Assistant Clerk | July 2005 | Massachusetts Financial Services Company, Vice President and Senior Counsel | N/A | ||||
Kino Clark (k) (age 43) | Assistant Treasurer | January 2012 | Massachusetts Financial Services Company, Assistant Vice President | N/A | ||||
17
Table of Contents
MFS Money Market Portfolio
Trustees and Officers – continued
Name, Age | Position(s) with Fund | Trustee/Officer Since (h) | Principal Occupations | Other Directorships (j) | ||||
Ethan D. Corey (k) (age 48) | Assistant Secretary and Assistant Clerk | July 2005 | Massachusetts Financial Services Company, Senior Vice President and Associate General Counsel | N/A | ||||
David L. DiLorenzo (k) (age 43) | Treasurer | July 2005 | Massachusetts Financial Services Company, Vice President | N/A | ||||
Robyn L. Griffin (age 36) | Assistant Independent Chief Compliance Officer | August 2008 | Griffin Compliance LLC (provider of compliance services), Principal (since August 2008); State Street Corporation (financial services provider), Mutual Fund Administration Assistant Vice President (October 2006 – July 2008); Liberty Mutual Group (insurance), Personal Market Assistant Controller (April 2006 – October 2006); Deloitte & Touche LLP (professional services firm). | N/A | ||||
Brian E. Langenfeld (k) (age 38) | Assistant Secretary and Assistant Clerk | June 2006 | Massachusetts Financial Services Company, Vice President and Senior Counsel | N/A | ||||
Ellen Moynihan (k) (age 54) | Assistant Treasurer | April 1997 | Massachusetts Financial Services Company, Senior Vice President | N/A | ||||
Susan S. Newton (k) (age 61) | Assistant Secretary and Assistant Clerk | May 2005 | Massachusetts Financial Services Company, Senior Vice President and Associate General Counsel | N/A | ||||
Susan A. Pereira (k) (age 41) | Assistant Secretary and Assistant Clerk | July 2005 | Massachusetts Financial Services Company, Vice President and Senior Counsel | N/A | ||||
Mark N. Polebaum (k) (age 59) | Secretary and Clerk | January 2006 | Massachusetts Financial Services Company, Executive Vice President, General Counsel and Secretary | N/A | ||||
Frank L. Tarantino (age 67) | Independent Chief Compliance Officer | June 2004 | Tarantino LLC (provider of compliance services), Principal | N/A | ||||
Richard S. Weitzel (k) (age 41) | Assistant Secretary and Assistant Clerk | October 2007 | Massachusetts Financial Services Company, Vice President and Assistant General Counsel | N/A | ||||
James O. Yost (k) (age 51) | Deputy Treasurer | September 1990 | Massachusetts Financial Services Company, Senior Vice President | N/A | ||||
| (h) | Date first appointed to serve as Trustee/officer of an MFS fund. Each Trustee has served continuously since appointment unless indicated otherwise. For the period from December 15, 2004 until February 22, 2005, Mr. Manning served as Advisory Trustee. For the period October 2008, until January 2012, Mr. Corcoran served as Treasurer of the Funds. Prior to January 2012, Messrs. DiLorenzo and Yost served as Assistant Treasurers of the Funds. |
| (j) | Directorships or trusteeships of companies required to report to the Securities and Exchange Commission (i.e., “public companies”). |
| (k) | “Interested person” of the Trust within the meaning of the Investment Company Act of 1940 (referred to as the 1940 Act), which is the principal federal law governing investment companies like the fund, as a result of position with MFS. The address of MFS is 500 Boylston Street, Boston, Massachusetts 02116. |
Each Trustee has been elected by shareholders and each Trustee and officer holds office until his or her successor is chosen and qualified or until his or her earlier death, resignation, retirement or removal. The Trust does not hold annual meetings for the purpose of electing Trustees, and Trustees are not elected for fixed terms. Messrs. Butler, Kavanaugh, Uek and Ms. Thomsen are members of the Trust’s Audit Committee.
Each of the Fund’s Trustees and officers holds comparable positions with certain other funds of which MFS or a subsidiary is the investment adviser or distributor, and, in the case of the officers, with certain affiliates of MFS. As of January 1, 2012, the Trustees served as board members of 131 funds within the MFS Family of Funds.
18
Table of Contents
MFS Money Market Portfolio
Trustees and Officers – continued
The Statement of Additional Information for the Fund includes further information about the Trustees and is available without charge upon request by calling 1-800-225-2606.
Investment Adviser Massachusetts Financial Services Company 500 Boylston Street, Boston, MA 02116-3741 | Custodian State Street Bank and Trust 1 Lincoln Street, Boston, MA 02111-2900 | |
Distributor MFS Fund Distributors, Inc. 500 Boylston Street, Boston, MA 02116-3741 | Independent Registered Public Accounting Firm Deloitte & Touche LLP 200 Berkeley Street, Boston, MA 02116 | |
Portfolio Manager Edward O’Dette |
19
Table of Contents
MFS Money Market Portfolio
At a special meeting of shareholders of the MFS Money Market Portfolio (hereinafter referred to as the “Fund” or the “Portfolio”), which was held on December 1, 2011, the shareholders approved a new investment advisory agreement based on the recommendation of the Board of Trustees. At its July, 2011 meeting, the Board of Trustees (i) approved, and recommended for shareholder approval, the new investment advisory agreement effective January 1, 2012, and (ii) the continuation of the existing investment advisory agreement effective September 1, 2011. The following includes a description of the factors that the Board of Trustees considered and the conclusions that formed the basis of their approval of both the new investment advisory agreement and the continuation of the prior investment advisory agreement.
BOARD APPROVAL OF NEW INVESTMENT ADVISORY AGREEMENT
The Investment Company Act of 1940 requires that both the full Board of Trustees and a majority of the non-interested (“independent”) Trustees, voting separately, initially approve the new investment advisory agreement (the “New Agreement”) between Massachusetts Financial Services Company (“MFS”) and MFS Variable Insurance Trust II (the “Trust”) on behalf of the Portfolio and, beginning on the second anniversary of the initial effective date of the New Agreement, annually approve the continuation of the New Agreement. The Trustees have considered matters bearing on the Portfolio and the then current advisory arrangement at their meetings throughout the year, including a review of performance data at each regular meeting. In addition, the independent Trustees met in person in July 2011 to consider the initial approval of the New Agreement, and to recommend that shareholders approve the New Agreement. The independent Trustees were assisted in their evaluation of the New Agreement by independent legal counsel, from whom they received separate legal advice and with whom they met separately from MFS management. The independent Trustees were also assisted in this process by the Portfolio’s Independent Chief Compliance Officer, a full-time senior officer appointed by and reporting to the independent Trustees.
In connection with their deliberations regarding the initial approval of the New Agreement, the Trustees, including the independent Trustees, considered such information and factors as they believed, in light of the legal advice furnished to them and their own business judgment, to be relevant. The New Agreement was considered separately for the series of the Trust (collectively, the “Portfolios”), although the Trustees also took into account the common interests of all Portfolios in the Trust in their review. As described below, the Trustees considered the nature, quality, and extent of the various investment advisory, administrative, and/or shareholder services to be performed by MFS under the New Agreement and other arrangements with the Trust.
In connection with their initial review meeting, the Trustees received and relied upon materials that included, among other items: (i) information provided by MFS on the advisory fees of comparable portfolios of its other clients, including institutional separate account and other clients, (ii) information as to whether, and to what extent applicable, expense waivers, reimbursements or fee “breakpoints” would be observed for the Portfolio under the New Agreement, and (iii) a comparison and summary of the differences in the provisions in the New Agreement compared to those in each of the then current investment advisory agreements for the Portfolios. In addition, in connection with the independent Trustees’ meetings in May and July, 2011 (the “contract review meetings”) for the purpose of considering whether to approve the continuation of the then current investment advisory agreements for the Portfolio, the independent Trustees received: (1) information provided by Lipper Inc. (“Lipper”) on the investment performance of the Portfolio for various time periods ended December 31, 2010, compared to the investment performance of a group of funds with substantially similar investment classifications/objectives (the “Lipper performance universe”), (2) information provided by Lipper on the Portfolio’s advisory fees and other expenses compared to the advisory fees and other expenses of comparable funds identified by Lipper (the “Lipper expense group”), (3) information regarding MFS’ financial results and financial condition, including MFS’ and certain of its affiliates’ estimated profitability from services performed for the Portfolio, (4) MFS’ views regarding the outlook for the mutual fund industry and its strategic business plans, (5) descriptions of various functions performed by MFS for the Trust, such as compliance monitoring and portfolio trading practices, and (6) information regarding the overall organization of MFS, including information about MFS’ senior management and other personnel providing investment advisory, administrative and other services to the Portfolio. The comparative performance, fee and expense information prepared and provided by Lipper was not independently verified, and the independent Trustees did not independently verify any information provided to them by MFS.
The Trustees’ conclusion as to the initial approval of the New Agreement was based on comprehensive consideration of all information provided to the Trustees and was not the result of any single factor. Some of the factors that figured particularly in the Trustees’ deliberations are described below for the Portfolio, while individual Trustees may have given different weight to various factors and evaluated the information presented as a whole differently than another individual Trustee. The Trustees recognized that the fee arrangements for the Portfolio could reflect years of review and discussion between the independent Trustees and MFS, that certain aspects of such arrangements may receive greater scrutiny in some years than others, and that
20
Table of Contents
MFS Money Market Portfolio
Board Approval of New Investment Advisory Agreement – continued
the Trustees’ conclusions may be based, in part, on their consideration of these same arrangements during the course of the year and in prior years.
Because the portfolio management team managing the Portfolio’s investments under the then current investment advisory agreement will remain the same under the New Agreement for the Portfolio, the Trustees compared the Portfolio’s total return investment performance to the performance of its Lipper performance universe over various time periods, based on information provided by Lipper. The Trustees placed particular emphasis on the total return performance of the Portfolio’s Initial Class shares in comparison to the performance of funds in its Lipper performance universe over the one-, three- and five-year periods ended December 31, 2010. The Trustees did not rely on performance results for more recent periods.
The Trustees noted the performance of the Portfolio’s Initial Class shares was in the 4th quintile relative to the other funds in the Lipper performance universe for the one-year period (the 1st quintile being the best performers and the 5th quintile being the worst performers). The total return performance of the Portfolio was in the 4th quintile for the three-year and the five-year periods ended December 31, 2010, relative to the Lipper performance universe. Based on the nature and quality of services provided by MFS, the Board of Trustees concluded that the Portfolio’s performance was adequate.
In the course of their deliberations, the Trustees took into account information provided by MFS during contract review meetings, as well as during investment review meetings conducted with portfolio management personnel during the course of the year. For Portfolios whose performance lagged their peer groups, they discussed the factors that contributed thereto and MFS’ efforts to improve such Portfolios’ performance. After reviewing this information, the Trustees concluded, within the context of their overall conclusions regarding the New Agreement, that they were satisfied with MFS’ responses and efforts relating to investment performance.
In assessing the reasonableness of the Portfolio’s advisory fee, the Trustees considered, among other information, the Portfolio’s advisory fee and the total expense ratio of the Portfolio’s Initial Class shares as a percentage of average daily net assets, compared to the advisory fee and total expense ratios of its peer group of funds based on information provided by Lipper. The Trustees also considered the advisory fees charged by MFS to institutional accounts. In comparing these fees, the Trustees considered the generally broader scope of services provided by MFS to the Trust than those provided to institutional accounts. The Trustees also considered the higher demands placed on MFS’ investment personnel and trading infrastructure as a result of the daily cash in-flows and out-flows of the Portfolio, and the impact on MFS and related expenses due to the more extensive regulatory regime to which the Portfolio is subject, compared to institutional accounts.
In considering the fees, the Trustees noted from the Lipper data that the Portfolio’s effective advisory fee rate and total expense ratio were each below the median of such fees and expenses of funds in the Lipper expense group. In addition, the Trustees accepted MFS’ offer to continue the expense limitation for the Portfolio. The Trustees further noted that the New Agreement would reflect MFS’ agreement to reduce the advisory fee on average daily net assets over $500 million on a permanent basis, and concluded that the breakpoint was sufficient to allow the Portfolio to benefit from economies of scale as its assets grow. The Trustees concluded that the fees were reasonable in light of the nature and quality of services provided.
The Trustees also considered whether the Portfolio is likely to benefit from any economies of scale due to future asset growth. In this regard, the Trustees reviewed the adequacy of breakpoints and discussed with MFS any adjustments necessary for the shareholders’ benefit.
The Trustees also considered information prepared by MFS relating to its costs and profits with respect to the Portfolio and other investment companies and accounts advised by MFS, as well as MFS’ methodologies used to determine and allocate its costs to the Portfolio and other accounts and products for purposes of estimating profitability.
The Trustees noted that there would be no increase to the net advisory fee arrangement for the Portfolio under the New Agreement when compared to the Portfolio’s then current investment advisory agreement. After reviewing these and other factors described below, the Trustees concluded that the advisory fees charged to the Portfolio under the New Agreement represent reasonable compensation in light of the nature and quality of the services being provided by MFS.
In addition, the Trustees considered MFS’ resources and related efforts to continue to retain, attract and motivate capable personnel to serve the Portfolio. The Trustees also considered the financial resources of MFS and its parent, Sun Life Financial Inc. The Trustees further considered any advantages and possible disadvantages of having an adviser which also serves other investment companies as well as institutional accounts.
21
Table of Contents
MFS Money Market Portfolio
Board Approval of New Investment Advisory Agreement – continued
The Trustees also considered the nature, quality, cost, and extent of administrative, transfer agency, and distribution services provided to the Trust by MFS and its affiliates under agreements and plans other than the New Agreement, including the 12b-1 fees the Portfolio pays to MFS Fund Distributors, Inc., an affiliate of MFS. The Trustees also considered the nature, extent and quality of certain other services MFS performs or arranges on the Portfolio’s behalf, which may include securities lending programs, directed expense payment programs, class action recovery programs, and MFS’ interaction with third-party service providers, principally custodians and sub-custodians. The Trustees concluded that the various non-advisory services provided by MFS and its affiliates on behalf of the Portfolio were satisfactory. The Trustees also considered the benefits to MFS from the use of the Portfolio’s portfolio brokerage commissions to pay for investment research and various other factors. Additionally, the Trustees considered so-called “fall-out benefits” to MFS such as reputational value derived from serving as investment manager to the Trust, and determined that any such benefits derived by MFS were reasonable and fair.
Based on their evaluation of factors that they deemed to be material, including those factors described above, the Board of Trustees, including a majority of the independent Trustees, concluded that the New Agreement should be approved for an initial two-year period, commencing upon its effective date, as set forth in the New Agreement.
BOARD APPROVAL OF CONTINUATION OF PRIOR INVESTMENT ADVISORY AGREEMENT
The Investment Company Act of 1940 requires that both the full Board of Trustees and a majority of the non-interested (“independent”) Trustees, voting separately, annually approve the continuation of the investment advisory agreement between MFS Variable Insurance Trust II (the “Trust”) and Massachusetts Financial Services Company (“MFS”) on behalf of the Fund. The Trustees consider matters bearing on the Fund and the advisory arrangements at their meetings throughout the year, including a review of performance data at each regular meeting. In addition, the independent Trustees met in person in May and again in July 2011 (“contract review meetings”) for the specific purpose of considering whether to approve the continuation of the investment advisory agreement for the Fund. The independent Trustees were assisted in their evaluation of the investment advisory agreement by independent legal counsel, from whom they received separate legal advice and with whom they met separately from MFS management during various contract review meetings. The independent Trustees were also assisted in this process by the Fund’s Independent Chief Compliance Officer, a full-time senior officer appointed by and reporting to the independent Trustees.
In connection with their deliberations, the Trustees, including the independent Trustees, considered such information and factors as they believed, in light of the legal advice furnished to them and their own business judgment, to be relevant. The investment advisory agreement was considered separately for the Fund, although the Trustees also took into account the common interests of all Funds in the Trust in their review. As described below, the Trustees considered the nature, quality, and extent of the various investment advisory, administrative, and shareholder services performed by MFS under the existing investment advisory agreement and other arrangements with the Trust.
In connection with their contract review meetings, the Trustees received and relied upon materials which included, among other items: (i) information provided by Lipper Inc. (“Lipper”) on the investment performance of the Fund for various time periods ended December 31, 2010, compared to the investment performance of a group of funds with substantially similar investment classifications/objectives (the “Lipper performance universe”), (ii) information provided by Lipper on the Fund’s advisory fees and other expenses compared to the advisory fees and other expenses of comparable funds identified by Lipper (the “Lipper expense group”), (iii) information provided by MFS on the advisory fees of comparable portfolios of its other clients, including institutional separate account and other clients, (iv) information as to whether, and to what extent applicable, expense waivers, reimbursements or fee “breakpoints” are observed for the Fund, (v) information regarding MFS’ financial results and financial condition, including MFS’ and certain of its affiliates’ estimated profitability from services performed for the Fund and other investment companies that the Board oversees as a whole, and for MFS’ institutional business, (vi) MFS’ views regarding the outlook for the mutual fund industry and its strategic business plans, (vii) descriptions of various functions performed by MFS for the Trust, such as compliance monitoring and portfolio trading practices, and (viii) information regarding the overall organization of MFS, including information about MFS’ senior management and other personnel providing investment advisory, administrative and other services to the Fund. The comparative performance, fee and expense information prepared and provided by Lipper was not independently verified, and the independent Trustees did not independently verify any information provided to them by MFS.
The Trustees’ conclusion as to the continuation of the investment advisory agreement was based on comprehensive consideration of all information provided to the Trustees and was not the result of any single factor. Some of the factors that figured particularly in the Trustees’ deliberations are described below for the Fund, while individual Trustees may have given different weight to various factors and evaluated the information presented as a whole differently than another individual
22
Table of Contents
MFS Money Market Portfolio
Board Approval of Continuation of Prior Investment Advisory Agreement – continued
Trustee. The Trustees recognized that the fee arrangements for the Fund reflect years of review and discussion between the independent Trustees and MFS, that certain aspects of such arrangements may receive greater scrutiny in some years than others, and that the Trustees’ conclusions may be based, in part, on their consideration of these same arrangements during the course of the year and in prior years.
Based on information provided by Lipper, the Trustees compared the Fund’s total return investment performance to the performance of the Lipper performance universe over various time periods. The Trustees placed particular emphasis on the total return performance of the Fund’s Initial Class shares in comparison to the performance of funds in its Lipper performance universe over the one-, three- and five -year periods ended December 31, 2010. The Trustees did not rely on performance results for more recent periods, including those shown elsewhere in this report.
The Trustees noted the performance of the Fund’s Initial Class shares was in the 4th quintile relative to the other funds in the Lipper performance universe for the one-year period (the 1st quintile being the best performers and the 5th quintile being the worst performers). The total return performance of the Fund was also in the 4th quintile for the three-year and five-year periods ended December 31, 2010, relative to the Lipper performance universe. Based on the nature and quality of services provided by MFS, the Board of Trustees concluded that the Fund’s performance was adequate.
In the course of their deliberations, the Trustees took into account information provided by MFS during contract review meetings, as well as during investment review meetings conducted with portfolio management personnel during the course of the year.
In assessing the reasonableness of the Fund’s advisory fee, the Trustees considered, among other information, the Fund’s advisory fee and the total expense ratio of the Fund’s Initial Class shares as a percentage of average daily net assets, compared to the advisory fee and total expense ratios of its peer group of funds based on information provided by Lipper. The Trustees also considered the advisory fees charged by MFS to institutional accounts. In comparing these fees, the Trustees considered the generally broader scope of services provided by MFS to the Trust than those provided to institutional accounts. The Trustees also considered the higher demands placed on MFS’ investment personnel and trading infrastructure as a result of the daily cash in-flows and out-flows of the Fund, and the impact on MFS and related expenses due to the more extensive regulatory regime to which the Fund is subject, compared to institutional accounts.
In considering the fees, the Trustees noted from the Lipper data (which takes into account any reductions or expense limitations) that the Fund’s effective advisory fee rate and total expense ratio were each below the median of such fees and expenses of funds in the Lipper expense group. In addition, the Trustees accepted MFS’ offer to continue the expense limitation for the Fund. The Trustees further concluded that the existing breakpoint was sufficient to allow the Fund to benefit from economies of scale as its assets grow. The Trustees concluded that the fees were reasonable in light of the nature and quality of services provided.
The Trustees also considered information prepared by MFS relating to its costs and profits with respect to the Fund and other investment companies and accounts advised by MFS, as well as MFS’ methodologies used to determine and allocate its costs to the Fund and other accounts and products for purposes of estimating profitability.
After reviewing these and other factors described below, the Trustees concluded that the advisory fees charged to the Fund represent reasonable compensation in light of the nature and quality of the services being provided by MFS.
In addition, the Trustees considered MFS’ resources and related efforts to continue to retain, attract and motivate capable personnel to serve the Fund. The Trustees also considered the financial resources of MFS and its parent, Sun Life Financial Inc. The Trustees further considered any advantages and possible disadvantages of having an adviser which also serves other investment companies as well as institutional accounts.
The Trustees also considered the nature, quality, cost, and extent of administrative, transfer agency, and distribution services provided to the Fund by MFS and its affiliates under agreements and plans other than the investment advisory agreement, including the 12b-1 fees the Fund pays to MFS Fund Distributors, Inc., an affiliate of MFS. The Trustees also considered the nature, extent and quality of certain other services MFS performs or arranges on the Fund’s behalf, which may include securities lending programs, directed expense payment programs, class action recovery programs, and MFS’ interaction with third-party service providers, principally custodians and sub-custodians. The Trustees concluded that the various non-advisory services provided by MFS and its affiliates on behalf of the Fund were satisfactory. The Trustees also considered the benefits to MFS from the use of the Fund’s portfolio brokerage commissions, if applicable, to pay for investment research and various other factors. Additionally, the Trustees considered so-called “fall-out benefits” to MFS such as reputational value derived from serving as investment manager to the Trust, and determined that any such benefits derived by MFS were reasonable and fair.
23
Table of Contents
MFS Money Market Portfolio
Board Approval of Continuation of Prior Investment Advisory Agreement – continued
Based on their evaluation of factors that they deemed to be material, including those factors described above, the Board of Trustees, including a majority of the independent Trustees, concluded that the investment advisory agreement should be continued for an additional one-year period, commencing September 1, 2011.
A discussion regarding the Board’s most recent review and renewal of the fund’s Investment Advisory Agreement with MFS is available by clicking on the fund’s name under “Variable Insurance Portfolios — VIT II” in the “Products and Performance” section of the MFS Web site (mfs.com).
24
Table of Contents
MFS Money Market Portfolio
PROXY VOTING POLICIES AND INFORMATION
A general description of the MFS funds’ proxy voting policies and procedures is available without charge, upon request, by calling
1-800-225-2606, by visiting the Proxy Voting section of mfs.com or by visiting the SEC’s Web site at http://www.sec.gov.
Information regarding how the fund voted proxies relating to portfolio securities during the most recent twelve-month period ended June 30 is available without charge by visiting the Proxy Voting section of mfs.com or by visiting the SEC’s Web site at http://www.sec.gov.
QUARTERLY PORTFOLIO DISCLOSURE
The fund will file a complete schedule of portfolio holdings with the Securities and Exchange Commission (the Commission) for the first and third quarters of each fiscal year on Form N-Q. The fund’s Form N-Q is available on the EDGAR database on the Commission’s Internet Web site at http://www.sec.gov and may be reviewed and copied at the:
Public Reference Room
Securities and Exchange Commission
100 F Street, NE, Room 1580
Washington, D.C. 20549
Information on the operation of the Public Reference Room may be obtained by calling the Commission at 1-800-SEC-0330. Copies of the fund’s Form N-Q also may be obtained, upon payment of a duplicating fee, by electronic request at the following e-mail address: publicinfo@sec.gov or by writing the Public Reference Section at the above address.
From time to time, MFS may post important information about the fund or the MFS funds on the MFS web site (mfs.com). This information is available by visiting the “News & Commentary” section of mfs.com or by clicking on the fund’s name under “Variable Insurance Portfolios — VIT II” in the “Products and Performance” section of mfs.com.
25
Table of Contents
rev. 3/11

| Why? | Financial companies choose how they share your personal information. Federal law gives consumers the right to limit some but not all sharing. Federal law also requires us to tell you how we collect, share, and protect your personal information. Please read this notice carefully to understand what we do. |
| What? | The types of personal information we collect and share depend on the product or service you have with us. This information can include:
•Social Security number and account balances •Account transactions and transaction history •Checking account information and wire transfer instructions
When you are no longer our customer, we continue to share your information as described in this notice. |
| How? | All financial companies need to share customers’ personal information to run their everyday business. In the section below, we list the reasons financial companies can share their customers’ personal information; the reasons MFS chooses to share; and whether you can limit this sharing. |
| Reasons we can share your personal information | Does MFS share? | Can you limit this sharing? | ||
For our everyday business purposes – such as to process your transactions, maintain your account(s), respond to court orders and legal investigations, or report to credit bureaus | Yes | No | ||
For our marketing purposes – to offer our products and services to you | No | We don’t share | ||
| For joint marketing with other financial companies | No | We don’t share | ||
For our affiliates’ everyday business purposes – information about your transactions and experiences | No | We don’t share | ||
For our affiliates’ everyday business purposes – information about your creditworthiness | No | We don’t share | ||
| For nonaffiliates to market to you | No | We don’t share |
| Questions? | Call 800-225-2606 or go to mfs.com. |
26
Table of Contents
| Page 2 |
| Who we are | ||
| Who is providing this notice? | MFS Funds, MFS Investment Management, MFS Institutional Advisors, Inc., MFS Fund Distributors, Inc., MFS Heritage Trust Company, and MFS Service Center, Inc. | |
| What we do | ||
| How does MFS protect my personal information? | To protect your personal information from unauthorized access and use, we use security measures that comply with federal law. These measures include procedural, electronic, and physical safeguards for the protection of the personal information we collect about you. | |
| How does MFS collect my personal information? | We collect your personal information, for example, when you
•open an account or provide account information •direct us to buy securities or direct us to sell your securities •make a wire transfer
We also collect your personal information from others, such as credit bureaus, affiliates and other companies. | |
| Why can’t I limit all sharing? | Federal law gives you the right to limit only
•sharing for affiliates’ everyday business purposes – information about your creditworthiness •affiliates from using your information to market to you •sharing for nonaffiliates to market to you
State laws and individual companies may give you additional rights to limit sharing. | |
| Definitions | ||
| Affiliates | Companies related by common ownership or control. They can be financial and nonfinancial companies.
•MFS does not share personal information with affiliates, except for everyday business purposes as described on page one of this notice. | |
| Nonaffiliates | Companies not related by common ownership or control. They can be financial and nonfinancial companies.
•MFS does not share with nonaffiliates so they can market to you. | |
| Joint Marketing | A formal agreement between nonaffiliated financial companies that together market financial products or services to you.
•MFS doesn’t jointly market. | |
| Other important information | ||
| If you own an MFS product or receive an MFS service in the name of a third party such as a bank or broker-dealer, their privacy policy may apply to you instead of ours. | ||
27
Table of Contents

Table of Contents

MFS® Massachusetts Investors Growth Stock Portfolio
MFS® Variable Insurance Trust II

ANNUAL REPORT
December 31, 2011
MIS-ANN
Table of Contents
MFS® MASSACHUSETTS INVESTORS GROWTH STOCK PORTFOLIO
The report is prepared for the general information of contract owners.
It is authorized for distribution to prospective investors only when preceded or accompanied by a current prospectus.
NOT FDIC INSURED Ÿ MAY LOSE VALUE Ÿ NO BANK OR CREDIT UNION GUARANTEE Ÿ NOT A DEPOSIT Ÿ NOT INSURED BY ANY FEDERAL GOVERNMENT AGENCY OR NCUA/NCUSIF
Table of Contents
MFS Massachusetts Investors Growth Stock Portfolio
LETTER FROM THE CHAIRMAN AND CEO

Dear Contract Owners:
We are indeed living through some volatile times. Economic uncertainty is everywhere, as it seems no place in the world has been unmoved by crisis. We have seen a devastating earthquake and tsunami that have led to disruptions in the Japanese markets
and supply chains. Protests have changed the face of the Middle East and left in their wake lingering tensions and resultant higher oil prices. We have seen debt limits tested in Europe and the United States and policymakers grappling to craft often unpopular monetary and fiscal responses at a time when consumers and businesses struggle with what appears to be a slowing global economy. On top of all of that, we have seen long-term U.S. debt lose its Standard & Poor’s AAA rating and the long-term debt ratings of 15 eurozone nations put on negative watch.
When markets become volatile, managing risk becomes a top priority for investors and their advisors. At MFS® risk management is foremost in our minds in all market climates. Our analysts and portfolio managers keep risks firmly in mind when evaluating securities. Additionally, we have a team of quantitative analysts that measures and assesses the risk profiles of our portfolios and securities on an ongoing basis. The chief investment risk officer, who oversees the team, reports directly to the firm’s president and chief investment officer so the risk associated with each portfolio can be assessed objectively and independently of the portfolio management team.
As always, we continue to be mindful of the many economic challenges faced at the local, national, and international levels. It is in times such as these that we want to remind investors of the merits of maintaining a long-term view, adhering to basic investing principles such as asset allocation and diversification, and working closely with their advisors to research and identify appropriate investment opportunities.
Respectfully,

Robert J. Manning
Chairman and Chief Executive Officer
MFS Investment Management®
February 15, 2012
The opinions expressed in this letter are subject to change, may not be relied upon for investment advice, and no forecasts can be guaranteed.
1
Table of Contents
MFS Massachusetts Investors Growth Stock Portfolio
Portfolio structure

| Top ten holdings | ||||
| Oracle Corp. | 4.0% | |||
| Apple, Inc. | 3.9% | |||
| Danaher Corp. | 3.8% | |||
| Google, Inc., “A” | 3.7% | |||
| United Technologies Corp. | 3.0% | |||
| PepsiCo, Inc. | 2.9% | |||
| Colgate-Palmolive Co. | 2.9% | |||
| Visa, Inc., “A” | 2.8% | |||
| Schlumberger Ltd. | 2.6% | |||
| Microchip Technology, Inc. | 2.5% |
| Equity sectors | ||||
| Technology | 26.1% | |||
| Industrial Goods & Services | 12.3% | |||
| Consumer Staples | 11.6% | |||
| Health Care | 11.0% | |||
| Financial Services | 8.4% | |||
| Special Products & Services | 7.9% | |||
| Retailing | 7.4% | |||
| Energy | 7.1% | |||
| Basic Materials | 3.0% | |||
| Leisure | 2.4% | |||
| Autos & Housing | 1.8% | |||
| Transportation | 0.5% |
Percentages are based on net assets as of 12/31/11.
The portfolio is actively managed and current holdings may be different.
2
Table of Contents
MFS Massachusetts Investors Growth Stock Portfolio
Summary of Results
For the twelve months ended December 31, 2011, Initial Class shares of the MFS Massachusetts Investors Growth Stock Portfolio (the “fund”) provided a total return of 0.80%, while Service Class shares of the fund provided a total return of 0.57%. These compare with a return of 2.64% over the same period for the fund’s benchmark, the Russell 1000 Growth Index.
Market Environment
Early in the period, the U.S. Federal Reserve (the “Fed”) responded to weak economic growth by loosening monetary policy further. More easing by the Fed improved market sentiment and drove risk-asset prices markedly higher. The December 2010 agreement on a surprisingly large (relative to expectations) expansionary U.S. fiscal package also boosted sentiment. During the subsequent several months, the renewed positive market sentiment, coupled with better indications of global macroeconomic activity, pushed many asset valuations to post-crisis highs. At the same time, the yields of the perceived “safest” global sovereign credits rose, indicating a renewed risk-seeking environment.
However, towards the middle of the period, a weakening macroeconomic backdrop and renewed concerns over peripheral euro zone sovereign debt caused a flight-to-quality move that pushed high-quality sovereign bond yields lower. In the U.S., concerns about sovereign debt default and the long-term sustainability of the trend in U.S. fiscal policy resulted in one agency downgrading U.S. credit quality. Amidst this turmoil, global equity markets declined sharply. As a result of these developments, global consumer and producer sentiment indicators fell precipitously and highly-rated sovereign bond yields hit multi-decade lows. Towards the end of the reporting period, uncertainty in financial markets spiked higher as markets more seriously contemplated the possible failure of the euro zone.
Detractors from Performance
Security selection in the health care sector detracted from the fund’s performance relative to the Russell 1000 Growth Index. The fund’s ownership in shares of life sciences supply company Thermo Fisher Scientific (b) held back relative results. Shares of the company declined as management lowered its full-year guidance due to sluggishness in the academic/government end market and a lower impact from foreign exchange. Its share price underperformance also reflected concerns about the potential for a more significant slowdown in its European business.
Security selection in the retailing sector also dampened performance. No individual securities within this sector were among the fund’s top relative detractors for the reporting period.
Elsewhere, the fund’s underweight position in shares of integrated oil and gas company Exxon Mobil held back performance as the stock outperformed the benchmark during the reporting period. Shares of Exxon Mobil, along with most energy companies, benefited as oil prices increased during the period. The company also reported positive earnings results, with very strong returns and cash flow generation which continued to support its dividend and share repurchase program. The fund’s ownership in shares of enterprise software products maker Oracle, computer products and services provider Hewlett-Packard, financial exchange operator CME Group (b), electrical components manufacturer Sensata Technologies Holding (b), multi-industrial company Johnson Controls, and index data provider MSCI also dampened relative results. Not holding shares of strong-performing tobacco company Philip Morris and fast food company McDonald’s also hurt relative results.
Contributors to Performance
Security selection in the technology sector contributed to relative returns, led by the fund’s ownership in shares of semiconductor manufacturer Microchip Technology and semiconductor equipment provider ASML Holding (b). Shares of ASML rose late in the period as the company benefited from increased order volume, system sales, and improving trends.
A combination of security selection and an underweight position in the basic materials sector also supported positive relative results. Not holding shares of precious metal company Freeport-McMoRan boosted relative performance as the stock underperformed the benchmark. Shares declined as workers from the company’s Indonesia mining site went on strike causing decreased production and increased costs during the reporting period. Additionally, concerns over slowing growth in China weighed on the stock.
3
Table of Contents
MFS Massachusetts Investors Growth Stock Portfolio
Management Review – continued
Elsewhere, the fund’s overweight positions in shares of global payments technology companies, Visa and MasterCard, household products company Colgate-Palmolive, facilities maintenance products supplier Grainger (h), management consulting firm Accenture, and athletic shoes and apparel manufacturer NIKE benefited relative performance. Not owning shares of poor-performing global automaker Ford, also helped.
Respectfully,
Jeffrey Constantino
Portfolio Manager
| (b) | Security is not a benchmark constituent. |
| (h) | Security was not held in the fund at period end. |
The views expressed in this report are those of the portfolio manager only through the end of the period of the report as stated on the cover and do not necessarily reflect the views of MFS or any other person in the MFS organization. These views are subject to change at any time based on market or other conditions, and MFS disclaims any responsibility to update such views. These views may not be relied upon as investment advice or an indication of trading intent on behalf of any MFS portfolio. References to specific securities are not recommendations of such securities, and may not be representative of any MFS portfolio’s current or future investments.
4
Table of Contents
MFS Massachusetts Investors Growth Stock Portfolio
PERFORMANCE SUMMARY THROUGH 12/31/11
The following chart illustrates the historical performance of the fund in comparison to its benchmark(s). Benchmarks are unmanaged and may not be invested in directly. Benchmark returns do not reflect any fees or expenses. The performance of other share classes will be greater than or less than that of the class depicted below. (See Notes to Performance Summary.)
Performance data shown represents past performance and is no guarantee of future results. Investment return and principal value fluctuate so your units, when sold, may be worth more or less than the original cost; current performance may be lower or higher than quoted. The performance shown does not reflect the deduction of taxes, if any, that a contract holder would pay on fund distributions or the redemption of contract units. The returns for the fund shown also do not reflect the deduction of expenses associated with variable products, such as mortality and expense risk charges, separate account charges, and sales charges imposed by the insurance company separate accounts. Such expenses would reduce the overall returns shown.
Growth of a Hypothetical $10,000 Investment
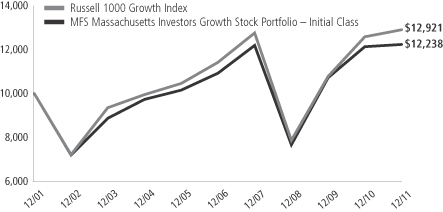
Total Returns through 12/31/11
Average annual total returns
| Share class | Class inception date | 1-yr | 5-yr | 10-yr | ||||||||
| Initial Class | 5/06/98 | 0.80% | 2.28% | 2.04% | ||||||||
| Service Class | 8/24/01 | 0.57% | 2.03% | 1.79% | ||||||||
| Comparative benchmark | ||||||||||||
| Russell 1000 Growth Index (f) | 2.64% | 2.50% | 2.60% | |||||||||
| (f) | Source: FactSet Research Systems Inc. |
Benchmark Definition
Russell 1000 Growth Index – constructed to provide a comprehensive barometer for growth securities in the large-cap segment of the U.S. equity universe. Companies in this index generally have higher price-to-book ratios and higher forecasted growth values.
It is not possible to invest directly in an index.
Notes to Performance Summary
Average annual total return represents the average annual change in value for each share class for the periods presented.
Performance results reflect any applicable expense subsidies and waivers in effect during the periods shown. Without such subsidies and waivers the fund’s performance results would be less favorable. Please see the prospectus and financial statements for complete details. All results are historical and assume the reinvestment of any dividends and capital gains distributions.
Performance results do not include adjustments made for financial reporting purposes in accordance with U.S. generally accepted accounting principles and may differ from amounts reported in the financial highlights.
From time to time the fund may receive proceeds from litigation settlements, without which performance would be lower.
5
Table of Contents
MFS Massachusetts Investors Growth Stock Portfolio
Fund Expenses Borne by the Contract Holders During the Period,
July 1, 2011 through December 31, 2011
As a contract holder of the fund, you incur ongoing costs, including management fees; distribution and/or service (12b-1) fees; and other fund expenses. This example is intended to help you understand your ongoing costs (in dollars) of investing in the fund and to compare these costs with the ongoing costs of investing in other mutual funds.
The example is based on an investment of $1,000 invested at the beginning of the period and held for the entire period July 1, 2011 through December 31, 2011.
Actual Expenses
The first line for each share class in the following table provides information about actual account values and actual expenses. You may use the information in this line, together with the amount you invested, to estimate the expenses that you paid over the period. Simply divide your account value by $1,000 (for example, an $8,600 account value divided by $1,000 = 8.6), then multiply the result by the number in the first line under the heading entitled “Expenses Paid During Period” to estimate the expenses you paid on your account during this period.
Hypothetical Example for Comparison Purposes
The second line for each share class in the following table provides information about hypothetical account values and hypothetical expenses based on the fund’s actual expense ratio and an assumed rate of return of 5% per year before expenses, which is not the fund’s actual return. The hypothetical account values and expenses may not be used to estimate the actual ending account balance or expenses you paid for the period. You may use this information to compare the ongoing costs of investing in the fund and other funds. To do so, compare this 5% hypothetical example with the 5% hypothetical examples that appear in the shareholder reports of the other funds.
Please note that the expenses shown in the table are meant to highlight the fund’s ongoing costs only and do not take into account the fees and expenses imposed under the variable contracts through which your investment in the fund is made. Therefore, the second line for each share class in the table is useful in comparing ongoing costs associated with an investment in vehicles (such as the fund) which fund benefits under variable annuity and variable life insurance contracts and to qualified pension and retirement plans only, and will not help you determine the relative total costs of investing in the fund through variable annuity and variable life insurance contracts. If the fees and expenses imposed under the variable contracts were included, your costs would have been higher.
| Share Class | Annualized Expense Ratio | Beginning Account Value 7/01/11 | Ending Account Value 12/31/11 | Expenses Paid During Period (p) 7/01/11-12/31/11 | ||||||||||||||
| Initial Class | Actual | 0.82% | $1,000.00 | $946.66 | $4.02 | |||||||||||||
| Hypothetical (h) | 0.82% | $1,000.00 | $1,021.07 | $4.18 | ||||||||||||||
| Service Class | Actual | 1.07% | $1,000.00 | $945.65 | $5.25 | |||||||||||||
| Hypothetical (h) | 1.07% | $1,000.00 | $1,019.81 | $5.45 | ||||||||||||||
| (h) | 5% class return per year before expenses. |
| (p) | Expenses paid is equal to each class’ annualized expense ratio, as shown above, multiplied by the average account value over the period, multiplied by the number of days in the period, divided by the number of days in the year. |
6
Table of Contents
MFS Massachusetts Investors Growth Stock Portfolio
PORTFOLIO OF INVESTMENTS – 12/31/11
The Portfolio of Investments is a complete list of all securities owned by your fund. It is categorized by broad-based asset classes.
| Issuer | Shares/Par | Value ($) | ||||||
| COMMON STOCKS – 99.5% | ||||||||
| Aerospace – 3.8% | ||||||||
| Precision Castparts Corp. | 23,790 | $ | 3,920,350 | |||||
| United Technologies Corp. | 223,730 | 16,352,426 | ||||||
|
| |||||||
| $ | 20,272,776 | |||||||
|
| |||||||
| Alcoholic Beverages – 0.8% | ||||||||
| Diageo PLC | 203,315 | $ | 4,440,998 | |||||
|
| |||||||
| Apparel Manufacturers – 2.8% | ||||||||
| LVMH Moet Hennessy Louis Vuitton S.A. | 38,867 | $ | 5,475,916 | |||||
| NIKE, Inc., “B” | 99,610 | 9,599,416 | ||||||
|
| |||||||
| $ | 15,075,332 | |||||||
|
| |||||||
| Automotive – 1.8% | ||||||||
| Johnson Controls, Inc. | 310,560 | $ | 9,708,106 | |||||
|
| |||||||
| Broadcasting – 1.3% | ||||||||
| Omnicom Group, Inc. | 46,070 | $ | 2,053,801 | |||||
| Viacom, Inc., “B” | 108,610 | 4,931,980 | ||||||
|
| |||||||
| $ | 6,985,781 | |||||||
|
| |||||||
| Brokerage & Asset Managers – 3.6% | ||||||||
| Charles Schwab Corp. | 450,170 | $ | 5,068,914 | |||||
| CME Group, Inc. | 24,980 | 6,086,877 | ||||||
| Franklin Resources, Inc. | 86,260 | 8,286,136 | ||||||
|
| |||||||
| $ | 19,441,927 | |||||||
|
| |||||||
| Business Services – 7.9% | ||||||||
| Accenture PLC, “A” | 236,940 | $ | 12,612,316 | |||||
| Dun & Bradstreet Corp. | 159,740 | 11,953,344 | ||||||
| MSCI, Inc., “A” (a) | 260,590 | 8,581,229 | ||||||
| Verisk Analytics, Inc., “A” (a) | 237,900 | 9,546,927 | ||||||
|
| |||||||
| $ | 42,693,816 | |||||||
|
| |||||||
| Cable TV – 1.1% | ||||||||
| DIRECTV, “A” (a) | 134,360 | $ | 5,745,234 | |||||
|
| |||||||
| Chemicals – 0.5% | ||||||||
| Monsanto Co. | 40,120 | $ | 2,811,208 | |||||
|
| |||||||
| Computer Software – 6.3% | ||||||||
| Autodesk, Inc. (a) | 224,850 | $ | 6,819,701 | |||||
| Check Point Software Technologies Ltd. (a) | 99,430 | 5,224,052 | ||||||
| Oracle Corp. | 849,470 | 21,788,906 | ||||||
|
| |||||||
| $ | 33,832,659 | |||||||
|
| |||||||
| Computer Software – Systems – 8.7% | ||||||||
| Apple, Inc. (a) | 51,820 | $ | 20,987,100 | |||||
| EMC Corp. (a) | 376,850 | 8,117,349 | ||||||
| Hewlett-Packard Co. | 217,490 | 5,602,542 | ||||||
| International Business Machines Corp. | 66,530 | 12,233,536 | ||||||
|
| |||||||
| $ | 46,940,527 | |||||||
|
| |||||||
| Consumer Products – 5.7% | ||||||||
| Church & Dwight Co., Inc. | 76,090 | $ | 3,481,878 | |||||
| Colgate-Palmolive Co. | 168,710 | 15,587,117 | ||||||
| Issuer | Shares/Par | Value ($) | ||||||
| COMMON STOCKS – continued | ||||||||
| Consumer Products – continued | ||||||||
| Procter & Gamble Co. | 175,811 | $ | 11,728,352 | |||||
|
| |||||||
| $ | 30,797,347 | |||||||
|
| |||||||
| Electrical Equipment – 8.5% | ||||||||
| Amphenol Corp., “A” | 177,280 | $ | 8,046,739 | |||||
| Danaher Corp. | 441,060 | 20,747,462 | ||||||
| Sensata Technologies Holding B.V. (a) | 372,450 | 9,787,986 | ||||||
| W.W. Grainger, Inc. | 39,900 | 7,468,881 | ||||||
|
| |||||||
| $ | 46,051,068 | |||||||
|
| |||||||
| Electronics – 5.6% | ||||||||
| ASML Holding N.V. | 163,120 | $ | 6,816,785 | |||||
| Microchip Technology, Inc. | 374,600 | 13,721,598 | ||||||
| Taiwan Semiconductor Manufacturing Co. Ltd., ADR | 768,309 | 9,918,869 | ||||||
|
| |||||||
| $ | 30,457,252 | |||||||
|
| |||||||
| Energy – Independent – 1.1% | ||||||||
| Occidental Petroleum Corp. | 64,230 | $ | 6,018,351 | |||||
|
| |||||||
| Energy – Integrated – 2.0% | ||||||||
| Chevron Corp. | 36,560 | $ | 3,889,984 | |||||
| Exxon Mobil Corp. | 81,880 | 6,940,149 | ||||||
|
| |||||||
| $ | 10,830,133 | |||||||
|
| |||||||
| Food & Beverages – 5.1% | ||||||||
| Groupe Danone | 131,847 | $ | 8,288,132 | |||||
| Mead Johnson Nutrition Co., “A” | 48,370 | 3,324,470 | ||||||
| PepsiCo, Inc. | 236,800 | 15,711,680 | ||||||
|
| |||||||
| $ | 27,324,282 | |||||||
|
| |||||||
| Food & Drug Stores – 0.7% | ||||||||
| CVS Caremark Corp. | 88,306 | $ | 3,601,119 | |||||
|
| |||||||
| General Merchandise – 3.2% | ||||||||
| Kohl’s Corp. | 152,350 | $ | 7,518,473 | |||||
| Target Corp. | 194,490 | 9,961,778 | ||||||
|
| |||||||
| $ | 17,480,251 | |||||||
|
| |||||||
| Internet – 4.3% | ||||||||
| eBay, Inc. (a) | 113,510 | $ | 3,442,758 | |||||
| Google, Inc., “A” (a) | 30,810 | 19,900,179 | ||||||
|
| |||||||
| $ | 23,342,937 | |||||||
|
| |||||||
| Major Banks – 0.5% | ||||||||
| Bank of New York Mellon Corp. | 125,869 | $ | 2,506,052 | |||||
|
| |||||||
| Medical & Health Technology & Services – 1.9% | ||||||||
| Medco Health Solutions, Inc. (a) | 65,000 | $ | 3,633,500 | |||||
| Patterson Cos., Inc. | 225,322 | 6,651,505 | ||||||
|
| |||||||
| $ | 10,285,005 | |||||||
|
| |||||||
| Medical Equipment – 6.8% | ||||||||
| Becton, Dickinson & Co. | 114,190 | $ | 8,532,277 | |||||
| DENTSPLY International, Inc. | 124,430 | 4,353,806 | ||||||
7
Table of Contents
MFS Massachusetts Investors Growth Stock Portfolio
Portfolio of Investments – continued
| Issuer | Shares/Par | Value ($) | ||||||
| COMMON STOCKS – continued | ||||||||
| Medical Equipment – continued | ||||||||
| Medtronic, Inc. | 76,230 | $ | 2,915,798 | |||||
| St. Jude Medical, Inc. | 125,020 | 4,288,186 | ||||||
| Thermo Fisher Scientific, Inc. (a) | 265,940 | 11,959,322 | ||||||
| Waters Corp. (a) | 61,030 | 4,519,272 | ||||||
|
| |||||||
| $ | 36,568,661 | |||||||
|
| |||||||
| Metals & Mining – 0.7% | ||||||||
| BHP Billiton Ltd., ADR | 53,960 | $ | 3,811,195 | |||||
|
| |||||||
| Network & Telecom – 1.2% | ||||||||
| Cisco Systems, Inc. | 351,987 | $ | 6,363,925 | |||||
|
| |||||||
| Oil Services – 4.0% | ||||||||
| National Oilwell Varco, Inc. | 105,140 | $ | 7,148,469 | |||||
| Schlumberger Ltd. | 208,480 | 14,241,269 | ||||||
|
| |||||||
| $ | 21,389,738 | |||||||
|
| |||||||
| Other Banks & Diversified Financials – 4.3% | ||||||||
| MasterCard, Inc., “A” | 21,520 | $ | 8,023,086 | |||||
| Visa, Inc., “A” | 147,720 | 14,998,012 | ||||||
|
| |||||||
| $ | 23,021,098 | |||||||
|
| |||||||
| Pharmaceuticals – 2.3% | ||||||||
| Abbott Laboratories | 67,880 | $ | 3,816,892 | |||||
| Allergan, Inc. | 36,690 | 3,219,181 | ||||||
| Johnson & Johnson | 78,250 | 5,131,635 | ||||||
|
| |||||||
| $ | 12,167,708 | |||||||
|
| |||||||
| Railroad & Shipping – 0.5% | ||||||||
| Kuehne & Nagel, Inc. AG | 24,970 | $ | 2,794,729 | |||||
|
| |||||||
| Issuer | Shares/Par | Value ($) | ||||||
| COMMON STOCKS – continued | ||||||||
| Specialty Chemicals – 1.8% | ||||||||
| Praxair, Inc. | 92,550 | $ | 9,893,595 | |||||
|
| |||||||
| Specialty Stores – 0.7% | ||||||||
| Industria de Diseno Textil S.A. | 43,293 | $ | 3,537,169 | |||||
|
| |||||||
| Total Common Stocks (Identified Cost, $487,165,303) | $ | 536,189,979 | ||||||
|
| |||||||
| MONEY MARKET FUNDS – 0.5% | ||||||||
| MFS Institutional Money Market Portfolio, 0.05%, at Cost and Net Asset Value (v) | 2,902,318 | $ | 2,902,318 | |||||
|
| |||||||
| Total Investments (Identified Cost, $490,067,621) | $ | 539,092,297 | ||||||
|
| |||||||
| OTHER ASSETS, LESS LIABILITIES – 0.0% | 11,536 | |||||||
|
| |||||||
| Net Assets – 100.0% | $ | 539,103,833 | ||||||
|
| |||||||
| (a) | Non-income producing security. |
| (v) | Underlying affiliated fund that is available only to investment companies managed by MFS. The rate quoted for the MFS Institutional Money Market Portfolio is the annualized seven-day yield of the fund at period end. |
The following abbreviations are used in this report and are defined:
| ADR | American Depository Receipt |
| PLC | Public Limited Company |
See Notes to Financial Statements
8
Table of Contents
MFS Massachusetts Investors Growth Stock Portfolio
FINANCIAL STATEMENTS | STATEMENT OF ASSETS AND LIABILITIES
This statement represents your fund’s balance sheet, which details the assets and liabilities comprising the total value of the fund.
At 12/31/11 | ||||||||
Assets | ||||||||
Investments – | ||||||||
Non-affiliated issuers, at value (identified cost, $487,165,303) | $536,189,979 | |||||||
Underlying affiliated funds, at cost and value | 2,902,318 | |||||||
Total investments, at value (identified cost, $490,067,621) | $539,092,297 | |||||||
Cash | 175,120 | |||||||
Receivables for | ||||||||
Fund shares sold | 18,892 | |||||||
Interest and dividends | 516,981 | |||||||
Other assets | 14,173 | |||||||
Total assets | $539,817,463 | |||||||
Liabilities | ||||||||
Payable for fund shares reacquired | $603,021 | |||||||
Payable to affiliates | ||||||||
Investment adviser | 32,895 | |||||||
Distribution and/or service fees | 1,103 | |||||||
Payable for Trustees’ compensation | 881 | |||||||
Accrued expenses and other liabilities | 75,730 | |||||||
Total liabilities | $713,630 | |||||||
Net assets | $539,103,833 | |||||||
Net assets consist of | ||||||||
Paid-in capital | $572,264,786 | |||||||
Unrealized appreciation (depreciation) on investments and translation of assets and liabilities in foreign currencies | 49,038,185 | |||||||
Accumulated net realized gain (loss) on investments and foreign currency transactions | (84,303,628 | ) | ||||||
Undistributed net investment income | 2,104,490 | |||||||
Net assets | $539,103,833 | |||||||
Shares of beneficial interest outstanding | 47,128,787 |
| Net assets | Shares outstanding | Net asset value per share | ||||||||||
Initial Class | $485,483,738 | 42,410,860 | $11.45 | |||||||||
Service Class | 53,620,095 | 4,717,927 | 11.37 | |||||||||
See Notes to Financial Statements
9
Table of Contents
MFS Massachusetts Investors Growth Stock Portfolio
FINANCIAL STATEMENTS | STATEMENT OF OPERATIONS
This statement describes how much your fund earned in investment income and accrued in expenses. It also describes any gains and/or losses generated by fund operations.
| Year ended 12/31/11 | ||||||||
Net investment income | ||||||||
Income | ||||||||
Dividends | $6,289,110 | |||||||
Interest | 26,212 | |||||||
Dividends from underlying affiliated funds | 5,076 | |||||||
Foreign taxes withheld | (152,169 | ) | ||||||
Total investment income | $6,168,229 | |||||||
Expenses | ||||||||
Management fee | $3,573,285 | |||||||
Distribution and/or service fees | 154,687 | |||||||
Administrative services fee | 158,792 | |||||||
Trustees’ compensation | 56,942 | |||||||
Custodian fee | 65,644 | |||||||
Shareholder communications | 21,231 | |||||||
Auditing fees | 49,158 | |||||||
Legal fees | 5,567 | |||||||
Miscellaneous | 40,062 | |||||||
Total expenses | $4,125,368 | |||||||
Fees paid indirectly | (4 | ) | ||||||
Reduction of expenses by investment adviser | (57,531 | ) | ||||||
Net expenses | $4,067,833 | |||||||
Net investment income | $2,100,396 | |||||||
Realized and unrealized gain (loss) on investments and foreign currency transactions | ||||||||
Realized gain (loss) (identified cost basis) | ||||||||
Investment transactions | $29,331,825 | |||||||
Foreign currency transactions | 5,239 | |||||||
Net realized gain (loss) on investments and foreign currency transactions | $29,337,064 | |||||||
Change in unrealized appreciation (depreciation) | ||||||||
Investments | $(28,672,382 | ) | ||||||
Translation of assets and liabilities in foreign currencies | 2,901 | |||||||
Net unrealized gain (loss) on investments and foreign currency translation | $(28,669,481 | ) | ||||||
Net realized and unrealized gain (loss) on investments and foreign currency | $667,583 | |||||||
Change in net assets from operations | $2,767,979 |
See Notes to Financial Statements
10
Table of Contents
MFS Massachusetts Investors Growth Stock Portfolio
FINANCIAL STATEMENTS | STATEMENTS OF CHANGES IN NET ASSETS
These statements describe the increases and/or decreases in net assets resulting from operations, any distributions, and any shareholder transactions.
For years ended 12/31 | 2011 | 2010 | ||||||
Change in net assets | ||||||||
From operations | ||||||||
Net investment income | $2,100,396 | $2,495,992 | ||||||
Net realized gain (loss) on investments and foreign currency transactions | 29,337,064 | 43,648,942 | ||||||
Net unrealized gain (loss) on investments and foreign currency translation | (28,669,481 | ) | 12,944,631 | |||||
Change in net assets from operations | $2,767,979 | $59,089,565 | ||||||
Distributions declared to shareholders | ||||||||
From net investment income | $(2,503,255 | ) | $(1,353,058 | ) | ||||
Change in net assets from fund share transactions | $39,199,459 | $(86,698,840 | ) | |||||
Total change in net assets | $39,464,183 | $(28,962,333 | ) | |||||
Net assets | ||||||||
At beginning of period | 499,639,650 | 528,601,983 | ||||||
At end of period (including undistributed net investment income of $2,104,490 and | $539,103,833 | $499,639,650 |
See Notes to Financial Statements
11
Table of Contents
MFS Massachusetts Investors Growth Stock Portfolio
FINANCIAL STATEMENTS | FINANCIAL HIGHLIGHTS
The financial highlights table is intended to help you understand the fund’s financial performance for the past 5 years. Certain information reflects financial results for a single fund share. The total returns in the table represent the rate by which an investor would have earned (or lost) on an investment in the fund share class (assuming reinvestment of all distributions) held for the entire period.
| Initial Class | Years ended 12/31 | |||||||||||||||||||
| 2011 | 2010 | 2009 | 2008 | 2007 | ||||||||||||||||
Net asset value, beginning of period | $11.43 | $10.13 | $7.30 | $11.69 | $10.52 | |||||||||||||||
| Income (loss) from investment operations | ||||||||||||||||||||
Net investment income (d) | $0.06 | $0.06 | $0.05 | $0.06 | $0.05 | |||||||||||||||
Net realized and unrealized gain (loss) on investments | 0.03 | 1.27 | 2.85 | (4.39 | ) | 1.16 | ||||||||||||||
Total from investment operations | $0.09 | $1.33 | $2.90 | $(4.33 | ) | $1.21 | ||||||||||||||
| Less distributions declared to shareholders | ||||||||||||||||||||
From net investment income | $(0.07 | ) | $(0.03 | ) | $(0.07 | ) | $(0.06 | ) | $(0.04 | ) | ||||||||||
Net asset value, end of period (x) | $11.45 | $11.43 | $10.13 | $7.30 | $11.69 | |||||||||||||||
Total return (%) (k)(r)(s)(x) | 0.80 | 13.15 | 40.14 | (37.22 | ) | 11.53 | ||||||||||||||
| Ratios (%) (to average net assets) and Supplemental data: | ||||||||||||||||||||
Expenses before expense reductions (f) | 0.83 | 0.86 | 0.87 | 0.86 | 0.84 | |||||||||||||||
Expenses after expense reductions (f) | 0.82 | 0.82 | 0.82 | 0.83 | 0.83 | |||||||||||||||
Net investment income | 0.47 | 0.55 | 0.62 | 0.62 | 0.48 | |||||||||||||||
Portfolio turnover | 24 | 45 | 53 | 42 | 62 | |||||||||||||||
Net assets at end of period (000 omitted) | $485,484 | $429,925 | $448,333 | $145,858 | $309,208 | |||||||||||||||
See Notes to Financial Statements
12
Table of Contents
MFS Massachusetts Investors Growth Stock Portfolio
Financial Highlights – continued
| Service Class | Years ended 12/31 | |||||||||||||||||||
| 2011 | 2010 | 2009 | 2008 | 2007 | ||||||||||||||||
Net asset value, beginning of period | $11.34 | $10.06 | $7.24 | $11.59 | $10.43 | |||||||||||||||
| Income (loss) from investment operations | ||||||||||||||||||||
Net investment income (d) | $0.03 | $0.03 | $0.04 | $0.04 | $0.02 | |||||||||||||||
Net realized and unrealized gain (loss) on investments | 0.03 | 1.26 | 2.82 | (4.36 | ) | 1.15 | ||||||||||||||
Total from investment operations | $0.06 | $1.29 | $2.86 | $(4.32 | ) | $1.17 | ||||||||||||||
| Less distributions declared to shareholders | ||||||||||||||||||||
From net investment income | $(0.03 | ) | $(0.01 | ) | $(0.04 | ) | $(0.03 | ) | $(0.01 | ) | ||||||||||
Net asset value, end of period (x) | $11.37 | $11.34 | $10.06 | $7.24 | $11.59 | |||||||||||||||
Total return (%) (k)(r)(s)(x) | 0.57 | 12.83 | 39.78 | (37.35 | ) | 11.26 | ||||||||||||||
| Ratios (%) (to average net assets) and Supplemental data: | ||||||||||||||||||||
Expenses before expense reductions (f) | 1.08 | 1.11 | 1.12 | 1.11 | 1.09 | |||||||||||||||
Expenses after expense reductions (f) | 1.07 | 1.07 | 1.07 | 1.08 | 1.08 | |||||||||||||||
Net investment income | 0.22 | 0.30 | 0.43 | 0.37 | 0.19 | |||||||||||||||
Portfolio turnover | 24 | 45 | 53 | 42 | 62 | |||||||||||||||
Net assets at end of period (000 omitted) | $53,620 | $69,714 | $80,269 | $59,579 | $119,324 | |||||||||||||||
| (d) | Per share data is based on average shares outstanding. |
| (f) | Ratios do not reflect reductions from fees paid indirectly, if applicable. |
| (k) | The total return does not reflect expenses that apply to separate accounts. Inclusion of these charges would reduce the total return figures for all periods shown. |
| (r) | Certain expenses have been reduced without which performance would have been lower. |
| (s) | From time to time the fund may receive proceeds from litigation settlements, without which performance would be lower. Excluding the effect of the proceeds received from a non-recurring litigation settlement against Tyco International Ltd., the Initial Class and Service Class total returns for the year ended December 31, 2010 would have each been lower by approximately 0.63%. |
| (x) | The net asset values per share and total returns have been calculated on net assets which include adjustments made in accordance with U.S. generally accepted accounting principles required at period end for financial reporting purposes. |
See Notes to Financial Statements
13
Table of Contents
MFS Massachusetts Investors Growth Stock Portfolio
| (1) | Business and Organization |
MFS Massachusetts Investors Growth Stock Portfolio (the fund) is a series of MFS Variable Insurance Trust II (the trust). The trust is organized as a Massachusetts business trust and is registered under the Investment Company Act of 1940, as amended, as an open-end management investment company. The shareholders of each series of the trust are separate accounts of insurance companies, which offer variable annuity and/or life insurance products, and qualified retirement and pension plans.
| (2) | Significant Accounting Policies |
General – The preparation of financial statements in conformity with U.S. generally accepted accounting principles requires management to make estimates and assumptions that affect the reported amounts of assets and liabilities, and disclosure of contingent assets and liabilities at the date of the financial statements and the reported amounts of revenues and expenses during the reporting period. Actual results could differ from those estimates. In the preparation of these financial statements, management has evaluated subsequent events occurring after the date of the fund’s Statement of Assets and Liabilities through the date that the financial statements were issued.
In December 2011, the Financial Accounting Standards Board issued Accounting Standards Update 2011-11, Balance Sheet (Topic 210) – Disclosures about Offsetting Assets and Liabilities (“ASU 2011-11”). Effective for annual reporting periods beginning on or after January 1, 2013 and interim periods within those annual periods, ASU 2011-11 is intended to enhance disclosure requirements on the offsetting of financial assets and liabilities. Although still evaluating the potential impacts of ASU 2011-11 to the fund, management expects that the impact of the fund’s adoption will be limited to additional financial statement disclosures.
Investment Valuations – Equity securities, including restricted equity securities, are generally valued at the last sale or official closing price as provided by a third-party pricing service on the market or exchange on which they are primarily traded. Equity securities, for which there were no sales reported that day, are generally valued at the last quoted daily bid quotation as provided by a third-party pricing service on the market or exchange on which such securities are primarily traded. Equity securities held short, for which there were no sales reported for that day, are generally valued at the last quoted daily ask quotation as provided by a third-party pricing service on the market or exchange on which such securities are primarily traded. Short-term instruments with a maturity at issuance of 60 days or less generally are valued at amortized cost, which approximates market value. Open-end investment companies are generally valued at net asset value per share. Securities and other assets generally valued on the basis of information from a third-party pricing service may also be valued at a broker/dealer bid quotation. Values obtained from third-party pricing services can utilize both transaction data and market information such as yield, quality, coupon rate, maturity, type of issue, trading characteristics, and other market data. The values of foreign securities and other assets and liabilities expressed in foreign currencies are converted to U.S. dollars using the mean of bid and asked prices for rates provided by a third-party pricing service.
The Board of Trustees has delegated primary responsibility for determining or causing to be determined the value of the fund’s investments (including any fair valuation) to the adviser pursuant to valuation policies and procedures approved by the Board. If the adviser determines that reliable market quotations are not readily available, investments are valued at fair value as determined in good faith by the adviser in accordance with such procedures under the oversight of the Board of Trustees. Under the fund’s valuation policies and procedures, market quotations are not considered to be readily available for most types of debt instruments and floating rate loans and many types of derivatives. These investments are generally valued at fair value based on information from third-party pricing services. In addition, investments may be valued at fair value if the adviser determines that an investment’s value has been materially affected by events occurring after the close of the exchange or market on which the investment is principally traded (such as foreign exchange or market) and prior to the determination of the fund’s net asset value, or after the halting of trading of a specific security where trading does not resume prior to the close of the exchange or market on which the security is principally traded. Events that occur on a frequent basis after foreign markets close (such as developments in foreign markets and significant movements in the U.S. markets) and prior to the determination of the fund’s net asset value may be deemed to have a material effect on the value of securities traded in foreign markets. Accordingly, the fund’s foreign equity securities may often be valued at fair value. The adviser generally relies on third-party pricing services or other information (such as the correlation with price movements of similar securities in the same or other markets; the type, cost and investment characteristics of the security; the business and financial condition of the issuer; and trading and other market data) to assist in determining whether to fair value and at what value to fair value an investment. The value of an investment for purposes of calculating the fund’s net asset value can differ depending on the source and method used to determine value. When fair valuation is used, the value of an investment used to determine the fund’s net asset value may differ from quoted or published prices for the same investment. There can be no assurance that the fund could obtain the fair value assigned to an investment if it were to sell the investment at the same time at which the fund determines its net asset value per share.
14
Table of Contents
MFS Massachusetts Investors Growth Stock Portfolio
Notes to Financial Statements – continued
Various inputs are used in determining the value of the fund’s assets or liabilities. These inputs are categorized into three broad levels. In certain cases, the inputs used to measure fair value may fall into different levels of the fair value hierarchy. In such cases, an investment’s level within the fair value hierarchy is based on the lowest level of input that is significant to the fair value measurement. The fund’s assessment of the significance of a particular input to the fair value measurement in its entirety requires judgment, and considers factors specific to the investment. Level 1 includes unadjusted quoted prices in active markets for identical assets or liabilities. Level 2 includes other significant observable market-based inputs (including quoted prices for similar securities, interest rates, prepayment speed, and credit risk). Level 3 includes unobservable inputs, which may include the adviser’s own assumptions in determining the fair value of investments. The following is a summary of the levels used as of December 31, 2011 in valuing the fund’s assets or liabilities:
| Investments at Value | Level 1 | Level 2 | Level 3 | Total | ||||||||||||
| Equity Securities: | ||||||||||||||||
United States | $485,882,134 | $— | $— | $485,882,134 | ||||||||||||
France | 8,288,132 | 5,475,916 | — | 13,764,048 | ||||||||||||
Taiwan | 9,918,869 | — | — | 9,918,869 | ||||||||||||
Netherlands | 6,816,785 | — | — | 6,816,785 | ||||||||||||
Israel | 5,224,052 | — | — | 5,224,052 | ||||||||||||
United Kingdom | 4,440,998 | — | — | 4,440,998 | ||||||||||||
Australia | 3,811,195 | — | — | 3,811,195 | ||||||||||||
Spain | — | 3,537,169 | — | 3,537,169 | ||||||||||||
Switzerland | — | 2,794,729 | — | 2,794,729 | ||||||||||||
| Mutual Funds | 2,902,318 | — | — | 2,902,318 | ||||||||||||
| Total Investments | $527,284,483 | $11,807,814 | $— | $539,092,297 | ||||||||||||
For further information regarding security characteristics, see the Portfolio of Investments.
Foreign Currency Translation – Purchases and sales of foreign investments, income, and expenses are converted into U.S. dollars based upon currency exchange rates prevailing on the respective dates of such transactions or on the reporting date for foreign denominated receivables and payables. Gains and losses attributable to foreign currency exchange rates on sales of securities are recorded for financial statement purposes as net realized gains and losses on investments. Gains and losses attributable to foreign exchange rate movements on receivables, payables, income and expenses are recorded for financial statement purposes as foreign currency transaction gains and losses. That portion of both realized and unrealized gains and losses on investments that results from fluctuations in foreign currency exchange rates is not separately disclosed.
Security Loans – State Street Bank and Trust Company (“State Street”), as lending agent, loans the securities of the fund to certain qualified institutions (the “Borrowers”) approved by the fund. The loans are collateralized by cash and/or U.S. Treasury and federal agency obligations in an amount typically at least equal to the market value of the securities loaned. The market value of the loaned securities is determined at the close of business of the fund and any additional required collateral is delivered to the fund on the next business day. State Street provides the fund with indemnification against Borrower default. The fund bears the risk of loss with respect to the investment of cash collateral. On loans collateralized by cash, the cash collateral is invested in a money market fund or short-term securities. A portion of the income generated upon investment of the collateral is remitted to the Borrowers, and the remainder is allocated between the fund and the lending agent. On loans collateralized by U.S. Treasury and/or federal agency obligations, a fee is received from the Borrower, and is allocated between the fund and the lending agent. Income from securities lending is included in interest income on the Statement of Operations. The dividend and interest income earned on the securities loaned is accounted for in the same manner as other dividend and interest income.
Indemnifications – Under the fund’s organizational documents, its officers and Trustees may be indemnified against certain liabilities and expenses arising out of the performance of their duties to the fund. Additionally, in the normal course of business, the fund enters into agreements with service providers that may contain indemnification clauses. The fund’s maximum exposure under these agreements is unknown as this would involve future claims that may be made against the fund that have not yet occurred.
Investment Transactions and Income – Investment transactions are recorded on the trade date. Interest income is recorded on the accrual basis. Dividends received in cash are recorded on the ex-dividend date. Certain dividends from foreign securities will be recorded when the fund is informed of the dividend if such information is obtained subsequent to the ex-dividend date. Dividend and interest payments received in additional securities are recorded on the ex-dividend or ex-interest date in an amount equal to the value of the security on such date.
15
Table of Contents
MFS Massachusetts Investors Growth Stock Portfolio
Notes to Financial Statements – continued
The fund may receive proceeds from litigation settlements. Any proceeds received from litigation involving portfolio holdings are reflected in the Statement of Operations in realized gain/loss if the security has been disposed of by the fund or in unrealized gain/loss if the security is still held by the fund. Any other proceeds from litigation not related to portfolio holdings are reflected as other income in the Statement of Operations.
Fees Paid Indirectly – The fund’s custody fee may be reduced according to an arrangement that measures the value of cash deposited with the custodian by the fund. This amount, for the year ended December 31, 2011, is shown as a reduction of total expenses on the Statement of Operations.
Tax Matters and Distributions – The fund intends to qualify as a regulated investment company, as defined under Subchapter M of the Internal Revenue Code, and to distribute all of its taxable income, including realized capital gains. As a result, no provision for federal income tax is required. The fund’s federal tax returns for the prior three fiscal years remain subject to examination by the Internal Revenue Service. Foreign taxes have been accrued by the fund in the accompanying financial statements.
Distributions to shareholders are recorded on the ex-dividend date. Income and capital gain distributions are determined in accordance with income tax regulations, which may differ from U.S. generally accepted accounting principles. Certain capital accounts in the financial statements are periodically adjusted for permanent differences in order to reflect their tax character. These adjustments have no impact on net assets or net asset value per share. Temporary differences which arise from recognizing certain items of income, expense, gain or loss in different periods for financial statement and tax purposes will reverse at some time in the future. Distributions in excess of net investment income or net realized gains are temporary overdistributions for financial statement purposes resulting from differences in the recognition or classification of income or distributions for financial statement and tax purposes.
Book/tax differences primarily relate to wash sale loss deferrals.
The tax character of distributions declared to shareholders for the last two fiscal years is as follows:
| 12/31/11 | 12/31/10 | |||||||
| Ordinary income (including any short-term capital gains) | $2,503,255 | $1,353,058 | ||||||
The federal tax cost and the tax basis components of distributable earnings were as follows:
| As of 12/31/11 | ||||
| Cost of investments | $490,381,353 | |||
| Gross appreciation | 75,492,790 | |||
| Gross depreciation | (26,781,846 | ) | ||
| Net unrealized appreciation (depreciation) | $48,710,944 | |||
| Undistributed ordinary income | 2,104,490 | |||
| Capital loss carryforwards | (83,989,896 | ) | ||
| Other temporary differences | 13,509 |
Under the Regulated Investment Company Modernization Act of 2010 (the “Act”), net capital losses recognized after December 31, 2010 may be carried forward indefinitely, and their character is retained as short-term and/or long-term losses. Previously, net capital losses were carried forward for eight years and treated as short-term losses. As a transition rule, the Act requires that post-enactment net capital losses be used before pre-enactment net capital losses.
As of December 31, 2011, the fund had capital loss carryforwards available to offset future realized gains. Such losses expire as follows:
| Pre-enactment losses: | ||||
| 12/31/15 | $(23,309,924 | ) | ||
| 12/31/16 | (51,745,133 | ) | ||
| 12/31/17 | (8,934,839 | ) | ||
| Total | $(83,989,896 | ) |
The availability of a portion of the capital loss carryforwards, which were acquired on December 4, 2009 in connection with the MFS Capital Appreciation Portfolio merger, may be limited in a given year.
Multiple Classes of Shares of Beneficial Interest – The fund offers multiple classes of shares, which differ in their respective distribution and/or service fees. The fund’s income, realized and unrealized gain (loss), and common expenses are allocated to shareholders based on the daily net assets of each class. Dividends are declared separately for each class. Differences in per
16
Table of Contents
MFS Massachusetts Investors Growth Stock Portfolio
Notes to Financial Statements – continued
share dividend rates are generally due to differences in separate class expenses. The fund’s distributions declared to shareholders as reported on the Statements of Changes in Net Assets are presented by class as follows:
| From net investment income | ||||||||
| Year ended 12/31/11 | Year ended 12/31/10 | |||||||
| Initial Class | $2,330,869 | $1,281,103 | ||||||
| Service Class | 172,386 | 71,955 | ||||||
| Total | $2,503,255 | $1,353,058 | ||||||
| (3) | Transactions with Affiliates |
Investment Adviser – The fund has an investment advisory agreement with MFS to provide overall investment management and related administrative services and facilities to the fund. The management fee is computed daily and paid monthly at an annual rate of 0.75% of the fund’s average daily net assets. The investment adviser has agreed in writing to reduce its management fee to 0.65% of average daily net assets in excess of $1 billion. This written agreement terminated on December 31, 2011. For the year ended December 31, 2011, the fund’s average daily net assets did not exceed $1 billion and therefore, the management fee was not reduced. The management fee incurred for the year ended December 31, 2011 was equivalent to an annual effective rate of 0.75% of the fund’s average daily net assets.
On December 1, 2011, shareholders of the fund approved a new investment advisory agreement between the trust, on behalf of the fund, and MFS. This new investment advisory agreement provides that effective January 1, 2012, the management fee is computed daily and paid monthly at the following annual rates:
| First $1 billion of average daily net assets | 0.75% | |||
| Average daily net assets in excess of $1 billion | 0.65% |
The investment adviser has agreed in writing to pay a portion of the fund’s total annual operating expenses, exclusive of interest, taxes, extraordinary expenses, brokerage and transaction costs, and investment-related expenses, such that the total annual operating expenses do not exceed 0.82% of average daily net assets for the Initial Class shares and 1.07% of average daily net assets for the Service Class shares. This written agreement will continue until April 30, 2013. For the year ended December 31, 2011, this reduction amounted to $57,531 and is reflected as a reduction of total expenses in the Statement of Operations.
Distributor – MFS Fund Distributors, Inc. (MFD), a wholly-owned subsidiary of MFS, is the distributor of shares of the fund. The Trustees have adopted a distribution plan for the Service Class shares pursuant to Rule 12b-1 under the Investment Company Act of 1940.
The fund’s distribution plan provides that the fund will pay MFD distribution and/or service fees equal to 0.25% per annum of its average daily net assets attributable to Service Class shares as partial consideration for services performed and expenses incurred by MFD and financial intermediaries (including participating insurance companies that invest in the fund to fund variable annuity and variable life insurance contracts, sponsors of qualified retirement and pension plans that invest in the fund, and affiliates of these participating insurance companies and plan sponsors) in connection with the sale and distribution of the Service Class shares. MFD may subsequently pay all, or a portion, of the distribution and/or service fees to financial intermediaries.
Shareholder Servicing Agent – MFS Service Center, Inc. (MFSC), a wholly-owned subsidiary of MFS, has contracted to provide transfer agent and recordkeeping functions in connection with the issuance, transfer, and redemption of each class of shares of the fund under a Shareholder Servicing Agent Agreement. During the year ended December 31, 2011, the fund did not pay MFSC a fee for this service.
Administrator – MFS provides certain financial, legal, shareholder communications, compliance, and other administrative services to the fund. Under an administrative services agreement, the fund partially reimburses MFS the costs incurred to provide these services. The fund is charged an annual fixed amount of $17,500 plus a fee based on average daily net assets. The administrative services fee incurred for the year ended December 31, 2011 was equivalent to an annual effective rate of 0.0333% of the fund’s average daily net assets.
Trustees’ and Officers’ Compensation – The fund pays compensation to Trustees in the form of a retainer, attendance fees, and additional compensation to the Board chairperson. The fund does not pay compensation directly to officers of the fund who are also officers of the investment adviser, all of whom receive remuneration for their services to the fund from MFS. Certain officers of the fund are officers or directors of MFS, MFD, and MFSC.
Other – This fund and certain other funds managed by MFS (the funds) have entered into services agreements (the Agreements) which provide for payment of fees by the funds to Tarantino LLC and Griffin Compliance LLC in return for the provision of
17
Table of Contents
MFS Massachusetts Investors Growth Stock Portfolio
Notes to Financial Statements – continued
services of an Independent Chief Compliance Officer (ICCO) and Assistant ICCO, respectively, for the funds. The ICCO and Assistant ICCO are officers of the funds and the sole members of Tarantino LLC and Griffin Compliance LLC, respectively. The funds can terminate the Agreements with Tarantino LLC and Griffin Compliance LLC at any time under the terms of the Agreements. MFS has agreed to bear all expenses associated with office space, other administrative support, and supplies provided to the ICCO and Assistant ICCO. For the year ended December 31, 2011, the aggregate fees paid by the fund to Tarantino LLC and Griffin Compliance LLC were $7,803 and are included in miscellaneous expense on the Statement of Operations.
The fund invests in the MFS Institutional Money Market Portfolio which is managed by MFS and seeks a high level of current income consistent with preservation of capital and liquidity. Income earned on this investment is included in dividends from underlying affiliated funds on the Statement of Operations. This money market fund does not pay a management fee to MFS.
| (4) | Portfolio Securities |
Purchases and sales of investments, other than U.S. Government securities, purchased option transactions, and short-term obligations, aggregated $116,325,660 and $191,917,884, respectively. Purchases exclude the value of securities acquired in connection with the Capital Appreciation Variable Account merger (See Note 8.)
| (5) | Shares of Beneficial Interest |
The fund’s Declaration of Trust permits the Trustees to issue an unlimited number of full and fractional shares of beneficial interest. Transactions in fund shares were as follows:
| Year ended 12/31/11 | Year ended 12/31/10 | |||||||||||||||
| Shares | Amount | Shares | Amount | |||||||||||||
| Shares sold | ||||||||||||||||
Initial Class | 276,271 | $3,177,926 | 260,261 | $2,595,367 | ||||||||||||
Service Class | 98,650 | 1,129,009 | 191,998 | 1,918,108 | ||||||||||||
| 374,921 | $4,306,935 | 452,259 | $4,513,475 | |||||||||||||
| Shares issued in connection with acquisition of Capital Appreciation Variable Account | ||||||||||||||||
Initial Class | 10,255,347 | $119,581,797 | ||||||||||||||
| Shares issued to shareholders in reinvestment of distributions | ||||||||||||||||
Initial Class | 209,422 | $2,330,869 | 119,617 | $1,281,103 | ||||||||||||
Service Class | 15,586 | 172,386 | 6,756 | 71,955 | ||||||||||||
| 225,008 | $2,503,255 | 126,373 | $1,353,058 | |||||||||||||
| Shares reacquired | ||||||||||||||||
Initial Class | (5,943,995 | ) | $(69,272,697 | ) | (7,026,510 | ) | $(71,724,639 | ) | ||||||||
Service Class | (1,543,209 | ) | (17,919,831 | ) | (2,033,549 | ) | (20,840,734 | ) | ||||||||
| (7,487,204 | ) | $(87,192,528 | ) | (9,060,059 | ) | $(92,565,373 | ) | |||||||||
| Net change | ||||||||||||||||
Initial Class | 4,797,045 | $55,817,895 | (6,646,632 | ) | $(67,848,169 | ) | ||||||||||
Service Class | (1,428,973 | ) | (16,618,436 | ) | (1,834,795 | ) | (18,850,671 | ) | ||||||||
| 3,368,072 | $39,199,459 | (8,481,427 | ) | $(86,698,840 | ) | |||||||||||
| (6) | Line of Credit |
The fund and certain other funds managed by MFS participate in a $1.1 billion unsecured committed line of credit, subject to a $1 billion sublimit, provided by a syndication of banks under a credit agreement. Borrowings may be made for temporary financing needs. Interest is charged to each fund, based on its borrowings, generally at a rate equal to the higher of the Federal Reserve funds rate or one month LIBOR plus an agreed upon spread. A commitment fee, based on the average daily, unused portion of the committed line of credit, is allocated among the participating funds at the end of each calendar quarter. In addition, the fund and other funds managed by MFS have established unsecured uncommitted borrowing arrangements with certain banks for temporary financing needs. Interest is charged to each fund, based on its borrowings, at a rate equal to the Federal Reserve funds rate plus an agreed upon spread. For the year ended December 31, 2011, the fund’s commitment fee and interest expense were $3,629 and $0, respectively, and are included in miscellaneous expense on the Statement of Operations.
18
Table of Contents
MFS Massachusetts Investors Growth Stock Portfolio
Notes to Financial Statements – continued
| (7) | Transactions in Underlying Affiliated Funds – Affiliated Issuers |
An affiliated issuer may be considered one in which the fund owns 5% or more of the outstanding voting securities, or a company which is under common control. For the purposes of this report, the fund assumes the following to be affiliated issuers:
| Underlying Affiliated Funds | Beginning Shares/Par Amount | Acquisitions Shares/Par Amount | Dispositions Shares/Par Amount | Ending Shares/Par Amount | ||||||||||||
| MFS Institutional Money Market Portfolio | 5,979,449 | 72,234,524 | (75,311,655 | ) | 2,902,318 | |||||||||||
| Underlying Affiliated Funds | Realized Gain (Loss) | Capital Gain Distributions | Dividend Income | Ending Value | ||||||||||||
| MFS Institutional Money Market Portfolio | $— | $— | $5,076 | $2,902,318 | ||||||||||||
| (8) | Acquisitions |
At the close of business on December 2, 2011, the fund with net assets of $439,145,630, acquired all of the investment-related assets and liabilities of Capital Appreciation Variable Account. The acquisition was part of a transaction in which the Capital Appreciation Variable Account was converted into a unit investment trust (“UIT”) that invests in the fund (the acquisition of the Account’s assets and liabilities and subsequent conversion into a UIT hereinafter referred to as the “Reorganization”). The Reorganization provided the contract owners of the Capital Appreciation Variable Account with the opportunity to participate in a larger combined portfolio with an identical investment objective and similar investment policies and strategies. The acquisition was accomplished by a tax-free exchange of 10,255,347 shares of the fund (valued at $119,581,797) for all of the investment-related assets and liabilities of Capital Appreciation Variable Account. Capital Appreciation Variable Account’s net assets on that date were $119,581,797, including investments valued at $119,481,954 with a cost basis of $100,293,081. For financial reporting purposes, assets received and shares issued by the fund were recorded at fair value; however, the cost basis of the investments received from Capital Appreciation Variable Account were carried forward to align ongoing reporting of the fund’s realized and unrealized gains and losses with amounts distributable to shareholders for tax purposes. Because the combined investment portfolios have been managed as a single integrated portfolio since the acquisition was completed, it is not practicable to separate the amounts of revenue and earnings of Capital Appreciation Variable Account that have been included in MFS Massachusetts Investors Growth Stock Portfolio’s Statement of Operations since December 2, 2011.
Assuming the acquisition had been completed on January 1, 2011, the fund’s pro forma results of operations for the year ended December 31, 2011 are as follows:
| Net investment income | $2,808,611 | |||
| Net realized and unrealized gain (loss) on investments and foreign currency transactions | 3,409,627 | |||
| Change in net assets from operations | $6,218,238 |
19
Table of Contents
MFS Massachusetts Investors Growth Stock Portfolio
REPORT OF INDEPENDENT REGISTERED PUBLIC ACCOUNTING FIRM
To the Board of Trustees of MFS Variable Insurance Trust II and the Shareholders of MFS Massachusetts Investors Growth Stock Portfolio:
We have audited the accompanying statement of assets and liabilities, including the portfolio of investments, of MFS Massachusetts Investors Growth Stock Portfolio (the “Fund”) (one of the portfolios comprising MFS Variable Insurance Trust II) as of December 31, 2011, and the related statement of operations for the year then ended, the statements of changes in net assets for each of the two years in the period then ended, and the financial highlights for each of the five years in the period then ended. These financial statements and financial highlights are the responsibility of the Fund’s management. Our responsibility is to express an opinion on these financial statements and financial highlights based on our audits.
We conducted our audits in accordance with the standards of the Public Company Accounting Oversight Board (United States). Those standards require that we plan and perform the audit to obtain reasonable assurance about whether the financial statements and financial highlights are free of material misstatement. The Fund is not required to have, nor were we engaged to perform, an audit of its internal control over financial reporting. Our audits included consideration of internal control over financial reporting as a basis for designing audit procedures that are appropriate in the circumstances, but not for the purpose of expressing an opinion on the effectiveness of the Fund’s internal control over financial reporting. Accordingly, we express no such opinion. An audit also includes examining, on a test basis, evidence supporting the amounts and disclosures in the financial statements, assessing the accounting principles used and significant estimates made by management, as well as evaluating the overall financial statement presentation. Our procedures included confirmation of securities owned as of December 31, 2011, by correspondence with the custodian. We believe that our audits provide a reasonable basis for our opinion.
In our opinion, the financial statements and financial highlights referred to above present fairly, in all material respects, the financial position of MFS Massachusetts Investors Growth Stock Portfolio as of December 31, 2011, the results of its operations for the year then ended, the changes in its net assets for each of the two years in the period then ended, and the financial highlights for each of the five years in the period then ended, in conformity with accounting principles generally accepted in the United States of America.
DELOITTE & TOUCHE LLP
Boston, Massachusetts
February 15, 2012
20
Table of Contents
MFS Massachusetts Investors Growth Stock Portfolio
RESULTS OF SHAREHOLDER MEETING (unaudited)
At a special meeting of shareholders of MFS Massachusetts Investors Growth Stock Portfolio, which was held on December 1, 2011, the following actions were taken for which shareholders of all series of MFS Variable Insurance Trust II voted together as a single class with respect to Item 1 and shareholders of MFS Massachusetts Investors Growth Stock Portfolio voted as a separate class with respect to Items 2 and 3:
Item 1: Election of ten Trustees as members of the Board of Trustees of the Trust effective January 1, 2012:
| Number of Shares | ||||||||
| For | Withheld Authority | |||||||
| Robert E. Butler | 681,916,712.8686 | 46,472,894.9218 | ||||||
| Maureen R. Goldfarb | 682,835,794.8512 | 45,553,812.9392 | ||||||
| David H. Gunning | 681,500,267.3085 | 46,889,340.4819 | ||||||
| William R. Gutow | 681,050,223.5547 | 47,339,384.2357 | ||||||
| Michael Hegarty | 682,477,088.8584 | 45,912,518.9320 | ||||||
| John P. Kavanaugh | 683,794,425.4269 | 44,595,182.3635 | ||||||
| Robert J. Manning | 682,699,559.7374 | 45,690,048.0530 | ||||||
| J. Dale Sherratt | 681,362,743.0513 | 47,026,864.7391 | ||||||
| Laurie J. Thomsen | 683,408,094.0000 | 44,981,513.7904 | ||||||
| Robert W. Uek | 681,424,852.0247 | 46,964,755.7657 | ||||||
Item 2: To approve a new investment advisory agreement dated January 1, 2012, between the Trust, on behalf of MFS Massachusetts Investors Growth Stock Portfolio, and MFS:
| Number of Shares | ||||||||||||
| For | Against | Withheld Authority | ||||||||||
| 34,515,278.5694 | 926,074.7245 | 3,212,055.8896 | ||||||||||
Item 3: To approve revisions to and restatements of certain fundamental investment restrictions of MFS Massachusetts Investors Growth Stock Portfolio effective January 1, 2012 as detailed below:
| Number of Shares | ||||||||||||||
| For | Against | Withheld Authority | ||||||||||||
| A. | Borrowing | 33,484,354.2568 | 1,800,842.9838 | 3,368,211.9429 | ||||||||||
| B. | Underwriting Securities | 33,866,129.8711 | 1,402,739.1358 | 3,384,540.1766 | ||||||||||
| C. | Issuance of Senior Securities | 33,895,646.6907 | 1,514,393.3108 | 3,243,369.1820 | ||||||||||
| D. | Lending of Money or Securities | 33,514,406.5437 | 1,715,442.4188 | 3,423,560.2210 | ||||||||||
| E. | Purchases or Sales of Real Estate; Interests in Oil, Gas or Mineral Leases; and Commodities | 34,097,895.7281 | 1,290,885.1515 | 3,264,628.3039 | ||||||||||
| F. | Industry Concentration | 34,184,571.9078 | 1,200,779.1487 | 3,268,058.1270 | ||||||||||
21
Table of Contents
MFS Massachusetts Investors Growth Stock Portfolio
TRUSTEES AND OFFICERS – IDENTIFICATION AND BACKGROUND
The Trustees and officers of the Trust, as of February 1, 2012, are listed below, together with their principal occupations during the past five years. (Their titles may have varied during that period.) The address of each Trustee and officer is 500 Boylston Street, Boston, Massachusetts 02116.
Name, Age | Position(s) with Fund | Trustee/Officer Since (h) | Principal Occupations | Other Directorships (j) | ||||
| INTERESTED TRUSTEES | ||||||||
Robert J. Manning (k) (age 48) | Trustee | February 2004 | Massachusetts Financial Services Company, Chairman, Chief Executive Officer and Director; President (until December 2009); Chief Investment Officer (until July 2010) | N/A | ||||
| INDEPENDENT TRUSTEES | ||||||||
David H. Gunning (age 69) | Trustee and Chair of Trustees | January 2004 | Retired; Cleveland-Cliffs Inc. (mining products and service provider), Vice Chairman/Director (until May 2007) | Lincoln Electric Holdings, Inc. (welding equipment manufacturer), Director; Development Alternatives, Inc. (consulting), Director/Non-Executive Chairman; Portman Limited (mining), Director (until 2008) | ||||
Robert E. Butler (age 70) | Trustee | January 2006 | Consultant – investment company industry regulatory and compliance matters | N/A | ||||
Maureen R. Goldfarb (age 56) | Trustee | January 2009 | Private investor | N/A | ||||
William R. Gutow (age 70) | Trustee | December 1993 | Private investor and real estate consultant; Capitol Entertainment Management Company (video franchise), Vice Chairman | Atlantic Coast Tan (tanning salons), Vice Chairman (until 2007); Texas Donuts (donut franchise), Vice Chairman (until 2010) | ||||
Michael Hegarty (age 67) | Trustee | December 2004 | Private investor | N/A | ||||
John P. Kavanaugh (age 57) | Trustee | January 2009 | Private investor; The Hanover Insurance Group, Inc., Vice President and Chief Investment Officer (until 2006); Allmerica Investment Trust, Allmerica Securities Trust and Opus Investment Trust (investment companies), Chairman, President and Trustee (until 2006) | N/A | ||||
J. Dale Sherratt (age 73) | Trustee | June 1989 | Insight Resources, Inc. (acquisition planning specialists), President; Wellfleet Investments (investor in health care companies), Managing General Partner | N/A | ||||
Laurie J. Thomsen (age 54) | Trustee | March 2005 | Private investor; New Profit, Inc. (venture philanthropy), Executive Partner (until 2010) | The Travelers Companies (property and casualty insurance), Director | ||||
Robert W. Uek (age 70) | Trustee | January 2006 | Consultant to investment company industry | N/A | ||||
| OFFICERS | ||||||||
John M. Corcoran (k) (age 46) | President | October 2008 | Massachusetts Financial Services Company, Senior Vice President (since October 2008); State Street Bank and Trust (financial services provider), Senior Vice President, (until September 2008) | N/A | ||||
| Christopher R. Bohane (k) (age 38) | Assistant Secretary and Assistant Clerk | July 2005 | Massachusetts Financial Services Company, Vice President and Senior Counsel | N/A | ||||
Kino Clark (k) (age 43) | Assistant Treasurer | January 2012 | Massachusetts Financial Services Company, Assistant Vice President | N/A | ||||
22
Table of Contents
MFS Massachusetts Investors Growth Stock Portfolio
Trustees and Officers – continued
Name, Age | Position(s) with Fund | Trustee/Officer Since (h) | Principal Occupations | Other Directorships (j) | ||||
Ethan D. Corey (k) (age 48) | Assistant Secretary and Assistant Clerk | July 2005 | Massachusetts Financial Services Company, Senior Vice President and Associate General Counsel | N/A | ||||
David L. DiLorenzo (k) (age 43) | Treasurer | July 2005 | Massachusetts Financial Services Company, Vice President | N/A | ||||
Robyn L. Griffin (age 36) | Assistant Independent Chief Compliance Officer | August 2008 | Griffin Compliance LLC (provider of compliance services), Principal (since August 2008); State Street Corporation (financial services provider), Mutual Fund Administration Assistant Vice President (October 2006 – July 2008); Liberty Mutual Group (insurance), Personal Market Assistant Controller (April 2006 – October 2006); Deloitte & Touche LLP (professional services firm). | N/A | ||||
Brian E. Langenfeld (k) (age 38) | Assistant Secretary and Assistant Clerk | June 2006 | Massachusetts Financial Services Company, Vice President and Senior Counsel | N/A | ||||
Ellen Moynihan (k) (age 54) | Assistant Treasurer | April 1997 | Massachusetts Financial Services Company, Senior Vice President | N/A | ||||
Susan S. Newton (k) (age 61) | Assistant Secretary and Assistant Clerk | May 2005 | Massachusetts Financial Services Company, Senior Vice President and Associate General Counsel | N/A | ||||
Susan A. Pereira (k) (age 41) | Assistant Secretary and Assistant Clerk | July 2005 | Massachusetts Financial Services Company, Vice President and Senior Counsel | N/A | ||||
Mark N. Polebaum (k) (age 59) | Secretary and Clerk | January 2006 | Massachusetts Financial Services Company, Executive Vice President, General Counsel and Secretary | N/A | ||||
Frank L. Tarantino (age 67) | Independent Chief Compliance Officer | June 2004 | Tarantino LLC (provider of compliance services), Principal | N/A | ||||
Richard S. Weitzel (k) (age 41) | Assistant Secretary and Assistant Clerk | October 2007 | Massachusetts Financial Services Company, Vice President and Assistant General Counsel | N/A | ||||
James O. Yost (k) (age 51) | Deputy Treasurer | September 1990 | Massachusetts Financial Services Company, Senior Vice President | N/A | ||||
| (h) | Date first appointed to serve as Trustee/officer of an MFS fund. Each Trustee has served continuously since appointment unless indicated otherwise. For the period from December 15, 2004 until February 22, 2005, Mr. Manning served as Advisory Trustee. For the period October 2008, until January 2012, Mr. Corcoran served as Treasurer of the Funds. Prior to January 2012, Messrs. DiLorenzo and Yost served as Assistant Treasurers of the Funds. |
| (j) | Directorships or trusteeships of companies required to report to the Securities and Exchange Commission (i.e., “public companies”). |
| (k) | “Interested person” of the Trust within the meaning of the Investment Company Act of 1940 (referred to as the 1940 Act), which is the principal federal law governing investment companies like the fund, as a result of position with MFS. The address of MFS is 500 Boylston Street, Boston, Massachusetts 02116. |
Each Trustee has been elected by shareholders and each Trustee and officer holds office until his or her successor is chosen and qualified or until his or her earlier death, resignation, retirement or removal. The Trust does not hold annual meetings for the purpose of electing Trustees, and Trustees are not elected for fixed terms. Messrs. Butler, Kavanaugh, Uek and Ms. Thomsen are members of the Trust’s Audit Committee.
Each of the Fund’s Trustees and officers holds comparable positions with certain other funds of which MFS or a subsidiary is the investment adviser or distributor, and, in the case of the officers, with certain affiliates of MFS. As of January 1, 2012, the Trustees served as board members of 131 funds within the MFS Family of Funds.
23
Table of Contents
MFS Massachusetts Investors Growth Stock Portfolio
Trustees and Officers – continued
The Statement of Additional Information for the Fund includes further information about the Trustees and is available without charge upon request by calling 1-800-225-2606.
Investment Adviser Massachusetts Financial Services Company 500 Boylston Street, Boston, MA 02116-3741 | Custodian State Street Bank and Trust 1 Lincoln Street, Boston, MA 02111-2900 | |
Distributor MFS Fund Distributors, Inc. 500 Boylston Street, Boston, MA 02116-3741 | Independent Registered Public Accounting Firm Deloitte & Touche LLP 200 Berkeley Street, Boston, MA 02116 | |
Portfolio Manager Jeffrey Constantino |
24
Table of Contents
MFS Massachusetts Investors Growth Stock Portfolio
At a special meeting of shareholders of the MFS Massachusetts Investors Growth Stock Portfolio (hereinafter referred to as the “Fund” or the “Portfolio”), which was held on December 1, 2011, the shareholders approved a new investment advisory agreement based on the recommendation of the Board of Trustees. At its July, 2011 meeting, the Board of Trustees (i) approved, and recommended for shareholder approval, the new investment advisory agreement effective January 1, 2012, and (ii) the continuation of the existing investment advisory agreement effective September 1, 2011. The following includes a description of the factors that the Board of Trustees considered and the conclusions that formed the basis of their approval of both the new investment advisory agreement and the continuation of the prior investment advisory agreement.
BOARD APPROVAL OF NEW INVESTMENT ADVISORY AGREEMENT
The Investment Company Act of 1940 requires that both the full Board of Trustees and a majority of the non-interested (“independent”) Trustees, voting separately, initially approve the new investment advisory agreement (the “New Agreement”) between Massachusetts Financial Services Company (“MFS”) and MFS Variable Insurance Trust II (the “Trust”) on behalf of the Portfolio and, beginning on the second anniversary of the initial effective date of the New Agreement, annually approve the continuation of the New Agreement. The Trustees have considered matters bearing on the Portfolio and the then current advisory arrangement at their meetings throughout the year, including a review of performance data at each regular meeting. In addition, the independent Trustees met in person in July 2011 to consider the initial approval of the New Agreement, and to recommend that shareholders approve the New Agreement. The independent Trustees were assisted in their evaluation of the New Agreement by independent legal counsel, from whom they received separate legal advice and with whom they met separately from MFS management. The independent Trustees were also assisted in this process by the Portfolio’s Independent Chief Compliance Officer, a full-time senior officer appointed by and reporting to the independent Trustees.
In connection with their deliberations regarding the initial approval of the New Agreement, the Trustees, including the independent Trustees, considered such information and factors as they believed, in light of the legal advice furnished to them and their own business judgment, to be relevant. The New Agreement was considered separately for the series of the Trust (collectively, the “Portfolios”), although the Trustees also took into account the common interests of all Portfolios in the Trust in their review. As described below, the Trustees considered the nature, quality, and extent of the various investment advisory, administrative, and/or shareholder services to be performed by MFS under the New Agreement and other arrangements with the Trust.
In connection with their initial review meeting, the Trustees received and relied upon materials that included, among other items: (i) information provided by MFS on the advisory fees of comparable portfolios of its other clients, including institutional separate account and other clients, (ii) information as to whether, and to what extent applicable, expense waivers, reimbursements or fee “breakpoints” would be observed for the Portfolio under the New Agreement, and (iii) a comparison and summary of the differences in the provisions in the New Agreement compared to those in each of the then current investment advisory agreements for the Portfolios. In addition, in connection with the independent Trustees’ meetings in May and July, 2011 (the “contract review meetings”) for the purpose of considering whether to approve the continuation of the then current investment advisory agreements for the Portfolio, the independent Trustees received: (1) information provided by Lipper Inc. (“Lipper”) on the investment performance of the Portfolio for various time periods ended December 31, 2010, compared to the investment performance of a group of funds with substantially similar investment classifications/objectives (the “Lipper performance universe”), (2) information provided by Lipper on the Portfolio’s advisory fees and other expenses compared to the advisory fees and other expenses of comparable funds identified by Lipper (the “Lipper expense group”), (3) information regarding MFS’ financial results and financial condition, including MFS’ and certain of its affiliates’ estimated profitability from services performed for the Portfolio, (4) MFS’ views regarding the outlook for the mutual fund industry and its strategic business plans, (5) descriptions of various functions performed by MFS for the Trust, such as compliance monitoring and portfolio trading practices, and (6) information regarding the overall organization of MFS, including information about MFS’ senior management and other personnel providing investment advisory, administrative and other services to the Portfolio. The comparative performance, fee and expense information prepared and provided by Lipper was not independently verified, and the independent Trustees did not independently verify any information provided to them by MFS.
The Trustees’ conclusion as to the initial approval of the New Agreement was based on comprehensive consideration of all information provided to the Trustees and was not the result of any single factor. Some of the factors that figured particularly in the Trustees’ deliberations are described below for the Portfolio, while individual Trustees may have given different weight to various factors and evaluated the information presented as a whole differently than another individual Trustee. The Trustees recognized that the fee arrangements for the Portfolio could reflect years of review and discussion between the independent Trustees and MFS, that certain aspects of such arrangements may receive greater scrutiny in some years than others, and that
25
Table of Contents
MFS Massachusetts Investors Growth Stock Portfolio
Board Approval of New Investment Advisory Agreement – continued
the Trustees’ conclusions may be based, in part, on their consideration of these same arrangements during the course of the year and in prior years.
Because the portfolio management team managing the Portfolio’s investments under the then current investment advisory agreement will remain the same under the New Agreement for the Portfolio, the Trustees compared the Portfolio’s total return investment performance to the performance of its Lipper performance universe over various time periods, based on information provided by Lipper. The Trustees placed particular emphasis on the total return performance of the Portfolio’s Initial Class shares in comparison to the performance of funds in its Lipper performance universe over the one-, three- and five-year periods ended December 31, 2010. The Trustees did not rely on performance results for more recent periods.
The Trustees noted the performance of the Portfolio’s Initial Class shares was in the 4th quintile relative to the other funds in the Lipper performance universe for the one-year period (the 1st quintile being the best performers and the 5th quintile being the worst performers). The total return performance of the Portfolio was in the 1st quintile for the three-year period and in the 2nd quintile for the five-year period ended December 31, 2010, relative to the Lipper performance universe. Based on the nature and quality of services provided by MFS, the Board of Trustees concluded that the Portfolio’s performance was satisfactory.
In the course of their deliberations, the Trustees took into account information provided by MFS during contract review meetings, as well as during investment review meetings conducted with portfolio management personnel during the course of the year. For Portfolios whose performance lagged their peer groups, they discussed the factors that contributed thereto and MFS’ efforts to improve such Portfolios’ performance. After reviewing this information, the Trustees concluded, within the context of their overall conclusions regarding the New Agreement, that they were satisfied with MFS’ responses and efforts relating to investment performance.
In assessing the reasonableness of the Portfolio’s advisory fee, the Trustees considered, among other information, the Portfolio’s advisory fee and the total expense ratio of the Portfolio’s Initial Class shares as a percentage of average daily net assets, compared to the advisory fee and total expense ratios of its peer group of funds based on information provided by Lipper. The Trustees also considered the advisory fees charged by MFS to institutional accounts. In comparing these fees, the Trustees considered the generally broader scope of services provided by MFS to the Trust than those provided to institutional accounts. The Trustees also considered the higher demands placed on MFS’ investment personnel and trading infrastructure as a result of the daily cash in-flows and out-flows of the Portfolio, and the impact on MFS and related expenses due to the more extensive regulatory regime to which the Portfolio is subject, compared to institutional accounts.
In considering the fees, the Trustees noted from the Lipper data that the Portfolio’s effective advisory fee rate and total expense ratio were each approximately at the median of such fees and expenses of funds in the Lipper expense group. In addition, the Trustees accepted MFS’ offer to continue the expense limitation for the Portfolio. The Trustees further noted that the New Agreement would reflect MFS’ agreement to reduce the advisory fee on average daily net assets over $1 billion on a permanent basis, and concluded that the breakpoint was sufficient to allow the Portfolio to benefit from economies of scale as its assets grow. The Trustees concluded that the fees were reasonable in light of the nature and quality of services provided.
The Trustees also considered whether the Portfolio is likely to benefit from any economies of scale due to future asset growth. In this regard, the Trustees reviewed the adequacy of breakpoints and discussed with MFS any adjustments necessary for the shareholders’ benefit.
The Trustees also considered information prepared by MFS relating to its costs and profits with respect to the Portfolio and other investment companies and accounts advised by MFS, as well as MFS’ methodologies used to determine and allocate its costs to the Portfolio and other accounts and products for purposes of estimating profitability.
The Trustees noted that there would be no increase to the net advisory fee arrangement for the Portfolio under the New Agreement when compared to the Portfolio’s then current investment advisory agreement. After reviewing these and other factors described below, the Trustees concluded that the advisory fees charged to the Portfolio under the New Agreement represent reasonable compensation in light of the nature and quality of the services being provided by MFS.
In addition, the Trustees considered MFS’ resources and related efforts to continue to retain, attract and motivate capable personnel to serve the Portfolio. The Trustees also considered the financial resources of MFS and its parent, Sun Life Financial Inc. The Trustees further considered any advantages and possible disadvantages of having an adviser which also serves other investment companies as well as institutional accounts.
The Trustees also considered the nature, quality, cost, and extent of administrative, transfer agency, and distribution services provided to the Trust by MFS and its affiliates under agreements and plans other than the New Agreement, including the 12b-1 fees the Portfolio pays to MFS Fund Distributors, Inc., an affiliate of MFS. The Trustees also considered the nature, extent and quality of certain other services MFS performs or arranges on the Portfolio’s behalf, which may include securities lending
26
Table of Contents
MFS Massachusetts Investors Growth Stock Portfolio
Board Approval of New Investment Advisory Agreement – continued
programs, directed expense payment programs, class action recovery programs, and MFS’ interaction with third-party service providers, principally custodians and sub-custodians. The Trustees concluded that the various non-advisory services provided by MFS and its affiliates on behalf of the Portfolio were satisfactory. The Trustees also considered the benefits to MFS from the use of the Portfolio’s portfolio brokerage commissions to pay for investment research and various other factors. Additionally, the Trustees considered so-called “fall-out benefits” to MFS such as reputational value derived from serving as investment manager to the Trust, and determined that any such benefits derived by MFS were reasonable and fair.
Based on their evaluation of factors that they deemed to be material, including those factors described above, the Board of Trustees, including a majority of the independent Trustees, concluded that the New Agreement should be approved for an initial two-year period, commencing upon its effective date, as set forth in the New Agreement.
BOARD APPROVAL OF CONTINUATION OF PRIOR INVESTMENT ADVISORY AGREEMENT
The Investment Company Act of 1940 requires that both the full Board of Trustees and a majority of the non-interested (“independent”) Trustees, voting separately, annually approve the continuation of the investment advisory agreement between MFS Variable Insurance Trust II (the “Trust”) and Massachusetts Financial Services Company (“MFS”) on behalf of the Fund. The Trustees consider matters bearing on the Fund and the advisory arrangements at their meetings throughout the year, including a review of performance data at each regular meeting. In addition, the independent Trustees met in person in May and again in July 2011 (“contract review meetings”) for the specific purpose of considering whether to approve the continuation of the investment advisory agreement for the Fund. The independent Trustees were assisted in their evaluation of the investment advisory agreement by independent legal counsel, from whom they received separate legal advice and with whom they met separately from MFS management during various contract review meetings. The independent Trustees were also assisted in this process by the Fund’s Independent Chief Compliance Officer, a full-time senior officer appointed by and reporting to the independent Trustees.
In connection with their deliberations, the Trustees, including the independent Trustees, considered such information and factors as they believed, in light of the legal advice furnished to them and their own business judgment, to be relevant. The investment advisory agreement was considered separately for the Fund, although the Trustees also took into account the common interests of all Funds in the Trust in their review. As described below, the Trustees considered the nature, quality, and extent of the various investment advisory, administrative, and shareholder services performed by MFS under the existing investment advisory agreement and other arrangements with the Trust.
In connection with their contract review meetings, the Trustees received and relied upon materials which included, among other items: (i) information provided by Lipper Inc. (“Lipper”) on the investment performance of the Fund for various time periods ended December 31, 2010, compared to the investment performance of a group of funds with substantially similar investment classifications/objectives (the “Lipper performance universe”), (ii) information provided by Lipper on the Fund’s advisory fees and other expenses compared to the advisory fees and other expenses of comparable funds identified by Lipper (the “Lipper expense group”), (iii) information provided by MFS on the advisory fees of comparable portfolios of its other clients, including institutional separate account and other clients, (iv) information as to whether, and to what extent applicable, expense waivers, reimbursements or fee “breakpoints” are observed for the Fund, (v) information regarding MFS’ financial results and financial condition, including MFS’ and certain of its affiliates’ estimated profitability from services performed for the Fund and other investment companies that the Board oversees as a whole, and for MFS’ institutional business, (vi) MFS’ views regarding the outlook for the mutual fund industry and its strategic business plans, (vii) descriptions of various functions performed by MFS for the Trust, such as compliance monitoring and portfolio trading practices, and (viii) information regarding the overall organization of MFS, including information about MFS’ senior management and other personnel providing investment advisory, administrative and other services to the Fund. The comparative performance, fee and expense information prepared and provided by Lipper was not independently verified, and the independent Trustees did not independently verify any information provided to them by MFS.
The Trustees’ conclusion as to the continuation of the investment advisory agreement was based on comprehensive consideration of all information provided to the Trustees and was not the result of any single factor. Some of the factors that figured particularly in the Trustees’ deliberations are described below for the Fund, while individual Trustees may have given different weight to various factors and evaluated the information presented as a whole differently than another individual Trustee. The Trustees recognized that the fee arrangements for the Fund reflect years of review and discussion between the independent Trustees and MFS, that certain aspects of such arrangements may receive greater scrutiny in some years than others, and that the Trustees’ conclusions may be based, in part, on their consideration of these same arrangements during the course of the year and in prior years.
27
Table of Contents
MFS Massachusetts Investors Growth Stock Portfolio
Board Approval of Continuation of Prior Investment Advisory Agreement – continued
Based on information provided by Lipper, the Trustees compared the Fund’s total return investment performance to the performance of the Lipper performance universe over various time periods. The Trustees placed particular emphasis on the total return performance of the Fund’s Initial Class shares in comparison to the performance of funds in its Lipper performance universe over the one-, three- and five-year periods ended December 31, 2010. The Trustees did not rely on performance results for more recent periods, including those shown elsewhere in this report.
The Trustees noted the performance of the Fund’s Initial Class shares was in the 4th quintile relative to the other funds in the Lipper performance universe for the one-year period (the 1st quintile being the best performers and the 5th quintile being the worst performers). The total return performance of the Fund was in the 1st quintile for the three-year period and in the 2nd quintile for the five-year period ended December 31, 2010, relative to the Lipper performance universe. Based on the nature and quality of services provided by MFS, the Board of Trustees concluded that the Fund’s performance was satisfactory.
In the course of their deliberations, the Trustees took into account information provided by MFS during contract review meetings, as well as during investment review meetings conducted with portfolio management personnel during the course of the year.
In assessing the reasonableness of the Fund’s advisory fee, the Trustees considered, among other information, the Fund’s advisory fee and the total expense ratio of the Fund’s Initial Class shares as a percentage of average daily net assets, compared to the advisory fee and total expense ratios of its peer group of funds based on information provided by Lipper. The Trustees also considered the advisory fees charged by MFS to institutional accounts. In comparing these fees, the Trustees considered the generally broader scope of services provided by MFS to the Trust than those provided to institutional accounts. The Trustees also considered the higher demands placed on MFS’ investment personnel and trading infrastructure as a result of the daily cash in-flows and out-flows of the Fund, and the impact on MFS and related expenses due to the more extensive regulatory regime to which the Fund is subject, compared to institutional accounts.
In considering the fees, the Trustees noted from the Lipper data (which takes into account any reductions or expense limitations) that the Fund’s effective advisory fee rate and total expense ratio were each approximately at the median of such fees and expenses of funds in the Lipper expense group. In addition, the Trustees accepted MFS’ offer to continue the expense limitation for the Fund. The Trustees further concluded that the existing breakpoint was sufficient to allow the Fund to benefit from economies of scale as its assets grow. The Trustees concluded that the fees were reasonable in light of the nature and quality of services provided.
The Trustees also considered information prepared by MFS relating to its costs and profits with respect to the Fund and other investment companies and accounts advised by MFS, as well as MFS’ methodologies used to determine and allocate its costs to the Fund and other accounts and products for purposes of estimating profitability.
After reviewing these and other factors described below, the Trustees concluded that the advisory fees charged to the Fund represent reasonable compensation in light of the nature and quality of the services being provided by MFS.
In addition, the Trustees considered MFS’ resources and related efforts to continue to retain, attract and motivate capable personnel to serve the Fund. The Trustees also considered the financial resources of MFS and its parent, Sun Life Financial Inc. The Trustees further considered any advantages and possible disadvantages of having an adviser which also serves other investment companies as well as institutional accounts.
The Trustees also considered the nature, quality, cost, and extent of administrative, transfer agency, and distribution services provided to the Fund by MFS and its affiliates under agreements and plans other than the investment advisory agreement, including the 12b-1 fees the Fund pays to MFS Fund Distributors, Inc., an affiliate of MFS. The Trustees also considered the nature, extent and quality of certain other services MFS performs or arranges on the Fund’s behalf, which may include securities lending programs, directed expense payment programs, class action recovery programs, and MFS’ interaction with third-party service providers, principally custodians and sub-custodians. The Trustees concluded that the various non-advisory services provided by MFS and its affiliates on behalf of the Fund were satisfactory. The Trustees also considered the benefits to MFS from the use of the Fund’s portfolio brokerage commissions, if applicable, to pay for investment research and various other factors. Additionally, the Trustees considered so-called “fall-out benefits” to MFS such as reputational value derived from serving as investment manager to the Trust, and determined that any such benefits derived by MFS were reasonable and fair.
Based on their evaluation of factors that they deemed to be material, including those factors described above, the Board of Trustees, including a majority of the independent Trustees, concluded that the investment advisory agreement should be continued for an additional one-year period, commencing September 1, 2011.
A discussion regarding the Board’s most recent review and renewal of the fund’s Investment Advisory Agreement with MFS is available by clicking on the fund’s name under “Variable Insurance Portfolios — VIT II” in the “Products and Performance” section of the MFS Web site (mfs.com).
28
Table of Contents
MFS Massachusetts Investors Growth Stock Portfolio
PROXY VOTING POLICIES AND INFORMATION
A general description of the MFS funds’ proxy voting policies and procedures is available without charge, upon request, by calling 1-800-225-2606, by visiting the Proxy Voting section of mfs.com or by visiting the SEC’s Web site at http://www.sec.gov.
Information regarding how the fund voted proxies relating to portfolio securities during the most recent twelve-month period ended June 30 is available without charge by visiting the Proxy Voting section of mfs.com or by visiting the SEC’s Web site at http://www.sec.gov.
QUARTERLY PORTFOLIO DISCLOSURE
The fund will file a complete schedule of portfolio holdings with the Securities and Exchange Commission (the Commission) for the first and third quarters of each fiscal year on Form N-Q. The fund’s Form N-Q is available on the EDGAR database on the Commission’s Internet Web site at http://www.sec.gov and may be reviewed and copied at the:
Public Reference Room
Securities and Exchange Commission
100 F Street, NE, Room 1580
Washington, D.C. 20549
Information on the operation of the Public Reference Room may be obtained by calling the Commission at 1-800-SEC-0330. Copies of the fund’s Form N-Q also may be obtained, upon payment of a duplicating fee, by electronic request at the following e-mail address: publicinfo@sec.gov or by writing the Public Reference Section at the above address.
From time to time, MFS may post important information about the fund or the MFS funds on the MFS web site (mfs.com). This information is available by visiting the “News & Commentary” section of mfs.com or by clicking on the fund’s name under “Variable Insurance Portfolios — VIT II” in the “Products and Performance” section of mfs.com.
FEDERAL TAX INFORMATION (unaudited)
The following information is provided pursuant to provisions of the Internal Revenue Code.
For corporate shareholders, 100% of the ordinary income dividends paid during the fiscal year qualify for the corporate dividends received deduction.
29
Table of Contents
rev. 3/11

| Why? | Financial companies choose how they share your personal information. Federal law gives consumers the right to limit some but not all sharing. Federal law also requires us to tell you how we collect, share, and protect your personal information. Please read this notice carefully to understand what we do. |
| What? | The types of personal information we collect and share depend on the product or service you have with us. This information can include:
• Social Security number and account balances • Account transactions and transaction history • Checking account information and wire transfer instructions
When you are no longer our customer, we continue to share your information as described in this notice. |
| How? | All financial companies need to share customers’ personal information to run their everyday business. In the section below, we list the reasons financial companies can share their customers’ personal information; the reasons MFS chooses to share; and whether you can limit this sharing. |
| Reasons we can share your personal information | Does MFS share? | Can you limit this sharing? | ||
For our everyday business purposes – such as to process your transactions, maintain your account(s), respond to court orders and legal investigations, or report to credit bureaus | Yes | No | ||
For our marketing purposes – to offer our products and services to you | No | We don’t share | ||
| For joint marketing with other financial companies | No | We don’t share | ||
For our affiliates’ everyday business purposes – information about your transactions and experiences | No | We don’t share | ||
For our affiliates’ everyday business purposes – information about your creditworthiness | No | We don’t share | ||
| For nonaffiliates to market to you | No | We don’t share |
| Questions? | Call 800-225-2606 or go to mfs.com. |
30
Table of Contents
| Page 2 |
| Who we are | ||
| Who is providing this notice? | MFS Funds, MFS Investment Management, MFS Institutional Advisors, Inc., MFS Fund Distributors, Inc., MFS Heritage Trust Company, and MFS Service Center, Inc. | |
| What we do | ||
| How does MFS protect my personal information? | To protect your personal information from unauthorized access and use, we use security measures that comply with federal law. These measures include procedural, electronic, and physical safeguards for the protection of the personal information we collect about you. | |
| How does MFS collect my personal information? | We collect your personal information, for example, when you
• open an account or provide account information • direct us to buy securities or direct us to sell your securities • make a wire transfer
We also collect your personal information from others, such as credit bureaus, affiliates and other companies. | |
| Why can’t I limit all sharing? | Federal law gives you the right to limit only
• sharing for affiliates’ everyday business purposes – information about your creditworthiness • affiliates from using your information to market to you • sharing for nonaffiliates to market to you
State laws and individual companies may give you additional rights to limit sharing. | |
| Definitions | ||
| Affiliates | Companies related by common ownership or control. They can be financial and nonfinancial companies.
•MFS does not share personal information with affiliates, except for everyday business purposes as described on page one of this notice. | |
| Nonaffiliates | Companies not related by common ownership or control. They can be financial and nonfinancial companies.
•MFS does not share with nonaffiliates so they can market to you. | |
| Joint Marketing | A formal agreement between nonaffiliated financial companies that together market financial products or services to you.
•MFS doesn’t jointly market. | |
| Other important information | ||
| If you own an MFS product or receive an MFS service in the name of a third party such as a bank or broker-dealer, their privacy policy may apply to you instead of ours. | ||
31
Table of Contents

Table of Contents

MFS® New Discovery Portfolio
MFS® Variable Insurance Trust II

ANNUAL REPORT
December 31, 2011
NWD-ANN
Table of Contents
MFS® NEW DISCOVERY PORTFOLIO
The report is prepared for the general information of contract owners.
It is authorized for distribution to prospective investors only when preceded or accompanied by a current prospectus.
NOT FDIC INSURED Ÿ MAY LOSE VALUE Ÿ NO BANK OR CREDIT UNION GUARANTEE Ÿ NOT A DEPOSIT Ÿ NOT INSURED BY ANY FEDERAL GOVERNMENT AGENCY OR NCUA/NCUSIF
Table of Contents
MFS New Discovery Portfolio
LETTER FROM THE CHAIRMAN AND CEO

Dear Contract Owners:
We are indeed living through some volatile times. Economic uncertainty is everywhere, as it seems no place in the world has been unmoved by crisis. We have seen a devastating earthquake and tsunami that have led to disruptions in the Japanese markets
and supply chains. Protests have changed the face of the Middle East and left in their wake lingering tensions and resultant higher oil prices. We have seen debt limits tested in Europe and the United States and policymakers grappling to craft often unpopular monetary and fiscal responses at a time when consumers and businesses struggle with what appears to be a slowing global economy. On top of all of that, we have seen long-term U.S. debt lose its Standard & Poor’s AAA rating and the long-term debt ratings of 15 eurozone nations put on negative watch.
When markets become volatile, managing risk becomes a top priority for investors and their advisors. At MFS® risk management is foremost in our minds in all market climates. Our analysts and portfolio managers keep risks firmly in mind when evaluating securities. Additionally, we have a team of quantitative analysts that measures and assesses the risk profiles of our portfolios and securities on an ongoing basis. The chief investment risk officer, who oversees the team, reports directly to the firm’s president and chief investment officer so the risk associated with each portfolio can be assessed objectively and independently of the portfolio management team.
As always, we continue to be mindful of the many economic challenges faced at the local, national, and international levels. It is in times such as these that we want to remind investors of the merits of maintaining a long-term view, adhering to basic investing principles such as asset allocation and diversification, and working closely with their advisors to research and identify appropriate investment opportunities.
Respectfully,

Robert J. Manning
Chairman and Chief Executive Officer
MFS Investment Management®
February 15, 2012
The opinions expressed in this letter are subject to change, may not be relied upon for investment advice, and no forecasts can be guaranteed.
1
Table of Contents
MFS New Discovery Portfolio
Portfolio structure

| Top ten holdings | ||||
| Cabot Oil & Gas Corp. | 2.1% | |||
| Brookdale Senior Living, Inc. | 2.0% | |||
| HomeAway, Inc. | 1.8% | |||
| Constant Contact, Inc. | 1.7% | |||
| OpenTable, Inc. | 1.6% | |||
| Energy XXI (Bermuda) Ltd. | 1.6% | |||
| Green Mountain Coffee Roasters, Inc. | 1.5% | |||
| WebMD Health Corp. | 1.5% | |||
| FleetCor Technologies, Inc. | 1.4% | |||
| Urban Outfitters, Inc. | 1.4% |
| Equity sectors | ||||
| Technology | 28.6% | |||
| Health Care | 20.3% | |||
| Special Products & Services | 9.7% | |||
| Industrial Goods & Services | 9.5% | |||
| Energy | 7.1% | |||
| Retailing | 6.0% | |||
| Transportation | 4.0% | |||
| Financial Services | 3.9% | |||
| Leisure | 3.8% | |||
| Basic Materials | 3.1% | |||
| Consumer Staples | 1.9% | |||
| Autos & Housing | 1.6% |
Percentages are based on net assets as of 12/31/11.
The portfolio is actively managed and current holdings may be different.
2
Table of Contents
MFS New Discovery Portfolio
Summary of Results
For the twelve months ended December 31, 2011, Initial Class shares of the MFS New Discovery Portfolio (the “fund”) provided a total return of –10.37%, while Service Class shares of the fund provided a total return of –10.55%. These compare with a return of –2.91% for the fund’s benchmark, the Russell 2000 Growth Index.
Market Environment
Early in the period, the U.S. Federal Reserve (the “Fed”) responded to weak economic growth by loosening monetary policy further. More easing by the Fed improved market sentiment and drove risk-asset prices markedly higher. The December 2010 agreement on a surprisingly large (relative to expectations) expansionary U.S. fiscal package also boosted sentiment. During the subsequent several months, the renewed positive market sentiment, coupled with better indications of global macroeconomic activity, pushed many asset valuations to post-crisis highs. At the same time, the yields of the perceived “safest” global sovereign credits rose, indicating a renewed risk-seeking environment.
However, towards the middle of the period, a weakening macroeconomic backdrop and renewed concerns over peripheral euro zone sovereign debt caused a flight-to-quality move that pushed high-quality sovereign bond yields lower. In the U.S., concerns about sovereign debt default and the long-term sustainability of the trend in U.S. fiscal policy resulted in one agency downgrading U.S. credit quality. Amidst this turmoil, global equity markets declined sharply. As a result of these developments, global consumer and producer sentiment indicators fell precipitously and highly-rated sovereign bond yields hit multi-decade lows. Towards the end of the reporting period, uncertainty in financial markets spiked higher as markets more seriously contemplated the possible failure of the euro zone.
Detractors from Performance
Stock selection in the retailing sector detracted from performance relative to the Russell 2000 Growth Index. Holdings of urban fashion apparel retailer Citi Trends hurt relative performance as the stock significantly underperformed the benchmark over the reporting period.
Security selection and, to a lesser extent, the fund’s underweight position in the health care sector was another negative factor for relative performance. There were no individual holdings within this sector that were among the fund’s top relative detractors.
Elsewhere, the fund’s overweight position in shares of online marketing and media company QuinStreet Inc. held back relative performance. Shares of the company performed poorly following management’s communication of a weak outlook in certain business channels. After making a successful stock market debut, shares of online vacation home marketplace HomeAway (b) hurt relative performance as the stock ended the year well below its initial public offering price. Holdings of online reservation provider OpenTable, telecommunications equipment supplier Calix, and technology equipment supplier Veeco Instruments also negatively impacted relative performance.
During the reporting period, the fund’s currency exposure, resulting primarily from holdings of foreign currency denominated securities, was a detractor from relative performance. All of MFS’ investment decisions are driven by the fundamentals of each individual opportunity and, as such, it is common for our portfolios to have different currency exposure than the benchmark.
Contributors to Performance
Stock selection in the energy sector was a principal contributor to the fund’s relative results. Within this sector, holdings of oil and gas exploration company PetroHawk Energy (b)(h), and the timing of the fund’s ownership in shares of oil exploration company Brigham Exploration (h), provided a boost to relative performance. Both companies were takeover targets in 2011, with mining giant BHP Billiton acquiring PetroHawk Energy in August, and oil and gas refiner StatoilHydro ASA announcing its deal to purchase Brigham Exploration in November. Fund performance also benefited from the strong performance of oil and gas exploration company Cabot Oil & Gas Corp (b).
3
Table of Contents
MFS New Discovery Portfolio
Management Review – continued
Holdings in other sectors that benefited relative performance included discount carrier Spirit Airlines (b) and cloud-based business execution software firm SuccessFactors (h). Shares of Spirit Airlines began publicly trading in May, closing at the end of the year above its initial public offering price. Shares of SuccessFactors rose as the company announced its acquisition by business software developer SAP AG in December. Additionally, the timing of the fund’s ownership in specialty coffee producer Green Mountain Coffee Roasters (b) was a large contributor to relative performance.
Respectfully,
Thomas Wetherald
Portfolio Manager
| (b) | Security is not a benchmark constituent. |
| (h) | Security was not held in the fund at period end. |
The views expressed in this report are those of the portfolio manager only through the end of the period of the report as stated on the cover and do not necessarily reflect the views of MFS or any other person in the MFS organization. These views are subject to change at any time based on market or other conditions, and MFS disclaims any responsibility to update such views. These views may not be relied upon as investment advice or an indication of trading intent on behalf of any MFS portfolio. References to specific securities are not recommendations of such securities, and may not be representative of any MFS portfolio’s current or future investments.
4
Table of Contents
MFS New Discovery Portfolio
PERFORMANCE SUMMARY THROUGH 12/31/11
The following chart illustrates the historical performance of the fund in comparison to its benchmark(s). Benchmarks are unmanaged and may not be invested in directly. Benchmark returns do not reflect any fees or expenses. The performance of other share classes will be greater than or less than that of the class depicted below. (See Notes to Performance Summary.)
Performance data shown represents past performance and is no guarantee of future results. Investment return and principal value fluctuate so your units, when sold, may be worth more or less than the original cost; current performance may be lower or higher than quoted. The performance shown does not reflect the deduction of taxes, if any, that a contract holder would pay on fund distributions or the redemption of contract units. The returns for the fund shown also do not reflect the deduction of expenses associated with variable products, such as mortality and expense risk charges, separate account charges, and sales charges imposed by the insurance company separate accounts. Such expenses would reduce the overall returns shown.
Growth of a Hypothetical $10,000 Investment
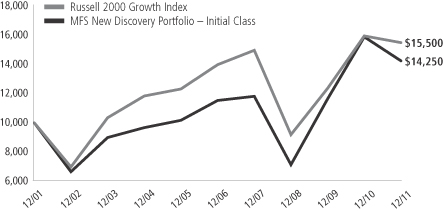
Total Returns through 12/31/11
Average annual total returns
| Share class | Class inception date | 1-yr | 5-yr | 10-yr | ||||||||
| Initial Class | 5/06/98 | (10.37)% | 4.33% | 3.61% | ||||||||
| Service Class | 8/24/01 | (10.55)% | 4.08% | 3.35% | ||||||||
| Comparative benchmark | ||||||||||||
| Russell 2000 Growth Index (f) | (2.91)% | 2.09% | 4.48% | |||||||||
| (f) | Source: FactSet Research Systems Inc. |
Benchmark Definition
Russell 2000 Growth Index – constructed to provide a comprehensive barometer for growth securities in the small-cap segment of the U.S. equity universe. Companies in this index generally have higher price-to-book ratios and higher forecasted growth values.
It is not possible to invest directly in an index.
Notes to Performance Summary
Average annual total return represents the average annual change in value for each share class for the periods presented.
Performance results reflect any applicable expense subsidies and waivers in effect during the periods shown. Without such subsidies and waivers the fund’s performance results would be less favorable. Please see the prospectus and financial statements for complete details. All results are historical and assume the reinvestment of any dividends and capital gains distributions.
Performance results do not include adjustments made for financial reporting purposes in accordance with U.S. generally accepted accounting principles and may differ from amounts reported in the financial highlights.
From time to time the fund may receive proceeds from litigation settlements, without which performance would be lower.
5
Table of Contents
MFS New Discovery Portfolio
Fund Expenses Borne by the Contract Holders During the Period,
July 1, 2011 through December 31, 2011
As a contract holder of the fund, you incur ongoing costs, including management fees; distribution and/or service (12b-1) fees; and other fund expenses. This example is intended to help you understand your ongoing costs (in dollars) of investing in the fund and to compare these costs with the ongoing costs of investing in other mutual funds.
The example is based on an investment of $1,000 invested at the beginning of the period and held for the entire period July 1, 2011 through December 31, 2011.
Actual Expenses
The first line for each share class in the following table provides information about actual account values and actual expenses. You may use the information in this line, together with the amount you invested, to estimate the expenses that you paid over the period. Simply divide your account value by $1,000 (for example, an $8,600 account value divided by $1,000 = 8.6), then multiply the result by the number in the first line under the heading entitled “Expenses Paid During Period” to estimate the expenses you paid on your account during this period.
Hypothetical Example for Comparison Purposes
The second line for each share class in the following table provides information about hypothetical account values and hypothetical expenses based on the fund’s actual expense ratio and an assumed rate of return of 5% per year before expenses, which is not the fund’s actual return. The hypothetical account values and expenses may not be used to estimate the actual ending account balance or expenses you paid for the period. You may use this information to compare the ongoing costs of investing in the fund and other funds. To do so, compare this 5% hypothetical example with the 5% hypothetical examples that appear in the shareholder reports of the other funds.
Please note that the expenses shown in the table are meant to highlight the fund’s ongoing costs only and do not take into account the fees and expenses imposed under the variable contracts through which your investment in the fund is made. Therefore, the second line for each share class in the table is useful in comparing ongoing costs associated with an investment in vehicles (such as the fund) which fund benefits under variable annuity and variable life insurance contracts and to qualified pension and retirement plans only, and will not help you determine the relative total costs of investing in the fund through variable annuity and variable life insurance contracts. If the fees and expenses imposed under the variable contracts were included, your costs would have been higher.
| Share Class | Annualized Expense Ratio | Beginning Account Value 7/01/11 | Ending Account Value 12/31/11 | Expenses Paid During Period (p) 7/01/11-12/31/11 | ||||||||||||||
| Initial Class | Actual | 0.95% | $1,000.00 | $810.57 | $4.34 | |||||||||||||
| Hypothetical (h) | 0.95% | $1,000.00 | $1,020.42 | $4.84 | ||||||||||||||
| Service Class | Actual | 1.20% | $1,000.00 | $810.04 | $5.47 | |||||||||||||
| Hypothetical (h) | 1.20% | $1,000.00 | $1,019.16 | $6.11 | ||||||||||||||
| (h) | 5% class return per year before expenses. |
| (p) | Expenses paid is equal to each class’ annualized expense ratio, as shown above, multiplied by the average account value over the period, multiplied by the number of days in the period, divided by the number of days in the year. |
6
Table of Contents
MFS New Discovery Portfolio
PORTFOLIO OF INVESTMENTS – 12/31/11
The Portfolio of Investments is a complete list of all securities owned by your fund. It is categorized by broad-based asset classes.
| Issuer | Shares/Par | Value ($) | ||||||
| COMMON STOCKS – 99.5% | ||||||||
| Aerospace – 0.9% | ||||||||
| FLIR Systems, Inc. | 14,460 | $ | 362,512 | |||||
| HEICO Corp. | 18,010 | 1,053,225 | ||||||
|
| |||||||
| $ | 1,415,737 | |||||||
|
| |||||||
| Airlines – 1.9% | ||||||||
| Allegiant Travel Co. (a) | 23,900 | $ | 1,274,826 | |||||
| Spirit Airlines, Inc. (a) | 101,460 | 1,582,776 | ||||||
|
| |||||||
| $ | 2,857,602 | |||||||
|
| |||||||
| Apparel Manufacturers – 0.9% | ||||||||
| Arezzo Industria e Comercio S.A. | 109,430 | $ | 1,361,092 | |||||
|
| |||||||
| Biotechnology – 1.6% | ||||||||
| Anacor Pharmaceuticals, Inc. (a) | 68,680 | $ | 425,816 | |||||
| Cepheid, Inc. (a) | 22,510 | 774,569 | ||||||
| Gen-Probe, Inc. (a) | 18,740 | 1,107,909 | ||||||
| NewLink Genetics Corp. (a) | 11,260 | 79,270 | ||||||
|
| |||||||
| $ | 2,387,564 | |||||||
|
| |||||||
| Business Services – 6.7% | ||||||||
| Calix, Inc. (a) | 146,140 | $ | 945,526 | |||||
| Concur Technologies, Inc. (a) | 23,790 | 1,208,294 | ||||||
| Constant Contact, Inc. (a) | 109,320 | 2,537,317 | ||||||
| FleetCor Technologies, Inc. (a) | 71,880 | 2,147,056 | ||||||
| Jones Lang LaSalle, Inc. | 26,530 | 1,625,228 | ||||||
| LPS Brasil-Consultoria de Imoveis S.A. | 21,000 | 292,722 | ||||||
| Multiplus S.A. | 47,260 | 817,121 | ||||||
| Ultimate Software Group, Inc. (a) | 5,850 | 380,952 | ||||||
|
| |||||||
| $ | 9,954,216 | |||||||
|
| |||||||
| Computer Software – 5.9% | ||||||||
| Ariba, Inc. (a) | 34,910 | $ | 980,273 | |||||
| Check Point Software Technologies Ltd. (a) | 22,140 | 1,163,236 | ||||||
| CommVault Systems, Inc. (a) | 15,320 | 654,470 | ||||||
| NetSuite, Inc. (a) | 16,840 | 682,862 | ||||||
| Nuance Communications, Inc. (a) | 78,855 | 1,983,992 | ||||||
| Red Hat, Inc. (a) | 28,140 | 1,161,901 | ||||||
| SolarWinds, Inc. (a) | 48,920 | 1,367,314 | ||||||
| Taleo Corp., “A” (a) | 20,300 | 785,407 | ||||||
|
| |||||||
| $ | 8,779,455 | |||||||
|
| |||||||
| Computer Software – Systems – 7.7% | ||||||||
| Aruba Networks, Inc. (a) | 69,470 | $ | 1,286,584 | |||||
| BroadSoft, Inc. (a) | 25,740 | 777,348 | ||||||
| Cornerstone OnDemand, Inc. (a) | 58,350 | 1,064,304 | ||||||
| Fusion-io, Inc. (a) | 26,480 | 640,816 | ||||||
| National Instruments Corp. | 48,505 | 1,258,705 | ||||||
| PROS Holdings, Inc. (a) | 46,320 | 689,242 | ||||||
| Qlik Technologies, Inc. (a) | 46,780 | 1,132,076 | ||||||
| SciQuest, Inc. (a) | 95,090 | 1,356,934 | ||||||
| ServiceSource International, Inc. (a) | 71,300 | 1,118,697 | ||||||
| Tangoe, Inc. (a) | 112,450 | 1,731,730 | ||||||
| Velti PLC (a) | 55,880 | 379,984 | ||||||
|
| |||||||
| $ | 11,436,420 | |||||||
|
| |||||||
| Issuer | Shares/Par | Value ($) | ||||||
| COMMON STOCKS – continued | ||||||||
| Construction – 1.6% | ||||||||
| Beacon Roofing Supply, Inc. (a) | 40,590 | $ | 821,136 | |||||
| Eagle Materials, Inc. | 16,690 | 428,265 | ||||||
| NVR, Inc. (a) | 1,710 | 1,173,060 | ||||||
|
| |||||||
| $ | 2,422,461 | |||||||
|
| |||||||
| Consumer Products – 0.4% | ||||||||
| L’Occitane International S.A. | 332,500 | $ | 667,860 | |||||
|
| |||||||
| Consumer Services – 3.0% | ||||||||
| Anhanguera Educacional Participacoes S.A. | 121,800 | $ | 1,312,521 | |||||
| HomeAway, Inc. (a) | 113,050 | 2,628,413 | ||||||
| MakeMyTrip Ltd. (a) | 25,400 | 610,616 | ||||||
|
| |||||||
| $ | 4,551,550 | |||||||
|
| |||||||
| Electrical Equipment – 1.8% | ||||||||
| MSC Industrial Direct Co., Inc., “A” | 22,170 | $ | 1,586,264 | |||||
| Sensata Technologies Holding B.V. (a) | 42,360 | 1,113,221 | ||||||
|
| |||||||
| $ | 2,699,485 | |||||||
|
| |||||||
| Electronics – 4.0% | ||||||||
| Entegris, Inc. (a) | 111,100 | $ | 969,348 | |||||
| Monolithic Power Systems, Inc. (a) | 113,120 | 1,704,718 | ||||||
| Semtech Corp. (a) | 44,910 | 1,114,666 | ||||||
| Stratasys, Inc. (a) | 37,800 | 1,149,498 | ||||||
| Veeco Instruments, Inc. (a) | 50,840 | 1,057,472 | ||||||
|
| |||||||
| $ | 5,995,702 | |||||||
|
| |||||||
| Energy – Independent – 5.1% | ||||||||
| Cabot Oil & Gas Corp. | 40,650 | $ | 3,085,335 | |||||
| Energy XXI (Bermuda) Ltd. (a) | 73,035 | 2,328,356 | ||||||
| EXCO Resources, Inc. | 129,900 | 1,357,455 | ||||||
| Pinecrest Energy, Inc. (a) | 371,620 | 864,529 | ||||||
|
| |||||||
| $ | 7,635,675 | |||||||
|
| |||||||
| Entertainment – 0.3% | ||||||||
| Six Flags Entertainment Corp. | 10,260 | $ | 423,122 | |||||
|
| |||||||
| Food & Beverages – 1.5% | ||||||||
| Green Mountain Coffee Roasters, Inc. (a) | 51,500 | $ | 2,309,775 | |||||
|
| |||||||
| Food & Drug Stores – 0.1% | ||||||||
| Sun Art Retail Group Ltd. (a) | 146,000 | $ | 182,533 | |||||
|
| |||||||
| Gaming & Lodging – 2.1% | ||||||||
| Morgans Hotel Group Co. (a) | 116,790 | $ | 689,061 | |||||
| WMS Industries, Inc. (a) | 55,290 | 1,134,551 | ||||||
| Wynn Resorts Ltd. | 11,260 | 1,244,117 | ||||||
|
| |||||||
| $ | 3,067,729 | |||||||
|
| |||||||
| General Merchandise – 0.5% | ||||||||
| Lojas Renner S.A. | 27,800 | $ | 721,511 | |||||
|
| |||||||
| Health Maintenance Organizations – 0.4% | ||||||||
| OdontoPrev S.A. | 38,900 | $ | 554,746 | |||||
|
| |||||||
7
Table of Contents
MFS New Discovery Portfolio
Portfolio of Investments – continued
| Issuer | Shares/Par | Value ($) | ||||||
| COMMON STOCKS – continued | ||||||||
| Insurance – 1.1% | ||||||||
| Brazil Insurance Participacoes e Administracao S.A. | 186,880 | $ | 1,703,235 | |||||
|
| |||||||
| Internet – 5.7% | ||||||||
| LinkedIn Corp., “A” (a) | 30,120 | $ | 1,897,861 | |||||
| LogMeIn, Inc. (a) | 21,830 | 841,547 | ||||||
| OpenTable, Inc. (a)(l) | 59,980 | 2,347,017 | ||||||
| QuinStreet, Inc. (a) | 135,580 | 1,269,029 | ||||||
| WebMD Health Corp. (a) | 58,700 | 2,204,185 | ||||||
|
| |||||||
| $ | 8,559,639 | |||||||
|
| |||||||
| Machinery & Tools – 6.8% | ||||||||
| Douglas Dynamics, Inc. | 37,770 | $ | 552,197 | |||||
| Finning International, Inc. | 47,160 | 1,028,146 | ||||||
| Herman Miller, Inc. | 62,480 | 1,152,756 | ||||||
| IPG Photonics Corp. (a) | 28,280 | 957,844 | ||||||
| Joy Global, Inc. | 17,200 | 1,289,484 | ||||||
| Nordson Corp. | 25,810 | 1,062,856 | ||||||
| Polypore International, Inc. (a) | 27,300 | 1,200,927 | ||||||
| United Rentals, Inc. (a) | 52,660 | 1,556,103 | ||||||
| WABCO Holdings, Inc. (a) | 30,790 | 1,336,286 | ||||||
|
| |||||||
| $ | 10,136,599 | |||||||
|
| |||||||
| Medical & Health Technology & Services – 8.0% | ||||||||
| Advisory Board Co. (a) | 10,470 | $ | 776,979 | |||||
| Air Methods Corp. (a) | 17,760 | 1,499,832 | ||||||
| Allscripts Healthcare Solutions, Inc. (a) | 73,620 | 1,394,363 | ||||||
| Brookdale Senior Living, Inc. (a) | 169,800 | 2,952,822 | ||||||
| Cerner Corp. (a) | 26,950 | 1,650,688 | ||||||
| Diagnosticos da America S.A. | 84,800 | 704,678 | ||||||
| Fleury S.A. | 60,100 | 689,527 | ||||||
| Healthcare Services Group, Inc. | 62,240 | 1,101,026 | ||||||
| HealthStream, Inc. (a) | 17,920 | 330,624 | ||||||
| IPC The Hospitalist Co., Inc. (a) | 18,360 | 839,419 | ||||||
|
| |||||||
| $ | 11,939,958 | |||||||
|
| |||||||
| Medical Equipment – 9.4% | ||||||||
| Align Technology, Inc. (a) | 36,970 | $ | 877,113 | |||||
| Conceptus, Inc. (a) | 84,430 | 1,067,195 | ||||||
| DexCom, Inc. (a) | 117,530 | 1,094,204 | ||||||
| Endologix, Inc. (a) | 141,760 | 1,627,405 | ||||||
| Essilor International S.A. | 15,665 | 1,104,445 | ||||||
| Heartware International, Inc. (a) | 10,660 | 735,540 | ||||||
| Masimo Corp. (a) | 73,310 | 1,369,797 | ||||||
| NxStage Medical, Inc. (a) | 78,390 | 1,393,774 | ||||||
| Sirona Dental Systems, Inc. (a) | 24,980 | 1,100,119 | ||||||
| Sonova Holding AG | 11,317 | 1,183,749 | ||||||
| Thoratec Corp. (a) | 30,200 | 1,013,512 | ||||||
| Uroplasty, Inc. (a) | 162,030 | 688,628 | ||||||
| Volcano Corp. (a) | 30,870 | 734,397 | ||||||
|
| |||||||
| $ | 13,989,878 | |||||||
|
| |||||||
| Metals & Mining – 1.4% | ||||||||
| Globe Specialty Metals, Inc. | 86,190 | $ | 1,154,084 | |||||
| Molycorp, Inc. (a) | 36,390 | 872,632 | ||||||
|
| |||||||
| $ | 2,026,716 | |||||||
|
| |||||||
| Issuer | Shares/Par | Value ($) | ||||||
| COMMON STOCKS – continued | ||||||||
| Network & Telecom – 5.3% | ||||||||
| Acme Packet, Inc. (a) | 51,660 | $ | 1,596,811 | |||||
| F5 Networks, Inc. (a) | 17,360 | 1,842,243 | ||||||
| Fortinet, Inc. (a) | 86,440 | 1,885,256 | ||||||
| Polycom, Inc. (a) | 89,440 | 1,457,872 | ||||||
| Riverbed Technology, Inc. (a) | 48,430 | 1,138,105 | ||||||
|
| |||||||
| $ | 7,920,287 | |||||||
|
| |||||||
| Oil Services – 2.0% | ||||||||
| Atwood Oceanics, Inc. (a) | 27,070 | $ | 1,077,115 | |||||
| Dresser-Rand Group, Inc. (a) | 37,200 | 1,856,652 | ||||||
|
| |||||||
| $ | 2,933,767 | |||||||
|
| |||||||
| Other Banks & Diversified Financials – 2.8% | ||||||||
| Air Lease Corp. (a) | 49,300 | $ | 1,168,903 | |||||
| BankUnited, Inc. | 50,610 | 1,112,914 | ||||||
| First Republic Bank (a) | 43,470 | 1,330,617 | ||||||
| Zipcar, Inc. (a) | 46,180 | 619,736 | ||||||
|
| |||||||
| $ | 4,232,170 | |||||||
|
| |||||||
| Pharmaceuticals – 0.9% | ||||||||
| Perrigo Co. | 13,300 | $ | 1,294,090 | |||||
|
| |||||||
| Precious Metals & Minerals – 0.5% | ||||||||
| Colossus Minerals, Inc. (a) | 114,220 | $ | 676,070 | |||||
|
| |||||||
| Railroad & Shipping – 0.3% | ||||||||
| Diana Shipping, Inc. (a) | 49,810 | $ | 372,579 | |||||
|
| |||||||
| Restaurants – 1.4% | ||||||||
| Arcos Dorados Holdings, Inc. | 47,330 | $ | 971,685 | |||||
| Dunkin Brands Group, Inc. (a) | 45,170 | 1,128,347 | ||||||
|
| |||||||
| $ | 2,100,032 | |||||||
|
| |||||||
| Specialty Chemicals – 1.2% | ||||||||
| Ecosynthetix, Inc. (a)(z) | 46,190 | $ | 226,699 | |||||
| Rockwood Holdings, Inc. (a) | 40,370 | 1,589,367 | ||||||
|
| |||||||
| $ | 1,816,066 | |||||||
|
| |||||||
| Specialty Stores – 4.5% | ||||||||
| Citi Trends, Inc. (a) | 134,520 | $ | 1,181,086 | |||||
| Francesca’s Holdings Corp. (a) | 85,260 | 1,474,998 | ||||||
| Monro Muffler Brake, Inc. | 19,780 | 767,265 | ||||||
| Urban Outfitters, Inc. (a) | 75,690 | 2,086,016 | ||||||
| Zumiez, Inc. (a) | 41,830 | 1,161,201 | ||||||
|
| |||||||
| $ | 6,670,566 | |||||||
|
| |||||||
| Trucking – 1.8% | ||||||||
| Atlas Air Worldwide Holdings, Inc. (a) | 39,340 | $ | 1,511,836 | |||||
| Swift Transportation Co. (a) | 150,660 | 1,241,438 | ||||||
|
| |||||||
| $ | 2,753,274 | |||||||
|
| |||||||
| Total Common Stocks (Identified Cost, $158,408,340) | $ | 148,549,161 | ||||||
|
| |||||||
8
Table of Contents
MFS New Discovery Portfolio
Portfolio of Investments – continued
| Issuer | Strike Price | First Exercise | Shares/Par | Value ($) | ||||||||||||
| WARRANTS – 0.0% | ||||||||||||||||
| Alcoholic Beverages – 0.0% | ||||||||||||||||
| Castle Brands, Inc. (1 share for 1 warrant) (Identified Cost, $70,840) (a) | $ | 6.57 | 5/08/07 | 50,440 | $ | 0 | ||||||||||
|
| |||||||||||||||
| MONEY MARKET FUNDS – 0.4% | ||||||||||||||||
| MFS Institutional Money Market Portfolio, 0.05%, at Cost and Net Asset Value (v) | 529,518 | $ | 529,518 | |||||||||||||
|
| |||||||||||||||
| Issuer | Shares/Par | Value ($) | ||||||
| COLLATERAL FOR SECURITIES LOANED – 0.7% | ||||||||
| Navigator Securities Lending Prime Portfolio, 0.27%, at Cost and Net Asset Value (j) | 1,126,799 | $ | 1,126,799 | |||||
|
| |||||||
Total Investments (Identified Cost, $160,135,497) |
| $ | 150,205,478 | |||||
|
| |||||||
| OTHER ASSETS, LESS LIABILITIES – (0.6)% | (882,882 | ) | ||||||
|
| |||||||
| Net Assets – 100.0% | $ | 149,322,596 | ||||||
|
| |||||||
| (a) | Non-income producing security. |
| (j) | The rate quoted is the annualized seven-day yield of the portfolio at period end. |
| (l) | A portion of this security is on loan. |
| (v) | Underlying affiliated fund that is available only to investment companies managed by MFS. The rate quoted for the MFS Institutional Money Market Portfolio is the annualized seven-day yield of the fund at period end. |
| (z) | Restricted securities are not registered under the Securities Act of 1933 and are subject to legal restrictions on resale. These securities generally may be resold in transactions exempt from registration or to the public if the securities are subsequently registered. Disposal of these securities may involve time-consuming negotiations and prompt sale at an acceptable price may be difficult. The fund holds the following restricted securities: |
| Restricted Securities | Acquisition Date | Cost | Value | |||||||
| Ecosynthetix, Inc. | 7/28/11 | $436,877 | $226,699 | |||||||
| % of Net Assets | 0.2% | |||||||||
The following abbreviations are used in this report and are defined:
| PLC | Public Limited Company |
See Notes to Financial Statements
9
Table of Contents
MFS New Discovery Portfolio
FINANCIAL STATEMENTS | STATEMENT OF ASSETS AND LIABILITIES
This statement represents your fund’s balance sheet, which details the assets and liabilities comprising the total value of the fund.
At 12/31/11 | ||||||||
Assets | ||||||||
Investments – | ||||||||
Non-affiliated issuers, at value (identified cost, $159,605,979) | $149,675,960 | |||||||
Underlying affiliated funds, at cost and value | 529,518 | |||||||
Total investments, at value, including $1,095,444 of securities on loan (identified cost, $160,135,497) | $150,205,478 | |||||||
Foreign currency, at value (identified cost, $32,969) | 32,938 | |||||||
Receivables for | ||||||||
Investments sold | 519,643 | |||||||
Interest and dividends | 36,380 | |||||||
Other assets | 4,851 | |||||||
Total assets | $150,799,290 | |||||||
Liabilities | ||||||||
Payables for | ||||||||
Investments purchased | $42,284 | |||||||
Fund shares reacquired | 224,503 | |||||||
Collateral for securities loaned, at value | 1,126,799 | |||||||
Payable to affiliates | ||||||||
Investment adviser | 12,315 | |||||||
Distribution and/or service fees | 1,636 | |||||||
Payable for Trustees’ compensation | 407 | |||||||
Accrued expenses and other liabilities | 68,750 | |||||||
Total liabilities | $1,476,694 | |||||||
Net assets | $149,322,596 | |||||||
Net assets consist of | ||||||||
Paid-in capital | $148,810,746 | |||||||
Unrealized appreciation (depreciation) on investments and translation of assets and liabilities in foreign currencies | (9,930,599 | ) | ||||||
Accumulated net realized gain (loss) on investments and foreign currency transactions | 10,442,449 | |||||||
Net assets | $149,322,596 | |||||||
Shares of beneficial interest outstanding | 9,995,602 |
| Net assets | Shares outstanding | Net asset value per share | ||||||||||
Initial Class | $69,663,595 | 4,582,526 | $15.20 | |||||||||
Service Class | 79,659,001 | 5,413,076 | 14.72 | |||||||||
See Notes to Financial Statements
10
Table of Contents
MFS New Discovery Portfolio
FINANCIAL STATEMENTS | STATEMENT OF OPERATIONS
This statement describes how much your fund earned in investment income and accrued in expenses. It also describes any gains and/or losses generated by fund operations.
| Year ended 12/31/11 | ||||||||
| Net investment loss | ||||||||
Income | ||||||||
Dividends | $649,938 | |||||||
Income on securities loaned | 87,611 | |||||||
Interest | 283 | |||||||
Dividends from underlying affiliated funds | 925 | |||||||
Foreign taxes withheld | (16,665 | ) | ||||||
Total investment income | $722,092 | |||||||
Expenses | ||||||||
Management fee | $1,620,097 | |||||||
Distribution and/or service fees | 242,175 | |||||||
Administrative services fee | 60,490 | |||||||
Trustees’ compensation | 22,329 | |||||||
Custodian fee | 51,606 | |||||||
Shareholder communications | 16,339 | |||||||
Auditing fees | 66,568 | |||||||
Legal fees | 5,432 | |||||||
Miscellaneous | 24,409 | |||||||
Total expenses | $2,109,445 | |||||||
Fees paid indirectly | (16 | ) | ||||||
Reduction of expenses by investment adviser | (154,379 | ) | ||||||
Net expenses | $1,955,050 | |||||||
Net investment loss | $(1,232,958 | ) | ||||||
Realized and unrealized gain (loss) on investments and foreign currency transactions | ||||||||
Realized gain (loss) (identified cost basis) | ||||||||
Investment transactions (net of $217 country tax) | $12,082,390 | |||||||
Foreign currency transactions | (170,944 | ) | ||||||
Net realized gain (loss) on investments and foreign currency transactions | $11,911,446 | |||||||
Change in unrealized appreciation (depreciation) | ||||||||
Investments | $(27,205,357 | ) | ||||||
Translation of assets and liabilities in foreign currencies | (539 | ) | ||||||
Net unrealized gain (loss) on investments and foreign currency translation | $(27,205,896 | ) | ||||||
Net realized and unrealized gain (loss) on investments and foreign currency | $(15,294,450 | ) | ||||||
Change in net assets from operations | $(16,527,408 | ) |
See Notes to Financial Statements
11
Table of Contents
MFS New Discovery Portfolio
FINANCIAL STATEMENTS | STATEMENTS OF CHANGES IN NET ASSETS
These statements describe the increases and/or decreases in net assets resulting from operations, any distributions, and any shareholder transactions.
For years ended 12/31 | 2011 | 2010 | ||||||
Change in net assets | ||||||||
From operations | ||||||||
Net investment loss | $(1,232,958 | ) | $(1,169,929 | ) | ||||
Net realized gain (loss) on investments and foreign currency transactions | 11,911,446 | 60,222,620 | ||||||
Net unrealized gain (loss) on investments and foreign currency translation | (27,205,896 | ) | 62,154 | |||||
Change in net assets from operations | $(16,527,408 | ) | $59,114,845 | |||||
| Distributions declared to shareholders | ||||||||
From net realized gain on investments | $(14,519,487 | ) | $— | |||||
Change in net assets from fund share transactions | $(14,650,729 | ) | $(58,230,686 | ) | ||||
Total change in net assets | $(45,697,624 | ) | $884,159 | |||||
| Net assets | ||||||||
At beginning of period | 195,020,220 | 194,136,061 | ||||||
At end of period | $149,322,596 | $195,020,220 |
See Notes to Financial Statements
12
Table of Contents
MFS New Discovery Portfolio
FINANCIAL STATEMENTS | FINANCIAL HIGHLIGHTS
The financial highlights table is intended to help you understand the fund’s financial performance for the past 5 years. Certain information reflects financial results for a single fund share. The total returns in the table represent the rate by which an investor would have earned (or lost) on an investment in the fund share class (assuming reinvestment of all distributions) held for the entire period.
| Initial Class | Years ended 12/31 | |||||||||||||||||||
| 2011 | 2010 | 2009 | 2008 | 2007 | ||||||||||||||||
Net asset value, beginning of period | $18.63 | $13.64 | $8.37 | $16.24 | $16.24 | |||||||||||||||
| Income (loss) from investment operations | ||||||||||||||||||||
Net investment loss (d) | $(0.10 | ) | $(0.07 | ) | $(0.05 | ) | $(0.04 | ) | $(0.08 | ) | ||||||||||
Net realized and unrealized gain (loss) on investments | (1.78 | ) | 5.06 | 5.32 | (5.42 | ) | 0.52 | |||||||||||||
Total from investment operations | $(1.88 | ) | $4.99 | $5.27 | $(5.46 | ) | $0.44 | |||||||||||||
| Less distributions declared to shareholders | ||||||||||||||||||||
From net realized gain on investments | $(1.55 | ) | $— | $— | $(2.41 | ) | $(0.44 | ) | ||||||||||||
Net asset value, end of period (x) | $15.20 | $18.63 | $13.64 | $8.37 | $16.24 | |||||||||||||||
Total return (%) (k)(r)(s)(x) | (10.37 | ) | 36.58 | 62.96 | (39.57 | ) | 2.56 | |||||||||||||
| Ratios (%) (to average net assets) and Supplemental data: | ||||||||||||||||||||
Expenses before expense reductions (f) | 1.04 | 1.09 | 1.05 | 1.02 | 1.00 | |||||||||||||||
Expenses after expense reductions (f) | 0.95 | 0.95 | 0.95 | 0.95 | 0.95 | |||||||||||||||
Net investment loss | (0.55 | ) | (0.48 | ) | (0.49 | ) | (0.28 | ) | (0.45 | ) | ||||||||||
Portfolio turnover | 176 | 192 | 153 | 127 | 95 | |||||||||||||||
Net assets at end of period (000 omitted) | $69,664 | $87,806 | $78,620 | $59,861 | $130,029 | |||||||||||||||
| Service Class | Years ended 12/31 | |||||||||||||||||||
| 2011 | 2010 | 2009 | 2008 | 2007 | ||||||||||||||||
Net asset value, beginning of period | $18.13 | $13.31 | $8.18 | $15.97 | $16.02 | |||||||||||||||
| Income (loss) from investment operations | ||||||||||||||||||||
Net investment loss (d) | $(0.14 | ) | $(0.11 | ) | $(0.07 | ) | $(0.07 | ) | $(0.12 | ) | ||||||||||
Net realized and unrealized gain (loss) on investments | (1.72 | ) | 4.93 | 5.20 | (5.31 | ) | 0.51 | |||||||||||||
Total from investment operations | $(1.86 | ) | $4.82 | $5.13 | $(5.38 | ) | $0.39 | |||||||||||||
| Less distributions declared to shareholders | ||||||||||||||||||||
From net realized gain on investments | $(1.55 | ) | $— | $— | $(2.41 | ) | $(0.44 | ) | ||||||||||||
Net asset value, end of period (x) | $14.72 | $18.13 | $13.31 | $8.18 | $15.97 | |||||||||||||||
Total return (%) (k)(r)(s)(x) | (10.55 | ) | 36.21 | 62.71 | (39.76 | ) | 2.28 | |||||||||||||
| Ratios (%) (to average net assets) and Supplemental data: | ||||||||||||||||||||
Expenses before expense reductions (f) | 1.29 | 1.34 | 1.30 | 1.27 | 1.25 | |||||||||||||||
Expenses after expense reductions (f) | 1.20 | 1.20 | 1.20 | 1.20 | 1.20 | |||||||||||||||
Net investment loss | (0.80 | ) | (0.73 | ) | (0.74 | ) | (0.54 | ) | (0.70 | ) | ||||||||||
Portfolio turnover | 176 | 192 | 153 | 127 | 95 | |||||||||||||||
Net assets at end of period (000 omitted) | $79,659 | $107,214 | $115,516 | $104,937 | $186,516 | |||||||||||||||
| (d) | Per share data is based on average shares outstanding. |
| (f) | Ratios do not reflect reductions from fees paid indirectly, if applicable. |
| (k) | The total return does not reflect expenses that apply to separate accounts. Inclusion of these charges would reduce the total return figures for all periods shown. |
| (r) | Certain expenses have been reduced without which performance would have been lower. |
| (s) | From time to time the fund may receive proceeds from litigation settlements, without which performance would be lower. |
| (x) | The net asset values per share and total returns have been calculated on net assets which include adjustments made in accordance with U.S. generally accepted accounting principles required at period end for financial reporting purposes. |
See Notes to Financial Statements
13
Table of Contents
MFS New Discovery Portfolio
| (1) | Business and Organization |
MFS New Discovery Portfolio (the fund) is a series of MFS Variable Insurance Trust II (the trust). The trust is organized as a Massachusetts business trust and is registered under the Investment Company Act of 1940, as amended, as an open-end management investment company. The shareholders of each series of the trust are separate accounts of insurance companies, which offer variable annuity and/or life insurance products, and qualified retirement and pension plans.
| (2) | Significant Accounting Policies |
General – The preparation of financial statements in conformity with U.S. generally accepted accounting principles requires management to make estimates and assumptions that affect the reported amounts of assets and liabilities, and disclosure of contingent assets and liabilities at the date of the financial statements and the reported amounts of revenues and expenses during the reporting period. Actual results could differ from those estimates. In the preparation of these financial statements, management has evaluated subsequent events occurring after the date of the fund’s Statement of Assets and Liabilities through the date that the financial statements were issued. The fund invests in foreign securities. Investments in foreign securities are vulnerable to the effects of changes in the relative values of the local currency and the U.S. dollar and to the effects of changes in each country’s legal, political, and economic environment.
In December 2011, the Financial Accounting Standards Board issued Accounting Standards Update 2011-11, Balance Sheet (Topic 210) – Disclosures about Offsetting Assets and Liabilities (“ASU 2011-11”). Effective for annual reporting periods beginning on or after January 1, 2013 and interim periods within those annual periods, ASU 2011-11 is intended to enhance disclosure requirements on the offsetting of financial assets and liabilities. Although still evaluating the potential impacts of ASU 2011-11 to the fund, management expects that the impact of the fund’s adoption will be limited to additional financial statement disclosures.
Investment Valuations – Equity securities, including restricted equity securities, are generally valued at the last sale or official closing price as provided by a third-party pricing service on the market or exchange on which they are primarily traded. Equity securities, for which there were no sales reported that day, are generally valued at the last quoted daily bid quotation as provided by a third-party pricing service on the market or exchange on which such securities are primarily traded. Equity securities held short, for which there were no sales reported for that day, are generally valued at the last quoted daily ask quotation as provided by a third-party pricing service on the market or exchange on which such securities are primarily traded. Short-term instruments with a maturity at issuance of 60 days or less generally are valued at amortized cost, which approximates market value. Open-end investment companies are generally valued at net asset value per share. Securities and other assets generally valued on the basis of information from a third-party pricing service may also be valued at a broker/dealer bid quotation. Values obtained from third-party pricing services can utilize both transaction data and market information such as yield, quality, coupon rate, maturity, type of issue, trading characteristics, and other market data. The values of foreign securities and other assets and liabilities expressed in foreign currencies are converted to U.S. dollars using the mean of bid and asked prices for rates provided by a third-party pricing service.
The Board of Trustees has delegated primary responsibility for determining or causing to be determined the value of the fund’s investments (including any fair valuation) to the adviser pursuant to valuation policies and procedures approved by the Board. If the adviser determines that reliable market quotations are not readily available, investments are valued at fair value as determined in good faith by the adviser in accordance with such procedures under the oversight of the Board of Trustees. Under the fund’s valuation policies and procedures, market quotations are not considered to be readily available for most types of debt instruments and floating rate loans and many types of derivatives. These investments are generally valued at fair value based on information from third-party pricing services. In addition, investments may be valued at fair value if the adviser determines that an investment’s value has been materially affected by events occurring after the close of the exchange or market on which the investment is principally traded (such as foreign exchange or market) and prior to the determination of the fund’s net asset value, or after the halting of trading of a specific security where trading does not resume prior to the close of the exchange or market on which the security is principally traded. Events that occur on a frequent basis after foreign markets close (such as developments in foreign markets and significant movements in the U.S. markets) and prior to the determination of the fund’s net asset value may be deemed to have a material effect on the value of securities traded in foreign markets. Accordingly, the fund’s foreign equity securities may often be valued at fair value. The adviser generally relies on third-party pricing services or other information (such as the correlation with price movements of similar securities in the same or other markets; the type, cost and investment characteristics of the security; the business and financial condition of the issuer; and trading and other market data) to assist in determining whether to fair value and at what value to fair value an investment. The value of an investment for purposes of calculating the fund’s net asset value can differ depending on the source and method used to determine value. When fair valuation is used, the value of an investment used to determine the
14
Table of Contents
MFS New Discovery Portfolio
Notes to Financial Statements – continued
fund’s net asset value may differ from quoted or published prices for the same investment. There can be no assurance that the fund could obtain the fair value assigned to an investment if it were to sell the investment at the same time at which the fund determines its net asset value per share.
Various inputs are used in determining the value of the fund’s assets or liabilities. These inputs are categorized into three broad levels. In certain cases, the inputs used to measure fair value may fall into different levels of the fair value hierarchy. In such cases, an investment’s level within the fair value hierarchy is based on the lowest level of input that is significant to the fair value measurement. The fund’s assessment of the significance of a particular input to the fair value measurement in its entirety requires judgment, and considers factors specific to the investment. Level 1 includes unadjusted quoted prices in active markets for identical assets or liabilities. Level 2 includes other significant observable market-based inputs (including quoted prices for similar securities, interest rates, prepayment speed, and credit risk). Level 3 includes unobservable inputs, which may include the adviser’s own assumptions in determining the fair value of investments. The following is a summary of the levels used as of December 31, 2011 in valuing the fund’s assets or liabilities:
| Investments at Value | Level 1 | Level 2 | Level 3 | Total | ||||||||||||
| Equity Securities: | ||||||||||||||||
United States | $130,959,877 | $— | $— | $130,959,877 | ||||||||||||
Brazil | 8,157,153 | — | — | 8,157,153 | ||||||||||||
Canada | 2,568,746 | 226,700 | — | 2,795,446 | ||||||||||||
Switzerland | 1,183,748 | — | — | 1,183,748 | ||||||||||||
Israel | 1,163,236 | — | — | 1,163,236 | ||||||||||||
France | — | 1,104,445 | — | 1,104,445 | ||||||||||||
Virgin Islands GB | 971,684 | — | — | 971,684 | ||||||||||||
Luxembourg | 667,860 | — | — | 667,860 | ||||||||||||
India | 610,616 | — | — | 610,616 | ||||||||||||
Other Countries | 935,096 | — | — | 935,096 | ||||||||||||
| Mutual Funds | 1,656,317 | — | — | 1,656,317 | ||||||||||||
| Total Investments | $148,874,333 | $1,331,145 | $— | $150,205,478 | ||||||||||||
For further information regarding security characteristics, see the Portfolio of Investments.
Foreign Currency Translation – Purchases and sales of foreign investments, income, and expenses are converted into U.S. dollars based upon currency exchange rates prevailing on the respective dates of such transactions or on the reporting date for foreign denominated receivables and payables. Gains and losses attributable to foreign currency exchange rates on sales of securities are recorded for financial statement purposes as net realized gains and losses on investments. Gains and losses attributable to foreign exchange rate movements on receivables, payables, income and expenses are recorded for financial statement purposes as foreign currency transaction gains and losses. That portion of both realized and unrealized gains and losses on investments that results from fluctuations in foreign currency exchange rates is not separately disclosed.
Security Loans – State Street Bank and Trust Company (“State Street”), as lending agent, loans the securities of the fund to certain qualified institutions (the “Borrowers”) approved by the fund. The loans are collateralized by cash and/or U.S. Treasury and federal agency obligations in an amount typically at least equal to the market value of the securities loaned. The market value of the loaned securities is determined at the close of business of the fund and any additional required collateral is delivered to the fund on the next business day. State Street provides the fund with indemnification against Borrower default. The fund bears the risk of loss with respect to the investment of cash collateral. On loans collateralized by cash, the cash collateral is invested in a money market fund or short-term securities. A portion of the income generated upon investment of the collateral is remitted to the Borrowers, and the remainder is allocated between the fund and the lending agent. On loans collateralized by U.S. Treasury and/or federal agency obligations, a fee is received from the Borrower, and is allocated between the fund and the lending agent. Income from securities lending is separately reported on the Statement of Operations. The dividend and interest income earned on the securities loaned is accounted for in the same manner as other dividend and interest income.
Indemnifications – Under the fund’s organizational documents, its officers and Trustees may be indemnified against certain liabilities and expenses arising out of the performance of their duties to the fund. Additionally, in the normal course of business, the fund enters into agreements with service providers that may contain indemnification clauses. The fund’s maximum exposure under these agreements is unknown as this would involve future claims that may be made against the fund that have not yet occurred.
Investment Transactions and Income – Investment transactions are recorded on the trade date. Interest income is recorded on the accrual basis. Dividends received in cash are recorded on the ex-dividend date. Certain dividends from foreign securities
15
Table of Contents
MFS New Discovery Portfolio
Notes to Financial Statements – continued
will be recorded when the fund is informed of the dividend if such information is obtained subsequent to the ex-dividend date. Dividend and interest payments received in additional securities are recorded on the ex-dividend or ex-interest date in an amount equal to the value of the security on such date.
The fund may receive proceeds from litigation settlements. Any proceeds received from litigation involving portfolio holdings are reflected in the Statement of Operations in realized gain/loss if the security has been disposed of by the fund or in unrealized gain/loss if the security is still held by the fund. Any other proceeds from litigation not related to portfolio holdings are reflected as other income in the Statement of Operations.
Fees Paid Indirectly – The fund’s custody fee may be reduced according to an arrangement that measures the value of cash deposited with the custodian by the fund. This amount, for the year ended December 31, 2011, is shown as a reduction of total expenses on the Statement of Operations.
Tax Matters and Distributions – The fund intends to qualify as a regulated investment company, as defined under Subchapter M of the Internal Revenue Code, and to distribute all of its taxable income, including realized capital gains. As a result, no provision for federal income tax is required. The fund’s federal tax returns for the prior three fiscal years remain subject to examination by the Internal Revenue Service. Foreign taxes have been accrued by the fund in the accompanying financial statements.
Distributions to shareholders are recorded on the ex-dividend date. Income and capital gain distributions are determined in accordance with income tax regulations, which may differ from U.S. generally accepted accounting principles. Certain capital accounts in the financial statements are periodically adjusted for permanent differences in order to reflect their tax character. These adjustments have no impact on net assets or net asset value per share. Temporary differences which arise from recognizing certain items of income, expense, gain or loss in different periods for financial statement and tax purposes will reverse at some time in the future. Distributions in excess of net investment income or net realized gains are temporary overdistributions for financial statement purposes resulting from differences in the recognition or classification of income or distributions for financial statement and tax purposes.
Book/tax differences primarily relate to wash sale loss deferrals.
The tax character of distributions declared to shareholders for the last two fiscal years is as follows:
| 12/31/11 | 12/31/10 | |||||||
| Ordinary income (including any short-term capital gains) | $10,192,031 | $— | ||||||
| Long-term capital gain | 4,327,456 | — | ||||||
| Total distributions | $14,519,487 | $— | ||||||
The federal tax cost and the tax basis components of distributable earnings were as follows:
| As of 12/31/11 | ||||
| Cost of investments | $164,592,266 | |||
| Gross appreciation | 10,135,490 | |||
| Gross depreciation | (24,522,278 | ) | ||
| Net unrealized appreciation (depreciation) | $(14,386,788 | ) | ||
Undistributed ordinary income | 14,899,218 | |||
| Other temporary differences | (580 | ) |
Multiple Classes of Shares of Beneficial Interest – The fund offers multiple classes of shares, which differ in their respective distribution and/or service fees. The fund’s income, realized and unrealized gain (loss), and common expenses are allocated to shareholders based on the daily net assets of each class. Dividends are declared separately for each class. Differences in per share dividend rates are generally due to differences in separate class expenses. The fund’s distributions declared to shareholders as reported on the Statements of Changes in Net Assets are presented by class as follows:
| From net realized gain on investments | ||||||||
| Year ended 12/31/11 | Year ended 12/31/10 | |||||||
| Initial Class | $6,701,669 | $— | ||||||
| Service Class | 7,817,818 | — | ||||||
| Total | $14,519,487 | $— | ||||||
16
Table of Contents
MFS New Discovery Portfolio
Notes to Financial Statements – continued
| (3) | Transactions with Affiliates |
Investment Adviser – The fund has an investment advisory agreement with MFS to provide overall investment management and related administrative services and facilities to the fund. The management fee is computed daily and paid monthly at the following annual rates:
| First $1 billion of average daily net assets | 0.90% | |||
| Average daily net assets in excess of $1 billion | 0.80% |
The investment adviser has agreed in writing to reduce its management fee to 0.75% of average daily net assets in excess of $2.5 billion. This written agreement will continue until modified by the fund’s Board of Trustees, but such agreement will continue at least until April 30, 2013. For the year ended December 31, 2011, the fund’s average daily net assets did not exceed $2.5 billion and therefore, the management fee was not reduced. The management fee incurred for the year ended December 31, 2011 was equivalent to an annual effective rate of 0.90% of the fund’s average daily net assets.
The investment adviser has agreed in writing to pay a portion of the fund’s total annual operating expenses, exclusive of interest, taxes, extraordinary expenses, brokerage and transaction costs, and investment-related expenses, such that total annual operating expenses do not exceed 0.95% of average daily net assets for the Initial Class shares and 1.20% of average daily net assets for the Service Class shares. This written agreement will continue until April 30, 2013. For the year ended December 31, 2011, this reduction amounted to $154,379 and is reflected as a reduction of total expenses in the Statement of Operations.
Distributor – MFS Fund Distributors, Inc. (MFD), a wholly-owned subsidiary of MFS, is the distributor of shares of the fund. The Trustees have adopted a distribution plan for the Service Class shares pursuant to Rule 12b-1 under the Investment Company Act of 1940.
The fund’s distribution plan provides that the fund will pay MFD distribution and/or service fees equal to 0.25% per annum of its average daily net assets attributable to Service Class shares as partial consideration for services performed and expenses incurred by MFD and financial intermediaries (including participating insurance companies that invest in the fund to fund variable annuity and variable life insurance contracts, sponsors of qualified retirement and pension plans that invest in the fund, and affiliates of these participating insurance companies and plan sponsors) in connection with the sale and distribution of the Service Class shares. MFD may subsequently pay all, or a portion, of the distribution and/or service fees to financial intermediaries.
Shareholder Servicing Agent – MFS Service Center, Inc. (MFSC), a wholly-owned subsidiary of MFS, has contracted to provide transfer agent and recordkeeping functions in connection with the issuance, transfer, and redemption of each class of shares of the fund under a Shareholder Servicing Agent Agreement. During the year ended December 31, 2011, the fund did not pay MFSC a fee for this service.
Administrator – MFS provides certain financial, legal, shareholder communications, compliance, and other administrative services to the fund. Under an administrative services agreement, the fund partially reimburses MFS the costs incurred to provide these services. The fund is charged an annual fixed amount of $17,500 plus a fee based on average daily net assets. The administrative services fee incurred for the year ended December 31, 2011 was equivalent to an annual effective rate of 0.0336% of the fund’s average daily net assets.
Trustees’ and Officers’ Compensation – The fund pays compensation to Trustees in the form of a retainer, attendance fees, and additional compensation to the Board chairperson. The fund does not pay compensation directly to officers of the fund who are also officers of the investment adviser, all of whom receive remuneration for their services to the fund from MFS. Certain officers of the fund are officers or directors of MFS, MFD, and MFSC.
Other – This fund and certain other funds managed by MFS (the funds) have entered into services agreements (the Agreements) which provide for payment of fees by the funds to Tarantino LLC and Griffin Compliance LLC in return for the provision of services of an Independent Chief Compliance Officer (ICCO) and Assistant ICCO, respectively, for the funds. The ICCO and Assistant ICCO are officers of the funds and the sole members of Tarantino LLC and Griffin Compliance LLC, respectively. The funds can terminate the Agreements with Tarantino LLC and Griffin Compliance LLC at any time under the terms of the Agreements. MFS has agreed to bear all expenses associated with office space, other administrative support, and supplies provided to the ICCO and Assistant ICCO. For the year ended December 31, 2011, the aggregate fees paid by the fund to Tarantino LLC and Griffin Compliance LLC were $3,018 and are included in miscellaneous expense on the Statement of Operations.
The fund invests in the MFS Institutional Money Market Portfolio which is managed by MFS and seeks a high level of current income consistent with preservation of capital and liquidity. Income earned on this investment is included in dividends from underlying affiliated funds on the Statement of Operations. This money market fund does not pay a management fee to MFS.
17
Table of Contents
MFS New Discovery Portfolio
Notes to Financial Statements – continued
| (4) | Portfolio Securities |
Purchases and sales of investments, other than U.S. Government securities, purchased option transactions, and short-term obligations, aggregated $319,042,665 and $349,619,415, respectively.
| (5) | Shares of Beneficial Interest |
The fund’s Declaration of Trust permits the Trustees to issue an unlimited number of full and fractional shares of beneficial interest. Transactions in fund shares were as follows:
| Year ended 12/31/11 | Year ended 12/31/10 | |||||||||||||||
| Shares | Amount | Shares | Amount | |||||||||||||
| Shares sold | ||||||||||||||||
Initial Class | 389,956 | $6,770,709 | 158,454 | $2,403,888 | ||||||||||||
Service Class | 488,436 | 7,547,690 | 114,963 | 1,741,456 | ||||||||||||
| 878,392 | $14,318,399 | 273,417 | $4,145,344 | |||||||||||||
| Shares issued to shareholders in reinvestment of distributions | ||||||||||||||||
Initial Class | 424,694 | $6,701,669 | — | $— | ||||||||||||
Service Class | 511,303 | 7,817,818 | — | — | ||||||||||||
| 935,997 | $14,519,487 | — | $— | |||||||||||||
| Shares reacquired | ||||||||||||||||
Initial Class | (944,373 | ) | $(17,044,090 | ) | (1,208,840 | ) | $(18,597,077 | ) | ||||||||
Service Class | (1,498,709 | ) | (26,444,525 | ) | (2,880,973 | ) | (43,778,953 | ) | ||||||||
| (2,443,082 | ) | $(43,488,615 | ) | (4,089,813 | ) | $(62,376,030 | ) | |||||||||
| Net change | ||||||||||||||||
Initial Class | (129,723 | ) | $(3,571,712 | ) | (1,050,386 | ) | $(16,193,189 | ) | ||||||||
Service Class | (498,970 | ) | (11,079,017 | ) | (2,766,010 | ) | (42,037,497 | ) | ||||||||
| (628,693 | ) | $(14,650,729 | ) | (3,816,396 | ) | $(58,230,686 | ) | |||||||||
| (6) | Line of Credit |
The fund and certain other funds managed by MFS participate in a $1.1 billion unsecured committed line of credit, subject to a $1 billion sublimit, provided by a syndication of banks under a credit agreement. Borrowings may be made for temporary financing needs. Interest is charged to each fund, based on its borrowings, generally at a rate equal to the higher of the Federal Reserve funds rate or one month LIBOR plus an agreed upon spread. A commitment fee, based on the average daily, unused portion of the committed line of credit, is allocated among the participating funds at the end of each calendar quarter. In addition, the fund and other funds managed by MFS have established unsecured uncommitted borrowing arrangements with certain banks for temporary financing needs. Interest is charged to each fund, based on its borrowings, at a rate equal to the Federal Reserve funds rate plus an agreed upon spread. For the year ended December 31, 2011, the fund’s commitment fee and interest expense were $1,411 and $0, respectively, and are included in miscellaneous expense on the Statement of Operations.
| (7) | Transactions in Underlying Affiliated Funds – Affiliated Issuers |
An affiliated issuer may be considered one in which the fund owns 5% or more of the outstanding voting securities, or a company which is under common control. For the purposes of this report, the fund assumes the following to be affiliated issuers:
| Underlying Affiliated Funds | Beginning Shares/Par Amount | Acquisitions Shares/Par Amount | Dispositions Shares/Par Amount | Ending Shares/Par Amount | ||||||||||||
| MFS Institutional Money Market Portfolio | 334,228 | 69,889,943 | (69,694,653 | ) | 529,518 | |||||||||||
| Underlying Affiliated Funds | Realized Gain (Loss) | Capital Gain Distributions | Dividend Income | Ending Value | ||||||||||||
| MFS Institutional Money Market Portfolio | $— | $— | $925 | $529,518 | ||||||||||||
18
Table of Contents
MFS New Discovery Portfolio
REPORT OF INDEPENDENT REGISTERED PUBLIC ACCOUNTING FIRM
To the Board of Trustees of MFS Variable Insurance Trust II and the Shareholders of
MFS New Discovery Portfolio:
We have audited the accompanying statement of assets and liabilities, including the portfolio of investments, of MFS New Discovery Portfolio (the “Fund”) (one of the series comprising MFS Variable Insurance Trust II) as of December 31, 2011, and the related statement of operations for the year then ended, the statements of changes in net assets for each of the two years in the period then ended, and the financial highlights for each of the five years in the period then ended. These financial statements and financial highlights are the responsibility of the Fund’s management. Our responsibility is to express an opinion on these financial statements and financial highlights based on our audits.
We conducted our audits in accordance with the standards of the Public Company Accounting Oversight Board (United States). Those standards require that we plan and perform the audit to obtain reasonable assurance about whether the financial statements and financial highlights are free of material misstatement. The Fund is not required to have, nor were we engaged to perform, an audit of its internal control over financial reporting. Our audits included consideration of internal control over financial reporting as a basis for designing audit procedures that are appropriate in the circumstances, but not for the purpose of expressing an opinion on the effectiveness of the Fund’s internal control over financial reporting. Accordingly, we express no such opinion. An audit also includes examining, on a test basis, evidence supporting the amounts and disclosures in the financial statements, assessing the accounting principles used and significant estimates made by management, as well as evaluating the overall financial statement presentation. Our procedures included confirmation of securities owned as of December 31, 2011, by correspondence with the custodian and brokers; where replies were not received from brokers, we performed other auditing procedures. We believe that our audits provide a reasonable basis for our opinion.
In our opinion, the financial statements and financial highlights referred to above present fairly, in all material respects, the financial position of MFS New Discovery Portfolio as of December 31, 2011, the results of its operations for the year then ended, the changes in its net assets for each of the two years in the period then ended, and the financial highlights for each of the five years in the period then ended, in conformity with accounting principles generally accepted in the United States of America.
DELOITTE & TOUCHE LLP
Boston, Massachusetts
February 15, 2012
19
Table of Contents
MFS New Discovery Portfolio
RESULTS OF SHAREHOLDER MEETING (unaudited)
At a special meeting of shareholders of MFS New Discovery Portfolio, which was held on December 1, 2011, the following actions were taken for which shareholders of all series of MFS Variable Insurance Trust II voted together as a single class with respect to Item 1 and shareholders of MFS New Discovery Portfolio voted as a separate class with respect to Items 2 and 3:
Item 1: Election of ten Trustees as members of the Board of Trustees of the Trust effective January 1, 2012:
| Number of Shares | ||||||||
| For | Withheld Authority | |||||||
| Robert E. Butler | 681,916,712.8686 | 46,472,894.9218 | ||||||
| Maureen R. Goldfarb | 682,835,794.8512 | 45,553,812.9392 | ||||||
| David H. Gunning | 681,500,267.3085 | 46,889,340.4819 | ||||||
| William R. Gutow | 681,050,223.5547 | 47,339,384.2357 | ||||||
| Michael Hegarty | 682,477,088.8584 | 45,912,518.9320 | ||||||
| John P. Kavanaugh | 683,794,425.4269 | 44,595,182.3635 | ||||||
| Robert J. Manning | 682,699,559.7374 | 45,690,048.0530 | ||||||
| J. Dale Sherratt | 681,362,743.0513 | 47,026,864.7391 | ||||||
| Laurie J. Thomsen | 683,408,094.0000 | 44,981,513.7904 | ||||||
| Robert W. Uek | 681,424,852.0247 | 46,964,755.7657 | ||||||
Item 2: To approve a new investment advisory agreement dated January 1, 2012, between the Trust, on behalf of MFS New Discovery Portfolio, and MFS:
| Number of Shares | ||||||||||||
| For | Against | Withheld Authority | ||||||||||
| 9,161,271.7834 | 362,623.4460 | 880,331.0915 | ||||||||||
Item 3: To approve revisions to and restatements of certain fundamental investment restrictions of MFS New Discovery Portfolio effective January 1, 2012 as detailed below:
| Number of Shares | ||||||||||||||
| For | Against | Withheld Authority | ||||||||||||
| A. | Borrowing | 8,752,416.6815 | 690,090.8028 | 961,718.8366 | ||||||||||
| B. | Underwriting Securities | 9,008,623.9808 | 458,298.8964 | 937,303.4437 | ||||||||||
| C. | Issuance of Senior Securities | 9,016,342.3444 | 458,238.0666 | 929,645.9099 | ||||||||||
| D. | Lending of Money or Securities | 8,775,699.0169 | 673,699.5503 | 954,827.7537 | ||||||||||
| E. | Purchases or Sales of Real Estate; Interests in Oil, Gas or Mineral Leases; and Commodities | 9,069,314.9435 | 440,846.3864 | 894,064.9910 | ||||||||||
| F. | Industry Concentration | 9,067,958.0035 | 416,483.4682 | 919,784.8492 | ||||||||||
20
Table of Contents
MFS New Discovery Portfolio
TRUSTEES AND OFFICERS – IDENTIFICATION AND BACKGROUND
The Trustees and officers of the Trust, as of February 1, 2012, are listed below, together with their principal occupations during the past five years. (Their titles may have varied during that period.) The address of each Trustee and officer is 500 Boylston Street, Boston, Massachusetts 02116.
Name, Age | Position(s) with Fund | Trustee/Officer Since (h) | Principal Occupations | Other Directorships (j) | ||||
| INTERESTED TRUSTEES | ||||||||
Robert J. Manning (k) (age 48) | Trustee | February 2004 | Massachusetts Financial Services Company, Chairman, Chief Executive Officer and Director; President (until December 2009); Chief Investment Officer (until July 2010) | N/A | ||||
| INDEPENDENT TRUSTEES | ||||||||
David H. Gunning (age 69) | Trustee and Chair of Trustees | January 2004 | Retired; Cleveland-Cliffs Inc. (mining products and service provider), Vice Chairman/Director (until May 2007) | Lincoln Electric Holdings, Inc. (welding equipment manufacturer), Director; Development Alternatives, Inc. (consulting), Director/Non-Executive Chairman; Portman Limited (mining), Director (until 2008) | ||||
Robert E. Butler (age 70) | Trustee | January 2006 | Consultant – investment company industry regulatory and compliance matters | N/A | ||||
Maureen R. Goldfarb (age 56) | Trustee | January 2009 | Private investor | N/A | ||||
William R. Gutow (age 70) | Trustee | December 1993 | Private investor and real estate consultant; Capitol Entertainment Management Company (video franchise), Vice Chairman | Atlantic Coast Tan (tanning salons), Vice Chairman (until 2007); Texas Donuts (donut franchise), Vice Chairman (until 2010) | ||||
Michael Hegarty (age 67) | Trustee | December 2004 | Private investor | N/A | ||||
John P. Kavanaugh (age 57) | Trustee | January 2009 | Private investor; The Hanover Insurance Group, Inc., Vice President and Chief Investment Officer (until 2006); Allmerica Investment Trust, Allmerica Securities Trust and Opus Investment Trust (investment companies), Chairman, President and Trustee (until 2006) | N/A | ||||
J. Dale Sherratt (age 73) | Trustee | June 1989 | Insight Resources, Inc. (acquisition planning specialists), President; Wellfleet Investments (investor in health care companies), Managing General Partner | N/A | ||||
Laurie J. Thomsen (age 54) | Trustee | March 2005 | Private investor; New Profit, Inc. (venture philanthropy), Executive Partner (until 2010) | The Travelers Companies (property and casualty insurance), Director | ||||
Robert W. Uek (age 70) | Trustee | January 2006 | Consultant to investment company industry | N/A | ||||
| OFFICERS | ||||||||
John M. Corcoran (k) (age 46) | President | October 2008 | Massachusetts Financial Services Company, Senior Vice President (since October 2008); State Street Bank and Trust (financial services provider), Senior Vice President, (until September 2008) | N/A | ||||
| Christopher R. Bohane (k) (age 38) | Assistant Secretary and Assistant Clerk | July 2005 | Massachusetts Financial Services Company, Vice President and Senior Counsel | N/A | ||||
Kino Clark (k) (age 43) | Assistant Treasurer | January 2012 | Massachusetts Financial Services Company, Assistant Vice President | N/A | ||||
21
Table of Contents
MFS New Discovery Portfolio
Trustees and Officers – continued
Name, Age | Position(s) with Fund | Trustee/Officer Since (h) | Principal Occupations | Other Directorships (j) | ||||
Ethan D. Corey (k) (age 48) | Assistant Secretary and Assistant Clerk | July 2005 | Massachusetts Financial Services Company, Senior Vice President and Associate General Counsel | N/A | ||||
David L. DiLorenzo (k) (age 43) | Treasurer | July 2005 | Massachusetts Financial Services Company, Vice President | N/A | ||||
Robyn L. Griffin (age 36) | Assistant Independent Chief Compliance Officer | August 2008 | Griffin Compliance LLC (provider of compliance services), Principal (since August 2008); State Street Corporation (financial services provider), Mutual Fund Administration Assistant Vice President (October 2006 – July 2008); Liberty Mutual Group (insurance), Personal Market Assistant Controller (April 2006 – October 2006); Deloitte & Touche LLP (professional services firm). | N/A | ||||
Brian E. Langenfeld (k) (age 38) | Assistant Secretary and Assistant Clerk | June 2006 | Massachusetts Financial Services Company, Vice President and Senior Counsel | N/A | ||||
Ellen Moynihan (k) (age 54) | Assistant Treasurer | April 1997 | Massachusetts Financial Services Company, Senior Vice President | N/A | ||||
Susan S. Newton (k) (age 61) | Assistant Secretary and Assistant Clerk | May 2005 | Massachusetts Financial Services Company, Senior Vice President and Associate General Counsel | N/A | ||||
Susan A. Pereira (k) (age 41) | Assistant Secretary and Assistant Clerk | July 2005 | Massachusetts Financial Services Company, Vice President and Senior Counsel | N/A | ||||
Mark N. Polebaum (k) (age 59) | Secretary and Clerk | January 2006 | Massachusetts Financial Services Company, Executive Vice President, General Counsel and Secretary | N/A | ||||
Frank L. Tarantino (age 67) | Independent Chief Compliance Officer | June 2004 | Tarantino LLC (provider of compliance services), Principal | N/A | ||||
Richard S. Weitzel (k) (age 41) | Assistant Secretary and Assistant Clerk | October 2007 | Massachusetts Financial Services Company, Vice President and Assistant General Counsel | N/A | ||||
James O. Yost (k) (age 51) | Deputy Treasurer | September 1990 | Massachusetts Financial Services Company, Senior Vice President | N/A | ||||
| (h) | Date first appointed to serve as Trustee/officer of an MFS fund. Each Trustee has served continuously since appointment unless indicated otherwise. For the period from December 15, 2004 until February 22, 2005, Mr. Manning served as Advisory Trustee. For the period October 2008, until January 2012, Mr. Corcoran served as Treasurer of the Funds. Prior to January 2012, Messrs. DiLorenzo and Yost served as Assistant Treasurers of the Funds. |
| (j) | Directorships or trusteeships of companies required to report to the Securities and Exchange Commission (i.e., “public companies”). |
| (k) | “Interested person” of the Trust within the meaning of the Investment Company Act of 1940 (referred to as the 1940 Act), which is the principal federal law governing investment companies like the fund, as a result of position with MFS. The address of MFS is 500 Boylston Street, Boston, Massachusetts 02116. |
Each Trustee has been elected by shareholders and each Trustee and officer holds office until his or her successor is chosen and qualified or until his or her earlier death, resignation, retirement or removal. The Trust does not hold annual meetings for the purpose of electing Trustees, and Trustees are not elected for fixed terms. Messrs. Butler, Kavanaugh, Uek and Ms. Thomsen are members of the Trust’s Audit Committee.
Each of the Fund’s Trustees and officers holds comparable positions with certain other funds of which MFS or a subsidiary is the investment adviser or distributor, and, in the case of the officers, with certain affiliates of MFS. As of January 1, 2012, the Trustees served as board members of 131 funds within the MFS Family of Funds.
22
Table of Contents
MFS New Discovery Portfolio
Trustees and Officers – continued
The Statement of Additional Information for the Fund includes further information about the Trustees and is available without charge upon request by calling 1-800-225-2606.
Investment Adviser Massachusetts Financial Services Company 500 Boylston Street, Boston, MA 02116-3741 | Custodian State Street Bank and Trust 1 Lincoln Street, Boston, MA 02111-2900 | |
Distributor MFS Fund Distributors, Inc. 500 Boylston Street, Boston, MA 02116-3741 | Independent Registered Public Accounting Firm Deloitte & Touche LLP 200 Berkeley Street, Boston, MA 02116 | |
Portfolio Manager Thomas Wetherald |
23
Table of Contents
MFS New Discovery Portfolio
At a special meeting of shareholders of the MFS New Discovery Portfolio (hereinafter referred to as the “Fund” or the “Portfolio”), which was held on December 1, 2011, the shareholders approved a new investment advisory agreement based on the recommendation of the Board of Trustees. At its July, 2011 meeting, the Board of Trustees (i) approved, and recommended for shareholder approval, the new investment advisory agreement effective January 1, 2012, and (ii) the continuation of the existing investment advisory agreement effective September 1, 2011. The following includes a description of the factors that the Board of Trustees considered and the conclusions that formed the basis of their approval of both the new investment advisory agreement and the continuation of the prior investment advisory agreement.
BOARD APPROVAL OF NEW INVESTMENT ADVISORY AGREEMENT
The Investment Company Act of 1940 requires that both the full Board of Trustees and a majority of the non-interested (“independent”) Trustees, voting separately, initially approve the new investment advisory agreement (the “New Agreement”) between Massachusetts Financial Services Company (“MFS”) and MFS Variable Insurance Trust II (the “Trust”) on behalf of the Portfolio and, beginning on the second anniversary of the initial effective date of the New Agreement, annually approve the continuation of the New Agreement. The Trustees have considered matters bearing on the Portfolio and the then current advisory arrangement at their meetings throughout the year, including a review of performance data at each regular meeting. In addition, the independent Trustees met in person in July 2011 to consider the initial approval of the New Agreement, and to recommend that shareholders approve the New Agreement. The independent Trustees were assisted in their evaluation of the New Agreement by independent legal counsel, from whom they received separate legal advice and with whom they met separately from MFS management. The independent Trustees were also assisted in this process by the Portfolio’s Independent Chief Compliance Officer, a full-time senior officer appointed by and reporting to the independent Trustees.
In connection with their deliberations regarding the initial approval of the New Agreement, the Trustees, including the independent Trustees, considered such information and factors as they believed, in light of the legal advice furnished to them and their own business judgment, to be relevant. The New Agreement was considered separately for the series of the Trust (collectively, the “Portfolios”), although the Trustees also took into account the common interests of all Portfolios in the Trust in their review. As described below, the Trustees considered the nature, quality, and extent of the various investment advisory, administrative, and/or shareholder services to be performed by MFS under the New Agreement and other arrangements with the Trust.
In connection with their initial review meeting, the Trustees received and relied upon materials that included, among other items: (i) information provided by MFS on the advisory fees of comparable portfolios of its other clients, including institutional separate account and other clients, (ii) information as to whether, and to what extent applicable, expense waivers, reimbursements or fee “breakpoints” would be observed for the Portfolio under the New Agreement, and (iii) a comparison and summary of the differences in the provisions in the New Agreement compared to those in each of the then current investment advisory agreements for the Portfolios. In addition, in connection with the independent Trustees’ meetings in May and July, 2011 (the “contract review meetings”) for the purpose of considering whether to approve the continuation of the then current investment advisory agreements for the Portfolio, the independent Trustees received: (1) information provided by Lipper Inc. (“Lipper”) on the investment performance of the Portfolio for various time periods ended December 31, 2010, compared to the investment performance of a group of funds with substantially similar investment classifications/objectives (the “Lipper performance universe”), (2) information provided by Lipper on the Portfolio’s advisory fees and other expenses compared to the advisory fees and other expenses of comparable funds identified by Lipper (the “Lipper expense group”), (3) information regarding MFS’ financial results and financial condition, including MFS’ and certain of its affiliates’ estimated profitability from services performed for the Portfolio, (4) MFS’ views regarding the outlook for the mutual fund industry and its strategic business plans, (5) descriptions of various functions performed by MFS for the Trust, such as compliance monitoring and portfolio trading practices, and (6) information regarding the overall organization of MFS, including information about MFS’ senior management and other personnel providing investment advisory, administrative and other services to the Portfolio. The comparative performance, fee and expense information prepared and provided by Lipper was not independently verified, and the independent Trustees did not independently verify any information provided to them by MFS.
The Trustees’ conclusion as to the initial approval of the New Agreement was based on comprehensive consideration of all information provided to the Trustees and was not the result of any single factor. Some of the factors that figured particularly in the Trustees’ deliberations are described below for the Portfolio, while individual Trustees may have given different weight to various factors and evaluated the information presented as a whole differently than another individual Trustee. The Trustees recognized that the fee arrangements for the Portfolio could reflect years of review and discussion between the independent Trustees and MFS, that certain aspects of such arrangements may receive greater scrutiny in some years than others, and that
24
Table of Contents
MFS New Discovery Portfolio
Board Approval of New Investment Advisory Agreement – continued
the Trustees’ conclusions may be based, in part, on their consideration of these same arrangements during the course of the year and in prior years.
Because the portfolio management team managing the Portfolio’s investments under the then current investment advisory agreement will remain the same under the New Agreement for the Portfolio, the Trustees compared the Portfolio’s total return investment performance to the performance of its Lipper performance universe over various time periods, based on information provided by Lipper. The Trustees placed particular emphasis on the total return performance of the Portfolio’s Initial Class shares in comparison to the performance of funds in its Lipper performance universe over the one-, three- and five-year periods ended December 31, 2010. The Trustees did not rely on performance results for more recent periods.
The Trustees noted the performance of the Portfolio’s Initial Class shares was in the 1st quintile relative to the other funds in the Lipper performance universe for the one-year period (the 1st quintile being the best performers and the 5th quintile being the worst performers). The total return performance of the Portfolio was also in the 1st quintile for the three-year and the five-year periods ended December 31, 2010, relative to the Lipper performance universe. Based on the nature and quality of services provided by MFS, the Board of Trustees concluded that the Portfolio’s performance was satisfactory.
In the course of their deliberations, the Trustees took into account information provided by MFS during contract review meetings, as well as during investment review meetings conducted with portfolio management personnel during the course of the year. For Portfolios whose performance lagged their peer groups, they discussed the factors that contributed thereto and MFS’ efforts to improve such Portfolios’ performance. After reviewing this information, the Trustees concluded, within the context of their overall conclusions regarding the New Agreement that they were satisfied with MFS’ responses and efforts relating to investment performance.
In assessing the reasonableness of the Portfolio’s advisory fee, the Trustees considered, among other information, the Portfolio’s advisory fee and the total expense ratio of the Portfolio’s Initial Class shares as a percentage of average daily net assets, compared to the advisory fee and total expense ratios of its peer group of funds based on information provided by Lipper. The Trustees also considered the advisory fees charged by MFS to institutional accounts. In comparing these fees, the Trustees considered the generally broader scope of services provided by MFS to the Trust than those provided to institutional accounts. The Trustees also considered the higher demands placed on MFS’ investment personnel and trading infrastructure as a result of the daily cash in-flows and out-flows of the Portfolio, and the impact on MFS and related expenses due to the more extensive regulatory regime to which the Portfolio is subject, compared to institutional accounts.
In considering the fees, the Trustees noted from the Lipper data that the Portfolio’s effective advisory fee rate and total expense ratio were each approximately at the median of such fees and expenses of funds in the Lipper expense group. The Trustees further noted that the New Agreement would reflect MFS’ agreement to reduce the advisory fee on average daily net assets over $1 billion on a permanent basis. In addition, the Trustees accepted MFS’ offer to continue the expense limitation for the Portfolio, and to continue to reduce the advisory fee for the Portfolio on average daily net assets over $2.5 billion, and concluded that the breakpoints were sufficient to allow the Portfolio to benefit from economies of scale as its assets grow. The Trustees concluded that the fees were reasonable in light of the nature and quality of services provided.
The Trustees also considered whether the Portfolio is likely to benefit from any economies of scale due to future asset growth. In this regard, the Trustees reviewed the adequacy of breakpoints and discussed with MFS any adjustments necessary for the shareholders’ benefit.
The Trustees also considered information prepared by MFS relating to its costs and profits with respect to the Portfolio and other investment companies and accounts advised by MFS, as well as MFS’ methodologies used to determine and allocate its costs to the Portfolio and other accounts and products for purposes of estimating profitability.
The Trustees noted that there would be no increase to the net advisory fee arrangement for the Portfolio under the New Agreement when compared to the Portfolio’s then current investment advisory agreement. After reviewing these and other factors described below, the Trustees concluded that the advisory fees charged to the Portfolio under the New Agreement represent reasonable compensation in light of the nature and quality of the services being provided by MFS.
In addition, the Trustees considered MFS’ resources and related efforts to continue to retain, attract and motivate capable personnel to serve the Portfolio. The Trustees also considered the financial resources of MFS and its parent, Sun Life Financial Inc. The Trustees further considered any advantages and possible disadvantages of having an adviser which also serves other investment companies as well as institutional accounts.
The Trustees also considered the nature, quality, cost, and extent of administrative, transfer agency, and distribution services provided to the Trust by MFS and its affiliates under agreements and plans other than the New Agreement, including the 12b-1 fees the Portfolio pays to MFS Fund Distributors, Inc., an affiliate of MFS. The Trustees also considered the nature, extent and
25
Table of Contents
MFS New Discovery Portfolio
Board Approval of New Investment Advisory Agreement – continued
quality of certain other services MFS performs or arranges on the Portfolio’s behalf, which may include securities lending programs, directed expense payment programs, class action recovery programs, and MFS’ interaction with third-party service providers, principally custodians and sub-custodians. The Trustees concluded that the various non-advisory services provided by MFS and its affiliates on behalf of the Portfolio were satisfactory. The Trustees also considered the benefits to MFS from the use of the Portfolio’s portfolio brokerage commissions to pay for investment research and various other factors. Additionally, the Trustees considered so-called “fall-out benefits” to MFS such as reputational value derived from serving as investment manager to the Trust, and determined that any such benefits derived by MFS were reasonable and fair.
Based on their evaluation of factors that they deemed to be material, including those factors described above, the Board of Trustees, including a majority of the independent Trustees, concluded that the New Agreement should be approved for an initial two-year period, commencing upon its effective date, as set forth in the New Agreement.
BOARD APPROVAL OF CONTINUATION OF PRIOR INVESTMENT ADVISORY AGREEMENT
The Investment Company Act of 1940 requires that both the full Board of Trustees and a majority of the non-interested (“independent”) Trustees, voting separately, annually approve the continuation of the investment advisory agreement between MFS Variable Insurance Trust II (the “Trust”) and Massachusetts Financial Services Company (“MFS”) on behalf of the Fund. The Trustees consider matters bearing on the Fund and the advisory arrangements at their meetings throughout the year, including a review of performance data at each regular meeting. In addition, the independent Trustees met in person in May and again in July 2011 (“contract review meetings”) for the specific purpose of considering whether to approve the continuation of the investment advisory agreement for the Fund. The independent Trustees were assisted in their evaluation of the investment advisory agreement by independent legal counsel, from whom they received separate legal advice and with whom they met separately from MFS management during various contract review meetings. The independent Trustees were also assisted in this process by the Fund’s Independent Chief Compliance Officer, a full-time senior officer appointed by and reporting to the independent Trustees.
In connection with their deliberations, the Trustees, including the independent Trustees, considered such information and factors as they believed, in light of the legal advice furnished to them and their own business judgment, to be relevant. The investment advisory agreement was considered separately for the Fund, although the Trustees also took into account the common interests of all Funds in the Trust in their review. As described below, the Trustees considered the nature, quality, and extent of the various investment advisory, administrative, and shareholder services performed by MFS under the existing investment advisory agreement and other arrangements with the Trust.
In connection with their contract review meetings, the Trustees received and relied upon materials which included, among other items: (i) information provided by Lipper Inc. (“Lipper”) on the investment performance of the Fund for various time periods ended December 31, 2010, compared to the investment performance of a group of funds with substantially similar investment classifications/objectives (the “Lipper performance universe”), (ii) information provided by Lipper on the Fund’s advisory fees and other expenses compared to the advisory fees and other expenses of comparable funds identified by Lipper (the “Lipper expense group”), (iii) information provided by MFS on the advisory fees of comparable portfolios of its other clients, including institutional separate account and other clients, (iv) information as to whether, and to what extent applicable, expense waivers, reimbursements or fee “breakpoints” are observed for the Fund, (v) information regarding MFS’ financial results and financial condition, including MFS’ and certain of its affiliates’ estimated profitability from services performed for the Fund and other investment companies that the Board oversees as a whole, and for MFS’ institutional business, (vi) MFS’ views regarding the outlook for the mutual fund industry and its strategic business plans, (vii) descriptions of various functions performed by MFS for the Trust, such as compliance monitoring and portfolio trading practices, and (viii) information regarding the overall organization of MFS, including information about MFS’ senior management and other personnel providing investment advisory, administrative and other services to the Fund. The comparative performance, fee and expense information prepared and provided by Lipper was not independently verified, and the independent Trustees did not independently verify any information provided to them by MFS.
The Trustees’ conclusion as to the continuation of the investment advisory agreement was based on comprehensive consideration of all information provided to the Trustees and was not the result of any single factor. Some of the factors that figured particularly in the Trustees’ deliberations are described below for the Fund, while individual Trustees may have given different weight to various factors and evaluated the information presented as a whole differently than another individual Trustee. The Trustees recognized that the fee arrangements for the Fund reflect years of review and discussion between the independent Trustees and MFS, that certain aspects of such arrangements may receive greater scrutiny in some years than
26
Table of Contents
MFS New Discovery Portfolio
Board Approval of Continuation of Prior Investment Advisory Agreement – continued
others, and that the Trustees’ conclusions may be based, in part, on their consideration of these same arrangements during the course of the year and in prior years.
Based on information provided by Lipper, the Trustees compared the Fund’s total return investment performance to the performance of the Lipper performance universe over various time periods. The Trustees placed particular emphasis on the total return performance of the Fund’s Initial Class shares in comparison to the performance of funds in its Lipper performance universe over the one-, three- and five -year periods ended December 31, 2010. The Trustees did not rely on performance results for more recent periods, including those shown elsewhere in this report.
The Trustees noted the performance of the Fund’s Initial Class shares was in the 1st quintile relative to the other funds in the Lipper performance universe for the one-year period (the 1st quintile being the best performers and the 5th quintile being the worst performers). The total return performance of the Fund was also in the 1st quintile for the three-year and five-year periods ended December 31, 2010, relative to the Lipper performance universe. Based on the nature and quality of services provided by MFS, the Board of Trustees concluded that the Fund’s performance was satisfactory.
In the course of their deliberations, the Trustees took into account information provided by MFS during contract review meetings, as well as during investment review meetings conducted with portfolio management personnel during the course of the year.
In assessing the reasonableness of the Fund’s advisory fee, the Trustees considered, among other information, the Fund’s advisory fee and the total expense ratio of the Fund’s Initial Class shares as a percentage of average daily net assets, compared to the advisory fee and total expense ratios of its peer group of funds based on information provided by Lipper. The Trustees also considered the advisory fees charged by MFS to institutional accounts. In comparing these fees, the Trustees considered the generally broader scope of services provided by MFS to the Trust than those provided to institutional accounts. The Trustees also considered the higher demands placed on MFS’ investment personnel and trading infrastructure as a result of the daily cash in-flows and out-flows of the Fund, and the impact on MFS and related expenses due to the more extensive regulatory regime to which the Fund is subject, compared to institutional accounts.
In considering the fees, the Trustees noted from the Lipper data (which takes into account any reductions or expense limitations) that the Fund’s effective advisory fee rate and total expense ratio were each approximately at the median of such fees and expenses of funds in the Lipper expense group. In addition, the Trustees accepted MFS’ offer to continue the expense limitation for the Fund, and to continue to reduce the advisory fee for the Fund on average daily net assets over $2.5 billion, and concluded that the existing breakpoints were sufficient to allow the Fund to benefit from economies of scale as its assets grow. The Trustees concluded that the fees were reasonable in light of the nature and quality of services provided.
The Trustees also considered information prepared by MFS relating to its costs and profits with respect to the Fund and other investment companies and accounts advised by MFS, as well as MFS’ methodologies used to determine and allocate its costs to the Fund and other accounts and products for purposes of estimating profitability.
After reviewing these and other factors described below, the Trustees concluded that the advisory fees charged to the Fund represent reasonable compensation in light of the nature and quality of the services being provided by MFS.
In addition, the Trustees considered MFS’ resources and related efforts to continue to retain, attract and motivate capable personnel to serve the Fund. The Trustees also considered the financial resources of MFS and its parent, Sun Life Financial Inc. The Trustees further considered any advantages and possible disadvantages of having an adviser which also serves other investment companies as well as institutional accounts.
The Trustees also considered the nature, quality, cost, and extent of administrative, transfer agency, and distribution services provided to the Fund by MFS and its affiliates under agreements and plans other than the investment advisory agreement, including the 12b-1 fees the Fund pays to MFS Fund Distributors, Inc., an affiliate of MFS. The Trustees also considered the nature, extent and quality of certain other services MFS performs or arranges on the Fund’s behalf, which may include securities lending programs, directed expense payment programs, class action recovery programs, and MFS’ interaction with third-party service providers, principally custodians and sub-custodians. The Trustees concluded that the various non-advisory services provided by MFS and its affiliates on behalf of the Fund were satisfactory. The Trustees also considered the benefits to MFS from the use of the Fund’s portfolio brokerage commissions, if applicable, to pay for investment research and various other factors. Additionally, the Trustees considered so-called “fall-out benefits” to MFS such as reputational value derived from serving as investment manager to the Trust, and determined that any such benefits derived by MFS were reasonable and fair.
Based on their evaluation of factors that they deemed to be material, including those factors described above, the Board of Trustees, including a majority of the independent Trustees, concluded that the investment advisory agreement should be continued for an additional one-year period, commencing September 1, 2011.
27
Table of Contents
MFS New Discovery Portfolio
Board Approval of Continuation of Prior Investment Advisory Agreement – continued
A discussion regarding the Board’s most recent review and renewal of the fund’s Investment Advisory Agreement with MFS is available by clicking on the fund’s name under “Variable Insurance Portfolios — VIT II” in the “Products and Performance” section of the MFS Web site (mfs.com).
28
Table of Contents
MFS New Discovery Portfolio
PROXY VOTING POLICIES AND INFORMATION
A general description of the MFS funds’ proxy voting policies and procedures is available without charge, upon request, by calling 1-800-225-2606, by visiting the Proxy Voting section of mfs.com or by visiting the SEC’s Web site at http://www.sec.gov.
Information regarding how the fund voted proxies relating to portfolio securities during the most recent twelve-month period ended June 30 is available without charge by visiting the Proxy Voting section of mfs.com or by visiting the SEC’s Web site at http://www.sec.gov.
QUARTERLY PORTFOLIO DISCLOSURE
The fund will file a complete schedule of portfolio holdings with the Securities and Exchange Commission (the Commission) for the first and third quarters of each fiscal year on Form N-Q. The fund’s Form N-Q is available on the EDGAR database on the Commission’s Internet Web site at http://www.sec.gov and may be reviewed and copied at the:
Public Reference Room
Securities and Exchange Commission
100 F Street, NE, Room 1580
Washington, D.C. 20549
Information on the operation of the Public Reference Room may be obtained by calling the Commission at 1-800-SEC-0330. Copies of the fund’s Form N-Q also may be obtained, upon payment of a duplicating fee, by electronic request at the following e-mail address: publicinfo@sec.gov or by writing the Public Reference Section at the above address.
From time to time, MFS may post important information about the fund or the MFS funds on the MFS web site (mfs.com). This information is available by visiting the “News & Commentary” section of mfs.com or by clicking on the fund’s name under “Variable Insurance Portfolios — VIT II” in the “Products and Performance” section of mfs.com.
FEDERAL TAX INFORMATION (unaudited)
The following information is provided pursuant to provisions of the Internal Revenue Code.
The fund designates $4,761,000 as capital gain dividends paid during the fiscal year.
For corporate shareholders, 4.83% of the ordinary income dividends paid during the fiscal year qualify for the corporate dividends received deduction.
29
Table of Contents
rev. 3/11

| Why? | Financial companies choose how they share your personal information. Federal law gives consumers the right to limit some but not all sharing. Federal law also requires us to tell you how we collect, share, and protect your personal information. Please read this notice carefully to understand what we do. |
| What? | The types of personal information we collect and share depend on the product or service you have with us. This information can include:
• Social Security number and account balances • Account transactions and transaction history • Checking account information and wire transfer instructions
When you are no longer our customer, we continue to share your information as described in this notice. |
| How? | All financial companies need to share customers’ personal information to run their everyday business. In the section below, we list the reasons financial companies can share their customers’ personal information; the reasons MFS chooses to share; and whether you can limit this sharing. |
| Reasons we can share your personal information | Does MFS share? | Can you limit this sharing? | ||
For our everyday business purposes – such as to process your transactions, maintain your account(s), respond to court orders and legal investigations, or report to credit bureaus | Yes | No | ||
For our marketing purposes – to offer our products and services to you | No | We don’t share | ||
| For joint marketing with other financial companies | No | We don’t share | ||
For our affiliates’ everyday business purposes – information about your transactions and experiences | No | We don’t share | ||
For our affiliates’ everyday business purposes – information about your creditworthiness | No | We don’t share | ||
| For nonaffiliates to market to you | No | We don’t share |
| Questions? | Call 800-225-2606 or go to mfs.com. |
30
Table of Contents
| Page 2 |
| Who we are | ||
| Who is providing this notice? | MFS Funds, MFS Investment Management, MFS Institutional Advisors, Inc., MFS Fund Distributors, Inc., MFS Heritage Trust Company, and MFS Service Center, Inc. | |
| What we do | ||
| How does MFS protect my personal information? | To protect your personal information from unauthorized access and use, we use security measures that comply with federal law. These measures include procedural, electronic, and physical safeguards for the protection of the personal information we collect about you. | |
| How does MFS collect my personal information? | We collect your personal information, for example, when you
• open an account or provide account information • direct us to buy securities or direct us to sell your securities • make a wire transfer
We also collect your personal information from others, such as credit bureaus, affiliates and other companies. | |
| Why can’t I limit all sharing? | Federal law gives you the right to limit only
• sharing for affiliates’ everyday business purposes – information about your creditworthiness • affiliates from using your information to market to you • sharing for nonaffiliates to market to you
State laws and individual companies may give you additional rights to limit sharing. | |
| Definitions | ||
| Affiliates | Companies related by common ownership or control. They can be financial and nonfinancial companies.
• MFS does not share personal information with affiliates, except for everyday business purposes as described on page one of this notice. | |
| Nonaffiliates | Companies not related by common ownership or control. They can be financial and nonfinancial companies.
• MFS does not share with nonaffiliates so they can market to you. | |
| Joint Marketing | A formal agreement between nonaffiliated financial companies that together market financial products or services to you.
• MFS doesn’t jointly market. | |
| Other important information | ||
| If you own an MFS product or receive an MFS service in the name of a third party such as a bank or broker-dealer, their privacy policy may apply to you instead of ours. | ||
31
Table of Contents

Table of Contents

MFS® Growth Portfolio
MFS® Variable Insurance Trust II

ANNUAL REPORT
December 31, 2011
EGS-ANN
Table of Contents
MFS® GROWTH PORTFOLIO
The report is prepared for the general information of contract owners.
It is authorized for distribution to prospective investors only when preceded or accompanied by a current prospectus.
NOT FDIC INSURED Ÿ MAY LOSE VALUE Ÿ NO BANK OR CREDIT UNION GUARANTEE Ÿ NOT A DEPOSIT Ÿ NOT INSURED BY ANY FEDERAL GOVERNMENT AGENCY OR NCUA/NCUSIF
Table of Contents
MFS Growth Portfolio
LETTER FROM THE CHAIRMAN AND CEO

Dear Contract Owners:
We are indeed living through some volatile times. Economic uncertainty is everywhere, as it seems no place in the world has been unmoved by crisis. We have seen a devastating earthquake and tsunami that have led to disruptions in the Japanese markets
and supply chains. Protests have changed the face of the Middle East and left in their wake lingering tensions and resultant higher oil prices. We have seen debt limits tested in Europe and the United States and policymakers grappling to craft often unpopular monetary and fiscal responses at a time when consumers and businesses struggle with what appears to be a slowing global economy. On top of all of that, we have seen long-term U.S. debt lose its Standard & Poor’s AAA rating and the long-term debt ratings of 15 eurozone nations put on negative watch.
When markets become volatile, managing risk becomes a top priority for investors and their advisors. At MFS® risk management is foremost in our minds in all market climates. Our analysts and portfolio managers keep risks firmly in mind when evaluating securities. Additionally, we have a team of quantitative analysts that measures and assesses the risk profiles of our portfolios and securities on an ongoing basis. The chief investment risk officer, who oversees the team, reports directly to the firm’s president and chief investment officer so the risk associated with each portfolio can be assessed objectively and independently of the portfolio management team.
As always, we continue to be mindful of the many economic challenges faced at the local, national, and international levels. It is in times such as these that we want to remind investors of the merits of maintaining a long-term view, adhering to basic investing principles such as asset allocation and diversification, and working closely with their advisors to research and identify appropriate investment opportunities.
Respectfully,

Robert J. Manning
Chairman and Chief Executive Officer
MFS Investment Management®
February 15, 2012
The opinions expressed in this letter are subject to change, may not be relied upon for investment advice, and no forecasts can be guaranteed.
1
Table of Contents
MFS Growth Portfolio
Portfolio structure

| Top ten holdings | ||||
| Apple, Inc. | 7.1% | |||
| Google, Inc., “A” | 4.8% | |||
| Danaher Corp. | 3.1% | |||
| Oracle Corp. | 2.6% | |||
| American Tower Corp., “A” | 2.5% | |||
| Qualcomm, Inc. | 2.4% | |||
| EMC Corp. | 2.2% | |||
| Precision Castparts Corp. | 1.9% | |||
| Viacom, Inc., “B” | 1.8% | |||
| MasterCard, Inc., “A” | 1.7% |
| Equity sectors | ||||
| Technology | 26.5% | |||
| Health Care | 10.3% | |||
| Retailing | 9.6% | |||
| Energy | 9.6% | |||
| Industrial Goods & Services | 8.4% | |||
| Consumer Staples | 7.8% | |||
| Leisure | 7.3% | |||
| Financial Services | 4.9% | |||
| Special Products & Services | 4.7% | |||
| Basic Materials | 2.7% | |||
| Utilities & Communications | 2.5% | |||
| Transportation | 2.4% | |||
| Autos & Housing | 1.8% |
Percentages are based on net assets as of 12/31/11.
The portfolio is actively managed and current holdings may be different.
2
Table of Contents
MFS Growth Portfolio
Summary of Results
For the twelve months ended December 31, 2011, Initial Class shares of the MFS Growth Portfolio (the “fund”) provided a total return of –0.45%, while Service Class shares of the fund provided a total return of –0.69%. These compare with a return of 2.64% for the fund’s benchmark, the Russell 1000 Growth Index.
Market Environment
Early in the period, the U.S. Federal Reserve (the “Fed”) responded to weak economic growth by loosening monetary policy further. More easing by the Fed improved market sentiment and drove risk-asset prices markedly higher. The December 2010 agreement on a surprisingly large (relative to expectations) expansionary U.S. fiscal package also boosted sentiment. During the subsequent several months, the renewed positive market sentiment, coupled with better indications of global macroeconomic activity, pushed many asset valuations to post-crisis highs. At the same time, the yields of the perceived “safest” global sovereign credits rose, indicating a renewed risk-seeking environment.
However, towards the middle of the period, a weakening macroeconomic backdrop and renewed concerns over peripheral euro zone sovereign debt caused a flight-to-quality move that pushed high-quality sovereign bond yields lower. In the U.S., concerns about sovereign debt default and the long-term sustainability of the trend in U.S. fiscal policy resulted in one agency downgrading U.S. credit quality. Amidst this turmoil, global equity markets declined sharply. As a result of these developments, global consumer and producer sentiment indicators fell precipitously and highly-rated sovereign bond yields hit multi-decade lows. Towards the end of the reporting period, uncertainty in financial markets spiked higher as markets more seriously contemplated the possible failure of the euro zone.
Detractors from Performance
Stock selection in the energy sector was a major factor in the fund’s underperformance relative to the Russell 1000 Growth Index. Not holding shares of integrated oil and gas company Exxon Mobil detracted from relative returns as the stock turned in strong performance over the reporting period. The fund’s holdings of poor-performing oil and gas company Newfield Exploration (h) also held back relative results. Shares of Newfield Exploration came under pressure as the company reported earnings that significantly missed analyst expectations. The slower earnings growth was primarily due to lower-than-estimated natural gas production and cost inflation from higher oil prices.
Security selection in the leisure sector also detracted from relative performance. Holding shares of weak-performing cruise operator Carnival weighed on relative returns. Its shares declined during the period as investors appeared to have been concerned about the impact that the weak macroeconomic environment would have on the cruise industry.
Stock selection in the special products & services sector was another negative factor for the fund’s relative returns. There were no individual securities within this sector that were among the fund’s top relative detractors for the period.
An underweight position in the consumer staples sector, which outperformed the benchmark, also weighed on relative performance. The fund’s underweight position in outperforming tobacco company Philip Morris International dampened relative returns. Shares of Philip Morris rose late in the period after the company reported better-than-expected earnings and its solid return of capital to shareholders via both dividends and share repurchases. In addition, management increased its 2011 earnings estimate driven by stronger-than-expected results in Japan and Indonesia.
A combination of an underweight position and stock selection in the health care sector also detracted from relative performance. The fund’s holdings of underperforming analytical instruments maker Thermo Fisher Scientific (b) hindered relative results. Although the company reported earnings in line with expectations, it lowered its full-year guidance due to sluggishness in the academic/government market. Its share price underperformance also appeared to have reflected concerns about the potential for a more significant slowdown in its European business.
Elsewhere, the fund’s underweight position in strong-performing diversified technology products and services company International Business Machines (IBM) held back relative performance. The fund’s holdings of poor-performing enterprise software products maker Oracle, project management provider Fluor, investment banking firm Goldman Sachs Group (b)(h), and diversified mining company Teck Resources (b)(h) (Canada) were also among the fund’s top relative detractors for the period.
Contributors to Performance
A combination of an underweight position and stock selection in the basic materials sector contributed to relative performance. An underweight position in shares of poor-performing precious metals company Freeport-McMoRan (h) aided relative results. The company experienced lower copper and gold sales due to lower production from its open-pit Grasberg mine in Indonesia. Its shares were down substantially after a labor dispute at the Grasberg mine, that lasted from September to December, stalled production.
3
Table of Contents
MFS Growth Portfolio
Management Review – continued
Security selection in the financial services sector also benefited relative performance. Holdings of global payments technology companies, MasterCard and Visa, and broadcast and communication tower management firm American Tower supported relative returns as all three stocks outperformed the benchmark over the reporting period. Shares of MasterCard appreciated throughout the year due to higher profitability driven by momentum in cross-border demand, increased emerging market opportunities, and strong volume trends which spurred its management to repurchase shares. Additionally, shares of MasterCard reacted strongly to news that the regulation of interchange rates, or the fees MasterCard and other banks can charge merchants when consumers pay for goods with debit cards, may be less onerous than previously expected.
Stock selection in the industrial goods & services sector strengthened relative returns. The fund’s holdings of strong-performing industrial goods and metal fabrication company Precision Castparts were among the fund’s top relative contributors for the reporting period.
Elsewhere, holdings of strong-performing biotechnology firm Alexion Pharmaceuticals, freight rail transportation business Kansas City Southern, and internet search giant Google supported relative performance. Alexion Pharmaceuticals reported strong earnings throughout the period and received FDA approval for Solaris to treat patients with atypical Hemolytic Uremic Syndrome which appeared to reflect positively on the stock price. Not holding shares of underperforming global automaker Ford Motor Company and computer products and services provider Hewlett-Packard also helped relative returns.
Respectfully,
Eric Fischman
Portfolio Manager
| (b) | Security is not a benchmark constituent. |
| (h) | Security was not held in the fund at period end. |
The views expressed in this report are those of the portfolio manager only through the end of the period of the report as stated on the cover and do not necessarily reflect the views of MFS or any other person in the MFS organization. These views are subject to change at any time based on market or other conditions, and MFS disclaims any responsibility to update such views. These views may not be relied upon as investment advice or an indication of trading intent on behalf of any MFS portfolio. References to specific securities are not recommendations of such securities, and may not be representative of any MFS portfolio’s current or future investments.
4
Table of Contents
MFS Growth Portfolio
PERFORMANCE SUMMARY THROUGH 12/31/11
The following chart illustrates the historical performance of the fund in comparison to its benchmark(s). Benchmarks are unmanaged and may not be invested in directly. Benchmark returns do not reflect any fees or expenses. The performance of other share classes will be greater than or less than that of the class depicted below. (See Notes to Performance Summary.)
Performance data shown represents past performance and is no guarantee of future results. Investment return and principal value fluctuate so your units, when sold, may be worth more or less than the original cost; current performance may be lower or higher than quoted. The performance shown does not reflect the deduction of taxes, if any, that a contract holder would pay on fund distributions or the redemption of contract units. The returns for the fund shown also do not reflect the deduction of expenses associated with variable products, such as mortality and expense risk charges, separate account charges, and sales charges imposed by the insurance company separate accounts. Such expenses would reduce the overall returns shown.
Growth of a Hypothetical $10,000 Investment
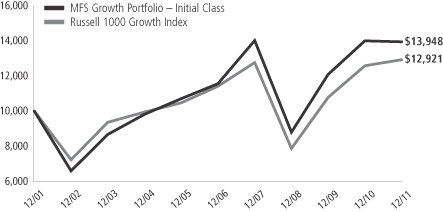
Total Returns through 12/31/11
Average annual total returns
| Share class | Class inception date | 1-yr | 5-yr | 10-yr | ||||||||
| Initial Class | 5/01/95 | (0.45)% | 3.83% | 3.38% | ||||||||
| Service Class | 8/24/01 | (0.69)% | 3.57% | 3.12% | ||||||||
| Comparative benchmark | ||||||||||||
| Russell 1000 Growth Index (f) | 2.64% | 2.50% | 2.60% | |||||||||
| (f) | Source: FactSet Research Systems Inc. |
Benchmark Definition
Russell 1000 Growth Index – constructed to provide a comprehensive barometer for growth securities in the large-cap segment of the U.S. equity universe. Companies in this index generally have higher price-to-book ratios and higher forecasted growth values.
It is not possible to invest directly in an index.
Notes to Performance Summary
Average annual total return represents the average annual change in value for each share class for the periods presented.
Performance results reflect any applicable expense subsidies and waivers in effect during the periods shown. Without such subsidies and waivers the fund’s performance results would be less favorable. Please see the prospectus and financial statements for complete details. All results are historical and assume the reinvestment of any dividends and capital gains distributions.
Performance results do not include adjustments made for financial reporting purposes in accordance with U.S. generally accepted accounting principles and may differ from amounts reported in the financial highlights.
From time to time the fund may receive proceeds from litigation settlements, without which performance would be lower.
5
Table of Contents
MFS Growth Portfolio
Fund Expenses Borne by the Contract Holders During the Period,
July 1, 2011 through December 31, 2011
As a contract holder of the fund, you incur ongoing costs, including management fees; distribution and/or service (12b-1) fees; and other fund expenses. This example is intended to help you understand your ongoing costs (in dollars) of investing in the fund and to compare these costs with the ongoing costs of investing in other mutual funds.
The example is based on an investment of $1,000 invested at the beginning of the period and held for the entire period July 1, 2011 through December 31, 2011.
Actual Expenses
The first line for each share class in the following table provides information about actual account values and actual expenses. You may use the information in this line, together with the amount you invested, to estimate the expenses that you paid over the period. Simply divide your account value by $1,000 (for example, an $8,600 account value divided by $1,000 = 8.6), then multiply the result by the number in the first line under the heading entitled “Expenses Paid During Period” to estimate the expenses you paid on your account during this period.
Hypothetical Example for Comparison Purposes
The second line for each share class in the following table provides information about hypothetical account values and hypothetical expenses based on the fund’s actual expense ratio and an assumed rate of return of 5% per year before expenses, which is not the fund’s actual return. The hypothetical account values and expenses may not be used to estimate the actual ending account balance or expenses you paid for the period. You may use this information to compare the ongoing costs of investing in the fund and other funds. To do so, compare this 5% hypothetical example with the 5% hypothetical examples that appear in the shareholder reports of the other funds.
Please note that the expenses shown in the table are meant to highlight the fund’s ongoing costs only and do not take into account the fees and expenses imposed under the variable contracts through which your investment in the fund is made. Therefore, the second line for each share class in the table is useful in comparing ongoing costs associated with an investment in vehicles (such as the fund) which fund benefits under variable annuity and variable life insurance contracts and to qualified pension and retirement plans only, and will not help you determine the relative total costs of investing in the fund through variable annuity and variable life insurance contracts. If the fees and expenses imposed under the variable contracts were included, your costs would have been higher.
| Share Class | Annualized Expense Ratio | Beginning Account Value 7/01/11 | Ending Account Value 12/31/11 | Expenses Paid During Period (p) 7/01/11-12/31/11 | ||||||||||||||
| Initial Class | Actual | 0.87% | $1,000.00 | $951.81 | $4.28 | |||||||||||||
| Hypothetical (h) | 0.87% | $1,000.00 | $1,020.82 | $4.43 | ||||||||||||||
| Service Class | Actual | 1.12% | $1,000.00 | $950.88 | $5.51 | |||||||||||||
| Hypothetical (h) | 1.12% | $1,000.00 | $1,019.56 | $5.70 | ||||||||||||||
| (h) | 5% class return per year before expenses. |
| (p) | Expenses paid is equal to each class’ annualized expense ratio, as shown above, multiplied by the average account value over the period, multiplied by the number of days in the period, divided by the number of days in the year. |
6
Table of Contents
MFS Growth Portfolio
PORTFOLIO OF INVESTMENTS – 12/31/11
The Portfolio of Investments is a complete list of all securities owned by your fund. It is categorized by broad-based asset classes.
| Issuer | Shares/Par | Value ($) | ||||||
| COMMON STOCKS – 98.5% | ||||||||
| Aerospace – 3.4% | ||||||||
| Honeywell International, Inc. | 40,990 | $ | 2,227,807 | |||||
| Precision Castparts Corp. | 16,685 | 2,749,521 | ||||||
|
| |||||||
| $ | 4,977,328 | |||||||
|
| |||||||
| Alcoholic Beverages – 1.3% | ||||||||
| Diageo PLC | 89,009 | $ | 1,944,219 | |||||
|
| |||||||
| Apparel Manufacturers – 1.5% | ||||||||
| LVMH Moet Hennessy Louis Vuitton S.A. | 4,293 | $ | 604,835 | |||||
| NIKE, Inc., “B” | 9,940 | 957,918 | ||||||
| VF Corp. | 4,834 | 613,870 | ||||||
|
| |||||||
| $ | 2,176,623 | |||||||
|
| |||||||
| Automotive – 0.8% | ||||||||
| Johnson Controls, Inc. | 36,890 | $ | 1,153,181 | |||||
|
| |||||||
| Biotechnology – 3.3% | ||||||||
| Alexion Pharmaceuticals, Inc. (a) | 23,090 | $ | 1,650,935 | |||||
| Biogen Idec, Inc. (a) | 4,020 | 442,401 | ||||||
| Celgene Corp. (a) | 30,620 | 2,069,912 | ||||||
| Gilead Sciences, Inc. (a) | 19,100 | 781,763 | ||||||
|
| |||||||
| $ | 4,945,011 | |||||||
|
| |||||||
| Broadcasting – 3.1% | ||||||||
| Discovery Communications, Inc., “A” (a) | 23,000 | $ | 942,310 | |||||
| News Corp., “A” | 54,940 | 980,130 | ||||||
| Viacom, Inc., “B” | 57,520 | 2,611,983 | ||||||
|
| |||||||
| $ | 4,534,423 | |||||||
|
| |||||||
| Brokerage & Asset Managers – 1.5% | ||||||||
| Affiliated Managers Group, Inc. (a) | 9,390 | $ | 900,969 | |||||
| Blackrock, Inc. | 7,524 | 1,341,078 | ||||||
|
| |||||||
| $ | 2,242,047 | |||||||
|
| |||||||
| Business Services – 4.0% | ||||||||
| Accenture PLC, “A” | 23,319 | $ | 1,241,270 | |||||
| Cognizant Technology Solutions Corp., “A” (a) | 28,170 | 1,811,613 | ||||||
| FleetCor Technologies, Inc. (a) | 16,220 | 484,491 | ||||||
| Jones Lang LaSalle, Inc. | 6,520 | 399,415 | ||||||
| MSCI, Inc., “A” (a) | 11,390 | 375,073 | ||||||
| Verisk Analytics, Inc., “A” (a) | 38,460 | 1,543,400 | ||||||
|
| |||||||
| $ | 5,855,262 | |||||||
|
| |||||||
| Cable TV – 1.1% | ||||||||
| Comcast Corp., “Special A” | 69,634 | $ | 1,640,577 | |||||
|
| |||||||
| Chemicals – 0.8% | ||||||||
| Celanese Corp. | 12,070 | $ | 534,339 | |||||
| Monsanto Co. | 9,370 | 656,556 | ||||||
|
| |||||||
| $ | 1,190,895 | |||||||
|
| |||||||
| Computer Software – 6.7% | ||||||||
| Autodesk, Inc. (a) | 44,330 | $ | 1,344,529 | |||||
| Check Point Software Technologies Ltd. (a) | 44,190 | 2,321,743 | ||||||
| Oracle Corp. | 150,950 | 3,871,868 | ||||||
| Issuer | Shares/Par | Value ($) | ||||||
| COMMON STOCKS – continued | ||||||||
| Computer Software – continued | ||||||||
| Red Hat, Inc. (a) | 34,540 | $ | 1,426,157 | |||||
| Salesforce.com, Inc. (a) | 1,430 | 145,088 | ||||||
| VeriSign, Inc. | 22,748 | 812,558 | ||||||
|
| |||||||
| $ | 9,921,943 | |||||||
|
| |||||||
| Computer Software – Systems – 10.4% | ||||||||
| Apple, Inc. (a) | 25,857 | $ | 10,472,085 | |||||
| EMC Corp. (a) | 149,200 | 3,213,768 | ||||||
| International Business Machines Corp. | 7,150 | 1,314,742 | ||||||
| Verifone Systems, Inc. (a) | 9,520 | 338,150 | ||||||
|
| |||||||
| $ | 15,338,745 | |||||||
|
| |||||||
| Construction – 1.0% | ||||||||
| Owens Corning (a) | 19,340 | $ | 555,445 | |||||
| Stanley Black & Decker, Inc. | 14,670 | 991,692 | ||||||
|
| |||||||
| $ | 1,547,137 | |||||||
|
| |||||||
| Consumer Products – 1.4% | ||||||||
| Colgate-Palmolive Co. | 21,900 | $ | 2,023,341 | |||||
|
| |||||||
| Consumer Services – 0.7% | ||||||||
| Priceline.com, Inc. (a) | 2,157 | $ | 1,008,850 | |||||
|
| |||||||
| Electrical Equipment – 3.1% | ||||||||
| Danaher Corp. | 98,910 | $ | 4,652,726 | |||||
|
| |||||||
| Electronics – 1.4% | ||||||||
| Altera Corp. | 17,070 | $ | 633,297 | |||||
| ASML Holding N.V. | 14,605 | 610,343 | ||||||
| Broadcom Corp., “A” | 28,089 | 824,693 | ||||||
|
| |||||||
| $ | 2,068,333 | |||||||
|
| |||||||
| Energy – Independent – 4.3% | ||||||||
| Cabot Oil & Gas Corp. | 16,700 | $ | 1,267,530 | |||||
| EQT Corp. | 20,530 | 1,124,839 | ||||||
| Noble Energy, Inc. | 20,080 | 1,895,351 | ||||||
| Occidental Petroleum Corp. | 14,420 | 1,351,154 | ||||||
| SM Energy Co. | 9,220 | 673,982 | ||||||
|
| |||||||
| $ | 6,312,856 | |||||||
|
| |||||||
| Engineering – Construction – 0.5% | ||||||||
| Fluor Corp. | 15,590 | $ | 783,397 | |||||
|
| |||||||
| Food & Beverages – 3.5% | ||||||||
| Coca-Cola Enterprises, Inc. | 22,670 | $ | 584,433 | |||||
| General Mills, Inc. | 16,880 | 682,121 | ||||||
| Green Mountain Coffee Roasters, Inc. (a) | 7,434 | 333,415 | ||||||
| Groupe Danone | 20,161 | 1,267,356 | ||||||
| Kraft Foods, Inc., “A” | 13,860 | 517,810 | ||||||
| Mead Johnson Nutrition Co., “A” | 25,510 | 1,753,302 | ||||||
|
| |||||||
| $ | 5,138,437 | |||||||
|
| |||||||
| Gaming & Lodging – 1.1% | ||||||||
| Carnival Corp. | 20,350 | $ | 664,224 | |||||
| Las Vegas Sands Corp. (a) | 23,890 | 1,020,820 | ||||||
|
| |||||||
| $ | 1,685,044 | |||||||
|
| |||||||
7
Table of Contents
MFS Growth Portfolio
Portfolio of Investments – continued
| Issuer | Shares/Par | Value ($) | ||||||
| COMMON STOCKS – continued | ||||||||
| General Merchandise – 3.8% | ||||||||
| Costco Wholesale Corp. | 17,530 | $ | 1,460,600 | |||||
| Dollar General Corp. (a) | 26,410 | 1,086,507 | ||||||
| Kohl’s Corp. | 12,690 | 626,251 | ||||||
| Target Corp. | 48,460 | 2,482,121 | ||||||
|
| |||||||
| $ | 5,655,479 | |||||||
|
| |||||||
| Internet – 4.8% | ||||||||
| Google, Inc., “A” (a) | 11,098 | $ | 7,168,198 | |||||
|
| |||||||
| Machinery & Tools – 0.9% | ||||||||
| Joy Global, Inc. | 10,780 | $ | 808,177 | |||||
| Polypore International, Inc. (a) | 12,310 | 541,517 | ||||||
|
| |||||||
| $ | 1,349,694 | |||||||
|
| |||||||
| Medical & Health Technology & Services – 1.4% | ||||||||
| AmerisourceBergen Corp. | 26,030 | $ | 968,056 | |||||
| Cerner Corp. (a) | 11,540 | 706,825 | ||||||
| IDEXX Laboratories, Inc. (a) | 5,340 | 410,966 | ||||||
|
| |||||||
| $ | 2,085,847 | |||||||
|
| |||||||
| Medical Equipment – 2.7% | ||||||||
| Cooper Cos., Inc. | 5,790 | $ | 408,311 | |||||
| Covidien PLC | 31,603 | 1,422,451 | ||||||
| Thermo Fisher Scientific, Inc. (a) | 47,494 | 2,135,805 | ||||||
|
| |||||||
| $ | 3,966,567 | |||||||
|
| |||||||
| Network & Telecom – 3.2% | ||||||||
| F5 Networks, Inc. (a) | 10,130 | $ | 1,074,996 | |||||
| Qualcomm, Inc. | 66,382 | 3,631,095 | ||||||
|
| |||||||
| $ | 4,706,091 | |||||||
|
| |||||||
| Oil Services – 5.3% | ||||||||
| Cameron International Corp. (a) | 39,670 | $ | 1,951,367 | |||||
| Dresser-Rand Group, Inc. (a) | 19,110 | 953,780 | ||||||
| Ensco International PLC, ADR | 26,800 | 1,257,456 | ||||||
| FMC Technologies, Inc. (a) | 12,860 | 671,678 | ||||||
| National Oilwell Varco, Inc. | 9,500 | 645,905 | ||||||
| Oceaneering International, Inc. | 9,600 | 442,848 | ||||||
| Schlumberger Ltd. | 28,383 | 1,938,843 | ||||||
|
| |||||||
| $ | 7,861,877 | |||||||
|
| |||||||
| Other Banks & Diversified Financials – 3.4% | ||||||||
| MasterCard, Inc., “A” | 6,906 | $ | 2,574,695 | |||||
| Visa, Inc., “A” | 24,163 | 2,453,269 | ||||||
|
| |||||||
| $ | 5,027,964 | |||||||
|
| |||||||
| Pharmaceuticals – 2.9% | ||||||||
| Abbott Laboratories | 26,950 | $ | 1,515,398 | |||||
| Allergan, Inc. | 19,542 | 1,714,615 | ||||||
| Pfizer, Inc. | 20,550 | 444,702 | ||||||
| Teva Pharmaceutical Industries Ltd., ADR | 15,860 | 640,110 | ||||||
|
| |||||||
| $ | 4,314,825 | |||||||
|
| |||||||
| Pollution Control – 0.5% | ||||||||
| Stericycle, Inc. (a) | 9,760 | $ | 760,499 | |||||
|
| |||||||
| Issuer | Shares/Par | Value ($) | ||||||
| COMMON STOCKS – continued | ||||||||
| Railroad & Shipping – 1.6% | ||||||||
| Kansas City Southern Co. (a) | 25,660 | $ | 1,745,137 | |||||
| Union Pacific Corp. | 6,353 | 673,037 | ||||||
|
| |||||||
| $ | 2,418,174 | |||||||
|
| |||||||
| Restaurants – 2.0% | ||||||||
| McDonald’s Corp. | 10,958 | $ | 1,099,416 | |||||
| Starbucks Corp. | 40,700 | 1,872,607 | ||||||
|
| |||||||
| $ | 2,972,023 | |||||||
|
| |||||||
| Specialty Chemicals – 1.9% | ||||||||
| Airgas, Inc. | 14,930 | $ | 1,165,734 | |||||
| Praxair, Inc. | 15,991 | 1,709,438 | ||||||
|
| |||||||
| $ | 2,875,172 | |||||||
|
| |||||||
| Specialty Stores – 4.3% | ||||||||
| Amazon.com, Inc. (a) | 5,876 | $ | 1,017,136 | |||||
| PetSmart, Inc. | 20,340 | 1,043,239 | ||||||
| Ross Stores, Inc. | 42,594 | 2,024,493 | ||||||
| Tiffany & Co. | 12,200 | 808,372 | ||||||
| Tractor Supply Co. | 9,490 | 665,723 | ||||||
| Urban Outfitters, Inc. (a) | 29,800 | 821,288 | ||||||
|
| |||||||
| $ | 6,380,251 | |||||||
|
| |||||||
| Telephone Services – 2.5% | ||||||||
| American Tower Corp., “A” (a) | 62,825 | $ | 3,770,128 | |||||
|
| |||||||
| Tobacco – 1.6% | ||||||||
| Philip Morris International, Inc. | 30,140 | $ | 2,365,387 | |||||
|
| |||||||
| Trucking – 0.8% | ||||||||
| Expeditors International of Washington, Inc. | 27,665 | $ | 1,133,158 | |||||
|
| |||||||
| Total Common Stocks (Identified Cost, $126,471,308) | $ | 145,951,709 | ||||||
|
| |||||||
| MONEY MARKET FUNDS – 2.4% | ||||||||
| MFS Institutional Money Market Portfolio, 0.05%, at Cost and Net Asset Value (v) | 3,552,303 | $ | 3,552,303 | |||||
|
| |||||||
| Total Investments (Identified Cost, $130,023,611) | $ | 149,504,012 | ||||||
|
| |||||||
| OTHER ASSETS, LESS LIABILITIES – (0.9)% | (1,273,367 | ) | ||||||
|
| |||||||
| Net Assets – 100.0% | $ | 148,230,645 | ||||||
|
| |||||||
| (a) | Non-income producing security. |
| (v) | Underlying affiliated fund that is available only to investment companies managed by MFS. The rate quoted for the MFS Institutional Money Market Portfolio is the annualized seven-day yield of the fund at period end. |
The following abbreviations are used in this report and are defined:
| ADR | American Depository Receipt |
| PLC | Public Limited Company |
See Notes to Financial Statements
8
Table of Contents
MFS Growth Portfolio
FINANCIAL STATEMENTS | STATEMENT OF ASSETS AND LIABILITIES
This statement represents your fund’s balance sheet, which details the assets and liabilities comprising the total value of the fund.
At 12/31/11 | ||||||||
Assets | ||||||||
Investments – | ||||||||
Non-affiliated issuers, at value (identified cost, $126,471,308) | $145,951,709 | |||||||
Underlying affiliated funds, at cost and value | 3,552,303 | |||||||
Total investments, at value (identified cost, $130,023,611) | $149,504,012 | |||||||
Receivables for | ||||||||
Investments sold | 376,825 | |||||||
Fund shares sold | 34,191 | |||||||
Dividends | 99,177 | |||||||
Other assets | 4,638 | |||||||
Total assets | $150,018,843 | |||||||
Liabilities | ||||||||
Payables for | ||||||||
Investments purchased | $1,608,879 | |||||||
Fund shares reacquired | 122,882 | |||||||
Payable to affiliates | ||||||||
Investment adviser | 9,570 | |||||||
Distribution and/or service fees | 231 | |||||||
Payable for Trustees’ compensation | 298 | |||||||
Accrued expenses and other liabilities | 46,338 | |||||||
Total liabilities | $1,788,198 | |||||||
Net assets | $148,230,645 | |||||||
Net assets consist of | ||||||||
Paid-in capital | $143,307,261 | |||||||
Unrealized appreciation (depreciation) on investments and translation of assets and liabilities in foreign currencies | 19,480,421 | |||||||
Accumulated net realized gain (loss) on investments and foreign currency transactions | (14,557,037 | ) | ||||||
Net assets | $148,230,645 | |||||||
Shares of beneficial interest outstanding | 6,719,067 |
| Net assets | Shares outstanding | Net asset value per share | ||||||||||
Initial Class | $136,991,268 | 6,200,720 | $22.09 | |||||||||
Service Class | 11,239,377 | 518,347 | 21.68 | |||||||||
See Notes to Financial Statements
9
Table of Contents
MFS Growth Portfolio
FINANCIAL STATEMENTS | STATEMENT OF OPERATIONS
This statement describes how much your fund earned in investment income and accrued in expenses. It also describes any gains and/or losses generated by fund operations.
Year ended 12/31/11 | ||||||||
Net investment income | ||||||||
Income | ||||||||
Dividends | $1,333,227 | |||||||
Interest | 15,114 | |||||||
Dividends from underlying affiliated funds | 4,012 | |||||||
Foreign taxes withheld | (10,775 | ) | ||||||
Total investment income | $1,341,578 | |||||||
Expenses | ||||||||
Management fee | $1,214,555 | |||||||
Distribution and/or service fees | 31,833 | |||||||
Administrative services fee | 54,529 | |||||||
Trustees’ compensation | 19,513 | |||||||
Custodian fee | 30,191 | |||||||
Shareholder communications | 12,903 | |||||||
Auditing fees | 47,786 | |||||||
Legal fees | 5,421 | |||||||
Miscellaneous | 20,855 | |||||||
Total expenses | $1,437,586 | |||||||
Fees paid indirectly | (1 | ) | ||||||
Net expenses | $1,437,585 | |||||||
Net investment loss | $(96,007 | ) | ||||||
Realized and unrealized gain (loss) on investments and foreign currency transactions | ||||||||
Realized gain (loss) (identified cost basis) | ||||||||
Investment transactions | $12,625,372 | |||||||
Foreign currency transactions | (2,843 | ) | ||||||
Net realized gain (loss) on investments and foreign currency transactions | $12,622,529 | |||||||
Change in unrealized appreciation (depreciation) | ||||||||
Investments | $(12,854,332 | ) | ||||||
Translation of assets and liabilities in foreign currencies | (816 | ) | ||||||
Net unrealized gain (loss) on investments and foreign currency translation | $(12,855,148 | ) | ||||||
Net realized and unrealized gain (loss) on investments and foreign currency | $(232,619 | ) | ||||||
Change in net assets from operations | $(328,626 | ) |
See Notes to Financial Statements
10
Table of Contents
MFS Growth Portfolio
FINANCIAL STATEMENTS | STATEMENTS OF CHANGES IN NET ASSETS
These statements describe the increases and/or decreases in net assets resulting from operations, any distributions, and any shareholder transactions.
For years ended 12/31 | 2011 | 2010 | ||||||
Change in net assets | ||||||||
From operations | ||||||||
Net investment income (loss) | $(96,007 | ) | $318,084 | |||||
Net realized gain (loss) on investments and foreign currency transactions | 12,622,529 | 14,124,784 | ||||||
Net unrealized gain (loss) on investments and foreign currency translation | (12,855,148 | ) | 9,293,071 | |||||
Change in net assets from operations | $(328,626 | ) | $23,735,939 | |||||
Distributions declared to shareholders | ||||||||
From net investment income | $(249,547 | ) | $(127,589 | ) | ||||
Change in net assets from fund share transactions | $(22,045,795 | ) | $(22,395,996 | ) | ||||
Total change in net assets | $(22,623,968 | ) | $1,212,354 | |||||
Net assets | ||||||||
At beginning of period | 170,854,613 | 169,642,259 | ||||||
At end of period (including undistributed net investment income of $0 and | $148,230,645 | $170,854,613 |
See Notes to Financial Statements
11
Table of Contents
MFS Growth Portfolio
FINANCIAL STATEMENTS | FINANCIAL HIGHLIGHTS
The financial highlights table is intended to help you understand the fund’s financial performance for the past 5 years. Certain information reflects financial results for a single fund share. The total returns in the table represent the rate by which an investor would have earned (or lost) on an investment in the fund share class (assuming reinvestment of all distributions) held for the entire period.
| Initial Class | Years ended 12/31 | |||||||||||||||||||
| 2011 | 2010 | 2009 | 2008 | 2007 | ||||||||||||||||
Net asset value, beginning of period | $22.23 | $19.21 | $13.99 | $22.37 | $18.45 | |||||||||||||||
| Income (loss) from investment operations | ||||||||||||||||||||
Net investment income (loss) (d) | $(0.01 | ) | $0.04 | $0.02 | $0.04 | $0.04 | ||||||||||||||
Net realized and unrealized gain (loss) on investments | (0.09 | ) | 3.00 | 5.24 | (8.37 | ) | 3.88 | |||||||||||||
Total from investment operations | $(0.10 | ) | $3.04 | $5.26 | $(8.33 | ) | $3.92 | |||||||||||||
| Less distributions declared to shareholders | ||||||||||||||||||||
From net investment income | $(0.04 | ) | $(0.02 | ) | $(0.04 | ) | $(0.05 | ) | $— | |||||||||||
Net asset value, end of period (x) | $22.09 | $22.23 | $19.21 | $13.99 | $22.37 | |||||||||||||||
Total return (%) (k)(s)(x) | (0.45 | ) | 15.81 | 37.74 | (37.33 | ) | 21.25 | |||||||||||||
| Ratios (%) (to average net assets) and Supplemental data: | ||||||||||||||||||||
Expenses (f) | 0.87 | 0.88 | 0.89 | 0.88 | 0.84 | |||||||||||||||
Net investment income (loss) | (0.04 | ) | 0.22 | 0.11 | 0.21 | 0.19 | ||||||||||||||
Portfolio turnover | 67 | 99 | 95 | 120 | 76 | |||||||||||||||
Net assets at end of period (000 omitted) | $136,991 | $156,785 | $155,357 | $131,692 | $264,089 | |||||||||||||||
| Service Class | Years ended 12/31 | |||||||||||||||||||
| 2011 | 2010 | 2009 | 2008 | 2007 | ||||||||||||||||
Net asset value, beginning of period | $21.83 | $18.90 | $13.75 | $22.01 | $18.19 | |||||||||||||||
| Income (loss) from investment operations | ||||||||||||||||||||
Net investment loss (d) | $(0.06 | ) | $(0.01 | ) | $(0.02 | ) | $(0.01 | ) | $(0.01 | ) | ||||||||||
Net realized and unrealized gain (loss) on investments | (0.09 | ) | 2.94 | 5.17 | (8.25 | ) | 3.83 | |||||||||||||
Total from investment operations | $(0.15 | ) | $2.93 | $5.15 | $(8.26 | ) | $3.82 | |||||||||||||
Net asset value, end of period (x) | $21.68 | $21.83 | $18.90 | $13.75 | $22.01 | |||||||||||||||
Total return (%) (k)(s)(x) | (0.69 | ) | 15.50 | 37.45 | (37.53 | ) | 21.00 | |||||||||||||
| Ratios (%) (to average net assets) and Supplemental data: | ||||||||||||||||||||
Expenses (f) | 1.12 | 1.13 | 1.14 | 1.13 | 1.09 | |||||||||||||||
Net investment loss | (0.29 | ) | (0.03 | ) | (0.14 | ) | (0.04 | ) | (0.06 | ) | ||||||||||
Portfolio turnover | 67 | 99 | 95 | 120 | 76 | |||||||||||||||
Net assets at end of period (000 omitted) | $11,239 | $14,069 | $14,286 | $13,256 | $23,773 | |||||||||||||||
| (d) | Per share data is based on average shares outstanding. |
| (f) | Ratios do not reflect reductions from fees paid indirectly, if applicable. |
| (k) | The total return does not reflect expenses that apply to separate accounts. Inclusion of these charges would reduce the total return figures for all periods shown. |
| (s) | From time to time the fund may receive proceeds from litigation settlements, without which performance would be lower. Excluding the effect of the proceeds received from a non-recurring litigation settlement against Tyco International Ltd., the Initial Class and Service Class total returns for the year ended December 31, 2010 would have each been lower by approximately 0.61%. |
| (x) | The net asset values per share and total returns have been calculated on net assets which include adjustments made in accordance with U.S. generally accepted accounting principles required at period end for financial reporting purposes. |
See Notes to Financial Statements
12
Table of Contents
MFS Growth Portfolio
| (1) | Business and Organization |
MFS Growth Portfolio (the fund) is a series of MFS Variable Insurance Trust II (the trust). The trust is organized as a Massachusetts business trust and is registered under the Investment Company Act of 1940, as amended, as an open-end management investment company. The shareholders of each series of the trust are separate accounts of insurance companies, which offer variable annuity and/or life insurance products, and qualified retirement and pension plans.
| (2) | Significant Accounting Policies |
General – The preparation of financial statements in conformity with U.S. generally accepted accounting principles requires management to make estimates and assumptions that affect the reported amounts of assets and liabilities, and disclosure of contingent assets and liabilities at the date of the financial statements and the reported amounts of revenues and expenses during the reporting period. Actual results could differ from those estimates. In the preparation of these financial statements, management has evaluated subsequent events occurring after the date of the fund’s Statement of Assets and Liabilities through the date that the financial statements were issued.
In December 2011, the Financial Accounting Standards Board issued Accounting Standards Update 2011-11, Balance Sheet (Topic 210) – Disclosures about Offsetting Assets and Liabilities (“ASU 2011-11”). Effective for annual reporting periods beginning on or after January 1, 2013 and interim periods within those annual periods, ASU 2011-11 is intended to enhance disclosure requirements on the offsetting of financial assets and liabilities. Although still evaluating the potential impacts of ASU 2011-11 to the fund, management expects that the impact of the fund’s adoption will be limited to additional financial statement disclosures.
Investment Valuations – Equity securities, including restricted equity securities, are generally valued at the last sale or official closing price as provided by a third-party pricing service on the market or exchange on which they are primarily traded. Equity securities, for which there were no sales reported that day, are generally valued at the last quoted daily bid quotation as provided by a third-party pricing service on the market or exchange on which such securities are primarily traded. Equity securities held short, for which there were no sales reported for that day, are generally valued at the last quoted daily ask quotation as provided by a third-party pricing service on the market or exchange on which such securities are primarily traded. Short-term instruments with a maturity at issuance of 60 days or less generally are valued at amortized cost, which approximates market value. Open-end investment companies are generally valued at net asset value per share. Securities and other assets generally valued on the basis of information from a third-party pricing service may also be valued at a broker/dealer bid quotation. Values obtained from third-party pricing services can utilize both transaction data and market information such as yield, quality, coupon rate, maturity, type of issue, trading characteristics, and other market data. The values of foreign securities and other assets and liabilities expressed in foreign currencies are converted to U.S. dollars using the mean of bid and asked prices for rates provided by a third-party pricing service.
The Board of Trustees has delegated primary responsibility for determining or causing to be determined the value of the fund’s investments (including any fair valuation) to the adviser pursuant to valuation policies and procedures approved by the Board. If the adviser determines that reliable market quotations are not readily available, investments are valued at fair value as determined in good faith by the adviser in accordance with such procedures under the oversight of the Board of Trustees. Under the fund’s valuation policies and procedures, market quotations are not considered to be readily available for most types of debt instruments and floating rate loans and many types of derivatives. These investments are generally valued at fair value based on information from third-party pricing services. In addition, investments may be valued at fair value if the adviser determines that an investment’s value has been materially affected by events occurring after the close of the exchange or market on which the investment is principally traded (such as foreign exchange or market) and prior to the determination of the fund’s net asset value, or after the halting of trading of a specific security where trading does not resume prior to the close of the exchange or market on which the security is principally traded. Events that occur on a frequent basis after foreign markets close (such as developments in foreign markets and significant movements in the U.S. markets) and prior to the determination of the fund’s net asset value may be deemed to have a material effect on the value of securities traded in foreign markets. Accordingly, the fund’s foreign equity securities may often be valued at fair value. The adviser generally relies on third-party pricing services or other information (such as the correlation with price movements of similar securities in the same or other markets; the type, cost and investment characteristics of the security; the business and financial condition of the issuer; and trading and other market data) to assist in determining whether to fair value and at what value to fair value an investment. The value of an investment for purposes of calculating the fund’s net asset value can differ depending on the source and method used to determine value. When fair valuation is used, the value of an investment used to determine the fund’s net asset value may differ from quoted or published prices for the same investment. There can be no assurance that the fund could obtain the fair value assigned to an investment if it were to sell the investment at the same time at which the fund determines its net asset value per share.
13
Table of Contents
MFS Growth Portfolio
Notes to Financial Statements – continued
Various inputs are used in determining the value of the fund’s assets or liabilities. These inputs are categorized into three broad levels. In certain cases, the inputs used to measure fair value may fall into different levels of the fair value hierarchy. In such cases, an investment’s level within the fair value hierarchy is based on the lowest level of input that is significant to the fair value measurement. The fund’s assessment of the significance of a particular input to the fair value measurement in its entirety requires judgment, and considers factors specific to the investment. Level 1 includes unadjusted quoted prices in active markets for identical assets or liabilities. Level 2 includes other significant observable market-based inputs (including quoted prices for similar securities, interest rates, prepayment speed, and credit risk). Level 3 includes unobservable inputs, which may include the adviser’s own assumptions in determining the fair value of investments. The following is a summary of the levels used as of December 31, 2011 in valuing the fund’s assets or liabilities:
| Investments at Value | Level 1 | Level 2 | Level 3 | Total | ||||||||||||
| Equity Securities: | ||||||||||||||||
United States | $137,305,648 | $— | $— | $137,305,648 | ||||||||||||
United Kingdom | 3,201,675 | — | — | 3,201,675 | ||||||||||||
Israel | 2,961,852 | — | — | 2,961,852 | ||||||||||||
France | 1,267,356 | 604,835 | — | 1,872,191 | ||||||||||||
Netherlands | 610,343 | — | — | 610,343 | ||||||||||||
| Mutual Funds | 3,552,303 | — | — | 3,552,303 | ||||||||||||
| Total Investments | $148,899,177 | $604,835 | $— | $149,504,012 | ||||||||||||
For further information regarding security characteristics, see the Portfolio of Investments.
Foreign Currency Translation – Purchases and sales of foreign investments, income, and expenses are converted into U.S. dollars based upon currency exchange rates prevailing on the respective dates of such transactions or on the reporting date for foreign denominated receivables and payables. Gains and losses attributable to foreign currency exchange rates on sales of securities are recorded for financial statement purposes as net realized gains and losses on investments. Gains and losses attributable to foreign exchange rate movements on receivables, payables, income and expenses are recorded for financial statement purposes as foreign currency transaction gains and losses. That portion of both realized and unrealized gains and losses on investments that results from fluctuations in foreign currency exchange rates is not separately disclosed.
Security Loans – State Street Bank and Trust Company (“State Street”), as lending agent, loans the securities of the fund to certain qualified institutions (the “Borrowers”) approved by the fund. The loans are collateralized by cash and/or U.S. Treasury and federal agency obligations in an amount typically at least equal to the market value of the securities loaned. The market value of the loaned securities is determined at the close of business of the fund and any additional required collateral is delivered to the fund on the next business day. State Street provides the fund with indemnification against Borrower default. The fund bears the risk of loss with respect to the investment of cash collateral. On loans collateralized by cash, the cash collateral is invested in a money market fund or short-term securities. A portion of the income generated upon investment of the collateral is remitted to the Borrowers, and the remainder is allocated between the fund and the lending agent. On loans collateralized by U.S. Treasury and/or federal agency obligations, a fee is received from the Borrower, and is allocated between the fund and the lending agent. Income from securities lending is included in interest income on the Statement of Operations. The dividend and interest income earned on the securities loaned is accounted for in the same manner as other dividend and interest income.
Indemnifications – Under the fund’s organizational documents, its officers and Trustees may be indemnified against certain liabilities and expenses arising out of the performance of their duties to the fund. Additionally, in the normal course of business, the fund enters into agreements with service providers that may contain indemnification clauses. The fund’s maximum exposure under these agreements is unknown as this would involve future claims that may be made against the fund that have not yet occurred.
Investment Transactions and Income – Investment transactions are recorded on the trade date. Interest income is recorded on the accrual basis. Dividends received in cash are recorded on the ex-dividend date. Certain dividends from foreign securities will be recorded when the fund is informed of the dividend if such information is obtained subsequent to the ex-dividend date. Dividend and interest payments received in additional securities are recorded on the ex-dividend or ex-interest date in an amount equal to the value of the security on such date.
The fund may receive proceeds from litigation settlements. Any proceeds received from litigation involving portfolio holdings are reflected in the Statement of Operations in realized gain/loss if the security has been disposed of by the fund or in unrealized gain/loss if the security is still held by the fund. Any other proceeds from litigation not related to portfolio holdings are reflected as other income in the Statement of Operations.
14
Table of Contents
MFS Growth Portfolio
Notes to Financial Statements – continued
Fees Paid Indirectly – The fund’s custody fee may be reduced according to an arrangement that measures the value of cash deposited with the custodian by the fund. This amount, for the year ended December 31, 2011, is shown as a reduction of total expenses on the Statement of Operations.
Tax Matters and Distributions – The fund intends to qualify as a regulated investment company, as defined under Subchapter M of the Internal Revenue Code, and to distribute all of its taxable income, including realized capital gains. As a result, no provision for federal income tax is required. The fund’s federal tax returns for the prior three fiscal years remain subject to examination by the Internal Revenue Service. Foreign taxes have been accrued by the fund in the accompanying financial statements.
Distributions to shareholders are recorded on the ex-dividend date. Income and capital gain distributions are determined in accordance with income tax regulations, which may differ from U.S. generally accepted accounting principles. Certain capital accounts in the financial statements are periodically adjusted for permanent differences in order to reflect their tax character. These adjustments have no impact on net assets or net asset value per share. Temporary differences which arise from recognizing certain items of income, expense, gain or loss in different periods for financial statement and tax purposes will reverse at some time in the future. Distributions in excess of net investment income or net realized gains are temporary overdistributions for financial statement purposes resulting from differences in the recognition or classification of income or distributions for financial statement and tax purposes.
Book/tax differences primarily relate to net operating losses, wash sale loss deferrals, and straddle loss deferrals.
The tax character of distributions declared to shareholders for the last two fiscal years is as follows:
| 12/31/11 | 12/31/10 | |||||||
| Ordinary income (including any short-term capital gains) (a) | $249,547 | $127,589 | ||||||
| (a) | Included in the fund’s distributions from ordinary income is $1,048 in excess of investment company taxable income, which in accordance with applicable U.S. tax law, is taxable to shareholders as ordinary income distributions. |
The federal tax cost and the tax basis components of distributable earnings were as follows:
| As of 12/31/11 | ||||
| Cost of investments | $130,174,392 | |||
| Gross appreciation | 23,171,696 | |||
| Gross depreciation | (3,842,076 | ) | ||
| Net unrealized appreciation (depreciation) | $19,329,620 | |||
| Capital loss carryforwards | (14,345,987 | ) | ||
| Other temporary differences | (60,249 | ) |
Under the Regulated Investment Company Modernization Act of 2010 (the “Act”), net capital losses recognized after December 31, 2010 may be carried forward indefinitely, and their character is retained as short-term and/or long-term losses. Previously, net capital losses were carried forward for eight years and treated as short-term losses. As a transition rule, the Act requires that post-enactment net capital losses be used before pre-enactment net capital losses.
As of December 31, 2011, the fund had capital loss carryforwards available to offset future realized gains. Such losses expire as follows:
| Pre-enactment losses: | ||||
| 12/31/16 | $(4,017,207 | ) | ||
| 12/31/17 | (10,328,780 | ) | ||
| Total | $(14,345,987 | ) |
Multiple Classes of Shares of Beneficial Interest – The fund offers multiple classes of shares, which differ in their respective distribution and/or service fees. The fund’s income, realized and unrealized gain (loss), and common expenses are allocated to shareholders based on the daily net assets of each class. Dividends are declared separately for each class. Differences in per share dividend rates are generally due to differences in separate class expenses. The fund’s distributions declared to shareholders as reported on the Statements of Changes in Net Assets are presented by class as follows:
| From net investment income | ||||||||
| Year ended 12/31/11 | Year ended 12/31/10 | |||||||
| Initial Class | $249,547 | $127,589 | ||||||
15
Table of Contents
MFS Growth Portfolio
Notes to Financial Statements – continued
| (3) | Transactions with Affiliates |
Investment Adviser – The fund has an investment advisory agreement with MFS to provide overall investment management and related administrative services and facilities to the fund. The management fee is computed daily and paid monthly at the following annual rates:
| First $300 million of average daily net assets | 0.75% | |||
| Average daily net assets in excess of $300 million | 0.675% |
The management fee incurred for the year ended December 31, 2011 was equivalent to an annual effective rate of 0.75% of the fund’s average daily net assets.
Distributor – MFS Fund Distributors, Inc. (MFD), a wholly-owned subsidiary of MFS, is the distributor of shares of the fund. The Trustees have adopted a distribution plan for the Service Class shares pursuant to Rule 12b-1 under the Investment Company Act of 1940.
The fund’s distribution plan provides that the fund will pay MFD distribution and/or service fees equal to 0.25% per annum of its average daily net assets attributable to Service Class shares as partial consideration for services performed and expenses incurred by MFD and financial intermediaries (including participating insurance companies that invest in the fund to fund variable annuity and variable life insurance contracts, sponsors of qualified retirement and pension plans that invest in the fund, and affiliates of these participating insurance companies and plan sponsors) in connection with the sale and distribution of the Service Class shares. MFD may subsequently pay all, or a portion, of the distribution and/or service fees to financial intermediaries.
Shareholder Servicing Agent – MFS Service Center, Inc. (MFSC), a wholly-owned subsidiary of MFS, has contracted to provide transfer agent and recordkeeping functions in connection with the issuance, transfer, and redemption of each class of shares of the fund under a Shareholder Servicing Agent Agreement. During the year ended December 31, 2011, the fund did not pay MFSC a fee for this service.
Administrator – MFS provides certain financial, legal, shareholder communications, compliance, and other administrative services to the fund. Under an administrative services agreement, the fund partially reimburses MFS the costs incurred to provide these services. The fund is charged an annual fixed amount of $17,500 plus a fee based on average daily net assets. The administrative services fee incurred for the year ended December 31, 2011 was equivalent to an annual effective rate of 0.0337% of the fund’s average daily net assets.
Trustees’ and Officers’ Compensation – The fund pays compensation to Trustees in the form of a retainer, attendance fees, and additional compensation to the Board chairperson. The fund does not pay compensation directly to officers of the fund who are also officers of the investment adviser, all of whom receive remuneration for their services to the fund from MFS. Certain officers of the fund are officers or directors of MFS, MFD, and MFSC.
Other – This fund and certain other funds managed by MFS (the funds) have entered into services agreements (the Agreements) which provide for payment of fees by the funds to Tarantino LLC and Griffin Compliance LLC in return for the provision of services of an Independent Chief Compliance Officer (ICCO) and Assistant ICCO, respectively, for the funds. The ICCO and Assistant ICCO are officers of the funds and the sole members of Tarantino LLC and Griffin Compliance LLC, respectively. The funds can terminate the Agreements with Tarantino LLC and Griffin Compliance LLC at any time under the terms of the Agreements. MFS has agreed to bear all expenses associated with office space, other administrative support, and supplies provided to the ICCO and Assistant ICCO. For the year ended December 31, 2011, the aggregate fees paid by the fund to Tarantino LLC and Griffin Compliance LLC were $2,701 and are included in miscellaneous expense on the Statement of Operations.
The fund invests in the MFS Institutional Money Market Portfolio which is managed by MFS and seeks a high level of current income consistent with preservation of capital and liquidity. Income earned on this investment is included in dividends from underlying affiliated funds on the Statement of Operations. This money market fund does not pay a management fee to MFS.
| (4) | Portfolio Securities |
Purchases and sales of investments, other than U.S. Government securities, purchased option transactions, and short-term obligations, aggregated $106,744,209 and $130,147,478, respectively.
16
Table of Contents
MFS Growth Portfolio
Notes to Financial Statements – continued
| (5) | Shares of Beneficial Interest |
The fund’s Declaration of Trust permits the Trustees to issue an unlimited number of full and fractional shares of beneficial interest. Transactions in fund shares were as follows:
| Year ended 12/31/11 | Year ended 12/31/10 | |||||||||||||||
| Shares | Amount | Shares | Amount | |||||||||||||
| Shares sold | ||||||||||||||||
Initial Class | 68,730 | $1,548,015 | 77,719 | $1,522,967 | ||||||||||||
Service Class | 56,393 | 1,224,246 | 54,474 | 1,085,267 | ||||||||||||
| 125,123 | $2,772,261 | 132,193 | $2,608,234 | |||||||||||||
| Shares issued to shareholders in reinvestment of distributions | ||||||||||||||||
Initial Class | 11,666 | $249,547 | 6,113 | $127,589 | ||||||||||||
| Shares reacquired | ||||||||||||||||
Initial Class | (932,824 | ) | $(21,028,561 | ) | (1,118,255 | ) | $(21,944,381 | ) | ||||||||
Service Class | (182,474 | ) | (4,039,042 | ) | (165,950 | ) | (3,187,438 | ) | ||||||||
| (1,115,298 | ) | $(25,067,603 | ) | (1,284,205 | ) | $(25,131,819 | ) | |||||||||
| Net change | ||||||||||||||||
Initial Class | (852,428 | ) | $(19,230,999 | ) | (1,034,423 | ) | $(20,293,825 | ) | ||||||||
Service Class | (126,081 | ) | (2,814,796 | ) | (111,476 | ) | (2,102,171 | ) | ||||||||
| (978,509 | ) | $(22,045,795 | ) | (1,145,899 | ) | $(22,395,996 | ) | |||||||||
| (6) | Line of Credit |
The fund and certain other funds managed by MFS participate in a $1.1 billion unsecured committed line of credit, subject to a $1 billion sublimit, provided by a syndication of banks under a credit agreement. Borrowings may be made for temporary financing needs. Interest is charged to each fund, based on its borrowings, generally at a rate equal to the higher of the Federal Reserve funds rate or one month LIBOR plus an agreed upon spread. A commitment fee, based on the average daily, unused portion of the committed line of credit, is allocated among the participating funds at the end of each calendar quarter. In addition, the fund and other funds managed by MFS have established unsecured uncommitted borrowing arrangements with certain banks for temporary financing needs. Interest is charged to each fund, based on its borrowings, at a rate equal to the Federal Reserve funds rate plus an agreed upon spread. For the year ended December 31, 2011, the fund’s commitment fee and interest expense were $1,262 and $0, respectively, and are included in miscellaneous expense on the Statement of Operations.
| (7) | Transactions in Underlying Affiliated Funds – Affiliated Issuers |
An affiliated issuer may be considered one in which the fund owns 5% or more of the outstanding voting securities, or a company which is under common control. For the purposes of this report, the fund assumes the following to be affiliated issuers:
| Underlying Affiliated Funds | Beginning Shares/Par Amount | Acquisitions Shares/Par Amount | Dispositions Shares/Par Amount | Ending Shares/Par Amount | ||||||||||||
| MFS Institutional Money Market Portfolio | 1,141,242 | 41,601,912 | (39,190,851 | ) | 3,552,303 | |||||||||||
| Underlying Affiliated Funds | Realized Gain (Loss) | Capital Gain Distributions | Dividend Income | Ending Value | ||||||||||||
| MFS Institutional Money Market Portfolio | $— | $— | $4,012 | $3,552,303 | ||||||||||||
17
Table of Contents
MFS Growth Portfolio
REPORT OF INDEPENDENT REGISTERED PUBLIC ACCOUNTING FIRM
To the Board of Trustees of MFS Variable Insurance Trust II and the Shareholders of
MFS Growth Portfolio:
We have audited the accompanying statement of assets and liabilities, including the portfolio of investments, of MFS Growth Portfolio (the “Fund”) (one of the portfolios comprising MFS Variable Insurance Trust II) as of December 31, 2011, and the related statement of operations for the year then ended, the statements of changes in net assets for each of the two years in the period then ended, and the financial highlights for each of the five years in the period then ended. These financial statements and financial highlights are the responsibility of the Fund’s management. Our responsibility is to express an opinion on these financial statements and financial highlights based on our audits.
We conducted our audits in accordance with the standards of the Public Company Accounting Oversight Board (United States). Those standards require that we plan and perform the audit to obtain reasonable assurance about whether the financial statements and financial highlights are free of material misstatement. The Fund is not required to have, nor were we engaged to perform, an audit of its internal control over financial reporting. Our audits included consideration of internal control over financial reporting as a basis for designing audit procedures that are appropriate in the circumstances, but not for the purpose of expressing an opinion on the effectiveness of the Fund’s internal control over financial reporting. Accordingly, we express no such opinion. An audit also includes examining, on a test basis, evidence supporting the amounts and disclosures in the financial statements, assessing the accounting principles used and significant estimates made by management, as well as evaluating the overall financial statement presentation. Our procedures included confirmation of securities owned as of December 31, 2011, by correspondence with the custodian and brokers; where replies were not received from brokers, we performed other auditing procedures. We believe that our audits provide a reasonable basis for our opinion.
In our opinion, the financial statements and financial highlights referred to above present fairly, in all material respects, the financial position of MFS Growth Portfolio as of December 31, 2011, the results of its operations for the year then ended, the changes in its net assets for each of the two years in the period then ended, and the financial highlights for each of the five years in the period then ended, in conformity with accounting principles generally accepted in the United States of America.
DELOITTE & TOUCHE LLP
Boston, Massachusetts
February 15, 2012
18
Table of Contents
MFS Growth Portfolio
RESULTS OF SHAREHOLDER MEETING (unaudited)
At a special meeting of shareholders of MFS Growth Portfolio, which was held on December 1, 2011, the following actions were taken for which shareholders of all series of MFS Variable Insurance Trust II voted together as a single class with respect to Item 1 and shareholders of MFS Growth Portfolio voted as a separate class with respect to Items 2 and 3:
Item 1: Election of ten Trustees as members of the Board of Trustees of the Trust effective January 1, 2012:
| Number of Shares | ||||||||
| For | Withheld Authority | |||||||
| Robert E. Butler | 681,916,712.8686 | 46,472,894.9218 | ||||||
| Maureen R. Goldfarb | 682,835,794.8512 | 45,553,812.9392 | ||||||
| David H. Gunning | 681,500,267.3085 | 46,889,340.4819 | ||||||
| William R. Gutow | 681,050,223.5547 | 47,339,384.2357 | ||||||
| Michael Hegarty | 682,477,088.8584 | 45,912,518.9320 | ||||||
| John P. Kavanaugh | 683,794,425.4269 | 44,595,182.3635 | ||||||
| Robert J. Manning | 682,699,559.7374 | 45,690,048.0530 | ||||||
| J. Dale Sherratt | 681,362,743.0513 | 47,026,864.7391 | ||||||
| Laurie J. Thomsen | 683,408,094.0000 | 44,981,513.7904 | ||||||
| Robert W. Uek | 681,424,852.0247 | 46,964,755.7657 | ||||||
Item 2: To approve a new investment advisory agreement dated January 1, 2012, between the Trust, on behalf of MFS Growth Portfolio, and MFS:
| Number of Shares | ||||||||||||
| For | Against | Withheld Authority | ||||||||||
| 6,032,222.6587 | 271,815.7928 | 598,727.7205 | ||||||||||
Item 3: To approve revisions to and restatements of certain fundamental investment restrictions of MFS Growth Portfolio effective January 1, 2012 as detailed below:
| Number of Shares | ||||||||||||||
| For | Against | Withheld Authority | ||||||||||||
| A. | Borrowing | 5,792,280.1374 | 475,866.3995 | 634,619.6351 | ||||||||||
| B. | Underwriting Securities | 5,988,079.4842 | 299,853.8262 | 614,832.8616 | ||||||||||
| C. | Issuance of Senior Securities | 5,990,182.7513 | 277,874.0907 | 634,709.3300 | ||||||||||
| D. | Lending of Money or Securities | 5,924,709.4237 | 360,531.4610 | 617,525.2873 | ||||||||||
| E. | Purchases or Sales of Real Estate; Interests in Oil, Gas or Mineral Leases; and Commodities | 6,060,464.4505 | 249,768.3163 | 592,533.4052 | ||||||||||
| F. | Industry Concentration | 6,006,436.9731 | 257,616.5577 | 638,712.6412 | ||||||||||
19
Table of Contents
MFS Growth Portfolio
TRUSTEES AND OFFICERS – IDENTIFICATION AND BACKGROUND
The Trustees and officers of the Trust, as of February 1, 2012, are listed below, together with their principal occupations during the past five years. (Their titles may have varied during that period.) The address of each Trustee and officer is 500 Boylston Street, Boston, Massachusetts 02116.
Name, Age | Position(s) with Fund | Trustee/Officer Since (h) | Principal Occupations | Other Directorships (j) | ||||
| INTERESTED TRUSTEES | ||||||||
Robert J. Manning (k) (age 48) | Trustee | February 2004 | Massachusetts Financial Services Company, Chairman, Chief Executive Officer and Director; President (until December 2009); Chief Investment Officer (until July 2010) | N/A | ||||
| INDEPENDENT TRUSTEES | ||||||||
David H. Gunning (age 69) | Trustee and Chair of Trustees | January 2004 | Retired; Cleveland-Cliffs Inc. (mining products and service provider), Vice Chairman/Director (until May 2007) | Lincoln Electric Holdings, Inc. (welding equipment manufacturer), Director; Development Alternatives, Inc. (consulting), Director/Non-Executive Chairman; Portman Limited (mining), Director (until 2008) | ||||
Robert E. Butler (age 70) | Trustee | January 2006 | Consultant – investment company industry regulatory and compliance matters | N/A | ||||
Maureen R. Goldfarb (age 56) | Trustee | January 2009 | Private investor | N/A | ||||
William R. Gutow (age 70) | Trustee | December 1993 | Private investor and real estate consultant; Capitol Entertainment Management Company (video franchise), Vice Chairman | Atlantic Coast Tan (tanning salons), Vice Chairman (until 2007); Texas Donuts (donut franchise), Vice Chairman (until 2010) | ||||
Michael Hegarty (age 67) | Trustee | December 2004 | Private investor | N/A | ||||
John P. Kavanaugh (age 57) | Trustee | January 2009 | Private investor; The Hanover Insurance Group, Inc., Vice President and Chief Investment Officer (until 2006); Allmerica Investment Trust, Allmerica Securities Trust and Opus Investment Trust (investment companies), Chairman, President and Trustee (until 2006) | N/A | ||||
J. Dale Sherratt (age 73) | Trustee | June 1989 | Insight Resources, Inc. (acquisition planning specialists), President; Wellfleet Investments (investor in health care companies), Managing General Partner | N/A | ||||
Laurie J. Thomsen (age 54) | Trustee | March 2005 | Private investor; New Profit, Inc. (venture philanthropy), Executive Partner (until 2010) | The Travelers Companies (property and casualty insurance), Director | ||||
Robert W. Uek (age 70) | Trustee | January 2006 | Consultant to investment company industry | N/A | ||||
| OFFICERS | ||||||||
John M. Corcoran (k) (age 46) | President | October 2008 | Massachusetts Financial Services Company, Senior Vice President (since October 2008); State Street Bank and Trust (financial services provider), Senior Vice President, (until September 2008) | N/A | ||||
| Christopher R. Bohane (k) (age 38) | Assistant Secretary and Assistant Clerk | July 2005 | Massachusetts Financial Services Company, Vice President and Senior Counsel | N/A | ||||
Kino Clark (k) (age 43) | Assistant Treasurer | January 2012 | Massachusetts Financial Services Company, Assistant Vice President | N/A | ||||
20
Table of Contents
MFS Growth Portfolio
Trustees and Officers – continued
Name, Age | Position(s) with Fund | Trustee/Officer Since (h) | Principal Occupations | Other Directorships (j) | ||||
Ethan D. Corey (k) (age 48) | Assistant Secretary and Assistant Clerk | July 2005 | Massachusetts Financial Services Company, Senior Vice President and Associate General Counsel | N/A | ||||
David L. DiLorenzo (k) (age 43) | Treasurer | July 2005 | Massachusetts Financial Services Company, Vice President | N/A | ||||
Robyn L. Griffin (age 36) | Assistant Independent Chief Compliance Officer | August 2008 | Griffin Compliance LLC (provider of compliance services), Principal (since August 2008); State Street Corporation (financial services provider), Mutual Fund Administration Assistant Vice President (October 2006 – July 2008); Liberty Mutual Group (insurance), Personal Market Assistant Controller (April 2006 – October 2006); Deloitte & Touche LLP (professional services firm). | N/A | ||||
Brian E. Langenfeld (k) (age 38) | Assistant Secretary and Assistant Clerk | June 2006 | Massachusetts Financial Services Company, Vice President and Senior Counsel | N/A | ||||
Ellen Moynihan (k) (age 54) | Assistant Treasurer | April 1997 | Massachusetts Financial Services Company, Senior Vice President | N/A | ||||
Susan S. Newton (k) (age 61) | Assistant Secretary and Assistant Clerk | May 2005 | Massachusetts Financial Services Company, Senior Vice President and Associate General Counsel | N/A | ||||
Susan A. Pereira (k) (age 41) | Assistant Secretary and Assistant Clerk | July 2005 | Massachusetts Financial Services Company, Vice President and Senior Counsel | N/A | ||||
Mark N. Polebaum (k) (age 59) | Secretary and Clerk | January 2006 | Massachusetts Financial Services Company, Executive Vice President, General Counsel and Secretary | N/A | ||||
Frank L. Tarantino (age 67) | Independent Chief Compliance Officer | June 2004 | Tarantino LLC (provider of compliance services), Principal | N/A | ||||
Richard S. Weitzel (k) (age 41) | Assistant Secretary and Assistant Clerk | October 2007 | Massachusetts Financial Services Company, Vice President and Assistant General Counsel | N/A | ||||
James O. Yost (k) (age 51) | Deputy Treasurer | September 1990 | Massachusetts Financial Services Company, Senior Vice President | N/A | ||||
| (h) | Date first appointed to serve as Trustee/officer of an MFS fund. Each Trustee has served continuously since appointment unless indicated otherwise. For the period from December 15, 2004 until February 22, 2005, Mr. Manning served as Advisory Trustee. For the period October 2008, until January 2012, Mr. Corcoran served as Treasurer of the Funds. Prior to January 2012, Messrs. DiLorenzo and Yost served as Assistant Treasurers of the Funds. |
| (j) | Directorships or trusteeships of companies required to report to the Securities and Exchange Commission (i.e., “public companies”). |
| (k) | “Interested person” of the Trust within the meaning of the Investment Company Act of 1940 (referred to as the 1940 Act), which is the principal federal law governing investment companies like the fund, as a result of position with MFS. The address of MFS is 500 Boylston Street, Boston, Massachusetts 02116. |
Each Trustee has been elected by shareholders and each Trustee and officer holds office until his or her successor is chosen and qualified or until his or her earlier death, resignation, retirement or removal. The Trust does not hold annual meetings for the purpose of electing Trustees, and Trustees are not elected for fixed terms. Messrs. Butler, Kavanaugh, Uek and Ms. Thomsen are members of the Trust’s Audit Committee.
Each of the Fund’s Trustees and officers holds comparable positions with certain other funds of which MFS or a subsidiary is the investment adviser or distributor, and, in the case of the officers, with certain affiliates of MFS. As of January 1, 2012, the Trustees served as board members of 131 funds within the MFS Family of Funds.
21
Table of Contents
MFS Growth Portfolio
Trustees and Officers – continued
The Statement of Additional Information for the Fund includes further information about the Trustees and is available without charge upon request by calling 1-800-225-2606.
Investment Adviser Massachusetts Financial Services Company 500 Boylston Street, Boston, MA 02116-3741 | Custodian State Street Bank and Trust 1 Lincoln Street, Boston, MA 02111-2900 | |
Distributor MFS Fund Distributors, Inc. 500 Boylston Street, Boston, MA 02116-3741 | Independent Registered Public Accounting Firm Deloitte & Touche LLP 200 Berkeley Street, Boston, MA 02116 | |
Portfolio Manager Eric Fischman |
22
Table of Contents
MFS Growth Portfolio
At a special meeting of shareholders of the MFS Growth Portfolio (hereinafter referred to as the “Fund” or the “Portfolio”), which was held on December 1, 2011, the shareholders approved a new investment advisory agreement based on the recommendation of the Board of Trustees. At its July, 2011 meeting, the Board of Trustees (i) approved, and recommended for shareholder approval, the new investment advisory agreement effective January 1, 2012, and (ii) the continuation of the existing investment advisory agreement effective September 1, 2011. The following includes a description of the factors that the Board of Trustees considered and the conclusions that formed the basis of their approval of both the new investment advisory agreement and the continuation of the prior investment advisory agreement.
BOARD APPROVAL OF NEW INVESTMENT ADVISORY AGREEMENT
The Investment Company Act of 1940 requires that both the full Board of Trustees and a majority of the non-interested (“independent”) Trustees, voting separately, initially approve the new investment advisory agreement (the “New Agreement”) between Massachusetts Financial Services Company (“MFS”) and MFS Variable Insurance Trust II (the “Trust”) on behalf of the Portfolio and, beginning on the second anniversary of the initial effective date of the New Agreement, annually approve the continuation of the New Agreement. The Trustees have considered matters bearing on the Portfolio and the then current advisory arrangement at their meetings throughout the year, including a review of performance data at each regular meeting. In addition, the independent Trustees met in person in July 2011 to consider the initial approval of the New Agreement, and to recommend that shareholders approve the New Agreement. The independent Trustees were assisted in their evaluation of the New Agreement by independent legal counsel, from whom they received separate legal advice and with whom they met separately from MFS management. The independent Trustees were also assisted in this process by the Portfolio’s Independent Chief Compliance Officer, a full-time senior officer appointed by and reporting to the independent Trustees.
In connection with their deliberations regarding the initial approval of the New Agreement, the Trustees, including the independent Trustees, considered such information and factors as they believed, in light of the legal advice furnished to them and their own business judgment, to be relevant. The New Agreement was considered separately for the series of the Trust (collectively, the “Portfolios”), although the Trustees also took into account the common interests of all Portfolios in the Trust in their review. As described below, the Trustees considered the nature, quality, and extent of the various investment advisory, administrative, and/or shareholder services to be performed by MFS under the New Agreement and other arrangements with the Trust.
In connection with their initial review meeting, the Trustees received and relied upon materials that included, among other items: (i) information provided by MFS on the advisory fees of comparable portfolios of its other clients, including institutional separate account and other clients, (ii) information as to whether, and to what extent applicable, expense waivers, reimbursements or fee “breakpoints” would be observed for the Portfolio under the New Agreement, and (iii) a comparison and summary of the differences in the provisions in the New Agreement compared to those in each of the then current investment advisory agreements for the Portfolios. In addition, in connection with the independent Trustees’ meetings in May and July, 2011 (the “contract review meetings”) for the purpose of considering whether to approve the continuation of the then current investment advisory agreements for the Portfolio, the independent Trustees received: (1) information provided by Lipper Inc. (“Lipper”) on the investment performance of the Portfolio for various time periods ended December 31, 2010, compared to the investment performance of a group of funds with substantially similar investment classifications/objectives (the “Lipper performance universe”), (2) information provided by Lipper on the Portfolio’s advisory fees and other expenses compared to the advisory fees and other expenses of comparable funds identified by Lipper (the “Lipper expense group”), (3) information regarding MFS’ financial results and financial condition, including MFS’ and certain of its affiliates’ estimated profitability from services performed for the Portfolio, (4) MFS’ views regarding the outlook for the mutual fund industry and its strategic business plans, (5) descriptions of various functions performed by MFS for the Trust, such as compliance monitoring and portfolio trading practices, and (6) information regarding the overall organization of MFS, including information about MFS’ senior management and other personnel providing investment advisory, administrative and other services to the Portfolio. The comparative performance, fee and expense information prepared and provided by Lipper was not independently verified, and the independent Trustees did not independently verify any information provided to them by MFS.
The Trustees’ conclusion as to the initial approval of the New Agreement was based on comprehensive consideration of all information provided to the Trustees and was not the result of any single factor. Some of the factors that figured particularly in the Trustees’ deliberations are described below for the Portfolio, while individual Trustees may have given different weight to various factors and evaluated the information presented as a whole differently than another individual Trustee. The Trustees recognized that the fee arrangements for the Portfolio could reflect years of review and discussion between the independent Trustees and MFS, that certain aspects of such arrangements may receive greater scrutiny in some years than others, and that
23
Table of Contents
MFS Growth Portfolio
Board Approval of New Investment Advisory Agreement – continued
the Trustees’ conclusions may be based, in part, on their consideration of these same arrangements during the course of the year and in prior years.
Because the portfolio management team managing the Portfolio’s investments under the then current investment advisory agreement will remain the same under the New Agreement for the Portfolio, the Trustees compared the Portfolio’s total return investment performance to the performance of its Lipper performance universe over various time periods, based on information provided by Lipper. The Trustees placed particular emphasis on the total return performance of the Portfolio’s Initial Class shares in comparison to the performance of funds in its Lipper performance universe over the one-, three- and five-year periods ended December 31, 2010. The Trustees did not rely on performance results for more recent periods.
The Trustees noted the performance of the Portfolio’s Initial Class shares was in the 4th quintile relative to the other funds in the Lipper performance universe for the one-year period (the 1st quintile being the best performers and the 5th quintile being the worst performers). The total return performance of the Portfolio was in the 3rd quintile for the three-year period and the 2nd quintile for the five-year period ended December 31, 2010, relative to the Lipper performance universe. Based on the nature and quality of services provided by MFS and MFS’ explanation of steps taken to improve performance, the Board of Trustees concluded that the Portfolio’s performance was adequate.
In the course of their deliberations, the Trustees took into account information provided by MFS during contract review meetings, as well as during investment review meetings conducted with portfolio management personnel during the course of the year. For Portfolios whose performance lagged their peer groups, they discussed the factors that contributed thereto and MFS’ efforts to improve such Portfolios’ performance. After reviewing this information, the Trustees concluded, within the context of their overall conclusions regarding the New Agreement, that they were satisfied with MFS’ responses and efforts relating to investment performance.
In assessing the reasonableness of the Portfolio’s advisory fee, the Trustees considered, among other information, the Portfolio’s advisory fee and the total expense ratio of the Portfolio’s Initial Class shares as a percentage of average daily net assets, compared to the advisory fee and total expense ratios of its peer group of funds based on information provided by Lipper. The Trustees also considered the advisory fees charged by MFS to institutional accounts. In comparing these fees, the Trustees considered the generally broader scope of services provided by MFS to the Trust than those provided to institutional accounts. The Trustees also considered the higher demands placed on MFS’ investment personnel and trading infrastructure as a result of the daily cash in-flows and out-flows of the Portfolio, and the impact on MFS and related expenses due to the more extensive regulatory regime to which the Portfolio is subject, compared to institutional accounts.
In considering the fees, the Trustees noted from the Lipper data that the Portfolio’s effective advisory fee rate and total expense ratio were each approximately at the median of such fees and expenses of funds in the Lipper expense group. The Trustees further concluded that the existing breakpoint was sufficient to allow the Portfolio to benefit from economies of scale as its assets grow. The Trustees concluded that the fees were reasonable in light of the nature and quality of services provided.
The Trustees also considered whether the Portfolio is likely to benefit from any economies of scale due to future asset growth. In this regard, the Trustees reviewed the adequacy of breakpoints and discussed with MFS any adjustments necessary for the shareholders’ benefit.
The Trustees also considered information prepared by MFS relating to its costs and profits with respect to the Portfolio and other investment companies and accounts advised by MFS, as well as MFS’ methodologies used to determine and allocate its costs to the Portfolio and other accounts and products for purposes of estimating profitability.
The Trustees noted that there would be no increase to the net advisory fee arrangement for the Portfolio under the New Agreement when compared to the Portfolio’s then current investment advisory agreement. After reviewing these and other factors described below, the Trustees concluded that the advisory fees charged to the Portfolio under the New Agreement represent reasonable compensation in light of the nature and quality of the services being provided by MFS.
In addition, the Trustees considered MFS’ resources and related efforts to continue to retain, attract and motivate capable personnel to serve the Portfolio. The Trustees also considered the financial resources of MFS and its parent, Sun Life Financial Inc. The Trustees further considered any advantages and possible disadvantages of having an adviser which also serves other investment companies as well as institutional accounts.
The Trustees also considered the nature, quality, cost, and extent of administrative, transfer agency, and distribution services provided to the Trust by MFS and its affiliates under agreements and plans other than the New Agreement, including the 12b-1 fees the Portfolio pays to MFS Fund Distributors, Inc., an affiliate of MFS. The Trustees also considered the nature, extent and quality of certain other services MFS performs or arranges on the Portfolio’s behalf, which may include securities lending programs, directed expense payment programs, class action recovery programs, and MFS’ interaction with third-party service
24
Table of Contents
MFS Growth Portfolio
Board Approval of New Investment Advisory Agreement – continued
providers, principally custodians and sub-custodians. The Trustees concluded that the various non-advisory services provided by MFS and its affiliates on behalf of the Portfolio were satisfactory. The Trustees also considered the benefits to MFS from the use of the Portfolio’s portfolio brokerage commissions to pay for investment research and various other factors. Additionally, the Trustees considered so-called “fall-out benefits” to MFS such as reputational value derived from serving as investment manager to the Trust, and determined that any such benefits derived by MFS were reasonable and fair.
Based on their evaluation of factors that they deemed to be material, including those factors described above, the Board of Trustees, including a majority of the independent Trustees, concluded that the New Agreement should be approved for an initial two-year period, commencing upon its effective date, as set forth in the New Agreement.
BOARD APPROVAL OF CONTINUATION OF PRIOR INVESTMENT ADVISORY AGREEMENT
The Investment Company Act of 1940 requires that both the full Board of Trustees and a majority of the non-interested (“independent”) Trustees, voting separately, annually approve the continuation of the investment advisory agreement between MFS Variable Insurance Trust II (the “Trust”) and Massachusetts Financial Services Company (“MFS”) on behalf of the Fund. The Trustees consider matters bearing on the Fund and the advisory arrangements at their meetings throughout the year, including a review of performance data at each regular meeting. In addition, the independent Trustees met in person in May and again in July 2011 (“contract review meetings”) for the specific purpose of considering whether to approve the continuation of the investment advisory agreement for the Fund. The independent Trustees were assisted in their evaluation of the investment advisory agreement by independent legal counsel, from whom they received separate legal advice and with whom they met separately from MFS management during various contract review meetings. The independent Trustees were also assisted in this process by the Fund’s Independent Chief Compliance Officer, a full-time senior officer appointed by and reporting to the independent Trustees.
In connection with their deliberations, the Trustees, including the independent Trustees, considered such information and factors as they believed, in light of the legal advice furnished to them and their own business judgment, to be relevant. The investment advisory agreement was considered separately for the Fund, although the Trustees also took into account the common interests of all Funds in the Trust in their review. As described below, the Trustees considered the nature, quality, and extent of the various investment advisory, administrative, and shareholder services performed by MFS under the existing investment advisory agreement and other arrangements with the Trust.
In connection with their contract review meetings, the Trustees received and relied upon materials which included, among other items: (i) information provided by Lipper Inc. (“Lipper”) on the investment performance of the Fund for various time periods ended December 31, 2010, compared to the investment performance of a group of funds with substantially similar investment classifications/objectives (the “Lipper performance universe”), (ii) information provided by Lipper on the Fund’s advisory fees and other expenses compared to the advisory fees and other expenses of comparable funds identified by Lipper (the “Lipper expense group”), (iii) information provided by MFS on the advisory fees of comparable portfolios of its other clients, including institutional separate account and other clients, (iv) information as to whether, and to what extent applicable, expense waivers, reimbursements or fee “breakpoints” are observed for the Fund, (v) information regarding MFS’ financial results and financial condition, including MFS’ and certain of its affiliates’ estimated profitability from services performed for the Fund and other investment companies that the Board oversees as a whole, and for MFS’ institutional business, (vi) MFS’ views regarding the outlook for the mutual fund industry and its strategic business plans, (vii) descriptions of various functions performed by MFS for the Trust, such as compliance monitoring and portfolio trading practices, and (viii) information regarding the overall organization of MFS, including information about MFS’ senior management and other personnel providing investment advisory, administrative and other services to the Fund. The comparative performance, fee and expense information prepared and provided by Lipper was not independently verified, and the independent Trustees did not independently verify any information provided to them by MFS.
The Trustees’ conclusion as to the continuation of the investment advisory agreement was based on comprehensive consideration of all information provided to the Trustees and was not the result of any single factor. Some of the factors that figured particularly in the Trustees’ deliberations are described below for the Fund, while individual Trustees may have given different weight to various factors and evaluated the information presented as a whole differently than another individual Trustee. The Trustees recognized that the fee arrangements for the Fund reflect years of review and discussion between the independent Trustees and MFS, that certain aspects of such arrangements may receive greater scrutiny in some years than others, and that the Trustees’ conclusions may be based, in part, on their consideration of these same arrangements during the course of the year and in prior years.
25
Table of Contents
MFS Growth Portfolio
Board Approval of Continuation Of Prior Investment Advisory Agreement – continued
Based on information provided by Lipper, the Trustees compared the Fund’s total return investment performance to the performance of the Lipper performance universe over various time periods. The Trustees placed particular emphasis on the total return performance of the Fund’s Initial Class shares in comparison to the performance of funds in its Lipper performance universe over the one-, three- and five -year periods ended December 31, 2010. The Trustees did not rely on performance results for more recent periods, including those shown elsewhere in this report.
The Trustees noted the performance of the Fund’s Initial Class shares was in the 4th quintile relative to the other funds in the Lipper performance universe for the one-year period (the 1st quintile being the best performers and the 5th quintile being the worst performers). The total return performance of the Fund was in the 3rd quintile for the three-year period and the 2nd quintile for the five-year period ended December 31, 2010, relative to the Lipper performance universe. Based on the nature and quality of services provided by MFS, the Board of Trustees concluded that the Fund’s performance was satisfactory.
In the course of their deliberations, the Trustees took into account information provided by MFS during contract review meetings, as well as during investment review meetings conducted with portfolio management personnel during the course of the year.
In assessing the reasonableness of the Fund’s advisory fee, the Trustees considered, among other information, the Fund’s advisory fee and the total expense ratio of the Fund’s Initial Class shares as a percentage of average daily net assets, compared to the advisory fee and total expense ratios of its peer group of funds based on information provided by Lipper. The Trustees also considered the advisory fees charged by MFS to institutional accounts. In comparing these fees, the Trustees considered the generally broader scope of services provided by MFS to the Trust than those provided to institutional accounts. The Trustees also considered the higher demands placed on MFS’ investment personnel and trading infrastructure as a result of the daily cash in-flows and out-flows of the Fund, and the impact on MFS and related expenses due to the more extensive regulatory regime to which the Fund is subject, compared to institutional accounts.
In considering the fees, the Trustees noted from the Lipper data (which takes into account any reductions or expense limitations) that the Fund’s effective advisory fee rate and total expense ratio were each approximately at the median of such fees and expenses of funds in the Lipper expense group. The Trustees further concluded that the existing breakpoint was sufficient to allow the Fund to benefit from economies of scale as its assets grow. The Trustees concluded that the fees were reasonable in light of the nature and quality of services provided.
The Trustees also considered information prepared by MFS relating to its costs and profits with respect to the Fund and other investment companies and accounts advised by MFS, as well as MFS’ methodologies used to determine and allocate its costs to the Fund and other accounts and products for purposes of estimating profitability.
After reviewing these and other factors described below, the Trustees concluded that the advisory fees charged to the Fund represent reasonable compensation in light of the nature and quality of the services being provided by MFS.
In addition, the Trustees considered MFS’ resources and related efforts to continue to retain, attract and motivate capable personnel to serve the Fund. The Trustees also considered the financial resources of MFS and its parent, Sun Life Financial Inc. The Trustees further considered any advantages and possible disadvantages of having an adviser which also serves other investment companies as well as institutional accounts.
The Trustees also considered the nature, quality, cost, and extent of administrative, transfer agency, and distribution services provided to the Fund by MFS and its affiliates under agreements and plans other than the investment advisory agreement, including the 12b-1 fees the Fund pays to MFS Fund Distributors, Inc., an affiliate of MFS. The Trustees also considered the nature, extent and quality of certain other services MFS performs or arranges on the Fund’s behalf, which may include securities lending programs, directed expense payment programs, class action recovery programs, and MFS’ interaction with third-party service providers, principally custodians and sub-custodians. The Trustees concluded that the various non-advisory services provided by MFS and its affiliates on behalf of the Fund were satisfactory. The Trustees also considered the benefits to MFS from the use of the Fund’s portfolio brokerage commissions, if applicable, to pay for investment research and various other factors. Additionally, the Trustees considered so-called “fall-out benefits” to MFS such as reputational value derived from serving as investment manager to the Trust, and determined that any such benefits derived by MFS were reasonable and fair.
Based on their evaluation of factors that they deemed to be material, including those factors described above, the Board of Trustees, including a majority of the independent Trustees, concluded that the investment advisory agreement should be continued for an additional one-year period, commencing September 1, 2011.
A discussion regarding the Board’s most recent review and renewal of the fund’s Investment Advisory Agreement with MFS is available by clicking on the fund’s name under “Variable Insurance Portfolios — VIT II” in the “Products and Performance” section of the MFS Web site (mfs.com).
26
Table of Contents
MFS Growth Portfolio
PROXY VOTING POLICIES AND INFORMATION
A general description of the MFS funds’ proxy voting policies and procedures is available without charge, upon request, by calling 1-800-225-2606, by visiting the Proxy Voting section of mfs.com or by visiting the SEC’s Web site at http://www.sec.gov.
Information regarding how the fund voted proxies relating to portfolio securities during the most recent twelve-month period ended June 30 is available without charge by visiting the Proxy Voting section of mfs.com or by visiting the SEC’s Web site at http://www.sec.gov.
QUARTERLY PORTFOLIO DISCLOSURE
The fund will file a complete schedule of portfolio holdings with the Securities and Exchange Commission (the Commission) for the first and third quarters of each fiscal year on Form N-Q. The fund’s Form N-Q is available on the EDGAR database on the Commission’s Internet Web site at http://www.sec.gov and may be reviewed and copied at the:
Public Reference Room
Securities and Exchange Commission
100 F Street, NE, Room 1580
Washington, D.C. 20549
Information on the operation of the Public Reference Room may be obtained by calling the Commission at 1-800-SEC-0330. Copies of the fund’s Form N-Q also may be obtained, upon payment of a duplicating fee, by electronic request at the following e-mail address: publicinfo@sec.gov or by writing the Public Reference Section at the above address.
From time to time, MFS may post important information about the fund or the MFS funds on the MFS web site (mfs.com). This information is available by visiting the “News & Commentary” section of mfs.com or by clicking on the fund’s name under “Variable Insurance Portfolios — VIT II” in the “Products and Performance” section of mfs.com.
FEDERAL TAX INFORMATION (unaudited)
The following information is provided pursuant to provisions of the Internal Revenue Code.
For corporate shareholders, 100% of the ordinary income dividends paid during the fiscal year qualify for the corporate dividends received deduction.
27
Table of Contents
rev. 3/11

| Why? | Financial companies choose how they share your personal information. Federal law gives consumers the right to limit some but not all sharing. Federal law also requires us to tell you how we collect, share, and protect your personal information. Please read this notice carefully to understand what we do. |
| What? | The types of personal information we collect and share depend on the product or service you have with us. This information can include:
• Social Security number and account balances • Account transactions and transaction history • Checking account information and wire transfer instructions
When you are no longer our customer, we continue to share your information as described in this notice. |
| How? | All financial companies need to share customers’ personal information to run their everyday business. In the section below, we list the reasons financial companies can share their customers’ personal information; the reasons MFS chooses to share; and whether you can limit this sharing. |
| Reasons we can share your personal information | Does MFS share? | Can you limit this sharing? | ||
For our everyday business purposes – such as to process your transactions, maintain your account(s), respond to court orders and legal investigations, or report to credit bureaus | Yes | No | ||
For our marketing purposes – to offer our products and services to you | No | We don’t share | ||
| For joint marketing with other financial companies | No | We don’t share | ||
For our affiliates’ everyday business purposes – information about your transactions and experiences | No | We don’t share | ||
For our affiliates’ everyday business purposes – information about your creditworthiness | No | We don’t share | ||
| For nonaffiliates to market to you | No | We don’t share |
| Questions? | Call 800-225-2606 or go to mfs.com. |
28
Table of Contents
| Page 2 |
| Who we are | ||
| Who is providing this notice? | MFS Funds, MFS Investment Management, MFS Institutional Advisors, Inc., MFS Fund Distributors, Inc., MFS Heritage Trust Company, and MFS Service Center, Inc. | |
| What we do | ||
| How does MFS protect my personal information? | To protect your personal information from unauthorized access and use, we use security measures that comply with federal law. These measures include procedural, electronic, and physical safeguards for the protection of the personal information we collect about you. | |
| How does MFS collect my personal information? | We collect your personal information, for example, when you
• open an account or provide account information • direct us to buy securities or direct us to sell your securities • make a wire transfer
We also collect your personal information from others, such as credit bureaus, affiliates and other companies. | |
| Why can’t I limit all sharing? | Federal law gives you the right to limit only
• sharing for affiliates’ everyday business purposes – information about your creditworthiness • affiliates from using your information to market to you • sharing for nonaffiliates to market to you
State laws and individual companies may give you additional rights to limit sharing. | |
| Definitions | ||
| Affiliates | Companies related by common ownership or control. They can be financial and nonfinancial companies.
•MFS does not share personal information with affiliates, except for everyday business purposes as described on page one of this notice. | |
| Nonaffiliates | Companies not related by common ownership or control. They can be financial and nonfinancial companies.
•MFS does not share with nonaffiliates so they can market to you. | |
| Joint Marketing | A formal agreement between nonaffiliated financial companies that together market financial products or services to you.
•MFS doesn’t jointly market. | |
| Other important information | ||
| If you own an MFS product or receive an MFS service in the name of a third party such as a bank or broker-dealer, their privacy policy may apply to you instead of ours. | ||
29
Table of Contents

Table of Contents

MFS® Mid Cap Growth Portfolio
MFS® Variable Insurance Trust II

ANNUAL REPORT
December 31, 2011
MCS-ANN
Table of Contents
MFS® MID CAP GROWTH PORTFOLIO
The report is prepared for the general information of contract owners.
It is authorized for distribution to prospective investors only when preceded or accompanied by a current prospectus.
NOT FDIC INSURED Ÿ MAY LOSE VALUE Ÿ NO BANK OR CREDIT UNION GUARANTEE Ÿ NOT A DEPOSIT Ÿ NOT INSURED BY ANY FEDERAL GOVERNMENT AGENCY OR NCUA/NCUSIF
Table of Contents
MFS Mid Cap Growth Portfolio
LETTER FROM THE CHAIRMAN AND CEO

Dear Contract Owners:
We are indeed living through some volatile times. Economic uncertainty is everywhere, as it seems no place in the world has been unmoved by crisis. We have seen a devastating earthquake and tsunami that have led to disruptions in the Japanese markets
and supply chains. Protests have changed the face of the Middle East and left in their wake lingering tensions and resultant higher oil prices. We have seen debt limits tested in Europe and the United States and policymakers grappling to craft often unpopular monetary and fiscal responses at a time when consumers and businesses struggle with what appears to be a slowing global economy. On top of all of that, we have seen long-term U.S. debt lose its Standard & Poor’s AAA rating and the long-term debt ratings of 15 eurozone nations put on negative watch.
When markets become volatile, managing risk becomes a top priority for investors and their advisors. At MFS® risk management is foremost in our minds in all market climates. Our analysts and portfolio managers keep risks firmly in mind when evaluating securities. Additionally, we have a team of quantitative analysts that measures and assesses the risk profiles of our portfolios and securities on an ongoing basis. The chief investment risk officer, who oversees the team, reports directly to the firm’s president and chief investment officer so the risk associated with each portfolio can be assessed objectively and independently of the portfolio management team.
As always, we continue to be mindful of the many economic challenges faced at the local, national, and international levels. It is in times such as these that we want to remind investors of the merits of maintaining a long-term view, adhering to basic investing principles such as asset allocation and diversification, and working closely with their advisors to research and identify appropriate investment opportunities.
Respectfully,

Robert J. Manning
Chairman and Chief Executive Officer
MFS Investment Management®
February 15, 2012
The opinions expressed in this letter are subject to change, may not be relied upon for investment advice, and no forecasts can be guaranteed.
1
Table of Contents
MFS Mid Cap Growth Portfolio
Portfolio structure
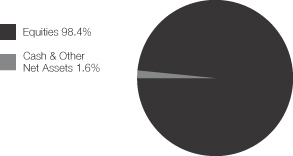
| Top ten holdings | ||||
| American Tower Corp., “A” | 2.2% | |||
| AMETEK, Inc. | 2.0% | |||
| Alexion Pharmaceuticals, Inc. | 2.0% | |||
| Ross Stores, Inc. | 2.0% | |||
| MasterCard, Inc., “A” | 1.8% | |||
| Check Point Software Technologies Ltd. | 1.8% | |||
| Airgas, Inc. | 1.7% | |||
| Verisk Analytics, Inc., “A” | 1.6% | |||
| Dresser-Rand Group, Inc. | 1.5% | |||
| Cameron International Corp. | 1.5% |
| Equity sectors | ||||
| Technology | 16.9% | |||
| Health Care | 14.3% | |||
| Industrial Goods & Services | 12.2% | |||
| Retailing | 10.5% | |||
| Energy | 10.4% | |||
| Special Products & Services | 7.9% | |||
| Autos & Housing | 5.1% | |||
| Basic Materials | 4.8% | |||
| Financial Services | 4.4% | |||
| Consumer Staples | 3.8% | |||
| Leisure | 3.2% | |||
| Utilities & Communications | 2.8% | |||
| Transportation | 2.1% |
Percentages are based on net assets as of 12/31/11.
The portfolio is actively managed and current holdings may be different.
2
Table of Contents
MFS Mid Cap Growth Portfolio
Summary of Results
For the twelve months ended December 31, 2011, Initial Class shares of the MFS Mid Cap Growth Portfolio (the “fund”) provided a total return of –5.99%, while Service Class shares of the fund provided a total return of –6.28%. These compare with a return of –1.65% for the fund’s benchmark, the Russell Midcap Growth Index.
Market Environment
Early in the period, the U.S. Federal Reserve (the “Fed”) responded to weak economic growth by loosening monetary policy further. More easing by the Fed improved market sentiment and drove risk-asset prices markedly higher. The December 2010 agreement on a surprisingly large (relative to expectations) expansionary U.S. fiscal package also boosted sentiment. During the subsequent several months, the renewed positive market sentiment, coupled with better indications of global macroeconomic activity, pushed many asset valuations to post-crisis highs. At the same time, the yields of the perceived “safest” global sovereign credits rose, indicating a renewed risk-seeking environment.
However, towards the middle of the period, a weakening macroeconomic backdrop and renewed concerns over peripheral euro zone sovereign debt caused a flight-to-quality move that pushed high-quality sovereign bond yields lower. In the U.S., concerns about sovereign debt default and the long-term sustainability of the trend in U.S. fiscal policy resulted in one agency downgrading U.S. credit quality. Amidst this turmoil, global equity markets declined sharply. As a result of these developments, global consumer and producer sentiment indicators fell precipitously and highly-rated sovereign bond yields hit multi-decade lows. Towards the end of the reporting period, uncertainty in financial markets spiked higher as markets more seriously contemplated the possible failure of the euro zone.
Detractors from Performance
Stock selection in the special products & services sector detracted from performance relative to the Russell Midcap Growth Index. The fund’s holdings of weak-performing Brazilian post-secondary education company Anhanguera Educacional Participacoes (b) held back relative results. Shares of the company declined as investors appeared to have been concerned about the firm’s future profit growth due to lower average revenue per student from increasing distance-learning enrollment.
Security selection in the leisure sector also held back relative returns. The fund’s holdings of cruise line operator Royal Caribbean Cruises, restaurant operator P.F. Chang’s China Bistro (b)(h), and outdoor advertiser Lamar Advertising (h) hampered relative returns as all three stocks underperformed the benchmark over the reporting period. Shares of Royal Caribbean Cruises declined over the period as weakness from Eastern European cruises and negative financial reporting revisions appeared to have lowered investor confidence in the company.
A combination of the fund’s underweight positions and stock selection in both the health care and consumer staples sectors dampened relative performance. In the health care sector, the timing of the fund’s ownership in shares of strong-performing surgical systems producer Intuitive Surgical hindered relative performance. Intuitive Surgical continued to beat consensus estimates on the backing of strong systems sales throughout the period. There were no individual stocks within the consumer staples sector that were among the fund’s top relative detractors.
Elsewhere, holdings of underperforming oil and gas company Newfield Exploration (h) and internet-based social expression and personal publishing service Shutterfly (b)(h) weighed on relative results. Newfield Exploration reported earnings that significantly missed analyst expectations. The slower earnings growth was primarily due to lower-than-estimated natural gas production and cost inflation from higher oil prices. Not owning shares of outperforming gas pipeline company El Paso and oil and gas exploration company Petrohawk Energy also held back relative returns.
During the reporting period, the timing of the fund’s cash position was also a detractor from relative performance. The fund strives to be fully invested and only holds cash to buy new holdings and to provide liquidity. The most significant impact from the fund’s cash position occurred during the fourth quarter of the reporting period, when equity markets rose, as measured by the fund’s benchmark. Holding cash in up markets can hurt performance versus the benchmark, which has no cash position.
Contributors to Performance
Stock selection in the technology sector contributed to relative performance, led by the fund’s holdings of software developer Autonomy (b)(h). Autonomy was acquired by Hewlett-Packard in October at a significant premium which drove the stock’s price higher. The timing of the fund’s ownership in shares of solar electric power modules manufacturer First Solar (h) also supported relative results. Shares of First Solar traded lower as the company reported lower-than-expected earnings in the second half of the period and its management reduced earnings and operating cash flow guidance. The results were primarily attributable to the delay in cash flows from U.S. projects and lower pricing in Europe due to the deteriorating macroeconomic conditions in the region.
3
Table of Contents
MFS Mid Cap Growth Portfolio
Management Review – continued
Security selection in the transportation sector also benefited relative returns. An overweight position in strong-performing freight rail transportation business Kansas City Southern was among the fund’s top relative contributors for the reporting period. Shares of the company appreciated during the period after reporting better-than-expected earnings due to higher revenues from an increase in freight volume growth and improved pricing.
Elsewhere, the fund’s holdings of debit and credit transaction processing company MasterCard (b), biotechnology firm Alexion Pharmaceuticals, apparel retailer Ross Stores, aerospace components and systems supplier Goodrich (h), broadcast and communication tower management firm American Tower (b) and industrial, medical, and specialty gases distributor Airgas bolstered relative returns. Shares of MasterCard rose during the period, led by increased purchase volume, transactions, and cross-border volume growth which drove higher earnings growth. Management cited processing growth in Brazil and the Netherlands as additional contributors to the stock’s positive performance. Shares of Goodrich appreciated during the period as United Technologies, a diversified aerospace and buildings products manufacturer, entered into an agreement to acquire the company at a premium. Not owning shares of underperforming coal mining company Peabody Energy also supported relative results.
Respectfully,
| Eric Fischman | Paul Gordon | |
| Portfolio Manager | Portfolio Manager |
Note to Contract Owners: Effective May 26, 2011, Paul Gordon replaced David DeGroff as a co-manager of the fund.
| (b) | Security is not a benchmark constituent. |
| (h) | Security was not held in the fund at period end. |
The views expressed in this report are those of the portfolio managers only through the end of the period of the report as stated on the cover and do not necessarily reflect the views of MFS or any other person in the MFS organization. These views are subject to change at any time based on market or other conditions, and MFS disclaims any responsibility to update such views. These views may not be relied upon as investment advice or an indication of trading intent on behalf of any MFS portfolio. References to specific securities are not recommendations of such securities, and may not be representative of any MFS portfolio’s current or future investments.
4
Table of Contents
MFS Mid Cap Growth Portfolio
PERFORMANCE SUMMARY THROUGH 12/31/11
The following chart illustrates the historical performance of the fund in comparison to its benchmark(s). Benchmarks are unmanaged and may not be invested in directly. Benchmark returns do not reflect any fees or expenses. The performance of other share classes will be greater than or less than that of the class depicted below. (See Notes to Performance Summary.)
Performance data shown represents past performance and is no guarantee of future results. Investment return and principal value fluctuate so your units, when sold, may be worth more or less than the original cost; current performance may be lower or higher than quoted. The performance shown does not reflect the deduction of taxes, if any, that a contract holder would pay on fund distributions or the redemption of contract units. The returns for the fund shown also do not reflect the deduction of expenses associated with variable products, such as mortality and expense risk charges, separate account charges, and sales charges imposed by the insurance company separate accounts. Such expenses would reduce the overall returns shown.
Growth of a Hypothetical $10,000 Investment
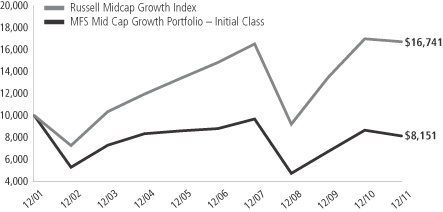
Total Returns through 12/31/11
Average annual total returns
| Share class | Class inception date | 1-yr | 5-yr | 10-yr | ||||||||
| Initial Class | 8/31/00 | (5.99)% | (1.56)% | (2.02)% | ||||||||
| Service Class | 8/24/01 | (6.28)% | (1.82)% | (2.26)% | ||||||||
| Comparative benchmark | ||||||||||||
| Russell Midcap Growth Index (f) | (1.65)% | 2.44% | 5.29% | |||||||||
| (f) | Source: FactSet Research Systems Inc. |
Benchmark Definition
Russell Midcap Growth Index – constructed to provide a comprehensive barometer for growth securities in the mid-cap segment of the U.S. equity universe. Companies in this index generally have higher price-to-book ratios and higher forecasted growth values.
It is not possible to invest directly in an index.
Notes to Performance Summary
Average annual total return represents the average annual change in value for each share class for the periods presented.
Performance results reflect any applicable expense subsidies and waivers in effect during the periods shown. Without such subsidies and waivers the fund’s performance results would be less favorable. Please see the prospectus and financial statements for complete details. All results are historical and assume the reinvestment of any dividends and capital gains distributions.
Performance results do not include adjustments made for financial reporting purposes in accordance with U.S. generally accepted accounting principles and may differ from amounts reported in the financial highlights.
From time to time the fund may receive proceeds from litigation settlements, without which performance would be lower.
5
Table of Contents
MFS Mid Cap Growth Portfolio
Fund Expenses Borne by the Contract Holders During the Period,
July 1, 2011 through December 31, 2011
As a contract holder of the fund, you incur ongoing costs, including management fees; distribution and/or service (12b-1) fees; and other fund expenses. This example is intended to help you understand your ongoing costs (in dollars) of investing in the fund and to compare these costs with the ongoing costs of investing in other mutual funds.
The example is based on an investment of $1,000 invested at the beginning of the period and held for the entire period July 1, 2011 through December 31, 2011.
Actual Expenses
The first line for each share class in the following table provides information about actual account values and actual expenses. You may use the information in this line, together with the amount you invested, to estimate the expenses that you paid over the period. Simply divide your account value by $1,000 (for example, an $8,600 account value divided by $1,000 = 8.6), then multiply the result by the number in the first line under the heading entitled “Expenses Paid During Period” to estimate the expenses you paid on your account during this period.
Hypothetical Example for Comparison Purposes
The second line for each share class in the following table provides information about hypothetical account values and hypothetical expenses based on the fund’s actual expense ratio and an assumed rate of return of 5% per year before expenses, which is not the fund’s actual return. The hypothetical account values and expenses may not be used to estimate the actual ending account balance or expenses you paid for the period. You may use this information to compare the ongoing costs of investing in the fund and other funds. To do so, compare this 5% hypothetical example with the 5% hypothetical examples that appear in the shareholder reports of the other funds.
Please note that the expenses shown in the table are meant to highlight the fund’s ongoing costs only and do not take into account the fees and expenses imposed under the variable contracts through which your investment in the fund is made. Therefore, the second line for each share class in the table is useful in comparing ongoing costs associated with an investment in vehicles (such as the fund) which fund benefits under variable annuity and variable life insurance contracts and to qualified pension and retirement plans only, and will not help you determine the relative total costs of investing in the fund through variable annuity and variable life insurance contracts. If the fees and expenses imposed under the variable contracts were included, your costs would have been higher.
| Share Class | Annualized Expense Ratio | Beginning Account Value 7/01/11 | Ending Account Value 12/31/11 | Expenses Paid During Period (p) 7/01/11-12/31/11 | ||||||||||||||
| Initial Class | Actual | 1.05% | $1,000.00 | $889.76 | $5.00 | |||||||||||||
| Hypothetical (h) | 1.05% | $1,000.00 | $1,019.91 | $5.35 | ||||||||||||||
| Service Class | Actual | 1.30% | $1,000.00 | $887.46 | $6.18 | |||||||||||||
| Hypothetical (h) | 1.30% | $1,000.00 | $1,018.65 | $6.61 | ||||||||||||||
| (h) | 5% class return per year before expenses. |
| (p) | Expenses paid is equal to each class’ annualized expense ratio, as shown above, multiplied by the average account value over the period, multiplied by the number of days in the period, divided by the number of days in the year. |
6
Table of Contents
MFS Mid Cap Growth Portfolio
PORTFOLIO OF INVESTMENTS – 12/31/11
The Portfolio of Investments is a complete list of all securities owned by your fund. It is categorized by broad-based asset classes.
| Issuer | Shares/Par | Value ($) | ||||||
| COMMON STOCKS – 98.4% | ||||||||
| Aerospace – 1.0% | ||||||||
| BE Aerospace, Inc. (a) | 8,080 | $ | 312,777 | |||||
|
| |||||||
| Alcoholic Beverages – 0.7% | ||||||||
| Beam, Inc. | 2,400 | $ | 122,952 | |||||
| Tsingtao Brewery Co. Ltd., “H” | 16,000 | 88,584 | ||||||
|
| |||||||
| $ | 211,536 | |||||||
|
| |||||||
| Apparel Manufacturers – 1.6% | ||||||||
| Li & Fung Ltd. | 80,000 | $ | 148,121 | |||||
| Polo Ralph Lauren Corp. | 640 | 88,371 | ||||||
| VF Corp. | 1,960 | 248,900 | ||||||
|
| |||||||
| $ | 485,392 | |||||||
|
| |||||||
| Automotive – 1.8% | ||||||||
| BorgWarner Transmission Systems, Inc. (a) | 3,800 | $ | 242,212 | |||||
| LKQ Corp. (a) | 10,340 | 311,027 | ||||||
|
| |||||||
| $ | 553,239 | |||||||
|
| |||||||
| Biotechnology – 2.5% | ||||||||
| Alexion Pharmaceuticals, Inc. (a) | 8,460 | $ | 604,890 | |||||
| Gen-Probe, Inc. (a) | 2,850 | 168,492 | ||||||
|
| |||||||
| $ | 773,382 | |||||||
|
| |||||||
| Broadcasting – 1.0% | ||||||||
| Discovery Communications, Inc., “A” (a) | 7,624 | $ | 312,355 | |||||
|
| |||||||
| Brokerage & Asset Managers – 2.4% | ||||||||
| Affiliated Managers Group, Inc. (a) | 3,880 | $ | 372,286 | |||||
| Evercore Partners, Inc. | 4,180 | 111,272 | ||||||
| IntercontinentalExchange, Inc. (a) | 2,100 | 253,155 | ||||||
|
| |||||||
| $ | 736,713 | |||||||
|
| |||||||
| Business Services – 6.1% | ||||||||
| Cognizant Technology Solutions Corp., “A” (a) | 6,070 | $ | 390,362 | |||||
| Concur Technologies, Inc. (a) | 3,830 | 194,526 | ||||||
| FleetCor Technologies, Inc. (a) | 5,740 | 171,454 | ||||||
| Gartner, Inc. (a) | 6,870 | 238,870 | ||||||
| Jones Lang LaSalle, Inc. | 3,110 | 190,519 | ||||||
| MSCI, Inc., “A” (a) | 6,160 | 202,849 | ||||||
| Verisk Analytics, Inc., “A” (a) | 12,230 | 490,790 | ||||||
|
| |||||||
| $ | 1,879,370 | |||||||
|
| |||||||
| Chemicals – 0.9% | ||||||||
| Celanese Corp. | 6,070 | $ | 268,719 | |||||
|
| |||||||
| Computer Software – 6.9% | ||||||||
| Ariba, Inc. (a) | 4,990 | $ | 140,119 | |||||
| Autodesk, Inc. (a) | 9,330 | 282,979 | ||||||
| Check Point Software Technologies Ltd. (a) | 10,300 | 541,162 | ||||||
| Informatica Corp. (a) | 3,230 | 119,284 | ||||||
| Parametric Technology Corp. (a) | 13,330 | 243,406 | ||||||
| Red Hat, Inc. (a) | 9,340 | 385,649 | ||||||
| TIBCO Software, Inc. (a) | 9,860 | 235,753 | ||||||
| VeriSign, Inc. | 5,140 | 183,601 | ||||||
|
| |||||||
| $ | 2,131,953 | |||||||
|
| |||||||
| Issuer | Shares/Par | Value ($) | ||||||
| COMMON STOCKS – continued | ||||||||
| Computer Software – Systems – 3.8% | ||||||||
| BroadSoft, Inc. (a) | 4,170 | $ | 125,934 | |||||
| MICROS Systems, Inc. (a) | 7,990 | 372,174 | ||||||
| NICE Systems Ltd., ADR (a) | 7,240 | 249,418 | ||||||
| Qlik Technologies, Inc. (a) | 10,990 | 265,958 | ||||||
| Verifone Systems, Inc. (a) | 4,760 | 169,075 | ||||||
|
| |||||||
| $ | 1,182,559 | |||||||
|
| |||||||
| Construction – 3.3% | ||||||||
| NVR, Inc. (a) | 280 | $ | 192,080 | |||||
| Owens Corning (a) | 7,480 | 214,826 | ||||||
| Sherwin-Williams Co. | 2,790 | 249,063 | ||||||
| Stanley Black & Decker, Inc. | 5,067 | 342,529 | ||||||
|
| |||||||
| $ | 998,498 | |||||||
|
| |||||||
| Consumer Services – 1.8% | ||||||||
| Anhanguera Educacional Participacoes S.A. | 5,900 | $ | 63,579 | |||||
| HomeAway, Inc. (a) | 2,920 | 67,890 | ||||||
| Priceline.com, Inc. (a) | 622 | 290,916 | ||||||
| Sotheby’s | 4,310 | 122,964 | ||||||
|
| |||||||
| $ | 545,349 | |||||||
|
| |||||||
| Containers – 1.6% | ||||||||
| Ball Corp. | 9,960 | $ | 355,672 | |||||
| Silgan Holdings, Inc. | 3,120 | 120,557 | ||||||
|
| |||||||
| $ | 476,229 | |||||||
|
| |||||||
| Electrical Equipment – 4.0% | ||||||||
| AMETEK, Inc. | 14,505 | $ | 610,661 | |||||
| Mettler-Toledo International, Inc. (a) | 1,540 | 227,473 | ||||||
| MSC Industrial Direct Co., Inc., “A” | 4,570 | 326,984 | ||||||
| Sensata Technologies Holding B.V. (a) | 2,700 | 70,956 | ||||||
|
| |||||||
| $ | 1,236,074 | |||||||
|
| |||||||
| Electronics – 2.5% | ||||||||
| Altera Corp. | 3,380 | $ | 125,398 | |||||
| ARM Holdings PLC | 23,663 | 218,148 | ||||||
| Hittite Microwave Corp. (a) | 2,390 | 118,018 | ||||||
| Microchip Technology, Inc. | 8,300 | 304,029 | ||||||
|
| |||||||
| $ | 765,593 | |||||||
|
| |||||||
| Energy – Independent – 6.2% | ||||||||
| Cabot Oil & Gas Corp. | 5,500 | $ | 417,450 | |||||
| Celtic Exploration Ltd. (a) | 10,480 | 235,266 | ||||||
| Concho Resources, Inc. (a) | 3,160 | 296,250 | ||||||
| EQT Corp. | 4,510 | 247,103 | ||||||
| Paramount Resources Ltd. (a) | 3,460 | 144,344 | ||||||
| Pioneer Natural Resources Co. | 2,930 | 262,176 | ||||||
| SM Energy Co. | 4,180 | 305,558 | ||||||
|
| |||||||
| $ | 1,908,147 | |||||||
|
| |||||||
| Engineering – Construction – 0.5% | ||||||||
| Fluor Corp. | 2,936 | $ | 147,534 | |||||
|
| |||||||
7
Table of Contents
MFS Mid Cap Growth Portfolio
Portfolio of Investments – continued
| Issuer | Shares/Par | Value ($) | ||||||
| COMMON STOCKS – continued | ||||||||
| Food & Beverages – 3.1% | ||||||||
| Coca-Cola Enterprises, Inc. | 7,270 | $ | 187,421 | |||||
| Green Mountain Coffee Roasters, Inc. (a) | 4,240 | 190,164 | ||||||
| Mead Johnson Nutrition Co., “A” | 6,330 | 435,061 | ||||||
| Want Want China Holdings Ltd. | 134,000 | 133,714 | ||||||
|
| |||||||
| $ | 946,360 | |||||||
|
| |||||||
| Gaming & Lodging – 1.2% | ||||||||
| Royal Caribbean Cruises Ltd. | 9,960 | $ | 246,709 | |||||
| Wynn Resorts Ltd. | 1,140 | 125,959 | ||||||
|
| |||||||
| $ | 372,668 | |||||||
|
| |||||||
| General Merchandise – 1.2% | ||||||||
| Dollar General Corp. (a) | 9,220 | $ | 379,311 | |||||
|
| |||||||
| Internet – 1.1% | ||||||||
| LinkedIn Corp., “A” (a) | 2,400 | $ | 151,224 | |||||
| OpenTable, Inc. (a) | 4,550 | 178,042 | ||||||
|
| |||||||
| $ | 329,266 | |||||||
|
| |||||||
| Machinery & Tools – 4.5% | ||||||||
| Cummins, Inc. | 1,670 | $ | 146,993 | |||||
| Flowserve Corp. | 3,200 | 317,824 | ||||||
| Gardner Denver, Inc. | 1,540 | 118,672 | ||||||
| Joy Global, Inc. | 3,620 | 271,391 | ||||||
| Polypore International, Inc. (a) | 5,460 | 240,185 | ||||||
| WABCO Holdings, Inc. (a) | 6,720 | 291,648 | ||||||
|
| |||||||
| $ | 1,386,713 | |||||||
|
| |||||||
| Medical & Health Technology & Services – 5.3% | ||||||||
| AmerisourceBergen Corp. | 7,180 | $ | 267,024 | |||||
| Cerner Corp. (a) | 5,280 | 323,400 | ||||||
| DaVita, Inc. (a) | 3,140 | 238,043 | ||||||
| Diagnosticos da America S.A. | 15,700 | 130,465 | ||||||
| IDEXX Laboratories, Inc. (a) | 3,300 | 253,968 | ||||||
| Patterson Cos., Inc. | 8,360 | 246,787 | ||||||
| SXC Health Solutions Corp. (a) | 3,180 | 179,606 | ||||||
|
| |||||||
| $ | 1,639,293 | |||||||
|
| |||||||
| Medical Equipment – 5.7% | ||||||||
| Cooper Cos., Inc. | 3,313 | $ | 233,633 | |||||
| Covidien PLC | 4,230 | 190,392 | ||||||
| Edwards Lifesciences Corp. (a) | 3,070 | 217,049 | ||||||
| Intuitive Surgical, Inc. (a) | 596 | 275,954 | ||||||
| NxStage Medical, Inc. (a) | 4,510 | 80,188 | ||||||
| Pall Corp. | 5,660 | 323,469 | ||||||
| Sirona Dental Systems, Inc. (a) | 2,530 | 111,421 | ||||||
| Thermo Fisher Scientific, Inc. (a) | 6,850 | 308,045 | ||||||
|
| |||||||
| $ | 1,740,151 | |||||||
|
| |||||||
| Network & Telecom – 2.6% | ||||||||
| Acme Packet, Inc. (a) | 6,850 | $ | 211,733 | |||||
| F5 Networks, Inc. (a) | 2,320 | 246,198 | ||||||
| Fortinet, Inc. (a) | 15,090 | 329,113 | ||||||
|
| |||||||
| $ | 787,044 | |||||||
|
| |||||||
| Oil Services – 4.2% | ||||||||
| Cameron International Corp. (a) | 9,230 | $ | 454,024 | |||||
| Issuer | Shares/Par | Value ($) | ||||||
| COMMON STOCKS – continued | ||||||||
| Oil Services – continued | ||||||||
| Dresser-Rand Group, Inc. (a) | 9,320 | $ | 465,161 | |||||
| FMC Technologies, Inc. (a) | 7,220 | 377,101 | ||||||
|
| |||||||
| $ | 1,296,286 | |||||||
|
| |||||||
| Other Banks & Diversified Financials – 2.0% | ||||||||
| BankUnited, Inc. | 3,580 | $ | 78,724 | |||||
| MasterCard, Inc., “A” | 1,460 | 544,317 | ||||||
|
| |||||||
| $ | 623,041 | |||||||
|
| |||||||
| Pharmaceuticals – 0.8% | ||||||||
| Perrigo Co. | 2,450 | $ | 238,385 | |||||
|
| |||||||
| Pollution Control – 2.2% | ||||||||
| Stericycle, Inc. (a) | 3,400 | $ | 264,928 | |||||
| Waste Connections, Inc. | 12,490 | 413,919 | ||||||
|
| |||||||
| $ | 678,847 | |||||||
|
| |||||||
| Railroad & Shipping – 1.2% | ||||||||
| Kansas City Southern Co. (a) | 5,220 | $ | 355,012 | |||||
|
| |||||||
| Restaurants – 1.0% | ||||||||
| Starbucks Corp. | 7,010 | $ | 322,530 | |||||
|
| |||||||
| Specialty Chemicals – 2.3% | ||||||||
| Airgas, Inc. | 6,610 | $ | 516,109 | |||||
| Rockwood Holdings, Inc. (a) | 4,610 | 181,496 | ||||||
|
| |||||||
| $ | 697,605 | |||||||
|
| |||||||
| Specialty Stores – 7.7% | ||||||||
| American Eagle Outfitters, Inc. | 7,050 | $ | 107,795 | |||||
| Francesca’s Holdings Corp. (a) | 9,350 | 161,755 | ||||||
| O’Reilly Automotive, Inc. (a) | 2,090 | 167,096 | ||||||
| PetSmart, Inc. | 7,190 | 368,775 | ||||||
| Ross Stores, Inc. | 12,700 | 603,631 | ||||||
| Tiffany & Co. | 4,220 | 279,617 | ||||||
| Tractor Supply Co. | 4,770 | 334,615 | ||||||
| Urban Outfitters, Inc. (a) | 12,370 | 340,917 | ||||||
|
| |||||||
| $ | 2,364,201 | |||||||
|
| |||||||
| Telephone Services – 2.2% | ||||||||
| American Tower Corp., “A” (a) | 11,320 | $ | 679,313 | |||||
|
| |||||||
| Trucking – 0.9% | ||||||||
| Expeditors International of Washington, Inc. | 6,490 | $ | 265,830 | |||||
|
| |||||||
| Utilities – Electric Power – 0.6% | ||||||||
| CMS Energy Corp. | 8,980 | $ | 198,278 | |||||
|
| |||||||
| Total Common Stocks (Identified Cost, $27,549,235) | $ | 30,225,553 | ||||||
|
| |||||||
| MONEY MARKET FUNDS – 2.4% | ||||||||
| MFS Institutional Money Market Portfolio, 0.05%, at Cost and Net Asset Value (v) | 726,173 | $ | 726,173 | |||||
|
| |||||||
| Total Investments (Identified Cost, $28,275,408) | $ | 30,951,726 | ||||||
|
| |||||||
| OTHER ASSETS, LESS LIABILITIES – (0.8)% | (242,642 | ) | ||||||
|
| |||||||
| Net Assets – 100.0% | $ | 30,709,084 | ||||||
|
| |||||||
8
Table of Contents
MFS Mid Cap Growth Portfolio
Portfolio of Investments – continued
| (a) | Non-income producing security. |
| (v) | Underlying affiliated fund that is available only to investment companies managed by MFS. The rate quoted for the MFS Institutional Money Market Portfolio is the annualized seven-day yield of the fund at period end. |
The following abbreviations are used in this report and are defined:
| ADR | American Depository Receipt |
| PLC | Public Limited Company |
See Notes to Financial Statements
9
Table of Contents
MFS Mid Cap Growth Portfolio
FINANCIAL STATEMENTS | STATEMENT OF ASSETS AND LIABILITIES
This statement represents your fund’s balance sheet, which details the assets and liabilities comprising the total value of the fund.
At 12/31/11 | ||||||||
Assets | ||||||||
Investments – | ||||||||
Non-affiliated issuers, at value (identified cost, $27,549,235) | $30,225,553 | |||||||
Underlying affiliated funds, at cost and value | 726,173 | |||||||
Total investments, at value (identified cost, $28,275,408) | $30,951,726 | |||||||
Receivables for | ||||||||
Fund shares sold | 2,708 | |||||||
Interest and dividends | 9,212 | |||||||
Other assets | 1,219 | |||||||
Total assets | $30,964,865 | |||||||
Liabilities | ||||||||
Payables for | ||||||||
Investments purchased | $207,874 | |||||||
Fund shares reacquired | 8,364 | |||||||
Payable to affiliates | ||||||||
Investment adviser | 2,040 | |||||||
Distribution and/or service fees | 229 | |||||||
Payable for Trustees’ compensation | 82 | |||||||
Accrued expenses and other liabilities | 37,192 | |||||||
Total liabilities | $255,781 | |||||||
Net assets | $30,709,084 | |||||||
Net assets consist of | ||||||||
Paid-in capital | $43,290,914 | |||||||
Unrealized appreciation (depreciation) on investments and translation of assets and liabilities in foreign currencies | 2,676,319 | |||||||
Accumulated net realized gain (loss) on investments and foreign currency transactions | (15,258,149 | ) | ||||||
Net assets | $30,709,084 | |||||||
Shares of beneficial interest outstanding | 5,478,441 |
| Net assets | Shares outstanding | Net asset value per share | ||||||||||
Initial Class | $19,588,919 | 3,465,037 | $5.65 | |||||||||
Service Class | 11,120,165 | 2,013,404 | 5.52 | |||||||||
See Notes to Financial Statements
10
Table of Contents
MFS Mid Cap Growth Portfolio
FINANCIAL STATEMENTS | STATEMENT OF OPERATIONS
This statement describes how much your fund earned in investment income and accrued in expenses. It also describes any gains and/or losses generated by fund operations.
Year ended 12/31/11 | ||||||||
Net investment loss | ||||||||
Income | ||||||||
Dividends | $156,161 | |||||||
Interest | 5,869 | |||||||
Dividends from underlying affiliated funds | 962 | |||||||
Foreign taxes withheld | (1,182 | ) | ||||||
Total investment income | $161,810 | |||||||
Expenses | ||||||||
Management fee | $279,724 | |||||||
Distribution and/or service fees | 33,775 | |||||||
Administrative services fee | 17,500 | |||||||
Trustees’ compensation | 4,632 | |||||||
Custodian fee | 19,835 | |||||||
Shareholder communications | 6,737 | |||||||
Auditing fees | 44,681 | |||||||
Legal fees | 5,363 | |||||||
Miscellaneous | 11,194 | |||||||
Total expenses | $423,441 | |||||||
Fees paid indirectly | (2 | ) | ||||||
Net expenses | $423,439 | |||||||
Net investment loss | $(261,629 | ) | ||||||
Realized and unrealized gain (loss) on investments and foreign currency transactions | ||||||||
Realized gain (loss) (identified cost basis) | ||||||||
Investment transactions | $5,194,418 | |||||||
Foreign currency transactions | (2,670 | ) | ||||||
Net realized gain (loss) on investments and foreign currency transactions | $5,191,748 | |||||||
Change in unrealized appreciation (depreciation) | ||||||||
Investments | $(7,135,618 | ) | ||||||
Translation of assets and liabilities in foreign currencies | (56 | ) | ||||||
Net unrealized gain (loss) on investments and foreign currency translation | $(7,135,674 | ) | ||||||
Net realized and unrealized gain (loss) on investments and foreign currency | $(1,943,926 | ) | ||||||
Change in net assets from operations | $(2,205,555 | ) |
See Notes to Financial Statements
11
Table of Contents
MFS Mid Cap Growth Portfolio
FINANCIAL STATEMENTS | STATEMENTS OF CHANGES IN NET ASSETS
These statements describe the increases and/or decreases in net assets resulting from operations, any distributions, and any shareholder transactions.
For years ended 12/31 | 2011 | 2010 | ||||||
Change in net assets | ||||||||
From operations | ||||||||
Net investment loss | $(261,629 | ) | $(80,138 | ) | ||||
Net realized gain (loss) on investments and foreign currency transactions | 5,191,748 | 6,134,245 | ||||||
Net unrealized gain (loss) on investments and foreign currency translation | (7,135,674 | ) | 3,418,930 | |||||
Change in net assets from operations | $(2,205,555 | ) | $9,473,037 | |||||
Change in net assets from fund share transactions | $(7,532,661 | ) | $(5,270,471 | ) | ||||
Total change in net assets | $(9,738,216 | ) | $4,202,566 | |||||
Net assets | ||||||||
At beginning of period | 40,447,300 | 36,244,734 | ||||||
At end of period | $30,709,084 | $40,447,300 |
See Notes to Financial Statements
12
Table of Contents
MFS Mid Cap Growth Portfolio
FINANCIAL STATEMENTS | FINANCIAL HIGHLIGHTS
The financial highlights table is intended to help you understand the fund’s financial performance for the past 5 years. Certain information reflects financial results for a single fund share. The total returns in the table represent the rate by which an investor would have earned (or lost) on an investment in the fund share class (assuming reinvestment of all distributions) held for the entire period.
| Initial Class | Years ended 12/31 | |||||||||||||||||||
| 2011 | 2010 | 2009 | 2008 | 2007 | ||||||||||||||||
Net asset value, beginning of period | $6.01 | $4.65 | $3.27 | $6.72 | $6.12 | |||||||||||||||
| Income (loss) from investment operations | ||||||||||||||||||||
Net investment income (loss) (d) | $(0.04 | ) | $(0.01 | ) | $(0.01 | ) | $0.01 | $(0.01 | ) | |||||||||||
Net realized and unrealized gain (loss) on investments | (0.32 | ) | 1.37 | 1.39 | (3.46 | ) | 0.61 | |||||||||||||
Total from investment operations | $(0.36 | ) | $1.36 | $1.38 | $(3.45 | ) | $0.60 | |||||||||||||
| Less distributions declared to shareholders | ||||||||||||||||||||
From net investment income | $— | $— | $(0.00 | )(w) | $— | $(0.00 | )(w) | |||||||||||||
From tax return of capital | — | — | (0.00 | )(w) | — | — | ||||||||||||||
Total distribution declared to shareholders | $— | $— | $(0.00 | )(w) | $— | $(0.00 | )(w) | |||||||||||||
Net asset value, end of period (x) | $5.65 | $6.01 | $4.65 | $3.27 | $6.72 | |||||||||||||||
Total return (%) (k)(r)(s)(x) | (5.99 | ) | 29.25 | 42.31 | (51.34 | ) | 9.84 | |||||||||||||
| Ratios (%) (to average net assets) and Supplemental data: | ||||||||||||||||||||
Expenses (f) | 1.04 | 1.07 | 1.05 | 0.97 | 0.88 | |||||||||||||||
Net investment income (loss) | (0.61 | ) | (0.11 | ) | (0.23 | ) | 0.13 | (0.12 | ) | |||||||||||
Portfolio turnover | 73 | 83 | 100 | 100 | 80 | |||||||||||||||
Net assets at end of period (000 omitted) | $19,589 | $24,944 | $20,300 | $15,803 | $44,944 | |||||||||||||||
| Service Class | Years ended 12/31 | |||||||||||||||||||
| 2011 | 2010 | 2009 | 2008 | 2007 | ||||||||||||||||
Net asset value, beginning of period | $5.89 | $4.57 | $3.22 | $6.63 | $6.05 | |||||||||||||||
| Income (loss) from investment operations | ||||||||||||||||||||
Net investment loss (d) | $(0.05 | ) | $(0.02 | ) | $(0.02 | ) | $(0.01 | ) | $(0.02 | ) | ||||||||||
Net realized and unrealized gain (loss) on investments | (0.32 | ) | 1.34 | 1.37 | (3.40 | ) | 0.60 | |||||||||||||
Total from investment operations | $(0.37 | ) | $1.32 | $1.35 | $(3.41 | ) | $0.58 | |||||||||||||
Net asset value, end of period (x) | $5.52 | $5.89 | $4.57 | $3.22 | $6.63 | |||||||||||||||
Total return (%) (k)(r)(s)(x) | (6.28 | ) | 28.88 | 41.93 | (51.43 | ) | 9.59 | |||||||||||||
| Ratios (%) (to average net assets) and Supplemental data: | ||||||||||||||||||||
Expenses (f) | 1.29 | 1.32 | 1.30 | 1.22 | 1.13 | |||||||||||||||
Net investment loss | (0.86 | ) | (0.38 | ) | (0.48 | ) | (0.12 | ) | (0.37 | ) | ||||||||||
Portfolio turnover | 73 | 83 | 100 | 100 | 80 | |||||||||||||||
Net assets at end of period (000 omitted) | $11,120 | $15,504 | $15,944 | $14,310 | $32,919 | |||||||||||||||
| (d) | Per share data is based on average shares outstanding. |
| (f) | Ratios do not reflect reductions from fees paid indirectly, if applicable. |
| (k) | The total return does not reflect expenses that apply to separate accounts. Inclusion of these charges would reduce the total return figures for all periods shown. |
| (r) | Certain expenses have been reduced without which performance would have been lower. |
| (s) | From time to time the fund may receive proceeds from litigation settlements, without which performance would be lower. |
| (w) | Per share amount was less than $0.01. |
| (x) | The net asset values per share and total returns have been calculated on net assets which include adjustments made in accordance with U.S. generally accepted accounting principles required at period end for financial reporting purposes. |
See Notes to Financial Statements
13
Table of Contents
MFS Mid Cap Growth Portfolio
| (1) | Business and Organization |
MFS Mid Cap Growth Portfolio (the fund) is a series of MFS Variable Insurance Trust II (the trust). The trust is organized as a Massachusetts business trust and is registered under the Investment Company Act of 1940, as amended, as an open-end management investment company. The shareholders of each series of the trust are separate accounts of insurance companies, which offer variable annuity and/or life insurance products, and qualified retirement and pension plans.
| (2) | Significant Accounting Policies |
General – The preparation of financial statements in conformity with U.S. generally accepted accounting principles requires management to make estimates and assumptions that affect the reported amounts of assets and liabilities, and disclosure of contingent assets and liabilities at the date of the financial statements and the reported amounts of revenues and expenses during the reporting period. Actual results could differ from those estimates. In the preparation of these financial statements, management has evaluated subsequent events occurring after the date of the fund’s Statement of Assets and Liabilities through the date that the financial statements were issued.
In December 2011, the Financial Accounting Standards Board issued Accounting Standards Update 2011-11, Balance Sheet (Topic 210) – Disclosures about Offsetting Assets and Liabilities (“ASU 2011-11”). Effective for annual reporting periods beginning on or after January 1, 2013 and interim periods within those annual periods, ASU 2011-11 is intended to enhance disclosure requirements on the offsetting of financial assets and liabilities. Although still evaluating the potential impacts of ASU 2011-11 to the fund, management expects that the impact of the fund’s adoption will be limited to additional financial statement disclosures.
Investment Valuations – Equity securities, including restricted equity securities, are generally valued at the last sale or official closing price as provided by a third-party pricing service on the market or exchange on which they are primarily traded. Equity securities, for which there were no sales reported that day, are generally valued at the last quoted daily bid quotation as provided by a third-party pricing service on the market or exchange on which such securities are primarily traded. Equity securities held short, for which there were no sales reported for that day, are generally valued at the last quoted daily ask quotation as provided by a third-party pricing service on the market or exchange on which such securities are primarily traded. Short-term instruments with a maturity at issuance of 60 days or less generally are valued at amortized cost, which approximates market value. Open-end investment companies are generally valued at net asset value per share. Securities and other assets generally valued on the basis of information from a third-party pricing service may also be valued at a broker/dealer bid quotation. Values obtained from third-party pricing services can utilize both transaction data and market information such as yield, quality, coupon rate, maturity, type of issue, trading characteristics, and other market data. The values of foreign securities and other assets and liabilities expressed in foreign currencies are converted to U.S. dollars using the mean of bid and asked prices for rates provided by a third-party pricing service.
The Board of Trustees has delegated primary responsibility for determining or causing to be determined the value of the fund’s investments (including any fair valuation) to the adviser pursuant to valuation policies and procedures approved by the Board. If the adviser determines that reliable market quotations are not readily available, investments are valued at fair value as determined in good faith by the adviser in accordance with such procedures under the oversight of the Board of Trustees. Under the fund’s valuation policies and procedures, market quotations are not considered to be readily available for most types of debt instruments and floating rate loans and many types of derivatives. These investments are generally valued at fair value based on information from third-party pricing services. In addition, investments may be valued at fair value if the adviser determines that an investment’s value has been materially affected by events occurring after the close of the exchange or market on which the investment is principally traded (such as foreign exchange or market) and prior to the determination of the fund’s net asset value, or after the halting of trading of a specific security where trading does not resume prior to the close of the exchange or market on which the security is principally traded. Events that occur on a frequent basis after foreign markets close (such as developments in foreign markets and significant movements in the U.S. markets) and prior to the determination of the fund’s net asset value may be deemed to have a material effect on the value of securities traded in foreign markets. Accordingly, the fund’s foreign equity securities may often be valued at fair value. The adviser generally relies on third-party pricing services or other information (such as the correlation with price movements of similar securities in the same or other markets; the type, cost and investment characteristics of the security; the business and financial condition of the issuer; and trading and other market data) to assist in determining whether to fair value and at what value to fair value an investment. The value of an investment for purposes of calculating the fund’s net asset value can differ depending on the source and method used to determine value. When fair valuation is used, the value of an investment used to determine the fund’s net asset value may differ from quoted or published prices for the same investment. There can be no assurance that the fund could obtain the fair value assigned to an investment if it were to sell the investment at the same time at which the fund determines its net asset value per share.
14
Table of Contents
MFS Mid Cap Growth Portfolio
Notes to Financial Statements – continued
Various inputs are used in determining the value of the fund’s assets or liabilities. These inputs are categorized into three broad levels. In certain cases, the inputs used to measure fair value may fall into different levels of the fair value hierarchy. In such cases, an investment’s level within the fair value hierarchy is based on the lowest level of input that is significant to the fair value measurement. The fund’s assessment of the significance of a particular input to the fair value measurement in its entirety requires judgment, and considers factors specific to the investment. Level 1 includes unadjusted quoted prices in active markets for identical assets or liabilities. Level 2 includes other significant observable market-based inputs (including quoted prices for similar securities, interest rates, prepayment speed, and credit risk). Level 3 includes unobservable inputs, which may include the adviser’s own assumptions in determining the fair value of investments. The following is a summary of the levels used as of December 31, 2011 in valuing the fund’s assets or liabilities:
| Investments at Value | Level 1 | Level 2 | Level 3 | Total | ||||||||||||
| Equity Securities: | ||||||||||||||||
United States | $28,272,751 | $— | $— | $28,272,751 | ||||||||||||
Israel | 790,580 | — | — | 790,580 | ||||||||||||
Canada | 379,610 | — | — | 379,610 | ||||||||||||
China | 222,298 | — | — | 222,298 | ||||||||||||
United Kingdom | — | 218,148 | — | 218,148 | ||||||||||||
Brazil | 194,044 | — | — | 194,044 | ||||||||||||
Hong Kong | 148,122 | — | — | 148,122 | ||||||||||||
| Mutual Funds | 726,173 | — | — | 726,173 | ||||||||||||
| Total Investments | $30,733,578 | $218,148 | $— | $30,951,726 | ||||||||||||
For further information regarding security characteristics, see the Portfolio of Investments.
Foreign Currency Translation – Purchases and sales of foreign investments, income, and expenses are converted into U.S. dollars based upon currency exchange rates prevailing on the respective dates of such transactions or on the reporting date for foreign denominated receivables and payables. Gains and losses attributable to foreign currency exchange rates on sales of securities are recorded for financial statement purposes as net realized gains and losses on investments. Gains and losses attributable to foreign exchange rate movements on receivables, payables, income and expenses are recorded for financial statement purposes as foreign currency transaction gains and losses. That portion of both realized and unrealized gains and losses on investments that results from fluctuations in foreign currency exchange rates is not separately disclosed.
Security Loans – State Street Bank and Trust Company (“State Street”), as lending agent, loans the securities of the fund to certain qualified institutions (the “Borrowers”) approved by the fund. The loans are collateralized by cash and/or U.S. Treasury and federal agency obligations in an amount typically at least equal to the market value of the securities loaned. The market value of the loaned securities is determined at the close of business of the fund and any additional required collateral is delivered to the fund on the next business day. State Street provides the fund with indemnification against Borrower default. The fund bears the risk of loss with respect to the investment of cash collateral. On loans collateralized by cash, the cash collateral is invested in a money market fund or short-term securities. A portion of the income generated upon investment of the collateral is remitted to the Borrowers, and the remainder is allocated between the fund and the lending agent. On loans collateralized by U.S. Treasury and/or federal agency obligations, a fee is received from the Borrower, and is allocated between the fund and the lending agent. Income from securities lending is included in interest income on the Statement of Operations. The dividend and interest income earned on the securities loaned is accounted for in the same manner as other dividend and interest income.
Indemnifications – Under the fund’s organizational documents, its officers and Trustees may be indemnified against certain liabilities and expenses arising out of the performance of their duties to the fund. Additionally, in the normal course of business, the fund enters into agreements with service providers that may contain indemnification clauses. The fund’s maximum exposure under these agreements is unknown as this would involve future claims that may be made against the fund that have not yet occurred.
Investment Transactions and Income – Investment transactions are recorded on the trade date. Interest income is recorded on the accrual basis. Dividends received in cash are recorded on the ex-dividend date. Certain dividends from foreign securities will be recorded when the fund is informed of the dividend if such information is obtained subsequent to the ex-dividend date. Dividend and interest payments received in additional securities are recorded on the ex-dividend or ex-interest date in an amount equal to the value of the security on such date.
The fund may receive proceeds from litigation settlements. Any proceeds received from litigation involving portfolio holdings are reflected in the Statement of Operations in realized gain/loss if the security has been disposed of by the fund or in
15
Table of Contents
MFS Mid Cap Growth Portfolio
Notes to Financial Statements – continued
unrealized gain/loss if the security is still held by the fund. Any other proceeds from litigation not related to portfolio holdings are reflected as other income in the Statement of Operations.
Fees Paid Indirectly – The fund’s custody fee may be reduced according to an arrangement that measures the value of cash deposited with the custodian by the fund. This amount, for the year ended December 31, 2011, is shown as a reduction of total expenses on the Statement of Operations.
Tax Matters and Distributions – The fund intends to qualify as a regulated investment company, as defined under Subchapter M of the Internal Revenue Code, and to distribute all of its taxable income, including realized capital gains. As a result, no provision for federal income tax is required. The fund’s federal tax returns for the prior three fiscal years remain subject to examination by the Internal Revenue Service. Foreign taxes have been accrued by the fund in the accompanying financial statements.
Distributions to shareholders are recorded on the ex-dividend date. Income and capital gain distributions are determined in accordance with income tax regulations, which may differ from U.S. generally accepted accounting principles. Certain capital accounts in the financial statements are periodically adjusted for permanent differences in order to reflect their tax character. These adjustments have no impact on net assets or net asset value per share. Temporary differences which arise from recognizing certain items of income, expense, gain or loss in different periods for financial statement and tax purposes will reverse at some time in the future. Distributions in excess of net investment income or net realized gains are temporary overdistributions for financial statement purposes resulting from differences in the recognition or classification of income or distributions for financial statement and tax purposes.
Book/tax differences primarily relate to net operating losses and wash sale loss deferrals.
The fund declared no distributions for the years ended December 31, 2011 and December 31, 2010.
The federal tax cost and the tax basis components of distributable earnings were as follows:
| As of 12/31/11 | ||||
| Cost of investments | $28,303,690 | |||
| Gross appreciation | 4,386,458 | |||
| Gross depreciation | (1,738,422 | ) | ||
| Net unrealized appreciation (depreciation) | $2,648,036 | |||
| Capital loss carryforwards | (15,229,914 | ) | ||
| Other temporary differences | 48 |
Under the Regulated Investment Company Modernization Act of 2010 (the “Act”), net capital losses recognized after December 31, 2010 may be carried forward indefinitely, and their character is retained as short-term and/or long-term losses. Previously, net capital losses were carried forward for eight years and treated as short-term losses. As a transition rule, the Act requires that post-enactment net capital losses be used before pre-enactment net capital losses.
As of December 31, 2011, the fund had capital loss carryforwards available to offset future realized gains. Such losses expire as follows:
| Pre-enactment losses: | ||||
| 12/31/16 | $(10,796,194 | ) | ||
| 12/31/17 | (4,433,720 | ) | ||
| Total | $(15,229,914 | ) |
Multiple Classes of Shares of Beneficial Interest – The fund offers multiple classes of shares, which differ in their respective distribution and/or service fees. The fund’s income, realized and unrealized gain (loss), and common expenses are allocated to shareholders based on the daily net assets of each class. Dividends are declared separately for each class. Differences in per share dividend rates are generally due to differences in separate class expenses.
| (3) | Transactions with Affiliates |
Investment Adviser – The fund has an investment advisory agreement with MFS to provide overall investment management and related administrative services and facilities to the fund. The management fee is computed daily and paid monthly at the following annual rates:
| First $1 billion of average daily net assets | 0.75% | |||
| Average daily net assets in excess of $1 billion | 0.70% |
16
Table of Contents
MFS Mid Cap Growth Portfolio
Notes to Financial Statements – continued
The investment adviser has agreed in writing to reduce its management fee to 0.65% of average daily net assets in excess of $2.5 billion. This written agreement will continue until modified by the fund’s Board of Trustees, but such agreement will continue at least until April 30, 2013. For the year ended December 31, 2011, the fund’s average daily net assets did not exceed $2.5 billion and therefore, the management fee was not reduced.
The management fee incurred for the year ended December 31, 2011 was equivalent to an annual effective rate of 0.75% of the fund’s average daily net assets.
Distributor – MFS Fund Distributors, Inc. (MFD), a wholly-owned subsidiary of MFS, is the distributor of shares of the fund. The Trustees have adopted a distribution plan for the Service Class shares pursuant to Rule 12b-1 under the Investment Company Act of 1940.
The fund’s distribution plan provides that the fund will pay MFD distribution and/or service fees equal to 0.25% per annum of its average daily net assets attributable to Service Class shares as partial consideration for services performed and expenses incurred by MFD and financial intermediaries (including participating insurance companies that invest in the fund to fund variable annuity and variable life insurance contracts, sponsors of qualified retirement and pension plans that invest in the fund, and affiliates of these participating insurance companies and plan sponsors) in connection with the sale and distribution of the Service Class shares. MFD may subsequently pay all, or a portion, of the distribution and/or service fees to financial intermediaries.
Shareholder Servicing Agent – MFS Service Center, Inc. (MFSC), a wholly-owned subsidiary of MFS, has contracted to provide transfer agent and recordkeeping functions in connection with the issuance, transfer, and redemption of each class of shares of the fund under a Shareholder Servicing Agent Agreement. During the year ended December 31, 2011, the fund did not pay MFSC a fee for this service.
Administrator – MFS provides certain financial, legal, shareholder communications, compliance, and other administrative services to the fund. Under an administrative services agreement, the fund partially reimburses MFS the costs incurred to provide these services. The fund is charged an annual fixed amount of $17,500 plus a fee based on average daily net assets. The administrative services fee incurred for the year ended December 31, 2011 was equivalent to an annual effective rate of 0.0469% of the fund’s average daily net assets.
Trustees’ and Officers’ Compensation – The fund pays compensation to Trustees in the form of a retainer, attendance fees, and additional compensation to the Board chairperson. The fund does not pay compensation directly to officers of the fund who are also officers of the investment adviser, all of whom receive remuneration for their services to the fund from MFS. Certain officers of the fund are officers or directors of MFS, MFD, and MFSC.
Other – This fund and certain other funds managed by MFS (the funds) have entered into services agreements (the Agreements) which provide for payment of fees by the funds to Tarantino LLC and Griffin Compliance LLC in return for the provision of services of an Independent Chief Compliance Officer (ICCO) and Assistant ICCO, respectively, for the funds. The ICCO and Assistant ICCO are officers of the funds and the sole members of Tarantino LLC and Griffin Compliance LLC, respectively. The funds can terminate the Agreements with Tarantino LLC and Griffin Compliance LLC at any time under the terms of the Agreements. MFS has agreed to bear all expenses associated with office space, other administrative support, and supplies provided to the ICCO and Assistant ICCO. For the year ended December 31, 2011, the aggregate fees paid by the fund to Tarantino LLC and Griffin Compliance LLC were $623 and are included in miscellaneous expense on the Statement of Operations.
The fund invests in the MFS Institutional Money Market Portfolio which is managed by MFS and seeks a high level of current income consistent with preservation of capital and liquidity. Income earned on this investment is included in dividends from underlying affiliated funds on the Statement of Operations. This money market fund does not pay a management fee to MFS.
| (4) | Portfolio Securities |
Purchases and sales of investments, other than U.S. Government securities, purchased option transactions, and short-term obligations, aggregated $26,872,305 and $34,740,524, respectively.
| (5) | Shares of Beneficial Interest |
The fund’s Declaration of Trust permits the Trustees to issue an unlimited number of full and fractional shares of beneficial interest. Transactions in fund shares were as follows:
| Year ended 12/31/11 | Year ended 12/31/10 | |||||||||||||||
| Shares | Amount | Shares | Amount | |||||||||||||
| Shares sold | ||||||||||||||||
Initial Class | 387,423 | $2,363,176 | 512,955 | $2,729,233 | ||||||||||||
Service Class | 140,064 | 810,093 | 249,849 | 1,320,751 | ||||||||||||
| 527,487 | $3,173,269 | 762,804 | $4,049,984 | |||||||||||||
17
Table of Contents
MFS Mid Cap Growth Portfolio
Notes to Financial Statements – continued
| Year ended 12/31/11 | Year ended 12/31/10 | |||||||||||||||
| Shares | Amount | Shares | Amount | |||||||||||||
| Shares reacquired | ||||||||||||||||
Initial Class | (1,069,893 | ) | $(6,255,789 | ) | (730,608 | ) | $(3,656,906 | ) | ||||||||
Service Class | (758,761 | ) | (4,450,141 | ) | (1,109,679 | ) | (5,663,549 | ) | ||||||||
| (1,828,654 | ) | $(10,705,930 | ) | (1,840,287 | ) | $(9,320,455 | ) | |||||||||
| Net change | ||||||||||||||||
Initial Class | (682,470 | ) | $(3,892,613 | ) | (217,653 | ) | $(927,673 | ) | ||||||||
Service Class | (618,697 | ) | (3,640,048 | ) | (859,830 | ) | (4,342,798 | ) | ||||||||
| (1,301,167 | ) | $(7,532,661 | ) | (1,077,483 | ) | $(5,270,471 | ) | |||||||||
| (6) | Line of Credit |
The fund and certain other funds managed by MFS participate in a $1.1 billion unsecured committed line of credit, subject to a $1 billion sublimit, provided by a syndication of banks under a credit agreement. Borrowings may be made for temporary financing needs. Interest is charged to each fund, based on its borrowings, generally at a rate equal to the higher of the Federal Reserve funds rate or one month LIBOR plus an agreed upon spread. A commitment fee, based on the average daily, unused portion of the committed line of credit, is allocated among the participating funds at the end of each calendar quarter. In addition, the fund and other funds managed by MFS have established unsecured uncommitted borrowing arrangements with certain banks for temporary financing needs. Interest is charged to each fund, based on its borrowings, at a rate equal to the Federal Reserve funds rate plus an agreed upon spread. For the year ended December 31, 2011, the fund’s commitment fee and interest expense were $296 and $0, respectively, and are included in miscellaneous expense on the Statement of Operations.
| (7) | Transactions in Underlying Affiliated Funds – Affiliated Issuers |
An affiliated issuer may be considered one in which the fund owns 5% or more of the outstanding voting securities, or a company which is under common control. For the purposes of this report, the fund assumes the following to be affiliated issuers:
| Underlying Affiliated Funds | Beginning Shares/Par Amount | Acquisitions Shares/Par Amount | Dispositions Shares/Par Amount | Ending Shares/Par Amount | ||||||||||||
| MFS Institutional Money Market Portfolio | 475,366 | 14,008,444 | (13,757,637 | ) | 726,173 | |||||||||||
| Underlying Affiliated Funds | Realized Gain (Loss) | Capital Gain Distributions | Dividend Income | Ending Value | ||||||||||||
| MFS Institutional Money Market Portfolio | $— | $— | $962 | $726,173 | ||||||||||||
18
Table of Contents
MFS Mid Cap Growth Portfolio
REPORT OF INDEPENDENT REGISTERED PUBLIC ACCOUNTING FIRM
To the Board of Trustees of MFS Variable Insurance Trust II and the Shareholders of
MFS Mid Cap Growth Portfolio:
We have audited the accompanying statement of assets and liabilities, including the portfolio of investments, of MFS Mid Cap Growth Portfolio (the “Fund”) (one of the portfolios comprising MFS Variable Insurance Trust II) as of December 31, 2011, and the related statement of operations for the year then ended, the statements of changes in net assets for each of the two years in the period then ended, and the financial highlights for each of the five years in the period then ended. These financial statements and financial highlights are the responsibility of the Fund’s management. Our responsibility is to express an opinion on these financial statements and financial highlights based on our audits.
We conducted our audits in accordance with the standards of the Public Company Accounting Oversight Board (United States). Those standards require that we plan and perform the audit to obtain reasonable assurance about whether the financial statements and financial highlights are free of material misstatement. The Fund is not required to have, nor were we engaged to perform, an audit of its internal control over financial reporting. Our audits included consideration of internal control over financial reporting as a basis for designing audit procedures that are appropriate in the circumstances, but not for the purpose of expressing an opinion on the effectiveness of the Fund’s internal control over financial reporting. Accordingly, we express no such opinion. An audit also includes examining, on a test basis, evidence supporting the amounts and disclosures in the financial statements, assessing the accounting principles used and significant estimates made by management, as well as evaluating the overall financial statement presentation. Our procedures included confirmation of securities owned as of December 31, 2011, by correspondence with the custodian and brokers; where replies were not received from brokers, we performed other auditing procedures. We believe that our audits provide a reasonable basis for our opinion.
In our opinion, the financial statements and financial highlights referred to above present fairly, in all material respects, the financial position of MFS Mid Cap Growth Portfolio as of December 31, 2011, the results of its operations for the year then ended, the changes in its net assets for each of the two years in the period then ended, and the financial highlights for each of the five years in the period then ended, in conformity with accounting principles generally accepted in the United States of America.
DELOITTE & TOUCHE LLP
Boston, Massachusetts
February 15, 2012
19
Table of Contents
MFS Mid Cap Growth Portfolio
RESULTS OF SHAREHOLDER MEETING (unaudited)
At a special meeting of shareholders of MFS Mid Cap Growth Portfolio, which was held on December 1, 2011, the following actions were taken for which shareholders of all series of MFS Variable Insurance Trust II voted together as a single class with respect to Item 1 and shareholders of MFS Mid Cap Growth Portfolio voted as a separate class with respect to Items 2 and 3:
Item 1: Election of ten Trustees as members of the Board of Trustees of the Trust effective January 1, 2012:
| Number of Shares | ||||||||
| For | Withheld Authority | |||||||
| Robert E. Butler | 681,916,712.8686 | 46,472,894.9218 | ||||||
| Maureen R. Goldfarb | 682,835,794.8512 | 45,553,812.9392 | ||||||
| David H. Gunning | 681,500,267.3085 | 46,889,340.4819 | ||||||
| William R. Gutow | 681,050,223.5547 | 47,339,384.2357 | ||||||
| Michael Hegarty | 682,477,088.8584 | 45,912,518.9320 | ||||||
| John P. Kavanaugh | 683,794,425.4269 | 44,595,182.3635 | ||||||
| Robert J. Manning | 682,699,559.7374 | 45,690,048.0530 | ||||||
| J. Dale Sherratt | 681,362,743.0513 | 47,026,864.7391 | ||||||
| Laurie J. Thomsen | 683,408,094.0000 | 44,981,513.7904 | ||||||
| Robert W. Uek | 681,424,852.0247 | 46,964,755.7657 | ||||||
Item 2: To approve a new investment advisory agreement dated January 1, 2012, between the Trust, on behalf of MFS Mid Cap Growth Portfolio, and MFS:
| Number of Shares | ||||||||||||
| For | Against | Withheld Authority | ||||||||||
| 4,979,638.8004 | 251,415.0227 | 604,407.8661 | ||||||||||
Item 3: To approve revisions to and restatements of certain fundamental investment restrictions of MFS Mid Cap Growth Portfolio effective January 1, 2012 as detailed below:
| Number of Shares | ||||||||||||||
| For | Against | Withheld Authority | ||||||||||||
| A. | Borrowing | 4,733,828.7908 | 486,773.8106 | 614,859.0878 | ||||||||||
| B. | Underwriting Securities | 4,900,528.6967 | 305,909.9584 | 629,023.0341 | ||||||||||
| C. | Issuance of Senior Securities | 4,909,959.6734 | 303,298.5160 | 622,203.4998 | ||||||||||
| D. | Lending of Money or Securities | 4,805,959.5234 | 400,204.3025 | 629,297.8633 | ||||||||||
| E. | Purchases or Sales of Real Estate; Interests in Oil, Gas or Mineral Leases; and Commodities | 4,952,468.4737 | 240,672.9051 | 642,320.3104 | ||||||||||
| F. | Industry Concentration | 4,988,605.1927 | 238,879.5848 | 607,976.9117 | ||||||||||
20
Table of Contents
MFS Mid Cap Growth Portfolio
TRUSTEES AND OFFICERS – IDENTIFICATION AND BACKGROUND
The Trustees and officers of the Trust, as of February 1, 2012, are listed below, together with their principal occupations during the past five years. (Their titles may have varied during that period.) The address of each Trustee and officer is 500 Boylston Street, Boston, Massachusetts 02116.
Name, Age | Position(s) with Fund | Trustee/Officer Since (h) | Principal Occupations | Other Directorships (j) | ||||
| INTERESTED TRUSTEES | ||||||||
Robert J. Manning (k) (age 48) | Trustee | February 2004 | Massachusetts Financial Services Company, Chairman, Chief Executive Officer and Director; President (until December 2009); Chief Investment Officer (until July 2010) | N/A | ||||
| INDEPENDENT TRUSTEES | ||||||||
David H. Gunning (age 69) | Trustee and Chair of Trustees | January 2004 | Retired; Cleveland-Cliffs Inc. (mining products and service provider), Vice Chairman/Director (until May 2007) | Lincoln Electric Holdings, Inc. (welding equipment manufacturer), Director; Development Alternatives, Inc. (consulting), Director/Non-Executive Chairman; Portman Limited (mining), Director (until 2008) | ||||
Robert E. Butler (age 70) | Trustee | January 2006 | Consultant – investment company industry regulatory and compliance matters | N/A | ||||
Maureen R. Goldfarb (age 56) | Trustee | January 2009 | Private investor | N/A | ||||
William R. Gutow (age 70) | Trustee | December 1993 | Private investor and real estate consultant; Capitol Entertainment Management Company (video franchise), Vice Chairman | Atlantic Coast Tan (tanning salons), Vice Chairman (until 2007); Texas Donuts (donut franchise), Vice Chairman (until 2010) | ||||
Michael Hegarty (age 67) | Trustee | December 2004 | Private investor | N/A | ||||
John P. Kavanaugh (age 57) | Trustee | January 2009 | Private investor; The Hanover Insurance Group, Inc., Vice President and Chief Investment Officer (until 2006); Allmerica Investment Trust, Allmerica Securities Trust and Opus Investment Trust (investment companies), Chairman, President and Trustee (until 2006) | N/A | ||||
J. Dale Sherratt (age 73) | Trustee | June 1989 | Insight Resources, Inc. (acquisition planning specialists), President; Wellfleet Investments (investor in health care companies), Managing General Partner | N/A | ||||
Laurie J. Thomsen (age 54) | Trustee | March 2005 | Private investor; New Profit, Inc. (venture philanthropy), Executive Partner (until 2010) | The Travelers Companies (property and casualty insurance), Director | ||||
Robert W. Uek (age 70) | Trustee | January 2006 | Consultant to investment company industry | N/A | ||||
| OFFICERS | ||||||||
John M. Corcoran (k) (age 46) | President | October 2008 | Massachusetts Financial Services Company, Senior Vice President (since October 2008); State Street Bank and Trust (financial services provider), Senior Vice President, (until September 2008) | N/A | ||||
| Christopher R. Bohane (k) (age 38) | Assistant Secretary and Assistant Clerk | July 2005 | Massachusetts Financial Services Company, Vice President and Senior Counsel | N/A | ||||
Kino Clark (k) (age 43) | Assistant Treasurer | January 2012 | Massachusetts Financial Services Company, Assistant Vice President | N/A | ||||
21
Table of Contents
MFS Mid Cap Growth Portfolio
Trustees and Officers – continued
Name, Age | Position(s) with Fund | Trustee/Officer Since (h) | Principal Occupations | Other Directorships (j) | ||||
Ethan D. Corey (k) (age 48) | Assistant Secretary and Assistant Clerk | July 2005 | Massachusetts Financial Services Company, Senior Vice President and Associate General Counsel | N/A | ||||
David L. DiLorenzo (k) (age 43) | Treasurer | July 2005 | Massachusetts Financial Services Company, Vice President | N/A | ||||
Robyn L. Griffin (age 36) | Assistant Independent Chief Compliance Officer | August 2008 | Griffin Compliance LLC (provider of compliance services), Principal (since August 2008); State Street Corporation (financial services provider), Mutual Fund Administration Assistant Vice President (October 2006 – July 2008); Liberty Mutual Group (insurance), Personal Market Assistant Controller (April 2006 – October 2006); Deloitte & Touche LLP (professional services firm). | N/A | ||||
Brian E. Langenfeld (k) (age 38) | Assistant Secretary and Assistant Clerk | June 2006 | Massachusetts Financial Services Company, Vice President and Senior Counsel | N/A | ||||
Ellen Moynihan (k) (age 54) | Assistant Treasurer | April 1997 | Massachusetts Financial Services Company, Senior Vice President | N/A | ||||
Susan S. Newton (k) (age 61) | Assistant Secretary and Assistant Clerk | May 2005 | Massachusetts Financial Services Company, Senior Vice President and Associate General Counsel | N/A | ||||
Susan A. Pereira (k) (age 41) | Assistant Secretary and Assistant Clerk | July 2005 | Massachusetts Financial Services Company, Vice President and Senior Counsel | N/A | ||||
Mark N. Polebaum (k) (age 59) | Secretary and Clerk | January 2006 | Massachusetts Financial Services Company, Executive Vice President, General Counsel and Secretary | N/A | ||||
Frank L. Tarantino (age 67) | Independent Chief Compliance Officer | June 2004 | Tarantino LLC (provider of compliance services), Principal | N/A | ||||
Richard S. Weitzel (k) (age 41) | Assistant Secretary and Assistant Clerk | October 2007 | Massachusetts Financial Services Company, Vice President and Assistant General Counsel | N/A | ||||
James O. Yost (k) (age 51) | Deputy Treasurer | September 1990 | Massachusetts Financial Services Company, Senior Vice President | N/A | ||||
| (h) | Date first appointed to serve as Trustee/officer of an MFS fund. Each Trustee has served continuously since appointment unless indicated otherwise. For the period from December 15, 2004 until February 22, 2005, Mr. Manning served as Advisory Trustee. For the period October 2008, until January 2012, Mr. Corcoran served as Treasurer of the Funds. Prior to January 2012, Messrs. DiLorenzo and Yost served as Assistant Treasurers of the Funds. |
| (j) | Directorships or trusteeships of companies required to report to the Securities and Exchange Commission (i.e., “public companies”). |
| (k) | “Interested person” of the Trust within the meaning of the Investment Company Act of 1940 (referred to as the 1940 Act), which is the principal federal law governing investment companies like the fund, as a result of position with MFS. The address of MFS is 500 Boylston Street, Boston, Massachusetts 02116. |
Each Trustee has been elected by shareholders and each Trustee and officer holds office until his or her successor is chosen and qualified or until his or her earlier death, resignation, retirement or removal. The Trust does not hold annual meetings for the purpose of electing Trustees, and Trustees are not elected for fixed terms. Messrs. Butler, Kavanaugh, Uek and Ms. Thomsen are members of the Trust’s Audit Committee.
Each of the Fund’s Trustees and officers holds comparable positions with certain other funds of which MFS or a subsidiary is the investment adviser or distributor, and, in the case of the officers, with certain affiliates of MFS. As of January 1, 2012, the Trustees served as board members of 131 funds within the MFS Family of Funds.
22
Table of Contents
MFS Mid Cap Growth Portfolio
Trustees and Officers – continued
The Statement of Additional Information for the Fund includes further information about the Trustees and is available without charge upon request by calling 1-800-225-2606.
Investment Adviser Massachusetts Financial Services Company 500 Boylston Street, Boston, MA 02116-3741 | Custodian State Street Bank and Trust 1 Lincoln Street, Boston, MA 02111-2900 | |
Distributor MFS Fund Distributors, Inc. 500 Boylston Street, Boston, MA 02116-3741 | Independent Registered Public Accounting Firm Deloitte & Touche LLP 200 Berkeley Street, Boston, MA 02116 | |
Portfolio Managers Eric Fischman Paul Gordon |
23
Table of Contents
MFS Mid Cap Growth Portfolio
At a special meeting of shareholders of the MFS Mid Cap Growth Portfolio (hereinafter referred to as the “Fund” or the “Portfolio”), which was held on December 1, 2011, the shareholders approved a new investment advisory agreement based on the recommendation of the Board of Trustees. At its July, 2011 meeting, the Board of Trustees (i) approved, and recommended for shareholder approval, the new investment advisory agreement effective January 1, 2012, and (ii) the continuation of the existing investment advisory agreement effective September 1, 2011. The following includes a description of the factors that the Board of Trustees considered and the conclusions that formed the basis of their approval of both the new investment advisory agreement and the continuation of the prior investment advisory agreement.
BOARD APPROVAL OF NEW INVESTMENT ADVISORY AGREEMENT
The Investment Company Act of 1940 requires that both the full Board of Trustees and a majority of the non-interested (“independent”) Trustees, voting separately, initially approve the new investment advisory agreement (the “New Agreement”) between Massachusetts Financial Services Company (“MFS”) and MFS Variable Insurance Trust II (the “Trust”) on behalf of the Portfolio and, beginning on the second anniversary of the initial effective date of the New Agreement, annually approve the continuation of the New Agreement. The Trustees have considered matters bearing on the Portfolio and the then current advisory arrangement at their meetings throughout the year, including a review of performance data at each regular meeting. In addition, the independent Trustees met in person in July 2011 to consider the initial approval of the New Agreement, and to recommend that shareholders approve the New Agreement. The independent Trustees were assisted in their evaluation of the New Agreement by independent legal counsel, from whom they received separate legal advice and with whom they met separately from MFS management. The independent Trustees were also assisted in this process by the Portfolio’s Independent Chief Compliance Officer, a full-time senior officer appointed by and reporting to the independent Trustees.
In connection with their deliberations regarding the initial approval of the New Agreement, the Trustees, including the independent Trustees, considered such information and factors as they believed, in light of the legal advice furnished to them and their own business judgment, to be relevant. The New Agreement was considered separately for the series of the Trust (collectively, the “Portfolios”), although the Trustees also took into account the common interests of all Portfolios in the Trust in their review. As described below, the Trustees considered the nature, quality, and extent of the various investment advisory, administrative, and/or shareholder services to be performed by MFS under the New Agreement and other arrangements with the Trust.
In connection with their initial review meeting, the Trustees received and relied upon materials that included, among other items: (i) information provided by MFS on the advisory fees of comparable portfolios of its other clients, including institutional separate account and other clients, (ii) information as to whether, and to what extent applicable, expense waivers, reimbursements or fee “breakpoints” would be observed for the Portfolio under the New Agreement, and (iii) a comparison and summary of the differences in the provisions in the New Agreement compared to those in each of the then current investment advisory agreements for the Portfolios. In addition, in connection with the independent Trustees’ meetings in May and July, 2011 (the “contract review meetings”) for the purpose of considering whether to approve the continuation of the then current investment advisory agreements for the Portfolio, the independent Trustees received: (1) information provided by Lipper Inc. (“Lipper”) on the investment performance of the Portfolio for various time periods ended December 31, 2010, compared to the investment performance of a group of funds with substantially similar investment classifications/objectives (the “Lipper performance universe”), (2) information provided by Lipper on the Portfolio’s advisory fees and other expenses compared to the advisory fees and other expenses of comparable funds identified by Lipper (the “Lipper expense group”), (3) information regarding MFS’ financial results and financial condition, including MFS’ and certain of its affiliates’ estimated profitability from services performed for the Portfolio, (4) MFS’ views regarding the outlook for the mutual fund industry and its strategic business plans, (5) descriptions of various functions performed by MFS for the Trust, such as compliance monitoring and portfolio trading practices, and (6) information regarding the overall organization of MFS, including information about MFS’ senior management and other personnel providing investment advisory, administrative and other services to the Portfolio. The comparative performance, fee and expense information prepared and provided by Lipper was not independently verified, and the independent Trustees did not independently verify any information provided to them by MFS.
The Trustees’ conclusion as to the initial approval of the New Agreement was based on comprehensive consideration of all information provided to the Trustees and was not the result of any single factor. Some of the factors that figured particularly in the Trustees’ deliberations are described below for the Portfolio, while individual Trustees may have given different weight to various factors and evaluated the information presented as a whole differently than another individual Trustee. The Trustees recognized that the fee arrangements for the Portfolio could reflect years of review and discussion between the independent Trustees and MFS, that certain aspects of such arrangements may receive greater scrutiny in some years than others, and that
24
Table of Contents
MFS Mid Cap Growth Portfolio
Board Approval of New Investment Advisory Agreement – continued
the Trustees’ conclusions may be based, in part, on their consideration of these same arrangements during the course of the year and in prior years.
Because the portfolio management team managing the Portfolio’s investments under the then current investment advisory agreement will remain the same under the New Agreement for the Portfolio, the Trustees compared the Portfolio’s total return investment performance to the performance of its Lipper performance universe over various time periods, based on information provided by Lipper. The Trustees placed particular emphasis on the total return performance of the Portfolio’s Initial Class shares in comparison to the performance of funds in its Lipper performance universe over the one-, three- and five-year periods ended December 31, 2010. The Trustees did not rely on performance results for more recent periods.
The Trustees noted the performance of the Portfolio’s Initial Class shares was in the 1st quintile relative to the other funds in the Lipper performance universe for the one-year period (the 1st quintile being the best performers and the 5th quintile being the worst performers). The total return performance of the Portfolio was in the 5th quintile for the three-year and five-year periods ended December 31, 2010, relative to the Lipper performance universe. Based on the nature and quality of services provided by MFS, the Board of Trustees concluded that the Portfolio’s performance was satisfactory.
In the course of their deliberations, the Trustees took into account information provided by MFS during contract review meetings, as well as during investment review meetings conducted with portfolio management personnel during the course of the year. For Portfolios whose performance lagged their peer groups, they discussed the factors that contributed thereto and MFS’ efforts to improve such Portfolios’ performance. After reviewing this information, the Trustees concluded, within the context of their overall conclusions regarding the New Agreement, that they were satisfied with MFS’ responses and efforts relating to investment performance.
In assessing the reasonableness of the Portfolio’s advisory fee, the Trustees considered, among other information, the Portfolio’s advisory fee and the total expense ratio of the Portfolio’s Initial Class shares as a percentage of average daily net assets, compared to the advisory fee and total expense ratios of its peer group of funds based on information provided by Lipper. The Trustees also considered the advisory fees charged by MFS to institutional accounts. In comparing these fees, the Trustees considered the generally broader scope of services provided by MFS to the Trust than those provided to institutional accounts. The Trustees also considered the higher demands placed on MFS’ investment personnel and trading infrastructure as a result of the daily cash in-flows and out-flows of the Portfolio, and the impact on MFS and related expenses due to the more extensive regulatory regime to which the Portfolio is subject, compared to institutional accounts.
In considering the fees, the Trustees noted from the Lipper data that the Portfolio’s effective advisory fee rate was approximately at the median and total expense ratio was above the median of such fees and expenses of funds in the Lipper expense group. The Trustees further noted that the New Agreement would reflect MFS’ agreement to reduce the advisory fee on average daily net assets over $1 billion on a permanent basis. In addition, the Trustees accepted MFS’ offer to continue to reduce the advisory fee for the Portfolio on average daily net assets over $2.5 billion, and concluded that the breakpoints were sufficient to allow the Portfolio to benefit from economies of scale as its assets grow. The Trustees concluded that the fees were reasonable in light of the nature and quality of services provided.
The Trustees also considered whether the Portfolio is likely to benefit from any economies of scale due to future asset growth. In this regard, the Trustees reviewed the adequacy of breakpoints and discussed with MFS any adjustments necessary for the shareholders’ benefit.
The Trustees also considered information prepared by MFS relating to its costs and profits with respect to the Portfolio and other investment companies and accounts advised by MFS, as well as MFS’ methodologies used to determine and allocate its costs to the Portfolio and other accounts and products for purposes of estimating profitability.
The Trustees noted that there would be no increase to the net advisory fee arrangement for the Portfolio under the New Agreement when compared to the Portfolio’s then current investment advisory agreement. After reviewing these and other factors described below, the Trustees concluded that the advisory fees charged to the Portfolio under the New Agreement represent reasonable compensation in light of the nature and quality of the services being provided by MFS.
In addition, the Trustees considered MFS’ resources and related efforts to continue to retain, attract and motivate capable personnel to serve the Portfolio. The Trustees also considered the financial resources of MFS and its parent, Sun Life Financial Inc. The Trustees further considered any advantages and possible disadvantages of having an adviser which also serves other investment companies as well as institutional accounts.
The Trustees also considered the nature, quality, cost, and extent of administrative, transfer agency, and distribution services provided to the Trust by MFS and its affiliates under agreements and plans other than the New Agreement, including the 12b-1
25
Table of Contents
MFS Mid Cap Growth Portfolio
Board Approval of New Investment Advisory Agreement – continued
fees the Portfolio pays to MFS Fund Distributors, Inc., an affiliate of MFS. The Trustees also considered the nature, extent and quality of certain other services MFS performs or arranges on the Portfolio’s behalf, which may include securities lending programs, directed expense payment programs, class action recovery programs, and MFS’ interaction with third-party service providers, principally custodians and sub-custodians. The Trustees concluded that the various non-advisory services provided by MFS and its affiliates on behalf of the Portfolio were satisfactory. The Trustees also considered the benefits to MFS from the use of the Portfolio’s portfolio brokerage commissions to pay for investment research and various other factors. Additionally, the Trustees considered so-called “fall-out benefits” to MFS such as reputational value derived from serving as investment manager to the Trust, and determined that any such benefits derived by MFS were reasonable and fair.
Based on their evaluation of factors that they deemed to be material, including those factors described above, the Board of Trustees, including a majority of the independent Trustees, concluded that the New Agreement should be approved for an initial two-year period, commencing upon its effective date, as set forth in the New Agreement.
BOARD APPROVAL OF CONTINUATION OF PRIOR INVESTMENT ADVISORY AGREEMENT
The Investment Company Act of 1940 requires that both the full Board of Trustees and a majority of the non-interested (“independent”) Trustees, voting separately, annually approve the continuation of the investment advisory agreement between MFS Variable Insurance Trust II (the “Trust”) and Massachusetts Financial Services Company (“MFS”) on behalf of the Fund. The Trustees consider matters bearing on the Fund and the advisory arrangements at their meetings throughout the year, including a review of performance data at each regular meeting. In addition, the independent Trustees met in person in May and again in July 2011 (“contract review meetings”) for the specific purpose of considering whether to approve the continuation of the investment advisory agreement for the Fund. The independent Trustees were assisted in their evaluation of the investment advisory agreement by independent legal counsel, from whom they received separate legal advice and with whom they met separately from MFS management during various contract review meetings. The independent Trustees were also assisted in this process by the Fund’s Independent Chief Compliance Officer, a full-time senior officer appointed by and reporting to the independent Trustees.
In connection with their deliberations, the Trustees, including the independent Trustees, considered such information and factors as they believed, in light of the legal advice furnished to them and their own business judgment, to be relevant. The investment advisory agreement was considered separately for the Fund, although the Trustees also took into account the common interests of all Funds in the Trust in their review. As described below, the Trustees considered the nature, quality, and extent of the various investment advisory, administrative, and shareholder services performed by MFS under the existing investment advisory agreement and other arrangements with the Trust.
In connection with their contract review meetings, the Trustees received and relied upon materials which included, among other items: (i) information provided by Lipper Inc. (“Lipper”) on the investment performance of the Fund for various time periods ended December 31, 2010, compared to the investment performance of a group of funds with substantially similar investment classifications/objectives (the “Lipper performance universe”), (ii) information provided by Lipper on the Fund’s advisory fees and other expenses compared to the advisory fees and other expenses of comparable funds identified by Lipper (the “Lipper expense group”), (iii) information provided by MFS on the advisory fees of comparable portfolios of its other clients, including institutional separate account and other clients, (iv) information as to whether, and to what extent applicable, expense waivers, reimbursements or fee “breakpoints” are observed for the Fund, (v) information regarding MFS’ financial results and financial condition, including MFS’ and certain of its affiliates’ estimated profitability from services performed for the Fund and other investment companies that the Board oversees as a whole, and for MFS’ institutional business, (vi) MFS’ views regarding the outlook for the mutual fund industry and its strategic business plans, (vii) descriptions of various functions performed by MFS for the Trust, such as compliance monitoring and portfolio trading practices, and (viii) information regarding the overall organization of MFS, including information about MFS’ senior management and other personnel providing investment advisory, administrative and other services to the Fund. The comparative performance, fee and expense information prepared and provided by Lipper was not independently verified, and the independent Trustees did not independently verify any information provided to them by MFS.
The Trustees’ conclusion as to the continuation of the investment advisory agreement was based on comprehensive consideration of all information provided to the Trustees and was not the result of any single factor. Some of the factors that figured particularly in the Trustees’ deliberations are described below for the Fund, while individual Trustees may have given different weight to various factors and evaluated the information presented as a whole differently than another individual Trustee. The Trustees recognized that the fee arrangements for the Fund reflect years of review and discussion between the independent Trustees and MFS, that certain aspects of such arrangements may receive greater scrutiny in some years than
26
Table of Contents
MFS Mid Cap Growth Portfolio
Board Approval of Continuation of Prior Investment Advisory Agreement – continued
others, and that the Trustees’ conclusions may be based, in part, on their consideration of these same arrangements during the course of the year and in prior years.
Based on information provided by Lipper, the Trustees compared the Fund’s total return investment performance to the performance of the Lipper performance universe over various time periods. The Trustees placed particular emphasis on the total return performance of the Fund’s Initial Class shares in comparison to the performance of funds in its Lipper performance universe over the one-, three- and five-year periods ended December 31, 2010. The Trustees did not rely on performance results for more recent periods, including those shown elsewhere in this report.
The Trustees noted the performance of the Fund’s Initial Class shares was in the 1st quintile relative to the other funds in the Lipper performance universe for the one-year period (the 1st quintile being the best performers and the 5th quintile being the worst performers). The total return performance of the Fund was in the 5th quintile for the three-year and five-year periods ended December 31, 2010, relative to the Lipper performance universe. Based on the nature and quality of services provided by MFS, the Board of Trustees concluded that the Fund’s performance was satisfactory.
In the course of their deliberations, the Trustees took into account information provided by MFS during contract review meetings, as well as during investment review meetings conducted with portfolio management personnel during the course of the year.
In assessing the reasonableness of the Fund’s advisory fee, the Trustees considered, among other information, the Fund’s advisory fee and the total expense ratio of the Fund’s Initial Class shares as a percentage of average daily net assets, compared to the advisory fee and total expense ratios of its peer group of funds based on information provided by Lipper. The Trustees also considered the advisory fees charged by MFS to institutional accounts. In comparing these fees, the Trustees considered the generally broader scope of services provided by MFS to the Trust than those provided to institutional accounts. The Trustees also considered the higher demands placed on MFS’ investment personnel and trading infrastructure as a result of the daily cash in-flows and out-flows of the Fund, and the impact on MFS and related expenses due to the more extensive regulatory regime to which the Fund is subject, compared to institutional accounts.
In considering the fees, the Trustees noted from the Lipper data (which takes into account any reductions or expense limitations) that the Fund’s effective advisory fee rate was approximately at the median and total expense ratio was above the median of such fees and expenses of funds in the Lipper expense group. The Trustees further noted that MFS agreed to continue to reduce its advisory fee on average daily net assets over $2.5 billion, and concluded that the existing breakpoints were sufficient to allow the Fund to benefit from economies of scale as its assets grow. The Trustees concluded that the fees were reasonable in light of the nature and quality of services provided.
The Trustees also considered information prepared by MFS relating to its costs and profits with respect to the Fund and other investment companies and accounts advised by MFS, as well as MFS’ methodologies used to determine and allocate its costs to the Fund and other accounts and products for purposes of estimating profitability.
After reviewing these and other factors described below, the Trustees concluded that the advisory fees charged to the Fund represent reasonable compensation in light of the nature and quality of the services being provided by MFS.
In addition, the Trustees considered MFS’ resources and related efforts to continue to retain, attract and motivate capable personnel to serve the Fund. The Trustees also considered the financial resources of MFS and its parent, Sun Life Financial Inc. The Trustees further considered any advantages and possible disadvantages of having an adviser which also serves other investment companies as well as institutional accounts.
The Trustees also considered the nature, quality, cost, and extent of administrative, transfer agency, and distribution services provided to the Fund by MFS and its affiliates under agreements and plans other than the investment advisory agreement, including the 12b-1 fees the Fund pays to MFS Fund Distributors, Inc., an affiliate of MFS. The Trustees also considered the nature, extent and quality of certain other services MFS performs or arranges on the Fund’s behalf, which may include securities lending programs, directed expense payment programs, class action recovery programs, and MFS’ interaction with third-party service providers, principally custodians and sub-custodians. The Trustees concluded that the various non-advisory services provided by MFS and its affiliates on behalf of the Fund were satisfactory. The Trustees also considered the benefits to MFS from the use of the Fund’s portfolio brokerage commissions, if applicable, to pay for investment research and various other factors. Additionally, the Trustees considered so-called “fall-out benefits” to MFS such as reputational value derived from serving as investment manager to the Trust, and determined that any such benefits derived by MFS were reasonable and fair.
Based on their evaluation of factors that they deemed to be material, including those factors described above, the Board of Trustees, including a majority of the independent Trustees, concluded that the investment advisory agreement should be continued for an additional one-year period, commencing September 1, 2011.
27
Table of Contents
MFS Mid Cap Growth Portfolio
Board Approval of Continuation of Prior Investment Advisory Agreement – continued
A discussion regarding the Board’s most recent review and renewal of the fund’s Investment Advisory Agreement with MFS is available by clicking on the fund’s name under “Variable Insurance Portfolios — VIT II” in the “Products and Performance” section of the MFS Web site (mfs.com).
28
Table of Contents
MFS Mid Cap Growth Portfolio
PROXY VOTING POLICIES AND INFORMATION
A general description of the MFS funds’ proxy voting policies and procedures is available without charge, upon request, by calling
1-800-225-2606, by visiting the Proxy Voting section of mfs.com or by visiting the SEC’s Web site at http://www.sec.gov.
Information regarding how the fund voted proxies relating to portfolio securities during the most recent twelve-month period ended June 30 is available without charge by visiting the Proxy Voting section of mfs.com or by visiting the SEC’s Web site at http://www.sec.gov.
QUARTERLY PORTFOLIO DISCLOSURE
The fund will file a complete schedule of portfolio holdings with the Securities and Exchange Commission (the Commission) for the first and third quarters of each fiscal year on Form N-Q. The fund’s Form N-Q is available on the EDGAR database on the Commission’s Internet Web site at http://www.sec.gov and may be reviewed and copied at the:
Public Reference Room
Securities and Exchange Commission
100 F Street, NE, Room 1580
Washington, D.C. 20549
Information on the operation of the Public Reference Room may be obtained by calling the Commission at 1-800-SEC-0330. Copies of the fund’s Form N-Q also may be obtained, upon payment of a duplicating fee, by electronic request at the following e-mail address: publicinfo@sec.gov or by writing the Public Reference Section at the above address.
From time to time, MFS may post important information about the fund or the MFS funds on the MFS web site (mfs.com). This information is available by visiting the “News & Commentary” section of mfs.com or by clicking on the fund’s name under “Variable Insurance Portfolios — VIT II” in the “Products and Performance” section of mfs.com.
29
Table of Contents
rev. 3/11

| Why? | Financial companies choose how they share your personal information. Federal law gives consumers the right to limit some but not all sharing. Federal law also requires us to tell you how we collect, share, and protect your personal information. Please read this notice carefully to understand what we do. |
| What? | The types of personal information we collect and share depend on the product or service you have with us. This information can include:
• Social Security number and account balances • Account transactions and transaction history • Checking account information and wire transfer instructions
When you are no longer our customer, we continue to share your information as described in this notice. |
| How? | All financial companies need to share customers’ personal information to run their everyday business. In the section below, we list the reasons financial companies can share their customers’ personal information; the reasons MFS chooses to share; and whether you can limit this sharing. |
| Reasons we can share your personal information | Does MFS share? | Can you limit this sharing? | ||
For our everyday business purposes – such as to process your transactions, maintain your account(s), respond to court orders and legal investigations, or report to credit bureaus | Yes | No | ||
For our marketing purposes – to offer our products and services to you | No | We don’t share | ||
| For joint marketing with other financial companies | No | We don’t share | ||
For our affiliates’ everyday business purposes – information about your transactions and experiences | No | We don’t share | ||
For our affiliates’ everyday business purposes – information about your creditworthiness | No | We don’t share | ||
| For nonaffiliates to market to you | No | We don’t share |
| Questions? | Call 800-225-2606 or go to mfs.com. |
30
Table of Contents
| Page 2 |
| Who we are | ||
| Who is providing this notice? | MFS Funds, MFS Investment Management, MFS Institutional Advisors, Inc., MFS Fund Distributors, Inc., MFS Heritage Trust Company, and MFS Service Center, Inc. | |
| What we do | ||
| How does MFS protect my personal information? | To protect your personal information from unauthorized access and use, we use security measures that comply with federal law. These measures include procedural, electronic, and physical safeguards for the protection of the personal information we collect about you. | |
| How does MFS collect my personal information? | We collect your personal information, for example, when you
• open an account or provide account information • direct us to buy securities or direct us to sell your securities • make a wire transfer
We also collect your personal information from others, such as credit bureaus, affiliates and other companies. | |
| Why can’t I limit all sharing? | Federal law gives you the right to limit only
• sharing for affiliates’ everyday business purposes – information about your creditworthiness • affiliates from using your information to market to you • sharing for nonaffiliates to market to you
State laws and individual companies may give you additional rights to limit sharing. | |
| Definitions | ||
| Affiliates | Companies related by common ownership or control. They can be financial and nonfinancial companies.
• MFS does not share personal information with affiliates, except for everyday business purposes as described on page one of this notice. | |
| Nonaffiliates | Companies not related by common ownership or control. They can be financial and nonfinancial companies.
• MFS does not share with nonaffiliates so they can market to you. | |
| Joint Marketing | A formal agreement between nonaffiliated financial companies that together market financial products or services to you.
• MFS doesn’t jointly market. | |
| Other important information | ||
| If you own an MFS product or receive an MFS service in the name of a third party such as a bank or broker-dealer, their privacy policy may apply to you instead of ours. | ||
31
Table of Contents

Table of Contents

MFS® Value Portfolio
MFS® Variable Insurance Trust II

ANNUAL REPORT
December 31, 2011
EIS-ANN
Table of Contents
MFS® VALUE PORTFOLIO
The report is prepared for the general information of contract owners.
It is authorized for distribution to prospective investors only when preceded or accompanied by a current prospectus.
NOT FDIC INSURED Ÿ MAY LOSE VALUE Ÿ NO BANK OR CREDIT UNION GUARANTEE Ÿ NOT A DEPOSIT Ÿ NOT INSURED BY ANY FEDERAL GOVERNMENT AGENCY OR NCUA/NCUSIF
Table of Contents
MFS Value Portfolio
LETTER FROM THE CHAIRMAN AND CEO

Dear Contract Owners:
We are indeed living through some volatile times. Economic uncertainty is everywhere, as it seems no place in the world has been unmoved by crisis. We have seen a devastating earthquake and tsunami that have led to disruptions in the Japanese markets
and supply chains. Protests have changed the face of the Middle East and left in their wake lingering tensions and resultant higher oil prices. We have seen debt limits tested in Europe and the United States and policymakers grappling to craft often unpopular monetary and fiscal responses at a time when consumers and businesses struggle with what appears to be a slowing global economy. On top of all of that, we have seen long-term U.S. debt lose its Standard & Poor’s AAA rating and the long-term debt ratings of 15 eurozone nations put on negative watch.
When markets become volatile, managing risk becomes a top priority for investors and their advisors. At MFS® risk management is foremost in our minds in all market climates. Our analysts and portfolio managers keep risks firmly in mind when evaluating securities. Additionally, we have a team of quantitative analysts that measures and assesses the risk profiles of our portfolios and securities on an ongoing basis. The chief investment risk officer, who oversees the team, reports directly to the firm’s president and chief investment officer so the risk associated with each portfolio can be assessed objectively and independently of the portfolio management team.
As always, we continue to be mindful of the many economic challenges faced at the local, national, and international levels. It is in times such as these that we want to remind investors of the merits of maintaining a long-term view, adhering to basic investing principles such as asset allocation and diversification, and working closely with their advisors to research and identify appropriate investment opportunities.
Respectfully,

Robert J. Manning
Chairman and Chief Executive Officer
MFS Investment Management®
February 15, 2012
The opinions expressed in this letter are subject to change, may not be relied upon for investment advice, and no forecasts can be guaranteed.
1
Table of Contents
MFS Value Portfolio
Portfolio structure
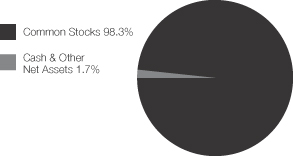
| Top ten holdings | ||||
| Philip Morris International, Inc. | 4.2% | |||
| Lockheed Martin Corp. | 3.6% | |||
| Johnson & Johnson | 2.9% | |||
| Pfizer, Inc. | 2.8% | |||
| AT&T, Inc. | 2.7% | |||
| JPMorgan Chase & Co. | 2.5% | |||
| Chevron Corp. | 2.3% | |||
| United Technologies Corp. | 2.2% | |||
| Goldman Sachs Group, Inc. | 2.1% | |||
| International Business Machines Corp. | 2.1% |
| Equity sectors | ||||
| Financial Services | 20.5% | |||
| Health Care | 13.1% | |||
| Consumer Staples | 12.2% | |||
| Industrial Goods & Services | 11.4% | |||
| Energy | 8.5% | |||
| Technology | 6.4% | |||
| Utilities & Communications | 6.0% | |||
| Leisure | 5.9% | |||
| Retailing | 4.0% | |||
| Basic Materials | 3.7% | |||
| Autos & Housing | 3.2% | |||
| Special Products & Services | 2.8% | |||
| Transportation | 0.6% |
Percentages are based on net assets as of 12/31/11.
The portfolio is actively managed and current holdings may be different.
2
Table of Contents
MFS Value Portfolio
Summary of Results
For the twelve months ended December 31, 2011, Initial Class shares of the MFS Value Portfolio (the “fund”) provided a total return of 0.00%, while Service Class shares of the fund provided a total return of –0.29%. These compare with a return of 0.39% for the fund’s benchmark, the Russell 1000 Value Index.
Market Environment
Early in the period, the U.S. Federal Reserve (the “Fed”) responded to weak economic growth by loosening monetary policy further. More easing by the Fed improved market sentiment and drove risk-asset prices markedly higher. The December 2010 agreement on a surprisingly large (relative to expectations) expansionary U.S. fiscal package also boosted sentiment. During the subsequent several months, the renewed positive market sentiment, coupled with better indications of global macroeconomic activity, pushed many asset valuations to post-crisis highs. At the same time, the yields of the perceived “safest” global sovereign credits rose, indicating a renewed risk-seeking environment.
However, towards the middle of the period, a weakening macroeconomic backdrop and renewed concerns over peripheral euro zone sovereign debt caused a flight-to-quality move that pushed high-quality sovereign bond yields lower. In the U.S., concerns about sovereign debt default and the long-term sustainability of the trend in U.S. fiscal policy resulted in one agency downgrading U.S. credit quality. Amidst this turmoil, global equity markets declined sharply. As a result of these developments, global consumer and producer sentiment indicators fell precipitously and highly-rated sovereign bond yields hit multi-decade lows. Towards the end of the reporting period, uncertainty in financial markets spiked higher as markets more seriously contemplated the possible failure of the euro zone.
Detractors from Performance
A combination of an underweight position and stock selection in the utilities & communications sector detracted from performance relative to the Russell 1000 Value Index. No individual holdings within this sector were among the fund’s top relative detractors.
Stock selection in the health care sector also held back relative returns. Within this sector, not holding strong-performing global pharmaceutical company Bristol Myers Squibb and health insurance and Medicare/Medicaid provider UnitedHealth Group dampened relative performance as both stocks outperformed the benchmark. Shares of Bristol Myers Squibb climbed during the period led by strong demand for the company’s newer drugs and a dividend increase late in the reporting period.
Elsewhere, holdings of investment banking firm Goldman Sachs Group, global financial services provider Bank of New York Mellon, and insurance company MetLife held back relative performance. The fund’s relative positioning in shares of strong-performing network equipment company Cisco Systems also hurt relative returns. Shares of Cisco Systems rose as the company delivered better-than-expected revenue and earnings-per-share for its first fiscal quarter. Additionally, its margins, which appeared to have been a point of concern for many investors, came in above expectations. The fund’s holdings of enterprise software products maker Oracle (b), offshore drilling contractor Transocean (b), toy maker Hasbro (b), and oil and gas exploration and production company Apache also negatively impacted performance.
Contributors to Performance
A combination of stock selection and overweight position in the consumer staples sector boosted relative performance. Tobacco company Philip Morris International and alcoholic beverage producer Diageo (b) outperformed the benchmark over the reporting period and were among the fund’s top relative contributors. Shares of Philip Morris rose late in the period after the company reported better-than-expected earnings and its solid return of capital to shareholders via both dividends and share repurchases. In addition, management increased its 2011 earnings estimate driven by stronger-than-expected results in Japan and Indonesia.
Stock selection in the industrial goods & services sector also supported relative returns. The fund’s overweight position in defense contractor Lockheed Martin benefited relative performance as the stock outperformed the benchmark over the reporting period. Shares of Lockheed Martin rose late in the period as the company announced a dividend increase and an increase in their share repurchase program.
3
Table of Contents
MFS Value Portfolio
Management Review – continued
Elsewhere, not holding shares of poor-performing financial services firms, Citigroup and Morgan Stanley, supported relative returns as Europe’s mounting sovereign debt crisis put pressure on most financial companies. Holdings of diversified technology products and services company International Business Machines (IBM) (b), debit and credit transaction processing company MasterCard (b), pharmaceutical and medical products maker Abbott Laboratories, management consulting firm Accenture (b), and fast food company McDonald’s (b)(h) were among the fund’s top relative contributors.
Respectfully,
| Nevin Chitkara | Steven Gorham | |
| Portfolio Manager | Portfolio Manager |
| (b) | Security is not a benchmark constituent. |
| (h) | Security was not held in the fund at period end. |
The views expressed in this report are those of the portfolio managers only through the end of the period of the report as stated on the cover and do not necessarily reflect the views of MFS or any other person in the MFS organization. These views are subject to change at any time based on market or other conditions, and MFS disclaims any responsibility to update such views. These views may not be relied upon as investment advice or an indication of trading intent on behalf of any MFS portfolio. References to specific securities are not recommendations of such securities, and may not be representative of any MFS portfolio’s current or future investments.
4
Table of Contents
MFS Value Portfolio
PERFORMANCE SUMMARY THROUGH 12/31/11
The following chart illustrates the historical performance of the fund in comparison to its benchmark(s). Benchmarks are unmanaged and may not be invested in directly. Benchmark returns do not reflect any fees or expenses. The performance of other share classes will be greater than or less than that of the class depicted below. (See Notes to Performance Summary.)
Performance data shown represents past performance and is no guarantee of future results. Investment return and principal value fluctuate so your units, when sold, may be worth more or less than the original cost; current performance may be lower or higher than quoted. The performance shown does not reflect the deduction of taxes, if any, that a contract holder would pay on fund distributions or the redemption of contract units. The returns for the fund shown also do not reflect the deduction of expenses associated with variable products, such as mortality and expense risk charges, separate account charges, and sales charges imposed by the insurance company separate accounts. Such expenses would reduce the overall returns shown.
Growth of a Hypothetical $10,000 Investment
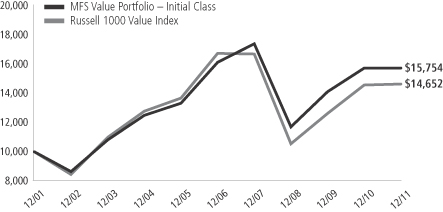
Total Returns through 12/31/11
Average annual total returns
| Share class | Class inception date | 1-yr | 5-yr | 10-yr | ||||||||
| Initial Class | 5/06/98 | 0.00% | (0.47)% | 4.65% | ||||||||
| Service Class | 8/24/01 | (0.29)% | (0.72)% | 4.39% | ||||||||
| Comparative benchmark | ||||||||||||
| Russell 1000 Value Index (f) | 0.39% | (2.64)% | 3.89% | |||||||||
| (f) | Source: FactSet Research Systems Inc. |
Benchmark Definition
Russell 1000 Value Index – constructed to provide a comprehensive barometer for the value securities in the large-cap segment of the U.S. equity universe. Companies in this index generally have lower price-to-book ratios and lower forecasted growth values.
It is not possible to invest directly in an index.
Notes to Performance Summary
Average annual total return represents the average annual change in value for each share class for the periods presented.
Performance results reflect any applicable expense subsidies and waivers in effect during the periods shown. Without such subsidies and waivers the fund’s performance results would be less favorable. Please see the prospectus and financial statements for complete details. All results are historical and assume the reinvestment of any dividends and capital gains distributions.
Performance results do not include adjustments made for financial reporting purposes in accordance with U.S. generally accepted accounting principles and may differ from amounts reported in the financial highlights.
From time to time the fund may receive proceeds from litigation settlements, without which performance would be lower.
5
Table of Contents
MFS Value Portfolio
Fund Expenses Borne by the Contract Holders During the Period,
July 1, 2011 through December 31, 2011
As a contract holder of the fund, you incur ongoing costs, including management fees; distribution and/or service (12b-1) fees; and other fund expenses. This example is intended to help you understand your ongoing costs (in dollars) of investing in the fund and to compare these costs with the ongoing costs of investing in other mutual funds.
The example is based on an investment of $1,000 invested at the beginning of the period and held for the entire period July 1, 2011 through December 31, 2011.
Actual Expenses
The first line for each share class in the following table provides information about actual account values and actual expenses. You may use the information in this line, together with the amount you invested, to estimate the expenses that you paid over the period. Simply divide your account value by $1,000 (for example, an $8,600 account value divided by $1,000 = 8.6), then multiply the result by the number in the first line under the heading entitled “Expenses Paid During Period” to estimate the expenses you paid on your account during this period.
Hypothetical Example for Comparison Purposes
The second line for each share class in the following table provides information about hypothetical account values and hypothetical expenses based on the fund’s actual expense ratio and an assumed rate of return of 5% per year before expenses, which is not the fund’s actual return. The hypothetical account values and expenses may not be used to estimate the actual ending account balance or expenses you paid for the period. You may use this information to compare the ongoing costs of investing in the fund and other funds. To do so, compare this 5% hypothetical example with the 5% hypothetical examples that appear in the shareholder reports of the other funds.
Please note that the expenses shown in the table are meant to highlight the fund’s ongoing costs only and do not take into account the fees and expenses imposed under the variable contracts through which your investment in the fund is made. Therefore, the second line for each share class in the table is useful in comparing ongoing costs associated with an investment in vehicles (such as the fund) which fund benefits under variable annuity and variable life insurance contracts and to qualified pension and retirement plans only, and will not help you determine the relative total costs of investing in the fund through variable annuity and variable life insurance contracts. If the fees and expenses imposed under the variable contracts were included, your costs would have been higher.
| Share Class | Annualized Expense Ratio | Beginning Account Value 7/01/11 | Ending Account Value | Expenses Paid During Period (p) 7/01/11-12/31/11 | ||||||||||||||
| Initial Class | Actual | 0.82% | $1,000.00 | $946.26 | $4.02 | |||||||||||||
| Hypothetical (h) | 0.82% | $1,000.00 | $1,021.07 | $4.18 | ||||||||||||||
| Service Class | Actual | 1.07% | $1,000.00 | $945.04 | $5.25 | |||||||||||||
| Hypothetical (h) | 1.07% | $1,000.00 | $1,019.81 | $5.45 | ||||||||||||||
| (h) | 5% class return per year before expenses. |
| (p) | Expenses paid is equal to each class’ annualized expense ratio, as shown above, multiplied by the average account value over the period, multiplied by the number of days in the period, divided by the number of days in the year. |
6
Table of Contents
MFS Value Portfolio
PORTFOLIO OF INVESTMENTS – 12/31/11
The Portfolio of Investments is a complete list of all securities owned by your fund. It is categorized by broad-based asset classes.
| Issuer | Shares/Par | Value ($) | ||||||
| COMMON STOCKS – 98.1% | ||||||||
| Aerospace – 8.6% | ||||||||
| Honeywell International, Inc. | 155,460 | $ | 8,449,251 | |||||
| Huntington Ingalls Industries, Inc. (a) | 17,078 | 534,200 | ||||||
| Lockheed Martin Corp. | 226,927 | 18,358,394 | ||||||
| Northrop Grumman Corp. | 95,370 | 5,577,238 | ||||||
| United Technologies Corp. | 151,545 | 11,076,424 | ||||||
|
| |||||||
| $ | 43,995,507 | |||||||
|
| |||||||
| Alcoholic Beverages – 1.7% | ||||||||
| Diageo PLC | 403,007 | $ | 8,802,860 | |||||
|
| |||||||
| Automotive – 1.1% | ||||||||
| General Motors Co. (a) | 45,760 | $ | 927,555 | |||||
| Johnson Controls, Inc. | 142,615 | 4,458,145 | ||||||
|
| |||||||
| $ | 5,385,700 | |||||||
|
| |||||||
| Broadcasting – 3.8% | ||||||||
| Omnicom Group, Inc. | 132,158 | $ | 5,891,604 | |||||
| Viacom, Inc., “B” | 128,670 | 5,842,905 | ||||||
| Walt Disney Co. | 208,582 | 7,821,825 | ||||||
|
| |||||||
| $ | 19,556,334 | |||||||
|
| |||||||
| Brokerage & Asset Managers – 1.6% | ||||||||
| Blackrock, Inc. | 32,744 | $ | 5,836,291 | |||||
| Franklin Resources, Inc. | 24,850 | 2,387,091 | ||||||
|
| |||||||
| $ | 8,223,382 | |||||||
|
| |||||||
| Business Services – 2.8% | ||||||||
| Accenture PLC, “A” | 187,297 | $ | 9,969,819 | |||||
| Dun & Bradstreet Corp. | 38,517 | 2,882,227 | ||||||
| Fiserv, Inc. (a) | 25,770 | 1,513,730 | ||||||
|
| |||||||
| $ | 14,365,776 | |||||||
|
| |||||||
| Cable TV – 0.8% | ||||||||
| Comcast Corp., “Special A” | 161,890 | $ | 3,814,128 | |||||
|
| |||||||
| Chemicals – 2.7% | ||||||||
| 3M Co. | 95,468 | $ | 7,802,600 | |||||
| PPG Industries, Inc. | 70,147 | 5,856,573 | ||||||
|
| |||||||
| $ | 13,659,173 | |||||||
|
| |||||||
| Computer Software – 2.0% | ||||||||
| Oracle Corp. | 396,233 | $ | 10,163,376 | |||||
|
| |||||||
| Computer Software – Systems – 2.3% | ||||||||
| Hewlett-Packard Co. | 36,260 | $ | 934,058 | |||||
| International Business Machines Corp. | 58,525 | 10,761,577 | ||||||
|
| |||||||
| $ | 11,695,635 | |||||||
|
| |||||||
| Construction – 2.1% | ||||||||
| Sherwin-Williams Co. | 46,552 | $ | 4,155,697 | |||||
| Stanley Black & Decker, Inc. | 99,786 | 6,745,534 | ||||||
|
| |||||||
| $ | 10,901,231 | |||||||
|
| |||||||
| Consumer Products – 0.5% | ||||||||
| Procter & Gamble Co. | 34,258 | $ | 2,285,351 | |||||
|
| |||||||
| Issuer | Shares/Par | Value ($) | ||||||
| COMMON STOCKS – continued | ||||||||
| Electrical Equipment – 2.1% | ||||||||
| Danaher Corp. | 123,420 | $ | 5,805,677 | |||||
| Tyco International Ltd. | 100,100 | 4,675,671 | ||||||
|
| |||||||
| $ | 10,481,348 | |||||||
|
| |||||||
| Electronics – 1.4% | ||||||||
| ASML Holding N.V. | 51,690 | $ | 2,160,125 | |||||
| Intel Corp. | 201,602 | 4,888,849 | ||||||
|
| |||||||
| $ | 7,048,974 | |||||||
|
| |||||||
| Energy – Independent – 3.5% | ||||||||
| Apache Corp. | 66,015 | $ | 5,979,639 | |||||
| EOG Resources, Inc. | 28,422 | 2,799,851 | ||||||
| Occidental Petroleum Corp. | 99,077 | 9,283,515 | ||||||
|
| |||||||
| $ | 18,063,005 | |||||||
|
| |||||||
| Energy – Integrated – 4.5% | ||||||||
| Chevron Corp. | 109,433 | $ | 11,643,671 | |||||
| Exxon Mobil Corp. | 110,307 | 9,349,621 | ||||||
| Hess Corp. | 34,935 | 1,984,308 | ||||||
|
| |||||||
| $ | 22,977,600 | |||||||
|
| |||||||
| Engineering – Construction – 0.2% | ||||||||
| Fluor Corp. | 15,840 | $ | 795,960 | |||||
|
| |||||||
| Food & Beverages – 4.6% | ||||||||
| General Mills, Inc. | 212,160 | $ | 8,573,386 | |||||
| J.M. Smucker Co. | 6,647 | 519,596 | ||||||
| Kellogg Co. | 50,590 | 2,558,336 | ||||||
| Nestle S.A. | 110,807 | 6,361,742 | ||||||
| PepsiCo, Inc. | 84,733 | 5,622,035 | ||||||
|
| |||||||
| $ | 23,635,095 | |||||||
|
| |||||||
| Food & Drug Stores – 1.2% | ||||||||
| CVS Caremark Corp. | 93,023 | $ | 3,793,478 | |||||
| Walgreen Co. | 67,510 | 2,231,881 | ||||||
|
| |||||||
| $ | 6,025,359 | |||||||
|
| |||||||
| General Merchandise – 1.8% | ||||||||
| Kohl’s Corp. | 36,990 | $ | 1,825,457 | |||||
| Target Corp. | 147,760 | 7,568,267 | ||||||
|
| |||||||
| $ | 9,393,724 | |||||||
|
| |||||||
| Insurance – 7.0% | ||||||||
| ACE Ltd. | 54,560 | $ | 3,825,747 | |||||
| Aon Corp. | 112,720 | 5,275,296 | ||||||
| Chubb Corp. | 60,195 | 4,166,698 | ||||||
| MetLife, Inc. | 299,858 | 9,349,572 | ||||||
| Prudential Financial, Inc. | 131,587 | 6,595,140 | ||||||
| Travelers Cos., Inc. | 111,525 | 6,598,934 | ||||||
|
| |||||||
| $ | 35,811,387 | |||||||
|
| |||||||
| Leisure & Toys – 0.9% | ||||||||
| Hasbro, Inc. | 136,983 | $ | 4,368,388 | |||||
|
| |||||||
| Machinery & Tools – 0.5% | ||||||||
| Eaton Corp. | 62,490 | $ | 2,720,190 | |||||
|
| |||||||
7
Table of Contents
MFS Value Portfolio
Portfolio of Investments – continued
| Issuer | Shares/Par | Value ($) | ||||||
| COMMON STOCKS – continued | ||||||||
| Major Banks – 10.5% | ||||||||
| Bank of America Corp. | 632,070 | $ | 3,514,309 | |||||
| Bank of New York Mellon Corp. | 388,405 | 7,733,144 | ||||||
| Goldman Sachs Group, Inc. | 119,092 | 10,769,490 | ||||||
| JPMorgan Chase & Co. | 382,662 | 12,723,510 | ||||||
| PNC Financial Services Group, Inc. | 71,185 | 4,105,239 | ||||||
| State Street Corp. | 109,215 | 4,402,457 | ||||||
| SunTrust Banks, Inc. | 35,740 | 632,598 | ||||||
| Wells Fargo & Co. | 359,552 | 9,909,253 | ||||||
|
| |||||||
| $ | 53,790,000 | |||||||
|
| |||||||
| Medical & Health Technology & Services – 0.6% | ||||||||
| Quest Diagnostics, Inc. | 52,000 | $ | 3,019,120 | |||||
|
| |||||||
| Medical Equipment – 3.7% | ||||||||
| Becton, Dickinson & Co. | 55,312 | $ | 4,132,913 | |||||
| Medtronic, Inc. | 189,890 | 7,263,293 | ||||||
| St. Jude Medical, Inc. | 106,030 | 3,636,829 | ||||||
| Thermo Fisher Scientific, Inc. (a) | 88,495 | 3,979,620 | ||||||
|
| |||||||
| $ | 19,012,655 | |||||||
|
| |||||||
| Network & Telecom – 0.7% | ||||||||
| Cisco Systems, Inc. | 204,640 | $ | 3,699,891 | |||||
|
| |||||||
| Oil Services – 0.5% | ||||||||
| Transocean, Inc. | 61,640 | $ | 2,366,360 | |||||
|
| |||||||
| Other Banks & Diversified Financials – 1.4% | ||||||||
| MasterCard, Inc., “A” | 8,300 | $ | 3,094,406 | |||||
| Western Union Co. | 233,855 | 4,270,192 | ||||||
|
| |||||||
| $ | 7,364,598 | |||||||
|
| |||||||
| Pharmaceuticals – 8.8% | ||||||||
| Abbott Laboratories | 173,502 | $ | 9,756,017 | |||||
| Johnson & Johnson | 224,017 | 14,691,035 | ||||||
| Merck & Co., Inc. | 88,162 | 3,323,707 | ||||||
| Pfizer, Inc. | 665,898 | 14,410,033 | ||||||
| Roche Holding AG | 16,895 | 2,857,242 | ||||||
|
| |||||||
| $ | 45,038,034 | |||||||
|
| |||||||
| Printing & Publishing – 0.4% | ||||||||
| Moody’s Corp. | 65,880 | $ | 2,218,838 | |||||
|
| |||||||
| Railroad & Shipping – 0.6% | ||||||||
| Canadian National Railway Co. | 38,590 | $ | 3,031,630 | |||||
|
| |||||||
| Specialty Chemicals – 1.0% | ||||||||
| Air Products & Chemicals, Inc. | 62,607 | $ | 5,333,490 | |||||
|
| |||||||
| Specialty Stores – 1.0% | ||||||||
| Advance Auto Parts, Inc. | 39,810 | $ | 2,771,970 | |||||
| Staples, Inc. | 174,630 | 2,425,611 | ||||||
|
| |||||||
| $ | 5,197,581 | |||||||
|
| |||||||
| Issuer | Shares/Par | Value ($) | ||||||
| COMMON STOCKS – continued | ||||||||
| Telecommunications – Wireless – 1.4% | ||||||||
| Vodafone Group PLC | 2,651,012 | $ | 7,365,352 | |||||
|
| |||||||
| Telephone Services – 2.7% | ||||||||
| AT&T, Inc. | 463,092 | $ | 14,003,902 | |||||
|
| |||||||
| Tobacco – 5.4% | ||||||||
| Altria Group, Inc. | 135,122 | $ | 4,006,367 | |||||
| Philip Morris International, Inc. | 276,635 | 21,710,315 | ||||||
| Reynolds American, Inc. | 48,940 | 2,027,095 | ||||||
|
| |||||||
| $ | 27,743,777 | |||||||
|
| |||||||
| Utilities – Electric Power – 1.7% | ||||||||
| PG&E Corp. | 125,148 | $ | 5,158,600 | |||||
| PPL Corp. | 64,982 | 1,911,770 | ||||||
| Public Service Enterprise Group, Inc. | 48,243 | 1,592,501 | ||||||
|
| |||||||
| $ | 8,662,871 | |||||||
|
| |||||||
| Total Common Stocks (Identified Cost, $489,164,654) | $ | 502,017,582 | ||||||
|
| |||||||
| CONVERTIBLE PREFERRED STOCKS – 0.2% | ||||||||
| Utilities – Electric Power – 0.2% | ||||||||
| PPL Corp., 9.5% (Identified Cost, $867,000) | 17,340 | $ | 968,092 | |||||
|
| |||||||
| MONEY MARKET FUNDS – 0.8% | ||||||||
| MFS Institutional Money Market Portfolio, 0.05%, at Cost and Net Asset Value (v) | 4,110,358 | $ | 4,110,358 | |||||
|
| |||||||
| Total Investments (Identified Cost, $494,142,012) | $ | 507,096,032 | ||||||
|
| |||||||
| OTHER ASSETS, LESS LIABILITIES – 0.9% | 4,350,999 | |||||||
|
| |||||||
| Net Assets – 100.0% | $ | 511,447,031 | ||||||
|
| |||||||
| (a) | Non-income producing security. |
| (v) | Underlying affiliated fund that is available only to investment companies managed by MFS. The rate quoted for the MFS Institutional Money Market Portfolio is the annualized seven-day yield of the fund at period end. |
The following abbreviations are used in this report and are defined:
| PLC | Public Limited Company |
See Notes to Financial Statements
8
Table of Contents
MFS Value Portfolio
FINANCIAL STATEMENTS | STATEMENT OF ASSETS AND LIABILITIES
This statement represents your fund’s balance sheet, which details the assets and liabilities comprising the total value of the fund.
At 12/31/11 | ||||||||
Assets | ||||||||
Investments – | ||||||||
Non-affiliated issuers, at value (identified cost, $490,031,654) | $502,985,674 | |||||||
Underlying affiliated funds, at cost and value | 4,110,358 | |||||||
Total investments, at value (identified cost, $494,142,012) | $507,096,032 | |||||||
Cash | 60,639 | |||||||
Receivables for | ||||||||
Investments sold | 3,058,486 | |||||||
Fund shares sold | 213,071 | |||||||
Interest and dividends | 1,272,378 | |||||||
Other assets | 14,444 | |||||||
Total assets | $511,715,050 | |||||||
Liabilities | ||||||||
Payable for fund shares reacquired | $169,607 | |||||||
Payable to affiliates | ||||||||
Investment adviser | 32,968 | |||||||
Distribution and/or service fees | 4,196 | |||||||
Payable for Trustees’ compensation | 824 | |||||||
Accrued expenses and other liabilities | 60,424 | |||||||
Total liabilities | $268,019 | |||||||
Net assets | $511,447,031 | |||||||
Net assets consist of | ||||||||
Paid-in capital | $471,101,476 | |||||||
Unrealized appreciation (depreciation) on investments and translation of assets and liabilities in foreign currencies | 12,946,878 | |||||||
Accumulated net realized gain (loss) on investments and foreign currency transactions | 18,565,444 | |||||||
Undistributed net investment income | 8,833,233 | |||||||
Net assets | $511,447,031 | |||||||
Shares of beneficial interest outstanding | 40,618,180 |
| Net assets | Shares outstanding | Net asset value per share | ||||||||||
Initial Class | $307,523,090 | 24,331,119 | $12.64 | |||||||||
Service Class | 203,923,941 | 16,287,061 | 12.52 | |||||||||
See Notes to Financial Statements
9
Table of Contents
MFS Value Portfolio
FINANCIAL STATEMENTS | STATEMENT OF OPERATIONS
This statement describes how much your fund earned in investment income and accrued in expenses. It also describes any gains and/or losses generated by fund operations.
| Year ended 12/31/11 | ||||||||
| Net investment income | ||||||||
Income | ||||||||
Dividends | $13,721,372 | |||||||
Interest | 1,341 | |||||||
Dividends from underlying affiliated funds | 5,902 | |||||||
Foreign taxes withheld | (60,858 | ) | ||||||
Total investment income | $13,667,757 | |||||||
Expenses | ||||||||
Management fee | $3,901,167 | |||||||
Distribution and/or service fees | 553,863 | |||||||
Administrative services fee | 173,001 | |||||||
Trustees’ compensation | 60,807 | |||||||
Custodian fee | 54,177 | |||||||
Shareholder communications | 8,384 | |||||||
Auditing fees | 44,177 | |||||||
Legal fees | 5,588 | |||||||
Miscellaneous | 42,187 | |||||||
Total expenses | $4,843,351 | |||||||
Fees paid indirectly | (1 | ) | ||||||
Net expenses | $4,843,350 | |||||||
Net investment income | $8,824,407 | |||||||
Realized and unrealized gain (loss) on investments and foreign currency transactions | ||||||||
Realized gain (loss) (identified cost basis) | ||||||||
Investment transactions | $25,303,470 | |||||||
Foreign currency transactions | 9,925 | |||||||
Net realized gain (loss) on investments and foreign currency transactions | $25,313,395 | |||||||
Change in unrealized appreciation (depreciation) | ||||||||
Investments | $(32,301,021 | ) | ||||||
Translation of assets and liabilities in foreign currencies | (11,720 | ) | ||||||
Net unrealized gain (loss) on investments and foreign currency translation | $(32,312,741 | ) | ||||||
Net realized and unrealized gain (loss) on investments and foreign currency | $(6,999,346 | ) | ||||||
Change in net assets from operations | $1,825,061 |
See Notes to Financial Statements
10
Table of Contents
MFS Value Portfolio
FINANCIAL STATEMENTS | STATEMENTS OF CHANGES IN NET ASSETS
These statements describe the increases and/or decreases in net assets resulting from operations, any distributions, and any shareholder transactions.
For years ended 12/31 | 2011 | 2010 | ||||||
Change in net assets | ||||||||
From operations | ||||||||
Net investment income | $8,824,407 | $7,897,225 | ||||||
Net realized gain (loss) on investments and foreign currency transactions | 25,313,395 | 46,359,089 | ||||||
Net unrealized gain (loss) on investments and foreign currency translation | (32,312,741 | ) | 4,702,652 | |||||
Change in net assets from operations | $1,825,061 | $58,958,966 | ||||||
Distributions declared to shareholders | ||||||||
From net investment income | $(7,907,338 | ) | $(6,932,160 | ) | ||||
From net realized gain on investments | (35,328,011 | ) | — | |||||
Total distributions declared to shareholders | $(43,235,349 | ) | $(6,932,160 | ) | ||||
Change in net assets from fund share transactions | $21,633,004 | $(17,191,538 | ) | |||||
Total change in net assets | $(19,777,284 | ) | $34,835,268 | |||||
Net assets | ||||||||
At beginning of period | 531,224,315 | 496,389,047 | ||||||
At end of period (including undistributed net investment income of $8,833,233 and | $511,447,031 | $531,224,315 |
See Notes to Financial Statements
11
Table of Contents
MFS Value Portfolio
FINANCIAL STATEMENTS | FINANCIAL HIGHLIGHTS
The financial highlights table is intended to help you understand the fund’s financial performance for the past 5 years. Certain information reflects financial results for a single fund share. The total returns in the table represent the rate by which an investor would have earned (or lost) on an investment in the fund share class (assuming reinvestment of all distributions) held for the entire period.
| Initial Class | Years ended 12/31 | |||||||||||||||||||
| 2011 | 2010 | 2009 | 2008 | 2007 | ||||||||||||||||
Net asset value, beginning of period | $13.91 | $12.64 | $10.70 | $18.78 | $18.70 | |||||||||||||||
| Income (loss) from investment operations | ||||||||||||||||||||
Net investment income (d) | $0.24 | $0.20 | $0.22 | $0.25 | $0.27 | |||||||||||||||
Net realized and unrealized gain (loss) on investments | (0.31 | ) | 1.25 | 1.92 | (5.50 | ) | 1.22 | |||||||||||||
Total from investment operations | $(0.07 | ) | $1.45 | $2.14 | $(5.25 | ) | $1.49 | |||||||||||||
| Less distributions declared to shareholders | ||||||||||||||||||||
From net investment income | $(0.23 | ) | $(0.18 | ) | $(0.20 | ) | $(0.30 | ) | $(0.30 | ) | ||||||||||
From net realized gain on investments | (0.97 | ) | — | — | (2.53 | ) | (1.11 | ) | ||||||||||||
Total distributions declared to shareholders | $(1.20 | ) | $(0.18 | ) | $(0.20 | ) | $(2.83 | ) | $(1.41 | ) | ||||||||||
Net asset value, end of period (x) | $12.64 | $13.91 | $12.64 | $10.70 | $18.78 | |||||||||||||||
Total return (%) (k)(s)(x) | (0.00 | )(w) | 11.51 | 20.49 | (32.64 | ) | 7.92 | |||||||||||||
| Ratios (%) (to average net assets) and Supplemental data: | ||||||||||||||||||||
Expenses (f) | 0.82 | 0.84 | 0.85 | 0.84 | 0.83 | |||||||||||||||
Net investment income | 1.81 | 1.59 | 1.98 | 1.75 | 1.40 | |||||||||||||||
Portfolio turnover | 22 | 34 | 27 | 44 | 25 | |||||||||||||||
Net assets at end of period (000 omitted) | $307,523 | $298,799 | $268,001 | $146,011 | $267,967 | |||||||||||||||
See Notes to Financial Statements
12
Table of Contents
MFS Value Portfolio
Financial Highlights – continued
| Service Class | Years ended 12/31 | |||||||||||||||||||
| 2011 | 2010 | 2009 | 2008 | 2007 | ||||||||||||||||
Net asset value, beginning of period | $13.79 | $12.54 | $10.61 | $18.66 | $18.59 | |||||||||||||||
| Income (loss) from investment operations | ||||||||||||||||||||
Net investment income (d) | $0.21 | $0.17 | $0.19 | $0.22 | $0.22 | |||||||||||||||
Net realized and unrealized gain (loss) on investments | (0.31 | ) | 1.23 | 1.91 | (5.48 | ) | 1.22 | |||||||||||||
Total from investment operations | $(0.10 | ) | $1.40 | $2.10 | $(5.26 | ) | $1.44 | |||||||||||||
| Less distributions declared to shareholders | ||||||||||||||||||||
From net investment income | $(0.20 | ) | $(0.15 | ) | $(0.17 | ) | $(0.26 | ) | $(0.26 | ) | ||||||||||
From net realized gain on investments | (0.97 | ) | — | — | (2.53 | ) | (1.11 | ) | ||||||||||||
Total distributions declared to shareholders | $(1.17 | ) | $(0.15 | ) | $(0.17 | ) | $(2.79 | ) | $(1.37 | ) | ||||||||||
Net asset value, end of period (x) | $12.52 | $13.79 | $12.54 | $10.61 | $18.66 | |||||||||||||||
Total return (%) (k)(s)(x) | (0.29 | ) | 11.22 | 20.30 | (32.87 | ) | 7.67 | |||||||||||||
| Ratios (%) (to average net assets) and Supplemental data: | ||||||||||||||||||||
Expenses (f) | 1.07 | 1.09 | 1.10 | 1.09 | 1.08 | |||||||||||||||
Net investment income | 1.54 | 1.33 | 1.73 | 1.62 | 1.16 | |||||||||||||||
Portfolio turnover | 22 | 34 | 27 | 44 | 25 | |||||||||||||||
Net assets at end of period (000 omitted) | $203,924 | $232,425 | $228,388 | $165,519 | $141,584 | |||||||||||||||
| (d) | Per share data is based on average shares outstanding. |
| (f) | Ratios do not reflect reductions from fees paid indirectly, if applicable. |
| (k) | The total return does not reflect expenses that apply to separate accounts. Inclusion of these charges would reduce the total return figures for all periods shown. |
| (s) | From time to time the fund may receive proceeds from litigation settlements, without which performance would be lower. |
| (w) | Per share amount was less than $0.01. |
| (x) | The net asset values per share and total returns have been calculated on net assets which include adjustments made in accordance with U.S. generally accepted accounting principles required at period end for financial reporting purposes. |
See Notes to Financial Statements
13
Table of Contents
MFS Value Portfolio
| (1) | Business and Organization |
MFS Value Portfolio (the fund) is a series of MFS Variable Insurance Trust II (the trust). The trust is organized as a Massachusetts business trust and is registered under the Investment Company Act of 1940, as amended, as an open-end management investment company. The shareholders of each series of the trust are separate accounts of insurance companies, which offer variable annuity and/or life insurance products, and qualified retirement and pension plans.
| (2) | Significant Accounting Policies |
General – The preparation of financial statements in conformity with U.S. generally accepted accounting principles requires management to make estimates and assumptions that affect the reported amounts of assets and liabilities, and disclosure of contingent assets and liabilities at the date of the financial statements and the reported amounts of revenues and expenses during the reporting period. Actual results could differ from those estimates. In the preparation of these financial statements, management has evaluated subsequent events occurring after the date of the fund’s Statement of Assets and Liabilities through the date that the financial statements were issued.
In December 2011, the Financial Accounting Standards Board issued Accounting Standards Update 2011-11, Balance Sheet (Topic 210) – Disclosures about Offsetting Assets and Liabilities (“ASU 2011-11”). Effective for annual reporting periods beginning on or after January 1, 2013 and interim periods within those annual periods, ASU 2011-11 is intended to enhance disclosure requirements on the offsetting of financial assets and liabilities. Although still evaluating the potential impacts of ASU 2011-11 to the fund, management expects that the impact of the fund’s adoption will be limited to additional financial statement disclosures.
Investment Valuations – Equity securities, including restricted equity securities, are generally valued at the last sale or official closing price as provided by a third-party pricing service on the market or exchange on which they are primarily traded. Equity securities, for which there were no sales reported that day, are generally valued at the last quoted daily bid quotation as provided by a third-party pricing service on the market or exchange on which such securities are primarily traded. Equity securities held short, for which there were no sales reported for that day, are generally valued at the last quoted daily ask quotation as provided by a third-party pricing service on the market or exchange on which such securities are primarily traded. Short-term instruments with a maturity at issuance of 60 days or less generally are valued at amortized cost, which approximates market value. Open-end investment companies are generally valued at net asset value per share. Securities and other assets generally valued on the basis of information from a third-party pricing service may also be valued at a broker/dealer bid quotation. Values obtained from third-party pricing services can utilize both transaction data and market information such as yield, quality, coupon rate, maturity, type of issue, trading characteristics, and other market data. The values of foreign securities and other assets and liabilities expressed in foreign currencies are converted to U.S. dollars using the mean of bid and asked prices for rates provided by a third-party pricing service.
The Board of Trustees has delegated primary responsibility for determining or causing to be determined the value of the fund’s investments (including any fair valuation) to the adviser pursuant to valuation policies and procedures approved by the Board. If the adviser determines that reliable market quotations are not readily available, investments are valued at fair value as determined in good faith by the adviser in accordance with such procedures under the oversight of the Board of Trustees. Under the fund’s valuation policies and procedures, market quotations are not considered to be readily available for most types of debt instruments and floating rate loans and many types of derivatives. These investments are generally valued at fair value based on information from third-party pricing services. In addition, investments may be valued at fair value if the adviser determines that an investment’s value has been materially affected by events occurring after the close of the exchange or market on which the investment is principally traded (such as foreign exchange or market) and prior to the determination of the fund’s net asset value, or after the halting of trading of a specific security where trading does not resume prior to the close of the exchange or market on which the security is principally traded. Events that occur on a frequent basis after foreign markets close (such as developments in foreign markets and significant movements in the U.S. markets) and prior to the determination of the fund’s net asset value may be deemed to have a material effect on the value of securities traded in foreign markets. Accordingly, the fund’s foreign equity securities may often be valued at fair value. The adviser generally relies on third-party pricing services or other information (such as the correlation with price movements of similar securities in the same or other markets; the type, cost and investment characteristics of the security; the business and financial condition of the issuer; and trading and other market data) to assist in determining whether to fair value and at what value to fair value an investment. The value of an investment for purposes of calculating the fund’s net asset value can differ depending on the source and method used to determine value. When fair valuation is used, the value of an investment used to determine the fund’s net asset value may differ from quoted or published prices for the same investment. There can be no assurance that the fund could obtain the fair value assigned to an investment if it were to sell the investment at the same time at which the fund determines its net asset value per share.
14
Table of Contents
MFS Value Portfolio
Notes to Financial Statements – continued
Various inputs are used in determining the value of the fund’s assets or liabilities. These inputs are categorized into three broad levels. In certain cases, the inputs used to measure fair value may fall into different levels of the fair value hierarchy. In such cases, an investment’s level within the fair value hierarchy is based on the lowest level of input that is significant to the fair value measurement. The fund’s assessment of the significance of a particular input to the fair value measurement in its entirety requires judgment, and considers factors specific to the investment. Level 1 includes unadjusted quoted prices in active markets for identical assets or liabilities. Level 2 includes other significant observable market-based inputs (including quoted prices for similar securities, interest rates, prepayment speed, and credit risk). Level 3 includes unobservable inputs, which may include the adviser’s own assumptions in determining the fair value of investments. The following is a summary of the levels used as of December 31, 2011 in valuing the fund’s assets or liabilities:
| Investments at Value | Level 1 | Level 2 | Level 3 | Total | ||||||||||||
| Equity Securities: | ||||||||||||||||
United States | $472,406,723 | $— | $— | $472,406,723 | ||||||||||||
United Kingdom | 16,168,212 | — | — | 16,168,212 | ||||||||||||
Switzerland | — | 9,218,984 | — | 9,218,984 | ||||||||||||
Canada | 3,031,630 | — | — | 3,031,630 | ||||||||||||
Netherlands | 2,160,125 | — | — | 2,160,125 | ||||||||||||
| Mutual Funds | 4,110,358 | — | — | 4,110,358 | ||||||||||||
| Total Investments | $497,877,048 | $9,218,984 | $— | $507,096,032 | ||||||||||||
For further information regarding security characteristics, see the Portfolio of Investments.
Foreign Currency Translation – Purchases and sales of foreign investments, income, and expenses are converted into U.S. dollars based upon currency exchange rates prevailing on the respective dates of such transactions or on the reporting date for foreign denominated receivables and payables. Gains and losses attributable to foreign currency exchange rates on sales of securities are recorded for financial statement purposes as net realized gains and losses on investments. Gains and losses attributable to foreign exchange rate movements on receivables, payables, income and expenses are recorded for financial statement purposes as foreign currency transaction gains and losses. That portion of both realized and unrealized gains and losses on investments that results from fluctuations in foreign currency exchange rates is not separately disclosed.
Security Loans – State Street Bank and Trust Company (“State Street”), as lending agent, loans the securities of the fund to certain qualified institutions (the “Borrowers”) approved by the fund. The loans are collateralized by cash and/or U.S. Treasury and federal agency obligations in an amount typically at least equal to the market value of the securities loaned. The market value of the loaned securities is determined at the close of business of the fund and any additional required collateral is delivered to the fund on the next business day. State Street provides the fund with indemnification against Borrower default. The fund bears the risk of loss with respect to the investment of cash collateral. On loans collateralized by cash, the cash collateral is invested in a money market fund or short-term securities. A portion of the income generated upon investment of the collateral is remitted to the Borrowers, and the remainder is allocated between the fund and the lending agent. On loans collateralized by U.S. Treasury and/or federal agency obligations, a fee is received from the Borrower, and is allocated between the fund and the lending agent. Income from securities lending is included interest income on the Statement of Operations. The dividend and interest income earned on the securities loaned is accounted for in the same manner as other dividend and interest income.
Indemnifications – Under the fund’s organizational documents, its officers and Trustees may be indemnified against certain liabilities and expenses arising out of the performance of their duties to the fund. Additionally, in the normal course of business, the fund enters into agreements with service providers that may contain indemnification clauses. The fund’s maximum exposure under these agreements is unknown as this would involve future claims that may be made against the fund that have not yet occurred.
Investment Transactions and Income – Investment transactions are recorded on the trade date. Interest income is recorded on the accrual basis. Dividends received in cash are recorded on the ex-dividend date. Certain dividends from foreign securities will be recorded when the fund is informed of the dividend if such information is obtained subsequent to the ex-dividend date. Dividend and interest payments received in additional securities are recorded on the ex-dividend or ex-interest date in an amount equal to the value of the security on such date.
The fund may receive proceeds from litigation settlements. Any proceeds received from litigation involving portfolio holdings are reflected in the Statement of Operations in realized gain/loss if the security has been disposed of by the fund or in unrealized gain/loss if the security is still held by the fund. Any other proceeds from litigation not related to portfolio holdings are reflected as other income in the Statement of Operations.
15
Table of Contents
MFS Value Portfolio
Notes to Financial Statements – continued
Fees Paid Indirectly – The fund’s custody fee may be reduced according to an arrangement that measures the value of cash deposited with the custodian by the fund. This amount, for the year ended December 31, 2011, is shown as a reduction of total expenses on the Statement of Operations.
Tax Matters and Distributions – The fund intends to qualify as a regulated investment company, as defined under Subchapter M of the Internal Revenue Code, and to distribute all of its taxable income, including realized capital gains. As a result, no provision for federal income tax is required. The fund’s federal tax returns for the prior three fiscal years remain subject to examination by the Internal Revenue Service. Foreign taxes have been accrued by the fund in the accompanying financial statements.
Distributions to shareholders are recorded on the ex-dividend date. Income and capital gain distributions are determined in accordance with income tax regulations, which may differ from U.S. generally accepted accounting principles. Certain capital accounts in the financial statements are periodically adjusted for permanent differences in order to reflect their tax character. These adjustments have no impact on net assets or net asset value per share. Temporary differences which arise from recognizing certain items of income, expense, gain or loss in different periods for financial statement and tax purposes will reverse at some time in the future. Distributions in excess of net investment income or net realized gains are temporary overdistributions for financial statement purposes resulting from differences in the recognition or classification of income or distributions for financial statement and tax purposes.
Book/tax differences primarily relate to wash sale loss deferrals.
The tax character of distributions declared to shareholders for the last two fiscal years is as follows:
| 12/31/11 | 12/31/10 | |||||||
| Ordinary income (including any short-term capital gains) | $9,458,810 | $6,932,160 | ||||||
| Long-term capital gains | 33,776,539 | — | ||||||
| Total distributions | $43,235,349 | $6,932,160 | ||||||
The federal tax cost and the tax basis components of distributable earnings were as follows:
| As of 12/31/11 | ||||
| Cost of investments | $494,691,370 | |||
| Gross appreciation | 53,072,779 | |||
| Gross depreciation | (40,668,117 | ) | ||
| Net unrealized appreciation (depreciation) | $12,404,662 | |||
| Undistributed ordinary income | 12,861,709 | |||
| Undistributed long-term capital gain | 20,306,496 | |||
| Capital loss carryforwards | (5,220,170 | ) | ||
| Other temporary differences | (7,142 | ) |
Under the Regulated Investment Company Modernization Act of 2010 (the “Act”), net capital losses recognized after December 31, 2010 may be carried forward indefinitely, and their character is retained as short-term and/or long-term losses. Previously, net capital losses were carried forward for eight years and treated as short-term losses. As a transition rule, the Act requires that post-enactment net capital losses be used before pre-enactment net capital losses.
As of December 31, 2011 the fund had capital loss carryforwards available to offset future realized gains. Such losses expire as follows:
| Pre-enactment losses: | ||||
| 12/31/15 | $(4,844,492 | ) | ||
| 12/31/16 | (375,678 | ) | ||
| Total | $(5,220,170 | ) |
The availability of a portion of the capital loss carryforwards, which were acquired on June 26, 2009 in connection with the MFS Strategic Value Portfolio and on December 4, 2009 in connection with the MFS Mid Cap Value Portfolio mergers, may be limited in a given year.
16
Table of Contents
MFS Value Portfolio
Notes to Financial Statements – continued
Multiple Classes of Shares of Beneficial Interest – The fund offers multiple classes of shares, which differ in their respective distribution and/or service fees. The fund’s income, realized and unrealized gain (loss), and common expenses are allocated to shareholders based on the daily net assets of each class. Dividends are declared separately for each class. Differences in per share dividend rates are generally due to differences in separate class expenses. The fund’s distributions declared to shareholders as reported on the Statements of Changes in Net Assets are presented by class as follows:
| From net investment income | From net realized gain on investments | |||||||||||||||
| Year ended 12/31/11 | Year ended 12/31/10 | Year ended 12/31/11 | Year ended 12/31/10 | |||||||||||||
| Initial Class | $4,858,021 | $4,231,627 | $20,263,116 | $— | ||||||||||||
| Service Class | 3,049,317 | 2,700,533 | 15,064,895 | — | ||||||||||||
| Total | $7,907,338 | $6,932,160 | $35,328,011 | $— | ||||||||||||
| (3) | Transactions with Affiliates |
Investment Adviser – The fund has an investment advisory agreement with MFS to provide overall investment management and related administrative services and facilities to the fund. The management fee is computed daily and paid monthly at the following annual rates:
| First $1 billion of average daily net assets | 0.75% | |||
| Average daily net assets in excess of $1 billion | 0.65% |
The management fee incurred for the year ended December 31, 2011 was equivalent to an annual effective rate of 0.75% of the fund’s average daily net assets.
The investment adviser has agreed in writing to pay a portion of the fund’s total annual operating expenses, exclusive of interest, taxes, extraordinary expenses, brokerage and transaction costs and investment-related expenses, such that total annual operating expenses do not exceed 0.90% of average daily net assets for the Initial Class shares and 1.15% of average daily net assets for the Service Class shares. This written agreement will continue until April 30, 2013. For the year ended December 31, 2011, the fund’s actual operating expenses did not exceed the limit and therefore, the investment adviser did not pay any portion of the fund’s expenses related to this agreement.
Distributor – MFS Fund Distributors, Inc. (MFD), a wholly-owned subsidiary of MFS, is the distributor of shares of the fund. The Trustees have adopted a distribution plan for the Service Class shares pursuant to Rule 12b-1 under the Investment Company Act of 1940.
The fund’s distribution plan provides that the fund will pay MFD distribution and/or service fees equal to 0.25% per annum of its average daily net assets attributable to Service Class shares as partial consideration for services performed and expenses incurred by MFD and financial intermediaries (including participating insurance companies that invest in the fund to fund variable annuity and variable life insurance contracts, sponsors of qualified retirement and pension plans that invest in the fund, and affiliates of these participating insurance companies and plan sponsors) in connection with the sale and distribution of the Service Class shares. MFD may subsequently pay all, or a portion, of the distribution and/or service fees to financial intermediaries.
Shareholder Servicing Agent – MFS Service Center, Inc. (MFSC), a wholly-owned subsidiary of MFS, has contracted to provide transfer agent and recordkeeping functions in connection with the issuance, transfer, and redemption of each class of shares of the fund under a Shareholder Servicing Agent Agreement. During the year ended December 31, 2011, the fund did not pay MFSC a fee for this service.
Administrator – MFS provides certain financial, legal, shareholder communications, compliance, and other administrative services to the fund. Under an administrative services agreement, the fund partially reimburses MFS the costs incurred to provide these services. The fund is charged an annual fixed amount of $17,500 plus a fee based on average daily net assets. The administrative services fee incurred for the year ended December 31, 2011 was equivalent to an annual effective rate of 0.0333% of the fund’s average daily net assets.
Trustees’ and Officers’ Compensation – The fund pays compensation to Trustees in the form of a retainer, attendance fees, and additional compensation to the Board chairperson. The fund does not pay compensation directly to officers of the fund who are also officers of the investment adviser, all of whom receive remuneration for their services to the fund from MFS. Certain officers of the fund are officers or directors of MFS, MFD, and MFSC.
Other – This fund and certain other funds managed by MFS (the funds) have entered into services agreements (the Agreements) which provide for payment of fees by the funds to Tarantino LLC and Griffin Compliance LLC in return for the provision of services of an Independent Chief Compliance Officer (ICCO) and Assistant ICCO, respectively, for the funds. The
17
Table of Contents
MFS Value Portfolio
Notes to Financial Statements – continued
ICCO and Assistant ICCO are officers of the funds and the sole members of Tarantino LLC and Griffin Compliance LLC, respectively. The funds can terminate the Agreements with Tarantino LLC and Griffin Compliance LLC at any time under the terms of the Agreements. MFS has agreed to bear all expenses associated with office space, other administrative support, and supplies provided to the ICCO and Assistant ICCO. For the year ended December 31, 2011, the aggregate fees paid by the fund to Tarantino LLC and Griffin Compliance LLC were $8,619 and are included in miscellaneous expense on the Statement of Operations.
The fund invests in the MFS Institutional Money Market Portfolio which is managed by MFS and seeks a high level of current income consistent with preservation of capital and liquidity. Income earned on this investment is included in dividends from underlying affiliated funds on the Statement of Operations. This money market fund does not pay a management fee to MFS.
| (4) | Portfolio Securities |
Purchases and sales of investments, other than U.S. Government securities, purchased option transactions, and short-term obligations, aggregated $114,557,506 and $130,262,282, respectively.
| (5) | Shares of Beneficial Interest |
The fund’s Declaration of Trust permits the Trustees to issue an unlimited number of full and fractional shares of beneficial interest. Transactions in fund shares were as follows:
| Year ended 12/31/11 | Year ended 12/31/10 | |||||||||||||||
| Shares | Amount | Shares | Amount | |||||||||||||
| Shares sold | ||||||||||||||||
Initial Class | 4,023,037 | $52,098,813 | 7,430,622 | $93,805,921 | ||||||||||||
Service Class | 1,151,500 | 14,661,660 | 1,125,101 | 13,970,482 | ||||||||||||
| 5,174,537 | $66,760,473 | 8,555,723 | $107,776,403 | |||||||||||||
| Shares issued to shareholders in reinvestment of distributions | ||||||||||||||||
Initial Class | 2,096,923 | $25,121,137 | 314,619 | $4,231,627 | ||||||||||||
Service Class | 1,524,766 | 18,114,212 | 202,287 | 2,700,533 | ||||||||||||
| 3,621,689 | $43,235,349 | 516,906 | $6,932,160 | |||||||||||||
| Shares reacquired | ||||||||||||||||
Initial Class | (3,262,487 | ) | $(45,265,120 | ) | (7,467,590 | ) | $(97,638,535 | ) | ||||||||
Service Class | (3,242,419 | ) | (43,097,698 | ) | (2,685,686 | ) | (34,261,566 | ) | ||||||||
| (6,504,906 | ) | $(88,362,818 | ) | (10,153,276 | ) | $(131,900,101 | ) | |||||||||
| Net change | ||||||||||||||||
Initial Class | 2,857,473 | $31,954,830 | 277,651 | $399,013 | ||||||||||||
Service Class | (566,153 | ) | (10,321,826 | ) | (1,358,298 | ) | (17,590,551 | ) | ||||||||
| 2,291,320 | $21,633,004 | (1,080,647 | ) | $(17,191,538 | ) | |||||||||||
| (6) | Line of Credit |
The fund and certain other funds managed by MFS participate in a $1.1 billion unsecured committed line of credit, subject to a $1 billion sublimit, provided by a syndication of banks under a credit agreement. Borrowings may be made for temporary financing needs. Interest is charged to each fund, based on its borrowings, generally at a rate equal to the higher of the Federal Reserve funds rate or one month LIBOR plus an agreed upon spread. A commitment fee, based on the average daily, unused portion of the committed line of credit, is allocated among the participating funds at the end of each calendar quarter. In addition, the fund and other funds managed by MFS have established unsecured uncommitted borrowing arrangements with certain banks for temporary financing needs. Interest is charged to each fund, based on its borrowings, at a rate equal to the Federal Reserve funds rate plus an agreed upon spread. For the year ended December 31, 2011, the fund’s commitment fee and interest expense were $3,970 and $0, respectively, and are included in miscellaneous expense on the Statement of Operations.
| (7) | Transactions in Underlying Affiliated Funds – Affiliated Issuers |
An affiliated issuer may be considered one in which the fund owns 5% or more of the outstanding voting securities, or a company which is under common control. For the purposes of this report, the fund assumes the following to be affiliated issuers:
| Underlying Affiliated Funds | Beginning Shares/Par Amount | Acquisitions Shares/Par Amount | Dispositions Shares/Par Amount | Ending Shares/Par Amount | ||||||||||||
| MFS Institutional Money Market Portfolio | 4,137,996 | 99,703,854 | (99,731,492 | ) | 4,110,358 | |||||||||||
| Underlying Affiliated Funds | Realized Gain (Loss) | Capital Gain Distributions | Dividend Income | Ending Value | ||||||||||||
| MFS Institutional Money Market Portfolio | $— | $— | $5,902 | $4,110,358 | ||||||||||||
18
Table of Contents
MFS Value Portfolio
REPORT OF INDEPENDENT REGISTERED PUBLIC ACCOUNTING FIRM
To the Board of Trustees of MFS Variable Insurance Trust II and the Shareholders of
MFS Value Portfolio:
We have audited the accompanying statement of assets and liabilities, including the portfolio of investments, of MFS Value Portfolio (the “Fund”) (one of the portfolios comprising MFS Variable Insurance Trust II) as of December 31, 2011, and the related statement of operations for the year then ended, the statements of changes in net assets for each of the two years in the period then ended, and the financial highlights for each of the five years in the period then ended. These financial statements and financial highlights are the responsibility of the Fund’s management. Our responsibility is to express an opinion on these financial statements and financial highlights based on our audits.
We conducted our audits in accordance with the standards of the Public Company Accounting Oversight Board (United States). Those standards require that we plan and perform the audit to obtain reasonable assurance about whether the financial statements and financial highlights are free of material misstatement. The Fund is not required to have, nor were we engaged to perform, an audit of its internal control over financial reporting. Our audits included consideration of internal control over financial reporting as a basis for designing audit procedures that are appropriate in the circumstances, but not for the purpose of expressing an opinion on the effectiveness of the Fund’s internal control over financial reporting. Accordingly, we express no such opinion. An audit also includes examining, on a test basis, evidence supporting the amounts and disclosures in the financial statements, assessing the accounting principles used and significant estimates made by management, as well as evaluating the overall financial statement presentation. Our procedures included confirmation of securities owned as of December 31, 2011, by correspondence with the custodian. We believe that our audits provide a reasonable basis for our opinion.
In our opinion, the financial statements and financial highlights referred to above present fairly, in all material respects, the financial position of MFS Value Portfolio as of December 31, 2011, the results of its operations for the year then ended, the changes in its net assets for each of the two years in the period then ended, and the financial highlights for each of the five years in the period then ended, in conformity with accounting principles generally accepted in the United States of America.
DELOITTE & TOUCHE LLP
Boston, Massachusetts
February 15, 2012
19
Table of Contents
MFS Value Portfolio
RESULTS OF SHAREHOLDER MEETING (unaudited)
At a special meeting of shareholders of MFS Value Portfolio, which was held on December 1, 2011, the following actions were taken for which shareholders of all series of MFS Variable Insurance Trust II voted together as a single class with respect to Item 1 and shareholders of MFS Value Portfolio voted as a separate class with respect to Items 2 and 3:
Item 1: Election of ten Trustees as members of the Board of Trustees of the Trust effective January 1, 2012:
| Number of Shares | ||||||||
| For | Withheld Authority | |||||||
| Robert E. Butler | 681,916,712.8686 | 46,472,894.9218 | ||||||
| Maureen R. Goldfarb | 682,835,794.8512 | 45,553,812.9392 | ||||||
| David H. Gunning | 681,500,267.3085 | 46,889,340.4819 | ||||||
| William R. Gutow | 681,050,223.5547 | 47,339,384.2357 | ||||||
| Michael Hegarty | 682,477,088.8584 | 45,912,518.9320 | ||||||
| John P. Kavanaugh | 683,794,425.4269 | 44,595,182.3635 | ||||||
| Robert J. Manning | 682,699,559.7374 | 45,690,048.0530 | ||||||
| J. Dale Sherratt | 681,362,743.0513 | 47,026,864.7391 | ||||||
| Laurie J. Thomsen | 683,408,094.0000 | 44,981,513.7904 | ||||||
| Robert W. Uek | 681,424,852.0247 | 46,964,755.7657 | ||||||
Item 2: To approve a new investment advisory agreement dated January 1, 2012, between the Trust, on behalf of MFS Value Portfolio, and MFS:
| Number of Shares | ||||||||||||
| For | Against | Withheld Authority | ||||||||||
| 36,442,513.8909 | 778,952.4329 | 4,358,761.1233 | ||||||||||
Item 3: To approve revisions to and restatements of certain fundamental investment restrictions of MFS Value Portfolio January 1, 2012 as detailed below:
| Number of Shares | ||||||||||||||
| For | Against | Withheld Authority | ||||||||||||
| A. | Borrowing | 34,922,420.3903 | 1,767,745.5565 | 4,890,061.5003 | ||||||||||
| B. | Underwriting Securities | 35,736,006.7001 | 996,157.1054 | 4,848,063.6416 | ||||||||||
| C. | Issuance of Senior Securities | 35,565,650.3803 | 1,282,511.7446 | 4,732,065.3222 | ||||||||||
| D. | Lending of Money or Securities | 35,045,502.0483 | 1,670,796.1109 | 4,863,929.2879 | ||||||||||
| E. | Purchases or Sales of Real Estate; Interests in Oil, Gas or Mineral Leases; and Commodities | 35,794,402.4846 | 1,032,861.8837 | 4,752,963.0788 | ||||||||||
| F. | Industry Concentration | 35,944,083.9743 | 920,348.5472 | 4,715,794.9256 | ||||||||||
20
Table of Contents
MFS Value Portfolio
TRUSTEES AND OFFICERS – IDENTIFICATION AND BACKGROUND
The Trustees and officers of the Trust, as of February 1, 2012, are listed below, together with their principal occupations during the past five years. (Their titles may have varied during that period.) The address of each Trustee and officer is 500 Boylston Street, Boston, Massachusetts 02116.
Name, Age | Position(s) with Fund | Trustee/Officer Since (h) | Principal Occupations | Other Directorships (j) | ||||
| INTERESTED TRUSTEES | ||||||||
Robert J. Manning (k) (age 48) | Trustee | February 2004 | Massachusetts Financial Services Company, Chairman, Chief Executive Officer and Director; President (until December 2009); Chief Investment Officer (until July 2010) | N/A | ||||
| INDEPENDENT TRUSTEES | ||||||||
David H. Gunning (age 69) | Trustee and Chair of Trustees | January 2004 | Retired; Cleveland-Cliffs Inc. (mining products and service provider), Vice Chairman/Director (until May 2007) | Lincoln Electric Holdings, Inc. (welding equipment manufacturer), Director; Development Alternatives, Inc. (consulting), Director/Non-Executive Chairman; Portman Limited (mining), Director (until 2008) | ||||
Robert E. Butler (age 70) | Trustee | January 2006 | Consultant – investment company industry regulatory and compliance matters | N/A | ||||
Maureen R. Goldfarb (age 56) | Trustee | January 2009 | Private investor | N/A | ||||
William R. Gutow (age 70) | Trustee | December 1993 | Private investor and real estate consultant; Capitol Entertainment Management Company (video franchise), Vice Chairman | Atlantic Coast Tan (tanning salons), Vice Chairman (until 2007); Texas Donuts (donut franchise), Vice Chairman (until 2010) | ||||
Michael Hegarty (age 67) | Trustee | December 2004 | Private investor | N/A | ||||
John P. Kavanaugh (age 57) | Trustee | January 2009 | Private investor; The Hanover Insurance Group, Inc., Vice President and Chief Investment Officer (until 2006); Allmerica Investment Trust, Allmerica Securities Trust and Opus Investment Trust (investment companies), Chairman, President and Trustee (until 2006) | N/A | ||||
J. Dale Sherratt (age 73) | Trustee | June 1989 | Insight Resources, Inc. (acquisition planning specialists), President; Wellfleet Investments (investor in health care companies), Managing General Partner | N/A | ||||
Laurie J. Thomsen (age 54) | Trustee | March 2005 | Private investor; New Profit, Inc. (venture philanthropy), Executive Partner (until 2010) | The Travelers Companies (property and casualty insurance), Director | ||||
Robert W. Uek (age 70) | Trustee | January 2006 | Consultant to investment company industry | N/A | ||||
| OFFICERS | ||||||||
John M. Corcoran (k) (age 46) | President | October 2008 | Massachusetts Financial Services Company, Senior Vice President (since October 2008); State Street Bank and Trust (financial services provider), Senior Vice President, (until September 2008) | N/A | ||||
| Christopher R. Bohane (k) (age 38) | Assistant Secretary and Assistant Clerk | July 2005 | Massachusetts Financial Services Company, Vice President and Senior Counsel | N/A | ||||
Kino Clark (k) (age 43) | Assistant Treasurer | January 2012 | Massachusetts Financial Services Company, Assistant Vice President | N/A | ||||
21
Table of Contents
MFS Value Portfolio
Trustees and Officers – continued
Name, Age | Position(s) with Fund | Trustee/Officer Since (h) | Principal Occupations | Other Directorships (j) | ||||
Ethan D. Corey (k) (age 48) | Assistant Secretary and Assistant Clerk | July 2005 | Massachusetts Financial Services Company, Senior Vice President and Associate General Counsel | N/A | ||||
David L. DiLorenzo (k) (age 43) | Treasurer | July 2005 | Massachusetts Financial Services Company, Vice President | N/A | ||||
Robyn L. Griffin (age 36) | Assistant Independent Chief Compliance Officer | August 2008 | Griffin Compliance LLC (provider of compliance services), Principal (since August 2008); State Street Corporation (financial services provider), Mutual Fund Administration Assistant Vice President (October 2006 – July 2008); Liberty Mutual Group (insurance), Personal Market Assistant Controller (April 2006 – October 2006); Deloitte & Touche LLP (professional services firm). | N/A | ||||
Brian E. Langenfeld (k) (age 38) | Assistant Secretary and Assistant Clerk | June 2006 | Massachusetts Financial Services Company, Vice President and Senior Counsel | N/A | ||||
Ellen Moynihan (k) (age 54) | Assistant Treasurer | April 1997 | Massachusetts Financial Services Company, Senior Vice President | N/A | ||||
Susan S. Newton (k) (age 61) | Assistant Secretary and Assistant Clerk | May 2005 | Massachusetts Financial Services Company, Senior Vice President and Associate General Counsel | N/A | ||||
Susan A. Pereira (k) (age 41) | Assistant Secretary and Assistant Clerk | July 2005 | Massachusetts Financial Services Company, Vice President and Senior Counsel | N/A | ||||
Mark N. Polebaum (k) (age 59) | Secretary and Clerk | January 2006 | Massachusetts Financial Services Company, Executive Vice President, General Counsel and Secretary | N/A | ||||
Frank L. Tarantino (age 67) | Independent Chief Compliance Officer | June 2004 | Tarantino LLC (provider of compliance services), Principal | N/A | ||||
Richard S. Weitzel (k) (age 41) | Assistant Secretary and Assistant Clerk | October 2007 | Massachusetts Financial Services Company, Vice President and Assistant General Counsel | N/A | ||||
James O. Yost (k) (age 51) | Deputy Treasurer | September 1990 | Massachusetts Financial Services Company, Senior Vice President | N/A | ||||
| (h) | Date first appointed to serve as Trustee/officer of an MFS fund. Each Trustee has served continuously since appointment unless indicated otherwise. For the period from December 15, 2004 until February 22, 2005, Mr. Manning served as Advisory Trustee. For the period October 2008, until January 2012, Mr. Corcoran served as Treasurer of the Funds. Prior to January 2012, Messrs. DiLorenzo and Yost served as Assistant Treasurers of the Funds. |
| (j) | Directorships or trusteeships of companies required to report to the Securities and Exchange Commission (i.e., “public companies”). |
| (k) | “Interested person” of the Trust within the meaning of the Investment Company Act of 1940 (referred to as the 1940 Act), which is the principal federal law governing investment companies like the fund, as a result of position with MFS. The address of MFS is 500 Boylston Street, Boston, Massachusetts 02116. |
Each Trustee has been elected by shareholders and each Trustee and officer holds office until his or her successor is chosen and qualified or until his or her earlier death, resignation, retirement or removal. The Trust does not hold annual meetings for the purpose of electing Trustees, and Trustees are not elected for fixed terms. Messrs. Butler, Kavanaugh, Uek and Ms. Thomsen are members of the Trust’s Audit Committee.
Each of the Fund’s Trustees and officers holds comparable positions with certain other funds of which MFS or a subsidiary is the investment adviser or distributor, and, in the case of the officers, with certain affiliates of MFS. As of January 1, 2012, the Trustees served as board members of 131 funds within the MFS Family of Funds.
22
Table of Contents
MFS Value Portfolio
Trustees and Officers – continued
The Statement of Additional Information for the Fund includes further information about the Trustees and is available without charge upon request by calling 1-800-225-2606.
Investment Adviser Massachusetts Financial Services Company 500 Boylston Street, Boston, MA 02116-3741 | Custodian State Street Bank and Trust 1 Lincoln Street, Boston, MA 02111-2900 | |
Distributor MFS Fund Distributors, Inc. 500 Boylston Street, Boston, MA 02116-3741 | Independent Registered Public Accounting Firm Deloitte & Touche LLP 200 Berkeley Street, Boston, MA 02116 | |
Portfolio Managers Nevin Chitkara Steven Gorham |
23
Table of Contents
MFS Value Portfolio
At a special meeting of shareholders of the MFS Value Portfolio (hereinafter referred to as the “Fund” or the “Portfolio”), which was held on December 1, 2011, the shareholders approved a new investment advisory agreement based on the recommendation of the Board of Trustees. At its July, 2011 meeting, the Board of Trustees (i) approved, and recommended for shareholder approval, the new investment advisory agreement effective January 1, 2012, and (ii) the continuation of the existing investment advisory agreement effective September 1, 2011. The following includes a description of the factors that the Board of Trustees considered and the conclusions that formed the basis of their approval of both the new investment advisory agreement and the continuation of the prior investment advisory agreement.
BOARD APPROVAL OF NEW INVESTMENT ADVISORY AGREEMENT
The Investment Company Act of 1940 requires that both the full Board of Trustees and a majority of the non-interested (“independent”) Trustees, voting separately, initially approve the new investment advisory agreement (the “New Agreement”) between Massachusetts Financial Services Company (“MFS”) and MFS Variable Insurance Trust II (the “Trust”) on behalf of the Portfolio and, beginning on the second anniversary of the initial effective date of the New Agreement, annually approve the continuation of the New Agreement. The Trustees have considered matters bearing on the Portfolio and the then current advisory arrangement at their meetings throughout the year, including a review of performance data at each regular meeting. In addition, the independent Trustees met in person in July 2011 to consider the initial approval of the New Agreement, and to recommend that shareholders approve the New Agreement. The independent Trustees were assisted in their evaluation of the New Agreement by independent legal counsel, from whom they received separate legal advice and with whom they met separately from MFS management. The independent Trustees were also assisted in this process by the Portfolio’s Independent Chief Compliance Officer, a full-time senior officer appointed by and reporting to the independent Trustees.
In connection with their deliberations regarding the initial approval of the New Agreement, the Trustees, including the independent Trustees, considered such information and factors as they believed, in light of the legal advice furnished to them and their own business judgment, to be relevant. The New Agreement was considered separately for the series of the Trust (collectively, the “Portfolios”), although the Trustees also took into account the common interests of all Portfolios in the Trust in their review. As described below, the Trustees considered the nature, quality, and extent of the various investment advisory, administrative, and/or shareholder services to be performed by MFS under the New Agreement and other arrangements with the Trust.
In connection with their initial review meeting, the Trustees received and relied upon materials that included, among other items: (i) information provided by MFS on the advisory fees of comparable portfolios of its other clients, including institutional separate account and other clients, (ii) information as to whether, and to what extent applicable, expense waivers, reimbursements or fee “breakpoints” would be observed for the Portfolio under the New Agreement, and (iii) a comparison and summary of the differences in the provisions in the New Agreement compared to those in each of the then current investment advisory agreements for the Portfolios. In addition, in connection with the independent Trustees’ meetings in May and July, 2011 (the “contract review meetings”) for the purpose of considering whether to approve the continuation of the then current investment advisory agreements for the Portfolio, the independent Trustees received: (1) information provided by Lipper Inc. (“Lipper”) on the investment performance of the Portfolio for various time periods ended December 31, 2010, compared to the investment performance of a group of funds with substantially similar investment classifications/objectives (the “Lipper performance universe”), (2) information provided by Lipper on the Portfolio’s advisory fees and other expenses compared to the advisory fees and other expenses of comparable funds identified by Lipper (the “Lipper expense group”), (3) information regarding MFS’ financial results and financial condition, including MFS’ and certain of its affiliates’ estimated profitability from services performed for the Portfolio, (4) MFS’ views regarding the outlook for the mutual fund industry and its strategic business plans, (5) descriptions of various functions performed by MFS for the Trust, such as compliance monitoring and portfolio trading practices, and (6) information regarding the overall organization of MFS, including information about MFS’ senior management and other personnel providing investment advisory, administrative and other services to the Portfolio. The comparative performance, fee and expense information prepared and provided by Lipper was not independently verified, and the independent Trustees did not independently verify any information provided to them by MFS.
The Trustees’ conclusion as to the initial approval of the New Agreement was based on comprehensive consideration of all information provided to the Trustees and was not the result of any single factor. Some of the factors that figured particularly in the Trustees’ deliberations are described below for the Portfolio, while individual Trustees may have given different weight to various factors and evaluated the information presented as a whole differently than another individual Trustee. The Trustees recognized that the fee arrangements for the Portfolio could reflect years of review and discussion between the independent Trustees and MFS, that certain aspects of such arrangements may receive greater scrutiny in some years than others, and that
24
Table of Contents
MFS Value Portfolio
Board Approval of New Investment Advisory Agreement – continued
the Trustees’ conclusions may be based, in part, on their consideration of these same arrangements during the course of the year and in prior years.
Because the portfolio management team managing the Portfolio’s investments under the then current investment advisory agreement will remain the same under the New Agreement for the Portfolio, the Trustees compared the Portfolio’s total return investment performance to the performance of its Lipper performance universe over various time periods, based on information provided by Lipper. The Trustees placed particular emphasis on the total return performance of the Portfolio’s Initial Class shares in comparison to the performance of funds in its Lipper performance universe over the one-, three- and five-year periods ended December 31, 2010. The Trustees did not rely on performance results for more recent periods.
The Trustees noted the performance of the Portfolio’s Initial Class shares was in the 4th quintile relative to the other funds in the Lipper performance universe for the one-year period (the 1st quintile being the best performers and the 5th quintile being the worst performers). The total return performance of the Portfolio was in the 3rd quintile for the three-year period and in the 1st quintile for the five-year period ended December 31, 2010, relative to the Lipper performance universe. Based on the nature and quality of services provided by MFS and MFS’ explanation of steps taken to improve performance, the Board of Trustees concluded that the Portfolio’s performance was satisfactory.
In the course of their deliberations, the Trustees took into account information provided by MFS during contract review meetings, as well as during investment review meetings conducted with portfolio management personnel during the course of the year. For Portfolios whose performance lagged their peer groups, they discussed the factors that contributed thereto and MFS’ efforts to improve such Portfolios’ performance. After reviewing this information, the Trustees concluded, within the context of their overall conclusions regarding the New Agreement, that they were satisfied with MFS’ responses and efforts relating to investment performance.
In assessing the reasonableness of the Portfolio’s advisory fee, the Trustees considered, among other information, the Portfolio’s advisory fee and the total expense ratio of the Portfolio’s Initial Class shares as a percentage of average daily net assets, compared to the advisory fee and total expense ratios of its peer group of funds based on information provided by Lipper. The Trustees also considered the advisory fees charged by MFS to institutional accounts. In comparing these fees, the Trustees considered the generally broader scope of services provided by MFS to the Trust than those provided to institutional accounts. The Trustees also considered the higher demands placed on MFS’ investment personnel and trading infrastructure as a result of the daily cash in-flows and out-flows of the Portfolio, and the impact on MFS and related expenses due to the more extensive regulatory regime to which the Portfolio is subject, compared to institutional accounts.
In considering the fees, the Trustees noted from the Lipper data that the Portfolio’s effective advisory fee rate was approximately at the median and total expense ratio was above the median of such fees and expenses of funds in the Lipper expense group. In addition, the Trustees accepted MFS’ offer to continue the expense limitation for the Portfolio. The Trustees further noted that the New Agreement would reflect MFS’ agreement to reduce the advisory fee on average daily net assets over $1 billion on a permanent basis, and concluded that the breakpoint was sufficient to allow the Portfolio to benefit from economies of scale as its assets grow. The Trustees concluded that the fees were reasonable in light of the nature and quality of services provided.
The Trustees also considered whether the Portfolio is likely to benefit from any economies of scale due to future asset growth. In this regard, the Trustees reviewed the adequacy of breakpoints and discussed with MFS any adjustments necessary for the shareholders’ benefit.
The Trustees also considered information prepared by MFS relating to its costs and profits with respect to the Portfolio and other investment companies and accounts advised by MFS, as well as MFS’ methodologies used to determine and allocate its costs to the Portfolio and other accounts and products for purposes of estimating profitability.
The Trustees noted that there would be no increase to the net advisory fee arrangement for the Portfolio under the New Agreement when compared to the Portfolio’s then current investment advisory agreement. After reviewing these and other factors described below, the Trustees concluded that the advisory fees charged to the Portfolio under the New Agreement represent reasonable compensation in light of the nature and quality of the services being provided by MFS.
In addition, the Trustees considered MFS’ resources and related efforts to continue to retain, attract and motivate capable personnel to serve the Portfolio. The Trustees also considered the financial resources of MFS and its parent, Sun Life Financial Inc. The Trustees further considered any advantages and possible disadvantages of having an adviser which also serves other investment companies as well as institutional accounts.
The Trustees also considered the nature, quality, cost, and extent of administrative, transfer agency, and distribution services provided to the Trust by MFS and its affiliates under agreements and plans other than the New Agreement, including the 12b-1
25
Table of Contents
MFS Value Portfolio
Board Approval of New Investment Advisory Agreement – continued
fees the Portfolio pays to MFS Fund Distributors, Inc., an affiliate of MFS. The Trustees also considered the nature, extent and quality of certain other services MFS performs or arranges on the Portfolio’s behalf, which may include securities lending programs, directed expense payment programs, class action recovery programs, and MFS’ interaction with third-party service providers, principally custodians and sub-custodians. The Trustees concluded that the various non-advisory services provided by MFS and its affiliates on behalf of the Portfolio were satisfactory. The Trustees also considered the benefits to MFS from the use of the Portfolio’s portfolio brokerage commissions to pay for investment research and various other factors. Additionally, the Trustees considered so-called “fall-out benefits” to MFS such as reputational value derived from serving as investment manager to the Trust, and determined that any such benefits derived by MFS were reasonable and fair.
Based on their evaluation of factors that they deemed to be material, including those factors described above, the Board of Trustees, including a majority of the independent Trustees, concluded that the New Agreement should be approved for an initial two-year period, commencing upon its effective date, as set forth in the New Agreement.
BOARD APPROVAL OF CONTINUATION OF PRIOR INVESTMENT ADVISORY AGREEMENT
The Investment Company Act of 1940 requires that both the full Board of Trustees and a majority of the non-interested (“independent”) Trustees, voting separately, annually approve the continuation of the investment advisory agreement between MFS Variable Insurance Trust II (the “Trust”) and Massachusetts Financial Services Company (“MFS”) on behalf of the Fund. The Trustees consider matters bearing on the Fund and the advisory arrangements at their meetings throughout the year, including a review of performance data at each regular meeting. In addition, the independent Trustees met in person in May and again in July 2011 (“contract review meetings”) for the specific purpose of considering whether to approve the continuation of the investment advisory agreement for the Fund. The independent Trustees were assisted in their evaluation of the investment advisory agreement by independent legal counsel, from whom they received separate legal advice and with whom they met separately from MFS management during various contract review meetings. The independent Trustees were also assisted in this process by the Fund’s Independent Chief Compliance Officer, a full-time senior officer appointed by and reporting to the independent Trustees.
In connection with their deliberations, the Trustees, including the independent Trustees, considered such information and factors as they believed, in light of the legal advice furnished to them and their own business judgment, to be relevant. The investment advisory agreement was considered separately for the Fund, although the Trustees also took into account the common interests of all Funds in the Trust in their review. As described below, the Trustees considered the nature, quality, and extent of the various investment advisory, administrative, and shareholder services performed by MFS under the existing investment advisory agreement and other arrangements with the Trust.
In connection with their contract review meetings, the Trustees received and relied upon materials which included, among other items: (i) information provided by Lipper Inc. (“Lipper”) on the investment performance of the Fund for various time periods ended December 31, 2010, compared to the investment performance of a group of funds with substantially similar investment classifications/objectives (the “Lipper performance universe”), (ii) information provided by Lipper on the Fund’s advisory fees and other expenses compared to the advisory fees and other expenses of comparable funds identified by Lipper (the “Lipper expense group”), (iii) information provided by MFS on the advisory fees of comparable portfolios of its other clients, including institutional separate account and other clients, (iv) information as to whether, and to what extent applicable, expense waivers, reimbursements or fee “breakpoints” are observed for the Fund, (v) information regarding MFS’ financial results and financial condition, including MFS’ and certain of its affiliates’ estimated profitability from services performed for the Fund and other investment companies that the Board oversees as a whole, and for MFS’ institutional business, (vi) MFS’ views regarding the outlook for the mutual fund industry and its strategic business plans, (vii) descriptions of various functions performed by MFS for the Trust, such as compliance monitoring and portfolio trading practices, and (viii) information regarding the overall organization of MFS, including information about MFS’ senior management and other personnel providing investment advisory, administrative and other services to the Fund. The comparative performance, fee and expense information prepared and provided by Lipper was not independently verified, and the independent Trustees did not independently verify any information provided to them by MFS.
The Trustees’ conclusion as to the continuation of the investment advisory agreement was based on comprehensive consideration of all information provided to the Trustees and was not the result of any single factor. Some of the factors that figured particularly in the Trustees’ deliberations are described below for the Fund, while individual Trustees may have given different weight to various factors and evaluated the information presented as a whole differently than another individual Trustee. The Trustees recognized that the fee arrangements for the Fund reflect years of review and discussion between the independent Trustees and MFS, that certain aspects of such arrangements may receive greater scrutiny in some years than
26
Table of Contents
MFS Value Portfolio
Board Approval of Continuation of Prior Investment Advisory Agreement – continued
others, and that the Trustees’ conclusions may be based, in part, on their consideration of these same arrangements during the course of the year and in prior years.
Based on information provided by Lipper, the Trustees compared the Fund’s total return investment performance to the performance of the Lipper performance universe over various time periods. The Trustees placed particular emphasis on the total return performance of the Fund’s Initial Class shares in comparison to the performance of funds in its Lipper performance universe over the one-, three- and five -year periods ended December 31, 2010. The Trustees did not rely on performance results for more recent periods, including those shown elsewhere in this report.
The Trustees noted the performance of the Fund’s Initial Class shares was in the 4th quintile relative to the other funds in the Lipper performance universe for the one-year period (the 1st quintile being the best performers and the 5th quintile being the worst performers). The total return performance of the Fund was in the 3rd quintile for the three-year period and in the 1st quintile for the five-year period ended December 31, 2010, relative to the Lipper performance universe. Based on the nature and quality of services provided by MFS, the Board of Trustees concluded that the Portfolio’s performance was satisfactory.
In the course of their deliberations, the Trustees took into account information provided by MFS during contract review meetings, as well as during investment review meetings conducted with portfolio management personnel during the course of the year.
In assessing the reasonableness of the Fund’s advisory fee, the Trustees considered, among other information, the Fund’s advisory fee and the total expense ratio of the Fund’s Initial Class shares as a percentage of average daily net assets, compared to the advisory fee and total expense ratios of its peer group of funds based on information provided by Lipper. The Trustees also considered the advisory fees charged by MFS to institutional accounts. In comparing these fees, the Trustees considered the generally broader scope of services provided by MFS to the Trust than those provided to institutional accounts. The Trustees also considered the higher demands placed on MFS’ investment personnel and trading infrastructure as a result of the daily cash in-flows and out-flows of the Fund, and the impact on MFS and related expenses due to the more extensive regulatory regime to which the Fund is subject, compared to institutional accounts.
In considering the fees, the Trustees noted from the Lipper data (which takes into account any reductions or expense limitations) that the Fund’s effective advisory fee rate was approximately at the median and total expense ratio was above the median of such fees and expenses of funds in the Lipper expense group. In addition, the Trustees accepted MFS’ offer to continue the expense limitation for the Fund. The Trustees further concluded that the existing breakpoint was sufficient to allow the Fund to benefit from economies of scale as its assets grow. The Trustees concluded that the fees were reasonable in light of the nature and quality of services provided.
The Trustees also considered information prepared by MFS relating to its costs and profits with respect to the Fund and other investment companies and accounts advised by MFS, as well as MFS’ methodologies used to determine and allocate its costs to the Fund and other accounts and products for purposes of estimating profitability.
After reviewing these and other factors described below, the Trustees concluded that the advisory fees charged to the Fund represent reasonable compensation in light of the nature and quality of the services being provided by MFS.
In addition, the Trustees considered MFS’ resources and related efforts to continue to retain, attract and motivate capable personnel to serve the Fund. The Trustees also considered the financial resources of MFS and its parent, Sun Life Financial Inc. The Trustees further considered any advantages and possible disadvantages of having an adviser which also serves other investment companies as well as institutional accounts.
The Trustees also considered the nature, quality, cost, and extent of administrative, transfer agency, and distribution services provided to the Fund by MFS and its affiliates under agreements and plans other than the investment advisory agreement, including the 12b-1 fees the Fund pays to MFS Fund Distributors, Inc., an affiliate of MFS. The Trustees also considered the nature, extent and quality of certain other services MFS performs or arranges on the Fund’s behalf, which may include securities lending programs, directed expense payment programs, class action recovery programs, and MFS’ interaction with third-party service providers, principally custodians and sub-custodians. The Trustees concluded that the various non-advisory services provided by MFS and its affiliates on behalf of the Fund were satisfactory. The Trustees also considered the benefits to MFS from the use of the Fund’s portfolio brokerage commissions, if applicable, to pay for investment research and various other factors. Additionally, the Trustees considered so-called “fall-out benefits” to MFS such as reputational value derived from serving as investment manager to the Trust, and determined that any such benefits derived by MFS were reasonable and fair.
Based on their evaluation of factors that they deemed to be material, including those factors described above, the Board of Trustees, including a majority of the independent Trustees, concluded that the investment advisory agreement should be continued for an additional one-year period, commencing September 1, 2011.
A discussion regarding the Board’s most recent review and renewal of the fund’s Investment Advisory Agreement with MFS is available by clicking on the fund’s name under “Variable Insurance Portfolios — VIT II” in the “Products and Performance” section of the MFS Web site (mfs.com).
27
Table of Contents
MFS Value Portfolio
PROXY VOTING POLICIES AND INFORMATION
A general description of the MFS funds’ proxy voting policies and procedures is available without charge, upon request, by calling
1-800-225-2606, by visiting the Proxy Voting section of mfs.com or by visiting the SEC’s Web site at http://www.sec.gov.
Information regarding how the fund voted proxies relating to portfolio securities during the most recent twelve-month period ended June 30 is available without charge by visiting the Proxy Voting section of mfs.com or by visiting the SEC’s Web site at http://www.sec.gov.
QUARTERLY PORTFOLIO DISCLOSURE
The fund will file a complete schedule of portfolio holdings with the Securities and Exchange Commission (the Commission) for the first and third quarters of each fiscal year on Form N-Q. The fund’s Form N-Q is available on the EDGAR database on the Commission’s Internet Web site at http://www.sec.gov and may be reviewed and copied at the:
Public Reference Room
Securities and Exchange Commission
100 F Street, NE, Room 1580
Washington, D.C. 20549
Information on the operation of the Public Reference Room may be obtained by calling the Commission at 1-800-SEC-0330. Copies of the fund’s Form N-Q also may be obtained, upon payment of a duplicating fee, by electronic request at the following e-mail address: publicinfo@sec.gov or by writing the Public Reference Section at the above address.
From time to time, MFS may post important information about the fund or the MFS funds on the MFS web site (mfs.com). This information is available by visiting the “News & Commentary” section of mfs.com or by clicking on the fund’s name under “Variable Insurance Portfolios — VIT II” in the “Products and Performance” section of mfs.com.
FEDERAL TAX INFORMATION (unaudited)
The following information is provided pursuant to provisions of the Internal Revenue Code.
For corporate shareholders, 100% of the ordinary income dividends paid during the fiscal year qualify for the corporate dividends received deduction.
The fund designates $37,155,000 as capital gain dividends paid during the fiscal year.
28
Table of Contents
rev. 3/11

| Why? | Financial companies choose how they share your personal information. Federal law gives consumers the right to limit some but not all sharing. Federal law also requires us to tell you how we collect, share, and protect your personal information. Please read this notice carefully to understand what we do. |
| What? | The types of personal information we collect and share depend on the product or service you have with us. This information can include:
• Social Security number and account balances • Account transactions and transaction history • Checking account information and wire transfer instructions
When you are no longer our customer, we continue to share your information as described in this notice. |
| How? | All financial companies need to share customers’ personal information to run their everyday business. In the section below, we list the reasons financial companies can share their customers’ personal information; the reasons MFS chooses to share; and whether you can limit this sharing. |
| Reasons we can share your personal information | Does MFS share? | Can you limit this sharing? | ||
For our everyday business purposes – such as to process your transactions, maintain your account(s), respond to court orders and legal investigations, or report to credit bureaus | Yes | No | ||
For our marketing purposes – to offer our products and services to you | No | We don’t share | ||
| For joint marketing with other financial companies | No | We don’t share | ||
For our affiliates’ everyday business purposes – information about your transactions and experiences | No | We don’t share | ||
For our affiliates’ everyday business purposes – information about your creditworthiness | No | We don’t share | ||
| For nonaffiliates to market to you | No | We don’t share |
| Questions? | Call 800-225-2606 or go to mfs.com. |
29
Table of Contents
| Page 2 |
| Who we are | ||
| Who is providing this notice? | MFS Funds, MFS Investment Management, MFS Institutional Advisors, Inc., MFS Fund Distributors, Inc., MFS Heritage Trust Company, and MFS Service Center, Inc. | |
| What we do | ||
| How does MFS protect my personal information? | To protect your personal information from unauthorized access and use, we use security measures that comply with federal law. These measures include procedural, electronic, and physical safeguards for the protection of the personal information we collect about you. | |
| How does MFS collect my personal information? | We collect your personal information, for example, when you
• open an account or provide account information • direct us to buy securities or direct us to sell your securities • make a wire transfer
We also collect your personal information from others, such as credit bureaus, affiliates and other companies. | |
| Why can’t I limit all sharing? | Federal law gives you the right to limit only
• sharing for affiliates’ everyday business purposes – information about your creditworthiness • affiliates from using your information to market to you • sharing for nonaffiliates to market to you
State laws and individual companies may give you additional rights to limit sharing. | |
| Definitions | ||
| Affiliates | Companies related by common ownership or control. They can be financial and nonfinancial companies.
• MFS does not share personal information with affiliates, except for everyday business purposes as described on page one of this notice. | |
| Nonaffiliates | Companies not related by common ownership or control. They can be financial and nonfinancial companies.
• MFS does not share with nonaffiliates so they can market to you. | |
| Joint Marketing | A formal agreement between nonaffiliated financial companies that together market financial products or services to you.
• MFS doesn’t jointly market. | |
| Other important information | ||
| If you own an MFS product or receive an MFS service in the name of a third party such as a bank or broker-dealer, their privacy policy may apply to you instead of ours. | ||
30
Table of Contents

Table of Contents

MFS® Core Equity Portfolio
MFS® Variable Insurance Trust II

ANNUAL REPORT
December 31, 2011
RGS-ANN
Table of Contents
MFS® CORE EQUITY PORTFOLIO
The report is prepared for the general information of contract owners.
It is authorized for distribution to prospective investors only when preceded or accompanied by a current prospectus.
NOT FDIC INSURED Ÿ MAY LOSE VALUE Ÿ NO BANK OR CREDIT UNION GUARANTEE Ÿ NOT A DEPOSIT Ÿ NOT INSURED BY ANY FEDERAL GOVERNMENT AGENCY OR NCUA/NCUSIF
Table of Contents
MFS Core Equity Portfolio
LETTER FROM THE CHAIRMAN AND CEO

Dear Contract Owners:
We are indeed living through some volatile times. Economic uncertainty is everywhere, as it seems no place in the world has been unmoved by crisis. We have seen a devastating earthquake and tsunami that have led to disruptions in the Japanese markets
and supply chains. Protests have changed the face of the Middle East and left in their wake lingering tensions and resultant higher oil prices. We have seen debt limits tested in Europe and the United States and policymakers grappling to craft often unpopular monetary and fiscal responses at a time when consumers and businesses struggle with what appears to be a slowing global economy. On top of all of that, we have seen long-term U.S. debt lose its Standard & Poor’s AAA rating and the long-term debt ratings of 15 eurozone nations put on negative watch.
When markets become volatile, managing risk becomes a top priority for investors and their advisors. At MFS® risk management is foremost in our minds in all market climates. Our analysts and portfolio managers keep risks firmly in mind when evaluating securities. Additionally, we have a team of quantitative analysts that measures and assesses the risk profiles of our portfolios and securities on an ongoing basis. The chief investment risk officer, who oversees the team, reports directly to the firm’s president and chief investment officer so the risk associated with each portfolio can be assessed objectively and independently of the portfolio management team.
As always, we continue to be mindful of the many economic challenges faced at the local, national, and international levels. It is in times such as these that we want to remind investors of the merits of maintaining a long-term view, adhering to basic investing principles such as asset allocation and diversification, and working closely with their advisors to research and identify appropriate investment opportunities.
Respectfully,

Robert J. Manning
Chairman and Chief Executive Officer
MFS Investment Management®
February 15, 2012
The opinions expressed in this letter are subject to change, may not be relied upon for investment advice, and no forecasts can be guaranteed.
1
Table of Contents
MFS Core Equity Portfolio
Portfolio structure (i)
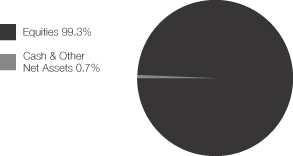
| Top ten holdings (i) | ||||
| Apple, Inc. | 4.3% | |||
| Exxon Mobil Corp. | 3.3% | |||
| Danaher Corp. | 2.1% | |||
| JPMorgan Chase & Co. | 2.1% | |||
| Chevron Corp. | 2.0% | |||
| Google, Inc., “A” | 1.9% | |||
| Philip Morris International, Inc. | 1.7% | |||
| Pfizer, Inc. | 1.7% | |||
| Target Corp. | 1.6% | |||
| ACE Ltd. | 1.5% |
| Equity sectors (i) | ||||
| Technology | 15.8% | |||
| Financial Services | 15.4% | |||
| Health Care | 12.1% | |||
| Energy | 11.0% | |||
| Industrial Goods & Services | 8.7% | |||
| Consumer Staples | 8.0% | |||
| Retailing | 7.2% | |||
| Utilities & Communications | 7.0% | |||
| Leisure | 4.8% | |||
| Basic Materials | 3.5% | |||
| Special Products & Services | 2.5% | |||
| Transportation | 2.0% | |||
| Autos & Housing | 1.3% |
| (i) | For purposes of this presentation, the components include the market value of securities and reflect the impact of the equivalent exposure of derivative positions. These amounts may be negative from time to time. Equivalent exposure is a calculated amount that translates the derivative position into a reasonable approximation of the amount of the underlying asset that the portfolio would have to hold at a given point in time to have the same price sensitivity that results from the portfolio’s ownership of the derivative contract. When dealing with derivatives, equivalent exposure is a more representative measure of the potential impact of a position on portfolio performance than market value. |
Percentages are based on net assets as of 12/31/11.
The portfolio is actively managed and current holdings may be different.
2
Table of Contents
MFS Core Equity Portfolio
Summary of Results
For the twelve months ended December 31, 2011, Initial Class shares of the MFS Core Equity Portfolio (the “fund”) provided a total return of –0.94%, while Service Class shares of the fund provided a total return of –1.25%. These compare with a return of 1.03% for the fund’s benchmark, the Russell 3000 Index.
Market Environment
Early in the period, the U.S. Federal Reserve (the “Fed”) responded to weak economic growth by loosening monetary policy further. More easing by the Fed improved market sentiment and drove risk-asset prices markedly higher. The December 2010 agreement on a surprisingly large (relative to expectations) expansionary U.S. fiscal package also boosted sentiment. During the subsequent several months, the renewed positive market sentiment, coupled with better indications of global macroeconomic activity, pushed many asset valuations to post-crisis highs. At the same time, the yields of the perceived “safest” global sovereign credits rose, indicating a renewed risk-seeking environment.
However, towards the middle of the period, a weakening macroeconomic backdrop and renewed concerns over peripheral euro zone sovereign debt caused a flight-to-quality move that pushed high-quality sovereign bond yields lower. In the U.S., concerns about sovereign debt default and the long-term sustainability of the trend in U.S. fiscal policy resulted in one agency downgrading U.S. credit quality. Amidst this turmoil, global equity markets declined sharply. As a result of these developments, global consumer and producer sentiment indicators fell precipitously and highly-rated sovereign bond yields hit multi-decade lows. Towards the end of the reporting period, uncertainty in financial markets spiked higher as markets more seriously contemplated the possible failure of the euro zone.
Detractors from Performance
Stock selection in the health care sector was a major detractor from performance relative to the Russell 3000 Index. Within this sector, the fund’s ownership in shares of specialty pharmaceutical and medication delivery device supplier Hospira Inc. (h) hurt results as the company underperformed the benchmark. Hospira’s stock price plunged after reporting that a quality-improvement initiative led to production issues which negatively affected the firm’s operating margin.
Security selection in both the consumer staples and special products and services sectors also held back relative performance. In the consumer staples sector, the fund’s holdings of cosmetics and beauty supply company Avon Products (h) weighed on relative performance as the stock slumped over the reporting period. Shares of Avon came under pressure after posting disappointing results in the second quarter and over concerns of the company’s weak organic sales growth. There were no individual stocks in the special products and services sector that were among the fund’s top relative detractors for the period.
Other top relative detractors during the reporting period included the fund’s holdings of project management provider Fluor, global automaker General Motors, semiconductor company Advanced Micro Devices, diversified mining company Teck Resources (b), investment banking firm Goldman Sachs Group, and fiber optics manufacturer Finisar. The fund’s overweight positions in global financial services firm JPMorgan Chase and retail store operator Target also weighed on results.
Contributors to Performance
Security selection in the basic materials sector was a positive factor for performance relative to the benchmark. The fund’s ownership in shares of industrial, medical, and specialty gases distributor Airgas Inc. and containers manufacturer Graham Packaging (h) aided relative results as both stocks outperformed the benchmark. Shares of Graham Packaging soared on the announcement of the company’s sale to packaging and storage product company Reynolds Group Holdings that was completed in the third quarter of 2011.
3
Table of Contents
MFS Core Equity Portfolio
Management Review – continued
Individual stocks in other sectors that benefited relative performance included computer and personal electronics maker Apple, railroad company Kansas City Southern, pharmaceutical and medical products maker Abbott Laboratories, fast-food giant McDonald’s, and global payments technology company Visa. Closing out of the fund’s position in poor-performing computer products and service provider Hewlett-Packard Co. (h) , and eliminating exposure to financial services firm Bank of America (h), also helped relative performance. Shares of Bank of America underperformed the benchmark as Europe’s mounting sovereign debt crisis put pressure on most financial companies.
Respectfully,
Joseph MacDougall
Portfolio Manager
Note to Contract Owners: Katrina Mead is no longer a co-manager of the fund.
| (b) | Security is not a benchmark constituent. |
| (h) | Security was not held in the fund at period end. |
The views expressed in this report are those of the portfolio manager only through the end of the period of the report as stated on the cover and do not necessarily reflect the views of MFS or any other person in the MFS organization. These views are subject to change at any time based on market or other conditions, and MFS disclaims any responsibility to update such views. These views may not be relied upon as investment advice or an indication of trading intent on behalf of any MFS portfolio. References to specific securities are not recommendations of such securities, and may not be representative of any MFS portfolio’s current or future investments.
4
Table of Contents
MFS Core Equity Portfolio
PERFORMANCE SUMMARY THROUGH 12/31/11
The following chart illustrates the historical performance of the fund in comparison to its benchmark(s). Benchmarks are unmanaged and may not be invested in directly. Benchmark returns do not reflect any fees or expenses. The performance of other share classes will be greater than or less than that of the class depicted below. (See Notes to Performance Summary.)
Performance data shown represents past performance and is no guarantee of future results. Investment return and principal value fluctuate so your units, when sold, may be worth more or less than the original cost; current performance may be lower or higher than quoted. The performance shown does not reflect the deduction of taxes, if any, that a contract holder would pay on fund distributions or the redemption of contract units. The returns for the fund shown also do not reflect the deduction of expenses associated with variable products, such as mortality and expense risk charges, separate account charges, and sales charges imposed by the insurance company separate accounts. Such expenses would reduce the overall returns shown.
Growth of a Hypothetical $10,000 Investment
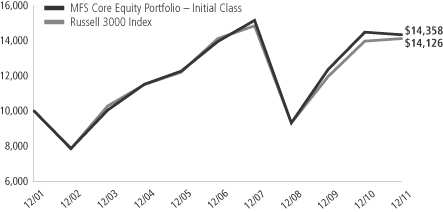
Total Returns through 12/31/11
Average annual total returns
| Share class | Class inception date | 1-yr | 5-yr | 10-yr | ||||||||
| Initial Class | 5/12/97 | (0.94)% | 0.56% | 3.68% | ||||||||
| Service Class | 8/24/01 | (1.25)% | 0.29% | 3.42% | ||||||||
| Comparative benchmark | ||||||||||||
| Russell 3000 Index (f) | 1.03% | (0.01)% | 3.51% | |||||||||
| (f) | Source: FactSet Research Systems Inc. |
Benchmark Definition
Russell 3000 Index – constructed to provide a comprehensive barometer for the 3,000 largest U.S. companies based on total market capitalization, which represents approximately 98% of the investable U.S. equity market.
It is not possible to invest directly in an index.
Notes to Performance Summary
Average annual total return represents the average annual change in value for each share class for the periods presented.
Performance results reflect any applicable expense subsidies and waivers in effect during the periods shown. Without such subsidies and waivers the fund’s performance results would be less favorable. Please see the prospectus and financial statements for complete details. All results are historical and assume the reinvestment of any dividends and capital gains distributions.
Performance results do not include adjustments made for financial reporting purposes in accordance with U.S. generally accepted accounting principles and may differ from amounts reported in the financial highlights.
From time to time the fund may receive proceeds from litigation settlements, without which performance would be lower.
5
Table of Contents
MFS Core Equity Portfolio
Fund Expenses Borne by the Contract Holders During the Period,
July 1, 2011 through December 31, 2011
As a contract holder of the fund, you incur ongoing costs, including management fees; distribution and/or service (12b-1) fees; and other fund expenses. This example is intended to help you understand your ongoing costs (in dollars) of investing in the fund and to compare these costs with the ongoing costs of investing in other mutual funds.
The example is based on an investment of $1,000 invested at the beginning of the period and held for the entire period July 1, 2011 through December 31, 2011.
Actual Expenses
The first line for each share class in the following table provides information about actual account values and actual expenses. You may use the information in this line, together with the amount you invested, to estimate the expenses that you paid over the period. Simply divide your account value by $1,000 (for example, an $8,600 account value divided by $1,000 = 8.6), then multiply the result by the number in the first line under the heading entitled “Expenses Paid During Period” to estimate the expenses you paid on your account during this period.
Hypothetical Example for Comparison Purposes
The second line for each share class in the following table provides information about hypothetical account values and hypothetical expenses based on the fund’s actual expense ratio and an assumed rate of return of 5% per year before expenses, which is not the fund’s actual return. The hypothetical account values and expenses may not be used to estimate the actual ending account balance or expenses you paid for the period. You may use this information to compare the ongoing costs of investing in the fund and other funds. To do so, compare this 5% hypothetical example with the 5% hypothetical examples that appear in the shareholder reports of the other funds.
Please note that the expenses shown in the table are meant to highlight the fund’s ongoing costs only and do not take into account the fees and expenses imposed under the variable contracts through which your investment in the fund is made. Therefore, the second line for each share class in the table is useful in comparing ongoing costs associated with an investment in vehicles (such as the fund) which fund benefits under variable annuity and variable life insurance contracts and to qualified pension and retirement plans only, and will not help you determine the relative total costs of investing in the fund through variable annuity and variable life insurance contracts. If the fees and expenses imposed under the variable contracts were included, your costs would have been higher.
| Share Class | Annualized Expense Ratio | Beginning Account Value 7/01/11 | Ending 12/31/11 | Expenses Paid During Period (p) 7/01/11-12/31/11 | ||||||||||||||
| Initial Class | Actual | 0.87% | $1,000.00 | $941.02 | $4.26 | |||||||||||||
| Hypothetical (h) | 0.87% | $1,000.00 | $1,020.82 | $4.43 | ||||||||||||||
| Service Class | Actual | 1.12% | $1,000.00 | $939.59 | $5.48 | |||||||||||||
| Hypothetical (h) | 1.12% | $1,000.00 | $1,019.56 | $5.70 | ||||||||||||||
| (h) | 5% class return per year before expenses. |
| (p) | Expenses paid is equal to each class’ annualized expense ratio, as shown above, multiplied by the average account value over the period, multiplied by the number of days in the period, divided by the number of days in the year. |
6
Table of Contents
MFS Core Equity Portfolio
PORTFOLIO OF INVESTMENTS – 12/31/11
The Portfolio of Investments is a complete list of all securities owned by your fund. It is categorized by broad-based asset classes.
| Issuer | Shares/Par | Value ($) | ||||||
| COMMON STOCKS – 98.7% | ||||||||
| Aerospace – 2.8% | ||||||||
| Boeing Co. | 5,200 | $ | 381,420 | |||||
| Honeywell International, Inc. | 17,200 | 934,820 | ||||||
| Lockheed Martin Corp. | 5,760 | 465,984 | ||||||
| Precision Castparts Corp. | 3,750 | 617,962 | ||||||
| Textron, Inc. | 12,430 | 229,831 | ||||||
| United Technologies Corp. | 14,780 | 1,080,270 | ||||||
|
| |||||||
| $ | 3,710,287 | |||||||
|
| |||||||
| Apparel Manufacturers – 0.8% | ||||||||
| NIKE, Inc., “B” | 6,860 | $ | 661,098 | |||||
| VF Corp. | 3,020 | 383,510 | ||||||
|
| |||||||
| $ | 1,044,608 | |||||||
|
| |||||||
| Automotive – 0.8% | ||||||||
| Delphi Automotive PLC (a) | 15,540 | $ | 334,732 | |||||
| General Motors Co. (a) | 24,550 | 497,629 | ||||||
| LKQ Corp. (a) | 6,500 | 195,520 | ||||||
|
| |||||||
| $ | 1,027,881 | |||||||
|
| |||||||
| Biotechnology – 1.7% | ||||||||
| Amgen, Inc. | 10,360 | $ | 665,215 | |||||
| Anacor Pharmaceuticals, Inc. (a) | 30,260 | 187,612 | ||||||
| Gilead Sciences, Inc. (a) | 35,360 | 1,447,285 | ||||||
|
| |||||||
| $ | 2,300,112 | |||||||
|
| |||||||
| Broadcasting – 1.5% | ||||||||
| News Corp., “A” | 48,380 | $ | 863,099 | |||||
| Viacom, Inc., “B” | 25,990 | 1,180,206 | ||||||
|
| |||||||
| $ | 2,043,305 | |||||||
|
| |||||||
| Brokerage & Asset Managers – 1.2% | ||||||||
| Affiliated Managers Group, Inc. (a) | 2,680 | $ | 257,146 | |||||
| Blackrock, Inc. | 1,743 | 310,672 | ||||||
| CME Group, Inc. | 1,540 | 375,252 | ||||||
| Franklin Resources, Inc. | 2,300 | 220,938 | ||||||
| FXCM, Inc. “A” | 22,060 | 215,085 | ||||||
| GFI Group, Inc. | 44,460 | 183,175 | ||||||
|
| |||||||
| $ | 1,562,268 | |||||||
|
| |||||||
| Business Services – 1.7% | ||||||||
| Accenture PLC, “A” | 9,350 | $ | 497,701 | |||||
| Automatic Data Processing, Inc. | 12,630 | 682,146 | ||||||
| FleetCor Technologies, Inc. (a) | 26,480 | 790,958 | ||||||
| Jones Lang LaSalle, Inc. | 5,610 | 343,669 | ||||||
|
| |||||||
| $ | 2,314,474 | |||||||
|
| |||||||
| Cable TV – 1.2% | ||||||||
| Comcast Corp., “Special A” | 35,700 | $ | 841,092 | |||||
| DIRECTV, “A” (a) | 11,480 | 490,885 | ||||||
| Time Warner Cable, Inc. | 4,290 | 272,715 | ||||||
|
| |||||||
| $ | 1,604,692 | |||||||
|
| |||||||
| Chemicals – 0.5% | ||||||||
| Celanese Corp. | 14,940 | $ | 661,394 | |||||
|
| |||||||
| Issuer | Shares/Par | Value ($) | ||||||
| COMMON STOCKS – continued | ||||||||
| Computer Software – 3.4% | ||||||||
| Autodesk, Inc. (a) | 24,610 | $ | 746,421 | |||||
| Check Point Software Technologies Ltd. (a) | 14,220 | 747,119 | ||||||
| Oracle Corp. | 65,330 | 1,675,715 | ||||||
| Red Hat, Inc. (a) | 18,900 | 780,381 | ||||||
| VeriSign, Inc. | 17,240 | 615,813 | ||||||
|
| |||||||
| $ | 4,565,449 | |||||||
|
| |||||||
| Computer Software – Systems – 6.9% | ||||||||
| Apple, Inc. (a)(s) | 14,120 | $ | 5,718,600 | |||||
| EMC Corp. (a) | 55,000 | 1,184,700 | ||||||
| International Business Machines Corp. | 10,440 | 1,919,707 | ||||||
| NICE Systems Ltd., ADR (a) | 11,380 | 392,041 | ||||||
|
| |||||||
| $ | 9,215,048 | |||||||
|
| |||||||
| Construction – 0.5% | ||||||||
| Owens Corning (a) | 16,130 | $ | 463,254 | |||||
| Stanley Black & Decker, Inc. | 3,980 | 269,048 | ||||||
|
| |||||||
| $ | 732,302 | |||||||
|
| |||||||
| Consumer Products – 1.8% | ||||||||
| Colgate-Palmolive Co. | 15,160 | $ | 1,400,632 | |||||
| Procter & Gamble Co. | 15,380 | 1,026,000 | ||||||
|
| |||||||
| $ | 2,426,632 | |||||||
|
| |||||||
| Consumer Services – 0.8% | ||||||||
| DeVry, Inc. | 8,920 | $ | 343,063 | |||||
| HomeAway, Inc. (a) | 13,050 | 303,412 | ||||||
| Priceline.com, Inc. (a) | 990 | 463,033 | ||||||
|
| |||||||
| $ | 1,109,508 | |||||||
|
| |||||||
| Containers – 0.5% | ||||||||
| Silgan Holdings, Inc. | 18,340 | $ | 708,658 | |||||
|
| |||||||
| Electrical Equipment – 3.2% | ||||||||
| AMETEK, Inc. | 9,420 | $ | 396,582 | |||||
| Amphenol Corp., “A” | 12,420 | 563,744 | ||||||
| Danaher Corp. | 58,670 | 2,759,837 | ||||||
| Sensata Technologies Holding B.V. (a) | 19,170 | 503,788 | ||||||
|
| |||||||
| $ | 4,223,951 | |||||||
|
| |||||||
| Electronics – 2.3% | ||||||||
| Advanced Micro Devices, Inc. (a) | 26,209 | $ | 141,529 | |||||
| Altera Corp. | 16,950 | 628,845 | ||||||
| ASML Holding N.V. | 12,960 | 541,598 | ||||||
| Hittite Microwave Corp. (a) | 7,420 | 366,400 | ||||||
| KLA-Tencor Corp. | 4,610 | 222,433 | ||||||
| Linear Technology Corp. | 8,820 | 264,865 | ||||||
| Microchip Technology, Inc. | 23,560 | 863,003 | ||||||
|
| |||||||
| $ | 3,028,673 | |||||||
|
| |||||||
| Energy – Independent – 3.9% | ||||||||
| Apache Corp. | 6,600 | $ | 597,828 | |||||
| Arch Coal, Inc. | 7,440 | 107,954 | ||||||
| Cabot Oil & Gas Corp. | 5,400 | 409,860 | ||||||
7
Table of Contents
MFS Core Equity Portfolio
Portfolio of Investments – continued
| Issuer | Shares/Par | Value ($) | ||||||
| COMMON STOCKS – continued | ||||||||
| Energy – Independent – continued | ||||||||
| Canadian Natural Resources Ltd. | 4,940 | $ | 184,992 | |||||
| CONSOL Energy, Inc. | 3,040 | 111,568 | ||||||
| Energy XXI (Bermuda) Ltd. (a) | 8,472 | 270,087 | ||||||
| EQT Corp. | 4,960 | 271,758 | ||||||
| Marathon Oil Corp. | 11,300 | 330,751 | ||||||
| Marathon Petroleum Corp. | 5,655 | 188,255 | ||||||
| Noble Energy, Inc. | 6,610 | 623,918 | ||||||
| Occidental Petroleum Corp. | 13,420 | 1,257,454 | ||||||
| Peabody Energy Corp. | 3,270 | 108,270 | ||||||
| Pioneer Natural Resources Co. | 2,370 | 212,068 | ||||||
| QEP Resources, Inc. | 4,030 | 118,079 | ||||||
| SM Energy Co. | 4,442 | 324,710 | ||||||
| Walter Energy, Inc. | 1,510 | 91,446 | ||||||
|
| |||||||
| $ | 5,208,998 | |||||||
|
| |||||||
| Energy – Integrated – 5.3% | ||||||||
| Chevron Corp. | 24,520 | $ | 2,608,928 | |||||
| Exxon Mobil Corp. (s) | 52,416 | 4,442,780 | ||||||
|
| |||||||
| $ | 7,051,708 | |||||||
|
| |||||||
| Engineering – Construction – 1.1% | ||||||||
| Fluor Corp. | 28,720 | $ | 1,443,180 | |||||
|
| |||||||
| Food & Beverages – 3.9% | ||||||||
| Bunge Ltd. | 11,550 | $ | 660,660 | |||||
| Coca-Cola Enterprises, Inc. | 9,640 | 248,519 | ||||||
| General Mills, Inc. | 25,200 | 1,018,332 | ||||||
| Kraft Foods, Inc., “A” | 30,040 | 1,122,294 | ||||||
| Mead Johnson Nutrition Co., “A” | 9,180 | 630,941 | ||||||
| PepsiCo, Inc. (s) | 23,477 | 1,557,699 | ||||||
|
| |||||||
| $ | 5,238,445 | |||||||
|
| |||||||
| Food & Drug Stores – 1.1% | ||||||||
| CVS Caremark Corp. | 26,440 | $ | 1,078,223 | |||||
| Kroger Co. | 13,880 | 336,174 | ||||||
|
| |||||||
| $ | 1,414,397 | |||||||
|
| |||||||
| Gaming & Lodging – 0.7% | ||||||||
| Las Vegas Sands Corp. (a) | 10,690 | $ | 456,784 | |||||
| Royal Caribbean Cruises Ltd. | 20,140 | 498,868 | ||||||
|
| |||||||
| $ | 955,652 | |||||||
|
| |||||||
| General Merchandise – 2.3% | ||||||||
| Kohl’s Corp. | 19,090 | $ | 942,092 | |||||
| Target Corp. | 42,430 | 2,173,265 | ||||||
|
| |||||||
| $ | 3,115,357 | |||||||
|
| |||||||
| Health Maintenance Organizations – 1.0% | ||||||||
| Aetna, Inc. | 23,180 | $ | 977,964 | |||||
| WellPoint, Inc. | 5,040 | 333,900 | ||||||
|
| |||||||
| $ | 1,311,864 | |||||||
|
| |||||||
| Insurance – 3.6% | ||||||||
| ACE Ltd. | 28,050 | $ | 1,966,866 | |||||
| Aflac, Inc. | 2,610 | 112,909 | ||||||
| Aon Corp. | 18,610 | 870,948 | ||||||
| Chubb Corp. | 8,680 | 600,830 | ||||||
| Issuer | Shares/Par | Value ($) | ||||||
| COMMON STOCKS – continued | ||||||||
| Insurance – continued | ||||||||
| Hartford Financial Services Group, Inc. | 14,360 | $ | 233,350 | |||||
| MetLife, Inc. | 13,760 | 429,037 | ||||||
| Prudential Financial, Inc. | 7,880 | 394,946 | ||||||
| Willis Group Holdings PLC | 5,970 | 231,636 | ||||||
|
| |||||||
| $ | 4,840,522 | |||||||
|
| |||||||
| Internet – 2.2% | ||||||||
| Google, Inc., “A” (a) | 3,960 | $ | 2,557,764 | |||||
| QuinStreet, Inc. (a) | 44,340 | 415,022 | ||||||
|
| |||||||
| $ | 2,972,786 | |||||||
|
| |||||||
| Leisure & Toys – 0.2% | ||||||||
| Hasbro, Inc. | 9,400 | $ | 299,766 | |||||
|
| |||||||
| Machinery & Tools – 1.4% | ||||||||
| Cummins, Inc. | 3,340 | $ | 293,987 | |||||
| Flowserve Corp. | 4,690 | 465,811 | ||||||
| Joy Global, Inc. | 8,260 | 619,252 | ||||||
| WABCO Holdings, Inc. (a) | 11,470 | 497,798 | ||||||
|
| |||||||
| $ | 1,876,848 | |||||||
|
| |||||||
| Major Banks – 4.6% | ||||||||
| Bank of New York Mellon Corp. | 37,285 | $ | 742,344 | |||||
| Goldman Sachs Group, Inc. | 10,820 | 978,453 | ||||||
| JPMorgan Chase & Co. (s) | 82,700 | 2,749,775 | ||||||
| PNC Financial Services Group, Inc. | 24,490 | 1,412,338 | ||||||
| SunTrust Banks, Inc. | 11,590 | 205,143 | ||||||
|
| |||||||
| $ | 6,088,053 | |||||||
|
| |||||||
| Medical & Health Technology & Services – 1.3% | ||||||||
| AmerisourceBergen Corp. | 11,450 | $ | 425,826 | |||||
| Cross Country Healthcare, Inc. (a) | 83,100 | 461,205 | ||||||
| Express Scripts, Inc. (a) | 10,660 | 476,395 | ||||||
| Henry Schein, Inc. (a) | 3,070 | 197,800 | ||||||
| Quest Diagnostics, Inc. | 2,330 | 135,280 | ||||||
|
| |||||||
| $ | 1,696,506 | |||||||
|
| |||||||
| Medical Equipment – 2.8% | ||||||||
| Covidien PLC | 16,580 | $ | 746,266 | |||||
| Heartware International, Inc. (a) | 4,270 | 294,630 | ||||||
| Medtronic, Inc. | 22,590 | 864,068 | ||||||
| NxStage Medical, Inc. (a) | 36,496 | 648,899 | ||||||
| NxStage Medical, Inc. (a) | 10,674 | 189,784 | ||||||
| Sirona Dental Systems, Inc. (a) | 3,770 | 166,031 | ||||||
| St. Jude Medical, Inc. | 12,970 | 444,871 | ||||||
| Thermo Fisher Scientific, Inc. (a) | 7,500 | 337,275 | ||||||
|
| |||||||
| $ | 3,691,824 | |||||||
|
| |||||||
| Metals & Mining – 0.6% | ||||||||
| Cliffs Natural Resources, Inc. | 6,840 | $ | 426,474 | |||||
| Teck Resources Ltd., “B” | 11,259 | 396,869 | ||||||
|
| |||||||
| $ | 823,343 | |||||||
|
| |||||||
| Natural Gas – Distribution – 0.6% | ||||||||
| AGL Resources, Inc. | 12,090 | $ | 510,923 | |||||
| ONEOK, Inc. | 3,600 | 312,084 | ||||||
|
| |||||||
| $ | 823,007 | |||||||
|
| |||||||
8
Table of Contents
MFS Core Equity Portfolio
Portfolio of Investments – continued
| Issuer | Shares/Par | Value ($) | ||||||
| COMMON STOCKS – continued | ||||||||
| Natural Gas – Pipeline – 0.4% | ||||||||
| Kinder Morgan, Inc. | 17,970 | $ | 578,095 | |||||
|
| |||||||
| Network & Telecom – 1.0% | ||||||||
| Acme Packet, Inc. (a) | 8,990 | $ | 277,881 | |||||
| F5 Networks, Inc. (a) | 3,740 | 396,889 | ||||||
| Finisar Corp. (a) | 16,820 | 281,651 | ||||||
| Fortinet, Inc. (a) | 17,490 | 381,457 | ||||||
|
| |||||||
| $ | 1,337,878 | |||||||
|
| |||||||
| Oil Services – 1.8% | ||||||||
| Cameron International Corp. (a) | 14,990 | $ | 737,358 | |||||
| Dresser-Rand Group, Inc. (a) | 3,980 | 198,642 | ||||||
| Halliburton Co. | 9,700 | 334,747 | ||||||
| Schlumberger Ltd. | 14,170 | 967,953 | ||||||
| Transocean, Inc. | 4,860 | 186,575 | ||||||
|
| |||||||
| $ | 2,425,275 | |||||||
|
| |||||||
| Other Banks & Diversified Financials – 3.1% | ||||||||
| American Express Co. | 5,330 | $ | 251,416 | |||||
| BankUnited, Inc. | 11,500 | 252,885 | ||||||
| Brookline Bancorp, Inc. | 30,110 | 254,128 | ||||||
| CapitalSource, Inc. | 64,010 | 428,867 | ||||||
| EuroDekania Ltd. (a)(z) | 100,530 | 252,783 | ||||||
| Fifth Third Bancorp | 44,250 | 562,860 | ||||||
| Prosperity Bancshares, Inc. | 6,210 | 250,573 | ||||||
| Visa, Inc., “A” | 12,960 | 1,315,829 | ||||||
| Western Union Co. | 15,150 | 276,639 | ||||||
| Zions Bancorporation | 17,670 | 287,668 | ||||||
|
| |||||||
| $ | 4,133,648 | |||||||
|
| |||||||
| Pharmaceuticals – 5.3% | ||||||||
| Abbott Laboratories | 32,640 | $ | 1,835,347 | |||||
| Johnson & Johnson | 19,590 | 1,284,712 | ||||||
| Merck & Co., Inc. | 27,500 | 1,036,750 | ||||||
| Pfizer, Inc. | 102,102 | 2,209,487 | ||||||
| Teva Pharmaceutical Industries Ltd., ADR | 17,370 | 701,053 | ||||||
|
| |||||||
| $ | 7,067,349 | |||||||
|
| |||||||
| Pollution Control – 0.2% | ||||||||
| Waste Connections, Inc. | 8,140 | $ | 269,760 | |||||
|
| |||||||
| Precious Metals & Minerals – 0.4% | ||||||||
| Goldcorp, Inc. | 10,960 | $ | 484,980 | |||||
|
| |||||||
| Printing & Publishing – 0.4% | ||||||||
| Moody’s Corp. | 17,650 | $ | 594,452 | |||||
|
| |||||||
| Railroad & Shipping – 0.8% | ||||||||
| Kansas City Southern Co. (a) | 16,260 | $ | 1,105,843 | |||||
|
| |||||||
| Real Estate – 2.9% | ||||||||
| BioMed Realty Trust, Inc., REIT | 13,970 | $ | 252,578 | |||||
| Mid-America Apartment Communities, Inc., REIT | 17,240 | 1,078,362 | ||||||
| Public Storage, Inc., REIT | 9,510 | 1,278,715 | ||||||
| Tanger Factory Outlet Centers, Inc., REIT | 43,990 | 1,289,787 | ||||||
|
| |||||||
| $ | 3,899,442 | |||||||
|
| |||||||
| Issuer | Shares/Par | Value ($) | ||||||
| COMMON STOCKS – continued | ||||||||
| Restaurants – 0.8% | ||||||||
| McDonald’s Corp. | 10,930 | $ | 1,096,607 | |||||
|
| |||||||
| Specialty Chemicals – 1.5% | ||||||||
| Airgas, Inc. | 23,880 | $ | 1,864,550 | |||||
| Ferro Corp. (a) | 28,860 | 141,125 | ||||||
|
| |||||||
| $ | 2,005,675 | |||||||
|
| |||||||
| Specialty Stores – 3.0% | ||||||||
| Amazon.com, Inc. (a) | 4,790 | $ | 829,149 | |||||
| Home Depot, Inc. | 17,930 | 753,777 | ||||||
| PetSmart, Inc. | 17,560 | 900,652 | ||||||
| Tiffany & Co. | 5,770 | 382,320 | ||||||
| Tractor Supply Co. | 7,150 | 501,572 | ||||||
| Urban Outfitters, Inc. (a) | 23,760 | 654,826 | ||||||
|
| |||||||
| $ | 4,022,296 | |||||||
|
| |||||||
| Telecommunications – Wireless – 0.3% | ||||||||
| SBA Communications Corp. (a) | 8,790 | $ | 377,618 | |||||
|
| |||||||
| Telephone Services – 2.7% | ||||||||
| American Tower Corp., “A” (a) | 9,760 | $ | 585,697 | |||||
| AT&T, Inc. | 53,730 | 1,624,795 | ||||||
| CenturyLink, Inc. | 10,528 | 391,641 | ||||||
| Verizon Communications, Inc. | 25,420 | 1,019,850 | ||||||
|
| |||||||
| $ | 3,621,983 | |||||||
|
| |||||||
| Tobacco – 2.3% | ||||||||
| Lorillard, Inc. | 7,200 | $ | 820,800 | |||||
| Philip Morris International, Inc. | 28,630 | 2,246,882 | ||||||
|
| |||||||
| $ | 3,067,682 | |||||||
|
| |||||||
| Trucking – 1.2% | ||||||||
| Atlas Air Worldwide Holdings, Inc. (a) | 4,850 | $ | 186,385 | |||||
| Expeditors International of Washington, Inc. | 23,160 | 948,634 | ||||||
| Swift Transportation Co. (a) | 58,110 | 478,826 | ||||||
|
| |||||||
| $ | 1,613,845 | |||||||
|
| |||||||
| Utilities – Electric Power – 2.4% | ||||||||
| AES Corp. (a) | 34,730 | $ | 411,203 | |||||
| American Electric Power Co., Inc. | 18,070 | 746,472 | ||||||
| Calpine Corp. (a) | 25,350 | 413,965 | ||||||
| CMS Energy Corp. | 28,000 | 618,240 | ||||||
| PG&E Corp. | 10,750 | 443,115 | ||||||
| Public Service Enterprise Group, Inc. | 17,130 | 565,461 | ||||||
|
| |||||||
| $ | 3,198,456 | |||||||
|
| |||||||
| Total Common Stocks (Identified Cost, $126,425,620) | $ | 132,032,382 | ||||||
|
| |||||||
| CONVERTIBLE PREFERRED STOCKS – 0.6% | ||||||||
| Utilities – Electric Power – 0.6% | ||||||||
| PPL Corp., 8.75% | 7,350 | $ | 407,925 | |||||
| PPL Corp., 9.5% | 8,010 | 447,198 | ||||||
|
| |||||||
| Total Convertible Preferred Stocks (Identified Cost, $780,978) | $ | 855,123 | ||||||
|
| |||||||
9
Table of Contents
MFS Core Equity Portfolio
Portfolio of Investments – continued
| Issuer | Shares/Par | Value ($) | ||||||
| MONEY MARKET FUNDS – 0.6% | ||||||||
| MFS Institutional Money Market Portfolio, 0.05%, at Cost and Net Asset Value (v) | 757,029 | $ | 757,029 | |||||
|
| |||||||
| Total Investments (Identified Cost, $127,963,627) | $ | 133,644,534 | ||||||
|
| |||||||
| Issuer/Expiration Date/ Strike Price | Number of Contracts | Value ($) | ||||||
| PUT OPTIONS WRITTEN – 0.0% | ||||||||
| Computer Software – 0.0% | ||||||||
| CommVault Systems, Inc. – January 2012 @ $36 (Premiums Received, $3,850) | (36 | ) | $ | (1,260 | ) | |||
|
| |||||||
| OTHER ASSETS, LESS LIABILITIES – 0.1% | 68,685 | |||||||
|
| |||||||
| Net Assets – 100.0% | $ | 133,711,959 | ||||||
|
| |||||||
| (a) | Non-income producing security. |
| (s) | Security or a portion of the security was pledged to cover collateral requirements for securities sold short and/or certain derivative transactions. At December 31, 2011, the value of securities pledged amounted to $546,415. At December 31, 2011, the fund had no short sales outstanding. |
| (v) | Underlying affiliated fund that is available only to investment companies managed by MFS. The rate quoted for the MFS Institutional Money Market Portfolio is the annualized seven-day yield of the fund at period end. |
| (z) | Restricted securities are not registered under the Securities Act of 1933 and are subject to legal restrictions on resale. These securities generally may be resold in transactions exempt from registration or to the public if the securities are subsequently registered. Disposal of these securities may involve time-consuming negotiations and prompt sale at an acceptable price may be difficult. The fund holds the following restricted securities: |
| Restricted Securities | Acquisition Date | Cost | Value | |||||||
| EuroDekania Ltd. | 3/08/07-6/25/07 | $1,412,164 | $252,783 | |||||||
| % of Net assets | 0.2% | |||||||||
The following abbreviations are used in this report and are defined:
| ADR | American Depository Receipt |
| PLC | Public Limited Company |
| REIT | Real Estate Investment Trust |
See Notes to Financial Statements
10
Table of Contents
MFS Core Equity Portfolio
FINANCIAL STATEMENTS | STATEMENT OF ASSETS AND LIABILITIES
This statement represents your fund’s balance sheet, which details the assets and liabilities comprising the total value of the fund.
At 12/31/11 | ||||||||
Assets | ||||||||
Investments – | ||||||||
Non-affiliated issuers, at value (identified cost, $127,206,598) | $132,887,505 | |||||||
Underlying affiliated funds, at cost and value | 757,029 | |||||||
Total investments, at value (identified cost, $127,963,627) | $133,644,534 | |||||||
Cash | 37,600 | |||||||
Deposits with brokers | 2,541 | |||||||
Receivables for | ||||||||
Investments sold | 66,410 | |||||||
Interest and dividends | 142,248 | |||||||
Other assets | 4,182 | |||||||
Total assets | $133,897,515 | |||||||
Liabilities | ||||||||
Payables for | ||||||||
Investments purchased | $67,349 | |||||||
Fund shares reacquired | 63,736 | |||||||
Written options outstanding, at value (premiums received, $3,850) | 1,260 | |||||||
Payable to affiliates | ||||||||
Investment adviser | 8,626 | |||||||
Distribution and/or service fees | 768 | |||||||
Payable for Trustees’ compensation | 259 | |||||||
Accrued expenses and other liabilities | 43,558 | |||||||
Total liabilities | $185,556 | |||||||
Net assets | $133,711,959 | |||||||
Net assets consist of | ||||||||
Paid-in capital | $157,087,675 | |||||||
Unrealized appreciation (depreciation) on investments and translation of assets and liabilities in foreign currencies | 5,683,544 | |||||||
Accumulated net realized gain (loss) on investments and foreign currency transactions | (30,034,191 | ) | ||||||
Undistributed net investment income | 974,931 | |||||||
Net assets | $133,711,959 | |||||||
Shares of beneficial interest outstanding | 9,608,621 |
| Net assets | Shares outstanding | Net asset value per share | ||||||||||
Initial Class | $96,375,156 | 6,910,902 | $13.95 | |||||||||
Service Class | 37,336,803 | 2,697,719 | 13.84 | |||||||||
See Notes to Financial Statements
11
Table of Contents
MFS Core Equity Portfolio
FINANCIAL STATEMENTS | STATEMENT OF OPERATIONS
This statement describes how much your fund earned in investment income and accrued in expenses. It also describes any gains and/or losses generated by fund operations.
Year ended 12/31/11 | ||||||||
Net investment income | ||||||||
Income | ||||||||
Dividends | $2,310,667 | |||||||
Interest | 8,257 | |||||||
Dividends from underlying affiliated funds | 1,010 | |||||||
Foreign taxes withheld | (7,100 | ) | ||||||
Total investment income | $2,312,834 | |||||||
Expenses | ||||||||
Management fee | $1,071,142 | |||||||
Distribution and/or service fees | 93,990 | |||||||
Administrative services fee | 48,185 | |||||||
Trustees’ compensation | 16,922 | |||||||
Custodian fee | 27,450 | |||||||
Shareholder communications | 11,682 | |||||||
Auditing fees | 46,150 | |||||||
Legal fees | 5,412 | |||||||
Dividend and interest expense on securities sold short | 5,560 | |||||||
Miscellaneous | 18,933 | |||||||
Total expenses | $1,345,426 | |||||||
Fees paid indirectly | (6 | ) | ||||||
Reduction of expenses by investment adviser | (9,966 | ) | ||||||
Net expenses | $1,335,454 | |||||||
Net investment income | $977,380 | |||||||
Realized and unrealized gain (loss) on investments and foreign currency transactions | ||||||||
Realized gain (loss) (identified cost basis) | ||||||||
Investment transactions | $7,633,125 | |||||||
Written option transactions | 444 | |||||||
Securities sold short | (533,254 | ) | ||||||
Foreign currency transactions | (1,414 | ) | ||||||
Net realized gain (loss) on investments and foreign currency transactions | $7,098,901 | |||||||
Change in unrealized appreciation (depreciation) | ||||||||
Investments | $(9,765,126 | ) | ||||||
Written options | 2,590 | |||||||
Securities sold short | 381,854 | |||||||
Translation of assets and liabilities in foreign currencies | 10 | |||||||
Net unrealized gain (loss) on investments and foreign currency translation | $(9,380,672 | ) | ||||||
Net realized and unrealized gain (loss) on investments and foreign currency | $(2,281,771 | ) | ||||||
Change in net assets from operations | $(1,304,391 | ) |
See Notes to Financial Statements
12
Table of Contents
MFS Core Equity Portfolio
FINANCIAL STATEMENTS | STATEMENTS OF CHANGES IN NET ASSETS
These statements describe the increases and/or decreases in net assets resulting from operations, any distributions, and any shareholder transactions.
For years ended 12/31 | 2011 | 2010 | ||||||
Change in net assets | ||||||||
From operations | ||||||||
Net investment income | $977,380 | $1,282,859 | ||||||
Net realized gain (loss) on investments and foreign currency transactions | 7,098,901 | 11,131,795 | ||||||
Net unrealized gain (loss) on investments and foreign currency translation | (9,380,672 | ) | 10,012,685 | |||||
Change in net assets from operations | $(1,304,391 | ) | $22,427,339 | |||||
Distributions declared to shareholders | ||||||||
From net investment income | $(1,287,609 | ) | $(1,519,015 | ) | ||||
Change in net assets from fund share transactions | $(11,636,008 | ) | $(15,874,134 | ) | ||||
Total change in net assets | $(14,228,008 | ) | $5,034,190 | |||||
Net assets | ||||||||
At beginning of period | 147,939,967 | 142,905,777 | ||||||
At end of period (including undistributed net investment income of $974,931 and | $133,711,959 | $147,939,967 |
See Notes to Financial Statements
13
Table of Contents
MFS Core Equity Portfolio
FINANCIAL STATEMENTS | FINANCIAL HIGHLIGHTS
The financial highlights table is intended to help you understand the fund’s financial performance for the past 5 years. Certain information reflects financial results for a single fund share. The total returns in the table represent the rate by which an investor would have earned (or lost) on an investment in the fund share class (assuming reinvestment of all distributions) held for the entire period.
| Initial Class | Years ended 12/31 | |||||||||||||||||||
| 2011 | 2010 | 2009 | 2008 | 2007 | ||||||||||||||||
Net asset value, beginning of period | $14.23 | $12.27 | $9.43 | $16.52 | $17.13 | |||||||||||||||
| Income (loss) from investment operations | ||||||||||||||||||||
Net investment income (d) | $0.11 | $0.12 | $0.13 | $0.16 | $0.11 | |||||||||||||||
Net realized and unrealized gain (loss) on investments | (0.25 | ) | 1.98 | 2.89 | (6.11 | ) | 1.41 | |||||||||||||
Total from investment operations | $(0.14 | ) | $2.10 | $3.02 | $(5.95 | ) | $1.52 | |||||||||||||
| Less distributions declared to shareholders | ||||||||||||||||||||
From net investment income | $(0.14 | ) | $(0.14 | ) | $(0.18 | ) | $(0.09 | ) | $(0.09 | ) | ||||||||||
From net realized gain on investments | — | — | — | (1.05 | ) | (2.04 | ) | |||||||||||||
Total distributions declared to shareholders | $(0.14 | ) | $(0.14 | ) | $(0.18 | ) | $(1.14 | ) | $(2.13 | ) | ||||||||||
Net asset value, end of period (x) | $13.95 | $14.23 | $12.27 | $9.43 | $16.52 | |||||||||||||||
Total return (%) (k)(r)(s)(x) | (0.94 | ) | 17.22 | 32.74 | (38.63 | ) | 8.71 | |||||||||||||
| Ratios (%) (to average net assets) and Supplemental data: | ||||||||||||||||||||
Expenses before expense reductions (f) | 0.88 | 0.90 | 0.89 | 0.88 | 0.86 | |||||||||||||||
Expenses after expense reductions (f) | 0.87 | 0.86 | 0.85 | 0.85 | N/A | |||||||||||||||
Net investment income | 0.75 | 0.98 | 1.28 | 1.22 | 0.65 | |||||||||||||||
Portfolio turnover | 65 | 69 | 91 | 109 | 156 | |||||||||||||||
Net assets at end of period (000 omitted) | $96,375 | $112,121 | $109,322 | $97,648 | $212,063 | |||||||||||||||
| Supplemental Ratios (%): | ||||||||||||||||||||
Ratio of expenses to average net assets after expense reductions excluding short sale dividend and interest expense (f) | 0.87 | 0.85 | 0.85 | N/A | N/A | |||||||||||||||
See Notes to Financial Statements
14
Table of Contents
MFS Core Equity Portfolio
Financial Highlights – continued
| Service Class | Years ended 12/31 | |||||||||||||||||||
| 2011 | 2010 | 2009 | 2008 | 2007 | ||||||||||||||||
Net asset value, beginning of period | $14.13 | $12.19 | $9.36 | $16.42 | $17.05 | |||||||||||||||
| Income (loss) from investment operations | ||||||||||||||||||||
Net investment income (d) | $0.07 | $0.09 | $0.10 | $0.13 | $0.07 | |||||||||||||||
Net realized and unrealized gain (loss) on investments | (0.25 | ) | 1.97 | 2.88 | (6.08 | ) | 1.39 | |||||||||||||
Total from investment operations | $(0.18 | ) | $2.06 | $2.98 | $(5.95 | ) | $1.46 | |||||||||||||
| Less distributions declared to shareholders | ||||||||||||||||||||
From net investment income | $(0.11 | ) | $(0.12 | ) | $(0.15 | ) | $(0.06 | ) | $(0.05 | ) | ||||||||||
From net realized gain on investments | — | — | — | (1.05 | ) | (2.04 | ) | |||||||||||||
Total distributions declared to shareholders | $(0.11 | ) | $(0.12 | ) | $(0.15 | ) | $(1.11 | ) | $(2.09 | ) | ||||||||||
Net asset value, end of period (x) | $13.84 | $14.13 | $12.19 | $9.36 | $16.42 | |||||||||||||||
Total return (%) (k)(r)(s)(x) | (1.25 | ) | 16.95 | 32.44 | (38.79 | ) | 8.40 | |||||||||||||
| Ratios (%) (to average net assets) and Supplemental data: | ||||||||||||||||||||
Expenses before expense reductions (f) | 1.13 | 1.15 | 1.14 | 1.13 | 1.11 | |||||||||||||||
Expenses after expense reductions (f) | 1.12 | 1.11 | 1.10 | 1.10 | N/A | |||||||||||||||
Net investment income | 0.51 | 0.73 | 1.02 | 1.00 | 0.41 | |||||||||||||||
Portfolio turnover | 65 | 69 | 91 | 109 | 156 | |||||||||||||||
Net assets at end of period (000 omitted) | $37,337 | $35,819 | $33,583 | $21,684 | $34,932 | |||||||||||||||
| Supplemental Ratios (%): | ||||||||||||||||||||
Ratio of expenses to average net assets after expense reductions | 1.12 | 1.10 | 1.10 | N/A | N/A | |||||||||||||||
| (d) | Per share data is based on average shares outstanding. |
| (f) | Ratios do not reflect reductions from fees paid indirectly, if applicable. |
| (k) | The total return does not reflect expenses that apply to separate accounts. Inclusion of these charges would reduce the total return figures for all periods shown. |
| (r) | Certain expenses have been reduced without which performance would have been lower. |
| (s) | From time to time the fund may receive proceeds from litigation settlements, without which performance would be lower. |
| (x) | The net asset values per share and total returns have been calculated on net assets which include adjustments made in accordance with U.S. generally accepted accounting principles required at period end for financial reporting purposes. |
See Notes to Financial Statements
15
Table of Contents
MFS Core Equity Portfolio
| (1) | Business and Organization |
MFS Core Equity Portfolio (the fund) is a series of MFS Variable Insurance Trust II (the trust). The trust is organized as a Massachusetts business trust and is registered under the Investment Company Act of 1940, as amended, as an open-end management investment company. The shareholders of each series of the trust are separate accounts of insurance companies, which offer variable annuity and/or life insurance products, and qualified retirement and pension plans.
| (2) | Significant Accounting Policies |
General – The preparation of financial statements in conformity with U.S. generally accepted accounting principles requires management to make estimates and assumptions that affect the reported amounts of assets and liabilities, and disclosure of contingent assets and liabilities at the date of the financial statements and the reported amounts of revenues and expenses during the reporting period. Actual results could differ from those estimates. In the preparation of these financial statements, management has evaluated subsequent events occurring after the date of the fund’s Statement of Assets and Liabilities through the date that the financial statements were issued.
In December 2011, the Financial Accounting Standards Board issued Accounting Standards Update 2011-11, Balance Sheet (Topic 210) – Disclosures about Offsetting Assets and Liabilities (“ASU 2011-11”). Effective for annual reporting periods beginning on or after January 1, 2013 and interim periods within those annual periods, ASU 2011-11 is intended to enhance disclosure requirements on the offsetting of financial assets and liabilities. Although still evaluating the potential impacts of ASU 2011-11 to the fund, management expects that the impact of the fund’s adoption will be limited to additional financial statement disclosures.
Investment Valuations – Equity securities, including restricted equity securities, are generally valued at the last sale or official closing price as provided by a third-party pricing service on the market or exchange on which they are primarily traded. Equity securities, for which there were no sales reported that day, are generally valued at the last quoted daily bid quotation as provided by a third-party pricing service on the market or exchange on which such securities are primarily traded. Equity securities held short, for which there were no sales reported for that day, are generally valued at the last quoted daily ask quotation as provided by a third-party pricing service on the market or exchange on which such securities are primarily traded. Short-term instruments with a maturity at issuance of 60 days or less generally are valued at amortized cost, which approximates market value. Open-end investment companies are generally valued at net asset value per share. Securities and other assets generally valued on the basis of information from a third-party pricing service may also be valued at a broker/dealer bid quotation. Values obtained from third-party pricing services can utilize both transaction data and market information such as yield, quality, coupon rate, maturity, type of issue, trading characteristics, and other market data. The values of foreign securities and other assets and liabilities expressed in foreign currencies are converted to U.S. dollars using the mean of bid and asked prices for rates provided by a third-party pricing service.
The Board of Trustees has delegated primary responsibility for determining or causing to be determined the value of the fund’s investments (including any fair valuation) to the adviser pursuant to valuation policies and procedures approved by the Board. If the adviser determines that reliable market quotations are not readily available, investments are valued at fair value as determined in good faith by the adviser in accordance with such procedures under the oversight of the Board of Trustees. Under the fund’s valuation policies and procedures, market quotations are not considered to be readily available for most types of debt instruments and floating rate loans and many types of derivatives. These investments are generally valued at fair value based on information from third-party pricing services. In addition, investments may be valued at fair value if the adviser determines that an investment’s value has been materially affected by events occurring after the close of the exchange or market on which the investment is principally traded (such as foreign exchange or market) and prior to the determination of the fund’s net asset value, or after the halting of trading of a specific security where trading does not resume prior to the close of the exchange or market on which the security is principally traded. Events that occur on a frequent basis after foreign markets close (such as developments in foreign markets and significant movements in the U.S. markets) and prior to the determination of the fund’s net asset value may be deemed to have a material effect on the value of securities traded in foreign markets. Accordingly, the fund’s foreign equity securities may often be valued at fair value. The adviser generally relies on third-party pricing services or other information (such as the correlation with price movements of similar securities in the same or other markets; the type, cost and investment characteristics of the security; the business and financial condition of the issuer; and trading and other market data) to assist in determining whether to fair value and at what value to fair value an investment. The value of an investment for purposes of calculating the fund’s net asset value can differ depending on the source and method used to determine value. When fair valuation is used, the value of an investment used to determine the fund’s net asset value may differ from quoted or published prices for the same investment. There can be no assurance that the fund could obtain the fair value assigned to an investment if it were to sell the investment at the same time at which the fund determines its net asset value per share.
16
Table of Contents
MFS Core Equity Portfolio
Notes to Financial Statements – continued
Various inputs are used in determining the value of the fund’s assets or liabilities. These inputs are categorized into three broad levels. In certain cases, the inputs used to measure fair value may fall into different levels of the fair value hierarchy. In such cases, an investment’s level within the fair value hierarchy is based on the lowest level of input that is significant to the fair value measurement. The fund’s assessment of the significance of a particular input to the fair value measurement in its entirety requires judgment, and considers factors specific to the investment. Level 1 includes unadjusted quoted prices in active markets for identical assets or liabilities. Level 2 includes other significant observable market-based inputs (including quoted prices for similar securities, interest rates, prepayment speed, and credit risk). Level 3 includes unobservable inputs, which may include the adviser’s own assumptions in determining the fair value of investments. Other financial instruments are derivative instruments not reflected in total investments, such as written options. The following is a summary of the levels used as of December 31, 2011 in valuing the fund’s assets or liabilities:
| Investments at Value | Level 1 | Level 2 | Level 3 | Total | ||||||||||||
| Equity Securities: | ||||||||||||||||
United States | $128,661,553 | $189,784 | $— | $128,851,337 | ||||||||||||
Israel | 1,840,213 | — | — | 1,840,213 | ||||||||||||
Canada | 1,066,842 | — | — | 1,066,842 | ||||||||||||
United Kingdom | 334,732 | — | 252,783 | 587,515 | ||||||||||||
Netherlands | 541,598 | — | — | 541,598 | ||||||||||||
| Mutual Funds | 757,029 | — | — | 757,029 | ||||||||||||
| Total Investments | $133,201,967 | $189,784 | $252,783 | $133,644,534 | ||||||||||||
| Other Financial Instruments | ||||||||||||||||
| Written Options | $(1,260 | ) | $— | $— | $(1,260 | ) | ||||||||||
For further information regarding security characteristics, see the Portfolio of Investments.
The following is a reconciliation of level 3 assets for which significant unobservable inputs were used to determine fair value. The fund’s policy is to recognize transfers between the levels as of the end of the period. The table presents the activity of level 3 securities held at the beginning and the end of the period.
| Equity Securities | ||||
| Balance as of 12/31/10 | $154,875 | |||
Change in unrealized appreciation (depreciation) | 97,908 | |||
| Balance as of 12/31/11 | $252,783 | |||
The net change in unrealized appreciation (depreciation) from investments still held as level 3 at December 31, 2011 is $97,908.
Foreign Currency Translation – Purchases and sales of foreign investments, income, and expenses are converted into U.S. dollars based upon currency exchange rates prevailing on the respective dates of such transactions or on the reporting date for foreign denominated receivables and payables. Gains and losses attributable to foreign currency exchange rates on sales of securities are recorded for financial statement purposes as net realized gains and losses on investments. Gains and losses attributable to foreign exchange rate movements on receivables, payables, income and expenses are recorded for financial statement purposes as foreign currency transaction gains and losses. That portion of both realized and unrealized gains and losses on investments that results from fluctuations in foreign currency exchange rates is not separately disclosed.
Derivatives – The fund uses derivatives for different purposes, primarily to increase or decrease exposure to a particular market or segment of the market, or security, to increase or decrease interest rate or currency exposure, or as alternatives to direct investments. Derivatives are used for hedging or non-hedging purposes. While hedging can reduce or eliminate losses, it can also reduce or eliminate gains. When the fund uses derivatives as an investment to increase market exposure, or for hedging purposes, gains and losses from derivative instruments may be substantially greater than the derivative’s original cost.
The derivative instruments used by the fund were written options and purchased options. The fund’s period end derivatives, as presented in the Portfolio of Investments, generally are indicative of the volume of its derivative activity during the period.
The following table presents, by major type of derivative contract, the fair value, on a gross basis, of the asset and liability components of derivatives held by the fund at December 31, 2011 as reported in the Statement of Assets and Liabilities:
| Fair Value | ||||||
| Risk | Derivative Contracts | Liability Derivatives | ||||
| Equity | Written Equity Options | $(1,260 | ) | |||
The following table presents, by major type of derivative contract, the realized gain (loss) on derivatives held by the fund for the year ended December 31, 2011 as reported in the Statement of Operations:
| Risk | Investment Transactions (Purchased Options) | Written Options | ||||||
| Equity | $(33,182 | ) | $444 | |||||
17
Table of Contents
MFS Core Equity Portfolio
Notes to Financial Statements – continued
The following table presents, by major type of derivative contract, the change in unrealized appreciation (depreciation) on derivatives held by the fund for year ended December 31, 2011 as reported in the Statement of Operations:
| Risk | Written Options | |||
| Equity | $2,590 | |||
Derivative counterparty credit risk is managed through formal evaluation of the creditworthiness of all potential counterparties. On certain over-the-counter derivatives, the fund attempts to reduce its exposure to counterparty credit risk whenever possible by entering into an International Swaps and Derivatives Association (ISDA) Master Agreement on a bilateral basis with each of the counterparties with whom it undertakes a significant volume of transactions. The ISDA Master Agreement gives each party to the agreement the right to terminate all transactions traded under such agreement if there is a certain deterioration in the credit quality of the other party. The ISDA Master Agreement gives the fund the right, upon an event of default by the applicable counterparty or a termination of the agreement, to close out all transactions traded under such agreement and to net amounts owed under each transaction to one net amount payable by one party to the other. This right to close out and net payments across all transactions traded under the ISDA Master Agreement could result in a reduction of the fund’s credit risk to such counterparty equal to any amounts payable by the fund under the applicable transactions, if any. However, absent an event of default by the counterparty or a termination of the agreement, the ISDA Master Agreement does not result in an offset of reported amounts of assets and liabilities in the Statement of Assets and Liabilities across transactions between the fund and the applicable counterparty.
Collateral requirements differ by type of derivative. Collateral or margin requirements are set by the broker or exchange clearing house for exchange traded derivatives (i.e., futures and exchange-traded options) while collateral terms are contract specific for over-the-counter traded derivatives (i.e., forward foreign currency exchange contracts, swaps and over-the-counter options). For derivatives traded under an ISDA Master Agreement, the collateral requirements are netted across all transactions traded under such agreement and one amount is posted from one party to the other to collateralize such obligations. Cash collateral that has been pledged to cover obligations of the fund under derivative contracts, if any, will be reported separately on the Statement of Assets and Liabilities as restricted cash. Securities collateral pledged for the same purpose, if any, is noted in the Portfolio of Investments.
Written Options – In exchange for a premium, the fund wrote put options on securities that it anticipated the price would increase. At the time the option was written, the fund believed the premium received exceeded the potential loss that could result from adverse price changes in the options’ underlying securities. In a written option, the fund as the option writer grants the buyer the right to purchase from, or sell to, the fund a specified number of shares or units of a particular security, currency or index at a specified price within a specified period of time.
The premium received is initially recorded as a liability on the Statement of Assets and Liabilities. The option is subsequently marked-to-market daily with the difference between the premium received and the market value of the written option being recorded as unrealized appreciation or depreciation. When a written option expires, the fund realizes a gain equal to the amount of the premium received. The difference between the premium received and the amount paid on effecting a closing transaction is considered a realized gain or loss. When a written put option is exercised, the premium reduces the cost basis of the security purchased by the fund.
At the initiation of the written option contract, for exchange traded options, the fund is required to deposit securities or cash as collateral with the custodian for the benefit of the broker. For over-the-counter options, the fund may post collateral subject to the terms of an ISDA Master Agreement as generally described above if the market value of the options contract moves against it. The fund, as writer of an option, may have no control over whether the underlying securities may be sold (call) or purchased (put) and, as a result, bears the market risk of an unfavorable change in the price of the securities underlying the written option. Losses from writing options can exceed the premium received and can exceed the potential loss from an ordinary buy and sell transaction. Although the fund’s market risk may be significant, the maximum counterparty credit risk to the fund is equal to the market value of any collateral posted to the broker. For over-the-counter options, this risk is mitigated in cases where there is an ISDA Master Agreement between the fund and the counterparty providing for netting as described above.
Written Option Transactions
| Number of contracts | Premiums received | |||||||
| Outstanding, beginning of period | — | $— | ||||||
| Options written | 312 | 25,772 | ||||||
| Options closed | (37 | ) | (3,665 | ) | ||||
| Options exercised | (176 | ) | (9,508 | ) | ||||
| Options expired | (63 | ) | (8,749 | ) | ||||
| Outstanding, end of period | 36 | $3,850 | ||||||
18
Table of Contents
MFS Core Equity Portfolio
Notes to Financial Statements – continued
Purchased Options – The fund purchased call and put options for a premium. Purchased call and put options entitle the holder to buy and sell a specified number of shares or units of a particular security, currency or index at a specified price at a specified date or within a specified period of time. Purchasing call options may be used to hedge against an anticipated increase in the dollar cost of securities or currency to be acquired or to increase the fund’s exposure to an underlying instrument. Purchasing put options may hedge against a decline in the value of portfolio securities or currency.
The premium paid is initially recorded as an investment in the Statement of Assets and Liabilities. That investment is subsequently marked-to-market daily with the difference between the premium paid and the market value of the purchased option being recorded as unrealized appreciation or depreciation. Premiums paid for purchased call and put options which have expired are treated as realized losses on investments in the Statement of Operations. Upon the exercise or closing of a purchased call option, the premium paid is added to the cost of the security or financial instrument. Upon the exercise or closing of a purchased put option, the premium paid is offset against the proceeds on the sale of the underlying security or financial instrument in order to determine the realized gain or loss on investments.
The risk in purchasing an option is that the fund pays a premium whether or not the option is exercised. The fund’s maximum risk of loss due to counterparty credit risk is limited to the market value of the option. For over-the-counter options, this risk is mitigated in cases where there is an ISDA Master Agreement between the fund and the counterparty providing for netting as described above and for posting of collateral by the counterparty to the fund to cover the fund’s exposure to the counterparty under such ISDA Master Agreement.
Short Sales – The fund entered into short sales whereby it sells a security it does not own in anticipation of a decline in the value of that security. The fund will realize a gain if the security price decreases and a loss if the security price increases between the date of the short sale and the date on which the fund replaces the borrowed security. Losses from short sales can exceed the proceeds of the security sold; and they can also exceed the potential loss from an ordinary buy and sell transaction. The amount of any premium, dividends, or interest the fund may be required to pay in connection with a short sale will be recognized as a fund expense. During the year ended December 31, 2011, this expense amounted to $5,560. The fund segregates cash or marketable securities in an amount that, when combined with the amount of proceeds from the short sale deposited with the broker, at least equals the current market value of the security sold short. At December 31, 2011, the fund had no short sales outstanding.
Security Loans – State Street Bank and Trust Company (“State Street”), as lending agent, loans the securities of the fund to certain qualified institutions (the “Borrowers”) approved by the fund. The loans are collateralized by cash and/or U.S. Treasury and federal agency obligations in an amount typically at least equal to the market value of the securities loaned. The market value of the loaned securities is determined at the close of business of the fund and any additional required collateral is delivered to the fund on the next business day. State Street provides the fund with indemnification against Borrower default. The fund bears the risk of loss with respect to the investment of cash collateral. On loans collateralized by cash, the cash collateral is invested in a money market fund or short-term securities. A portion of the income generated upon investment of the collateral is remitted to the Borrowers, and the remainder is allocated between the fund and the lending agent. On loans collateralized by U.S. Treasury and/or federal agency obligations, a fee is received from the Borrower, and is allocated between the fund and the lending agent. Income from securities lending is included in interest income on the Statement of Operations. The dividend and interest income earned on the securities loaned is accounted for in the same manner as other dividend and interest income.
Indemnifications – Under the fund’s organizational documents, its officers and Trustees may be indemnified against certain liabilities and expenses arising out of the performance of their duties to the fund. Additionally, in the normal course of business, the fund enters into agreements with service providers that may contain indemnification clauses. The fund’s maximum exposure under these agreements is unknown as this would involve future claims that may be made against the fund that have not yet occurred.
Investment Transactions and Income – Investment transactions are recorded on the trade date. Interest income is recorded on the accrual basis. Dividends received in cash are recorded on the ex-dividend date. Certain dividends from foreign securities will be recorded when the fund is informed of the dividend if such information is obtained subsequent to the ex-dividend date. Dividend and interest payments received in additional securities are recorded on the ex-dividend or ex-interest date in an amount equal to the value of the security on such date.
The fund may receive proceeds from litigation settlements. Any proceeds received from litigation involving portfolio holdings are reflected in the Statement of Operations in realized gain/loss if the security has been disposed of by the fund or in unrealized gain/loss if the security is still held by the fund. Any other proceeds from litigation not related to portfolio holdings are reflected as other income in the Statement of Operations.
19
Table of Contents
MFS Core Equity Portfolio
Notes to Financial Statements – continued
Fees Paid Indirectly – The fund’s custody fee may be reduced according to an arrangement that measures the value of cash deposited with the custodian by the fund. This amount, for the year ended December 31, 2011, is shown as a reduction of total expenses on the Statement of Operations.
Tax Matters and Distributions – The fund intends to qualify as a regulated investment company, as defined under Subchapter M of the Internal Revenue Code, and to distribute all of its taxable income, including realized capital gains. As a result, no provision for federal income tax is required. The fund’s federal tax returns for the prior three fiscal years remain subject to examination by the Internal Revenue Service. Foreign taxes have been accrued by the fund in the accompanying financial statements.
Distributions to shareholders are recorded on the ex-dividend date. Income and capital gain distributions are determined in accordance with income tax regulations, which may differ from U.S. generally accepted accounting principles. Certain capital accounts in the financial statements are periodically adjusted for permanent differences in order to reflect their tax character. These adjustments have no impact on net assets or net asset value per share. Temporary differences which arise from recognizing certain items of income, expense, gain or loss in different periods for financial statement and tax purposes will reverse at some time in the future. Distributions in excess of net investment income or net realized gains are temporary overdistributions for financial statement purposes resulting from differences in the recognition or classification of income or distributions for financial statement and tax purposes.
Book/tax differences primarily relate to wash sale loss deferrals.
The tax character of distributions declared to shareholders for the last two fiscal years is as follows:
| 12/31/11 | 12/31/10 | |||||||
| Ordinary income (including any short-term capital gains) | $1,287,609 | $1,519,015 | ||||||
The federal tax cost and the tax basis components of distributable earnings were as follows:
| As of 12/31/11 | ||||
| Cost of investments | $128,072,899 | |||
| Gross appreciation | 15,206,064 | |||
| Gross depreciation | (9,634,429 | ) | ||
| Net unrealized appreciation (depreciation) | $5,571,635 | |||
| Undistributed ordinary income | 974,931 | |||
| Capital loss carryforwards | (29,892,035 | ) | ||
| Other temporary differences | (30,247 | ) |
Under the Regulated Investment Company Modernization Act of 2010 (the “Act”), net capital losses recognized after December 31, 2010 may be carried forward indefinitely, and their character is retained as short-term and/or long-term losses. Previously, net capital losses were carried forward for eight years and treated as short-term losses. As a transition rule, the Act requires that post-enactment net capital losses be used before pre-enactment net capital losses.
As of December 31, 2011, the fund had capital loss carryforwards available to offset future realized gains. Such losses expire as follows:
| Pre-enactment losses: | ||||
| 12/31/16 | $(13,521,109 | ) | ||
| 12/31/17 | (16,370,926 | ) | ||
| Total | $(29,892,035 | ) |
Multiple Classes of Shares of Beneficial Interest – The fund offers multiple classes of shares, which differ in their respective distribution and/or service fees. The fund’s income, realized and unrealized gain (loss), and common expenses are allocated to shareholders based on the daily net assets of each class. Dividends are declared separately for each class. Differences in per share dividend rates are generally due to differences in separate class expenses. The fund’s distributions declared to shareholders as reported on the Statements of Changes in Net Assets are presented by class as follows:
| From net investment income | ||||||||
| Year ended 12/31/11 | Year ended 12/31/10 | |||||||
| Initial Class | $1,006,030 | $1,210,524 | ||||||
| Service Class | 281,579 | 308,491 | ||||||
| Total | $1,287,609 | $1,519,015 | ||||||
20
Table of Contents
MFS Core Equity Portfolio
Notes to Financial Statements – continued
| (3) | Transactions with Affiliates |
Investment Adviser – The fund has an investment advisory agreement with MFS to provide overall investment management and related administrative services and facilities to the fund. The management fee is computed daily and paid monthly at the following annual rates:
| First $1 billion of average daily net assets | 0.75% | |||
| Average daily net assets in excess of $1 billion | 0.65% |
The investment adviser has agreed in writing to reduce its management fee to 0.60% of average daily net assets in excess of $2.5 billion. This written agreement will continue until modified by the fund’s Board of Trustees, but such agreement will continue at least until April 30, 2013. For the year ended December 31, 2011, the fund’s average daily net assets did not exceed $2.5 billion and therefore, the management fee was not reduced. The management fee incurred for the year ended December 31, 2011 was equivalent to an annual effective rate of 0.75% of the fund’s average daily net assets.
The investment adviser had agreed in writing to pay a portion of the fund’s total annual operating expenses, exclusive of interest, taxes, extraordinary expenses, brokerage and transaction costs and investment-related expenses, such that total annual operating expenses did not exceed 0.85% of average daily net assets for the Initial Class shares and 1.10% of average daily net assets for the Service Class shares. This written agreement terminated on April 30, 2011. For the period January 1, 2011 through April 30, 2011, this reduction amounted to $9,966 and is reflected as a reduction of total expenses in the Statement of Operations.
Distributor – MFS Fund Distributors, Inc. (MFD), a wholly-owned subsidiary of MFS, is the distributor of shares of the fund. The Trustees have adopted a distribution plan for the Service Class shares pursuant to Rule 12b-1 under the Investment Company Act of 1940.
The fund’s distribution plan provides that the fund will pay MFD distribution and/or service fees equal to 0.25% per annum of its average daily net assets attributable to Service Class shares as partial consideration for services performed and expenses incurred by MFD and financial intermediaries (including participating insurance companies that invest in the fund to fund variable annuity and variable life insurance contracts, sponsors of qualified retirement and pension plans that invest in the fund, and affiliates of these participating insurance companies and plan sponsors) in connection with the sale and distribution of the Service Class shares. MFD may subsequently pay all, or a portion, of the distribution and/or service fees to financial intermediaries.
Shareholder Servicing Agent – MFS Service Center, Inc. (MFSC), a wholly-owned subsidiary of MFS, has contracted to provide transfer agent and recordkeeping functions in connection with the issuance, transfer, and redemption of each class of shares of the fund under a Shareholder Servicing Agent Agreement. During the year ended December 31, 2011, the fund did not pay MFSC a fee for this service.
Administrator – MFS provides certain financial, legal, shareholder communications, compliance, and other administrative services to the fund. Under an administrative services agreement, the fund partially reimburses MFS the costs incurred to provide these services. The fund is charged an annual fixed amount of $17,500 plus a fee based on average daily net assets. The administrative services fee incurred for the year ended December 31, 2011 was equivalent to an annual effective rate of 0.0337% of the fund’s average daily net assets.
Trustees’ and Officers’ Compensation – The fund pays compensation to Trustees in the form of a retainer, attendance fees, and additional compensation to the Board chairperson. The fund does not pay compensation directly to officers of the fund who are also officers of the investment adviser, all of whom receive remuneration for their services to the fund from MFS. Certain officers of the fund are officers or directors of MFS, MFD, and MFSC.
Other – This fund and certain other funds managed by MFS (the funds) have entered into services agreements (the Agreements) which provide for payment of fees by the funds to Tarantino LLC and Griffin Compliance LLC in return for the provision of services of an Independent Chief Compliance Officer (ICCO) and Assistant ICCO, respectively, for the funds. The ICCO and Assistant ICCO are officers of the funds and the sole members of Tarantino LLC and Griffin Compliance LLC, respectively. The funds can terminate the Agreements with Tarantino LLC and Griffin Compliance LLC at any time under the terms of the Agreements. MFS has agreed to bear all expenses associated with office space, other administrative support, and supplies provided to the ICCO and Assistant ICCO. For the year ended December 31, 2011, the aggregate fees paid by the fund to Tarantino LLC and Griffin Compliance LLC were $2,383 and are included in miscellaneous expense on the Statement of Operations.
The fund invests in the MFS Institutional Money Market Portfolio which is managed by MFS and seeks a high level of current income consistent with preservation of capital and liquidity. Income earned on this investment is included in dividends from underlying affiliated funds on the Statement of Operations. This money market fund does not pay a management fee to MFS.
21
Table of Contents
MFS Core Equity Portfolio
Notes to Financial Statements – continued
| (4) | Portfolio Securities |
Purchases and sales of investments, other than U.S. Government securities, purchased option transactions, and short-term obligations, aggregated $93,462,566 and $105,568,857, respectively.
| (5) | Shares of Beneficial Interest |
The fund’s Declaration of Trust permits the Trustees to issue an unlimited number of full and fractional shares of beneficial interest. Transactions in fund shares were as follows:
| Year ended 12/31/11 | Year ended 12/31/10 | |||||||||||||||
| Shares | Amount | Shares | Amount | |||||||||||||
| Shares sold | ||||||||||||||||
Initial Class | 84,615 | $1,181,327 | 120,904 | $1,459,987 | ||||||||||||
Service Class | 634,165 | 8,900,700 | 344,200 | 4,323,006 | ||||||||||||
| 718,780 | $10,082,027 | 465,104 | $5,782,993 | |||||||||||||
| Shares issued to shareholders in reinvestment of distributions | ||||||||||||||||
Initial Class | 75,471 | $1,006,030 | 91,292 | $1,210,524 | ||||||||||||
Service Class | 21,267 | 281,579 | 23,406 | 308,491 | ||||||||||||
| 96,738 | $1,287,609 | 114,698 | $1,519,015 | |||||||||||||
| Shares reacquired | ||||||||||||||||
Initial Class | (1,125,770 | ) | $(16,146,864 | ) | (1,244,574 | ) | $(15,747,976 | ) | ||||||||
Service Class | (492,675 | ) | (6,858,780 | ) | (587,843 | ) | (7,428,166 | ) | ||||||||
| (1,618,445 | ) | $(23,005,644 | ) | (1,832,417 | ) | $(23,176,142 | ) | |||||||||
| Net change | ||||||||||||||||
Initial Class | (965,684 | ) | $(13,959,507 | ) | (1,032,378 | ) | $(13,077,465 | ) | ||||||||
Service Class | 162,757 | 2,323,499 | (220,237 | ) | (2,796,669 | ) | ||||||||||
| (802,927 | ) | $(11,636,008 | ) | (1,252,615 | ) | $(15,874,134 | ) | |||||||||
| (6) | Line of Credit |
The fund and certain other funds managed by MFS participate in a $1.1 billion unsecured committed line of credit, subject to a $1 billion sublimit, provided by a syndication of banks under a credit agreement. Borrowings may be made for temporary financing needs. Interest is charged to each fund, based on its borrowings, generally at a rate equal to the higher of the Federal Reserve funds rate or one month LIBOR plus an agreed upon spread. A commitment fee, based on the average daily, unused portion of the committed line of credit, is allocated among the participating funds at the end of each calendar quarter. In addition, the fund and other funds managed by MFS have established unsecured uncommitted borrowing arrangements with certain banks for temporary financing needs. Interest is charged to each fund, based on its borrowings, at a rate equal to the Federal Reserve funds rate plus an agreed upon spread. For the year ended December 31, 2011, the fund’s commitment fee and interest expense were $1,107 and $0, respectively, and are included in miscellaneous expense on the Statement of Operations.
| (7) | Transactions in Underlying Affiliated Funds – Affiliated Issuers |
An affiliated issuer may be considered one in which the fund owns 5% or more of the outstanding voting securities, or a company which is under common control. For the purposes of this report, the fund assumes the following to be affiliated issuers:
| Underlying Affiliated Funds | Beginning Shares/Par Amount | Acquisitions Shares/Par Amount | Dispositions Shares/Par Amount | Ending Shares/Par Amount | ||||||||||||
| MFS Institutional Money Market Portfolio | 60 | 29,889,596 | (29,132,627 | ) | 757,029 | |||||||||||
| Underlying Affiliated Funds | Realized Gain (Loss) | Capital Gain Distributions | Dividend Income | Ending Value | ||||||||||||
| MFS Institutional Money Market Portfolio | $— | $— | $1,010 | $757,029 | ||||||||||||
22
Table of Contents
MFS Core Equity Portfolio
REPORT OF INDEPENDENT REGISTERED PUBLIC ACCOUNTING FIRM
To the Board of Trustees of MFS Variable Insurance Trust II and the Shareholders of
MFS Core Equity Portfolio:
We have audited the accompanying statement of assets and liabilities, including the portfolio of investments, of MFS Core Equity Portfolio (the “Fund”) (one of the portfolios comprising MFS Variable Insurance Trust II) as of December 31, 2011, and the related statement of operations for the year then ended, the statements of changes in net assets for each of the two years in the period then ended, and the financial highlights for each of the five years in the period then ended. These financial statements and financial highlights are the responsibility of the Fund’s management. Our responsibility is to express an opinion on these financial statements and financial highlights based on our audits.
We conducted our audits in accordance with the standards of the Public Company Accounting Oversight Board (United States). Those standards require that we plan and perform the audit to obtain reasonable assurance about whether the financial statements and financial highlights are free of material misstatement. The Fund is not required to have, nor were we engaged to perform, an audit of its internal control over financial reporting. Our audits included consideration of internal control over financial reporting as a basis for designing audit procedures that are appropriate in the circumstances, but not for the purpose of expressing an opinion on the effectiveness of the Fund’s internal control over financial reporting. Accordingly, we express no such opinion. An audit also includes examining, on a test basis, evidence supporting the amounts and disclosures in the financial statements, assessing the accounting principles used and significant estimates made by management, as well as evaluating the overall financial statement presentation. Our procedures included confirmation of securities owned as of December 31, 2011, by correspondence with the custodian and brokers; where replies were not received from brokers, we performed other auditing procedures. We believe that our audits provide a reasonable basis for our opinion.
In our opinion, the financial statements and financial highlights referred to above present fairly, in all material respects, the financial position of MFS Core Equity Portfolio as of December 31, 2011, the results of its operations for the year then ended, the changes in its net assets for each of the two years in the period then ended, and the financial highlights for each of the five years in the period then ended, in conformity with accounting principles generally accepted in the United States of America.
DELOITTE & TOUCHE LLP
Boston, Massachusetts
February 15, 2012
23
Table of Contents
MFS Core Equity Portfolio
RESULTS OF SHAREHOLDER MEETING (unaudited)
At a special meeting of shareholders of MFS Core Equity Portfolio, which was held on December 1, 2011, the following actions were taken for which shareholders of all series of MFS Variable Insurance Trust II voted together as a single class with respect to Item 1 and shareholders of MFS Core Equity Portfolio voted as a separate class with respect to Items 2 and 3:
Item 1: Election of ten Trustees as members of the Board of Trustees of the Trust effective January 1, 2012:
| Number of Shares | ||||||||
| For | Withheld Authority | |||||||
| Robert E. Butler | 681,916,712.8686 | 46,472,894.9218 | ||||||
| Maureen R. Goldfarb | 682,835,794.8512 | 45,553,812.9392 | ||||||
| David H. Gunning | 681,500,267.3085 | 46,889,340.4819 | ||||||
| William R. Gutow | 681,050,223.5547 | 47,339,384.2357 | ||||||
| Michael Hegarty | 682,477,088.8584 | 45,912,518.9320 | ||||||
| John P. Kavanaugh | 683,794,425.4269 | 44,595,182.3635 | ||||||
| Robert J. Manning | 682,699,559.7374 | 45,690,048.0530 | ||||||
| J. Dale Sherratt | 681,362,743.0513 | 47,026,864.7391 | ||||||
| Laurie J. Thomsen | 683,408,094.0000 | 44,981,513.7904 | ||||||
| Robert W. Uek | 681,424,852.0247 | 46,964,755.7657 | ||||||
Item 2: To approve a new investment advisory agreement dated January 1, 2012, between the Trust, on behalf of MFS Core Equity Portfolio, and MFS:
| Number of Shares | ||||||||||||
| For | Against | Withheld Authority | ||||||||||
| 8,472,577.1859 | 430,246.6490 | 895,315.8559 | ||||||||||
Item 3: To approve revisions to and restatements of certain fundamental investment restrictions of MFS Core Equity Portfolio effective January 1, 2012 as detailed below:
| Number of Shares | ||||||||||||||
| For | Against | Withheld Authority | ||||||||||||
| A. | Borrowing | 8,207,143.6326 | 680,376.4168 | 910,619.6414 | ||||||||||
| B. | Underwriting Securities | 8,370,923.0478 | 551,199.3946 | 876,017.2484 | ||||||||||
| C. | Issuance of Senior Securities | 8,426,961.2088 | 514,444.3961 | 856,734.0859 | ||||||||||
| D. | Lending of Money or Securities | 8,199,088.9069 | 697,095.4712 | 901,955.3127 | ||||||||||
| E. | Purchases or Sales of Real Estate; Interests in Oil, Gas or Mineral Leases; and Commodities | 8,387,653.1910 | 556,174.6809 | 854,311.8189 | ||||||||||
| F. | Industry Concentration | 8,398,971.0720 | 504,389.3598 | 894,779.2590 | ||||||||||
24
Table of Contents
MFS Core Equity Portfolio
TRUSTEES AND OFFICERS – IDENTIFICATION AND BACKGROUND
The Trustees and officers of the Trust, as of February 1, 2012, are listed below, together with their principal occupations during the past five years. (Their titles may have varied during that period.) The address of each Trustee and officer is 500 Boylston Street, Boston, Massachusetts 02116.
Name, Age | Position(s) with Fund | Trustee/Officer Since (h) | Principal Occupations | Other Directorships (j) | ||||
| INTERESTED TRUSTEES | ||||||||
Robert J. Manning (k) (age 48) | Trustee | February 2004 | Massachusetts Financial Services Company, Chairman, Chief Executive Officer and Director; President (until December 2009); Chief Investment Officer (until July 2010) | N/A | ||||
| INDEPENDENT TRUSTEES | ||||||||
David H. Gunning (age 69) | Trustee and Chair of Trustees | January 2004 | Retired; Cleveland-Cliffs Inc. (mining products and service provider), Vice Chairman/Director (until May 2007) | Lincoln Electric Holdings, Inc. (welding equipment manufacturer), Director; Development Alternatives, Inc. (consulting), Director/Non-Executive Chairman; Portman Limited (mining), Director (until 2008) | ||||
Robert E. Butler (age 70) | Trustee | January 2006 | Consultant – investment company industry regulatory and compliance matters | N/A | ||||
Maureen R. Goldfarb (age 56) | Trustee | January 2009 | Private investor | N/A | ||||
William R. Gutow (age 70) | Trustee | December 1993 | Private investor and real estate consultant; Capitol Entertainment Management Company (video franchise), Vice Chairman | Atlantic Coast Tan (tanning salons), Vice Chairman (until 2007); Texas Donuts (donut franchise), Vice Chairman (until 2010) | ||||
Michael Hegarty (age 67) | Trustee | December 2004 | Private investor | N/A | ||||
John P. Kavanaugh (age 57) | Trustee | January 2009 | Private investor; The Hanover Insurance Group, Inc., Vice President and Chief Investment Officer (until 2006); Allmerica Investment Trust, Allmerica Securities Trust and Opus Investment Trust (investment companies), Chairman, President and Trustee (until 2006) | N/A | ||||
J. Dale Sherratt (age 73) | Trustee | June 1989 | Insight Resources, Inc. (acquisition planning specialists), President; Wellfleet Investments (investor in health care companies), Managing General Partner | N/A | ||||
Laurie J. Thomsen (age 54) | Trustee | March 2005 | Private investor; New Profit, Inc. (venture philanthropy), Executive Partner (until 2010) | The Travelers Companies (property and casualty insurance), Director | ||||
Robert W. Uek (age 70) | Trustee | January 2006 | Consultant to investment company industry | N/A | ||||
| OFFICERS | ||||||||
John M. Corcoran (k) (age 46) | President | October 2008 | Massachusetts Financial Services Company, Senior Vice President (since October 2008); State Street Bank and Trust (financial services provider), Senior Vice President, (until September 2008) | N/A | ||||
| Christopher R. Bohane (k) (age 38) | Assistant Secretary and Assistant Clerk | July 2005 | Massachusetts Financial Services Company, Vice President and Senior Counsel | N/A | ||||
Kino Clark (k) (age 43) | Assistant Treasurer | January 2012 | Massachusetts Financial Services Company, Assistant Vice President | N/A | ||||
25
Table of Contents
MFS Core Equity Portfolio
Trustees and Officers – continued
Name, Age | Position(s) with Fund | Trustee/Officer Since (h) | Principal Occupations | Other Directorships (j) | ||||
Ethan D. Corey (k) (age 48) | Assistant Secretary and Assistant Clerk | July 2005 | Massachusetts Financial Services Company, Senior Vice President and Associate General Counsel | N/A | ||||
David L. DiLorenzo (k) (age 43) | Treasurer | July 2005 | Massachusetts Financial Services Company, Vice President | N/A | ||||
Robyn L. Griffin (age 36) | Assistant Independent Chief Compliance Officer | August 2008 | Griffin Compliance LLC (provider of compliance services), Principal (since August 2008); State Street Corporation (financial services provider), Mutual Fund Administration Assistant Vice President (October 2006 – July 2008); Liberty Mutual Group (insurance), Personal Market Assistant Controller (April 2006 – October 2006); Deloitte & Touche LLP (professional services firm). | N/A | ||||
Brian E. Langenfeld (k) (age 38) | Assistant Secretary and Assistant Clerk | June 2006 | Massachusetts Financial Services Company, Vice President and Senior Counsel | N/A | ||||
Ellen Moynihan (k) (age 54) | Assistant Treasurer | April 1997 | Massachusetts Financial Services Company, Senior Vice President | N/A | ||||
Susan S. Newton (k) (age 61) | Assistant Secretary and Assistant Clerk | May 2005 | Massachusetts Financial Services Company, Senior Vice President and Associate General Counsel | N/A | ||||
Susan A. Pereira (k) (age 41) | Assistant Secretary and Assistant Clerk | July 2005 | Massachusetts Financial Services Company, Vice President and Senior Counsel | N/A | ||||
Mark N. Polebaum (k) (age 59) | Secretary and Clerk | January 2006 | Massachusetts Financial Services Company, Executive Vice President, General Counsel and Secretary | N/A | ||||
Frank L. Tarantino (age 67) | Independent Chief Compliance Officer | June 2004 | Tarantino LLC (provider of compliance services), Principal | N/A | ||||
Richard S. Weitzel (k) (age 41) | Assistant Secretary and Assistant Clerk | October 2007 | Massachusetts Financial Services Company, Vice President and Assistant General Counsel | N/A | ||||
James O. Yost (k) (age 51) | Deputy Treasurer | September 1990 | Massachusetts Financial Services Company, Senior Vice President | N/A | ||||
| (h) | Date first appointed to serve as Trustee/officer of an MFS fund. Each Trustee has served continuously since appointment unless indicated otherwise. For the period from December 15, 2004 until February 22, 2005, Mr. Manning served as Advisory Trustee. For the period October 2008, until January 2012, Mr. Corcoran served as Treasurer of the Funds. Prior to January 2012, Messrs. DiLorenzo and Yost served as Assistant Treasurers of the Funds. |
| (j) | Directorships or trusteeships of companies required to report to the Securities and Exchange Commission (i.e., “public companies”). |
| (k) | “Interested person” of the Trust within the meaning of the Investment Company Act of 1940 (referred to as the 1940 Act), which is the principal federal law governing investment companies like the fund, as a result of position with MFS. The address of MFS is 500 Boylston Street, Boston, Massachusetts 02116. |
Each Trustee has been elected by shareholders and each Trustee and officer holds office until his or her successor is chosen and qualified or until his or her earlier death, resignation, retirement or removal. The Trust does not hold annual meetings for the purpose of electing Trustees, and Trustees are not elected for fixed terms. Messrs. Butler, Kavanaugh, Uek and Ms. Thomsen are members of the Trust’s Audit Committee.
Each of the Fund’s Trustees and officers holds comparable positions with certain other funds of which MFS or a subsidiary is the investment adviser or distributor, and, in the case of the officers, with certain affiliates of MFS. As of January 1, 2012, the Trustees served as board members of 131 funds within the MFS Family of Funds.
26
Table of Contents
MFS Core Equity Portfolio
Trustees and Officers – continued
The Statement of Additional Information for the Fund includes further information about the Trustees and is available without charge upon request by calling 1-800-225-2606.
Investment Adviser Massachusetts Financial Services Company 500 Boylston Street, Boston, MA 02116-3741 | Custodian State Street Bank and Trust 1 Lincoln Street, Boston, MA 02111-2900 | |
Distributor MFS Fund Distributors, Inc. 500 Boylston Street, Boston, MA 02116-3741 | Independent Registered Public Accounting Firm Deloitte & Touche LLP 200 Berkeley Street, Boston, MA 02116 | |
Portfolio Manager Joseph MacDougall |
27
Table of Contents
MFS Core Equity Portfolio
At a special meeting of shareholders of the MFS Core Equity Portfolio (hereinafter referred to as the “Fund” or the “Portfolio”), which was held on December 1, 2011, the shareholders approved a new investment advisory agreement based on the recommendation of the Board of Trustees. At its July, 2011 meeting, the Board of Trustees (i) approved, and recommended for shareholder approval, the new investment advisory agreement effective January 1, 2012, and (ii) the continuation of the existing investment advisory agreement effective September 1, 2011. The following includes a description of the factors that the Board of Trustees considered and the conclusions that formed the basis of their approval of both the new investment advisory agreement and the continuation of the prior investment advisory agreement.
BOARD APPROVAL OF NEW INVESTMENT ADVISORY AGREEMENT
The Investment Company Act of 1940 requires that both the full Board of Trustees and a majority of the non-interested (“independent”) Trustees, voting separately, initially approve the new investment advisory agreement (the “New Agreement”) between Massachusetts Financial Services Company (“MFS”) and MFS Variable Insurance Trust II (the “Trust”) on behalf of the Portfolio and, beginning on the second anniversary of the initial effective date of the New Agreement, annually approve the continuation of the New Agreement. The Trustees have considered matters bearing on the Portfolio and the then current advisory arrangement at their meetings throughout the year, including a review of performance data at each regular meeting. In addition, the independent Trustees met in person in July 2011 to consider the initial approval of the New Agreement, and to recommend that shareholders approve the New Agreement. The independent Trustees were assisted in their evaluation of the New Agreement by independent legal counsel, from whom they received separate legal advice and with whom they met separately from MFS management. The independent Trustees were also assisted in this process by the Portfolio’s Independent Chief Compliance Officer, a full-time senior officer appointed by and reporting to the independent Trustees.
In connection with their deliberations regarding the initial approval of the New Agreement, the Trustees, including the independent Trustees, considered such information and factors as they believed, in light of the legal advice furnished to them and their own business judgment, to be relevant. The New Agreement was considered separately for the series of the Trust (collectively, the “Portfolios”), although the Trustees also took into account the common interests of all Portfolios in the Trust in their review. As described below, the Trustees considered the nature, quality, and extent of the various investment advisory, administrative, and/or shareholder services to be performed by MFS under the New Agreement and other arrangements with the Trust.
In connection with their initial review meeting, the Trustees received and relied upon materials that included, among other items: (i) information provided by MFS on the advisory fees of comparable portfolios of its other clients, including institutional separate account and other clients, (ii) information as to whether, and to what extent applicable, expense waivers, reimbursements or fee “breakpoints” would be observed for the Portfolio under the New Agreement, and (iii) a comparison and summary of the differences in the provisions in the New Agreement compared to those in each of the then current investment advisory agreements for the Portfolios. In addition, in connection with the independent Trustees’ meetings in May and July, 2011 (the “contract review meetings”) for the purpose of considering whether to approve the continuation of the then current investment advisory agreements for the Portfolio, the independent Trustees received: (1) information provided by Lipper Inc. (“Lipper”) on the investment performance of the Portfolio for various time periods ended December 31, 2010, compared to the investment performance of a group of funds with substantially similar investment classifications/objectives (the “Lipper performance universe”), (2) information provided by Lipper on the Portfolio’s advisory fees and other expenses compared to the advisory fees and other expenses of comparable funds identified by Lipper (the “Lipper expense group”), (3) information regarding MFS’ financial results and financial condition, including MFS’ and certain of its affiliates’ estimated profitability from services performed for the Portfolio, (4) MFS’ views regarding the outlook for the mutual fund industry and its strategic business plans, (5) descriptions of various functions performed by MFS for the Trust, such as compliance monitoring and portfolio trading practices, and (6) information regarding the overall organization of MFS, including information about MFS’ senior management and other personnel providing investment advisory, administrative and other services to the Portfolio. The comparative performance, fee and expense information prepared and provided by Lipper was not independently verified, and the independent Trustees did not independently verify any information provided to them by MFS.
The Trustees’ conclusion as to the initial approval of the New Agreement was based on comprehensive consideration of all information provided to the Trustees and was not the result of any single factor. Some of the factors that figured particularly in the Trustees’ deliberations are described below for the Portfolio, while individual Trustees may have given different weight to various factors and evaluated the information presented as a whole differently than another individual Trustee. The Trustees recognized that the fee arrangements for the Portfolio could reflect years of review and discussion between the independent Trustees and MFS, that certain aspects of such arrangements may receive greater scrutiny in some years than others, and that the Trustees’ conclusions may be based, in part, on their consideration of these same arrangements during the course of the year and in prior years.
28
Table of Contents
MFS Core Equity Portfolio
Board Approval of New Investment Advisory Agreement – continued
Because the portfolio management team managing the Portfolio’s investments under the then current investment advisory agreement will remain the same under the New Agreement for the Portfolio, the Trustees compared the Portfolio’s total return investment performance to the performance of its Lipper performance universe over various time periods, based on information provided by Lipper. The Trustees placed particular emphasis on the total return performance of the Portfolio’s Initial Class shares in comparison to the performance of funds in its Lipper performance universe over the one-, three- and five-year periods ended December 31, 2010. The Trustees did not rely on performance results for more recent periods.
The Trustees noted the performance of the Portfolio’s Initial Class shares was in the 2nd quintile relative to the other funds in the Lipper performance universe for the one-year period (the 1st quintile being the best performers and the 5th quintile being the worst performers). The total return performance of the Portfolio was also in the 2nd quintile for the three-year and the five-year periods ended December 31, 2010, relative to the Lipper performance universe. Based on the nature and quality of services provided by MFS, the Board of Trustees concluded that the Portfolio’s performance was satisfactory.
In the course of their deliberations, the Trustees took into account information provided by MFS during contract review meetings, as well as during investment review meetings conducted with portfolio management personnel during the course of the year. For Portfolios whose performance lagged their peer groups, they discussed the factors that contributed thereto and MFS’ efforts to improve such Portfolios’ performance. After reviewing this information, the Trustees concluded, within the context of their overall conclusions regarding the New Agreement, that they were satisfied with MFS’ responses and efforts relating to investment performance.
In assessing the reasonableness of the Portfolio’s advisory fee, the Trustees considered, among other information, the Portfolio’s advisory fee and the total expense ratio of the Portfolio’s Initial Class shares as a percentage of average daily net assets, compared to the advisory fee and total expense ratios of its peer group of funds based on information provided by Lipper. The Trustees also considered the advisory fees charged by MFS to institutional accounts. In comparing these fees, the Trustees considered the generally broader scope of services provided by MFS to the Trust than those provided to institutional accounts. The Trustees also considered the higher demands placed on MFS’ investment personnel and trading infrastructure as a result of the daily cash in-flows and out-flows of the Portfolio, and the impact on MFS and related expenses due to the more extensive regulatory regime to which the Portfolio is subject, compared to institutional accounts.
In considering the fees, the Trustees noted from the Lipper data that the Portfolio’s effective advisory fee rate and total expense ratio were each approximately at the median of such fees and expenses of funds in the Lipper expense group. The Trustees further noted that the New Agreement would reflect MFS’ agreement to reduce the advisory fee on average daily net assets over $1 billion on a permanent basis. In addition, the Trustees accepted MFS’ offer to continue to reduce the advisory fee for the Portfolio on average daily net assets over $2.5 billion, and concluded that the breakpoints were sufficient to allow the Portfolio to benefit from economies of scale as its assets grow. The Trustees concluded that the fees were reasonable in light of the nature and quality of services provided.
The Trustees also considered whether the Portfolio is likely to benefit from any economies of scale due to future asset growth. In this regard, the Trustees reviewed the adequacy of breakpoints and discussed with MFS any adjustments necessary for the shareholders’ benefit.
The Trustees also considered information prepared by MFS relating to its costs and profits with respect to the Portfolio and other investment companies and accounts advised by MFS, as well as MFS’ methodologies used to determine and allocate its costs to the Portfolio and other accounts and products for purposes of estimating profitability.
The Trustees noted that there would be no increase to the net advisory fee arrangement for the Portfolio under the New Agreement when compared to the Portfolio’s then current investment advisory agreement. After reviewing these and other factors described below, the Trustees concluded that the advisory fees charged to the Portfolio under the New Agreement represent reasonable compensation in light of the nature and quality of the services being provided by MFS.
In addition, the Trustees considered MFS’ resources and related efforts to continue to retain, attract and motivate capable personnel to serve the Portfolio. The Trustees also considered the financial resources of MFS and its parent, Sun Life Financial Inc. The Trustees further considered any advantages and possible disadvantages of having an adviser which also serves other investment companies as well as institutional accounts.
The Trustees also considered the nature, quality, cost, and extent of administrative, transfer agency, and distribution services provided to the Trust by MFS and its affiliates under agreements and plans other than the New Agreement, including the 12b-1 fees the Portfolio pays to MFS Fund Distributors, Inc., an affiliate of MFS. The Trustees also considered the nature, extent and quality of certain other services MFS performs or arranges on the Portfolio’s behalf, which may include securities lending programs, directed expense payment programs, class action recovery programs, and MFS’ interaction with third-party service
29
Table of Contents
MFS Core Equity Portfolio
Board Approval of New Investment Advisory Agreement – continued
providers, principally custodians and sub-custodians. The Trustees concluded that the various non-advisory services provided by MFS and its affiliates on behalf of the Portfolio were satisfactory. The Trustees also considered the benefits to MFS from the use of the Portfolio’s portfolio brokerage commissions to pay for investment research and various other factors. Additionally, the Trustees considered so-called “fall-out benefits” to MFS such as reputational value derived from serving as investment manager to the Trust, and determined that any such benefits derived by MFS were reasonable and fair.
Based on their evaluation of factors that they deemed to be material, including those factors described above, the Board of Trustees, including a majority of the independent Trustees, concluded that the New Agreement should be approved for an initial two-year period, commencing upon its effective date, as set forth in the New Agreement.
BOARD APPROVAL OF CONTINUATION OF PRIOR INVESTMENT ADVISORY AGREEMENT
The Investment Company Act of 1940 requires that both the full Board of Trustees and a majority of the non-interested (“independent”) Trustees, voting separately, annually approve the continuation of the investment advisory agreement between MFS Variable Insurance Trust II (the “Trust”) and Massachusetts Financial Services Company (“MFS”) on behalf of the Fund. The Trustees consider matters bearing on the Fund and the advisory arrangements at their meetings throughout the year, including a review of performance data at each regular meeting. In addition, the independent Trustees met in person in May and again in July 2011 (“contract review meetings”) for the specific purpose of considering whether to approve the continuation of the investment advisory agreement for the Fund. The independent Trustees were assisted in their evaluation of the investment advisory agreement by independent legal counsel, from whom they received separate legal advice and with whom they met separately from MFS management during various contract review meetings. The independent Trustees were also assisted in this process by the Fund’s Independent Chief Compliance Officer, a full-time senior officer appointed by and reporting to the independent Trustees.
In connection with their deliberations, the Trustees, including the independent Trustees, considered such information and factors as they believed, in light of the legal advice furnished to them and their own business judgment, to be relevant. The investment advisory agreement was considered separately for the Fund, although the Trustees also took into account the common interests of all Funds in the Trust in their review. As described below, the Trustees considered the nature, quality, and extent of the various investment advisory, administrative, and shareholder services performed by MFS under the existing investment advisory agreement and other arrangements with the Trust.
In connection with their contract review meetings, the Trustees received and relied upon materials which included, among other items: (i) information provided by Lipper Inc. (“Lipper”) on the investment performance of the Fund for various time periods ended December 31, 2010, compared to the investment performance of a group of funds with substantially similar investment classifications/objectives (the “Lipper performance universe”), (ii) information provided by Lipper on the Fund’s advisory fees and other expenses compared to the advisory fees and other expenses of comparable funds identified by Lipper (the “Lipper expense group”), (iii) information provided by MFS on the advisory fees of comparable portfolios of its other clients, including institutional separate account and other clients, (iv) information as to whether, and to what extent applicable, expense waivers, reimbursements or fee “breakpoints” are observed for the Fund, (v) information regarding MFS’ financial results and financial condition, including MFS’ and certain of its affiliates’ estimated profitability from services performed for the Fund and other investment companies that the Board oversees as a whole, and for MFS’ institutional business, (vi) MFS’ views regarding the outlook for the mutual fund industry and its strategic business plans, (vii) descriptions of various functions performed by MFS for the Trust, such as compliance monitoring and portfolio trading practices, and (viii) information regarding the overall organization of MFS, including information about MFS’ senior management and other personnel providing investment advisory, administrative and other services to the Fund. The comparative performance, fee and expense information prepared and provided by Lipper was not independently verified, and the independent Trustees did not independently verify any information provided to them by MFS.
The Trustees’ conclusion as to the continuation of the investment advisory agreement was based on comprehensive consideration of all information provided to the Trustees and was not the result of any single factor. Some of the factors that figured particularly in the Trustees’ deliberations are described below for the Fund, while individual Trustees may have given different weight to various factors and evaluated the information presented as a whole differently than another individual Trustee. The Trustees recognized that the fee arrangements for the Fund reflect years of review and discussion between the independent Trustees and MFS, that certain aspects of such arrangements may receive greater scrutiny in some years than others, and that the Trustees’ conclusions may be based, in part, on their consideration of these same arrangements during the course of the year and in prior years.
30
Table of Contents
MFS Core Equity Portfolio
Board Approval of Continuation of Prior Investment Advisory Agreement – continued
Based on information provided by Lipper, the Trustees compared the Fund’s total return investment performance to the performance of the Lipper performance universe over various time periods. The Trustees placed particular emphasis on the total return performance of the Fund’s Initial Class shares in comparison to the performance of funds in its Lipper performance universe over the one-, three- and five -year periods ended December 31, 2010. The Trustees did not rely on performance results for more recent periods, including those shown elsewhere in this report.
The Trustees noted the performance of the Fund’s Initial Class shares was in the 2nd quintile relative to the other funds in the Lipper performance universe for the one-year period (the 1st quintile being the best performers and the 5th quintile being the worst performers). The total return performance of the Fund was also in the 2nd quintile for the three-year and the five-year periods ended December 31, 2010, relative to the Lipper performance universe. Based on the nature and quality of services provided by MFS, the Board of Trustees concluded that the Fund’s performance was satisfactory.
In the course of their deliberations, the Trustees took into account information provided by MFS during contract review meetings, as well as during investment review meetings conducted with portfolio management personnel during the course of the year.
In assessing the reasonableness of the Fund’s advisory fee, the Trustees considered, among other information, the Fund’s advisory fee and the total expense ratio of the Fund’s Initial Class shares as a percentage of average daily net assets, compared to the advisory fee and total expense ratios of its peer group of funds based on information provided by Lipper. The Trustees also considered the advisory fees charged by MFS to institutional accounts. In comparing these fees, the Trustees considered the generally broader scope of services provided by MFS to the Trust than those provided to institutional accounts. The Trustees also considered the higher demands placed on MFS’ investment personnel and trading infrastructure as a result of the daily cash in-flows and out-flows of the Fund, and the impact on MFS and related expenses due to the more extensive regulatory regime to which the Fund is subject, compared to institutional accounts.
In considering the fees, the Trustees noted from the Lipper data (which takes into account any reductions or expense limitations) that the Fund’s effective advisory fee rate and total expense ratio were each approximately at the median of such fees and expenses of funds in the Lipper expense group. The Trustees accepted MFS’ offer to continue to reduce the advisory fee for the Portfolio on average daily net assets over $2.5 billion, and concluded that the existing breakpoints were sufficient to allow the Fund to benefit from economies of scale as its assets grow. The Trustees concluded that the fees were reasonable in light of the nature and quality of services provided.
The Trustees also considered information prepared by MFS relating to its costs and profits with respect to the Fund and other investment companies and accounts advised by MFS, as well as MFS’ methodologies used to determine and allocate its costs to the Fund and other accounts and products for purposes of estimating profitability.
After reviewing these and other factors described below, the Trustees concluded that the advisory fees charged to the Fund represent reasonable compensation in light of the nature and quality of the services being provided by MFS.
In addition, the Trustees considered MFS’ resources and related efforts to continue to retain, attract and motivate capable personnel to serve the Fund. The Trustees also considered the financial resources of MFS and its parent, Sun Life Financial Inc. The Trustees further considered any advantages and possible disadvantages of having an adviser which also serves other investment companies as well as institutional accounts.
The Trustees also considered the nature, quality, cost, and extent of administrative, transfer agency, and distribution services provided to the Fund by MFS and its affiliates under agreements and plans other than the investment advisory agreement, including the 12b-1 fees the Fund pays to MFS Fund Distributors, Inc., an affiliate of MFS. The Trustees also considered the nature, extent and quality of certain other services MFS performs or arranges on the Fund’s behalf, which may include securities lending programs, directed expense payment programs, class action recovery programs, and MFS’ interaction with third-party service providers, principally custodians and sub-custodians. The Trustees concluded that the various non-advisory services provided by MFS and its affiliates on behalf of the Fund were satisfactory. The Trustees also considered the benefits to MFS from the use of the Fund’s portfolio brokerage commissions, if applicable, to pay for investment research and various other factors. Additionally, the Trustees considered so-called “fall-out benefits” to MFS such as reputational value derived from serving as investment manager to the Trust, and determined that any such benefits derived by MFS were reasonable and fair.
Based on their evaluation of factors that they deemed to be material, including those factors described above, the Board of Trustees, including a majority of the independent Trustees, concluded that the investment advisory agreement should be continued for an additional one-year period, commencing September 1, 2011.
A discussion regarding the Board’s most recent review and renewal of the fund’s Investment Advisory Agreement with MFS is available by clicking on the fund’s name under “Variable Insurance Portfolios — VIT II” in the “Products and Performance” section of the MFS Web site (mfs.com).
31
Table of Contents
MFS Core Equity Portfolio
PROXY VOTING POLICIES AND INFORMATION
A general description of the MFS funds’ proxy voting policies and procedures is available without charge, upon request, by calling 1-800-225-2606, by visiting the Proxy Voting section of mfs.com or by visiting the SEC’s Web site at http://www.sec.gov.
Information regarding how the fund voted proxies relating to portfolio securities during the most recent twelve-month period ended June 30 is available without charge by visiting the Proxy Voting section of mfs.com or by visiting the SEC’s Web site at http://www.sec.gov.
QUARTERLY PORTFOLIO DISCLOSURE
The fund will file a complete schedule of portfolio holdings with the Securities and Exchange Commission (the Commission) for the first and third quarters of each fiscal year on Form N-Q. The fund’s Form N-Q is available on the EDGAR database on the Commission’s Internet Web site at http://www.sec.gov and may be reviewed and copied at the:
Public Reference Room
Securities and Exchange Commission
100 F Street, NE, Room 1580
Washington, D.C. 20549
Information on the operation of the Public Reference Room may be obtained by calling the Commission at 1-800-SEC-0330. Copies of the fund’s Form N-Q also may be obtained, upon payment of a duplicating fee, by electronic request at the following e-mail address: publicinfo@sec.gov or by writing the Public Reference Section at the above address.
From time to time, MFS may post important information about the fund or the MFS funds on the MFS web site (mfs.com). This information is available by visiting the “News & Commentary” section of mfs.com or by clicking on the fund’s name under “Variable Insurance Portfolios — VIT II” in the “Products and Performance” section of mfs.com.
FEDERAL TAX INFORMATION (unaudited)
The following information is provided pursuant to provisions of the Internal Revenue Code.
For corporate shareholders, 100% of the ordinary income dividends paid during the fiscal year qualify for the corporate dividends received deduction.
32
Table of Contents
rev. 3/11

| Why? | Financial companies choose how they share your personal information. Federal law gives consumers the right to limit some but not all sharing. Federal law also requires us to tell you how we collect, share, and protect your personal information. Please read this notice carefully to understand what we do. |
| What? | The types of personal information we collect and share depend on the product or service you have with us. This information can include:
• Social Security number and account balances • Account transactions and transaction history • Checking account information and wire transfer instructions
When you are no longer our customer, we continue to share your information as described in this notice. |
| How? | All financial companies need to share customers’ personal information to run their everyday business. In the section below, we list the reasons financial companies can share their customers’ personal information; the reasons MFS chooses to share; and whether you can limit this sharing. |
| Reasons we can share your personal information | Does MFS share? | Can you limit this sharing? | ||
For our everyday business purposes – such as to process your transactions, maintain your account(s), respond to court orders and legal investigations, or report to credit bureaus | Yes | No | ||
For our marketing purposes – to offer our products and services to you | No | We don’t share | ||
| For joint marketing with other financial companies | No | We don’t share | ||
For our affiliates’ everyday business purposes – information about your transactions and experiences | No | We don’t share | ||
For our affiliates’ everyday business purposes – information about your creditworthiness | No | We don’t share | ||
| For nonaffiliates to market to you | No | We don’t share |
| Questions? | Call 800-225-2606 or go to mfs.com. |
33
Table of Contents
| Page 2 |
| Who we are | ||
| Who is providing this notice? | MFS Funds, MFS Investment Management, MFS Institutional Advisors, Inc., MFS Fund Distributors, Inc., MFS Heritage Trust Company, and MFS Service Center, Inc. | |
| What we do | ||
| How does MFS protect my personal information? | To protect your personal information from unauthorized access and use, we use security measures that comply with federal law. These measures include procedural, electronic, and physical safeguards for the protection of the personal information we collect about you. | |
| How does MFS collect my personal information? | We collect your personal information, for example, when you
• open an account or provide account information • direct us to buy securities or direct us to sell your securities • make a wire transfer
We also collect your personal information from others, such as credit bureaus, affiliates and other companies. | |
| Why can’t I limit all sharing? | Federal law gives you the right to limit only
• sharing for affiliates’ everyday business purposes – information about your creditworthiness • affiliates from using your information to market to you • sharing for nonaffiliates to market to you
State laws and individual companies may give you additional rights to limit sharing. | |
| Definitions | ||
| Affiliates | Companies related by common ownership or control. They can be financial and nonfinancial companies.
• MFS does not share personal information with affiliates, except for everyday business purposes as described on page one of this notice. | |
| Nonaffiliates | Companies not related by common ownership or control. They can be financial and nonfinancial companies.
• MFS does not share with nonaffiliates so they can market to you. | |
| Joint Marketing | A formal agreement between nonaffiliated financial companies that together market financial products or services to you.
• MFS doesn’t jointly market. | |
| Other important information | ||
| If you own an MFS product or receive an MFS service in the name of a third party such as a bank or broker-dealer, their privacy policy may apply to you instead of ours. | ||
34
Table of Contents

Table of Contents

MFS® Strategic Income Portfolio
MFS® Variable Insurance Trust II

ANNUAL REPORT
December 31, 2011
SIS-ANN
Table of Contents
MFS® STRATEGIC INCOME PORTFOLIO
The report is prepared for the general information of contract owners.
It is authorized for distribution to prospective investors only when preceded or accompanied by a current prospectus.
NOT FDIC INSURED Ÿ MAY LOSE VALUE Ÿ NO BANK OR CREDIT UNION GUARANTEE Ÿ NOT A DEPOSIT Ÿ NOT INSURED BY ANY FEDERAL GOVERNMENT AGENCY OR NCUA/NCUSIF
Table of Contents
MFS Strategic Income Portfolio
LETTER FROM THE CHAIRMAN AND CEO

Dear Contract Owners:
We are indeed living through some volatile times. Economic uncertainty is everywhere, as it seems no place in the world has been unmoved by crisis. We have seen a devastating earthquake and tsunami that have led to disruptions in the Japanese markets
and supply chains. Protests have changed the face of the Middle East and left in their wake lingering tensions and resultant higher oil prices. We have seen debt limits tested in Europe and the United States and policymakers grappling to craft often unpopular monetary and fiscal responses at a time when consumers and businesses struggle with what appears to be a slowing global economy. On top of all of that, we have seen long-term U.S. debt lose its Standard & Poor’s AAA rating and the long-term debt ratings of 15 eurozone nations put on negative watch.
When markets become volatile, managing risk becomes a top priority for investors and their advisors. At MFS® risk management is foremost in our minds in all market climates. Our analysts and portfolio managers keep risks firmly in mind when evaluating securities. Additionally, we have a team of quantitative analysts that measures and assesses the risk profiles of our portfolios and securities on an ongoing basis. The chief investment risk officer, who oversees the team, reports directly to the firm’s president and chief investment officer so the risk associated with each portfolio can be assessed objectively and independently of the portfolio management team.
As always, we continue to be mindful of the many economic challenges faced at the local, national, and international levels. It is in times such as these that we want to remind investors of the merits of maintaining a long-term view, adhering to basic investing principles such as asset allocation and diversification, and working closely with their advisors to research and identify appropriate investment opportunities.
Respectfully,

Robert J. Manning
Chairman and Chief Executive Officer
MFS Investment Management®
February 15, 2012
The opinions expressed in this letter are subject to change, may not be relied upon for investment advice, and no forecasts can be guaranteed.
1
Table of Contents
MFS Strategic Income Portfolio
Portfolio structure (i)
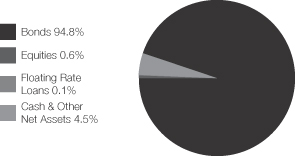
| Fixed income sectors (i) | ||||
| High Grade Corporates | 39.8% | |||
| High Yield Corporates | 29.4% | |||
| Non-U.S. Government Bonds | 14.8% | |||
| Emerging Markets Bonds | 5.8% | |||
| Commercial Mortgage-Backed Securities | 1.9% | |||
| U.S. Government Agencies | 1.4% | |||
| Mortgage-Backed Securities | 0.6% | |||
| Collateralized Debt Obligations | 0.6% | |||
| Asset-Backed Securities | 0.5% | |||
| Floating Rate Loans | 0.1% |
| Composition including fixed income credit quality (a)(i) | ||||
| AAA | 7.7% | |||
| AA | 9.3% | |||
| A | 15.8% | |||
| BBB | 27.7% | |||
| BB | 12.4% | |||
| B | 14.4% | |||
| CCC | 5.0% | |||
| CC | 0.1% | |||
| C | 0.3% | |||
| D (o) | 0.0% | |||
| Federal Agencies | 1.9% | |||
| Not Rated | 0.3% | |||
| Non-Fixed Income | 0.6% | |||
| Cash & Other | 4.5% |
| Portfolio facts (i) | ||||
| Average Duration (d) | 4.6 | |||
| Average Effective Maturity (m) | 7.3 yrs. |
| Issuer country weightings (i)(x) | ||||
| United States | 67.2% | |||
| Japan | 4.4% | |||
| United Kingdom | 3.2% | |||
| Canada | 2.7% | |||
| France | 2.5% | |||
| Germany | 2.3% | |||
| Italy | 2.1% | |||
| Netherlands | 1.7% | |||
| Brazil | 1.6% | |||
| Other Countries | 12.3% |
| (a) | For all securities other than those specifically described below, ratings are assigned to underlying securities utilizing ratings from Moody’s, Fitch, and Standard & Poor’s rating agencies and applying the following hierarchy: If all three agencies provide a rating, the middle rating (after dropping the highest and lowest ratings) is assigned; if two of the three agencies rate a security, the lower of the two is assigned. Ratings are shown in the S&P and Fitch scale (e.g., AAA). All ratings are subject to change. Federal Agencies includes rated and unrated U.S. Agency fixed-income securities, U.S. Agency mortgage-backed securities, and collateralized mortgage obligations of U.S. Agency mortgage-backed securities. Not Rated includes fixed income securities, which have not been rated by any rating agency. Non-Fixed Income includes equity securities (including convertible bonds and equity derivatives) and commodities. Cash & Other includes cash, other assets less liabilities, offsets to derivative positions, and short-term securities. The fund may not hold all of these instruments. The fund is not rated by these agencies. |
| (d) | Duration is a measure of how much a bond’s price is likely to fluctuate with general changes in interest rates, e.g., if rates rise 1.00%, a bond with a 5-year duration is likely to lose about 5.00% of its value due to the interest rate move. |
2
Table of Contents
MFS Strategic Income Portfolio
Portfolio Composition – continued
| (i) | For purposes of this presentation, the components include the market value of securities, and reflect the impact of the equivalent exposure of derivative positions. These amounts may be negative from time to time. The bond component will include any accrued interest amounts. Equivalent exposure is a calculated amount that translates the derivative position into a reasonable approximation of the amount of the underlying asset that the portfolio would have to hold at a given point in time to have the same |
| price sensitivity that results from the portfolio’s ownership of the derivative contract. When dealing with derivatives, equivalent exposure is a more representative measure of the potential impact of a position on portfolio performance than market value. Where the fund holds convertible bonds, these are treated as part of the equity portion of the portfolio. |
| (m) | In determining an instrument’s effective maturity for purposes of calculating the fund’s dollar-weighted average effective maturity, MFS uses the instrument’s stated maturity or, if applicable, an earlier date on which MFS believes it is probable that a maturity-shortening device (such as a put, pre-refunding or prepayment) will cause the instrument to be repaid. Such an earlier date can be substantially shorter than the instrument’s stated maturity. |
| (o) | Less than 0.1%. |
| (x) | Represents the portfolio’s exposure to issuer countries as a percentage of a portfolio’s total net assets. |
Percentages are based on net assets as of 12/31/11.
The portfolio is actively managed and current holdings may be different.
3
Table of Contents
MFS Strategic Income Portfolio
Summary of Results
For the twelve months ended December 31, 2011, Initial Class shares of the MFS Strategic Income Portfolio (the “fund”) provided a total return of 4.67%, while Service Class shares of the fund provided a total return of 4.31%. These compare with a return of 4.98% for the fund’s benchmark, the Barclays Capital U.S. High-Yield Corporate Bond Index. The fund’s other benchmark, the MFS Strategic Income Blended Index (“Blended Index”), generated a return of 6.54%. The Blended Index reflects the blended returns of various fixed income market indices, with percentage allocations to each index designed to resemble the fixed income allocations of the fund. The market indices and related percentage allocations used to compile the Blended Index are set forth in the Performance Summary.
Market Environment
Early in the period, the U.S. Federal Reserve (the “Fed”) responded to weak economic growth by loosening monetary policy further. More easing by the Fed improved market sentiment and drove risk-asset prices markedly higher. The December 2010 agreement on a surprisingly large (relative to expectations) expansionary U.S. fiscal package also boosted sentiment. During the subsequent several months, the renewed positive market sentiment, coupled with better indications of global macroeconomic activity, pushed many asset valuations to post-crisis highs. At the same time, the yields of the perceived “safest” global sovereign credits rose, indicating a renewed risk-seeking environment.
However, towards the middle of the period, a weakening macroeconomic backdrop and renewed concerns over peripheral euro zone sovereign debt caused a flight-to-quality move that pushed high-quality sovereign bond yields lower. In the U.S., concerns about sovereign debt default and the long-term sustainability of the trend in U.S. fiscal policy resulted in one agency downgrading U.S. credit quality. Amidst this turmoil, global equity markets declined sharply. As a result of these developments, global consumer and producer sentiment indicators fell precipitously and highly-rated sovereign bond yields hit multi-decade lows. Towards the end of the reporting period, uncertainty in financial markets spiked higher as markets more seriously contemplated the possible failure of the euro zone.
Detractors from Performance
Credit quality, primarily the fund’s greater exposure to “BBB” rated (r) securities, was a primary detractor from performance relative to the Blended Index as these credit quality sectors underperformed higher-rated securities over the reporting period.
Yield curve (y) positioning, particularly the fund’s lesser exposure to shifts at the long end of the yield curve (centered around maturities of 10 years or more), was another detractor from the fund’s relative results as the yield curve flattened over the reporting period.
A greater relative exposure to the financial and banking sectors hindered relative performance. These market segments underperformed the Blended Index as Europe’s mounting sovereign debt crisis put pressure on most financial companies.
Contributors to Performance
Relative to the Blended Index, the fund’s avoidance of Turkish bonds, and a lesser exposure to Russian bonds, were key drivers of positive performance. A greater exposure to corporate bonds in the industrial sector also benefited relative returns as this market segment turned in strong performance over the reporting period.
Security selection was another positive factor for relative results. Individual securities that were among the fund’s top relative contributors included the debt of Anthracite CDO (h), drugstore chain CVS Caremark, energy infrastructure operator Kinder Morgan Energy Partners, enterprise software products maker Oracle, and television network operator NBCUniversal Media.
Respectfully,
| William Adams | James Calmas | David Cole | Robert Persons | |||
| Portfolio Manager | Portfolio Manager | Portfolio Manager | Portfolio Manager | |||
| Matthew Ryan | Erik Weisman | |||||
| Portfolio Manager | Portfolio Manager | |||||
Note to Contract Owners: Effective May 1, 2011, William Adams and David Cole replaced John Addeo as co-managers of the fund.
4
Table of Contents
MFS Strategic Income Portfolio
Management Review – continued
| (h) | Security was not held in the fund at period end. |
| (r) | Bonds rated “BBB”, “Baa”, or higher are considered investment grade; bonds rated “BB”, “Ba”, or below are considered non-investment grade. The source for bond quality ratings is Moody’s Investors Service, Standard & Poor’s and Fitch, Inc. and are applied using the following hierarchy: If all three agencies provide a rating, the middle rating (after dropping the highest and lowest ratings) is assigned; if two of the three agencies rate a security, the lower of the two is assigned. Ratings are shown in the S&P and Fitch scale (e.g., AAA). For securities which are not rated by any of the three agencies, the security is considered Not Rated. |
| (y) | A yield curve graphically depicts the yields of different maturity bonds of the same credit quality and type; a normal yield curve is upward sloping, with short-term rates lower than long-term rates. |
The views expressed in this report are those of the portfolio managers only through the end of the period of the report as stated on the cover and do not necessarily reflect the views of MFS or any other person in the MFS organization. These views are subject to change at any time based on market or other conditions, and MFS disclaims any responsibility to update such views. These views may not be relied upon as investment advice or an indication of trading intent on behalf of any MFS portfolio. References to specific securities are not recommendations of such securities, and may not be representative of any MFS portfolio’s current or future investments.
5
Table of Contents
MFS Strategic Income Portfolio
PERFORMANCE SUMMARY THROUGH 12/31/11
The following chart illustrates the historical performance of the fund in comparison to its benchmark(s). Benchmarks are unmanaged and may not be invested in directly. Benchmark returns do not reflect any fees or expenses. The performance of other share classes will be greater than or less than that of the class depicted below. (See Notes to Performance Summary.)
Performance data shown represents past performance and is no guarantee of future results. Investment return and principal value fluctuate so your units, when sold, may be worth more or less than the original cost; current performance may be lower or higher than quoted. The performance shown does not reflect the deduction of taxes, if any, that a contract holder would pay on fund distributions or the redemption of contract units. The returns for the fund shown also do not reflect the deduction of expenses associated with variable products, such as mortality and expense risk charges, separate account charges, and sales charges imposed by the insurance company separate accounts. Such expenses would reduce the overall returns shown.
Growth of a Hypothetical $10,000 Investment
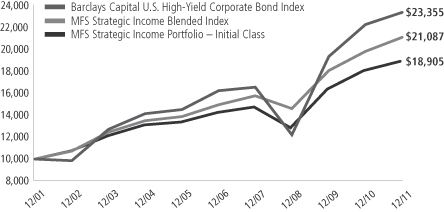
Total Returns through 12/31/11
Average annual total returns
| Share class | Class inception date | 1-yr | 5-yr | 10-yr | ||||||||
| Initial Class | 5/06/98 | 4.67% | 5.81% | 6.58% | ||||||||
| Service Class | 8/24/01 | 4.31% | 5.53% | 6.30% | ||||||||
| Comparative benchmarks | ||||||||||||
| Barclays Capital U.S. High-Yield Corporate Bond Index (f) | 4.98% | 7.54% | 8.85% | |||||||||
| MFS Strategic Income Blended Index (f)(x) | 6.54% | 7.13% | 7.75% | |||||||||
| Barclays Capital U.S. Credit Bond Index (f) | 8.35% | 6.80% | 6.35% | |||||||||
| Barclays Capital U.S. Government/Mortgage Bond Index (f) | 7.74% | 6.56% | 5.64% | |||||||||
| Citigroup World Government Bond Non-Dollar Hedged Index (f) | 4.06% | 4.34% | 4.43% | |||||||||
| Citigroup World Government Bond Non-Dollar Index (f) | 5.17% | 7.23% | 8.36% | |||||||||
| JPMorgan Emerging Markets Bond Index Global (f) | 8.46% | 8.08% | 11.04% | |||||||||
| (f) | Source: FactSet Research Systems Inc. |
| (x) | MFS Strategic Income Blended Index is at a point in time and allocations during the period can change. As of December 31, 2011 the blended index was comprised of 10% Barclays Capital U.S. Credit Bond Index, 33% Barclays Capital U.S. High-Yield Corporate Bond Index, 14% JPMorgan Emerging Markets Bond Index Global, 8.5% Citigroup World Government Bond Non-Dollar Hedged Index, 8.5% Citigroup World Government Bond Non-Dollar Index, and 26% Barclays Capital U.S. Government/Mortgage Bond Index. |
Benchmark Definitions
Barclays Capital U.S. Credit Bond Index – a market capitalization-weighted index that measures the performance of publicly issued, SEC-registered, U.S. corporate and specified foreign debentures and secured notes that meet specified maturity, liquidity, and quality requirements.
Barclays Capital U.S. Government/Mortgage Bond Index – measures debt issued by the U.S. Government, and its agencies, as well as mortgage-backed pass-through securities of Ginnie Mae (GNMA), Fannie Mae (FNMA), and Freddie Mac (FHLMC).
6
Table of Contents
MFS Strategic Income Portfolio
Performance Summary – continued
Barclays Capital U.S. High-Yield Corporate Bond Index – a market capitalization-weighted index that measures the performance of non-investment grade, fixed rate debt. Eurobonds and debt issues from countries designated as emerging markets (e.g., Argentina, Brazil, Venezuela, etc.) are excluded.
Citigroup World Government Bond Non-Dollar Hedged Index – a market capitalization-weighted index that is designed to represent the currency-hedged performance of the international developed government bond markets, excluding the United States.
Citigroup World Government Bond Non-Dollar Index – a market capitalization-weighted index that is designed to represent the performance of the international developed government bond markets, excluding the United States.
JPMorgan Emerging Markets Bond Index Global – measures the performance of U.S.-dollar-denominated debt instruments issued by emerging market sovereign and quasi-sovereign entities: Brady bonds, loans, Eurobonds.
It is not possible to invest directly in an index.
Notes to Performance Summary
Average annual total return represents the average annual change in value for each share class for the periods presented.
Performance results reflect any applicable expense subsidies and waivers in effect during the periods shown. Without such subsidies and waivers the fund’s performance results would be less favorable. Please see the prospectus and financial statements for complete details. All results are historical and assume the reinvestment of any dividends and capital gains distributions.
Performance results do not include adjustments made for financial reporting purposes in accordance with U.S. generally accepted accounting principles and may differ from amounts reported in the financial highlights.
From time to time the fund may receive proceeds from litigation settlements, without which performance would be lower.
7
Table of Contents
MFS Strategic Income Portfolio
Fund Expenses Borne by the Contract Holders During the Period,
July 1, 2011 through December 31, 2011
As a contract holder of the fund, you incur ongoing costs, including management fees; distribution and/or service (12b-1) fees; and other fund expenses. This example is intended to help you understand your ongoing costs (in dollars) of investing in the fund and to compare these costs with the ongoing costs of investing in other mutual funds.
The example is based on an investment of $1,000 invested at the beginning of the period and held for the entire period July 1, 2011 through December 31, 2011.
Actual Expenses
The first line for each share class in the following table provides information about actual account values and actual expenses. You may use the information in this line, together with the amount you invested, to estimate the expenses that you paid over the period. Simply divide your account value by $1,000 (for example, an $8,600 account value divided by $1,000 = 8.6), then multiply the result by the number in the first line under the heading entitled “Expenses Paid During Period” to estimate the expenses you paid on your account during this period.
Hypothetical Example for Comparison Purposes
The second line for each share class in the following table provides information about hypothetical account values and hypothetical expenses based on the fund’s actual expense ratio and an assumed rate of return of 5% per year before expenses, which is not the fund’s actual return. The hypothetical account values and expenses may not be used to estimate the actual ending account balance or expenses you paid for the period. You may use this information to compare the ongoing costs of investing in the fund and other funds. To do so, compare this 5% hypothetical example with the 5% hypothetical examples that appear in the shareholder reports of the other funds.
Please note that the expenses shown in the table are meant to highlight the fund’s ongoing costs only and do not take into account the fees and expenses imposed under the variable contracts through which your investment in the fund is made. Therefore, the second line for each share class in the table is useful in comparing ongoing costs associated with an investment in vehicles (such as the fund) which fund benefits under variable annuity and variable life insurance contracts and to qualified pension and retirement plans only, and will not help you determine the relative total costs of investing in the fund through variable annuity and variable life insurance contracts. If the fees and expenses imposed under the variable contracts were included, your costs would have been higher.
| Share Class | Annualized Expense Ratio | Beginning Account Value 7/01/11 | Ending Account Value 12/31/11 | Expenses Paid During Period (p) 7/01/11-12/31/11 | ||||||||||||||
| Initial Class | Actual | 0.90% | $1,000.00 | $1,009.87 | $4.56 | |||||||||||||
| Hypothetical (h) | 0.90% | $1,000.00 | $1,020.67 | $4.58 | ||||||||||||||
| Service Class | Actual | 1.15% | $1,000.00 | $1,007.13 | $5.82 | |||||||||||||
| Hypothetical (h) | 1.15% | $1,000.00 | $1,019.41 | $5.85 | ||||||||||||||
| (h) | 5% class return per year before expenses. |
| (p) | Expenses paid is equal to each class’ annualized expense ratio, as shown above, multiplied by the average account value over the period, multiplied by the number of days in the period, divided by the number of days in the year. |
8
Table of Contents
MFS Strategic Income Portfolio
PORTFOLIO OF INVESTMENTS – 12/31/11
The Portfolio of Investments is a complete list of all securities owned by your fund. It is categorized by broad-based asset classes.
| Issuer | Shares/Par | Value ($) | ||||||
| BONDS – 92.7% | ||||||||
| Aerospace – 0.6% | ||||||||
| BE Aerospace, Inc., 8.5%, 2018 | $ | 45,000 | $ | 49,239 | ||||
| Bombardier, Inc., 7.5%, 2018 (n) | 85,000 | 90,950 | ||||||
| Bombardier, Inc., 7.75%, 2020 (n) | 25,000 | 27,250 | ||||||
| CPI International, Inc., 8%, 2018 | 55,000 | 45,788 | ||||||
| Hawker Beechcraft Acquisition Co. LLC, 8.5%, 2015 | 65,000 | 12,025 | ||||||
| Huntington Ingalls Industries, Inc., 7.125%, 2021 (n) | 95,000 | 93,100 | ||||||
|
| |||||||
| $ | 318,352 | |||||||
|
| |||||||
| Airlines – 0.3% | ||||||||
| Continental Airlines, Inc., FRN, 0.878%, 2013 | $ | 151,785 | $ | 142,632 | ||||
|
| |||||||
| Apparel Manufacturers – 0.2% | ||||||||
| Hanesbrands, Inc., 8%, 2016 | $ | 30,000 | $ | 32,625 | ||||
| Hanesbrands, Inc., 6.375%, 2020 | 30,000 | 30,450 | ||||||
| Phillips-Van Heusen Corp., 7.375%, 2020 | 55,000 | 59,675 | ||||||
|
| |||||||
| $ | 122,750 | |||||||
|
| |||||||
| Asset-Backed & Securitized – 3.0% | ||||||||
| ARCap REIT, Inc., CDO, “H”, FRN, 6.013%, 2045 (a)(d)(z) | $ | 34,474 | $ | 2 | ||||
| Bayview Financial Revolving Mortgage Loan Trust, FRN, 1.893%, 2040 (z) | 173,670 | 98,956 | ||||||
| Capital Trust Realty Ltd., CDO, 5.16%, 2035 (n) | 149,720 | 148,522 | ||||||
| Chase Commercial Mortgage Securities Corp., 6.6%, 2029 (z) | 67,834 | 69,276 | ||||||
| Crest Ltd., “A1” CDO, FRN, 1.053%, 2018 (z) | 123,908 | 105,322 | ||||||
| Crest Ltd., CDO, 7%, 2040 (a)(p) | 299,620 | 14,981 | ||||||
| Deutsche Mortgage & Asset Receiving Corp., FRN, 7.5%, 2031 | 11,775 | 11,766 | ||||||
| Falcon Franchise Loan LLC, FRN, 4.696%, 2023 (i)(z) | 194,793 | 11,707 | ||||||
| Falcon Franchise Loan LLC, FRN, 4.806%, 2025 (i)(z) | 271,088 | 34,509 | ||||||
| First Union-Lehman Brothers Bank of America, FRN, 0.443%, 2035 (i) | 1,883,077 | 27,630 | ||||||
| First Union-Lehman Brothers Commercial Mortgage Trust, 7%, 2029 (n) | 10,854 | 10,970 | ||||||
| GMAC LLC, FRN, 6.02%, 2033 (z) | 150,669 | 154,707 | ||||||
| Hertz Global Holdings, Inc., 4.26%, 2014 (n) | 150,000 | 153,552 | ||||||
| Morgan Stanley Capital I, Inc., FRN, 1.383%, 2039 (i)(z) | 1,375,372 | 28,360 | ||||||
| Prudential Securities Secured Financing Corp., FRN, 7.289%, 2013 (z) | 411,000 | 377,680 | ||||||
| Salomon Brothers Mortgage Securities, Inc., FRN, 7.161%, 2032 (z) | 210,129 | 215,941 | ||||||
|
| |||||||
| $ | 1,463,881 | |||||||
|
| |||||||
| Automotive – 2.0% | ||||||||
| Accuride Corp., 9.5%, 2018 | $ | 100,000 | $ | 96,500 | ||||
| Allison Transmission, Inc., 7.125%, 2019 (n) | 75,000 | 73,500 | ||||||
| Ford Motor Co., 7.45%, 2031 | 55,000 | 66,000 | ||||||
| Issuer | Shares/Par | Value ($) | ||||||
| BONDS – continued | ||||||||
| Automotive – continued | ||||||||
| Ford Motor Credit Co. LLC, 12%, 2015 | $ | 230,000 | $ | 281,748 | ||||
| General Motors Financial Co., Inc., 6.75%, 2018 (n) | 80,000 | 81,600 | ||||||
| Harley-Davidson Financial Services, 3.875%, 2016 (n) | 190,000 | 196,823 | ||||||
| Lear Corp., 8.125%, 2020 | 35,000 | 38,500 | ||||||
| RCI Banque S.A., 4.6%, 2016 (n) | 140,000 | 133,264 | ||||||
|
| |||||||
| $ | 967,935 | |||||||
|
| |||||||
| Banks & Diversified Financials (Covered Bonds) – 0.5% | ||||||||
| Bank of Nova Scotia, 1.45%, 2013 (n) | $ | 240,000 | $ | 242,778 | ||||
|
| |||||||
| Basic Industry – 0.1% | ||||||||
| Trimas Corp., 9.75%, 2017 | $ | 55,000 | $ | 59,675 | ||||
|
| |||||||
| Broadcasting – 2.3% | ||||||||
| Allbritton Communications Co., 8%, 2018 | $ | 45,000 | $ | 44,663 | ||||
| AMC Networks, Inc., 7.75%, 2021 (n) | 34,000 | 36,975 | ||||||
| CBS Corp., 5.75%, 2020 | 40,000 | 44,971 | ||||||
| Clear Channel Communications, Inc., 9%, 2021 | 49,000 | 41,283 | ||||||
| EH Holding Corp., 7.625%, 2021 (n) | 30,000 | 31,500 | ||||||
| Gray Television, Inc., 10.5%, 2015 | 15,000 | 14,175 | ||||||
| Intelsat Bermuda Ltd., 11.25%, 2017 | 85,000 | 82,238 | ||||||
| Intelsat Jackson Holdings Ltd., 9.5%, 2016 | 120,000 | 125,400 | ||||||
| Intelsat Jackson Holdings Ltd., 11.25%, 2016 | 25,000 | 26,266 | ||||||
| LBI Media, Inc., 8.5%, 2017 (z) | 55,000 | 30,319 | ||||||
| Liberty Media Corp., 8.5%, 2029 | 45,000 | 43,650 | ||||||
| Local TV Finance LLC, 9.25%, 2015 (p)(z) | 76,186 | 72,758 | ||||||
| NBCUniversal Media LLC, 5.95%, 2041 | 161,000 | 189,242 | ||||||
| Newport Television LLC, 13%, 2017 (n)(p) | 24,956 | 21,225 | ||||||
| Nexstar Broadcasting Group, Inc., 8.875%, 2017 | 20,000 | 20,500 | ||||||
| Sinclair Broadcast Group, Inc., 9.25%, 2017 (n) | 25,000 | 27,250 | ||||||
| Sinclair Broadcast Group, Inc., 8.375%, 2018 | 5,000 | 5,163 | ||||||
| SIRIUS XM Radio, Inc., 13%, 2013 (n) | 30,000 | 34,050 | ||||||
| SIRIUS XM Radio, Inc., 8.75%, 2015 (n) | 30,000 | 32,850 | ||||||
| SIRIUS XM Radio, Inc., 7.625%, 2018 (n) | 75,000 | 78,750 | ||||||
| Univision Communications, Inc., 6.875%, 2019 (n) | 70,000 | 67,550 | ||||||
| Univision Communications, Inc., 7.875%, 2020 (n) | 20,000 | 20,300 | ||||||
| Univision Communications, Inc., 8.5%, 2021 (n) | 35,000 | 31,850 | ||||||
|
| |||||||
| $ | 1,122,928 | |||||||
|
| |||||||
| Brokerage & Asset Managers – 0.8% | ||||||||
| E*TRADE Financial Corp., 7.875%, 2015 | $ | 40,000 | $ | 40,200 | ||||
| E*TRADE Financial Corp., 12.5%, 2017 | 25,000 | 28,250 | ||||||
| TD AMERITRADE Holding Corp., 5.6%, 2019 | 310,000 | 335,187 | ||||||
|
| |||||||
| $ | 403,637 | |||||||
|
| |||||||
| Building – 0.6% | ||||||||
| Associated Materials LLC, 9.125%, 2017 | $ | 15,000 | $ | 13,088 | ||||
| Building Materials Holding Corp., 6.875%, 2018 (n) | 20,000 | 21,000 | ||||||
9
Table of Contents
MFS Strategic Income Portfolio
Portfolio of Investments – continued
| Issuer | Shares/Par | Value ($) | ||||||
| BONDS – continued | ||||||||
| Building – continued | ||||||||
| Building Materials Holding Corp., 7%, 2020 (n) | $ | 20,000 | $ | 21,500 | ||||
| Building Materials Holding Corp., 6.75%, 2021 (n) | 20,000 | 21,000 | ||||||
| CRH PLC, 8.125%, 2018 | 120,000 | 136,922 | ||||||
| Nortek, Inc., 10%, 2018 (n) | 10,000 | 9,475 | ||||||
| Nortek, Inc., 8.5%, 2021 (n) | 80,000 | 67,600 | ||||||
| Roofing Supply Group LLC/Roofing Supply Finance, Inc., 8.625%, 2017 (n) | 5,000 | 5,100 | ||||||
|
| |||||||
| $ | 295,685 | |||||||
|
| |||||||
| Business Services – 0.5% | ||||||||
| Ceridian Corp., 12.25%, 2015 (p) | $ | 25,000 | $ | 19,375 | ||||
| iGate Corp., 9%, 2016 (n) | 45,000 | 46,463 | ||||||
| Interactive Data Corp., 10.25%, 2018 | 50,000 | 54,750 | ||||||
| Iron Mountain, Inc., 8.375%, 2021 | 60,000 | 63,900 | ||||||
| SunGard Data Systems, Inc., 10.25%, 2015 | 36,000 | 37,305 | ||||||
| SunGard Data Systems, Inc., 7.375%, 2018 | 20,000 | 20,475 | ||||||
|
| |||||||
| $ | 242,268 | |||||||
|
| |||||||
| Cable TV – 2.8% | ||||||||
| Bresnan Broadband Holdings LLC, 8%, 2018 (n) | $ | 10,000 | $ | 10,400 | ||||
| Cablevision Systems Corp., 8.625%, 2017 | 35,000 | 38,763 | ||||||
| CCH II LLC, 13.5%, 2016 | 55,000 | 63,525 | ||||||
| CCO Holdings LLC, 7.875%, 2018 | 85,000 | 90,631 | ||||||
| CCO Holdings LLC, 8.125%, 2020 | 55,000 | 60,225 | ||||||
| Cequel Communications Holdings, 8.625%, 2017 (n) | 25,000 | 26,500 | ||||||
| CSC Holdings LLC, 8.5%, 2014 | 35,000 | 38,719 | ||||||
| DIRECTV Holdings LLC, 5.875%, 2019 | 70,000 | 78,793 | ||||||
| DISH DBS Corp., 6.75%, 2021 | 20,000 | 21,550 | ||||||
| EchoStar Corp., 7.125%, 2016 | 30,000 | 32,325 | ||||||
| Insight Communications Co., Inc., 9.375%, 2018 (n) | 40,000 | 45,700 | ||||||
| Mediacom LLC, 9.125%, 2019 | 45,000 | 47,756 | ||||||
| Myriad International Holdings B.V., 6.375%, 2017 (n) | 128,000 | 136,320 | ||||||
| TCI Communications, Inc., 9.8%, 2012 | 245,000 | 246,624 | ||||||
| Time Warner Cable, Inc., 8.25%, 2019 | 190,000 | 238,642 | ||||||
| Videotron LTEE, 6.875%, 2014 | 21,000 | 21,053 | ||||||
| Virgin Media Finance PLC, 8.375%, 2019 | 100,000 | 109,750 | ||||||
| Ziggo Bond Co. B.V., 8%, 2018 (n) | EUR | 50,000 | 65,360 | |||||
|
| |||||||
| $ | 1,372,636 | |||||||
|
| |||||||
| Chemicals – 1.9% | ||||||||
| Celanese U.S. Holdings LLC, 6.625%, 2018 | $ | 85,000 | $ | 90,313 | ||||
| Dow Chemical Co., 8.55%, 2019 | 260,000 | 340,165 | ||||||
| Hexion U.S. Finance Corp./Hexion Nova Scotia Finance, 8.875%, 2018 | 70,000 | 65,625 | ||||||
| Hexion U.S. Finance Corp./Hexion Nova Scotia Finance, 9%, 2020 | 10,000 | 8,250 | ||||||
| Huntsman International LLC, 8.625%, 2021 | 80,000 | 84,800 | ||||||
| Lyondell Chemical Co., 11%, 2018 | 71,549 | 78,167 | ||||||
| Momentive Performance Materials, Inc., 12.5%, 2014 | 65,000 | 68,900 | ||||||
| Issuer | Shares/Par | Value ($) | ||||||
| BONDS – continued | ||||||||
| Chemicals – continued | ||||||||
| Momentive Performance Materials, Inc., 11.5%, 2016 | $ | 49,000 | $ | 36,505 | ||||
| Nalco Co., 8.25%, 2017 | 10,000 | 11,350 | ||||||
| Polypore International, Inc., 7.5%, 2017 | 50,000 | 51,750 | ||||||
| Sociedad Quimica y Minera de Chile S.A., 5.5%, 2020 (n) | 100,000 | 106,975 | ||||||
|
| |||||||
| $ | 942,800 | |||||||
|
| |||||||
| Computer Software – 0.5% | ||||||||
| Lawson Software, Inc., 11.5%, 2018 (n) | $ | 55,000 | $ | 53,350 | ||||
| Oracle Corp., 5.375%, 2040 | 103,000 | 125,483 | ||||||
| Syniverse Holdings, Inc., 9.125%, 2019 | 45,000 | 47,475 | ||||||
|
| |||||||
| $ | 226,308 | |||||||
|
| |||||||
| Computer Software – Systems – 0.3% | ||||||||
| CDW LLC/CDW Finance Corp., 12.535%, 2017 | $ | 15,000 | $ | 15,075 | ||||
| CDW LLC/CDW Finance Corp., 8.5%, 2019 | 65,000 | 65,488 | ||||||
| DuPont Fabros Technology, Inc., REIT, 8.5%, 2017 | 45,000 | 48,150 | ||||||
| Eagle Parent, Inc., 8.625%, 2019 (n) | 20,000 | 19,100 | ||||||
|
| |||||||
| $ | 147,813 | |||||||
|
| |||||||
| Conglomerates – 0.5% | ||||||||
| Amsted Industries, Inc., 8.125%, 2018 (n) | $ | 75,000 | $ | 79,500 | ||||
| Dynacast International LLC, 9.25%, 2019 (z) | 35,000 | 32,900 | ||||||
| Griffon Corp., 7.125%, 2018 | 70,000 | 69,300 | ||||||
| Tomkins LLC/Tomkins, Inc., 9%, 2018 | 76,000 | 84,265 | ||||||
|
| |||||||
| $ | 265,965 | |||||||
|
| |||||||
| Consumer Products – 0.7% | ||||||||
| Easton-Bell Sports, Inc., 9.75%, 2016 | $ | 45,000 | $ | 49,050 | ||||
| Elizabeth Arden, Inc., 7.375%, 2021 | 50,000 | 52,000 | ||||||
| Libbey Glass, Inc., 10%, 2015 | 41,000 | 43,870 | ||||||
| Mattel, Inc., 5.45%, 2041 | 83,000 | 84,044 | ||||||
| Visant Corp., 10%, 2017 | 35,000 | 32,025 | ||||||
| Whirlpool Corp., 8%, 2012 | 91,000 | 93,031 | ||||||
|
| |||||||
| $ | 354,020 | |||||||
|
| |||||||
| Consumer Services – 0.4% | ||||||||
| Realogy Corp., 11.5%, 2017 | $ | 50,000 | $ | 39,000 | ||||
| Service Corp. International, 7%, 2017 | 135,000 | 146,475 | ||||||
| Service Corp. International, 7%, 2019 | 10,000 | 10,525 | ||||||
|
| |||||||
| $ | 196,000 | |||||||
|
| |||||||
| Containers – 0.4% | ||||||||
| Graham Packaging Co. LP/GPC Capital Corp., 9.875%, 2014 | $ | 35,000 | $ | 35,569 | ||||
| Greif, Inc., 6.75%, 2017 | 125,000 | 130,625 | ||||||
| Packaging Dynamics Corp., 8.75%, 2016 (z) | 20,000 | 20,000 | ||||||
| Sealed Air Corp., 8.125%, 2019 (n) | 5,000 | 5,475 | ||||||
| Sealed Air Corp., 8.375%, 2021 (n) | 5,000 | 5,525 | ||||||
|
| |||||||
| $ | 197,194 | |||||||
|
| |||||||
| Defense Electronics – 0.7% | ||||||||
| BAE Systems Holdings, Inc., 5.2%, 2015 (n) | $ | 212,000 | $ | 227,945 | ||||
| BAE Systems Holdings, Inc., 6.375%, 2019 (n) | 60,000 | 67,126 | ||||||
10
Table of Contents
MFS Strategic Income Portfolio
Portfolio of Investments – continued
| Issuer | Shares/Par | Value ($) | ||||||
| BONDS – continued | ||||||||
| Defense Electronics – continued | ||||||||
| ManTech International Corp., 7.25%, 2018 | $ | 45,000 | $ | 45,844 | ||||
|
| |||||||
| $ | 340,915 | |||||||
|
| |||||||
| Electrical Equipment – 0.0% | ||||||||
| Avaya, Inc., 9.75%, 2015 | $ | 25,000 | $ | 22,500 | ||||
|
| |||||||
| Electronics – 0.3% | ||||||||
| Freescale Semiconductor, Inc., 9.25%, 2018 (n) | $ | 50,000 | $ | 53,438 | ||||
| Freescale Semiconductor, Inc., 8.05%, 2020 | 30,000 | 28,200 | ||||||
| Sensata Technologies B.V., 6.5%, 2019 (n) | 90,000 | 88,875 | ||||||
|
| |||||||
| $ | 170,513 | |||||||
|
| |||||||
| Emerging Market Quasi-Sovereign – 2.4% | ||||||||
| Banco do Brasil S.A., 5.875%, 2022 (n) | $ | 277,000 | $ | 277,277 | ||||
| IIRSA Norte Finance Ltd., 8.75%, 2024 | 124,092 | 142,246 | ||||||
| Petrobras International Finance Co., 7.875%, 2019 | 117,000 | 139,663 | ||||||
| Petrobras International Finance Co., 6.75%, 2041 | 73,000 | 83,887 | ||||||
| Petroleos Mexicanos, 5.5%, 2021 | 116,000 | 125,860 | ||||||
| Petroleos Mexicanos, 6.5%, 2041 | 10,000 | 11,250 | ||||||
| Petroleos Mexicanos, 6.5%, 2041 (n) | 49,000 | 55,125 | ||||||
| Ras Laffan Liquefied Natural Gas Co. Ltd., 5.832%, 2016 (n) | 193,950 | 207,527 | ||||||
| VEB Finance Ltd., 6.902%, 2020 (n) | 132,000 | 135,300 | ||||||
|
| |||||||
| $ | 1,178,135 | |||||||
|
| |||||||
| Emerging Market Sovereign – 0.6% | ||||||||
| Republic of Argentina, FRN, 0.438%, 2012 | $ | 37,863 | $ | 36,944 | ||||
| Republic of Philippines, 6.375%, 2034 | 100,000 | 119,375 | ||||||
| Republic of Poland, 5%, 2022 | 13,000 | 13,065 | ||||||
| Republic of South Africa, 5.5%, 2020 | 113,000 | 126,560 | ||||||
| United Mexican States, 5.95%, 2019 | 6,000 | 7,131 | ||||||
|
| |||||||
| $ | 303,075 | |||||||
|
| |||||||
| Energy – Independent – 3.4% | ||||||||
| Anadarko Petroleum Corp., 5.95%, 2016 | $ | 160,000 | $ | 181,368 | ||||
| ATP Oil & Gas Corp., 11.875%, 2015 | 30,000 | 19,725 | ||||||
| Bill Barrett Corp., 9.875%, 2016 | 45,000 | 49,500 | ||||||
| Bill Barrett Corp., 7.625%, 2019 | 10,000 | 10,450 | ||||||
| BreitBurn Energy Partners LP, 8.625%, 2020 | 25,000 | 26,156 | ||||||
| Carrizo Oil & Gas, Inc., 8.625%, 2018 | 25,000 | 25,250 | ||||||
| Carrizo Oil & Gas, Inc., 8.625%, 2018 (n) | 5,000 | 5,025 | ||||||
| Chaparral Energy, Inc., 8.875%, 2017 | 80,000 | 82,800 | ||||||
| Chesapeake Energy Corp., 6.875%, 2020 | 25,000 | 26,750 | ||||||
| Concho Resources, Inc., 8.625%, 2017 | 35,000 | 38,238 | ||||||
| Concho Resources, Inc., 6.5%, 2022 | 60,000 | 62,700 | ||||||
| Connacher Oil & Gas Ltd., 8.5%, 2019 (n) | 25,000 | 22,625 | ||||||
| Continental Resources, Inc., 8.25%, 2019 | 45,000 | 49,500 | ||||||
| Denbury Resources, Inc., 8.25%, 2020 | 65,000 | 72,638 | ||||||
| Energy XXI Gulf Coast, Inc., 9.25%, 2017 | 80,000 | 86,800 | ||||||
| EXCO Resources, Inc., 7.5%, 2018 | 70,000 | 66,150 | ||||||
| Harvest Operations Corp., 6.875%, 2017 (n) | 80,000 | 82,800 | ||||||
| Hilcorp Energy I/Hilcorp Finance Co., 8%, 2020 (n) | 20,000 | 21,400 | ||||||
| Laredo Petroleum, Inc., 9.5%, 2019 (n) | 30,000 | 31,800 | ||||||
| LINN Energy LLC, 6.5%, 2019 (n) | 15,000 | 14,888 | ||||||
| Issuer | Shares/Par | Value ($) | ||||||
| BONDS – continued | ||||||||
| Energy – Independent – continued | ||||||||
| LINN Energy LLC, 8.625%, 2020 | $ | 30,000 | $ | 32,550 | ||||
| LINN Energy LLC, 7.75%, 2021 | 37,000 | 38,480 | ||||||
| Newfield Exploration Co., 6.625%, 2014 | 60,000 | 60,675 | ||||||
| Newfield Exploration Co., 6.625%, 2016 | 25,000 | 25,750 | ||||||
| Newfield Exploration Co., 6.875%, 2020 | 35,000 | 37,450 | ||||||
| Pioneer Natural Resources Co., 7.5%, 2020 | 95,000 | 111,420 | ||||||
| QEP Resources, Inc., 6.875%, 2021 | 95,000 | 102,363 | ||||||
| Quicksilver Resources, Inc., 9.125%, 2019 | 25,000 | 26,500 | ||||||
| Range Resources Corp., 8%, 2019 | 35,000 | 39,025 | ||||||
| SandRidge Energy, Inc., 8%, 2018 (n) | 85,000 | 85,850 | ||||||
| SM Energy Co., 6.5%, 2021 (n) | 45,000 | 46,350 | ||||||
| Swift Energy Co., 7.875%, 2022 (n) | 20,000 | 19,750 | ||||||
| Talisman Energy, Inc., 7.75%, 2019 | 20,000 | 24,661 | ||||||
| Whiting Petroleum Corp., 6.5%, 2018 | 30,000 | 31,350 | ||||||
|
| |||||||
| $ | 1,658,737 | |||||||
|
| |||||||
| Energy – Integrated – 1.3% | ||||||||
| BP Capital Markets PLC, 4.5%, 2020 | $ | 46,000 | $ | 50,663 | ||||
| BP Capital Markets PLC, 4.742%, 2021 | 130,000 | 147,245 | ||||||
| Cenovus Energy, Inc., 4.5%, 2014 | 60,000 | 64,637 | ||||||
| Hess Corp., 8.125%, 2019 | 60,000 | 77,020 | ||||||
| Pacific Rubiales Energy Corp., 7.25%, 2021 (z) | 115,000 | 115,575 | ||||||
| Petro-Canada Financial Partnership, 5%, 2014 | 170,000 | 183,718 | ||||||
|
| |||||||
| $ | 638,858 | |||||||
|
| |||||||
| Engineering – Construction – 0.1% | ||||||||
| B-Corp. Merger Sub, Inc., 8.25%, 2019 (n) | $ | 40,000 | $ | 37,600 | ||||
|
| |||||||
| Entertainment – 0.7% | ||||||||
| AMC Entertainment, Inc., 8.75%, 2019 | $ | 90,000 | $ | 93,150 | ||||
| AMC Entertainment, Inc., 9.75%, 2020 | 35,000 | 33,250 | ||||||
| Cinemark USA, Inc., 8.625%, 2019 | 75,000 | 81,563 | ||||||
| Viacom, Inc., 3.875%, 2021 | 120,000 | 122,504 | ||||||
|
| |||||||
| $ | 330,467 | |||||||
|
| |||||||
| Financial Institutions – 1.8% | ||||||||
| CIT Group, Inc., 5.25%, 2014 (n) | $ | 70,000 | $ | 69,738 | ||||
| CIT Group, Inc., 7%, 2017 | 215,000 | 215,000 | ||||||
| CIT Group, Inc., 6.625%, 2018 (n) | 53,000 | 54,855 | ||||||
| General Electric Capital Corp., 6%, 2019 | 50,000 | 57,431 | ||||||
| General Electric Capital Corp., 5.5%, 2020 | 110,000 | 121,032 | ||||||
| GMAC, Inc., 8%, 2031 | 10,000 | 9,650 | ||||||
| International Lease Finance Corp., 8.75%, 2017 | 70,000 | 72,100 | ||||||
| International Lease Finance Corp., 7.125%, 2018 (n) | 69,000 | 71,415 | ||||||
| Nationstar Mortgage LLC, 10.875%, 2015 | 85,000 | 84,150 | ||||||
| SLM Corp., 8.45%, 2018 | 25,000 | 25,750 | ||||||
| SLM Corp., 8%, 2020 | 90,000 | 90,900 | ||||||
|
| |||||||
| $ | 872,021 | |||||||
|
| |||||||
| Food & Beverages – 1.9% | ||||||||
| Anheuser-Busch InBev S.A., 7.75%, 2019 | $ | 220,000 | $ | 284,935 | ||||
| ARAMARK Corp., 8.5%, 2015 | 50,000 | 51,250 | ||||||
| B&G Foods, Inc., 7.625%, 2018 | 80,000 | 85,000 | ||||||
| Corp Lindley S.A., 6.75%, 2021 (n) | 3,000 | 3,060 | ||||||
| Kraft Foods, Inc., 6.125%, 2018 | 170,000 | 200,590 | ||||||
11
Table of Contents
MFS Strategic Income Portfolio
Portfolio of Investments – continued
| Issuer | Shares/Par | Value ($) | ||||||
| BONDS – continued | ||||||||
| Food & Beverages – continued | ||||||||
| Pinnacle Foods Finance LLC, 9.25%, 2015 | $ | 65,000 | $ | 66,706 | ||||
| Pinnacle Foods Finance LLC, 10.625%, 2017 | 20,000 | 21,000 | ||||||
| Pinnacle Foods Finance LLC, 8.25%, 2017 | 15,000 | 15,600 | ||||||
| TreeHouse Foods, Inc., 7.75%, 2018 | 45,000 | 48,713 | ||||||
| Tyson Foods, Inc., 6.85%, 2016 | 120,000 | 131,700 | ||||||
|
| |||||||
| $ | 908,554 | |||||||
|
| |||||||
| Food & Drug Stores – 0.4% | ||||||||
| CVS Caremark Corp., 5.75%, 2041 | $ | 180,000 | $ | 214,332 | ||||
|
| |||||||
| Forest & Paper Products – 0.8% | ||||||||
| Boise, Inc., 8%, 2020 | $ | 45,000 | $ | 47,588 | ||||
| Cascades, Inc., 7.75%, 2017 | 35,000 | 34,650 | ||||||
| Georgia-Pacific Corp., 8%, 2024 | 40,000 | 51,284 | ||||||
| Graphic Packaging Holding Co., 7.875%, 2018 | 30,000 | 31,950 | ||||||
| Inversiones CMPC S.A., 4.75%, 2018 (n) | 136,000 | 141,884 | ||||||
| Votorantim Participacoes S.A., 6.75%, 2021 (n) | 100,000 | 105,750 | ||||||
|
| |||||||
| $ | 413,106 | |||||||
|
| |||||||
| Gaming & Lodging – 2.2% | ||||||||
| Boyd Gaming Corp., 7.125%, 2016 | $ | 60,000 | $ | 51,900 | ||||
| FelCor Lodging LP, REIT, 6.75%, 2019 | 15,000 | 14,400 | ||||||
| Firekeepers Development Authority, 13.875%, 2015 (n) | 65,000 | 73,775 | ||||||
| Fontainebleau Las Vegas Holdings LLC, 10.25%, 2015 (a)(d)(n) | 95,000 | 59 | ||||||
| GWR Operating Partnership LLP, 10.875%, 2017 | 25,000 | 27,188 | ||||||
| Harrah’s Operating Co., Inc., 11.25%, 2017 | 100,000 | 106,125 | ||||||
| Harrah’s Operating Co., Inc., 10%, 2018 | 4,000 | 2,600 | ||||||
| Harrah’s Operating Co., Inc., 10%, 2018 | 32,000 | 21,920 | ||||||
| Host Hotels & Resorts, Inc., 6.75%, 2016 | 45,000 | 46,238 | ||||||
| Marriott International, Inc., 5.625%, 2013 | 120,000 | 125,103 | ||||||
| MGM Mirage, 10.375%, 2014 | 5,000 | 5,713 | ||||||
| MGM Mirage, 6.625%, 2015 | 20,000 | 19,000 | ||||||
| MGM Mirage, 7.5%, 2016 | 10,000 | 9,575 | ||||||
| MGM Resorts International, 11.375%, 2018 | 55,000 | 60,500 | ||||||
| MGM Resorts International, 9%, 2020 | 45,000 | 49,838 | ||||||
| Penn National Gaming, Inc., 8.75%, 2019 | 75,000 | 81,563 | ||||||
| Seven Seas Cruises S. de R.L., 9.125%, 2019 (n) | 35,000 | 35,788 | ||||||
| Wyndham Worldwide Corp., 6%, 2016 | 90,000 | 97,056 | ||||||
| Wyndham Worldwide Corp., 5.75%, 2018 | 140,000 | 148,207 | ||||||
| Wyndham Worldwide Corp., 7.375%, 2020 | 50,000 | 57,069 | ||||||
| Wynn Las Vegas LLC, 7.75%, 2020 | 60,000 | 66,600 | ||||||
|
| |||||||
| $ | 1,100,217 | |||||||
|
| |||||||
| Health Maintenance Organizations – 0.1% | ||||||||
| AMERIGROUP Corp., 7.5%, 2019 | $ | 40,000 | $ | 41,200 | ||||
|
| |||||||
| Industrial – 0.2% | ||||||||
| Altra Holdings, Inc., 8.125%, 2016 | $ | 35,000 | $ | 37,188 | ||||
| Mueller Water Products, Inc., 8.75%, 2020 | 42,000 | 45,623 | ||||||
|
| |||||||
| $ | 82,811 | |||||||
|
| |||||||
| Issuer | Shares/Par | Value ($) | ||||||
| BONDS – continued | ||||||||
| Insurance – 2.2% | ||||||||
| Allianz AG, 5.5% to 2014, FRN to 2049 | EUR | 248,000 | $ | 284,897 | ||||
| American International Group, Inc., 8.175% to 2038, FRN to 2068 | $ | 40,000 | 35,600 | |||||
| Metropolitan Life Global Funding I, 2.875%, 2012 (n) | 160,000 | 162,092 | ||||||
| Metropolitan Life Global Funding I, 5.125%, 2014 (n) | 80,000 | 86,138 | ||||||
| Principal Financial Group, Inc., 8.875%, 2019 | 130,000 | 161,856 | ||||||
| Prudential Financial, Inc., 6.2%, 2015 | 130,000 | 142,058 | ||||||
| Unum Group, 7.125%, 2016 | 160,000 | 182,577 | ||||||
|
| |||||||
| $ | 1,055,218 | |||||||
|
| |||||||
| Insurance – Property & Casualty – 2.5% | ||||||||
| Aon Corp., 3.5%, 2015 | $ | 140,000 | $ | 143,662 | ||||
| AXIS Capital Holdings Ltd., 5.75%, 2014 | 205,000 | 215,543 | ||||||
| AXIS Capital Holdings Ltd., 5.875%, 2020 | 50,000 | 51,405 | ||||||
| CNA Financial Corp., 5.875%, 2020 | 160,000 | 164,360 | ||||||
| Liberty Mutual Group, Inc., 10.75% to 2038, FRN to 2088 (n) | 70,000 | 87,850 | ||||||
| PartnerRe Ltd., 5.5%, 2020 | 107,000 | 107,904 | ||||||
| QBE Capital Funding III Ltd., FRN, 7.25%, 2041 (n) | 200,000 | 176,108 | ||||||
| Travelers Cos., Inc., 3.9%, 2020 | 220,000 | 234,313 | ||||||
| USI Holdings Corp., 9.75%, 2015 (z) | 40,000 | 38,300 | ||||||
|
| |||||||
| $ | 1,219,445 | |||||||
|
| |||||||
| International Market Quasi-Sovereign – 2.6% | ||||||||
| Bank of Ireland, 2.75%, 2012 (n) | $ | 130,000 | $ | 128,870 | ||||
| EDF Energies Nouvelles S.A., 6.5%, 2019 (n) | 230,000 | 260,182 | ||||||
| ING Bank N.V., 3.9%, 2014 (n) | 190,000 | 200,452 | ||||||
| Irish Life & Permanent PLC, 3.6%, 2013 (e)(n) | 400,000 | 349,830 | ||||||
| Swedbank AB, 2.8%, 2012 (n) | 100,000 | 100,236 | ||||||
| Vestjysk Bank A/S, FRN, 1.109%, 2013 (n) | 130,000 | 130,589 | ||||||
| Westpac Banking Corp., 3.45%, 2014 (n) | 100,000 | 106,083 | ||||||
|
| |||||||
| $ | 1,276,242 | |||||||
|
| |||||||
| International Market Sovereign – 11.7% | ||||||||
| Federal Republic of Germany, 3.75%, 2015 | EUR | 258,000 | $ | 367,308 | ||||
| Federal Republic of Germany, 4.25%, 2018 | EUR | 105,000 | 161,544 | |||||
| Federal Republic of Germany, 6.25%, 2030 | EUR | 129,000 | 256,732 | |||||
| Government of Canada, 4.5%, 2015 | CAD | 86,000 | 93,973 | |||||
| Government of Canada, 4.25%, 2018 | CAD | 45,000 | 51,546 | |||||
| Government of Canada, 5.75%, 2033 | CAD | 17,000 | 25,656 | |||||
| Government of Japan, 1.3%, 2014 | JPY | 41,700,000 | 559,282 | |||||
| Government of Japan, 1.7%, 2017 | JPY | 59,450,000 | 824,868 | |||||
| Government of Japan, 2.2%, 2027 | JPY | 19,100,000 | 271,091 | |||||
| Government of Japan, 2.4%, 2037 | JPY | 20,100,000 | 290,979 | |||||
| Kingdom of Belgium, 5.5%, 2017 | EUR | 113,000 | 160,094 | |||||
| Kingdom of Spain, 4.6%, 2019 | EUR | 162,000 | 208,893 | |||||
| Kingdom of the Netherlands, 3.75%, 2014 | EUR | 286,000 | 399,879 | |||||
12
Table of Contents
MFS Strategic Income Portfolio
Portfolio of Investments – continued
| Issuer | Shares/Par | Value ($) | ||||||
| BONDS – continued | ||||||||
| International Market Sovereign – continued | ||||||||
| Kingdom of the Netherlands, 5.5%, 2028 | EUR | 36,000 | $ | 64,377 | ||||
| Republic of Austria, 4.65%, 2018 | EUR | 139,000 | 201,399 | |||||
| Republic of France, 6%, 2025 | EUR | 111,000 | 182,910 | |||||
| Republic of France, 4.75%, 2035 | EUR | 149,000 | 224,913 | |||||
| Republic of Italy, 4.75%, 2013 | EUR | 284,000 | 365,454 | |||||
| Republic of Italy, 5.25%, 2017 | EUR | 379,000 | 468,776 | |||||
| United Kingdom Treasury, 8%, 2015 | GBP | 136,000 | 271,548 | |||||
| United Kingdom Treasury, 8%, 2021 | GBP | 51,000 | 121,390 | |||||
| United Kingdom Treasury, 4.25%, 2036 | GBP | 72,000 | 137,209 | |||||
|
| |||||||
| $ | 5,709,821 | |||||||
|
| |||||||
| Local Authorities – 0.7% | ||||||||
| Louisiana Gas & Fuels Tax Rev. (Build America Bonds), FRN, 3%, 2043 | $ | 160,000 | $ | 161,866 | ||||
| Province of Ontario, 5.45%, 2016 | 145,000 | 168,372 | ||||||
|
| |||||||
| $ | 330,238 | |||||||
|
| |||||||
| Machinery & Tools – 1.0% | ||||||||
| Atlas Copco AB, 5.6%, 2017 (n) | $ | 214,000 | $ | 242,166 | ||||
| Case Corp., 7.25%, 2016 | 25,000 | 26,813 | ||||||
| Case New Holland, Inc., 7.875%, 2017 | 130,000 | 146,900 | ||||||
| CNH Capital LLC, 6.25%, 2016 (n) | 10,000 | 10,300 | ||||||
| Rental Service Corp., 9.5%, 2014 | 10,000 | 10,275 | ||||||
| RSC Equipment Rental, Inc., 8.25%, 2021 | 55,000 | 55,688 | ||||||
|
| |||||||
| $ | 492,142 | |||||||
|
| |||||||
| Major Banks – 5.2% | ||||||||
| Bank of America Corp., 7.375%, 2014 | $ | 65,000 | $ | 67,396 | ||||
| Bank of America Corp., 6.5%, 2016 | 325,000 | 327,298 | ||||||
| Barclays Bank PLC, 5.125%, 2020 | 130,000 | 133,539 | ||||||
| BNP Paribas, 7.195% to 2037, FRN to 2049 (n) | 100,000 | 69,750 | ||||||
| BNP Paribas, FRN, 3.313%, 2014 | 78,000 | 73,443 | ||||||
| Commonwealth Bank of Australia, 5%, 2019 (n) | 140,000 | 148,475 | ||||||
| Credit Suisse New York, 5.5%, 2014 | 130,000 | 135,125 | ||||||
| Goldman Sachs Group, Inc., 6%, 2014 | 90,000 | 93,421 | ||||||
| Intesa Sanpaolo S.p.A., FRN, 2.906%, 2014 (n) | 100,000 | 88,045 | ||||||
| JPMorgan Chase & Co., 4.625%, 2021 | 140,000 | 144,851 | ||||||
| JPMorgan Chase Capital XXII, 6.45%, 2087 | 110,000 | 110,000 | ||||||
| JPMorgan Chase Capital XXVII, 7%, 2039 | 30,000 | 30,188 | ||||||
| Macquarie Group Ltd., 6%, 2020 (n) | 171,000 | 160,399 | ||||||
| Merrill Lynch & Co., Inc., 6.4%, 2017 | 90,000 | 87,147 | ||||||
| Morgan Stanley, 6%, 2014 | 100,000 | 100,972 | ||||||
| Morgan Stanley, 7.3%, 2019 | 100,000 | 101,845 | ||||||
| Morgan Stanley, 5.625%, 2019 | 100,000 | 92,608 | ||||||
| Royal Bank of Scotland Group PLC, 7.648% to 2031, FRN to 2049 | 80,000 | 54,500 | ||||||
| Standard Chartered PLC, 3.85%, 2015 (n) | 150,000 | 150,969 | ||||||
| SunTrust Banks, Inc., 3.5%, 2017 | 107,000 | 107,552 | ||||||
| UFJ Finance Aruba AEC, 6.75%, 2013 | 159,000 | 169,901 | ||||||
| Wells Fargo & Co., 7.98% to 2018, FRN to 2049 | 78,000 | 83,558 | ||||||
|
| |||||||
| $ | 2,530,982 | |||||||
|
| |||||||
| Issuer | Shares/Par | Value ($) | ||||||
| BONDS – continued | ||||||||
| Medical & Health Technology & Services – 3.2% | ||||||||
| Beagle Acquisition Corp., 11%, 2019 (n) | $ | 20,000 | $ | 20,925 | ||||
| Biomet, Inc., 10%, 2017 | 5,000 | 5,400 | ||||||
| Biomet, Inc., 10.375%, 2017 (p) | 25,000 | 27,063 | ||||||
| Biomet, Inc., 11.625%, 2017 | 65,000 | 70,525 | ||||||
| Cardinal Health, Inc., 5.8%, 2016 | 201,000 | 230,334 | ||||||
| Davita, Inc., 6.375%, 2018 | 65,000 | 66,544 | ||||||
| Davita, Inc., 6.625%, 2020 | 20,000 | 20,550 | ||||||
| Emergency Medical Services Corp., 8.125%, 2019 (z) | 15,000 | 14,963 | ||||||
| Fresenius Medical Care AG & Co. KGaA, 9%, 2015 (n) | 35,000 | 39,244 | ||||||
| HCA, Inc., 8.5%, 2019 | 145,000 | 158,775 | ||||||
| HCA, Inc., 7.5%, 2022 | 50,000 | 51,125 | ||||||
| Health Management Associates, Inc., 7.375%, 2020 (n) | 20,000 | 20,800 | ||||||
| HealthSouth Corp., 8.125%, 2020 | 105,000 | 105,788 | ||||||
| Hospira, Inc., 6.05%, 2017 | 100,000 | 110,401 | ||||||
| McKesson Corp., 5.7%, 2017 | 90,000 | 105,001 | ||||||
| Owens & Minor, Inc., 6.35%, 2016 | 170,000 | 184,600 | ||||||
| Tenet Healthcare Corp., 9.25%, 2015 | 30,000 | 31,538 | ||||||
| United Surgical Partners International, Inc., 8.875%, 2017 | 15,000 | 14,963 | ||||||
| United Surgical Partners International, Inc., 9.25%, 2017 (p) | 25,000 | 25,125 | ||||||
| Universal Health Services, Inc., 7%, 2018 | 35,000 | 36,313 | ||||||
| Universal Hospital Services, Inc., 8.5%, 2015 (p) | 85,000 | 85,850 | ||||||
| Universal Hospital Services, Inc., FRN, 4.12%, 2015 | 20,000 | 18,050 | ||||||
| Vanguard Health Systems, Inc., 8%, 2018 | 85,000 | 84,363 | ||||||
| VWR Funding, Inc., 10.25%, 2015 (p) | 30,352 | 31,338 | ||||||
|
| |||||||
| $ | 1,559,578 | |||||||
|
| |||||||
| Metals & Mining – 1.9% | ||||||||
| AK Steel Corp., 7.625%, 2020 | $ | 35,000 | $ | 32,900 | ||||
| ArcelorMittal, 5.5%, 2021 | 310,000 | 284,552 | ||||||
| Arch Coal, Inc., 7%, 2019 (n) | 55,000 | 56,100 | ||||||
| Cloud Peak Energy, Inc., 8.25%, 2017 | 75,000 | 79,875 | ||||||
| Cloud Peak Energy, Inc., 8.5%, 2019 | 70,000 | 75,600 | ||||||
| Consol Energy, Inc., 8%, 2017 | 35,000 | 38,325 | ||||||
| Consol Energy, Inc., 8.25%, 2020 | 20,000 | 22,100 | ||||||
| Fortescue Metals Group Ltd., 6.875%, 2018 (n) | 15,000 | 14,363 | ||||||
| Fortescue Metals Group Ltd., 8.25%, 2019 (n) | 30,000 | 30,525 | ||||||
| Peabody Energy Corp., 6%, 2018 (n) | 20,000 | 20,400 | ||||||
| Peabody Energy Corp., 6.25%, 2021 (n) | 20,000 | 20,700 | ||||||
| Southern Copper Corp., 6.75%, 2040 | 104,000 | 104,064 | ||||||
| Vale Overseas Ltd., 4.625%, 2020 | 100,000 | 103,410 | ||||||
| Vale Overseas Ltd., 6.875%, 2039 | 51,000 | 58,415 | ||||||
|
| |||||||
| $ | 941,329 | |||||||
|
| |||||||
| Mortgage-Backed – 0.6% | ||||||||
| Fannie Mae, 6.5%, 2032 | $ | 100,476 | $ | 114,106 | ||||
| Freddie Mac, 4.224%, 2020 | 146,497 | 162,210 | ||||||
|
| |||||||
| $ | 276,316 | |||||||
|
| |||||||
13
Table of Contents
MFS Strategic Income Portfolio
Portfolio of Investments – continued
| Issuer | Shares/Par | Value ($) | ||||||
| BONDS – continued | ||||||||
| Natural Gas – Distribution – 0.2% | ||||||||
| EQT Corp., 4.875%, 2021 | $ | 74,000 | $ | 74,699 | ||||
| Ferrellgas LP/Ferrellgas Finance Corp., 6.5%, 2021 | 30,000 | 26,400 | ||||||
|
| |||||||
| $ | 101,099 | |||||||
|
| |||||||
| Natural Gas – Pipeline – 2.5% | ||||||||
| Atlas Pipeline Partners LP/Finance Corp., 8.75%, 2018 (n) | $ | 80,000 | $ | 83,600 | ||||
| Crosstex Energy, Inc., 8.875%, 2018 | 75,000 | 81,938 | ||||||
| El Paso Corp., 7%, 2017 | 75,000 | 82,174 | ||||||
| El Paso Corp., 7.75%, 2032 | 80,000 | 92,400 | ||||||
| Enbridge Energy Partners LP, 4.2%, 2021 | 200,000 | 208,857 | ||||||
| Energy Transfer Equity LP, 7.5%, 2020 | 65,000 | 71,013 | ||||||
| Enterprise Products Partners LP, 8.375% to 2016, FRN to 2066 | 33,000 | 35,310 | ||||||
| Enterprise Products Partners LP, 7.034% to 2018, FRN to 2068 | 20,000 | 20,800 | ||||||
| Kinder Morgan Energy Partners LP, 5.85%, 2012 | 143,000 | 147,610 | ||||||
| Kinder Morgan Energy Partners LP, 6.375%, 2041 | 190,000 | 214,177 | ||||||
| Spectra Energy Capital LLC, 8%, 2019 | 164,000 | 206,380 | ||||||
|
| |||||||
| $ | 1,244,259 | |||||||
|
| |||||||
| Network & Telecom – 2.7% | ||||||||
| AT&T, Inc., 5.5%, 2018 | $ | 150,000 | $ | 173,630 | ||||
| AT&T, Inc., 3.875%, 2021 | 70,000 | 74,043 | ||||||
| CenturyLink, Inc., 7.6%, 2039 | 17,000 | 16,682 | ||||||
| Cincinnati Bell, Inc., 8.25%, 2017 | 15,000 | 15,075 | ||||||
| Cincinnati Bell, Inc., 8.75%, 2018 | 75,000 | 69,656 | ||||||
| Citizens Communications Co., 9%, 2031 | 30,000 | 27,375 | ||||||
| France Telecom, 4.375%, 2014 | 120,000 | 126,758 | ||||||
| Frontier Communications Corp., 8.125%, 2018 | 90,000 | 90,675 | ||||||
| Frontier Communications Corp., 8.5%, 2020 | 35,000 | 35,831 | ||||||
| Qwest Communications International, Inc., 7.125%, 2018 (n) | 50,000 | 52,000 | ||||||
| Qwest Corp., 7.5%, 2014 | 140,000 | 154,199 | ||||||
| Telefonica S.A., 5.877%, 2019 | 150,000 | 148,240 | ||||||
| Verizon Communications, Inc., 8.75%, 2018 | 140,000 | 189,102 | ||||||
| Windstream Corp., 8.125%, 2018 | 10,000 | 10,713 | ||||||
| Windstream Corp., 7.75%, 2020 | 95,000 | 98,206 | ||||||
| Windstream Corp., 7.75%, 2021 | 15,000 | 15,375 | ||||||
|
| |||||||
| $ | 1,297,560 | |||||||
|
| |||||||
| Oil Services – 0.3% | ||||||||
| Chesapeake Energy Corp., 6.625%, 2019 (n) | $ | 15,000 | $ | 15,600 | ||||
| Dresser-Rand Group, Inc., 6.5%, 2021 (z) | 10,000 | 10,225 | ||||||
| McJunkin Red Man Holding Corp., 9.5%, 2016 | 30,000 | 30,450 | ||||||
| Pioneer Drilling Co., 9.875%, 2018 | 65,000 | 67,925 | ||||||
| Pioneer Drilling Co., 9.875%, 2018 (n) | 5,000 | 5,225 | ||||||
| Unit Corp., 6.625%, 2021 | 5,000 | 5,000 | ||||||
|
| |||||||
| $ | 134,425 | |||||||
|
| |||||||
| Other Banks & Diversified Financials – 2.7% | ||||||||
| Bosphorus Financial Services Ltd., FRN, 2.257%, 2012 (z) | $ | 12,500 | $ | 12,487 | ||||
| Issuer | Shares/Par | Value ($) | ||||||
| BONDS – continued | ||||||||
| Other Banks & Diversified Financials – continued | ||||||||
| Citigroup, Inc., 6.375%, 2014 | $ | 120,000 | $ | 125,943 | ||||
| Citigroup, Inc., 6.01%, 2015 | 100,000 | 104,471 | ||||||
| Citigroup, Inc., 8.5%, 2019 | 88,000 | 103,584 | ||||||
| Groupe BPCE S.A., 12.5% to 2019, FRN to 2049 (n) | 157,000 | 141,721 | ||||||
| Lloyds TSB Bank PLC, 5.8%, 2020 (n) | 200,000 | 189,876 | ||||||
| Santander Holdings USA, Inc., 4.625%, 2016 | 20,000 | 19,206 | ||||||
| Santander International Debt S.A., 2.991%, 2013 (n) | 100,000 | 95,601 | ||||||
| Santander UK PLC, 8.963% to 2030, FRN to 2049 | 103,000 | 92,700 | ||||||
| Svenska Handelsbanken AB, 4.875%, 2014 (n) | 180,000 | 187,292 | ||||||
| UBS Preferred Funding Trust V, 6.243% to 2016, FRN to 2049 | 270,000 | 228,488 | ||||||
|
| |||||||
| $ | 1,301,369 | |||||||
|
| |||||||
| Pharmaceuticals – 1.1% | ||||||||
| Celgene Corp., 3.95%, 2020 | $ | 160,000 | $ | 161,140 | ||||
| Roche Holdings, Inc., 6%, 2019 (n) | 200,000 | 243,083 | ||||||
| Teva Pharmaceutical Finance LLC, 5.55%, 2016 | 87,000 | 98,342 | ||||||
| Valeant Pharmaceuticals International, Inc., 7%, 2020 (n) | 25,000 | 24,688 | ||||||
|
| |||||||
| $ | 527,253 | |||||||
|
| |||||||
| Pollution Control – 0.4% | ||||||||
| Republic Services, Inc., 5.25%, 2021 | $ | 130,000 | $ | 147,405 | ||||
| WCA Waste Corp., 7.5%, 2019 (n) | 45,000 | 45,450 | ||||||
|
| |||||||
| $ | 192,855 | |||||||
|
| |||||||
| Printing & Publishing – 0.2% | ||||||||
| American Media, Inc., 13.5%, 2018 (z) | $ | 6,759 | $ | 5,475 | ||||
| Nielsen Finance LLC, 11.5%, 2016 | 26,000 | 29,770 | ||||||
| Nielsen Finance LLC, 7.75%, 2018 | 45,000 | 48,600 | ||||||
|
| |||||||
| $ | 83,845 | |||||||
|
| |||||||
| Railroad & Shipping – 0.3% | ||||||||
| Kansas City Southern de Mexico S.A. de C.V., 6.125%, 2021 | $ | 20,000 | $ | 20,550 | ||||
| Kansas City Southern Railway, 8%, 2015 | 35,000 | 37,144 | ||||||
| Panama Canal Railway Co., 7%, 2026 (n) | 91,400 | 83,174 | ||||||
|
| |||||||
| $ | 140,868 | |||||||
|
| |||||||
| Real Estate – 1.6% | ||||||||
| Boston Properties LP, REIT, 3.7%, 2018 | $ | 73,000 | $ | 74,539 | ||||
| CNL Lifestyle Properties, Inc., REIT, 7.25%, 2019 | 25,000 | 23,125 | ||||||
| Entertainment Properties Trust, REIT, 7.75%, 2020 | 45,000 | 47,304 | ||||||
| HCP, Inc., REIT, 5.375%, 2021 | 141,000 | 147,822 | ||||||
| Kennedy Wilson, Inc., 8.75%, 2019 (n) | 25,000 | 24,375 | ||||||
| Kimco Realty Corp., REIT, 6.875%, 2019 | 36,000 | 41,425 | ||||||
| MPT Operating Partnership LP, REIT, 6.875%, 2021 | 30,000 | 29,738 | ||||||
| Simon Property Group, Inc., REIT, 6.1%, 2016 | 230,000 | 261,427 | ||||||
| WEA Finance LLC, REIT, 6.75%, 2019 (n) | 110,000 | 122,688 | ||||||
|
| |||||||
| $ | 772,443 | |||||||
|
| |||||||
14
Table of Contents
MFS Strategic Income Portfolio
Portfolio of Investments – continued
| Issuer | Shares/Par | Value ($) | ||||||
| BONDS – continued | ||||||||
| Retailers – 2.5% | ||||||||
| Academy Ltd., 9.25%, 2019 (n) | $ | 25,000 | $ | 24,688 | ||||
| AutoZone, Inc., 6.5%, 2014 | 230,000 | 252,665 | ||||||
| Burlington Coat Factory Warehouse Corp., 10%, 2019 | 45,000 | 43,988 | ||||||
| J. Crew Group, Inc., 8.125%, 2019 | 35,000 | 33,425 | ||||||
| Kohl’s Corp., 4%, 2021 | 65,000 | 66,595 | ||||||
| Limited Brands, Inc., 5.25%, 2014 | 59,000 | 61,360 | ||||||
| Limited Brands, Inc., 6.9%, 2017 | 40,000 | 43,100 | ||||||
| Limited Brands, Inc., 7%, 2020 | 15,000 | 16,238 | ||||||
| Limited Brands, Inc., 6.95%, 2033 | 20,000 | 18,550 | ||||||
| Macy’s, Inc., 8.125%, 2015 | 200,000 | 230,913 | ||||||
| Neiman Marcus Group, Inc., 10.375%, 2015 | 55,000 | 57,132 | ||||||
| QVC, Inc., 7.375%, 2020 (n) | 35,000 | 37,363 | ||||||
| Rite Aid Corp., 9.375%, 2015 | 30,000 | 28,950 | ||||||
| Sally Beauty Holdings, Inc., 6.875%, 2019 (z) | 20,000 | 20,900 | ||||||
| Staples, Inc., 9.75%, 2014 | 140,000 | 160,086 | ||||||
| Toys “R” Us Property Co. II LLC, 8.5%, 2017 | 30,000 | 31,050 | ||||||
| Toys “R” Us, Inc., 10.75%, 2017 | 50,000 | 54,688 | ||||||
| Yankee Aquisition Corp., 8.5%, 2015 | 10,000 | 10,100 | ||||||
| YCC Holdings LLC/Yankee Finance, Inc., 10.25%, 2016 (p) | 25,000 | 21,875 | ||||||
|
| |||||||
| $ | 1,213,666 | |||||||
|
| |||||||
| Specialty Chemicals – 0.3% | ||||||||
| Ecolab, Inc., 4.35%, 2021 | $ | 120,000 | $ | 128,147 | ||||
| Koppers, Inc., 7.875%, 2019 | 20,000 | 21,200 | ||||||
|
| |||||||
| $ | 149,347 | |||||||
|
| |||||||
| Specialty Stores – 0.1% | ||||||||
| Michaels Stores, Inc., 11.375%, 2016 | $ | 35,000 | $ | 37,097 | ||||
| Michaels Stores, Inc., 7.75%, 2018 | 35,000 | 35,350 | ||||||
|
| |||||||
| $ | 72,447 | |||||||
|
| |||||||
| Supermarkets – 0.3% | ||||||||
| Delhaize Group, 5.875%, 2014 | $ | 150,000 | $ | 162,806 | ||||
|
| |||||||
| Supranational – 0.6% | ||||||||
| Central American Bank, 4.875%, 2012 (n) | $ | 305,000 | $ | 305,264 | ||||
|
| |||||||
| Telecommunications – Wireless – 2.3% | ||||||||
| American Tower Corp., 4.625%, 2015 | $ | 80,000 | $ | 83,385 | ||||
| Clearwire Corp., 12%, 2015 (n) | 60,000 | 57,450 | ||||||
| Cricket Communications, Inc., 7.75%, 2020 | 50,000 | 43,750 | ||||||
| Crown Castle International Corp., 9%, 2015 | 35,000 | 37,931 | ||||||
| Crown Castle International Corp., 7.125%, 2019 | 130,000 | 140,400 | ||||||
| Crown Castle Towers LLC, 6.113%, 2020 (n) | 157,000 | 173,224 | ||||||
| MetroPCS Wireless, Inc., 7.875%, 2018 | 35,000 | 35,481 | ||||||
| MetroPCS Wireless, Inc., 6.625%, 2020 | 10,000 | 9,325 | ||||||
| NII Holdings, Inc., 10%, 2016 | 50,000 | 56,750 | ||||||
| NII Holdings, Inc., 8.875%, 2019 | 10,000 | 10,525 | ||||||
| NII Holdings, Inc., 7.625%, 2021 | 30,000 | 29,775 | ||||||
| Rogers Cable, Inc., 5.5%, 2014 | 164,000 | 176,782 | ||||||
| Sprint Capital Corp., 6.875%, 2028 | 40,000 | 28,550 | ||||||
| Sprint Nextel Corp., 6%, 2016 | 85,000 | 70,550 | ||||||
| Sprint Nextel Corp., 8.375%, 2017 | 55,000 | 49,294 | ||||||
| Sprint Nextel Corp., 9%, 2018 (n) | 10,000 | 10,500 | ||||||
| Issuer | Shares/Par | Value ($) | ||||||
| BONDS – continued | ||||||||
| Telecommunications – Wireless – continued | ||||||||
| Wind Acquisition Finance S.A., 11.75%, 2017 (n) | $ | 115,000 | $ | 102,925 | ||||
|
| |||||||
| $ | 1,116,597 | |||||||
|
| |||||||
| Telephone Services – 0.1% | ||||||||
| Cogent Communications Group, Inc., 8.375%, 2018 (n) | $ | 15,000 | $ | 15,375 | ||||
| Level 3 Financing, Inc., 9.375%, 2019 | 45,000 | 46,969 | ||||||
|
| |||||||
| $ | 62,344 | |||||||
|
| |||||||
| Tobacco – 1.4% | ||||||||
| Altria Group, Inc., 9.25%, 2019 | $ | 210,000 | $ | 281,979 | ||||
| Lorillard Tobacco Co., 8.125%, 2019 | 63,000 | 75,045 | ||||||
| Lorillard Tobacco Co., 6.875%, 2020 | 70,000 | 78,221 | ||||||
| Reynolds American, Inc., 6.75%, 2017 | 240,000 | 272,791 | ||||||
|
| |||||||
| $ | 708,036 | |||||||
|
| |||||||
| Transportation – 0.0% | ||||||||
| Navios South American Logistics, Inc., 9.25%, 2019 (n) | $ | 20,000 | $ | 16,000 | ||||
|
| |||||||
| Transportation – Services – 1.1% | ||||||||
| ACL I Corp., 10.625%, 2016 (n)(p) | $ | 42,275 | $ | 32,373 | ||||
| American Petroleum Tankers LLC, 10.25%, 2015 | 18,000 | 18,360 | ||||||
| Avis Budget Car Rental LLC , 9.75%, 2020 | 15,000 | 15,413 | ||||||
| Commercial Barge Line Co., 12.5%, 2017 | 100,000 | 107,750 | ||||||
| Erac USA Finance Co., 6.375%, 2017 (n) | 180,000 | 208,000 | ||||||
| Hertz Corp., 7.5%, 2018 | 35,000 | 36,575 | ||||||
| Navios Maritime Acquisition Corp., 8.625%, 2017 | 60,000 | 43,500 | ||||||
| Navios Maritime Holdings, Inc., 8.875%, 2017 | 25,000 | 23,813 | ||||||
| Swift Services Holdings, Inc., 10%, 2018 | 55,000 | 57,888 | ||||||
|
| |||||||
| $ | 543,672 | |||||||
|
| |||||||
| U.S. Government Agencies and Equivalents – 1.4% | ||||||||
| National Credit Union Administration Guaranteed Note, 2.9%, 2020 | $ | 50,000 | $ | 52,791 | ||||
| Small Business Administration, 4.34%, 2024 | 188,732 | 204,130 | ||||||
| Small Business Administration, 4.77%, 2024 | 148,226 | 161,921 | ||||||
| Small Business Administration, 4.625%, 2025 | 115,005 | 125,529 | ||||||
| Small Business Administration, 5.11%, 2025 | 106,609 | 117,778 | ||||||
|
| |||||||
| $ | 662,149 | |||||||
|
| |||||||
| Utilities – Electric Power – 3.7% | ||||||||
| AES Corp., 8%, 2017 | $ | 85,000 | $ | 93,500 | ||||
| Allegheny Energy, Inc., 5.75%, 2019 (n) | 150,000 | 160,425 | ||||||
| Atlantic Power Corp., 9%, 2018 (z) | 15,000 | 15,038 | ||||||
| Calpine Corp., 8%, 2016 (n) | 55,000 | 59,400 | ||||||
| Calpine Corp., 7.875%, 2020 (n) | 65,000 | 70,038 | ||||||
| CMS Energy Corp., 4.25%, 2015 | 140,000 | 141,498 | ||||||
| Covanta Holding Corp., 7.25%, 2020 | 35,000 | 36,791 | ||||||
| Dolphin Subsidiary ll, Inc., 7.25%, 2021 (n) | 35,000 | 37,800 | ||||||
| Duke Energy Corp., 3.35%, 2015 | 220,000 | 231,911 | ||||||
| Edison Mission Energy, 7%, 2017 | 50,000 | 32,500 | ||||||
| EDP Finance B.V., 6%, 2018 (n) | 200,000 | 168,237 | ||||||
| Energy Future Holdings Corp., 10%, 2020 | 65,000 | 68,250 | ||||||
15
Table of Contents
MFS Strategic Income Portfolio
Portfolio of Investments – continued
| Issuer | Shares/Par | Value ($) | ||||||
| BONDS – continued | ||||||||
| Utilities – Electric Power – continued | ||||||||
| Energy Future Holdings Corp., 10%, 2020 | $ | 145,000 | $ | 152,975 | ||||
| Exelon Generation Co. LLC, 5.2%, 2019 | 70,000 | 76,895 | ||||||
| GenOn Energy, Inc., 9.5%, 2018 | 30,000 | 30,375 | ||||||
| GenOn Energy, Inc., 9.875%, 2020 | 80,000 | 81,200 | ||||||
| NRG Energy, Inc., 7.375%, 2017 | 30,000 | 31,125 | ||||||
| NRG Energy, Inc., 8.25%, 2020 | 120,000 | 120,600 | ||||||
| PPL WEM Holdings PLC, 3.9%, 2016 (n) | 160,000 | 160,385 | ||||||
| Texas Competitive Electric Holdings Co. LLC, 11.5%, 2020 (n) | 25,000 | 21,219 | ||||||
|
| |||||||
| $ | 1,790,162 | |||||||
|
| |||||||
| Total Bonds (Identified Cost, $44,010,408) | $ | 45,388,075 | ||||||
|
| |||||||
| PREFERRED STOCKS – 0.3% | ||||||||
| Other Banks & Diversified Financials – 0.3% | ||||||||
| Ally Financial, Inc., 7% (n) | 30 | $ | 21,505 | |||||
| Ally Financial, Inc., “A”, 8.5% | 4,507 | 82,884 | ||||||
| GMAC Capital Trust I, 8.125% | 1,575 | 30,461 | ||||||
|
| |||||||
| Total Preferred Stocks (Identified Cost, $176,676) | $ | 134,850 | ||||||
|
| |||||||
| CONVERTIBLE PREFERRED STOCKS – 0.1% | ||||||||
| Automotive – 0.1% | ||||||||
| General Motors Co., 4.75% (Identified Cost, $40,000) | 800 | $ | 27,400 | |||||
|
| |||||||
| FLOATING RATE LOANS (g)(r) – 0.1% | ||||||||
| Financial Institutions – 0.0% | ||||||||
| Springleaf Finance Corp., Term Loan, 5.5%, 2017 | $ | 22,538 | $ | 19,538 | ||||
|
| |||||||
| Oil Services – 0.1% | ||||||||
| Samson Investment Co., Bridge Term Loan, 2012 (o) | $ | 45,000 | $ | 45,000 | ||||
|
| |||||||
| Total Floating Rate Loans (Identified Cost, $67,437) | $ | 64,538 | ||||||
|
| |||||||
| Issuer | Shares/Par | Value ($) | ||||||||||||||
| COMMON STOCKS – 0.1% | ||||||||||||||||
| Automotive – 0.0% | ||||||||||||||||
| Accuride Corp. (a) | 1,188 | $ | 8,459 | |||||||||||||
|
| |||||||||||||||
| Broadcasting – 0.1% | ||||||||||||||||
| New Young Broadcasting Holding Co., Inc. (a) | 9 | $ | 24,300 | |||||||||||||
|
| |||||||||||||||
| Printing & Publishing – 0.0% | ||||||||||||||||
| American Media Operations, Inc. (a) | 1,733 | $ | 20,605 | |||||||||||||
|
| |||||||||||||||
Total Common Stocks (Identified Cost, $58,327) |
| $ | 53,364 | |||||||||||||
|
| |||||||||||||||
| Strike Price | First Exercise | |||||||||||||||
| WARRANTS – 0.1% | ||||||||||||||||
| Broadcasting – 0.1% | ||||||||||||||||
| New Young Broadcasting Holding Co., Inc. (1 share for 1 warrant) (a) (Identified Cost, $28,491) | $ | 0.01 | 7/14/10 | 14 | $ | 37,800 | ||||||||||
|
| |||||||||||||||
| MONEY MARKET FUNDS – 5.2% | ||||||||||||||||
| MFS Institutional Money Market Portfolio, 0.05%, at Cost and Net Asset Value (v) | 2,545,148 | $ | 2,545,148 | |||||||||||||
|
| |||||||||||||||
| Total Investments (Identified Cost, $46,926,487) | $ | 48,251,175 | ||||||||||||||
|
| |||||||||||||||
| OTHER ASSETS, LESS LIABILITIES – 1.4% | 679,138 | |||||||||||||||
|
| |||||||||||||||
| Net Assets – 100.0% | $ | 48,930,313 | ||||||||||||||
|
| |||||||||||||||
| (a) | Non-income producing security. |
| (d) | Non-income producing security – in default. |
| (e) | Guaranteed by Minister for Finance of Ireland. |
| (g) | The rate shown represents a weighted average coupon rate on settled positions at period end, unless otherwise indicated. |
| (i) | Interest only security for which the fund receives interest on notional principal (Par amount). Par amount shown is the notional principal and does not reflect the cost of the security. |
| (n) | Securities exempt from registration under Rule 144A of the Securities Act of 1933. These securities may be sold in the ordinary course of business in transactions exempt from registration, normally to qualified institutional buyers. At period end, the aggregate value of these securities was $10,296,112, representing 21.04% of net assets. |
| (o) | All or a portion of this position has not settled. Upon settlement date, interest rates for unsettled amounts will be determined. The rate shown represents the weighted average coupon rate for settled amounts. |
| (p) | Payment-in-kind security. |
| (r) | Remaining maturities of floating rate loans may be less than stated maturities shown as a result of contractual or optional prepayments by the borrower. Such prepayments cannot be predicted with certainty. These loans may be subject to restrictions on resale. Floating rate loans generally have rates of interest which are determined periodically by reference to a base lending rate plus a premium. |
| (v) | Underlying affiliated fund that is available only to investment companies managed by MFS. The rate quoted for the MFS Institutional Money Market Portfolio is the annualized seven-day yield of the fund at period end. |
16
Table of Contents
MFS Strategic Income Portfolio
Portfolio of Investments – continued
| (z) | Restricted securities are not registered under the Securities Act of 1933 and are subject to legal restrictions on resale. These securities generally may be resold in transactions exempt from registration or to the public if the securities are subsequently registered. Disposal of these securities may involve time-consuming negotiations and prompt sale at an acceptable price may be difficult. The fund holds the following restricted securities: |
| Restricted Securities | Acquisition Date | Cost | Value | |||||||
| American Media, Inc., 13.5%, 2018 | 12/22/10 | $6,859 | $5,475 | |||||||
| ARCap REIT, Inc., CDO, “H”, FRN, 6.013%, 2045 | 9/21/04 | 1,257 | 2 | |||||||
| Atlantic Power Corp., 9%, 2018 | 10/26/11 | 14,627 | 15,038 | |||||||
| Bayview Financial Revolving Mortgage Loan Trust, FRN, 1.893%, 2040 | 3/01/06 | 173,670 | 98,956 | |||||||
| Bosphorus Financial Services Ltd., FRN, 2.257%, 2012 | 3/08/05 | 12,500 | 12,487 | |||||||
| Chase Commercial Mortgage Securities Corp., 6.6%, 2029 | 6/07/00 | 59,283 | 69,276 | |||||||
| Crest Ltd., “A1” CDO, FRN, 1.053%, 2018 | 1/21/10 | 96,953 | 105,322 | |||||||
| Dresser-Rand Group, Inc., 6.5%, 2021 | 12/14/11-12/20/11 | 10,200 | 10,225 | |||||||
| Dynacast International LLC, 9.25%, 2019 | 7/12/11-7/15/11 | 35,372 | 32,900 | |||||||
| Emergency Medical Services Corp., 8.125%, 2019 | 5/13/11 | 15,000 | 14,963 | |||||||
| Falcon Franchise Loan LLC, FRN, 4.696%, 2023 | 1/18/02 | 9,569 | 11,707 | |||||||
| Falcon Franchise Loan LLC, FRN, 4.806%, 2025 | 1/29/03 | 21,518 | 34,509 | |||||||
| GMAC LLC, FRN, 6.02%, 2033 | 11/17/00 | 147,548 | 154,707 | |||||||
| LBI Media, Inc., 8.5%, 2017 | 7/18/07 | 54,401 | 30,319 | |||||||
| Local TV Finance LLC, 9.25%, 2015 | 11/28/07-2/16/11 | 75,083 | 72,758 | |||||||
| Morgan Stanley Capital I, Inc., FRN, 1.383%, 2039 | 7/20/04 | 36,064 | 28,360 | |||||||
| Pacific Rubiales Energy Corp., 7.25%, 2021 | 12/16/11 | 102,122 | 115,575 | |||||||
| Packaging Dynamics Corp., 8.75%, 2016 | 1/25/11-2/01/11 | 20,302 | 20,000 | |||||||
| Prudential Securities Secured Financing Corp., FRN, 7.289%, 2013 | 12/06/04 | 418,810 | 377,680 | |||||||
| Sally Beauty Holdings, Inc., 6.875%, 2019 | 11/03/11 | 20,000 | 20,900 | |||||||
| Salomon Brothers Mortgage Securities, Inc., FRN, 7.161%, 2032 | 1/07/05 | 213,789 | 215,941 | |||||||
| USI Holdings Corp., 9.75%, 2015 | 5/07/07-6/08/07 | 40,389 | 38,300 | |||||||
| Total Restricted Securities | $1,485,400 | |||||||||
| % of Net assets | 3.0% | |||||||||
The following abbreviations are used in this report and are defined:
| CDO | Collateralized Debt Obligation |
| FRN | Floating Rate Note. Interest rate resets periodically and may not be the rate reported at period end. |
| PLC | Public Limited Company |
| REIT | Real Estate Investment Trust |
Abbreviations indicate amounts shown in currencies other than the U.S. dollar. All amounts are stated in U.S. dollars unless otherwise indicated. A list of abbreviations is shown below:
| CAD | Canadian Dollar |
| CNY | Chinese Yuan Renminbi |
| EUR | Euro |
| GBP | British Pound |
| IDR | Indonesian Rupiah |
| JPY | Japanese Yen |
| SEK | Swedish Krona |
17
Table of Contents
MFS Strategic Income Portfolio
Portfolio of Investments – continued
Derivative Contracts at 12/31/11
Forward Foreign Currency Exchange Contracts at 12/31/11
| Type | Currency | Counterparty | Contracts to Deliver/Receive | Settlement Date Range | In Exchange For | Contracts at Value | Net Unrealized Appreciation (Depreciation) | |||||||||||||||||
| Asset Derivatives | ||||||||||||||||||||||||
| BUY | CAD | Merrill Lynch International Bank | 120,000 | 1/12/12 | $ | 114,543 | $ | 117,769 | $ | 3,226 | ||||||||||||||
| BUY | CNY | Deutsche Bank AG | 1,766,000 | 5/16/12 | 278,989 | 280,062 | 1,073 | |||||||||||||||||
| SELL | EUR | UBS AG | 1,238,035 | 3/15/12 | 1,656,552 | 1,603,309 | 53,243 | |||||||||||||||||
| SELL | JPY | JPMorgan Chase Bank N.A. | 7,293,456 | 1/12/12 | 95,029 | 94,767 | 262 | |||||||||||||||||
|
| |||||||||||||||||||||||
| $ | 57,804 | |||||||||||||||||||||||
|
| |||||||||||||||||||||||
| Liability Derivatives | ||||||||||||||||||||||||
| SELL | CAD | Merrill Lynch International Bank | 288,695 | 1/12/12 | $ | 275,567 | $ | 283,325 | $ | (7,758 | ) | |||||||||||||
| BUY | EUR | Credit Suisse Group | 75,859 | 1/12/12 | 102,427 | 98,186 | (4,241 | ) | ||||||||||||||||
| BUY | EUR | HSBC Bank | 75,859 | 1/12/12 | 102,287 | 98,186 | (4,101 | ) | ||||||||||||||||
| BUY | EUR | UBS AG | 20,250 | 1/12/12 | 27,085 | 26,210 | (875 | ) | ||||||||||||||||
| SELL | GBP | Barclays Bank PLC | 158,681 | 1/12/12 | 243,894 | 246,415 | (2,521 | ) | ||||||||||||||||
| SELL | GBP | Deutsche Bank AG | 158,681 | 1/12/12 | 243,925 | 246,415 | (2,490 | ) | ||||||||||||||||
| BUY | IDR | JPMorgan Chase Bank N.A. | 727,447,000 | 1/11/12 | 80,292 | 80,171 | (121 | ) | ||||||||||||||||
| BUY | SEK | Barclays Bank PLC | 31,910 | 1/12/12 | 4,675 | 4,635 | (40 | ) | ||||||||||||||||
| BUY | SEK | Deutsche Bank AG | 31,910 | 1/12/12 | 4,676 | 4,635 | (41 | ) | ||||||||||||||||
|
| |||||||||||||||||||||||
| $ | (22,188 | ) | ||||||||||||||||||||||
|
| |||||||||||||||||||||||
Swap Agreements at 12/31/11
| Expiration | Notional Amount | Counterparty | Cash Flows to Receive | Cash Flows to Pay | Fair Value | |||||||||||||
| Asset Derivatives | ||||||||||||||||||
| Credit Default Swaps | ||||||||||||||||||
| 9/20/14 | USD | 250,000(a | ) | Goldman Sachs International | 1.00% (fixed rate) | (1) | $3,223 | |||||||||||
|
| |||||||||||||||||
| (1) | Fund, as protection seller, to pay notional amount upon a defined credit event by Cargill, Inc., 7.375%, 10/01/25, an A-rated bond. The fund entered into the contract to gain issuer exposure. |
| (a) | Net unamortized premiums received by the fund amounted to $315. |
The credit ratings presented here are an indicator of the current payment/performance risk of the related swap, the reference obligation for which may be either a single security or, in the case of a credit default index, a basket of securities issued by corporate or sovereign issuers. Ratings are assigned to each reference security, including each individual security within a reference basket of securities utilizing ratings from Moody’s, Fitch, and Standard & Poor’s rating agencies and applying the following hierarchy. If all three agencies provide a rating, the middle rating (after dropping the highest and lowest ratings) is assigned; if two of the three agencies rate a security, the lower of the two is assigned. Ratings are shown in the S&P and Fitch scale (e.g., AAA). The ratings for a credit default index are calculated by MFS as a weighted average of the external credit ratings of the individual securities that compose the index’s reference basket of securities.
At December 31, 2011, the fund had sufficient cash and/or other liquid securities to cover any commitments under these contracts.
See Notes to Financial Statements
18
Table of Contents
MFS Strategic Income Portfolio
FINANCIAL STATEMENTS | STATEMENT OF ASSETS AND LIABILITIES
This statement represents your fund’s balance sheet, which details the assets and liabilities comprising the total value of the fund.
At 12/31/11 | ||||||||
Assets | ||||||||
Investments – | ||||||||
Non-affiliated issuers, at value (identified cost, $44,381,339) | $45,706,027 | |||||||
Underlying affiliated funds, at cost and value | 2,545,148 | |||||||
Total investments, at value (identified cost, $46,926,487) | $48,251,175 | |||||||
Cash | 4,616 | |||||||
Receivables for | ||||||||
Forward foreign currency exchange contracts | 57,804 | |||||||
Investments sold | 5,473 | |||||||
Fund shares sold | 9,189 | |||||||
Interest | 751,245 | |||||||
Swaps, at value (net unamortized premiums received, $315) | 3,223 | |||||||
Other assets | 1,709 | |||||||
Total assets | $49,084,434 | |||||||
Liabilities | ||||||||
Payables for | ||||||||
Forward foreign currency exchange contracts | $22,188 | |||||||
Investments purchased | 45,000 | |||||||
Fund shares reacquired | 35,650 | |||||||
Payable to affiliates | ||||||||
Investment adviser | 1,977 | |||||||
Distribution and/or service fees | 213 | |||||||
Payable for Trustees’ compensation | 76 | |||||||
Accrued expenses and other liabilities | 49,017 | |||||||
Total liabilities | $154,121 | |||||||
Net assets | $48,930,313 | |||||||
Net assets consist of | ||||||||
Paid-in capital | $49,594,759 | |||||||
Unrealized appreciation (depreciation) on investments and translation of assets and liabilities in foreign currencies | 1,357,394 | |||||||
Accumulated net realized gain (loss) on investments and foreign currency transactions | (4,285,421 | ) | ||||||
Undistributed net investment income | 2,263,581 | |||||||
Net assets | $48,930,313 | |||||||
Shares of beneficial interest outstanding | 5,032,381 |
| Net assets | Shares outstanding | Net asset value per share | ||||||||||
Initial Class | $38,562,750 | 3,960,705 | $9.74 | |||||||||
Service Class | 10,367,563 | 1,071,676 | 9.67 | |||||||||
See Notes to Financial Statements
19
Table of Contents
MFS Strategic Income Portfolio
FINANCIAL STATEMENTS | STATEMENT OF OPERATIONS
This statement describes how much your fund earned in investment income and accrued in expenses. It also describes any gains and/or losses generated by fund operations.
Year ended 12/31/11 | ||||||||
Net investment income | ||||||||
Income | ||||||||
Interest | $2,843,807 | |||||||
Dividends | 12,153 | |||||||
Dividends from underlying affiliated funds | 1,847 | |||||||
Total investment income | $2,857,807 | |||||||
Expenses | ||||||||
Management fee | $376,616 | |||||||
Distribution and/or service fees | 26,867 | |||||||
Administrative services fee | 17,713 | |||||||
Trustees’ compensation | 5,920 | |||||||
Custodian fee | 26,182 | |||||||
Shareholder communications | 8,345 | |||||||
Auditing fees | 70,917 | |||||||
Legal fees | 5,212 | |||||||
Miscellaneous | 14,069 | |||||||
Total expenses | $551,841 | |||||||
Fees paid indirectly | (20 | ) | ||||||
Reduction of expenses by investment adviser | (72,451 | ) | ||||||
Net expenses | $479,370 | |||||||
Net investment income | $2,378,437 | |||||||
Realized and unrealized gain (loss) on investments and foreign currency transactions | ||||||||
Realized gain (loss) (identified cost basis) | ||||||||
Investment transactions | $300,627 | |||||||
Futures contracts | (5,777 | ) | ||||||
Swap transactions | 2,648 | |||||||
Foreign currency transactions | (33,854 | ) | ||||||
Net realized gain (loss) on investments and foreign currency transactions | $263,644 | |||||||
Change in unrealized appreciation (depreciation) | ||||||||
Investments | $(413,122 | ) | ||||||
Futures contracts | (10,349 | ) | ||||||
Swap transactions | (1,962 | ) | ||||||
Translation of assets and liabilities in foreign currencies | 47,385 | |||||||
Net unrealized gain (loss) on investments and foreign currency translation | $(378,048 | ) | ||||||
Net realized and unrealized gain (loss) on investments and foreign currency | $(114,404 | ) | ||||||
Change in net assets from operations | $2,264,033 |
See Notes to Financial Statements
20
Table of Contents
MFS Strategic Income Portfolio
FINANCIAL STATEMENTS | STATEMENTS OF CHANGES IN NET ASSETS
These statements describe the increases and/or decreases in net assets resulting from operations, any distributions, and any shareholder transactions.
For years ended 12/31 | 2011 | 2010 | ||||||
Change in net assets | ||||||||
From operations | ||||||||
Net investment income | $2,378,437 | $2,672,926 | ||||||
Net realized gain (loss) on investments and foreign currency transactions | 263,644 | 960,422 | ||||||
Net unrealized gain (loss) on investments and foreign currency translation | (378,048 | ) | 1,521,110 | |||||
Change in net assets from operations | $2,264,033 | $5,154,458 | ||||||
Distributions declared to shareholders | ||||||||
From net investment income | $(2,837,428 | ) | $(2,808,031 | ) | ||||
Change in net assets from fund share transactions | $(2,364,894 | ) | $(2,342,922 | ) | ||||
Total change in net assets | $(2,938,289 | ) | $3,505 | |||||
Net assets | ||||||||
At beginning of period | 51,868,602 | 51,865,097 | ||||||
At end of period (including undistributed net investment income of $2,263,581 and | $48,930,313 | $51,868,602 |
See Notes to Financial Statements
21
Table of Contents
MFS Strategic Income Portfolio
FINANCIAL STATEMENTS | FINANCIAL HIGHLIGHTS
The financial highlights table is intended to help you understand the fund’s financial performance for the past 5 years. Certain information reflects financial results for a single fund share. The total returns in the table represent the rate by which an investor would have earned (or lost) on an investment in the fund share class (assuming reinvestment of all distributions) held for the entire period.
| Initial Class | Years ended 12/31 | |||||||||||||||||||
| 2011 | 2010 | 2009 | 2008 | 2007 | ||||||||||||||||
Net asset value, beginning of period | $9.87 | $9.46 | $8.36 | $10.40 | $10.61 | |||||||||||||||
| Income (loss) from investment operations | ||||||||||||||||||||
Net investment income (d) | $0.48 | $0.49 | $0.55 | $0.58 | $0.60 | |||||||||||||||
Net realized and unrealized gain (loss) on investments | (0.02 | ) | 0.45 | 1.54 | (1.82 | ) | (0.23 | ) | ||||||||||||
Total from investment operations | $0.46 | $0.94 | $2.09 | $(1.24 | ) | $0.37 | ||||||||||||||
| Less distributions declared to shareholders | ||||||||||||||||||||
From net investment income | $(0.59 | ) | $(0.53 | ) | $(0.99 | ) | $(0.80 | ) | $(0.58 | ) | ||||||||||
Net asset value, end of period (x) | $9.74 | $9.87 | $9.46 | $8.36 | $10.40 | |||||||||||||||
Total return (%) (k)(r)(s)(x) | 4.67 | 10.27 | 27.52 | (12.94 | ) | 3.49 | ||||||||||||||
| Ratios (%) (to average net assets) and Supplemental data: | ||||||||||||||||||||
Expenses before expense reductions (f) | 1.05 | 1.06 | 1.03 | 1.02 | 0.95 | |||||||||||||||
Expenses after expense reductions (f) | 0.90 | 0.90 | 0.90 | 0.90 | 0.90 | |||||||||||||||
Net investment income | 4.79 | 5.11 | 6.23 | 6.07 | 5.70 | |||||||||||||||
Portfolio turnover | 29 | 48 | 63 | 38 | 49 | |||||||||||||||
Net assets at end of period (000 omitted) | $38,563 | $40,927 | $40,221 | $31,159 | $49,582 | |||||||||||||||
| Service Class | Years ended 12/31 | |||||||||||||||||||
| 2011 | 2010 | 2009 | 2008 | 2007 | ||||||||||||||||
Net asset value, beginning of period | $9.81 | $9.40 | $8.30 | $10.33 | $10.54 | |||||||||||||||
| Income (loss) from investment operations | ||||||||||||||||||||
Net investment income (d) | $0.45 | $0.47 | $0.52 | $0.55 | $0.57 | |||||||||||||||
Net realized and unrealized gain (loss) on investments | (0.03 | ) | 0.45 | 1.54 | (1.80 | ) | (0.23 | ) | ||||||||||||
Total from investment operations | $0.42 | $0.92 | $2.06 | $(1.25 | ) | $0.34 | ||||||||||||||
| Less distributions declared to shareholders | ||||||||||||||||||||
From net investment income | $(0.56 | ) | $(0.51 | ) | $(0.96 | ) | $(0.78 | ) | $(0.55 | ) | ||||||||||
Net asset value, end of period (x) | $9.67 | $9.81 | $9.40 | $8.30 | $10.33 | |||||||||||||||
Total return (%) (k)(r)(s)(x) | 4.31 | 10.05 | 27.24 | (13.21 | ) | 3.24 | ||||||||||||||
| Ratios (%) (to average net assets) and Supplemental data: | ||||||||||||||||||||
Expenses before expense reductions (f) | 1.30 | 1.31 | 1.28 | 1.26 | 1.20 | |||||||||||||||
Expenses after expense reductions (f) | 1.15 | 1.15 | 1.15 | 1.15 | 1.15 | |||||||||||||||
Net investment income | 4.54 | 4.87 | 6.02 | 5.82 | 5.45 | |||||||||||||||
Portfolio turnover | 29 | 48 | 63 | 38 | 49 | |||||||||||||||
Net assets at end of period (000 omitted) | $10,368 | $10,942 | $11,644 | $11,192 | $19,232 | |||||||||||||||
| (d) | Per share data is based on average shares outstanding. |
| (f) | Ratios do not reflect reductions from fees paid indirectly, if applicable. |
| (k) | The total return does not reflect expenses that apply to separate accounts. Inclusion of these charges would reduce the total return figures for all periods shown. |
| (r) | Certain expenses have been reduced without which performance would have been lower. |
| (s) | From time to time the fund may receive proceeds from litigation settlements, without which performance would be lower. |
| (x) | The net asset values per share and total returns have been calculated on net assets which include adjustments made in accordance with U.S. generally accepted accounting principles required at period end for financial reporting purposes. |
See Notes to Financial Statements
22
Table of Contents
MFS Strategic Income Portfolio
| (1) | Business and Organization |
MFS Strategic Income Portfolio (the fund) is a series of MFS Variable Insurance Trust II (the trust). The trust is organized as a Massachusetts business trust and is registered under the Investment Company Act of 1940, as amended, as an open-end management investment company. The shareholders of each series of the trust are separate accounts of insurance companies, which offer variable annuity and/or life insurance products, and qualified retirement and pension plans.
| (2) | Significant Accounting Policies |
General – The preparation of financial statements in conformity with U.S. generally accepted accounting principles requires management to make estimates and assumptions that affect the reported amounts of assets and liabilities, and disclosure of contingent assets and liabilities at the date of the financial statements and the reported amounts of revenues and expenses during the reporting period. Actual results could differ from those estimates. In the preparation of these financial statements, management has evaluated subsequent events occurring after the date of the fund’s Statement of Assets and Liabilities through the date that the financial statements were issued. The fund invests in high-yield securities rated below investment grade. Investments in high-yield securities involve greater degrees of credit and market risk than investments in higher-rated securities and tend to be more sensitive to economic conditions. The fund invests in foreign securities. Investments in foreign securities are vulnerable to the effects of changes in the relative values of the local currency and the U.S. dollar and to the effects of changes in each country’s legal, political, and economic environment.
In December 2011, the Financial Accounting Standards Board issued Accounting Standards Update 2011-11, Balance Sheet (Topic 210) – Disclosures about Offsetting Assets and Liabilities (“ASU 2011-11”). Effective for annual reporting periods beginning on or after January 1, 2013 and interim periods within those annual periods, ASU 2011-11 is intended to enhance disclosure requirements on the offsetting of financial assets and liabilities. Although still evaluating the potential impacts of ASU 2011-11 to the fund, management expects that the impact of the fund’s adoption will be limited to additional financial statement disclosures.
Investment Valuations – Debt instruments and floating rate loans (other than short-term instruments), including restricted debt instruments, are generally valued at an evaluated or composite bid as provided by a third-party pricing service. Equity securities, including restricted equity securities, are generally valued at the last sale or official closing price as provided by a third-party pricing service on the market or exchange on which they are primarily traded. Equity securities, for which there were no sales reported that day, are generally valued at the last quoted daily bid quotation as provided by a third-party pricing service on the market or exchange on which such securities are primarily traded. Equity securities held short, for which there were no sales reported for that day, are generally valued at the last quoted daily ask quotation as provided by a third-party pricing service on the market or exchange on which such securities are primarily traded. Short-term instruments with a maturity at issuance of 60 days or less generally are valued at amortized cost, which approximates market value. Futures contracts are generally valued at last posted settlement price as provided by a third-party pricing service on the market on which they are primarily traded. Futures contracts for which there were no trades that day for a particular position are generally valued at the closing bid quotation as provided by a third-party pricing service on the market on which such futures contracts are primarily traded. Forward foreign currency exchange contracts are generally valued at the mean of bid and asked prices for the time period interpolated from rates provided by a third-party pricing service for proximate time periods. Swaps are generally valued at valuations provided by a third-party pricing service. Open-end investment companies are generally valued at net asset value per share. Securities and other assets generally valued on the basis of information from a third-party pricing service may also be valued at a broker/dealer bid quotation. Values obtained from third-party pricing services can utilize both transaction data and market information such as yield, quality, coupon rate, maturity, type of issue, trading characteristics, and other market data. The values of foreign securities and other assets and liabilities expressed in foreign currencies are converted to U.S. dollars using the mean of bid and asked prices for rates provided by a third-party pricing service.
The Board of Trustees has delegated primary responsibility for determining or causing to be determined the value of the fund’s investments (including any fair valuation) to the adviser pursuant to valuation policies and procedures approved by the Board. If the adviser determines that reliable market quotations are not readily available, investments are valued at fair value as determined in good faith by the adviser in accordance with such procedures under the oversight of the Board of Trustees. Under the fund’s valuation policies and procedures, market quotations are not considered to be readily available for most types of debt instruments and floating rate loans and many types of derivatives. These investments are generally valued at fair value based on information from third-party pricing services. In addition, investments may be valued at fair value if the adviser determines that an investment’s value has been materially affected by events occurring after the close of the exchange or market on which the investment is principally traded (such as foreign exchange or market) and prior to the determination of the fund’s net asset value, or after the halting of trading of a specific security where trading does not resume prior to the close
23
Table of Contents
MFS Strategic Income Portfolio
Notes to Financial Statements – continued
of the exchange or market on which the security is principally traded. The adviser generally relies on third-party pricing services or other information (such as the correlation with price movements of similar securities in the same or other markets; the type, cost and investment characteristics of the security; the business and financial condition of the issuer; and trading and other market data) to assist in determining whether to fair value and at what value to fair value an investment. The value of an investment for purposes of calculating the fund’s net asset value can differ depending on the source and method used to determine value. When fair valuation is used, the value of an investment used to determine the fund’s net asset value may differ from quoted or published prices for the same investment. There can be no assurance that the fund could obtain the fair value assigned to an investment if it were to sell the investment at the same time at which the fund determines its net asset value per share.
Various inputs are used in determining the value of the fund’s assets or liabilities. These inputs are categorized into three broad levels. In certain cases, the inputs used to measure fair value may fall into different levels of the fair value hierarchy. In such cases, an investment’s level within the fair value hierarchy is based on the lowest level of input that is significant to the fair value measurement. The fund’s assessment of the significance of a particular input to the fair value measurement in its entirety requires judgment, and considers factors specific to the investment. Level 1 includes unadjusted quoted prices in active markets for identical assets or liabilities. Level 2 includes other significant observable market-based inputs (including quoted prices for similar securities, interest rates, prepayment speed, and credit risk). Level 3 includes unobservable inputs, which may include the adviser’s own assumptions in determining the fair value of investments. Other financial instruments are derivative instruments not reflected in total investments, such as forward foreign currency exchange contracts and swap contracts. The following is a summary of the levels used as of December 31, 2011 in valuing the fund’s assets or liabilities:
| Investments at Value | Level 1 | Level 2 | Level 3 | Total | ||||||||||||
| Equity Securities | $149,204 | $83,605 | $20,605 | $253,414 | ||||||||||||
| U.S. Treasury Bonds & U.S. Government Agency & Equivalents | — | 662,149 | — | 662,149 | ||||||||||||
| Non-U.S. Sovereign Debt | — | 8,772,537 | — | 8,772,537 | ||||||||||||
| Corporate Bonds | — | 27,204,043 | — | 27,204,043 | ||||||||||||
| Residential Mortgage-Backed Securities | — | 276,316 | — | 276,316 | ||||||||||||
| Commercial Mortgage-Backed Securities | — | 942,546 | — | 942,546 | ||||||||||||
| Asset-Backed Securities (including CDOs) | — | 521,335 | — | 521,335 | ||||||||||||
| Foreign Bonds | — | 7,009,149 | — | 7,009,149 | ||||||||||||
| Floating Rate Loans | — | 64,538 | — | 64,538 | ||||||||||||
| Mutual Funds | 2,545,148 | — | — | 2,545,148 | ||||||||||||
| Total Investments | $2,694,352 | $45,536,218 | $20,605 | $48,251,175 | ||||||||||||
| Other Financial Instruments | ||||||||||||||||
| Swaps | $— | $3,223 | $— | $3,223 | ||||||||||||
| Forward Foreign Currency Exchange Contracts | — | 35,616 | — | 35,616 | ||||||||||||
For further information regarding security characteristics, see the Portfolio of Investments.
The following is a reconciliation of level 3 assets for which significant unobservable inputs were used to determine fair value. The fund’s policy is to recognize transfers between the levels as of the end of the period. The table presents the activity of level 3 securities held at the beginning and the end of the period.
Equity Securities | Corporate Bonds | Total | ||||||||||
| Balance as of 12/31/10 | $— | $6,867 | $6,867 | |||||||||
Change in unrealized appreciation (depreciation) | — | (1,392 | ) | (1,392 | ) | |||||||
Transfers into level 3 | 20,605 | — | 20,605 | |||||||||
Transfers out of level 3 | — | (5,475 | ) | (5,475 | ) | |||||||
| Balance as of 12/31/11 | $20,605 | $— | $20,605 | |||||||||
The net change in unrealized appreciation (depreciation) from investments held as level 3 at December 31, 2011 is $0.
Foreign Currency Translation – Purchases and sales of foreign investments, income, and expenses are converted into U.S. dollars based upon currency exchange rates prevailing on the respective dates of such transactions or on the reporting date for foreign denominated receivables and payables. Gains and losses attributable to foreign currency exchange rates on sales of securities are recorded for financial statement purposes as net realized gains and losses on investments. Gains and losses attributable to foreign exchange rate movements on receivables, payables, income and expenses are recorded for financial statement purposes as foreign currency transaction gains and losses. That portion of both realized and unrealized gains and losses on investments that results from fluctuations in foreign currency exchange rates is not separately disclosed.
24
Table of Contents
MFS Strategic Income Portfolio
Notes to Financial Statements – continued
Derivatives – The fund uses derivatives for different purposes, primarily to increase or decrease exposure to a particular market or segment of the market, or security, to increase or decrease interest rate or currency exposure, or as alternatives to direct investments. Derivatives are used for hedging or non-hedging purposes. While hedging can reduce or eliminate losses, it can also reduce or eliminate gains. When the fund uses derivatives as an investment to increase market exposure, or for hedging purposes, gains and losses from derivative instruments may be substantially greater than the derivative’s original cost.
The derivative instruments used by the fund were futures contracts, forward foreign currency exchange contracts, and swap agreements. The fund’s period end derivatives, as presented in the Portfolio of Investments and the associated Derivative Contract Tables, generally are indicative of the volume of its derivative activity during the period.
The following table presents, by major type of derivative contract, the fair value, on a gross basis, of the asset and liability components of derivatives held by the fund at December 31, 2011 as reported in the Statement of Assets and Liabilities:
| Fair Value | ||||||||||
| Risk | Derivative Contracts | Asset Derivatives | Liability Derivatives | |||||||
| Foreign Exchange | Forward Foreign Currency Exchange | $57,804 | $(22,188 | ) | ||||||
| Credit | Credit Default Swaps | 3,223 | — | |||||||
| Total | $61,027 | $(22,188 | ) | |||||||
The following table presents, by major type of derivative contract, the realized gain (loss) on derivatives held by the fund for the year ended December 31, 2011 as reported in the Statement of Operations:
| Risk | Futures Contracts | Swap Transactions | Foreign Currency Transactions | |||||||||
| Interest Rate | $(5,777 | ) | $— | $— | ||||||||
| Foreign Exchange | — | — | (34,634 | ) | ||||||||
| Credit | — | 2,648 | — | |||||||||
| Total | $(5,777 | ) | $2,648 | $(34,634 | ) | |||||||
The following table presents, by major type of derivative contract, the change in unrealized appreciation (depreciation) on derivatives held by the fund for the year ended December 31, 2011 as reported in the Statement of Operations:
| Risk | Futures Contracts | Swap Transactions | Translation of Assets and Liabilities in Foreign Currencies | |||||||||
| Interest Rate | $(10,349 | ) | $ — | $— | ||||||||
| Foreign Exchange | — | — | 54,751 | |||||||||
| Credit | — | (1,962 | ) | — | ||||||||
| Total | $(10,349 | ) | $(1,962 | ) | $54,751 | |||||||
Derivative counterparty credit risk is managed through formal evaluation of the creditworthiness of all potential counterparties. On certain over-the-counter derivatives, the fund attempts to reduce its exposure to counterparty credit risk whenever possible by entering into an International Swaps and Derivatives Association (ISDA) Master Agreement on a bilateral basis with each of the counterparties with whom it undertakes a significant volume of transactions. The ISDA Master Agreement gives each party to the agreement the right to terminate all transactions traded under such agreement if there is a certain deterioration in the credit quality of the other party. The ISDA Master Agreement gives the fund the right, upon an event of default by the applicable counterparty or a termination of the agreement, to close out all transactions traded under such agreement and to net amounts owed under each transaction to one net amount payable by one party to the other. This right to close out and net payments across all transactions traded under the ISDA Master Agreement could result in a reduction of the fund’s credit risk to such counterparty equal to any amounts payable by the fund under the applicable transactions, if any. However, absent an event of default by the counterparty or a termination of the agreement, the ISDA Master Agreement does not result in an offset of reported amounts of assets and liabilities in the Statement of Assets and Liabilities across transactions between the fund and the applicable counterparty.
Collateral requirements differ by type of derivative. Collateral or margin requirements are set by the broker or exchange clearing house for exchange traded derivatives (i.e., futures and exchange-traded options) while collateral terms are contract specific for over-the-counter traded derivatives (i.e., forward foreign currency exchange contracts, swaps and over-the-counter options). For derivatives traded under an ISDA Master Agreement, the collateral requirements are netted across all transactions traded under such agreement and one amount is posted from one party to the other to collateralize such obligations. Cash
25
Table of Contents
MFS Strategic Income Portfolio
Notes to Financial Statements – continued
collateral that has been pledged to cover obligations of the fund under derivative contracts, if any, will be reported separately on the Statement of Assets and Liabilities as restricted cash. Securities collateral pledged for the same purpose, if any, is noted in the Portfolio of Investments.
Futures Contracts – The fund entered into futures contracts which may be used to hedge against or obtain broad market, interest rate, duration, or currency exposure. A futures contract represents a commitment for the future purchase or sale of an asset at a specified price on a specified date.
Upon entering into a futures contract, the fund is required to deposit with the broker, either in cash or securities, an initial margin in an amount equal to a certain percentage of the notional amount of the contract. Subsequent payments (variation margin) are made or received by the fund each day, depending on the daily fluctuations in the value of the contract, and are recorded for financial statement purposes as unrealized gain or loss by the fund until the contract is closed or expires at which point the gain or loss on futures is realized.
The fund bears the risk of interest rates, exchange rates or securities prices moving unexpectedly, in which case, the fund may not achieve the anticipated benefits of the futures contracts and may realize a loss. While futures may present less counterparty risk to the fund since the contracts are exchange traded and the exchange’s clearinghouse guarantees payments to the broker, there is still counterparty credit risk due to the insolvency of the broker. The fund’s maximum risk of loss due to counterparty credit risk is equal to the margin posted by the fund to the broker plus any gains or minus any losses on the outstanding futures contracts.
Forward Foreign Currency Exchange Contracts – The fund entered into forward foreign currency exchange contracts for the purchase or sale of a specific foreign currency at a fixed price on a future date. These contracts may be used to hedge the fund’s currency risk or for non-hedging purposes. For hedging purposes, the fund may enter into contracts to deliver or receive foreign currency that the fund will receive from or use in its normal investment activities. The fund may also use contracts to hedge against declines in the value of foreign currency denominated securities due to unfavorable exchange rate movements. For non-hedging purposes, the fund may enter into contracts with the intent of changing the relative exposure of the fund’s portfolio of securities to different currencies to take advantage of anticipated exchange rate changes.
Forward foreign currency exchange contracts are adjusted by the daily exchange rate of the underlying currency and any unrealized gains or losses are recorded as a receivable or payable for forward foreign currency exchange contracts until the contract settlement date. On contract settlement date, any gain or loss on the contract is recorded as realized gains or losses on foreign currency transactions.
Risks may arise upon entering into these contracts from unanticipated movements in the value of the contract and from the potential inability of counterparties to meet the terms of their contracts. Generally, the fund’s maximum risk due to counterparty credit risk is the unrealized gain on the contract due to the use of Continuous Linked Settlement, an industry accepted settlement system. This risk is mitigated in cases where there is an ISDA Master Agreement between the fund and the counterparty providing for netting as described above and for posting of collateral by the counterparty to the fund to cover the fund’s exposure to the counterparty under such ISDA Master Agreement.
Swap Agreements – The fund entered into swap agreements. A swap is generally an exchange of cash payments, at specified intervals or upon the occurrence of specified events, between the fund and a counterparty. The net cash payments exchanged are recorded as a realized gain or loss on swap transactions in the Statement of Operations. The value of the swap, which is adjusted daily and includes any related interest accruals to be paid or received by the fund, is recorded on the Statement of Assets and Liabilities. The daily change in value, including any related interest accruals to be paid or received, is recorded as unrealized appreciation or depreciation on swap transactions in the Statement of Operations. Amounts paid or received at the inception of the swap are reflected as premiums paid or received on the Statement of Assets and Liabilities and are amortized using the effective interest method over the term of the agreement. A liquidation payment received or made upon early termination is recorded as a realized gain or loss on swap transactions in the Statement of Operations.
Risks related to swap agreements include the possible lack of a liquid market, unfavorable market and interest rate movements of the underlying instrument and the failure of the counterparty to perform under the terms of the agreements. To address counterparty risk, swap transactions are limited to only highly-rated counterparties. The risk is further mitigated by having an ISDA Master Agreement between the fund and the counterparty providing for netting as described above and by the posting of collateral by the counterparty to the fund to cover the fund’s exposure to the counterparty under such ISDA Master Agreement.
The fund entered into credit default swaps in order to manage its exposure to the market or certain sectors of the market, to reduce its credit risk exposure to defaults of corporate and sovereign issuers or to create exposure to corporate or sovereign issuers to which it is not otherwise exposed. In a credit default swap, the protection buyer can make an upfront payment and
26
Table of Contents
MFS Strategic Income Portfolio
Notes to Financial Statements – continued
will make a stream of payments based on a fixed percentage applied to the contract notional amount to the protection seller in exchange for the right to receive a specified return upon the occurrence of a defined credit event on the reference obligation (which may be either a single security or a basket of securities issued by corporate or sovereign issuers) and, with respect to the rare cases where physical settlement applies, the delivery by the buyer to the seller of a defined deliverable obligation. Although contract-specific, credit events generally consist of a combination of the following: bankruptcy, failure to pay, restructuring, obligation acceleration, obligation default, or repudiation/moratorium, each as defined in the 2003 ISDA Credit Derivatives Definitions as amended by the relevant contract. Restructuring is generally not applicable when the reference obligation is issued by a North American corporation and obligation acceleration, obligation default, or repudiation/moratorium are generally only applicable when the reference obligation is issued by a sovereign entity or an entity in an emerging country. Upon determination of the final price for the deliverable obligation (or upon delivery of the deliverable obligation in the case of physical settlement), the difference between the value of the deliverable obligation and the swap’s notional amount is recorded as realized gain or loss on swap transactions in the Statement of Operations.
Credit default swaps are considered to have credit-risk-related contingent features since they trigger payment by the protection seller to the protection buyer upon the occurrence of a defined credit event. As discussed earlier in this note, any collateral requirements for these swaps are based generally on the market value of the swap netted against collateral requirements for other types of over-the-counter derivatives traded under each counterparty’s ISDA Master Agreement. The maximum amount of future, undiscounted payments that the fund, as protection seller, could be required to make is equal to the swap’s notional amount. The protection seller’s payment obligation would be offset to the extent of the value of the contract’s deliverable obligation. At December 31, 2011, the fund did not hold any credit default swaps at an unrealized loss where it is the protection seller.
The fund’s maximum risk of loss from counterparty risk, either as the protection seller or as the protection buyer, is the fair value of the contract. This risk is mitigated by having an ISDA Master Agreement between the fund and the counterparty providing for netting as described above and by the posting of collateral by the counterparty to the fund to cover the fund’s exposure to the counterparty under such ISDA Master Agreement.
Loans and Other Direct Debt Instruments – The fund invests in loans and loan participations or other receivables. These investments may include standby financing commitments, including revolving credit facilities, which obligate the fund to supply additional cash to the borrower on demand. Loan participations involve a risk of insolvency of the lending bank or other financial intermediary.
Indemnifications – Under the fund’s organizational documents, its officers and Trustees may be indemnified against certain liabilities and expenses arising out of the performance of their duties to the fund. Additionally, in the normal course of business, the fund enters into agreements with service providers that may contain indemnification clauses. The fund’s maximum exposure under these agreements is unknown as this would involve future claims that may be made against the fund that have not yet occurred.
Investment Transactions and Income – Investment transactions are recorded on the trade date. Interest income is recorded on the accrual basis. All premium and discount is amortized or accreted for financial statement purposes in accordance with U.S. generally accepted accounting principles. The fund earns certain fees in connection with its floating rate loan purchasing activities. These fees are in addition to interest payments earned and may include amendment fees, commitment fees, facility fees, consent fees, and prepayment fees. Commitment fees are recorded on an accrual basis as income in the accompanying financial statements. Dividends received in cash are recorded on the ex-dividend date. Certain dividends from foreign securities will be recorded when the fund is informed of the dividend if such information is obtained subsequent to the ex-dividend date. Dividend and interest payments received in additional securities are recorded on the ex-dividend or ex-interest date in an amount equal to the value of the security on such date. Debt obligations may be placed on non-accrual status or set to accrue at a rate of interest less than the contractual coupon when the collection of all or a portion of interest has become doubtful. Interest income for those debt obligations may be further reduced by the write-off of the related interest receivables when deemed uncollectible.
The fund may receive proceeds from litigation settlements. Any proceeds received from litigation involving portfolio holdings are reflected in the Statement of Operations in realized gain/loss if the security has been disposed of by the fund or in unrealized gain/loss if the security is still held by the fund. Any other proceeds from litigation not related to portfolio holdings are reflected as other income in the Statement of Operations.
Fees Paid Indirectly – The fund’s custody fee may be reduced according to an arrangement that measures the value of cash deposited with the custodian by the fund. This amount, for the year ended December 31, 2011, is shown as a reduction of total expenses on the Statement of Operations.
27
Table of Contents
MFS Strategic Income Portfolio
Notes to Financial Statements – continued
Tax Matters and Distributions – The fund intends to qualify as a regulated investment company, as defined under Subchapter M of the Internal Revenue Code, and to distribute all of its taxable income, including realized capital gains. As a result, no provision for federal income tax is required. The fund’s federal tax returns for the prior three fiscal years remain subject to examination by the Internal Revenue Service. Foreign taxes have been accrued by the fund in the accompanying financial statements.
Distributions to shareholders are recorded on the ex-dividend date. Income and capital gain distributions are determined in accordance with income tax regulations, which may differ from U.S. generally accepted accounting principles. Certain capital accounts in the financial statements are periodically adjusted for permanent differences in order to reflect their tax character. These adjustments have no impact on net assets or net asset value per share. Temporary differences which arise from recognizing certain items of income, expense, gain or loss in different periods for financial statement and tax purposes will reverse at some time in the future. Distributions in excess of net investment income or net realized gains are temporary overdistributions for financial statement purposes resulting from differences in the recognition or classification of income or distributions for financial statement and tax purposes.
Book/tax differences primarily relate to amortization and accretion of debt securities, wash sale loss deferrals, straddle loss deferrals, and derivative transactions.
The tax character of distributions declared to shareholders for the last two fiscal years is as follows:
| 12/31/11 | 12/31/10 | |||||||
| Ordinary income (including any short-term capital gains) | $2,837,428 | $2,808,031 | ||||||
The federal tax cost and the tax basis components of distributable earnings were as follows:
| As of 12/31/11 | ||||
| Cost of investments | $47,345,140 | |||
| Gross appreciation | 2,744,214 | |||
| Gross depreciation | (1,838,179 | ) | ||
| Net unrealized appreciation (depreciation) | $906,035 | |||
| Undistributed ordinary income | 2,688,309 | |||
| Capital loss carryforwards | (3,843,513 | ) | ||
| Other temporary differences | (415,277 | ) |
Under the Regulated Investment Company Modernization Act of 2010 (the “Act”), net capital losses recognized after December 31, 2010 may be carried forward indefinitely, and their character is retained as short-term and/or long-term losses. Previously, net capital losses were carried forward for eight years and treated as short-term losses. As a transition rule, the Act requires that post-enactment net capital losses be used before pre-enactment net capital losses.
As of December 31, 2011, the fund had capital loss carryforwards available to offset future realized gains. Such losses expire as follows:
| Pre-enactment losses: | ||||
| 12/31/15 | $(8,256 | ) | ||
| 12/31/16 | (2,156,556 | ) | ||
| 12/31/17 | (1,642,018 | ) | ||
| Total | $(3,806,830 | ) | ||
| Post-enactment losses: | ||||
| Long-Term | $(36,683 | ) | ||
Multiple Classes of Shares of Beneficial Interest – The fund offers multiple classes of shares, which differ in their respective distribution and/or service fees. The fund’s income, realized and unrealized gain (loss), and common expenses are allocated to shareholders based on the daily net assets of each class. Dividends are declared separately for each class. Differences in per share dividend rates are generally due to differences in separate class expenses. The fund’s distributions declared to shareholders as reported on the Statements of Changes in Net Assets are presented by class as follows:
| From net investment income | ||||||||
| Year ended 12/31/11 | Year ended 12/31/10 | |||||||
| Initial Class | $2,246,632 | $2,214,015 | ||||||
| Service Class | 590,796 | 594,016 | ||||||
| Total | $2,837,428 | $2,808,031 | ||||||
28
Table of Contents
MFS Strategic Income Portfolio
Notes to Financial Statements – continued
| (3) | Transactions with Affiliates |
Investment Adviser – The fund has an investment advisory agreement with MFS to provide overall investment management and related administrative services and facilities to the fund. The management fee is computed daily and paid monthly at the following annual rates:
| First $1 billion of average daily net assets | 0.75% | |||
| Average daily net assets in excess of $1 billion | 0.65% |
The investment adviser has agreed in writing to reduce its management fee to 0.70% for the first $1 billion of average daily net assets. This written agreement terminated on December 31, 2011. This management fee reduction amounted to $25,108, which is shown as a reduction of total expenses in the Statement of Operations. The management fee incurred for the year ended December 31, 2011 was equivalent to an annual effective rate of 0.70% of the fund’s average daily net assets.
On December 1, 2011, shareholders of the fund approved a new investment advisory agreement between the trust, on behalf of the fund, and MFS. This new investment advisory agreement provides that effective January 1, 2012, the management fee is computed daily and paid monthly at the following annual rates:
| First $1 billion of average daily net assets | 0.70% | |||
| Average daily net assets in excess of $1 billion | 0.65% |
The investment adviser has agreed in writing to pay a portion of the fund’s total annual operating expenses, exclusive of interest, taxes, extraordinary expenses, brokerage and transaction costs, and investment-related expenses, such that total annual operating expenses do not exceed 0.90% of average daily net assets for the Initial Class shares and 1.15% of average daily net assets for the Service Class shares. This written agreement will continue until April 30, 2013. For the year ended December 31, 2011, this reduction amounted to $47,343 and is reflected as a reduction of total expenses in the Statement of Operations.
Distributor – MFS Fund Distributors, Inc. (MFD), a wholly-owned subsidiary of MFS, is the distributor of shares of the fund. The Trustees have adopted a distribution plan for the Service Class shares pursuant to Rule 12b-1 under the Investment Company Act of 1940.
The fund’s distribution plan provides that the fund will pay MFD distribution and/or service fees equal to 0.25% per annum of its average daily net assets attributable to Service Class shares as partial consideration for services performed and expenses incurred by MFD and financial intermediaries (including participating insurance companies that invest in the fund to fund variable annuity and variable life insurance contracts, sponsors of qualified retirement and pension plans that invest in the fund, and affiliates of these participating insurance companies and plan sponsors) in connection with the sale and distribution of the Service Class shares. MFD may subsequently pay all, or a portion, of the distribution and/or service fees to financial intermediaries.
Shareholder Servicing Agent – MFS Service Center, Inc. (MFSC), a wholly-owned subsidiary of MFS, has contracted to provide transfer agent and recordkeeping functions in connection with the issuance, transfer, and redemption of each class of shares of the fund under a Shareholder Servicing Agent Agreement. During the year ended December 31, 2011, the fund did not pay MFSC a fee for this service.
Administrator – MFS provides certain financial, legal, shareholder communications, compliance, and other administrative services to the fund. Under an administrative services agreement, the fund partially reimburses MFS the costs incurred to provide these services. The fund is charged an annual fixed amount of $17,500 plus a fee based on average daily net assets. The administrative services fee incurred for the year ended December 31, 2011 was equivalent to an annual effective rate of 0.0353% of the fund’s average daily net assets.
Trustees’ and Officers’ Compensation – The fund pays compensation to Trustees in the form of a retainer, attendance fees, and additional compensation to the Board chairperson. The fund does not pay compensation directly to officers of the fund who are also officers of the investment adviser, all of whom receive remuneration for their services to the fund from MFS. Certain officers of the fund are officers or directors of MFS, MFD, and MFSC.
Other – This fund and certain other funds managed by MFS (the funds) have entered into services agreements (the Agreements) which provide for payment of fees by the funds to Tarantino LLC and Griffin Compliance LLC in return for the provision of services of an Independent Chief Compliance Officer (ICCO) and Assistant ICCO, respectively, for the funds. The ICCO and Assistant ICCO are officers of the funds and the sole members of Tarantino LLC and Griffin Compliance LLC, respectively. The funds can terminate the Agreements with Tarantino LLC and Griffin Compliance LLC at any time under the terms of the Agreements. MFS has agreed to bear all expenses associated with office space, other administrative support, and supplies provided to the ICCO and Assistant ICCO. For the year ended December 31, 2011, the aggregate fees paid by the fund to Tarantino LLC and Griffin Compliance LLC were $831 and are included in miscellaneous expense on the Statement of Operations.
29
Table of Contents
MFS Strategic Income Portfolio
Notes to Financial Statements – continued
The fund invests in the MFS Institutional Money Market Portfolio which is managed by MFS and seeks a high level of current income consistent with preservation of capital and liquidity. Income earned on this investment is included in dividends from underlying affiliated funds on the Statement of Operations. This money market fund does not pay a management fee to MFS.
| (4) | Portfolio Securities |
Purchases and sales of investments, other than purchased option transactions and short-term obligations, were as follows:
| Purchases | Sales | |||||||
| U.S. Government securities | $50,695 | $37,332 | ||||||
| Investments (non-U.S. Government securities) | $13,686,342 | $18,532,423 | ||||||
| (5) | Shares of Beneficial Interest |
The fund’s Declaration of Trust permits the Trustees to issue an unlimited number of full and fractional shares of beneficial interest. Transactions in fund shares were as follows:
| Year ended 12/31/11 | Year ended 12/31/10 | |||||||||||||||
| Shares | Amount | Shares | Amount | |||||||||||||
| Shares sold | ||||||||||||||||
Initial Class | 372,136 | $3,704,937 | 355,970 | $3,411,617 | ||||||||||||
Service Class | 167,680 | 1,662,734 | 162,760 | 1,564,769 | ||||||||||||
| 539,816 | $5,367,671 | 518,730 | $4,976,386 | |||||||||||||
| Shares issued to shareholders in reinvestment of distributions | ||||||||||||||||
Initial Class | 232,812 | $2,246,632 | 237,301 | $2,214,015 | ||||||||||||
Service Class | 61,541 | 590,796 | 63,941 | 594,016 | ||||||||||||
| 294,353 | $2,837,428 | 301,242 | $2,808,031 | |||||||||||||
| Shares reacquired | ||||||||||||||||
Initial Class | (790,674 | ) | $(7,873,245 | ) | (698,800 | ) | $(6,759,659 | ) | ||||||||
Service Class | (273,071 | ) | (2,696,748 | ) | (349,494 | ) | (3,367,680 | ) | ||||||||
| (1,063,745 | ) | $(10,569,993 | ) | (1,048,294 | ) | $(10,127,339 | ) | |||||||||
| Net change | ||||||||||||||||
Initial Class | (185,726 | ) | $(1,921,676 | ) | (105,529 | ) | $(1,134,027 | ) | ||||||||
Service Class | (43,850 | ) | (443,218 | ) | (122,793 | ) | (1,208,895 | ) | ||||||||
| (229,576 | ) | $(2,364,894 | ) | (228,322 | ) | $(2,342,922 | ) | |||||||||
| (6) | Line of Credit |
The fund and certain other funds managed by MFS participate in a $1.1 billion unsecured committed line of credit, subject to a $1 billion sublimit, provided by a syndication of banks under a credit agreement. Borrowings may be made for temporary financing needs. Interest is charged to each fund, based on its borrowings, generally at a rate equal to the higher of the Federal Reserve funds rate or one month LIBOR plus an agreed upon spread. A commitment fee, based on the average daily, unused portion of the committed line of credit, is allocated among the participating funds at the end of each calendar quarter. In addition, the fund and other funds managed by MFS have established unsecured uncommitted borrowing arrangements with certain banks for temporary financing needs. Interest is charged to each fund, based on its borrowings, at a rate equal to the Federal Reserve funds rate plus an agreed upon spread. For the year ended December 31, 2011, the fund’s commitment fee and interest expense were $387 and $0, respectively, and are included in miscellaneous expense on the Statement of Operations.
| (7) | Transactions in Underlying Affiliated Funds – Affiliated Issuers |
An affiliated issuer may be considered one in which the fund owns 5% or more of the outstanding voting securities, or a company which is under common control. For the purposes of this report, the fund assumes the following to be affiliated issuers:
| Underlying Affiliated Funds | Beginning Shares/Par Amount | Acquisitions Shares/Par Amount | Dispositions Shares/Par Amount | Ending Shares/Par Amount | ||||||||||||
| MFS Institutional Money Market Portfolio | 55 | 14,178,452 | (11,633,359 | ) | 2,545,148 | |||||||||||
| Underlying Affiliated Funds | Realized Gain (Loss) | Capital Gain Distributions | Dividend Income | Ending Value | ||||||||||||
| MFS Institutional Money Market Portfolio | $— | $— | $1,847 | $2,545,148 | ||||||||||||
30
Table of Contents
MFS Strategic Income Portfolio
REPORT OF INDEPENDENT REGISTERED PUBLIC ACCOUNTING FIRM
To the Board of Trustees of MFS Variable Insurance Trust II and the Shareholders of
MFS Strategic Income Portfolio:
We have audited the accompanying statement of assets and liabilities, including the portfolio of investments, of MFS Strategic Income Portfolio (the “Fund”) (one of the portfolios comprising MFS Variable Insurance Trust II) as of December 31, 2011, and the related statement of operations for the year then ended, the statements of changes in net assets for each of the two years in the period then ended, and the financial highlights for each of the five years in the period then ended. These financial statements and financial highlights are the responsibility of the Fund’s management. Our responsibility is to express an opinion on these financial statements and financial highlights based on our audits.
We conducted our audits in accordance with the standards of the Public Company Accounting Oversight Board (United States). Those standards require that we plan and perform the audit to obtain reasonable assurance about whether the financial statements and financial highlights are free of material misstatement. The Fund is not required to have, nor were we engaged to perform, an audit of its internal control over financial reporting. Our audits included consideration of internal control over financial reporting as a basis for designing audit procedures that are appropriate in the circumstances, but not for the purpose of expressing an opinion on the effectiveness of the Fund’s internal control over financial reporting. Accordingly, we express no such opinion. An audit also includes examining, on a test basis, evidence supporting the amounts and disclosures in the financial statements, assessing the accounting principles used and significant estimates made by management, as well as evaluating the overall financial statement presentation. Our procedures included confirmation of securities owned as of December 31, 2011, by correspondence with the custodian and brokers; where replies were not received from brokers, we performed other auditing procedures. We believe that our audits provide a reasonable basis for our opinion.
In our opinion, the financial statements and financial highlights referred to above present fairly, in all material respects, the financial position of MFS Strategic Income Portfolio as of December 31, 2011, the results of its operations for the year then ended, the changes in its net assets for each of the two years in the period then ended, and the financial highlights for each of the five years in the period then ended, in conformity with accounting principles generally accepted in the United States of America.
DELOITTE & TOUCHE LLP
Boston, Massachusetts
February 15, 2012
31
Table of Contents
MFS Strategic Income Portfolio
RESULTS OF SHAREHOLDER MEETING (unaudited)
At a special meeting of shareholders of MFS Strategic Income Portfolio, which was held on December 1, 2011, the following actions were taken for which shareholders of all series of MFS Variable Insurance Trust II voted together as a single class with respect to Item 1 and shareholders of MFS Strategic Income Portfolio voted as a separate class with respect to Items 2 and 3:
Item 1: Election of ten Trustees as members of the Board of Trustees of the Trust effective January 1, 2012:
| Number of Shares | ||||||||
| For | Withheld Authority | |||||||
| Robert E. Butler | 681,916,712.8686 | 46,472,894.9218 | ||||||
| Maureen R. Goldfarb | 682,835,794.8512 | 45,553,812.9392 | ||||||
| David H. Gunning | 681,500,267.3085 | 46,889,340.4819 | ||||||
| William R. Gutow | 681,050,223.5547 | 47,339,384.2357 | ||||||
| Michael Hegarty | 682,477,088.8584 | 45,912,518.9320 | ||||||
| John P. Kavanaugh | 683,794,425.4269 | 44,595,182.3635 | ||||||
| Robert J. Manning | 682,699,559.7374 | 45,690,048.0530 | ||||||
| J. Dale Sherratt | 681,362,743.0513 | 47,026,864.7391 | ||||||
| Laurie J. Thomsen | 683,408,094.0000 | 44,981,513.7904 | ||||||
| Robert W. Uek | 681,424,852.0247 | 46,964,755.7657 | ||||||
Item 2: To approve a new investment advisory agreement dated January 1, 2012, between the Trust, on behalf of MFS Strategic Income Portfolio, and MFS:
| Number of Shares | ||||||||||||
| For | Against | Withheld Authority | ||||||||||
| 4,611,552.4057 | 41,527.3878 | 435,291.9458 | ||||||||||
Item 3: To approve revisions to and restatements of certain fundamental investment restrictions of MFS Strategic Income Portfolio effective January 1, 2012 as detailed below:
| Number of Shares | ||||||||||||||
| For | Against | Withheld Authority | ||||||||||||
| A. | Borrowing | 4,177,000.8885 | 320,800.5563 | 590,570.2945 | ||||||||||
| B. | Underwriting Securities | 4,274,017.7460 | 258,074.4033 | 556,279.5900 | ||||||||||
| C. | Issuance of Senior Securities | 4,264,551.0247 | 249,210.1184 | 574,610.5962 | ||||||||||
| D. | Lending of Money or Securities | 4,188,161.7408 | 271,115.6413 | 629,094.3572 | ||||||||||
| E. | Purchases or Sales of Real Estate; Interests in Oil, Gas or Mineral Leases; and Commodities | 4,330,811.4120 | 226,274.3368 | 531,285.9905 | ||||||||||
| F. | Industry Concentration | 4,363,936.8806 | 158,947.7393 | 565,487.1194 | ||||||||||
32
Table of Contents
MFS Strategic Income Portfolio
TRUSTEES AND OFFICERS – IDENTIFICATION AND BACKGROUND
The Trustees and officers of the Trust, as of February 1, 2012, are listed below, together with their principal occupations during the past five years. (Their titles may have varied during that period.) The address of each Trustee and officer is 500 Boylston Street, Boston, Massachusetts 02116.
Name, Age | Position(s) with Fund | Trustee/Officer Since (h) | Principal Occupations | Other Directorships (j) | ||||
| INTERESTED TRUSTEES | ||||||||
Robert J. Manning (k) (age 48) | Trustee | February 2004 | Massachusetts Financial Services Company, Chairman, Chief Executive Officer and Director; President (until December 2009); Chief Investment Officer (until July 2010) | N/A | ||||
| INDEPENDENT TRUSTEES | ||||||||
David H. Gunning (age 69) | Trustee and Chair of Trustees | January 2004 | Retired; Cleveland-Cliffs Inc. (mining products and service provider), Vice Chairman/Director (until May 2007) | Lincoln Electric Holdings, Inc. (welding equipment manufacturer), Director; Development Alternatives, Inc. (consulting), Director/Non-Executive Chairman; Portman Limited (mining), Director (until 2008) | ||||
Robert E. Butler (age 70) | Trustee | January 2006 | Consultant – investment company industry regulatory and compliance matters | N/A | ||||
Maureen R. Goldfarb (age 56) | Trustee | January 2009 | Private investor | N/A | ||||
William R. Gutow (age 70) | Trustee | December 1993 | Private investor and real estate consultant; Capitol Entertainment Management Company (video franchise), Vice Chairman | Atlantic Coast Tan (tanning salons), Vice Chairman (until 2007); Texas Donuts (donut franchise), Vice Chairman (until 2010) | ||||
Michael Hegarty (age 67) | Trustee | December 2004 | Private investor | N/A | ||||
John P. Kavanaugh (age 57) | Trustee | January 2009 | Private investor; The Hanover Insurance Group, Inc., Vice President and Chief Investment Officer (until 2006); Allmerica Investment Trust, Allmerica Securities Trust and Opus Investment Trust (investment companies), Chairman, President and Trustee (until 2006) | N/A | ||||
J. Dale Sherratt (age 73) | Trustee | June 1989 | Insight Resources, Inc. (acquisition planning specialists), President; Wellfleet Investments (investor in health care companies), Managing General Partner | N/A | ||||
Laurie J. Thomsen (age 54) | Trustee | March 2005 | Private investor; New Profit, Inc. (venture philanthropy), Executive Partner (until 2010) | The Travelers Companies (property and casualty insurance), Director | ||||
Robert W. Uek (age 70) | Trustee | January 2006 | Consultant to investment company industry | N/A | ||||
| OFFICERS | ||||||||
John M. Corcoran (k) (age 46) | President | October 2008 | Massachusetts Financial Services Company, Senior Vice President (since October 2008); State Street Bank and Trust (financial services provider), Senior Vice President, (until September 2008) | N/A | ||||
| Christopher R. Bohane (k) (age 38) | Assistant Secretary and Assistant Clerk | July 2005 | Massachusetts Financial Services Company, Vice President and Senior Counsel | N/A | ||||
Kino Clark (k) (age 43) | Assistant Treasurer | January 2012 | Massachusetts Financial Services Company, Assistant Vice President | N/A | ||||
33
Table of Contents
MFS Strategic Income Portfolio
Trustees and Officers – continued
Name, Age | Position(s) with Fund | Trustee/Officer Since (h) | Principal Occupations | Other Directorships (j) | ||||
Ethan D. Corey (k) (age 48) | Assistant Secretary and Assistant Clerk | July 2005 | Massachusetts Financial Services Company, Senior Vice President and Associate General Counsel | N/A | ||||
David L. DiLorenzo (k) (age 43) | Treasurer | July 2005 | Massachusetts Financial Services Company, Vice President | N/A | ||||
Robyn L. Griffin (age 36) | Assistant Independent Chief Compliance Officer | August 2008 | Griffin Compliance LLC (provider of compliance services), Principal (since August 2008); State Street Corporation (financial services provider), Mutual Fund Administration Assistant Vice President (October 2006 – July 2008); Liberty Mutual Group (insurance), Personal Market Assistant Controller (April 2006 – October 2006); Deloitte & Touche LLP (professional services firm). | N/A | ||||
Brian E. Langenfeld (k) (age 38) | Assistant Secretary and Assistant Clerk | June 2006 | Massachusetts Financial Services Company, Vice President and Senior Counsel | N/A | ||||
Ellen Moynihan (k) (age 54) | Assistant Treasurer | April 1997 | Massachusetts Financial Services Company, Senior Vice President | N/A | ||||
Susan S. Newton (k) (age 61) | Assistant Secretary and Assistant Clerk | May 2005 | Massachusetts Financial Services Company, Senior Vice President and Associate General Counsel | N/A | ||||
Susan A. Pereira (k) (age 41) | Assistant Secretary and Assistant Clerk | July 2005 | Massachusetts Financial Services Company, Vice President and Senior Counsel | N/A | ||||
Mark N. Polebaum (k) (age 59) | Secretary and Clerk | January 2006 | Massachusetts Financial Services Company, Executive Vice President, General Counsel and Secretary | N/A | ||||
Frank L. Tarantino (age 67) | Independent Chief Compliance Officer | June 2004 | Tarantino LLC (provider of compliance services), Principal | N/A | ||||
Richard S. Weitzel (k) (age 41) | Assistant Secretary and Assistant Clerk | October 2007 | Massachusetts Financial Services Company, Vice President and Assistant General Counsel | N/A | ||||
James O. Yost (k) (age 51) | Deputy Treasurer | September 1990 | Massachusetts Financial Services Company, Senior Vice President | N/A | ||||
| (h) | Date first appointed to serve as Trustee/officer of an MFS fund. Each Trustee has served continuously since appointment unless indicated otherwise. For the period from December 15, 2004 until February 22, 2005, Mr. Manning served as Advisory Trustee. For the period October 2008, until January 2012, Mr. Corcoran served as Treasurer of the Funds. Prior to January 2012, Messrs. DiLorenzo and Yost served as Assistant Treasurers of the Funds. |
| (j) | Directorships or trusteeships of companies required to report to the Securities and Exchange Commission (i.e., “public companies”). |
| (k) | “Interested person” of the Trust within the meaning of the Investment Company Act of 1940 (referred to as the 1940 Act), which is the principal federal law governing investment companies like the fund, as a result of position with MFS. The address of MFS is 500 Boylston Street, Boston, Massachusetts 02116. |
Each Trustee has been elected by shareholders and each Trustee and officer holds office until his or her successor is chosen and qualified or until his or her earlier death, resignation, retirement or removal. The Trust does not hold annual meetings for the purpose of electing Trustees, and Trustees are not elected for fixed terms. Messrs. Butler, Kavanaugh, Uek and Ms. Thomsen are members of the Trust’s Audit Committee.
Each of the Fund’s Trustees and officers holds comparable positions with certain other funds of which MFS or a subsidiary is the investment adviser or distributor, and, in the case of the officers, with certain affiliates of MFS. As of January 1, 2012, the Trustees served as board members of 131 funds within the MFS Family of Funds.
34
Table of Contents
MFS Strategic Income Portfolio
Trustees and Officers – continued
The Statement of Additional Information for the Fund includes further information about the Trustees and is available without charge upon request by calling 1-800-225-2606.
Investment Adviser Massachusetts Financial Services Company 500 Boylston Street, Boston, MA 02116-3741 | Custodian State Street Bank and Trust 1 Lincoln Street, Boston, MA 02111-2900 | |
Distributor MFS Fund Distributors, Inc. 500 Boylston Street, Boston, MA 02116-3741 | Independent Registered Public Accounting Firm Deloitte & Touche LLP 200 Berkeley Street, Boston, MA 02116 | |
Portfolio Managers William Adams James Calmas David Cole Robert Persons Matthew Ryan Erik Weisman |
35
Table of Contents
MFS Strategic Income Portfolio
At a special meeting of shareholders of the MFS Strategic Income Portfolio (hereinafter referred to as the “Fund” or the “Portfolio”), which was held on December 1, 2011, the shareholders approved a new investment advisory agreement based on the recommendation of the Board of Trustees. At its July, 2011 meeting, the Board of Trustees (i) approved, and recommended for shareholder approval, the new investment advisory agreement effective January 1, 2012, and (ii) the continuation of the existing investment advisory agreement effective September 1, 2011. The following includes a description of the factors that the Board of Trustees considered and the conclusions that formed the basis of their approval of both the new investment advisory agreement and the continuation of the prior investment advisory agreement.
BOARD APPROVAL OF NEW INVESTMENT ADVISORY AGREEMENT
The Investment Company Act of 1940 requires that both the full Board of Trustees and a majority of the non-interested (“independent”) Trustees, voting separately, initially approve the new investment advisory agreement (the “New Agreement”) between Massachusetts Financial Services Company (“MFS”) and MFS Variable Insurance Trust II (the “Trust”) on behalf of the Portfolio and, beginning on the second anniversary of the initial effective date of the New Agreement, annually approve the continuation of the New Agreement. The Trustees have considered matters bearing on the Portfolio and the then current advisory arrangement at their meetings throughout the year, including a review of performance data at each regular meeting. In addition, the independent Trustees met in person in July 2011 to consider the initial approval of the New Agreement, and to recommend that shareholders approve the New Agreement. The independent Trustees were assisted in their evaluation of the New Agreement by independent legal counsel, from whom they received separate legal advice and with whom they met separately from MFS management. The independent Trustees were also assisted in this process by the Portfolio’s Independent Chief Compliance Officer, a full-time senior officer appointed by and reporting to the independent Trustees.
In connection with their deliberations regarding the initial approval of the New Agreement, the Trustees, including the independent Trustees, considered such information and factors as they believed, in light of the legal advice furnished to them and their own business judgment, to be relevant. The New Agreement was considered separately for the series of the Trust (collectively, the “Portfolios”), although the Trustees also took into account the common interests of all Portfolios in the Trust in their review. As described below, the Trustees considered the nature, quality, and extent of the various investment advisory, administrative, and/or shareholder services to be performed by MFS under the New Agreement and other arrangements with the Trust.
In connection with their initial review meeting, the Trustees received and relied upon materials that included, among other items: (i) information provided by MFS on the advisory fees of comparable portfolios of its other clients, including institutional separate account and other clients, (ii) information as to whether, and to what extent applicable, expense waivers, reimbursements or fee “breakpoints” would be observed for the Portfolio under the New Agreement, and (iii) a comparison and summary of the differences in the provisions in the New Agreement compared to those in each of the then current investment advisory agreements for the Portfolios. In addition, in connection with the independent Trustees’ meetings in May and July, 2011 (the “contract review meetings”) for the purpose of considering whether to approve the continuation of the then current investment advisory agreements for the Portfolio, the independent Trustees received: (1) information provided by Lipper Inc. (“Lipper”) on the investment performance of the Portfolio for various time periods ended December 31, 2010, compared to the investment performance of a group of funds with substantially similar investment classifications/objectives (the “Lipper performance universe”), (2) information provided by Lipper on the Portfolio’s advisory fees and other expenses compared to the advisory fees and other expenses of comparable funds identified by Lipper (the “Lipper expense group”), (3) information regarding MFS’ financial results and financial condition, including MFS’ and certain of its affiliates’ estimated profitability from services performed for the Portfolio, (4) MFS’ views regarding the outlook for the mutual fund industry and its strategic business plans, (5) descriptions of various functions performed by MFS for the Trust, such as compliance monitoring and portfolio trading practices, and (6) information regarding the overall organization of MFS, including information about MFS’ senior management and other personnel providing investment advisory, administrative and other services to the Portfolio. The comparative performance, fee and expense information prepared and provided by Lipper was not independently verified, and the independent Trustees did not independently verify any information provided to them by MFS.
The Trustees’ conclusion as to the initial approval of the New Agreement was based on comprehensive consideration of all information provided to the Trustees and was not the result of any single factor. Some of the factors that figured particularly in the Trustees’ deliberations are described below for the Portfolio, while individual Trustees may have given different weight to various factors and evaluated the information presented as a whole differently than another individual Trustee. The Trustees recognized that the fee arrangements for the Portfolio could reflect years of review and discussion between the independent Trustees and MFS, that certain aspects of such arrangements may receive greater scrutiny in some years than others, and that the Trustees’ conclusions may be based, in part, on their consideration of these same arrangements during the course of the year and in prior years.
36
Table of Contents
MFS Strategic Income Portfolio
Board Approval of New Investment Advisory Agreement – continued
Because the portfolio management team managing the Portfolio’s investments under the then current investment advisory agreement will remain the same under the New Agreement for the Portfolio, the Trustees compared the Portfolio’s total return investment performance to the performance of its Lipper performance universe over various time periods, based on information provided by Lipper. The Trustees placed particular emphasis on the total return performance of the Portfolio’s Initial Class shares in comparison to the performance of funds in its Lipper performance universe over the one-, three- and five-year periods ended December 31, 2010. The Trustees did not rely on performance results for more recent periods.
The Trustees noted the performance of the Portfolio��s Initial Class shares was in the 3rd quintile relative to the other funds in the Lipper performance universe for the one-year period (the 1st quintile being the best performers and the 5th quintile being the worst performers). The total return performance of the Portfolio was also in the 3rd quintile for the three-year and five-year periods ended December 31, 2010, relative to the Lipper performance universe. Based on the nature and quality of services provided by MFS, the Board of Trustees concluded that the Portfolio’s performance was satisfactory.
In the course of their deliberations, the Trustees took into account information provided by MFS during contract review meetings, as well as during investment review meetings conducted with portfolio management personnel during the course of the year. For Portfolios whose performance lagged their peer groups, they discussed the factors that contributed thereto and MFS’ efforts to improve such Portfolios’ performance. After reviewing this information, the Trustees concluded, within the context of their overall conclusions regarding the New Agreement, that they were satisfied with MFS’ responses and efforts relating to investment performance.
In assessing the reasonableness of the Portfolio’s advisory fee, the Trustees considered, among other information, the Portfolio’s advisory fee and the total expense ratio of the Portfolio’s Initial Class shares as a percentage of average daily net assets, compared to the advisory fee and total expense ratios of its peer group of funds based on information provided by Lipper. The Trustees also considered the advisory fees charged by MFS to institutional accounts. In comparing these fees, the Trustees considered the generally broader scope of services provided by MFS to the Trust than those provided to institutional accounts. The Trustees also considered the higher demands placed on MFS’ investment personnel and trading infrastructure as a result of the daily cash in-flows and out-flows of the Portfolio, and the impact on MFS and related expenses due to the more extensive regulatory regime to which the Portfolio is subject, compared to institutional accounts.
In considering the fees, the Trustees noted from the Lipper data that the Portfolio’s effective advisory fee rate and total expense ratio were each approximately at the median of such fees and expenses of funds in the Lipper expense group. In addition, the Trustees accepted MFS’ offer to continue the expense limitation for the Portfolio. The Trustees further noted that the New Agreement would reflect MFS’ agreement to observe a lower advisory fee and to reduce the advisory fee on average daily net assets over $1 billion on a permanent basis. The Trustees further concluded that the breakpoint was sufficient to allow the Portfolio to benefit from economies of scale as its assets grow. The Trustees concluded that the fees were reasonable in light of the nature and quality of services provided.
The Trustees also considered whether the Portfolio is likely to benefit from any economies of scale due to future asset growth. In this regard, the Trustees reviewed the adequacy of breakpoints and discussed with MFS any adjustments necessary for the shareholders’ benefit.
The Trustees also considered information prepared by MFS relating to its costs and profits with respect to the Portfolio and other investment companies and accounts advised by MFS, as well as MFS’ methodologies used to determine and allocate its costs to the Portfolio and other accounts and products for purposes of estimating profitability.
The Trustees noted that there would be no increase to the net advisory fee arrangement for the Portfolio under the New Agreement when compared to the Portfolio’s then current investment advisory agreement. After reviewing these and other factors described below, the Trustees concluded that the advisory fees charged to the Portfolio under the New Agreement represent reasonable compensation in light of the nature and quality of the services being provided by MFS.
In addition, the Trustees considered MFS’ resources and related efforts to continue to retain, attract and motivate capable personnel to serve the Portfolio. The Trustees also considered the financial resources of MFS and its parent, Sun Life Financial Inc. The Trustees further considered any advantages and possible disadvantages of having an adviser which also serves other investment companies as well as institutional accounts.
The Trustees also considered the nature, quality, cost, and extent of administrative, transfer agency, and distribution services provided to the Trust by MFS and its affiliates under agreements and plans other than the New Agreement, including the 12b-1 fees the Portfolio pays to MFS Fund Distributors, Inc., an affiliate of MFS. The Trustees also considered the nature, extent and quality of certain other services MFS performs or arranges on the Portfolio’s behalf, which may include securities lending programs, directed expense payment programs, class action recovery programs, and MFS’ interaction with third-party service providers, principally custodians and sub-custodians. The Trustees concluded that the various non-advisory services provided
37
Table of Contents
MFS Strategic Income Portfolio
Board Approval of New Investment Advisory Agreement – continued
by MFS and its affiliates on behalf of the Portfolio were satisfactory. The Trustees also considered the benefits to MFS from the use of the Portfolio’s portfolio brokerage commissions to pay for investment research and various other factors. Additionally, the Trustees considered so-called “fall-out benefits” to MFS such as reputational value derived from serving as investment manager to the Trust, and determined that any such benefits derived by MFS were reasonable and fair.
Based on their evaluation of factors that they deemed to be material, including those factors described above, the Board of Trustees, including a majority of the independent Trustees, concluded that the New Agreement should be approved for an initial two-year period, commencing upon its effective date, as set forth in the New Agreement.
BOARD APPROVAL OF CONTINUATION OF PRIOR INVESTMENT ADVISORY AGREEMENT
The Investment Company Act of 1940 requires that both the full Board of Trustees and a majority of the non-interested (“independent”) Trustees, voting separately, annually approve the continuation of the investment advisory agreement between MFS Variable Insurance Trust II (the “Trust”) and Massachusetts Financial Services Company (“MFS”) on behalf of the Fund. The Trustees consider matters bearing on the Fund and the advisory arrangements at their meetings throughout the year, including a review of performance data at each regular meeting. In addition, the independent Trustees met in person in May and again in July 2011 (“contract review meetings”) for the specific purpose of considering whether to approve the continuation of the investment advisory agreement for the Fund. The independent Trustees were assisted in their evaluation of the investment advisory agreement by independent legal counsel, from whom they received separate legal advice and with whom they met separately from MFS management during various contract review meetings. The independent Trustees were also assisted in this process by the Fund’s Independent Chief Compliance Officer, a full-time senior officer appointed by and reporting to the independent Trustees.
In connection with their deliberations, the Trustees, including the independent Trustees, considered such information and factors as they believed, in light of the legal advice furnished to them and their own business judgment, to be relevant. The investment advisory agreement was considered separately for the Fund, although the Trustees also took into account the common interests of all Funds in the Trust in their review. As described below, the Trustees considered the nature, quality, and extent of the various investment advisory, administrative, and shareholder services performed by MFS under the existing investment advisory agreement and other arrangements with the Trust.
In connection with their contract review meetings, the Trustees received and relied upon materials which included, among other items: (i) information provided by Lipper Inc. (“Lipper”) on the investment performance of the Fund for various time periods ended December 31, 2010, compared to the investment performance of a group of funds with substantially similar investment classifications/objectives (the “Lipper performance universe”), (ii) information provided by Lipper on the Fund’s advisory fees and other expenses compared to the advisory fees and other expenses of comparable funds identified by Lipper (the “Lipper expense group”), (iii) information provided by MFS on the advisory fees of comparable portfolios of its other clients, including institutional separate account and other clients, (iv) information as to whether, and to what extent applicable, expense waivers, reimbursements or fee “breakpoints” are observed for the Fund, (v) information regarding MFS’ financial results and financial condition, including MFS’ and certain of its affiliates’ estimated profitability from services performed for the Fund and other investment companies that the Board oversees as a whole, and for MFS’ institutional business, (vi) MFS’ views regarding the outlook for the mutual fund industry and its strategic business plans, (vii) descriptions of various functions performed by MFS for the Trust, such as compliance monitoring and portfolio trading practices, and (viii) information regarding the overall organization of MFS, including information about MFS’ senior management and other personnel providing investment advisory, administrative and other services to the Fund. The comparative performance, fee and expense information prepared and provided by Lipper was not independently verified, and the independent Trustees did not independently verify any information provided to them by MFS.
The Trustees’ conclusion as to the continuation of the investment advisory agreement was based on comprehensive consideration of all information provided to the Trustees and was not the result of any single factor. Some of the factors that figured particularly in the Trustees’ deliberations are described below for the Fund, while individual Trustees may have given different weight to various factors and evaluated the information presented as a whole differently than another individual Trustee. The Trustees recognized that the fee arrangements for the Fund reflect years of review and discussion between the independent Trustees and MFS, that certain aspects of such arrangements may receive greater scrutiny in some years than others, and that the Trustees’ conclusions may be based, in part, on their consideration of these same arrangements during the course of the year and in prior years.
Based on information provided by Lipper, the Trustees compared the Fund’s total return investment performance to the performance of the Lipper performance universe over various time periods. The Trustees placed particular emphasis on the
38
Table of Contents
MFS Strategic Income Portfolio
Board Approval of Continuation of Prior Investment Advisory Agreement – continued
total return performance of the Fund’s Initial Class shares in comparison to the performance of funds in its Lipper performance universe over the one-, three- and five-year periods ended December 31, 2010. The Trustees did not rely on performance results for more recent periods, including those shown elsewhere in this report.
The Trustees noted the performance of the Fund’s Initial Class shares was in the 3rd quintile relative to the other funds in the Lipper performance universe for the one-year period (the 1st quintile being the best performers and the 5th quintile being the worst performers). The total return performance of the Fund was also in the 3rd quintile for the three-year and five-year periods ended December 31, 2010, relative to the Lipper performance universe. Based on the nature and quality of services provided by MFS, the Board of Trustees concluded that the Fund’s performance was satisfactory.
In the course of their deliberations, the Trustees took into account information provided by MFS during contract review meetings, as well as during investment review meetings conducted with portfolio management personnel during the course of the year.
In assessing the reasonableness of the Fund’s advisory fee, the Trustees considered, among other information, the Fund’s advisory fee and the total expense ratio of the Fund’s Initial Class shares as a percentage of average daily net assets, compared to the advisory fee and total expense ratios of its peer group of funds based on information provided by Lipper. The Trustees also considered the advisory fees charged by MFS to institutional accounts. In comparing these fees, the Trustees considered the generally broader scope of services provided by MFS to the Trust than those provided to institutional accounts. The Trustees also considered the higher demands placed on MFS’ investment personnel and trading infrastructure as a result of the daily cash in-flows and out-flows of the Fund, and the impact on MFS and related expenses due to the more extensive regulatory regime to which the Fund is subject, compared to institutional accounts.
In considering the fees, the Trustees noted from the Lipper data (which takes into account any reductions or expense limitations) that the Fund’s effective advisory fee rate and total expense ratio were each approximately at the median of such fees and expenses of funds in the Lipper expense group. In addition, the Trustees accepted MFS’ offer to continue the expense limitation for the Fund. The Trustees further concluded that the existing breakpoint was sufficient to allow the Fund to benefit from economies of scale as its assets grow. The Trustees concluded that the fees were reasonable in light of the nature and quality of services provided.
The Trustees also considered information prepared by MFS relating to its costs and profits with respect to the Fund and other investment companies and accounts advised by MFS, as well as MFS’ methodologies used to determine and allocate its costs to the Fund and other accounts and products for purposes of estimating profitability.
After reviewing these and other factors described below, the Trustees concluded that the advisory fees charged to the Fund represent reasonable compensation in light of the nature and quality of the services being provided by MFS.
In addition, the Trustees considered MFS’ resources and related efforts to continue to retain, attract and motivate capable personnel to serve the Fund. The Trustees also considered the financial resources of MFS and its parent, Sun Life Financial Inc. The Trustees further considered any advantages and possible disadvantages of having an adviser which also serves other investment companies as well as institutional accounts.
The Trustees also considered the nature, quality, cost, and extent of administrative, transfer agency, and distribution services provided to the Fund by MFS and its affiliates under agreements and plans other than the investment advisory agreement, including the 12b-1 fees the Fund pays to MFS Fund Distributors, Inc., an affiliate of MFS. The Trustees also considered the nature, extent and quality of certain other services MFS performs or arranges on the Fund’s behalf, which may include securities lending programs, directed expense payment programs, class action recovery programs, and MFS’ interaction with third-party service providers, principally custodians and sub-custodians. The Trustees concluded that the various non-advisory services provided by MFS and its affiliates on behalf of the Fund were satisfactory. The Trustees also considered the benefits to MFS from the use of the Fund’s portfolio brokerage commissions, if applicable, to pay for investment research and various other factors. Additionally, the Trustees considered so-called “fall-out benefits” to MFS such as reputational value derived from serving as investment manager to the Trust, and determined that any such benefits derived by MFS were reasonable and fair.
Based on their evaluation of factors that they deemed to be material, including those factors described above, the Board of Trustees, including a majority of the independent Trustees, concluded that the investment advisory agreement should be continued for an additional one-year period, commencing September 1, 2011.
A discussion regarding the Board’s most recent review and renewal of the fund’s Investment Advisory Agreement with MFS is available by clicking on the fund’s name under “Variable Insurance Portfolios — VIT II” in the “Products and Performance” section of the MFS Web site (mfs.com).
39
Table of Contents
MFS Strategic Income Portfolio
PROXY VOTING POLICIES AND INFORMATION
A general description of the MFS funds’ proxy voting policies and procedures is available without charge, upon request, by calling 1-800-225-2606, by visiting the Proxy Voting section of mfs.com or by visiting the SEC’s Web site at http://www.sec.gov.
Information regarding how the fund voted proxies relating to portfolio securities during the most recent twelve-month period ended June 30 is available without charge by visiting the Proxy Voting section of mfs.com or by visiting the SEC’s Web site at http://www.sec.gov.
QUARTERLY PORTFOLIO DISCLOSURE
The fund will file a complete schedule of portfolio holdings with the Securities and Exchange Commission (the Commission) for the first and third quarters of each fiscal year on Form N-Q. The fund’s Form N-Q is available on the EDGAR database on the Commission’s Internet Web site at http://www.sec.gov and may be reviewed and copied at the:
Public Reference Room
Securities and Exchange Commission
100 F Street, NE, Room 1580
Washington, D.C. 20549
Information on the operation of the Public Reference Room may be obtained by calling the Commission at 1-800-SEC-0330. Copies of the fund’s Form N-Q also may be obtained, upon payment of a duplicating fee, by electronic request at the following e-mail address: publicinfo@sec.gov or by writing the Public Reference Section at the above address.
From time to time, MFS may post important information about the fund or the MFS funds on the MFS web site (mfs.com). This information is available by visiting the “News & Commentary” section of mfs.com or by clicking on the fund’s name under “Variable Insurance Portfolios — VIT II” in the “Products and Performance” section of mfs.com.
40
Table of Contents
rev. 3/11

| Why? | Financial companies choose how they share your personal information. Federal law gives consumers the right to limit some but not all sharing. Federal law also requires us to tell you how we collect, share, and protect your personal information. Please read this notice carefully to understand what we do. |
| What? | The types of personal information we collect and share depend on the product or service you have with us. This information can include:
• Social Security number and account balances • Account transactions and transaction history • Checking account information and wire transfer instructions
When you are no longer our customer, we continue to share your information as described in this notice. |
| How? | All financial companies need to share customers’ personal information to run their everyday business. In the section below, we list the reasons financial companies can share their customers’ personal information; the reasons MFS chooses to share; and whether you can limit this sharing. |
| Reasons we can share your personal information | Does MFS share? | Can you limit this sharing? | ||
For our everyday business purposes – such as to process your transactions, maintain your account(s), respond to court orders and legal investigations, or report to credit bureaus | Yes | No | ||
For our marketing purposes – to offer our products and services to you | No | We don’t share | ||
| For joint marketing with other financial companies | No | We don’t share | ||
For our affiliates’ everyday business purposes – information about your transactions and experiences | No | We don’t share | ||
For our affiliates’ everyday business purposes – information about your creditworthiness | No | We don’t share | ||
| For nonaffiliates to market to you | No | We don’t share |
| Questions? | Call 800-225-2606 or go to mfs.com. |
41
Table of Contents
| Page 2 |
| Who we are | ||
| Who is providing this notice? | MFS Funds, MFS Investment Management, MFS Institutional Advisors, Inc., MFS Fund Distributors, Inc., MFS Heritage Trust Company, and MFS Service Center, Inc. | |
| What we do | ||
| How does MFS protect my personal information? | To protect your personal information from unauthorized access and use, we use security measures that comply with federal law. These measures include procedural, electronic, and physical safeguards for the protection of the personal information we collect about you. | |
| How does MFS collect my personal information? | We collect your personal information, for example, when you
• open an account or provide account information • direct us to buy securities or direct us to sell your securities • make a wire transfer
We also collect your personal information from others, such as credit bureaus, affiliates and other companies. | |
| Why can’t I limit all sharing? | Federal law gives you the right to limit only
• sharing for affiliates’ everyday business purposes – information about your creditworthiness • affiliates from using your information to market to you • sharing for nonaffiliates to market to you
State laws and individual companies may give you additional rights to limit sharing. | |
| Definitions | ||
| Affiliates | Companies related by common ownership or control. They can be financial and nonfinancial companies.
• MFS does not share personal information with affiliates, except for everyday business purposes as described on page one of this notice. | |
| Nonaffiliates | Companies not related by common ownership or control. They can be financial and nonfinancial companies.
• MFS does not share with nonaffiliates so they can market to you. | |
| Joint Marketing | A formal agreement between nonaffiliated financial companies that together market financial products or services to you.
• MFS doesn’t jointly market. | |
| Other important information | ||
| If you own an MFS product or receive an MFS service in the name of a third party such as a bank or broker-dealer, their privacy policy may apply to you instead of ours. | ||
42
Table of Contents

Table of Contents

MFS® Global Governments Portfolio
MFS® Variable Insurance Trust II

ANNUAL REPORT
December 31, 2011
WGS-ANN
Table of Contents
MFS® GLOBAL GOVERNMENTS PORTFOLIO
The report is prepared for the general information of contract owners.
It is authorized for distribution to prospective investors only when preceded or accompanied by a current prospectus.
NOT FDIC INSURED Ÿ MAY LOSE VALUE Ÿ NO BANK OR CREDIT UNION GUARANTEE Ÿ NOT A DEPOSIT Ÿ NOT INSURED BY ANY FEDERAL GOVERNMENT AGENCY OR NCUA/NCUSIF
Table of Contents
MFS Global Governments Portfolio
LETTER FROM THE CHAIRMAN AND CEO

Dear Contract Owners:
We are indeed living through some volatile times. Economic uncertainty is everywhere, as it seems no place in the world has been unmoved by crisis. We have seen a devastating earthquake and tsunami that have led to disruptions in the Japanese markets
and supply chains. Protests have changed the face of the Middle East and left in their wake lingering tensions and resultant higher oil prices. We have seen debt limits tested in Europe and the United States and policymakers grappling to craft often unpopular monetary and fiscal responses at a time when consumers and businesses struggle with what appears to be a slowing global economy. On top of all of that, we have seen long-term U.S. debt lose its Standard & Poor’s AAA rating and the long-term debt ratings of 15 eurozone nations put on negative watch.
When markets become volatile, managing risk becomes a top priority for investors and their advisors. At MFS® risk management is foremost in our minds in all market climates. Our analysts and portfolio managers keep risks firmly in mind when evaluating securities. Additionally, we have a team of quantitative analysts that measures and assesses the risk profiles of our portfolios and securities on an ongoing basis. The chief investment risk officer, who oversees the team, reports directly to the firm’s president and chief investment officer so the risk associated with each portfolio can be assessed objectively and independently of the portfolio management team.
As always, we continue to be mindful of the many economic challenges faced at the local, national, and international levels. It is in times such as these that we want to remind investors of the merits of maintaining a long-term view, adhering to basic investing principles such as asset allocation and diversification, and working closely with their advisors to research and identify appropriate investment opportunities.
Respectfully,

Robert J. Manning
Chairman and Chief Executive Officer
MFS Investment Management®
February 15, 2012
The opinions expressed in this letter are subject to change, may not be relied upon for investment advice, and no forecasts can be guaranteed.
1
Table of Contents
MFS Global Governments Portfolio
Portfolio structure (i)
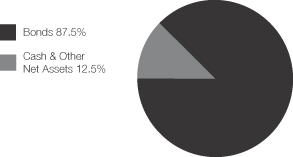
| Fixed income sectors (i) | ||||
| Non-U.S. Government Bonds | 61.4% | |||
| U.S. Treasury Securities | 19.2% | |||
| Mortgage-Backed Securities | 3.4% | |||
| U.S. Government Agencies | 2.4% | |||
| Commercial Mortgage-Backed Securities | 0.6% | |||
| High Grade Corporates | 0.5% | |||
| Composition including fixed income credit quality (a)(i) | ||||
| AAA | 28.3% | |||
| AA | 26.4% | |||
| A | 7.3% | |||
| BBB | 0.5% | |||
| U.S. Government | 19.2% | |||
| Federal Agencies | 5.8% | |||
| Cash & Other | 12.5% | |||
| Portfolio facts (i) | ||||
| Average Duration (d) | 6.9 | |||
| Average Effective Maturity (m) | 9.9 yrs. | |||
| Issuer country weightings (i)(x) | ||||
| United States | 37.7% | |||
| Japan | 23.3% | |||
| Germany | 9.3% | |||
| Italy | 6.8% | |||
| United Kingdom | 5.3% | |||
| Canada | 3.2% | |||
| Netherlands | 3.1% | |||
| France | 2.9% | |||
| Spain | 2.1% | |||
| Other Countries | 6.3% | |||
| Currency exposure (i)(y) | ||||
| United States Dollar | 33.6% | |||
| Japanese Yen | 32.2% | |||
| Euro | 23.7% | |||
| British Pound Sterling | 6.7% | |||
| Canadian Dollar | 1.8% | |||
| Australian Dollar | 1.0% | |||
| Danish Krone | 0.6% | |||
| Swedish Krona | 0.4% | |||
| Norwegian Krone (o) | (0.0)% | |||
| (a) | For all securities other than those specifically described below, ratings are assigned to underlying securities utilizing ratings from Moody’s, Fitch, and Standard & Poor’s rating agencies and applying the following hierarchy: If all three agencies provide a rating, the middle rating (after dropping the highest and lowest ratings) is assigned; if two of the three agencies rate a security, the lower of the two is assigned. Ratings are shown in the S&P and Fitch scale (e.g., AAA). All ratings are subject to change. U.S. Government includes securities issued by the U.S. Department of the Treasury. Federal Agencies includes rated and unrated U.S. Agency fixed-income securities, U.S. Agency mortgage-backed securities, and collateralized mortgage obligations of U.S. Agency mortgage-backed securities. Cash & Other includes cash, other assets less liabilities, offsets to derivative positions, and short-term securities. The fund may not hold all of these instruments. The fund is not rated by these agencies. |
| (d) | Duration is a measure of how much a bond’s price is likely to fluctuate with general changes in interest rates, e.g., if rates rise 1.00%, a bond with a 5-year duration is likely to lose about 5.00% of its value due to the interest rate move. |
| (i) | For purposes of this presentation, the components include the market value of securities, and reflect the impact of the equivalent exposure of derivative positions. These amounts may be negative from time to time. The bond component will include any accrued interest amounts. Equivalent exposure is a calculated amount that translates the derivative position into a reasonable approximation of the amount of the underlying asset that the portfolio would have to hold at a given point in time to have the same price sensitivity that results from the portfolio’s ownership of the derivative contract. When dealing with derivatives, equivalent exposure is a more representative measure of the potential impact of a position on portfolio performance than market value. Where the fund holds convertible bonds, these are treated as part of the equity portion of the portfolio. |
| (m) | In determining an instrument’s effective maturity for purposes of calculating the fund’s dollar-weighted average effective maturity, MFS uses the instrument’s stated maturity or, if applicable, an earlier date on which MFS believes it is probable that a maturity-shortening device (such as a put, pre-refunding or prepayment) will cause the instrument to be repaid. Such an earlier date can be substantially shorter than the instrument’s stated maturity. |
| (o) | Less than 0.1%. |
| (x) | Represents the portfolio’s exposure to issuer countries as a percentage of a portfolio’s total net assets. |
| (y) | Represents the portfolio’s exposure to a particular currency as a percentage of a portfolio’s total net assets. |
Percentages are based on net assets as of 12/31/11.
The portfolio is actively managed and current holdings may be different.
2
Table of Contents
MFS Global Governments Portfolio
Summary of Results
For the twelve months ended December 31, 2011, Initial Class shares of the MFS Global Governments Portfolio (the “fund”) provided a total return of 6.06%, while Service Class shares of the fund provided a total return of 5.75%. These compare with a return of 7.22% for the fund’s benchmark, the JPMorgan Global Government Bond Index (Unhedged).
Market Environment
Early in the period, the U.S. Federal Reserve (the “Fed”) responded to weak economic growth by loosening monetary policy further. More easing by the Fed improved market sentiment and drove risk-asset prices markedly higher. The December 2010 agreement on a surprisingly large (relative to expectations) expansionary U.S. fiscal package also boosted sentiment. During the subsequent several months, the renewed positive market sentiment, coupled with better indications of global macroeconomic activity, pushed many asset valuations to post-crisis highs. At the same time, the yields of the perceived “safest” global sovereign credits rose, indicating a renewed risk-seeking environment.
However, towards the middle of the period, a weakening macroeconomic backdrop and renewed concerns over peripheral euro zone sovereign debt caused a flight-to-quality move that pushed high-quality sovereign bond yields lower. In the U.S., concerns about the long-term sustainability of the trend in U.S. fiscal policy resulted in one agency downgrading U.S. credit quality. Amidst this turmoil, global equity markets declined sharply. As a result of these developments, global consumer and producer sentiment indicators fell precipitously and highly-rated sovereign bond yields hit multi-decade lows. Towards the end of the reporting period, uncertainty in financial markets spiked higher as investors more seriously contemplated the possible failure of the euro zone.
Detractors from Performance
Relative to the JPMorgan Global Government Bond Index (Unhedged), the fund’s exposure to shifts at the long end of the U.S. yield curve (y) (centered around maturities of 10 years or more), held back performance as the yield curve flattened over the reporting period.
The fund’s exposure to the euro also weakened relative results.
Contributors to Performance
The fund’s return from yield, which was greater than that of the benchmark, contributed to relative performance over the reporting period.
A greater exposure to shifts in the middle portion of the U.S. yield curve (centered around maturities of 7 years) also benefited relative returns.
The fund’s out-of-benchmark exposure to Treasury Inflation-Protected Securities (TIPS) and underweight exposure to Italy were additional positive factors for relative performance. Other factors that contributed to relative performance included the fund’s overweight currency exposure in the emerging markets, specifically to China and Singapore, as well as the fund’s overweight positioning in Australian bonds.
Respectfully,
| Matthew Ryan | Erik Weisman | |
| Portfolio Manager | Portfolio Manager |
| (y) | A yield curve graphically depicts the yields of different maturity bonds of the same credit quality and type; a normal yield curve is upward sloping, with short-term rates lower than long-term rates. |
The views expressed in this report are those of the portfolio managers only through the end of the period of the report as stated on the cover and do not necessarily reflect the views of MFS or any other person in the MFS organization. These views are subject to change at any time based on market or other conditions, and MFS disclaims any responsibility to update such views. These views may not be relied upon as investment advice or an indication of trading intent on behalf of any MFS portfolio. References to specific securities are not recommendations of such securities, and may not be representative of any MFS portfolio’s current or future investments.
3
Table of Contents
MFS Global Governments Portfolio
PERFORMANCE SUMMARY THROUGH 12/31/11
The following chart illustrates the historical performance of the fund in comparison to its benchmark(s). Benchmarks are unmanaged and may not be invested in directly. Benchmark returns do not reflect any fees or expenses. The performance of other share classes will be greater than or less than that of the class depicted below. (See Notes to Performance Summary.)
Performance data shown represents past performance and is no guarantee of future results. Investment return and principal value fluctuate so your units, when sold, may be worth more or less than the original cost; current performance may be lower or higher than quoted. The performance shown does not reflect the deduction of taxes, if any, that a contract holder would pay on fund distributions or the redemption of contract units. The returns for the fund shown also do not reflect the deduction of expenses associated with variable products, such as mortality and expense risk charges, separate account charges, and sales charges imposed by the insurance company separate accounts. Such expenses would reduce the overall returns shown.
Growth of a Hypothetical $10,000 Investment
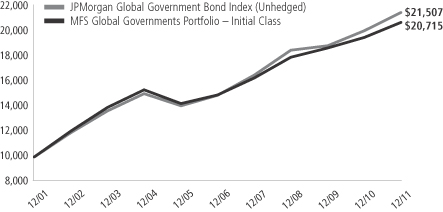
Total Returns through 12/31/11
Average annual total returns
| Share class | Class inception date | 1-yr | 5-yr | 10-yr | ||||||||
| Initial Class | 5/16/88 | 6.06% | 6.74% | 7.55% | ||||||||
| Service Class | 8/24/01 | 5.75% | 6.47% | 7.28% | ||||||||
| Comparative benchmark | ||||||||||||
| JPMorgan Global Government Bond Index (Unhedged) (f) | 7.22% | 7.61% | 7.96% | |||||||||
| (f) | Source: FactSet Research Systems Inc. |
Benchmark Definition
JPMorgan Global Government Bond Index (Unhedged) – measures developed government bond markets around the world.
It is not possible to invest directly in an index.
Notes to Performance Summary
Average annual total return represents the average annual change in value for each share class for the periods presented.
Performance results reflect any applicable expense subsidies and waivers in effect during the periods shown. Without such subsidies and waivers the fund’s performance results would be less favorable. Please see the prospectus and financial statements for complete details. All results are historical and assume the reinvestment of any dividends and capital gains distributions.
Performance results do not include adjustments made for financial reporting purposes in accordance with U.S. generally accepted accounting principles and may differ from amounts reported in the financial highlights.
From time to time the fund may receive proceeds from litigation settlements, without which performance would be lower.
4
Table of Contents
MFS Global Governments Portfolio
Fund Expenses Borne by the Contract Holders During the Period,
July 1, 2011 through December 31, 2011
As a contract holder of the fund, you incur ongoing costs, including management fees; distribution and/or service (12b-1) fees; and other fund expenses. This example is intended to help you understand your ongoing costs (in dollars) of investing in the fund and to compare these costs with the ongoing costs of investing in other mutual funds.
The example is based on an investment of $1,000 invested at the beginning of the period and held for the entire period July 1, 2011 through December 31, 2011.
Actual Expenses
The first line for each share class in the following table provides information about actual account values and actual expenses. You may use the information in this line, together with the amount you invested, to estimate the expenses that you paid over the period. Simply divide your account value by $1,000 (for example, an $8,600 account value divided by $1,000 = 8.6), then multiply the result by the number in the first line under the heading entitled “Expenses Paid During Period” to estimate the expenses you paid on your account during this period.
Hypothetical Example for Comparison Purposes
The second line for each share class in the following table provides information about hypothetical account values and hypothetical expenses based on the fund’s actual expense ratio and an assumed rate of return of 5% per year before expenses, which is not the fund’s actual return. The hypothetical account values and expenses may not be used to estimate the actual ending account balance or expenses you paid for the period. You may use this information to compare the ongoing costs of investing in the fund and other funds. To do so, compare this 5% hypothetical example with the 5% hypothetical examples that appear in the shareholder reports of the other funds.
Please note that the expenses shown in the table are meant to highlight the fund’s ongoing costs only and do not take into account the fees and expenses imposed under the variable contracts through which your investment in the fund is made. Therefore, the second line for each share class in the table is useful in comparing ongoing costs associated with an investment in vehicles (such as the fund) which fund benefits under variable annuity and variable life insurance contracts and to qualified pension and retirement plans only, and will not help you determine the relative total costs of investing in the fund through variable annuity and variable life insurance contracts. If the fees and expenses imposed under the variable contracts were included, your costs would have been higher.
| Share Class | Annualized Expense Ratio | Beginning Account Value 7/01/11 | Ending Account Value | Expenses Paid During Period (p) 7/01/11-12/31/11 | ||||||||||||||
| Initial Class | Actual | 1.00% | $1,000.00 | $1,025.17 | $5.10 | |||||||||||||
| Hypothetical (h) | 1.00% | $1,000.00 | $1,020.16 | $5.09 | ||||||||||||||
| Service Class | Actual | 1.25% | $1,000.00 | $1,023.50 | $6.38 | |||||||||||||
| Hypothetical (h) | 1.25% | $1,000.00 | $1,018.90 | $6.36 | ||||||||||||||
| (h) | 5% class return per year before expenses. |
| (p) | Expenses paid is equal to each class’ annualized expense ratio, as shown above, multiplied by the average account value over the period, multiplied by the number of days in the period, divided by the number of days in the year. |
5
Table of Contents
MFS Global Governments Portfolio
PORTFOLIO OF INVESTMENTS – 12/31/11
The Portfolio of Investments is a complete list of all securities owned by your fund. It is categorized by broad-based asset classes.
| Issuer | Shares/Par | Value ($) | ||||||
| BONDS – 86.5% | ||||||||
| Foreign Bonds – 61.6% | ||||||||
| Australia – 1.9% | ||||||||
| Commonwealth of Australia, 5.75%, 2021 | AUD | 603,000 | $ | 717,291 | ||||
|
| |||||||
| Belgium – 1.0% | ||||||||
| Kingdom of Belgium, 4.25%, 2021 | EUR | 276,000 | $ | 360,775 | ||||
|
| |||||||
| Canada – 3.2% | ||||||||
| Bayview Commercial Asset Trust, FRN, 1.7%, 2023 (z) | CAD | 180,000 | $ | 164,286 | ||||
| Government of Canada, 4.5%, 2015 | CAD | 370,000 | 404,303 | |||||
| Government of Canada, 4.25%, 2018 | CAD | 12,000 | 13,746 | |||||
| Government of Canada, 3.25%, 2021 | CAD | 224,000 | 244,460 | |||||
| Government of Canada, 5.75%, 2033 | CAD | 229,000 | 345,603 | |||||
|
| |||||||
| $ | 1,172,398 | |||||||
|
| |||||||
| Denmark – 0.6% | ||||||||
| Kingdom of Denmark, 3%, 2021 | DKK | 1,095,000 | $ | 213,604 | ||||
|
| |||||||
| France – 2.9% | ||||||||
| Republic of France, 6%, 2025 | EUR | 193,000 | $ | 318,033 | ||||
| Republic of France, 4.75%, 2035 | EUR | 489,000 | 738,138 | |||||
|
| |||||||
| $ | 1,056,171 | |||||||
|
| |||||||
| Germany – 9.1% | ||||||||
| Federal Republic of Germany, 3.75%, 2013 | EUR | 1,244,000 | $ | 1,698,278 | ||||
| Federal Republic of Germany, 3.75%, 2015 | EUR | 366,000 | 521,065 | |||||
| Federal Republic of Germany, 4.25%, 2018 | EUR | 221,000 | 340,012 | |||||
| Federal Republic of Germany, 3.25%, 2021 | EUR | 212,000 | 309,996 | |||||
| Federal Republic of Germany, 6.25%, 2030 | EUR | 249,000 | 495,552 | |||||
|
| |||||||
| $ | 3,364,903 | �� | ||||||
|
| |||||||
| Italy – 6.6% | ||||||||
| Republic of Italy, 4.75%, 2013 | EUR | 414,000 | $ | 532,739 | ||||
| Republic of Italy, 5.25%, 2017 | EUR | 1,249,000 | 1,544,858 | |||||
| Republic of Italy, 3.75%, 2021 | EUR | 343,000 | 364,021 | |||||
|
| |||||||
| $ | 2,441,618 | |||||||
|
| |||||||
| Japan – 23.2% | ||||||||
| Government of Japan, 1.7%, 2017 | JPY | 213,450,000 | $ | 2,961,617 | ||||
| Government of Japan, 1.1%, 2020 | JPY | 75,200,000 | 1,001,934 | |||||
| Government of Japan, 2.1%, 2024 | JPY | 130,550,000 | 1,862,399 | |||||
| Government of Japan, 2.2%, 2027 | JPY | 123,900,000 | 1,758,543 | |||||
| Government of Japan, 2.4%, 2037 | JPY | 66,300,000 | 959,795 | |||||
|
| |||||||
| $ | 8,544,288 | |||||||
|
| |||||||
| Netherlands – 3.0% | ||||||||
| ABN Amro Bank N.V., FRN, 2.198%, 2014 (n) | $ | 200,000 | $ | 195,066 | ||||
| Issuer | Shares/Par | Value ($) | ||||||
| BONDS – continued | ||||||||
| Foreign Bonds – continued | ||||||||
| Netherlands – continued | ||||||||
| Kingdom of the Netherlands, 3.75%, 2014 | EUR | 510,000 | $ | 713,071 | ||||
| Kingdom of the Netherlands, 3.5%, 2020 | EUR | 37,000 | 53,124 | |||||
| Kingdom of the Netherlands, 5.5%, 2028 | EUR | 90,000 | 160,941 | |||||
|
| |||||||
| $ | 1,122,202 | |||||||
|
| |||||||
| Norway – 1.0% | ||||||||
| Eksportfinans A.S.A., 1.875%, 2013 | $ | 205,000 | $ | 193,282 | ||||
| Government of Norway, 3.75%, 2021 | NOK | 990,000 | 183,538 | |||||
|
| |||||||
| $ | 376,820 | |||||||
|
| |||||||
| Spain – 2.1% | ||||||||
| Kingdom of Spain, 4.6%, 2019 | EUR | 586,000 | $ | 755,624 | ||||
|
| |||||||
| Sweden – 1.7% | ||||||||
| Kingdom of Sweden, 5%, 2020 | SEK | 3,380,000 | $ | 632,446 | ||||
|
| |||||||
| United Kingdom – 5.3% | ||||||||
| United Kingdom Treasury, 8%, 2021 | GBP | 133,100 | $ | 316,803 | ||||
| United Kingdom Treasury, 4.25%, 2027 | GBP | 355,000 | 674,683 | |||||
| United Kingdom Treasury, 4.25%, 2036 | GBP | 509,000 | 969,994 | |||||
|
| |||||||
| $ | 1,961,480 | |||||||
|
| |||||||
| Total Foreign Bonds | $ | 22,719,620 | ||||||
|
| |||||||
| U.S. Bonds – 24.9% | ||||||||
| Asset-Backed & Securitized – 0.2% | ||||||||
| Commercial Mortgage Asset Trust, FRN, 0.736%, 2032 (i)(z) | $ | 5,096,865 | $ | 59,220 | ||||
| First Union National Bank Commercial Mortgage Trust, FRN, 1.504%, 2043 (i)(z) | 341,149 | 446 | ||||||
|
| |||||||
| $ | 59,666 | |||||||
|
| |||||||
| Mortgage-Backed – 3.4% | ||||||||
| Fannie Mae, 4.764%, 2012 | $ | 171,545 | $ | 173,036 | ||||
| Fannie Mae, 5.371%, 2013 | 114,855 | 117,752 | ||||||
| Fannie Mae, 4.78%, 2015 | 89,885 | 97,761 | ||||||
| Fannie Mae, 4.856%, 2015 | 43,228 | 46,954 | ||||||
| Fannie Mae, 5.5%, 2015 | 47,947 | 51,643 | ||||||
| Fannie Mae, 5.09%, 2016 | 84,000 | 93,216 | ||||||
| Fannie Mae, 5.424%, 2016 | 88,709 | 99,891 | ||||||
| Fannie Mae, 5.05%, 2017 | 52,633 | 58,469 | ||||||
| Fannie Mae, 5.16%, 2018 | 139,048 | 154,331 | ||||||
| Fannie Mae, 5.1%, 2019 | 62,890 | 71,130 | ||||||
| Fannie Mae, 5.18%, 2019 | 62,924 | 71,448 | ||||||
| Fannie Mae, 6.16%, 2019 | 49,193 | 56,207 | ||||||
| Freddie Mac, 3.882%, 2017 | 89,000 | 97,232 | ||||||
| Freddie Mac, 5.085%, 2019 | 43,000 | 49,361 | ||||||
| Freddie Mac, 5%, 2028 | 17,331 | 17,387 | ||||||
|
| |||||||
| $ | 1,255,818 | |||||||
|
| |||||||
| U.S. Government Agencies and Equivalents – 2.3% | ||||||||
| Aid-Egypt, 4.45%, 2015 | $ | 301,000 | $ | 336,735 | ||||
| Small Business Administration, 4.57%, 2025 | 26,185 | 28,586 | ||||||
6
Table of Contents
MFS Global Governments Portfolio
Portfolio of Investments – continued
| Issuer | Shares/Par | Value ($) | ||||||
| BONDS – continued | ||||||||
| U.S. Bonds – continued | ||||||||
| U.S. Government Agencies and Equivalents – continued | ||||||||
| Small Business Administration, 5.09%, 2025 | $ | 29,770 | $ | 32,936 | ||||
| Small Business Administration, 5.21%, 2026 | 420,987 | 467,066 | ||||||
|
| |||||||
| $ | 865,323 | |||||||
|
| |||||||
| U.S. Treasury Obligations – 19.0% | ||||||||
| U.S. Treasury Bonds, 6.875%, 2025 | $ | 153,000 | $ | 235,620 | ||||
| U.S. Treasury Bonds, 5.25%, 2029 | 377,000 | 520,849 | ||||||
| U.S. Treasury Bonds, 4.5%, 2039 | 1,022,400 | 1,352,283 | ||||||
| U.S. Treasury Notes, 4.125%, 2015 | 1,984,000 | 2,225,645 | ||||||
| U.S. Treasury Notes, 4.75%, 2017 | 1,674,000 | 2,015,600 | ||||||
| U.S. Treasury Notes, 3.5%, 2020 | 577,000 | 663,775 | ||||||
|
| |||||||
| $ | 7,013,772 | |||||||
|
| |||||||
| Total U.S. Bonds | $ | 9,194,579 | ||||||
|
| |||||||
| Total Bonds (Identified Cost, $29,201,332) | $ | 31,914,199 | ||||||
|
| |||||||
| Issuer | Shares/Par | Value ($) | ||||||
| SHORT-TERM OBLIGATIONS (y) – 2.0% | ||||||||
| Barclays U.S. Funding Corp., 0.09%, due 1/03/12, at Amortized Cost and Value | $ | 737,000 | $ | 736,996 | ||||
|
| |||||||
| REPURCHASE AGREEMENTS – 1.3% | ||||||||
| Merrill Lynch, Pierce, Fenner & Smith, Inc., 0.01%, dated 12/30/11, due 1/03/12, total to be received $467,001 (secured by U.S. Treasury and Federal Agency obligations valued at $476,340 in a jointly traded account), at Cost and Value | $ | 467,000 | $ | 467,000 | ||||
|
| |||||||
| MONEY MARKET FUNDS – 2.5% | ||||||||
| MFS Institutional Money Market Portfolio, 0.05%, at Cost and Net Asset Value (v) | 923,205 | $ | 923,205 | |||||
|
| |||||||
| Total Investments (Identified Cost, $31,328,533) | $ | 34,041,400 | ||||||
|
| |||||||
| OTHER ASSETS, LESS LIABILITIES – 7.7% | 2,827,869 | |||||||
|
| |||||||
| Net Assets – 100.0% | $ | 36,869,269 | ||||||
|
| |||||||
| (i) | Interest only security for which the fund receives interest on notional principal (Par amount). Par amount shown is the notional principal and does not reflect the cost of the security. |
| (n) | Securities exempt from registration under Rule 144A of the Securities Act of 1933. These securities may be sold in the ordinary course of business in transactions exempt from registration, normally to qualified institutional buyers. At period end, the aggregate value of these securities was $195,066, representing 0.5% of net assets. |
| (v) | Underlying affiliated fund that is available only to investment companies managed by MFS. The rate quoted for the MFS Institutional Money Market Portfolio is the annualized seven-day yield of the fund at period end. |
| (y) | The rate shown represents an annualized yield at time of purchase. |
| (z) | Restricted securities are not registered under the Securities Act of 1933 and are subject to legal restrictions on resale. These securities generally may be resold in transactions exempt from registration or to the public if the securities are subsequently registered. Disposal of these securities may involve time-consuming negotiations and prompt sale at an acceptable price may be difficult. The fund holds the following restricted securities: |
| Restricted Securities | Acquisition Date | Cost | Value | |||||||
| Bayview Commercial Asset Trust, FRN, 1.7%, 2023 | 5/25/06 | $180,261 | $164,286 | |||||||
| Commercial Mortgage Asset Trust, FRN, 0.736%, 2032 | 8/25/03-12/02/11 | 79,405 | 59,220 | |||||||
| First Union National Bank Commercial Mortgage Trust, FRN, 1.504%, 2043 | 12/11/03-11/30/11 | 427 | 446 | |||||||
| Total Restricted Securities | $223,952 | |||||||||
| % of Net Assets | 0.6% | |||||||||
The following abbreviations are used in this report and are defined:
| FRN | Floating Rate Note. Interest rate resets periodically and may not be the rate reported at period end. |
Abbreviations indicate amounts shown in currencies other than the U.S. dollar. All amounts are stated in U.S. dollars unless otherwise indicated. A list of abbreviations is shown below:
| AUD | Australian Dollar |
| CAD | Canadian Dollar |
| CNY | Chinese Yuan Renminbi |
| DKK | Danish Krone |
| EUR | Euro |
| GBP | British Pound |
| JPY | Japanese Yen |
| NOK | Norwegian Krone |
| SEK | Swedish Krona |
7
Table of Contents
MFS Global Governments Portfolio
Portfolio of Investments – continued
Derivative Contracts at 12/31/11
Forward Foreign Currency Exchange Contracts at 12/31/11
| Type | Currency | Counterparty | Contracts to Deliver/Receive | Settlement Date Range | In Exchange For | Contracts at Value | Net Unrealized Appreciation (Depreciation) | |||||||||||||||||
| Asset Derivatives | ||||||||||||||||||||||||
| BUY | AUD | JPMorgan Chase Bank N.A | 20,344 | 1/12/12 | $ | 20,672 | $ | 20,789 | $ | 117 | ||||||||||||||
| BUY | AUD | Merrill Lynch International Bank | 29,000 | 1/12/12 | 29,026 | 29,634 | 608 | |||||||||||||||||
| BUY | AUD | Royal Bank of Scotland Group PLC | 6,000 | 1/12/12 | 5,983 | 6,131 | 148 | |||||||||||||||||
| SELL | AUD | Barclays Bank PLC | 7,000 | 1/12/12 | 7,196 | 7,153 | 43 | |||||||||||||||||
| SELL | AUD | Westpac Banking Corp. | 246,575 | 1/12/12 | 252,196 | 251,968 | 228 | |||||||||||||||||
| BUY | CAD | Barclays Bank PLC | 27,000 | 1/12/12 | 26,472 | 26,498 | 26 | |||||||||||||||||
| BUY | CAD | JPMorgan Chase Bank N.A | 87,394 | 1/12/12 | 85,613 | 85,768 | 155 | |||||||||||||||||
| BUY | CAD | Merrill Lynch International Bank | 32,769 | 1/12/12 | 31,279 | 32,159 | 880 | |||||||||||||||||
| SELL | CAD | Brown Brothers Harriman | 28,000 | 1/12/12 | 27,569 | 27,479 | 90 | |||||||||||||||||
| BUY | CNY | Barclays Bank PLC | 20,000 | 1/18/12 | 3,119 | 3,177 | 58 | |||||||||||||||||
| SELL | DKK | Brown Brothers Harriman | 122,000 | 1/12/12 | 22,592 | 21,243 | 1,349 | |||||||||||||||||
| SELL | DKK | JPMorgan Chase Bank N.A | 34,000 | 1/12/12 | 6,066 | 5,920 | 146 | |||||||||||||||||
| SELL | EUR | Barclays Bank PLC | 407,811 | 1/12/12 | 545,020 | 527,835 | 17,185 | |||||||||||||||||
| SELL | EUR | Brown Brothers Harriman | 19,000 | 1/12/12 | 25,743 | 24,592 | 1,151 | |||||||||||||||||
| SELL | EUR | Citibank N.A. | 380,000 | 1/12/12 | 500,396 | 491,839 | 8,557 | |||||||||||||||||
| SELL | EUR | Credit Suisse Group | 262,819 | 1/12/12 | 348,744 | 340,170 | 8,574 | |||||||||||||||||
| SELL | EUR | Deutsche Bank AG | 139,000 | 1/12/12 | 183,609 | 179,910 | 3,699 | |||||||||||||||||
| SELL | EUR | Goldman Sachs International | 39,000 | 1/12/12 | 53,298 | 50,478 | 2,820 | |||||||||||||||||
| SELL | EUR | HSBC Bank | 2,277 | 1/12/12 | 3,070 | 2,947 | 123 | |||||||||||||||||
| SELL | EUR | JPMorgan Chase Bank N.A | 296,195 | 1/12/12 | 397,171 | 383,369 | 13,802 | |||||||||||||||||
| SELL | EUR | Merrill Lynch International Bank | 206,710 | 1/12/12 | 278,407 | 267,547 | 10,860 | |||||||||||||||||
| SELL | EUR | Royal Bank of Scotland Group PLC | 13,000 | 1/12/12 | 17,727 | 16,826 | 901 | |||||||||||||||||
| SELL | EUR | UBS AG | 1,442,622 | 1/12/12-3/15/12 | 1,930,250 | 1,868,194 | 62,056 | |||||||||||||||||
| BUY | GBP | Barclays Bank PLC | 149,687 | 1/12/12 | 230,070 | 232,448 | 2,378 | |||||||||||||||||
| BUY | GBP | Deutsche Bank AG | 149,687 | 1/12/12 | 230,100 | 232,448 | 2,348 | |||||||||||||||||
| SELL | GBP | Barclays Bank PLC | 8,000 | 1/12/12 | 12,591 | 12,423 | 168 | |||||||||||||||||
| SELL | GBP | Brown Brothers Harriman | 7,000 | 1/12/12 | 11,140 | 10,870 | 270 | |||||||||||||||||
| SELL | GBP | Citibank N.A. | 11,000 | 1/12/12 | 17,272 | 17,082 | 190 | |||||||||||||||||
| SELL | GBP | JPMorgan Chase Bank N.A | 44,193 | 1/12/12 | 69,055 | 68,626 | 429 | |||||||||||||||||
| SELL | GBP | UBS AG | 10,000 | 1/12/12 | 15,900 | 15,529 | 371 | |||||||||||||||||
| BUY | JPY | Barclays Bank PLC | 5,245,798 | 1/12/12 | 67,397 | 68,161 | 764 | |||||||||||||||||
| BUY | JPY | Brown Brothers Harriman | 2,609,000 | 1/12/12 | 33,571 | 33,900 | 329 | |||||||||||||||||
| BUY | JPY | Citibank N.A. | 2,368,000 | 1/12/12 | 30,504 | 30,768 | 264 | |||||||||||||||||
| BUY | JPY | Credit Suisse Group | 24,352,889 | 1/12/12 | 313,399 | 316,427 | 3,028 | |||||||||||||||||
| BUY | JPY | JPMorgan Chase Bank N.A | 43,220,423 | 1/12/12 | 554,842 | 561,580 | 6,738 | |||||||||||||||||
| BUY | JPY | Merrill Lynch International Bank | 1,436,000 | 1/12/12 | 18,511 | 18,659 | 148 | |||||||||||||||||
| BUY | JPY | UBS AG | 4,675,000 | 1/12/12 | 60,273 | 60,744 | 471 | |||||||||||||||||
| SELL | JPY | Credit Suisse Group | 4,656,000 | 1/12/12 | 60,962 | 60,497 | 465 | |||||||||||||||||
| SELL | JPY | JPMorgan Chase Bank N.A | 1,498,000 | 1/12/12 | 19,479 | 19,464 | 15 | |||||||||||||||||
| SELL | JPY | Merrill Lynch International Bank | 2,685,000 | 1/12/12 | 35,036 | 34,887 | 149 | |||||||||||||||||
| SELL | JPY | Royal Bank of Scotland Group PLC | 184,000 | 1/12/12 | 2,397 | 2,391 | 6 | |||||||||||||||||
| SELL | NOK | Barclays Bank PLC | 245,457 | 1/12/12 | 42,854 | 41,030 | 1,824 | |||||||||||||||||
| SELL | NOK | Credit Suisse Group | 909,710 | 1/12/12 | 154,664 | 152,065 | 2,599 | |||||||||||||||||
8
Table of Contents
MFS Global Governments Portfolio
Portfolio of Investments – continued
Derivative Contracts at 12/31/11 – continued
Forward Foreign Currency Exchange Contracts at 12/31/11 – continued
| Type | Currency | Counterparty | Contracts to Deliver/Receive | Settlement Date Range | In Exchange For | Contracts at Value | Net Unrealized Appreciation (Depreciation) | |||||||||||||||||
| Asset Derivatives – continued | ||||||||||||||||||||||||
| SELL | NOK | JPMorgan Chase Bank N.A | 177,215 | 1/12/12 | $ | 30,566 | $ | 29,623 | $ | 943 | ||||||||||||||
| SELL | SEK | Barclays Bank PLC | 1,624,035 | 1/12/12 | 238,742 | 235,887 | 2,855 | |||||||||||||||||
| SELL | SEK | Citibank N.A. | 109,000 | 1/12/12 | 16,221 | 15,832 | 389 | |||||||||||||||||
| SELL | SEK | Deutsche Bank AG | 753,245 | 1/12/12 | 110,378 | 109,407 | 971 | |||||||||||||||||
| SELL | SEK | JPMorgan Chase Bank N.A | 549,297 | 1/12/12 | 81,220 | 79,784 | 1,436 | |||||||||||||||||
| SELL | SEK | Royal Bank of Scotland Group PLC | 219,771 | 1/12/12 | 32,816 | 31,921 | 895 | |||||||||||||||||
|
| |||||||||||||||||||||||
| $ | 164,019 | |||||||||||||||||||||||
|
| |||||||||||||||||||||||
| Liability Derivatives | ||||||||||||||||||||||||
| BUY | AUD | Citibank N.A. | 17,000 | 1/12/12 | $ | 17,427 | $ | 17,372 | $ | (55 | ) | |||||||||||||
| SELL | AUD | Barclays Bank PLC | 8,000 | 1/12/12 | 7,967 | 8,175 | (208 | ) | ||||||||||||||||
| SELL | AUD | Citibank N.A. | 75,009 | 1/12/12 | 75,264 | 76,649 | (1,385 | ) | ||||||||||||||||
| SELL | AUD | Credit Suisse Group | 9,000 | 1/12/12 | 8,690 | 9,197 | (507 | ) | ||||||||||||||||
| SELL | AUD | JPMorgan Chase Bank N.A | 20,344 | 1/12/12 | 20,672 | 20,789 | (117 | ) | ||||||||||||||||
| SELL | AUD | Westpac Banking Corp. | 63,995 | 1/12/12 | 61,011 | 65,394 | (4,383 | ) | ||||||||||||||||
| BUY | CAD | Barclays Bank PLC | 25,000 | 1/12/12 | 24,672 | 24,535 | (137 | ) | ||||||||||||||||
| SELL | CAD | Barclays Bank PLC | 7,000 | 1/12/12 | 6,679 | 6,870 | (191 | ) | ||||||||||||||||
| SELL | CAD | Citibank N.A. | 22,764 | 1/12/12 | 22,333 | 22,341 | (8 | ) | ||||||||||||||||
| SELL | CAD | Goldman Sachs International | 517,667 | 1/12/12 | 494,603 | 508,036 | (13,433 | ) | ||||||||||||||||
| SELL | CAD | JPMorgan Chase Bank N.A | 96,394 | 1/12/12 | 94,075 | 94,601 | (526 | ) | ||||||||||||||||
| SELL | CAD | UBS AG | 10,000 | 1/12/12 | 9,719 | 9,814 | (95 | ) | ||||||||||||||||
| BUY | CNY | JPMorgan Chase Bank N.A | 2,395,000 | 5/16/12 | 380,763 | 379,813 | (950 | ) | ||||||||||||||||
| SELL | CNY | Barclays Bank PLC | 20,000 | 1/18/12 | 3,135 | 3,177 | (42 | ) | ||||||||||||||||
| SELL | CNY | JPMorgan Chase Bank N.A | 2,395,000 | 5/16/12 | 376,321 | 379,813 | (3,492 | ) | ||||||||||||||||
| BUY | DKK | Deutsche Bank AG | 1,547 | 1/12/12 | 279 | 269 | (10 | ) | ||||||||||||||||
| BUY | DKK | JPMorgan Chase Bank N.A | 65,000 | 1/12/12 | 12,004 | 11,318 | (686 | ) | ||||||||||||||||
| BUY | DKK | Merrill Lynch International Bank | 91,097 | 1/12/12 | 16,415 | 15,862 | (553 | ) | ||||||||||||||||
| BUY | EUR | Barclays Bank PLC | 126,000 | 1/12/12 | 169,317 | 163,083 | (6,234 | ) | ||||||||||||||||
| BUY | EUR | Brown Brothers Harriman | 18,000 | 1/12/12 | 25,478 | 23,298 | (2,180 | ) | ||||||||||||||||
| BUY | EUR | Citibank N.A. | 1,023,221 | 1/12/12 | 1,368,416 | 1,324,368 | (44,048 | ) | ||||||||||||||||
| BUY | EUR | Credit Suisse Group | 302,452 | 1/12/12 | 411,446 | 391,467 | (19,979 | ) | ||||||||||||||||
| BUY | EUR | Deutsche Bank AG | 295,000 | 1/12/12 | 400,969 | 381,822 | (19,147 | ) | ||||||||||||||||
| BUY | EUR | Goldman Sachs International | 423,661 | 1/12/12 | 582,745 | 548,350 | (34,395 | ) | ||||||||||||||||
| BUY | EUR | HSBC Bank | 23,452 | 1/12/12 | 31,622 | 30,354 | (1,268 | ) | ||||||||||||||||
| BUY | EUR | JPMorgan Chase Bank N.A | 296,195 | 1/12/12 | 397,171 | 383,369 | (13,802 | ) | ||||||||||||||||
| BUY | EUR | UBS AG | 469,103 | 1/12/12 | 627,113 | 607,167 | (19,946 | ) | ||||||||||||||||
| SELL | EUR | Citibank N.A. | 28,000 | 1/12/12 | 36,200 | 36,241 | (41 | ) | ||||||||||||||||
| BUY | GBP | Barclays Bank PLC | 84,000 | 1/12/12 | 131,761 | 130,443 | (1,318 | ) | ||||||||||||||||
| BUY | GBP | Citibank N.A. | 12,000 | 1/12/12 | 18,920 | 18,635 | (285 | ) | ||||||||||||||||
| BUY | GBP | Goldman Sachs International | 6,000 | 1/12/12 | 9,504 | 9,317 | (187 | ) | ||||||||||||||||
| BUY | GBP | JPMorgan Chase Bank N.A | 42,193 | 1/12/12 | 65,803 | 65,520 | (283 | ) | ||||||||||||||||
| SELL | GBP | Barclays Bank PLC | 32,437 | 1/12/12 | 49,992 | 50,371 | (379 | ) | ||||||||||||||||
| SELL | GBP | Citibank N.A. | 14,000 | 1/12/12 | 21,584 | 21,741 | (157 | ) | ||||||||||||||||
| BUY | JPY | Barclays Bank PLC | 685,000 | 1/12/12 | 8,915 | 8,900 | (15 | ) | ||||||||||||||||
| BUY | JPY | Brown Brothers Harriman | 3,218,000 | 1/12/12 | 42,296 | 41,813 | (483 | ) | ||||||||||||||||
| BUY | JPY | Citibank N.A. | 1,883,000 | 1/12/12 | 24,617 | 24,467 | (150 | ) | ||||||||||||||||
| BUY | JPY | Credit Suisse Group | 40,230,081 | 1/12/12 | 524,635 | 522,725 | (1,910 | ) | ||||||||||||||||
| BUY | JPY | Deutsche Bank AG | 2,841,000 | 1/12/12 | 37,001 | 36,914 | (87 | ) | ||||||||||||||||
| BUY | JPY | Goldman Sachs International | 108,214,502 | 1/12/12 | 1,411,046 | 1,406,074 | (4,972 | ) | ||||||||||||||||
9
Table of Contents
MFS Global Governments Portfolio
Portfolio of Investments – continued
Derivative Contracts at 12/31/11 – continued
Forward Foreign Currency Exchange Contracts at 12/31/11 – continued
| Type | Currency | Counterparty | Contracts to Deliver/Receive | Settlement Date Range | In Exchange For | Contracts at Value | Net Unrealized Appreciation (Depreciation) | |||||||||||||||||
| Liability Derivatives – continued | ||||||||||||||||||||||||
| BUY | JPY | HSBC Bank | 108,214,502 | 1/12/12 | $ | 1,411,322 | $ | 1,406,074 | $ | (5,248 | ) | |||||||||||||
| BUY | JPY | Morgan Stanley Capital Services, Inc. | 1,861,544 | 1/12/12 | 24,269 | 24,188 | (81 | ) | ||||||||||||||||
| BUY | JPY | UBS AG | 3,599,000 | 1/12/12 | 47,466 | 46,763 | (703 | ) | ||||||||||||||||
| SELL | JPY | Barclays Bank PLC | 26,255,000 | 1/12/12 | 337,067 | 341,142 | (4,075 | ) | ||||||||||||||||
| SELL | JPY | Credit Suisse Group | 4,318,000 | 1/12/12 | 55,542 | 56,105 | (563 | ) | ||||||||||||||||
| SELL | JPY | Deutsche Bank AG | 3,566,000 | 1/12/12 | 46,304 | 46,334 | (30 | ) | ||||||||||||||||
| SELL | JPY | JPMorgan Chase Bank N.A | 43,220,423 | 1/12/12 | 554,842 | 561,580 | (6,738 | ) | ||||||||||||||||
| SELL | JPY | Merrill Lynch International Bank | 1,641,000 | 1/12/12 | �� | 21,091 | 21,322 | (231 | ) | |||||||||||||||
| SELL | JPY | Morgan Stanley Capital Services , Inc. | 8,695,000 | 1/12/12 | 111,872 | 112,978 | (1,106 | ) | ||||||||||||||||
| SELL | JPY | Royal Bank of Scotland Group PLC | 3,969,000 | 1/12/12 | 51,124 | 51,571 | (447 | ) | ||||||||||||||||
| SELL | JPY | UBS AG | 765,000 | 1/12/12 | 9,832 | 9,940 | (108 | ) | ||||||||||||||||
| BUY | NOK | Citibank N.A. | 33,000 | 1/12/12 | 5,811 | 5,516 | (295 | ) | ||||||||||||||||
| BUY | NOK | JPMorgan Chase Bank N.A | 177,215 | 1/12/12 | 30,566 | 29,623 | (943 | ) | ||||||||||||||||
| BUY | SEK | Citibank N.A. | 256,000 | 1/12/12 | 38,050 | 37,183 | (867 | ) | ||||||||||||||||
| BUY | SEK | JPMorgan Chase Bank N.A | 549,297 | 1/12/12 | 81,220 | 79,785 | (1,435 | ) | ||||||||||||||||
| SELL | SEK | Barclays Bank PLC | 104,000 | 1/12/12 | 14,966 | 15,105 | (139 | ) | ||||||||||||||||
| SELL | SEK | Deutsche Bank AG | 732,948 | 1/12/12 | 105,613 | 106,458 | (845 | ) | ||||||||||||||||
| SELL | SEK | UBS AG | 36,000 | 1/12/12 | 5,193 | 5,228 | (35 | ) | ||||||||||||||||
|
| |||||||||||||||||||||||
| $ | (221,933 | ) | ||||||||||||||||||||||
|
| |||||||||||||||||||||||
At December 31, 2011, the fund had sufficient cash and/or securities to cover any commitments under these derivative contracts.
See Notes to Financial Statements
10
Table of Contents
MFS Global Governments Portfolio
FINANCIAL STATEMENTS | STATEMENT OF ASSETS AND LIABILITIES
This statement represents your fund’s balance sheet, which details the assets and liabilities comprising the total value of the fund.
At 12/31/11 | ||||||||
Assets | ||||||||
Investments – | ||||||||
Non-affiliated issuers, at value (identified cost, $30,405,328) | $33,118,195 | |||||||
Underlying affiliated funds, at cost and value | 923,205 | |||||||
Total investments, at value (identified cost, $31,328,533) | $34,041,400 | |||||||
Cash | 2,747,742 | |||||||
Foreign currency, at value (identified cost, $270) | 271 | |||||||
Receivables for | ||||||||
Forward foreign currency exchange contracts | 164,019 | |||||||
Interest | 355,392 | |||||||
Other assets | 1,266 | |||||||
Total assets | $37,310,090 | |||||||
Liabilities | ||||||||
Payables for | ||||||||
Forward foreign currency exchange contracts | $221,933 | |||||||
Fund shares reacquired | 162,960 | |||||||
Payable to affiliates | ||||||||
Investment adviser | 1,140 | |||||||
Distribution and/or service fees | 53 | |||||||
Payable for Trustees’ compensation | 45 | |||||||
Accrued expenses and other liabilities | 54,690 | |||||||
Total liabilities | $440,821 | |||||||
Net assets | $36,869,269 | |||||||
Net assets consist of | ||||||||
Paid-in capital | $33,992,442 | |||||||
Unrealized appreciation (depreciation) on investments and translation of assets and liabilities in foreign currencies | 2,643,787 | |||||||
Accumulated distributions in excess of net realized gain on investments and foreign currency transactions | (586,841 | ) | ||||||
Undistributed net investment income | 819,881 | |||||||
Net assets | $36,869,269 | |||||||
Shares of beneficial interest outstanding | 3,269,383 |
| Net assets | Shares outstanding | Net asset value per share | ||||||||||
Initial Class | $34,252,309 | 3,034,326 | $11.29 | |||||||||
Service Class | 2,616,960 | 235,057 | 11.13 | |||||||||
See Notes to Financial Statements
11
Table of Contents
MFS Global Governments Portfolio
FINANCIAL STATEMENTS | STATEMENT OF OPERATIONS
This statement describes how much your fund earned in investment income and accrued in expenses. It also describes any gains and/or losses generated by fund operations.
Year ended 12/31/11 | ||||||||
Net investment income | ||||||||
Income | ||||||||
Interest | $835,465 | |||||||
Dividends from underlying affiliated funds | 61 | |||||||
Total investment income | $835,526 | |||||||
Expenses | ||||||||
Management fee | $242,008 | |||||||
Distribution and/or service fees | 7,018 | |||||||
Administrative services fee | 17,500 | |||||||
Trustees’ compensation | 3,766 | |||||||
Custodian fee | 19,525 | |||||||
Shareholder communications | 11,387 | |||||||
Auditing fees | 57,133 | |||||||
Legal fees | 5,361 | |||||||
Miscellaneous | 11,890 | |||||||
Total expenses | $375,588 | |||||||
Fees paid indirectly | (2 | ) | ||||||
Reduction of expenses by investment adviser | (45,510 | ) | ||||||
Net expenses | $330,076 | |||||||
Net investment income | $505,450 | |||||||
Realized and unrealized gain (loss) on investments and foreign currency transactions | ||||||||
Realized gain (loss) (identified cost basis) | ||||||||
Investment transactions | $478,928 | |||||||
Foreign currency transactions | 6,937 | |||||||
Net realized gain (loss) on investments and foreign currency transactions | $485,865 | |||||||
Change in unrealized appreciation (depreciation) | ||||||||
Investments | $904,965 | |||||||
Translation of assets and liabilities in foreign currencies | (13,975 | ) | ||||||
Net unrealized gain (loss) on investments and foreign currency translation | $890,990 | |||||||
Net realized and unrealized gain (loss) on investments and foreign currency | $1,376,855 | |||||||
Change in net assets from operations | $1,882,305 |
See Notes to Financial Statements
12
Table of Contents
MFS Global Governments Portfolio
FINANCIAL STATEMENTS | STATEMENTS OF CHANGES IN NET ASSETS
These statements describe the increases and/or decreases in net assets resulting from operations, any distributions, and any shareholder transactions.
For years ended 12/31 | 2011 | 2010 | ||||||
Change in net assets | ||||||||
From operations | ||||||||
Net investment income | $505,450 | $550,040 | ||||||
Net realized gain (loss) on investments and foreign currency transactions | 485,865 | 413,512 | ||||||
Net unrealized gain (loss) on investments and foreign currency translation | 890,990 | 530,555 | ||||||
Change in net assets from operations | $1,882,305 | $1,494,107 | ||||||
Distributions declared to shareholders | ||||||||
From net investment income | $(707,802 | ) | $— | |||||
From net realized gain on investments | (327,622 | ) | (271,570 | ) | ||||
Total distributions declared to shareholders | $(1,035,424 | ) | $(271,570 | ) | ||||
Change in net assets from fund share transactions | $2,882,411 | $(3,689,597 | ) | |||||
Total change in net assets | $3,729,292 | $(2,467,060 | ) | |||||
Net assets | ||||||||
At beginning of period | 33,139,977 | 35,607,037 | ||||||
At end of period (including undistributed net investment income of $819,881 and | $36,869,269 | $33,139,977 |
See Notes to Financial Statements
13
Table of Contents
MFS Global Governments Portfolio
FINANCIAL STATEMENTS | FINANCIAL HIGHLIGHTS
The financial highlights table is intended to help you understand the fund’s financial performance for the past 5 years. Certain information reflects financial results for a single fund share. The total returns in the table represent the rate by which an investor would have earned (or lost) on an investment in the fund share class (assuming reinvestment of all distributions) held for the entire period.
| Initial Class | Years ended 12/31 | |||||||||||||||||||
| 2011 | 2010 | 2009 | 2008 | 2007 | ||||||||||||||||
Net asset value, beginning of period | $11.00 | $10.60 | $11.59 | $11.43 | $10.70 | |||||||||||||||
| Income (loss) from investment operations | ||||||||||||||||||||
Net investment income (d) | $0.18 | $0.18 | $0.22 | $0.26 | $0.36 | |||||||||||||||
Net realized and unrealized gain (loss) on investments | 0.49 | 0.30 | 0.13 | 0.84 | 0.58 | |||||||||||||||
Total from investment operations | $0.67 | $0.48 | $0.35 | $1.10 | $0.94 | |||||||||||||||
| Less distributions declared to shareholders | ||||||||||||||||||||
From net investment income | $(0.26 | ) | $— | $(1.34 | ) | $(0.94 | ) | $(0.21 | ) | |||||||||||
From net realized gain on investments | (0.12 | ) | (0.08 | ) | — | — | — | |||||||||||||
Total distributions declared to shareholders | $(0.38 | ) | $(0.08 | ) | $(1.34 | ) | $(0.94 | ) | $(0.21 | ) | ||||||||||
Net asset value, end of period (x) | $11.29 | $11.00 | $10.60 | $11.59 | $11.43 | |||||||||||||||
Total return (%) (k)(r)(s)(x) | 6.06 | 4.61 | 4.06 | 10.12 | 8.99 | |||||||||||||||
| Ratios (%) (to average net assets) and Supplemental data: | ||||||||||||||||||||
Expenses before expense reductions (f) | 1.14 | 1.15 | 1.16 | 1.09 | 1.08 | |||||||||||||||
Expenses after expense reductions (f) | 1.00 | 1.00 | 1.00 | 1.00 | 1.00 | |||||||||||||||
Net investment income | 1.59 | 1.64 | 2.08 | 2.31 | 3.33 | |||||||||||||||
Portfolio turnover | 70 | 66 | 84 | 113 | 134 | |||||||||||||||
Net assets at end of period (000 omitted) | $34,252 | $30,047 | $32,034 | $36,813 | $36,559 | |||||||||||||||
See Notes to Financial Statements
14
Table of Contents
MFS Global Governments Portfolio
Financial Highlights – continued
| Service Class | Years ended 12/31 | |||||||||||||||||||
| 2011 | 2010 | 2009 | 2008 | 2007 | ||||||||||||||||
Net asset value, beginning of period | $10.85 | $10.48 | $11.47 | $11.32 | $10.60 | |||||||||||||||
| Income (loss) from investment operations | ||||||||||||||||||||
Net investment income (d) | $0.15 | $0.15 | $0.19 | $0.23 | $0.33 | |||||||||||||||
Net realized and unrealized gain (loss) on investments | 0.48 | 0.30 | 0.12 | 0.84 | 0.58 | |||||||||||||||
Total from investment operations | $0.63 | $0.45 | $0.31 | $1.07 | $0.91 | |||||||||||||||
| Less distributions declared to shareholders | ||||||||||||||||||||
From net investment income | $(0.23 | ) | $— | $(1.30 | ) | $(0.92 | ) | $(0.19 | ) | |||||||||||
From net realized gain on investments | (0.12 | ) | (0.08 | ) | — | — | — | |||||||||||||
Total distributions declared to shareholders | $(0.35 | ) | $(0.08 | ) | $(1.30 | ) | $(0.92 | ) | $(0.19 | ) | ||||||||||
Net asset value, end of period (x) | $11.13 | $10.85 | $10.48 | $11.47 | $11.32 | |||||||||||||||
Total return (%) (k)(r)(s)(x) | 5.75 | 4.38 | 3.77 | 9.93 | 8.67 | |||||||||||||||
| Ratios (%) (to average net assets) and Supplemental data: | ||||||||||||||||||||
Expenses before expense reductions (f) | 1.39 | 1.40 | 1.41 | 1.35 | 1.33 | |||||||||||||||
Expenses after expense reductions (f) | 1.25 | 1.25 | 1.25 | 1.25 | 1.25 | |||||||||||||||
Net investment income | 1.34 | 1.39 | 1.78 | 2.03 | 3.08 | |||||||||||||||
Portfolio turnover | 70 | 66 | 84 | 113 | 134 | |||||||||||||||
Net assets at end of period (000 omitted) | $2,617 | $3,093 | $3,573 | $6,371 | $4,063 | |||||||||||||||
| (d) | Per share data is based on average shares outstanding. |
| (f) | Ratios do not reflect reductions from fees paid indirectly, if applicable. |
| (k) | The total return does not reflect expenses that apply to separate accounts. Inclusion of these charges would reduce the total return figures for all periods shown. |
| (r) | Certain expenses have been reduced without which performance would have been lower. |
| (s) | From time to time the fund may receive proceeds from litigation settlements, without which performance would be lower. |
| (x) | The net asset values per share and total returns have been calculated on net assets which include adjustments made in accordance with U.S. generally accepted accounting principles required at period end for financial reporting purposes. |
See Notes to Financial Statements
15
Table of Contents
MFS Global Governments Portfolio
| (1) | Business and Organization |
MFS Global Governments Portfolio (the fund) is a series of MFS Variable Insurance Trust II (the trust). The trust is organized as a Massachusetts business trust and is registered under the Investment Company Act of 1940, as amended, as an open-end management investment company. The shareholders of each series of the trust are separate accounts of insurance companies, which offer variable annuity and/or life insurance products, and qualified retirement and pension plans.
| (2) | Significant Accounting Policies |
General – The preparation of financial statements in conformity with U.S. generally accepted accounting principles requires management to make estimates and assumptions that affect the reported amounts of assets and liabilities, and disclosure of contingent assets and liabilities at the date of the financial statements and the reported amounts of revenues and expenses during the reporting period. Actual results could differ from those estimates. In the preparation of these financial statements, management has evaluated subsequent events occurring after the date of the fund’s Statement of Assets and Liabilities through the date that the financial statements were issued. The fund invests in foreign securities. Investments in foreign securities are vulnerable to the effects of changes in the relative values of the local currency and the U.S. dollar and to the effects of changes in each country’s legal, political, and economic environment.
In December 2011, the Financial Accounting Standards Board issued Accounting Standards Update 2011-11, Balance Sheet (Topic 210) – Disclosures about Offsetting Assets and Liabilities (“ASU 2011-11”). Effective for annual reporting periods beginning on or after January 1, 2013 and interim periods within those annual periods, ASU 2011-11 is intended to enhance disclosure requirements on the offsetting of financial assets and liabilities. Although still evaluating the potential impacts of ASU 2011-11 to the fund, management expects that the impact of the fund’s adoption will be limited to additional financial statement disclosures.
Investment Valuations – Debt instruments and floating rate loans (other than short-term instruments), including restricted debt instruments, are generally valued at an evaluated or composite bid as provided by a third-party pricing service. Short-term instruments with a maturity at issuance of 60 days or less generally are valued at amortized cost, which approximates market value. Forward foreign currency exchange contracts are generally valued at the mean of bid and asked prices for the time period interpolated from rates provided by a third-party pricing service for proximate time periods. Open-end investment companies are generally valued at net asset value per share. Securities and other assets generally valued on the basis of information from a third-party pricing service may also be valued at a broker/dealer bid quotation. Values obtained from third-party pricing services can utilize both transaction data and market information such as yield, quality, coupon rate, maturity, type of issue, trading characteristics, and other market data. The values of foreign securities and other assets and liabilities expressed in foreign currencies are converted to U.S. dollars using the mean of bid and asked prices for rates provided by a third-party pricing service.
The Board of Trustees has delegated primary responsibility for determining or causing to be determined the value of the fund’s investments (including any fair valuation) to the adviser pursuant to valuation policies and procedures approved by the Board. If the adviser determines that reliable market quotations are not readily available, investments are valued at fair value as determined in good faith by the adviser in accordance with such procedures under the oversight of the Board of Trustees. Under the fund’s valuation policies and procedures, market quotations are not considered to be readily available for most types of debt instruments and floating rate loans and many types of derivatives. These investments are generally valued at fair value based on information from third-party pricing services. In addition, investments may be valued at fair value if the adviser determines that an investment’s value has been materially affected by events occurring after the close of the exchange or market on which the investment is principally traded (such as foreign exchange or market) and prior to the determination of the fund’s net asset value, or after the halting of trading of a specific security where trading does not resume prior to the close of the exchange or market on which the security is principally traded. The adviser generally relies on third-party pricing services or other information (such as the correlation with price movements of similar securities in the same or other markets; the type, cost and investment characteristics of the security; the business and financial condition of the issuer; and trading and other market data) to assist in determining whether to fair value and at what value to fair value an investment. The value of an investment for purposes of calculating the fund’s net asset value can differ depending on the source and method used to determine value. When fair valuation is used, the value of an investment used to determine the fund’s net asset value may differ from quoted or published prices for the same investment. There can be no assurance that the fund could obtain the fair value assigned to an investment if it were to sell the investment at the same time at which the fund determines its net asset value per share.
Various inputs are used in determining the value of the fund’s assets or liabilities. These inputs are categorized into three broad levels. In certain cases, the inputs used to measure fair value may fall into different levels of the fair value hierarchy. In such cases, an investment’s level within the fair value hierarchy is based on the lowest level of input that is significant to the fair
16
Table of Contents
MFS Global Governments Portfolio
Notes to Financial Statements – continued
value measurement. The fund’s assessment of the significance of a particular input to the fair value measurement in its entirety requires judgment, and considers factors specific to the investment. Level 1 includes unadjusted quoted prices in active markets for identical assets or liabilities. Level 2 includes other significant observable market-based inputs (including quoted prices for similar securities, interest rates, prepayment speed, and credit risk). Level 3 includes unobservable inputs, which may include the adviser’s own assumptions in determining the fair value of investments. Other financial instruments are derivative instruments not reflected in total investments, such as forward foreign currency exchange contracts. The following is a summary of the levels used as of December 31, 2011 in valuing the fund’s assets or liabilities:
| Investments at Value | Level 1 | Level 2 | Level 3 | Total | ||||||||||||
| U.S. Treasury Bonds & U.S. Government Agency & Equivalents | $— | $7,879,095 | $— | $7,879,095 | ||||||||||||
| Non-U.S. Sovereign Debt | — | 22,360,268 | — | 22,360,268 | ||||||||||||
| Residential Mortgage-Backed Securities | — | 1,255,818 | — | 1,255,818 | ||||||||||||
| Commercial Mortgage-Backed Securities | — | 223,952 | — | 223,952 | ||||||||||||
| Foreign Bonds | — | 195,066 | — | 195,066 | ||||||||||||
| Short Term Securities | — | 1,203,996 | — | 1,203,996 | ||||||||||||
| Mutual Funds | 923,205 | — | — | 923,205 | ||||||||||||
| Total Investments | $923,205 | $33,118,195 | $— | $34,041,400 | ||||||||||||
| Other Financial Instruments | ||||||||||||||||
| Forward Foreign Currency Exchange Contracts | $— | $(57,914 | ) | $— | $(57,914 | ) | ||||||||||
For further information regarding security characteristics, see the Portfolio of Investments.
Repurchase Agreements – The fund entered into repurchase agreements with approved counterparties. Each repurchase agreement is recorded at cost. The fund requires that the securities collateral in a repurchase transaction be transferred to a custodian. The fund monitors, on a daily basis, the value of the collateral to ensure that its value, including accrued interest, is greater than amounts owed to the fund under each such repurchase agreement. The fund and other funds managed by MFS may utilize a joint trading account for the purpose of entering into one or more repurchase agreements.
Inflation-Adjusted Debt Securities – The fund invests in inflation-adjusted debt securities issued by the U.S. Treasury. The fund may also invest in inflation-adjusted debt securities issued by U.S. Government agencies and instrumentalities other than the U.S. Treasury and by other entities such as U.S. and foreign corporations and foreign governments. The principal value of these debt securities is adjusted through income according to changes in the Consumer Price Index or another general price or wage index. These debt securities typically pay a fixed rate of interest, but this fixed rate is applied to the inflation-adjusted principal amount. The principal paid at maturity of the debt security is typically equal to the inflation-adjusted principal amount, or the security’s original par value, whichever is greater. Other types of inflation-adjusted securities may use other methods to adjust for other measures of inflation.
Foreign Currency Translation – Purchases and sales of foreign investments, income, and expenses are converted into U.S. dollars based upon currency exchange rates prevailing on the respective dates of such transactions or on the reporting date for foreign denominated receivables and payables. Gains and losses attributable to foreign currency exchange rates on sales of securities are recorded for financial statement purposes as net realized gains and losses on investments. Gains and losses attributable to foreign exchange rate movements on receivables, payables, income and expenses are recorded for financial statement purposes as foreign currency transaction gains and losses. That portion of both realized and unrealized gains and losses on investments that results from fluctuations in foreign currency exchange rates is not separately disclosed.
Derivatives – The fund uses derivatives for different purposes, primarily to increase or decrease exposure to a particular market or segment of the market, or security, to increase or decrease interest rate or currency exposure, or as alternatives to direct investments. Derivatives are used for hedging or non-hedging purposes. While hedging can reduce or eliminate losses, it can also reduce or eliminate gains. When the fund uses derivatives as an investment to increase market exposure, or for hedging purposes, gains and losses from derivative instruments may be substantially greater than the derivative’s original cost.
The derivative instruments used by the fund were forward foreign currency exchange contracts. The fund’s period end derivatives, as presented in the Portfolio of Investments and the associated Derivative Contract Tables generally are indicative of the volume of its derivative activity during the period.
The following table presents, by major type of derivative contract, the fair value, on a gross basis, of the asset and liability components of derivatives held by the fund at December 31, 2011 as reported in the Statement of Assets and Liabilities:
| Fair Value | ||||||||||
| Risk | Derivative Contracts | Asset Derivatives | Liability Derivatives | |||||||
| Foreign Exchange | Forward Foreign Currency Exchange | $164,019 | $(221,933 | ) | ||||||
17
Table of Contents
MFS Global Governments Portfolio
Notes to Financial Statements – continued
The following table presents, by major type of derivative contract, the realized gain (loss) on derivatives held by the fund for the year ended December 31, 2011 as reported in the Statement of Operations:
| Risk | Foreign Currency Transactions | |||
| Foreign Exchange | $(3,235 | ) | ||
The following table presents, by major type of derivative contract, the change in unrealized appreciation (depreciation) on derivatives held by the fund for the year ended December 31, 2011 as reported in the Statement of Operations:
| Risk | Translation of Assets and Liabilities in Foreign Currencies | |||
| Foreign Exchange | $(1,442 | ) | ||
Derivative counterparty credit risk is managed through formal evaluation of the creditworthiness of all potential counterparties. On certain over-the-counter derivatives, the fund attempts to reduce its exposure to counterparty credit risk whenever possible by entering into an International Swaps and Derivatives Association (ISDA) Master Agreement on a bilateral basis with each of the counterparties with whom it undertakes a significant volume of transactions. The ISDA Master Agreement gives each party to the agreement the right to terminate all transactions traded under such agreement if there is a certain deterioration in the credit quality of the other party. The ISDA Master Agreement gives the fund the right, upon an event of default by the applicable counterparty or a termination of the agreement, to close out all transactions traded under such agreement and to net amounts owed under each transaction to one net amount payable by one party to the other. This right to close out and net payments across all transactions traded under the ISDA Master Agreement could result in a reduction of the fund’s credit risk to such counterparty equal to any amounts payable by the fund under the applicable transactions, if any. However, absent an event of default by the counterparty or a termination of the agreement, the ISDA Master Agreement does not result in an offset of reported amounts of assets and liabilities in the Statement of Assets and Liabilities across transactions between the fund and the applicable counterparty.
Collateral requirements differ by type of derivative. Collateral or margin requirements are set by the broker or exchange clearing house for exchange traded derivatives (i.e., futures and exchange-traded options) while collateral terms are contract specific for over-the-counter traded derivatives (i.e., forward foreign currency exchange contracts, swaps and over-the-counter options). For derivatives traded under an ISDA Master Agreement, the collateral requirements are netted across all transactions traded under such agreement and one amount is posted from one party to the other to collateralize such obligations. Cash collateral that has been pledged to cover obligations of the fund under derivative contracts, if any, will be reported separately on the Statement of Assets and Liabilities as restricted cash. Securities collateral pledged for the same purpose, if any, is noted in the Portfolio of Investments.
Forward Foreign Currency Exchange Contracts – The fund entered into forward foreign currency exchange contracts for the purchase or sale of a specific foreign currency at a fixed price on a future date. These contracts may be used to hedge the fund’s currency risk or for non-hedging purposes. For hedging purposes, the fund may enter into contracts to deliver or receive foreign currency that the fund will receive from or use in its normal investment activities. The fund may also use contracts to hedge against declines in the value of foreign currency denominated securities due to unfavorable exchange rate movements. For non-hedging purposes, the fund may enter into contracts with the intent of changing the relative exposure of the fund’s portfolio of securities to different currencies to take advantage of anticipated exchange rate changes.
Forward foreign currency exchange contracts are adjusted by the daily exchange rate of the underlying currency and any unrealized gains or losses are recorded as a receivable or payable for forward foreign currency exchange contracts until the contract settlement date. On contract settlement date, any gain or loss on the contract is recorded as realized gains or losses on foreign currency transactions.
Risks may arise upon entering into these contracts from unanticipated movements in the value of the contract and from the potential inability of counterparties to meet the terms of their contracts. Generally, the fund’s maximum risk due to counterparty credit risk is the unrealized gain on the contract due to the use of Continuous Linked Settlement, an industry accepted settlement system. This risk is mitigated in cases where there is an ISDA Master Agreement between the fund and the counterparty providing for netting as described above and for posting of collateral by the counterparty to the fund to cover the fund’s exposure to the counterparty under such ISDA Master Agreement.
18
Table of Contents
MFS Global Governments Portfolio
Notes to Financial Statements – continued
Indemnifications – Under the fund’s organizational documents, its officers and Trustees may be indemnified against certain liabilities and expenses arising out of the performance of their duties to the fund. Additionally, in the normal course of business, the fund enters into agreements with service providers that may contain indemnification clauses. The fund’s maximum exposure under these agreements is unknown as this would involve future claims that may be made against the fund that have not yet occurred.
Investment Transactions and Income – Investment transactions are recorded on the trade date. Interest income is recorded on the accrual basis. All premium and discount is amortized or accreted for financial statement purposes in accordance with U.S. generally accepted accounting principles. Inflation-indexed bonds are fixed-income securities whose principal value is periodically adjusted upward or downward to the rate of inflation. Interest is accrued based on the principal value, which is adjusted for inflation. Any increase or decrease in the principal amount of an inflation-indexed bond is generally recorded as an increase or decrease in interest income, respectively, even though the adjusted principal is not received until maturity.
The fund may receive proceeds from litigation settlements. Any proceeds received from litigation involving portfolio holdings are reflected in the Statement of Operations in realized gain/loss if the security has been disposed of by the fund or in unrealized gain/loss if the security is still held by the fund. Any other proceeds from litigation not related to portfolio holdings are reflected as other income in the Statement of Operations.
Fees Paid Indirectly – The fund’s custody fee may be reduced according to an arrangement that measures the value of cash deposited with the custodian by the fund. This amount, for the year ended December 31, 2011, is shown as a reduction of total expenses on the Statement of Operations.
Tax Matters and Distributions – The fund intends to qualify as a regulated investment company, as defined under Subchapter M of the Internal Revenue Code, and to distribute all of its taxable income, including realized capital gains. As a result, no provision for federal income tax is required. The fund’s federal tax returns for the prior three fiscal years remain subject to examination by the Internal Revenue Service.
Distributions to shareholders are recorded on the ex-dividend date. Income and capital gain distributions are determined in accordance with income tax regulations, which may differ from U.S. generally accepted accounting principles. Certain capital accounts in the financial statements are periodically adjusted for permanent differences in order to reflect their tax character. These adjustments have no impact on net assets or net asset value per share. Temporary differences which arise from recognizing certain items of income, expense, gain or loss in different periods for financial statement and tax purposes will reverse at some time in the future. Distributions in excess of net investment income or net realized gains are temporary overdistributions for financial statement purposes resulting from differences in the recognition or classification of income or distributions for financial statement and tax purposes.
Book/tax differences primarily relate to amortization and accretion of debt securities, wash sale loss deferrals, straddle loss deferrals, and derivative transactions.
The tax character of distributions declared to shareholders for the last two fiscal years is as follows:
| 12/31/11 | 12/31/10 | |||||||
| Ordinary income (including any short-term capital gains) | $863,984 | $52,511 | ||||||
| Long-term capital gains | 171,440 | 219,059 | ||||||
| Total distributions | $1,035,424 | $271,570 | ||||||
The federal tax cost and the tax basis components of distributable earnings were as follows:
| As of 12/31/11 | ||||
| Cost of investments | $31,793,860 | |||
| Gross appreciation | 2,818,366 | |||
| Gross depreciation | (570,826 | ) | ||
| Net unrealized appreciation (depreciation) | $2,247,540 | |||
| Undistributed ordinary income | 996,242 | |||
| Capital loss carryforwards | (128,619 | ) | ||
| Other temporary differences | (238,336 | ) |
Under the Regulated Investment Company Modernization Act of 2010 (the “Act”), net capital losses recognized after December 31, 2010 may be carried forward indefinitely, and their character is retained as short-term and/or long-term losses. Previously, net capital losses were carried forward for eight years and treated as short-term losses. As a transition rule, the Act requires that post-enactment net capital losses be used before pre-enactment net capital losses.
19
Table of Contents
MFS Global Governments Portfolio
Notes to Financial Statements – continued
As of December 31, 2011, the fund had capital loss carryforwards available to offset future realized gains. Such losses are characterized as follows:
| Post-enactment losses: | ||||
| Short-Term | $(30,621 | ) | ||
| Long-Term | (97,998 | ) | ||
| Total | $(128,619 | ) |
Multiple Classes of Shares of Beneficial Interest – The fund offers multiple classes of shares, which differ in their respective distribution and/or service fees. The fund’s income, realized and unrealized gain (loss), and common expenses are allocated to shareholders based on the daily net assets of each class. Dividends are declared separately for each class. Differences in per share dividend rates are generally due to differences in separate class expenses. The fund’s distributions declared to shareholders as reported on the Statements of Changes in Net Assets are presented by class as follows:
| From net investment income | From net realized gain on investments | |||||||||||||||
| Year ended 12/31/11 | Year ended 12/31/10 | Year ended 12/31/11 | Year ended 12/31/10 | |||||||||||||
| Initial Class | $652,562 | $— | $298,684 | $246,429 | ||||||||||||
| Service Class | 55,240 | — | 28,938 | 25,141 | ||||||||||||
| Total | $707,802 | $— | $327,622 | $271,570 | ||||||||||||
| (3) | Transactions with Affiliates |
Investment Adviser – The fund has an investment advisory agreement with MFS to provide overall investment management and related administrative services and facilities to the fund. The management fee is computed daily and paid monthly at the following annual rates:
| First $300 million of average daily net assets | 0.75% | |||
| Average daily net assets in excess of $300 million | 0.675% |
The management fee incurred for the year ended December 31, 2011 was equivalent to an annual effective rate of 0.75% of the fund’s average daily net assets.
The investment adviser has agreed in writing to pay a portion of the fund’s total annual operating expenses, exclusive of interest, taxes, extraordinary expenses, and brokerage commissions, such that total annual fund operating expenses do not exceed 1.25% of the fund’s average daily net assets. MFS’ agreement to limit the fund’s total annual operating expenses is contained in the investment advisory agreement between MFS and the fund. This agreement terminated on December 31, 2011 in connection with shareholder approval on December 1, 2011 of a new investment advisory agreement between the trust, on behalf of the fund, and MFS effective January 1, 2012. In addition, the investment adviser has voluntarily agreed to pay a portion of the fund’s total annual operating expenses, exclusive of interest, taxes, extraordinary expenses, and brokerage commissions, such that total annual operating expenses do not exceed 1.00% of the fund’s average daily net assets attributable to Initial Class shares. This voluntary agreement terminated December 31, 2011. For the year ended December 31, 2011 these reductions amounted to $45,510 and are reflected as a reduction of total expenses in the Statements of Operations.
Effective January 1, 2012, the investment adviser has agreed in writing to pay a portion of the fund’s total annual operating expenses, exclusive of interest, taxes, extraordinary expenses, brokerage and transaction costs and investment-related expenses, such that total annual operating expenses do not exceed 1.00% of average daily net assets for the Initial Class shares and 1.25% of average daily net assets for the Service Class shares. This written agreement will continue until modified by the fund’s Board of Trustees, but such agreement will continue at least until April 30, 2015.
Distributor – MFS Fund Distributors, Inc. (MFD), a wholly-owned subsidiary of MFS, is the distributor of shares of the fund. The Trustees have adopted a distribution plan for the Service Class shares pursuant to Rule 12b-1 under the Investment Company Act of 1940.
The fund’s distribution plan provides that the fund will pay MFD distribution and/or service fees equal to 0.25% per annum of its average daily net assets attributable to Service Class shares as partial consideration for services performed and expenses incurred by MFD and financial intermediaries (including participating insurance companies that invest in the fund to fund variable annuity and variable life insurance contracts, sponsors of qualified retirement and pension plans that invest in the fund, and affiliates of these participating insurance companies and plan sponsors) in connection with the sale and distribution of the Service Class shares. MFD may subsequently pay all, or a portion, of the distribution and/or service fees to financial intermediaries.
Shareholder Servicing Agent – MFS Service Center, Inc. (MFSC), a wholly-owned subsidiary of MFS, has contracted to provide transfer agent and recordkeeping functions in connection with the issuance, transfer, and redemption of each class of shares of
20
Table of Contents
MFS Global Governments Portfolio
Notes to Financial Statements – continued
the fund under a Shareholder Servicing Agent Agreement. During the year ended December 31, 2011, the fund did not pay MFSC a fee for this service.
Administrator – MFS provides certain financial, legal, shareholder communications, compliance, and other administrative services to the fund. Under an administrative services agreement, the fund partially reimburses MFS the costs incurred to provide these services. The fund is charged an annual fixed amount of $17,500 plus a fee based on average daily net assets. The administrative services fee incurred for the year ended December 31, 2011 was equivalent to an annual effective rate of 0.0542% of the fund’s average daily net assets.
Trustees’ and Officers’ Compensation – The fund pays compensation to Trustees in the form of a retainer, attendance fees, and additional compensation to the Board chairperson. The fund does not pay compensation directly to officers of the fund who are also officers of the investment adviser, all of whom receive remuneration for their services to the fund from MFS. Certain officers of the fund are officers or directors of MFS, MFD, and MFSC.
Other – This fund and certain other funds managed by MFS (the funds) have entered into services agreements (the Agreements) which provide for payment of fees by the funds to Tarantino LLC and Griffin Compliance LLC in return for the provision of services of an Independent Chief Compliance Officer (ICCO) and Assistant ICCO, respectively, for the funds. The ICCO and Assistant ICCO are officers of the funds and the sole members of Tarantino LLC and Griffin Compliance LLC, respectively. The funds can terminate the Agreements with Tarantino LLC and Griffin Compliance LLC at any time under the terms of the Agreements. MFS has agreed to bear all expenses associated with office space, other administrative support, and supplies provided to the ICCO and Assistant ICCO. For the year ended December 31, 2011, the aggregate fees paid by the fund to Tarantino LLC and Griffin Compliance LLC were $525 and are included in miscellaneous expense on the Statement of Operations.
| (4) | Portfolio Securities |
Purchases and sales of investments, other than purchased option transactions and short-term obligations, were as follows:
| Purchases | Sales | |||||||
| U.S. Government securities | $10,925,548 | $14,441,269 | ||||||
| Investments (non-U.S. Government securities) | $9,766,538 | $11,642,506 | ||||||
Purchases exclude the value of securities acquired in connection with the Global Governments Variable Account merger. (See Note 8.)
| (5) | Shares of Beneficial Interest |
The fund’s Declaration of Trust permits the Trustees to issue an unlimited number of full and fractional shares of beneficial interest. Transactions in fund shares were as follows:
| Year ended 12/31/11 | Year ended 12/31/10 | |||||||||||||||
| Shares | Amount | Shares | Amount | |||||||||||||
| Shares sold | ||||||||||||||||
Initial Class | 202,675 | $2,304,762 | 168,578 | $1,826,044 | ||||||||||||
Service Class | 19,493 | 215,069 | 62,979 | 669,806 | ||||||||||||
| 222,168 | $2,519,831 | 231,557 | $2,495,850 | |||||||||||||
| Shares issued in connection with acquisition of Global Governments Variable Account | ||||||||||||||||
Initial Class | 528,467 | $5,924,201 | ||||||||||||||
| Shares issued to shareholders in reinvestment of distributions | ||||||||||||||||
Initial Class | 82,933 | $951,246 | 23,627 | $246,429 | ||||||||||||
Service Class | 7,436 | 84,178 | 2,441 | 25,141 | ||||||||||||
| 90,369 | $1,035,424 | 26,068 | $271,570 | |||||||||||||
| Shares reacquired | ||||||||||||||||
Initial Class | (511,532 | ) | $(5,748,742 | ) | (483,326 | ) | $(5,176,405 | ) | ||||||||
Service Class | (76,992 | ) | (848,303 | ) | (121,224 | ) | (1,280,612 | ) | ||||||||
| (588,524 | ) | $(6,597,045 | ) | (604,550 | ) | $(6,457,017 | ) | |||||||||
| Net change | ||||||||||||||||
Initial Class | 302,543 | $3,431,467 | (291,121 | ) | $(3,103,932 | ) | ||||||||||
Service Class | (50,063 | ) | (549,056 | ) | (55,804 | ) | (585,665 | ) | ||||||||
| 252,480 | $2,882,411 | (346,925 | ) | $(3,689,597 | ) | |||||||||||
21
Table of Contents
MFS Global Governments Portfolio
Notes to Financial Statements – continued
| (6) | Line of Credit |
The fund and certain other funds managed by MFS participate in a $1.1 billion unsecured committed line of credit, subject to a $1 billion sublimit, provided by a syndication of banks under a credit agreement. Borrowings may be made for temporary financing needs. Interest is charged to each fund, based on its borrowings, generally at a rate equal to the higher of the Federal Reserve funds rate or one month LIBOR plus an agreed upon spread. A commitment fee, based on the average daily, unused portion of the committed line of credit, is allocated among the participating funds at the end of each calendar quarter. In addition, the fund and other funds managed by MFS have established unsecured uncommitted borrowing arrangements with certain banks for temporary financing needs. Interest is charged to each fund, based on its borrowings, at a rate equal to the Federal Reserve funds rate plus an agreed upon spread. For the year ended December 31, 2011, the fund’s commitment fee and interest expense were $248 and $0, respectively, and are included in miscellaneous expense on the Statement of Operations.
| (7) | Transactions in Underlying Affiliated Funds – Affiliated Issuers |
An affiliated issuer may be considered one in which the fund owns 5% or more of the outstanding voting securities, or a company which is under common control. For the purposes of this report, the fund assumes the following to be affiliated issuers:
| Underlying Affiliated Funds | Beginning Shares/Par Amount | Acquisitions Shares/Par Amount | Dispositions Shares/Par Amount | Ending Shares/Par Amount | ||||||||||
| MFS Institutional Money Market Portfolio | — | 923,205 | — | 923,205 | ||||||||||
| Underlying Affiliated Funds | Realized Gain (Loss) | Capital Gain Distributions | Dividend Income | Ending Value | ||||||||||
| MFS Institutional Money Market Portfolio | $— | $— | $61 | $923,205 | ||||||||||
| (8) | Acquisitions |
At the close of business on December 2, 2011, the fund with net assets of $31,193,981 acquired all of the investment-related assets and liabilities of Global Governments Variable Account. The acquisition was part of a transaction in which the Global Governments Variable Account was converted into a unit investment trust (“UIT”) that invests in the fund (the acquisition of the Account’s assets and liabilities and subsequent conversion into a UIT hereinafter referred to as the “Reorganization”). The Reorganization provided the contract owners of the Global Governments Variable Account with the opportunity to participate in a larger combined portfolio with an identical investment objective and similar investment policies and strategies. The acquisition was accomplished by a tax-free exchange of 528,467 shares of the fund (valued at $5,924,201) for all of the investment-related assets and liabilities of Global Governments Variable Account. Global Governments Variable Account’s net assets on that date were $5,924,201 including investments valued at $5,952,050 with a cost basis of $5,657,871. For financial reporting purposes, assets received and shares issued by the fund were recorded at fair value; however, the cost basis of the investments received from Global Governments Variable Account were carried forward to align ongoing reporting of the fund’s realized and unrealized gains and losses with amounts distributable to shareholders for tax purposes. Because the combined investment portfolios have been managed as a single integrated portfolio since the acquisition was completed, it is not practicable to separate the amounts of revenue and earnings of Global Governments Variable Account that have been included in MFS Global Governments Portfolio’s Statement of Operations since December 2, 2011.
Assuming the acquisition had been completed on January 1, 2011, the fund’s pro forma results of operations for the year ended December 31, 2011 are as follows:
| Net investment income | $617,563 | |||
| Net realized and unrealized gain (loss) on investments and foreign currency transactions | 1,499,344 | |||
| Change in net assets from operations | $2,116,907 |
22
Table of Contents
MFS Global Governments Portfolio
REPORT OF INDEPENDENT REGISTERED PUBLIC ACCOUNTING FIRM
To the Board of Trustees of MFS Variable Insurance Trust II and the Shareholders of
MFS Global Governments Portfolio:
We have audited the accompanying statement of assets and liabilities, including the portfolio of investments, of MFS Global Governments Portfolio (the “Fund”) (one of the portfolios comprising MFS Variable Insurance Trust II) as of December 31, 2011, and the related statement of operations for the year then ended, the statements of changes in net assets for each of the two years in the period then ended, and the financial highlights for each of the five years in the period then ended. These financial statements and financial highlights are the responsibility of the Fund’s management. Our responsibility is to express an opinion on these financial statements and financial highlights based on our audits.
We conducted our audits in accordance with the standards of the Public Company Accounting Oversight Board (United States). Those standards require that we plan and perform the audit to obtain reasonable assurance about whether the financial statements and financial highlights are free of material misstatement. The Fund is not required to have, nor were we engaged to perform, an audit of its internal control over financial reporting. Our audits included consideration of internal control over financial reporting as a basis for designing audit procedures that are appropriate in the circumstances, but not for the purpose of expressing an opinion on the effectiveness of the Fund’s internal control over financial reporting. Accordingly, we express no such opinion. An audit also includes examining, on a test basis, evidence supporting the amounts and disclosures in the financial statements, assessing the accounting principles used and significant estimates made by management, as well as evaluating the overall financial statement presentation. Our procedures included confirmation of securities owned as of December 31, 2011, by correspondence with the custodian and brokers; where replies were not received from brokers, we performed other auditing procedures. We believe that our audits provide a reasonable basis for our opinion.
In our opinion, the financial statements and financial highlights referred to above present fairly, in all material respects, the financial position of MFS Global Governments Portfolio as of December 31, 2011, the results of its operations for the year then ended, the changes in its net assets for each of the two years in the period then ended, and the financial highlights for each of the five years in the period then ended, in conformity with accounting principles generally accepted in the United States of America.
DELOITTE & TOUCHE LLP
Boston, Massachusetts
February 15, 2012
23
Table of Contents
MFS Global Governments Portfolio
RESULTS OF SHAREHOLDER MEETING (unaudited)
At a special meeting of shareholders of MFS Global Governments Portfolio, which was held on December 1, 2011, the following actions were taken for which shareholders of all series of MFS Variable Insurance Trust II voted together as a single class with respect to Item 1 and shareholders of MFS Global Governments Portfolio voted as a separate class with respect to Items 2 and 3:
Item 1: Election of ten Trustees as members of the Board of Trustees of the Trust effective January 1, 2012:
| Number of Shares | ||||||||
| For | Withheld Authority | |||||||
| Robert E. Butler | 681,916,712.8686 | 46,472,894.9218 | ||||||
| Maureen R. Goldfarb | 682,835,794.8512 | 45,553,812.9392 | ||||||
| David H. Gunning | 681,500,267.3085 | 46,889,340.4819 | ||||||
| William R. Gutow | 681,050,223.5547 | 47,339,384.2357 | ||||||
| Michael Hegarty | 682,477,088.8584 | 45,912,518.9320 | ||||||
| John P. Kavanaugh | 683,794,425.4269 | 44,595,182.3635 | ||||||
| Robert J. Manning | 682,699,559.7374 | 45,690,048.0530 | ||||||
| J. Dale Sherratt | 681,362,743.0513 | 47,026,864.7391 | ||||||
| Laurie J. Thomsen | 683,408,094.0000 | 44,981,513.7904 | ||||||
| Robert W. Uek | 681,424,852.0247 | 46,964,755.7657 | ||||||
Item 2: To approve a new investment advisory agreement dated January 1, 2012, between the Trust, on behalf of MFS Global Governments Portfolio, and MFS:
| Number of Shares | ||||||||||||
| For | Against | Withheld Authority | ||||||||||
| 2,169,402.3408 | 170,894.5861 | 453,299.9546 | ||||||||||
Item 3: To approve revisions to and restatements of certain fundamental investment restrictions of MFS Global Governments Portfolio effective January 1, 2012 as detailed below:
| Number of Shares | ||||||||||||||
| For | Against | Withheld Authority | ||||||||||||
| A. | Borrowing | 2,238,558.1069 | 264,433.9720 | 290,604.8026 | ||||||||||
| B. | Underwriting Securities | 2,266,208.7097 | 225,884.2774 | 301,503.8944 | ||||||||||
| C. | Issuance of Senior Securities | 2,247,223.0375 | 207,273.9396 | 339,099.9044 | ||||||||||
| D. | Lending of Money or Securities | 2,262,661.6251 | 221,722.5540 | 309,212.7024 | ||||||||||
| E. | Purchases or Sales of Real Estate; Interests in Oil, Gas or Mineral Leases; and Commodities | 2,291,822.6406 | 196,545.8638 | 305,228.3771 | ||||||||||
| F. | Industry Concentration | 2,314,152.5094 | 164,946.5566 | 314,497.8155 | ||||||||||
24
Table of Contents
MFS Global Governments Portfolio
TRUSTEES AND OFFICERS – IDENTIFICATION AND BACKGROUND
The Trustees and officers of the Trust, as of February 1, 2012, are listed below, together with their principal occupations during the past five years. (Their titles may have varied during that period.) The address of each Trustee and officer is 500 Boylston Street, Boston, Massachusetts 02116.
Name, Age | Position(s) with Fund | Trustee/Officer Since (h) | Principal Occupations | Other Directorships (j) | ||||
| INTERESTED TRUSTEES | ||||||||
Robert J. Manning (k) (age 48) | Trustee | February 2004 | Massachusetts Financial Services Company, Chairman, Chief Executive Officer and Director; President (until December 2009); Chief Investment Officer (until July 2010) | N/A | ||||
| INDEPENDENT TRUSTEES | ||||||||
David H. Gunning (age 69) | Trustee and Chair of Trustees | January 2004 | Retired; Cleveland-Cliffs Inc. (mining products and service provider), Vice Chairman/Director (until May 2007) | Lincoln Electric Holdings, Inc. (welding equipment manufacturer), Director; Development Alternatives, Inc. (consulting), Director/Non-Executive Chairman; Portman Limited (mining), Director (until 2008) | ||||
Robert E. Butler (age 70) | Trustee | January 2006 | Consultant – investment company industry regulatory and compliance matters | N/A | ||||
Maureen R. Goldfarb (age 56) | Trustee | January 2009 | Private investor | N/A | ||||
William R. Gutow (age 70) | Trustee | December 1993 | Private investor and real estate consultant; Capitol Entertainment Management Company (video franchise), Vice Chairman | Atlantic Coast Tan (tanning salons), Vice Chairman (until 2007); Texas Donuts (donut franchise), Vice Chairman (until 2010) | ||||
Michael Hegarty (age 67) | Trustee | December 2004 | Private investor | N/A | ||||
John P. Kavanaugh (age 57) | Trustee | January 2009 | Private investor; The Hanover Insurance Group, Inc., Vice President and Chief Investment Officer (until 2006); Allmerica Investment Trust, Allmerica Securities Trust and Opus Investment Trust (investment companies), Chairman, President and Trustee (until 2006) | N/A | ||||
J. Dale Sherratt (age 73) | Trustee | June 1989 | Insight Resources, Inc. (acquisition planning specialists), President; Wellfleet Investments (investor in health care companies), Managing General Partner | N/A | ||||
Laurie J. Thomsen (age 54) | Trustee | March 2005 | Private investor; New Profit, Inc. (venture philanthropy), Executive Partner (until 2010) | The Travelers Companies (property and casualty insurance), Director | ||||
Robert W. Uek (age 70) | Trustee | January 2006 | Consultant to investment company industry | N/A | ||||
| OFFICERS | ||||||||
John M. Corcoran (k) (age 46) | President | October 2008 | Massachusetts Financial Services Company, Senior Vice President (since October 2008); State Street Bank and Trust (financial services provider), Senior Vice President, (until September 2008) | N/A | ||||
| Christopher R. Bohane (k) (age 38) | Assistant Secretary and Assistant Clerk | July 2005 | Massachusetts Financial Services Company, Vice President and Senior Counsel | N/A | ||||
Kino Clark (k) (age 43) | Assistant Treasurer | January 2012 | Massachusetts Financial Services Company, Assistant Vice President | N/A | ||||
25
Table of Contents
MFS Global Governments Portfolio
Trustees and Officers – continued
Name, Age | Position(s) with Fund | Trustee/Officer Since (h) | Principal Occupations | Other Directorships (j) | ||||
Ethan D. Corey (k) (age 48) | Assistant Secretary and Assistant Clerk | July 2005 | Massachusetts Financial Services Company, Senior Vice President and Associate General Counsel | N/A | ||||
David L. DiLorenzo (k) (age 43) | Treasurer | July 2005 | Massachusetts Financial Services Company, Vice President | N/A | ||||
Robyn L. Griffin (age 36) | Assistant Independent Chief Compliance Officer | August 2008 | Griffin Compliance LLC (provider of compliance services), Principal (since August 2008); State Street Corporation (financial services provider), Mutual Fund Administration Assistant Vice President (October 2006 – July 2008); Liberty Mutual Group (insurance), Personal Market Assistant Controller (April 2006 – October 2006); Deloitte & Touche LLP (professional services firm). | N/A | ||||
Brian E. Langenfeld (k) (age 38) | Assistant Secretary and Assistant Clerk | June 2006 | Massachusetts Financial Services Company, Vice President and Senior Counsel | N/A | ||||
Ellen Moynihan (k) (age 54) | Assistant Treasurer | April 1997 | Massachusetts Financial Services Company, Senior Vice President | N/A | ||||
Susan S. Newton (k) (age 61) | Assistant Secretary and Assistant Clerk | May 2005 | Massachusetts Financial Services Company, Senior Vice President and Associate General Counsel | N/A | ||||
Susan A. Pereira (k) (age 41) | Assistant Secretary and Assistant Clerk | July 2005 | Massachusetts Financial Services Company, Vice President and Senior Counsel | N/A | ||||
Mark N. Polebaum (k) (age 59) | Secretary and Clerk | January 2006 | Massachusetts Financial Services Company, Executive Vice President, General Counsel and Secretary | N/A | ||||
Frank L. Tarantino (age 67) | Independent Chief Compliance Officer | June 2004 | Tarantino LLC (provider of compliance services), Principal | N/A | ||||
Richard S. Weitzel (k) (age 41) | Assistant Secretary and Assistant Clerk | October 2007 | Massachusetts Financial Services Company, Vice President and Assistant General Counsel | N/A | ||||
James O. Yost (k) (age 51) | Deputy Treasurer | September 1990 | Massachusetts Financial Services Company, Senior Vice President | N/A | ||||
| (h) | Date first appointed to serve as Trustee/officer of an MFS fund. Each Trustee has served continuously since appointment unless indicated otherwise. For the period from December 15, 2004 until February 22, 2005, Mr. Manning served as Advisory Trustee. For the period October 2008, until January 2012, Mr. Corcoran served as Treasurer of the Funds. Prior to January 2012, Messrs. DiLorenzo and Yost served as Assistant Treasurers of the Funds. |
| (j) | Directorships or trusteeships of companies required to report to the Securities and Exchange Commission (i.e., “public companies”). |
| (k) | “Interested person” of the Trust within the meaning of the Investment Company Act of 1940 (referred to as the 1940 Act), which is the principal federal law governing investment companies like the fund, as a result of position with MFS. The address of MFS is 500 Boylston Street, Boston, Massachusetts 02116. |
Each Trustee has been elected by shareholders and each Trustee and officer holds office until his or her successor is chosen and qualified or until his or her earlier death, resignation, retirement or removal. The Trust does not hold annual meetings for the purpose of electing Trustees, and Trustees are not elected for fixed terms. Messrs. Butler, Kavanaugh, Uek and Ms. Thomsen are members of the Trust’s Audit Committee.
Each of the Fund’s Trustees and officers holds comparable positions with certain other funds of which MFS or a subsidiary is the investment adviser or distributor, and, in the case of the officers, with certain affiliates of MFS. As of January 1, 2012, the Trustees served as board members of 131 funds within the MFS Family of Funds.
26
Table of Contents
MFS Global Governments Portfolio
Trustees and Officers – continued
The Statement of Additional Information for the Fund includes further information about the Trustees and is available without charge upon request by calling 1-800-225-2606.
Investment Adviser Massachusetts Financial Services Company 500 Boylston Street, Boston, MA 02116-3741 | Custodian State Street Bank and Trust 1 Lincoln Street, Boston, MA 02111-2900 | |
Distributor MFS Fund Distributors, Inc. 500 Boylston Street, Boston, MA 02116-3741 | Independent Registered Public Accounting Firm Deloitte & Touche LLP 200 Berkeley Street, Boston, MA 02116 | |
Portfolio Managers Matthew Ryan Erik Weisman |
27
Table of Contents
MFS Global Governments Portfolio
At a special meeting of shareholders of the MFS Global Governments Portfolio (hereinafter referred to as the “Fund” or the “Portfolio”), which was held on December 1, 2011, the shareholders approved a new investment advisory agreement based on the recommendation of the Board of Trustees. At its July, 2011 meeting, the Board of Trustees (i) approved, and recommended for shareholder approval, the new investment advisory agreement effective January 1, 2012, and (ii) the continuation of the existing investment advisory agreement effective September 1, 2011. The following includes a description of the factors that the Board of Trustees considered and the conclusions that formed the basis of their approval of both the new investment advisory agreement and the continuation of the prior investment advisory agreement.
BOARD APPROVAL OF NEW INVESTMENT ADVISORY AGREEMENT
The Investment Company Act of 1940 requires that both the full Board of Trustees and a majority of the non-interested (“independent”) Trustees, voting separately, initially approve the new investment advisory agreement (the “New Agreement”) between Massachusetts Financial Services Company (“MFS”) and MFS Variable Insurance Trust II (the “Trust”) on behalf of the Portfolio and, beginning on the second anniversary of the initial effective date of the New Agreement, annually approve the continuation of the New Agreement. The Trustees have considered matters bearing on the Portfolio and the then current advisory arrangement at their meetings throughout the year, including a review of performance data at each regular meeting. In addition, the independent Trustees met in person in July 2011 to consider the initial approval of the New Agreement, and to recommend that shareholders approve the New Agreement. The independent Trustees were assisted in their evaluation of the New Agreement by independent legal counsel, from whom they received separate legal advice and with whom they met separately from MFS management. The independent Trustees were also assisted in this process by the Portfolio’s Independent Chief Compliance Officer, a full-time senior officer appointed by and reporting to the independent Trustees.
In connection with their deliberations regarding the initial approval of the New Agreement, the Trustees, including the independent Trustees, considered such information and factors as they believed, in light of the legal advice furnished to them and their own business judgment, to be relevant. The New Agreement was considered separately for the series of the Trust (collectively, the “Portfolios”), although the Trustees also took into account the common interests of all Portfolios in the Trust in their review. As described below, the Trustees considered the nature, quality, and extent of the various investment advisory, administrative, and/or shareholder services to be performed by MFS under the New Agreement and other arrangements with the Trust.
In connection with their initial review meeting, the Trustees received and relied upon materials that included, among other items: (i) information provided by MFS on the advisory fees of comparable portfolios of its other clients, including institutional separate account and other clients, (ii) information as to whether, and to what extent applicable, expense waivers, reimbursements or fee “breakpoints” would be observed for the Portfolio under the New Agreement, and (iii) a comparison and summary of the differences in the provisions in the New Agreement compared to those in each of the then current investment advisory agreements for the Portfolios. In addition, in connection with the independent Trustees’ meetings in May and July, 2011 (the “contract review meetings”) for the purpose of considering whether to approve the continuation of the then current investment advisory agreements for the Portfolio, the independent Trustees received: (1) information provided by Lipper Inc. (“Lipper”) on the investment performance of the Portfolio for various time periods ended December 31, 2010, compared to the investment performance of a group of funds with substantially similar investment classifications/objectives (the “Lipper performance universe”), (2) information provided by Lipper on the Portfolio’s advisory fees and other expenses compared to the advisory fees and other expenses of comparable funds identified by Lipper (the “Lipper expense group”), (3) information regarding MFS’ financial results and financial condition, including MFS’ and certain of its affiliates’ estimated profitability from services performed for the Portfolio, (4) MFS’ views regarding the outlook for the mutual fund industry and its strategic business plans, (5) descriptions of various functions performed by MFS for the Trust, such as compliance monitoring and portfolio trading practices, and (6) information regarding the overall organization of MFS, including information about MFS’ senior management and other personnel providing investment advisory, administrative and other services to the Portfolio. The comparative performance, fee and expense information prepared and provided by Lipper was not independently verified, and the independent Trustees did not independently verify any information provided to them by MFS.
The Trustees’ conclusion as to the initial approval of the New Agreement was based on comprehensive consideration of all information provided to the Trustees and was not the result of any single factor. Some of the factors that figured particularly in the Trustees’ deliberations are described below for the Portfolio, while individual Trustees may have given different weight to various factors and evaluated the information presented as a whole differently than another individual Trustee. The Trustees recognized that the fee arrangements for the Portfolio could reflect years of review and discussion between the independent Trustees and MFS, that certain aspects of such arrangements may receive greater scrutiny in some years than others, and that
28
Table of Contents
MFS Global Governments Portfolio
Board Approval of New Investment Advisory Agreement – continued
the Trustees’ conclusions may be based, in part, on their consideration of these same arrangements during the course of the year and in prior years.
Because the portfolio management team managing the Portfolio’s investments under the then current investment advisory agreement will remain the same under the New Agreement for the Portfolio, the Trustees compared the Portfolio’s total return investment performance to the performance of its Lipper performance universe over various time periods, based on information provided by Lipper. The Trustees placed particular emphasis on the total return performance of the Portfolio’s Initial Class shares in comparison to the performance of funds in its Lipper performance universe over the one-, three- and five-year periods ended December 31, 2010. The Trustees did not rely on performance results for more recent periods.
The Trustees noted the performance of the Portfolio’s Initial Class shares was in the 5th quintile relative to the other funds in the Lipper performance universe for the one-year period (the 1st quintile being the best performers and the 5th quintile being the worst performers). The total return performance of the Portfolio was in the 4th quintile for the three-year and the five-year periods ended December 31, 2010, relative to the Lipper performance universe. Based on the nature and quality of services provided by MFS and MFS’ explanation of steps taken to improve performance, the Board of Trustees concluded that the Portfolio’s performance was adequate.
In the course of their deliberations, the Trustees took into account information provided by MFS during contract review meetings, as well as during investment review meetings conducted with portfolio management personnel during the course of the year. For Portfolios whose performance lagged their peer groups, they discussed the factors that contributed thereto and MFS’ efforts to improve such Portfolios’ performance. After reviewing this information, the Trustees concluded, within the context of their overall conclusions regarding the New Agreement, that they were satisfied with MFS’ responses and efforts relating to investment performance.
In assessing the reasonableness of the Portfolio’s advisory fee, the Trustees considered, among other information, the Portfolio’s advisory fee and the total expense ratio of the Portfolio’s Initial Class shares as a percentage of average daily net assets, compared to the advisory fee and total expense ratios of its peer group of funds based on information provided by Lipper. The Trustees also considered the advisory fees charged by MFS to institutional accounts. In comparing these fees, the Trustees considered the generally broader scope of services provided by MFS to the Trust than those provided to institutional accounts. The Trustees also considered the higher demands placed on MFS’ investment personnel and trading infrastructure as a result of the daily cash in-flows and out-flows of the Portfolio, and the impact on MFS and related expenses due to the more extensive regulatory regime to which the Portfolio is subject, compared to institutional accounts.
In considering the fees, the Trustees noted from the Lipper data that the Portfolio’s effective advisory fee rate and total expense ratio were each approximately at the median of such fees and expenses of funds in the Lipper expense group. In addition, the Trustees accepted MFS’ offer to continue the expense limitation for the Portfolio. The Trustees further concluded that the existing breakpoint was sufficient to allow the Portfolio to benefit from economies of scale as its assets grow. The Trustees concluded that the fees were reasonable in light of the nature and quality of services provided.
The Trustees also considered whether the Portfolio is likely to benefit from any economies of scale due to future asset growth. In this regard, the Trustees reviewed the adequacy of breakpoints and discussed with MFS any adjustments necessary for the shareholders’ benefit.
The Trustees also considered information prepared by MFS relating to its costs and profits with respect to the Portfolio and other investment companies and accounts advised by MFS, as well as MFS’ methodologies used to determine and allocate its costs to the Portfolio and other accounts and products for purposes of estimating profitability.
The Trustees noted that there would be no increase to the net advisory fee arrangement for the Portfolio under the New Agreement when compared to the Portfolio’s then current investment advisory agreement. After reviewing these and other factors described below, the Trustees concluded that the advisory fees charged to the Portfolio under the New Agreement represent reasonable compensation in light of the nature and quality of the services being provided by MFS.
In addition, the Trustees considered MFS’ resources and related efforts to continue to retain, attract and motivate capable personnel to serve the Portfolio. The Trustees also considered the financial resources of MFS and its parent, Sun Life Financial Inc. The Trustees further considered any advantages and possible disadvantages of having an adviser which also serves other investment companies as well as institutional accounts.
29
Table of Contents
MFS Global Governments Portfolio
Board Approval of New Investment Advisory Agreement – continued
The Trustees also considered the nature, quality, cost, and extent of administrative, transfer agency, and distribution services provided to the Trust by MFS and its affiliates under agreements and plans other than the New Agreement, including the 12b-1 fees the Portfolio pays to MFS Fund Distributors, Inc., an affiliate of MFS. The Trustees also considered the nature, extent and quality of certain other services MFS performs or arranges on the Portfolio’s behalf, which may include securities lending programs, directed expense payment programs, class action recovery programs, and MFS’ interaction with third-party service providers, principally custodians and sub-custodians. The Trustees concluded that the various non-advisory services provided by MFS and its affiliates on behalf of the Portfolio were satisfactory. The Trustees also considered the benefits to MFS from the use of the Portfolio’s portfolio brokerage commissions to pay for investment research and various other factors. Additionally, the Trustees considered so-called “fall-out benefits” to MFS such as reputational value derived from serving as investment manager to the Trust, and determined that any such benefits derived by MFS were reasonable and fair.
Based on their evaluation of factors that they deemed to be material, including those factors described above, the Board of Trustees, including a majority of the independent Trustees, concluded that the New Agreement should be approved for an initial two-year period, commencing upon its effective date, as set forth in the New Agreement.
BOARD APPROVAL OF CONTINUATION OF PRIOR INVESTMENT ADVISORY AGREEMENT
The Investment Company Act of 1940 requires that both the full Board of Trustees and a majority of the non-interested (“independent”) Trustees, voting separately, annually approve the continuation of the investment advisory agreement between MFS Variable Insurance Trust II (the “Trust”) and Massachusetts Financial Services Company (“MFS”) on behalf of the Fund. The Trustees consider matters bearing on the Fund and the advisory arrangements at their meetings throughout the year, including a review of performance data at each regular meeting. In addition, the independent Trustees met in person in May and again in July 2011 (“contract review meetings”) for the specific purpose of considering whether to approve the continuation of the investment advisory agreement for the Fund. The independent Trustees were assisted in their evaluation of the investment advisory agreement by independent legal counsel, from whom they received separate legal advice and with whom they met separately from MFS management during various contract review meetings. The independent Trustees were also assisted in this process by the Fund’s Independent Chief Compliance Officer, a full-time senior officer appointed by and reporting to the independent Trustees.
In connection with their deliberations, the Trustees, including the independent Trustees, considered such information and factors as they believed, in light of the legal advice furnished to them and their own business judgment, to be relevant. The investment advisory agreement was considered separately for the Fund, although the Trustees also took into account the common interests of all Funds in the Trust in their review. As described below, the Trustees considered the nature, quality, and extent of the various investment advisory, administrative, and shareholder services performed by MFS under the existing investment advisory agreement and other arrangements with the Trust.
In connection with their contract review meetings, the Trustees received and relied upon materials which included, among other items: (i) information provided by Lipper Inc. (“Lipper”) on the investment performance of the Fund for various time periods ended December 31, 2010, compared to the investment performance of a group of funds with substantially similar investment classifications/objectives (the “Lipper performance universe”), (ii) information provided by Lipper on the Fund’s advisory fees and other expenses compared to the advisory fees and other expenses of comparable funds identified by Lipper (the “Lipper expense group”), (iii) information provided by MFS on the advisory fees of comparable portfolios of its other clients, including institutional separate account and other clients, (iv) information as to whether, and to what extent applicable, expense waivers, reimbursements or fee “breakpoints” are observed for the Fund, (v) information regarding MFS’ financial results and financial condition, including MFS’ and certain of its affiliates’ estimated profitability from services performed for the Fund and other investment companies that the Board oversees as a whole, and for MFS’ institutional business, (vi) MFS’ views regarding the outlook for the mutual fund industry and its strategic business plans, (vii) descriptions of various functions performed by MFS for the Trust, such as compliance monitoring and portfolio trading practices, and (viii) information regarding the overall organization of MFS, including information about MFS’ senior management and other personnel providing investment advisory, administrative and other services to the Fund. The comparative performance, fee and expense information prepared and provided by Lipper was not independently verified, and the independent Trustees did not independently verify any information provided to them by MFS.
The Trustees’ conclusion as to the continuation of the investment advisory agreement was based on comprehensive consideration of all information provided to the Trustees and was not the result of any single factor. Some of the factors that figured particularly in the Trustees’ deliberations are described below for the Fund, while individual Trustees may have given different weight to various factors and evaluated the information presented as a whole differently than another individual
30
Table of Contents
MFS Global Governments Portfolio
Board Approval of Continuation of Prior Investment Advisory Agreement – continued
Trustee. The Trustees recognized that the fee arrangements for the Fund reflect years of review and discussion between the independent Trustees and MFS, that certain aspects of such arrangements may receive greater scrutiny in some years than others, and that the Trustees’ conclusions may be based, in part, on their consideration of these same arrangements during the course of the year and in prior years.
Based on information provided by Lipper, the Trustees compared the Fund’s total return investment performance to the performance of the Lipper performance universe over various time periods. The Trustees placed particular emphasis on the total return performance of the Fund’s Initial Class shares in comparison to the performance of funds in its Lipper performance universe over the one-, three- and five-year periods ended December 31, 2010. The Trustees did not rely on performance results for more recent periods, including those shown elsewhere in this report.
The Trustees noted the performance of the Fund’s Initial Class shares was in the 5th quintile relative to the other funds in the Lipper performance universe for the one-year period (the 1st quintile being the best performers and the 5th quintile being the worst performers). The total return performance of the Fund was in the 4th quintile for the three-year and the five-year periods ended December 31, 2010, relative to the Lipper performance universe. Based on the nature and quality of services provided by MFS and MFS’ explanation of steps taken to improve performance, the Board of Trustees concluded that the Fund’s performance was adequate.
In the course of their deliberations, the Trustees took into account information provided by MFS during contract review meetings, as well as during investment review meetings conducted with portfolio management personnel during the course of the year.
In assessing the reasonableness of the Fund’s advisory fee, the Trustees considered, among other information, the Fund’s advisory fee and the total expense ratio of the Fund’s Initial Class shares as a percentage of average daily net assets, compared to the advisory fee and total expense ratios of its peer group of funds based on information provided by Lipper. The Trustees also considered the advisory fees charged by MFS to institutional accounts. In comparing these fees, the Trustees considered the generally broader scope of services provided by MFS to the Trust than those provided to institutional accounts. The Trustees also considered the higher demands placed on MFS’ investment personnel and trading infrastructure as a result of the daily cash in-flows and out-flows of the Fund, and the impact on MFS and related expenses due to the more extensive regulatory regime to which the Fund is subject, compared to institutional accounts.
In considering the fees, the Trustees noted from the Lipper data (which takes into account any reductions or expense limitations) that the Fund’s effective advisory fee rate and total expense ratio were each approximately at the median of such fees and expenses of funds in the Lipper expense group. The Trustees further concluded that the existing breakpoint was sufficient to allow the Fund to benefit from economies of scale as its assets grow. The Trustees concluded that the fees were reasonable in light of the nature and quality of services provided.
The Trustees also considered information prepared by MFS relating to its costs and profits with respect to the Fund and other investment companies and accounts advised by MFS, as well as MFS’ methodologies used to determine and allocate its costs to the Fund and other accounts and products for purposes of estimating profitability.
After reviewing these and other factors described below, the Trustees concluded that the advisory fees charged to the Fund represent reasonable compensation in light of the nature and quality of the services being provided by MFS.
In addition, the Trustees considered MFS’ resources and related efforts to continue to retain, attract and motivate capable personnel to serve the Fund. The Trustees also considered the financial resources of MFS and its parent, Sun Life Financial Inc. The Trustees further considered any advantages and possible disadvantages of having an adviser which also serves other investment companies as well as institutional accounts.
The Trustees also considered the nature, quality, cost, and extent of administrative, transfer agency, and distribution services provided to the Fund by MFS and its affiliates under agreements and plans other than the investment advisory agreement, including the 12b-1 fees the Fund pays to MFS Fund Distributors, Inc., an affiliate of MFS. The Trustees also considered the nature, extent and quality of certain other services MFS performs or arranges on the Fund’s behalf, which may include securities lending programs, directed expense payment programs, class action recovery programs, and MFS’ interaction with third-party service providers, principally custodians and sub-custodians. The Trustees concluded that the various non-advisory services provided by MFS and its affiliates on behalf of the Fund were satisfactory. The Trustees also considered the benefits to MFS from the use of the Fund’s portfolio brokerage commissions, if applicable, to pay for investment research and various other factors. Additionally, the Trustees considered so-called “fall-out benefits” to MFS such as reputational value derived from serving as investment manager to the Trust, and determined that any such benefits derived by MFS were reasonable and fair.
31
Table of Contents
MFS Global Governments Portfolio
Board Approval of Continuation of Prior Investment Advisory Agreement – continued
Based on their evaluation of factors that they deemed to be material, including those factors described above, the Board of Trustees, including a majority of the independent Trustees, concluded that the investment advisory agreement should be continued for an additional one-year period, commencing September 1, 2011.
A discussion regarding the Board’s most recent review and renewal of the fund’s Investment Advisory Agreement with MFS is available by clicking on the fund’s name under “Variable Insurance Portfolios — VIT II” in the “Products and Performance” section of the MFS Web site (mfs.com).
32
Table of Contents
MFS Global Governments Portfolio
PROXY VOTING POLICIES AND INFORMATION
A general description of the MFS funds’ proxy voting policies and procedures is available without charge, upon request, by calling
1-800-225-2606, by visiting the Proxy Voting section of mfs.com or by visiting the SEC’s Web site at http://www.sec.gov.
Information regarding how the fund voted proxies relating to portfolio securities during the most recent twelve-month period ended June 30 is available without charge by visiting the Proxy Voting section of mfs.com or by visiting the SEC’s Web site at http://www.sec.gov.
QUARTERLY PORTFOLIO DISCLOSURE
The fund will file a complete schedule of portfolio holdings with the Securities and Exchange Commission (the Commission) for the first and third quarters of each fiscal year on Form N-Q. The fund’s Form N-Q is available on the EDGAR database on the Commission’s Internet Web site at http://www.sec.gov and may be reviewed and copied at the:
Public Reference Room
Securities and Exchange Commission
100 F Street, NE, Room 1580
Washington, D.C. 20549
Information on the operation of the Public Reference Room may be obtained by calling the Commission at 1-800-SEC-0330. Copies of the fund’s Form N-Q also may be obtained, upon payment of a duplicating fee, by electronic request at the following e-mail address: publicinfo@sec.gov or by writing the Public Reference Section at the above address.
From time to time, MFS may post important information about the fund or the MFS funds on the MFS web site (mfs.com). This information is available by visiting the “News & Commentary” section of mfs.com or by clicking on the fund’s name under “Variable Insurance Portfolios — VIT II” in the “Products and Performance” section of mfs.com.
FEDERAL TAX INFORMATION (unaudited)
The following information is provided pursuant to provisions of the Internal Revenue Code.
The fund designates $189,000 as capital gain dividends paid during the fiscal year.
33
Table of Contents
rev. 3/11

| Why? | Financial companies choose how they share your personal information. Federal law gives consumers the right to limit some but not all sharing. Federal law also requires us to tell you how we collect, share, and protect your personal information. Please read this notice carefully to understand what we do. |
| What? | The types of personal information we collect and share depend on the product or service you have with us. This information can include:
• Social Security number and account balances • Account transactions and transaction history • Checking account information and wire transfer instructions
When you are no longer our customer, we continue to share your information as described in this notice. |
| How? | All financial companies need to share customers’ personal information to run their everyday business. In the section below, we list the reasons financial companies can share their customers’ personal information; the reasons MFS chooses to share; and whether you can limit this sharing. |
| Reasons we can share your personal information | Does MFS share? | Can you limit this sharing? | ||
For our everyday business purposes – such as to process your transactions, maintain your account(s), respond to court orders and legal investigations, or report to credit bureaus | Yes | No | ||
For our marketing purposes – to offer our products and services to you | No | We don’t share | ||
| For joint marketing with other financial companies | No | We don’t share | ||
For our affiliates’ everyday business purposes – information about your transactions and experiences | No | We don’t share | ||
For our affiliates’ everyday business purposes – information about your creditworthiness | No | We don’t share | ||
| For nonaffiliates to market to you | No | We don’t share |
| Questions? | Call 800-225-2606 or go to mfs.com. |
34
Table of Contents
| Page 2 |
| Who we are | ||
| Who is providing this notice? | MFS Funds, MFS Investment Management, MFS Institutional Advisors, Inc., MFS Fund Distributors, Inc., MFS Heritage Trust Company, and MFS Service Center, Inc. | |
| What we do | ||
| How does MFS protect my personal information? | To protect your personal information from unauthorized access and use, we use security measures that comply with federal law. These measures include procedural, electronic, and physical safeguards for the protection of the personal information we collect about you. | |
| How does MFS collect my personal information? | We collect your personal information, for example, when you
• open an account or provide account information • direct us to buy securities or direct us to sell your securities • make a wire transfer
We also collect your personal information from others, such as credit bureaus, affiliates and other companies. | |
| Why can’t I limit all sharing? | Federal law gives you the right to limit only
• sharing for affiliates’ everyday business purposes – information about your creditworthiness • affiliates from using your information to market to you • sharing for nonaffiliates to market to you
State laws and individual companies may give you additional rights to limit sharing. | |
| Definitions | ||
| Affiliates | Companies related by common ownership or control. They can be financial and nonfinancial companies.
•MFS does not share personal information with affiliates, except for everyday business purposes as described on page one of this notice. | |
| Nonaffiliates | Companies not related by common ownership or control. They can be financial and nonfinancial companies.
•MFS does not share with nonaffiliates so they can market to you. | |
| Joint Marketing | A formal agreement between nonaffiliated financial companies that together market financial products or services to you.
•MFS doesn’t jointly market. | |
| Other important information | ||
| If you own an MFS product or receive an MFS service in the name of a third party such as a bank or broker-dealer, their privacy policy may apply to you instead of ours. | ||
35
Table of Contents

Table of Contents

MFS® High Yield Portfolio
MFS® Variable Insurance Trust II

ANNUAL REPORT
December 31, 2011
HYS-ANN
Table of Contents
MFS® HIGH YIELD PORTFOLIO
The report is prepared for the general information of contract owners.
It is authorized for distribution to prospective investors only when preceded or accompanied by a current prospectus.
NOT FDIC INSURED Ÿ MAY LOSE VALUE Ÿ NO BANK OR CREDIT UNION GUARANTEE Ÿ NOT A DEPOSIT Ÿ NOT INSURED BY ANY FEDERAL GOVERNMENT AGENCY OR NCUA/NCUSIF
Table of Contents
MFS High Yield Portfolio
LETTER FROM THE CHAIRMAN AND CEO

Dear Contract Owners:
We are indeed living through some volatile times. Economic uncertainty is everywhere, as it seems no place in the world has been unmoved by crisis. We have seen a devastating earthquake and tsunami that have led to disruptions in the Japanese markets
and supply chains. Protests have changed the face of the Middle East and left in their wake lingering tensions and resultant higher oil prices. We have seen debt limits tested in Europe and the United States and policymakers grappling to craft often unpopular monetary and fiscal responses at a time when consumers and businesses struggle with what appears to be a slowing global economy. On top of all of that, we have seen long-term U.S. debt lose its Standard & Poor’s AAA rating and the long-term debt ratings of 15 eurozone nations put on negative watch.
When markets become volatile, managing risk becomes a top priority for investors and their advisors. At MFS® risk management is foremost in our minds in all market climates. Our analysts and portfolio managers keep risks firmly in mind when evaluating securities. Additionally, we have a team of quantitative analysts that measures and assesses the risk profiles of our portfolios and securities on an ongoing basis. The chief investment risk officer, who oversees the team, reports directly to the firm’s president and chief investment officer so the risk associated with each portfolio can be assessed objectively and independently of the portfolio management team.
As always, we continue to be mindful of the many economic challenges faced at the local, national, and international levels. It is in times such as these that we want to remind investors of the merits of maintaining a long-term view, adhering to basic investing principles such as asset allocation and diversification, and working closely with their advisors to research and identify appropriate investment opportunities.
Respectfully,

Robert J. Manning
Chairman and Chief Executive Officer
MFS Investment Management®
February 15, 2012
The opinions expressed in this letter are subject to change, may not be relied upon for investment advice, and no forecasts can be guaranteed.
1
Table of Contents
MFS High Yield Portfolio
Portfolio structure (i)
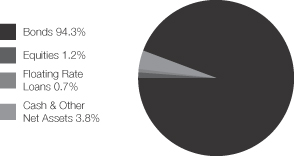
| Top five industries (i) | ||||
| Energy-Independent | 8.8% | |||
| Broadcasting | 5.9% | |||
| Medical & Health Technology & Services | 5.7% | |||
| Utilities – Electric Power | 5.1% | |||
| Gaming & Lodging | 4.8% |
| Composition including fixed income credit quality (a)(i) | ||||
| A | 0.1% | |||
| BBB | 5.0% | |||
| BB | 26.9% | |||
| B | 45.9% | |||
| CCC | 15.4% | |||
| CC | 0.6% | |||
| C | 0.2% | |||
| D | 0.2% | |||
| Not Rated | 0.7% | |||
| Non-Fixed Income | 1.2% | |||
| Cash & Other | 3.8% | |||
| Portfolio facts (i) | ||||
| Average Duration (d) | 4.3 | |||
| Average Effective Maturity (m) | 7.1 yrs. | |||
| (a) | For all securities other than those specifically described below, ratings are assigned to underlying securities utilizing ratings from Moody’s, Fitch, and Standard & Poor’s rating agencies and applying the following hierarchy: If all three agencies provide a rating, the middle rating (after dropping the highest and lowest ratings) is assigned; if two of the three agencies rate a security, the lower of the two is assigned. Ratings are shown in the S&P and Fitch scale (e.g., AAA). All ratings are subject to change. Not Rated includes fixed income securities which have not been rated by any rating agency. Non-Fixed Income includes equity securities (including convertible bonds and equity derivatives) and commodities. Cash & Other includes cash, other assets less liabilities, offsets to derivative positions, and short-term securities. The fund may not hold all of these instruments. The fund is not rated by these agencies. |
| (d) | Duration is a measure of how much a bond’s price is likely to fluctuate with general changes in interest rates, e.g., if rates rise 1.00%, a bond with a 5-year duration is likely to lose about 5.00% of its value due to the interest rate move. |
| (i) | For purposes of this presentation, the components include the market value of securities, and reflect the impact of the equivalent exposure of derivative positions. These amounts may be negative from time to time. The bond component will include any accrued interest amounts. Equivalent exposure is a calculated amount that translates the derivative position into a reasonable approximation of the amount of the underlying asset that the portfolio would have to hold at a given point in time to have the same price sensitivity that results from the portfolio’s ownership of the derivative contract. When dealing with derivatives, equivalent exposure is a more representative measure of the potential impact of a position on portfolio performance than market value. Where the fund holds convertible bonds, these are treated as part of the equity portion of the portfolio. |
| (m) | In determining an instrument’s effective maturity for purposes of calculating the fund’s dollar-weighted average effective maturity, MFS uses the instrument’s stated maturity or, if applicable, an earlier date on which MFS believes it is probable that a maturity-shortening device (such as a put, pre-refunding or prepayment) will cause the instrument to be repaid. Such an earlier date can be substantially shorter than the instrument’s stated maturity. |
Percentages are based on net assets as of 12/31/11.
The portfolio is actively managed and current holdings may be different.
2
Table of Contents
MFS High Yield Portfolio
Summary of Results
For the twelve months ended December 31, 2011, Initial Class shares of the MFS High Yield Portfolio (the “fund”) provided a total return of 4.13%, while Service Class shares of the fund provided a total return of 3.86%. These compare with a return of 4.96% for the fund’s benchmark, the Barclays Capital U.S. High-Yield Corporate Bond 2% Issuer Capped Index. Effective September 15, 2011, the Barclays Capital U.S. High-Yield Corporate Bond 2% Issuer Capped Index replaced the Barclays Capital U.S. High-Yield Corporate Bond Index as the fund’s primary benchmark. The Barclays Capital U.S. High-Yield Corporate Bond Index generated a return of 4.98% over the reporting period.
Market Environment
Early in the period, the U.S. Federal Reserve (the “Fed”) responded to weak economic growth by loosening monetary policy further. More easing by the Fed improved market sentiment and drove risk-asset prices markedly higher. The December 2010 agreement on a surprisingly large (relative to expectations) expansionary U.S. fiscal package also boosted sentiment. During the subsequent several months, the renewed positive market sentiment, coupled with better indications of global macroeconomic activity, pushed many asset valuations to post-crisis highs. At the same time, the yields of the perceived “safest” global sovereign credits rose, indicating a renewed risk-seeking environment.
However, towards the middle of the period, a weakening macroeconomic backdrop and renewed concerns over peripheral euro zone sovereign debt caused a flight-to-quality move that pushed high-quality sovereign bond yields lower. In the U.S., concerns about sovereign debt default and the long-term sustainability of the trend in U.S. fiscal policy resulted in one agency downgrading U.S. credit quality. Amidst this turmoil, global equity markets declined sharply. As a result of these developments, global consumer and producer sentiment indicators fell precipitously and highly-rated sovereign bond yields hit multi-decade lows. Towards the end of the reporting period, uncertainty in financial markets spiked higher as markets more seriously contemplated the possible failure of the euro zone.
Detractors from Performance
Relative to the Barclays Capital U.S. High-Yield Corporate Bond Index, the fund’s greater exposure to “BBB” and “B” rated (r) securities detracted from performance as these credit quality sectors underperformed higher-rated securities over the reporting period.
The fund’s greater exposure to the financial sector also hindered relative results. This market segment underperformed the benchmark as Europe’s mounting sovereign debt crisis put pressure on most financial companies.
Among individual securities, the fund’s holdings of automotive financial services firm Ally Financial were among the fund’s top relative detractors for the reporting period. Debt holdings of aviation company Hawker Beechcraft Acquisition, financial services firm First Union National Bank Commercial Mortgage Trust, and cement manufacturer CEMEX also held back relative returns.
Contributors to Performance
The fund’s lesser exposure to “BB” rated securities contributed to performance. The fund’s return from yield, which was greater than that of the benchmark, also benefited relative results.
Top individual contributors during the reporting period included the fund’s debt holdings of Anthracite CDO (h), funeral homes operator Service Corp. International, energy company Energy Future Holdings, financial services firm Wachovia, and insurance company American International Group.
Respectfully,
| William Adams | David Cole | |
| Portfolio Manager | Portfolio Manager |
Note to Contract Owners: Effective May 1, 2011, William Adams replaced John Addeo as a co-manager of the fund.
| (h) | Security was not held in the fund at period end. |
| (r) | Bonds rated “BBB”, “Baa”, or higher are considered investment grade; bonds rated “BB”, “Ba”, or below are considered non-investment grade. The source for bond quality ratings is Moody’s Investors Service, Standard & Poor’s and Fitch, Inc. and are applied using the following hierarchy: If all three agencies provide a rating, the middle rating (after dropping the highest and lowest ratings) is assigned; if two of the three agencies rate a security, the lower of the two is assigned. Ratings are shown in the S&P and Fitch scale (e.g., AAA). For securities which are not rated by any of the three agencies, the security is considered Not Rated. |
The views expressed in this report are those of the portfolio managers only through the end of the period of the report as stated on the cover and do not necessarily reflect the views of MFS or any other person in the MFS organization. These views are subject to change at any time based on market or other conditions, and MFS disclaims any responsibility to update such views. These views may not be relied upon as investment advice or an indication of trading intent on behalf of any MFS portfolio. References to specific securities are not recommendations of such securities, and may not be representative of any MFS portfolio’s current or future investments.
3
Table of Contents
MFS High Yield Portfolio
PERFORMANCE SUMMARY THROUGH 12/31/11
The following chart illustrates the historical performance of the fund in comparison to its benchmark(s). Benchmarks are unmanaged and may not be invested in directly. Benchmark returns do not reflect any fees or expenses. The performance of other share classes will be greater than or less than that of the class depicted below. (See Notes to Performance Summary.)
Performance data shown represents past performance and is no guarantee of future results. Investment return and principal value fluctuate so your units, when sold, may be worth more or less than the original cost; current performance may be lower or higher than quoted. The performance shown does not reflect the deduction of taxes, if any, that a contract holder would pay on fund distributions or the redemption of contract units. The returns for the fund shown also do not reflect the deduction of expenses associated with variable products, such as mortality and expense risk charges, separate account charges, and sales charges imposed by the insurance company separate accounts. Such expenses would reduce the overall returns shown.
Growth of a Hypothetical $10,000 Investment
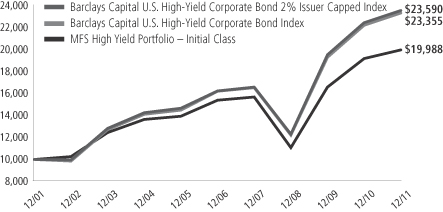
Total Returns through 12/31/11
Average annual total returns
| Share class | Class inception date | 1-yr | 5-yr | 10-yr | ||||||||
| Initial Class | 6/12/85 | 4.13% | 5.34% | 7.17% | ||||||||
| Service Class | 8/24/01 | 3.86% | 5.09% | 6.91% | ||||||||
| Comparative benchmarks | ||||||||||||
| Barclays Capital U.S. High-Yield Corporate Bond 2% Issuer Capped Index (f)(z) | 4.96% | 7.74% | 8.96% | |||||||||
| Barclays Capital U.S. High-Yield Corporate Bond Index (f)(z) | 4.98% | 7.54% | 8.85% | |||||||||
| (f) | Source: FactSet Research Systems Inc. |
| (z) | Effective September 15, 2011, the Barclays Capital U.S. High-Yield Corporate Bond 2% Issuer Capped Index replaced the Barclays Capital U.S. High-Yield Corporate Bond Index as the fund’s primary benchmark as the new benchmark more appropriately aligns with the fund’s investment strategy. |
Benchmark Definitions
Barclays Capital U.S. High-Yield Corporate Bond Index – a market capitalization-weighted index that measures the performance of non-investment grade, fixed rate debt. Eurobonds and debt issues from countries designated as emerging markets (e.g., Argentina, Brazil, Venezuela, etc.) are excluded.
Barclays Capital U.S. High-Yield Corporate Bond 2% Issuer Capped Index – is a component of the Barclays Capital U.S. High-Yield Corporate Bond Index, which measures performance of non-investment grade, fixed rate debt. The index limits the maximum exposure to any one issuer to 2%.
It is not possible to invest directly in an index.
Notes to Performance Summary
Average annual total return represents the average annual change in value for each share class for the periods presented.
4
Table of Contents
MFS High Yield Portfolio
Performance Summary – continued
Performance results reflect any applicable expense subsidies and waivers in effect during the periods shown. Without such subsidies and waivers the fund’s performance results would be less favorable. Please see the prospectus and financial statements for complete details. All results are historical and assume the reinvestment of any dividends and capital gains distributions.
Performance results do not include adjustments made for financial reporting purposes in accordance with U.S. generally accepted accounting principles and may differ from amounts reported in the financial highlights.
From time to time the fund may receive proceeds from litigation settlements, without which performance would be lower.
5
Table of Contents
MFS High Yield Portfolio
Fund Expenses Borne by the Contract Holders During the Period,
July 1, 2011 through December 31, 2011
As a contract holder of the fund, you incur ongoing costs, including management fees; distribution and/or service (12b-1) fees; and other fund expenses. This example is intended to help you understand your ongoing costs (in dollars) of investing in the fund and to compare these costs with the ongoing costs of investing in other mutual funds.
The example is based on an investment of $1,000 invested at the beginning of the period and held for the entire period July 1, 2011 through December 31, 2011.
Actual Expenses
The first line for each share class in the following table provides information about actual account values and actual expenses. You may use the information in this line, together with the amount you invested, to estimate the expenses that you paid over the period. Simply divide your account value by $1,000 (for example, an $8,600 account value divided by $1,000 = 8.6), then multiply the result by the number in the first line under the heading entitled “Expenses Paid During Period” to estimate the expenses you paid on your account during this period.
Hypothetical Example for Comparison Purposes
The second line for each share class in the following table provides information about hypothetical account values and hypothetical expenses based on the fund’s actual expense ratio and an assumed rate of return of 5% per year before expenses, which is not the fund’s actual return. The hypothetical account values and expenses may not be used to estimate the actual ending account balance or expenses you paid for the period. You may use this information to compare the ongoing costs of investing in the fund and other funds. To do so, compare this 5% hypothetical example with the 5% hypothetical examples that appear in the shareholder reports of the other funds.
Please note that the expenses shown in the table are meant to highlight the fund’s ongoing costs only and do not take into account the fees and expenses imposed under the variable contracts through which your investment in the fund is made. Therefore, the second line for each share class in the table is useful in comparing ongoing costs associated with an investment in vehicles (such as the fund) which fund benefits under variable annuity and variable life insurance contracts and to qualified pension and retirement plans only, and will not help you determine the relative total costs of investing in the fund through variable annuity and variable life insurance contracts. If the fees and expenses imposed under the variable contracts were included, your costs would have been higher.
| Share Class | Annualized Expense Ratio | Beginning Account Value 7/01/11 | Ending Account Value 12/31/11 | Expenses Paid During Period (p) 7/01/11-12/31/11 | ||||||||||||||
Initial Class | Actual | 0.81% | $1,000.00 | $994.62 | $4.07 | |||||||||||||
| Hypothetical (h) | 0.81% | $1,000.00 | $1,021.12 | $4.13 | ||||||||||||||
| Service Class | Actual | 1.06% | $1,000.00 | $994.85 | $5.33 | |||||||||||||
| Hypothetical (h) | 1.06% | $1,000.00 | $1,019.86 | $5.40 | ||||||||||||||
| (h) | 5% class return per year before expenses. |
| (p) | Expenses paid is equal to each class’ annualized expense ratio, as shown above, multiplied by the average account value over the period, multiplied by the number of days in the period, divided by the number of days in the year. |
6
Table of Contents
MFS High Yield Portfolio
PORTFOLIO OF INVESTMENTS – 12/31/11
The Portfolio of Investments is a complete list of all securities owned by your fund. It is categorized by broad-based asset classes.
| Issuer | Shares/Par | Value ($) | ||||||
| BONDS – 92.5% | ||||||||
| Aerospace – 1.7% | ||||||||
| BE Aerospace, Inc., 8.5%, 2018 | $ | 370,000 | $ | 405,150 | ||||
| Bombardier, Inc., 7.5%, 2018 (n) | 1,020,000 | 1,091,400 | ||||||
| Bombardier, Inc., 7.75%, 2020 (n) | 390,000 | 425,100 | ||||||
| CPI International, Inc., 8%, 2018 | 755,000 | 628,537 | ||||||
| Hawker Beechcraft Acquisition Co. LLC, 8.5%, 2015 | 884,000 | 163,540 | ||||||
| Heckler & Koch GmbH, 9.5%, 2018 (z) | EUR | 390,000 | 320,521 | |||||
| Huntington Ingalls Industries, Inc., 7.125%, 2021 (n) | $ | 785,000 | 769,300 | |||||
|
| |||||||
| $ | 3,803,548 | |||||||
|
| |||||||
| Apparel Manufacturers – 0.7% | ||||||||
| Hanesbrands, Inc., 8%, 2016 | $ | 410,000 | $ | 445,875 | ||||
| Hanesbrands, Inc., 6.375%, 2020 | 390,000 | 395,850 | ||||||
| Phillips-Van Heusen Corp., 7.375%, 2020 | 795,000 | 862,575 | ||||||
|
| |||||||
| $ | 1,704,300 | |||||||
|
| |||||||
| Asset-Backed & Securitized – 0.8% | ||||||||
| Arbor Realty Mortgage Securities, CDO, FRN, 2.711%, 2038 (z) | $ | 568,228 | $ | 73,870 | ||||
| Arcap REIT, Inc., CDO, “H”, FRN, 6.013%, 2045 (a)(d)(z) | 28,539 | 1 | ||||||
| Citigroup Commercial Mortgage Trust, FRN, 5.697%, 2049 | 1,100,911 | 385,001 | ||||||
| Crest Ltd., CDO, 7%, 2040 (a)(p) | 170,894 | 8,545 | ||||||
| CWCapital Cobalt Ltd., CDO, 6.23%, 2045 (a)(p)(z) | 1,143,583 | 22,872 | ||||||
| CWCapital Cobalt Ltd., CDO, “F”, FRN, 1.72%, 2050 (z) | 516,539 | 10,331 | ||||||
| First Union National Bank Commercial Mortgage Trust, 6.75%, 2032 | 1,020,000 | 554,042 | ||||||
| G-Force LLC, CDO, “A2”, 4.83%, 2036 (z) | 419,589 | 399,134 | ||||||
| JPMorgan Chase Commercial Mortgage Securities Corp., “C”, FRN, 6.058%, 2051 | 800,000 | 347,600 | ||||||
| Wachovia Bank Commercial Mortgage Trust, FRN, 5.744%, 2047 | 644,486 | 101,958 | ||||||
|
| |||||||
| $ | 1,903,354 | |||||||
|
| |||||||
| Automotive – 3.0% | ||||||||
| Accuride Corp., 9.5%, 2018 | $ | 980,000 | $ | 945,700 | ||||
| Allison Transmission, Inc., 7.125%, 2019 (n) | 650,000 | 637,000 | ||||||
| Chrysler Group LLC/CG Co-Issuer, Inc., 8.25%, 2021 (n) | 480,000 | 436,800 | ||||||
| Ford Motor Co., 7.45%, 2031 | 750,000 | 900,000 | ||||||
| Ford Motor Credit Co. LLC, 8%, 2014 | 100,000 | 108,847 | ||||||
| Ford Motor Credit Co. LLC, 12%, 2015 | 1,514,000 | 1,854,635 | ||||||
| General Motors Financial Co., Inc., 6.75%, 2018 (n) | 610,000 | 622,200 | ||||||
| Jaguar Land Rover PLC, 7.75%, 2018 (n) | 155,000 | 147,638 | ||||||
| Jaguar Land Rover PLC, 8.125%, 2021 (n) | 805,000 | 756,700 | ||||||
| Lear Corp., 8.125%, 2020 | 450,000 | 495,000 | ||||||
|
| |||||||
| $ | 6,904,520 | |||||||
|
| |||||||
| Issuer | Shares/Par | Value ($) | ||||||
| BONDS – continued | ||||||||
| Basic Industry – 0.4% | ||||||||
| Trimas Corp., 9.75%, 2017 | $ | 760,000 | $ | 824,600 | ||||
|
| |||||||
| Broadcasting – 5.4% | ||||||||
| Allbritton Communications Co., 8%, 2018 | $ | 375,000 | $ | 372,187 | ||||
| AMC Networks, Inc., 7.75%, 2021 (n) | 454,000 | 493,725 | ||||||
| Clear Channel Communications, Inc., 9%, 2021 | 546,000 | 460,005 | ||||||
| EH Holding Corp., 7.625%, 2021 (n) | 455,000 | 477,750 | ||||||
| Gray Television, Inc., 10.5%, 2015 | 205,000 | 193,725 | ||||||
| Inmarsat Finance PLC, 7.375%, 2017 (n) | 845,000 | 883,025 | ||||||
| Intelsat Bermuda Ltd., 11.25%, 2017 | 910,000 | 880,425 | ||||||
| Intelsat Jackson Holdings Ltd., 9.5%, 2016 | 1,270,000 | 1,327,150 | ||||||
| Intelsat Jackson Holdings Ltd., 11.25%, 2016 | 610,000 | 640,881 | ||||||
| LBI Media, Inc., 8.5%, 2017 (z) | 740,000 | 407,925 | ||||||
| Liberty Media Corp., 8.5%, 2029 | 875,000 | 848,750 | ||||||
| Local TV Finance LLC, 9.25%, 2015 (p)(z) | 1,117,186 | 1,066,913 | ||||||
| Newport Television LLC, 13%, 2017 (n)(p) | 347,901 | 295,885 | ||||||
| Nexstar Broadcasting Group, Inc., 8.875%, 2017 | 315,000 | 322,875 | ||||||
| Sinclair Broadcast Group, Inc., 9.25%, 2017 (n) | 465,000 | 506,850 | ||||||
| Sinclair Broadcast Group, Inc., 8.375%, 2018 | 125,000 | 129,062 | ||||||
| SIRIUS XM Radio, Inc., 13%, 2013 (n) | 420,000 | 476,700 | ||||||
| SIRIUS XM Radio, Inc., 8.75%, 2015 (n) | 535,000 | 585,825 | ||||||
| SIRIUS XM Radio, Inc., 7.625%, 2018 (n) | 595,000 | 624,750 | ||||||
| Univision Communications, Inc., 6.875%, 2019 (n) | 440,000 | 424,600 | ||||||
| Univision Communications, Inc., 7.875%, 2020 (n) | 375,000 | 380,625 | ||||||
| Univision Communications, Inc., 8.5%, 2021 (n) | 495,000 | 450,450 | ||||||
|
| |||||||
| $ | 12,250,083 | |||||||
|
| |||||||
| Brokerage & Asset Managers – 0.4% | ||||||||
| E*TRADE Financial Corp., 7.875%, 2015 | $ | 50,000 | $ | 50,250 | ||||
| E*TRADE Financial Corp., 12.5%, 2017 | 845,000 | 954,850 | ||||||
|
| |||||||
| $ | 1,005,100 | |||||||
|
| |||||||
| Building – 1.8% | ||||||||
| Associated Materials LLC, 9.125%, 2017 | $ | 195,000 | $ | 170,137 | ||||
| Building Materials Holding Corp., 6.875%, 2018 (n) | 565,000 | 593,250 | ||||||
| Building Materials Holding Corp., 7%, 2020 (n) | 345,000 | 370,875 | ||||||
| Building Materials Holding Corp., 6.75%, 2021 (n) | 305,000 | 320,250 | ||||||
| CEMEX S.A., 9.25%, 2020 | 1,550,000 | 1,181,875 | ||||||
| Masonite International Corp., 8.25%, 2021 (n) | 375,000 | 367,500 | ||||||
| Nortek, Inc., 10%, 2018 (n) | 215,000 | 203,713 | ||||||
| Nortek, Inc., 8.5%, 2021 (n) | 825,000 | 697,125 | ||||||
| Roofing Supply Group LLC/Roofing Supply Finance, Inc., 8.625%, 2017 (n) | 284,000 | 289,680 | ||||||
|
| |||||||
| $ | 4,194,405 | |||||||
|
| |||||||
7
Table of Contents
MFS High Yield Portfolio
Portfolio of Investments – continued
| Issuer | Shares/Par | Value ($) | ||||||
| BONDS – continued | ||||||||
| Business Services – 1.5% | ||||||||
| Ceridian Corp., 12.25%, 2015 (p) | $ | 370,000 | $ | 286,750 | ||||
| iGate Corp., 9%, 2016 (n) | 661,000 | 682,483 | ||||||
| Interactive Data Corp., 10.25%, 2018 | 665,000 | 728,175 | ||||||
| Iron Mountain, Inc., 8.375%, 2021 | 845,000 | 899,925 | ||||||
| SunGard Data Systems, Inc., 10.25%, 2015 | 433,000 | 448,696 | ||||||
| SunGard Data Systems, Inc., 7.375%, 2018 | 325,000 | 332,719 | ||||||
|
| |||||||
| $ | 3,378,748 | |||||||
|
| |||||||
| Cable TV – 3.8% | ||||||||
| Bresnan Broadband Holdings LLC, 8%, 2018 (n) | $ | 185,000 | $ | 192,400 | ||||
| Cablevision Systems Corp., 8.625%, 2017 | 550,000 | 609,125 | ||||||
| CCH II LLC, 13.5%, 2016 | 785,000 | 906,675 | ||||||
| CCO Holdings LLC, 7.875%, 2018 | 660,000 | 703,725 | ||||||
| CCO Holdings LLC, 8.125%, 2020 | 980,000 | 1,073,100 | ||||||
| Cequel Communications Holdings, 8.625%, 2017 (n) | 415,000 | 439,900 | ||||||
| CSC Holdings LLC, 8.5%, 2014 | 70,000 | 77,438 | ||||||
| DISH DBS Corp., 6.75%, 2021 | 260,000 | 280,150 | ||||||
| EchoStar Corp., 7.125%, 2016 | 605,000 | 651,888 | ||||||
| Insight Communications Co., Inc., 9.375%, 2018 (n) | 660,000 | 754,050 | ||||||
| Mediacom LLC, 9.125%, 2019 | 610,000 | 647,362 | ||||||
| Telenet Finance Luxembourg, 6.375%, 2020 (n) | EUR | 165,000 | 205,009 | |||||
| UPCB Finance III Ltd., 6.625%, 2020 (n) | $ | 908,000 | 894,380 | |||||
| Virgin Media Finance PLC, 9.5%, 2016 | 225,000 | 252,563 | ||||||
| Virgin Media Finance PLC, 8.375%, 2019 | 525,000 | 576,188 | ||||||
| Ziggo Bond Co. B.V., 8%, 2018 (n) | EUR | 320,000 | 418,302 | |||||
|
| |||||||
| $ | 8,682,255 | |||||||
|
| |||||||
| Chemicals – 3.1% | ||||||||
| Celanese U.S. Holdings LLC, 6.625%, 2018 | $ | 630,000 | $ | 669,375 | ||||
| Hexion U.S. Finance Corp./Hexion Nova Scotia Finance, 8.875%, 2018 | 845,000 | 792,187 | ||||||
| Hexion U.S. Finance Corp./Hexion Nova Scotia Finance, 9%, 2020 | 190,000 | 156,750 | ||||||
| Huntsman International LLC, 8.625%, 2021 | 710,000 | 752,600 | ||||||
| Lyondell Chemical Co., 11%, 2018 | 722,039 | 788,828 | ||||||
| LyondellBasell Industries, Inc., 6%, 2021 (n) | 825,000 | 855,938 | ||||||
| Momentive Performance Materials, Inc., 12.5%, 2014 | 1,099,000 | 1,164,940 | ||||||
| Momentive Performance Materials, Inc., 11.5%, 2016 | 652,000 | 485,740 | ||||||
| Nalco Co., 8.25%, 2017 | 127,000 | 144,145 | ||||||
| Polypore International, Inc., 7.5%, 2017 | 695,000 | 719,325 | ||||||
| Solutia, Inc., 7.875%, 2020 | 580,000 | 630,750 | ||||||
|
| |||||||
| $ | 7,160,578 | |||||||
|
| |||||||
| Issuer | Shares/Par | Value ($) | ||||||
| BONDS – continued | ||||||||
| Computer Software – 0.6% | ||||||||
| Lawson Software, Inc., 11.5%, 2018 (n) | $ | 600,000 | $ | 582,000 | ||||
| Syniverse Holdings, Inc., 9.125%, 2019 | 670,000 | 706,850 | ||||||
|
| |||||||
| $ | 1,288,850 | |||||||
|
| |||||||
| Computer Software – Systems – 1.2% | ||||||||
| Audatex North America, Inc., 6.75%, 2018 (n) | $ | 425,000 | $ | 429,250 | ||||
| CDW LLC/CDW Finance Corp., 12.535%, 2017 | 340,000 | 341,700 | ||||||
| CDW LLC/CDW Finance Corp., 8.5%, 2019 | 800,000 | 806,000 | ||||||
| DuPont Fabros Technology, Inc., REIT, 8.5%, 2017 | 830,000 | 888,100 | ||||||
| Eagle Parent, Inc., 8.625%, 2019 (n) | 250,000 | 238,750 | ||||||
|
| |||||||
| $ | 2,703,800 | |||||||
|
| |||||||
| Conglomerates – 1.6% | ||||||||
| Amsted Industries, Inc., 8.125%, 2018 (n) | $ | 990,000 | $ | 1,049,400 | ||||
| Dynacast International LLC, 9.25%, 2019 (z) | 530,000 | 498,200 | ||||||
| Griffon Corp., 7.125%, 2018 | 945,000 | 935,550 | ||||||
| Tomkins LLC/Tomkins, Inc., 9%, 2018 | 1,138,000 | 1,261,757 | ||||||
|
| |||||||
| $ | 3,744,907 | |||||||
|
| |||||||
| Consumer Products – 1.2% | ||||||||
| Easton-Bell Sports, Inc., 9.75%, 2016 | $ | 230,000 | $ | 250,700 | ||||
| Elizabeth Arden, Inc., 7.375%, 2021 | 650,000 | 676,000 | ||||||
| Jarden Corp., 7.5%, 2020 | 785,000 | 836,025 | ||||||
| Libbey Glass, Inc., 10%, 2015 | 580,000 | 620,600 | ||||||
| Visant Corp., 10%, 2017 | 480,000 | 439,200 | ||||||
|
| |||||||
| $ | 2,822,525 | |||||||
|
| |||||||
| Consumer Services – 1.0% | ||||||||
| Realogy Corp., 11.5%, 2017 | $ | 625,000 | $ | 487,500 | ||||
| Service Corp. International, 6.75%, 2015 | 380,000 | 408,500 | ||||||
| Service Corp. International, 7%, 2017 | 1,325,000 | 1,437,625 | ||||||
|
| |||||||
| $ | 2,333,625 | |||||||
|
| |||||||
| Containers – 1.6% | ||||||||
| Exopack Holding Corp., 10%, 2018 (z) | $ | 375,000 | $ | 375,000 | ||||
| Graham Packaging Co. LP/GPC Capital Corp., 9.875%, 2014 | 455,000 | 462,394 | ||||||
| Greif, Inc., 6.75%, 2017 | 1,020,000 | 1,065,900 | ||||||
| Packaging Dynamics Corp., 8.75%, 2016 (z) | 270,000 | 270,000 | ||||||
| Reynolds Group, 8.75%, 2016 (n) | 285,000 | 299,963 | ||||||
| Reynolds Group, 7.125%, 2019 (n) | 570,000 | 579,975 | ||||||
| Reynolds Group, 8.25%, 2021 (n) | 495,000 | 438,075 | ||||||
| Sealed Air Corp., 8.125%, 2019 (n) | 115,000 | 125,925 | ||||||
| Sealed Air Corp., 8.375%, 2021 (n) | 115,000 | 127,075 | ||||||
|
| |||||||
| $ | 3,744,307 | |||||||
|
| |||||||
| Defense Electronics – 0.6% | ||||||||
| Ducommun, Inc., 9.75%, 2018 (n) | $ | 629,000 | $ | 638,435 | ||||
| ManTech International Corp., 7.25%, 2018 | 540,000 | 550,125 | ||||||
| MOOG, Inc., 7.25%, 2018 | 125,000 | 131,875 | ||||||
|
| |||||||
| $ | 1,320,435 | |||||||
|
| |||||||
| Electrical Equipment – 0.1% | ||||||||
| Avaya, Inc., 9.75%, 2015 | $ | 270,000 | $ | 243,000 | ||||
|
| |||||||
8
Table of Contents
MFS High Yield Portfolio
Portfolio of Investments – continued
| Issuer | Shares/Par | Value ($) | ||||||
| BONDS – continued | ||||||||
| Electronics – 0.9% | ||||||||
| Freescale Semiconductor, Inc., 9.25%, 2018 (n) | $ | 765,000 | $ | 817,594 | ||||
| Freescale Semiconductor, Inc., 8.05%, 2020 | 340,000 | 319,600 | ||||||
| NXP B.V., 9.75%, 2018 (n) | 105,000 | 114,450 | ||||||
| Sensata Technologies B.V., 6.5%, 2019 (n) | 715,000 | 706,063 | ||||||
|
| |||||||
| $ | 1,957,707 | |||||||
|
| |||||||
| Energy – Independent – 8.6% | ||||||||
| ATP Oil & Gas Corp., 11.875%, 2015 | $ | 445,000 | $ | 292,587 | ||||
| Bill Barrett Corp., 9.875%, 2016 | 655,000 | 720,500 | ||||||
| Bill Barrett Corp., 7.625%, 2019 | 175,000 | 182,875 | ||||||
| BreitBurn Energy Partners LP, 8.625%, 2020 | 325,000 | 340,031 | ||||||
| Carrizo Oil & Gas, Inc., 8.625%, 2018 | 305,000 | 308,050 | ||||||
| Carrizo Oil & Gas, Inc., 8.625%, 2018 (n) | 120,000 | 120,600 | ||||||
| Chaparral Energy, Inc., 8.875%, 2017 | 1,085,000 | 1,122,975 | ||||||
| Chesapeake Energy Corp., 6.875%, 2020 | 325,000 | 347,750 | ||||||
| Concho Resources, Inc., 8.625%, 2017 | 440,000 | 480,700 | ||||||
| Concho Resources, Inc., 6.5%, 2022 | 810,000 | 846,450 | ||||||
| Connacher Oil & Gas Ltd., 8.5%, 2019 (n) | 440,000 | 398,200 | ||||||
| Continental Resources, Inc., 8.25%, 2019 | 665,000 | 731,500 | ||||||
| Denbury Resources, Inc., 8.25%, 2020 | 780,000 | 871,650 | ||||||
| Energy XXI Gulf Coast, Inc., 9.25%, 2017 | 1,050,000 | 1,139,250 | ||||||
| EXCO Resources, Inc., 7.5%, 2018 | 965,000 | 911,925 | ||||||
| Harvest Operations Corp., 6.875%, 2017 (n) | 1,145,000 | 1,185,075 | ||||||
| Hilcorp Energy I/Hilcorp Finance Co., 8%, 2020 (n) | 255,000 | 272,850 | ||||||
| Laredo Petroleum, Inc., 9.5%, 2019 (n) | 445,000 | 471,700 | ||||||
| LINN Energy LLC, 6.5%, 2019 (n) | 310,000 | 307,675 | ||||||
| LINN Energy LLC, 8.625%, 2020 | 350,000 | 379,750 | ||||||
| LINN Energy LLC, 7.75%, 2021 | 298,000 | 309,920 | ||||||
| Newfield Exploration Co., 6.625%, 2014 | 700,000 | 707,875 | ||||||
| Newfield Exploration Co., 6.625%, 2016 | 375,000 | 386,250 | ||||||
| Newfield Exploration Co., 6.875%, 2020 | 300,000 | 321,000 | ||||||
| OGX Petroleo e Gas Participacoes S.A., 8.5%, 2018 (n) | 1,414,000 | 1,385,720 | ||||||
| Pioneer Natural Resources Co., 7.5%, 2020 | 630,000 | 738,890 | ||||||
| QEP Resources, Inc., 6.875%, 2021 | 940,000 | 1,012,850 | ||||||
| Quicksilver Resources, Inc., 9.125%, 2019 | 320,000 | 339,200 | ||||||
| Range Resources Corp., 8%, 2019 | 650,000 | 724,750 | ||||||
| SandRidge Energy, Inc., 8%, 2018 (n) | 1,160,000 | 1,171,600 | ||||||
| SM Energy Co., 6.5%, 2021 (n) | 645,000 | 664,350 | ||||||
| Swift Energy Co., 7.875%, 2022 (n) | 310,000 | 306,125 | ||||||
| Whiting Petroleum Corp., 6.5%, 2018 | 210,000 | 219,450 | ||||||
|
| |||||||
| $ | 19,720,073 | |||||||
|
| |||||||
| Engineering – Construction – 0.2% | ||||||||
| B-Corp. Merger Sub, Inc., 8.25%, 2019 (n) | $ | 570,000 | $ | 535,800 | ||||
|
| |||||||
| Entertainment – 1.0% | ||||||||
| AMC Entertainment, Inc., 8.75%, 2019 | $ | 610,000 | $ | 631,350 | ||||
| AMC Entertainment, Inc., 9.75%, 2020 | 520,000 | 494,000 | ||||||
| Cinemark USA, Inc., 8.625%, 2019 | 755,000 | 821,062 | ||||||
| NAI Entertainment Holdings LLC, 8.25%, 2017 (n) | 330,000 | 348,975 | ||||||
|
| |||||||
| $ | 2,295,387 | |||||||
|
| |||||||
| Issuer | Shares/Par | Value ($) | ||||||
| BONDS – continued | ||||||||
| Financial Institutions – 4.7% | ||||||||
| CIT Group, Inc., 5.25%, 2014 (n) | $ | 1,005,000 | $ | 1,001,231 | ||||
| CIT Group, Inc., 7%, 2017 | 3,595,000 | 3,595,000 | ||||||
| CIT Group, Inc., 6.625%, 2018 (n) | 846,000 | 875,610 | ||||||
| Credit Acceptance Corp., 9.125%, 2017 | 450,000 | 470,250 | ||||||
| GMAC, Inc., 8%, 2031 | 130,000 | 125,450 | ||||||
| International Lease Finance Corp., 8.75%, 2017 | 840,000 | 865,200 | ||||||
| International Lease Finance Corp., 7.125%, 2018 (n) | 991,000 | 1,025,685 | ||||||
| Nationstar Mortgage LLC, 10.875%, 2015 | 1,160,000 | 1,148,400 | ||||||
| SLM Corp., 8.45%, 2018 | 230,000 | 236,900 | ||||||
| SLM Corp., 8%, 2020 | 1,135,000 | 1,146,350 | ||||||
| Springleaf Finance Corp., 6.9%, 2017 | 495,000 | 356,400 | ||||||
|
| |||||||
| $ | 10,846,476 | |||||||
|
| |||||||
| Food & Beverages – 1.6% | ||||||||
| ARAMARK Corp., 8.5%, 2015 | $ | 485,000 | $ | 497,125 | ||||
| B&G Foods, Inc., 7.625%, 2018 | 690,000 | 733,125 | ||||||
| Constellation Brands, Inc., 7.25%, 2016 | 230,000 | 252,713 | ||||||
| Pinnacle Foods Finance LLC, 9.25%, 2015 | 940,000 | 964,675 | ||||||
| Pinnacle Foods Finance LLC, 10.625%, 2017 | 270,000 | 283,500 | ||||||
| Pinnacle Foods Finance LLC, 8.25%, 2017 | 195,000 | 202,800 | ||||||
| TreeHouse Foods, Inc., 7.75%, 2018 | 590,000 | 638,675 | ||||||
|
| |||||||
| $ | 3,572,613 | |||||||
|
| |||||||
| Forest & Paper Products – 1.7% | �� | |||||||
| Boise, Inc., 8%, 2020 | $ | 580,000 | $ | 613,350 | ||||
| Cascades, Inc., 7.75%, 2017 | 535,000 | 529,650 | ||||||
| Georgia-Pacific Corp., 8%, 2024 | 615,000 | 788,495 | ||||||
| Graphic Packaging Holding Co., 7.875%, 2018 | 480,000 | 511,200 | ||||||
| Millar Western Forest Products Ltd., 8.5%, 2021 (z) | 145,000 | 110,200 | ||||||
| Smurfit Kappa Group PLC, 7.75%, 2019 (n) | EUR | 565,000 | 753,189 | |||||
| Tembec Industries, Inc., 11.25%, 2018 | $ | 275,000 | 283,250 | |||||
| Xerium Technologies, Inc., 8.875%, 2018 (z) | 285,000 | 257,925 | ||||||
|
| |||||||
| $ | 3,847,259 | |||||||
|
| |||||||
| Gaming & Lodging – 4.7% | ||||||||
| Boyd Gaming Corp., 7.125%, 2016 | $ | 800,000 | $ | 692,000 | ||||
| FelCor Lodging LP, REIT, 6.75%, 2019 | 365,000 | 350,400 | ||||||
| Firekeepers Development Authority, 13.875%, 2015 (n) | 630,000 | 715,050 | ||||||
| Fontainebleau Las Vegas Holdings LLC, 10.25%, 2015 (a)(d)(n) | 1,450,000 | 906 | ||||||
| GWR Operating Partnership LLP, 10.875%, 2017 | 340,000 | 369,750 | ||||||
| Harrah’s Operating Co., Inc., 11.25%, 2017 | 1,395,000 | 1,480,444 | ||||||
| Harrah’s Operating Co., Inc., 10%, 2018 | 408,000 | 265,200 | ||||||
| Harrah’s Operating Co., Inc., 10%, 2018 | 110,000 | 75,350 | ||||||
| Host Hotels & Resorts, Inc., 6.75%, 2016 | 1,090,000 | 1,119,975 | ||||||
| MGM Mirage, 10.375%, 2014 | 155,000 | 177,087 | ||||||
9
Table of Contents
MFS High Yield Portfolio
Portfolio of Investments – continued
| Issuer | Shares/Par | Value ($) | ||||||
| BONDS – continued | ||||||||
| Gaming & Lodging – continued | ||||||||
| MGM Mirage, 6.625%, 2015 | $ | 260,000 | $ | 247,000 | ||||
| MGM Mirage, 7.5%, 2016 | 130,000 | 124,475 | ||||||
| MGM Resorts International, 11.375%, 2018 | 880,000 | 968,000 | ||||||
| MGM Resorts International, 9%, 2020 | 815,000 | 902,612 | ||||||
| Penn National Gaming, Inc., 8.75%, 2019 | 1,050,000 | 1,141,875 | ||||||
| Seven Seas Cruises S. de R.L., 9.125%, 2019 (n) | 475,000 | 485,688 | ||||||
| Wyndham Worldwide Corp., 7.375%, 2020 | 705,000 | 804,669 | ||||||
| Wynn Las Vegas LLC, 7.75%, 2020 | 810,000 | 899,100 | ||||||
|
| |||||||
| $ | 10,819,581 | |||||||
|
| |||||||
| Health Maintenance Organizations – 0.2% | ||||||||
| AMERIGROUP Corp., 7.5%, 2019 | $ | 525,000 | $ | 540,750 | ||||
|
| |||||||
| Industrial – 1.2% | ||||||||
| Altra Holdings, Inc., 8.125%, 2016 | $ | 565,000 | $ | 600,312 | ||||
| Dematic S.A., 8.75%, 2016 (z) | 740,000 | 730,750 | ||||||
| Hillman Group, Inc., 10.875%, 2018 | 405,000 | 400,950 | ||||||
| Hyva Global B.V., 8.625%, 2016 (n) | 467,000 | 385,275 | ||||||
| Mueller Water Products, Inc., 8.75%, 2020 | 611,000 | 663,699 | ||||||
|
| |||||||
| $ | 2,780,986 | |||||||
|
| |||||||
| Insurance – 0.5% | ||||||||
| American International Group, Inc., 8.175% to 2038, FRN to 2068 | $ | 550,000 | $ | 489,500 | ||||
| MetLife, Inc., 9.25% to 2038, FRN to 2068 (n) | 500,000 | 571,250 | ||||||
|
| |||||||
| $ | 1,060,750 | |||||||
|
| |||||||
| Insurance – Property & Casualty – 1.0% | ||||||||
| Liberty Mutual Group, Inc., 10.75% to 2038, FRN to 2088 (n) | $ | 765,000 | $ | 960,075 | ||||
| USI Holdings Corp., 9.75%, 2015 (z) | 570,000 | 545,775 | ||||||
| XL Group PLC, 6.5% to 2017, FRN to 2049 | 1,000,000 | 782,500 | ||||||
|
| |||||||
| $ | 2,288,350 | |||||||
|
| |||||||
| Machinery & Tools – 1.1% | ||||||||
| Case Corp., 7.25%, 2016 | $ | 390,000 | $ | 418,275 | ||||
| Case New Holland, Inc., 7.875%, 2017 | 1,260,000 | 1,423,800 | ||||||
| CNH Capital LLC, 6.25%, 2016 (n) | 175,000 | 180,250 | ||||||
| Rental Service Corp., 9.5%, 2014 | 130,000 | 133,575 | ||||||
| RSC Equipment Rental, Inc., 8.25%, 2021 | 360,000 | 364,500 | ||||||
|
| |||||||
| $ | 2,520,400 | |||||||
|
| |||||||
| Major Banks – 0.4% | ||||||||
| Royal Bank of Scotland Group PLC, 6.99% to 2017, FRN to 2049 (a)(d)(n) | $ | 320,000 | $ | 200,400 | ||||
| Royal Bank of Scotland Group PLC, 7.648% to 2031, FRN to 2049 | 1,125,000 | 766,406 | ||||||
|
| |||||||
| $ | 966,806 | |||||||
|
| |||||||
| Medical & Health Technology & Services – 5.6% | ||||||||
| Beagle Acquisition Corp., 11%, 2019 (n) | $ | 310,000 | $ | 324,338 | ||||
| Biomet, Inc., 10%, 2017 | 700,000 | 756,000 | ||||||
| Biomet, Inc., 10.375%, 2017 (p) | 265,000 | 286,863 | ||||||
| Biomet, Inc., 11.625%, 2017 | 370,000 | 401,450 | ||||||
| Davita, Inc., 6.375%, 2018 | 745,000 | 762,694 | ||||||
| Issuer | Shares/Par | Value ($) | ||||||
| BONDS – continued | ||||||||
| Medical & Health Technology & Services – continued | ||||||||
| Davita, Inc., 6.625%, 2020 | $ | 335,000 | $ | 344,212 | ||||
| Emergency Medical Services Corp., 8.125%, 2019 (z) | 240,000 | 239,400 | ||||||
| Fresenius Medical Care AG & Co. KGaA, 9%, 2015 (n) | 720,000 | 807,300 | ||||||
| HCA, Inc., 8.5%, 2019 | 2,050,000 | 2,244,750 | ||||||
| HCA, Inc., 7.5%, 2022 | 485,000 | 495,912 | ||||||
| Health Management Associates, Inc., 7.375%, 2020 (n) | 310,000 | 322,400 | ||||||
| HealthSouth Corp., 8.125%, 2020 | 1,005,000 | 1,012,538 | ||||||
| Teleflex, Inc., 6.875%, 2019 | 340,000 | 354,450 | ||||||
| Tenet Healthcare Corp., 9.25%, 2015 | 425,000 | 446,781 | ||||||
| United Surgical Partners International, Inc., 8.875%, 2017 | 280,000 | 279,300 | ||||||
| United Surgical Partners International, Inc., 9.25%, 2017 (p) | 425,000 | 427,125 | ||||||
| Universal Health Services, Inc., 7%, 2018 | 515,000 | 534,312 | ||||||
| Universal Hospital Services, Inc., 8.5%, 2015 (p) | 870,000 | 878,700 | ||||||
| Universal Hospital Services, Inc., FRN, 4.12%, 2015 | 335,000 | 302,338 | ||||||
| Vanguard Health Systems, Inc., 0%, 2016 | 3,000 | 1,875 | ||||||
| Vanguard Health Systems, Inc., 8%, 2018 | 1,145,000 | 1,136,412 | ||||||
| VWR Funding, Inc., 10.25%, 2015 (p) | 366,192 | 378,093 | ||||||
|
| |||||||
| $ | 12,737,243 | |||||||
|
| |||||||
| Metals & Mining – 2.7% | ||||||||
| AK Steel Corp., 7.625%, 2020 | $ | 590,000 | $ | 554,600 | ||||
| Arch Coal, Inc., 7%, 2019 (n) | 655,000 | 668,100 | ||||||
| Arch Coal, Inc., 7.25%, 2020 | 350,000 | 357,875 | ||||||
| Cloud Peak Energy, Inc., 8.25%, 2017 | 1,065,000 | 1,134,225 | ||||||
| Cloud Peak Energy, Inc., 8.5%, 2019 | 995,000 | 1,074,600 | ||||||
| Consol Energy, Inc., 8%, 2017 | 555,000 | 607,725 | ||||||
| Consol Energy, Inc., 8.25%, 2020 | 370,000 | 408,850 | ||||||
| Fortescue Metals Group Ltd., 6.875%, 2018 (n) | 190,000 | 181,925 | ||||||
| Fortescue Metals Group Ltd., 8.25%, 2019 (n) | 545,000 | 554,538 | ||||||
| Peabody Energy Corp., 6%, 2018 (n) | 305,000 | 311,100 | ||||||
| Peabody Energy Corp., 6.25%, 2021 (n) | 305,000 | 315,675 | ||||||
|
| |||||||
| $ | 6,169,213 | |||||||
|
| |||||||
| Natural Gas – Distribution – 0.2% | ||||||||
| Ferrellgas LP/Ferrellgas Finance Corp., 6.5%, 2021 | $ | 390,000 | $ | 343,200 | ||||
|
| |||||||
| Natural Gas – Pipeline – 2.6% | ||||||||
| Atlas Pipeline Partners LP, 8.75%, 2018 | $ | 560,000 | $ | 588,000 | ||||
| Atlas Pipeline Partners LP/Finance Corp., 8.75%, 2018 (n) | 495,000 | 517,275 | ||||||
| Crosstex Energy, Inc., 8.875%, 2018 | 1,040,000 | 1,136,200 | ||||||
| El Paso Corp., 7%, 2017 | 660,000 | 723,130 | ||||||
| El Paso Corp., 7.75%, 2032 | 1,040,000 | 1,201,200 | ||||||
| Energy Transfer Equity LP, 7.5%, 2020 | 855,000 | 934,087 | ||||||
| Enterprise Products Partners LP, 8.375% to 2016, FRN to 2066 | 465,000 | 497,550 | ||||||
10
Table of Contents
MFS High Yield Portfolio
Portfolio of Investments – continued
| Issuer | Shares/Par | Value ($) | ||||||
| BONDS – continued | ||||||||
| Natural Gas – Pipeline – continued | ||||||||
| Enterprise Products Partners LP, 7.034% to 2018, FRN to 2068 | $ | 287,000 | $ | 298,480 | ||||
|
| |||||||
| $ | 5,895,922 | |||||||
|
| |||||||
| Network & Telecom – 2.5% | ||||||||
| CenturyLink, Inc., 7.6%, 2039 | $ | 216,000 | $ | 211,953 | ||||
| Cincinnati Bell, Inc., 8.25%, 2017 | 230,000 | 231,150 | ||||||
| Cincinnati Bell, Inc., 8.75%, 2018 | 975,000 | 905,531 | ||||||
| Citizens Communications Co., 9%, 2031 | 485,000 | 442,563 | ||||||
| Frontier Communications Corp., 8.25%, 2017 | 205,000 | 209,612 | ||||||
| Frontier Communications Corp., 8.125%, 2018 | 900,000 | 906,750 | ||||||
| Frontier Communications Corp., 8.5%, 2020 | 495,000 | 506,756 | ||||||
| Qwest Communications International, Inc., 7.125%, 2018 (n) | 1,075,000 | 1,118,000 | ||||||
| Windstream Corp., 8.125%, 2018 | 150,000 | 160,687 | ||||||
| Windstream Corp., 7.75%, 2020 | 755,000 | 780,481 | ||||||
| Windstream Corp., 7.75%, 2021 | 315,000 | 322,875 | ||||||
|
| |||||||
| $ | 5,796,358 | |||||||
|
| |||||||
| Oil Services – 1.2% | ||||||||
| Chesapeake Energy Corp., 6.625%, 2019 (n) | $ | 230,000 | $ | 239,200 | ||||
| Dresser-Rand Group, Inc., 6.5%, 2021 (z) | 130,000 | 132,925 | ||||||
| Edgen Murray Corp., 12.25%, 2015 | 460,000 | 414,000 | ||||||
| Expro Finance Luxembourg, 8.5%, 2016 (n) | 475,000 | 418,000 | ||||||
| McJunkin Red Man Holding Corp., 9.5%, 2016 | 375,000 | 380,625 | ||||||
| Pioneer Drilling Co., 9.875%, 2018 | 950,000 | 992,750 | ||||||
| Pioneer Drilling Co., 9.875%, 2018 (n) | 70,000 | 73,150 | ||||||
| Unit Corp., 6.625%, 2021 | 140,000 | 140,000 | ||||||
|
| |||||||
| $ | 2,790,650 | |||||||
|
| |||||||
| Other Banks & Diversified Financials – 1.5% | ||||||||
| Capital One Financial Corp., 10.25%, 2039 | $ | 975,000 | $ | 1,011,563 | ||||
| Groupe BPCE S.A., 12.5% to 2019, FRN to 2049 (n) | 545,000 | 491,961 | ||||||
| LBG Capital No.1 PLC, 7.875%, 2020 (n) | 705,000 | 534,390 | ||||||
| Santander UK PLC, 8.963% to 2030, FRN to 2049 | 1,534,000 | 1,380,600 | ||||||
|
| |||||||
| $ | 3,418,514 | |||||||
|
| |||||||
| Pharmaceuticals – 0.5% | ||||||||
| Capsugel FinanceCo. SCA, 9.875%, 2019 (n) | EUR | 375,000 | $ | 490,197 | ||||
| Endo Pharmaceuticals Holdings, Inc., 7%, 2019 | $ | 275,000 | 292,875 | |||||
| Valeant Pharmaceuticals International, Inc., 7%, 2020 (n) | 325,000 | 320,938 | ||||||
|
| |||||||
| $ | 1,104,010 | |||||||
|
| |||||||
| Issuer | Shares/Par | Value ($) | ||||||
| BONDS – continued | ||||||||
| Pollution Control – 0.3% | ||||||||
| WCA Waste Corp., 7.5%, 2019 (n) | $ | 650,000 | $ | 656,500 | ||||
|
| |||||||
| Printing & Publishing – 0.5% | ||||||||
| American Media, Inc., 13.5%, 2018 (z) | $ | 100,346 | $ | 81,280 | ||||
| Nielsen Finance LLC, 11.5%, 2016 | 286,000 | 327,470 | ||||||
| Nielsen Finance LLC, 7.75%, 2018 | 605,000 | 653,400 | ||||||
|
| |||||||
| $ | 1,062,150 | |||||||
|
| |||||||
| Railroad & Shipping – 0.3% | ||||||||
| Kansas City Southern de Mexico S.A. de C.V., 6.125%, 2021 | $ | 310,000 | $ | 318,525 | ||||
| Kansas City Southern Railway, 8%, 2015 | 270,000 | 286,538 | ||||||
|
| |||||||
| $ | 605,063 | |||||||
|
| |||||||
| Real Estate – 1.0% | ||||||||
| CB Richard Ellis Group, Inc., 11.625%, 2017 | $ | 290,000 | $ | 334,225 | ||||
| CNL Lifestyle Properties, Inc., REIT, 7.25%, 2019 | 325,000 | 300,625 | ||||||
| Entertainment Properties Trust, REIT, 7.75%, 2020 | 755,000 | 793,652 | ||||||
| Kennedy Wilson, Inc., 8.75%, 2019 (n) | 415,000 | 404,625 | ||||||
| MPT Operating Partnership LP, REIT, 6.875%, 2021 | 440,000 | 436,150 | ||||||
|
| |||||||
| $ | 2,269,277 | |||||||
|
| |||||||
| Retailers – 2.7% | ||||||||
| Academy Ltd., 9.25%, 2019 (n) | $ | 220,000 | $ | 217,250 | ||||
| Burlington Coat Factory Warehouse Corp., 10%, 2019 | 620,000 | 606,050 | ||||||
| J. Crew Group, Inc., 8.125%, 2019 | 555,000 | 530,025 | ||||||
| Limited Brands, Inc., 6.9%, 2017 | 550,000 | 592,625 | ||||||
| Limited Brands, Inc., 7%, 2020 | 205,000 | 221,912 | ||||||
| Limited Brands, Inc., 6.95%, 2033 | 320,000 | 296,800 | ||||||
| Neiman Marcus Group, Inc., 10.375%, 2015 | 605,000 | 628,450 | ||||||
| QVC, Inc., 7.375%, 2020 (n) | 390,000 | 416,325 | ||||||
| Rite Aid Corp., 9.375%, 2015 | 570,000 | 550,050 | ||||||
| Sally Beauty Holdings, Inc., 6.875%, 2019 (z) | 290,000 | 303,050 | ||||||
| Toys “R” Us Property Co. II LLC, 8.5%, 2017 | 249,000 | 257,715 | ||||||
| Toys “R” Us, Inc., 10.75%, 2017 | 1,050,000 | 1,148,437 | ||||||
| Yankee Aquisition Corp., 8.5%, 2015 | 160,000 | 161,600 | ||||||
| YCC Holdings LLC/Yankee Finance, Inc., 10.25%, 2016 (p) | 320,000 | 280,000 | ||||||
|
| |||||||
| $ | 6,210,289 | |||||||
|
| |||||||
| Specialty Chemicals – 0.1% | ||||||||
| Koppers, Inc., 7.875%, 2019 | $ | 260,000 | $ | 275,600 | ||||
|
| |||||||
| Specialty Stores – 0.5% | ||||||||
| Michaels Stores, Inc., 11.375%, 2016 | $ | 530,000 | $ | 561,747 | ||||
| Michaels Stores, Inc., 7.75%, 2018 | 540,000 | 545,400 | ||||||
|
| |||||||
| $ | 1,107,147 | |||||||
|
| |||||||
| Telecommunications – Wireless – 4.4% | ||||||||
| Clearwire Corp., 12%, 2015 (n) | $ | 670,000 | $ | 641,525 | ||||
| Cricket Communications, Inc., 7.75%, 2016 | 95,000 | 98,087 | ||||||
| Cricket Communications, Inc., 7.75%, 2020 | 635,000 | 555,625 | ||||||
| Crown Castle International Corp., 9%, 2015 | 825,000 | 894,094 | ||||||
11
Table of Contents
MFS High Yield Portfolio
Portfolio of Investments – continued
| Issuer | Shares/Par | Value ($) | ||||||
| BONDS – continued | ||||||||
| Telecommunications – Wireless – continued | ||||||||
| Crown Castle International Corp., 7.125%, 2019 | $ | 575,000 | $ | 621,000 | ||||
| Digicel Group Ltd., 12%, 2014 (n) | 140,000 | 156,800 | ||||||
| Digicel Group Ltd., 8.25%, 2017 (n) | 895,000 | 899,475 | ||||||
| Digicel Group Ltd., 10.5%, 2018 (n) | 280,000 | 281,400 | ||||||
| MetroPCS Wireless, Inc., 7.875%, 2018 | 450,000 | 456,187 | ||||||
| MetroPCS Wireless, Inc., 6.625%, 2020 | 155,000 | 144,537 | ||||||
| NII Holdings, Inc., 10%, 2016 | 675,000 | 766,125 | ||||||
| NII Holdings, Inc., 8.875%, 2019 | 65,000 | 68,412 | ||||||
| NII Holdings, Inc., 7.625%, 2021 | 485,000 | 481,362 | ||||||
| Sprint Capital Corp., 6.875%, 2028 | 530,000 | 378,288 | ||||||
| Sprint Nextel Corp., 6%, 2016 | 1,155,000 | 958,650 | ||||||
| Sprint Nextel Corp., 8.375%, 2017 | 675,000 | 604,969 | ||||||
| Sprint Nextel Corp., 9%, 2018 (n) | 310,000 | 325,500 | ||||||
| Wind Acquisition Finance S.A., 11.75%, 2017 (n) | 1,175,000 | 1,051,625 | ||||||
| Wind Acquisition Finance S.A., 7.25%, 2018 (n) | 755,000 | 687,050 | ||||||
|
| |||||||
| $ | 10,070,711 | |||||||
|
| |||||||
| Telephone Services – 0.4% | ||||||||
| Cogent Communications Group, Inc., 8.375%, 2018 (n) | $ | 320,000 | $ | 328,000 | ||||
| Level 3 Financing, Inc., 9.375%, 2019 | 585,000 | 610,594 | ||||||
|
| |||||||
| $ | 938,594 | |||||||
|
| |||||||
| Transportation – 0.1% | ||||||||
| Navios South American Logistics, Inc., 9.25%, 2019 (n) | $ | 332,000 | $ | 265,600 | ||||
|
| |||||||
| Transportation – Services – 2.2% | ||||||||
| ACL I Corp., 10.625%, 2016 (n)(p) | $ | 649,978 | $ | 497,730 | ||||
| Aguila American Resources Ltd., 7.875%, 2018 (n) | 460,000 | 446,200 | ||||||
| American Petroleum Tankers LLC, 10.25%, 2015 | 412,000 | 420,240 | ||||||
| Avis Budget Car Rental LLC , 9.75%, 2020 | 260,000 | 267,150 | ||||||
| Commercial Barge Line Co., 12.5%, 2017 | 1,370,000 | 1,476,175 | ||||||
| Hertz Corp., 7.5%, 2018 | 510,000 | 532,950 | ||||||
| Navios Maritime Acquisition Corp., 8.625%, 2017 | 790,000 | 572,750 | ||||||
| Navios Maritime Holdings, Inc., 8.875%, 2017 | 220,000 | 209,550 | ||||||
| Swift Services Holdings, Inc., 10%, 2018 | 680,000 | 715,700 | ||||||
|
| |||||||
| $ | 5,138,445 | |||||||
|
| |||||||
| Utilities – Electric Power – 4.9% | ||||||||
| AES Corp., 8%, 2017 | $ | 665,000 | $ | 731,500 | ||||
| Atlantic Power Corp., 9%, 2018 (z) | 260,000 | 260,650 | ||||||
| Calpine Corp., 8%, 2016 (n) | 625,000 | 675,000 | ||||||
| Calpine Corp., 7.875%, 2020 (n) | 840,000 | 905,100 | ||||||
| Covanta Holding Corp., 7.25%, 2020 | 835,000 | 877,718 | ||||||
| Dolphin Subsidiary ll, Inc., 7.25%, 2021 (n) | 495,000 | 534,600 | ||||||
| Edison Mission Energy, 7%, 2017 | 670,000 | 435,500 | ||||||
| EDP Finance B.V., 6%, 2018 (n) | 825,000 | 693,976 | ||||||
| Enel Finance International S.A., 6%, 2039 (n) | 250,000 | 201,212 | ||||||
| Energy Future Holdings Corp., 10%, 2020 | 950,000 | 997,500 | ||||||
| Issuer | Shares/Par | Value ($) | ||||||
| BONDS – continued | ||||||||
| Utilities – Electric Power – continued | ||||||||
| Energy Future Holdings Corp., 10%, 2020 | $ | 1,595,000 | $ | 1,682,725 | ||||
| GenOn Energy, Inc., 9.5%, 2018 | 325,000 | 329,062 | ||||||
| GenOn Energy, Inc., 9.875%, 2020 | 1,145,000 | 1,162,175 | ||||||
| NRG Energy, Inc., 7.375%, 2017 | 420,000 | 435,750 | ||||||
| NRG Energy, Inc., 8.25%, 2020 | 1,055,000 | 1,060,275 | ||||||
| Texas Competitive Electric Holdings Co. LLC, 11.5%, 2020 (n) | 340,000 | 288,575 | ||||||
|
| |||||||
| $ | 11,271,318 | |||||||
|
| |||||||
| Total Bonds (Identified Cost, $217,245,065) | $ | 211,891,682 | ||||||
|
| |||||||
| FLOATING RATE LOANS (g)(r) – 0.7% | ||||||||
| Aerospace – 0.2% | ||||||||
| Hawker Beechcraft Acquisition Co. LLC, Term Loan, 10.5%, 2014 | $ | 524,803 | $ | 406,722 | ||||
|
| |||||||
| Broadcasting – 0.0% | ||||||||
| Local TV Finance LLC, Term Loan B, 2.3%, 2013 | $ | 68,299 | $ | 65,673 | ||||
|
| |||||||
| Financial Institutions – 0.1% | ||||||||
| Springleaf Finance Corp., Term Loan, 5.5%, 2017 | $ | 326,932 | $ | 283,409 | ||||
|
| |||||||
| Oil Services – 0.3% | ||||||||
| Samson Investment Co., Bridge Term Loan, 2012 (o) | $ | 620,000 | $ | 620,000 | ||||
|
| |||||||
| Utilities – Electric Power – 0.1% | ||||||||
| Dynegy Holdings, Inc., CoalCo. Term Loan, 9.25%, 2016 | $ | 87,702 | $ | 88,184 | ||||
| Dynegy Holdings, Inc., GasCo. Term Loan, 9.25%, 2016 | 131,553 | 133,151 | ||||||
|
| |||||||
| $ | 221,335 | |||||||
|
| |||||||
| Total Floating Rate Loans (Identified Cost, $1,726,322) | $ | 1,597,139 | ||||||
|
| |||||||
| COMMON STOCKS – 0.4% | ||||||||
| Automotive – 0.1% | ||||||||
| Accuride Corp. (a) | 17,214 | $ | 122,564 | |||||
|
| |||||||
| Broadcasting – 0.2% | ||||||||
| New Young Broadcasting Holding Co., Inc. (a) | 186 | $ | 502,200 | |||||
|
| |||||||
| Printing & Publishing – 0.1% | ||||||||
| American Media Operations, Inc. (a) | 25,715 | $ | 305,751 | |||||
|
| |||||||
| Special Products & Services – 0.0% | ||||||||
| Mark IV Industries LLC, Common Units, “A” (a) | 776 | $ | 28,712 | |||||
|
| |||||||
| Total Common Stocks (Identified Cost, $2,158,610) | $ | 959,227 | ||||||
|
| |||||||
| CONVERTIBLE PREFERRED STOCKS – 0.2% | ||||||||
| Automotive – 0.2% | ||||||||
| General Motors Co., 4.75% (Identified Cost, $566,560) | 11,360 | $ | 389,080 | |||||
|
| |||||||
12
Table of Contents
MFS High Yield Portfolio
Portfolio of Investments – continued
| Issuer | Shares/Par | Value ($) | ||||||
| PREFERRED STOCKS – 0.7% | ||||||||
| Other Banks & Diversified Financials – 0.7% | ||||||||
| Ally Financial, Inc., 7% (n) | 363 | $ | 260,214 | |||||
| Ally Financial, Inc., “A”, 8.5% | 60,384 | 1,110,462 | ||||||
| GMAC Capital Trust I, 8.125% | 17,850 | 345,219 | ||||||
|
| |||||||
| Total Preferred Stocks (Identified Cost, $2,247,432) | $ | 1,715,895 | ||||||
|
| |||||||
| Strike Price | First Exercise | |||||||||||||||
| WARRANTS – 0.2% | ||||||||||||||||
| Broadcasting – 0.2% | ||||||||||||||||
| New Young Broadcasting Holding Co., Inc. (a) (1 share for 1 warrant) (Identified Cost, $277,697) | $ | 0.01 | 7/14/10 | 145 | $ | 391,500 | ||||||||||
|
| |||||||||||||||
| Issuer/Expiration Date/ Strike Price | Number of Contracts | Value ($) | ||||||
| PUT OPTIONS PURCHASED – 0.0% | ||||||||
| Market Index Securities – 0.0% | ||||||||
| S&P 500 Index – January 2012 @ $1,150 (Premiums Paid, $117,975) | 75 | $ | 22,875 | |||||
|
| |||||||
| Issuer | Shares/Par | |||||||
| MONEY MARKET FUNDS – 3.7% | ||||||||
| MFS Institutional Money Market Portfolio, 0.05%, at Cost and Net Asset Value (v) | 8,583,165 | $ | 8,583,165 | |||||
|
| |||||||
| Total Investments (Identified Cost, $232,922,826) | $ | 225,550,563 | ||||||
|
| |||||||
| OTHER ASSETS, LESS LIABILITIES – 1.6% | 3,622,450 | |||||||
|
| |||||||
| Net Assets – 100.0% | $ | 229,173,013 | ||||||
|
| |||||||
| (a) | Non-income producing security. |
| (d) | In default. Interest and/or scheduled principal payment(s) have been missed. |
| (g) | The rate shown represents a weighted average coupon rate on settled positions at period end, unless otherwise indicated. |
| (n) | Securities exempt from registration under Rule 144A of the Securities Act of 1933. These securities may be sold in the ordinary course of business in transactions exempt from registration, normally to qualified institutional buyers. At period end, the aggregate value of these securities was $56,764,181, representing 24.8% of net assets. |
| (o) | All or a portion of this position has not settled. Upon settlement date, interest rates for unsettled amounts will be determined. The rate shown represents the weighted average coupon rate for settled amounts. |
| (p) | Payment-in-kind security. |
| (r) | Remaining maturities of floating rate loans may be less than stated maturities shown as a result of contractual or optional prepayments by the borrower. Such prepayments cannot be predicted with certainty. These loans may be subject to restrictions on resale. Floating rate loans generally have rates of interest which are determined periodically by reference to a base lending rate plus a premium. |
| (v) | Underlying affiliated fund that is available only to investment companies managed by MFS. The rate quoted for the MFS Institutional Money Market Portfolio is the annualized seven-day yield of the fund at period end. |
| (z) | Restricted securities are not registered under the Securities Act of 1933 and are subject to legal restrictions on resale. These securities generally may be resold in transactions exempt from registration or to the public if the securities are subsequently registered. Disposal of these securities may involve time-consuming negotiations and prompt sale at an acceptable price may be difficult. The fund holds the following restricted securities: |
| Restricted Securities | Acquisition Date | Cost | Value | |||||||
| American Media, Inc., 13.5%, 2018 | 12/22/11 | $101,811 | $81,280 | |||||||
| Arbor Realty Mortgage Securities, CDO, FRN, 2.711%, 2038 | 12/20/05 | 568,229 | 73,870 | |||||||
| Arcap REIT, Inc., CDO, “H”, FRN, 6.013%, 2045 | 6/21/11 | 1,040 | 1 | |||||||
| Atlantic Power Corp., 9%, 2018 | 10/26/11 | 253,533 | 260,650 | |||||||
| CWCapital Cobalt Ltd., CDO, 6.23%, 2045 | 3/20/06 | 966,723 | 22,872 | |||||||
| CWCapital Cobalt Ltd., CDO, “F”, FRN, 1.72%, 2050 | 4/12/06 | 516,761 | 10,331 | |||||||
| Dematic S.A., 8.75%, 2016 | 4/19/11-10/21/11 | 740,178 | 730,750 | |||||||
| Dresser-Rand Group, Inc., 6.5%, 2021 | 12/14/11-12/20/11 | 132,594 | 132,925 | |||||||
| Dynacast International LLC, 9.25%, 2019 | 7/12/11-7/15/11 | 535,903 | 498,200 | |||||||
| Emergency Medical Services Corp., 8.125%, 2019 | 5/13/11 | 240,000 | 239,400 | |||||||
| Exopack Holding Corp., 10%, 2018 | 5/25/11 | 376,356 | 375,000 | |||||||
| G-Force LLC, CDO, “A2”, 4.83%, 2036 | 1/20/11 | 407,346 | 399,134 | |||||||
| Heckler & Koch GmbH, 9.5%, 2018 | 5/06/11-5/10/11 | 552,798 | 320,521 | |||||||
| LBI Media, Inc., 8.5%, 2017 | 7/18/07 | 731,953 | 407,925 | |||||||
| Local TV Finance LLC, 9.25%, 2015 | 11/28/07-2/16/11 | 1,099,933 | 1,066,913 | |||||||
| Millar Western Forest Products Ltd., 8.5%, 2021 | 7/27/11-8/15/11 | 119,092 | 110,200 | |||||||
| Packaging Dynamics Corp., 8.75%, 2016 | 1/25/11-2/01/11 | 273,616 | 270,000 | |||||||
13
Table of Contents
MFS High Yield Portfolio
Portfolio of Investments – continued
| Restricted Securities – continued | Acquisition Date | Cost | Value | |||||||
| Sally Beauty Holdings, Inc., 6.875%, 2019 | 11/03/11 | $290,000 | $303,050 | |||||||
| USI Holdings Corp., 9.75%, 2015 | 5/07/07-11/28/07 | 571,497 | 545,775 | |||||||
| Xerium Technologies, Inc., 8.875%, 2018 | 5/20/11 | 285,000 | 257,925 | |||||||
| Total Restricted Securities | $6,106,722 | |||||||||
| % of Net Assets | 2.7% | |||||||||
The following abbreviations are used in this report and are defined:
| CDO | Collateralized Debt Obligation |
| FRN | Floating Rate Note. Interest rate resets periodically and may not be the rate reported at period end. |
| PLC | Public Limited Company |
| REIT | Real Estate Investment Trust |
Abbreviations indicate amounts shown in currencies other than the U.S. dollar. All amounts are stated in U.S. dollars unless otherwise indicated. A list of abbreviations is shown below:
| EUR | Euro |
Derivative Contracts at 12/31/11
Forward Foreign Currency Exchange Contracts at 12/31/11
Type | Currency | Counterparty | Contracts to Deliver/Receive | Settlement Date Range | In Exchange For | Contracts at Value | Net Unrealized Appreciation (Depreciation) | |||||||||||||||||
| Asset Derivatives | ||||||||||||||||||||||||
| SELL | EUR | Barclays Bank PLC | 1,007,996 | 1/12/12 | $ | 1,362,154 | $ | 1,304,663 | $ | 57,491 | ||||||||||||||
| SELL | EUR | Credit Suisse Group | 1,190,671 | 1/12/12 | 1,616,166 | 1,541,102 | 75,064 | |||||||||||||||||
| SELL | EUR | JPMorgan Chase Bank N.A. | 353,772 | 1/12/12 | 474,377 | 457,892 | 16,485 | |||||||||||||||||
|
| |||||||||||||||||||||||
| $ | 149,040 | |||||||||||||||||||||||
|
| |||||||||||||||||||||||
| Liability Derivatives | ||||||||||||||||||||||||
| BUY | EUR | Barclays Bank PLC | 61,425 | 1/12/12 | $ | 83,559 | $ | 79,503 | $ | (4,056 | ) | |||||||||||||
| BUY | EUR | Goldman Sachs International | 269,161 | 1/12/12 | 363,735 | 348,379 | (15,356 | ) | ||||||||||||||||
| BUY | EUR | JPMorgan Chase Bank N.A. | 353,772 | 1/12/12 | 474,377 | 457,892 | (16,485 | ) | ||||||||||||||||
|
| |||||||||||||||||||||||
| $ | (35,897 | ) | ||||||||||||||||||||||
|
| |||||||||||||||||||||||
At December 31, 2011, the fund had sufficient cash and/or securities to cover any commitments under these derivative contracts.
See Notes to Financial Statements
14
Table of Contents
MFS High Yield Portfolio
FINANCIAL STATEMENTS | STATEMENT OF ASSETS AND LIABILITIES
This statement represents your fund’s balance sheet, which details the assets and liabilities comprising the total value of the fund.
At 12/31/11 | ||||||||
Assets | ||||||||
Investments – | ||||||||
Non-affiliated issuers, at value (identified cost, $224,339,661) | $216,967,398 | |||||||
Underlying affiliated funds, at cost and value | 8,583,165 | |||||||
Total investments, at value (identified cost, $232,922,826) | $225,550,563 | |||||||
Cash | 189,015 | |||||||
Receivables for | ||||||||
Forward foreign currency exchange contracts | 149,040 | |||||||
Investments sold | 74,436 | |||||||
Interest and dividends | 4,256,462 | |||||||
Other assets | 6,318 | |||||||
Total assets | $230,225,834 | |||||||
Liabilities | ||||||||
Payables for | ||||||||
Forward foreign currency exchange contracts | $35,897 | |||||||
Investments purchased | 723,960 | |||||||
Fund shares reacquired | 208,987 | |||||||
Payable to affiliates | ||||||||
Investment adviser | 13,810 | |||||||
Distribution and/or service fees | 1,712 | |||||||
Payable for Trustees’ compensation | 412 | |||||||
Accrued expenses and other liabilities | 68,043 | |||||||
Total liabilities | $1,052,821 | |||||||
Net assets | $229,173,013 | |||||||
Net assets consist of | ||||||||
Paid-in capital | $270,549,178 | |||||||
Unrealized appreciation (depreciation) on investments and translation of assets and liabilities in foreign currencies | (7,261,111 | ) | ||||||
Accumulated net realized gain (loss) on investments and foreign currency transactions | (49,022,354 | ) | ||||||
Undistributed net investment income | 14,907,300 | |||||||
Net assets | $229,173,013 | |||||||
Shares of beneficial interest outstanding | 40,774,347 |
| Net assets | Shares outstanding | Net asset value per share | ||||||||||
Initial Class | $145,772,898 | 25,841,964 | $5.64 | |||||||||
Service Class | 83,400,115 | 14,932,383 | 5.59 | |||||||||
See Notes to Financial Statements
15
Table of Contents
MFS High Yield Portfolio
FINANCIAL STATEMENTS | STATEMENT OF OPERATIONS
This statement describes how much your fund earned in investment income and accrued in expenses. It also describes any gains and/or losses generated by fund operations.
| Year ended 12/31/11 | ||||||||
Net investment income | ||||||||
Income | ||||||||
Interest | $16,232,003 | |||||||
Dividends | 138,354 | |||||||
Dividends from underlying affiliated funds | 5,519 | |||||||
Foreign taxes withheld | (787 | ) | ||||||
Total investment income | $16,375,089 | |||||||
Expenses | ||||||||
Management fee | $1,576,962 | |||||||
Distribution and/or service fees | 229,629 | |||||||
Administrative services fee | 70,613 | |||||||
Trustees’ compensation | 25,501 | |||||||
Custodian fee | 26,304 | |||||||
Shareholder communications | 23,952 | |||||||
Auditing fees | 62,837 | |||||||
Legal fees | 5,933 | |||||||
Miscellaneous | 24,723 | |||||||
Total expenses | $2,046,454 | |||||||
Fees paid indirectly | (149 | ) | ||||||
Reduction of expenses by investment adviser | (105,131 | ) | ||||||
Net expenses | $1,941,174 | |||||||
Net investment income | $14,433,915 | |||||||
Realized and unrealized gain (loss) on investments and foreign currency transactions | ||||||||
Realized gain (loss) (identified cost basis) | ||||||||
Investment transactions | $212,139 | |||||||
Futures contracts | (276,435 | ) | ||||||
Foreign currency transactions | 34,479 | |||||||
Net realized gain (loss) on investments and foreign currency transactions | $(29,817 | ) | ||||||
Change in unrealized appreciation (depreciation) | ||||||||
Investments | $(5,310,247 | ) | ||||||
Futures contracts | (55,842 | ) | ||||||
Translation of assets and liabilities in foreign currencies | 125,212 | |||||||
Net unrealized gain (loss) on investments and foreign currency translation | $(5,240,877 | ) | ||||||
Net realized and unrealized gain (loss) on investments and foreign currency | $(5,270,694 | ) | ||||||
Change in net assets from operations | $9,163,221 |
See Notes to Financial Statements
16
Table of Contents
MFS High Yield Portfolio
FINANCIAL STATEMENTS | STATEMENTS OF CHANGES IN NET ASSETS
These statements describe the increases and/or decreases in net assets resulting from operations, any distributions, and any shareholder transactions.
For years ended 12/31 | 2011 | 2010 | ||||||
Change in net assets | ||||||||
From operations | ||||||||
Net investment income | $14,433,915 | $16,163,547 | ||||||
Net realized gain (loss) on investments and foreign currency transactions | (29,817 | ) | 3,658,899 | |||||
Net unrealized gain (loss) on investments and foreign currency translation | (5,240,877 | ) | 11,527,282 | |||||
Change in net assets from operations | $9,163,221 | $31,349,728 | ||||||
Distributions declared to shareholders | ||||||||
From net investment income | $(17,370,717 | ) | $(20,660,022 | ) | ||||
Change in net assets from fund share transactions | $13,526,079 | $(16,468,998 | ) | |||||
Total change in net assets | $5,318,583 | $(5,779,292 | ) | |||||
Net assets | ||||||||
At beginning of period | 223,854,430 | 229,633,722 | ||||||
At end of period (including undistributed net investment income of $14,907,300 and | $229,173,013 | $223,854,430 |
See Notes to Financial Statements
17
Table of Contents
MFS High Yield Portfolio
FINANCIAL STATEMENTS | FINANCIAL HIGHLIGHTS
The financial highlights table is intended to help you understand the fund’s financial performance for the past 5 years. Certain information reflects financial results for a single fund share. The total returns in the table represent the rate by which an investor would have earned (or lost) on an investment in the fund share class (assuming reinvestment of all distributions) held for the entire period.
| Initial Class | Years ended 12/31 | |||||||||||||||||||
| 2011 | 2010 | 2009 | 2008 | 2007 | ||||||||||||||||
Net asset value, beginning of period | $5.96 | $5.67 | $4.25 | $6.56 | $6.93 | |||||||||||||||
| Income (loss) from investment operations | ||||||||||||||||||||
Net investment income (d) | $0.41 | $0.42 | $0.44 | $0.49 | $0.49 | |||||||||||||||
Net realized and unrealized gain (loss) on investments | (0.18 | ) | 0.42 | 1.49 | (2.26 | ) | (0.34 | ) | ||||||||||||
Total from investment operations | $0.23 | $0.84 | $1.93 | $(1.77 | ) | $0.15 | ||||||||||||||
| Less distributions declared to shareholders | ||||||||||||||||||||
From net investment income | $(0.55 | ) | $(0.55 | ) | $(0.51 | ) | $(0.54 | ) | $(0.52 | ) | ||||||||||
Net asset value, end of period (x) | $5.64 | $5.96 | $5.67 | $4.25 | $6.56 | |||||||||||||||
Total return (%) (k)(r)(s)(x) | 4.13 | 15.53 | 50.00 | (29.50 | ) | 1.93 | ||||||||||||||
| Ratios (%) (to average net assets) and Supplemental data: | ||||||||||||||||||||
Expenses before expense reductions (f) | 0.86 | 0.88 | 0.87 | 0.89 | 0.84 | |||||||||||||||
Expenses after expense reductions (f) | 0.81 | 0.83 | 0.82 | 0.84 | 0.79 | |||||||||||||||
Net investment income | 6.97 | 7.42 | 9.21 | 8.60 | 7.25 | |||||||||||||||
Portfolio turnover | 57 | 62 | 58 | 63 | 69 | |||||||||||||||
Net assets at end of period (000 omitted) | $145,773 | $122,666 | $121,416 | $96,605 | $175,408 | |||||||||||||||
| Service Class | Years ended 12/31 | |||||||||||||||||||
| 2011 | 2010 | 2009 | 2008 | 2007 | ||||||||||||||||
Net asset value, beginning of period | $5.91 | $5.63 | $4.21 | $6.50 | $6.88 | |||||||||||||||
| Income (loss) from investment operations | ||||||||||||||||||||
Net investment income (d) | $0.40 | $0.41 | $0.43 | $0.47 | $0.47 | |||||||||||||||
Net realized and unrealized gain (loss) on investments | (0.19 | ) | 0.40 | 1.49 | (2.24 | ) | (0.35 | ) | ||||||||||||
Total from investment operations | $0.21 | $0.81 | $1.92 | $(1.77 | ) | $0.12 | ||||||||||||||
| Less distributions declared to shareholders | ||||||||||||||||||||
From net investment income | $(0.53 | ) | $(0.53 | ) | $(0.50 | ) | $(0.52 | ) | $(0.50 | ) | ||||||||||
Net asset value, end of period (x) | $5.59 | $5.91 | $5.63 | $4.21 | $6.50 | |||||||||||||||
Total return (%) (k)(r)(s)(x) | 3.86 | 15.17 | 49.97 | (29.64 | ) | 1.56 | ||||||||||||||
| Ratios (%) (to average net assets) and Supplemental data: | �� | |||||||||||||||||||
Expenses before expense reductions (f) | 1.11 | 1.13 | 1.12 | 1.14 | 1.09 | |||||||||||||||
Expenses after expense reductions (f) | 1.06 | 1.08 | 1.07 | 1.09 | 1.04 | |||||||||||||||
Net investment income | 6.73 | 7.18 | 9.01 | 8.38 | 7.01 | |||||||||||||||
Portfolio turnover | 57 | 62 | 58 | 63 | 69 | |||||||||||||||
Net assets at end of period (000 omitted) | $83,400 | $101,189 | $108,217 | $103,169 | $149,162 | |||||||||||||||
| (d) | Per share data is based on average shares outstanding. |
| (f) | Ratios do not reflect reductions from fees paid indirectly, if applicable. |
| (k) | The total return does not reflect expenses that apply to separate accounts. Inclusion of these charges would reduce the total return figures for all periods shown. |
| (r) | Certain expenses have been reduced without which performance would have been lower. |
| (s) | From time to time the fund may receive proceeds from litigation settlements, without which performance would be lower. |
| (x) | The net asset values per share and total returns have been calculated on net assets which include adjustments made in accordance with U.S. generally accepted accounting principles required at period end for financial reporting purposes. |
See Notes to Financial Statements
18
Table of Contents
MFS High Yield Portfolio
| (1) | Business and Organization |
MFS High Yield Portfolio (the fund) is a series of MFS Variable Insurance Trust II (the trust). The trust is organized as a Massachusetts business trust and is registered under the Investment Company Act of 1940, as amended, as an open-end management investment company. The shareholders of each series of the trust are separate accounts of insurance companies, which offer variable annuity and/or life insurance products, and qualified retirement and pension plans.
| (2) | Significant Accounting Policies |
General – The preparation of financial statements in conformity with U.S. generally accepted accounting principles requires management to make estimates and assumptions that affect the reported amounts of assets and liabilities, and disclosure of contingent assets and liabilities at the date of the financial statements and the reported amounts of revenues and expenses during the reporting period. Actual results could differ from those estimates. In the preparation of these financial statements, management has evaluated subsequent events occurring after the date of the fund’s Statement of Assets and Liabilities through the date that the financial statements were issued. The fund invests in high-yield securities rated below investment grade. Investments in high-yield securities involve greater degrees of credit and market risk than investments in higher-rated securities and tend to be more sensitive to economic conditions. The fund invests in foreign securities. Investments in foreign securities are vulnerable to the effects of changes in the relative values of the local currency and the U.S. dollar and to the effects of changes in each country’s legal, political, and economic environment.
In December 2011, the Financial Accounting Standards Board issued Accounting Standards Update 2011-11, Balance Sheet (Topic 210) – Disclosures about Offsetting Assets and Liabilities (“ASU 2011-11”). Effective for annual reporting periods beginning on or after January 1, 2013 and interim periods within those annual periods, ASU 2011-11 is intended to enhance disclosure requirements on the offsetting of financial assets and liabilities. Although still evaluating the potential impacts of ASU 2011-11 to the fund, management expects that the impact of the fund’s adoption will be limited to additional financial statement disclosures.
Investment Valuations – Debt instruments and floating rate loans (other than short-term instruments), including restricted debt instruments, are generally valued at an evaluated or composite bid as provided by a third-party pricing service. Equity securities, including restricted equity securities, are generally valued at the last sale or official closing price as provided by a third-party pricing service on the market or exchange on which they are primarily traded. Equity securities, for which there were no sales reported that day, are generally valued at the last quoted daily bid quotation as provided by a third-party pricing service on the market or exchange on which such securities are primarily traded. Equity securities held short, for which there were no sales reported for that day, are generally valued at the last quoted daily ask quotation as provided by a third-party pricing service on the market or exchange on which such securities are primarily traded. Short-term instruments with a maturity at issuance of 60 days or less generally are valued at amortized cost, which approximates market value. Exchange-traded options are generally valued at the last sale or official closing price as provided by a third-party pricing service on the exchange on which such options are primarily traded. Exchange-traded options for which there were no sales reported that day are generally valued at the last daily bid quotation as provided by a third-party pricing service on the exchange on which such options are primarily traded. Options not traded on an exchange are generally valued at a broker/dealer bid quotation. Foreign currency options are generally valued at valuations provided by a third-party pricing service. Futures contracts are generally valued at last posted settlement price as provided by a third-party pricing service on the market on which they are primarily traded. Futures contracts for which there were no trades that day for a particular position are generally valued at the closing bid quotation as provided by a third-party pricing service on the market on which such futures contracts are primarily traded. Forward foreign currency exchange contracts are generally valued at the mean of bid and asked prices for the time period interpolated from rates provided by a third-party pricing service for proximate time periods. Open-end investment companies are generally valued at net asset value per share. Securities and other assets generally valued on the basis of information from a third-party pricing service may also be valued at a broker/dealer bid quotation. Values obtained from third-party pricing services can utilize both transaction data and market information such as yield, quality, coupon rate, maturity, type of issue, trading characteristics, and other market data. The values of foreign securities and other assets and liabilities expressed in foreign currencies are converted to U.S. dollars using the mean of bid and asked prices for rates provided by a third-party pricing service.
The Board of Trustees has delegated primary responsibility for determining or causing to be determined the value of the fund’s investments (including any fair valuation) to the adviser pursuant to valuation policies and procedures approved by the Board. If the adviser determines that reliable market quotations are not readily available, investments are valued at fair value as determined in good faith by the adviser in accordance with such procedures under the oversight of the Board of Trustees. Under the fund’s valuation policies and procedures, market quotations are not considered to be readily available for most types of debt instruments and floating rate loans and many types of derivatives. These investments are generally valued at fair value
19
Table of Contents
MFS High Yield Portfolio
Notes to Financial Statements – continued
based on information from third-party pricing services. In addition, investments may be valued at fair value if the adviser determines that an investment’s value has been materially affected by events occurring after the close of the exchange or market on which the investment is principally traded (such as foreign exchange or market) and prior to the determination of the fund’s net asset value, or after the halting of trading of a specific security where trading does not resume prior to the close of the exchange or market on which the security is principally traded. The adviser generally relies on third-party pricing services or other information (such as the correlation with price movements of similar securities in the same or other markets; the type, cost and investment characteristics of the security; the business and financial condition of the issuer; and trading and other market data) to assist in determining whether to fair value and at what value to fair value an investment. The value of an investment for purposes of calculating the fund’s net asset value can differ depending on the source and method used to determine value. When fair valuation is used, the value of an investment used to determine the fund’s net asset value may differ from quoted or published prices for the same investment. There can be no assurance that the fund could obtain the fair value assigned to an investment if it were to sell the investment at the same time at which the fund determines its net asset value per share.
Various inputs are used in determining the value of the fund’s assets or liabilities. These inputs are categorized into three broad levels. In certain cases, the inputs used to measure fair value may fall into different levels of the fair value hierarchy. In such cases, an investment’s level within the fair value hierarchy is based on the lowest level of input that is significant to the fair value measurement. The fund’s assessment of the significance of a particular input to the fair value measurement in its entirety requires judgment, and considers factors specific to the investment. Level 1 includes unadjusted quoted prices in active markets for identical assets or liabilities. Level 2 includes other significant observable market-based inputs (including quoted prices for similar securities, interest rates, prepayment speed, and credit risk). Level 3 includes unobservable inputs, which may include the adviser’s own assumptions in determining the fair value of investments. Other financial instruments are derivative instruments not reflected in total investments, such as forward foreign currency exchange contracts. The following is a summary of the levels used as of December 31, 2011 in valuing the fund’s assets or liabilities:
| Investments at Value | Level 1 | Level 2 | Level 3 | Total | ||||||||||||
| Equity Securities | $1,990,200 | $1,182,626 | $305,751 | $3,478,577 | ||||||||||||
| Corporate Bonds | — | 181,513,649 | — | 181,513,649 | ||||||||||||
| Commercial Mortgage-Backed Securities | — | 1,388,601 | — | 1,388,601 | ||||||||||||
| Asset-Backed Securities (including CDOs) | — | 514,753 | — | 514,753 | ||||||||||||
| Foreign Bonds | — | 28,474,679 | — | 28,474,679 | ||||||||||||
| Floating Rate Loans | — | 1,597,139 | — | 1,597,139 | ||||||||||||
| Mutual Funds | 8,583,165 | — | — | 8,583,165 | ||||||||||||
| Total Investments | $10,573,365 | $214,671,447 | $305,751 | $225,550,563 | ||||||||||||
| Other Financial Instruments | ||||||||||||||||
| Forward Foreign Currency Exchange Contracts | $— | $113,143 | $— | $113,143 | ||||||||||||
For further information regarding security characteristics, see the Portfolio of Investments.
The following is a reconciliation of level 3 assets for which significant unobservable inputs were used to determine fair value. The fund’s policy is to recognize transfers between the levels as of the end of the period. The table presents the activity of level 3 securities held at the beginning and the end of the period.
| Equity Securities | Asset-Backed Securities | Corporate Bonds | Total | |||||||||||||
| Balance as of 12/31/10 | $0 | $315,599 | $87,231 | $402,830 | ||||||||||||
Realized gain (loss) | — | (534,970 | ) | (307,954 | ) | (842,924 | ) | |||||||||
Change in unrealized appreciation (depreciation) | — | 385,621 | 302,003 | 687,624 | ||||||||||||
Sales | 0 | (166,250 | ) | 0 | (166,250 | ) | ||||||||||
Transfers into level 3 | 261,604 | — | — | 261,604 | ||||||||||||
Transfers out of level 3 | — | — | (81,280 | ) | (81,280 | ) | ||||||||||
Acquired in merger | 44,147 | — | — | 44,147 | ||||||||||||
| Balance as of 12/31/11 | $305,751 | $— | $— | $305,751 | ||||||||||||
The net change in unrealized appreciation (depreciation) from investments held as level 3 at December 31, 2011 is $0.
Foreign Currency Translation – Purchases and sales of foreign investments, income, and expenses are converted into U.S. dollars based upon currency exchange rates prevailing on the respective dates of such transactions or on the reporting date for foreign denominated receivables and payables. Gains and losses attributable to foreign currency exchange rates on sales of securities are recorded for financial statement purposes as net realized gains and losses on investments. Gains and losses
20
Table of Contents
MFS High Yield Portfolio
Notes to Financial Statements – continued
attributable to foreign exchange rate movements on receivables, payables, income and expenses are recorded for financial statement purposes as foreign currency transaction gains and losses. That portion of both realized and unrealized gains and losses on investments that results from fluctuations in foreign currency exchange rates is not separately disclosed.
Derivatives – The fund uses derivatives for different purposes, primarily to increase or decrease exposure to a particular market or segment of the market, or security, to increase or decrease interest rate or currency exposure, or as alternatives to direct investments. Derivatives are used for hedging or non-hedging purposes. While hedging can reduce or eliminate losses, it can also reduce or eliminate gains. When the fund uses derivatives as an investment to increase market exposure, or for hedging purposes, gains and losses from derivative instruments may be substantially greater than the derivative’s original cost.
The derivative instruments used by the fund were purchased options, futures contracts, and forward foreign currency exchange contracts. The fund’s period end derivatives, as presented in the Portfolio of Investments and the associated Derivative Contract Tables, generally are indicative of the volume of its derivative activity during the period.
The following table presents, by major type of derivative contract, the fair value, on a gross basis, of the asset and liability components of derivatives held by the fund at December 31, 2011 as reported in the Statement of Assets and Liabilities:
| Fair Value (a) | ||||||||||
| Risk | Derivative Contracts | Asset Derivatives | Liability Derivatives | |||||||
| Foreign Exchange | Forward Foreign Currency Exchange | $149,040 | $(35,897 | ) | ||||||
| Equity | Purchased Equity Options | 22,875 | — | |||||||
| Total | $171,915 | $(35,897 | ) | |||||||
| (a) | The value of purchased options outstanding is included in total investments, at value, within the fund’s Statement of Assets and Liabilities. |
The following table presents, by major type of derivative contract, the realized gain (loss) on derivatives held by the fund for the year ended December 31, 2011 as reported in the Statement of Operations:
| Risk | Futures Contracts | Foreign Currency Transactions | Investment Transactions (Purchased Options) | |||||||||
| Interest Rate | $(276,435 | ) | $— | $— | ||||||||
| Foreign Exchange | — | �� | 37,252 | — | ||||||||
| Equity | — | — | 200,854 | |||||||||
| Total | $(276,435 | ) | $37,252 | $200,854 | ||||||||
The following table presents, by major type of derivative contract, the change in unrealized appreciation (depreciation) on derivatives held by the fund for the year ended December 31, 2011 as reported in the Statement of Operations:
| Risk | Futures Contracts | Translation of Assets and Liabilities in Foreign Currencies | Investments (Purchased Options) | |||||||||
| Interest Rate | $(55,842 | ) | $— | $— | ||||||||
| Foreign Exchange | — | 127,268 | — | |||||||||
| Equity | — | — | (212,714 | ) | ||||||||
| Total | $(55,842 | ) | $127,268 | $(212,714 | ) | |||||||
Derivative counterparty credit risk is managed through formal evaluation of the creditworthiness of all potential counterparties. On certain over-the-counter derivatives, the fund attempts to reduce its exposure to counterparty credit risk whenever possible by entering into an International Swaps and Derivatives Association (ISDA) Master Agreement on a bilateral basis with each of the counterparties with whom it undertakes a significant volume of transactions. The ISDA Master Agreement gives each party to the agreement the right to terminate all transactions traded under such agreement if there is a certain deterioration in the credit quality of the other party. The ISDA Master Agreement gives the fund the right, upon an event of default by the applicable counterparty or a termination of the agreement, to close out all transactions traded under such agreement and to net amounts owed under each transaction to one net amount payable by one party to the other. This right to close out and net payments across all transactions traded under the ISDA Master Agreement could result in a reduction of the fund’s credit risk to such counterparty equal to any amounts payable by the fund under the applicable transactions, if any. However, absent an event of default by the counterparty or a termination of the agreement, the ISDA Master Agreement does not result in an offset of reported amounts of assets and liabilities in the Statement of Assets and Liabilities across transactions between the fund and the applicable counterparty.
21
Table of Contents
MFS High Yield Portfolio
Notes to Financial Statements – continued
Collateral requirements differ by type of derivative. Collateral or margin requirements are set by the broker or exchange clearing house for exchange traded derivatives (i.e., futures and exchange-traded options) while collateral terms are contract specific for over-the-counter traded derivatives (i.e., forward foreign currency exchange contracts, swaps and over-the-counter options). For derivatives traded under an ISDA Master Agreement, the collateral requirements are netted across all transactions traded under such agreement and one amount is posted from one party to the other to collateralize such obligations. Cash collateral that has been pledged to cover obligations of the fund under derivative contracts, if any, will be reported separately on the Statement of Assets and Liabilities as restricted cash. Securities collateral pledged for the same purpose, if any, is noted in the Portfolio of Investments.
Purchased Options – The fund purchased call and put options for a premium. Purchased call and put options entitle the holder to buy and sell a specified number of shares or units of a particular security, currency or index at a specified price at a specified date or within a specified period of time. Purchasing call options may be used to hedge against an anticipated increase in the dollar cost of securities or currency to be acquired or to increase the fund’s exposure to an underlying instrument. Purchasing put options may hedge against a decline in the value of portfolio securities or currency.
The premium paid is initially recorded as an investment in the Statement of Assets and Liabilities. That investment is subsequently marked-to-market daily with the difference between the premium paid and the market value of the purchased option being recorded as unrealized appreciation or depreciation. Premiums paid for purchased call and put options which have expired are treated as realized losses on investments in the Statement of Operations. Upon the exercise or closing of a purchased call option, the premium paid is added to the cost of the security or financial instrument. Upon the exercise or closing of a purchased put option, the premium paid is offset against the proceeds on the sale of the underlying security or financial instrument in order to determine the realized gain or loss on investments.
The risk in purchasing an option is that the fund pays a premium whether or not the option is exercised. The fund’s maximum risk of loss due to counterparty credit risk is limited to the market value of the option. For over-the-counter options, this risk is mitigated in cases where there is an ISDA Master Agreement between the fund and the counterparty providing for netting as described above and for posting of collateral by the counterparty to the fund to cover the fund’s exposure to the counterparty under such ISDA Master Agreement.
Futures Contracts – The fund entered into futures contracts which may be used to hedge against or obtain broad market, interest rate, duration, or currency exposure. A futures contract represents a commitment for the future purchase or sale of an asset at a specified price on a specified date.
Upon entering into a futures contract, the fund is required to deposit with the broker, either in cash or securities, an initial margin in an amount equal to a certain percentage of the notional amount of the contract. Subsequent payments (variation margin) are made or received by the fund each day, depending on the daily fluctuations in the value of the contract, and are recorded for financial statement purposes as unrealized gain or loss by the fund until the contract is closed or expires at which point the gain or loss on futures is realized.
The fund bears the risk of interest rates, exchange rates or securities prices moving unexpectedly, in which case, the fund may not achieve the anticipated benefits of the futures contracts and may realize a loss. While futures may present less counterparty risk to the fund since the contracts are exchange traded and the exchange’s clearinghouse guarantees payments to the broker, there is still counterparty credit risk due to the insolvency of the broker. The fund’s maximum risk of loss due to counterparty credit risk is equal to the margin posted by the fund to the broker plus any gains or minus any losses on the outstanding futures contracts.
Forward Foreign Currency Exchange Contracts – The fund entered into forward foreign currency exchange contracts for the purchase or sale of a specific foreign currency at a fixed price on a future date. These contracts may be used to hedge the fund’s currency risk or for non-hedging purposes. For hedging purposes, the fund may enter into contracts to deliver or receive foreign currency that the fund will receive from or use in its normal investment activities. The fund may also use contracts to hedge against declines in the value of foreign currency denominated securities due to unfavorable exchange rate movements. For non-hedging purposes, the fund may enter into contracts with the intent of changing the relative exposure of the fund’s portfolio of securities to different currencies to take advantage of anticipated exchange rate changes.
Forward foreign currency exchange contracts are adjusted by the daily exchange rate of the underlying currency and any unrealized gains or losses are recorded as a receivable or payable for forward foreign currency exchange contracts until the contract settlement date. On contract settlement date, any gain or loss on the contract is recorded as realized gains or losses on foreign currency transactions.
22
Table of Contents
MFS High Yield Portfolio
Notes to Financial Statements – continued
Risks may arise upon entering into these contracts from unanticipated movements in the value of the contract and from the potential inability of counterparties to meet the terms of their contracts. Generally, the fund’s maximum risk due to counterparty credit risk is the unrealized gain on the contract due to the use of Continuous Linked Settlement, an industry accepted settlement system. This risk is mitigated in cases where there is an ISDA Master Agreement between the fund and the counterparty providing for netting as described above and for posting of collateral by the counterparty to the fund to cover the fund’s exposure to the counterparty under such ISDA Master Agreement.
Loans and Other Direct Debt Instruments – The fund invests in loans and loan participations or other receivables. These investments may include standby financing commitments, including revolving credit facilities, which obligate the fund to supply additional cash to the borrower on demand. Loan participations involve a risk of insolvency of the lending bank or other financial intermediary.
Indemnifications – Under the fund’s organizational documents, its officers and Trustees may be indemnified against certain liabilities and expenses arising out of the performance of their duties to the fund. Additionally, in the normal course of business, the fund enters into agreements with service providers that may contain indemnification clauses. The fund’s maximum exposure under these agreements is unknown as this would involve future claims that may be made against the fund that have not yet occurred.
Investment Transactions and Income – Investment transactions are recorded on the trade date. Interest income is recorded on the accrual basis. All premium and discount is amortized or accreted for financial statement purposes in accordance with U.S. generally accepted accounting principles. The fund earns certain fees in connection with its floating rate loan purchasing activities. These fees are in addition to interest payments earned and may include amendment fees, commitment fees, facility fees, consent fees, and prepayment fees. Commitment fees are recorded on an accrual basis as income in the accompanying financial statements. Dividends received in cash are recorded on the ex-dividend date. Certain dividends from foreign securities will be recorded when the fund is informed of the dividend if such information is obtained subsequent to the ex-dividend date. Dividend and interest payments received in additional securities are recorded on the ex-dividend or ex-interest date in an amount equal to the value of the security on such date. Debt obligations may be placed on non-accrual status or set to accrue at a rate of interest less than the contractual coupon when the collection of all or a portion of interest has become doubtful. Interest income for those debt obligations may be further reduced by the write-off of the related interest receivables when deemed uncollectible.
The fund may receive proceeds from litigation settlements. Any proceeds received from litigation involving portfolio holdings are reflected in the Statement of Operations in realized gain/loss if the security has been disposed of by the fund or in unrealized gain/loss if the security is still held by the fund. Any other proceeds from litigation not related to portfolio holdings are reflected as other income in the Statement of Operations.
Fees Paid Indirectly – The fund’s custody fee may be reduced according to an arrangement that measures the value of cash deposited with the custodian by the fund. This amount, for the year ended December 31, 2011, is shown as a reduction of total expenses on the Statement of Operations.
Tax Matters and Distributions – The fund intends to qualify as a regulated investment company, as defined under Subchapter M of the Internal Revenue Code, and to distribute all of its taxable income, including realized capital gains. As a result, no provision for federal income tax is required. The fund’s federal tax returns for the prior three fiscal years remain subject to examination by the Internal Revenue Service. Foreign taxes have been accrued by the fund in the accompanying financial statements.
Distributions to shareholders are recorded on the ex-dividend date. Income and capital gain distributions are determined in accordance with income tax regulations, which may differ from U.S. generally accepted accounting principles. Certain capital accounts in the financial statements are periodically adjusted for permanent differences in order to reflect their tax character. These adjustments have no impact on net assets or net asset value per share. Temporary differences which arise from recognizing certain items of income, expense, gain or loss in different periods for financial statement and tax purposes will reverse at some time in the future. Distributions in excess of net investment income or net realized gains are temporary overdistributions for financial statement purposes resulting from differences in the recognition or classification of income or distributions for financial statement and tax purposes.
Book/tax differences primarily relate to amortization and accretion of debt securities.
The tax character of distributions declared to shareholders for the last two fiscal years is as follows:
| 12/31/11 | 12/31/10 | |||||||
| Ordinary income (including any short-term capital gains) | $17,370,717 | $20,660,022 | ||||||
23
Table of Contents
MFS High Yield Portfolio
Notes to Financial Statements – continued
The federal tax cost and the tax basis components of distributable earnings were as follows:
| As of 12/31/11 | ||||
| Cost of investments | $234,034,828 | |||
| Gross appreciation | 6,219,937 | |||
| Gross depreciation | (14,704,202 | ) | ||
| Net unrealized appreciation (depreciation) | $(8,484,265 | ) | ||
| Undistributed ordinary income | 15,107,524 | |||
| Capital loss carryforwards | (48,005,452 | ) | ||
| Other temporary differences | 6,028 |
Under the Regulated Investment Company Modernization Act of 2010 (the “Act”), net capital losses recognized after December 31, 2010 may be carried forward indefinitely, and their character is retained as short-term and/or long-term losses. Previously, net capital losses were carried forward for eight years and treated as short-term losses. As a transition rule, the Act requires that post-enactment net capital losses be used before pre-enactment net capital losses.
As of December 31, 2011, the fund had capital loss carryforwards available to offset future realized gains. Such losses expire as follows:
| Pre-enactment losses: | ||||
| 12/31/13 | $(5,089,839 | ) | ||
| 12/31/14 | (7,011,353 | ) | ||
| 12/31/16 | (23,243,372 | ) | ||
| 12/31/17 | (11,194,472 | ) | ||
| Total | $(46,539,036 | ) | ||
| Post-enactment losses: | ||||
| Long-Term | $(1,466,416 | ) |
Multiple Classes of Shares of Beneficial Interest – The fund offers multiple classes of shares, which differ in their respective distribution and/or service fees. The fund’s income, realized and unrealized gain (loss), and common expenses are allocated to shareholders based on the daily net assets of each class. Dividends are declared separately for each class. Differences in per share dividend rates are generally due to differences in separate class expenses. The fund’s distributions declared to shareholders as reported on the Statements of Changes in Net Assets are presented by class as follows:
| From net investment income | ||||||||
| Year ended 12/31/11 | Year ended 12/31/10 | |||||||
| Initial Class | $9,741,063 | $11,086,633 | ||||||
| Service Class | 7,629,654 | 9,573,389 | ||||||
| Total | $17,370,717 | $20,660,022 | ||||||
| (3) | Transactions with Affiliates |
Investment Adviser – The fund has an investment advisory agreement with MFS to provide overall investment management and related administrative services and facilities to the fund. The management fee is computed daily and paid monthly at an annual rate of 0.75% of the fund’s average daily net assets. The investment adviser has agreed in writing to reduce its management fee to 0.70% for the first $1 billion of average daily net assets and 0.65% of average daily net assets in excess of $1 billion. This written agreement terminated on December 31, 2011. This management fee reduction amounted to $105,131, which is shown as a reduction of total expenses in the Statement of Operations. The management fee incurred for the year ended December 31, 2011 was equivalent to an annual effective rate of 0.70% of the fund’s average daily net assets.
On December 1, 2011, shareholders of the fund approved a new investment advisory agreement between the trust, on behalf of the fund, and MFS. This new investment advisory agreement provides that effective January 1, 2012, the management fee is computed daily and paid monthly at the following annual rates:
| First $1 billion of average daily net assets | 0.70% | |||
| Average daily net assets in excess of $1 billion | 0.65% |
The investment adviser has agreed in writing to pay a portion of the fund’s total annual operating expenses, exclusive of interest, taxes, extraordinary expenses, and brokerage commissions, such that total annual fund operating expenses do not exceed 1.25% of the fund’s average daily net assets. MFS’ agreement to limit the fund’s total annual operating expenses is contained in the investment advisory agreement between MFS and the fund. This agreement terminated on December 31, 2011
24
Table of Contents
MFS High Yield Portfolio
Notes to Financial Statements – continued
in connection with shareholder approval of the new investment advisory agreement. In addition, the investment adviser has voluntarily agreed to pay a portion of the fund’s total annual operating expenses, exclusive of interest, taxes, extraordinary expenses, and brokerage commissions, such that total annual operating expenses do not exceed 1.00% of the fund’s average daily net assets attributable to Initial Class shares. This voluntary agreement also terminated on December 31, 2011. For the year ended December 31, 2011, the fund’s actual operating expenses did not exceed the limit and therefore, the investment adviser did not pay any portion of the fund’s expenses related to this agreement.
Distributor – MFS Fund Distributors, Inc. (MFD), a wholly-owned subsidiary of MFS, is the distributor of shares of the fund. The Trustees have adopted a distribution plan for the Service Class shares pursuant to Rule 12b-1 under the Investment Company Act of 1940.
The fund’s distribution plan provides that the fund will pay MFD distribution and/or service fees equal to 0.25% per annum of its average daily net assets attributable to Service Class shares as partial consideration for services performed and expenses incurred by MFD and financial intermediaries (including participating insurance companies that invest in the fund to fund variable annuity and variable life insurance contracts, sponsors of qualified retirement and pension plans that invest in the fund, and affiliates of these participating insurance companies and plan sponsors) in connection with the sale and distribution of the Service Class shares. MFD may subsequently pay all, or a portion, of the distribution and/or service fees to financial intermediaries.
Shareholder Servicing Agent – MFS Service Center, Inc. (MFSC), a wholly-owned subsidiary of MFS, has contracted to provide transfer agent and recordkeeping functions in connection with the issuance, transfer, and redemption of each class of shares of the fund under a Shareholder Servicing Agent Agreement. During the year ended December 31, 2011, the fund did not pay MFSC a fee for this service.
Administrator – MFS provides certain financial, legal, shareholder communications, compliance, and other administrative services to the fund. Under an administrative services agreement, the fund partially reimburses MFS the costs incurred to provide these services. The fund is charged an annual fixed amount of $17,500 plus a fee based on average daily net assets. The administrative services fee incurred for the year ended December 31, 2011 was equivalent to an annual effective rate of 0.0336% of the fund’s average daily net assets.
Trustees’ and Officers’ Compensation – The fund pays compensation to Trustees in the form of a retainer, attendance fees, and additional compensation to the Board chairperson. The fund does not pay compensation directly to officers of the fund who are also officers of the investment adviser, all of whom receive remuneration for their services to the fund from MFS. Certain officers of the fund are officers or directors of MFS, MFD, and MFSC.
Other – This fund and certain other funds managed by MFS (the funds) have entered into services agreements (the Agreements) which provide for payment of fees by the funds to Tarantino LLC and Griffin Compliance LLC in return for the provision of services of an Independent Chief Compliance Officer (ICCO) and Assistant ICCO, respectively, for the funds. The ICCO and Assistant ICCO are officers of the funds and the sole members of Tarantino LLC and Griffin Compliance LLC, respectively. The funds can terminate the Agreements with Tarantino LLC and Griffin Compliance LLC at any time under the terms of the Agreements. MFS has agreed to bear all expenses associated with office space, other administrative support, and supplies provided to the ICCO and Assistant ICCO. For the year ended December 31, 2011, the aggregate fees paid by the fund to Tarantino LLC and Griffin Compliance LLC were $3,447 and are included in miscellaneous expense on the Statement of Operations.
The fund invests in the MFS Institutional Money Market Portfolio which is managed by MFS and seeks a high level of current income consistent with preservation of capital and liquidity. Income earned on this investment is included in dividends from underlying affiliated funds on the Statement of Operations. This money market fund does not pay a management fee to MFS.
| (4) | Portfolio Securities |
Purchases and sales of investments, other than U.S. Government securities, purchased option transactions, and short-term obligations, aggregated $114,489,702 and $140,916,784, respectively. Purchases exclude the value of securities acquired in connection with the High Yield Variable Account merger. (See Note 8.)
| (5) | Shares of Beneficial Interest |
The fund’s Declaration of Trust permits the Trustees to issue an unlimited number of full and fractional shares of beneficial interest. Transactions in fund shares were as follows:
| Year ended 12/31/11 | Year ended 12/31/10 | |||||||||||||||
| Shares | Amount | Shares | Amount | |||||||||||||
| Shares sold | ||||||||||||||||
Initial Class | 2,391,503 | $13,890,676 | 3,370,209 | $19,314,937 | ||||||||||||
Service Class | 915,930 | 5,120,442 | 2,073,739 | 11,938,579 | ||||||||||||
| 3,307,433 | $19,011,118 | 5,443,948 | $31,253,516 | |||||||||||||
25
Table of Contents
MFS High Yield Portfolio
Notes to Financial Statements – continued
| Year ended 12/31/11 | Year ended 12/31/10 | |||||||||||||||
| Shares | Amount | Shares | Amount | |||||||||||||
| Shares issued in connection with acquisition of High Yield Variable Account | ||||||||||||||||
Initial Class | 6,689,850 | $37,062,971 | ||||||||||||||
| Shares issued to shareholders in reinvestment of distributions | ||||||||||||||||
Initial Class | 1,774,328 | $9,741,063 | 2,012,093 | $11,086,633 | ||||||||||||
Service Class | 1,402,510 | 7,629,654 | 1,750,163 | 9,573,389 | ||||||||||||
| 3,176,838 | $17,370,717 | 3,762,256 | $20,660,022 | |||||||||||||
| Shares reacquired | ||||||||||||||||
Initial Class | (5,578,901 | ) | $(33,317,490 | ) | (6,217,269 | ) | $(35,131,534 | ) | ||||||||
Service Class | (4,510,215 | ) | (26,601,237 | ) | (5,938,351 | ) | (33,251,002 | ) | ||||||||
| (10,089,116 | ) | $(59,918,727 | ) | (12,155,620 | ) | $(68,382,536 | ) | |||||||||
| Net change | ||||||||||||||||
Initial Class | 5,276,780 | $27,377,220 | (834,967 | ) | $(4,729,964 | ) | ||||||||||
Service Class | (2,191,775 | ) | (13,851,141 | ) | (2,114,449 | ) | (11,739,034 | ) | ||||||||
| 3,085,005 | $13,526,079 | (2,949,416 | ) | $(16,468,998 | ) | |||||||||||
| (6) | Line of Credit |
The fund and certain other funds managed by MFS participate in a $1.1 billion unsecured committed line of credit, subject to a $1 billion sublimit, provided by a syndication of banks under a credit agreement. Borrowings may be made for temporary financing needs. Interest is charged to each fund, based on its borrowings, generally at a rate equal to the higher of the Federal Reserve funds rate or one month LIBOR plus an agreed upon spread. A commitment fee, based on the average daily, unused portion of the committed line of credit, is allocated among the participating funds at the end of each calendar quarter. In addition, the fund and other funds managed by MFS have established unsecured uncommitted borrowing arrangements with certain banks for temporary financing needs. Interest is charged to each fund, based on its borrowings, at a rate equal to the Federal Reserve funds rate plus an agreed upon spread. For the year ended December 31, 2011, the fund’s commitment fee and interest expense were $1,610 and $0, respectively, and are included in miscellaneous expense on the Statement of Operations.
| (7) | Transactions in Underlying Affiliated Funds – Affiliated Issuers |
An affiliated issuer may be considered one in which the fund owns 5% or more of the outstanding voting securities, or a company which is under common control. For the purposes of this report, the fund assumes the following to be affiliated issuers:
| Underlying Affiliated Funds | Beginning Shares/Par Amount | Acquisitions Shares/Par Amount | Dispositions Shares/Par Amount | Ending Shares/Par Amount | ||||||||||||
| MFS Institutional Money Market Portfolio | 4,748,268 | 75,962,879 | (72,127,982 | ) | 8,583,165 | |||||||||||
| Underlying Affiliated Funds | Realized Gain (Loss) | Capital Gain Distributions | Dividend Income | Ending Value | ||||||||||||
| MFS Institutional Money Market Portfolio | $— | $— | $5,519 | $8,583,165 | ||||||||||||
| (8) | Acquisitions |
At the close of business on December 2, 2011, the fund with net assets of $189,041,440, acquired all of the investment-related assets and liabilities of High Yield Variable Account. The acquisition was part of a transaction in which the High Yield Variable Account was converted into a unit investment trust (“UIT”) that invests in the fund (the acquisition of the Account’s assets and liabilities and subsequent conversion into a UIT hereinafter referred to as the “Reorganization”). The Reorganization provided the contract owners of the High Yield Variable Account with the opportunity to participate in a larger combined portfolio with an identical investment objective and similar investment policies and strategies. The acquisition was accomplished by a tax-free exchange of 6,689,850 shares of the fund (valued at $37,062,971) for all of the investment-related assets and liabilities of High Yield Variable Account. High Yield Variable Account’s net assets on that date were $37,062,971, including investments valued at $36,182,636 with a cost basis of $37,558,906. For financial reporting purposes, assets received and shares issued by the fund were recorded at fair value; however, the cost basis of the investments received from High Yield Variable Account were carried forward to align ongoing reporting of the fund’s realized and unrealized gains and losses with amounts distributable to shareholders for tax purposes. Because the combined investment portfolios have been managed as a single integrated portfolio since the acquisition was completed, it is not practicable to separate the amounts of revenue and earnings of High Yield Variable Account that have been included in MFS High Yield Portfolio’s Statement of Operations since December 2, 2011.
26
Table of Contents
MFS High Yield Portfolio
Notes to Financial Statements – continued
Assuming the acquisition had been completed on January 1, 2011, the fund’s pro forma results of operations for the year ended December 31, 2011 are as follows:
| Net investment income | $17,140,345 | |||
| Net realized and unrealized gain (loss) on investments and foreign currency transactions | (7,046,839 | ) | ||
| Change in net assets from operations | $10,093,506 |
27
Table of Contents
MFS High Yield Portfolio
REPORT OF INDEPENDENT REGISTERED PUBLIC ACCOUNTING FIRM
To the Board of Trustees of MFS Variable Insurance Trust II and the Shareholders of
MFS High Yield Portfolio:
We have audited the accompanying statement of assets and liabilities, including the portfolio of investments, of MFS High Yield Portfolio (the “Fund”) (one of the portfolios comprising MFS Variable Insurance Trust II) as of December 31, 2011, and the related statement of operations for the year then ended, the statements of changes in net assets for each of the two years in the period then ended, and the financial highlights for each of the five years in the period then ended. These financial statements and financial highlights are the responsibility of the Fund’s management. Our responsibility is to express an opinion on these financial statements and financial highlights based on our audits.
We conducted our audits in accordance with the standards of the Public Company Accounting Oversight Board (United States). Those standards require that we plan and perform the audit to obtain reasonable assurance about whether the financial statements and financial highlights are free of material misstatement. The Fund is not required to have, nor were we engaged to perform, an audit of its internal control over financial reporting. Our audits included consideration of internal control over financial reporting as a basis for designing audit procedures that are appropriate in the circumstances, but not for the purpose of expressing an opinion on the effectiveness of the Fund’s internal control over financial reporting. Accordingly, we express no such opinion. An audit also includes examining, on a test basis, evidence supporting the amounts and disclosures in the financial statements, assessing the accounting principles used and significant estimates made by management, as well as evaluating the overall financial statement presentation. Our procedures included confirmation of securities owned as of December 31, 2011, by correspondence with the custodian and brokers; where replies were not received from brokers, we performed other auditing procedures. We believe that our audits provide a reasonable basis for our opinion.
In our opinion, the financial statements and financial highlights referred to above present fairly, in all material respects, the financial position of MFS High Yield Portfolio as of December 31, 2011, the results of its operations for the year then ended, the changes in its net assets for each of the two years in the period then ended, and the financial highlights for each of the five years in the period then ended, in conformity with accounting principles generally accepted in the United States of America.
DELOITTE & TOUCHE LLP
Boston, Massachusetts
February 15, 2012
28
Table of Contents
MFS High Yield Portfolio
RESULTS OF SHAREHOLDER MEETING (unaudited)
At a special meeting of shareholders of MFS High Yield Portfolio, which was held on December 1, 2011, the following actions were taken for which shareholders of all series of MFS Variable Insurance Trust II voted together as a single class with respect to Item 1 and shareholders of MFS High Yield Portfolio voted as a separate class with respect to Items 2 and 3:
Item 1: Election of ten Trustees as members of the Board of Trustees of the Trust effective January 1, 2012:
| Number of Shares | ||||||||
| For | Withheld Authority | |||||||
| Robert E. Butler | 681,916,712.8686 | 46,472,894.9218 | ||||||
| Maureen R. Goldfarb | 682,835,794.8512 | 45,553,812.9392 | ||||||
| David H. Gunning | 681,500,267.3085 | 46,889,340.4819 | ||||||
| William R. Gutow | 681,050,223.5547 | 47,339,384.2357 | ||||||
| Michael Hegarty | 682,477,088.8584 | 45,912,518.9320 | ||||||
| John P. Kavanaugh | 683,794,425.4269 | 44,595,182.3635 | ||||||
| Robert J. Manning | 682,699,559.7374 | 45,690,048.0530 | ||||||
| J. Dale Sherratt | 681,362,743.0513 | 47,026,864.7391 | ||||||
| Laurie J. Thomsen | 683,408,094.0000 | 44,981,513.7904 | ||||||
| Robert W. Uek | 681,424,852.0247 | 46,964,755.7657 | ||||||
Item 2: To approve a new investment advisory agreement dated January 1, 2012, between the Trust, on behalf of MFS High Yield Portfolio, and MFS:
| Number of Shares | ||||||||||||
| For | Against | Withheld Authority | ||||||||||
| 30,177,062.6883 | 776,118.1908 | 3,052,740.0345 | ||||||||||
Item 3: To approve revisions to and restatements of certain fundamental investment restrictions of MFS High Yield Portfolio effective January 1, 2012 as detailed below:
| Number of Shares | ||||||||||||||
| For | Against | Withheld Authority | ||||||||||||
| A. | Borrowing | 28,911,502.3782 | 1,864,222.1344 | 3,230,196.4010 | ||||||||||
| B. | Underwriting Securities | 29,342,687.8804 | 1,333,033.7383 | 3,330,199.2949 | ||||||||||
| C. | Issuance of Senior Securities | 29,552,284.4657 | 1,091,514.4771 | 3,362,121.9708 | ||||||||||
| D. | Lending of Money or Securities | 29,145,644.8906 | 1,571,194.8870 | 3,289,081.1360 | ||||||||||
| E. | Purchases or Sales of Real Estate; Interests in Oil, Gas or Mineral Leases; and Commodities | 29,805,950.5831 | 1,025,425.4013 | 3,174,544.9292 | ||||||||||
| F. | Industry Concentration | 29,825,640.3106 | 969,789.6359 | 3,210,490.9671 | ||||||||||
29
Table of Contents
MFS High Yield Portfolio
TRUSTEES AND OFFICERS – IDENTIFICATION AND BACKGROUND
The Trustees and officers of the Trust, as of February 1, 2012, are listed below, together with their principal occupations during the past five years. (Their titles may have varied during that period.) The address of each Trustee and officer is 500 Boylston Street, Boston, Massachusetts 02116.
Name, Age | Position(s) with Fund | Trustee/Officer Since (h) | Principal Occupations | Other Directorships (j) | ||||
| INTERESTED TRUSTEES | ||||||||
Robert J. Manning (k) (age 48) | Trustee | February 2004 | Massachusetts Financial Services Company, Chairman, Chief Executive Officer and Director; President (until December 2009); Chief Investment Officer (until July 2010) | N/A | ||||
| INDEPENDENT TRUSTEES | ||||||||
David H. Gunning (age 69) | Trustee and Chair of Trustees | January 2004 | Retired; Cleveland-Cliffs Inc. (mining products and service provider), Vice Chairman/Director (until May 2007) | Lincoln Electric Holdings, Inc. (welding equipment manufacturer), Director; Development Alternatives, Inc. (consulting), Director/Non-Executive Chairman; Portman Limited (mining), Director (until 2008) | ||||
Robert E. Butler (age 70) | Trustee | January 2006 | Consultant – investment company industry regulatory and compliance matters | N/A | ||||
Maureen R. Goldfarb (age 56) | Trustee | January 2009 | Private investor | N/A | ||||
William R. Gutow (age 70) | Trustee | December 1993 | Private investor and real estate consultant; Capitol Entertainment Management Company (video franchise), Vice Chairman | Atlantic Coast Tan (tanning salons), Vice Chairman (until 2007); Texas Donuts (donut franchise), Vice Chairman (until 2010) | ||||
Michael Hegarty (age 67) | Trustee | December 2004 | Private investor | N/A | ||||
John P. Kavanaugh (age 57) | Trustee | January 2009 | Private investor; The Hanover Insurance Group, Inc., Vice President and Chief Investment Officer (until 2006); Allmerica Investment Trust, Allmerica Securities Trust and Opus Investment Trust (investment companies), Chairman, President and Trustee (until 2006) | N/A | ||||
J. Dale Sherratt (age 73) | Trustee | June 1989 | Insight Resources, Inc. (acquisition planning specialists), President; Wellfleet Investments (investor in health care companies), Managing General Partner | N/A | ||||
Laurie J. Thomsen (age 54) | Trustee | March 2005 | Private investor; New Profit, Inc. (venture philanthropy), Executive Partner (until 2010) | The Travelers Companies (property and casualty insurance), Director | ||||
Robert W. Uek (age 70) | Trustee | January 2006 | Consultant to investment company industry | N/A | ||||
| OFFICERS | ||||||||
John M. Corcoran (k) (age 46) | President | October 2008 | Massachusetts Financial Services Company, Senior Vice President (since October 2008); State Street Bank and Trust (financial services provider), Senior Vice President, (until September 2008) | N/A | ||||
| Christopher R. Bohane (k) (age 38) | Assistant Secretary and Assistant Clerk | July 2005 | Massachusetts Financial Services Company, Vice President and Senior Counsel | N/A | ||||
Kino Clark (k) (age 43) | Assistant Treasurer | January 2012 | Massachusetts Financial Services Company, Assistant Vice President | N/A | ||||
30
Table of Contents
MFS High Yield Portfolio
Trustees and Officers – continued
Name, Age | Position(s) with Fund | Trustee/Officer Since (h) | Principal Occupations | Other Directorships (j) | ||||
Ethan D. Corey (k) (age 48) | Assistant Secretary and Assistant Clerk | July 2005 | Massachusetts Financial Services Company, Senior Vice President and Associate General Counsel | N/A | ||||
David L. DiLorenzo (k) (age 43) | Treasurer | July 2005 | Massachusetts Financial Services Company, Vice President | N/A | ||||
Robyn L. Griffin (age 36) | Assistant Independent Chief Compliance Officer | August 2008 | Griffin Compliance LLC (provider of compliance services), Principal (since August 2008); State Street Corporation (financial services provider), Mutual Fund Administration Assistant Vice President (October 2006 – July 2008); Liberty Mutual Group (insurance), Personal Market Assistant Controller (April 2006 – October 2006); Deloitte & Touche LLP (professional services firm). | N/A | ||||
Brian E. Langenfeld (k) (age 38) | Assistant Secretary and Assistant Clerk | June 2006 | Massachusetts Financial Services Company, Vice President and Senior Counsel | N/A | ||||
Ellen Moynihan (k) (age 54) | Assistant Treasurer | April 1997 | Massachusetts Financial Services Company, Senior Vice President | N/A | ||||
Susan S. Newton (k) (age 61) | Assistant Secretary and Assistant Clerk | May 2005 | Massachusetts Financial Services Company, Senior Vice President and Associate General Counsel | N/A | ||||
Susan A. Pereira (k) (age 41) | Assistant Secretary and Assistant Clerk | July 2005 | Massachusetts Financial Services Company, Vice President and Senior Counsel | N/A | ||||
Mark N. Polebaum (k) (age 59) | Secretary and Clerk | January 2006 | Massachusetts Financial Services Company, Executive Vice President, General Counsel and Secretary | N/A | ||||
Frank L. Tarantino (age 67) | Independent Chief Compliance Officer | June 2004 | Tarantino LLC (provider of compliance services), Principal | N/A | ||||
Richard S. Weitzel (k) (age 41) | Assistant Secretary and Assistant Clerk | October 2007 | Massachusetts Financial Services Company, Vice President and Assistant General Counsel | N/A | ||||
James O. Yost (k) (age 51) | Deputy Treasurer | September 1990 | Massachusetts Financial Services Company, Senior Vice President | N/A | ||||
| (h) | Date first appointed to serve as Trustee/officer of an MFS fund. Each Trustee has served continuously since appointment unless indicated otherwise. For the period from December 15, 2004 until February 22, 2005, Mr. Manning served as Advisory Trustee. For the period October 2008, until January 2012, Mr. Corcoran served as Treasurer of the Funds. Prior to January 2012, Messrs. DiLorenzo and Yost served as Assistant Treasurers of the Funds. |
| (j) | Directorships or trusteeships of companies required to report to the Securities and Exchange Commission (i.e., “public companies”). |
| (k) | “Interested person” of the Trust within the meaning of the Investment Company Act of 1940 (referred to as the 1940 Act), which is the principal federal law governing investment companies like the fund, as a result of position with MFS. The address of MFS is 500 Boylston Street, Boston, Massachusetts 02116. |
Each Trustee has been elected by shareholders and each Trustee and officer holds office until his or her successor is chosen and qualified or until his or her earlier death, resignation, retirement or removal. The Trust does not hold annual meetings for the purpose of electing Trustees, and Trustees are not elected for fixed terms. Messrs. Butler, Kavanaugh, Uek and Ms. Thomsen are members of the Trust’s Audit Committee.
Each of the Fund’s Trustees and officers holds comparable positions with certain other funds of which MFS or a subsidiary is the investment adviser or distributor, and, in the case of the officers, with certain affiliates of MFS. As of January 1, 2012, the Trustees served as board members of 131 funds within the MFS Family of Funds.
31
Table of Contents
MFS High Yield Portfolio
Trustees and Officers – continued
The Statement of Additional Information for the Fund includes further information about the Trustees and is available without charge upon request by calling 1-800-225-2606.
Investment Adviser Massachusetts Financial Services Company 500 Boylston Street, Boston, MA 02116-3741 | Custodian State Street Bank and Trust 1 Lincoln Street, Boston, MA 02111-2900 | |
Distributor MFS Fund Distributors, Inc. 500 Boylston Street, Boston, MA 02116-3741 | Independent Registered Public Accounting Firm Deloitte & Touche LLP 200 Berkeley Street, Boston, MA 02116 | |
Portfolio Managers William Adams David Cole |
32
Table of Contents
MFS High Yield Portfolio
At a special meeting of shareholders of the MFS High Yield Portfolio (hereinafter referred to as the “Fund” or the “Portfolio”), which was held on December 1, 2011, the shareholders approved a new investment advisory agreement based on the recommendation of the Board of Trustees. At its July, 2011 meeting, the Board of Trustees (i) approved, and recommended for shareholder approval, the new investment advisory agreement effective January 1, 2012, and (ii) the continuation of the existing investment advisory agreement effective September 1, 2011. The following includes a description of the factors that the Board of Trustees considered and the conclusions that formed the basis of their approval of both the new investment advisory agreement and the continuation of the prior investment advisory agreement.
BOARD APPROVAL OF NEW INVESTMENT ADVISORY AGREEMENT
The Investment Company Act of 1940 requires that both the full Board of Trustees and a majority of the non-interested (“independent”) Trustees, voting separately, initially approve the new investment advisory agreement (the “New Agreement”) between Massachusetts Financial Services Company (“MFS”) and MFS Variable Insurance Trust II (the “Trust”) on behalf of the Portfolio and, beginning on the second anniversary of the initial effective date of the New Agreement, annually approve the continuation of the New Agreement. The Trustees have considered matters bearing on the Portfolio and the then current advisory arrangement at their meetings throughout the year, including a review of performance data at each regular meeting. In addition, the independent Trustees met in person in July 2011 to consider the initial approval of the New Agreement, and to recommend that shareholders approve the New Agreement. The independent Trustees were assisted in their evaluation of the New Agreement by independent legal counsel, from whom they received separate legal advice and with whom they met separately from MFS management. The independent Trustees were also assisted in this process by the Portfolio’s Independent Chief Compliance Officer, a full-time senior officer appointed by and reporting to the independent Trustees.
In connection with their deliberations regarding the initial approval of the New Agreement, the Trustees, including the independent Trustees, considered such information and factors as they believed, in light of the legal advice furnished to them and their own business judgment, to be relevant. The New Agreement was considered separately for the series of the Trust (collectively, the “Portfolios”), although the Trustees also took into account the common interests of all Portfolios in the Trust in their review. As described below, the Trustees considered the nature, quality, and extent of the various investment advisory, administrative, and/or shareholder services to be performed by MFS under the New Agreement and other arrangements with the Trust.
In connection with their initial review meeting, the Trustees received and relied upon materials that included, among other items: (i) information provided by MFS on the advisory fees of comparable portfolios of its other clients, including institutional separate account and other clients, (ii) information as to whether, and to what extent applicable, expense waivers, reimbursements or fee “breakpoints” would be observed for the Portfolio under the New Agreement, and (iii) a comparison and summary of the differences in the provisions in the New Agreement compared to those in each of the then current investment advisory agreements for the Portfolios. In addition, in connection with the independent Trustees’ meetings in May and July, 2011 (the “contract review meetings”) for the purpose of considering whether to approve the continuation of the then current investment advisory agreements for the Portfolio, the independent Trustees received: (1) information provided by Lipper Inc. (“Lipper”) on the investment performance of the Portfolio for various time periods ended December 31, 2010, compared to the investment performance of a group of funds with substantially similar investment classifications/objectives (the “Lipper performance universe”), (2) information provided by Lipper on the Portfolio’s advisory fees and other expenses compared to the advisory fees and other expenses of comparable funds identified by Lipper (the “Lipper expense group”), (3) information regarding MFS’ financial results and financial condition, including MFS’ and certain of its affiliates’ estimated profitability from services performed for the Portfolio, (4) MFS’ views regarding the outlook for the mutual fund industry and its strategic business plans, (5) descriptions of various functions performed by MFS for the Trust, such as compliance monitoring and portfolio trading practices, and (6) information regarding the overall organization of MFS, including information about MFS’ senior management and other personnel providing investment advisory, administrative and other services to the Portfolio. The comparative performance, fee and expense information prepared and provided by Lipper was not independently verified, and the independent Trustees did not independently verify any information provided to them by MFS.
The Trustees’ conclusion as to the initial approval of the New Agreement was based on comprehensive consideration of all information provided to the Trustees and was not the result of any single factor. Some of the factors that figured particularly in the Trustees’ deliberations are described below for the Portfolio, while individual Trustees may have given different weight to various factors and evaluated the information presented as a whole differently than another individual Trustee. The Trustees recognized that the fee arrangements for the Portfolio could reflect years of review and discussion between the independent Trustees and MFS, that certain aspects of such arrangements may receive greater scrutiny in some years than others, and that
33
Table of Contents
MFS High Yield Portfolio
Board Approval of New Investment Advisory Agreement – continued
the Trustees’ conclusions may be based, in part, on their consideration of these same arrangements during the course of the year and in prior years.
Because the portfolio management team managing the Portfolio’s investments under the then current investment advisory agreement will remain the same under the New Agreement for the Portfolio, the Trustees compared the Portfolio’s total return investment performance to the performance of its Lipper performance universe over various time periods, based on information provided by Lipper. The Trustees placed particular emphasis on the total return performance of the Portfolio’s Initial Class shares in comparison to the performance of funds in its Lipper performance universe over the one-, three- and five-year periods ended December 31, 2010. The Trustees did not rely on performance results for more recent periods.
The Trustees noted the performance of the Portfolio’s Initial Class shares was in the 1st quintile relative to the other funds in the Lipper performance universe for the one-year period (the 1st quintile being the best performers and the 5th quintile being the worst performers). The total return performance of the Portfolio was in the 4th quintile for the three-year and the five-year periods ended December 31, 2010, relative to the Lipper performance universe. Based on the nature and quality of services provided by MFS, the Board of Trustees concluded that the Portfolio’s performance was satisfactory.
In the course of their deliberations, the Trustees took into account information provided by MFS during contract review meetings, as well as during investment review meetings conducted with portfolio management personnel during the course of the year. For Portfolios whose performance lagged their peer groups, they discussed the factors that contributed thereto and MFS’ efforts to improve such Portfolios’ performance. After reviewing this information, the Trustees concluded, within the context of their overall conclusions regarding the New Agreement, that they were satisfied with MFS’ responses and efforts relating to investment performance.
In assessing the reasonableness of the Portfolio’s advisory fee, the Trustees considered, among other information, the Portfolio’s advisory fee and the total expense ratio of the Portfolio’s Initial Class shares as a percentage of average daily net assets, compared to the advisory fee and total expense ratios of its peer group of funds based on information provided by Lipper. The Trustees also considered the advisory fees charged by MFS to institutional accounts. In comparing these fees, the Trustees considered the generally broader scope of services provided by MFS to the Trust than those provided to institutional accounts. The Trustees also considered the higher demands placed on MFS’ investment personnel and trading infrastructure as a result of the daily cash in-flows and out-flows of the Portfolio, and the impact on MFS and related expenses due to the more extensive regulatory regime to which the Portfolio is subject, compared to institutional accounts.
In considering the fees, the Trustees noted from the Lipper data that the Portfolio’s effective advisory fee rate and total expense ratio were each above the median of such fees and expenses of funds in the Lipper expense group. The Trustees further noted that the New Agreement would reflect MFS’ agreement to observe a lower advisory fee and to reduce the advisory fee on average daily net assets over $1 billion on a permanent basis, and concluded that the breakpoint was sufficient to allow the Portfolio to benefit from economies of scale as its assets grow. The Trustees concluded that the reduced fees were reasonable in light of the nature and quality of services provided.
The Trustees also considered whether the Portfolio is likely to benefit from any economies of scale due to future asset growth. In this regard, the Trustees reviewed the adequacy of breakpoints and discussed with MFS any adjustments necessary for the shareholders’ benefit.
The Trustees also considered information prepared by MFS relating to its costs and profits with respect to the Portfolio and other investment companies and accounts advised by MFS, as well as MFS’ methodologies used to determine and allocate its costs to the Portfolio and other accounts and products for purposes of estimating profitability.
The Trustees noted that there would be no increase to the net advisory fee arrangement for the Portfolio under the New Agreement when compared to the Portfolio’s then current investment advisory agreement. After reviewing these and other factors described below, the Trustees concluded that the advisory fees charged to the Portfolio under the New Agreement represent reasonable compensation in light of the nature and quality of the services being provided by MFS.
In addition, the Trustees considered MFS’ resources and related efforts to continue to retain, attract and motivate capable personnel to serve the Portfolio. The Trustees also considered the financial resources of MFS and its parent, Sun Life Financial Inc. The Trustees further considered any advantages and possible disadvantages of having an adviser which also serves other investment companies as well as institutional accounts.
The Trustees also considered the nature, quality, cost, and extent of administrative, transfer agency, and distribution services provided to the Trust by MFS and its affiliates under agreements and plans other than the New Agreement, including the 12b-1 fees the Portfolio pays to MFS Fund Distributors, Inc., an affiliate of MFS. The Trustees also considered the nature, extent and
34
Table of Contents
MFS High Yield Portfolio
Board Approval of New Investment Advisory Agreement – continued
quality of certain other services MFS performs or arranges on the Portfolio’s behalf, which may include securities lending programs, directed expense payment programs, class action recovery programs, and MFS’ interaction with third-party service providers, principally custodians and sub-custodians. The Trustees concluded that the various non-advisory services provided by MFS and its affiliates on behalf of the Portfolio were satisfactory. The Trustees also considered the benefits to MFS from the use of the Portfolio’s portfolio brokerage commissions to pay for investment research and various other factors. Additionally, the Trustees considered so-called “fall-out benefits” to MFS such as reputational value derived from serving as investment manager to the Trust, and determined that any such benefits derived by MFS were reasonable and fair.
Based on their evaluation of factors that they deemed to be material, including those factors described above, the Board of Trustees, including a majority of the independent Trustees, concluded that the New Agreement should be approved for an initial two-year period, commencing upon its effective date, as set forth in the New Agreement.
BOARD APPROVAL OF CONTINUATION OF PRIOR INVESTMENT ADVISORY AGREEMENT
The Investment Company Act of 1940 requires that both the full Board of Trustees and a majority of the non-interested (“independent”) Trustees, voting separately, annually approve the continuation of the investment advisory agreement between MFS Variable Insurance Trust II (the “Trust”) and Massachusetts Financial Services Company (“MFS”) on behalf of the Fund. The Trustees consider matters bearing on the Fund and the advisory arrangements at their meetings throughout the year, including a review of performance data at each regular meeting. In addition, the independent Trustees met in person in May and again in July 2011 (“contract review meetings”) for the specific purpose of considering whether to approve the continuation of the investment advisory agreement for the Fund. The independent Trustees were assisted in their evaluation of the investment advisory agreement by independent legal counsel, from whom they received separate legal advice and with whom they met separately from MFS management during various contract review meetings. The independent Trustees were also assisted in this process by the Fund’s Independent Chief Compliance Officer, a full-time senior officer appointed by and reporting to the independent Trustees.
In connection with their deliberations, the Trustees, including the independent Trustees, considered such information and factors as they believed, in light of the legal advice furnished to them and their own business judgment, to be relevant. The investment advisory agreement was considered separately for the Fund, although the Trustees also took into account the common interests of all Funds in the Trust in their review. As described below, the Trustees considered the nature, quality, and extent of the various investment advisory, administrative, and shareholder services performed by MFS under the existing investment advisory agreement and other arrangements with the Trust.
In connection with their contract review meetings, the Trustees received and relied upon materials which included, among other items: (i) information provided by Lipper Inc. (“Lipper”) on the investment performance of the Fund for various time periods ended December 31, 2010, compared to the investment performance of a group of funds with substantially similar investment classifications/objectives (the “Lipper performance universe”), (ii) information provided by Lipper on the Fund’s advisory fees and other expenses compared to the advisory fees and other expenses of comparable funds identified by Lipper (the “Lipper expense group”), (iii) information provided by MFS on the advisory fees of comparable portfolios of its other clients, including institutional separate account and other clients, (iv) information as to whether, and to what extent applicable, expense waivers, reimbursements or fee “breakpoints” are observed for the Fund, (v) information regarding MFS’ financial results and financial condition, including MFS’ and certain of its affiliates’ estimated profitability from services performed for the Fund and other investment companies that the Board oversees as a whole, and for MFS’ institutional business, (vi) MFS’ views regarding the outlook for the mutual fund industry and its strategic business plans, (vii) descriptions of various functions performed by MFS for the Trust, such as compliance monitoring and portfolio trading practices, and (viii) information regarding the overall organization of MFS, including information about MFS’ senior management and other personnel providing investment advisory, administrative and other services to the Fund. The comparative performance, fee and expense information prepared and provided by Lipper was not independently verified, and the independent Trustees did not independently verify any information provided to them by MFS.
The Trustees’ conclusion as to the continuation of the investment advisory agreement was based on comprehensive consideration of all information provided to the Trustees and was not the result of any single factor. Some of the factors that figured particularly in the Trustees’ deliberations are described below for the Fund, while individual Trustees may have given different weight to various factors and evaluated the information presented as a whole differently than another individual Trustee. The Trustees recognized that the fee arrangements for the Fund reflect years of review and discussion between the independent Trustees and MFS, that certain aspects of such arrangements may receive greater scrutiny in some years than
35
Table of Contents
MFS High Yield Portfolio
Board Approval of Continuation of Prior Investment Advisory Agreement – continued
others, and that the Trustees’ conclusions may be based, in part, on their consideration of these same arrangements during the course of the year and in prior years.
Based on information provided by Lipper, the Trustees compared the Fund’s total return investment performance to the performance of the Lipper performance universe over various time periods. The Trustees placed particular emphasis on the total return performance of the Fund’s Initial Class shares in comparison to the performance of funds in its Lipper performance universe over the one-, three- and five -year periods ended December 31, 2010. The Trustees did not rely on performance results for more recent periods, including those shown elsewhere in this report.
The Trustees noted the performance of the Fund’s Initial Class shares was in the 1st quintile relative to the other funds in the Lipper performance universe for the one-year period (the 1st quintile being the best performers and the 5th quintile being the worst performers). The total return performance of the Fund was in the 4th quintile for the three-year and the five-year periods ended December 31, 2010, relative to the Lipper performance universe. Based on the nature and quality of services provided by MFS, the Board of Trustees concluded that the Fund’s performance was satisfactory.
In the course of their deliberations, the Trustees took into account information provided by MFS during contract review meetings, as well as during investment review meetings conducted with portfolio management personnel during the course of the year.
In assessing the reasonableness of the Fund’s advisory fee, the Trustees considered, among other information, the Fund’s advisory fee and the total expense ratio of the Fund’s Initial Class shares as a percentage of average daily net assets, compared to the advisory fee and total expense ratios of its peer group of funds based on information provided by Lipper. The Trustees also considered the advisory fees charged by MFS to institutional accounts. In comparing these fees, the Trustees considered the generally broader scope of services provided by MFS to the Trust than those provided to institutional accounts. The Trustees also considered the higher demands placed on MFS’ investment personnel and trading infrastructure as a result of the daily cash in-flows and out-flows of the Fund, and the impact on MFS and related expenses due to the more extensive regulatory regime to which the Fund is subject, compared to institutional accounts.
In considering the fees, the Trustees noted from the Lipper data (which takes into account any reductions or expense limitations) that the Fund’s effective advisory fee rate and total expense ratio were each above the median of such fees and expenses of funds in the Lipper expense group. The Trustees further concluded that the existing breakpoint was sufficient to allow the Fund to benefit from economies of scale as its assets grow. The Trustees concluded that the fees were reasonable in light of the nature and quality of services provided.
The Trustees also considered information prepared by MFS relating to its costs and profits with respect to the Fund and other investment companies and accounts advised by MFS, as well as MFS’ methodologies used to determine and allocate its costs to the Fund and other accounts and products for purposes of estimating profitability.
After reviewing these and other factors described below, the Trustees concluded that the advisory fees charged to the Fund represent reasonable compensation in light of the nature and quality of the services being provided by MFS.
In addition, the Trustees considered MFS’ resources and related efforts to continue to retain, attract and motivate capable personnel to serve the Fund. The Trustees also considered the financial resources of MFS and its parent, Sun Life Financial Inc. The Trustees further considered any advantages and possible disadvantages of having an adviser which also serves other investment companies as well as institutional accounts.
The Trustees also considered the nature, quality, cost, and extent of administrative, transfer agency, and distribution services provided to the Fund by MFS and its affiliates under agreements and plans other than the investment advisory agreement, including the 12b-1 fees the Fund pays to MFS Fund Distributors, Inc., an affiliate of MFS. The Trustees also considered the nature, extent and quality of certain other services MFS performs or arranges on the Fund’s behalf, which may include securities lending programs, directed expense payment programs, class action recovery programs, and MFS’ interaction with third-party service providers, principally custodians and sub-custodians. The Trustees concluded that the various non-advisory services provided by MFS and its affiliates on behalf of the Fund were satisfactory. The Trustees also considered the benefits to MFS from the use of the Fund’s portfolio brokerage commissions, if applicable, to pay for investment research and various other factors. Additionally, the Trustees considered so-called “fall-out benefits” to MFS such as reputational value derived from serving as investment manager to the Trust, and determined that any such benefits derived by MFS were reasonable and fair.
Based on their evaluation of factors that they deemed to be material, including those factors described above, the Board of Trustees, including a majority of the independent Trustees, concluded that the investment advisory agreement should be continued for an additional one-year period, commencing September 1, 2011.
36
Table of Contents
MFS High Yield Portfolio
Board Approval of Continuation of Prior Investment Advisory Agreement – continued
A discussion regarding the Board’s most recent review and renewal of the fund’s Investment Advisory Agreement with MFS is available by clicking on the fund’s name under “Variable Insurance Portfolios — VIT II” in the “Products and Performance” section of the MFS Web site (mfs.com).
37
Table of Contents
MFS High Yield Portfolio
PROXY VOTING POLICIES AND INFORMATION
A general description of the MFS funds’ proxy voting policies and procedures is available without charge, upon request, by calling
1-800-225-2606, by visiting the Proxy Voting section of mfs.com or by visiting the SEC’s Web site at http://www.sec.gov.
Information regarding how the fund voted proxies relating to portfolio securities during the most recent twelve-month period ended June 30 is available without charge by visiting the Proxy Voting section of mfs.com or by visiting the SEC’s Web site at http://www.sec.gov.
QUARTERLY PORTFOLIO DISCLOSURE
The fund will file a complete schedule of portfolio holdings with the Securities and Exchange Commission (the Commission) for the first and third quarters of each fiscal year on Form N-Q. The fund’s Form N-Q is available on the EDGAR database on the Commission’s Internet Web site at http://www.sec.gov and may be reviewed and copied at the:
Public Reference Room
Securities and Exchange Commission
100 F Street, NE, Room 1580
Washington, D.C. 20549
Information on the operation of the Public Reference Room may be obtained by calling the Commission at 1-800-SEC-0330. Copies of the fund’s Form N-Q also may be obtained, upon payment of a duplicating fee, by electronic request at the following e-mail address: publicinfo@sec.gov or by writing the Public Reference Section at the above address.
From time to time, MFS may post important information about the fund or the MFS funds on the MFS web site (mfs.com). This information is available by visiting the “News & Commentary” section of mfs.com or by clicking on the fund’s name under “Variable Insurance Portfolios — VIT II” in the “Products and Performance” section of mfs.com.
38
Table of Contents
rev. 3/11

| Why? | Financial companies choose how they share your personal information. Federal law gives consumers the right to limit some but not all sharing. Federal law also requires us to tell you how we collect, share, and protect your personal information. Please read this notice carefully to understand what we do. |
| What? | The types of personal information we collect and share depend on the product or service you have with us. This information can include:
• Social Security number and account balances • Account transactions and transaction history • Checking account information and wire transfer instructions
When you are no longer our customer, we continue to share your information as described in this notice. |
| How? | All financial companies need to share customers’ personal information to run their everyday business. In the section below, we list the reasons financial companies can share their customers’ personal information; the reasons MFS chooses to share; and whether you can limit this sharing. |
| Reasons we can share your personal information | Does MFS share? | Can you limit this sharing? | ||
For our everyday business purposes – such as to process your transactions, maintain your account(s), respond to court orders and legal investigations, or report to credit bureaus | Yes | No | ||
For our marketing purposes – to offer our products and services to you | No | We don’t share | ||
| For joint marketing with other financial companies | No | We don’t share | ||
For our affiliates’ everyday business purposes – information about your transactions and experiences | No | We don’t share | ||
For our affiliates’ everyday business purposes – information about your creditworthiness | No | We don’t share | ||
| For nonaffiliates to market to you | No | We don’t share |
| Questions? | Call 800-225-2606 or go to mfs.com. |
39
Table of Contents
| Page 2 |
| Who we are | ||
| Who is providing this notice? | MFS Funds, MFS Investment Management, MFS Institutional Advisors, Inc., MFS Fund Distributors, Inc., MFS Heritage Trust Company, and MFS Service Center, Inc. | |
| What we do | ||
| How does MFS protect my personal information? | To protect your personal information from unauthorized access and use, we use security measures that comply with federal law. These measures include procedural, electronic, and physical safeguards for the protection of the personal information we collect about you. | |
| How does MFS collect my personal information? | We collect your personal information, for example, when you
• open an account or provide account information • direct us to buy securities or direct us to sell your securities • make a wire transfer
We also collect your personal information from others, such as credit bureaus, affiliates and other companies. | |
| Why can’t I limit all sharing? | Federal law gives you the right to limit only
• sharing for affiliates’ everyday business purposes – information about your creditworthiness • affiliates from using your information to market to you • sharing for nonaffiliates to market to you
State laws and individual companies may give you additional rights to limit sharing. | |
| Definitions | ||
| Affiliates | Companies related by common ownership or control. They can be financial and nonfinancial companies.
• MFS does not share personal information with affiliates, except for everyday business purposes as described on page one of this notice. | |
| Nonaffiliates | Companies not related by common ownership or control. They can be financial and nonfinancial companies.
• MFS does not share with nonaffiliates so they can market to you. | |
| Joint Marketing | A formal agreement between nonaffiliated financial companies that together market financial products or services to you.
• MFS doesn’t jointly market. | |
| Other important information | ||
| If you own an MFS product or receive an MFS service in the name of a third party such as a bank or broker-dealer, their privacy policy may apply to you instead of ours. | ||
40
Table of Contents

Table of Contents

MFS® Bond Portfolio
MFS® Variable Insurance Trust II

ANNUAL REPORT
December 31, 2011
BDS-ANN
Table of Contents
MFS® BOND PORTFOLIO
The report is prepared for the general information of contract owners.
It is authorized for distribution to prospective investors only when preceded or accompanied by a current prospectus.
NOT FDIC INSURED Ÿ MAY LOSE VALUE Ÿ NO BANK OR CREDIT UNION GUARANTEE Ÿ
NOT A DEPOSIT Ÿ NOT INSURED BY ANY FEDERAL GOVERNMENT AGENCY OR NCUA/NCUSIF
Table of Contents
MFS Bond Portfolio
LETTER FROM THE CHAIRMAN AND CEO

Dear Contract Owners:
We are indeed living through some volatile times. Economic uncertainty is everywhere, as it seems no place in the world has been unmoved by crisis. We have seen a devastating earthquake and tsunami that have led to disruptions in the Japanese markets
and supply chains. Protests have changed the face of the Middle East and left in their wake lingering tensions and resultant higher oil prices. We have seen debt limits tested in Europe and the United States and policymakers grappling to craft often unpopular monetary and fiscal responses at a time when consumers and businesses struggle with what appears to be a slowing global economy. On top of all of that, we have seen long-term U.S. debt lose its Standard & Poor’s AAA rating and the long-term debt ratings of 15 eurozone nations put on negative watch.
When markets become volatile, managing risk becomes a top priority for investors and their advisors. At MFS® risk management is foremost in our minds in all market climates. Our analysts and portfolio managers keep risks firmly in mind when evaluating securities. Additionally, we have a team of quantitative analysts that measures and assesses the risk profiles of our portfolios and securities on an ongoing basis. The chief investment risk officer, who oversees the team, reports directly to the firm’s president and chief investment officer so the risk associated with each portfolio can be assessed objectively and independently of the portfolio management team.
As always, we continue to be mindful of the many economic challenges faced at the local, national, and international levels. It is in times such as these that we want to remind investors of the merits of maintaining a long-term view, adhering to basic investing principles such as asset allocation and diversification, and working closely with their advisors to research and identify appropriate investment opportunities.
Respectfully,

Robert J. Manning
Chairman and Chief Executive Officer
MFS Investment Management®
February 15, 2012
The opinions expressed in this letter are subject to change, may not be relied upon for investment advice, and no forecasts can be guaranteed.
1
Table of Contents
MFS Bond Portfolio
Portfolio structure (i)

| Fixed income sectors (i) | ||||
| High Grade Corporates | 63.9% | |||
| High Yield Corporates | 24.5% | |||
| Emerging Markets Bonds | 6.3% | |||
| Commercial Mortgage-Backed Securities | 3.0% | |||
| Collateralized Debt Obligations | 1.2% | |||
| Asset-Backed Securities | 0.6% | |||
| Mortgage-Backed Securities (o) | 0.0% |
| Composition including fixed income credit quality (a)(i) | ||||
| AAA | 1.3% | |||
| AA | 2.4% | |||
| A | 15.2% | |||
| BBB | 54.4% | |||
| BB | 21.0% | |||
| B | 4.7% | |||
| CCC | 0.1% | |||
| C | 0.1% | |||
| D | 0.3% | |||
| Federal Agencies (o) | 0.0% | |||
| Not Rated (o) | 0.0% | |||
| Cash & Other | 0.5% | |||
| Portfolio facts (i) | ||||
| Average Duration (d) | 5.6 | |||
| Average Effective Maturity (m) | 8.6 yrs. |
| (a) | For all securities other than those specifically described below, ratings are assigned to underlying securities utilizing ratings from Moody’s, Fitch, and Standard & Poor’s rating agencies and applying the following hierarchy: If all three agencies provide a rating, the middle rating (after dropping the highest and lowest ratings) is assigned; if two of the three agencies rate a security, the lower of the two is assigned. Ratings are shown in the S&P and Fitch scale (e.g., AAA). All ratings are subject to change. Federal Agencies includes rated and unrated U.S. Agency fixed-income securities, U.S. Agency mortgage-backed securities, and collateralized mortgage obligations of U.S. Agency mortgage-backed securities. Not Rated includes fixed income securities which have not been rated by any rating agency. Cash & Other includes cash, other assets less liabilities, offsets to derivative positions, and short-term securities. The fund may not hold all of these instruments. The fund is not rated by these agencies. |
| (d) | Duration is a measure of how much a bond’s price is likely to fluctuate with general changes in interest rates, e.g., if rates rise 1.00%, a bond with a 5-year duration is likely to lose about 5.00% of its value due to the interest rate move. |
| (i) | For purposes of this presentation, the components include the market value of securities, and reflect the impact of the equivalent exposure of derivative positions. These amounts may be negative from time to time. The bond component will include any accrued interest amounts. Equivalent exposure is a calculated amount that translates the derivative position into a reasonable approximation of the amount of the underlying asset that the portfolio would have to hold at a given point in time to have the same price sensitivity that results from the portfolio’s ownership of the derivative contract. When dealing with derivatives, equivalent exposure is a more representative measure of the potential impact of a position on portfolio performance than market value. Where the fund holds convertible bonds, these are treated as part of the equity portion of the portfolio. |
| (m) | In determining an instrument’s effective maturity for purposes of calculating the fund’s dollar-weighted average effective maturity, MFS uses the instrument’s stated maturity or, if applicable, an earlier date on which MFS believes it is probable that a maturity-shortening device (such as a put, pre-refunding or prepayment) will cause the instrument to be repaid. Such an earlier date can be substantially shorter than the instrument’s stated maturity. |
| (o) | Less than 0.1%. |
Percentages are based on net assets as of 12/31/11.
The portfolio is actively managed and current holdings may be different.
2
Table of Contents
MFS Bond Portfolio
Summary of Results
For the twelve months ended December 31, 2011, Initial Class shares of the MFS Bond Portfolio (the “fund”) provided a total return of 6.63%, while Service Class shares of the fund provided a total return of 6.30%. These compare with a return of 8.35% for the fund’s benchmark, the Barclays Capital U.S. Credit Bond Index.
Market Environment
Early in the period, the U.S. Federal Reserve (the “Fed”) responded to weak economic growth by loosening monetary policy further. More easing by the Fed improved market sentiment and drove risk-asset prices markedly higher. The December 2010 agreement on a surprisingly large (relative to expectations) expansionary U.S. fiscal package also boosted sentiment. During the subsequent several months, the renewed positive market sentiment, coupled with better indications of global macroeconomic activity, pushed many asset valuations to post-crisis highs. At the same time, the yields of the perceived “safest” global sovereign credits rose, indicating a renewed risk-seeking environment.
However, towards the middle of the period, a weakening macroeconomic backdrop and renewed concerns over peripheral euro zone sovereign debt caused a flight-to-quality move that pushed high-quality sovereign bond yields lower. In the U.S., concerns about sovereign debt default and the long-term sustainability of the trend in U.S. fiscal policy resulted in one agency downgrading U.S. credit quality. Amidst this turmoil, global equity markets declined sharply. As a result of these developments, global consumer and producer sentiment indicators fell precipitously and highly-rated sovereign bond yields hit multi-decade lows. Towards the end of the reporting period, uncertainty in financial markets spiked higher as markets more seriously contemplated the possible failure of the euro zone.
Detractors from Performance
Credit quality, primarily the fund’s greater exposure to “BB” and “B” rated (r) securities, was a primary detractor from relative performance as these credit quality sectors underperformed higher-rated securities over the reporting period.
Yield curve (y) positioning, particularly the fund’s lesser exposure to shifts at the long end of the yield curve (centered around maturities of 10 years or more), was another detractor from the fund’s relative results as the yield curve flattened. The fund’s lesser exposure to the utility – electric sector was another factor that weakened relative performance as this market segment outperformed the benchmark over the reporting period.
Contributors to Performance
The fund’s return from yield, which was greater than that of the Barclays Capital U.S. Credit Bond Index, contributed to relative results.
The timing of the fund’s exposure to bonds in the industrial sector also benefited relative performance as this market segment turned in strong performance over the reporting period. A lesser exposure to bonds in the banking sector also helped relative returns as Europe’s mounting sovereign debt crisis put pressure on most financial companies.
Respectfully,
| Richard Hawkins | Robert Persons | |
| Portfolio Manager | Portfolio Manager |
| (r) | Bonds rated “BBB”, “Baa”, or higher are considered investment grade; bonds rated “BB”, “Ba”, or below are considered non-investment grade. The source for bond quality ratings is Moody’s Investors Service, Standard & Poor’s and Fitch, Inc. and are applied using the following hierarchy: If all three agencies provide a rating, the middle rating (after dropping the highest and lowest ratings) is assigned; if two of the three agencies rate a security, the lower of the two is assigned. Ratings are shown in the S&P and Fitch scale (e.g., AAA). For securities which are not rated by any of the three agencies, the security is considered Not Rated. |
| (y) | A yield curve graphically depicts the yields of different maturity bonds of the same credit quality and type; a normal yield curve is upward sloping, with short-term rates lower than long-term rates. |
The views expressed in this report are those of the portfolio managers only through the end of the period of the report as stated on the cover and do not necessarily reflect the views of MFS or any other person in the MFS organization. These views are subject to change at any time based on market or other conditions, and MFS disclaims any responsibility to update such views. These views may not be relied upon as investment advice or an indication of trading intent on behalf of any MFS portfolio. References to specific securities are not recommendations of such securities, and may not be representative of any MFS portfolio’s current or future investments.
3
Table of Contents
MFS Bond Portfolio
PERFORMANCE SUMMARY THROUGH 12/31/11
The following chart illustrates the historical performance of the fund in comparison to its benchmark(s). Benchmarks are unmanaged and may not be invested in directly. Benchmark returns do not reflect any fees or expenses. The performance of other share classes will be greater than or less than that of the class depicted below. (See Notes to Performance Summary.)
Performance data shown represents past performance and is no guarantee of future results. Investment return and principal value fluctuate so your units, when sold, may be worth more or less than the original cost; current performance may be lower or higher than quoted. The performance shown does not reflect the deduction of taxes, if any, that a contract holder would pay on fund distributions or the redemption of contract units. The returns for the fund shown also do not reflect the deduction of expenses associated with variable products, such as mortality and expense risk charges, separate account charges, and sales charges imposed by the insurance company separate accounts. Such expenses would reduce the overall returns shown.
Growth of a Hypothetical $10,000 Investment
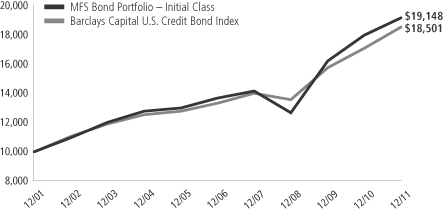
Total Returns through 12/31/11
Average annual total returns
| Share class | Class inception date | 1-yr | 5-yr | 10-yr | ||||||||
| Initial Class | 5/06/98 | 6.63% | 6.98% | 6.71% | ||||||||
| Service Class | 8/24/01 | 6.30% | 6.72% | 6.45% | ||||||||
| Comparative benchmark | ||||||||||||
| Barclays Capital U.S. Credit Bond Index (f) | 8.35% | 6.80% | 6.35% | |||||||||
| (f) | Source: FactSet Research Systems Inc. |
Benchmark Definition
Barclays Capital U.S. Credit Bond Index – a market capitalization-weighted index that measures the performance of publicly issued, SEC-registered, U.S. corporate and specified foreign debentures and secured notes that meet specified maturity, liquidity, and quality requirements.
It is not possible to invest directly in an index.
Notes to Performance Summary
Average annual total return represents the average annual change in value for each share class for the periods presented.
Performance results reflect any applicable expense subsidies and waivers in effect during the periods shown. Without such subsidies and waivers the fund’s performance results would be less favorable. Please see the prospectus and financial statements for complete details. All results are historical and assume the reinvestment of any dividends and capital gains distributions.
Performance results do not include adjustments made for financial reporting purposes in accordance with U.S. generally accepted accounting principles and may differ from amounts reported in the financial highlights.
From time to time the fund may receive proceeds from litigation settlements, without which performance would be lower.
4
Table of Contents
MFS Bond Portfolio
Fund Expenses Borne by the Contract Holders During the Period,
July 1, 2011 through December 31, 2011
As a contract holder of the fund, you incur ongoing costs, including management fees; distribution and/or service (12b-1) fees; and other fund expenses. This example is intended to help you understand your ongoing costs (in dollars) of investing in the fund and to compare these costs with the ongoing costs of investing in other mutual funds.
The example is based on an investment of $1,000 invested at the beginning of the period and held for the entire period July 1, 2011 through December 31, 2011.
Actual Expenses
The first line for each share class in the following table provides information about actual account values and actual expenses. You may use the information in this line, together with the amount you invested, to estimate the expenses that you paid over the period. Simply divide your account value by $1,000 (for example, an $8,600 account value divided by $1,000 = 8.6), then multiply the result by the number in the first line under the heading entitled “Expenses Paid During Period” to estimate the expenses you paid on your account during this period.
Hypothetical Example for Comparison Purposes
The second line for each share class in the following table provides information about hypothetical account values and hypothetical expenses based on the fund’s actual expense ratio and an assumed rate of return of 5% per year before expenses, which is not the fund’s actual return. The hypothetical account values and expenses may not be used to estimate the actual ending account balance or expenses you paid for the period. You may use this information to compare the ongoing costs of investing in the fund and other funds. To do so, compare this 5% hypothetical example with the 5% hypothetical examples that appear in the shareholder reports of the other funds.
Please note that the expenses shown in the table are meant to highlight the fund’s ongoing costs only and do not take into account the fees and expenses imposed under the variable contracts through which your investment in the fund is made. Therefore, the second line for each share class in the table is useful in comparing ongoing costs associated with an investment in vehicles (such as the fund) which fund benefits under variable annuity and variable life insurance contracts and to qualified pension and retirement plans only, and will not help you determine the relative total costs of investing in the fund through variable annuity and variable life insurance contracts. If the fees and expenses imposed under the variable contracts were included, your costs would have been higher.
| Share Class | Annualized Expense Ratio | Beginning Account Value 7/01/11 | Ending Account Value 12/31/11 | Expenses Paid During Period (p) 7/01/11-12/31/11 | ||||||||||||||
| Initial Class | Actual | 0.69% | $1,000.00 | $1,026.11 | $3.52 | |||||||||||||
| Hypothetical (h) | 0.69% | $1,000.00 | $1,021.73 | $3.52 | ||||||||||||||
| Service Class | Actual | 0.94% | $1,000.00 | $1,025.27 | $4.80 | |||||||||||||
| Hypothetical (h) | 0.94% | $1,000.00 | $1,020.47 | $4.79 | ||||||||||||||
| (h) | 5% class return per year before expenses. |
| (p) | Expenses paid is equal to each class’ annualized expense ratio, as shown above, multiplied by the average account value over the period, multiplied by the number of days in the period, divided by the number of days in the year. |
5
Table of Contents
MFS Bond Portfolio
PORTFOLIO OF INVESTMENTS – 12/31/11
The Portfolio of Investments is a complete list of all securities owned by your fund. It is categorized by broad-based asset classes.
| Issuer | Shares/Par | Value ($) | ||||||
| BONDS – 97.7% | ||||||||
| Aerospace – 1.1% | ||||||||
| BE Aerospace, Inc., 8.5%, 2018 | $ | 2,258,000 | $ | 2,472,510 | ||||
| Bombardier, Inc., 7.75%, 2020 (n) | 406,000 | 442,540 | ||||||
|
| |||||||
| $ | 2,915,050 | |||||||
|
| |||||||
| Airlines – 0.6% | ||||||||
| Continental Airlines, Inc., 7.25%, 2021 | $ | 347,572 | $ | 370,164 | ||||
| Continental Airlines, Inc., FRN, 0.878%, 2013 | 1,233,255 | 1,158,883 | ||||||
|
| |||||||
| $ | 1,529,047 | |||||||
|
| |||||||
| Apparel Manufacturers – 0.5% | ||||||||
| Phillips-Van Heusen Corp., 7.375%, 2020 | $ | 1,174,000 | $ | 1,273,790 | ||||
|
| |||||||
| Asset-Backed & Securitized – 4.7% | ||||||||
| Anthracite Ltd., “A”, CDO, FRN, 0.651%, 2019 (z) | $ | 404,829 | $ | 333,984 | ||||
| ARCap REIT, Inc., CDO, “G”, FRN, 6.099%, 2045 (a)(d)(z) | 350,000 | 108 | ||||||
| Bayview Financial Revolving Mortgage Loan Trust, FRN, 1.893%, 2040 (z) | 326,499 | 186,037 | ||||||
| Capital Trust Realty Ltd., CDO, 5.16%, 2035 (n) | 1,432,076 | 1,420,619 | ||||||
| Citigroup/Deutsche Bank Commercial Mortgage Trust, 5.322%, 2049 | 514,266 | 545,458 | ||||||
| Commercial Mortgage Acceptance Corp., FRN, 1.869%, 2030 (i) | 954,910 | 39,884 | ||||||
| Credit Suisse Mortgage Capital Certificate, 5.311%, 2039 | 454,000 | 484,575 | ||||||
| Crest Ltd., “A2”, CDO, 4.669%, 2018 (z) | 350,384 | 311,842 | ||||||
| Falcon Franchise Loan LLC, FRN, 4.806%, 2025 (i)(z) | 907,873 | 115,572 | ||||||
| First Union-Lehman Brothers Commercial Mortgage Trust, 7%, 2029 (n) | 43,924 | 44,392 | ||||||
| FUEL Trust, 4.207%, 2016 (n) | 560,000 | 564,754 | ||||||
| FUEL Trust, 3.984%, 2016 (n) | 638,000 | 637,914 | ||||||
| G-Force LLC, CDO, “A2”, 4.83%, 2036 (z) | 648,880 | 617,247 | ||||||
| GMAC LLC, FRN, 6.02%, 2033 (z) | 344,387 | 353,617 | ||||||
| GMAC LLC, FRN, 7.718%, 2034 (d)(n)(q) | 825,000 | 673,719 | ||||||
| Greenwich Capital Commercial Funding Corp., FRN, 5.882%, 2038 | 350,000 | 355,110 | ||||||
| JPMorgan Chase Commercial Mortgage Securities Corp., FRN, 5.399%, 2042 (n) | 765,072 | 101,602 | ||||||
| JPMorgan Chase Commercial Mortgage Securities Corp., FRN, 5.816%, 2049 | 1,195,039 | 1,270,000 | ||||||
| JPMorgan Chase Commercial Mortgage Securities Corp., FRN, 5.986%, 2051 | 2,617,888 | 2,785,294 | ||||||
| KKR Financial CLO Ltd., “C”, FRN, 1.907%, 2021 (n) | 505,395 | 368,938 | ||||||
| Lehman Brothers Commercial Conduit Mortgage Trust, FRN, 0.891%, 2030 (i) | 1,318,496 | 21,211 | ||||||
| Morgan Stanley Capital I, Inc., FRN, 0.983%, 2030 (i)(n) | 2,309,926 | 62,146 | ||||||
| Prudential Securities Secured Financing Corp., FRN, 7.289%, 2013 (z) | 567,000 | 521,033 | ||||||
| Spirit Master Funding LLC, 5.05%, 2023 (z) | 337,060 | 310,837 | ||||||
|
| |||||||
| $ | 12,125,893 | |||||||
|
| |||||||
| Issuer | Shares/Par | Value ($) | ||||||
| BONDS – continued | ||||||||
| Automotive – 2.8% | ||||||||
| Ford Motor Credit Co. LLC, 8%, 2014 | $ | 1,415,000 | $ | 1,540,181 | ||||
| Harley-Davidson Financial Services, 3.875%, 2016 (n) | 1,061,000 | 1,099,103 | ||||||
| Lear Corp., 8.125%, 2020 | 2,372,000 | 2,609,200 | ||||||
| RCI Banque S.A., 4.6%, 2016 (n) | 802,000 | 763,412 | ||||||
| TRW Automotive, Inc., 7.25%, 2017 (n) | 1,093,000 | 1,169,510 | ||||||
|
| |||||||
| $ | 7,181,406 | |||||||
|
| |||||||
| Biotechnology – 0.2% | ||||||||
| Life Technologies Corp., 6%, 2020 | $ | 360,000 | $ | 402,422 | ||||
|
| |||||||
| Broadcasting – 2.1% | ||||||||
| CBS Corp., 8.875%, 2019 | $ | 760,000 | $ | 976,138 | ||||
| CBS Corp., 5.75%, 2020 | 440,000 | 494,684 | ||||||
| News America, Inc., 8.5%, 2025 | 770,000 | 945,307 | ||||||
| News America, Inc., 6.15%, 2041 | 278,000 | 320,420 | ||||||
| SIRIUS XM Radio, Inc., 13%, 2013 (n) | 2,005,000 | 2,275,675 | ||||||
| WPP Finance, 8%, 2014 | 366,000 | 407,691 | ||||||
|
| |||||||
| $ | 5,419,915 | |||||||
|
| |||||||
| Brokerage & Asset Managers – 0.4% | ||||||||
| TD Ameritrade Holding Co., 4.15%, 2014 | $ | 855,000 | $ | 903,640 | ||||
|
| |||||||
| Building – 1.7% | ||||||||
| Mohawk Industries, Inc., 6.875%, 2016 | $ | 1,840,000 | $ | 1,978,000 | ||||
| Owens Corning, Inc., 6.5%, 2016 | 2,221,000 | 2,423,959 | ||||||
|
| |||||||
| $ | 4,401,959 | |||||||
|
| |||||||
| Cable TV – 3.6% | ||||||||
| CCH II LLC, 13.5%, 2016 | $ | 1,500,000 | $ | 1,732,500 | ||||
| Cox Communications, Inc., 6.25%, 2018 (n) | 261,000 | 303,941 | ||||||
| DIRECTV Holdings LLC, 7.625%, 2016 | 570,000 | 604,913 | ||||||
| DIRECTV Holdings LLC, 5.875%, 2019 | 490,000 | 551,554 | ||||||
| DIRECTV Holdings LLC, 6.375%, 2041 | 690,000 | 795,584 | ||||||
| Myriad International Holdings B.V., 6.375%, 2017 (n) | 586,000 | 624,090 | ||||||
| TCI Communications, Inc., 9.8%, 2012 | 439,000 | 441,910 | ||||||
| Time Warner Cable, Inc., 8.25%, 2019 | 850,000 | 1,067,610 | ||||||
| Time Warner Cable, Inc., 5%, 2020 | 354,000 | 387,854 | ||||||
| Time Warner Cable, Inc., 4%, 2021 | 470,000 | 475,512 | ||||||
| Time Warner Entertainment Co. LP, 8.375%, 2033 | 266,000 | 348,652 | ||||||
| Virgin Media Finance PLC, 9.5%, 2016 | 1,600,000 | 1,796,000 | ||||||
|
| |||||||
| $ | 9,130,120 | |||||||
|
| |||||||
| Chemicals – 3.2% | ||||||||
| Ashland, Inc., 9.125%, 2017 | $ | 1,432,000 | $ | 1,596,680 | ||||
| CF Industries Holdings, Inc., 7.125%, 2020 | 526,000 | 621,995 | ||||||
| Dow Chemical Co., 8.55%, 2019 | 1,936,000 | 2,532,923 | ||||||
| Lyondell Chemical Co., 11%, 2018 | 1,554,693 | 1,698,502 | ||||||
| LyondellBasell Industries, Inc., 6%, 2021 (n) | 255,000 | 264,562 | ||||||
| Nalco Co., 8.25%, 2017 | 1,321,000 | 1,499,335 | ||||||
|
| |||||||
| $ | 8,213,997 | |||||||
|
| |||||||
| Conglomerates – 0.2% | ||||||||
| Kennametal, Inc., 7.2%, 2012 | $ | 526,000 | $ | 540,149 | ||||
|
| |||||||
6
Table of Contents
MFS Bond Portfolio
Portfolio of Investments – continued
| Issuer | Shares/Par | Value ($) | ||||||
| BONDS – continued | ||||||||
| Consumer Products – 1.5% | ||||||||
| Hasbro, Inc., 6.35%, 2040 | $ | 1,544,000 | $ | 1,669,186 | ||||
| Mattel, Inc., 5.45%, 2041 | 815,000 | 825,248 | ||||||
| Newell Rubbermaid, Inc., 5.5%, 2013 | 1,202,000 | 1,260,351 | ||||||
|
| |||||||
| $ | 3,754,785 | |||||||
|
| |||||||
| Consumer Services – 0.5% | ||||||||
| Service Corp. International, 7.375%, 2014 | $ | 820,000 | $ | 891,750 | ||||
| Service Corp. International, 7%, 2019 | 450,000 | 473,625 | ||||||
|
| |||||||
| $ | 1,365,375 | |||||||
|
| |||||||
| Containers – 1.5% | ||||||||
| Crown Americas LLC, 7.625%, 2017 | $ | 2,356,000 | $ | 2,570,985 | ||||
| Greif, Inc., 6.75%, 2017 | 1,136,000 | 1,187,120 | ||||||
|
| |||||||
| $ | 3,758,105 | |||||||
|
| |||||||
| Defense Electronics – 0.6% | ||||||||
| BAE Systems Holdings, Inc., 6.375%, 2019 (n) | $ | 1,358,000 | $ | 1,519,288 | ||||
|
| |||||||
| Electronics – 0.5% | ||||||||
| Intel Corp., 4.8%, 2041 | $ | 690,000 | $ | 773,288 | ||||
| Tyco Electronics Group S.A., 6.55%, 2017 | 360,000 | 415,871 | ||||||
|
| |||||||
| $ | 1,189,159 | |||||||
|
| |||||||
| Emerging Market Quasi-Sovereign – 1.7% | ||||||||
| Centrais Eletricas Brasileiras S.A., 5.75%, 2021 (n) | $ | 1,400,000 | $ | 1,454,600 | ||||
| Gaz Capital S.A., 8.125%, 2014 (n) | 409,000 | 441,720 | ||||||
| Petrobras International Finance Co., 3.875%, 2016 | 1,179,000 | 1,214,619 | ||||||
| Petroleos Mexicanos, 6.5%, 2041 | 70,000 | 78,750 | ||||||
| Petroleos Mexicanos, 6.5%, 2041 (n) | 928,000 | 1,044,000 | ||||||
|
| |||||||
| $ | 4,233,689 | |||||||
|
| |||||||
| Energy – Independent – 5.9% | ||||||||
| Anadarko Petroleum Corp., 6.375%, 2017 | $ | 1,337,000 | $ | 1,549,762 | ||||
| Anadarko Petroleum Corp., 6.45%, 2036 | 804,000 | 916,641 | ||||||
| Anadarko Petroleum Corp., 6.2%, 2040 | 750,000 | 834,667 | ||||||
| Chesapeake Energy Corp., 6.875%, 2020 | 1,071,000 | 1,145,970 | ||||||
| Newfield Exploration Co., 6.625%, 2016 | 1,715,000 | 1,766,450 | ||||||
| Noble Energy, Inc., 4.15%, 2021 | 1,920,000 | 1,986,227 | ||||||
| OGX Petroleo e Gas Participacoes S.A., 8.5%, 2018 (n) | 1,180,000 | 1,156,400 | ||||||
| Pioneer Natural Resources Co., 6.65%, 2017 | 1,100,000 | 1,217,113 | ||||||
| Pioneer Natural Resources Co., 7.5%, 2020 | 1,518,000 | 1,780,373 | ||||||
| Southwestern Energy Co., 7.5%, 2018 | 1,851,000 | 2,133,277 | ||||||
| Talisman Energy, Inc., 7.75%, 2019 | 590,000 | 727,506 | ||||||
|
| |||||||
| $ | 15,214,386 | |||||||
|
| |||||||
| Energy – Integrated – 1.8% | ||||||||
| BG Energy Capital PLC, 5.125%, 2041 (n) | $ | 906,000 | $ | 980,477 | ||||
| BP Capital Markets PLC, 4.5%, 2020 | 747,000 | 822,724 | ||||||
| BP Capital Markets PLC, 3.561%, 2021 | 1,110,000 | 1,155,603 | ||||||
| Hess Corp., 8.125%, 2019 | 440,000 | 564,812 | ||||||
| LUKOIL International Finance B.V., 6.125%, 2020 (n) | 1,199,000 | 1,175,020 | ||||||
|
| |||||||
| $ | 4,698,636 | |||||||
|
| |||||||
| Issuer | Shares/Par | Value ($) | ||||||
| BONDS – continued | ||||||||
| Entertainment – 0.7% | ||||||||
| Viacom, Inc., 3.5%, 2017 | $ | 800,000 | $ | 833,530 | ||||
| Viacom, Inc., 3.875%, 2021 | 1,000,000 | 1,020,869 | ||||||
|
| |||||||
| $ | 1,854,399 | |||||||
|
| |||||||
| Financial Institutions – 2.7% | ||||||||
| CIT Group, Inc., 6.625%, 2018 (n) | $ | 1,900,000 | $ | 1,966,500 | ||||
| General Electric Capital Corp., 3.75%, 2014 | 413,000 | 435,330 | ||||||
| General Electric Capital Corp., 5.5%, 2020 | 1,470,000 | 1,617,429 | ||||||
| International Lease Finance Corp., 8.75%, 2017 | 90,000 | 92,700 | ||||||
| International Lease Finance Corp., 7.125%, 2018 (n) | 570,000 | 589,950 | ||||||
| International Lease Finance Corp., 6.25%, 2019 | 1,147,000 | 1,059,587 | ||||||
| SLM Corp., 6.25%, 2016 | 727,000 | 706,992 | ||||||
| SLM Corp., 8%, 2020 | 468,000 | 472,680 | ||||||
|
| |||||||
| $ | 6,941,168 | |||||||
|
| |||||||
| Food & Beverages – 5.3% | ||||||||
| Anheuser-Busch InBev S.A., 7.75%, 2019 | $ | 610,000 | $ | 790,047 | ||||
| Anheuser-Busch InBev Worldwide, Inc., 6.375%, 2040 | 690,000 | 948,101 | ||||||
| J.M. Smucker Co., 3.5%, 2021 | 880,000 | 900,282 | ||||||
| Kraft Foods, Inc., 6.5%, 2040 | 1,475,000 | 1,918,886 | ||||||
| Miller Brewing Co., 5.5%, 2013 (n) | 1,724,000 | 1,837,782 | ||||||
| Pernod Ricard S.A., 5.75%, 2021 (n) | 831,000 | 937,535 | ||||||
| Pernod-Ricard S.A., 4.45%, 2022 (n) | 524,000 | 548,935 | ||||||
| Smithfield Foods, Inc., 7.75%, 2017 | 1,370,000 | 1,500,150 | ||||||
| Tyson Foods, Inc., 6.85%, 2016 | 2,229,000 | 2,446,327 | ||||||
| Wm. Wrigley Jr. Co., 3.05%, 2013 (n) | 1,797,000 | 1,829,817 | ||||||
|
| |||||||
| $ | 13,657,862 | |||||||
|
| |||||||
| Food & Drug Stores – 1.1% | ||||||||
| CVS Caremark Corp., 3.25%, 2015 | $ | 296,000 | $ | 312,088 | ||||
| CVS Caremark Corp., 5.75%, 2017 | 664,000 | 774,783 | ||||||
| CVS Caremark Corp., 5.75%, 2041 | 1,465,000 | 1,744,421 | ||||||
|
| |||||||
| $ | 2,831,292 | |||||||
|
| |||||||
| Forest & Paper Products – 0.5% | ||||||||
| Georgia-Pacific Corp., 5.4%, 2020 (n) | $ | 806,000 | $ | 892,764 | ||||
| International Paper Co., 6%, 2041 | 360,000 | 390,821 | ||||||
|
| |||||||
| $ | 1,283,585 | |||||||
|
| |||||||
| Gaming & Lodging – 2.3% | ||||||||
| Host Hotels & Resorts, Inc., 6.75%, 2016 | $ | 1,600,000 | $ | 1,644,000 | ||||
| Starwood Hotels & Resorts Worldwide, Inc., 6.75%, 2018 | 150,000 | 169,500 | ||||||
| Wyndham Worldwide Corp., 6%, 2016 | 2,530,000 | 2,728,352 | ||||||
| Wynn Las Vegas LLC, 7.75%, 2020 | 1,200,000 | 1,332,000 | ||||||
|
| |||||||
| $ | 5,873,852 | |||||||
|
| |||||||
| Insurance – 1.7% | ||||||||
| American International Group, Inc., 6.4%, 2020 | $ | 1,200,000 | $ | 1,211,076 | ||||
| Metropolitan Life Global Funding I, 5.125%, 2014 (n) | 370,000 | 398,389 | ||||||
7
Table of Contents
MFS Bond Portfolio
Portfolio of Investments – continued
| Issuer | Shares/Par | Value ($) | ||||||
| BONDS – continued | ||||||||
| Insurance – continued | ||||||||
| Prudential Financial, Inc., 4.75%, 2015 | $ | 631,000 | $ | 666,269 | ||||
| Unum Group, 7.125%, 2016 | 500,000 | 570,553 | ||||||
| UnumProvident Corp., 6.85%, 2015 (n) | 1,340,000 | 1,483,576 | ||||||
|
| |||||||
| $ | 4,329,863 | |||||||
|
| |||||||
| Insurance – Health – 1.2% | ||||||||
| CIGNA Corp., 2.75%, 2016 | $ | 1,400,000 | $ | 1,396,933 | ||||
| CIGNA Corp., 5.375%, 2042 | 700,000 | 695,976 | ||||||
| Humana, Inc., 7.2%, 2018 | 754,000 | 879,514 | ||||||
|
| |||||||
| $ | 2,972,423 | |||||||
|
| |||||||
| Insurance – Property & Casualty – 2.4% | ||||||||
| AXIS Capital Holdings Ltd., 5.75%, 2014 | $ | 855,000 | $ | 898,972 | ||||
| AXIS Capital Holdings Ltd., 5.875%, 2020 | 190,000 | 195,339 | ||||||
| Chubb Corp., 6.375% to 2017, FRN to 2067 | 279,000 | 275,512 | ||||||
| CNA Financial Corp., 5.875%, 2020 | 1,570,000 | 1,612,781 | ||||||
| Marsh & McLennan Cos., Inc., 4.8%, 2021 | 500,000 | 547,283 | ||||||
| XL Group PLC, 5.75%, 2021 | 1,110,000 | 1,171,468 | ||||||
| XL Group PLC, 6.5% to 2017, FRN to 2049 | 663,000 | 518,797 | ||||||
| ZFS Finance USA Trust V, 6.5% to 2017, FRN to 2067 (n) | 896,000 | 806,400 | ||||||
|
| |||||||
| $ | 6,026,552 | |||||||
|
| |||||||
| Machinery & Tools – 0.9% | ||||||||
| Case New Holland, Inc., 7.875%, 2017 | $ | 1,989,000 | $ | 2,247,570 | ||||
|
| |||||||
| Major Banks – 6.6% | ||||||||
| Bank of America Corp., 5.65%, 2018 | $ | 580,000 | $ | 552,597 | ||||
| Bank of America Corp., 7.625%, 2019 | 500,000 | 517,109 | ||||||
| Bank of America Corp., 5.625%, 2020 | 185,000 | 170,891 | ||||||
| BB&T Corp., 3.95%, 2016 | 500,000 | 537,180 | ||||||
| Commonwealth Bank of Australia, 5%, 2019 (n) | 400,000 | 424,216 | ||||||
| Goldman Sachs Group, Inc., 5.625%, 2017 | 1,123,000 | 1,101,205 | ||||||
| Goldman Sachs Group, Inc., 7.5%, 2019 | 1,927,000 | 2,128,196 | ||||||
| HSBC USA, Inc., 4.875%, 2020 | 1,540,000 | 1,429,021 | ||||||
| JPMorgan Chase & Co., 4.25%, 2020 | 893,000 | 899,272 | ||||||
| Macquarie Group Ltd., 6%, 2020 (n) | 418,000 | 392,086 | ||||||
| Merrill Lynch & Co., Inc., 6.15%, 2013 | 500,000 | 504,684 | ||||||
| Merrill Lynch & Co., Inc., 6.05%, 2016 | 349,000 | 328,953 | ||||||
| Morgan Stanley, 5.75%, 2016 | 906,000 | 882,372 | ||||||
| Morgan Stanley, 7.3%, 2019 | 1,240,000 | 1,262,877 | ||||||
| PNC Funding Corp., 5.625%, 2017 | 1,095,000 | 1,192,318 | ||||||
| Santander UK PLC, 3.875%, 2014 (n) | 413,000 | 387,603 | ||||||
| SunTrust Banks, Inc., 3.5%, 2017 | 366,000 | 367,887 | ||||||
| UniCredito Luxembourg Finance S.A., 6%, 2017 (n) | 510,000 | 383,803 | ||||||
| Wachovia Corp., 6.605%, 2025 | 1,270,000 | 1,447,166 | ||||||
| Wells Fargo & Co., 2.625%, 2016 | 1,919,000 | 1,917,829 | ||||||
|
| |||||||
| $ | 16,827,265 | |||||||
|
| |||||||
| Medical & Health Technology & Services – 2.2% | ||||||||
| Davita, Inc., 6.625%, 2020 | $ | 1,540,000 | $ | 1,582,350 | ||||
| Fresenius Medical Care AG & Co. KGaA, 9%, 2015 (n) | 1,775,000 | 1,990,219 | ||||||
| Hospira, Inc., 6.05%, 2017 | 906,000 | 1,000,229 | ||||||
| McKesson Corp., 5.7%, 2017 | 770,000 | 898,343 | ||||||
| Issuer | Shares/Par | Value ($) | ||||||
| BONDS – continued | ||||||||
| Medical & Health Technology & Services – continued | ||||||||
| McKesson Corp., 7.5%, 2019 | $ | 120,000 | $ | 153,709 | ||||
|
| |||||||
| $ | 5,624,850 | |||||||
|
| |||||||
| Metals & Mining – 4.4% | ||||||||
| ArcelorMittal, 6.5%, 2014 | $ | 362,000 | $ | 382,718 | ||||
| ArcelorMittal, 3.75%, 2016 | 584,000 | 554,384 | ||||||
| ArcelorMittal, 9.85%, 2019 | 1,254,000 | 1,394,719 | ||||||
| Gold Fields Orogen Holding Ltd., 4.875%, 2020 (n) | 1,701,000 | 1,501,883 | ||||||
| Peabody Energy Corp., 7.375%, 2016 | 1,591,000 | 1,750,100 | ||||||
| Southern Copper Corp., 6.75%, 2040 | 1,764,000 | 1,765,087 | ||||||
| Teck Resources Ltd., 10.75%, 2019 | 940,000 | 1,146,800 | ||||||
| Vale Overseas Ltd., 5.625%, 2019 | 2,501,000 | 2,755,104 | ||||||
|
| |||||||
| $ | 11,250,795 | |||||||
|
| |||||||
| Mortgage-Backed – 0.0% | ||||||||
| Fannie Mae, 7.5%, 2030 - 2031 | $ | 57,867 | $ | 69,204 | ||||
|
| |||||||
| Natural Gas – Pipeline – 3.9% | ||||||||
| El Paso Pipeline Partners LP, 6.5%, 2020 | $ | 940,000 | $ | 1,035,998 | ||||
| El Paso Pipeline Partners LP, 5%, 2021 | 311,000 | 320,086 | ||||||
| Energy Transfer Partners LP, 8.5%, 2014 | 1,252,000 | 1,403,721 | ||||||
| Energy Transfer Partners LP, 9.7%, 2019 | 480,000 | 588,072 | ||||||
| Enterprise Products Operating LP, 5.65%, 2013 | 354,000 | 370,645 | ||||||
| Enterprise Products Partners LP, 6.3%, 2017 | 540,000 | 632,409 | ||||||
| Enterprise Products Partners LP, 8.375% to 2016, FRN to 2066 | 506,000 | 541,420 | ||||||
| Enterprise Products Partners LP, 7.034% to 2018, FRN to 2068 | 267,000 | 277,680 | ||||||
| Kinder Morgan Energy Partners, 6.85%, 2020 | 370,000 | 435,055 | ||||||
| Kinder Morgan Energy Partners LP, 5.125%, 2014 | 410,000 | 443,549 | ||||||
| Kinder Morgan Energy Partners LP, 7.4%, 2031 | 581,000 | 694,233 | ||||||
| Plains All American Pipeline, LP, 3.95%, 2015 | 1,290,000 | 1,366,030 | ||||||
| Rockies Express Pipeline, 5.625%, 2020 (n) | 697,000 | 663,778 | ||||||
| Spectra Energy Capital LLC, 8%, 2019 | 942,000 | 1,185,428 | ||||||
|
| |||||||
| $ | 9,958,104 | |||||||
|
| |||||||
| Network & Telecom – 2.7% | ||||||||
| AT&T, Inc., 5.35%, 2040 | $ | 600,000 | $ | 674,940 | ||||
| AT&T, Inc., 5.55%, 2041 | 1,024,000 | 1,205,675 | ||||||
| CenturyLink, Inc., 7.6%, 2039 | 580,000 | 569,134 | ||||||
| Telefonica Emisiones S.A.U., 5.134%, 2020 | 1,200,000 | 1,127,182 | ||||||
| Telefonica Emisiones S.A.U., 5.462%, 2021 | 760,000 | 725,242 | ||||||
| Verizon Communications, Inc., 6%, 2041 | 690,000 | 855,511 | ||||||
| Windstream Corp., 7.75%, 2021 | 1,815,000 | 1,860,375 | ||||||
|
| |||||||
| $ | 7,018,059 | |||||||
|
| |||||||
| Oil Services – 0.4% | ||||||||
| Transocean, Inc., 6%, 2018 | $ | 490,000 | $ | 500,790 | ||||
| Transocean, Inc., 6.5%, 2020 | 500,000 | 516,496 | ||||||
|
| |||||||
| $ | 1,017,286 | |||||||
|
| |||||||
8
Table of Contents
MFS Bond Portfolio
Portfolio of Investments – continued
| Issuer | Shares/Par | Value ($) | ||||||
| BONDS – continued | ||||||||
| Other Banks & Diversified Financials – 2.9% | ||||||||
| American Express Centurion Bank, 5.5%, 2013 | $ | 590,000 | $ | 616,699 | ||||
| American Express Co., 8.125%, 2019 | 320,000 | 413,719 | ||||||
| Banco Bradesco S.A., 6.75%, 2019 (n) | 786,000 | 860,670 | ||||||
| Banco Santander U.S. Debt S.A.U., 3.781%, 2015 (n) | 1,500,000 | 1,359,382 | ||||||
| Capital One Financial Corp., 8.8%, 2019 | 1,000,000 | 1,143,990 | ||||||
| Capital One Financial Corp., 10.25%, 2039 | 510,000 | 529,125 | ||||||
| Citigroup, Inc., 6.125%, 2018 | 635,000 | 675,867 | ||||||
| Discover Bank, 7%, 2020 | 1,426,000 | 1,491,978 | ||||||
| Santander Holdings USA, Inc., 4.625%, 2016 | 290,000 | 278,490 | ||||||
|
| |||||||
| $ | 7,369,920 | |||||||
|
| |||||||
| Pharmaceuticals – 1.5% | ||||||||
| Celgene Corp., 2.45%, 2015 | $ | 606,000 | $ | 613,925 | ||||
| Mylan Laboratories, Inc., 7.625%, 2017 (n) | 1,777,000 | 1,939,151 | ||||||
| Teva Pharmaceutical Finance IV LLC, 3.65%, 2021 | 1,330,000 | 1,352,790 | ||||||
|
| |||||||
| $ | 3,905,866 | |||||||
|
| |||||||
| Pollution Control – 1.0% | ||||||||
| Allied Waste North America, Inc., 6.875%, 2017 | $ | 1,110,000 | $ | 1,173,825 | ||||
| Republic Services, Inc., 5.25%, 2021 | 1,160,000 | 1,315,310 | ||||||
|
| |||||||
| $ | 2,489,135 | |||||||
|
| |||||||
| Precious Metals & Minerals – 0.3% | ||||||||
| Teck Resources Ltd., 6.25%, 2041 | $ | 750,000 | $ | 866,410 | ||||
|
| |||||||
| Printing & Publishing – 0.1% | ||||||||
| Pearson PLC, 5.5%, 2013 (n) | $ | 260,000 | $ | 273,369 | ||||
|
| |||||||
| Railroad & Shipping – 0.5% | ||||||||
| CSX Corp., 7.375%, 2019 | $ | 365,000 | $ | 454,945 | ||||
| Kansas City Southern, 8%, 2018 | 757,000 | 828,915 | ||||||
|
| |||||||
| $ | 1,283,860 | |||||||
|
| |||||||
| Real Estate – 2.9% | ||||||||
| Boston Properties LP, REIT, 3.7%, 2018 | $ | 754,000 | $ | 769,896 | ||||
| ERP Operating LP, REIT, 4.625%, 2021 | 670,000 | 683,235 | ||||||
| HCP, Inc., REIT, 5.375%, 2021 | 1,369,000 | 1,435,239 | ||||||
| HRPT Properties Trust, REIT, 6.25%, 2016 | 1,027,000 | 1,088,872 | ||||||
| Simon Property Group, Inc., REIT, 5.75%, 2015 | 440,000 | 492,258 | ||||||
| Simon Property Group, Inc., REIT, 10.35%, 2019 | 1,026,000 | 1,408,390 | ||||||
| WEA Finance LLC, REIT, 6.75%, 2019 (n) | 1,447,000 | 1,613,906 | ||||||
|
| |||||||
| $ | 7,491,796 | |||||||
|
| |||||||
| Retailers – 2.3% | ||||||||
| Gap, Inc., 5.95%, 2021 | $ | 1,149,000 | $ | 1,095,917 | ||||
| Home Depot, Inc., 5.95%, 2041 | 1,554,000 | 2,004,958 | ||||||
| Kohl’s Corp., 4%, 2021 | 1,117,000 | 1,144,416 | ||||||
| Limited Brands, Inc., 7%, 2020 | 1,441,000 | 1,559,882 | ||||||
|
| |||||||
| $ | 5,805,173 | |||||||
|
| |||||||
| Specialty Chemicals – 0.3% | ||||||||
| Ecolab, Inc., 5.5%, 2041 | $ | 799,000 | $ | 885,405 | ||||
|
| |||||||
| Issuer | Shares/Par | Value ($) | ||||||
| BONDS – continued | ||||||||
| Specialty Stores – 0.4% | ||||||||
| Advance Auto Parts, Inc., 5.75%, 2020 | $ | 965,000 | $ | 1,056,825 | ||||
|
| |||||||
| Telecommunications – Wireless – 2.6% | ||||||||
| America Movil S.A.B. de C.V., 2.375%, 2016 | $ | 592,000 | $ | 590,351 | ||||
| America Movil S.A.B. de C.V., 6.125%, 2040 | 358,000 | 425,647 | ||||||
| American Tower Corp., 4.625%, 2015 | 1,770,000 | 1,844,892 | ||||||
| American Tower Corp., 4.5%, 2018 | 1,150,000 | 1,169,852 | ||||||
| Crown Castle International Corp., 7.75%, 2017 (n) | 960,000 | 1,034,400 | ||||||
| Crown Castle Towers LLC, 6.113%, 2020 (n) | 955,000 | 1,053,689 | ||||||
| Rogers Cable, Inc., 5.5%, 2014 | 364,000 | 392,369 | ||||||
| Vodafone Group PLC, 5.625%, 2017 | 201,000 | 233,388 | ||||||
|
| |||||||
| $ | 6,744,588 | |||||||
|
| |||||||
| Telephone Services – 0.2% | ||||||||
| Embarq Corp., 7.082%, 2016 | $ | 540,000 | $ | 585,331 | ||||
|
| |||||||
| Tobacco – 3.1% | ||||||||
| Altria Group, Inc., 9.95%, 2038 | $ | 736,000 | $ | 1,119,443 | ||||
| BAT International Finance PLC, 9.5%, 2018 (n) | 1,048,000 | 1,423,058 | ||||||
| Lorillard Tobacco Co., 8.125%, 2019 | 2,257,000 | 2,688,534 | ||||||
| Lorillard Tobacco Co., 7%, 2041 | 434,000 | 456,183 | ||||||
| Reynolds American, Inc., 7.25%, 2012 | 881,000 | 902,383 | ||||||
| Reynolds American, Inc., 6.75%, 2017 | 1,100,000 | 1,250,291 | ||||||
|
| |||||||
| $ | 7,839,892 | |||||||
|
| |||||||
| Transportation – Services – 0.3% | ||||||||
| Erac USA Finance Co., 6.375%, 2017 (n) | $ | 200,000 | $ | 231,111 | ||||
| Erac USA Finance Co., 7%, 2037 (n) | 534,000 | 642,442 | ||||||
|
| |||||||
| $ | 873,553 | |||||||
|
| |||||||
| Utilities – Electric Power – 5.2% | ||||||||
| Allegheny Energy Supply Co. LLC, 8.25%, 2012 (n) | $ | 610,000 | $ | 621,014 | ||||
| CenterPoint Energy, Inc., 5.95%, 2017 | 800,000 | 904,760 | ||||||
| CMS Energy Corp., 2.75%, 2014 | 780,000 | 770,356 | ||||||
| CMS Energy Corp., 6.25%, 2020 | 918,000 | 964,006 | ||||||
| Dominion Resources, Inc., 4.9%, 2041 | 700,000 | 755,861 | ||||||
| EDP Finance B.V., 6%, 2018 (n) | 1,863,000 | 1,567,124 | ||||||
| Enel Finance International S.A., 6%, 2039 (n) | 1,132,000 | 911,086 | ||||||
| Enersis S.A., 7.375%, 2014 | 686,000 | 749,644 | ||||||
| FirstEnergy Solutions Corp., 6.05%, 2021 | 1,766,000 | 1,959,721 | ||||||
| Oncor Electric Delivery Co., 6.8%, 2018 | 561,000 | 682,232 | ||||||
| PPL Energy Supply LLC, 4.6%, 2021 | 1,200,000 | 1,216,919 | ||||||
| PPL WEM Holdings PLC, 5.375%, 2021 (n) | 1,057,000 | 1,108,423 | ||||||
| PSEG Power LLC, 5.32%, 2016 | 288,000 | 321,228 | ||||||
| System Energy Resources, Inc., 5.129%, 2014 (z) | 254,274 | 259,573 | ||||||
| Waterford 3 Funding Corp., 8.09%, 2017 | 559,371 | 552,424 | ||||||
|
| |||||||
| $ | 13,344,371 | |||||||
|
| |||||||
| Total Bonds (Identified Cost, $241,414,555) | $ | 250,370,434 | ||||||
|
| |||||||
9
Table of Contents
MFS Bond Portfolio
Portfolio of Investments – continued
| Issuer | Shares/Par | Value ($) | ||||||
| MONEY MARKET FUNDS – 0.5% | ||||||||
| MFS Institutional Money Market Portfolio, 0.05%, at Cost and Net Asset Value (v) | 1,192,839 | $ | 1,192,839 | |||||
|
| |||||||
| Total Investments (Identified Cost, $242,607,394) | $ | 251,563,273 | ||||||
|
| |||||||
| OTHER ASSETS, LESS LIABILITIES – 1.8% | 4,626,188 | |||||||
|
| |||||||
| Net Assets – 100.0% | $ | 256,189,461 | ||||||
|
| |||||||
| (a) | Non-income producing security. |
| (d) | In default. Interest and/or scheduled principal payment(s) have been missed. |
| (i) | Interest only security for which the fund receives interest on notional principal (Par amount). Par amount shown is the notional principal and does not reflect the cost of the security. |
| (n) | Securities exempt from registration under Rule 144A of the Securities Act of 1933. These securities may be sold in the ordinary course of business in transactions exempt from registration, normally to qualified institutional buyers. At period end, the aggregate value of these securities was $50,262,483, representing 19.6% of net assets. |
| (q) | Interest received was less than stated coupon rate. |
| (v) | Underlying affiliated fund that is available only to investment companies managed by MFS. The rate quoted for the MFS Institutional Money Market Portfolio is the annualized seven-day yield of the fund at period end. |
| (z) | Restricted securities are not registered under the Securities Act of 1933 and are subject to legal restrictions on resale. These securities generally may be resold in transactions exempt from registration or to the public if the securities are subsequently registered. Disposal of these securities may involve time-consuming negotiations and prompt sale at an acceptable price may be difficult. The fund holds the following restricted securities: |
| Restricted Securities | Acquisition Date | Cost | Value | |||||||
| ARCap REIT, Inc., CDO, “G”, FRN, 6.099%, 2045 | 9/21/04 | $323,381 | $108 | |||||||
| Anthracite Ltd., “A”, CDO, FRN, 0.651%, 2019 | 1/15/10 | 300,427 | 333,984 | |||||||
| Bayview Financial Revolving Mortgage Loan Trust, FRN, 1.893%, 2040 | 3/01/06 | 326,499 | 186,037 | |||||||
| Crest Ltd., “A2”, CDO, 4.669%, 2018 | 3/02/10 | 292,232 | 311,842 | |||||||
| Falcon Franchise Loan LLC, FRN, 4.806%, 2025 | 1/29/03 | 74,104 | 115,572 | |||||||
| G-Force LLC, CDO, “A2”, 4.83%, 2036 | 1/20/11 | 629,946 | 617,247 | |||||||
| GMAC LLC, FRN, 6.02%, 2033 | 3/20/02 | 215,796 | 353,617 | |||||||
| Prudential Securities Secured Financing Corp., FRN, 7.289%, 2013 | 12/06/04 | 577,773 | 521,033 | |||||||
| Spirit Master Funding LLC, 5.05%, 2023 | 10/04/05 | 334,057 | 310,837 | |||||||
| System Energy Resources, Inc., 5.129%, 2014 | 4/16/04-9/08/04 | 254,350 | 259,573 | |||||||
| Total Restricted Securities | $3,009,850 | |||||||||
| % of Net Assets | 1.2% | |||||||||
The following abbreviations are used in this report and are defined:
| CDO | Collateralized Debt Obligation |
| CLO | Collateralized Loan Obligation |
| FRN | Floating Rate Note. Interest rate resets periodically and may not be the rate reported at period end. |
| PLC | Public Limited Company |
| REIT | Real Estate Investment Trust |
10
Table of Contents
MFS Bond Portfolio
Portfolio of Investments – continued
Derivative Contracts at 12/31/11
Swap Agreements at 12/31/11
| Expiration | Notional | Counterparty | Cash Flows to Receive | Cash Flows to Pay | Fair Value | |||||||||||||
| Liability Derivatives | ||||||||||||||||||
| Credit Default Swaps | ||||||||||||||||||
| 12/20/12 | USD | 910,000 | Merrill Lynch International | 1.00% (fixed rate) | (1) | $(136,446 | ) | |||||||||||
|
| |||||||||||||||||
| (1) | Fund, as protection seller, to pay notional amount upon a defined credit event by MBIA, Inc., 7%, 12/15/25, a B- rated bond. The fund entered into the contract to gain issuer exposure. |
The credit ratings presented here are an indicator of the current payment/performance risk of the related swap, the reference obligation for which may be either a single security or, in the case of a credit default index, a basket of securities issued by corporate or sovereign issuers. Ratings are assigned to each reference security, including each individual security within a reference basket of securities, utilizing ratings from Moody’s, Fitch, and Standard & Poor’s rating agencies and applying the following hierarchy: If all three agencies provide a rating, the middle rating (after dropping the highest and lowest ratings) is assigned; if two of the three agencies rate a security, the lower of the two is assigned. Ratings are shown in the S&P and Fitch scale (e.g., AAA). The ratings for a credit default index are calculated by MFS as a weighted average of the external credit ratings of the individual securities that compose the index’s reference basket of securities.
At December 31, 2011, the fund had sufficient cash and/or other liquid securities to cover any commitments under these derivative contracts.
See Notes to Financial Statements
11
Table of Contents
MFS Bond Portfolio
FINANCIAL STATEMENTS | STATEMENT OF ASSETS AND LIABILITIES
This statement represents your fund’s balance sheet, which details the assets and liabilities comprising the total value of the fund.
At 12/31/11 | ||||||||
Assets | ||||||||
Investments – | ||||||||
Non-affiliated issuers, at value (identified cost, $241,414,555) | $250,370,434 | |||||||
Underlying affiliated funds, at cost and value | 1,192,839 | |||||||
Total investments, at value (identified cost, $242,607,394) | $251,563,273 | |||||||
Restricted cash | 290,000 | |||||||
Receivables for | ||||||||
Investments sold | 779,388 | |||||||
Fund shares sold | 148,821 | |||||||
Interest | 3,643,120 | |||||||
Other assets | 7,617 | |||||||
Total assets | $256,432,219 | |||||||
Liabilities | ||||||||
Payables for | ||||||||
Fund shares reacquired | $35,668 | |||||||
Swaps, at value | 136,446 | |||||||
Payable to affiliates | ||||||||
Investment adviser | 13,309 | |||||||
Distribution and/or service fees | 3,389 | |||||||
Payable for Trustees’ compensation | 248 | |||||||
Accrued expenses and other liabilities | 53,698 | |||||||
Total liabilities | $242,758 | |||||||
Net assets | $256,189,461 | |||||||
Net assets consist of | ||||||||
Paid-in capital | $236,385,028 | |||||||
Unrealized appreciation (depreciation) on investments | 8,819,433 | |||||||
Accumulated net realized gain (loss) on investments | (2,435,015 | ) | ||||||
Undistributed net investment income | 13,420,015 | |||||||
Net assets | $256,189,461 | |||||||
Shares of beneficial interest outstanding | 22,093,126 |
| Net assets | Shares outstanding | Net asset value per share | ||||||||||
Initial Class | $90,822,158 | 7,784,475 | $11.67 | |||||||||
Service Class | 165,367,303 | 14,308,651 | 11.56 | |||||||||
See Notes to Financial Statements
12
Table of Contents
MFS Bond Portfolio
FINANCIAL STATEMENTS | STATEMENT OF OPERATIONS
This statement describes how much your fund earned in investment income and accrued in expenses. It also describes any gains and/or losses generated by fund operations.
Year ended 12/31/11 | ||||||||
Net investment income | ||||||||
| Income | ||||||||
Interest | $14,011,036 | |||||||
Dividends from underlying affiliated funds | 6,033 | |||||||
Total investment income | $14,017,069 | |||||||
| Expenses | ||||||||
Management fee | $1,518,408 | |||||||
Distribution and/or service fees | 401,528 | |||||||
Administrative services fee | 84,540 | |||||||
Trustees’ compensation | 27,914 | |||||||
Custodian fee | 34,368 | |||||||
Shareholder communications | 7,534 | |||||||
Auditing fees | 59,264 | |||||||
Legal fees | 5,468 | |||||||
Miscellaneous | 24,309 | |||||||
Total expenses | $2,163,333 | |||||||
Fees paid indirectly | (71 | ) | ||||||
Net expenses | $2,163,262 | |||||||
Net investment income | $11,853,807 | |||||||
Realized and unrealized gain (loss) on investments | ||||||||
| Realized gain (loss) (identified cost basis) | ||||||||
Investment transactions | $5,358,324 | |||||||
Swap transactions | 9,226 | |||||||
Net realized gain (loss) on investments | $5,367,550 | |||||||
| Change in unrealized appreciation (depreciation) | ||||||||
Investments | $(1,842,612 | ) | ||||||
Swap transactions | 198,889 | |||||||
Net unrealized gain (loss) on investments | $(1,643,723 | ) | ||||||
Net realized and unrealized gain (loss) on investments | $3,723,827 | |||||||
Change in net assets from operations | $15,577,634 |
See Notes to Financial Statements
13
Table of Contents
MFS Bond Portfolio
FINANCIAL STATEMENTS | STATEMENTS OF CHANGES IN NET ASSETS
These statements describe the increases and/or decreases in net assets resulting from operations, any distributions, and any shareholder transactions.
For years ended 12/31 | 2011 | 2010 | ||||||
Change in net assets | ||||||||
From operations | ||||||||
Net investment income | $11,853,807 | $11,047,353 | ||||||
Net realized gain (loss) on investments | 5,367,550 | 5,204,534 | ||||||
Net unrealized gain (loss) on investments | (1,643,723 | ) | 5,670,043 | |||||
Change in net assets from operations | $15,577,634 | $21,921,930 | ||||||
Distributions declared to shareholders | ||||||||
From net investment income | $(12,189,902 | ) | $(9,040,106 | ) | ||||
Change in net assets from fund share transactions | $10,240,192 | $41,142,255 | ||||||
Total change in net assets | $13,627,924 | $54,024,079 | ||||||
Net assets | ||||||||
At beginning of period | 242,561,537 | 188,537,458 | ||||||
At end of period (including undistributed net investment income of $13,420,015 and | $256,189,461 | $242,561,537 |
See Notes to Financial Statements
14
Table of Contents
MFS Bond Portfolio
FINANCIAL STATEMENTS | FINANCIAL HIGHLIGHTS
The financial highlights table is intended to help you understand the fund’s financial performance for the past 5 years. Certain information reflects financial results for a single fund share. The total returns in the table represent the rate by which an investor would have earned (or lost) on an investment in the fund share class (assuming reinvestment of all distributions) held for the entire period.
| Initial Class | Years ended 12/31 | |||||||||||||||||||
| 2011 | 2010 | 2009 | 2008 | 2007 | ||||||||||||||||
Net asset value, beginning of period | $11.49 | $10.84 | $9.11 | $10.89 | $11.19 | |||||||||||||||
| Income (loss) from investment operations | ||||||||||||||||||||
Net investment income (d) | $0.57 | $0.58 | $0.59 | $0.57 | $0.60 | |||||||||||||||
Net realized and unrealized gain (loss) on investments | 0.18 | 0.57 | 1.81 | (1.64 | ) | (0.21 | ) | |||||||||||||
Total from investment operations | $0.75 | $1.15 | $2.40 | $(1.07 | ) | $0.39 | ||||||||||||||
Less distributions declared to shareholders | ||||||||||||||||||||
From net investment income | $(0.57 | ) | $(0.50 | ) | $(0.67 | ) | $(0.71 | ) | $(0.69 | ) | ||||||||||
Net asset value, end of period (x) | $11.67 | $11.49 | $10.84 | $9.11 | $10.89 | |||||||||||||||
Total return (%) (k)(s)(x) | 6.63 | 10.86 | 27.96 | (10.53 | ) | 3.53 | ||||||||||||||
| Ratios (%) (to average net assets) and Supplemental data: | ||||||||||||||||||||
Expenses (f) | 0.70 | 0.72 | 0.74 | 0.74 | 0.71 | |||||||||||||||
Net investment income | 4.85 | 5.17 | 5.93 | 5.64 | 5.50 | |||||||||||||||
Portfolio turnover | 55 | 58 | 71 | 46 | 42 | |||||||||||||||
Net assets at end of period (000 omitted) | $90,822 | $95,584 | $92,244 | $70,504 | $105,554 | |||||||||||||||
| Service Class | Years ended 12/31 | |||||||||||||||||||
| 2011 | 2010 | 2009 | 2008 | 2007 | ||||||||||||||||
Net asset value, beginning of period | $11.40 | $10.76 | $9.04 | $10.81 | $11.11 | |||||||||||||||
| Income (loss) from investment operations | ||||||||||||||||||||
Net investment income (d) | $0.53 | $0.55 | $0.56 | $0.54 | $0.57 | |||||||||||||||
Net realized and unrealized gain (loss) on investments | 0.18 | 0.57 | 1.80 | (1.63 | ) | (0.21 | ) | |||||||||||||
Total from investment operations | $0.71 | $1.12 | $2.36 | $(1.09 | ) | $0.36 | ||||||||||||||
Less distributions declared to shareholders | ||||||||||||||||||||
From net investment income | $(0.55 | ) | $(0.48 | ) | $(0.64 | ) | $(0.68 | ) | $(0.66 | ) | ||||||||||
Net asset value, end of period (x) | $11.56 | $11.40 | $10.76 | $9.04 | $10.81 | |||||||||||||||
Total return (%) (k)(s)(x) | 6.30 | 10.67 | 27.66 | (10.77 | ) | 3.28 | ||||||||||||||
| Ratios (%) (to average net assets) and Supplemental data: | ||||||||||||||||||||
Expenses (f) | 0.95 | 0.97 | 0.99 | 0.99 | 0.96 | |||||||||||||||
Net investment income | 4.59 | 4.90 | 5.64 | 5.39 | 5.25 | |||||||||||||||
Portfolio turnover | 55 | 58 | 71 | 46 | 42 | |||||||||||||||
Net assets at end of period (000 omitted) | $165,367 | $146,977 | $96,293 | $52,038 | $77,588 | |||||||||||||||
| (d) | Per share data is based on average shares outstanding. |
| (f) | Ratios do not reflect reductions from fees paid indirectly, if applicable. |
| (k) | The total return does not reflect expenses that apply to separate accounts. Inclusion of these charges would reduce the total return figures for all periods shown. |
| (s) | From time to time the fund may receive proceeds from litigation settlements, without which performance would be lower. |
| (x) | The net asset values per share and total returns have been calculated on net assets which include adjustments made in accordance with U.S. generally accepted accounting principles required at period end for financial reporting purposes. |
See Notes to Financial Statements
15
Table of Contents
MFS Bond Portfolio
| (1) | Business and Organization |
MFS Bond Portfolio (the fund) is a series of MFS Variable Insurance Trust II (the trust). The trust is organized as a Massachusetts business trust and is registered under the Investment Company Act of 1940, as amended, as an open-end management investment company. The shareholders of each series of the trust are separate accounts of insurance companies, which offer variable annuity and/or life insurance products, and qualified retirement and pension plans.
| (2) | Significant Accounting Policies |
General – The preparation of financial statements in conformity with U.S. generally accepted accounting principles requires management to make estimates and assumptions that affect the reported amounts of assets and liabilities, and disclosure of contingent assets and liabilities at the date of the financial statements and the reported amounts of revenues and expenses during the reporting period. Actual results could differ from those estimates. In the preparation of these financial statements, management has evaluated subsequent events occurring after the date of the fund’s Statement of Assets and Liabilities through the date that the financial statements were issued. The fund invests in high-yield securities rated below investment grade. Investments in high-yield securities involve greater degrees of credit and market risk than investments in higher-rated securities and tend to be more sensitive to economic conditions. The fund invests in foreign securities. Investments in foreign securities are vulnerable to the effects of changes in the relative values of the local currency and the U.S. dollar and to the effects of changes in each country’s legal, political, and economic environment.
In December 2011, the Financial Accounting Standards Board issued Accounting Standards Update 2011-11, Balance Sheet (Topic 210) – Disclosures about Offsetting Assets and Liabilities (“ASU 2011-11”). Effective for annual reporting periods beginning on or after January 1, 2013 and interim periods within those annual periods, ASU 2011-11 is intended to enhance disclosure requirements on the offsetting of financial assets and liabilities. Although still evaluating the potential impacts of ASU 2011-11 to the fund, management expects that the impact of the fund’s adoption will be limited to additional financial statement disclosures.
Investment Valuations – Debt instruments and floating rate loans (other than short-term instruments), including restricted debt instruments, are generally valued at an evaluated or composite bid as provided by a third-party pricing service. Short-term instruments with a maturity at issuance of 60 days or less generally are valued at amortized cost, which approximates market value. Swaps are generally valued at valuations provided by a third-party pricing service. Open-end investment companies are generally valued at net asset value per share. Securities and other assets generally valued on the basis of information from a third-party pricing service may also be valued at a broker/dealer bid quotation. Values obtained from third-party pricing services can utilize both transaction data and market information such as yield, quality, coupon rate, maturity, type of issue, trading characteristics, and other market data. The values of foreign securities and other assets and liabilities expressed in foreign currencies are converted to U.S. dollars using the mean of bid and asked prices for rates provided by a third-party pricing service.
The Board of Trustees has delegated primary responsibility for determining or causing to be determined the value of the fund’s investments (including any fair valuation) to the adviser pursuant to valuation policies and procedures approved by the Board. If the adviser determines that reliable market quotations are not readily available, investments are valued at fair value as determined in good faith by the adviser in accordance with such procedures under the oversight of the Board of Trustees. Under the fund’s valuation policies and procedures, market quotations are not considered to be readily available for most types of debt instruments and floating rate loans and many types of derivatives. These investments are generally valued at fair value based on information from third-party pricing services. In addition, investments may be valued at fair value if the adviser determines that an investment’s value has been materially affected by events occurring after the close of the exchange or market on which the investment is principally traded (such as foreign exchange or market) and prior to the determination of the fund’s net asset value, or after the halting of trading of a specific security where trading does not resume prior to the close of the exchange or market on which the security is principally traded. The adviser generally relies on third-party pricing services or other information (such as the correlation with price movements of similar securities in the same or other markets; the type, cost and investment characteristics of the security; the business and financial condition of the issuer; and trading and other market data) to assist in determining whether to fair value and at what value to fair value an investment. The value of an investment for purposes of calculating the fund’s net asset value can differ depending on the source and method used to determine value. When fair valuation is used, the value of an investment used to determine the fund’s net asset value may differ from quoted or published prices for the same investment. There can be no assurance that the fund could obtain the fair value assigned to an investment if it were to sell the investment at the same time at which the fund determines its net asset value per share.
Various inputs are used in determining the value of the fund’s assets or liabilities. These inputs are categorized into three broad levels. In certain cases, the inputs used to measure fair value may fall into different levels of the fair value hierarchy. In such
16
Table of Contents
MFS Bond Portfolio
Notes to Financial Statements – continued
cases, an investment’s level within the fair value hierarchy is based on the lowest level of input that is significant to the fair value measurement. The fund’s assessment of the significance of a particular input to the fair value measurement in its entirety requires judgment, and considers factors specific to the investment. Level 1 includes unadjusted quoted prices in active markets for identical assets or liabilities. Level 2 includes other significant observable market-based inputs (including quoted prices for similar securities, interest rates, prepayment speed, and credit risk). Level 3 includes unobservable inputs, which may include the adviser’s own assumptions in determining the fair value of investments. Other financial instruments are derivative instruments not reflected in total investments, such as swap contracts. The following is a summary of the levels used as of December 31, 2011 in valuing the fund’s assets or liabilities:
| Investments at Value | Level 1 | Level 2 | Level 3 | Total | ||||||||||||
| Non-U.S. Sovereign Debt | $— | $4,233,689 | $— | $4,233,689 | ||||||||||||
| Corporate Bonds | — | 194,582,230 | — | 194,582,230 | ||||||||||||
| Residential Mortgage-Backed Securities | — | 69,204 | — | 69,204 | ||||||||||||
| Commercial Mortgage-Backed Securities | — | 7,684,450 | — | 7,684,450 | ||||||||||||
| Asset-Backed Securities (including CDOs) | — | 4,441,443 | — | 4,441,443 | ||||||||||||
| Foreign Bonds | — | 39,359,418 | — | 39,359,418 | ||||||||||||
| Mutual Funds | 1,192,839 | — | — | 1,192,839 | ||||||||||||
| Total Investments | $1,192,839 | $250,370,434 | $— | $251,563,273 | ||||||||||||
| Other Financial Instruments | ||||||||||||||||
| Swaps | $— | $(136,446 | ) | $— | $(136,446 | ) | ||||||||||
For further information regarding security characteristics, see the Portfolio of Investments.
Derivatives – The fund uses derivatives for different purposes, primarily to increase or decrease exposure to a particular market or segment of the market, or security, to increase or decrease interest rate or currency exposure, or as alternatives to direct investments. Derivatives are used for hedging or non-hedging purposes. While hedging can reduce or eliminate losses, it can also reduce or eliminate gains. When the fund uses derivatives as an investment to increase market exposure, or for hedging purposes, gains and losses from derivative instruments may be substantially greater than the derivative’s original cost.
The derivative instruments used by the fund were swap agreements. The fund’s period end derivatives, as presented in the Portfolio of Investments and the associated Derivative Contract Tables, generally are indicative of the volume of its derivative activity during the period.
The following table presents, by major type of derivative contract, the fair value, on a gross basis, of the asset and liability components of derivatives held by the fund at December 31, 2011 as reported in the Statement of Assets and Liabilities:
| Fair Value | ||||||
| Risk | Derivative Contracts | Liability Derivatives | ||||
| Credit | Credit Default Swaps | $(136,446 | ) | |||
The following table presents, by major type of derivative contract, the realized gain (loss) on derivatives held by the fund for the year ended December 31, 2011 as reported in the Statement of Operations:
| Risk | Swap Transactions | |||
| Credit | $9,226 | |||
The following table presents, by major type of derivative contract, the change in unrealized appreciation (depreciation) on derivatives held by the fund for the year ended December 31, 2011 as reported in the Statement of Operations:
| Risk | Swap Transactions | |||
| Credit | $198,889 | |||
Derivative counterparty credit risk is managed through formal evaluation of the creditworthiness of all potential counterparties. On certain over-the-counter derivatives, the fund attempts to reduce its exposure to counterparty credit risk whenever possible by entering into an International Swaps and Derivatives Association (ISDA) Master Agreement on a bilateral basis with each of the counterparties with whom it undertakes a significant volume of transactions. The ISDA Master Agreement gives each party to the agreement the right to terminate all transactions traded under such agreement if there is a certain deterioration in the credit quality of the other party. The ISDA Master Agreement gives the fund the right, upon an event of default by the applicable counterparty or a termination of the agreement, to close out all transactions traded under such agreement and to net amounts owed under each transaction to one net amount payable by one party to the other. This right to close out and net payments across all transactions traded under the ISDA Master Agreement could result in a reduction
17
Table of Contents
MFS Bond Portfolio
Notes to Financial Statements – continued
of the fund’s credit risk to such counterparty equal to any amounts payable by the fund under the applicable transactions, if any. However, absent an event of default by the counterparty or a termination of the agreement, the ISDA Master Agreement does not result in an offset of reported amounts of assets and liabilities in the Statement of Assets and Liabilities across transactions between the fund and the applicable counterparty.
Collateral requirements differ by type of derivative. Collateral or margin requirements are set by the broker or exchange clearing house for exchange traded derivatives (i.e., futures and exchange-traded options) while collateral terms are contract specific for over-the-counter traded derivatives (i.e., forward foreign currency exchange contracts, swaps and over-the-counter options). For derivatives traded under an ISDA Master Agreement, the collateral requirements are netted across all transactions traded under such agreement and one amount is posted from one party to the other to collateralize such obligations. Cash collateral that has been pledged to cover obligations of the fund under derivative contracts, if any, will be reported separately on the Statement of Assets and Liabilities as restricted cash. Securities collateral pledged for the same purpose, if any, is noted in the Portfolio of Investments.
Swap Agreements – The fund entered into swap agreements. A swap is generally an exchange of cash payments, at specified intervals or upon the occurrence of specified events, between the fund and a counterparty. The net cash payments exchanged are recorded as a realized gain or loss on swap transactions in the Statement of Operations. The value of the swap, which is adjusted daily and includes any related interest accruals to be paid or received by the fund, is recorded on the Statement of Assets and Liabilities. The daily change in value, including any related interest accruals to be paid or received, is recorded as unrealized appreciation or depreciation on swap transactions in the Statement of Operations. Amounts paid or received at the inception of the swap are reflected as premiums paid or received on the Statement of Assets and Liabilities and are amortized using the effective interest method over the term of the agreement. A liquidation payment received or made upon early termination is recorded as a realized gain or loss on swap transactions in the Statement of Operations.
Risks related to swap agreements include the possible lack of a liquid market, unfavorable market and interest rate movements of the underlying instrument and the failure of the counterparty to perform under the terms of the agreements. To address counterparty risk, swap transactions are limited to only highly-rated counterparties. The risk is further mitigated by having an ISDA Master Agreement between the fund and the counterparty providing for netting as described above and by the posting of collateral by the counterparty to the fund to cover the fund’s exposure to the counterparty under such ISDA Master Agreement.
The fund entered into credit default swaps in order to manage its exposure to the market or certain sectors of the market, to reduce its credit risk exposure to defaults of corporate and sovereign issuers or to create exposure to corporate or sovereign issuers to which it is not otherwise exposed. In a credit default swap, the protection buyer can make an upfront payment and will make a stream of payments based on a fixed percentage applied to the contract notional amount to the protection seller in exchange for the right to receive a specified return upon the occurrence of a defined credit event on the reference obligation (which may be either a single security or a basket of securities issued by corporate or sovereign issuers) and, with respect to the rare cases where physical settlement applies, the delivery by the buyer to the seller of a defined deliverable obligation. Although contract-specific, credit events generally consist of a combination of the following: bankruptcy, failure to pay, restructuring, obligation acceleration, obligation default, or repudiation/moratorium, each as defined in the 2003 ISDA Credit Derivatives Definitions as amended by the relevant contract. Restructuring is generally not applicable when the reference obligation is issued by a North American corporation and obligation acceleration, obligation default, or repudiation/moratorium are generally only applicable when the reference obligation is issued by a sovereign entity or an entity in an emerging country. Upon determination of the final price for the deliverable obligation (or upon delivery of the deliverable obligation in the case of physical settlement), the difference between the value of the deliverable obligation and the swap’s notional amount is recorded as realized gain or loss on swap transactions in the Statement of Operations.
Credit default swaps are considered to have credit-risk-related contingent features since they trigger payment by the protection seller to the protection buyer upon the occurrence of a defined credit event. The aggregate fair value of credit default swaps in a net liability position as of December 31, 2011 is disclosed in the footnotes to the Portfolio of Investments. As discussed earlier in this note, collateral requirements for these swaps are based generally on the market value of the swap netted against collateral requirements for other types of over-the-counter derivatives traded under each counterparty’s ISDA Master Agreement. The maximum amount of future, undiscounted payments that the fund, as protection seller, could be required to make is equal to the swap’s notional amount. The protection seller’s payment obligation would be offset to the extent of the value of the contract’s deliverable obligation. If a defined credit event had occurred as of December 31, 2011, the swaps’ credit-risk-related contingent features would have been triggered and, for those swaps in a net liability position for which the fund is the protection seller, the fund in order to settle these swaps would have been required to either (1) pay the swap’s notional value of $910,000 less the value of the contracts’ related deliverable obligations as decided through an ISDA auction or (2) pay the notional value of the swaps in return for physical receipt of the deliverable obligations.
18
Table of Contents
MFS Bond Portfolio
Notes to Financial Statements – continued
The fund’s maximum risk of loss from counterparty risk, either as the protection seller or as the protection buyer, is the fair value of the contract. This risk is mitigated by having an ISDA Master Agreement between the fund and the counterparty providing for netting as described above and by the posting of collateral by the counterparty to the fund to cover the fund’s exposure to the counterparty under such ISDA Master Agreement.
Loans and Other Direct Debt Instruments – The fund invests in loans and loan participations or other receivables. These investments may include standby financing commitments, including revolving credit facilities, which obligate the fund to supply additional cash to the borrower on demand. Loan participations involve a risk of insolvency of the lending bank or other financial intermediary.
Indemnifications – Under the fund’s organizational documents, its officers and Trustees may be indemnified against certain liabilities and expenses arising out of the performance of their duties to the fund. Additionally, in the normal course of business, the fund enters into agreements with service providers that may contain indemnification clauses. The fund’s maximum exposure under these agreements is unknown as this would involve future claims that may be made against the fund that have not yet occurred.
Investment Transactions and Income – Investment transactions are recorded on the trade date. Interest income is recorded on the accrual basis. All premium and discount is amortized or accreted for financial statement purposes in accordance with U.S. generally accepted accounting principles. The fund earns certain fees in connection with its floating rate loan purchasing activities. These fees are in addition to interest payments earned and may include amendment fees, commitment fees, facility fees, consent fees, and prepayment fees. Commitment fees are recorded on an accrual basis as income in the accompanying financial statements. Dividend and interest payments received in additional securities are recorded on the ex-dividend or ex-interest date in an amount equal to the value of the security on such date. Debt obligations may be placed on non-accrual status or set to accrue at a rate of interest less than the contractual coupon when the collection of all or a portion of interest has become doubtful. Interest income for those debt obligations may be further reduced by the write-off of the related interest receivables when deemed uncollectible.
The fund may receive proceeds from litigation settlements. Any proceeds received from litigation involving portfolio holdings are reflected in the Statement of Operations in realized gain/loss if the security has been disposed of by the fund or in unrealized gain/loss if the security is still held by the fund. Any other proceeds from litigation not related to portfolio holdings are reflected as other income in the Statement of Operations.
Fees Paid Indirectly – The fund’s custody fee may be reduced according to an arrangement that measures the value of cash deposited with the custodian by the fund. This amount, for the year ended December 31, 2011, is shown as a reduction of total expenses on the Statement of Operations.
Tax Matters and Distributions – The fund intends to qualify as a regulated investment company, as defined under Subchapter M of the Internal Revenue Code, and to distribute all of its taxable income, including realized capital gains. As a result, no provision for federal income tax is required. The fund’s federal tax returns for the prior three fiscal years remain subject to examination by the Internal Revenue Service. Foreign taxes have been accrued by the fund in the accompanying financial statements.
Distributions to shareholders are recorded on the ex-dividend date. Income and capital gain distributions are determined in accordance with income tax regulations, which may differ from U.S. generally accepted accounting principles. Certain capital accounts in the financial statements are periodically adjusted for permanent differences in order to reflect their tax character. These adjustments have no impact on net assets or net asset value per share. Temporary differences which arise from recognizing certain items of income, expense, gain or loss in different periods for financial statement and tax purposes will reverse at some time in the future. Distributions in excess of net investment income or net realized gains are temporary overdistributions for financial statement purposes resulting from differences in the recognition or classification of income or distributions for financial statement and tax purposes.
Book/tax differences primarily relate to amortization and accretion of debt securities and derivative transactions.
The tax character of distributions declared to shareholders for the last two fiscal years is as follows:
| 12/31/11 | 12/31/10 | |||||||
| Ordinary income (including any short-term capital gains) | $12,189,902 | $9,040,106 | ||||||
19
Table of Contents
MFS Bond Portfolio
Notes to Financial Statements – continued
The federal tax cost and the tax basis components of distributable earnings were as follows:
| As of 12/31/11 | ||||
| Cost of investments | $244,326,723 | |||
| Gross appreciation | 11,807,818 | |||
| Gross depreciation | (4,571,268 | ) | ||
| Net unrealized appreciation (depreciation) | $7,236,550 | |||
| Undistributed ordinary income | 13,340,627 | |||
| Capital loss carryforwards | (715,383 | ) | ||
| Other temporary differences | (57,361 | ) |
Under the Regulated Investment Company Modernization Act of 2010 (the “Act”), net capital losses recognized after December 31, 2010 may be carried forward indefinitely, and their character is retained as short-term and/or long-term losses. Previously, net capital losses were carried forward for eight years and treated as short-term losses. As a transition rule, the Act requires that post-enactment net capital losses be used before pre-enactment net capital losses.
As of December 31, 2011, the fund had capital loss carryforwards available to offset future realized gains. Such losses expire as follows:
| Pre-enactment losses: | ||||
| 12/31/16 | $(267,263 | ) | ||
| 12/31/17 | (448,120 | ) | ||
| Total | $(715,383 | ) |
Multiple Classes of Shares of Beneficial Interest – The fund offers multiple classes of shares, which differ in their respective distribution and/or service fees. The fund’s income, realized and unrealized gain (loss), and common expenses are allocated to shareholders based on the daily net assets of each class. Dividends are declared separately for each class. Differences in per share dividend rates are generally due to differences in separate class expenses. The fund’s distributions declared to shareholders as reported on the Statements of Changes in Net Assets are presented by class as follows:
| From net investment income | ||||||||
| Year ended 12/31/11 | Year ended 12/31/10 | |||||||
| Initial Class | $4,438,708 | $4,170,932 | ||||||
| Service Class | 7,751,194 | 4,869,174 | ||||||
| Total | $12,189,902 | $9,040,106 | ||||||
| (3) | Transactions with Affiliates |
Investment Adviser – The fund has an investment advisory agreement with MFS to provide overall investment management and related administrative services and facilities to the fund. The management fee is computed daily and paid monthly at an annual rate of 0.60% of the fund’s average daily net assets. The investment adviser has agreed in writing to reduce its management fee to 0.50% of average daily net assets in excess of $1 billion. This written agreement terminated on December 31, 2011. For the year ended December 31, 2011, the fund’s average daily net assets did not exceed $1 billion and therefore, the management fee was not reduced. The management fee incurred for the year ended December 31, 2011 was equivalent to an annual effective rate of 0.60% of the fund’s average daily net assets.
On December 1, 2011, shareholders of the fund approved a new investment advisory agreement between the trust, on behalf of the fund, and MFS. This new investment advisory agreement provides that effective January 1, 2012, the management fee is computed daily and paid monthly at the following annual rates:
| First $1 billion of average daily net assets | 0.60% | |||
| Average daily net assets in excess of $1 billion | 0.50% |
Distributor – MFS Fund Distributors, Inc. (MFD), a wholly-owned subsidiary of MFS, is the distributor of shares of the fund. The Trustees have adopted a distribution plan for the Service Class shares pursuant to Rule 12b-1 under the Investment Company Act of 1940.
The fund’s distribution plan provides that the fund will pay MFD distribution and/or service fees equal to 0.25% per annum of its average daily net assets attributable to Service Class shares as partial consideration for services performed and expenses incurred by MFD and financial intermediaries (including participating insurance companies that invest in the fund to fund variable annuity and variable life insurance contracts, sponsors of qualified retirement and pension plans that invest in the fund, and
20
Table of Contents
MFS Bond Portfolio
Notes to Financial Statements – continued
affiliates of these participating insurance companies and plan sponsors) in connection with the sale and distribution of the Service Class shares. MFD may subsequently pay all, or a portion, of the distribution and/or service fees to financial intermediaries.
Shareholder Servicing Agent – MFS Service Center, Inc. (MFSC), a wholly-owned subsidiary of MFS, has contracted to provide transfer agent and recordkeeping functions in connection with the issuance, transfer, and redemption of each class of shares of the fund under a Shareholder Servicing Agent Agreement. During the year ended December 31, 2011, the fund did not pay MFSC a fee for this service.
Administrator – MFS provides certain financial, legal, shareholder communications, compliance, and other administrative services to the fund. Under an administrative services agreement, the fund partially reimburses MFS the costs incurred to provide these services. The fund is charged an annual fixed amount of $17,500 plus a fee based on average daily net assets. The administrative services fee incurred for the year ended December 31, 2011 was equivalent to an annual effective rate of 0.0334% of the fund’s average daily net assets.
Trustees’ and Officers’ Compensation – The fund pays compensation to Trustees in the form of a retainer, attendance fees, and additional compensation to the Board chairperson. The fund does not pay compensation directly to officers of the fund who are also officers of the investment adviser, all of whom receive remuneration for their services to the fund from MFS. Certain officers of the fund are officers or directors of MFS, MFD, and MFSC.
Other – This fund and certain other funds managed by MFS (the funds) have entered into services agreements (the Agreements) which provide for payment of fees by the funds to Tarantino LLC and Griffin Compliance LLC in return for the provision of services of an Independent Chief Compliance Officer (ICCO) and Assistant ICCO, respectively, for the funds. The ICCO and Assistant ICCO are officers of the funds and the sole members of Tarantino LLC and Griffin Compliance LLC, respectively. The funds can terminate the Agreements with Tarantino LLC and Griffin Compliance LLC at any time under the terms of the Agreements. MFS has agreed to bear all expenses associated with office space, other administrative support, and supplies provided to the ICCO and Assistant ICCO. For the year ended December 31, 2011, the aggregate fees paid by the fund to Tarantino LLC and Griffin Compliance LLC were $4,156 and are included in miscellaneous expense on the Statement of Operations.
The fund invests in the MFS Institutional Money Market Portfolio which is managed by MFS and seeks a high level of current income consistent with preservation of capital and liquidity. Income earned on this investment is included in dividends from underlying affiliated funds on the Statement of Operations. This money market fund does not pay a management fee to MFS.
| (4) | Portfolio Securities |
Purchases and sales of investments, other than purchased option transactions, and short-term obligations, were as follows:
| Purchases | Sales | |||||||
| U.S. Government securities | $— | $11,327 | ||||||
| Investments (non-U.S. Government securities) | $154,334,185 | $135,398,208 | ||||||
| (5) | Shares of Beneficial Interest |
The fund’s Declaration of Trust permits the Trustees to issue an unlimited number of full and fractional shares of beneficial interest. Transactions in fund shares were as follows:
| Year ended 12/31/11 | Year ended 12/31/10 | |||||||||||||||
| Shares | Amount | Shares | Amount | |||||||||||||
| Shares sold | ||||||||||||||||
Initial Class | 598,989 | $7,091,720 | 789,328 | $8,770,173 | ||||||||||||
Service Class | 3,224,003 | 37,338,728 | 4,489,214 | 49,686,140 | ||||||||||||
| 3,822,992 | $44,430,448 | 5,278,542 | $58,456,313 | |||||||||||||
| Shares issued to shareholders in reinvestment of distributions | ||||||||||||||||
Initial Class | 386,647 | $4,438,708 | 383,710 | $4,170,932 | ||||||||||||
Service Class | 680,526 | 7,751,194 | 451,267 | 4,869,174 | ||||||||||||
| 1,067,173 | $12,189,902 | 834,977 | $9,040,106 | |||||||||||||
| Shares reacquired | ||||||||||||||||
Initial Class | (1,518,031 | ) | $(17,713,423 | ) | (1,364,016 | ) | $(15,376,313 | ) | ||||||||
Service Class | (2,492,911 | ) | (28,666,735 | ) | (988,611 | ) | (10,977,851 | ) | ||||||||
| (4,010,942 | ) | $(46,380,158 | ) | (2,352,627 | ) | $(26,354,164 | ) | |||||||||
| Net change | ||||||||||||||||
Initial Class | (532,395 | ) | $(6,182,995 | ) | (190,978 | ) | $(2,435,208 | ) | ||||||||
Service Class | 1,411,618 | 16,423,187 | 3,951,870 | 43,577,463 | ||||||||||||
| 879,223 | $10,240,192 | 3,760,892 | $41,142,255 | |||||||||||||
21
Table of Contents
MFS Bond Portfolio
Notes to Financial Statements – continued
| (6) | Line of Credit |
The fund and certain other funds managed by MFS participate in a $1.1 billion unsecured committed line of credit, subject to a $1 billion sublimit, provided by a syndication of banks under a credit agreement. Borrowings may be made for temporary financing needs. Interest is charged to each fund, based on its borrowings, generally at a rate equal to the higher of the Federal Reserve funds rate or one month LIBOR plus an agreed upon spread. A commitment fee, based on the average daily, unused portion of the committed line of credit, is allocated among the participating funds at the end of each calendar quarter. In addition, the fund and other funds managed by MFS have established unsecured uncommitted borrowing arrangements with certain banks for temporary financing needs. Interest is charged to each fund, based on its borrowings, at a rate equal to the Federal Reserve funds rate plus an agreed upon spread. For the year ended December 31, 2011, the fund’s commitment fee and interest expense were $1,959 and $0, respectively, and are included in miscellaneous expense on the Statement of Operations.
| (7) | Transactions in Underlying Affiliated Funds – Affiliated Issuers |
An affiliated issuer may be considered one in which the fund owns 5% or more of the outstanding voting securities, or a company which is under common control. For the purposes of this report, the fund assumes the following to be affiliated issuers:
| Underlying Affiliated Funds | Beginning Shares/Par Amount | Acquisitions Shares/Par Amount | Dispositions Shares/Par Amount | Ending Shares/Par Amount | ||||||||||||
| MFS Institutional Money Market Portfolio | 9,282,745 | 107,551,032 | (115,640,938 | ) | 1,192,839 | |||||||||||
| Underlying Affiliated Funds | Realized Gain (Loss) | Capital Gain Distributions | Dividend Income | Ending Value | ||||||||||||
| MFS Institutional Money Market Portfolio | $— | $— | $6,033 | $1,192,839 | ||||||||||||
22
Table of Contents
MFS Bond Portfolio
REPORT OF INDEPENDENT REGISTERED PUBLIC ACCOUNTING FIRM
To the Board of Trustees of MFS Variable Insurance Trust II and the Shareholders of
MFS Bond Portfolio:
We have audited the accompanying statement of assets and liabilities, including the portfolio of investments, of MFS Bond Portfolio (the “Fund”) (one of the portfolios comprising MFS Variable Insurance Trust II) as of December 31, 2011, and the related statement of operations for the year then ended, the statements of changes in net assets for each of the two years in the period then ended, and the financial highlights for each of the five years in the period then ended. These financial statements and financial highlights are the responsibility of the Fund’s management. Our responsibility is to express an opinion on these financial statements and financial highlights based on our audits.
We conducted our audits in accordance with the standards of the Public Company Accounting Oversight Board (United States). Those standards require that we plan and perform the audit to obtain reasonable assurance about whether the financial statements and financial highlights are free of material misstatement. The Fund is not required to have, nor were we engaged to perform, an audit of its internal control over financial reporting. Our audits included consideration of internal control over financial reporting as a basis for designing audit procedures that are appropriate in the circumstances, but not for the purpose of expressing an opinion on the effectiveness of the Fund’s internal control over financial reporting. Accordingly, we express no such opinion. An audit also includes examining, on a test basis, evidence supporting the amounts and disclosures in the financial statements, assessing the accounting principles used and significant estimates made by management, as well as evaluating the overall financial statement presentation. Our procedures included confirmation of securities owned as of December 31, 2011, by correspondence with the custodian and brokers; where replies were not received from brokers, we performed other auditing procedures. We believe that our audits provide a reasonable basis for our opinion.
In our opinion, the financial statements and financial highlights referred to above present fairly, in all material respects, the financial position of MFS Bond Portfolio as of December 31, 2011, the results of its operations for the year then ended, the changes in its net assets for each of the two years in the period then ended, and the financial highlights for each of the five years in the period then ended, in conformity with accounting principles generally accepted in the United States of America.
DELOITTE & TOUCHE LLP
Boston, Massachusetts
February 15, 2012
23
Table of Contents
MFS Bond Portfolio
RESULTS OF SHAREHOLDER MEETING (unaudited)
At a special meeting of shareholders of MFS Bond Portfolio, which was held on December 1, 2011, the following actions were taken for which shareholders of all series of MFS Variable Insurance Trust II voted together as a single class with respect to Item 1 and shareholders of MFS Bond Portfolio voted as a separate class with respect to Items 2 and 3:
Item 1: Election of ten Trustees as members of the Board of Trustees of the Trust effective January 1, 2012:
| Number of Shares | ||||||||
| For | Withheld Authority | |||||||
| Robert E. Butler | 681,916,712.8686 | 46,472,894.9218 | ||||||
| Maureen R. Goldfarb | 682,835,794.8512 | 45,553,812.9392 | ||||||
| David H. Gunning | 681,500,267.3085 | 46,889,340.4819 | ||||||
| William R. Gutow | 681,050,223.5547 | 47,339,384.2357 | ||||||
| Michael Hegarty | 682,477,088.8584 | 45,912,518.9320 | ||||||
| John P. Kavanaugh | 683,794,425.4269 | 44,595,182.3635 | ||||||
| Robert J. Manning | 682,699,559.7374 | 45,690,048.0530 | ||||||
| J. Dale Sherratt | 681,362,743.0513 | 47,026,864.7391 | ||||||
| Laurie J. Thomsen | 683,408,094.0000 | 44,981,513.7904 | ||||||
| Robert W. Uek | 681,424,852.0247 | 46,964,755.7657 | ||||||
Item 2: To approve a new investment advisory agreement dated January 1, 2012, between the Trust, on behalf of MFS Bond Portfolio, and MFS:
| Number of Shares | ||||||||||||
| For | Against | Withheld Authority | ||||||||||
| 20,200,158.4280 | 632,633.8685 | 1,805,980.3226 | ||||||||||
Item 3: To approve revisions to and restatements of certain fundamental investment restrictions of MFS Bond Portfolio effective January 1, 2012 as detailed below:
| Number of Shares | ||||||||||||||
| For | Against | Withheld Authority | ||||||||||||
| A. | Borrowing | 19,139,394.4678 | 1,511,315.9726 | 1,988,062.1787 | ||||||||||
| B. | Underwriting Securities | 19,610,462.5874 | 1,047,339.6867 | 1,980,970.3450 | ||||||||||
| C. | Issuance of Senior Securities | 19,749,925.8269 | 1,001,659.1533 | 1,887,187.6389 | ||||||||||
| D. | Lending of Money or Securities | 19,246,273.0270 | 1,445,535.2369 | 1,946,964.3552 | ||||||||||
| E. | Purchases or Sales of Real Estate; Interests in Oil, Gas or Mineral Leases; and Commodities | 19,769,419.2736 | 979,466.4209 | 1,889,886.9246 | ||||||||||
| F. | Industry Concentration | 19,757,176.5350 | 929,894.3159 | 1,951,701.7682 | ||||||||||
24
Table of Contents
MFS Bond Portfolio
TRUSTEES AND OFFICERS – IDENTIFICATION AND BACKGROUND
The Trustees and officers of the Trust, as of February 1, 2012, are listed below, together with their principal occupations during the past five years. (Their titles may have varied during that period.) The address of each Trustee and officer is 500 Boylston Street, Boston, Massachusetts 02116.
Name, Age | Position(s) with Fund | Trustee/Officer Since (h) | Principal Occupations | Other Directorships (j) | ||||
| INTERESTED TRUSTEES | ||||||||
Robert J. Manning (k) (age 48) | Trustee | February 2004 | Massachusetts Financial Services Company, Chairman, Chief Executive Officer and Director; President (until December 2009); Chief Investment Officer (until July 2010) | N/A | ||||
| INDEPENDENT TRUSTEES | ||||||||
David H. Gunning (age 69) | Trustee and Chair of Trustees | January 2004 | Retired; Cleveland-Cliffs Inc. (mining products and service provider), Vice Chairman/Director (until May 2007) | Lincoln Electric Holdings, Inc. (welding equipment manufacturer), Director; Development Alternatives, Inc. (consulting), Director/Non-Executive Chairman; Portman Limited (mining), Director (until 2008) | ||||
Robert E. Butler (age 70) | Trustee | January 2006 | Consultant – investment company industry regulatory and compliance matters | N/A | ||||
Maureen R. Goldfarb (age 56) | Trustee | January 2009 | Private investor | N/A | ||||
William R. Gutow (age 70) | Trustee | December 1993 | Private investor and real estate consultant; Capitol Entertainment Management Company (video franchise), Vice Chairman | Atlantic Coast Tan (tanning salons), Vice Chairman (until 2007); Texas Donuts (donut franchise), Vice Chairman (until 2010) | ||||
Michael Hegarty (age 67) | Trustee | December 2004 | Private investor | N/A | ||||
John P. Kavanaugh (age 57) | Trustee | January 2009 | Private investor; The Hanover Insurance Group, Inc., Vice President and Chief Investment Officer (until 2006); Allmerica Investment Trust, Allmerica Securities Trust and Opus Investment Trust (investment companies), Chairman, President and Trustee (until 2006) | N/A | ||||
J. Dale Sherratt (age 73) | Trustee | June 1989 | Insight Resources, Inc. (acquisition planning specialists), President; Wellfleet Investments (investor in health care companies), Managing General Partner | N/A | ||||
Laurie J. Thomsen (age 54) | Trustee | March 2005 | Private investor; New Profit, Inc. (venture philanthropy), Executive Partner (until 2010) | The Travelers Companies (property and casualty insurance), Director | ||||
Robert W. Uek (age 70) | Trustee | January 2006 | Consultant to investment company industry | N/A | ||||
| OFFICERS | ||||||||
John M. Corcoran (k) (age 46) | President | October 2008 | Massachusetts Financial Services Company, Senior Vice President (since October 2008); State Street Bank and Trust (financial services provider), Senior Vice President, (until September 2008) | N/A | ||||
| Christopher R. Bohane (k) (age 38) | Assistant Secretary and Assistant Clerk | July 2005 | Massachusetts Financial Services Company, Vice President and Senior Counsel | N/A | ||||
Kino Clark (k) (age 43) | Assistant Treasurer | January 2012 | Massachusetts Financial Services Company, Assistant Vice President | N/A | ||||
25
Table of Contents
MFS Bond Portfolio
Trustees and Officers – continued
Name, Age | Position(s) with Fund | Trustee/Officer Since (h) | Principal Occupations | Other Directorships (j) | ||||
Ethan D. Corey (k) (age 48) | Assistant Secretary and Assistant Clerk | July 2005 | Massachusetts Financial Services Company, Senior Vice President and Associate General Counsel | N/A | ||||
David L. DiLorenzo (k) (age 43) | Treasurer | July 2005 | Massachusetts Financial Services Company, Vice President | N/A | ||||
Robyn L. Griffin (age 36) | Assistant Independent Chief Compliance Officer | August 2008 | Griffin Compliance LLC (provider of compliance services), Principal (since August 2008); State Street Corporation (financial services provider), Mutual Fund Administration Assistant Vice President (October 2006 – July 2008); Liberty Mutual Group (insurance), Personal Market Assistant Controller (April 2006 – October 2006); Deloitte & Touche LLP (professional services firm). | N/A | ||||
Brian E. Langenfeld (k) (age 38) | Assistant Secretary and Assistant Clerk | June 2006 | Massachusetts Financial Services Company, Vice President and Senior Counsel | N/A | ||||
Ellen Moynihan (k) (age 54) | Assistant Treasurer | April 1997 | Massachusetts Financial Services Company, Senior Vice President | N/A | ||||
Susan S. Newton (k) (age 61) | Assistant Secretary and Assistant Clerk | May 2005 | Massachusetts Financial Services Company, Senior Vice President and Associate General Counsel | N/A | ||||
Susan A. Pereira (k) (age 41) | Assistant Secretary and Assistant Clerk | July 2005 | Massachusetts Financial Services Company, Vice President and Senior Counsel | N/A | ||||
Mark N. Polebaum (k) (age 59) | Secretary and Clerk | January 2006 | Massachusetts Financial Services Company, Executive Vice President, General Counsel and Secretary | N/A | ||||
Frank L. Tarantino (age 67) | Independent Chief Compliance Officer | June 2004 | Tarantino LLC (provider of compliance services), Principal | N/A | ||||
Richard S. Weitzel (k) (age 41) | Assistant Secretary and Assistant Clerk | October 2007 | Massachusetts Financial Services Company, Vice President and Assistant General Counsel | N/A | ||||
James O. Yost (k) (age 51) | Deputy Treasurer | September 1990 | Massachusetts Financial Services Company, Senior Vice President | N/A | ||||
| (h) | Date first appointed to serve as Trustee/officer of an MFS fund. Each Trustee has served continuously since appointment unless indicated otherwise. For the period from December 15, 2004 until February 22, 2005, Mr. Manning served as Advisory Trustee. For the period October 2008, until January 2012, Mr. Corcoran served as Treasurer of the Funds. Prior to January 2012, Messrs. DiLorenzo and Yost served as Assistant Treasurers of the Funds. |
| (j) | Directorships or trusteeships of companies required to report to the Securities and Exchange Commission (i.e., “public companies”). |
| (k) | “Interested person” of the Trust within the meaning of the Investment Company Act of 1940 (referred to as the 1940 Act), which is the principal federal law governing investment companies like the fund, as a result of position with MFS. The address of MFS is 500 Boylston Street, Boston, Massachusetts 02116. |
Each Trustee has been elected by shareholders and each Trustee and officer holds office until his or her successor is chosen and qualified or until his or her earlier death, resignation, retirement or removal. The Trust does not hold annual meetings for the purpose of electing Trustees, and Trustees are not elected for fixed terms. Messrs. Butler, Kavanaugh, Uek and Ms. Thomsen are members of the Trust’s Audit Committee.
Each of the Fund’s Trustees and officers holds comparable positions with certain other funds of which MFS or a subsidiary is the investment adviser or distributor, and, in the case of the officers, with certain affiliates of MFS. As of January 1, 2012, the Trustees served as board members of 131 funds within the MFS Family of Funds.
26
Table of Contents
MFS Bond Portfolio
Trustees and Officers – continued
The Statement of Additional Information for the Fund includes further information about the Trustees and is available without charge upon request by calling 1-800-225-2606.
Investment Adviser Massachusetts Financial Services Company 500 Boylston Street, Boston, MA 02116-3741 | Custodian State Street Bank and Trust 1 Lincoln Street, Boston, MA 02111-2900 | |
Distributor MFS Fund Distributors, Inc. 500 Boylston Street, Boston, MA 02116-3741 | Independent Registered Public Accounting Firm Deloitte & Touche LLP 200 Berkeley Street, Boston, MA 02116 | |
Portfolio Managers Richard Hawkins Robert Persons |
27
Table of Contents
MFS Bond Portfolio
At a special meeting of shareholders of the MFS Bond Portfolio (hereinafter referred to as the “Fund” or the “Portfolio”), which was held on December 1, 2011, the shareholders approved a new investment advisory agreement based on the recommendation of the Board of Trustees. At its July, 2011 meeting, the Board of Trustees (i) approved, and recommended for shareholder approval, the new investment advisory agreement effective January 1, 2012, and (ii) the continuation of the existing investment advisory agreement effective September 1, 2011. The following includes a description of the factors that the Board of Trustees considered and the conclusions that formed the basis of their approval of both the new investment advisory agreement and the continuation of the prior investment advisory agreement.
BOARD APPROVAL OF NEW INVESTMENT ADVISORY AGREEMENT
The Investment Company Act of 1940 requires that both the full Board of Trustees and a majority of the non-interested (“independent”) Trustees, voting separately, initially approve the new investment advisory agreement (the “New Agreement”) between Massachusetts Financial Services Company (“MFS”) and MFS Variable Insurance Trust II (the “Trust”) on behalf of the Portfolio and, beginning on the second anniversary of the initial effective date of the New Agreement, annually approve the continuation of the New Agreement. The Trustees have considered matters bearing on the Portfolio and the then current advisory arrangement at their meetings throughout the year, including a review of performance data at each regular meeting. In addition, the independent Trustees met in person in July 2011 to consider the initial approval of the New Agreement, and to recommend that shareholders approve the New Agreement. The independent Trustees were assisted in their evaluation of the New Agreement by independent legal counsel, from whom they received separate legal advice and with whom they met separately from MFS management. The independent Trustees were also assisted in this process by the Portfolio’s Independent Chief Compliance Officer, a full-time senior officer appointed by and reporting to the independent Trustees.
In connection with their deliberations regarding the initial approval of the New Agreement, the Trustees, including the independent Trustees, considered such information and factors as they believed, in light of the legal advice furnished to them and their own business judgment, to be relevant. The New Agreement was considered separately for the series of the Trust (collectively, the “Portfolios”), although the Trustees also took into account the common interests of all Portfolios in the Trust in their review. As described below, the Trustees considered the nature, quality, and extent of the various investment advisory, administrative, and/or shareholder services to be performed by MFS under the New Agreement and other arrangements with the Trust.
In connection with their initial review meeting, the Trustees received and relied upon materials that included, among other items: (i) information provided by MFS on the advisory fees of comparable portfolios of its other clients, including institutional separate account and other clients, (ii) information as to whether, and to what extent applicable, expense waivers, reimbursements or fee “breakpoints” would be observed for the Portfolio under the New Agreement, and (iii) a comparison and summary of the differences in the provisions in the New Agreement compared to those in each of the then current investment advisory agreements for the Portfolios. In addition, in connection with the independent Trustees’ meetings in May and July, 2011 (the “contract review meetings”) for the purpose of considering whether to approve the continuation of the then current investment advisory agreements for the Portfolio, the independent Trustees received: (1) information provided by Lipper Inc. (“Lipper”) on the investment performance of the Portfolio for various time periods ended December 31, 2010, compared to the investment performance of a group of funds with substantially similar investment classifications/objectives (the “Lipper performance universe”), (2) information provided by Lipper on the Portfolio’s advisory fees and other expenses compared to the advisory fees and other expenses of comparable funds identified by Lipper (the “Lipper expense group”), (3) information regarding MFS’ financial results and financial condition, including MFS’ and certain of its affiliates’ estimated profitability from services performed for the Portfolio, (4) MFS’ views regarding the outlook for the mutual fund industry and its strategic business plans, (5) descriptions of various functions performed by MFS for the Trust, such as compliance monitoring and portfolio trading practices, and (6) information regarding the overall organization of MFS, including information about MFS’ senior management and other personnel providing investment advisory, administrative and other services to the Portfolio. The comparative performance, fee and expense information prepared and provided by Lipper was not independently verified, and the independent Trustees did not independently verify any information provided to them by MFS.
The Trustees’ conclusion as to the initial approval of the New Agreement was based on comprehensive consideration of all information provided to the Trustees and was not the result of any single factor. Some of the factors that figured particularly in the Trustees’ deliberations are described below for the Portfolio, while individual Trustees may have given different weight to various factors and evaluated the information presented as a whole differently than another individual Trustee. The Trustees recognized that the fee arrangements for the Portfolio could reflect years of review and discussion between the independent Trustees and MFS, that certain aspects of such arrangements may receive greater scrutiny in some years than others, and that
28
Table of Contents
MFS Bond Portfolio
Board Approval of New Investment Advisory Agreement – continued
the Trustees’ conclusions may be based, in part, on their consideration of these same arrangements during the course of the year and in prior years.
Because the portfolio management team managing the Portfolio’s investments under the then current investment advisory agreement will remain the same under the New Agreement for the Portfolio, the Trustees compared the Portfolio’s total return investment performance to the performance of its Lipper performance universe over various time periods, based on information provided by Lipper. The Trustees placed particular emphasis on the total return performance of the Portfolio’s Initial Class shares in comparison to the performance of funds in its Lipper performance universe over the one-, three- and five-year periods ended December 31, 2010. The Trustees did not rely on performance results for more recent periods.
The Trustees noted the performance of the Portfolio’s Initial Class shares was in the 1st quintile relative to the other funds in the Lipper performance universe for the one-year period (the 1st quintile being the best performers and the 5th quintile being the worst performers). The total return performance of the Portfolio was also in the 1st quintile for the three-year and the five-year periods ended December 31, 2010, relative to the Lipper performance universe. Based on the nature and quality of services provided by MFS, the Board of Trustees concluded that the Portfolio’s performance was satisfactory.
In the course of their deliberations, the Trustees took into account information provided by MFS during contract review meetings, as well as during investment review meetings conducted with portfolio management personnel during the course of the year. For Portfolios whose performance lagged their peer groups, they discussed the factors that contributed thereto and MFS’ efforts to improve such Portfolios’ performance. After reviewing this information, the Trustees concluded, within the context of their overall conclusions regarding the New Agreement, that they were satisfied with MFS’ responses and efforts relating to investment performance.
In assessing the reasonableness of the Portfolio’s advisory fee, the Trustees considered, among other information, the Portfolio’s advisory fee and the total expense ratio of the Portfolio’s Initial Class shares as a percentage of average daily net assets, compared to the advisory fee and total expense ratios of its peer group of funds based on information provided by Lipper. The Trustees also considered the advisory fees charged by MFS to institutional accounts. In comparing these fees, the Trustees considered the generally broader scope of services provided by MFS to the Trust than those provided to institutional accounts. The Trustees also considered the higher demands placed on MFS’ investment personnel and trading infrastructure as a result of the daily cash in-flows and out-flows of the Portfolio, and the impact on MFS and related expenses due to the more extensive regulatory regime to which the Portfolio is subject, compared to institutional accounts.
In considering the fees, the Trustees noted from the Lipper data that the Portfolio’s effective advisory fee rate and total expense ratio were each above the median of such fees and expenses of funds in the Lipper expense group. The Trustees further noted that the New Agreement would reflect MFS’ agreement to reduce the advisory fee on average daily net assets over $1 billion on a permanent basis, and concluded that the breakpoint was sufficient to allow the Portfolio to benefit from economies of scale as its assets grow. The Trustees concluded that the fees were reasonable in light of the nature and quality of services provided.
The Trustees also considered whether the Portfolio is likely to benefit from any economies of scale due to future asset growth. In this regard, the Trustees reviewed the adequacy of breakpoints and discussed with MFS any adjustments necessary for the shareholders’ benefit.
The Trustees also considered information prepared by MFS relating to its costs and profits with respect to the Portfolio and other investment companies and accounts advised by MFS, as well as MFS’ methodologies used to determine and allocate its costs to the Portfolio and other accounts and products for purposes of estimating profitability.
The Trustees noted that there would be no increase to the net advisory fee arrangement for the Portfolio under the New Agreement when compared to the Portfolio’s then current investment advisory agreement. After reviewing these and other factors described below, the Trustees concluded that the advisory fees charged to the Portfolio under the New Agreement represent reasonable compensation in light of the nature and quality of the services being provided by MFS.
In addition, the Trustees considered MFS’ resources and related efforts to continue to retain, attract and motivate capable personnel to serve the Portfolio. The Trustees also considered the financial resources of MFS and its parent, Sun Life Financial Inc. The Trustees further considered any advantages and possible disadvantages of having an adviser which also serves other investment companies as well as institutional accounts.
The Trustees also considered the nature, quality, cost, and extent of administrative, transfer agency, and distribution services provided to the Trust by MFS and its affiliates under agreements and plans other than the New Agreement, including the 12b-1 fees the Portfolio pays to MFS Fund Distributors, Inc., an affiliate of MFS. The Trustees also considered the nature, extent and quality of certain other services MFS performs or arranges on the Portfolio’s behalf, which may include securities lending
29
Table of Contents
MFS Bond Portfolio
Board Approval of New Investment Advisory Agreement – continued
programs, directed expense payment programs, class action recovery programs, and MFS’ interaction with third-party service providers, principally custodians and sub-custodians. The Trustees concluded that the various non-advisory services provided by MFS and its affiliates on behalf of the Portfolio were satisfactory. The Trustees also considered the benefits to MFS from the use of the Portfolio’s portfolio brokerage commissions to pay for investment research and various other factors. Additionally, the Trustees considered so-called “fall-out benefits” to MFS such as reputational value derived from serving as investment manager to the Trust, and determined that any such benefits derived by MFS were reasonable and fair.
Based on their evaluation of factors that they deemed to be material, including those factors described above, the Board of Trustees, including a majority of the independent Trustees, concluded that the New Agreement should be approved for an initial two-year period, commencing upon its effective date, as set forth in the New Agreement.
BOARD APPROVAL OF CONTINUATION OF PRIOR INVESTMENT ADVISORY AGREEMENT
The Investment Company Act of 1940 requires that both the full Board of Trustees and a majority of the non-interested (“independent”) Trustees, voting separately, annually approve the continuation of the investment advisory agreement between MFS Variable Insurance Trust II (the “Trust”) and Massachusetts Financial Services Company (“MFS”) on behalf of the Fund. The Trustees consider matters bearing on the Fund and the advisory arrangements at their meetings throughout the year, including a review of performance data at each regular meeting. In addition, the independent Trustees met in person in May and again in July 2011 (“contract review meetings”) for the specific purpose of considering whether to approve the continuation of the investment advisory agreement for the Fund. The independent Trustees were assisted in their evaluation of the investment advisory agreement by independent legal counsel, from whom they received separate legal advice and with whom they met separately from MFS management during various contract review meetings. The independent Trustees were also assisted in this process by the Fund’s Independent Chief Compliance Officer, a full-time senior officer appointed by and reporting to the independent Trustees.
In connection with their deliberations, the Trustees, including the independent Trustees, considered such information and factors as they believed, in light of the legal advice furnished to them and their own business judgment, to be relevant. The investment advisory agreement was considered separately for the Fund, although the Trustees also took into account the common interests of all Funds in the Trust in their review. As described below, the Trustees considered the nature, quality, and extent of the various investment advisory, administrative, and shareholder services performed by MFS under the existing investment advisory agreement and other arrangements with the Trust.
In connection with their contract review meetings, the Trustees received and relied upon materials which included, among other items: (i) information provided by Lipper Inc. (“Lipper”) on the investment performance of the Fund for various time periods ended December 31, 2010, compared to the investment performance of a group of funds with substantially similar investment classifications/objectives (the “Lipper performance universe”), (ii) information provided by Lipper on the Fund’s advisory fees and other expenses compared to the advisory fees and other expenses of comparable funds identified by Lipper (the “Lipper expense group”), (iii) information provided by MFS on the advisory fees of comparable portfolios of its other clients, including institutional separate account and other clients, (iv) information as to whether, and to what extent applicable, expense waivers, reimbursements or fee “breakpoints” are observed for the Fund, (v) information regarding MFS’ financial results and financial condition, including MFS’ and certain of its affiliates’ estimated profitability from services performed for the Fund and other investment companies that the Board oversees as a whole, and for MFS’ institutional business, (vi) MFS’ views regarding the outlook for the mutual fund industry and its strategic business plans, (vii) descriptions of various functions performed by MFS for the Trust, such as compliance monitoring and portfolio trading practices, and (viii) information regarding the overall organization of MFS, including information about MFS’ senior management and other personnel providing investment advisory, administrative and other services to the Fund. The comparative performance, fee and expense information prepared and provided by Lipper was not independently verified, and the independent Trustees did not independently verify any information provided to them by MFS.
The Trustees’ conclusion as to the continuation of the investment advisory agreement was based on comprehensive consideration of all information provided to the Trustees and was not the result of any single factor. Some of the factors that figured particularly in the Trustees’ deliberations are described below for the Fund, while individual Trustees may have given different weight to various factors and evaluated the information presented as a whole differently than another individual Trustee. The Trustees recognized that the fee arrangements for the Fund reflect years of review and discussion between the independent Trustees and MFS, that certain aspects of such arrangements may receive greater scrutiny in some years than others, and that the Trustees’ conclusions may be based, in part, on their consideration of these same arrangements during the course of the year and in prior years.
30
Table of Contents
MFS Bond Portfolio
Board Approval of Continuation of Prior Investment Advisory Agreement – continued
Based on information provided by Lipper, the Trustees compared the Fund’s total return investment performance to the performance of the Lipper performance universe over various time periods. The Trustees placed particular emphasis on the total return performance of the Fund’s Initial Class shares in comparison to the performance of funds in its Lipper performance universe over the one-, three- and five-year periods ended December 31, 2010. The Trustees did not rely on performance results for more recent periods, including those shown elsewhere in this report.
The Trustees noted the performance of the Fund’s Initial Class shares was in the 1st quintile relative to the other funds in the Lipper performance universe for the one-year period (the 1st quintile being the best performers and the 5th quintile being the worst performers). The total return performance of the Fund was also in the 1st quintile for the three-year and the five-year periods ended December 31, 2010, relative to the Lipper performance universe. Based on the nature and quality of services provided by MFS, the Board of Trustees concluded that the Fund’s performance was satisfactory.
In the course of their deliberations, the Trustees took into account information provided by MFS during contract review meetings, as well as during investment review meetings conducted with portfolio management personnel during the course of the year.
In assessing the reasonableness of the Fund’s advisory fee, the Trustees considered, among other information, the Fund’s advisory fee and the total expense ratio of the Fund’s Initial Class shares as a percentage of average daily net assets, compared to the advisory fee and total expense ratios of its peer group of funds based on information provided by Lipper. The Trustees also considered the advisory fees charged by MFS to institutional accounts. In comparing these fees, the Trustees considered the generally broader scope of services provided by MFS to the Trust than those provided to institutional accounts. The Trustees also considered the higher demands placed on MFS’ investment personnel and trading infrastructure as a result of the daily cash in-flows and out-flows of the Fund, and the impact on MFS and related expenses due to the more extensive regulatory regime to which the Fund is subject, compared to institutional accounts.
In considering the fees, the Trustees noted from the Lipper data (which takes into account any reductions or expense limitations) that the Fund’s effective advisory fee rate and total expense ratio were each above the median of such fees and expenses of funds in the Lipper expense group. The Trustees further concluded that the existing breakpoint was sufficient to allow the Fund to benefit from economies of scale as its assets grow. The Trustees concluded that the fees were reasonable in light of the nature and quality of services provided.
The Trustees also considered information prepared by MFS relating to its costs and profits with respect to the Fund and other investment companies and accounts advised by MFS, as well as MFS’ methodologies used to determine and allocate its costs to the Fund and other accounts and products for purposes of estimating profitability.
After reviewing these and other factors described below, the Trustees concluded that the advisory fees charged to the Fund represent reasonable compensation in light of the nature and quality of the services being provided by MFS.
In addition, the Trustees considered MFS’ resources and related efforts to continue to retain, attract and motivate capable personnel to serve the Fund. The Trustees also considered the financial resources of MFS and its parent, Sun Life Financial Inc. The Trustees further considered any advantages and possible disadvantages of having an adviser which also serves other investment companies as well as institutional accounts.
The Trustees also considered the nature, quality, cost, and extent of administrative, transfer agency, and distribution services provided to the Fund by MFS and its affiliates under agreements and plans other than the investment advisory agreement, including the 12b-1 fees the Fund pays to MFS Fund Distributors, Inc., an affiliate of MFS. The Trustees also considered the nature, extent and quality of certain other services MFS performs or arranges on the Fund’s behalf, which may include securities lending programs, directed expense payment programs, class action recovery programs, and MFS’ interaction with third-party service providers, principally custodians and sub-custodians. The Trustees concluded that the various non-advisory services provided by MFS and its affiliates on behalf of the Fund were satisfactory. The Trustees also considered the benefits to MFS from the use of the Fund’s portfolio brokerage commissions, if applicable, to pay for investment research and various other factors. Additionally, the Trustees considered so-called “fall-out benefits” to MFS such as reputational value derived from serving as investment manager to the Trust, and determined that any such benefits derived by MFS were reasonable and fair.
Based on their evaluation of factors that they deemed to be material, including those factors described above, the Board of Trustees, including a majority of the independent Trustees, concluded that the investment advisory agreement should be continued for an additional one-year period, commencing September 1, 2011.
A discussion regarding the Board’s most recent review and renewal of the fund’s Investment Advisory Agreement with MFS is available by clicking on the fund’s name under “Variable Insurance Portfolios — VIT II” in the “Products and Performance” section of the MFS Web site (mfs.com).
31
Table of Contents
MFS Bond Portfolio
PROXY VOTING POLICIES AND INFORMATION
A general description of the MFS funds’ proxy voting policies and procedures is available without charge, upon request, by calling 1-800-225-2606, by visiting the Proxy Voting section of mfs.com or by visiting the SEC’s Web site at http://www.sec.gov.
Information regarding how the fund voted proxies relating to portfolio securities during the most recent twelve-month period ended June 30 is available without charge by visiting the Proxy Voting section of mfs.com or by visiting the SEC’s Web site at http://www.sec.gov.
QUARTERLY PORTFOLIO DISCLOSURE
The fund will file a complete schedule of portfolio holdings with the Securities and Exchange Commission (the Commission) for the first and third quarters of each fiscal year on Form N-Q. The fund’s Form N-Q is available on the EDGAR database on the Commission’s Internet Web site at http://www.sec.gov and may be reviewed and copied at the:
Public Reference Room
Securities and Exchange Commission
100 F Street, NE, Room 1580
Washington, D.C. 20549
Information on the operation of the Public Reference Room may be obtained by calling the Commission at 1-800-SEC-0330. Copies of the fund’s Form N-Q also may be obtained, upon payment of a duplicating fee, by electronic request at the following e-mail address: publicinfo@sec.gov or by writing the Public Reference Section at the above address.
From time to time, MFS may post important information about the fund or the MFS funds on the MFS web site (mfs.com). This information is available by visiting the “News & Commentary” section of mfs.com or by clicking on the fund’s name under “Variable Insurance Portfolios — VIT II” in the “Products and Performance” section of mfs.com.
32
Table of Contents
rev. 3/11

| Why? | Financial companies choose how they share your personal information. Federal law gives consumers the right to limit some but not all sharing. Federal law also requires us to tell you how we collect, share, and protect your personal information. Please read this notice carefully to understand what we do. |
| What? | The types of personal information we collect and share depend on the product or service you have with us. This information can include:
• Social Security number and account balances • Account transactions and transaction history • Checking account information and wire transfer instructions
When you are no longer our customer, we continue to share your information as described in this notice. |
| How? | All financial companies need to share customers’ personal information to run their everyday business. In the section below, we list the reasons financial companies can share their customers’ personal information; the reasons MFS chooses to share; and whether you can limit this sharing. |
| Reasons we can share your personal information | Does MFS share? | Can you limit this sharing? | ||
For our everyday business purposes – such as to process your transactions, maintain your account(s), respond to court orders and legal investigations, or report to credit bureaus | Yes | No | ||
For our marketing purposes – to offer our products and services to you | No | We don’t share | ||
| For joint marketing with other financial companies | No | We don’t share | ||
For our affiliates’ everyday business purposes – information about your transactions and experiences | No | We don’t share | ||
For our affiliates’ everyday business purposes – information about your creditworthiness | No | We don’t share | ||
| For nonaffiliates to market to you | No | We don’t share |
| Questions? | Call 800-225-2606 or go to mfs.com. |
33
Table of Contents
| Page 2 |
| Who we are | ||
| Who is providing this notice? | MFS Funds, MFS Investment Management, MFS Institutional Advisors, Inc., MFS Fund Distributors, Inc., MFS Heritage Trust Company, and MFS Service Center, Inc. | |
| What we do | ||
| How does MFS protect my personal information? | To protect your personal information from unauthorized access and use, we use security measures that comply with federal law. These measures include procedural, electronic, and physical safeguards for the protection of the personal information we collect about you. | |
| How does MFS collect my personal information? | We collect your personal information, for example, when you
• open an account or provide account information • direct us to buy securities or direct us to sell your securities • make a wire transfer
We also collect your personal information from others, such as credit bureaus, affiliates and other companies. | |
| Why can’t I limit all sharing? | Federal law gives you the right to limit only
• sharing for affiliates’ everyday business purposes – information about your creditworthiness • affiliates from using your information to market to you • sharing for nonaffiliates to market to you
State laws and individual companies may give you additional rights to limit sharing. | |
| Definitions | ||
| Affiliates | Companies related by common ownership or control. They can be financial and nonfinancial companies.
• MFS does not share personal information with affiliates, except for everyday business purposes as described on page one of this notice. | |
| Nonaffiliates | Companies not related by common ownership or control. They can be financial and nonfinancial companies.
• MFS does not share with nonaffiliates so they can market to you. | |
| Joint Marketing | A formal agreement between nonaffiliated financial companies that together market financial products or services to you.
• MFS doesn’t jointly market. | |
| Other important information | ||
| If you own an MFS product or receive an MFS service in the name of a third party such as a bank or broker-dealer, their privacy policy may apply to you instead of ours. | ||
34
Table of Contents

Table of Contents

MFS® Government Securities Portfolio
MFS® Variable Insurance Trust II

ANNUAL REPORT
December 31, 2011
GSS-ANN
Table of Contents
MFS® GOVERNMENT SECURITIES PORTFOLIO
The report is prepared for the general information of contract owners.
It is authorized for distribution to prospective investors only when preceded or accompanied by a current prospectus.
NOT FDIC INSURED Ÿ MAY LOSE VALUE Ÿ NO BANK OR CREDIT UNION GUARANTEE Ÿ NOT A DEPOSIT Ÿ NOT INSURED BY ANY FEDERAL GOVERNMENT AGENCY OR NCUA/NCUSIF
Table of Contents
MFS Government Securities Portfolio
LETTER FROM THE CHAIRMAN AND CEO

Dear Contract Owners:
We are indeed living through some volatile times. Economic uncertainty is everywhere, as it seems no place in the world has been unmoved by crisis. We have seen a devastating earthquake and tsunami that have led to disruptions in the Japanese markets
and supply chains. Protests have changed the face of the Middle East and left in their wake lingering tensions and resultant higher oil prices. We have seen debt limits tested in Europe and the United States and policymakers grappling to craft often unpopular monetary and fiscal responses at a time when consumers and businesses struggle with what appears to be a slowing global economy. On top of all of that, we have seen long-term U.S. debt lose its Standard & Poor’s AAA rating and the long-term debt ratings of 15 eurozone nations put on negative watch.
When markets become volatile, managing risk becomes a top priority for investors and their advisors. At MFS® risk management is foremost in our minds in all market climates. Our analysts and portfolio managers keep risks firmly in mind when evaluating securities. Additionally, we have a team of quantitative analysts that measures and assesses the risk profiles of our portfolios and securities on an ongoing basis. The chief investment risk officer, who oversees the team, reports directly to the firm’s president and chief investment officer so the risk associated with each portfolio can be assessed objectively and independently of the portfolio management team.
As always, we continue to be mindful of the many economic challenges faced at the local, national, and international levels. It is in times such as these that we want to remind investors of the merits of maintaining a long-term view, adhering to basic investing principles such as asset allocation and diversification, and working closely with their advisors to research and identify appropriate investment opportunities.
Respectfully,

Robert J. Manning
Chairman and Chief Executive Officer
MFS Investment Management®
February 15, 2012
The opinions expressed in this letter are subject to change, may not be relied upon for investment advice, and no forecasts can be guaranteed.
1
Table of Contents
MFS Government Securities Portfolio
Portfolio structure (i)
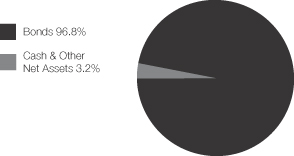
| Fixed income sectors (i) | ||||
| Mortgage-Backed Securities | 43.4% | |||
| U.S. Treasury Securities | 41.3% | |||
| U.S. Government Agencies | 8.4% | |||
| Commercial Mortgage-Backed Securities | 1.6% | |||
| High Grade Corporates | 1.2% | |||
| Municipal Bonds | 0.9% |
| Composition including fixed income credit quality (a)(i) | ||||
| AAA | 2.0% | |||
| AA | 1.3% | |||
| A | 0.1% | |||
| BBB | 0.3% | |||
| U.S. Government | 41.3% | |||
| Federal Agencies | 51.8% | |||
| Cash & Other | 3.2% | |||
| Portfolio facts (i) | ||||
| Average Duration (d) | 3.9 | |||
| Average Effective Maturity (m) | 5.7 yrs. | |||
| (a) | For all securities other than those specifically described below, ratings are assigned to underlying securities utilizing ratings from Moody’s, Fitch, and Standard & Poor’s rating agencies and applying the following hierarchy: If all three agencies provide a rating, the middle rating (after dropping the highest and lowest ratings) is assigned; if two of the three agencies rate a security, the lower of the two is assigned. Ratings are shown in the S&P and Fitch scale (e.g., AAA). All ratings are subject to change. U.S. Government includes securities issued by the U.S. Department of the Treasury. Federal Agencies includes rated and unrated U.S. Agency fixed-income securities, U.S. Agency mortgage-backed securities and collateralized mortgage obligations of U.S. Agency mortgage-backed securities. Cash & Other includes cash, other assets less liabilities, offsets to derivative positions, and short-term securities. The fund may not hold all of these instruments. The fund is not rated by these agencies. |
| (d) | Duration is a measure of how much a bond’s price is likely to fluctuate with general changes in interest rates, e.g., if rates rise 1.00%, a bond with a 5-year duration is likely to lose about 5.00% of its value due to the interest rate move. |
| (i) | For purposes of this presentation, the components include the market value of securities, and reflect the impact of the equivalent exposure of derivative positions. These amounts may be negative from time to time. The bond component will include any accrued interest amounts. Equivalent exposure is a calculated amount that translates the derivative position into a reasonable approximation of the amount of the underlying asset that the portfolio would have to hold at a given point in time to have the same price sensitivity that results from the portfolio’s ownership of the derivative contract. When dealing with derivatives, equivalent exposure is a more representative measure of the potential impact of a position on portfolio performance than market value. Where the fund holds convertible bonds, these are treated as part of the equity portion of the portfolio. |
| (m) | In determining an instrument’s effective maturity for purposes of calculating the fund’s dollar-weighted average effective maturity, MFS uses the instrument’s stated maturity or, if applicable, an earlier date on which MFS believes it is probable that a maturity-shortening device (such as a put, pre-refunding or prepayment) will cause the instrument to be repaid. Such an earlier date can be substantially shorter than the instrument’s stated maturity. |
Percentages are based on net assets as of 12/31/11.
The portfolio is actively managed and current holdings may be different.
2
Table of Contents
MFS Government Securities Portfolio
Summary of Results
For the twelve months ended December 31, 2011, Initial Class shares of the MFS Government Securities Portfolio (the “fund”) provided a total return of 7.40%, while Service Class shares of the fund provided a total return of 7.11%. These compare with a return of 7.74% for the fund’s benchmark, the Barclays Capital U.S. Government/Mortgage Bond Index.
Market Environment
Early in the period, the U.S. Federal Reserve (the “Fed”) responded to weak economic growth by loosening monetary policy further. More easing by the Fed improved market sentiment and drove risk-asset prices markedly higher. The December 2010 agreement on a surprisingly large (relative to expectations) expansionary U.S. fiscal package also boosted sentiment. During the subsequent several months, the renewed positive market sentiment, coupled with better indications of global macroeconomic activity, pushed many asset valuations to post-crisis highs. At the same time, the yields of the perceived “safest” global sovereign credits rose, indicating a renewed risk-seeking environment.
However, towards the middle of the period, a weakening macroeconomic backdrop and renewed concerns over peripheral euro zone sovereign debt caused a flight-to-quality move that pushed high-quality sovereign bond yields lower. In the U.S., concerns about sovereign debt default and the long-term sustainability of the trend in U.S. fiscal policy resulted in one agency downgrading U.S. credit quality. Amidst this turmoil, global equity markets declined sharply. As a result of these developments, global consumer and producer sentiment indicators fell precipitously and highly-rated sovereign bond yields hit multi-decade lows. Towards the end of the reporting period, uncertainty in financial markets spiked higher as markets more seriously contemplated the possible failure of the euro zone.
Detractors from Performance
Relative to the Barclays Capital U.S. Government/Mortgage Bond Index, the fund’s lesser exposure to pure pass-through mortgage-backed securities, particularly to Government National Mortgage Association (Ginnie Mae) securities, held back relative results as these bonds performed well over the reporting period.
Contributors to Performance
Yield curve (y) positioning, particularly the fund’s greater exposure to shifts at the long end of the yield curve (centered around maturities of 10 years or more), contributed to relative performance as the yield curve flattened over the reporting period.
Security selection was another positive factor for relative results.
Respectfully,
Geoffrey Schechter
Portfolio Manager
| (y) | A yield curve graphically depicts the yields of different maturity bonds of the same credit quality and type; a normal yield curve is upward sloping, with short-term rates lower than long-term rates. |
The views expressed in this report are those of the portfolio manager only through the end of the period of the report as stated on the cover and do not necessarily reflect the views of MFS or any other person in the MFS organization. These views are subject to change at any time based on market or other conditions, and MFS disclaims any responsibility to update such views. These views may not be relied upon as investment advice or an indication of trading intent on behalf of any MFS portfolio. References to specific securities are not recommendations of such securities, and may not be representative of any MFS portfolio’s current or future investments.
3
Table of Contents
MFS Government Securities Portfolio
PERFORMANCE SUMMARY THROUGH 12/31/11
The following chart illustrates the historical performance of the fund in comparison to its benchmark(s). Benchmarks are unmanaged and may not be invested in directly. Benchmark returns do not reflect any fees or expenses. The performance of other share classes will be greater than or less than that of the class depicted below. (See Notes to Performance Summary.)
Performance data shown represents past performance and is no guarantee of future results. Investment return and principal value fluctuate so your units, when sold, may be worth more or less than the original cost; current performance may be lower or higher than quoted. The performance shown does not reflect the deduction of taxes, if any, that a contract holder would pay on fund distributions or the redemption of contract units. The returns for the fund shown also do not reflect the deduction of expenses associated with variable products, such as mortality and expense risk charges, separate account charges, and sales charges imposed by the insurance company separate accounts. Such expenses would reduce the overall returns shown.
Growth of a Hypothetical $10,000 Investment
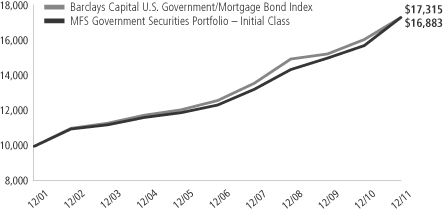
Total Returns through 12/31/11
Average annual total returns
| Share class | Class inception date | 1-yr | 5-yr | 10-yr | ||||||||
| Initial Class | 6/12/85 | 7.40% | 6.46% | 5.38% | ||||||||
| Service Class | 8/24/01 | 7.11% | 6.20% | 5.12% | ||||||||
| Comparative benchmark | ||||||||||||
| Barclays Capital U.S. Government/Mortgage Bond Index (f) | 7.74% | 6.56% | 5.64% | |||||||||
| (f) | Source: FactSet Research Systems Inc. |
Benchmark Definition
Barclays Capital U.S. Government/Mortgage Bond Index – measures debt issued by the U.S. Government, and its agencies, as well as mortgage-backed pass-through securities of Ginnie Mae (GNMA), Fannie Mae (FNMA), and Freddie Mac (FHLMC).
It is not possible to invest directly in an index.
Notes to Performance Summary
Average annual total return represents the average annual change in value for each share class for the periods presented.
Performance results reflect any applicable expense subsidies and waivers in effect during the periods shown. Without such subsidies and waivers the fund’s performance results would be less favorable. Please see the prospectus and financial statements for complete details. All results are historical and assume the reinvestment of any dividends and capital gains distributions.
Performance results do not include adjustments made for financial reporting purposes in accordance with U.S. generally accepted accounting principles and may differ from amounts reported in the financial highlights.
From time to time the fund may receive proceeds from litigation settlements, without which performance would be lower.
4
Table of Contents
MFS Government Securities Portfolio
Fund Expenses Borne by the Contract Holders During the Period,
July 1, 2011 through December 31, 2011
As a contract holder of the fund, you incur ongoing costs, including management fees; distribution and/or service (12b-1) fees; and other fund expenses. This example is intended to help you understand your ongoing costs (in dollars) of investing in the fund and to compare these costs with the ongoing costs of investing in other mutual funds.
The example is based on an investment of $1,000 invested at the beginning of the period and held for the entire period July 1, 2011 through December 31, 2011.
Actual Expenses
The first line for each share class in the following table provides information about actual account values and actual expenses. You may use the information in this line, together with the amount you invested, to estimate the expenses that you paid over the period. Simply divide your account value by $1,000 (for example, an $8,600 account value divided by $1,000 = 8.6), then multiply the result by the number in the first line under the heading entitled “Expenses Paid During Period” to estimate the expenses you paid on your account during this period.
Hypothetical Example for Comparison Purposes
The second line for each share class in the following table provides information about hypothetical account values and hypothetical expenses based on the fund’s actual expense ratio and an assumed rate of return of 5% per year before expenses, which is not the fund’s actual return. The hypothetical account values and expenses may not be used to estimate the actual ending account balance or expenses you paid for the period. You may use this information to compare the ongoing costs of investing in the fund and other funds. To do so, compare this 5% hypothetical example with the 5% hypothetical examples that appear in the shareholder reports of the other funds.
Please note that the expenses shown in the table are meant to highlight the fund’s ongoing costs only and do not take into account the fees and expenses imposed under the variable contracts through which your investment in the fund is made. Therefore, the second line for each share class in the table is useful in comparing ongoing costs associated with an investment in vehicles (such as the fund) which fund benefits under variable annuity and variable life insurance contracts and to qualified pension and retirement plans only, and will not help you determine the relative total costs of investing in the fund through variable annuity and variable life insurance contracts. If the fees and expenses imposed under the variable contracts were included, your costs would have been higher.
| Share Class | Annualized Expense Ratio | Beginning Account Value 7/01/11 | Ending Account Value 12/31/11 | Expenses Paid During Period (p) 7/01/11-12/31/11 | ||||||||||||||
| Initial Class | Actual | 0.62% | $1,000.00 | $1,050.25 | $3.20 | |||||||||||||
| Hypothetical (h) | 0.62% | $1,000.00 | $1,022.08 | $3.16 | ||||||||||||||
| Service Class | Actual | 0.87% | $1,000.00 | $1,048.82 | $4.49 | |||||||||||||
| Hypothetical (h) | 0.87% | $1,000.00 | $1,020.82 | $4.43 | ||||||||||||||
| (h) | 5% class return per year before expenses. |
| (p) | Expenses paid is equal to each class’ annualized expense ratio, as shown above, multiplied by the average account value over the period, multiplied by the number of days in the period, divided by the number of days in the year. |
Expense Changes Impacting the Table
Changes to the portfolio’s fee arrangements occurred during the six month period. Had these fee changes been in effect throughout the entire six month period, the annualized expense ratios would have been 0.61% for the Initial Class shares and 0.86% for the Service Class shares; the actual expenses paid during the period would have been approximately $3.15 for the Initial Class shares and $4.44 for the Service Class shares; and the hypothetical expenses paid during the period would have been approximately $3.11 for the Initial Class shares and $4.38 for the Service Class shares. For further information about the fund’s fee arrangements and changes to those fee arrangements, please see Note 3 in the Notes to Financial Statements.
5
Table of Contents
MFS Government Securities Portfolio
PORTFOLIO OF INVESTMENTS – 12/31/11
The Portfolio of Investments is a complete list of all securities owned by your fund. It is categorized by broad-based asset classes.
| Issuer | Shares/Par | Value ($) | ||||||
| BONDS – 96.2% | ||||||||
| Agency – Other – 5.2% | ||||||||
| Financing Corp., 9.4%, 2018 | $ | 6,495,000 | $ | 9,328,022 | ||||
| Financing Corp., 9.8%, 2018 | 7,760,000 | 11,404,080 | ||||||
| Financing Corp., 10.35%, 2018 | 3,915,000 | 5,960,439 | ||||||
| Financing Corp., STRIPS, 0%, 2017 | 10,160,000 | 9,237,543 | ||||||
|
| |||||||
| $ | 35,930,084 | |||||||
|
| |||||||
| Asset-Backed & Securitized – 1.6% | ||||||||
| Citigroup/Deutsche Bank Commercial Mortgage Trust, 5.322%, 2049 | $ | 1,860,000 | $ | 1,972,815 | ||||
| Commercial Mortgage Pass-Through Certificates, “A4”, 5.306%, 2046 | 3,870,649 | 4,197,367 | ||||||
| JPMorgan Chase Commercial Mortgage Securities Corp., FRN, 5.816%, 2049 | 2,275,833 | 2,418,589 | ||||||
| JPMorgan Chase Commercial Mortgage Securities Corp., FRN, 5.986%, 2051 | 2,223,578 | 2,365,769 | ||||||
|
| |||||||
| $ | 10,954,540 | |||||||
|
| |||||||
| Local Authorities – 1.2% | ||||||||
| Nashville & Davidson County, TN, Metropolitan Government Convention Center Authority (Build America Bonds), 6.731%, 2043 | $ | 2,225,000 | $ | 2,615,999 | ||||
| Port Authority NY & NJ (168th Series), 4.926%, 2051 | 2,735,000 | 2,821,070 | ||||||
| San Francisco, CA, City & County Public Utilities Commission, Water Rev. (Build America Bonds), 6%, 2040 | 320,000 | 373,187 | ||||||
| State of California (Build America Bonds), 7.625%, 2040 | 435,000 | 535,202 | ||||||
| University of California Rev. (Build America Bonds), 5.77%, 2043 | 1,345,000 | 1,522,917 | ||||||
|
| |||||||
| �� | $ | 7,868,375 | ||||||
|
| |||||||
| Mortgage-Backed – 43.2% | ||||||||
| Fannie Mae, 4.719%, 2012 | $ | 344,468 | $ | 347,468 | ||||
| Fannie Mae, 4.73%, 2012 | 928,181 | 944,238 | ||||||
| Fannie Mae, 6.005%, 2012 | 257,808 | 258,473 | ||||||
| Fannie Mae, 4.325%, 2013 | 344,344 | 353,276 | ||||||
| Fannie Mae, 4.501%, 2013 | 587,338 | 600,587 | ||||||
| Fannie Mae, 4.542%, 2013 | 1,407,422 | 1,443,268 | ||||||
| Fannie Mae, 4.845%, 2013 | 1,849,911 | 1,915,484 | ||||||
| Fannie Mae, 5%, 2013 - 2041 | 28,819,154 | 31,157,536 | ||||||
| Fannie Mae, 5.06%, 2013 | 915,431 | 959,539 | ||||||
| Fannie Mae, 5.159%, 2013 | 2,234,474 | 2,343,493 | ||||||
| Fannie Mae, 5.37%, 2013 | 1,482,094 | 1,519,473 | ||||||
| Fannie Mae, 4.563%, 2014 | 1,039,503 | 1,101,083 | ||||||
| Fannie Mae, 4.6%, 2014 | 900,422 | 949,390 | ||||||
| Fannie Mae, 4.61%, 2014 | 3,417,085 | 3,615,690 | ||||||
| Fannie Mae, 4.77%, 2014 | 769,375 | 819,697 | ||||||
| Fannie Mae, 4.82%, 2014 - 2015 | 923,408 | 998,878 | ||||||
| Fannie Mae, 4.842%, 2014 | 5,224,464 | 5,548,991 | ||||||
| Fannie Mae, 4.873%, 2014 | 3,280,614 | 3,418,353 | ||||||
| Fannie Mae, 4.88%, 2014 - 2020 | 869,156 | 943,755 | ||||||
| Issuer | Shares/Par | Value ($) | ||||||
| BONDS – continued | ||||||||
| Mortgage-Backed – continued | ||||||||
| Fannie Mae, 5.1%, 2014 - 2019 | $ | 1,237,521 | $ | 1,338,431 | ||||
| Fannie Mae, 4.56%, 2015 | 1,166,724 | 1,254,498 | ||||||
| Fannie Mae, 4.62%, 2015 | 1,587,955 | 1,704,256 | ||||||
| Fannie Mae, 4.665%, 2015 | 788,945 | 849,965 | ||||||
| Fannie Mae, 4.69%, 2015 | 562,323 | 605,149 | ||||||
| Fannie Mae, 4.7%, 2015 | 1,020,989 | 1,100,675 | ||||||
| Fannie Mae, 4.74%, 2015 | 740,386 | 800,958 | ||||||
| Fannie Mae, 4.78%, 2015 | 897,048 | 975,651 | ||||||
| Fannie Mae, 4.79%, 2015 | 1,027,891 | 1,117,898 | ||||||
| Fannie Mae, 4.81%, 2015 | 1,018,633 | 1,108,249 | ||||||
| Fannie Mae, 4.815%, 2015 | 921,244 | 999,396 | ||||||
| Fannie Mae, 4.85%, 2015 | 564,881 | 609,099 | ||||||
| Fannie Mae, 4.856%, 2015 | 306,198 | 332,592 | ||||||
| Fannie Mae, 4.87%, 2015 | 594,499 | 644,241 | ||||||
| Fannie Mae, 4.89%, 2015 | 752,739 | 813,231 | ||||||
| Fannie Mae, 4.893%, 2015 | 1,588,087 | 1,737,319 | ||||||
| Fannie Mae, 4.997%, 2015 | 157,379 | 171,861 | ||||||
| Fannie Mae, 5.466%, 2015 | 3,189,028 | 3,517,723 | ||||||
| Fannie Mae, 5.152%, 2016 | 1,807,440 | 2,017,051 | ||||||
| Fannie Mae, 5.35%, 2016 | 53,202 | 59,272 | ||||||
| Fannie Mae, 5.423%, 2016 | 1,823,452 | 2,053,313 | ||||||
| Fannie Mae, 5.725%, 2016 | 1,652,183 | 1,828,226 | ||||||
| Fannie Mae, 6.5%, 2016 - 2037 | 4,838,339 | 5,473,467 | ||||||
| Fannie Mae, 4.989%, 2017 | 3,362,152 | 3,618,093 | ||||||
| Fannie Mae, 5.5%, 2017 - 2038 | 39,134,677 | 42,713,532 | ||||||
| Fannie Mae, 6%, 2017 - 2037 | 9,169,324 | 10,090,904 | ||||||
| Fannie Mae, 3.8%, 2018 | 651,665 | 704,614 | ||||||
| Fannie Mae, 3.99%, 2018 | 600,000 | 654,008 | ||||||
| Fannie Mae, 4%, 2018 | 693,673 | 756,046 | ||||||
| Fannie Mae, 4.19%, 2018 | 396,532 | 435,357 | ||||||
| Fannie Mae, 5.16%, 2018 | 1,397,836 | 1,551,478 | ||||||
| Fannie Mae, 5.68%, 2018 | 508,464 | 574,435 | ||||||
| Fannie Mae, 4.5%, 2019 - 2041 | 21,249,093 | 22,680,005 | ||||||
| Fannie Mae, 4.67%, 2019 | 525,000 | 587,931 | ||||||
| Fannie Mae, 4.83%, 2019 | 389,113 | 437,553 | ||||||
| Fannie Mae, 4.876%, 2019 | 2,588,068 | 2,878,368 | ||||||
| Fannie Mae, 5.05%, 2019 | 325,884 | 368,794 | ||||||
| Fannie Mae, 5.6%, 2019 | 626,564 | 698,185 | ||||||
| Fannie Mae, 3.87%, 2020 | 758,928 | 821,342 | ||||||
| Fannie Mae, 4.14%, 2020 | 467,147 | 512,366 | ||||||
| Fannie Mae, 7.5%, 2022 - 2031 | 592,501 | 706,541 | ||||||
| Fannie Mae, 4.5%, 2025 | 993,124 | 1,059,047 | ||||||
| Freddie Mac, 4.375%, 2015 | 42,310 | 42,298 | ||||||
| Freddie Mac, 5%, 2016 - 2040 | 11,987,260 | 12,852,538 | ||||||
| Freddie Mac, 3.882%, 2017 | 2,158,000 | 2,357,607 | ||||||
| Freddie Mac, 3.154%, 2018 | 2,151,000 | 2,265,197 | ||||||
| Freddie Mac, 4.186%, 2019 | 814,000 | 906,304 | ||||||
| Freddie Mac, 5.085%, 2019 | 3,191,000 | 3,663,077 | ||||||
| Freddie Mac, 6%, 2019 - 2038 | 19,043,936 | 21,122,029 | ||||||
| Freddie Mac, 3.32%, 2020 | 976,974 | 1,044,493 | ||||||
| Freddie Mac, 4.224%, 2020 | 1,911,350 | 2,116,358 | ||||||
| Freddie Mac, 4.251%, 2020 | 1,449,000 | 1,604,521 | ||||||
6
Table of Contents
MFS Government Securities Portfolio
Portfolio of Investments – continued
| Issuer | Shares/Par | Value ($) | ||||||
| BONDS – continued | ||||||||
| Mortgage-Backed – continued | ||||||||
| Freddie Mac, 4.5%, 2022 - 2028 | $ | 1,702,334 | $ | 1,776,437 | ||||
| Freddie Mac, 5.5%, 2022 - 2036 | 23,158,500 | 25,277,357 | ||||||
| Freddie Mac, 4%, 2025 | 4,992,157 | 5,240,848 | ||||||
| Freddie Mac, 6.5%, 2032 - 2037 | 2,981,764 | 3,380,699 | ||||||
| Ginnie Mae, 4%, 2032 | 37,850 | 37,997 | ||||||
| Ginnie Mae, 5.5%, 2033 - 2038 | 9,062,423 | 10,211,927 | ||||||
| Ginnie Mae, 4.5%, 2039 - 2041 | 10,937,208 | 11,980,450 | ||||||
| Ginnie Mae, 5.612%, 2058 | 4,860,709 | 5,163,076 | ||||||
| Ginnie Mae, 6.357%, 2058 | 2,566,162 | 2,723,139 | ||||||
|
| |||||||
| $ | 295,966,144 | |||||||
|
| |||||||
| Municipals – 1.0% | ||||||||
| Minnesota Public Facilities Authority, Revolving Fund Rev., “C”, 5%, 2020 | $ | 3,850,000 | $ | 4,890,847 | ||||
| Triborough Bridge & Tunnel Authority Rev., NY, “A”, 5%, 2021 | 1,310,000 | 1,624,557 | ||||||
|
| |||||||
| $ | 6,515,404 | |||||||
|
| |||||||
| U.S. Government Agencies and Equivalents – 3.0% | ||||||||
| Aid-Egypt, 4.45%, 2015 | $ | 3,162,000 | $ | 3,537,393 | ||||
| FDIC Structured Sale Guarantee Note, 0%, 2012 (n) | 516,000 | 511,918 | ||||||
| Small Business Administration, 6.35%, 2021 | 749,824 | 830,174 | ||||||
| Small Business Administration, 6.34%, 2021 | 680,141 | 753,907 | ||||||
| Small Business Administration, 6.44%, 2021 | 1,081,447 | 1,202,135 | ||||||
| Small Business Administration, 6.625%, 2021 | 1,471,513 | 1,632,160 | ||||||
| Small Business Administration, 6.07%, 2022 | 978,872 | 1,083,924 | ||||||
| Small Business Administration, 4.98%, 2023 | 1,073,062 | 1,175,843 | ||||||
| Small Business Administration, 4.77%, 2024 | 1,931,320 | 2,109,767 | ||||||
| Small Business Administration, 5.52%, 2024 | 1,232,765 | 1,372,258 | ||||||
| Small Business Administration, 4.99%, 2024 | 152,640 | 167,668 | ||||||
| Small Business Administration, 5.11%, 2025 | 1,461,158 | 1,614,092 | ||||||
| U.S. Department of Housing & Urban Development, 6.36%, 2016 | 4,272,000 | 4,278,686 | ||||||
| U.S. Department of Housing & Urban Development, 6.59%, 2016 | 416,000 | 416,513 | ||||||
|
| |||||||
| $ | 20,686,438 | |||||||
|
| |||||||
| U.S. Treasury Obligations – 41.0% | ||||||||
| U.S. Treasury Bonds, 9.25%, 2016 | $ | 19,000 | $ | 25,649 | ||||
| U.S. Treasury Bonds, 7.5%, 2016 | 218,000 | 287,470 | ||||||
| U.S. Treasury Bonds, 7.875%, 2021 | 177,000 | 270,105 | ||||||
| U.S. Treasury Bonds, 6.25%, 2023 | 2,891,000 | 4,137,744 | ||||||
| U.S. Treasury Bonds, 6%, 2026 | 2,699,000 | 3,889,934 | ||||||
| U.S. Treasury Bonds, 6.75%, 2026 | 1,862,000 | 2,875,336 | ||||||
| U.S. Treasury Bonds, 6.375%, 2027 | 326,000 | 494,145 | ||||||
| Issuer | Shares/Par | Value ($) | ||||||
| BONDS – continued | ||||||||
| U.S. Treasury Obligations – continued | ||||||||
| U.S. Treasury Bonds, 5.25%, 2029 | $ | 18,828,000 | $ | 26,012,049 | ||||
| U.S. Treasury Bonds, 4.5%, 2036 | 1,226,000 | 1,604,336 | ||||||
| U.S. Treasury Bonds, 5%, 2037 | 488,000 | 686,631 | ||||||
| U.S. Treasury Bonds, 4.375%, 2038 | 3,919,000 | 5,066,530 | ||||||
| U.S. Treasury Bonds, 4.5%, 2039 | 21,111,500 | 27,923,252 | ||||||
| U.S. Treasury Notes, 1.125%, 2012 | 1,170,000 | 1,170,412 | ||||||
| U.S. Treasury Notes, 1.375%, 2012 | 2,014,900 | 2,018,047 | ||||||
| U.S. Treasury Notes, 1.375%, 2012 | 101,963,000 | 102,460,885 | ||||||
| U.S. Treasury Notes, 1.375%, 2013 | 57,000 | 57,708 | ||||||
| U.S. Treasury Notes, 1.375%, 2013 | 648,000 | 657,239 | ||||||
| U.S. Treasury Notes, 4%, 2014 | 211,000 | 227,550 | ||||||
| U.S. Treasury Notes, 1.875%, 2014 | 12,853,000 | 13,318,921 | ||||||
| U.S. Treasury Notes, 4%, 2015 | 6,718,000 | 7,461,179 | ||||||
| U.S. Treasury Notes, 2.125%, 2015 | 35,954,000 | 37,956,746 | ||||||
| U.S. Treasury Notes, 2.625%, 2016 | 201,000 | 217,473 | ||||||
| U.S. Treasury Notes, 2.625%, 2018 | 9,719,000 | 10,582,319 | ||||||
| U.S. Treasury Notes, 2.75%, 2019 | 5,047,400 | 5,528,084 | ||||||
| U.S. Treasury Notes, 3.125%, 2019 | 8,538,000 | 9,573,231 | ||||||
| U.S. Treasury Notes, 3.5%, 2020 | 7,808,000 | 8,982,253 | ||||||
| U.S. Treasury Notes, 2.625%, 2020 | 6,777,000 | 7,309,103 | ||||||
|
| |||||||
| $ | 280,794,331 | |||||||
|
| |||||||
| Total Bonds (Identified Cost, $610,035,322) | $ | 658,715,316 | ||||||
|
| |||||||
| MONEY MARKET FUNDS – 3.2% | ||||||||
| MFS Institutional Money Market Portfolio, 0.05%, at Cost and Net Asset Value (v) | 21,906,213 | $ | 21,906,213 | |||||
|
| |||||||
| Total Investments (Identified Cost, $631,941,535) | $ | 680,621,529 | ||||||
|
| |||||||
| OTHER ASSETS, LESS LIABILITIES – 0.6% | 3,871,102 | |||||||
|
| |||||||
| Net Assets – 100.0% | $ | 684,492,631 | ||||||
|
| |||||||
| (n) | Securities exempt from registration under Rule 144A of the Securities Act of 1933. These securities may be sold in the ordinary course of business in transactions exempt from registration, normally to qualified institutional buyers. At period end, the aggregate value of these securities was $511,918, representing 0.1% of net assets. |
| (v) | Underlying affiliated fund that is available only to investment companies managed by MFS. The rate quoted for the MFS Institutional Money Market Portfolio is the annualized seven-day yield of the fund at period end. |
The following abbreviations are used in this report and are defined:
| FRN | Floating Rate Note. Interest rate resets periodically and may not be the rate reported at period end. |
| STRIPS | Separate Trading of Registered Interest and Principal of Securities |
See Notes to Financial Statements
7
Table of Contents
MFS Government Securities Portfolio
FINANCIAL STATEMENTS | STATEMENT OF ASSETS AND LIABILITIES
This statement represents your fund’s balance sheet, which details the assets and liabilities comprising the total value of the fund.
At 12/31/11 | ||||||||
Assets | ||||||||
Investments – | ||||||||
Non-affiliated issuers, at value (identified cost, $610,035,322) | $658,715,316 | |||||||
Underlying affiliated funds, at cost and value | 21,906,213 | |||||||
Total investments, at value (identified cost, $631,941,535) | $680,621,529 | |||||||
Receivables for | ||||||||
Fund shares sold | 494,049 | |||||||
Interest | 4,004,415 | |||||||
Other assets | 17,755 | |||||||
Total assets | $685,137,748 | |||||||
Liabilities | ||||||||
Payable for fund shares reacquired | $521,347 | |||||||
Payable to affiliates | ||||||||
Investment adviser | 32,804 | |||||||
Distribution and/or service fees | 8,623 | |||||||
Payable for Trustees’ compensation | 984 | |||||||
Accrued expenses and other liabilities | 81,359 | |||||||
Total liabilities | $645,117 | |||||||
Net assets | $684,492,631 | |||||||
Net assets consist of | ||||||||
Paid-in capital | $616,027,268 | |||||||
Unrealized appreciation (depreciation) on investments | 48,679,994 | |||||||
Accumulated distributions in excess of net realized gain on investments | (20,362 | ) | ||||||
Undistributed net investment income | 19,805,731 | |||||||
Net assets | $684,492,631 | |||||||
Shares of beneficial interest outstanding | 50,101,870 |
| Net assets | Shares outstanding | Net asset value per share | ||||||||||
Initial Class | $264,328,205 | 19,259,061 | $13.72 | |||||||||
Service Class | 420,164,426 | 30,842,809 | 13.62 | |||||||||
See Notes to Financial Statements
8
Table of Contents
MFS Government Securities Portfolio
FINANCIAL STATEMENTS | STATEMENT OF OPERATIONS
This statement describes how much your fund earned in investment income and accrued in expenses. It also describes any gains and/or losses generated by fund operations.
Year ended 12/31/11 | ||||||||
Net investment income | ||||||||
Income | ||||||||
Interest | $22,642,662 | |||||||
Dividends from underlying affiliated funds | 49,638 | |||||||
Total investment income | $22,692,300 | |||||||
Expenses | ||||||||
Management fee | $3,555,508 | |||||||
Distribution and/or service fees | 1,070,108 | |||||||
Administrative services fee | 214,722 | |||||||
Trustees’ compensation | 76,161 | |||||||
Custodian fee | 78,329 | |||||||
Shareholder communications | 20,366 | |||||||
Auditing fees | 49,383 | |||||||
Legal fees | 5,643 | |||||||
Miscellaneous | 49,719 | |||||||
Total expenses | $5,119,939 | |||||||
Fees paid indirectly | (39 | ) | ||||||
Net expenses | $5,119,900 | |||||||
Net investment income | $17,572,400 | |||||||
Realized and unrealized gain (loss) on investments | ||||||||
Realized gain (loss) (identified cost basis) | ||||||||
Investment transactions | $7,964,728 | |||||||
Futures contracts | (528,904 | ) | ||||||
Net realized gain (loss) on investments | $7,435,824 | |||||||
Change in unrealized appreciation (depreciation) | ||||||||
Investments | $20,450,412 | |||||||
Futures contracts | (89,375 | ) | ||||||
Net unrealized gain (loss) on investments | $20,361,037 | |||||||
Net realized and unrealized gain (loss) on investments | $27,796,861 | |||||||
Change in net assets from operations | $45,369,261 |
See Notes to Financial Statements
9
Table of Contents
MFS Government Securities Portfolio
FINANCIAL STATEMENTS | STATEMENTS OF CHANGES IN NET ASSETS
These statements describe the increases and/or decreases in net assets resulting from operations, any distributions, and any shareholder transactions.
For years ended 12/31 | 2011 | 2010 | ||||||
Change in net assets | ||||||||
| From operations | ||||||||
Net investment income | $17,572,400 | $21,588,117 | ||||||
Net realized gain (loss) on investments | 7,435,824 | 2,821,596 | ||||||
Net unrealized gain (loss) on investments | 20,361,037 | 6,059,440 | ||||||
Change in net assets from operations | $45,369,261 | $30,469,153 | ||||||
| Distributions declared to shareholders | ||||||||
From net investment income | $(23,218,426 | ) | $(23,390,230 | ) | ||||
From net realized gain on investments | (228,585 | ) | — | |||||
Total distributions declared to shareholders | $(23,447,011 | ) | $(23,390,230 | ) | ||||
Change in net assets from fund share transactions | $(6,053,896 | ) | $(5,850,571 | ) | ||||
Total change in net assets | $15,868,354 | $1,228,352 | ||||||
| Net assets | ||||||||
At beginning of period | 668,624,277 | 667,395,925 | ||||||
At end of period (including undistributed net investment income of $19,805,731 and | $684,492,631 | $668,624,277 |
See Notes to Financial Statements
10
Table of Contents
MFS Government Securities Portfolio
FINANCIAL STATEMENTS | FINANCIAL HIGHLIGHTS
The financial highlights table is intended to help you understand the fund’s financial performance for the past 5 years. Certain information reflects financial results for a single fund share. The total returns in the table represent the rate by which an investor would have earned (or lost) on an investment in the fund share class (assuming reinvestment of all distributions) held for the entire period.
| Initial Class | Years ended 12/31 | |||||||||||||||||||
| 2011 | 2010 | 2009 | 2008 | 2007 | ||||||||||||||||
Net asset value, beginning of period | $13.27 | $13.14 | $13.23 | $12.89 | $12.65 | |||||||||||||||
| Income (loss) from investment operations | ||||||||||||||||||||
Net investment income (d) | $0.39 | $0.45 | $0.50 | $0.55 | $0.56 | |||||||||||||||
Net realized and unrealized gain (loss) on investments | 0.58 | 0.16 | 0.08 | 0.51 | 0.31 | |||||||||||||||
Total from investment operations | $0.97 | $0.61 | $0.58 | $1.06 | $0.87 | |||||||||||||||
| Less distributions declared to shareholders | ||||||||||||||||||||
From net investment income | $(0.52 | ) | $(0.48 | ) | $(0.67 | ) | $(0.72 | ) | $(0.63 | ) | ||||||||||
From net realized gain on investments | (0.00 | )(w) | — | — | — | — | ||||||||||||||
Total distributions declared to shareholders | $(0.52 | ) | $(0.48 | ) | $(0.67 | ) | $(0.72 | ) | $(0.63 | ) | ||||||||||
Net asset value, end of period (x) | $13.72 | $13.27 | $13.14 | $13.23 | $12.89 | |||||||||||||||
Total return (%) (k)(s)(x) | 7.40 | 4.75 | 4.49 | 8.55 | 7.18 | |||||||||||||||
| Ratios (%) (to average net assets) and Supplemental data: | ||||||||||||||||||||
Expenses (f) | 0.63 | 0.64 | 0.64 | 0.65 | 0.63 | |||||||||||||||
Net investment income | 2.88 | 3.39 | 3.85 | 4.31 | 4.48 | |||||||||||||||
Portfolio turnover | 29 | 36 | 36 | 52 | 39 | |||||||||||||||
Net assets at end of period (000 omitted) | $264,328 | $227,694 | $250,133 | $266,170 | $299,871 | |||||||||||||||
| Service Class | Years ended 12/31 | |||||||||||||||||||
| 2011 | 2010 | 2009 | 2008 | 2007 | ||||||||||||||||
Net asset value, beginning of period | $13.18 | $13.06 | $13.15 | $12.81 | $12.58 | |||||||||||||||
| Income (loss) from investment operations | ||||||||||||||||||||
Net investment income (d) | $0.35 | $0.41 | $0.46 | $0.52 | $0.53 | |||||||||||||||
Net realized and unrealized gain (loss) on investments | 0.57 | 0.17 | 0.08 | 0.50 | 0.31 | |||||||||||||||
Total from investment operations | $0.92 | $0.58 | $0.54 | $1.02 | $0.84 | |||||||||||||||
| Less distributions declared to shareholders | ||||||||||||||||||||
From net investment income | $(0.48 | ) | $(0.46 | ) | $(0.63 | ) | $(0.68 | ) | $(0.61 | ) | ||||||||||
From net realized gain on investments | (0.00 | )(w) | — | — | — | — | ||||||||||||||
Total distributions declared to shareholders | $(0.48 | ) | $(0.46 | ) | $(0.63 | ) | $(0.68 | ) | $(0.61 | ) | ||||||||||
Net asset value, end of period (x) | $13.62 | $13.18 | $13.06 | $13.15 | $12.81 | |||||||||||||||
Total return (%) (k)(s)(x) | 7.11 | 4.49 | 4.23 | 8.29 | 6.91 | |||||||||||||||
| Ratios (%) (to average net assets) and Supplemental data: | ||||||||||||||||||||
Expenses (f) | 0.88 | 0.89 | 0.89 | 0.90 | 0.88 | |||||||||||||||
Net investment income | 2.64 | 3.13 | 3.54 | 4.06 | 4.23 | |||||||||||||||
Portfolio turnover | 29 | 36 | 36 | 52 | 39 | |||||||||||||||
Net assets at end of period (000 omitted) | $420,164 | $440,930 | $417,263 | $271,052 | $320,695 | |||||||||||||||
| (d) | Per share data is based on average shares outstanding. |
| (f) | Ratios do not reflect reductions from fees paid indirectly, if applicable. |
| (k) | The total return does not reflect expenses that apply to separate accounts. Inclusion of these charges would reduce the total return figures for all periods shown. |
| (s) | From time to time the fund may receive proceeds from litigation settlements, without which performance would be lower. |
| (w) | Per share amount was less than $0.01. |
| (x) | The net asset values per share and total returns have been calculated on net assets which include adjustments made in accordance with U.S. generally accepted accounting principles required at period end for financial reporting purposes. |
See Notes to Financial Statements
11
Table of Contents
MFS Government Securities Portfolio
| (1) | Business and Organization |
MFS Government Securities Portfolio (the fund) is a series of MFS Variable Insurance Trust II (the trust). The trust is organized as a Massachusetts business trust and is registered under the Investment Company Act of 1940, as amended, as an open-end management investment company. The shareholders of each series of the trust are separate accounts of insurance companies, which offer variable annuity and/or life insurance products, and qualified retirement and pension plans.
| (2) | Significant Accounting Policies |
General – The preparation of financial statements in conformity with U.S. generally accepted accounting principles requires management to make estimates and assumptions that affect the reported amounts of assets and liabilities, and disclosure of contingent assets and liabilities at the date of the financial statements and the reported amounts of revenues and expenses during the reporting period. Actual results could differ from those estimates. In the preparation of these financial statements, management has evaluated subsequent events occurring after the date of the fund’s Statement of Assets and Liabilities through the date that the financial statements were issued. The fund invests a significant portion of its assets in asset-backed and/or mortgage-backed securities. The value of these securities may depend, in part, on the issuer’s or borrower’s credit quality or ability to pay principal and interest when due and may fall if an issuer or borrower defaults on its obligation to pay principal or interest or if the instrument’s credit rating is downgraded by a credit rating agency. U.S. Government securities not supported as to the payment of principal or interest by the U.S. Treasury, such as those issued by Fannie Mae, Freddie Mac, and the Federal Home Loan Banks, are subject to greater credit risk than are U.S. Government securities supported by the U.S. Treasury, such as those issued by Ginnie Mae.
In December 2011, the Financial Accounting Standards Board issued Accounting Standards Update 2011-11, Balance Sheet (Topic 210) – Disclosures about Offsetting Assets and Liabilities (“ASU 2011-11”). Effective for annual reporting periods beginning on or after January 1, 2013 and interim periods within those annual periods, ASU 2011-11 is intended to enhance disclosure requirements on the offsetting of financial assets and liabilities. Although still evaluating the potential impacts of ASU 2011-11 to the fund, management expects that the impact of the fund’s adoption will be limited to additional financial statement disclosures.
Investment Valuations – Debt instruments and floating rate loans (other than short-term instruments), including restricted debt instruments, are generally valued at an evaluated or composite bid as provided by a third-party pricing service. Short-term instruments with a maturity at issuance of 60 days or less generally are valued at amortized cost, which approximates market value. Exchange-traded options are generally valued at the last sale or official closing price as provided by a third-party pricing service on the exchange on which such options are primarily traded. Exchange-traded options for which there were no sales reported that day are generally valued at the last daily bid quotation as provided by a third-party pricing service on the exchange on which such options are primarily traded. Options not traded on an exchange are generally valued at a broker/dealer bid quotation. Foreign currency options are generally valued at valuations provided by a third-party pricing service. Futures contracts are generally valued at last posted settlement price as provided by a third-party pricing service on the market on which they are primarily traded. Futures contracts for which there were no trades that day for a particular position are generally valued at the closing bid quotation as provided by a third-party pricing service on the market on which such futures contracts are primarily traded. Open-end investment companies are generally valued at net asset value per share. Securities and other assets generally valued on the basis of information from a third-party pricing service may also be valued at a broker/dealer bid quotation. Values obtained from third-party pricing services can utilize both transaction data and market information such as yield, quality, coupon rate, maturity, type of issue, trading characteristics, and other market data.
The Board of Trustees has delegated primary responsibility for determining or causing to be determined the value of the fund’s investments (including any fair valuation) to the adviser pursuant to valuation policies and procedures approved by the Board. If the adviser determines that reliable market quotations are not readily available, investments are valued at fair value as determined in good faith by the adviser in accordance with such procedures under the oversight of the Board of Trustees. Under the fund’s valuation policies and procedures, market quotations are not considered to be readily available for most types of debt instruments and floating rate loans and many types of derivatives. These investments are generally valued at fair value based on information from third-party pricing services. In addition, investments may be valued at fair value if the adviser determines that an investment’s value has been materially affected by events occurring after the close of the exchange or market on which the investment is principally traded (such as foreign exchange or market) and prior to the determination of the fund’s net asset value, or after the halting of trading of a specific security where trading does not resume prior to the close of the exchange or market on which the security is principally traded. The adviser generally relies on third-party pricing services or other information (such as the correlation with price movements of similar securities in the same or other markets; the type, cost and investment characteristics of the security; the business and financial condition of the issuer; and trading and other market data) to assist in determining whether to fair value and at what value to fair value an investment. The value of an
12
Table of Contents
MFS Government Securities Portfolio
Notes to Financial Statements – continued
investment for purposes of calculating the fund’s net asset value can differ depending on the source and method used to determine value. When fair valuation is used, the value of an investment used to determine the fund’s net asset value may differ from quoted or published prices for the same investment. There can be no assurance that the fund could obtain the fair value assigned to an investment if it were to sell the investment at the same time at which the fund determines its net asset value per share.
Various inputs are used in determining the value of the fund’s assets or liabilities. These inputs are categorized into three broad levels. In certain cases, the inputs used to measure fair value may fall into different levels of the fair value hierarchy. In such cases, an investment’s level within the fair value hierarchy is based on the lowest level of input that is significant to the fair value measurement. The fund’s assessment of the significance of a particular input to the fair value measurement in its entirety requires judgment, and considers factors specific to the investment. Level 1 includes unadjusted quoted prices in active markets for identical assets or liabilities. Level 2 includes other significant observable market-based inputs (including quoted prices for similar securities, interest rates, prepayment speed, and credit risk). Level 3 includes unobservable inputs, which may include the adviser’s own assumptions in determining the fair value of investments. The following is a summary of the levels used as of December 31, 2011 in valuing the fund’s assets or liabilities:
| Investments at Value | Level 1 | Level 2 | Level 3 | Total | ||||||||||||
| U.S. Treasury Bonds & U.S. Government Agency & Equivalents | $— | $337,410,853 | $— | $337,410,853 | ||||||||||||
| Municipal Bonds | — | 6,515,404 | — | 6,515,404 | ||||||||||||
| Corporate Bonds | — | 7,868,375 | — | 7,868,375 | ||||||||||||
| Residential Mortgage-Backed Securities | — | 295,966,144 | — | 295,966,144 | ||||||||||||
| Commercial Mortgage-Backed Securities | — | 10,954,540 | — | 10,954,540 | ||||||||||||
| Mutual Funds | 21,906,213 | — | — | 21,906,213 | ||||||||||||
| Total Investments | $21,906,213 | $658,715,316 | $— | $680,621,529 | ||||||||||||
For further information regarding security characteristics, see the Portfolio of Investments.
Inflation-Adjusted Debt Securities – The fund invests in inflation-adjusted debt securities issued by the U.S. Treasury. The fund may also invest in inflation-adjusted debt securities issued by U.S. Government agencies and instrumentalities other than the U.S. Treasury and by other entities such as U.S. and foreign corporations and foreign governments. The principal value of these debt securities is adjusted through income according to changes in the Consumer Price Index or another general price or wage index. These debt securities typically pay a fixed rate of interest, but this fixed rate is applied to the inflation-adjusted principal amount. The principal paid at maturity of the debt security is typically equal to the inflation-adjusted principal amount, or the security’s original par value, whichever is greater. Other types of inflation-adjusted securities may use other methods to adjust for other measures of inflation.
Derivatives – The fund uses derivatives for different purposes, primarily to increase or decrease exposure to a particular market or segment of the market, or security, to increase or decrease interest rate or currency exposure, or as alternatives to direct investments. Derivatives are used for hedging or non-hedging purposes. While hedging can reduce or eliminate losses, it can also reduce or eliminate gains. When the fund uses derivatives as an investment to increase market exposure, or for hedging purposes, gains and losses from derivative instruments may be substantially greater than the derivative’s original cost.
The derivative instruments used by the fund were purchased options and futures contracts. At December 31, 2011, the fund did not have any outstanding derivative instruments.
The following table presents, by major type of derivative contract, the realized gain (loss) on derivatives held by the fund for the year ended December 31, 2011 as reported in the Statement of Operations:
| Risk | Futures Contracts | Investment Transactions (Purchased Options) | ||||||
| Interest Rate | $(528,904 | ) | $1,448 | |||||
The following table presents, by major type of derivative contract, the change in unrealized appreciation (depreciation) on derivatives held by the fund for the year ended December 31, 2011 as reported in the Statement of Operations:
| Risk | Futures Contracts | |||
| Interest Rate | $(89,375 | ) | ||
Derivative counterparty credit risk is managed through formal evaluation of the creditworthiness of all potential counterparties. On certain over-the-counter derivatives, the fund attempts to reduce its exposure to counterparty credit risk
13
Table of Contents
MFS Government Securities Portfolio
Notes to Financial Statements – continued
whenever possible by entering into an International Swaps and Derivatives Association (ISDA) Master Agreement on a bilateral basis with each of the counterparties with whom it undertakes a significant volume of transactions. The ISDA Master Agreement gives each party to the agreement the right to terminate all transactions traded under such agreement if there is a certain deterioration in the credit quality of the other party. The ISDA Master Agreement gives the fund the right, upon an event of default by the applicable counterparty or a termination of the agreement, to close out all transactions traded under such agreement and to net amounts owed under each transaction to one net amount payable by one party to the other. This right to close out and net payments across all transactions traded under the ISDA Master Agreement could result in a reduction of the fund’s credit risk to such counterparty equal to any amounts payable by the fund under the applicable transactions, if any. However, absent an event of default by the counterparty or a termination of the agreement, the ISDA Master Agreement does not result in an offset of reported amounts of assets and liabilities in the Statement of Assets and Liabilities across transactions between the fund and the applicable counterparty.
Collateral requirements differ by type of derivative. Collateral or margin requirements are set by the broker or exchange clearing house for exchange traded derivatives (i.e., futures and exchange-traded options) while collateral terms are contract specific for over-the-counter traded derivatives (i.e., forward foreign currency exchange contracts, swaps and over-the-counter options). For derivatives traded under an ISDA Master Agreement, the collateral requirements are netted across all transactions traded under such agreement and one amount is posted from one party to the other to collateralize such obligations. Cash collateral that has been pledged to cover obligations of the fund under derivative contracts, if any, will be reported separately on the Statement of Assets and Liabilities as restricted cash. Securities collateral pledged for the same purpose, if any, is noted in the Portfolio of Investments.
Purchased Options – The fund purchased call and put options for a premium. Purchased call and put options entitle the holder to buy and sell a specified number of shares or units of a particular security, currency or index at a specified price at a specified date or within a specified period of time. Purchasing call options may be used to hedge against an anticipated increase in the dollar cost of securities or currency to be acquired or to increase the fund’s exposure to an underlying instrument. Purchasing put options may hedge against a decline in the value of portfolio securities or currency.
The premium paid is initially recorded as an investment in the Statement of Assets and Liabilities. That investment is subsequently marked-to-market daily with the difference between the premium paid and the market value of the purchased option being recorded as unrealized appreciation or depreciation. Premiums paid for purchased call and put options which have expired are treated as realized losses on investments in the Statement of Operations. Upon the exercise or closing of a purchased call option, the premium paid is added to the cost of the security or financial instrument. Upon the exercise or closing of a purchased put option, the premium paid is offset against the proceeds on the sale of the underlying security or financial instrument in order to determine the realized gain or loss on investments.
The risk in purchasing an option is that the fund pays a premium whether or not the option is exercised. The fund’s maximum risk of loss due to counterparty credit risk is limited to the market value of the option. For over-the-counter options, this risk is mitigated in cases where there is an ISDA Master Agreement between the fund and the counterparty providing for netting as described above and for posting of collateral by the counterparty to the fund to cover the fund’s exposure to the counterparty under such ISDA Master Agreement.
Futures Contracts – The fund entered into futures contracts which may be used to hedge against or obtain broad market, interest rate or currency exposure. A futures contract represents a commitment for the future purchase or sale of an asset at a specified price on a specified date.
Upon entering into a futures contract, the fund is required to deposit with the broker, either in cash or securities, an initial margin in an amount equal to a certain percentage of the notional amount of the contract. Subsequent payments (variation margin) are made or received by the fund each day, depending on the daily fluctuations in the value of the contract, and are recorded for financial statement purposes as unrealized gain or loss by the fund until the contract is closed or expires at which point the gain or loss on futures is realized.
The fund bears the risk of interest rates, exchange rates or securities prices moving unexpectedly, in which case, the fund may not achieve the anticipated benefits of the futures contracts and may realize a loss. While futures may present less counterparty risk to the fund since the contracts are exchange traded and the exchange’s clearinghouse guarantees payments to the broker, there is still counterparty credit risk due to the insolvency of the broker. The fund’s maximum risk of loss due to counterparty credit risk is equal to the margin posted by the fund to the broker plus any gains or minus any losses on the outstanding futures contracts.
Indemnifications – Under the fund’s organizational documents, its officers and Trustees may be indemnified against certain liabilities and expenses arising out of the performance of their duties to the fund. Additionally, in the normal course of
14
Table of Contents
MFS Government Securities Portfolio
Notes to Financial Statements – continued
business, the fund enters into agreements with service providers that may contain indemnification clauses. The fund’s maximum exposure under these agreements is unknown as this would involve future claims that may be made against the fund that have not yet occurred.
Investment Transactions and Income – Investment transactions are recorded on the trade date. Interest income is recorded on the accrual basis. All premium and discount is amortized or accreted for financial statement purposes in accordance with U.S. generally accepted accounting principles. Inflation-indexed bonds are fixed-income securities whose principal value is periodically adjusted upward or downward to the rate of inflation. Interest is accrued based on the principal value, which is adjusted for inflation. Any increase or decrease in the principal amount of an inflation-indexed bond is generally recorded as an increase or decrease in interest income, respectively, even though the adjusted principal is not received until maturity. Dividend and interest payments received in additional securities are recorded on the ex-dividend or ex-interest date in an amount equal to the value of the security on such date.
The fund may receive proceeds from litigation settlements. Any proceeds received from litigation involving portfolio holdings are reflected in the Statement of Operations in realized gain/loss if the security has been disposed of by the fund or in unrealized gain/loss if the security is still held by the fund. Any other proceeds from litigation not related to portfolio holdings are reflected as other income in the Statement of Operations.
The fund purchased or sold debt securities on a when-issued or delayed delivery basis, or in a “To Be Announced” (TBA) or “forward commitment” transaction with delivery or payment to occur at a later date beyond the normal settlement period. TBA securities resulting from these transactions are included in the Portfolio of Investments. At the time a fund enters into a commitment to purchase or sell a security, the transaction is recorded and the value of the security acquired is reflected in the fund’s net asset value. The price of such security and the date that the security will be delivered and paid for are fixed at the time the transaction is negotiated. The value of the security may vary with market fluctuations. No interest accrues to the fund until payment takes place. At the time that a fund enters into this type of transaction, the fund is required to have sufficient cash and/or liquid securities to cover its commitments. Losses may arise due to changes in the value of the underlying securities or if the counterparty does not perform under the contract’s terms, or if the issuer does not issue the securities due to political, economic or other factors. Additionally, losses may arise due to declines in the value of the securities prior to settlement date.
Fees Paid Indirectly – The fund’s custody fee may be reduced according to an arrangement that measures the value of cash deposited with the custodian by the fund. This amount, for the year ended December 31, 2011, is shown as a reduction of total expenses on the Statement of Operations.
Tax Matters and Distributions – The fund intends to qualify as a regulated investment company, as defined under Subchapter M of the Internal Revenue Code, and to distribute all of its taxable income, including realized capital gains. As a result, no provision for federal income tax is required. The fund’s federal tax returns for the prior three fiscal years remain subject to examination by the Internal Revenue Service.
Distributions to shareholders are recorded on the ex-dividend date. Income and capital gain distributions are determined in accordance with income tax regulations, which may differ from U.S. generally accepted accounting principles. Certain capital accounts in the financial statements are periodically adjusted for permanent differences in order to reflect their tax character. These adjustments have no impact on net assets or net asset value per share. Temporary differences which arise from recognizing certain items of income, expense, gain or loss in different periods for financial statement and tax purposes will reverse at some time in the future. Distributions in excess of net investment income or net realized gains are temporary overdistributions for financial statement purposes resulting from differences in the recognition or classification of income or distributions for financial statement and tax purposes.
Book/tax differences primarily relate to amortization and accretion of debt securities.
The tax character of distributions declared to shareholders for the last two fiscal years is as follows:
| 12/31/11 | 12/31/10 | |||||||
| Ordinary income (including any short-term capital gains) | $23,218,426 | $23,390,230 | ||||||
| Long-term capital gains | 228,585 | — | ||||||
| Total distributions | $23,447,011 | $23,390,230 | ||||||
15
Table of Contents
MFS Government Securities Portfolio
Notes to Financial Statements – continued
The federal tax cost and the tax basis components of distributable earnings were as follows:
| As of 12/31/11 | ||||
| Cost of investments | $637,801,352 | |||
| Gross appreciation | 43,546,195 | |||
| Gross depreciation | (726,018 | ) | ||
| Net unrealized appreciation (depreciation) | $42,820,177 | |||
| Undistributed ordinary income | 23,921,103 | |||
| Undistributed long-term capital gain | 1,793,816 | |||
| Other temporary differences | (69,733 | ) | ||
Multiple Classes of Shares of Beneficial Interest – The fund offers multiple classes of shares, which differ in their respective distribution and/or service fees. The fund’s income, realized and unrealized gain (loss), and common expenses are allocated to shareholders based on the daily net assets of each class. Dividends are declared separately for each class. Differences in per share dividend rates are generally due to differences in separate class expenses. The fund’s distributions declared to shareholders as reported on the Statements of Changes in Net Assets are presented by class as follows:
| From net investment income | From net realized gain on investments | |||||||||||||||
| Year ended 12/31/11 | Year ended 12/31/10 | Year ended 12/31/11 | Year ended 12/31/10 | |||||||||||||
| Initial Class | $7,932,135 | $8,713,299 | $74,653 | $— | ||||||||||||
| Service Class | 15,286,291 | 14,676,931 | 153,932 | — | ||||||||||||
| Total | $23,218,426 | $23,390,230 | $228,585 | $— | ||||||||||||
| (3) | Transactions with Affiliates |
Investment Adviser – The fund has an investment advisory agreement with MFS to provide overall investment management and related administrative services and facilities to the fund. The management fee is computed daily and paid monthly at the following annual rates:
| First $1 billion of average daily net assets | 0.55% | |||
| Average daily net assets in excess of $1 billion | 0.50% |
The management fee incurred for the year ended December 31, 2011 was equivalent to an annual effective rate of 0.55% of the fund’s average daily net assets.
The investment adviser has agreed in writing to pay a portion of the fund’s total annual operating expenses, exclusive of interest, taxes, extraordinary expenses, and brokerage commissions , such that total annual fund operating expenses do not exceed 1.25% of the fund’s average daily net assets. MFS’ agreement to limit the fund’s total annual operating expenses is contained in the investment advisory agreement between MFS and the fund. This agreement terminated on December 31, 2011 in connection with shareholder approval on December 1, 2011 of a new investment advisory agreement between the trust, on behalf of the fund, and MFS effective January 1, 2012. In addition, the investment adviser has voluntarily agreed to pay a portion of the fund’s total annual operating expenses, exclusive of interest, taxes, extraordinary expenses, and brokerage commissions, such that total annual operating expenses do not exceed 1.00% of the fund’s average daily net assets attributable to Initial Class shares. This voluntary agreement terminated December 31, 2011. For the year ended December 31, 2011, the fund’s actual operating expenses did not exceed the limit and therefore, the investment adviser did not pay any portion of the fund’s expenses related to this agreement.
Effective December 3, 2011, the investment adviser has agreed in writing to pay a portion of the fund’s total annual operating expenses, exclusive of interest, taxes, extraordinary expenses, brokerage and transaction costs and investment-related expenses, such that total annual operating expenses do not exceed 0.61% of average daily net assets for the Initial Class shares and 0.86% of average daily net assets for the Service Class shares. This written agreement will continue until April 30, 2014. For the period December 3, 2011 through December 31, 2011, the fund’s actual operating expenses did not exceed the limit and therefore, the investment adviser did not pay any portion of the fund’s expenses related to this agreement.
Distributor – MFS Fund Distributors, Inc. (MFD), a wholly-owned subsidiary of MFS, is the distributor of shares of the fund. The Trustees have adopted a distribution plan for the Service Class shares pursuant to Rule 12b-1 under the Investment Company Act of 1940.
The fund’s distribution plan provides that the fund will pay MFD distribution and/or service fees equal to 0.25% per annum of its average daily net assets attributable to Service Class shares as partial consideration for services performed and expenses
16
Table of Contents
MFS Government Securities Portfolio
Notes to Financial Statements – continued
incurred by MFD and financial intermediaries (including participating insurance companies that invest in the fund to fund variable annuity and variable life insurance contracts, sponsors of qualified retirement and pension plans that invest in the fund, and affiliates of these participating insurance companies and plan sponsors) in connection with the sale and distribution of the Service Class shares. MFD may subsequently pay all, or a portion, of the distribution and/or service fees to financial intermediaries.
Shareholder Servicing Agent – MFS Service Center, Inc. (MFSC), a wholly-owned subsidiary of MFS, has contracted to provide transfer agent and recordkeeping functions in connection with the issuance, transfer, and redemption of each class of shares of the fund under a Shareholder Servicing Agent Agreement. During the year ended December 31, 2011, the fund did not pay MFSC a fee for this service.
Administrator – MFS provides certain financial, legal, shareholder communications, compliance, and other administrative services to the fund. Under an administrative services agreement, the fund partially reimburses MFS the costs incurred to provide these services. The fund is charged an annual fixed amount of $17,500 plus a fee based on average daily net assets. The administrative services fee incurred for the year ended December 31, 2011 was equivalent to an annual effective rate of 0.0332% of the fund’s average daily net assets.
Trustees’ and Officers’ Compensation – The fund pays compensation to Trustees in the form of a retainer, attendance fees, and additional compensation to the Board chairperson. The fund does not pay compensation directly to officers of the fund who are also officers of the investment adviser, all of whom receive remuneration for their services to the fund from MFS. Certain officers of the fund are officers or directors of MFS, MFD, and MFSC.
Other – This fund and certain other funds managed by MFS (the funds) have entered into services agreements (the Agreements) which provide for payment of fees by the funds to Tarantino LLC and Griffin Compliance LLC in return for the provision of services of an Independent Chief Compliance Officer (ICCO) and Assistant ICCO, respectively, for the funds. The ICCO and Assistant ICCO are officers of the funds and the sole members of Tarantino LLC and Griffin Compliance LLC, respectively. The funds can terminate the Agreements with Tarantino LLC and Griffin Compliance LLC at any time under the terms of the Agreements. MFS has agreed to bear all expenses associated with office space, other administrative support, and supplies provided to the ICCO and Assistant ICCO. For the year ended December 31, 2011, the aggregate fees paid by the fund to Tarantino LLC and Griffin Compliance LLC were $10,624 and are included in miscellaneous expense on the Statement of Operations.
The fund invests in the MFS Institutional Money Market Portfolio which is managed by MFS and seeks a high level of current income consistent with preservation of capital and liquidity. Income earned on this investment is included in dividends from underlying affiliated funds on the Statement of Operations. This money market fund does not pay a management fee to MFS.
| (4) | Portfolio Securities |
Purchases and sales of investments, other than purchased option transactions, and short-term obligations, were as follows:
| Purchases | Sales | |||||||
| U.S. Government securities | $175,000,726 | $2,320,426 | ||||||
| Investments (non-U.S. Government securities) | $494,938 | $319,692,831 | ||||||
Purchases exclude the value of securities acquired in connection with the Government Securities Variable Account merger. (See Note 8)
| (5) | Shares of Beneficial Interest |
The fund’s Declaration of Trust permits the Trustees to issue an unlimited number of full and fractional shares of beneficial interest. Transactions in fund shares were as follows:
| Year ended 12/31/11 | Year ended 12/31/10 | |||||||||||||||
| Shares | Amount | Shares | Amount | |||||||||||||
| Shares sold | ||||||||||||||||
Initial Class | 1,368,448 | $18,583,787 | 1,095,324 | $14,559,638 | ||||||||||||
Service Class | 3,457,872 | 46,547,288 | 4,738,186 | 62,491,854 | ||||||||||||
| 4,826,320 | $65,131,075 | 5,833,510 | $77,051,492 | |||||||||||||
| Shares issued in connection with acquisition of Government Securities Variable Account | ||||||||||||||||
Initial Class | 3,911,252 | $53,310,360 | ||||||||||||||
17
Table of Contents
MFS Government Securities Portfolio
Notes to Financial Statements – continued
| Year ended 12/31/11 | Year ended 12/31/10 | |||||||||||||||
| Shares | Amount | Shares | Amount | |||||||||||||
| Shares issued to shareholders in reinvestment of distributions | ||||||||||||||||
Initial Class | 593,095 | $8,006,788 | 674,404 | $8,713,299 | ||||||||||||
Service Class | 1,151,396 | 15,440,223 | 1,142,174 | 14,676,931 | ||||||||||||
| 1,744,491 | $23,447,011 | 1,816,578 | $23,390,230 | |||||||||||||
| Shares reacquired | ||||||||||||||||
Initial Class | (3,767,855 | ) | $(50,830,241 | ) | (3,646,469 | ) | $(48,569,228 | ) | ||||||||
Service Class | (7,224,647 | ) | (97,112,101 | ) | (4,373,733 | ) | (57,723,065 | ) | ||||||||
| (10,992,502 | ) | $(147,942,342 | ) | (8,020,202 | ) | $(106,292,293 | ) | |||||||||
| Net change | ||||||||||||||||
Initial Class | 2,104,940 | $29,070,694 | (1,876,741 | ) | $(25,296,291 | ) | ||||||||||
Service Class | (2,615,379 | ) | (35,124,590 | ) | 1,506,627 | 19,445,720 | ||||||||||
| (510,439 | ) | $(6,053,896 | ) | (370,114 | ) | $(5,850,571 | ) | |||||||||
| (6) | Line of Credit |
The fund and certain other funds managed by MFS participate in a $1.1 billion unsecured committed line of credit, subject to a $1 billion sublimit, provided by a syndication of banks under a credit agreement. Borrowings may be made for temporary financing needs. Interest is charged to each fund, based on its borrowings, generally at a rate equal to the higher of the Federal Reserve funds rate or one month LIBOR plus an agreed upon spread. A commitment fee, based on the average daily, unused portion of the committed line of credit, is allocated among the participating funds at the end of each calendar quarter. In addition, the fund and other funds managed by MFS have established unsecured uncommitted borrowing arrangements with certain banks for temporary financing needs. Interest is charged to each fund, based on its borrowings, at a rate equal to the Federal Reserve funds rate plus an agreed upon spread. For the year ended December 31, 2011, the fund’s commitment fee and interest expense were $4,986 and $0, respectively, and are included in miscellaneous expense on the Statement of Operations.
| (7) | Transactions in Underlying Affiliated Funds – Affiliated Issuers |
An affiliated issuer may be considered one in which the fund owns 5% or more of the outstanding voting securities, or a company which is under common control. For the purposes of this report, the fund assumes the following to be affiliated issuers:
| Underlying Affiliated Funds | Beginning Shares/Par Amount | Acquisitions Shares/Par Amount | Dispositions Shares/Par Amount | Ending Shares/Par Amount | ||||||||||||
| MFS Institutional Money Market Portfolio | 36,330,825 | 255,461,067 | (269,885,679 | ) | 21,906,213 | |||||||||||
| Underlying Affiliated Funds | Realized Gain (Loss) | Capital Gain Distributions | Dividend Income | Ending Value | ||||||||||||
| MFS Institutional Money Market Portfolio | $— | $— | $49,638 | $21,906,213 | ||||||||||||
| (8) | Acquisitions |
At the close of business on December 2, 2011, the fund with net assets of $622,179,000, acquired all of the investment-related assets and liabilities of Government Securities Variable Account. The acquisition was part of a transaction in which the Government Securities Variable Account was converted into a unit investment trust (“UIT”) that invests in the fund (the acquisition of the Account’s assets and liabilities and subsequent conversion into a UIT hereinafter referred to as the “Reorganization”). The Reorganization provided the contract owners of the Government Securities Variable Account with the opportunity to participate in a larger combined portfolio with an identical investment objective and similar investment policies and strategies. The acquisition was accomplished by a tax-free exchange of 3,911,252 shares of the fund (valued at $53,310,360) for all of the investment-related assets and liabilities of Government Securities Variable Account. Government Securities Variable Account’s net assets on that date were $53,310,360, including investments valued at $53,536,440 with a cost basis of $50,354,919. For financial reporting purposes, assets received and shares issued by the fund were recorded at fair value; however, the cost basis of the investments received from Government Securities Variable Account were carried forward to align ongoing reporting of the fund’s realized and unrealized gains and losses with amounts distributable to shareholders for tax purposes. Because the combined investment portfolios have been managed as a single integrated portfolio since the acquisition was completed, it is not practicable to separate the amounts of revenue and earnings of Government Securities Variable Account that have been included in MFS Government Securities Portfolio’s Statement of Operations since December 2, 2011. No pro forma information is provided as it is not material to the combined fund results.
18
Table of Contents
MFS Government Securities Portfolio
REPORT OF INDEPENDENT REGISTERED PUBLIC ACCOUNTING FIRM
To the Board of Trustees of MFS Variable Insurance Trust II and the Shareholders of
MFS Government Securities Portfolio:
We have audited the accompanying statement of assets and liabilities, including the portfolio of investments, of MFS Government Securities Portfolio (the “Fund”) (one of the portfolios comprising MFS Variable Insurance Trust II) as of December 31, 2011, and the related statement of operations for the year then ended, the statements of changes in net assets for each of the two years in the period then ended, and the financial highlights for each of the five years in the period then ended. These financial statements and financial highlights are the responsibility of the Fund’s management. Our responsibility is to express an opinion on these financial statements and financial highlights based on our audits.
We conducted our audits in accordance with the standards of the Public Company Accounting Oversight Board (United States). Those standards require that we plan and perform the audit to obtain reasonable assurance about whether the financial statements and financial highlights are free of material misstatement. The Fund is not required to have, nor were we engaged to perform, an audit of its internal control over financial reporting. Our audits included consideration of internal control over financial reporting as a basis for designing audit procedures that are appropriate in the circumstances, but not for the purpose of expressing an opinion on the effectiveness of the Fund’s internal control over financial reporting. Accordingly, we express no such opinion. An audit also includes examining, on a test basis, evidence supporting the amounts and disclosures in the financial statements, assessing the accounting principles used and significant estimates made by management, as well as evaluating the overall financial statement presentation. Our procedures included confirmation of securities owned as of December 31, 2011, by correspondence with the custodian and brokers; where replies were not received from brokers, we performed other auditing procedures. We believe that our audits provide a reasonable basis for our opinion.
In our opinion, the financial statements and financial highlights present fairly, in all material respects, the financial position of MFS Government Securities Portfolio as of December 31, 2011, the results of its operations for the year then ended, the changes in its net assets for each of the two years in the period then ended, and the financial highlights for each of the five years in the period then ended, in conformity with accounting principles generally accepted in the United States of America.
DELOITTE & TOUCHE LLP
Boston, Massachusetts
February 15, 2012
19
Table of Contents
MFS Government Securities Portfolio
RESULTS OF SHAREHOLDER MEETING (unaudited)
At a special meeting of shareholders of MFS Government Securities Portfolio, which was held on December 1, 2011, the following actions were taken for which shareholders of all series of MFS Variable Insurance Trust II voted together as a single class with respect to Item 1 and shareholders of MFS Government Securities Portfolio voted as a separate class with respect to Items 2 and 3:
Item 1: Election of ten Trustees as members of the Board of Trustees of the Trust effective January 1, 2012:
| Number of Shares | ||||||||
| For | Withheld Authority | |||||||
| Robert E. Butler | 681,916,712.8686 | 46,472,894.9218 | ||||||
| Maureen R. Goldfarb | 682,835,794.8512 | 45,553,812.9392 | ||||||
| David H. Gunning | 681,500,267.3085 | 46,889,340.4819 | ||||||
| William R. Gutow | 681,050,223.5547 | 47,339,384.2357 | ||||||
| Michael Hegarty | 682,477,088.8584 | 45,912,518.9320 | ||||||
| John P. Kavanaugh | 683,794,425.4269 | 44,595,182.3635 | ||||||
| Robert J. Manning | 682,699,559.7374 | 45,690,048.0530 | ||||||
| J. Dale Sherratt | 681,362,743.0513 | 47,026,864.7391 | ||||||
| Laurie J. Thomsen | 683,408,094.0000 | 44,981,513.7904 | ||||||
| Robert W. Uek | 681,424,852.0247 | 46,964,755.7657 | ||||||
Item 2: To approve a new investment advisory agreement dated January 1, 2012, between the Trust, on behalf of MFS Government Securities Portfolio, and MFS:
| Number of Shares | ||||||||||||
| For | Against | Withheld Authority | ||||||||||
| 39,745,229.2943 | 835,944.6922 | 5,136,896.7592 | ||||||||||
Item 3: To approve revisions to and restatements of certain fundamental investment restrictions of MFS Government Securities Portfolio effective January 1, 2012 as detailed below:
| Number of Shares | ||||||||||||||
| For | Against | Withheld Authority | ||||||||||||
| A. | Borrowing | 38,092,574.3583 | 2,220,754.6806 | 5,404,741.7068 | ||||||||||
| B. | Underwriting Securities | 38,801,042.6523 | 1,556,512.3028 | 5,360,515.7906 | ||||||||||
| C. | Issuance of Senior Securities | 38,896,387.3544 | 1,328,361.8665 | 5,493,321.5248 | ||||||||||
| D. | Lending of Money or Securities | 38,257,139.3335 | 1,947,401.2580 | 5,513,530.1542 | ||||||||||
| E. | Purchases or Sales of Real Estate; Interests in Oil, Gas or Mineral Leases; and Commodities | 39,321,302.5270 | 1,346,876.8698 | 5,049,891.3489 | ||||||||||
| F. | Industry Concentration | 39,512,762.4227 | 1,172,113.5204 | 5,033,194.8026 | ||||||||||
20
Table of Contents
MFS Government Securities Portfolio
TRUSTEES AND OFFICERS – IDENTIFICATION AND BACKGROUND
The Trustees and officers of the Trust, as of February 1, 2012, are listed below, together with their principal occupations during the past five years. (Their titles may have varied during that period.) The address of each Trustee and officer is 500 Boylston Street, Boston, Massachusetts 02116.
Name, Age | Position(s) with Fund | Trustee/Officer Since (h) | Principal Occupations | Other Directorships (j) | ||||
| INTERESTED TRUSTEES | ||||||||
Robert J. Manning (k) (age 48) | Trustee | February 2004 | Massachusetts Financial Services Company, Chairman, Chief Executive Officer and Director; President (until December 2009); Chief Investment Officer (until July 2010) | N/A | ||||
| INDEPENDENT TRUSTEES | ||||||||
David H. Gunning (age 69) | Trustee and Chair of Trustees | January 2004 | Retired; Cleveland-Cliffs Inc. (mining products and service provider), Vice Chairman/Director (until May 2007) | Lincoln Electric Holdings, Inc. (welding equipment manufacturer), Director; Development Alternatives, Inc. (consulting), Director/Non-Executive Chairman; Portman Limited (mining), Director (until 2008) | ||||
Robert E. Butler (age 70) | Trustee | January 2006 | Consultant – investment company industry regulatory and compliance matters | N/A | ||||
Maureen R. Goldfarb (age 56) | Trustee | January 2009 | Private investor | N/A | ||||
William R. Gutow (age 70) | Trustee | December 1993 | Private investor and real estate consultant; Capitol Entertainment Management Company (video franchise), Vice Chairman | Atlantic Coast Tan (tanning salons), Vice Chairman (until 2007); Texas Donuts (donut franchise), Vice Chairman (until 2010) | ||||
Michael Hegarty (age 67) | Trustee | December 2004 | Private investor | N/A | ||||
John P. Kavanaugh (age 57) | Trustee | January 2009 | Private investor; The Hanover Insurance Group, Inc., Vice President and Chief Investment Officer (until 2006); Allmerica Investment Trust, Allmerica Securities Trust and Opus Investment Trust (investment companies), Chairman, President and Trustee (until 2006) | N/A | ||||
J. Dale Sherratt (age 73) | Trustee | June 1989 | Insight Resources, Inc. (acquisition planning specialists), President; Wellfleet Investments (investor in health care companies), Managing General Partner | N/A | ||||
Laurie J. Thomsen (age 54) | Trustee | March 2005 | Private investor; New Profit, Inc. (venture philanthropy), Executive Partner (until 2010) | The Travelers Companies (property and casualty insurance), Director | ||||
Robert W. Uek (age 70) | Trustee | January 2006 | Consultant to investment company industry | N/A | ||||
| OFFICERS | ||||||||
John M. Corcoran (k) (age 46) | President | October 2008 | Massachusetts Financial Services Company, Senior Vice President (since October 2008); State Street Bank and Trust (financial services provider), Senior Vice President, (until September 2008) | N/A | ||||
| Christopher R. Bohane (k) (age 38) | Assistant Secretary and Assistant Clerk | July 2005 | Massachusetts Financial Services Company, Vice President and Senior Counsel | N/A | ||||
Kino Clark (k) (age 43) | Assistant Treasurer | January 2012 | Massachusetts Financial Services Company, Assistant Vice President | N/A | ||||
21
Table of Contents
MFS Government Securities Portfolio
Trustees and Officers – continued
Name, Age | Position(s) with Fund | Trustee/Officer Since (h) | Principal Occupations | Other Directorships (j) | ||||
Ethan D. Corey (k) (age 48) | Assistant Secretary and Assistant Clerk | July 2005 | Massachusetts Financial Services Company, Senior Vice President and Associate General Counsel | N/A | ||||
David L. DiLorenzo (k) (age 43) | Treasurer | July 2005 | Massachusetts Financial Services Company, Vice President | N/A | ||||
Robyn L. Griffin (age 36) | Assistant Independent Chief Compliance Officer | August 2008 | Griffin Compliance LLC (provider of compliance services), Principal (since August 2008); State Street Corporation (financial services provider), Mutual Fund Administration Assistant Vice President (October 2006 – July 2008); Liberty Mutual Group (insurance), Personal Market Assistant Controller (April 2006 – October 2006); Deloitte & Touche LLP (professional services firm). | N/A | ||||
Brian E. Langenfeld (k) (age 38) | Assistant Secretary and Assistant Clerk | June 2006 | Massachusetts Financial Services Company, Vice President and Senior Counsel | N/A | ||||
Ellen Moynihan (k) (age 54) | Assistant Treasurer | April 1997 | Massachusetts Financial Services Company, Senior Vice President | N/A | ||||
Susan S. Newton (k) (age 61) | Assistant Secretary and Assistant Clerk | May 2005 | Massachusetts Financial Services Company, Senior Vice President and Associate General Counsel | N/A | ||||
Susan A. Pereira (k) (age 41) | Assistant Secretary and Assistant Clerk | July 2005 | Massachusetts Financial Services Company, Vice President and Senior Counsel | N/A | ||||
Mark N. Polebaum (k) (age 59) | Secretary and Clerk | January 2006 | Massachusetts Financial Services Company, Executive Vice President, General Counsel and Secretary | N/A | ||||
Frank L. Tarantino (age 67) | Independent Chief Compliance Officer | June 2004 | Tarantino LLC (provider of compliance services), Principal | N/A | ||||
Richard S. Weitzel (k) (age 41) | Assistant Secretary and Assistant Clerk | October 2007 | Massachusetts Financial Services Company, Vice President and Assistant General Counsel | N/A | ||||
James O. Yost (k) (age 51) | Deputy Treasurer | September 1990 | Massachusetts Financial Services Company, Senior Vice President | N/A | ||||
| (h) | Date first appointed to serve as Trustee/officer of an MFS fund. Each Trustee has served continuously since appointment unless indicated otherwise. For the period from December 15, 2004 until February 22, 2005, Mr. Manning served as Advisory Trustee. For the period October 2008, until January 2012, Mr. Corcoran served as Treasurer of the Funds. Prior to January 2012, Messrs. DiLorenzo and Yost served as Assistant Treasurers of the Funds. |
| (j) | Directorships or trusteeships of companies required to report to the Securities and Exchange Commission (i.e., “public companies”). |
| (k) | “Interested person” of the Trust within the meaning of the Investment Company Act of 1940 (referred to as the 1940 Act), which is the principal federal law governing investment companies like the fund, as a result of position with MFS. The address of MFS is 500 Boylston Street, Boston, Massachusetts 02116. |
Each Trustee has been elected by shareholders and each Trustee and officer holds office until his or her successor is chosen and qualified or until his or her earlier death, resignation, retirement or removal. The Trust does not hold annual meetings for the purpose of electing Trustees, and Trustees are not elected for fixed terms. Messrs. Butler, Kavanaugh, Uek and Ms. Thomsen are members of the Trust’s Audit Committee.
Each of the Fund’s Trustees and officers holds comparable positions with certain other funds of which MFS or a subsidiary is the investment adviser or distributor, and, in the case of the officers, with certain affiliates of MFS. As of January 1, 2012, the Trustees served as board members of 131 funds within the MFS Family of Funds.
22
Table of Contents
MFS Government Securities Portfolio
Trustees and Officers – continued
The Statement of Additional Information for the Fund includes further information about the Trustees and is available without charge upon request by calling 1-800-225-2606.
Investment Adviser Massachusetts Financial Services Company 500 Boylston Street, Boston, MA 02116-3741 | Custodian State Street Bank and Trust 1 Lincoln Street, Boston, MA 02111-2900 | |
Distributor MFS Fund Distributors, Inc. 500 Boylston Street, Boston, MA 02116-3741 | Independent Registered Public Accounting Firm Deloitte & Touche LLP 200 Berkeley Street, Boston, MA 02116 | |
Portfolio Manager Geoffrey Schechter |
23
Table of Contents
MFS Government Securities Portfolio
At a special meeting of shareholders of the MFS Government Securities Portfolio (hereinafter referred to as the “Fund” or the “Portfolio”), which was held on December 1, 2011, the shareholders approved a new investment advisory agreement based on the recommendation of the Board of Trustees. At its July, 2011 meeting, the Board of Trustees (i) approved, and recommended for shareholder approval, the new investment advisory agreement effective January 1, 2012, and (ii) the continuation of the existing investment advisory agreement effective September 1, 2011. The following includes a description of the factors that the Board of Trustees considered and the conclusions that formed the basis of their approval of both the new investment advisory agreement and the continuation of the prior investment advisory agreement.
BOARD APPROVAL OF NEW INVESTMENT ADVISORY AGREEMENT
The Investment Company Act of 1940 requires that both the full Board of Trustees and a majority of the non-interested (“independent”) Trustees, voting separately, initially approve the new investment advisory agreement (the “New Agreement”) between Massachusetts Financial Services Company (“MFS”) and MFS Variable Insurance Trust II (the “Trust”) on behalf of the Portfolio and, beginning on the second anniversary of the initial effective date of the New Agreement, annually approve the continuation of the New Agreement. The Trustees have considered matters bearing on the Portfolio and the then current advisory arrangement at their meetings throughout the year, including a review of performance data at each regular meeting. In addition, the independent Trustees met in person in July 2011 to consider the initial approval of the New Agreement, and to recommend that shareholders approve the New Agreement. The independent Trustees were assisted in their evaluation of the New Agreement by independent legal counsel, from whom they received separate legal advice and with whom they met separately from MFS management. The independent Trustees were also assisted in this process by the Portfolio’s Independent Chief Compliance Officer, a full-time senior officer appointed by and reporting to the independent Trustees.
In connection with their deliberations regarding the initial approval of the New Agreement, the Trustees, including the independent Trustees, considered such information and factors as they believed, in light of the legal advice furnished to them and their own business judgment, to be relevant. The New Agreement was considered separately for the series of the Trust (collectively, the “Portfolios”), although the Trustees also took into account the common interests of all Portfolios in the Trust in their review. As described below, the Trustees considered the nature, quality, and extent of the various investment advisory, administrative, and/or shareholder services to be performed by MFS under the New Agreement and other arrangements with the Trust.
In connection with their initial review meeting, the Trustees received and relied upon materials that included, among other items: (i) information provided by MFS on the advisory fees of comparable portfolios of its other clients, including institutional separate account and other clients, (ii) information as to whether, and to what extent applicable, expense waivers, reimbursements or fee “breakpoints” would be observed for the Portfolio under the New Agreement, and (iii) a comparison and summary of the differences in the provisions in the New Agreement compared to those in each of the then current investment advisory agreements for the Portfolios. In addition, in connection with the independent Trustees’ meetings in May and July, 2011 (the “contract review meetings”) for the purpose of considering whether to approve the continuation of the then current investment advisory agreements for the Portfolio, the independent Trustees received: (1) information provided by Lipper Inc. (“Lipper”) on the investment performance of the Portfolio for various time periods ended December 31, 2010, compared to the investment performance of a group of funds with substantially similar investment classifications/objectives (the “Lipper performance universe”), (2) information provided by Lipper on the Portfolio’s advisory fees and other expenses compared to the advisory fees and other expenses of comparable funds identified by Lipper (the “Lipper expense group”), (3) information regarding MFS’ financial results and financial condition, including MFS’ and certain of its affiliates’ estimated profitability from services performed for the Portfolio, (4) MFS’ views regarding the outlook for the mutual fund industry and its strategic business plans, (5) descriptions of various functions performed by MFS for the Trust, such as compliance monitoring and portfolio trading practices, and (6) information regarding the overall organization of MFS, including information about MFS’ senior management and other personnel providing investment advisory, administrative and other services to the Portfolio. The comparative performance, fee and expense information prepared and provided by Lipper was not independently verified, and the independent Trustees did not independently verify any information provided to them by MFS.
The Trustees’ conclusion as to the initial approval of the New Agreement was based on comprehensive consideration of all information provided to the Trustees and was not the result of any single factor. Some of the factors that figured particularly in the Trustees’ deliberations are described below for the Portfolio, while individual Trustees may have given different weight to various factors and evaluated the information presented as a whole differently than another individual Trustee. The Trustees recognized that the fee arrangements for the Portfolio could reflect years of review and discussion between the independent Trustees and MFS, that certain aspects of such arrangements may receive greater scrutiny in some years than others, and that the Trustees’ conclusions may be based, in part, on their consideration of these same arrangements during the course of the year and in prior years.
24
Table of Contents
MFS Government Securities Portfolio
Board Approval of New Investment Advisory Agreement – continued
Because the portfolio management team managing the Portfolio’s investments under the then current investment advisory agreement will remain the same under the New Agreement for the Portfolio, the Trustees compared the Portfolio’s total return investment performance to the performance of its Lipper performance universe over various time periods, based on information provided by Lipper. The Trustees placed particular emphasis on the total return performance of the Portfolio’s Initial Class shares in comparison to the performance of funds in its Lipper performance universe over the one-, three- and five-year periods ended December 31, 2010. The Trustees did not rely on performance results for more recent periods.
The Trustees noted the performance of the Portfolio’s Initial Class shares was in the 5th quintile relative to the other funds in the Lipper performance universe for the one-year period (the 1st quintile being the best performers and the 5th quintile being the worst performers). The total return performance of the Portfolio was in the 2nd quintile for the three-year period and in the 1st quintile for the five-year period ended December 31, 2010, relative to the Lipper performance universe. Based on the nature and quality of services provided by MFS, the Board of Trustees concluded that the Portfolio’s performance was satisfactory.
In the course of their deliberations, the Trustees took into account information provided by MFS during contract review meetings, as well as during investment review meetings conducted with portfolio management personnel during the course of the year. For Portfolios whose performance lagged their peer groups, they discussed the factors that contributed thereto and MFS’ efforts to improve such Portfolios’ performance. After reviewing this information, the Trustees concluded, within the context of their overall conclusions regarding the New Agreement, that they were satisfied with MFS’ responses and efforts relating to investment performance.
In assessing the reasonableness of the Portfolio’s advisory fee, the Trustees considered, among other information, the Portfolio’s advisory fee and the total expense ratio of the Portfolio’s Initial Class shares as a percentage of average daily net assets, compared to the advisory fee and total expense ratios of its peer group of funds based on information provided by Lipper. The Trustees also considered the advisory fees charged by MFS to institutional accounts. In comparing these fees, the Trustees considered the generally broader scope of services provided by MFS to the Trust than those provided to institutional accounts. The Trustees also considered the higher demands placed on MFS’ investment personnel and trading infrastructure as a result of the daily cash in-flows and out-flows of the Portfolio, and the impact on MFS and related expenses due to the more extensive regulatory regime to which the Portfolio is subject, compared to institutional accounts.
In considering the fees, the Trustees noted from the Lipper data that the Portfolio’s effective advisory fee rate was above the median and total expense ratio was approximately at the median of such fees and expenses of funds in the Lipper expense group. In addition, the Trustees accepted MFS’ offer to implement an expense limitation for the Portfolio upon completion of the acquisition by the Portfolio of the Government Securities Variable Account, subject to approval by the variable account’s contract owners. The Trustees further noted that the New Agreement would reflect MFS’ agreement to reduce the advisory fee on average daily net assets over $1 billion on a permanent basis, and concluded that the breakpoint was sufficient to allow the Portfolio to benefit from economies of scale as its assets grow. The Trustees concluded that the fees were reasonable in light of the nature and quality of services provided.
The Trustees also considered whether the Portfolio is likely to benefit from any economies of scale due to future asset growth. In this regard, the Trustees reviewed the adequacy of breakpoints and discussed with MFS any adjustments necessary for the shareholders’ benefit.
The Trustees also considered information prepared by MFS relating to its costs and profits with respect to the Portfolio and other investment companies and accounts advised by MFS, as well as MFS’ methodologies used to determine and allocate its costs to the Portfolio and other accounts and products for purposes of estimating profitability.
The Trustees noted that there would be no increase to the net advisory fee arrangement for the Portfolio under the New Agreement when compared to the Portfolio’s then current investment advisory agreement. After reviewing these and other factors described below, the Trustees concluded that the advisory fees charged to the Portfolio under the New Agreement represent reasonable compensation in light of the nature and quality of the services being provided by MFS.
In addition, the Trustees considered MFS’ resources and related efforts to continue to retain, attract and motivate capable personnel to serve the Portfolio. The Trustees also considered the financial resources of MFS and its parent, Sun Life Financial Inc. The Trustees further considered any advantages and possible disadvantages of having an adviser which also serves other investment companies as well as institutional accounts.
The Trustees also considered the nature, quality, cost, and extent of administrative, transfer agency, and distribution services provided to the Trust by MFS and its affiliates under agreements and plans other than the New Agreement, including the 12b-1 fees the Portfolio pays to MFS Fund Distributors, Inc., an affiliate of MFS. The Trustees also considered the nature, extent and quality of certain other services MFS performs or arranges on the Portfolio’s behalf, which may include securities lending
25
Table of Contents
MFS Government Securities Portfolio
Board Approval of New Investment Advisory Agreement – continued
programs, directed expense payment programs, class action recovery programs, and MFS’ interaction with third-party service providers, principally custodians and sub-custodians. The Trustees concluded that the various non-advisory services provided by MFS and its affiliates on behalf of the Portfolio were satisfactory. The Trustees also considered the benefits to MFS from the use of the Portfolio’s portfolio brokerage commissions to pay for investment research and various other factors. Additionally, the Trustees considered so-called “fall-out benefits” to MFS such as reputational value derived from serving as investment manager to the Trust, and determined that any such benefits derived by MFS were reasonable and fair.
Based on their evaluation of factors that they deemed to be material, including those factors described above, the Board of Trustees, including a majority of the independent Trustees, concluded that the New Agreement should be approved for an initial two-year period, commencing upon its effective date, as set forth in the New Agreement.
BOARD APPROVAL OF CONTINUATION OF PRIOR INVESTMENT ADVISORY AGREEMENT
The Investment Company Act of 1940 requires that both the full Board of Trustees and a majority of the non-interested (“independent”) Trustees, voting separately, annually approve the continuation of the investment advisory agreement between MFS Variable Insurance Trust II (the “Trust”) and Massachusetts Financial Services Company (“MFS”) on behalf of the Fund. The Trustees consider matters bearing on the Fund and the advisory arrangements at their meetings throughout the year, including a review of performance data at each regular meeting. In addition, the independent Trustees met in person in May and again in July 2011 (“contract review meetings”) for the specific purpose of considering whether to approve the continuation of the investment advisory agreement for the Fund. The independent Trustees were assisted in their evaluation of the investment advisory agreement by independent legal counsel, from whom they received separate legal advice and with whom they met separately from MFS management during various contract review meetings. The independent Trustees were also assisted in this process by the Fund’s Independent Chief Compliance Officer, a full-time senior officer appointed by and reporting to the independent Trustees.
In connection with their deliberations, the Trustees, including the independent Trustees, considered such information and factors as they believed, in light of the legal advice furnished to them and their own business judgment, to be relevant. The investment advisory agreement was considered separately for the Fund, although the Trustees also took into account the common interests of all Funds in the Trust in their review. As described below, the Trustees considered the nature, quality, and extent of the various investment advisory, administrative, and shareholder services performed by MFS under the existing investment advisory agreement and other arrangements with the Trust.
In connection with their contract review meetings, the Trustees received and relied upon materials which included, among other items: (i) information provided by Lipper Inc. (“Lipper”) on the investment performance of the Fund for various time periods ended December 31, 2010, compared to the investment performance of a group of funds with substantially similar investment classifications/objectives (the “Lipper performance universe”), (ii) information provided by Lipper on the Fund’s advisory fees and other expenses compared to the advisory fees and other expenses of comparable funds identified by Lipper (the “Lipper expense group”), (iii) information provided by MFS on the advisory fees of comparable portfolios of its other clients, including institutional separate account and other clients, (iv) information as to whether, and to what extent applicable, expense waivers, reimbursements or fee “breakpoints” are observed for the Fund, (v) information regarding MFS’ financial results and financial condition, including MFS’ and certain of its affiliates’ estimated profitability from services performed for the Fund and other investment companies that the Board oversees as a whole, and for MFS’ institutional business, (vi) MFS’ views regarding the outlook for the mutual fund industry and its strategic business plans, (vii) descriptions of various functions performed by MFS for the Trust, such as compliance monitoring and portfolio trading practices, and (viii) information regarding the overall organization of MFS, including information about MFS’ senior management and other personnel providing investment advisory, administrative and other services to the Fund. The comparative performance, fee and expense information prepared and provided by Lipper was not independently verified, and the independent Trustees did not independently verify any information provided to them by MFS.
The Trustees’ conclusion as to the continuation of the investment advisory agreement was based on comprehensive consideration of all information provided to the Trustees and was not the result of any single factor. Some of the factors that figured particularly in the Trustees’ deliberations are described below for the Fund, while individual Trustees may have given different weight to various factors and evaluated the information presented as a whole differently than another individual Trustee. The Trustees recognized that the fee arrangements for the Fund reflect years of review and discussion between the independent Trustees and MFS, that certain aspects of such arrangements may receive greater scrutiny in some years than others, and that the Trustees’ conclusions may be based, in part, on their consideration of these same arrangements during the course of the year and in prior years.
26
Table of Contents
MFS Government Securities Portfolio
Board Approval of Continuation of Prior Investment Advisory Agreement – continued
Based on information provided by Lipper, the Trustees compared the Fund’s total return investment performance to the performance of the Lipper performance universe over various time periods. The Trustees placed particular emphasis on the total return performance of the Fund’s Initial Class shares in comparison to the performance of funds in its Lipper performance universe over the one-, three- and five-year periods ended December 31, 2010. The Trustees did not rely on performance results for more recent periods, including those shown elsewhere in this report.
The Trustees noted the performance of the Fund’s Initial Class shares was in the 5th quintile relative to the other funds in the Lipper performance universe for the one-year period (the 1st quintile being the best performers and the 5th quintile being the worst performers). The total return performance of the Fund was in the 2nd quintile for the three-year period and the 1st quintile for the five-year period ended December 31, 2010, relative to the Lipper performance universe. Based on the nature and quality of services provided by MFS, the Board of Trustees concluded that the Fund’s performance was satisfactory.
In the course of their deliberations, the Trustees took into account information provided by MFS during contract review meetings, as well as during investment review meetings conducted with portfolio management personnel during the course of the year.
In assessing the reasonableness of the Fund’s advisory fee, the Trustees considered, among other information, the Fund’s advisory fee and the total expense ratio of the Fund’s Initial Class shares as a percentage of average daily net assets, compared to the advisory fee and total expense ratios of its peer group of funds based on information provided by Lipper. The Trustees also considered the advisory fees charged by MFS to institutional accounts. In comparing these fees, the Trustees considered the generally broader scope of services provided by MFS to the Trust than those provided to institutional accounts. The Trustees also considered the higher demands placed on MFS’ investment personnel and trading infrastructure as a result of the daily cash in-flows and out-flows of the Fund, and the impact on MFS and related expenses due to the more extensive regulatory regime to which the Fund is subject, compared to institutional accounts.
In considering the fees, the Trustees noted from the Lipper data (which takes into account any reductions or expense limitations) that the Fund’s effective advisory fee rate was above the median and total expense ratio was approximately at the median of such fees and expenses of funds in the Lipper expense group. The Trustees further concluded that the existing breakpoint was sufficient to allow the Fund to benefit from economies of scale as its assets grow. The Trustees concluded that the fees were reasonable in light of the nature and quality of services provided.
The Trustees also considered information prepared by MFS relating to its costs and profits with respect to the Fund and other investment companies and accounts advised by MFS, as well as MFS’ methodologies used to determine and allocate its costs to the Fund and other accounts and products for purposes of estimating profitability.
After reviewing these and other factors described below, the Trustees concluded that the advisory fees charged to the Fund represent reasonable compensation in light of the nature and quality of the services being provided by MFS.
In addition, the Trustees considered MFS’ resources and related efforts to continue to retain, attract and motivate capable personnel to serve the Fund. The Trustees also considered the financial resources of MFS and its parent, Sun Life Financial Inc. The Trustees further considered any advantages and possible disadvantages of having an adviser which also serves other investment companies as well as institutional accounts.
The Trustees also considered the nature, quality, cost, and extent of administrative, transfer agency, and distribution services provided to the Fund by MFS and its affiliates under agreements and plans other than the investment advisory agreement, including the 12b-1 fees the Fund pays to MFS Fund Distributors, Inc., an affiliate of MFS. The Trustees also considered the nature, extent and quality of certain other services MFS performs or arranges on the Fund’s behalf, which may include securities lending programs, directed expense payment programs, class action recovery programs, and MFS’ interaction with third-party service providers, principally custodians and sub-custodians. The Trustees concluded that the various non-advisory services provided by MFS and its affiliates on behalf of the Fund were satisfactory. The Trustees also considered the benefits to MFS from the use of the Fund’s portfolio brokerage commissions, if applicable, to pay for investment research and various other factors. Additionally, the Trustees considered so-called “fall-out benefits” to MFS such as reputational value derived from serving as investment manager to the Trust, and determined that any such benefits derived by MFS were reasonable and fair.
Based on their evaluation of factors that they deemed to be material, including those factors described above, the Board of Trustees, including a majority of the independent Trustees, concluded that the investment advisory agreement should be continued for an additional one-year period, commencing September 1, 2011.
A discussion regarding the Board’s most recent review and renewal of the fund’s Investment Advisory Agreement with MFS is available by clicking on the fund’s name under “Variable Insurance Portfolios — VIT II” in the “Products and Performance” section of the MFS Web site (mfs.com).
27
Table of Contents
MFS Government Securities Portfolio
PROXY VOTING POLICIES AND INFORMATION
A general description of the MFS funds’ proxy voting policies and procedures is available without charge, upon request, by calling
1-800-225-2606, by visiting the Proxy Voting section of mfs.com or by visiting the SEC’s Web site at http://www.sec.gov.
Information regarding how the fund voted proxies relating to portfolio securities during the most recent twelve-month period ended June 30 is available without charge by visiting the Proxy Voting section of mfs.com or by visiting the SEC’s Web site at http://www.sec.gov.
QUARTERLY PORTFOLIO DISCLOSURE
The fund will file a complete schedule of portfolio holdings with the Securities and Exchange Commission (the Commission) for the first and third quarters of each fiscal year on Form N-Q. The fund’s Form N-Q is available on the EDGAR database on the Commission’s Internet Web site at http://www.sec.gov and may be reviewed and copied at the:
Public Reference Room
Securities and Exchange Commission
100 F Street, NE, Room 1580
Washington, D.C. 20549
Information on the operation of the Public Reference Room may be obtained by calling the Commission at 1-800-SEC-0330. Copies of the fund’s Form N-Q also may be obtained, upon payment of a duplicating fee, by electronic request at the following e-mail address: publicinfo@sec.gov or by writing the Public Reference Section at the above address.
From time to time, MFS may post important information about the fund or the MFS funds on the MFS web site (mfs.com). This information is available by visiting the “News & Commentary” section of mfs.com or by clicking on the fund’s name under “Variable Insurance Portfolios — VIT II” in the “Products and Performance” section of mfs.com.
FEDERAL TAX INFORMATION (unaudited)
The following information is provided pursuant to provisions of the Internal Revenue Code.
The fund designates $252,000 as capital gain dividends paid during the fiscal year.
28
Table of Contents
rev. 3/11

| Why? | Financial companies choose how they share your personal information. Federal law gives consumers the right to limit some but not all sharing. Federal law also requires us to tell you how we collect, share, and protect your personal information. Please read this notice carefully to understand what we do. |
| What? | The types of personal information we collect and share depend on the product or service you have with us. This information can include:
• Social Security number and account balances • Account transactions and transaction history • Checking account information and wire transfer instructions
When you are no longer our customer, we continue to share your information as described in this notice. |
| How? | All financial companies need to share customers’ personal information to run their everyday business. In the section below, we list the reasons financial companies can share their customers’ personal information; the reasons MFS chooses to share; and whether you can limit this sharing. |
| Reasons we can share your personal information | Does MFS share? | Can you limit this sharing? | ||
For our everyday business purposes – such as to process your transactions, maintain your account(s), respond to court orders and legal investigations, or report to credit bureaus | Yes | No | ||
For our marketing purposes – to offer our products and services to you | No | We don’t share | ||
| For joint marketing with other financial companies | No | We don’t share | ||
For our affiliates’ everyday business purposes – information about your transactions and experiences | No | We don’t share | ||
For our affiliates’ everyday business purposes – information about your creditworthiness | No | We don’t share | ||
| For nonaffiliates to market to you | No | We don’t share |
| Questions? | Call 800-225-2606 or go to mfs.com. |
29
Table of Contents
| Page 2 |
| Who we are | ||
| Who is providing this notice? | MFS Funds, MFS Investment Management, MFS Institutional Advisors, Inc., MFS Fund Distributors, Inc., MFS Heritage Trust Company, and MFS Service Center, Inc. | |
| What we do | ||
| How does MFS protect my personal information? | To protect your personal information from unauthorized access and use, we use security measures that comply with federal law. These measures include procedural, electronic, and physical safeguards for the protection of the personal information we collect about you. | |
| How does MFS collect my personal information? | We collect your personal information, for example, when you
• open an account or provide account information • direct us to buy securities or direct us to sell your securities • make a wire transfer
We also collect your personal information from others, such as credit bureaus, affiliates and other companies. | |
| Why can’t I limit all sharing? | Federal law gives you the right to limit only
• sharing for affiliates’ everyday business purposes – information about your creditworthiness • affiliates from using your information to market to you • sharing for nonaffiliates to market to you
State laws and individual companies may give you additional rights to limit sharing. | |
| Definitions | ||
| Affiliates | Companies related by common ownership or control. They can be financial and nonfinancial companies.
• MFS does not share personal information with affiliates, except for everyday business purposes as described on page one of this notice. | |
| Nonaffiliates | Companies not related by common ownership or control. They can be financial and nonfinancial companies.
• MFS does not share with nonaffiliates so they can market to you. | |
| Joint Marketing | A formal agreement between nonaffiliated financial companies that together market financial products or services to you.
• MFS doesn’t jointly market. | |
| Other important information | ||
| If you own an MFS product or receive an MFS service in the name of a third party such as a bank or broker-dealer, their privacy policy may apply to you instead of ours. | ||
30
Table of Contents

Table of Contents

MFS® Total Return Portfolio
MFS® Variable Insurance Trust II

ANNUAL REPORT
December 31, 2011
TRS-ANN
Table of Contents
MFS® TOTAL RETURN PORTFOLIO
The report is prepared for the general information of contract owners.
It is authorized for distribution to prospective investors only when preceded or accompanied by a current prospectus.
NOT FDIC INSURED Ÿ MAY LOSE VALUE Ÿ NO BANK OR CREDIT UNION GUARANTEE Ÿ NOT A DEPOSIT Ÿ NOT INSURED BY ANY FEDERAL GOVERNMENT AGENCY OR NCUA/NCUSIF
Table of Contents
MFS Total Return Portfolio
LETTER FROM THE CHAIRMAN AND CEO

Dear Contract Owners:
We are indeed living through some volatile times. Economic uncertainty is everywhere, as it seems no place in the world has been unmoved by crisis. We have seen a devastating earthquake and tsunami that have led to disruptions in the Japanese markets
and supply chains. Protests have changed the face of the Middle East and left in their wake lingering tensions and resultant higher oil prices. We have seen debt limits tested in Europe and the United States and policymakers grappling to craft often unpopular monetary and fiscal responses at a time when consumers and businesses struggle with what appears to be a slowing global economy. On top of all of that, we have seen long-term U.S. debt lose its Standard & Poor’s AAA rating and the long-term debt ratings of 15 eurozone nations put on negative watch.
When markets become volatile, managing risk becomes a top priority for investors and their advisors. At MFS® risk management is foremost in our minds in all market climates. Our analysts and portfolio managers keep risks firmly in mind when evaluating securities. Additionally, we have a team of quantitative analysts that measures and assesses the risk profiles of our portfolios and securities on an ongoing basis. The chief investment risk officer, who oversees the team, reports directly to the firm’s president and chief investment officer so the risk associated with each portfolio can be assessed objectively and independently of the portfolio management team.
As always, we continue to be mindful of the many economic challenges faced at the local, national, and international levels. It is in times such as these that we want to remind investors of the merits of maintaining a long-term view, adhering to basic investing principles such as asset allocation and diversification, and working closely with their advisors to research and identify appropriate investment opportunities.
Respectfully,

Robert J. Manning
Chairman and Chief Executive Officer
MFS Investment Management®
February 15, 2012
The opinions expressed in this letter are subject to change, may not be relied upon for investment advice, and no forecasts can be guaranteed.
1
Table of Contents
MFS Total Return Portfolio
Portfolio structure (i)
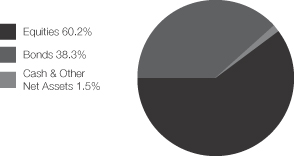
| Top ten holdings (i) | ||||
| U.S. Treasury Notes, 3.125%, 2013 | 2.6% | |||
| Philip Morris International Inc. | 2.2% | |||
| Fannie Mae, 5.5%, 30 Years | 2.0% | |||
| Exxon Mobil Corp. | 1.9% | |||
| JPMorgan Chase & Co. | 1.9% | |||
| Lockheed Martin Corp. | 1.7% | |||
| U.S. Treasury Notes, 4.5%, 2039 | 1.6% | |||
| U.S. Treasury Notes, 3.5%, 2020 | 1.6% | |||
| Johnson & Johnson | 1.5% | |||
| United Technologies Corp. | 1.4% |
| Composition including fixed income credit quality (a)(i) | ||||
| AAA | 1.7% | |||
| AA | 1.3% | |||
| A | 3.2% | |||
| BBB | 5.4% | |||
| BB | 0.3% | |||
| CC | 0.1% | |||
| C | 0.1% | |||
| D (o) | 0.0% | |||
| U.S. Government | 13.3% | |||
| Federal Agencies | 12.9% | |||
| Not Rated (o) | 0.0% | |||
| Non-Fixed Income | 60.2% | |||
| Cash & Other | 1.5% |
| Equity sectors | ||||
| Financial Services | 12.2% | |||
| Health Care | 7.2% | |||
| Energy | 6.9% | |||
| Consumer Staples | 6.8% | |||
| Industrial Goods & Services | 6.6% | |||
| Utilities & Communications | 4.7% | |||
| Technology | 3.8% | |||
| Leisure | 3.5% | |||
| Basic Materials | 2.9% | |||
| Retailing | 2.8% | |||
| Autos & Housing | 1.4% | |||
| Special Products & Services | 0.9% | |||
| Transportation | 0.5% |
| Fixed income sectors (i) | ||||
| U.S. Treasury Securities | 13.3% | |||
| Mortgage-Backed Securities | 12.5% | |||
| High Grade Corporates | 8.7% | |||
| Commercial Mortgage-Backed Securities | 1.7% | |||
| Non-U.S. Government Bonds | 0.8% | |||
| Emerging Markets Bonds | 0.5% | |||
| U.S. Government Agencies | 0.4% | |||
| Collateralized Debt Obligations | 0.2% | |||
| Asset-Backed Securities | 0.2% | |||
| High Yield Corporates (o) | 0.0% | |||
| Residential Mortgage-Backed Securities (o) | 0.0% |
| (a) | For all securities other than those specifically described below, ratings are assigned to underlying securities utilizing ratings from Moody’s, Fitch, and Standard & Poor’s rating agencies and applying the following hierarchy: If all three agencies provide a rating, the middle rating (after dropping the highest and lowest ratings) is assigned; if two of the three agencies rate a security, the lower of the two is assigned. Ratings are shown in the S&P and Fitch scale (e.g., AAA). All ratings are subject to change. U.S. Government includes securities issued by the U.S. Department of the Treasury. Federal Agencies includes rated and unrated U.S. Agency fixed-income securities, U.S. Agency mortgage-backed securities, and collateralized mortgage obligations of U.S. Agency mortgage-backed securities. Not Rated includes fixed income securities which have not been rated by any rating agency. Non-Fixed Income includes equity securities (including convertible bonds and equity derivatives) and commodities. Cash & Other includes cash, other assets less liabilities, offsets to derivative positions, and short-term securities. The fund may not hold all of these instruments. The fund is not rated by these agencies. |
2
Table of Contents
MFS Total Return Portfolio
Portfolio Composition – continued
| (i) | For purposes of this presentation, the components include the market value of securities, and reflect the impact of the equivalent exposure of derivative positions. These amounts may be negative from time to time. The bond component will include any accrued interest amounts. Equivalent exposure is a calculated amount that translates the derivative position into a reasonable approximation of the amount of the underlying asset that the portfolio would have to hold at a given point in time to have the same price sensitivity that results from the portfolio’s ownership of the derivative contract. When dealing with derivatives, equivalent exposure is a more representative measure of the potential impact of a position on portfolio performance than market value. Where the fund holds convertible bonds, these are treated as part of the equity portion of the portfolio. |
| (o) | Less than 0.1%. |
Percentages are based on net assets as of 12/31/11.
The portfolio is actively managed and current holdings may be different.
3
Table of Contents
MFS Total Return Portfolio
Summary of Results
For the twelve months ended December 31, 2011, Initial Class shares of the MFS Total Return Portfolio (the “fund”) provided a total return of 1.93%, while Service Class shares of the fund provided a total return of 1.66%. These compare with returns of 2.11% and 7.84% for the fund’s benchmarks, the Standard & Poor’s 500 Stock Index (“S&P 500 Index”) and the Barclays Capital U.S. Aggregate Bond Index, respectively. The fund’s other benchmark, the MFS Total Return Blended Index (“Blended Index”), generated a return of 4.69%. The Blended Index reflects the blended returns of the equity and fixed income market indices, with percentage allocations to each index designed to resemble the equity and fixed income allocations of the fund. The market indices and related percentage allocations used to compile the Blended Index are set forth in the Performance Summary.
Market Environment
Early in the period, the U.S. Federal Reserve (the “Fed”) responded to weak economic growth by loosening monetary policy further. More easing by the Fed improved market sentiment and drove risk-asset prices markedly higher. The December 2010 agreement on a surprisingly large (relative to expectations) expansionary U.S. fiscal package also boosted sentiment. During the subsequent several months, the renewed positive market sentiment, coupled with better indications of global macroeconomic activity, pushed many asset valuations to post-crisis highs. At the same time, the yields of the perceived “safest” global sovereign credits rose, indicating a renewed risk-seeking environment.
However, towards the middle of the period, a weakening macroeconomic backdrop and renewed concerns over peripheral euro zone sovereign debt caused a flight-to-quality move that pushed high-quality sovereign bond yields lower. In the U.S., concerns about the long-term sustainability of the trend in U.S. fiscal policy resulted in one agency downgrading U.S. credit quality. Amidst this turmoil, global equity markets declined sharply. As a result of these developments, global consumer and producer sentiment indicators fell precipitously and highly-rated sovereign bond yields hit multi-decade lows. Towards the end of the reporting period, uncertainty in financial markets spiked higher as investors more seriously contemplated the possible failure of the euro zone.
Detractors from Performance
Within the equity portion of the fund, an overweight position and stock selection in the financial services sector held back performance relative to the S&P 500 Index. The fund’s holdings of financial services firms, Goldman Sachs, Bank of New York Mellon, MetLife, JPMorgan Chase, and Bank of America, weakened relative performance as all five stocks underperformed the benchmark. Financial firms faced downward pressure during the period amidst a weakening economic environment and increased concerns regarding the European sovereign debt crisis.
Stock selection in the retailing, health care, and energy sectors also negatively impacted relative performance. There were no individual stocks within either the retailing or health care sectors that were among the fund’s top relative detractors for the reporting period. Within the energy sector, holdings of oil and gas exploration and production company Apache and offshore drilling contractor Transocean (b) hindered relative performance.
Elsewhere, holdings of toy maker Hasbro and global automaker General Motors (b), and not holding shares of strong-performing computer and personal electronics maker Apple, weighed on relative results.
Within the fixed income portion of the fund, a greater exposure to “BBB” rated (r) securities detracted from performance relative to the Barclays Capital U.S. Aggregate Bond Index as this credit quality sector underperformed higher-rated securities over the reporting period.
The fund’s greater exposure to the financial sector also hurt relative returns. Bonds within this sector underperformed over the reporting period as Europe’s mounting sovereign debt crisis put downward pressure on the shares of most financial companies.
Contributors to Performance
Within the equity portion of the portfolio, stock selection in the industrial goods & services sector benefited performance relative to the S&P 500 Index. The fund’s overweight allocation to defense contractor Lockheed Martin aided relative results as the stock outperformed the benchmark.
A combination of an overweight position and stock selection in the consumer staples sector was another positive factor for relative performance. The fund’s holdings of tobacco company Philip Morris International and alcoholic beverage producer Diageo (b) (United Kingdom) were among the top relative contributors as both stocks turned in strong performance over the reporting period. Shares of Philip Morris rose as the company reported strong earnings results near the end of the reporting period in addition to its solid return of capital to shareholders via both dividends and share repurchases. Diageo’s stock appreciated significantly in the second half of 2011 after management reported a 5% increase in full-year operating profit and forecasted a medium-term goal of 6% organic revenue growth.
4
Table of Contents
MFS Total Return Portfolio
Management Review – continued
Elsewhere, the fund’s holdings of pharmaceutical and medical products maker Abbott Laboratories and voice and data communications services company Vodafone Group (b) (United Kingdom) boosted relative performance. Not holding poor-performing financial services firm Citigroup, global automaker Ford Motor, precious metals company Freeport-McMoRan, and global investment banking firm Morgan Stanley positively impacted relative performance. The timing of the fund’s ownership in shares of global consulting and outsourcing company Accenture also supported relative results.
Within the fixed income portion of the fund, bond selection within the financial, agency, and municipal sectors were positive factors for performance relative to the Barclays Capital U.S. Aggregate Bond Index.
Respectfully,
| Nevin Chitkara | William Douglas | Steven Gorham | Richard Hawkins | |||||||
| Portfolio Manager | Portfolio Manager | Portfolio Manager | Portfolio Manager | |||||||
| Joshua Marson | Brooks Taylor | |||||||||
| Portfolio Manager | Portfolio Manager | |||||||||
Notes to Contract Owners: Michael Roberge is no longer a co-manager of the fund.
| (b) | Security is not a benchmark constituent. |
| (h) | Security was not held in the fund at period end. |
| (r) | Bonds rated “BBB”, “Baa”, or higher are considered investment grade; bonds rated “BB”, “Ba”, or below are considered non-investment grade. The source for bond quality ratings is Moody’s Investors Service, Standard & Poor’s and Fitch, Inc. and are applied using the following hierarchy: If all three agencies provide a rating, the middle rating (after dropping the highest and lowest ratings) is assigned; if two of the three agencies rate a security, the lower of the two is assigned. Ratings are shown in the S&P and Fitch scale (e.g., AAA). For securities which are not rated by any of the three agencies, the security is considered Not Rated. |
The views expressed in this report are those of the portfolio managers only through the end of the period of the report as stated on the cover and do not necessarily reflect the views of MFS or any other person in the MFS organization. These views are subject to change at any time based on market or other conditions, and MFS disclaims any responsibility to update such views. These views may not be relied upon as investment advice or an indication of trading intent on behalf of any MFS portfolio. References to specific securities are not recommendations of such securities, and may not be representative of any MFS portfolio’s current or future investments.
5
Table of Contents
MFS Total Return Portfolio
PERFORMANCE SUMMARY THROUGH 12/31/11
The following chart illustrates the historical performance of the fund in comparison to its benchmark(s). Benchmarks are unmanaged and may not be invested in directly. Benchmark returns do not reflect any fees or expenses. The performance of other share classes will be greater than or less than that of the class depicted below. (See Notes to Performance Summary.)
Performance data shown represents past performance and is no guarantee of future results. Investment return and principal value fluctuate so your units, when sold, may be worth more or less than the original cost; current performance may be lower or higher than quoted. The performance shown does not reflect the deduction of taxes, if any, that a contract holder would pay on fund distributions or the redemption of contract units. The returns for the fund shown also do not reflect the deduction of expenses associated with variable products, such as mortality and expense risk charges, separate account charges, and sales charges imposed by the insurance company separate accounts. Such expenses would reduce the overall returns shown.
Growth of a Hypothetical $10,000 Investment
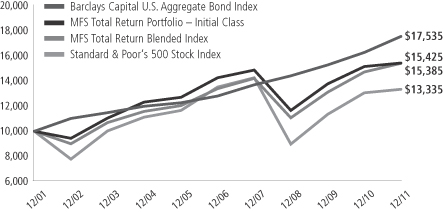
Total Returns through 12/31/11
Average annual total returns
| Share class | Class inception date | 1-yr | 5-yr | 10-yr | ||||||||
| Initial Class | 5/11/88 | 1.93% | 1.61% | 4.43% | ||||||||
| Service Class | 8/24/01 | 1.66% | 1.36% | 4.17% | ||||||||
| Comparative benchmarks | ||||||||||||
| Standard & Poor’s 500 Stock Index (f) | 2.11% | (0.25)% | 2.92% | |||||||||
| Barclays Capital U.S. Aggregate Bond Index (f) | 7.84% | 6.50% | 5.78% | |||||||||
| MFS Total Return Blended Index (f)(x) | 4.69% | 2.84% | 4.40% | |||||||||
| (f) | Source: FactSet Research Systems Inc. |
| (x) | MFS Total Return Blended Index consists of 60% Standard & Poor’s 500 Stock Index and 40% Barclays Capital U.S. Aggregate Bond Index. |
Benchmark Definitions
Barclays Capital U.S. Aggregate Bond Index – a market capitalization-weighted index that measures the performance of the U.S. investment-grade, fixed rate bond market, with index components for government and corporate securities, mortgage pass-through securities, and asset-backed securities with at least one year to final maturity.
Standard & Poor’s 500 Stock Index – a market capitalization-weighted index of 500 widely held equity securities, designed to measure broad U.S. equity performance.
It is not possible to invest directly in an index.
Notes to Performance Summary
Average annual total return represents the average annual change in value for each share class for the periods presented.
Performance results reflect any applicable expense subsidies and waivers in effect during the periods shown. Without such subsidies and waivers the fund’s performance results would be less favorable. Please see the prospectus and financial statements for complete details. All results are historical and assume the reinvestment of any dividends and capital gains distributions.
6
Table of Contents
MFS Total Return Portfolio
Performance Summary – continued
Performance results do not include adjustments made for financial reporting purposes in accordance with U.S. generally accepted accounting principles and may differ from amounts reported in the financial highlights.
From time to time the fund may receive proceeds from litigation settlements, without which performance would be lower.
7
Table of Contents
MFS Total Return Portfolio
Fund Expenses Borne by the Contract Holders During the Period,
July 1, 2011 through December 31, 2011
As a contract holder of the fund, you incur ongoing costs, including management fees; distribution and/or service (12b-1) fees; and other fund expenses. This example is intended to help you understand your ongoing costs (in dollars) of investing in the fund and to compare these costs with the ongoing costs of investing in other mutual funds.
The example is based on an investment of $1,000 invested at the beginning of the period and held for the entire period July 1, 2011 through December 31, 2011.
Actual Expenses
The first line for each share class in the following table provides information about actual account values and actual expenses. You may use the information in this line, together with the amount you invested, to estimate the expenses that you paid over the period. Simply divide your account value by $1,000 (for example, an $8,600 account value divided by $1,000 = 8.6), then multiply the result by the number in the first line under the heading entitled “Expenses Paid During Period” to estimate the expenses you paid on your account during this period.
Hypothetical Example for Comparison Purposes
The second line for each share class in the following table provides information about hypothetical account values and hypothetical expenses based on the fund’s actual expense ratio and an assumed rate of return of 5% per year before expenses, which is not the fund’s actual return. The hypothetical account values and expenses may not be used to estimate the actual ending account balance or expenses you paid for the period. You may use this information to compare the ongoing costs of investing in the fund and other funds. To do so, compare this 5% hypothetical example with the 5% hypothetical examples that appear in the shareholder reports of the other funds.
Please note that the expenses shown in the table are meant to highlight the fund’s ongoing costs only and do not take into account the fees and expenses imposed under the variable contracts through which your investment in the fund is made. Therefore, the second line for each share class in the table is useful in comparing ongoing costs associated with an investment in vehicles (such as the fund) which fund benefits under variable annuity and variable life insurance contracts and to qualified pension and retirement plans only, and will not help you determine the relative total costs of investing in the fund through variable annuity and variable life insurance contracts. If the fees and expenses imposed under the variable contracts were included, your costs would have been higher.
| Share Class | Annualized Expense Ratio | Beginning Account Value 7/01/11 | Ending Account Value 12/31/11 | Expenses Paid During Period (p) 7/01/11-12/31/11 | ||||||||||||||
| Initial Class | Actual | 0.74% | $1,000.00 | $977.30 | $3.69 | |||||||||||||
| Hypothetical (h) | 0.74% | $1,000.00 | $1,021.48 | $3.77 | ||||||||||||||
| Service Class | Actual | 0.99% | $1,000.00 | $976.01 | $4.93 | |||||||||||||
| Hypothetical (h) | 0.99% | $1,000.00 | $1,020.21 | $5.04 | ||||||||||||||
| (h) | 5% class return per year before expenses. |
| (p) | Expenses paid is equal to each class’ annualized expense ratio, as shown above, multiplied by the average account value over the period, multiplied by the number of days in the period, divided by the number of days in the year. |
8
Table of Contents
MFS Total Return Portfolio
PORTFOLIO OF INVESTMENTS – 12/31/11
The Portfolio of Investments is a complete list of all securities owned by your fund. It is categorized by broad-based asset classes.
| Issuer | Shares/Par | Value ($) | ||||||
| COMMON STOCKS – 60.0% | ||||||||
| Aerospace – 4.5% | ||||||||
| Honeywell International, Inc. | 197,290 | $ | 10,722,713 | |||||
| Huntington Ingalls Industries, Inc. (a) | 13,948 | 436,293 | ||||||
| Lockheed Martin Corp. | 283,780 | 22,957,802 | ||||||
| Northrop Grumman Corp. | 81,960 | 4,793,021 | ||||||
| Precision Castparts Corp. | 14,750 | 2,430,653 | ||||||
| United Technologies Corp. | 245,180 | 17,920,206 | ||||||
|
| |||||||
| $ | 59,260,688 | |||||||
|
| |||||||
| Alcoholic Beverages – 0.8% | ||||||||
| Diageo PLC | 503,399 | $ | 10,995,717 | |||||
|
| |||||||
| Automotive – 0.6% | ||||||||
| General Motors Co. (a) | 71,760 | $ | 1,454,575 | |||||
| Johnson Controls, Inc. | 203,330 | 6,356,096 | ||||||
|
| |||||||
| $ | 7,810,671 | |||||||
|
| |||||||
| Broadcasting – 2.2% | ||||||||
| Omnicom Group, Inc. | 178,450 | $ | 7,955,301 | |||||
| Viacom, Inc., “B” | 228,960 | 10,397,074 | ||||||
| Walt Disney Co. | 298,080 | 11,178,000 | ||||||
|
| |||||||
| $ | 29,530,375 | |||||||
|
| |||||||
| Brokerage & Asset Managers – 0.9% | ||||||||
| Blackrock, Inc. | 40,457 | $ | 7,211,056 | |||||
| Franklin Resources, Inc. | 49,530 | 4,757,852 | ||||||
|
| |||||||
| $ | 11,968,908 | |||||||
|
| |||||||
| Business Services – 0.9% | ||||||||
| Accenture PLC, “A” | 150,110 | $ | 7,990,355 | |||||
| Dun & Bradstreet Corp. | 30,410 | 2,275,580 | ||||||
| Fiserv, Inc. (a) | 20,580 | 1,208,869 | ||||||
|
| |||||||
| $ | 11,474,804 | |||||||
|
| |||||||
| Cable TV – 0.6% | ||||||||
| Comcast Corp., “Special A” | 332,980 | $ | 7,845,009 | |||||
|
| |||||||
| Chemicals – 2.1% | ||||||||
| 3M Co. | 148,430 | $ | 12,131,184 | |||||
| Celanese Corp. | 76,620 | 3,391,967 | ||||||
| E.I. du Pont de Nemours & Co. | 69,990 | 3,204,142 | ||||||
| PPG Industries, Inc. | 110,500 | 9,225,645 | ||||||
|
| |||||||
| $ | 27,952,938 | |||||||
|
| |||||||
| Computer Software – 1.4% | ||||||||
| Check Point Software Technologies Ltd. (a) | 46,950 | $ | 2,466,753 | |||||
| Microsoft Corp. | 79,750 | 2,070,310 | ||||||
| Oracle Corp. | 556,540 | 14,275,251 | ||||||
|
| |||||||
| $ | 18,812,314 | |||||||
|
| |||||||
| Computer Software – Systems – 1.2% | ||||||||
| Hewlett-Packard Co. | 109,850 | $ | 2,829,736 | |||||
| International Business Machines Corp. | 70,880 | 13,033,414 | ||||||
|
| |||||||
| $ | 15,863,150 | |||||||
|
| |||||||
| Issuer | Shares/Par | Value ($) | ||||||
| COMMON STOCKS – continued | ||||||||
| Construction – 0.7% | ||||||||
| Sherwin-Williams Co. | 37,440 | $ | 3,342,269 | |||||
| Stanley Black & Decker, Inc. | 79,707 | 5,388,193 | ||||||
|
| |||||||
| $ | 8,730,462 | |||||||
|
| |||||||
| Consumer Products – 0.8% | ||||||||
| Procter & Gamble Co. | 128,704 | $ | 8,585,844 | |||||
| Reckitt Benckiser Group PLC | 40,447 | 1,993,161 | ||||||
|
| |||||||
| $ | 10,579,005 | |||||||
|
| |||||||
| Electrical Equipment – 1.5% | ||||||||
| Danaher Corp. | 288,550 | $ | 13,573,392 | |||||
| Tyco International Ltd. | 124,090 | 5,796,244 | ||||||
|
| |||||||
| $ | 19,369,636 | |||||||
|
| |||||||
| Electronics – 0.7% | ||||||||
| ASML Holding N.V. | 75,097 | $ | 3,138,304 | |||||
| Intel Corp. | 162,120 | 3,931,410 | ||||||
| Microchip Technology, Inc. | 62,420 | 2,286,445 | ||||||
|
| |||||||
| $ | 9,356,159 | |||||||
|
| |||||||
| Energy – Independent – 2.9% | ||||||||
| Anadarko Petroleum Corp. | 41,380 | $ | 3,158,535 | |||||
| Apache Corp. | 152,790 | 13,839,718 | ||||||
| EOG Resources, Inc. | 22,660 | 2,232,237 | ||||||
| EQT Corp. | 47,930 | 2,626,085 | ||||||
| Noble Energy, Inc. | 50,910 | 4,805,395 | ||||||
| Occidental Petroleum Corp. | 131,810 | 12,350,597 | ||||||
|
| |||||||
| $ | 39,012,567 | |||||||
|
| |||||||
| Energy – Integrated – 3.5% | ||||||||
| Chevron Corp. | 156,832 | $ | 16,686,925 | |||||
| Exxon Mobil Corp. | 290,418 | 24,615,830 | ||||||
| Hess Corp. | 77,790 | 4,418,472 | ||||||
|
| |||||||
| $ | 45,721,227 | |||||||
|
| |||||||
| Engineering – Construction – 0.2% | ||||||||
| Fluor Corp. | 63,790 | $ | 3,205,448 | |||||
|
| |||||||
| Food & Beverages – 2.6% | ||||||||
| General Mills, Inc. | 168,540 | $ | 6,810,701 | |||||
| Groupe Danone | 48,012 | 3,018,118 | ||||||
| J.M. Smucker Co. | 5,281 | 412,816 | ||||||
| Kellogg Co. | 40,790 | 2,062,750 | ||||||
| Nestle S.A. | 202,734 | 11,639,529 | ||||||
| PepsiCo, Inc. | 163,730 | 10,863,486 | ||||||
|
| |||||||
| $ | 34,807,400 | |||||||
|
| |||||||
| Food & Drug Stores – 1.0% | ||||||||
| CVS Caremark Corp. | 186,166 | $ | 7,591,849 | |||||
| Kroger Co. | 93,900 | 2,274,258 | ||||||
| Walgreen Co. | 113,760 | 3,760,906 | ||||||
|
| |||||||
| $ | 13,627,013 | |||||||
|
| |||||||
9
Table of Contents
MFS Total Return Portfolio
Portfolio of Investments – continued
| Issuer | Shares/Par | Value ($) | ||||||
| COMMON STOCKS – continued | ||||||||
| General Merchandise – 1.2% | ||||||||
| Kohl’s Corp. | 111,610 | $ | 5,507,954 | |||||
| Target Corp. | 213,050 | 10,912,421 | ||||||
|
| |||||||
| $ | 16,420,375 | |||||||
|
| |||||||
| Health Maintenance Organizations – 0.1% | ||||||||
| Aetna, Inc. | 47,420 | $ | 2,000,650 | |||||
|
| |||||||
| Insurance – 4.0% | ||||||||
| ACE Ltd. | 144,220 | $ | 10,112,706 | |||||
| Aon Corp. | 162,860 | 7,621,848 | ||||||
| Chubb Corp. | 47,250 | 3,270,645 | ||||||
| MetLife, Inc. | 393,560 | 12,271,201 | ||||||
| Prudential Financial, Inc. | 211,310 | 10,590,857 | ||||||
| Travelers Cos., Inc. | 159,710 | 9,450,041 | ||||||
|
| |||||||
| $ | 53,317,298 | |||||||
|
| |||||||
| Leisure & Toys – 0.5% | ||||||||
| Hasbro, Inc. | 195,450 | $ | 6,232,901 | |||||
|
| |||||||
| Machinery & Tools – 0.4% | ||||||||
| Eaton Corp. | 112,950 | $ | 4,916,714 | |||||
|
| |||||||
| Major Banks – 6.3% | ||||||||
| Bank of America Corp. | 1,048,730 | $ | 5,830,939 | |||||
| Bank of New York Mellon Corp. | 613,369 | 12,212,177 | ||||||
| Goldman Sachs Group, Inc. | 145,190 | 13,129,532 | ||||||
| JPMorgan Chase & Co. | 738,824 | 24,565,898 | ||||||
| PNC Financial Services Group, Inc. | 93,650 | 5,400,796 | ||||||
| State Street Corp. | 188,710 | 7,606,900 | ||||||
| SunTrust Banks, Inc. | 49,070 | 868,539 | ||||||
| Wells Fargo & Co. | 501,660 | 13,825,750 | ||||||
|
| |||||||
| $ | 83,440,531 | |||||||
|
| |||||||
| Medical & Health Technology & Services – 0.4% | ||||||||
| AmerisourceBergen Corp. | 61,960 | $ | 2,304,292 | |||||
| Quest Diagnostics, Inc. | 41,630 | 2,417,038 | ||||||
|
| |||||||
| $ | 4,721,330 | |||||||
|
| |||||||
| Medical Equipment – 2.3% | ||||||||
| Becton, Dickinson & Co. | 83,800 | $ | 6,261,536 | |||||
| Covidien PLC | 75,460 | 3,396,455 | ||||||
| Medtronic, Inc. | 224,690 | 8,594,393 | ||||||
| St. Jude Medical, Inc. | 151,860 | 5,208,798 | ||||||
| Thermo Fisher Scientific, Inc. (a) | 155,890 | 7,010,373 | ||||||
|
| |||||||
| $ | 30,471,555 | |||||||
|
| |||||||
| Metals & Mining – 0.1% | ||||||||
| Cliffs Natural Resources, Inc. | 21,760 | $ | 1,356,736 | |||||
|
| |||||||
| Natural Gas – Pipeline – 0.5% | ||||||||
| Kinder Morgan, Inc. | 42,060 | $ | 1,353,070 | |||||
| Williams Cos., Inc. (a) | 142,550 | 3,850,276 | ||||||
| WPX Energy, Inc. (a) | 47,516 | 863,366 | ||||||
|
| |||||||
| $ | 6,066,712 | |||||||
|
| |||||||
| Network & Telecom – 0.5% | ||||||||
| Cisco Systems, Inc. | 344,630 | $ | 6,230,910 | |||||
|
| |||||||
| Issuer | Shares/Par | Value ($) | ||||||
| COMMON STOCKS – continued | ||||||||
| Oil Services – 0.5% | ||||||||
| Schlumberger Ltd. | 25,880 | $ | 1,767,863 | |||||
| Transocean, Inc. | 113,010 | 4,338,454 | ||||||
|
| |||||||
| $ | 6,106,317 | |||||||
|
| |||||||
| Other Banks & Diversified Financials – 1.0% | ||||||||
| MasterCard, Inc., “A” | 6,700 | $ | 2,497,894 | |||||
| TCF Financial Corp. | 110,980 | 1,145,314 | ||||||
| Visa, Inc., “A” | 44,440 | 4,511,993 | ||||||
| Western Union Co. | 185,590 | 3,388,873 | ||||||
| Zions Bancorporation | 98,130 | 1,597,556 | ||||||
|
| |||||||
| $ | 13,141,630 | |||||||
|
| |||||||
| Pharmaceuticals – 4.4% | ||||||||
| Abbott Laboratories | 257,200 | $ | 14,462,356 | |||||
| Bayer AG | 27,923 | 1,785,284 | ||||||
| Johnson & Johnson | 296,380 | 19,436,600 | ||||||
| Merck & Co., Inc. | 70,660 | 2,663,882 | ||||||
| Pfizer, Inc. | 807,078 | 17,465,168 | ||||||
| Roche Holding AG | 13,191 | 2,230,830 | ||||||
|
| |||||||
| $ | 58,044,120 | |||||||
|
| |||||||
| Printing & Publishing – 0.1% | ||||||||
| Moody’s Corp. | 53,160 | $ | 1,790,429 | |||||
|
| |||||||
| Railroad & Shipping – 0.3% | ||||||||
| Canadian National Railway Co. | 30,320 | $ | 2,381,939 | |||||
| Union Pacific Corp. | 15,650 | 1,657,961 | ||||||
|
| |||||||
| $ | 4,039,900 | |||||||
|
| |||||||
| Restaurants – 0.1% | ||||||||
| McDonald’s Corp. | 19,990 | $ | 2,005,597 | |||||
|
| |||||||
| Specialty Chemicals – 0.7% | ||||||||
| Air Products & Chemicals, Inc. | 99,330 | $ | 8,461,923 | |||||
| Airgas, Inc. | 13,740 | 1,072,819 | ||||||
|
| |||||||
| $ | 9,534,742 | |||||||
|
| |||||||
| Specialty Stores – 0.6% | ||||||||
| Advance Auto Parts, Inc. | 57,700 | $ | 4,017,651 | |||||
| Staples, Inc. | 265,690 | 3,690,434 | ||||||
|
| |||||||
| $ | 7,708,085 | |||||||
|
| |||||||
| Telecommunications – Wireless – 0.8% | ||||||||
| Vodafone Group PLC | 3,929,157 | $ | 10,916,444 | |||||
|
| |||||||
| Telephone Services – 1.5% | ||||||||
| AT&T, Inc. | 577,660 | $ | 17,468,438 | |||||
| CenturyLink, Inc. | 61,168 | 2,275,450 | ||||||
|
| |||||||
| $ | 19,743,888 | |||||||
|
| |||||||
| Tobacco – 2.6% | ||||||||
| Altria Group, Inc. | 108,010 | $ | 3,202,497 | |||||
| Philip Morris International, Inc. | 372,020 | 29,196,130 | ||||||
| Reynolds American, Inc. | 39,420 | 1,632,776 | ||||||
|
| |||||||
| $ | 34,031,403 | |||||||
|
| |||||||
| Trucking – 0.2% | ||||||||
| United Parcel Service, Inc., “B” | 43,740 | $ | 3,201,331 | |||||
|
| |||||||
10
Table of Contents
MFS Total Return Portfolio
Portfolio of Investments – continued
| Issuer | Shares/Par | Value ($) | ||||||
| COMMON STOCKS – continued | ||||||||
| Utilities – Electric Power – 1.8% | ||||||||
| American Electric Power Co., Inc. | 83,120 | $ | 3,433,687 | |||||
| Exelon Corp. | 47,330 | 2,052,702 | ||||||
| NRG Energy, Inc. (a) | 102,200 | 1,851,864 | ||||||
| PG&E Corp. | 129,190 | 5,325,212 | ||||||
| PPL Corp. | 184,340 | 5,423,283 | ||||||
| Public Service Enterprise Group, Inc. | 167,410 | 5,526,204 | ||||||
|
| |||||||
| $ | 23,612,952 | |||||||
|
| |||||||
| Total Common Stocks (Identified Cost, $777,472,776) | $ | 794,976,041 | ||||||
|
| |||||||
| BONDS – 38.0% | ||||||||
| Agency – Other – 0.1% | ||||||||
| Financing Corp., 9.65%, 2018 | $ | 535,000 | $ | 798,718 | ||||
|
| |||||||
| Asset-Backed & Securitized – 2.0% | ||||||||
| Anthracite Ltd., “A”, CDO, FRN, 0.743%, 2017 (n) | $ | 1,397,814 | $ | 1,299,967 | ||||
| Bayview Financial Revolving Mortgage Loan Trust, FRN, 1.893%, 2040 (z) | 1,458,827 | 831,228 | ||||||
| BlackRock Capital Finance LP, 7.75%, 2026 (n) | 174,892 | 19,238 | ||||||
| Capital Trust Realty Ltd., CDO, 5.16%, 2035 (n) | 1,093,424 | 1,084,677 | ||||||
| Citigroup Commercial Mortgage Trust, FRN, 5.697%, 2017 | 3,050,000 | 3,362,634 | ||||||
| Citigroup/Deutsche Bank Commercial Mortgage Trust, 5.322%, 2049 | 137,638 | 145,986 | ||||||
| Credit Suisse Mortgage Capital Certificate, FRN, 5.695%, 2017 | 2,034,095 | 2,122,247 | ||||||
| GMAC Mortgage Corp. Loan Trust, FRN, 5.805%, 2036 | 886,806 | 576,716 | ||||||
| JPMorgan Chase Commercial Mortgage Securities Corp., 4.78%, 2042 | 1,772,000 | 1,834,164 | ||||||
| JPMorgan Chase Commercial Mortgage Securities Corp., 5.552%, 2045 | 1,131,871 | 1,242,356 | ||||||
| JPMorgan Chase Commercial Mortgage Securities Corp., FRN, 5.215%, 2041 | 2,024,903 | 2,166,055 | ||||||
| JPMorgan Chase Commercial Mortgage Securities Corp., FRN, 5.475%, 2043 | 1,839,069 | 2,023,059 | ||||||
| JPMorgan Chase Commercial Mortgage Securities Corp., FRN, 5.816%, 2049 | 777,548 | 826,321 | ||||||
| JPMorgan Chase Commercial Mortgage Securities Corp., FRN, 5.986%, 2051 | 2,664,573 | 2,834,964 | ||||||
| Merrill Lynch Mortgage Trust, FRN, “A3”, 5.833%, 2050 | 28,792 | 30,006 | ||||||
| Merrill Lynch/Countrywide Commercial Mortgage Trust, FRN, 5.742%, 2050 | 2,034,095 | 2,151,308 | ||||||
| Morgan Stanley Capital I, Inc., FRN, 0.983%, 2030 (i)(n) | 7,179,264 | 193,151 | ||||||
| Residential Asset Mortgage Products, Inc., FRN, 4.97%, 2034 | 460,434 | 459,087 | ||||||
| Residential Funding Mortgage Securities, Inc., FRN, 5.32%, 2035 | 1,534,000 | 877,034 | ||||||
| Issuer | Shares/Par | Value ($) | ||||||
| BONDS – continued | ||||||||
| Asset-Backed & Securitized – continued | ||||||||
| Spirit Master Funding LLC, 5.05%, 2023 (z) | $ | 1,348,240 | $ | 1,243,347 | ||||
| Wachovia Bank Commercial Mortgage Trust, “A4”, FRN, 5.898%, 2017 | 1,545,000 | 1,672,821 | ||||||
|
| |||||||
| $ | 26,996,366 | |||||||
|
| |||||||
| Automotive – 0.1% | ||||||||
| Toyota Motor Credit Corp., 3.2%, 2015 | $ | 770,000 | $ | 809,898 | ||||
| Toyota Motor Credit Corp., 3.4%, 2021 | 1,120,000 | 1,154,275 | ||||||
|
| |||||||
| $ | 1,964,173 | |||||||
|
| |||||||
| Broadcasting – 0.1% | ||||||||
| News America, Inc., 8.5%, 2025 | $ | 1,253,000 | $ | 1,538,273 | ||||
|
| |||||||
| Cable TV – 0.4% | ||||||||
| Cox Communications, Inc., 4.625%, 2013 | $ | 1,282,000 | $ | 1,351,438 | ||||
| DIRECTV Holdings LLC, 4.6%, 2021 | 1,610,000 | 1,673,996 | ||||||
| Time Warner Entertainment Co. LP, 8.375%, 2033 | 1,940,000 | 2,542,799 | ||||||
|
| |||||||
| $ | 5,568,233 | |||||||
|
| |||||||
| Conglomerates – 0.2% | ||||||||
| Kennametal, Inc., 7.2%, 2012 | $ | 1,991,000 | $ | 2,044,556 | ||||
|
| |||||||
| Defense Electronics – 0.1% | ||||||||
| BAE Systems Holdings, Inc., 5.2%, 2015 (n) | $ | 862,000 | $ | 926,831 | ||||
|
| |||||||
| Emerging Market Quasi-Sovereign – 0.2% | ||||||||
| Corporacion Nacional del Cobre de Chile, 3.75%, 2020 (n) | $ | 342,000 | $ | 347,317 | ||||
| Petrobras International Finance Co., 6.75%, 2041 | 340,000 | 390,705 | ||||||
| Petroleos Mexicanos, 8%, 2019 | 918,000 | 1,145,205 | ||||||
| Ras Laffan Liquefied Natural Gas Co. Ltd., 5.832%, 2016 (n) | 876,654 | 938,020 | ||||||
|
| |||||||
| $ | 2,821,247 | |||||||
|
| |||||||
| Emerging Market Sovereign – 0.2% | ||||||||
| Republic of Peru, 7.35%, 2025 | $ | 103,000 | $ | 136,475 | ||||
| Russian Federation, 3.625%, 2015 (z) | 2,700,000 | 2,713,500 | ||||||
|
| |||||||
| $ | 2,849,975 | |||||||
|
| |||||||
| Energy – Independent – 0.1% | ||||||||
| Anadarko Petroleum Corp., 6.45%, 2036 | $ | 1,630,000 | $ | 1,858,365 | ||||
|
| |||||||
| Energy – Integrated – 0.5% | ||||||||
| BP Capital Markets PLC, 4.5%, 2020 | $ | 371,000 | $ | 408,609 | ||||
| BP Capital Markets PLC, 4.742%, 2021 | 1,061,000 | 1,201,746 | ||||||
| Hess Corp., 8.125%, 2019 | 350,000 | 449,282 | ||||||
| Husky Energy, Inc., 5.9%, 2014 | 944,000 | 1,026,005 | ||||||
| Husky Energy, Inc., 7.25%, 2019 | 959,000 | 1,173,544 | ||||||
| Petro-Canada, 6.05%, 2018 | 1,942,000 | 2,286,064 | ||||||
|
| |||||||
| $ | 6,545,250 | |||||||
|
| |||||||
| Financial Institutions – 0.0% | ||||||||
| General Electric Capital Corp., 5.45%, 2013 | $ | 179,000 | $ | 187,281 | ||||
|
| |||||||
11
Table of Contents
MFS Total Return Portfolio
Portfolio of Investments – continued
| Issuer | Shares/Par | Value ($) | ||||||
| BONDS – continued | ||||||||
| Food & Beverages – 0.3% | ||||||||
| Anheuser-Busch InBev Worldwide, Inc., 8%, 2039 | $ | 1,270,000 | $ | 1,967,917 | ||||
| Miller Brewing Co., 5.5%, 2013 (n) | 1,601,000 | 1,706,664 | ||||||
|
| |||||||
| $ | 3,674,581 | |||||||
|
| |||||||
| Food & Drug Stores – 0.1% | ||||||||
| CVS Caremark Corp., 6.125%, 2016 | $ | 1,250,000 | $ | 1,455,865 | ||||
|
| |||||||
| Gaming & Lodging – 0.1% | ||||||||
| Wyndham Worldwide Corp., 6%, 2016 | $ | 1,246,000 | $ | 1,343,686 | ||||
|
| |||||||
| Insurance – 0.2% | ||||||||
| MetLife, Inc., 4.75%, 2021 | $ | 370,000 | $ | 400,263 | ||||
| Metropolitan Life Global Funding I, 5.125%, 2013 (n) | 690,000 | 720,797 | ||||||
| Metropolitan Life Global Funding I, 5.125%, 2014 (n) | 680,000 | 732,175 | ||||||
| Prudential Financial, Inc., 6.625%, 2040 | 530,000 | 585,490 | ||||||
|
| |||||||
| $ | 2,438,725 | |||||||
|
| |||||||
| Insurance – Property & Casualty – 0.2% | ||||||||
| Chubb Corp., 6.375% to 2017, FRN to 2067 | $ | 1,910,000 | $ | 1,886,125 | ||||
| ZFS Finance USA Trust IV, 5.875% to 2012, FRN to 2032 (n) | 146,000 | 137,240 | ||||||
| ZFS Finance USA Trust V, 6.5% to 2017, FRN to 2037 (n) | 524,000 | 471,600 | ||||||
|
| |||||||
| $ | 2,494,965 | |||||||
|
| |||||||
| International Market Quasi-Sovereign – 0.7% | ||||||||
| Achmea Hypotheekbank N.V., 3.2%, 2014 (n) | $ | 663,000 | $ | 695,783 | ||||
| ING Bank N.V., 3.9%, 2014 (n) | 1,560,000 | 1,645,820 | ||||||
| Irish Life & Permanent PLC, 3.6%, 2013 (e)(n) | 1,900,000 | 1,661,694 | ||||||
| KFW International Finance, Inc., 4.875%, 2019 | 1,580,000 | 1,877,767 | ||||||
| Royal Bank of Scotland Group PLC, 2.625%, 2012 (n) | 2,810,000 | 2,828,189 | ||||||
| Societe Financement de l’ Economie Francaise, 3.375%, 2014 (n) | 900,000 | 921,035 | ||||||
|
| |||||||
| $ | 9,630,288 | |||||||
|
| |||||||
| Local Authorities – 0.1% | ||||||||
| New Jersey Turnpike Authority Rev. (Build America Bonds), “F”, 7.414%, 2040 | $ | 1,280,000 | $ | 1,835,494 | ||||
|
| |||||||
| Machinery & Tools – 0.2% | ||||||||
| Atlas Copco AB, 5.6%, 2017 (n) | $ | 1,850,000 | $ | 2,093,495 | ||||
|
| |||||||
| Major Banks – 1.6% | ||||||||
| ABN Amro Bank N.V., FRN, 2.198%, 2014 (n) | $ | 2,370,000 | $ | 2,311,527 | ||||
| Bank of America Corp., 7.375%, 2014 | 590,000 | 611,740 | ||||||
| Bank of America Corp., 5.49%, 2019 | 829,000 | 714,524 | ||||||
| Bank of America Corp., 7.625%, 2019 | 840,000 | 868,742 | ||||||
| Issuer | Shares/Par | Value ($) | ||||||
| BONDS – continued | ||||||||
| Major Banks – continued | ||||||||
| BNP Paribas, 7.195% to 2037, FRN to 2049 (n) | $ | 800,000 | $ | 558,000 | ||||
| Commonwealth Bank of Australia, 5%, 2019 (n) | 840,000 | 890,853 | ||||||
| Credit Suisse New York, 5.5%, 2014 | 1,720,000 | 1,787,802 | ||||||
| Goldman Sachs Group, Inc., 5.625%, 2017 | 1,547,000 | 1,516,976 | ||||||
| HSBC USA, Inc., 4.875%, 2020 | 860,000 | 798,025 | ||||||
| JPMorgan Chase & Co., 6.3%, 2019 | 1,410,000 | 1,597,017 | ||||||
| JPMorgan Chase Capital XXII, 6.45%, 2037 | 679,000 | 679,000 | ||||||
| JPMorgan Chase Capital XXVII, 7%, 2039 | 179,000 | 180,119 | ||||||
| Merrill Lynch & Co., Inc., 6.15%, 2013 | 1,320,000 | 1,332,367 | ||||||
| Morgan Stanley, 6.625%, 2018 | 1,790,000 | 1,767,523 | ||||||
| PNC Funding Corp., 5.625%, 2017 | 1,270,000 | 1,382,871 | ||||||
| Royal Bank of Scotland PLC, 6.125%, 2021 | 1,500,000 | 1,479,794 | ||||||
| UniCredito Luxembourg Finance S.A., 6%, 2017 (n) | 1,710,000 | 1,286,869 | ||||||
| Wachovia Corp., 5.25%, 2014 | 868,000 | 915,543 | ||||||
|
| |||||||
| $ | 20,679,292 | |||||||
|
| |||||||
| Medical & Health Technology & Services – 0.2% | ||||||||
| CareFusion Corp., 6.375%, 2019 | $ | 1,400,000 | $ | 1,653,189 | ||||
| Hospira, Inc., 6.05%, 2017 | 1,164,000 | 1,285,063 | ||||||
|
| |||||||
| $ | 2,938,252 | |||||||
|
| |||||||
| Metals & Mining – 0.2% | ||||||||
| ArcelorMittal, 9.85%, 2019 | $ | 691,000 | $ | 768,541 | ||||
| ArcelorMittal, 5.25%, 2020 | 790,000 | 717,369 | ||||||
| Vale Overseas Ltd., 4.625%, 2020 | 337,000 | 348,493 | ||||||
| Vale Overseas Ltd., 6.875%, 2039 | 257,000 | 294,368 | ||||||
|
| |||||||
| $ | 2,128,771 | |||||||
|
| |||||||
| Mortgage-Backed – 12.5% | ||||||||
| Fannie Mae, 4.01%, 2013 | $ | 190,238 | $ | 196,090 | ||||
| Fannie Mae, 4.563%, 2014 | 888,275 | 940,895 | ||||||
| Fannie Mae, 4.63%, 2014 | 476,989 | 504,122 | ||||||
| Fannie Mae, 4.842%, 2014 | 783,100 | 831,743 | ||||||
| Fannie Mae, 4.88%, 2014 | 295,458 | 316,697 | ||||||
| Fannie Mae, 4.56%, 2015 | 326,026 | 350,554 | ||||||
| Fannie Mae, 4.7%, 2015 | 626,374 | 675,260 | ||||||
| Fannie Mae, 4.78%, 2015 | 451,220 | 490,758 | ||||||
| Fannie Mae, 4.856%, 2015 | 297,192 | 322,810 | ||||||
| Fannie Mae, 4.893%, 2015 | 55,125 | 60,305 | ||||||
| Fannie Mae, 4.997%, 2015 | 130,780 | 142,814 | ||||||
| Fannie Mae, 5.1%, 2015 | 480,000 | 509,267 | ||||||
| Fannie Mae, 5.09%, 2016 | 500,000 | 554,858 | ||||||
| Fannie Mae, 5.27%, 2016 | 538,251 | 595,998 | ||||||
| Fannie Mae, 5.5%, 2016 - 2040 | 25,996,396 | 28,395,065 | ||||||
| Fannie Mae, 5.662%, 2016 | 419,909 | 473,452 | ||||||
| Fannie Mae, 5.725%, 2016 | 307,490 | 340,253 | ||||||
| Fannie Mae, 4.989%, 2017 | 78,281 | 84,240 | ||||||
12
Table of Contents
MFS Total Return Portfolio
Portfolio of Investments – continued
| Issuer | Shares/Par | Value ($) | ||||||
| BONDS – continued | ||||||||
| Mortgage-Backed – continued | ||||||||
| Fannie Mae, 5.05%, 2017 | $ | 486,366 | $ | 540,294 | ||||
| Fannie Mae, 6%, 2017 - 2037 | 17,007,608 | 18,882,436 | ||||||
| Fannie Mae, 2.578%, 2018 | 843,000 | 854,731 | ||||||
| Fannie Mae, 3.849%, 2018 | 200,334 | 217,729 | ||||||
| Fannie Mae, 4.5%, 2018 - 2041 | 5,242,818 | 5,606,942 | ||||||
| Fannie Mae, 5%, 2018 - 2041 | 15,703,157 | 16,982,447 | ||||||
| Fannie Mae, 5.37%, 2018 | 600,000 | 678,432 | ||||||
| Fannie Mae, 4.6%, 2019 | 186,000 | 209,343 | ||||||
| Fannie Mae, 7.5%, 2030 - 2031 | 174,991 | 209,257 | ||||||
| Fannie Mae, 6.5%, 2031 - 2037 | 4,669,879 | 5,281,860 | ||||||
| Freddie Mac, 6%, 2016 - 2037 | 6,769,286 | 7,497,353 | ||||||
| Freddie Mac, 3.882%, 2017 | 406,817 | 444,446 | ||||||
| Freddie Mac, 5%, 2017 - 2039 | 11,432,784 | 12,335,564 | ||||||
| Freddie Mac, 2.412%, 2018 (n) | 594,000 | 603,003 | ||||||
| Freddie Mac, 3.154%, 2018 | 156,000 | 164,282 | ||||||
| Freddie Mac, 4.5%, 2018 - 2035 | 5,657,333 | 6,023,804 | ||||||
| Freddie Mac, 5.085%, 2019 | 1,523,000 | 1,748,313 | ||||||
| Freddie Mac, 5.5%, 2019 - 2037 | 8,126,884 | 8,866,198 | ||||||
| Freddie Mac, 3.808%, 2020 | 1,303,000 | 1,414,194 | ||||||
| Freddie Mac, 4%, 2024 | 2,146,636 | 2,253,573 | ||||||
| Freddie Mac, 6.5%, 2034 - 2038 | 2,849,974 | 3,213,786 | ||||||
| Freddie Mac, 4%, 2040 - 2041 | 7,952,293 | 8,352,593 | ||||||
| Ginnie Mae, 4.5%, 2033 - 2041 | 7,128,399 | 7,828,531 | ||||||
| Ginnie Mae, 5%, 2033 - 2039 | 6,518,636 | 7,232,020 | ||||||
| Ginnie Mae, 5.5%, 2033 - 2035 | 3,225,366 | 3,640,861 | ||||||
| Ginnie Mae, 6%, 2033 - 2038 | 3,264,359 | 3,715,245 | ||||||
| Ginnie Mae, 4%, 2041 | 4,082,291 | 4,374,303 | ||||||
|
| |||||||
| $ | 164,956,721 | |||||||
|
| |||||||
| Natural Gas – Pipeline – 0.3% | ||||||||
| Enterprise Products Operating LLC, 6.5%, 2019 | $ | 1,042,000 | $ | 1,213,393 | ||||
| Kinder Morgan Energy Partners LP, 7.4%, 2031 | 804,000 | 960,694 | ||||||
| Kinder Morgan Energy Partners LP, 7.75%, 2032 | 661,000 | 819,122 | ||||||
| Spectra Energy Capital LLC, 8%, 2019 | 1,040,000 | 1,308,753 | ||||||
|
| |||||||
| $ | 4,301,962 | |||||||
|
| |||||||
| Network & Telecom – 0.2% | ||||||||
| BellSouth Corp., 6.55%, 2034 | $ | 1,472,000 | $ | 1,752,226 | ||||
| Telecom Italia Capital, 5.25%, 2013 | 812,000 | 779,994 | ||||||
|
| |||||||
| $ | 2,532,220 | |||||||
|
| |||||||
| Other Banks & Diversified Financials – 0.9% | ||||||||
| American Express Co., 5.5%, 2016 | $ | 1,034,000 | $ | 1,139,671 | ||||
| Banco Bradesco S.A., 6.75%, 2019 (n) | 681,000 | 745,695 | ||||||
| Banco Santander U.S. Debt S.A.U., 3.781%, 2015 (n) | 700,000 | 634,375 | ||||||
| Capital One Financial Corp., 6.15%, 2016 | 1,670,000 | 1,737,688 | ||||||
| Groupe BPCE S.A., 12.5% to 2019, FRN to 2049 (n) | 1,612,000 | 1,455,120 | ||||||
| HSBC Holdings PLC, 5.1%, 2021 | 842,000 | 894,703 | ||||||
| Nordea Bank AB, 4.875%, 2021 (z) | 820,000 | 838,138 | ||||||
| Issuer | Shares/Par | Value ($) | ||||||
| BONDS – continued | ||||||||
| Other Banks & Diversified Financials – continued | ||||||||
| Nordea Bank AB, 5.424% to 2015, FRN to 2049 (n) | $ | 699,000 | $ | 630,498 | ||||
| Svenska Handelsbanken AB, 4.875%, 2014 (n) | 2,120,000 | 2,205,883 | ||||||
| UBS Preferred Funding Trust V, 6.243% to 2016, FRN to 2049 | 2,620,000 | 2,217,175 | ||||||
|
| |||||||
| $ | 12,498,946 | |||||||
|
| |||||||
| Pharmaceuticals – 0.3% | ||||||||
| Roche Holdings, Inc., 6%, 2019 (n) | $ | 1,578,000 | $ | 1,917,922 | ||||
| Teva Pharmaceutical Finance IV LLC, 3.65%, 2021 | 1,610,000 | 1,637,587 | ||||||
|
| |||||||
| $ | 3,555,509 | |||||||
|
| |||||||
| Real Estate – 0.5% | ||||||||
| Boston Properties, Inc., REIT, 5%, 2015 | $ | 411,000 | $ | 445,101 | ||||
| HCP, Inc., REIT, 5.375%, 2021 | 919,000 | 963,466 | ||||||
| HRPT Properties Trust, REIT, 6.25%, 2016 | 2,725,000 | 2,889,168 | ||||||
| Simon Property Group, Inc., REIT, 5.875%, 2017 | 1,131,000 | 1,291,778 | ||||||
| WEA Finance LLC, REIT, 6.75%, 2019 (n) | 457,000 | 509,713 | ||||||
| WEA Finance LLC, REIT, 4.625%, 2021 (n) | 1,240,000 | 1,217,053 | ||||||
|
| |||||||
| $ | 7,316,279 | |||||||
|
| |||||||
| Retailers – 0.3% | ||||||||
| Home Depot, Inc., 5.95%, 2041 | $ | 346,000 | $ | 446,406 | ||||
| Limited Brands, Inc., 5.25%, 2014 | 440,000 | 457,600 | ||||||
| Wal-Mart Stores, Inc., 5.25%, 2035 | 2,435,000 | 2,912,720 | ||||||
|
| |||||||
| $ | 3,816,726 | |||||||
|
| |||||||
| Specialty Chemicals – 0.0% | ||||||||
| Ecolab, Inc., 5.5%, 2041 | $ | 210,000 | $ | 232,710 | ||||
|
| |||||||
| Supranational – 0.1% | ||||||||
| Asian Development Bank, 2.75%, 2014 | $ | 1,120,000 | $ | 1,176,501 | ||||
|
| |||||||
| Telecommunications – Wireless – 0.3% | ||||||||
| Crown Castle Towers LLC, 6.113%, 2020 (n) | $ | 888,000 | $ | 979,765 | ||||
| Crown Castle Towers LLC, 4.883%, 2020 (n) | 440,000 | 449,695 | ||||||
| Rogers Communications, Inc., 6.8%, 2018 | 1,686,000 | 2,053,791 | ||||||
|
| |||||||
| $ | 3,483,251 | |||||||
|
| |||||||
| Transportation – Services – 0.1% | ||||||||
| Erac USA Finance Co., 7%, 2037 (n) | $ | 1,423,000 | $ | 1,711,974 | ||||
|
| |||||||
| U.S. Government Agencies and Equivalents – 0.4% | ||||||||
| Aid-Egypt, 4.45%, 2015 | $ | 152,000 | $ | 170,045 | ||||
| Small Business Administration, 4.35%, 2023 | 21,790 | 23,514 | ||||||
| Small Business Administration, 4.77%, 2024 | 569,222 | 621,816 | ||||||
13
Table of Contents
MFS Total Return Portfolio
Portfolio of Investments – continued
| Issuer | Shares/Par | Value ($) | ||||||
| BONDS – continued | ||||||||
| U.S. Government Agencies and Equivalents – continued | ||||||||
| Small Business Administration, 5.18%, 2024 | $ | 962,184 | $ | 1,060,834 | ||||
| Small Business Administration, 5.52%, 2024 | 125,584 | 139,795 | ||||||
| Small Business Administration, 4.99%, 2024 | 859,288 | 943,886 | ||||||
| Small Business Administration, 4.95%, 2025 | 56,093 | 61,717 | ||||||
| Small Business Administration, 5.11%, 2025 | 1,715,592 | 1,895,324 | ||||||
|
| |||||||
| $ | 4,916,931 | |||||||
|
| |||||||
| U.S. Treasury Obligations – 13.2% | ||||||||
| U.S. Treasury Bonds, 2%, 2013 | $ | 2,545,000 | $ | 2,629,005 | ||||
| U.S. Treasury Bonds, 8.5%, 2020 | 2,604,000 | 4,005,074 | ||||||
| U.S. Treasury Bonds, 8%, 2021 | 357,000 | 557,980 | ||||||
| U.S. Treasury Bonds, 6%, 2026 | 776,000 | 1,118,410 | ||||||
| U.S. Treasury Bonds, 6.75%, 2026 | 440,000 | 679,456 | ||||||
| U.S. Treasury Bonds, 5.25%, 2029 | 2,985,000 | 4,123,963 | ||||||
| U.S. Treasury Bonds, 5.375%, 2031 | 79,000 | 112,600 | ||||||
| U.S. Treasury Bonds, 4.5%, 2036 | 94,000 | 123,008 | ||||||
| U.S. Treasury Bonds, 5%, 2037 | 8,070,000 | 11,354,740 | ||||||
| U.S. Treasury Bonds, 4.5%, 2039 | 15,844,200 | 20,956,426 | ||||||
| U.S. Treasury Notes, 4.625%, 2012 | 1,800,000 | 1,847,110 | ||||||
| U.S. Treasury Notes, 1.375%, 2013 | 733,000 | 742,105 | ||||||
| U.S. Treasury Notes, 3.875%, 2013 | 281,000 | 292,569 | ||||||
| U.S. Treasury Notes, 1.375%, 2013 | 7,941,000 | 8,054,223 | ||||||
| U.S. Treasury Notes, 3.5%, 2013 | 420,000 | 439,359 | ||||||
| U.S. Treasury Notes, 3.125%, 2013 | 32,695,000 | 34,325,925 | ||||||
| U.S. Treasury Notes, 2.75%, 2013 | 1,218,000 | 1,273,143 | ||||||
| U.S. Treasury Notes, 1.5%, 2013 | 280,000 | 286,956 | ||||||
| U.S. Treasury Notes, 1.875%, 2014 | 15,111,000 | 15,658,774 | ||||||
| U.S. Treasury Notes, 4.75%, 2014 | 150,000 | 165,680 | ||||||
| U.S. Treasury Notes, 4.125%, 2015 | 4,512,000 | 5,061,548 | ||||||
| U.S. Treasury Notes, 2.125%, 2015 | 15,410,000 | 16,268,383 | ||||||
| U.S. Treasury Notes, 2.625%, 2016 | 936,000 | 1,011,758 | ||||||
| U.S. Treasury Notes, 5.125%, 2016 | 488,000 | 580,682 | ||||||
| U.S. Treasury Notes, 4.75%, 2017 | 1,507,000 | 1,814,521 | ||||||
| U.S. Treasury Notes, 3.75%, 2018 | 1,633,000 | 1,899,765 | ||||||
| U.S. Treasury Notes, 2.75%, 2019 | 405,500 | 444,117 | ||||||
| Issuer | Shares/Par | Value ($) | ||||||
| BONDS – continued | ||||||||
| U.S. Treasury Obligations – continued | ||||||||
| U.S. Treasury Notes, 3.125%, 2019 | $ | 11,695,000 | $ | 13,113,019 | ||||
| U.S. Treasury Notes, 3.5%, 2020 | 18,049,000 | 20,763,407 | ||||||
| U.S. Treasury Notes, TIPS, 0.5%, 2014 | 4,732,000 | 4,753,441 | ||||||
|
| |||||||
| $ | 174,457,147 | |||||||
|
| |||||||
| Utilities – Electric Power – 1.0% | ||||||||
| Bruce Mansfield Unit, 6.85%, 2034 | $ | 2,705,462 | $ | 2,940,037 | ||||
| EDP Finance B.V., 6%, 2018 (n) | 1,139,000 | 958,107 | ||||||
| Enel Finance International S.A., 6.25%, 2017 (n) | 1,183,000 | 1,129,058 | ||||||
| MidAmerican Funding LLC, 6.927%, 2029 | 2,816,000 | 3,505,326 | ||||||
| Oncor Electric Delivery Co., 7%, 2022 | 1,658,000 | 2,123,862 | ||||||
| PSEG Power LLC, 5.32%, 2016 | 1,014,000 | 1,130,991 | ||||||
| System Energy Resources, Inc., 5.129%, 2014 (z) | 341,993 | 349,120 | ||||||
| Waterford 3 Funding Corp., 8.09%, 2017 | 1,555,352 | 1,536,034 | ||||||
|
| |||||||
| $ | 13,672,535 | |||||||
|
| |||||||
| Total Bonds (Identified Cost, $469,903,456) | $ | 503,442,094 | ||||||
|
| |||||||
| CONVERTIBLE PREFERRED STOCKS – 0.2% | ||||||||
| Automotive – 0.1% | ||||||||
| General Motors Co., 4.75% | 46,800 | $ | 1,602,900 | |||||
|
| |||||||
| Utilities – Electric Power – 0.1% | ||||||||
| PPL Corp., 9.5% | 13,880 | $ | 774,920 | |||||
|
| |||||||
| Total Convertible Preferred Stocks (Identified Cost, $3,034,000) | $ | 2,377,820 | ||||||
|
| |||||||
| MONEY MARKET FUNDS – 1.4% | ||||||||
| MFS Institutional Money Market Portfolio, 0.05%, at Cost and Net Asset Value (v) | 17,677,046 | $ | 17,677,046 | |||||
|
| |||||||
| Total Investments (Identified Cost, $1,268,087,278) | $ | 1,318,473,001 | ||||||
|
| |||||||
| OTHER ASSETS, LESS LIABILITIES – 0.4% | 5,912,375 | |||||||
|
| |||||||
| Net Assets – 100.0% | $ | 1,324,385,376 | ||||||
|
| |||||||
| (a) | Non-income producing security. |
| (e) | Guaranteed by Minister for Finance of Ireland. |
| (i) | Interest only security for which the fund receives interest on notional principal (Par amount). Par amount shown is the notional principal and does not reflect the cost of the security. |
| (n) | Securities exempt from registration under Rule 144A of the Securities Act of 1933. These securities may be sold in the ordinary course of business in transactions exempt from registration, normally to qualified institutional buyers. At period end, the aggregate value of these securities was $38,618,803, representing 2.9% of net assets. |
| (v) | Underlying affiliated fund that is available only to investment companies managed by MFS. The rate quoted for the MFS Institutional Money Market Portfolio is the annualized seven-day yield of the fund at period end. |
14
Table of Contents
MFS Total Return Portfolio
Portfolio of Investments – continued
| (z) | Restricted securities are not registered under the Securities Act of 1933 and are subject to legal restrictions on resale. These securities generally may be resold in transactions exempt from registration or to the public if the securities are subsequently registered. Disposal of these securities may involve time-consuming negotiations and prompt sale at an acceptable price may be difficult. The fund holds the following restricted securities: |
| Restricted Securities | Acquisition Date | Cost | Value | |||||||
| Bayview Financial Revolving Mortgage Loan Trust, FRN, 1.893%, 2040 | 3/01/06 | $1,458,827 | $831,228 | |||||||
| Nordea Bank AB, 4.875%, 2021 | 1/11/11 | 816,388 | 838,138 | |||||||
| Russian Federation, 3.625%, 2015 | 4/22/10 | 2,690,294 | 2,713,500 | |||||||
| Spirit Master Funding LLC, 5.05%, 2023 | 10/04/05 | 1,336,238 | 1,243,347 | |||||||
| System Energy Resources, Inc., 5.129%, 2014 | 4/16/04 | 341,993 | 349,120 | |||||||
| Total Restricted Securities | $5,975,333 | |||||||||
| % of Net Assets | 0.5% | |||||||||
The following abbreviations are used in this report and are defined:
| CDO | Collateralized Debt Obligation |
| FRN | Floating Rate Note. Interest rate resets periodically and may not be the rate reported at period end. |
| PLC | Public Limited Company |
| REIT | Real Estate Investment Trust |
| TIPS | Treasury Inflation Protected Security |
See Notes to Financial Statements
15
Table of Contents
MFS Total Return Portfolio
FINANCIAL STATEMENTS | STATEMENT OF ASSETS AND LIABILITIES
This statement represents your fund’s balance sheet, which details the assets and liabilities comprising the total value of the fund.
At 12/31/11 | ||||||||
Assets | ||||||||
Investments – | ||||||||
Non-affiliated issuers, at value (identified cost, $1,250,410,232) | $1,300,795,955 | |||||||
Underlying affiliated funds, at cost and value | 17,677,046 | |||||||
Total investments, at value (identified cost, $1,268,087,278) | $1,318,473,001 | |||||||
Cash | 1,449,819 | |||||||
Receivables for | ||||||||
Investments sold | 124,355 | |||||||
Fund shares sold | 65,591 | |||||||
Interest and dividends | 5,634,170 | |||||||
Other assets | 35,319 | |||||||
Total assets | $1,325,782,255 | |||||||
Liabilities | ||||||||
Payables for | ||||||||
Investments purchased | $82,855 | |||||||
Fund shares reacquired | 1,096,087 | |||||||
Payable to affiliates | ||||||||
Investment adviser | 82,536 | |||||||
Distribution and/or service fees | 15,019 | |||||||
Payable for Trustees’ compensation | 2,400 | |||||||
Accrued expenses and other liabilities | 117,982 | |||||||
Total liabilities | $1,396,879 | |||||||
Net assets | $1,324,385,376 | |||||||
Net assets consist of | ||||||||
Paid-in capital | $1,329,345,894 | |||||||
Unrealized appreciation (depreciation) on investments and translation of assets and liabilities in foreign currencies | 50,378,388 | |||||||
Accumulated net realized gain (loss) on investments and foreign currency transactions | (86,907,659 | ) | ||||||
Undistributed net investment income | 31,568,753 | |||||||
Net assets | $1,324,385,376 | |||||||
Shares of beneficial interest outstanding | 80,113,231 |
| Net assets | Shares outstanding | Net asset value per share | ||||||||||
Initial Class | $593,602,252 | 35,714,994 | $16.62 | |||||||||
Service Class | 730,783,124 | 44,398,237 | 16.46 | |||||||||
See Notes to Financial Statements
16
Table of Contents
MFS Total Return Portfolio
FINANCIAL STATEMENTS | STATEMENT OF OPERATIONS
This statement describes how much your fund earned in investment income and accrued in expenses. It also describes any gains and/or losses generated by fund operations.
Year ended 12/31/11 | ||||||||
Net investment income | ||||||||
Income | ||||||||
Interest | $21,554,940 | |||||||
Dividends | 20,196,414 | |||||||
Dividends from underlying affiliated funds | 14,686 | |||||||
Foreign taxes withheld | (119,907 | ) | ||||||
Total investment income | $41,646,133 | |||||||
Expenses | ||||||||
Management fee | $9,238,591 | |||||||
Distribution and/or service fees | 1,962,148 | |||||||
Administrative services fee | 442,669 | |||||||
Trustees’ compensation | 160,229 | |||||||
Custodian fee | 155,323 | |||||||
Shareholder communications | 27,489 | |||||||
Auditing fees | 57,561 | |||||||
Legal fees | 5,678 | |||||||
Miscellaneous | 87,043 | |||||||
Total expenses | $12,136,731 | |||||||
Fees paid indirectly | (39 | ) | ||||||
Reduction of expenses by investment adviser | (270,253 | ) | ||||||
Net expenses | $11,866,439 | |||||||
Net investment income | $29,779,694 | |||||||
Realized and unrealized gain (loss) on investments and foreign currency transactions | ||||||||
Realized gain (loss) (identified cost basis) | ||||||||
Investment transactions | $45,153,392 | |||||||
Foreign currency transactions | 6,452 | |||||||
Net realized gain (loss) on investments and foreign currency transactions | $45,159,844 | |||||||
Change in unrealized appreciation (depreciation) | ||||||||
Investments | $(49,885,249 | ) | ||||||
Translation of assets and liabilities in foreign currencies | (16,299 | ) | ||||||
Net unrealized gain (loss) on investments and foreign currency translation | $(49,901,548 | ) | ||||||
Net realized and unrealized gain (loss) on investments and foreign currency | $(4,741,704 | ) | ||||||
Change in net assets from operations | $25,037,990 |
See Notes to Financial Statements
17
Table of Contents
MFS Total Return Portfolio
FINANCIAL STATEMENTS | STATEMENTS OF CHANGES IN NET ASSETS
These statements describe the increases and/or decreases in net assets resulting from operations, any distributions, and any shareholder transactions.
Years ended 12/31 | 2011 | 2010 | ||||||
Change in net assets | ||||||||
From operations | ||||||||
Net investment income | $29,779,694 | $31,504,299 | ||||||
Net realized gain (loss) on investments and foreign currency transactions | 45,159,844 | 56,484,401 | ||||||
Net unrealized gain (loss) on investments and foreign currency translation | (49,901,548 | ) | 44,058,427 | |||||
Change in net assets from operations | $25,037,990 | $132,047,127 | ||||||
Distributions declared to shareholders | ||||||||
From net investment income | $(33,161,222 | ) | $(37,470,337 | ) | ||||
Change in net assets from fund share transactions | $(72,331,661 | ) | $(149,042,604 | ) | ||||
Total change in net assets | $(80,454,893 | ) | $(54,465,814 | ) | ||||
Net assets | ||||||||
At beginning of period | 1,404,840,269 | 1,459,306,083 | ||||||
At end of period (including undistributed net investment income of $31,568,753 and | $1,324,385,376 | $1,404,840,269 |
See Notes to Financial Statements
18
Table of Contents
MFS Total Return Portfolio
FINANCIAL STATEMENTS | FINANCIAL HIGHLIGHTS
The financial highlights table is intended to help you understand the fund’s financial performance for the past 5 years. Certain information reflects financial results for a single fund share. The total returns in the table represent the rate by which an investor would have earned (or lost) on an investment in the fund share class (assuming reinvestment of all distributions) held for the entire period.
| Initial Class | Years ended 12/31 | |||||||||||||||||||
| 2011 | 2010 | 2009 | 2008 | 2007 | ||||||||||||||||
Net asset value, beginning of period | $16.77 | $15.66 | $13.83 | $19.50 | $20.02 | |||||||||||||||
| Income (loss) from investment operations | ||||||||||||||||||||
Net investment income (d) | $0.40 | $0.38 | $0.40 | $0.49 | $0.53 | |||||||||||||||
Net realized and unrealized gain (loss) on investments and foreign currency | (0.09 | ) | 1.16 | 1.98 | (4.30 | ) | 0.36 | |||||||||||||
Total from investment operations | $0.31 | $1.54 | $2.38 | $(3.81 | ) | $0.89 | ||||||||||||||
| Less distributions declared to shareholders | ||||||||||||||||||||
From net investment income | $(0.46 | ) | $(0.43 | ) | $(0.55 | ) | $(0.60 | ) | $(0.60 | ) | ||||||||||
From net realized gain on investments | — | — | — | (1.26 | ) | (0.81 | ) | |||||||||||||
Total distributions declared to shareholders | $(0.46 | ) | $(0.43 | ) | $(0.55 | ) | $(1.86 | ) | $(1.41 | ) | ||||||||||
Net asset value, end of period (x) | $16.62 | $16.77 | $15.66 | $13.83 | $19.50 | |||||||||||||||
Total return (%) (k)(r)(s)(x) | 1.93 | 9.97 | 18.09 | (21.55 | ) | 4.32 | ||||||||||||||
| Ratios (%) (to average net assets) and Supplemental data: | ||||||||||||||||||||
Expenses before expense reductions (f) | 0.76 | 0.75 | 0.76 | 0.74 | 0.70 | |||||||||||||||
Expenses after expense reductions (f) | 0.74 | 0.74 | — | — | — | |||||||||||||||
Net investment income | 2.38 | 2.37 | 2.87 | 2.93 | 2.67 | |||||||||||||||
Portfolio turnover | 20 | 32 | 45 | 62 | 60 | |||||||||||||||
Net assets at end of period (000 omitted) | $593,602 | $571,781 | $604,214 | $604,843 | $1,013,465 | |||||||||||||||
See Notes to Financial Statements
19
Table of Contents
MFS Total Return Portfolio
Financial Highlights – continued
| Service Class | Years ended 12/31 | |||||||||||||||||||
| 2011 | 2010 | 2009 | 2008 | 2007 | ||||||||||||||||
Net asset value, beginning of period | $16.61 | $15.52 | $13.70 | $19.33 | $19.86 | |||||||||||||||
| Income (loss) from investment operations | ||||||||||||||||||||
Net investment income (d) | $0.36 | $0.33 | $0.36 | $0.44 | $0.48 | |||||||||||||||
Net realized and unrealized gain (loss) on investments | (0.10 | ) | 1.16 | 1.97 | (4.26 | ) | 0.36 | |||||||||||||
Total from investment operations | $0.26 | $1.49 | $2.33 | $(3.82 | ) | $0.84 | ||||||||||||||
| Less distributions declared to shareholders | ||||||||||||||||||||
From net investment income | $(0.41 | ) | $(0.40 | ) | $(0.51 | ) | $(0.55 | ) | $(0.56 | ) | ||||||||||
From net realized gain on investments | — | — | — | (1.26 | ) | (0.81 | ) | |||||||||||||
Total distributions declared to shareholders | $(0.41 | ) | $(0.40 | ) | $(0.51 | ) | $(1.81 | ) | $(1.37 | ) | ||||||||||
Net asset value, end of period (x) | $16.46 | $16.61 | $15.52 | $13.70 | $19.33 | |||||||||||||||
Total return (%) (k)(r)(s)(x) | 1.66 | 9.69 | 17.81 | (21.74 | ) | 4.07 | ||||||||||||||
| Ratios (%) (to average net assets) and Supplemental data: | ||||||||||||||||||||
Expenses before expense reductions (f) | 1.01 | 1.00 | 1.00 | 0.99 | 0.95 | |||||||||||||||
Expenses after expense reductions (f) | 0.99 | 0.99 | — | — | — | |||||||||||||||
Net investment income | 2.13 | 2.12 | 2.60 | 2.69 | 2.42 | |||||||||||||||
Portfolio turnover | 20 | 32 | 45 | 62 | 60 | |||||||||||||||
Net assets at end of period (000 omitted) | $730,783 | $833,059 | $855,092 | $708,517 | $994,977 | |||||||||||||||
| (d) | Per share data is based on average shares outstanding. |
| (f) | Ratios do not reflect reductions from fees paid indirectly, if applicable. |
| (k) | The total return does not reflect expenses that apply to separate accounts. Inclusion of these charges would reduce the total return figures for all periods shown. |
| (r) | Certain expenses have been reduced without which performance would have been lower. |
| (s) | From time to time the fund may receive proceeds from litigation settlements, without which performance would be lower. |
| (x) | The net asset values per share and total returns have been calculated on net assets which include adjustments made in accordance with U.S. generally accepted accounting principles required at period end for financial reporting purposes. |
See Notes to Financial Statements
20
Table of Contents
MFS Total Return Portfolio
| (1) | Business and Organization |
MFS Total Return Portfolio (the fund) is a series of MFS Variable Insurance Trust II (the trust). The trust is organized as a Massachusetts business trust and is registered under the Investment Company Act of 1940, as amended, as an open-end management investment company. The shareholders of each series of the trust are separate accounts of insurance companies, which offer variable annuity and/or life insurance products, and qualified retirement and pension plans.
| (2) | Significant Accounting Policies |
General – The preparation of financial statements in conformity with U.S. generally accepted accounting principles requires management to make estimates and assumptions that affect the reported amounts of assets and liabilities, and disclosure of contingent assets and liabilities at the date of the financial statements and the reported amounts of revenues and expenses during the reporting period. Actual results could differ from those estimates. In the preparation of these financial statements, management has evaluated subsequent events occurring after the date of the fund’s Statement of Assets and Liabilities through the date that the financial statements were issued. The fund invests a significant portion of its assets in asset-backed and/or mortgage-backed securities. The value of these securities may depend, in part, on the issuer’s or borrower’s credit quality or ability to pay principal and interest when due and may fall if an issuer or borrower defaults on its obligation to pay principal or interest or if the instrument’s credit rating is downgraded by a credit rating agency. U.S. Government securities not supported as to the payment of principal or interest by the U.S. Treasury, such as those issued by Fannie Mae, Freddie Mac, and the Federal Home Loan Banks, are subject to greater credit risk than are U.S. Government securities supported by the U.S. Treasury, such as those issued by Ginnie Mae. The fund invests in foreign securities. Investments in foreign securities are vulnerable to the effects of changes in the relative values of the local currency and the U.S. dollar and to the effects of changes in each country’s legal, political, and economic environment.
In December 2011, the Financial Accounting Standards Board issued Accounting Standards Update 2011-11, Balance Sheet (Topic 210) – Disclosures about Offsetting Assets and Liabilities (“ASU 2011-11”). Effective for annual reporting periods beginning on or after January 1, 2013 and interim periods within those annual periods, ASU 2011-11 is intended to enhance disclosure requirements on the offsetting of financial assets and liabilities. Although still evaluating the potential impacts of ASU 2011-11 to the fund, management expects that the impact of the fund’s adoption will be limited to additional financial statement disclosures.
Investment Valuations – Equity securities, including restricted equity securities, are generally valued at the last sale or official closing price as provided by a third-party pricing service on the market or exchange on which they are primarily traded. Equity securities, for which there were no sales reported that day, are generally valued at the last quoted daily bid quotation as provided by a third-party pricing service on the market or exchange on which such securities are primarily traded. Equity securities held short, for which there were no sales reported for that day, are generally valued at the last quoted daily ask quotation as provided by a third-party pricing service on the market or exchange on which such securities are primarily traded. Debt instruments and floating rate loans (other than short-term instruments), including restricted debt instruments, are generally valued at an evaluated or composite bid as provided by a third-party pricing service. Short-term instruments with a maturity at issuance of 60 days or less generally are valued at amortized cost, which approximates market value. Open-end investment companies are generally valued at net asset value per share. Securities and other assets generally valued on the basis of information from a third-party pricing service may also be valued at a broker/dealer bid quotation. Values obtained from third-party pricing services can utilize both transaction data and market information such as yield, quality, coupon rate, maturity, type of issue, trading characteristics, and other market data. The values of foreign securities and other assets and liabilities expressed in foreign currencies are converted to U.S. dollars using the mean of bid and asked prices for rates provided by a third-party pricing service.
The Board of Trustees has delegated primary responsibility for determining or causing to be determined the value of the fund’s investments (including any fair valuation) to the adviser pursuant to valuation policies and procedures approved by the Board. If the adviser determines that reliable market quotations are not readily available, investments are valued at fair value as determined in good faith by the adviser in accordance with such procedures under the oversight of the Board of Trustees. Under the fund’s valuation policies and procedures, market quotations are not considered to be readily available for most types of debt instruments and floating rate loans and many types of derivatives. These investments are generally valued at fair value based on information from third-party pricing services. In addition, investments may be valued at fair value if the adviser determines that an investment’s value has been materially affected by events occurring after the close of the exchange or market on which the investment is principally traded (such as foreign exchange or market) and prior to the determination of the fund’s net asset value, or after the halting of trading of a specific security where trading does not resume prior to the close of the exchange or market on which the security is principally traded. Events that occur on a frequent basis after foreign
21
Table of Contents
MFS Total Return Portfolio
Notes to Financial Statements – continued
markets close (such as developments in foreign markets and significant movements in the U.S. markets) and prior to the determination of the fund’s net asset value may be deemed to have a material effect on the value of securities traded in foreign markets. Accordingly, the fund’s foreign equity securities may often be valued at fair value. The adviser generally relies on third-party pricing services or other information (such as the correlation with price movements of similar securities in the same or other markets; the type, cost and investment characteristics of the security; the business and financial condition of the issuer; and trading and other market data) to assist in determining whether to fair value and at what value to fair value an investment. The value of an investment for purposes of calculating the fund’s net asset value can differ depending on the source and method used to determine value. When fair valuation is used, the value of an investment used to determine the fund’s net asset value may differ from quoted or published prices for the same investment. There can be no assurance that the fund could obtain the fair value assigned to an investment if it were to sell the investment at the same time at which the fund determines its net asset value per share.
Various inputs are used in determining the value of the fund’s assets or liabilities. These inputs are categorized into three broad levels. In certain cases, the inputs used to measure fair value may fall into different levels of the fair value hierarchy. In such cases, an investment’s level within the fair value hierarchy is based on the lowest level of input that is significant to the fair value measurement. The fund’s assessment of the significance of a particular input to the fair value measurement in its entirety requires judgment, and considers factors specific to the investment. Level 1 includes unadjusted quoted prices in active markets for identical assets or liabilities. Level 2 includes other significant observable market-based inputs (including quoted prices for similar securities, interest rates, prepayment speed, and credit risk). Level 3 includes unobservable inputs, which may include the adviser’s own assumptions in determining the fair value of investments. The following is a summary of the levels used as of December 31, 2011 in valuing the fund’s assets or liabilities:
| Investments at Value | Level 1 | Level 2 | Level 3 | Total | ||||||||||||
| Equity Securities: | ||||||||||||||||
United States | $746,787,783 | $— | $— | $746,787,783 | ||||||||||||
United Kingdom | 21,912,160 | 1,993,161 | — | 23,905,321 | ||||||||||||
Switzerland | — | 13,870,359 | — | 13,870,359 | ||||||||||||
Netherlands | 3,138,304 | — | — | 3,138,304 | ||||||||||||
France | 3,018,118 | — | — | 3,018,118 | ||||||||||||
Israel | 2,466,753 | — | — | 2,466,753 | ||||||||||||
Canada | 2,381,939 | — | — | 2,381,939 | ||||||||||||
Germany | 1,785,284 | — | — | 1,785,284 | ||||||||||||
| U.S. Treasury Bonds & U.S. Government Agency & Equivalents | — | 180,172,796 | — | 180,172,796 | ||||||||||||
| Non-U.S. Sovereign Debt | — | 16,478,011 | — | 16,478,011 | ||||||||||||
| Corporate Bonds | — | 76,235,734 | — | 76,235,734 | ||||||||||||
| Residential Mortgage-Backed Securities | — | 166,888,787 | — | 166,888,787 | ||||||||||||
| Commercial Mortgage-Backed Securities | — | 21,848,418 | — | 21,848,418 | ||||||||||||
| Asset-Backed Securities (including CDOs) | — | 3,215,872 | — | 3,215,872 | ||||||||||||
| Foreign Bonds | — | 38,602,476 | — | 38,602,476 | ||||||||||||
| Mutual Funds | 17,677,046 | — | — | 17,677,046 | ||||||||||||
| Total Investments | $799,167,387 | $519,305,614 | $— | $1,318,473,001 | ||||||||||||
For further information regarding security characteristics, see the Portfolio of Investments.
Inflation-Adjusted Debt Securities – The fund invests in inflation-adjusted debt securities issued by the U.S. Treasury. The fund may also invest in inflation-adjusted debt securities issued by U.S. Government agencies and instrumentalities other than the U.S. Treasury and by other entities such as U.S. and foreign corporations and foreign governments. The principal value of these debt securities is adjusted through income according to changes in the Consumer Price Index or another general price or wage index. These debt securities typically pay a fixed rate of interest, but this fixed rate is applied to the inflation-adjusted principal amount. The principal paid at maturity of the debt security is typically equal to the inflation-adjusted principal amount, or the security’s original par value, whichever is greater. Other types of inflation-adjusted securities may use other methods to adjust for other measures of inflation.
Foreign Currency Translation – Purchases and sales of foreign investments, income, and expenses are converted into U.S. dollars based upon currency exchange rates prevailing on the respective dates of such transactions or on the reporting date for foreign denominated receivables and payables. Gains and losses attributable to foreign currency exchange rates on sales of securities are recorded for financial statement purposes as net realized gains and losses on investments. Gains and losses attributable to foreign exchange rate movements on receivables, payables, income and expenses are recorded for financial
22
Table of Contents
MFS Total Return Portfolio
Notes to Financial Statements – continued
statement purposes as foreign currency transaction gains and losses. That portion of both realized and unrealized gains and losses on investments that results from fluctuations in foreign currency exchange rates is not separately disclosed.
Security Loans – State Street Bank and Trust Company (“State Street”), as lending agent, loans the securities of the fund to certain qualified institutions (the “Borrowers”) approved by the fund. The loans are collateralized by cash and/or U.S. Treasury and federal agency obligations in an amount typically at least equal to the market value of the securities loaned. The market value of the loaned securities is determined at the close of business of the fund and any additional required collateral is delivered to the fund on the next business day. State Street provides the fund with indemnification against Borrower default. The fund bears the risk of loss with respect to the investment of cash collateral. On loans collateralized by cash, the cash collateral is invested in a money market fund or short-term securities. A portion of the income generated upon investment of the collateral is remitted to the Borrowers, and the remainder is allocated between the fund and the lending agent. On loans collateralized by U.S. Treasury and/or federal agency obligations, a fee is received from the Borrower, and is allocated between the fund and the lending agent. Income from securities lending is included in interest income on the Statement of Operations. The dividend and interest income earned on the securities loaned is accounted for in the same manner as other dividend and interest income.
Indemnifications – Under the fund’s organizational documents, its officers and Trustees may be indemnified against certain liabilities and expenses arising out of the performance of their duties to the fund. Additionally, in the normal course of business, the fund enters into agreements with service providers that may contain indemnification clauses. The fund’s maximum exposure under these agreements is unknown as this would involve future claims that may be made against the fund that have not yet occurred.
Investment Transactions and Income – Investment transactions are recorded on the trade date. Interest income is recorded on the accrual basis. All premium and discount is amortized or accreted for financial statement purposes in accordance with U.S. generally accepted accounting principles. Inflation-indexed bonds are fixed-income securities whose principal value is periodically adjusted upward or downward to the rate of inflation. Interest is accrued based on the principal value, which is adjusted for inflation. Any increase or decrease in the principal amount of an inflation-indexed bond is generally recorded as an increase or decrease in interest income, respectively, even though the adjusted principal is not received until maturity. Dividends received in cash are recorded on the ex-dividend date. Certain dividends from foreign securities will be recorded when the fund is informed of the dividend if such information is obtained subsequent to the ex-dividend date. Dividend and interest payments received in additional securities are recorded on the ex-dividend or ex-interest date in an amount equal to the value of the security on such date.
The fund may receive proceeds from litigation settlements. Any proceeds received from litigation involving portfolio holdings are reflected in the Statement of Operations in realized gain/loss if the security has been disposed of by the fund or in unrealized gain/loss if the security is still held by the fund. Any other proceeds from litigation not related to portfolio holdings are reflected as other income in the Statement of Operations.
Fees Paid Indirectly – The fund’s custody fee may be reduced according to an arrangement that measures the value of cash deposited with the custodian by the fund. This amount, for the year ended December 31, 2011, is shown as a reduction of total expenses on the Statement of Operations.
Tax Matters and Distributions – The fund intends to qualify as a regulated investment company, as defined under Subchapter M of the Internal Revenue Code, and to distribute all of its taxable income, including realized capital gains. As a result, no provision for federal income tax is required. The fund’s federal tax returns for the prior three fiscal years remain subject to examination by the Internal Revenue Service. Foreign taxes have been accrued by the fund in the accompanying financial statements.
Distributions to shareholders are recorded on the ex-dividend date. Income and capital gain distributions are determined in accordance with income tax regulations, which may differ from U.S. generally accepted accounting principles. Certain capital accounts in the financial statements are periodically adjusted for permanent differences in order to reflect their tax character. These adjustments have no impact on net assets or net asset value per share. Temporary differences which arise from recognizing certain items of income, expense, gain or loss in different periods for financial statement and tax purposes will reverse at some time in the future. Distributions in excess of net investment income or net realized gains are temporary overdistributions for financial statement purposes resulting from differences in the recognition or classification of income or distributions for financial statement and tax purposes.
Book/tax differences primarily relate to amortization and accretion of debt securities and wash sale loss deferrals.
23
Table of Contents
MFS Total Return Portfolio
Notes to Financial Statements – continued
The tax character of distributions declared to shareholders for the last two fiscal years is as follows:
| 12/31/11 | 12/31/10 | |||||||
| Ordinary income (including any short-term capital gains) | $33,161,222 | $37,470,337 | ||||||
The federal tax cost and the tax basis components of distributable earnings were as follows:
| As of 12/31/11 | ||||
| Cost of investments | $1,280,064,208 | |||
| Gross appreciation | 111,253,696 | |||
| Gross depreciation | (72,844,903 | ) | ||
| Net unrealized appreciation (depreciation) | $38,408,793 | |||
| Undistributed ordinary income | 31,568,753 | |||
| Capital loss carryforwards | (74,930,729 | ) | ||
| Other temporary differences | (7,335 | ) |
Under the Regulated Investment Company Modernization Act of 2010 (the “Act”), net capital losses recognized after December 31, 2010 may be carried forward indefinitely, and their character is retained as short-term and/or long-term losses. Previously, net capital losses were carried forward for eight years and treated as short-term losses. As a transition rule, the Act requires that post-enactment net capital losses be used before pre-enactment net capital losses.
As of December 31, 2011, the fund had capital loss carryforwards available to offset future realized gains. Such losses expire as follows:
| Pre-enactment losses: | ||||
| 12/31/16 | $(58,876,411 | ) | ||
| 12/31/17 | (16,054,318 | ) | ||
| Total | $(74,930,729 | ) |
Multiple Classes of Shares of Beneficial Interest – The fund offers multiple classes of shares, which differ in their respective distribution and/or service fees. The fund’s income, realized and unrealized gain (loss), and common expenses are allocated to shareholders based on the daily net assets of each class. Dividends are declared separately for each class. Differences in per share dividend rates are generally due to differences in separate class expenses. The fund’s distributions declared to shareholders as reported on the Statements of Changes in Net Assets are presented by class as follows:
| From net investment income | ||||||||
| Year ended 12/31/11 | Year ended 12/31/10 | |||||||
| Initial Class | $14,376,700 | $15,999,098 | ||||||
| Service Class | 18,784,522 | 21,471,239 | ||||||
| Total | $33,161,222 | $37,470,337 | ||||||
| (3) | Transactions with Affiliates |
Investment Adviser – The fund has an investment advisory agreement with MFS to provide overall investment management and related administrative services and facilities to the fund.
The management fee is computed daily and paid monthly at the following annual rates:
| First $300 million of average daily net assets | 0.75% | |||
| Average daily net assets in excess of $300 million | 0.675% |
The investment adviser has agreed in writing to reduce its management fee to 0.60% of average daily net assets in excess of $1 billion. This written agreement terminated on December 31, 2011. The management fee incurred for the year ended December 31, 2011 was equivalent to an annual effective rate of 0.67% of the fund’s average daily net assets. This management fee reduction amounted to $251,108, which is shown as a reduction of total expenses in the Statement of Operations.
On December 1, 2011, shareholders of the fund approved a new investment advisory agreement between the trust, on behalf of the fund, and MFS. This new investment advisory agreement provides that effective January 1, 2012, the management fee is computed daily and paid monthly at the following annual rates:
| First $300 million of average daily net assets | 0.75% | |||
| Next $700 million of average daily net assets | 0.675% | |||
| Average daily net assets in excess of $1 billion | 0.60% |
24
Table of Contents
MFS Total Return Portfolio
Notes to Financial Statements – continued
The investment adviser has agreed in writing to pay a portion of the fund’s total annual operating expenses, exclusive of interest, taxes, extraordinary expenses, and brokerage commissions, such that the total annual operating expenses of the fund do not exceed 1.25% of the fund’s average daily net assets. This written agreement terminated on December 31, 2011 in connection with shareholder approval of the new investment advisory agreement. In addition, the investment adviser has agreed in writing to pay a portion of the fund’s total annual operating expenses, exclusive of interest, taxes, extraordinary expenses, brokerage and transaction costs and investment related expenses, such that the total annual operating expenses do not exceed 0.74% of average daily net assets for the Initial Class shares and 0.99% of average daily net assets for the Service Class shares. This written agreement will continue until April 30, 2013. For the year ended December 31, 2011, this reduction amounted to $19,145 and is reflected as a reduction of total expenses in the Statement of Operations.
Distributor – MFS Fund Distributors, Inc. (MFD), a wholly-owned subsidiary of MFS, is the distributor of shares of the fund. The Trustees have adopted a distribution plan for the Service Class shares pursuant to Rule 12b-1 under the Investment Company Act of 1940.
The fund’s distribution plan provides that the fund will pay MFD distribution and/or service fees equal to 0.25% per annum of its average daily net assets attributable to Service Class shares as partial consideration for services performed and expenses incurred by MFD and financial intermediaries (including participating insurance companies that invest in the fund to fund variable annuity and variable life insurance contracts, sponsors of qualified retirement and pension plans that invest in the fund, and affiliates of these participating insurance companies and plan sponsors) in connection with the sale and distribution of the Service Class shares. MFD may subsequently pay all, or a portion, of the distribution and/or service fees to financial intermediaries.
Shareholder Servicing Agent – MFS Service Center, Inc. (MFSC), a wholly-owned subsidiary of MFS, has contracted to provide transfer agent and recordkeeping functions in connection with the issuance, transfer, and redemption of each class of shares of the fund under a Shareholder Servicing Agent Agreement. During the year ended December 31, 2011, the fund did not pay MFSC a fee for this service.
Administrator – MFS provides certain financial, legal, shareholder communications, compliance, and other administrative services to the fund. Under an administrative services agreement, the fund partially reimburses MFS the costs incurred to provide these services. The fund is charged an annual fixed amount of $17,500 plus a fee based on average daily net assets. The administrative services fee incurred for the year ended December 31, 2011 was equivalent to an annual effective rate of 0.0331% of the fund’s average daily net assets.
Trustees’ and Officers’ Compensation – The fund pays compensation to Trustees in the form of a retainer, attendance fees, and additional compensation to the Board chairperson. The fund does not pay compensation directly to officers of the fund who are also officers of the investment adviser, all of whom receive remuneration for their services to the fund from MFS. Certain officers of the fund are officers or directors of MFS, MFD, and MFSC.
Other – This fund and certain other funds managed by MFS (the funds) have entered into services agreements (the Agreements) which provide for payment of fees by the funds to Tarantino LLC and Griffin Compliance LLC in return for the provision of services of an Independent Chief Compliance Officer (ICCO) and Assistant ICCO, respectively, for the funds. The ICCO and Assistant ICCO are officers of the funds and the sole members of Tarantino LLC and Griffin Compliance LLC, respectively. The funds can terminate the Agreements with Tarantino LLC and Griffin Compliance LLC at any time under the terms of the Agreements. MFS has agreed to bear all expenses associated with office space, other administrative support, and supplies provided to the ICCO and Assistant ICCO. For the year ended December 31, 2011, the aggregate fees paid by the fund to Tarantino LLC and Griffin Compliance LLC were $22,170 and are included in miscellaneous expense on the Statement of Operations.
The fund invests in the MFS Institutional Money Market Portfolio which is managed by MFS and seeks a high level of current income consistent with preservation of capital and liquidity. Income earned on this investment is included in dividends from underlying affiliated funds on the Statement of Operations. This money market fund does not pay a management fee to MFS.
| (4) | Portfolio Securities |
Purchases and sales of investments, other than purchased option transactions, and short-term obligations, were as follows:
| Purchases | Sales | |||||||
| U.S. Government securities | $74,363,548 | $145,903,040 | ||||||
| Investments (non-U.S. Government securities) | $188,572,138 | $298,788,316 | ||||||
Purchases exclude the value of securities acquired in connection with the Total Return Variable Account merger. (See Note 8.)
25
Table of Contents
MFS Total Return Portfolio
Notes to Financial Statements – continued
| (5) | Shares of Beneficial Interest |
The fund’s Declaration of Trust permits the Trustees to issue an unlimited number of full and fractional shares of beneficial interest. Transactions in fund shares were as follows:
| Year ended 12/31/11 | Year ended 12/31/10 | |||||||||||||||
| Shares | Amount | Shares | Amount | |||||||||||||
| Shares sold | ||||||||||||||||
Initial Class | 217,705 | $3,698,442 | 409,999 | $6,469,643 | ||||||||||||
Service Class | 903,326 | 14,964,933 | 1,433,031 | 22,334,230 | ||||||||||||
| 1,121,031 | $18,663,375 | 1,843,030 | $28,803,873 | |||||||||||||
| Shares issued in connection with acquisition of Total Return Variable Account | ||||||||||||||||
Initial Class | 5,309,597 | $87,449,070 | ||||||||||||||
| Shares issued to shareholders in reinvestment of distributions | ||||||||||||||||
Initial Class | 890,750 | $14,376,700 | 993,116 | $15,999,098 | ||||||||||||
Service Class | 1,174,032 | 18,784,522 | 1,343,632 | 21,471,239 | ||||||||||||
| 2,064,782 | $33,161,222 | 2,336,748 | $37,470,337 | |||||||||||||
| Shares reacquired | ||||||||||||||||
Initial Class | (4,791,148 | ) | $(80,701,035 | ) | (5,903,250 | ) | $(93,426,169 | ) | ||||||||
Service Class | (7,830,688 | ) | (130,904,293 | ) | (7,737,752 | ) | (121,890,645 | ) | ||||||||
| (12,621,836 | ) | $(211,605,328 | ) | (13,641,002 | ) | $(215,316,814 | ) | |||||||||
| Net change | ||||||||||||||||
Initial Class | 1,626,904 | $24,823,177 | (4,500,135 | ) | $(70,957,428 | ) | ||||||||||
Service Class | (5,753,330 | ) | (97,154,838 | ) | (4,961,089 | ) | (78,085,176 | ) | ||||||||
| (4,126,426 | ) | $(72,331,661 | ) | (9,461,224 | ) | $(149,042,604 | ) | |||||||||
| (6) | Line of Credit |
The fund and certain other funds managed by MFS participate in a $1.1 billion unsecured committed line of credit, subject to a $1 billion sublimit, provided by a syndication of banks under a credit agreement. Borrowings may be made for temporary financing needs. Interest is charged to each fund, based on its borrowings, generally at a rate equal to the higher of the Federal Reserve funds rate or one month LIBOR plus an agreed upon spread. A commitment fee, based on the average daily, unused portion of the committed line of credit, is allocated among the participating funds at the end of each calendar quarter. In addition, the fund and other funds managed by MFS have established unsecured uncommitted borrowing arrangements with certain banks for temporary financing needs. Interest is charged to each fund, based on its borrowings, at a rate equal to the Federal Reserve funds rate plus an agreed upon spread. For the year ended December 31, 2011, the fund’s commitment fee and interest expense were $10,324 and $0, respectively, and are included in miscellaneous expense on the Statement of Operations.
| (7) | Transactions in Underlying Affiliated Funds – Affiliated Issuers |
An affiliated issuer may be considered one in which the fund owns 5% or more of the outstanding voting securities, or a company which is under common control. For the purposes of this report, the fund assumes the following to be affiliated issuers:
| Underlying Affiliated Funds | Beginning Shares/Par Amount | Acquisitions Shares/Par Amount | Dispositions Shares/Par Amount | Ending Shares/Par Amount | ||||||||||||
| MFS Institutional Money Market Portfolio | 9,034,481 | 228,530,886 | (219,888,321 | ) | 17,677,046 | |||||||||||
| Underlying Affiliated Funds | Realized Gain (Loss) | Capital Gain Distributions | Dividend Income | Ending Value | ||||||||||||
| MFS Institutional Money Market Portfolio | $— | $— | $14,686 | $17,677,046 | ||||||||||||
| (8) | Acquisitions |
At the close of business on December 2, 2011, the fund with net assets of $1,241,377,323, acquired all of the investment-related assets and liabilities of Total Return Variable Account. The acquisition was part of a transaction in which the Total Return Variable Account was converted into a unit investment trust (“UIT”) that invests in the fund (the acquisition of the Account’s assets and liabilities and subsequent conversion into a UIT hereinafter referred to as the “Reorganization”). The Reorganization provided the contract owners of the Total Return Variable Account with the opportunity to participate in a larger combined portfolio with an identical investment objective and similar investment policies and strategies. The acquisition was accomplished by a tax-free exchange of 5,309,597 shares of the fund (valued at $87,449,070) for all of the investment-related
26
Table of Contents
MFS Total Return Portfolio
Notes to Financial Statements – continued
assets and liabilities of Total Return Variable Account. Total Return Variable Account’s net assets on that date were $87,449,070, including investments valued at $87,136,582 with a cost basis of $78,638,088. For financial reporting purposes, assets received and shares issued by the fund were recorded at fair value; however, the cost basis of the investments received from Total Return Variable Account were carried forward to align ongoing reporting of the fund’s realized and unrealized gains and losses with amounts distributable to shareholders for tax purposes. Because the combined investment portfolios have been managed as a single integrated portfolio since the acquisition was completed, it is not practicable to separate the amounts of revenue and earnings of Total Return Variable Account that have been included in Total Return Variable Account’s Statement of Operations since December 2, 2011. No pro forma information is provided as it is not material to the combined fund results.
27
Table of Contents
MFS Total Return Portfolio
REPORT OF INDEPENDENT REGISTERED PUBLIC ACCOUNTING FIRM
To the Board of Trustees of MFS Variable Insurance Trust II and the Shareholders of
MFS Total Return Portfolio:
We have audited the accompanying statement of assets and liabilities, including the portfolio of investments, of MFS Total Return Portfolio (the “Fund”) (one of the portfolios comprising MFS Variable Insurance Trust II) as of December 31, 2011, and the related statement of operations for the year then ended, the statements of changes in net assets for each of the two years in the period then ended, and the financial highlights for each of the five years in the period then ended. These financial statements and financial highlights are the responsibility of the Fund’s management. Our responsibility is to express an opinion on these financial statements and financial highlights based on our audits.
We conducted our audits in accordance with the standards of the Public Company Accounting Oversight Board (United States). Those standards require that we plan and perform the audit to obtain reasonable assurance about whether the financial statements and financial highlights are free of material misstatement. The Fund is not required to have, nor were we engaged to perform, an audit of its internal control over financial reporting. Our audits included consideration of internal control over financial reporting as a basis for designing audit procedures that are appropriate in the circumstances, but not for the purpose of expressing an opinion on the effectiveness of the Fund’s internal control over financial reporting. Accordingly, we express no such opinion. An audit also includes examining, on a test basis, evidence supporting the amounts and disclosures in the financial statements, assessing the accounting principles used and significant estimates made by management, as well as evaluating the overall financial statement presentation. Our procedures included confirmation of securities owned as of December 31, 2011, by correspondence with the custodian and brokers; where replies were not received from brokers, we performed other auditing procedures. We believe that our audits provide a reasonable basis for our opinion.
In our opinion, the financial statements and financial highlights referred to above present fairly, in all material respects, the financial position of MFS Total Return Portfolio as of December 31, 2011, the results of its operations for the year then ended, the changes in its net assets for each of the two years in the period then ended, and the financial highlights for each of the five years in the period then ended, in conformity with accounting principles generally accepted in the United States of America.
DELOITTE & TOUCHE LLP
Boston, Massachusetts
February 15, 2012
28
Table of Contents
MFS Total Return Portfolio
RESULTS OF SHAREHOLDER MEETING (unaudited)
At a special meeting of shareholders of MFS Total Return Portfolio, which was held on December 1, 2011, the following actions were taken for which shareholders of all series of MFS Variable Insurance Trust II voted together as a single class with respect to Item 1 and shareholders of MFS Total Return Portfolio voted as a separate class with respect to Items 2 and 3:
Item 1: Election of ten Trustees as members of the Board of Trustees of the Trust effective January 1, 2012:
| Number of Shares | ||||||||
| For | Withheld Authority | |||||||
| Robert E. Butler | 681,916,712.8686 | 46,472,894.9218 | ||||||
| Maureen R. Goldfarb | 682,835,794.8512 | 45,553,812.9392 | ||||||
| David H. Gunning | 681,500,267.3085 | 46,889,340.4819 | ||||||
| William R. Gutow | 681,050,223.5547 | 47,339,384.2357 | ||||||
| Michael Hegarty | 682,477,088.8584 | 45,912,518.9320 | ||||||
| John P. Kavanaugh | 683,794,425.4269 | 44,595,182.3635 | ||||||
| Robert J. Manning | 682,699,559.7374 | 45,690,048.0530 | ||||||
| J. Dale Sherratt | 681,362,743.0513 | 47,026,864.7391 | ||||||
| Laurie J. Thomsen | 683,408,094.0000 | 44,981,513.7904 | ||||||
| Robert W. Uek | 681,424,852.0247 | 46,964,755.7657 | ||||||
Item 2: To approve a new investment advisory agreement dated January 1, 2012, between the Trust, on behalf of MFS Total Return Portfolio, and MFS:
| Number of Shares | ||||||||||||
| For | Against | Withheld Authority | ||||||||||
| 68,138,747.0641 | 2,292,783.3848 | 7,234,910.4957 | ||||||||||
Item 3: To approve revisions to and restatements of certain fundamental investment restrictions of MFS Total Return Portfolio effective January 1, 2012 as detailed below:
| Number of Shares | ||||||||||||||
| For | Against | Withheld Authority | ||||||||||||
| A. | Borrowing | 65,215,029.5453 | 4,659,155.3057 | 7,792,256.0936 | ||||||||||
| B. | Underwriting Securities | 66,524,062.8044 | 3,663,314.5598 | 7,479,063.5804 | ||||||||||
| C. | Issuance of Senior Securities | 66,816,482.6922 | 3,432,263.1391 | 7,417,695.1133 | ||||||||||
| D. | Lending of Money or Securities | 65,939,847.9205 | 4,075,544.7660 | 7,651,048.2581 | ||||||||||
| E. | Purchases or Sales of Real Estate; Interests in Oil, Gas or Mineral Leases; and Commodities | 67,258,221.1459 | 3,109,654.9265 | 7,298,564.8722 | ||||||||||
| F. | Industry Concentration | 67,211,063.8352 | 2,806,802.1396 | 7,648,574.9698 | ||||||||||
29
Table of Contents
MFS Total Return Portfolio
TRUSTEES AND OFFICERS – IDENTIFICATION AND BACKGROUND
The Trustees and officers of the Trust, as of February 1, 2012, are listed below, together with their principal occupations during the past five years. (Their titles may have varied during that period.) The address of each Trustee and officer is 500 Boylston Street, Boston, Massachusetts 02116.
Name, Age | Position(s) with Fund | Trustee/Officer Since (h) | Principal Occupations | Other Directorships (j) | ||||
| INTERESTED TRUSTEES | ||||||||
Robert J. Manning (k) (age 48) | Trustee | February 2004 | Massachusetts Financial Services Company, Chairman, Chief Executive Officer and Director; President (until December 2009); Chief Investment Officer (until July 2010) | N/A | ||||
| INDEPENDENT TRUSTEES | ||||||||
David H. Gunning (age 69) | Trustee and Chair of Trustees | January 2004 | Retired; Cleveland-Cliffs Inc. (mining products and service provider), Vice Chairman/Director (until May 2007) | Lincoln Electric Holdings, Inc. (welding equipment manufacturer), Director; Development Alternatives, Inc. (consulting), Director/Non-Executive Chairman; Portman Limited (mining), Director (until 2008) | ||||
Robert E. Butler (age 70) | Trustee | January 2006 | Consultant – investment company industry regulatory and compliance matters | N/A | ||||
Maureen R. Goldfarb (age 56) | Trustee | January 2009 | Private investor | N/A | ||||
William R. Gutow (age 70) | Trustee | December 1993 | Private investor and real estate consultant; Capitol Entertainment Management Company (video franchise), Vice Chairman | Atlantic Coast Tan (tanning salons), Vice Chairman (until 2007); Texas Donuts (donut franchise), Vice Chairman (until 2010) | ||||
Michael Hegarty (age 67) | Trustee | December 2004 | Private investor | N/A | ||||
John P. Kavanaugh (age 57) | Trustee | January 2009 | Private investor; The Hanover Insurance Group, Inc., Vice President and Chief Investment Officer (until 2006); Allmerica Investment Trust, Allmerica Securities Trust and Opus Investment Trust (investment companies), Chairman, President and Trustee (until 2006) | N/A | ||||
J. Dale Sherratt (age 73) | Trustee | June 1989 | Insight Resources, Inc. (acquisition planning specialists), President; Wellfleet Investments (investor in health care companies), Managing General Partner | N/A | ||||
Laurie J. Thomsen (age 54) | Trustee | March 2005 | Private investor; New Profit, Inc. (venture philanthropy), Executive Partner (until 2010) | The Travelers Companies (property and casualty insurance), Director | ||||
Robert W. Uek (age 70) | Trustee | January 2006 | Consultant to investment company industry | N/A | ||||
| OFFICERS | ||||||||
John M. Corcoran (k) (age 46) | President | October 2008 | Massachusetts Financial Services Company, Senior Vice President (since October 2008); State Street Bank and Trust (financial services provider), Senior Vice President, (until September 2008) | N/A | ||||
| Christopher R. Bohane (k) (age 38) | Assistant Secretary and Assistant Clerk | July 2005 | Massachusetts Financial Services Company, Vice President and Senior Counsel | N/A | ||||
Kino Clark (k) (age 43) | Assistant Treasurer | January 2012 | Massachusetts Financial Services Company, Assistant Vice President | N/A | ||||
30
Table of Contents
MFS Total Return Portfolio
Trustees and Officers – continued
Name, Age | Position(s) with Fund | Trustee/Officer Since (h) | Principal Occupations | Other Directorships (j) | ||||
Ethan D. Corey (k) (age 48) | Assistant Secretary and Assistant Clerk | July 2005 | Massachusetts Financial Services Company, Senior Vice President and Associate General Counsel | N/A | ||||
David L. DiLorenzo (k) (age 43) | Treasurer | July 2005 | Massachusetts Financial Services Company, Vice President | N/A | ||||
Robyn L. Griffin (age 36) | Assistant Independent Chief Compliance Officer | August 2008 | Griffin Compliance LLC (provider of compliance services), Principal (since August 2008); State Street Corporation (financial services provider), Mutual Fund Administration Assistant Vice President (October 2006 – July 2008); Liberty Mutual Group (insurance), Personal Market Assistant Controller (April 2006 – October 2006); Deloitte & Touche LLP (professional services firm). | N/A | ||||
Brian E. Langenfeld (k) (age 38) | Assistant Secretary and Assistant Clerk | June 2006 | Massachusetts Financial Services Company, Vice President and Senior Counsel | N/A | ||||
Ellen Moynihan (k) (age 54) | Assistant Treasurer | April 1997 | Massachusetts Financial Services Company, Senior Vice President | N/A | ||||
Susan S. Newton (k) (age 61) | Assistant Secretary and Assistant Clerk | May 2005 | Massachusetts Financial Services Company, Senior Vice President and Associate General Counsel | N/A | ||||
Susan A. Pereira (k) (age 41) | Assistant Secretary and Assistant Clerk | July 2005 | Massachusetts Financial Services Company, Vice President and Senior Counsel | N/A | ||||
Mark N. Polebaum (k) (age 59) | Secretary and Clerk | January 2006 | Massachusetts Financial Services Company, Executive Vice President, General Counsel and Secretary | N/A | ||||
Frank L. Tarantino (age 67) | Independent Chief Compliance Officer | June 2004 | Tarantino LLC (provider of compliance services), Principal | N/A | ||||
Richard S. Weitzel (k) (age 41) | Assistant Secretary and Assistant Clerk | October 2007 | Massachusetts Financial Services Company, Vice President and Assistant General Counsel | N/A | ||||
James O. Yost (k) (age 51) | Deputy Treasurer | September 1990 | Massachusetts Financial Services Company, Senior Vice President | N/A | ||||
| (h) | Date first appointed to serve as Trustee/officer of an MFS fund. Each Trustee has served continuously since appointment unless indicated otherwise. For the period from December 15, 2004 until February 22, 2005, Mr. Manning served as Advisory Trustee. For the period October 2008, until January 2012, Mr. Corcoran served as Treasurer of the Funds. Prior to January 2012, Messrs. DiLorenzo and Yost served as Assistant Treasurers of the Funds. |
| (j) | Directorships or trusteeships of companies required to report to the Securities and Exchange Commission (i.e., “public companies”). |
| (k) | “Interested person” of the Trust within the meaning of the Investment Company Act of 1940 (referred to as the 1940 Act), which is the principal federal law governing investment companies like the fund, as a result of position with MFS. The address of MFS is 500 Boylston Street, Boston, Massachusetts 02116. |
Each Trustee has been elected by shareholders and each Trustee and officer holds office until his or her successor is chosen and qualified or until his or her earlier death, resignation, retirement or removal. The Trust does not hold annual meetings for the purpose of electing Trustees, and Trustees are not elected for fixed terms. Messrs. Butler, Kavanaugh, Uek and Ms. Thomsen are members of the Trust’s Audit Committee.
Each of the Fund’s Trustees and officers holds comparable positions with certain other funds of which MFS or a subsidiary is the investment adviser or distributor, and, in the case of the officers, with certain affiliates of MFS. As of January 1, 2012, the Trustees served as board members of 131 funds within the MFS Family of Funds.
31
Table of Contents
MFS Total Return Portfolio
Trustees and Officers – continued
The Statement of Additional Information for the Fund includes further information about the Trustees and is available without charge upon request by calling 1-800-225-2606.
Investment Adviser Massachusetts Financial Services Company 500 Boylston Street, Boston, MA 02116-3741 | Custodian State Street Bank and Trust 1 Lincoln Street, Boston, MA 02111-2900 | |
Distributor MFS Fund Distributors, Inc. 500 Boylston Street, Boston, MA 02116-3741 | Independent Registered Public Accounting Firm Deloitte & Touche LLP 200 Berkeley Street, Boston, MA 02116 | |
Portfolio Managers Nevin Chitkara William Douglas Steven Gorham Richard Hawkins Joshua Marston Brooks Taylor |
32
Table of Contents
MFS Total Return Portfolio
At a special meeting of shareholders of the MFS Total Return Portfolio (hereinafter referred to as the “Fund” or the “Portfolio”), which was held on December 1, 2011, the shareholders approved a new investment advisory agreement based on the recommendation of the Board of Trustees. At its July, 2011 meeting, the Board of Trustees (i) approved, and recommended for shareholder approval, the new investment advisory agreement effective January 1, 2012, and (ii) the continuation of the existing investment advisory agreement effective September 1, 2011. The following includes a description of the factors that the Board of Trustees considered and the conclusions that formed the basis of their approval of both the new investment advisory agreement and the continuation of the prior investment advisory agreement.
BOARD APPROVAL OF NEW INVESTMENT ADVISORY AGREEMENT
The Investment Company Act of 1940 requires that both the full Board of Trustees and a majority of the non-interested (“independent”) Trustees, voting separately, initially approve the new investment advisory agreement (the “New Agreement”) between Massachusetts Financial Services Company (“MFS”) and MFS Variable Insurance Trust II (the “Trust”) on behalf of the Portfolio and, beginning on the second anniversary of the initial effective date of the New Agreement, annually approve the continuation of the New Agreement. The Trustees have considered matters bearing on the Portfolio and the then current advisory arrangement at their meetings throughout the year, including a review of performance data at each regular meeting. In addition, the independent Trustees met in person in July 2011 to consider the initial approval of the New Agreement, and to recommend that shareholders approve the New Agreement. The independent Trustees were assisted in their evaluation of the New Agreement by independent legal counsel, from whom they received separate legal advice and with whom they met separately from MFS management. The independent Trustees were also assisted in this process by the Portfolio’s Independent Chief Compliance Officer, a full-time senior officer appointed by and reporting to the independent Trustees.
In connection with their deliberations regarding the initial approval of the New Agreement, the Trustees, including the independent Trustees, considered such information and factors as they believed, in light of the legal advice furnished to them and their own business judgment, to be relevant. The New Agreement was considered separately for the series of the Trust (collectively, the “Portfolios”), although the Trustees also took into account the common interests of all Portfolios in the Trust in their review. As described below, the Trustees considered the nature, quality, and extent of the various investment advisory, administrative, and/or shareholder services to be performed by MFS under the New Agreement and other arrangements with the Trust.
In connection with their initial review meeting, the Trustees received and relied upon materials that included, among other items: (i) information provided by MFS on the advisory fees of comparable portfolios of its other clients, including institutional separate account and other clients, (ii) information as to whether, and to what extent applicable, expense waivers, reimbursements or fee “breakpoints” would be observed for the Portfolio under the New Agreement, and (iii) a comparison and summary of the differences in the provisions in the New Agreement compared to those in each of the then current investment advisory agreements for the Portfolios. In addition, in connection with the independent Trustees’ meetings in May and July, 2011 (the “contract review meetings”) for the purpose of considering whether to approve the continuation of the then current investment advisory agreements for the Portfolio, the independent Trustees received: (1) information provided by Lipper Inc. (“Lipper”) on the investment performance of the Portfolio for various time periods ended December 31, 2010, compared to the investment performance of a group of funds with substantially similar investment classifications/objectives (the “Lipper performance universe”), (2) information provided by Lipper on the Portfolio’s advisory fees and other expenses compared to the advisory fees and other expenses of comparable funds identified by Lipper (the “Lipper expense group”), (3) information regarding MFS’ financial results and financial condition, including MFS’ and certain of its affiliates’ estimated profitability from services performed for the Portfolio, (4) MFS’ views regarding the outlook for the mutual fund industry and its strategic business plans, (5) descriptions of various functions performed by MFS for the Trust, such as compliance monitoring and portfolio trading practices, and (6) information regarding the overall organization of MFS, including information about MFS’ senior management and other personnel providing investment advisory, administrative and other services to the Portfolio. The comparative performance, fee and expense information prepared and provided by Lipper was not independently verified, and the independent Trustees did not independently verify any information provided to them by MFS.
The Trustees’ conclusion as to the initial approval of the New Agreement was based on comprehensive consideration of all information provided to the Trustees and was not the result of any single factor. Some of the factors that figured particularly in the Trustees’ deliberations are described below for the Portfolio, while individual Trustees may have given different weight to various factors and evaluated the information presented as a whole differently than another individual Trustee. The Trustees recognized that the fee arrangements for the Portfolio could reflect years of review and discussion between the independent Trustees and MFS, that certain aspects of such arrangements may receive greater scrutiny in some years than others, and that
33
Table of Contents
MFS Total Return Portfolio
Board Approval of New Investment Advisory Agreement – continued
the Trustees’ conclusions may be based, in part, on their consideration of these same arrangements during the course of the year and in prior years.
Because the portfolio management team managing the Portfolio’s investments under the then current investment advisory agreement will remain the same under the New Agreement for the Portfolio, the Trustees compared the Portfolio’s total return investment performance to the performance of its Lipper performance universe over various time periods, based on information provided by Lipper. The Trustees placed particular emphasis on the total return performance of the Portfolio’s Initial Class shares in comparison to the performance of funds in its Lipper performance universe over the one-, three- and five-year periods ended December 31, 2010. The Trustees did not rely on performance results for more recent periods.
The Trustees noted the performance of the Portfolio’s Initial Class shares was in the 4th quintile relative to the other funds in the Lipper performance universe for the one-year period (the 1st quintile being the best performers and the 5th quintile being the worst performers). The total return performance of the Portfolio was in the 3rd quintile for the three-year period and in the 4th quintile for the five-year period ended December 31, 2010, relative to the Lipper performance universe. Based on the nature and quality of services provided by MFS and MFS’ explanation of steps taken to improve performance, the Board of Trustees concluded that the Portfolio’s performance was adequate.
In the course of their deliberations, the Trustees took into account information provided by MFS during contract review meetings, as well as during investment review meetings conducted with portfolio management personnel during the course of the year. For Portfolios whose performance lagged their peer groups, they discussed the factors that contributed thereto and MFS’ efforts to improve such Portfolios’ performance. After reviewing this information, the Trustees concluded, within the context of their overall conclusions regarding the New Agreement, that they were satisfied with MFS’ responses and efforts relating to investment performance.
In assessing the reasonableness of the Portfolio’s advisory fee, the Trustees considered, among other information, the Portfolio’s advisory fee and the total expense ratio of the Portfolio’s Initial Class shares as a percentage of average daily net assets, compared to the advisory fee and total expense ratios of its peer group of funds based on information provided by Lipper. The Trustees also considered the advisory fees charged by MFS to institutional accounts. In comparing these fees, the Trustees considered the generally broader scope of services provided by MFS to the Trust than those provided to institutional accounts. The Trustees also considered the higher demands placed on MFS’ investment personnel and trading infrastructure as a result of the daily cash in-flows and out-flows of the Portfolio, and the impact on MFS and related expenses due to the more extensive regulatory regime to which the Portfolio is subject, compared to institutional accounts.
In considering the fees, the Trustees noted from the Lipper data that the Portfolio’s effective advisory fee rate and total expense ratio were each above the median of such fees and expenses of funds in the Lipper expense group. In addition, the Trustees accepted MFS’ offer to continue the expense limitation for the Portfolio. The Trustees further noted that the New Agreement would reflect the existing advisory fee reduction on average daily net assets over $300 million and MFS’ agreement to further reduce the advisory fee on average daily net assets over $1 billion on a permanent basis, and concluded that the breakpoints were sufficient to allow the Portfolio to benefit from economies of scale as its assets grow. The Trustees concluded that the fees were reasonable in light of the nature and quality of services provided.
The Trustees also considered whether the Portfolio is likely to benefit from any economies of scale due to future asset growth. In this regard, the Trustees reviewed the adequacy of breakpoints and discussed with MFS any adjustments necessary for the shareholders’ benefit.
The Trustees also considered information prepared by MFS relating to its costs and profits with respect to the Portfolio and other investment companies and accounts advised by MFS, as well as MFS’ methodologies used to determine and allocate its costs to the Portfolio and other accounts and products for purposes of estimating profitability.
The Trustees noted that there would be no increase to the net advisory fee arrangement for the Portfolio under the New Agreement when compared to the Portfolio’s then current investment advisory agreement. After reviewing these and other factors described below, the Trustees concluded that the advisory fees charged to the Portfolio under the New Agreement represent reasonable compensation in light of the nature and quality of the services being provided by MFS.
In addition, the Trustees considered MFS’ resources and related efforts to continue to retain, attract and motivate capable personnel to serve the Portfolio. The Trustees also considered the financial resources of MFS and its parent, Sun Life Financial Inc. The Trustees further considered any advantages and possible disadvantages of having an adviser which also serves other investment companies as well as institutional accounts.
34
Table of Contents
MFS Total Return Portfolio
Board Approval of New Investment Advisory Agreement – continued
The Trustees also considered the nature, quality, cost, and extent of administrative, transfer agency, and distribution services provided to the Trust by MFS and its affiliates under agreements and plans other than the New Agreement, including the 12b-1 fees the Portfolio pays to MFS Fund Distributors, Inc., an affiliate of MFS. The Trustees also considered the nature, extent and quality of certain other services MFS performs or arranges on the Portfolio’s behalf, which may include securities lending programs, directed expense payment programs, class action recovery programs, and MFS’ interaction with third-party service providers, principally custodians and sub-custodians. The Trustees concluded that the various non-advisory services provided by MFS and its affiliates on behalf of the Portfolio were satisfactory. The Trustees also considered the benefits to MFS from the use of the Portfolio’s portfolio brokerage commissions to pay for investment research and various other factors. Additionally, the Trustees considered so-called “fall-out benefits” to MFS such as reputational value derived from serving as investment manager to the Trust, and determined that any such benefits derived by MFS were reasonable and fair.
Based on their evaluation of factors that they deemed to be material, including those factors described above, the Board of Trustees, including a majority of the independent Trustees, concluded that the New Agreement should be approved for an initial two-year period, commencing upon its effective date, as set forth in the New Agreement.
BOARD APPROVAL OF CONTINUATION OF PRIOR INVESTMENT ADVISORY AGREEMENT
The Investment Company Act of 1940 requires that both the full Board of Trustees and a majority of the non-interested (“independent”) Trustees, voting separately, annually approve the continuation of the investment advisory agreement between MFS Variable Insurance Trust II (the “Trust”) and Massachusetts Financial Services Company (“MFS”) on behalf of the Fund. The Trustees consider matters bearing on the Fund and the advisory arrangements at their meetings throughout the year, including a review of performance data at each regular meeting. In addition, the independent Trustees met in person in May and again in July 2011 (“contract review meetings”) for the specific purpose of considering whether to approve the continuation of the investment advisory agreement for the Fund. The independent Trustees were assisted in their evaluation of the investment advisory agreement by independent legal counsel, from whom they received separate legal advice and with whom they met separately from MFS management during various contract review meetings. The independent Trustees were also assisted in this process by the Fund’s Independent Chief Compliance Officer, a full-time senior officer appointed by and reporting to the independent Trustees.
In connection with their deliberations, the Trustees, including the independent Trustees, considered such information and factors as they believed, in light of the legal advice furnished to them and their own business judgment, to be relevant. The investment advisory agreement was considered separately for the Fund, although the Trustees also took into account the common interests of all Funds in the Trust in their review. As described below, the Trustees considered the nature, quality, and extent of the various investment advisory, administrative, and shareholder services performed by MFS under the existing investment advisory agreement and other arrangements with the Trust.
In connection with their contract review meetings, the Trustees received and relied upon materials which included, among other items: (i) information provided by Lipper Inc. (“Lipper”) on the investment performance of the Fund for various time periods ended December 31, 2010, compared to the investment performance of a group of funds with substantially similar investment classifications/objectives (the “Lipper performance universe”), (ii) information provided by Lipper on the Fund’s advisory fees and other expenses compared to the advisory fees and other expenses of comparable funds identified by Lipper (the “Lipper expense group”), (iii) information provided by MFS on the advisory fees of comparable portfolios of its other clients, including institutional separate account and other clients, (iv) information as to whether, and to what extent applicable, expense waivers, reimbursements or fee “breakpoints” are observed for the Fund, (v) information regarding MFS’ financial results and financial condition, including MFS’ and certain of its affiliates’ estimated profitability from services performed for the Fund and other investment companies that the Board oversees as a whole, and for MFS’ institutional business, (vi) MFS’ views regarding the outlook for the mutual fund industry and its strategic business plans, (vii) descriptions of various functions performed by MFS for the Trust, such as compliance monitoring and portfolio trading practices, and (viii) information regarding the overall organization of MFS, including information about MFS’ senior management and other personnel providing investment advisory, administrative and other services to the Fund. The comparative performance, fee and expense information prepared and provided by Lipper was not independently verified, and the independent Trustees did not independently verify any information provided to them by MFS.
The Trustees’ conclusion as to the continuation of the investment advisory agreement was based on comprehensive consideration of all information provided to the Trustees and was not the result of any single factor. Some of the factors that figured particularly in the Trustees’ deliberations are described below for the Fund, while individual Trustees may have given different weight to various factors and evaluated the information presented as a whole differently than another individual
35
Table of Contents
MFS Total Return Portfolio
Board Approval of Continuation of Prior Investment Advisory Agreement – continued
Trustee. The Trustees recognized that the fee arrangements for the Fund reflect years of review and discussion between the independent Trustees and MFS, that certain aspects of such arrangements may receive greater scrutiny in some years than others, and that the Trustees’ conclusions may be based, in part, on their consideration of these same arrangements during the course of the year and in prior years.
Based on information provided by Lipper, the Trustees compared the Fund’s total return investment performance to the performance of the Lipper performance universe over various time periods. The Trustees placed particular emphasis on the total return performance of the Fund’s Initial Class shares in comparison to the performance of funds in its Lipper performance universe over the one-, three- and five-year periods ended December 31, 2010. The Trustees did not rely on performance results for more recent periods, including those shown elsewhere in this report.
The Trustees noted the performance of the Fund’s Initial Class shares was in the 4th quintile relative to the other funds in the Lipper performance universe for the one-year period (the 1st quintile being the best performers and the 5th quintile being the worst performers). The total return performance of the Fund was in the 3rd quintile for the three-year period and in the 4th quintile for the five-year period ended December 31, 2010, relative to the Lipper performance universe. Based on the nature and quality of services provided by MFS and MFS’ explanation of steps taken to improve performance, the Board of Trustees concluded that the Portfolio’s performance was adequate.
In the course of their deliberations, the Trustees took into account information provided by MFS during contract review meetings, as well as during investment review meetings conducted with portfolio management personnel during the course of the year.
In assessing the reasonableness of the Fund’s advisory fee, the Trustees considered, among other information, the Fund’s advisory fee and the total expense ratio of the Fund’s Initial Class shares as a percentage of average daily net assets, compared to the advisory fee and total expense ratios of its peer group of funds based on information provided by Lipper. The Trustees also considered the advisory fees charged by MFS to institutional accounts. In comparing these fees, the Trustees considered the generally broader scope of services provided by MFS to the Trust than those provided to institutional accounts. The Trustees also considered the higher demands placed on MFS’ investment personnel and trading infrastructure as a result of the daily cash in-flows and out-flows of the Fund, and the impact on MFS and related expenses due to the more extensive regulatory regime to which the Fund is subject, compared to institutional accounts.
In considering the fees, the Trustees noted from the Lipper data (which takes into account any reductions or expense limitations) that the Fund’s effective advisory fee rate and total expense ratio were each above the median of such fees and expenses of funds in the Lipper expense group. In addition, the Trustees accepted MFS’ offer to continue the expense limitation for the Fund. The Trustees further concluded that the existing breakpoints were sufficient to allow the Fund to benefit from economies of scale as its assets grow. The Trustees concluded that the fees were reasonable in light of the nature and quality of services provided.
The Trustees also considered information prepared by MFS relating to its costs and profits with respect to the Fund and other investment companies and accounts advised by MFS, as well as MFS’ methodologies used to determine and allocate its costs to the Fund and other accounts and products for purposes of estimating profitability.
After reviewing these and other factors described below, the Trustees concluded that the advisory fees charged to the Fund represent reasonable compensation in light of the nature and quality of the services being provided by MFS.
In addition, the Trustees considered MFS’ resources and related efforts to continue to retain, attract and motivate capable personnel to serve the Fund. The Trustees also considered the financial resources of MFS and its parent, Sun Life Financial Inc. The Trustees further considered any advantages and possible disadvantages of having an adviser which also serves other investment companies as well as institutional accounts.
The Trustees also considered the nature, quality, cost, and extent of administrative, transfer agency, and distribution services provided to the Fund by MFS and its affiliates under agreements and plans other than the investment advisory agreement, including the 12b-1 fees the Fund pays to MFS Fund Distributors, Inc., an affiliate of MFS. The Trustees also considered the nature, extent and quality of certain other services MFS performs or arranges on the Fund’s behalf, which may include securities lending programs, directed expense payment programs, class action recovery programs, and MFS’ interaction with third-party service providers, principally custodians and sub-custodians. The Trustees concluded that the various non-advisory services provided by MFS and its affiliates on behalf of the Fund were satisfactory. The Trustees also considered the benefits to MFS from the use of the Fund’s portfolio brokerage commissions, if applicable, to pay for investment research and various other factors. Additionally, the Trustees considered so-called “fall-out benefits” to MFS such as reputational value derived from serving as investment manager to the Trust, and determined that any such benefits derived by MFS were reasonable and fair.
36
Table of Contents
MFS Total Return Portfolio
Board Approval of Continuation of Prior Investment Advisory Agreement – continued
Based on their evaluation of factors that they deemed to be material, including those factors described above, the Board of Trustees, including a majority of the independent Trustees, concluded that the investment advisory agreement should be continued for an additional one-year period, commencing September 1, 2011.
A discussion regarding the Board’s most recent review and renewal of the fund’s Investment Advisory Agreement with MFS is available by clicking on the fund’s name under “Variable Insurance Portfolios — VIT II” in the “Products and Performance” section of the MFS Web site (mfs.com).
37
Table of Contents
MFS Total Return Portfolio
PROXY VOTING POLICIES AND INFORMATION
A general description of the MFS funds’ proxy voting policies and procedures is available without charge, upon request, by calling 1-800-225-2606, by visiting the Proxy Voting section of mfs.com or by visiting the SEC’s Web site at http://www.sec.gov.
Information regarding how the fund voted proxies relating to portfolio securities during the most recent twelve-month period ended June 30 is available without charge by visiting the Proxy Voting section of mfs.com or by visiting the SEC’s Web site at http://www.sec.gov.
QUARTERLY PORTFOLIO DISCLOSURE
The fund will file a complete schedule of portfolio holdings with the Securities and Exchange Commission (the Commission) for the first and third quarters of each fiscal year on Form N-Q. The fund’s Form N-Q is available on the EDGAR database on the Commission’s Internet Web site at http://www.sec.gov and may be reviewed and copied at the:
Public Reference Room
Securities and Exchange Commission
100 F Street, NE, Room 1580
Washington, D.C. 20549
Information on the operation of the Public Reference Room may be obtained by calling the Commission at 1-800-SEC-0330. Copies of the fund’s Form N-Q also may be obtained, upon payment of a duplicating fee, by electronic request at the following e-mail address: publicinfo@sec.gov or by writing the Public Reference Section at the above address.
From time to time, MFS may post important information about the fund or the MFS funds on the MFS web site (mfs.com). This information is available by visiting the “News & Commentary” section of mfs.com or by clicking on the fund’s name under “Variable Insurance Portfolios — VIT II” in the “Products and Performance” section of mfs.com.
FEDERAL TAX INFORMATION (unaudited)
The following information is provided pursuant to provisions of the Internal Revenue Code.
For corporate shareholders, 51.59% of the ordinary income dividends paid during the fiscal year qualify for the corporate dividends received deduction.
38
Table of Contents
rev. 3/11

| Why? | Financial companies choose how they share your personal information. Federal law gives consumers the right to limit some but not all sharing. Federal law also requires us to tell you how we collect, share, and protect your personal information. Please read this notice carefully to understand what we do. |
| What? | The types of personal information we collect and share depend on the product or service you have with us. This information can include:
• Social Security number and account balances • Account transactions and transaction history • Checking account information and wire transfer instructions
When you are no longer our customer, we continue to share your information as described in this notice. |
| How? | All financial companies need to share customers’ personal information to run their everyday business. In the section below, we list the reasons financial companies can share their customers’ personal information; the reasons MFS chooses to share; and whether you can limit this sharing. |
| Reasons we can share your personal information | Does MFS share? | Can you limit this sharing? | ||
For our everyday business purposes – such as to process your transactions, maintain your account(s), respond to court orders and legal investigations, or report to credit bureaus | Yes | No | ||
For our marketing purposes – to offer our products and services to you | No | We don’t share | ||
| For joint marketing with other financial companies | No | We don’t share | ||
For our affiliates’ everyday business purposes – information about your transactions and experiences | No | We don’t share | ||
For our affiliates’ everyday business purposes – information about your creditworthiness | No | We don’t share | ||
| For nonaffiliates to market to you | No | We don’t share |
| Questions? | Call 800-225-2606 or go to mfs.com. |
39
Table of Contents
| Page 2 |
| Who we are | ||
| Who is providing this notice? | MFS Funds, MFS Investment Management, MFS Institutional Advisors, Inc., MFS Fund Distributors, Inc., MFS Heritage Trust Company, and MFS Service Center, Inc. | |
| What we do | ||
| How does MFS protect my personal information? | To protect your personal information from unauthorized access and use, we use security measures that comply with federal law. These measures include procedural, electronic, and physical safeguards for the protection of the personal information we collect about you. | |
| How does MFS collect my personal information? | We collect your personal information, for example, when you
• open an account or provide account information • direct us to buy securities or direct us to sell your securities • make a wire transfer
We also collect your personal information from others, such as credit bureaus, affiliates and other companies. | |
| Why can’t I limit all sharing? | Federal law gives you the right to limit only
• sharing for affiliates’ everyday business purposes – information about your creditworthiness • affiliates from using your information to market to you • sharing for nonaffiliates to market to you
State laws and individual companies may give you additional rights to limit sharing. | |
| Definitions | ||
| Affiliates | Companies related by common ownership or control. They can be financial and nonfinancial companies.
• MFS does not share personal information with affiliates, except for everyday business purposes as described on page one of this notice. | |
| Nonaffiliates | Companies not related by common ownership or control. They can be financial and nonfinancial companies.
• MFS does not share with nonaffiliates so they can market to you. | |
| Joint Marketing | A formal agreement between nonaffiliated financial companies that together market financial products or services to you.
• MFS doesn’t jointly market. | |
| Other important information | ||
| If you own an MFS product or receive an MFS service in the name of a third party such as a bank or broker-dealer, their privacy policy may apply to you instead of ours. | ||
40
Table of Contents

Table of Contents

MFS® Utilities Portfolio
MFS® Variable Insurance Trust II

ANNUAL REPORT
December 31, 2011
UTS-ANN
Table of Contents
MFS® UTILITIES PORTFOLIO
The report is prepared for the general information of contract owners.
It is authorized for distribution to prospective investors only when preceded or accompanied by a current prospectus.
NOT FDIC INSURED Ÿ MAY LOSE VALUE Ÿ NO BANK OR CREDIT UNION GUARANTEE Ÿ NOT A DEPOSIT Ÿ NOT INSURED BY ANY FEDERAL GOVERNMENT AGENCY OR NCUA/NCUSIF
Table of Contents
MFS Utilities Portfolio
LETTER FROM THE CHAIRMAN AND CEO

Dear Contract Owners:
We are indeed living through some volatile times. Economic uncertainty is everywhere, as it seems no place in the world has been unmoved by crisis. We have seen a devastating earthquake and tsunami that have led to disruptions in the Japanese markets
and supply chains. Protests have changed the face of the Middle East and left in their wake lingering tensions and resultant higher oil prices. We have seen debt limits tested in Europe and the United States and policymakers grappling to craft often unpopular monetary and fiscal responses at a time when consumers and businesses struggle with what appears to be a slowing global economy. On top of all of that, we have seen long-term U.S. debt lose its Standard & Poor’s AAA rating and the long-term debt ratings of 15 eurozone nations put on negative watch.
When markets become volatile, managing risk becomes a top priority for investors and their advisors. At MFS® risk management is foremost in our minds in all market climates. Our analysts and portfolio managers keep risks firmly in mind when evaluating securities. Additionally, we have a team of quantitative analysts that measures and assesses the risk profiles of our portfolios and securities on an ongoing basis. The chief investment risk officer, who oversees the team, reports directly to the firm’s president and chief investment officer so the risk associated with each portfolio can be assessed objectively and independently of the portfolio management team.
As always, we continue to be mindful of the many economic challenges faced at the local, national, and international levels. It is in times such as these that we want to remind investors of the merits of maintaining a long-term view, adhering to basic investing principles such as asset allocation and diversification, and working closely with their advisors to research and identify appropriate investment opportunities.
Respectfully,

Robert J. Manning
Chairman and Chief Executive Officer
MFS Investment Management®
February 15, 2012
The opinions expressed in this letter are subject to change, may not be relied upon for investment advice, and no forecasts can be guaranteed.
1
Table of Contents
MFS Utilities Portfolio
Portfolio structure (i)
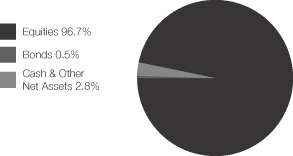
| Top ten holdings (i) | ||||
| El Paso Corp. | 4.4% | |||
| Comcast Corp., “Special A” | 3.7% | |||
| CMS Energy Corp. | 3.0% | |||
| Williams Cos., Inc. | 2.8% | |||
| Public Service Enterprise Group, Inc. | 2.8% | |||
| Virgin Media, Inc. | 2.6% | |||
| AES Corp. | 2.6% | |||
| Edison International | 2.4% | |||
| Energias de Portugal S.A. | 2.2% | |||
| CEZ A.S. | 1.9% |
| Top five industries (i) | ||||
| Utilities – Electric Power | 48.1% | |||
| Cable TV | 10.4% | |||
| Natural Gas – Pipeline | 10.4% | |||
| Telephone Services | 8.7% | |||
| Telecommunications – Wireless | 7.8% | |||
| Issuer country weightings (i)(x) | ||||
| United States | 67.6% | |||
| Brazil | 8.3% | |||
| United Kingdom | 4.1% | |||
| Portugal | 3.3% | |||
| Spain | 2.6% | |||
| Germany | 2.6% | |||
| Czech Republic | 1.9% | |||
| Chile | 1.9% | |||
| Israel | 1.6% | |||
| Other Countries | 6.1% | |||
| (i) | For purposes of this presentation, the components include the market value of securities. The bond component will include any accrued interest amounts. Where the fund holds convertible bonds, these are treated as part of the equity portion of the portfolio. |
| (x) | Represents the portfolio’s exposure to issuer countries as a percentage of a portfolio’s total net assets. |
Percentages are based on net assets as of 12/31/11.
The portfolio is actively managed and current holdings may be different.
2
Table of Contents
MFS Utilities Portfolio
Summary of Results
For the twelve months ended December 31, 2011, Initial Class shares of the MFS Utilities Portfolio (the “fund”) provided a total return of 7.12%, while Service Class shares of the fund provided a total return of 6.84%. These compare with a return of 2.11% for the fund’s benchmark, the Standard & Poor’s 500 Stock Index, and a return of 19.91% for the fund’s other benchmark, the Standard & Poor’s 500 Utilities Index (“S&P Utilities Index”).
Market Environment
Early in the period, the U.S. Federal Reserve (the “Fed”) responded to weak economic growth by loosening monetary policy further. More easing by the Fed improved market sentiment and drove risk-asset prices markedly higher. The December 2010 agreement on a surprisingly large (relative to expectations) expansionary U.S. fiscal package also boosted sentiment. During the subsequent several months, the renewed positive market sentiment, coupled with better indications of global macroeconomic activity, pushed many asset valuations to post-crisis highs. At the same time, the yields of the perceived “safest” global sovereign credits rose, indicating a renewed risk-seeking environment.
However, towards the middle of the period, a weakening macroeconomic backdrop and renewed concerns over peripheral euro zone sovereign debt caused a flight-to-quality move that pushed high-quality sovereign bond yields lower. In the U.S., concerns about sovereign debt default and the long-term sustainability of the trend in U.S. fiscal policy resulted in one agency downgrading U.S. credit quality. Amidst this turmoil, global equity markets declined sharply. As a result of these developments, global consumer and producer sentiment indicators fell precipitously and highly-rated sovereign bond yields hit multi-decade lows. Towards the end of the reporting period, uncertainty in financial markets spiked higher as markets more seriously contemplated the possible failure of the euro zone.
Detractors from Performance
Stock selection in the electric power industry was a primary factor for the fund’s underperformance relative to the S&P Utilities Index. The fund’s holdings of electric utility companies, Fortum Oyj (b) (Finland) and CEZ (b) (Czech Republic), held back relative returns. Shares of Fortum Oyj declined late in the period as the company reported weak earnings driven by high costs in Russia, where production volumes and prices also declined. Additionally, fears over the euro zone sovereign debt crisis, and declining CO2 and Nordic power prices, also held back the stock’s performance. Not holding shares of strong-performing electric power & natural gas distributors, Duke Energy and Dominion Resources, and electric utility company Progress Energy, also dampened relative results.
The fund’s exposure to the wireless communications industry, which is not represented in the benchmark, hampered relative performance. Holdings of weak-performing wireless communications providers, NII Holdings and Cellcom Israel, held back relative returns. NII Holdings faced intense competition in the industry, particularly in Brazil.
The fund’s out-of-benchmark exposure to the telephone services industry also weighed on relative results. There were no individual stocks within this industry that were among the fund’s top relative detractors.
The fund’s exposure to the cable TV industry, which is not represented in the benchmark, was an additional negative factor for relative performance. The fund’s holding of media and communications services company Virgin Media hindered relative returns. The company reported a loss during the period as average revenue per user declined and churn rates increased.
Elsewhere, holdings of oil and natural gas producer QEP Resources, and the timing of the fund’s ownership in shares of strong-performing natural gas distribution company Oneok, were also among the fund’s top relative detractors.
During the reporting period, the fund’s currency exposure, resulting primarily from holdings of foreign currency denominated securities, was a detractor from relative performance. All of MFS’ investment decisions are driven by the fundamentals of each individual opportunity and as such, it is common for our portfolios to have different currency exposure than the benchmark.
Contributors to Performance
The fund’s out-of-benchmark exposure to the natural gas pipeline industry boosted relative performance. Within this industry, holdings of gas pipeline companies, El Paso and Williams Companies, supported relative returns. In October, natural gas pipelines operator Kinder Morgan signed a definitive agreement to purchase El Paso at a substantial premium which helped El Paso’s stock price performance.
Elsewhere, the fund’s holdings of Brazilian cellular telecommunications provider Vivo Participaceos (b)(h), integrated energy company EQT Corporation (b), and natural gas distributor Southern Union (b)(h) bolstered relative performance. Shares of Vivo
3
Table of Contents
MFS Utilities Portfolio
Management Review – continued
Participaceos appreciated as the company was acquired by Brazilian wireless company Telecomunicacoes de Sao Paulo at a premium. The timing of the fund’s ownership in shares of California-based utility company PG&E (h), electric utility companies, Exelon and Edison International, and integrated energy company Entergy (h) also helped relative performance. Shares of PG&E came under pressure as the company trimmed its 2012-2013 profit estimates due to its plans to increase spending on improving its operations and customer service. Additionally, concerns about the potential for dilution in 2014 from penalties in the aftermath of last year’s tragic explosion at one of its pipelines in San Bruno, California, which the company took financial responsibility for, also weighed on the stock. The fund’s underweight position in energy services holding company Sempra Energy, which underperformed the benchmark, was another contributor to relative performance.
Respectfully,
| Robert Persons | Maura Shaughnessy | |
| Portfolio Manager | Portfolio Manager |
| (b) | Security is not a benchmark constituent. |
| (h) | Security was not held in the fund at period end. |
The views expressed in this report are those of the portfolio managers only through the end of the period of the report as stated on the cover and do not necessarily reflect the views of MFS or any other person in the MFS organization. These views are subject to change at any time based on market or other conditions, and MFS disclaims any responsibility to update such views. These views may not be relied upon as investment advice or an indication of trading intent on behalf of any MFS portfolio. References to specific securities are not recommendations of such securities, and may not be representative of any MFS portfolio’s current or future investments.
4
Table of Contents
MFS Utilities Portfolio
PERFORMANCE SUMMARY THROUGH 12/31/11
The following chart illustrates the historical performance of the fund in comparison to its benchmark(s). Benchmarks are unmanaged and may not be invested in directly. Benchmark returns do not reflect any fees or expenses. The performance of other share classes will be greater than or less than that of the class depicted below. (See Notes to Performance Summary.)
Performance data shown represents past performance and is no guarantee of future results. Investment return and principal value fluctuate so your units, when sold, may be worth more or less than the original cost; current performance may be lower or higher than quoted. The performance shown does not reflect the deduction of taxes, if any, that a contract holder would pay on fund distributions or the redemption of contract units. The returns for the fund shown also do not reflect the deduction of expenses associated with variable products, such as mortality and expense risk charges, separate account charges, and sales charges imposed by the insurance company separate accounts. Such expenses would reduce the overall returns shown.
Growth of a Hypothetical $10,000 Investment
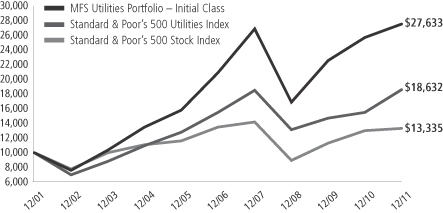
Total Returns through 12/31/11
Average annual total returns
| Share class | Class inception date | 1-yr | 5-yr | 10-yr | ||||||||
| Initial Class | 11/16/93 | 7.12% | 5.66% | 10.70% | ||||||||
| Service Class | 8/24/01 | 6.84% | 5.39% | 10.42% | ||||||||
| Comparative benchmarks | ||||||||||||
| Standard & Poor’s 500 Stock Index (f) | 2.11% | (0.25)% | 2.92% | |||||||||
| Standard & Poor’s 500 Utilities Index (f) | 19.91% | 3.71% | 6.42% | |||||||||
| (f) | Source: FactSet Research Systems Inc. |
Benchmark Definitions
Standard & Poor’s 500 Stock Index – a market capitalization-weighted index of 500 widely held equity securities, designed to measure broad U.S. equity performance.
Standard & Poor’s 500 Utilities Index – a market capitalization-weighted index designed to measure the utilities sector, including those companies considered electric, gas or water utilities, or companies that operate as independent producers and/or distributors of power.
It is not possible to invest directly in an index.
Notes to Performance Summary
Average annual total return represents the average annual change in value for each share class for the periods presented.
Performance results reflect any applicable expense subsidies and waivers in effect during the periods shown. Without such subsidies and waivers the fund’s performance results would be less favorable. Please see the prospectus and financial statements for complete details. All results are historical and assume the reinvestment of any dividends and capital gains distributions.
Performance results do not include adjustments made for financial reporting purposes in accordance with U.S. generally accepted accounting principles and may differ from amounts reported in the financial highlights.
From time to time the fund may receive proceeds from litigation settlements, without which performance would be lower.
5
Table of Contents
MFS Utilities Portfolio
Fund Expenses Borne by the Contract Holders During the Period,
July 1, 2011 through December 31, 2011
As a contract holder of the fund, you incur ongoing costs, including management fees; distribution and/or service (12b-1) fees; and other fund expenses. This example is intended to help you understand your ongoing costs (in dollars) of investing in the fund and to compare these costs with the ongoing costs of investing in other mutual funds.
The example is based on an investment of $1,000 invested at the beginning of the period and held for the entire period July 1, 2011 through December 31, 2011.
Actual Expenses
The first line for each share class in the following table provides information about actual account values and actual expenses. You may use the information in this line, together with the amount you invested, to estimate the expenses that you paid over the period. Simply divide your account value by $1,000 (for example, an $8,600 account value divided by $1,000 = 8.6), then multiply the result by the number in the first line under the heading entitled “Expenses Paid During Period” to estimate the expenses you paid on your account during this period.
Hypothetical Example for Comparison Purposes
The second line for each share class in the following table provides information about hypothetical account values and hypothetical expenses based on the fund’s actual expense ratio and an assumed rate of return of 5% per year before expenses, which is not the fund’s actual return. The hypothetical account values and expenses may not be used to estimate the actual ending account balance or expenses you paid for the period. You may use this information to compare the ongoing costs of investing in the fund and other funds. To do so, compare this 5% hypothetical example with the 5% hypothetical examples that appear in the shareholder reports of the other funds.
Please note that the expenses shown in the table are meant to highlight the fund’s ongoing costs only and do not take into account the fees and expenses imposed under the variable contracts through which your investment in the fund is made. Therefore, the second line for each share class in the table is useful in comparing ongoing costs associated with an investment in vehicles (such as the fund) which fund benefits under variable annuity and variable life insurance contracts and to qualified pension and retirement plans only, and will not help you determine the relative total costs of investing in the fund through variable annuity and variable life insurance contracts. If the fees and expenses imposed under the variable contracts were included, your costs would have been higher.
| Share Class | Annualized Expense Ratio | Beginning Account Value 7/01/11 | Ending Account Value 12/31/11 | Expenses Paid During Period (p) 7/01/11-12/31/11 | ||||||||||||||
| Initial Class | Actual | 0.88% | $1,000.00 | $964.27 | $4.36 | |||||||||||||
| Hypothetical (h) | 0.88% | $1,000.00 | $1,020.77 | $4.48 | ||||||||||||||
| Service Class | Actual | 1.13% | $1,000.00 | $963.16 | $5.59 | |||||||||||||
| Hypothetical (h) | 1.13% | $1,000.00 | $1,019.51 | $5.75 | ||||||||||||||
| (h) | 5% class return per year before expenses. |
| (p) | Expenses paid is equal to each class’ annualized expense ratio, as shown above, multiplied by the average account value over the period, multiplied by the number of days in the period, divided by the number of days in the year. |
6
Table of Contents
MFS Utilities Portfolio
PORTFOLIO OF INVESTMENTS – 12/31/11
The Portfolio of Investments is a complete list of all securities owned by your fund. It is categorized by broad-based asset classes.
| Issuer | Shares/Par | Value ($) | ||||||
| COMMON STOCKS – 91.8% | ||||||||
| Broadcasting – 0.6% | ||||||||
| Viacom, Inc., “B” | 39,420 | $ | 1,790,062 | |||||
|
| |||||||
| Cable TV – 9.7% | ||||||||
| Comcast Corp., “Special A” | 484,050 | $ | 11,404,213 | |||||
| Liberty Global, Inc., “A” (a) | 61,580 | 2,526,627 | ||||||
| Telenet Group Holding N.V. | 87,128 | 3,319,597 | ||||||
| Time Warner Cable, Inc. | 73,069 | 4,644,996 | ||||||
| Virgin Media, Inc. | 372,120 | 7,955,926 | ||||||
|
| |||||||
| $ | 29,851,359 | |||||||
|
| |||||||
| Energy – Independent – 5.2% | ||||||||
| Arch Coal, Inc. | 94,160 | $ | 1,366,262 | |||||
| Energen Corp. | 29,740 | 1,487,000 | ||||||
| EQT Corp. | 88,760 | 4,863,160 | ||||||
| Occidental Petroleum Corp. | 18,220 | 1,707,214 | ||||||
| QEP Resources, Inc. | 146,700 | 4,298,310 | ||||||
| Ultra Petroleum Corp. (a) | 39,610 | 1,173,644 | ||||||
| Williams Partners LP | 22,230 | 1,333,578 | ||||||
|
| |||||||
| $ | 16,229,168 | |||||||
|
| |||||||
| Natural Gas – Distribution – 5.5% | ||||||||
| AGL Resources, Inc. | 39,760 | $ | 1,680,258 | |||||
| GDF SUEZ | 99,151 | 2,696,628 | ||||||
| National Fuel Gas Co. | 13,800 | 767,004 | ||||||
| ONEOK, Inc. | 8,860 | 768,073 | ||||||
| Sempra Energy | 97,740 | 5,375,700 | ||||||
| Spectra Energy Corp. | 128,820 | 3,961,215 | ||||||
| UGI Corp. | 54,610 | 1,605,534 | ||||||
|
| |||||||
| $ | 16,854,412 | |||||||
|
| |||||||
| Natural Gas – Pipeline – 10.4% | ||||||||
| El Paso Corp. | 512,926 | $ | 13,628,444 | |||||
| Enagas S.A. | 225,468 | 4,156,513 | ||||||
| Kinder Morgan, Inc. (l) | 124,810 | 4,015,138 | ||||||
| Williams Cos., Inc. (a) | 317,297 | 8,570,192 | ||||||
| WPX Energy, Inc. (a) | 93,874 | 1,705,691 | ||||||
|
| |||||||
| $ | 32,075,978 | |||||||
|
| |||||||
| Oil Services – 0.5% | ||||||||
| Transocean, Inc. | 43,400 | $ | 1,666,126 | |||||
|
| |||||||
| Telecommunications – Wireless – 7.3% | ||||||||
| Cellcom Israel Ltd. | 166,922 | $ | 2,820,982 | |||||
| Mobile TeleSystems OJSC, ADR | 152,180 | 2,234,002 | ||||||
| MTN Group Ltd. | 91,791 | 1,630,272 | ||||||
| NII Holdings, Inc. (a) | 158,670 | 3,379,671 | ||||||
| SBA Communications Corp. (a) | 71,740 | 3,081,950 | ||||||
| Tim Participacoes S.A., ADR | 216,507 | 5,585,881 | ||||||
| Vodafone Group PLC | 1,341,357 | 3,726,715 | ||||||
|
| |||||||
| $ | 22,459,473 | |||||||
|
| |||||||
| Telephone Services – 8.7% | ||||||||
| American Tower Corp., “A” (a) | 53,240 | $ | 3,194,932 | |||||
| Bezeq – The Israel Telecommunication Corp. Ltd. | 1,192,820 | 2,185,324 | ||||||
| Issuer | Shares/Par | Value ($) | ||||||
| COMMON STOCKS – continued | ||||||||
| Telephone Services – continued | ||||||||
| CenturyLink, Inc. | 83,125 | $ | 3,092,250 | |||||
| Crown Castle International Corp. (a) | 62,550 | 2,802,240 | ||||||
| Deutsche Telekom AG | 141,620 | 1,624,881 | ||||||
| Frontier Communications Corp. | 88,620 | 456,393 | ||||||
| Kabel Deutschland Holding AG (a) | 62,685 | 3,172,179 | ||||||
| Portugal Telecom, SGPS, S.A. | 155,016 | 892,801 | ||||||
| PT XL Axiata Tbk | 3,210,500 | 1,602,152 | ||||||
| Telecom Italia S.p.A. | 2,809,961 | 2,507,445 | ||||||
| Telefonica Brasil S.A., ADR | 196,276 | 5,364,223 | ||||||
|
| |||||||
| $ | 26,894,820 | |||||||
|
| |||||||
| Utilities – Electric Power – 43.9% | ||||||||
| AES Corp. (a) | 669,740 | $ | 7,929,722 | |||||
| AES Tiete S.A., IPS | 89,254 | 1,286,234 | ||||||
| Aguas Andinas S.A. | 4,578,165 | 2,626,166 | ||||||
| American Electric Power Co., Inc. | 144,540 | 5,970,947 | ||||||
| Calpine Corp. (a) | 343,030 | 5,601,680 | ||||||
| CenterPoint Energy, Inc. | 159,450 | 3,203,351 | ||||||
| CEZ A.S. | 151,395 | 6,023,125 | ||||||
| China Hydroelectric Corp., ADR (a) | 85,650 | 97,641 | ||||||
| CMS Energy Corp. | 421,970 | 9,317,098 | ||||||
| Companhia de Saneamento Basico do Estado de Sao Paulo (a) | 6,500 | 181,314 | ||||||
| Companhia de Saneamento de Minas Gerais – Copasa MG | 140,400 | 2,514,065 | ||||||
| Companhia Energetica de Minas Gerais, IPS | 6,300 | 112,372 | ||||||
| Companhia Paranaense de Energia, ADR | 62,100 | 1,302,858 | ||||||
| Companhia Paranaense de Energia, IPS | 53,800 | 1,122,005 | ||||||
| Constellation Energy Group, Inc. | 93,770 | 3,719,856 | ||||||
| E-CL S.A. | 500,130 | 1,331,434 | ||||||
| E.ON AG | 72,887 | 1,566,794 | ||||||
| Edison International | 181,890 | 7,530,246 | ||||||
| EDP Renovaveis S.A. (a) | 461,808 | 2,819,367 | ||||||
| Eletropaulo Metropolitana S.A., IPS | 15,940 | 311,921 | ||||||
| ENEL OGK-5 OAO (a) | 5,282,896 | 290,559 | ||||||
| Energias de Portugal S.A. | 2,155,135 | 6,669,179 | ||||||
| Energias do Brasil S.A. | 106,200 | 2,362,847 | ||||||
| Enersis S.A., ADR | 107,420 | 1,893,815 | ||||||
| Exelon Corp. | 34,010 | 1,475,014 | ||||||
| FirstEnergy Corp. | 61,290 | 2,715,147 | ||||||
| Fortum Corp. | 145,477 | 3,095,148 | ||||||
| GenOn Energy, Inc. (a) | 1,195,460 | 3,120,151 | ||||||
| International Power PLC | 761,925 | 3,989,985 | ||||||
| ITC Holdings Corp. | 6,160 | 467,421 | ||||||
| Light S.A. | 161,810 | 2,498,393 | ||||||
| National Grid PLC | 323,151 | 3,136,584 | ||||||
| NextEra Energy, Inc. | 91,130 | 5,547,994 | ||||||
| Northeast Utilities | 55,280 | 1,993,950 | ||||||
| NRG Energy, Inc. (a) | 208,706 | 3,781,753 | ||||||
| NV Energy, Inc. | 124,360 | 2,033,286 | ||||||
| OGE Energy Corp. | 70,370 | 3,990,683 | ||||||
| OGK-4 OAO (a) | 4,891,569 | 322,844 | ||||||
| PPL Corp. | 82,610 | 2,430,386 | ||||||
7
Table of Contents
MFS Utilities Portfolio
Portfolio of Investments – continued
| Issuer | Shares/Par | Value ($) | ||||||
| COMMON STOCKS – continued | ||||||||
| Utilities – Electric Power – continued | ||||||||
| Public Service Enterprise Group, Inc. | 257,760 | $ | 8,508,658 | |||||
| Red Electrica de Espana | 89,003 | 3,797,627 | ||||||
| RWE AG | 45,220 | 1,584,165 | ||||||
| SSE PLC | 84,338 | 1,690,912 | ||||||
| TGK International GmbH | 1,035,209,542 | 300,211 | ||||||
| Tractebel Energia S.A. | 180,500 | 2,899,225 | ||||||
| Verbund AG | 23,960 | 642,997 | ||||||
|
| |||||||
| $ | 135,807,130 | |||||||
|
| |||||||
| Total Common Stocks (Identified Cost, $279,182,147) | $ | 283,628,528 | ||||||
|
| |||||||
| BONDS – 0.5% | ||||||||
| Asset-Backed & Securitized – 0.0% | ||||||||
| Falcon Franchise Loan LLC, FRN, 4.696%, 2023 (i)(z) | $ | 238,016 | $ | 14,305 | ||||
|
| |||||||
| Utilities – Electric Power – 0.5% | ||||||||
| GenOn Energy, Inc., 9.875%, 2020 | $ | 1,615,000 | $ | 1,639,225 | ||||
|
| |||||||
| Total Bonds (Identified Cost, $1,625,378) | $ | 1,653,530 | ||||||
|
| |||||||
| CONVERTIBLE PREFERRED STOCKS – 3.6% | ||||||||
| Utilities – Electric Power – 3.6% | ||||||||
| Great Plains Energy, Inc., 12% | 32,340 | $ | 2,149,963 | |||||
| NextEra Energy, Inc., 7% | 54,060 | 2,881,398 | ||||||
| PPL Corp., 9.5% | 54,430 | 3,038,827 | ||||||
| PPL Corp., 8.75% | 54,960 | 3,050,280 | ||||||
|
| |||||||
| Total Convertible Preferred Stocks (Identified Cost, $10,532,323) | $ | 11,120,468 | ||||||
|
| |||||||
| Issuer | Shares/Par | Value ($) | ||||||
| CONVERTIBLE BONDS – 1.3% | ||||||||
| Cable TV – 0.7% | ||||||||
| Virgin Media, Inc., 6.5%, 2016 | $ | 1,637,000 | $ | 2,265,199 | ||||
|
| |||||||
| Telecommunications – Wireless – 0.6% | ||||||||
| SBA Communications Corp., 4%, 2014 | $ | 1,084,000 | $ | 1,647,680 | ||||
|
| |||||||
| Total Convertible Bonds (Identified Cost, $3,401,020) | $ | 3,912,879 | ||||||
|
| |||||||
| MONEY MARKET FUNDS – 2.0% | ||||||||
| MFS Institutional Money Market Portfolio, 0.05%, at Cost and Net Asset Value (v) | 6,151,225 | $ | 6,151,225 | |||||
|
| |||||||
| COLLATERAL FOR SECURITIES LOANED – 1.0% | ||||||||
| Navigator Securities Lending Prime Portfolio, 0.27%, at Cost and Net Asset Value (j) | 3,087,583 | $ | 3,087,583 | |||||
|
| |||||||
| Total Investments (Identified Cost, $303,979,676) | $ | 309,554,213 | ||||||
|
| |||||||
| OTHER ASSETS, LESS LIABILITIES – (0.2)% | (576,618 | ) | ||||||
|
| |||||||
| Net Assets – 100.0% | $ | 308,977,595 | ||||||
|
| |||||||
| (a) | Non-income producing security. |
| (i) | Interest only security for which the series receives interest on notional principal (Par amount). Par amount shown is the notional principal and does not reflect the cost of the security. |
| (j) | The rate quoted is the annualized seven-day yield of the fund at period end. |
| (l) | A portion of this security is on loan. |
| (v) | Underlying affiliated fund that is available only to investment companies managed by MFS. The rate quoted for the MFS Institutional Money Market Portfolio is the annualized seven-day yield of the fund at period end. |
| (z) | Restricted securities are not registered under the Securities Act of 1933 and are subject to legal restrictions on resale. These securities generally may be resold in transactions exempt from registration or to the public if the securities are subsequently registered. Disposal of these securities may involve time-consuming negotiations and prompt sale at an acceptable price may be difficult. The fund holds the following restricted securities: |
| Restricted Securities | Acquisition Date | Cost | Value | |||||||
| Falcon Franchise Loan LLC, FRN, 4.696%, 2023 | 1/18/02 | $13,569 | $14,305 | |||||||
| % of Net assets | 0.0% | |||||||||
The following abbreviations are used in this report and are defined:
| ADR | American Depository Receipt |
| FRN | Floating Rate Note. Interest rate resets periodically and may not be the rate reported at period end. |
| IPS | International Preference Stock |
| PLC | Public Limited Company |
Abbreviations indicate amounts shown in currencies other than the U.S. dollar. All amounts are stated in U.S. dollars unless otherwise indicated. A list of abbreviations is shown below:
| BRL | Brazilian Real |
| EUR | Euro |
| GBP | British Pound |
8
Table of Contents
MFS Utilities Portfolio
Portfolio of Investments – continued
Derivative Contracts at 12/31/11
Forward Foreign Currency Exchange Contracts at 12/31/11
| Type | Currency | Counterparty | Contracts to Deliver/Receive | Settlement Date Range | In Exchange For | Contracts at Value | Net Unrealized Appreciation (Depreciation) | |||||||||||||||||
| Asset Derivatives | ||||||||||||||||||||||||
| SELL | BRL | Barclays Bank PLC | 2,433,000 | 2/02/12 | $ | 1,392,746 | $ | 1,295,532 | $ | 97,214 | ||||||||||||||
| SELL | BRL | HSBC Bank | 7,453,678 | 2/02/12 | 4,286,187 | 3,968,961 | 317,226 | |||||||||||||||||
| SELL | BRL | JPMorgan Chase Bank N.A. | 350,000 | 2/02/12 | 196,906 | 186,369 | 10,537 | |||||||||||||||||
| BUY | EUR | Deutsche Bank AG | 7,638 | 1/12/12 | 9,884 | 9,887 | 3 | |||||||||||||||||
| SELL | EUR | Barclays Bank PLC | 397,516 | 1/12/12 | 536,291 | 514,510 | 21,781 | |||||||||||||||||
| SELL | EUR | Citibank N.A. | 171,365 | 1/12/12 | 234,216 | 221,800 | 12,416 | |||||||||||||||||
| SELL | EUR | Credit Suisse Group | 781,401 | 1/12/12 | 1,054,958 | 1,011,377 | 43,581 | |||||||||||||||||
| SELL | EUR | Deutsche Bank AG | 625,703 | 1/12/12 | 834,731 | 809,855 | 24,876 | |||||||||||||||||
| SELL | EUR | Goldman Sachs International | 103,258 | 1/12/12 | 139,899 | 133,648 | 6,251 | |||||||||||||||||
| SELL | EUR | HSBC Bank | 328,932 | 1/12/12 | 438,236 | 425,741 | 12,495 | |||||||||||||||||
| SELL | EUR | JPMorgan Chase Bank N.A. | 407,070 | 1/12/12 | 548,703 | 526,876 | 21,827 | |||||||||||||||||
| SELL | EUR | Merrill Lynch International Bank | 980,797 | 1/12/12 | 1,309,799 | 1,269,458 | 40,341 | |||||||||||||||||
| SELL | EUR | Royal Bank of Scotland Group PLC | 22,704 | 1/12/12 | 30,704 | 29,385 | 1,319 | |||||||||||||||||
| SELL | EUR | UBS AG | 15,582,147 | 1/12/12-3/15/12 | 20,838,810 | 20,179,283 | 659,527 | |||||||||||||||||
| BUY | GBP | Credit Suisse Group | 74,248 | 1/12/12 | 114,212 | 115,299 | 1,087 | |||||||||||||||||
| SELL | GBP | Barclays Bank PLC | 375,284 | 1/12/12 | 593,035 | 582,776 | 10,259 | |||||||||||||||||
| SELL | GBP | Credit Suisse Group | 5,717 | 1/12/12 | 9,081 | 8,877 | 204 | |||||||||||||||||
|
| |||||||||||||||||||||||
| $ | 1,280,944 | |||||||||||||||||||||||
|
| |||||||||||||||||||||||
| Liability Derivatives | ||||||||||||||||||||||||
| BUY | EUR | Barclays Bank PLC | 128,867 | 1/12/12 | $ | 182,954 | $ | 166,794 | $ | (16,160 | ) | |||||||||||||
| BUY | EUR | Citibank N.A. | 37,227 | 1/12/12 | 51,795 | 48,184 | (3,611 | ) | ||||||||||||||||
| BUY | EUR | Deutsche Bank AG | 27,179 | 1/12/12 | 35,237 | 35,178 | (59 | ) | ||||||||||||||||
| BUY | EUR | Merrill Lynch International Bank | 25,799 | 1/12/12 | 33,725 | 33,392 | (333 | ) | ||||||||||||||||
| BUY | EUR | UBS AG | 180,205 | 1/12/12 | 248,802 | 233,242 | (15,560 | ) | ||||||||||||||||
| SELL | EUR | Barclays Bank PLC | 17,693 | 1/12/12 | 22,893 | 22,900 | (7 | ) | ||||||||||||||||
| SELL | EUR | Deutsche Bank AG | 32,886 | 1/12/12 | 42,557 | 42,565 | (8 | ) | ||||||||||||||||
| BUY | GBP | Barclays Bank PLC | 283,095 | 1/12/12 | 446,487 | 439,616 | (6,871 | ) | ||||||||||||||||
| BUY | GBP | Credit Suisse Group | 43 | 1/12/12 | 68 | 68 | 0 | |||||||||||||||||
| BUY | GBP | Deutsche Bank AG | 53,510 | 1/12/12 | 83,582 | 83,095 | (487 | ) | ||||||||||||||||
| BUY | GBP | JPMorgan Chase Bank N.A. | 6,458 | 1/12/12 | 10,074 | 10,029 | (45 | ) | ||||||||||||||||
| BUY | GBP | Morgan Stanley Capital Services, Inc. | 27,444 | 1/12/12 | 42,632 | 42,618 | (14 | ) | ||||||||||||||||
| SELL | GBP | Barclays Bank PLC | 4,458,703 | 1/12/12 | 6,853,211 | 6,923,890 | (70,679 | ) | ||||||||||||||||
| SELL | GBP | Credit Suisse Group | 39,673 | 1/12/12 | 61,456 | 61,607 | (151 | ) | ||||||||||||||||
| SELL | GBP | Deutsche Bank AG | 4,449,744 | 1/12/12 | 6,840,169 | 6,909,978 | (69,809 | ) | ||||||||||||||||
| SELL | GBP | Merrill Lynch International Bank | 33,543 | 1/12/12 | 51,902 | 52,088 | (186 | ) | ||||||||||||||||
|
| |||||||||||||||||||||||
| $ | (183,980 | ) | ||||||||||||||||||||||
|
| |||||||||||||||||||||||
At December 31, 2011, the fund had sufficient cash and/or securities to cover any commitments under these derivative contracts.
See Notes to Financial Statements
9
Table of Contents
MFS Utilities Portfolio
FINANCIAL STATEMENTS | STATEMENT OF ASSETS AND LIABILITIES
This statement represents your fund’s balance sheet, which details the assets and liabilities comprising the total value of the fund.
At 12/31/11 | ||||||||
Assets | ||||||||
Investments – | ||||||||
Non-affiliated issuers, at value (identified cost, $297,828,451) | $303,402,988 | |||||||
Underlying affiliated funds, at cost and value | 6,151,225 | |||||||
Total investments, at value, including $3,079,924 of securities on loan (identified cost, $303,979,676) | $309,554,213 | |||||||
Foreign currency, at value (identified cost, $145,721) | 144,998 | |||||||
Receivables for | ||||||||
Forward foreign currency exchange contracts | 1,280,944 | |||||||
Investments sold | 3,547,211 | |||||||
Fund shares sold | 92,084 | |||||||
Interest and dividends | 829,363 | |||||||
Other assets | 8,982 | |||||||
Total assets | $315,457,795 | |||||||
Liabilities | ||||||||
Payables for | ||||||||
Forward foreign currency exchange contracts | $183,980 | |||||||
Investments purchased | 3,005,832 | |||||||
Fund shares reacquired | 94,322 | |||||||
Collateral for securities loaned, at value | 3,087,583 | |||||||
Payable to affiliates | ||||||||
Investment adviser | 19,788 | |||||||
Distribution and/or service fees | 2,663 | |||||||
Payable for Trustees’ compensation | 475 | |||||||
Accrued expenses and other liabilities | 85,557 | |||||||
Total liabilities | $6,480,200 | |||||||
Net assets | $308,977,595 | |||||||
Net assets consist of | ||||||||
Paid-in capital | $296,970,021 | |||||||
Unrealized appreciation (depreciation) on investments and translation of assets and liabilities in foreign currencies | 6,663,055 | |||||||
Accumulated net realized gain (loss) on investments and foreign currency transactions | (7,333,287 | ) | ||||||
Undistributed net investment income | 12,677,806 | |||||||
Net assets | $308,977,595 | |||||||
Shares of beneficial interest outstanding | 13,893,862 |
| Net assets | Shares outstanding | Net asset value per share | ||||||||||
Initial Class | $178,972,695 | 8,012,449 | $22.34 | |||||||||
Service Class | 130,004,900 | 5,881,413 | 22.10 | |||||||||
See Notes to Financial Statements
10
Table of Contents
MFS Utilities Portfolio
FINANCIAL STATEMENTS | STATEMENT OF OPERATIONS
This statement describes how much your fund earned in investment income and accrued in expenses. It also describes any gains and/or losses generated by fund operations.
| Year ended 12/31/11 | ||||||||
| Net investment income | ||||||||
Income | ||||||||
Dividends | $15,142,091 | |||||||
Interest | 190,466 | |||||||
Dividends from underlying affiliated funds | 3,200 | |||||||
Foreign taxes withheld | (872,689 | ) | ||||||
Total investment income | $14,463,068 | |||||||
Expenses | ||||||||
Management fee | $2,367,555 | |||||||
Distribution and/or service fees | 321,652 | |||||||
Administrative services fee | 105,820 | |||||||
Trustees’ compensation | 36,270 | |||||||
Custodian fee | 132,786 | |||||||
Shareholder communications | 15,630 | |||||||
Auditing fees | 47,080 | |||||||
Legal fees | 5,488 | |||||||
Miscellaneous | 39,998 | |||||||
Total expenses | $3,072,279 | |||||||
Fees paid indirectly | (93 | ) | ||||||
Net expenses | $3,072,186 | |||||||
Net investment income | $11,390,882 | |||||||
Realized and unrealized gain (loss) on investments and foreign currency transactions | ||||||||
Realized gain (loss) (identified cost basis) | ||||||||
Investment transactions | $24,528,729 | |||||||
Foreign currency transactions | 1,266,989 | |||||||
Net realized gain (loss) on investments and foreign currency transactions | $25,795,718 | |||||||
Change in unrealized appreciation (depreciation) | ||||||||
Investments | $(16,925,418 | ) | ||||||
Translation of assets and liabilities in foreign currencies | 1,033,180 | |||||||
Net unrealized gain (loss) on investments and foreign currency translation | $(15,892,238 | ) | ||||||
Net realized and unrealized gain (loss) on investments and foreign currency | $9,903,480 | |||||||
Change in net assets from operations | $21,294,362 |
See Notes to Financial Statements
11
Table of Contents
MFS Utilities Portfolio
FINANCIAL STATEMENTS | STATEMENTS OF CHANGES IN NET ASSETS
These statements describe the increases and/or decreases in net assets resulting from operations, any distributions, and any shareholder transactions.
For years ended 12/31 | 2011 | 2010 | ||||||
Change in net assets | ||||||||
From operations | ||||||||
Net investment income | $11,390,882 | $10,151,534 | ||||||
Net realized gain (loss) on investments and foreign currency transactions | 25,795,718 | 14,839,074 | ||||||
Net unrealized gain (loss) on investments and foreign currency translation | (15,892,238 | ) | 13,978,246 | |||||
Change in net assets from operations | $21,294,362 | $38,968,854 | ||||||
Distributions declared to shareholders | ||||||||
From net investment income | $(10,670,058 | ) | $(9,661,054 | ) | ||||
Change in net assets from fund share transactions | $(18,328,446 | ) | $(27,695,612 | ) | ||||
Total change in net assets | $(7,704,142 | ) | $1,612,188 | |||||
Net assets | ||||||||
At beginning of period | 316,681,737 | 315,069,549 | ||||||
At end of period (including undistributed net investment income of $12,677,806 and | $308,977,595 | $316,681,737 |
See Notes to Financial Statements
12
Table of Contents
MFS Utilities Portfolio
FINANCIAL STATEMENTS | FINANCIAL HIGHLIGHTS
The financial highlights table is intended to help you understand the fund’s financial performance for the past 5 years. Certain information reflects financial results for a single fund share. The total returns in the table represent the rate by which an investor would have earned (or lost) on an investment in the fund share class (assuming reinvestment of all distributions) held for the entire period.
| Initial Class | Years ended 12/31 | |||||||||||||||||||
| 2011 | 2010 | 2009 | 2008 | 2007 | ||||||||||||||||
Net asset value, beginning of period | $21.64 | $19.61 | $15.56 | $29.51 | $23.25 | |||||||||||||||
| Income (loss) from investment operations | ||||||||||||||||||||
Net investment income (d) | $0.83 | $0.67 | $0.69 | $0.62 | $0.58 | |||||||||||||||
Net realized and unrealized gain (loss) on investments | 0.67 | 1.98 | 4.21 | (9.78 | ) | 6.02 | ||||||||||||||
Total from investment operations | $1.50 | $2.65 | $4.90 | $(9.16 | ) | $6.60 | ||||||||||||||
| Less distributions declared to shareholders | ||||||||||||||||||||
From net investment income | $(0.80 | ) | $(0.62 | ) | $(0.85 | ) | $(0.47 | ) | $(0.34 | ) | ||||||||||
From net realized gain on investments | — | — | — | (4.32 | ) | — | ||||||||||||||
Total distributions declared to shareholders | $(0.80 | ) | $(0.62 | ) | $(0.85 | ) | $(4.79 | ) | $(0.34 | ) | ||||||||||
Net asset value, end of period (x) | $22.34 | $21.64 | $19.61 | $15.56 | $29.51 | |||||||||||||||
Total return (%) (k)(s)(x) | 7.12 | 13.90 | 33.63 | (37.16 | ) | 28.53 | ||||||||||||||
| Ratios (%) (to average net assets) and Supplemental data: | ||||||||||||||||||||
Expenses (f) | 0.87 | 0.88 | 0.88 | 0.86 | 0.84 | |||||||||||||||
Net investment income | 3.69 | 3.43 | 4.14 | 2.73 | 2.18 | |||||||||||||||
Portfolio turnover | 52 | 55 | 70 | 63 | 90 | |||||||||||||||
Net assets at end of period (000 omitted) | $178,973 | $191,566 | $199,634 | $178,805 | $381,498 | |||||||||||||||
| Service Class | Years ended 12/31 | |||||||||||||||||||
| 2011 | 2010 | 2009 | 2008 | 2007 | ||||||||||||||||
Net asset value, beginning of period | $21.42 | $19.43 | $15.41 | $29.28 | $23.09 | |||||||||||||||
| Income (loss) from investment operations | ||||||||||||||||||||
Net investment income (d) | $0.77 | $0.62 | $0.63 | $0.57 | $0.52 | |||||||||||||||
Net realized and unrealized gain (loss) on investments | 0.66 | 1.96 | 4.18 | (9.71 | ) | 5.97 | ||||||||||||||
Total from investment operations | $1.43 | $2.58 | $4.81 | $(9.14 | ) | $6.49 | ||||||||||||||
| Less distributions declared to shareholders | ||||||||||||||||||||
From net investment income | $(0.75 | ) | $(0.59 | ) | $(0.79 | ) | $(0.41 | ) | $(0.30 | ) | ||||||||||
From net realized gain on investments | — | — | — | (4.32 | ) | — | ||||||||||||||
Total distributions declared to shareholders | $(0.75 | ) | $(0.59 | ) | $(0.79 | ) | $(4.73 | ) | $(0.30 | ) | ||||||||||
Net asset value, end of period (x) | $22.10 | $21.42 | $19.43 | $15.41 | $29.28 | |||||||||||||||
Total return (%) (k)(s)(x) | 6.84 | 13.60 | 33.27 | (37.31 | ) | 28.24 | ||||||||||||||
| Ratios (%) (to average net assets) and Supplemental data: | ||||||||||||||||||||
Expenses (f) | 1.12 | 1.13 | 1.13 | 1.12 | 1.08 | |||||||||||||||
Net investment income | 3.43 | 3.20 | 3.81 | 2.57 | 1.93 | |||||||||||||||
Portfolio turnover | 52 | 55 | 70 | 63 | 90 | |||||||||||||||
Net assets at end of period (000 omitted) | $130,005 | $125,116 | $115,435 | $83,248 | $126,288 | |||||||||||||||
| (d) | Per share data is based on average shares outstanding. |
| (f) | Ratios do not reflect reductions from fees paid indirectly, if applicable. |
| (k) | The total return does not reflect expenses that apply to separate accounts. Inclusion of these charges would reduce the total return figures for all periods shown. |
| (s) | From time to time the fund may receive proceeds from litigation settlements, without which performance would be lower. Excluding the effect of the proceeds received from a non-recurring litigation settlement against Enron Corp., the Initial Class and Service Class total returns for the year ended December 31, 2008 would have been lower by approximately 1.01%. |
| (x) | The net asset values per share and total returns have been calculated on net assets which include adjustments made in accordance with U.S. generally accepted accounting principles required at period end for financial reporting purposes. |
See Notes to Financial Statements
13
Table of Contents
MFS Utilities Portfolio
| (1) | Business and Organization |
MFS Utilities Portfolio (the fund) is a series of MFS Variable Insurance Trust II (the trust). The trust is organized as a Massachusetts business trust and is registered under the Investment Company Act of 1940, as amended, as an open-end management investment company. The shareholders of each series of the trust are separate accounts of insurance companies, which offer variable annuity and/or life insurance products, and qualified retirement and pension plans.
| (2) | Significant Accounting Policies |
General – The preparation of financial statements in conformity with U.S. generally accepted accounting principles requires management to make estimates and assumptions that affect the reported amounts of assets and liabilities, and disclosure of contingent assets and liabilities at the date of the financial statements and the reported amounts of revenues and expenses during the reporting period. Actual results could differ from those estimates. In the preparation of these financial statements, management has evaluated subsequent events occurring after the date of the fund’s Statement of Assets and Liabilities through the date that the financial statements were issued. The fund invests primarily in securities of issuers in the utility industry. Issuers in a single industry can react similarly to market, economic, political and regulatory conditions and developments. The fund invests in foreign securities, including securities of emerging market issuers. Investments in foreign securities are vulnerable to the effects of changes in the relative values of the local currency and the U.S. dollar and to the effects of changes in each country’s legal, political, and economic environment. The markets of emerging markets countries are generally more volatile than the markets of developed countries with more mature economies. All of the risks of investing in foreign securities previously described are heightened when investing in emerging markets countries.
In December 2011, the Financial Accounting Standards Board issued Accounting Standards Update 2011-11, Balance Sheet (Topic 210) – Disclosures about Offsetting Assets and Liabilities (“ASU 2011-11”). Effective for annual reporting periods beginning on or after January 1, 2013 and interim periods within those annual periods, ASU 2011-11 is intended to enhance disclosure requirements on the offsetting of financial assets and liabilities. Although still evaluating the potential impacts of ASU 2011-11 to the fund, management expects that the impact of the fund’s adoption will be limited to additional financial statement disclosures.
Investment Valuations – Equity securities, including restricted equity securities, are generally valued at the last sale or official closing price as provided by a third-party pricing service on the market or exchange on which they are primarily traded. Equity securities, for which there were no sales reported that day, are generally valued at the last quoted daily bid quotation as provided by a third-party pricing service on the market or exchange on which such securities are primarily traded. Equity securities held short, for which there were no sales reported for that day, are generally valued at the last quoted daily ask quotation as provided by a third-party pricing service on the market or exchange on which such securities are primarily traded. Debt instruments and floating rate loans (other than short-term instruments), including restricted debt instruments, are generally valued at an evaluated or composite bid as provided by a third-party pricing service. Short-term instruments with a maturity at issuance of 60 days or less generally are valued at amortized cost, which approximates market value. Forward foreign currency exchange contracts are generally valued at the mean of bid and asked prices for the time period interpolated from rates provided by a third-party pricing service for proximate time periods. Open-end investment companies are generally valued at net asset value per share. Securities and other assets generally valued on the basis of information from a third-party pricing service may also be valued at a broker/dealer bid quotation. Values obtained from third-party pricing services can utilize both transaction data and market information such as yield, quality, coupon rate, maturity, type of issue, trading characteristics, and other market data. The values of foreign securities and other assets and liabilities expressed in foreign currencies are converted to U.S. dollars using the mean of bid and asked prices for rates provided by a third-party pricing service.
The Board of Trustees has delegated primary responsibility for determining or causing to be determined the value of the fund’s investments (including any fair valuation) to the adviser pursuant to valuation policies and procedures approved by the Board. If the adviser determines that reliable market quotations are not readily available, investments are valued at fair value as determined in good faith by the adviser in accordance with such procedures under the oversight of the Board of Trustees. Under the fund’s valuation policies and procedures, market quotations are not considered to be readily available for most types of debt instruments and floating rate loans and many types of derivatives. These investments are generally valued at fair value based on information from third-party pricing services. In addition, investments may be valued at fair value if the adviser determines that an investment’s value has been materially affected by events occurring after the close of the exchange or market on which the investment is principally traded (such as foreign exchange or market) and prior to the determination of the fund’s net asset value, or after the halting of trading of a specific security where trading does not resume prior to the close of the exchange or market on which the security is principally traded. Events that occur on a frequent basis after foreign markets close (such as developments in foreign markets and significant movements in the U.S. markets) and prior to the
14
Table of Contents
MFS Utilities Portfolio
Notes to Financial Statements – continued
determination of the fund’s net asset value may be deemed to have a material effect on the value of securities traded in foreign markets. Accordingly, the fund’s foreign equity securities may often be valued at fair value. The adviser generally relies on third-party pricing services or other information (such as the correlation with price movements of similar securities in the same or other markets; the type, cost and investment characteristics of the security; the business and financial condition of the issuer; and trading and other market data) to assist in determining whether to fair value and at what value to fair value an investment. The value of an investment for purposes of calculating the fund’s net asset value can differ depending on the source and method used to determine value. When fair valuation is used, the value of an investment used to determine the fund’s net asset value may differ from quoted or published prices for the same investment. There can be no assurance that the fund could obtain the fair value assigned to an investment if it were to sell the investment at the same time at which the fund determines its net asset value per share.
Various inputs are used in determining the value of the fund’s assets or liabilities. These inputs are categorized into three broad levels. In certain cases, the inputs used to measure fair value may fall into different levels of the fair value hierarchy. In such cases, an investment’s level within the fair value hierarchy is based on the lowest level of input that is significant to the fair value measurement. The fund��s assessment of the significance of a particular input to the fair value measurement in its entirety requires judgment, and considers factors specific to the investment. Level 1 includes unadjusted quoted prices in active markets for identical assets or liabilities. Level 2 includes other significant observable market-based inputs (including quoted prices for similar securities, interest rates, prepayment speed, and credit risk). Level 3 includes unobservable inputs, which may include the adviser’s own assumptions in determining the fair value of investments. Other financial instruments are derivative instruments not reflected in total investments, such as forward foreign currency exchange contracts. The following is a summary of the levels used as of December 31, 2011 in valuing the fund’s assets or liabilities:
| Investments at Value | Level 1 | Level 2 | Level 3 | Total | ||||||||||||
| Equity Securities: | ||||||||||||||||
United States | $194,759,616 | $— | $— | $194,759,616 | ||||||||||||
Brazil | 25,541,337 | — | — | 25,541,337 | ||||||||||||
United Kingdom | 12,544,196 | — | — | 12,544,196 | ||||||||||||
Portugal | 7,561,980 | 2,819,367 | — | 10,381,347 | ||||||||||||
Spain | — | 7,954,140 | — | 7,954,140 | ||||||||||||
Germany | 1,624,881 | 6,323,138 | — | 7,948,019 | ||||||||||||
Czech Republic | 6,023,125 | — | — | 6,023,125 | ||||||||||||
Chile | 5,851,414 | — | — | 5,851,414 | ||||||||||||
Israel | 5,006,306 | — | — | 5,006,306 | ||||||||||||
Other Countries | 5,190,195 | 13,549,301 | — | 18,739,496 | ||||||||||||
| Corporate Bonds | — | 5,552,104 | — | 5,552,104 | ||||||||||||
| Commercial Mortgage-Backed Securities | — | 14,305 | — | 14,305 | ||||||||||||
| Mutual Funds | 9,238,808 | — | — | 9,238,808 | ||||||||||||
| Total Investments | $273,341,858 | $36,212,355 | $— | $309,554,213 | ||||||||||||
| Other Financial Instruments | ||||||||||||||||
| Forward Foreign Currency Exchange Contracts | $— | $1,096,964 | $— | $1,096,964 | ||||||||||||
For further information regarding security characteristics, see the Portfolio of Investments.
Foreign Currency Translation – Purchases and sales of foreign investments, income, and expenses are converted into U.S. dollars based upon currency exchange rates prevailing on the respective dates of such transactions or on the reporting date for foreign denominated receivables and payables. Gains and losses attributable to foreign currency exchange rates on sales of securities are recorded for financial statement purposes as net realized gains and losses on investments. Gains and losses attributable to foreign exchange rate movements on receivables, payables, income and expenses are recorded for financial statement purposes as foreign currency transaction gains and losses. That portion of both realized and unrealized gains and losses on investments that results from fluctuations in foreign currency exchange rates is not separately disclosed.
Derivatives – The fund uses derivatives for different purposes, primarily to increase or decrease exposure to a particular market or segment of the market, or security, to increase or decrease interest rate or currency exposure, or as alternatives to direct investments. Derivatives are used for hedging or non-hedging purposes. While hedging can reduce or eliminate losses, it can also reduce or eliminate gains. When the fund uses derivatives as an investment to increase market exposure, or for hedging purposes, gains and losses from derivative instruments may be substantially greater than the derivative’s original cost.
The derivative instruments used by the fund were forward foreign currency exchange contracts. The fund’s period end derivatives, as presented in the Portfolio of Investments and the associated Derivative Contract Tables, generally are indicative of the volume of its derivative activity during the period.
15
Table of Contents
MFS Utilities Portfolio
Notes to Financial Statements – continued
The following table presents, by major type of derivative contract, the fair value, on a gross basis, of the asset and liability components of derivatives held by the fund at December 31, 2011 as reported in the Statement of Assets and Liabilities:
| Fair Value | ||||||||||
| Risk | Derivative Contracts | Asset Derivatives | Liability Derivatives | |||||||
| Foreign Exchange | Forward Foreign Currency Exchange | $1,280,944 | $(183,980 | ) | ||||||
The following table presents, by major type of derivative contract, the realized gain (loss) on derivatives held by the fund for the year ended December 31, 2011 as reported in the Statement of Operations:
| Risk | Foreign Currency Transactions | |||
| Foreign Exchange | $1,575,148 | |||
The following table presents, by major type of derivative contract, the change in unrealized appreciation (depreciation) on derivatives held by the fund for the year ended December 31, 2011 as reported in the Statement of Operations:
| Risk | Translation of Liabilities in Foreign Currencies | |||
| Foreign Exchange | $1,042,713 | |||
Derivative counterparty credit risk is managed through formal evaluation of the creditworthiness of all potential counterparties. On certain over-the-counter derivatives, the fund attempts to reduce its exposure to counterparty credit risk whenever possible by entering into an International Swaps and Derivatives Association (ISDA) Master Agreement on a bilateral basis with each of the counterparties with whom it undertakes a significant volume of transactions. The ISDA Master Agreement gives each party to the agreement the right to terminate all transactions traded under such agreement if there is a certain deterioration in the credit quality of the other party. The ISDA Master Agreement gives the fund the right, upon an event of default by the applicable counterparty or a termination of the agreement, to close out all transactions traded under such agreement and to net amounts owed under each transaction to one net amount payable by one party to the other. This right to close out and net payments across all transactions traded under the ISDA Master Agreement could result in a reduction of the fund’s credit risk to such counterparty equal to any amounts payable by the fund under the applicable transactions, if any. However, absent an event of default by the counterparty or a termination of the agreement, the ISDA Master Agreement does not result in an offset of reported amounts of assets and liabilities in the Statement of Assets and Liabilities across transactions between the fund and the applicable counterparty.
Collateral requirements differ by type of derivative. Collateral or margin requirements are set by the broker or exchange clearing house for exchange traded derivatives (i.e., futures and exchange-traded options) while collateral terms are contract specific for over-the-counter traded derivatives (i.e., forward foreign currency exchange contracts, swaps and over-the-counter options). For derivatives traded under an ISDA Master Agreement, the collateral requirements are netted across all transactions traded under such agreement and one amount is posted from one party to the other to collateralize such obligations. Cash collateral that has been pledged to cover obligations of the fund under derivative contracts, if any, will be reported separately on the Statement of Assets and Liabilities as restricted cash. Securities collateral pledged for the same purpose, if any, is noted in the Portfolio of Investments.
Forward Foreign Currency Exchange Contracts – The fund entered into forward foreign currency exchange contracts for the purchase or sale of a specific foreign currency at a fixed price on a future date. These contracts may be used to hedge the fund’s currency risk or for non-hedging purposes. For hedging purposes, the fund may enter into contracts to deliver or receive foreign currency that the fund will receive from or use in its normal investment activities. The fund may also use contracts to hedge against declines in the value of foreign currency denominated securities due to unfavorable exchange rate movements. For non-hedging purposes, the fund may enter into contracts with the intent of changing the relative exposure of the fund’s portfolio of securities to different currencies to take advantage of anticipated exchange rate changes.
Forward foreign currency exchange contracts are adjusted by the daily exchange rate of the underlying currency and any unrealized gains or losses are recorded as a receivable or payable for forward foreign currency exchange contracts until the contract settlement date. On contract settlement date, any gain or loss on the contract is recorded as realized gains or losses on foreign currency transactions.
Risks may arise upon entering into these contracts from unanticipated movements in the value of the contract and from the potential inability of counterparties to meet the terms of their contracts. Generally, the fund’s maximum risk due to
16
Table of Contents
MFS Utilities Portfolio
Notes to Financial Statements – continued
counterparty credit risk is the unrealized gain on the contract due to the use of Continuous Linked Settlement, an industry accepted settlement system. This risk is mitigated in cases where there is an ISDA Master Agreement between the fund and the counterparty providing for netting as described above and for posting of collateral by the counterparty to the fund to cover the fund’s exposure to the counterparty under such ISDA Master Agreement.
Security Loans – State Street Bank and Trust Company (“State Street”), as lending agent, loans the securities of the fund to certain qualified institutions (the “Borrowers”) approved by the fund. The loans are collateralized by cash and/or U.S. Treasury and federal agency obligations in an amount typically at least equal to the market value of the securities loaned. The market value of the loaned securities is determined at the close of business of the fund and any additional required collateral is delivered to the fund on the next business day. State Street provides the fund with indemnification against Borrower default. The fund bears the risk of loss with respect to the investment of cash collateral. On loans collateralized by cash, the cash collateral is invested in a money market fund or short-term securities. A portion of the income generated upon investment of the collateral is remitted to the Borrowers, and the remainder is allocated between the fund and the lending agent. On loans collateralized by U.S. Treasury and/or federal agency obligations, a fee is received from the Borrower, and is allocated between the fund and the lending agent. Income from securities lending is included in interest income on the Statement of Operations. The dividend and interest income earned on the securities loaned is accounted for in the same manner as other dividend and interest income.
Indemnifications – Under the fund’s organizational documents, its officers and Trustees may be indemnified against certain liabilities and expenses arising out of the performance of their duties to the fund. Additionally, in the normal course of business, the fund enters into agreements with service providers that may contain indemnification clauses. The fund’s maximum exposure under these agreements is unknown as this would involve future claims that may be made against the fund that have not yet occurred.
Investment Transactions and Income – Investment transactions are recorded on the trade date. Interest income is recorded on the accrual basis. All premium and discount is amortized or accreted for financial statement purposes in accordance with U.S. generally accepted accounting principles. Dividends received in cash are recorded on the ex-dividend date. Certain dividends from foreign securities will be recorded when the fund is informed of the dividend if such information is obtained subsequent to the ex-dividend date. Dividend and interest payments received in additional securities are recorded on the ex-dividend or ex-interest date in an amount equal to the value of the security on such date.
The fund may receive proceeds from litigation settlements. Any proceeds received from litigation involving portfolio holdings are reflected in the Statement of Operations in realized gain/loss if the security has been disposed of by the fund or in unrealized gain/loss if the security is still held by the fund. Any other proceeds from litigation not related to portfolio holdings are reflected as other income in the Statement of Operations.
Fees Paid Indirectly – The fund’s custody fee may be reduced according to an arrangement that measures the value of cash deposited with the custodian by the fund. This amount, for the year ended December 31, 2011, is shown as a reduction of total expenses on the Statement of Operations.
Tax Matters and Distributions – The fund intends to qualify as a regulated investment company, as defined under Subchapter M of the Internal Revenue Code, and to distribute all of its taxable income, including realized capital gains. As a result, no provision for federal income tax is required. The fund’s federal tax returns for the prior three fiscal years remain subject to examination by the Internal Revenue Service. Foreign taxes have been accrued by the fund in the accompanying financial statements.
Distributions to shareholders are recorded on the ex-dividend date. Income and capital gain distributions are determined in accordance with income tax regulations, which may differ from U.S. generally accepted accounting principles. Certain capital accounts in the financial statements are periodically adjusted for permanent differences in order to reflect their tax character. These adjustments have no impact on net assets or net asset value per share. Temporary differences which arise from recognizing certain items of income, expense, gain or loss in different periods for financial statement and tax purposes will reverse at some time in the future. Distributions in excess of net investment income or net realized gains are temporary overdistributions for financial statement purposes resulting from differences in the recognition or classification of income or distributions for financial statement and tax purposes.
Book/tax differences primarily relate to amortization and accretion of debt securities, wash sale loss deferrals, and derivative transactions.
The tax character of distributions declared to shareholders for the last two fiscal years is as follows:
| 12/31/11 | 12/31/10 | |||||||
| Ordinary income (including any short-term capital gains) | $10,670,058 | $9,661,054 | ||||||
17
Table of Contents
MFS Utilities Portfolio
Notes to Financial Statements – continued
The federal tax cost and the tax basis components of distributable earnings were as follows:
| As of 12/31/11 | ||||
| Cost of investments | $305,045,708 | |||
| Gross appreciation | 33,326,540 | |||
| Gross depreciation | (28,818,035 | ) | ||
| Net unrealized appreciation (depreciation) | $4,508,505 | |||
| Undistributed ordinary income | 13,778,952 | |||
| Capital loss carryforwards | (6,267,255 | ) | ||
| Other temporary differences | (12,628 | ) |
Under the Regulated Investment Company Modernization Act of 2010 (the “Act”), net capital losses recognized after December 31, 2010 may be carried forward indefinitely, and their character is retained as short-term and/or long-term losses. Previously, net capital losses were carried forward for eight years and treated as short-term losses. As a transition rule, the Act requires that post-enactment net capital losses be used before pre-enactment net capital losses.
As of December 31, 2011, the fund had capital loss carryforwards available to offset future realized gains. Such losses expire as follows:
| Pre-enactment losses: | ||||
| 12/31/17 | $(6,267,255 | ) |
Multiple Classes of Shares of Beneficial Interest – The fund offers multiple classes of shares, which differ in their respective distribution and/or service fees. The fund’s income, realized and unrealized gain (loss), and common expenses are allocated to shareholders based on the daily net assets of each class. Dividends are declared separately for each class. Differences in per share dividend rates are generally due to differences in separate class expenses. The fund’s distributions declared to shareholders as reported on the Statements of Changes in Net Assets are presented by class as follows:
| From net investment income | ||||||||
| Year ended 12/31/11 | Year ended 12/31/10 | |||||||
| Initial Class | $6,480,865 | $6,050,884 | ||||||
| Service Class | 4,189,193 | 3,610,170 | ||||||
| Total | $10,670,058 | $9,661,054 | ||||||
| (3) | Transactions with Affiliates |
Investment Adviser – The fund has an investment advisory agreement with MFS to provide overall investment management and related administrative services and facilities to the fund.
The management fee is computed daily and paid monthly at the following annual rates:
| First $300 million of average daily net assets | 0.75% | |||
| Average daily net assets in excess of $300 million | 0.675% |
The management fee incurred for the year ended December 31, 2011 was equivalent to an annual effective rate of 0.75% of the fund’s average daily net assets.
Distributor – MFS Fund Distributors, Inc. (MFD), a wholly-owned subsidiary of MFS, is the distributor of shares of the fund. The Trustees have adopted a distribution plan for the Service Class shares pursuant to Rule 12b-1 under the Investment Company Act of 1940.
The fund’s distribution plan provides that the fund will pay MFD distribution and/or service fees equal to 0.25% per annum of its average daily net assets attributable to Service Class shares as partial consideration for services performed and expenses incurred by MFD and financial intermediaries (including participating insurance companies that invest in the fund to fund variable annuity and variable life insurance contracts, sponsors of qualified retirement and pension plans that invest in the fund, and affiliates of these participating insurance companies and plan sponsors) in connection with the sale and distribution of the Service Class shares. MFD may subsequently pay all, or a portion, of the distribution and/or service fees to financial intermediaries.
Shareholder Servicing Agent – MFS Service Center, Inc. (MFSC), a wholly-owned subsidiary of MFS, has contracted to provide transfer agent and recordkeeping functions in connection with the issuance, transfer, and redemption of each class of shares of the fund under a Shareholder Servicing Agent Agreement. During the year ended December 31, 2011, the fund did not pay MFSC a fee for this service.
18
Table of Contents
MFS Utilities Portfolio
Notes to Financial Statements – continued
Administrator – MFS provides certain financial, legal, shareholder communications, compliance, and other administrative services to the fund. Under an administrative services agreement, the fund partially reimburses MFS the costs incurred to provide these services. The fund is charged an annual fixed amount of $17,500 plus a fee based on average daily net assets. The administrative services fee incurred for the year ended December 31, 2011 was equivalent to an annual effective rate of 0.0333% of the fund’s average daily net assets.
Trustees’ and Officers’ Compensation – The fund pays compensation to Trustees in the form of a retainer, attendance fees, and additional compensation to the Board chairperson. The fund does not pay compensation directly to officers of the fund who are also officers of the investment adviser, all of whom receive remuneration for their services to the fund from MFS. Certain officers of the fund are officers or directors of MFS, MFD, and MFSC.
Other – This fund and certain other funds managed by MFS (the funds) have entered into services agreements (the Agreements) which provide for payment of fees by the funds to Tarantino LLC and Griffin Compliance LLC in return for the provision of services of an Independent Chief Compliance Officer (ICCO) and Assistant ICCO, respectively, for the funds. The ICCO and Assistant ICCO are officers of the funds and the sole members of Tarantino LLC and Griffin Compliance LLC, respectively. The funds can terminate the Agreements with Tarantino LLC and Griffin Compliance LLC at any time under the terms of the Agreements. MFS has agreed to bear all expenses associated with office space, other administrative support, and supplies provided to the ICCO and Assistant ICCO. For the year ended December 31, 2011, the aggregate fees paid by the fund to Tarantino LLC and Griffin Compliance LLC were $5,289 and are included in miscellaneous expense on the Statement of Operations.
The fund invests in the MFS Institutional Money Market Portfolio which is managed by MFS and seeks a high level of current income consistent with preservation of capital and liquidity. Income earned on this investment is included in dividends from underlying affiliated funds on the Statement of Operations. This money market fund does not pay a management fee to MFS.
| (4) | Portfolio Securities |
Purchases and sales of investments, other than U.S. Government securities, purchased option transactions, and short-term obligations, aggregated $165,948,948 and $183,728,405, respectively.
| (5) | Shares of Beneficial Interest |
The fund’s Declaration of Trust permits the Trustees to issue an unlimited number of full and fractional shares of beneficial interest. Transactions in fund shares were as follows:
| Year ended 12/31/11 | Year ended 12/31/10 | |||||||||||||||
| Shares | Amount | Shares | Amount | |||||||||||||
| Shares sold | ||||||||||||||||
Initial Class | 195,064 | $4,398,559 | 200,012 | $3,995,167 | ||||||||||||
Service Class | 1,112,704 | 24,780,307 | 790,180 | 15,356,100 | ||||||||||||
| 1,307,768 | $29,178,866 | 990,192 | $19,351,267 | |||||||||||||
| Shares issued to shareholders in reinvestment of distributions | ||||||||||||||||
Initial Class | 303,981 | $6,480,865 | 312,062 | $6,050,884 | ||||||||||||
Service Class | 198,352 | 4,189,193 | 187,736 | 3,610,170 | ||||||||||||
| 502,333 | $10,670,058 | 499,798 | $9,661,054 | |||||||||||||
| Shares reacquired | ||||||||||||||||
Initial Class | (1,339,096 | ) | $(30,204,101 | ) | (1,838,990 | ) | $(35,813,242 | ) | ||||||||
Service Class | (1,269,723 | ) | (27,973,269 | ) | (1,078,027 | ) | (20,894,691 | ) | ||||||||
| (2,608,819 | ) | $(58,177,370 | ) | (2,917,017 | ) | $(56,707,933 | ) | |||||||||
| Net change | ||||||||||||||||
Initial Class | (840,051 | ) | $(19,324,677 | ) | (1,326,916 | ) | $(25,767,191 | ) | ||||||||
Service Class | 41,333 | 996,231 | (100,111 | ) | (1,928,421 | ) | ||||||||||
| (798,718 | ) | $(18,328,446 | ) | (1,427,027 | ) | $(27,695,612 | ) | |||||||||
| (6) | Line of Credit |
The fund and certain other funds managed by MFS participate in a $1.1 billion unsecured committed line of credit, subject to a $1 billion sublimit, provided by a syndication of banks under a credit agreement. Borrowings may be made for temporary financing needs. Interest is charged to each fund, based on its borrowings, generally at a rate equal to the higher of the Federal Reserve funds rate or one month LIBOR plus an agreed upon spread. A commitment fee, based on the average daily, unused portion of the committed line of credit, is allocated among the participating funds at the end of each calendar quarter. In addition, the fund and other funds managed by MFS have established unsecured uncommitted borrowing arrangements with certain banks for temporary financing needs. Interest is charged to each fund, based on its borrowings, at a rate equal to the
19
Table of Contents
MFS Utilities Portfolio
Notes to Financial Statements – continued
Federal Reserve funds rate plus an agreed upon spread. For the year ended December 31, 2011, the fund’s commitment fee and interest expense were $2,452 and $0, respectively, and are included in miscellaneous expense on the Statement of Operations.
| (7) | Transactions in Underlying Affiliated Funds – Affiliated Issuers |
An affiliated issuer may be considered one in which the fund owns 5% or more of the outstanding voting securities, or a company which is under common control. For the purposes of this report, the fund assumes the following to be affiliated issuers:
| Underlying Affiliated Funds | Beginning Shares/Par Amount | Acquisitions Shares/Par Amount | Dispositions Shares/Par Amount | Ending Shares/Par Amount | ||||||||||||
| MFS Institutional Money Market Portfolio | 759,461 | 70,528,473 | (65,136,709 | ) | 6,151,225 | |||||||||||
| Underlying Affiliated Funds | Realized Gain (Loss) | Capital Gain Distributions | Dividend Income | Ending Value | ||||||||||||
| MFS Institutional Money Market Portfolio | $— | $— | $3,200 | $6,151,225 | ||||||||||||
20
Table of Contents
MFS Utilities Portfolio
REPORT OF INDEPENDENT REGISTERED PUBLIC ACCOUNTING FIRM
To the Board of Trustees of MFS Variable Insurance Trust II and the Shareholders of
MFS Utilities Portfolio:
We have audited the accompanying statement of assets and liabilities, including the portfolio of investments, of MFS Utilities Portfolio (the “Fund”) (one of the portfolios comprising MFS Variable Insurance Trust II) as of December 31, 2011, and the related statement of operations for the year then ended, the statements of changes in net assets for each of the two years in the period then ended, and the financial highlights for each of the five years in the period then ended. These financial statements and financial highlights are the responsibility of the Fund’s management. Our responsibility is to express an opinion on these financial statements and financial highlights based on our audits.
We conducted our audits in accordance with the standards of the Public Company Accounting Oversight Board (United States). Those standards require that we plan and perform the audit to obtain reasonable assurance about whether the financial statements and financial highlights are free of material misstatement. The Fund is not required to have, nor were we engaged to perform, an audit of its internal control over financial reporting. Our audits included consideration of internal control over financial reporting as a basis for designing audit procedures that are appropriate in the circumstances, but not for the purpose of expressing an opinion on the effectiveness of the Fund’s internal control over financial reporting. Accordingly, we express no such opinion. An audit also includes examining, on a test basis, evidence supporting the amounts and disclosures in the financial statements, assessing the accounting principles used and significant estimates made by management, as well as evaluating the overall financial statement presentation. Our procedures included confirmation of securities owned as of December 31, 2011, by correspondence with the custodian and brokers; where replies were not received from brokers, we performed other auditing procedures. We believe that our audits provide a reasonable basis for our opinion.
In our opinion, the financial statements and financial highlights referred to above present fairly, in all material respects, the financial position of MFS Utilities Portfolio as of December 31, 2011, the results of its operations for the year then ended, the changes in its net assets for each of the two years in the period then ended, and the financial highlights for each of the five years in the period then ended, in conformity with accounting principles generally accepted in the United States of America.
DELOITTE & TOUCHE LLP
Boston, Massachusetts
February 15, 2012
21
Table of Contents
MFS Utilities Portfolio
RESULTS OF SHAREHOLDER MEETING (unaudited)
At a special meeting of shareholders of MFS Utilities Portfolio, which was held on December 1, 2011, the following actions were taken for which shareholders of all series of MFS Variable Insurance Trust II voted together as a single class with respect to Item 1 and shareholders of MFS Utilities Portfolio voted as a separate class with respect to Items 2 and 3:
Item 1: Election of ten Trustees as members of the Board of Trustees of the Trust effective January 1, 2012:
| Number of Shares | ||||||||
| For | Withheld Authority | |||||||
| Robert E. Butler | 681,916,712.8686 | 46,472,894.9218 | ||||||
| Maureen R. Goldfarb | 682,835,794.8512 | 45,553,812.9392 | ||||||
| David H. Gunning | 681,500,267.3085 | 46,889,340.4819 | ||||||
| William R. Gutow | 681,050,223.5547 | 47,339,384.2357 | ||||||
| Michael Hegarty | 682,477,088.8584 | 45,912,518.9320 | ||||||
| John P. Kavanaugh | 683,794,425.4269 | 44,595,182.3635 | ||||||
| Robert J. Manning | 682,699,559.7374 | 45,690,048.0530 | ||||||
| J. Dale Sherratt | 681,362,743.0513 | 47,026,864.7391 | ||||||
| Laurie J. Thomsen | 683,408,094.0000 | 44,981,513.7904 | ||||||
| Robert W. Uek | 681,424,852.0247 | 46,964,755.7657 | ||||||
Item 2: To approve a new investment advisory agreement dated January 1, 2012, between the Trust, on behalf of MFS Utilities Portfolio, and MFS:
| Number of Shares | ||||||||||||
| For | Against | Withheld Authority | ||||||||||
| 12,002,274.4643 | 669,354.4489 | 1,248,275.0659 | ||||||||||
Item 3: To approve revisions to and restatements of certain fundamental investment restrictions of MFS Utilities Portfolio effective January 1, 2012 as detailed below:
| Number of Shares | ||||||||||||||
| For | Against | Withheld Authority | ||||||||||||
| A. | Borrowing | 11,459,847.6461 | 1,125,978.4001 | 1,334,077.9329 | ||||||||||
| B. | Underwriting Securities | 11,744,196.7956 | 863,983.4136 | 1,311,723.7699 | ||||||||||
| C. | Issuance of Senior Securities | 11,789,830.9678 | 786,694.8555 | 1,343,378.1558 | ||||||||||
| D. | Lending of Money or Securities | 11,491,044.2833 | 1,073,537.9388 | 1,355,321.7570 | ||||||||||
| E. | Purchases or Sales of Real Estate; Interests in Oil, Gas or Mineral Leases; and Commodities | 11,879,287.1484 | 752,079.3988 | 1,288,537.4319 | ||||||||||
| F. | Industry Concentration | 11,900,901.8354 | 649,498.8074 | 1,369,503.3363 | ||||||||||
22
Table of Contents
MFS Utilities Portfolio
TRUSTEES AND OFFICERS – IDENTIFICATION AND BACKGROUND
The Trustees and officers of the Trust, as of February 1, 2012, are listed below, together with their principal occupations during the past five years. (Their titles may have varied during that period.) The address of each Trustee and officer is 500 Boylston Street, Boston, Massachusetts 02116.
Name, Age | Position(s) with Fund | Trustee/Officer Since (h) | Principal Occupations | Other Directorships (j) | ||||
| INTERESTED TRUSTEES | ||||||||
Robert J. Manning (k) (age 48) | Trustee | February 2004 | Massachusetts Financial Services Company, Chairman, Chief Executive Officer and Director; President (until December 2009); Chief Investment Officer (until July 2010) | N/A | ||||
| INDEPENDENT TRUSTEES | ||||||||
David H. Gunning (age 69) | Trustee and Chair of Trustees | January 2004 | Retired; Cleveland-Cliffs Inc. (mining products and service provider), Vice Chairman/Director (until May 2007) | Lincoln Electric Holdings, Inc. (welding equipment manufacturer), Director; Development Alternatives, Inc. (consulting), Director/Non-Executive Chairman; Portman Limited (mining), Director (until 2008) | ||||
Robert E. Butler (age 70) | Trustee | January 2006 | Consultant – investment company industry regulatory and compliance matters | N/A | ||||
Maureen R. Goldfarb (age 56) | Trustee | January 2009 | Private investor | N/A | ||||
William R. Gutow (age 70) | Trustee | December 1993 | Private investor and real estate consultant; Capitol Entertainment Management Company (video franchise), Vice Chairman | Atlantic Coast Tan (tanning salons), Vice Chairman (until 2007); Texas Donuts (donut franchise), Vice Chairman (until 2010) | ||||
Michael Hegarty (age 67) | Trustee | December 2004 | Private investor | N/A | ||||
John P. Kavanaugh (age 57) | Trustee | January 2009 | Private investor; The Hanover Insurance Group, Inc., Vice President and Chief Investment Officer (until 2006); Allmerica Investment Trust, Allmerica Securities Trust and Opus Investment Trust (investment companies), Chairman, President and Trustee (until 2006) | N/A | ||||
J. Dale Sherratt (age 73) | Trustee | June 1989 | Insight Resources, Inc. (acquisition planning specialists), President; Wellfleet Investments (investor in health care companies), Managing General Partner | N/A | ||||
Laurie J. Thomsen (age 54) | Trustee | March 2005 | Private investor; New Profit, Inc. (venture philanthropy), Executive Partner (until 2010) | The Travelers Companies (property and casualty insurance), Director | ||||
Robert W. Uek (age 70) | Trustee | January 2006 | Consultant to investment company industry | N/A | ||||
| OFFICERS | ||||||||
John M. Corcoran (k) (age 46) | President | October 2008 | Massachusetts Financial Services Company, Senior Vice President (since October 2008); State Street Bank and Trust (financial services provider), Senior Vice President, (until September 2008) | N/A | ||||
| Christopher R. Bohane (k) (age 38) | Assistant Secretary and Assistant Clerk | July 2005 | Massachusetts Financial Services Company, Vice President and Senior Counsel | N/A | ||||
Kino Clark (k) (age 43) | Assistant Treasurer | January 2012 | Massachusetts Financial Services Company, Assistant Vice President | N/A | ||||
23
Table of Contents
MFS Utilities Portfolio
Trustees and Officers – continued
Name, Age | Position(s) with Fund | Trustee/Officer Since (h) | Principal Occupations | Other Directorships (j) | ||||
Ethan D. Corey (k) (age 48) | Assistant Secretary and Assistant Clerk | July 2005 | Massachusetts Financial Services Company, Senior Vice President and Associate General Counsel | N/A | ||||
David L. DiLorenzo (k) (age 43) | Treasurer | July 2005 | Massachusetts Financial Services Company, Vice President | N/A | ||||
Robyn L. Griffin (age 36) | Assistant Independent Chief Compliance Officer | August 2008 | Griffin Compliance LLC (provider of compliance services), Principal (since August 2008); State Street Corporation (financial services provider), Mutual Fund Administration Assistant Vice President (October 2006 – July 2008); Liberty Mutual Group (insurance), Personal Market Assistant Controller (April 2006 – October 2006); Deloitte & Touche LLP (professional services firm). | N/A | ||||
Brian E. Langenfeld (k) (age 38) | Assistant Secretary and Assistant Clerk | June 2006 | Massachusetts Financial Services Company, Vice President and Senior Counsel | N/A | ||||
Ellen Moynihan (k) (age 54) | Assistant Treasurer | April 1997 | Massachusetts Financial Services Company, Senior Vice President | N/A | ||||
Susan S. Newton (k) (age 61) | Assistant Secretary and Assistant Clerk | May 2005 | Massachusetts Financial Services Company, Senior Vice President and Associate General Counsel | N/A | ||||
Susan A. Pereira (k) (age 41) | Assistant Secretary and Assistant Clerk | July 2005 | Massachusetts Financial Services Company, Vice President and Senior Counsel | N/A | ||||
Mark N. Polebaum (k) (age 59) | Secretary and Clerk | January 2006 | Massachusetts Financial Services Company, Executive Vice President, General Counsel and Secretary | N/A | ||||
Frank L. Tarantino (age 67) | Independent Chief Compliance Officer | June 2004 | Tarantino LLC (provider of compliance services), Principal | N/A | ||||
Richard S. Weitzel (k) (age 41) | Assistant Secretary and Assistant Clerk | October 2007 | Massachusetts Financial Services Company, Vice President and Assistant General Counsel | N/A | ||||
James O. Yost (k) (age 51) | Deputy Treasurer | September 1990 | Massachusetts Financial Services Company, Senior Vice President | N/A | ||||
| (h) | Date first appointed to serve as Trustee/officer of an MFS fund. Each Trustee has served continuously since appointment unless indicated otherwise. For the period from December 15, 2004 until February 22, 2005, Mr. Manning served as Advisory Trustee. For the period October 2008, until January 2012, Mr. Corcoran served as Treasurer of the Funds. Prior to January 2012, Messrs. DiLorenzo and Yost served as Assistant Treasurers of the Funds. |
| (j) | Directorships or trusteeships of companies required to report to the Securities and Exchange Commission (i.e., “public companies”). |
| (k) | “Interested person” of the Trust within the meaning of the Investment Company Act of 1940 (referred to as the 1940 Act), which is the principal federal law governing investment companies like the fund, as a result of position with MFS. The address of MFS is 500 Boylston Street, Boston, Massachusetts 02116. |
Each Trustee has been elected by shareholders and each Trustee and officer holds office until his or her successor is chosen and qualified or until his or her earlier death, resignation, retirement or removal. The Trust does not hold annual meetings for the purpose of electing Trustees, and Trustees are not elected for fixed terms. Messrs. Butler, Kavanaugh, Uek and Ms. Thomsen are members of the Trust’s Audit Committee.
Each of the Fund’s Trustees and officers holds comparable positions with certain other funds of which MFS or a subsidiary is the investment adviser or distributor, and, in the case of the officers, with certain affiliates of MFS. As of January 1, 2012, the Trustees served as board members of 131 funds within the MFS Family of Funds.
24
Table of Contents
MFS Utilities Portfolio
Trustees and Officers – continued
The Statement of Additional Information for the Fund includes further information about the Trustees and is available without charge upon request by calling 1-800-225-2606.
Investment Adviser Massachusetts Financial Services Company 500 Boylston Street, Boston, MA 02116-3741 | Custodian State Street Bank and Trust 1 Lincoln Street, Boston, MA 02111-2900 | |
Distributor MFS Fund Distributors, Inc. 500 Boylston Street, Boston, MA 02116-3741 | Independent Registered Public Accounting Firm Deloitte & Touche LLP 200 Berkeley Street, Boston, MA 02116 | |
Portfolio Managers Robert Persons Maura Shaughnessy |
25
Table of Contents
MFS Utilities Portfolio
At a special meeting of shareholders of the MFS Utilities Portfolio (hereinafter referred to as the “Fund” or the “Portfolio”), which was held on December 1, 2011, the shareholders approved a new investment advisory agreement based on the recommendation of the Board of Trustees. At its July, 2011 meeting, the Board of Trustees (i) approved, and recommended for shareholder approval, the new investment advisory agreement effective January 1, 2012, and (ii) the continuation of the existing investment advisory agreement effective September 1, 2011. The following includes a description of the factors that the Board of Trustees considered and the conclusions that formed the basis of their approval of both the new investment advisory agreement and the continuation of the prior investment advisory agreement.
BOARD APPROVAL OF NEW INVESTMENT ADVISORY AGREEMENT
The Investment Company Act of 1940 requires that both the full Board of Trustees and a majority of the non-interested (“independent”) Trustees, voting separately, initially approve the new investment advisory agreement (the “New Agreement”) between Massachusetts Financial Services Company (“MFS”) and MFS Variable Insurance Trust II (the “Trust”) on behalf of the Portfolio and, beginning on the second anniversary of the initial effective date of the New Agreement, annually approve the continuation of the New Agreement. The Trustees have considered matters bearing on the Portfolio and the then current advisory arrangement at their meetings throughout the year, including a review of performance data at each regular meeting. In addition, the independent Trustees met in person in July 2011 to consider the initial approval of the New Agreement, and to recommend that shareholders approve the New Agreement. The independent Trustees were assisted in their evaluation of the New Agreement by independent legal counsel, from whom they received separate legal advice and with whom they met separately from MFS management. The independent Trustees were also assisted in this process by the Portfolio’s Independent Chief Compliance Officer, a full-time senior officer appointed by and reporting to the independent Trustees.
In connection with their deliberations regarding the initial approval of the New Agreement, the Trustees, including the independent Trustees, considered such information and factors as they believed, in light of the legal advice furnished to them and their own business judgment, to be relevant. The New Agreement was considered separately for the series of the Trust (collectively, the “Portfolios”), although the Trustees also took into account the common interests of all Portfolios in the Trust in their review. As described below, the Trustees considered the nature, quality, and extent of the various investment advisory, administrative, and/or shareholder services to be performed by MFS under the New Agreement and other arrangements with the Trust.
In connection with their initial review meeting, the Trustees received and relied upon materials that included, among other items: (i) information provided by MFS on the advisory fees of comparable portfolios of its other clients, including institutional separate account and other clients, (ii) information as to whether, and to what extent applicable, expense waivers, reimbursements or fee “breakpoints” would be observed for the Portfolio under the New Agreement, and (iii) a comparison and summary of the differences in the provisions in the New Agreement compared to those in each of the then current investment advisory agreements for the Portfolios. In addition, in connection with the independent Trustees’ meetings in May and July, 2011 (the “contract review meetings”) for the purpose of considering whether to approve the continuation of the then current investment advisory agreements for the Portfolio, the independent Trustees received: (1) information provided by Lipper Inc. (“Lipper”) on the investment performance of the Portfolio for various time periods ended December 31, 2010, compared to the investment performance of a group of funds with substantially similar investment classifications/objectives (the “Lipper performance universe”), (2) information provided by Lipper on the Portfolio’s advisory fees and other expenses compared to the advisory fees and other expenses of comparable funds identified by Lipper (the “Lipper expense group”), (3) information regarding MFS’ financial results and financial condition, including MFS’ and certain of its affiliates’ estimated profitability from services performed for the Portfolio, (4) MFS’ views regarding the outlook for the mutual fund industry and its strategic business plans, (5) descriptions of various functions performed by MFS for the Trust, such as compliance monitoring and portfolio trading practices, and (6) information regarding the overall organization of MFS, including information about MFS’ senior management and other personnel providing investment advisory, administrative and other services to the Portfolio. The comparative performance, fee and expense information prepared and provided by Lipper was not independently verified, and the independent Trustees did not independently verify any information provided to them by MFS.
The Trustees’ conclusion as to the initial approval of the New Agreement was based on comprehensive consideration of all information provided to the Trustees and was not the result of any single factor. Some of the factors that figured particularly in the Trustees’ deliberations are described below for the Portfolio, while individual Trustees may have given different weight to various factors and evaluated the information presented as a whole differently than another individual Trustee. The Trustees recognized that the fee arrangements for the Portfolio could reflect years of review and discussion between the independent Trustees and MFS, that certain aspects of such arrangements may receive greater scrutiny in some years than others, and that
26
Table of Contents
MFS Utilities Portfolio
Board Approval of New Investment Advisory Agreement – continued
the Trustees’ conclusions may be based, in part, on their consideration of these same arrangements during the course of the year and in prior years.
Because the portfolio management team managing the Portfolio’s investments under the then current investment advisory agreement will remain the same under the New Agreement for the Portfolio, the Trustees compared the Portfolio’s total return investment performance to the performance of its Lipper performance universe over various time periods, based on information provided by Lipper. The Trustees placed particular emphasis on the total return performance of the Portfolio’s Initial Class shares in comparison to the performance of funds in its Lipper performance universe over the one-, three- and five-year periods ended December 31, 2010. The Trustees did not rely on performance results for more recent periods.
The Trustees noted the performance of the Portfolio’s Initial Class shares was in the 1st quintile relative to the other funds in the Lipper performance universe for the one-year period (the 1st quintile being the best performers and the 5th quintile being the worst performers). The total return performance of the Portfolio was also in the 1st quintile for the three-year and the five-year periods ended December 31, 2010, relative to the Lipper performance universe. Based on the nature and quality of services provided by MFS, the Board of Trustees concluded that the Portfolio’s performance was satisfactory.
In the course of their deliberations, the Trustees took into account information provided by MFS during contract review meetings, as well as during investment review meetings conducted with portfolio management personnel during the course of the year. For Portfolios whose performance lagged their peer groups, they discussed the factors that contributed thereto and MFS’ efforts to improve such Portfolios’ performance. After reviewing this information, the Trustees concluded, within the context of their overall conclusions regarding the New Agreement, that they were satisfied with MFS’ responses and efforts relating to investment performance.
In assessing the reasonableness of the Portfolio’s advisory fee, the Trustees considered, among other information, the Portfolio’s advisory fee and the total expense ratio of the Portfolio’s Initial Class shares as a percentage of average daily net assets, compared to the advisory fee and total expense ratios of its peer group of funds based on information provided by Lipper. The Trustees also considered the advisory fees charged by MFS to institutional accounts. In comparing these fees, the Trustees considered the generally broader scope of services provided by MFS to the Trust than those provided to institutional accounts. The Trustees also considered the higher demands placed on MFS’ investment personnel and trading infrastructure as a result of the daily cash in-flows and out-flows of the Portfolio, and the impact on MFS and related expenses due to the more extensive regulatory regime to which the Portfolio is subject, compared to institutional accounts.
In considering the fees, the Trustees noted from the Lipper data that the Portfolio’s effective advisory fee rate was above the median and total expense ratio was approximately at the median of such fees and expenses of funds in the Lipper expense group. The Trustees further concluded that the existing breakpoint was sufficient to allow the Portfolio to benefit from economies of scale as its assets grow. The Trustees concluded that the fees were reasonable in light of the nature and quality of services provided.
The Trustees also considered whether the Portfolio is likely to benefit from any economies of scale due to future asset growth. In this regard, the Trustees reviewed the adequacy of breakpoints and discussed with MFS any adjustments necessary for the shareholders’ benefit.
The Trustees also considered information prepared by MFS relating to its costs and profits with respect to the Portfolio and other investment companies and accounts advised by MFS, as well as MFS’ methodologies used to determine and allocate its costs to the Portfolio and other accounts and products for purposes of estimating profitability.
The Trustees noted that there would be no increase to the net advisory fee arrangement for the Portfolio under the New Agreement when compared to the Portfolio’s then current investment advisory agreement. After reviewing these and other factors described below, the Trustees concluded that the advisory fees charged to the Portfolio under the New Agreement represent reasonable compensation in light of the nature and quality of the services being provided by MFS.
In addition, the Trustees considered MFS’ resources and related efforts to continue to retain, attract and motivate capable personnel to serve the Portfolio. The Trustees also considered the financial resources of MFS and its parent, Sun Life Financial Inc. The Trustees further considered any advantages and possible disadvantages of having an adviser which also serves other investment companies as well as institutional accounts.
The Trustees also considered the nature, quality, cost, and extent of administrative, transfer agency, and distribution services provided to the Trust by MFS and its affiliates under agreements and plans other than the New Agreement, including the 12b-1 fees the Portfolio pays to MFS Fund Distributors, Inc., an affiliate of MFS. The Trustees also considered the nature, extent and quality of certain other services MFS performs or arranges on the Portfolio’s behalf, which may include securities lending
27
Table of Contents
MFS Utilities Portfolio
Board Approval of New Investment Advisory Agreement – continued
programs, directed expense payment programs, class action recovery programs, and MFS’ interaction with third-party service providers, principally custodians and sub-custodians. The Trustees concluded that the various non-advisory services provided by MFS and its affiliates on behalf of the Portfolio were satisfactory. The Trustees also considered the benefits to MFS from the use of the Portfolio’s portfolio brokerage commissions to pay for investment research and various other factors. Additionally, the Trustees considered so-called “fall-out benefits” to MFS such as reputational value derived from serving as investment manager to the Trust, and determined that any such benefits derived by MFS were reasonable and fair.
Based on their evaluation of factors that they deemed to be material, including those factors described above, the Board of Trustees, including a majority of the independent Trustees, concluded that the New Agreement should be approved for an initial two-year period, commencing upon its effective date, as set forth in the New Agreement.
BOARD APPROVAL OF CONTINUATION OF PRIOR INVESTMENT ADVISORY AGREEMENT
The Investment Company Act of 1940 requires that both the full Board of Trustees and a majority of the non-interested (“independent”) Trustees, voting separately, annually approve the continuation of the investment advisory agreement between MFS Variable Insurance Trust II (the “Trust”) and Massachusetts Financial Services Company (“MFS”) on behalf of the Fund. The Trustees consider matters bearing on the Fund and the advisory arrangements at their meetings throughout the year, including a review of performance data at each regular meeting. In addition, the independent Trustees met in person in May and again in July 2011 (“contract review meetings”) for the specific purpose of considering whether to approve the continuation of the investment advisory agreement for the Fund. The independent Trustees were assisted in their evaluation of the investment advisory agreement by independent legal counsel, from whom they received separate legal advice and with whom they met separately from MFS management during various contract review meetings. The independent Trustees were also assisted in this process by the Fund’s Independent Chief Compliance Officer, a full-time senior officer appointed by and reporting to the independent Trustees.
In connection with their deliberations, the Trustees, including the independent Trustees, considered such information and factors as they believed, in light of the legal advice furnished to them and their own business judgment, to be relevant. The investment advisory agreement was considered separately for the Fund, although the Trustees also took into account the common interests of all Funds in the Trust in their review. As described below, the Trustees considered the nature, quality, and extent of the various investment advisory, administrative, and shareholder services performed by MFS under the existing investment advisory agreement and other arrangements with the Trust.
In connection with their contract review meetings, the Trustees received and relied upon materials which included, among other items: (i) information provided by Lipper Inc. (“Lipper”) on the investment performance of the Fund for various time periods ended December 31, 2010, compared to the investment performance of a group of funds with substantially similar investment classifications/objectives (the “Lipper performance universe”), (ii) information provided by Lipper on the Fund’s advisory fees and other expenses compared to the advisory fees and other expenses of comparable funds identified by Lipper (the “Lipper expense group”), (iii) information provided by MFS on the advisory fees of comparable portfolios of its other clients, including institutional separate account and other clients, (iv) information as to whether, and to what extent applicable, expense waivers, reimbursements or fee “breakpoints” are observed for the Fund, (v) information regarding MFS’ financial results and financial condition, including MFS’ and certain of its affiliates’ estimated profitability from services performed for the Fund and other investment companies that the Board oversees as a whole, and for MFS’ institutional business, (vi) MFS’ views regarding the outlook for the mutual fund industry and its strategic business plans, (vii) descriptions of various functions performed by MFS for the Trust, such as compliance monitoring and portfolio trading practices, and (viii) information regarding the overall organization of MFS, including information about MFS’ senior management and other personnel providing investment advisory, administrative and other services to the Fund. The comparative performance, fee and expense information prepared and provided by Lipper was not independently verified, and the independent Trustees did not independently verify any information provided to them by MFS.
The Trustees’ conclusion as to the continuation of the investment advisory agreement was based on comprehensive consideration of all information provided to the Trustees and was not the result of any single factor. Some of the factors that figured particularly in the Trustees’ deliberations are described below for the Fund, while individual Trustees may have given different weight to various factors and evaluated the information presented as a whole differently than another individual Trustee. The Trustees recognized that the fee arrangements for the Fund reflect years of review and discussion between the independent Trustees and MFS, that certain aspects of such arrangements may receive greater scrutiny in some years than others, and that the Trustees’ conclusions may be based, in part, on their consideration of these same arrangements during the course of the year and in prior years.
28
Table of Contents
MFS Utilities Portfolio
Board Approval of Continuation of Prior Investment Advisory Agreement – continued
Based on information provided by Lipper, the Trustees compared the Fund’s total return investment performance to the performance of the Lipper performance universe over various time periods. The Trustees placed particular emphasis on the total return performance of the Fund’s Initial Class shares in comparison to the performance of funds in its Lipper performance universe over the one-, three- and five -year periods ended December 31, 2010. The Trustees did not rely on performance results for more recent periods, including those shown elsewhere in this report.
The Trustees noted the performance of the Fund’s Initial Class shares was in the 1st quintile relative to the other funds in the Lipper performance universe for the one-year period (the 1st quintile being the best performers and the 5th quintile being the worst performers). The total return performance of the Fund was also in the 1st quintile for the three-year and the five-year periods ended December 31, 2010, relative to the Lipper performance universe. Based on the nature and quality of services provided by MFS, the Board of Trustees concluded that the Portfolio’s performance was satisfactory.
In the course of their deliberations, the Trustees took into account information provided by MFS during contract review meetings, as well as during investment review meetings conducted with portfolio management personnel during the course of the year.
In assessing the reasonableness of the Fund’s advisory fee, the Trustees considered, among other information, the Fund’s advisory fee and the total expense ratio of the Fund’s Initial Class shares as a percentage of average daily net assets, compared to the advisory fee and total expense ratios of its peer group of funds based on information provided by Lipper. The Trustees also considered the advisory fees charged by MFS to institutional accounts. In comparing these fees, the Trustees considered the generally broader scope of services provided by MFS to the Trust than those provided to institutional accounts. The Trustees also considered the higher demands placed on MFS’ investment personnel and trading infrastructure as a result of the daily cash in-flows and out-flows of the Fund, and the impact on MFS and related expenses due to the more extensive regulatory regime to which the Fund is subject, compared to institutional accounts.
In considering the fees, the Trustees noted from the Lipper data (which takes into account any reductions or expense limitations) that the Fund’s effective advisory fee rate was above the median and total expense ratio was approximately at the median of such fees and expenses of funds in the Lipper expense group. The Trustees further concluded that the existing breakpoint was sufficient to allow the Fund to benefit from economies of scale as its assets grow. The Trustees concluded that the fees were reasonable in light of the nature and quality of services provided.
The Trustees also considered information prepared by MFS relating to its costs and profits with respect to the Fund and other investment companies and accounts advised by MFS, as well as MFS’ methodologies used to determine and allocate its costs to the Fund and other accounts and products for purposes of estimating profitability.
After reviewing these and other factors described below, the Trustees concluded that the advisory fees charged to the Fund represent reasonable compensation in light of the nature and quality of the services being provided by MFS.
In addition, the Trustees considered MFS’ resources and related efforts to continue to retain, attract and motivate capable personnel to serve the Fund. The Trustees also considered the financial resources of MFS and its parent, Sun Life Financial Inc. The Trustees further considered any advantages and possible disadvantages of having an adviser which also serves other investment companies as well as institutional accounts.
The Trustees also considered the nature, quality, cost, and extent of administrative, transfer agency, and distribution services provided to the Fund by MFS and its affiliates under agreements and plans other than the investment advisory agreement, including the 12b-1 fees the Fund pays to MFS Fund Distributors, Inc., an affiliate of MFS. The Trustees also considered the nature, extent and quality of certain other services MFS performs or arranges on the Fund’s behalf, which may include securities lending programs, directed expense payment programs, class action recovery programs, and MFS’ interaction with third-party service providers, principally custodians and sub-custodians. The Trustees concluded that the various non-advisory services provided by MFS and its affiliates on behalf of the Fund were satisfactory. The Trustees also considered the benefits to MFS from the use of the Fund’s portfolio brokerage commissions, if applicable, to pay for investment research and various other factors. Additionally, the Trustees considered so-called “fall-out benefits” to MFS such as reputational value derived from serving as investment manager to the Trust, and determined that any such benefits derived by MFS were reasonable and fair.
Based on their evaluation of factors that they deemed to be material, including those factors described above, the Board of Trustees, including a majority of the independent Trustees, concluded that the investment advisory agreement should be continued for an additional one-year period, commencing September 1, 2011.
A discussion regarding the Board’s most recent review and renewal of the fund’s Investment Advisory Agreement with MFS is available by clicking on the fund’s name under “Variable Insurance Portfolios — VIT II” in the “Products and Performance” section of the MFS Web site (mfs.com).
29
Table of Contents
MFS Utilities Portfolio
PROXY VOTING POLICIES AND INFORMATION
A general description of the MFS funds’ proxy voting policies and procedures is available without charge, upon request, by calling
1-800-225-2606, by visiting the Proxy Voting section of mfs.com or by visiting the SEC’s Web site at http://www.sec.gov.
Information regarding how the fund voted proxies relating to portfolio securities during the most recent twelve-month period ended June 30 is available without charge by visiting the Proxy Voting section of mfs.com or by visiting the SEC’s Web site at http://www.sec.gov.
QUARTERLY PORTFOLIO DISCLOSURE
The fund will file a complete schedule of portfolio holdings with the Securities and Exchange Commission (the Commission) for the first and third quarters of each fiscal year on Form N-Q. The fund’s Form N-Q is available on the EDGAR database on the Commission’s Internet Web site at http://www.sec.gov and may be reviewed and copied at the:
Public Reference Room
Securities and Exchange Commission
100 F Street, NE, Room 1580
Washington, D.C. 20549
Information on the operation of the Public Reference Room may be obtained by calling the Commission at 1-800-SEC-0330. Copies of the fund’s Form N-Q also may be obtained, upon payment of a duplicating fee, by electronic request at the following e-mail address: publicinfo@sec.gov or by writing the Public Reference Section at the above address.
From time to time, MFS may post important information about the fund or the MFS funds on the MFS web site (mfs.com). This information is available by visiting the “News & Commentary” section of mfs.com or by clicking on the fund’s name under “Variable Insurance Portfolios — VIT II” in the “Products and Performance” section of mfs.com.
FEDERAL TAX INFORMATION (unaudited)
The following information is provided pursuant to provisions of the Internal Revenue Code.
For corporate shareholders, 63.19% of the ordinary income dividends paid during the fiscal year qualify for the corporate dividends received deduction.
30
Table of Contents
rev. 3/11

| Why? | Financial companies choose how they share your personal information. Federal law gives consumers the right to limit some but not all sharing. Federal law also requires us to tell you how we collect, share, and protect your personal information. Please read this notice carefully to understand what we do. |
| What? | The types of personal information we collect and share depend on the product or service you have with us. This information can include:
• Social Security number and account balances • Account transactions and transaction history • Checking account information and wire transfer instructions
When you are no longer our customer, we continue to share your information as described in this notice. |
| How? | All financial companies need to share customers’ personal information to run their everyday business. In the section below, we list the reasons financial companies can share their customers’ personal information; the reasons MFS chooses to share; and whether you can limit this sharing. |
| Reasons we can share your personal information | Does MFS share? | Can you limit this sharing? | ||
For our everyday business purposes – such as to process your transactions, maintain your account(s), respond to court orders and legal investigations, or report to credit bureaus | Yes | No | ||
For our marketing purposes – to offer our products and services to you | No | We don’t share | ||
| For joint marketing with other financial companies | No | We don’t share | ||
For our affiliates’ everyday business purposes – information about your transactions and experiences | No | We don’t share | ||
For our affiliates’ everyday business purposes – information about your creditworthiness | No | We don’t share | ||
| For nonaffiliates to market to you | No | We don’t share |
| Questions? | Call 800-225-2606 or go to mfs.com. |
31
Table of Contents
| Page 2 |
| Who we are | ||
| Who is providing this notice? | MFS Funds, MFS Investment Management, MFS Institutional Advisors, Inc., MFS Fund Distributors, Inc., MFS Heritage Trust Company, and MFS Service Center, Inc. | |
| What we do | ||
| How does MFS protect my personal information? | To protect your personal information from unauthorized access and use, we use security measures that comply with federal law. These measures include procedural, electronic, and physical safeguards for the protection of the personal information we collect about you. | |
| How does MFS collect my personal information? | We collect your personal information, for example, when you
• open an account or provide account information • direct us to buy securities or direct us to sell your securities • make a wire transfer
We also collect your personal information from others, such as credit bureaus, affiliates and other companies. | |
| Why can’t I limit all sharing? | Federal law gives you the right to limit only
• sharing for affiliates’ everyday business purposes – information about your creditworthiness • affiliates from using your information to market to you • sharing for nonaffiliates to market to you
State laws and individual companies may give you additional rights to limit sharing. | |
| Definitions | ||
| Affiliates | Companies related by common ownership or control. They can be financial and nonfinancial companies.
•MFS does not share personal information with affiliates, except for everyday business purposes as described on page one of this notice. | |
| Nonaffiliates | Companies not related by common ownership or control. They can be financial and nonfinancial companies.
•MFS does not share with nonaffiliates so they can market to you. | |
| Joint Marketing | A formal agreement between nonaffiliated financial companies that together market financial products or services to you.
•MFS doesn’t jointly market. | |
| Other important information | ||
| If you own an MFS product or receive an MFS service in the name of a third party such as a bank or broker-dealer, their privacy policy may apply to you instead of ours. | ||
32
Table of Contents

Table of Contents
| ITEM 2. | CODE OF ETHICS. |
The Registrant has adopted a Code of Ethics pursuant to Section 406 of the Sarbanes-Oxley Act and as defined in Form N-CSR that applies to the Registrant’s principal executive officer and principal financial and accounting officer. During the period covered by this report, the Registrant has not amended any provision in its Code of Ethics (the “Code”) that relates to an element of the Code’s definitions enumerated in paragraph (b) of Item 2 of this Form N-CSR. During the period covered by this report, the Registrant did not grant a waiver, including an implicit waiver, from any provision of the Code.
A copy of the Code of Ethics is filed as an exhibit to this Form N-CSR.
| ITEM 3. | AUDIT COMMITTEE FINANCIAL EXPERT. |
For the reporting period ended December 31, 2012, Messrs. J. Kermit Birchfield, Robert C. Bishop, and Haviland Wright, members of the Audit Committee, have been determined by the Board of Trustees in their reasonable business judgment to meet the definition of “audit committee financial expert” as such term is defined in Form N-CSR. In addition, Messrs. J. Kermit Birchfield, Robert C. Bishop, and Haviland Wright are “independent” members of the Audit Committee as defined in Form N-CSR.
Effective January 1, 2012, Messrs. Robert E. Butler, John P. Kavanaugh and Robert W. Uek and Ms. Laurie J. Thomsen, members of the Audit Committee, have been determined by the Board of Trustees in their reasonable business judgment to meet the definition of “audit committee financial expert” as such term is defined in Form N-CSR. In addition, Messrs. Butler, Kavanaugh and Uek and Ms. Thomsen are “independent” members of the Audit Committee (as such term has been defined by the Securities and Exchange Commission in regulations implementing Section 407 of the Sarbanes-Oxley Act of 2002). The Securities and Exchange Commission has stated that the designation of a person as an audit committee financial expert pursuant to this Item 3 on the Form N-CSR does not impose on such a person any duties, obligations or liability that are greater than the duties, obligations or liability imposed on such person as a member of the Audit Committee and the Board of Trustees in the absence of such designation or identification.
| ITEM 4. | PRINCIPAL ACCOUNTANT FEES AND SERVICES. |
Items 4(a) through 4(d) and 4(g):
The Board of Trustees has appointed Deloitte & Touche LLP (“Deloitte”) to serve as independent accountants to each series of the Registrant (collectively, the “Funds”). The tables below set forth the audit fees billed to the Funds as well as fees for non-audit services provided to the Funds and/or to the Funds’ investment adviser, Massachusetts Financial Services Company (“MFS”) and to various entities either controlling, controlled
Table of Contents
by, or under common control with MFS that provide ongoing services to the Funds (“MFS Related Entities”).
For the fiscal years ended December 31, 2011 and 2010, audit fees billed to the Funds by Deloitte were as follows:
| Audit Fees | ||||||||
| 2011 | 20104 | |||||||
Fees billed by Deloitte: | ||||||||
MFS Blended Research Core Equity Portfolio | 39,101 | 38,659 | ||||||
MFS Blended Research Growth Portfolio | 37,176 | 36,755 | ||||||
MFS Blended Research Value Portfolio | 37,176 | 36,755 | ||||||
MFS Bond Portfolio | 54,563 | 53,979 | ||||||
MFS Core Equity Portfolio | 41,001 | 40,564 | ||||||
MFS Growth Portfolio | 39,732 | 39,309 | ||||||
MFS Emerging Markets Equity Portfolio | 41,217 | 40,752 | ||||||
MFS Global Governments Portfolio | 52,429 | 51,868 | ||||||
MFS Global Growth Portfolio | 50,389 | 49,824 | ||||||
MFS Global Tactical Allocation Portfolio | 50,389 | 49,824 | ||||||
MFS Government Securities Portfolio | 44,670 | 44,193 | ||||||
MFS High Yield Portfolio | 57,711 | 57,092 | ||||||
MFS International Growth Portfolio | 41,217 | 40,752 | ||||||
MFS International Value Portfolio | 41,923 | 41,450 | ||||||
MFS Massachusetts Investors Growth Stock Portfolio | 41,001 | 40,564 | ||||||
MFS Mid Cap Growth Portfolio | 39,026 | 38,611 | ||||||
MFS Money Market Portfolio | 24,212 | 23,958 | ||||||
MFS New Discovery Portfolio | 39,026 | 38,611 | ||||||
MFS Research International Portfolio | 39,101 | 38,659 | ||||||
MFS Global Research Portfolio | 39,807 | 39,357 | ||||||
MFS Strategic Income | 57,471 | 56,855 | ||||||
Portfolio | ||||||||
MFS Technology Portfolio | 39,101 | 38,659 | ||||||
MFS Total Return Portfolio | 52,429 | 51,868 | ||||||
MFS Utilities Portfolio | 39,026 | 38,611 | ||||||
MFS Value Portfolio | 39,026 | 38,611 | ||||||
Total | 1,077,920 | 1,066,140 | ||||||
For the fiscal years ended December 31, 2011 and 2010, fees billed by Deloitte for audit-related, tax and other services provided to the Funds and for audit-related, tax and other services provided to MFS and MFS Related Entities were as follows:
Table of Contents
| Audit-Related Fees1/4 | Tax Fees2 | All Other Fees3/4 | ||||||||||||||||||||||
| 2011 | 2010 | 2011 | 2010 | 2011 | 2010 | |||||||||||||||||||
Fees billed by Deloitte: | ||||||||||||||||||||||||
To MFS Blended Research Core Equity Portfolio | 2,400 | 2,400 | 4,410 | 4,362 | 1,331 | 1,601 | ||||||||||||||||||
To MFS Blended Research Growth Portfolio | 2,400 | 2,400 | 5,107 | 5,051 | 1,331 | 1,601 | ||||||||||||||||||
To MFS Blended Research Value Portfolio | 2,400 | 2,400 | 5,107 | 5,051 | 1,331 | 1,601 | ||||||||||||||||||
To MFS Bond Portfolio | 0 | 0 | 4,410 | 4,362 | 1,331 | 1,601 | ||||||||||||||||||
To MFS Core Equity Portfolio | 0 | 0 | 4,410 | 4,362 | 1,331 | 1,601 | ||||||||||||||||||
To MFS Growth Portfolio | 0 | 0 | 4,410 | 4,362 | 1,331 | 1,601 | ||||||||||||||||||
To MFS Emerging Markets Equity Portfolio | 2,400 | 2,400 | 4,410 | 4,362 | 1,331 | 1,601 | ||||||||||||||||||
To MFS Global Governments Portfolio | 0 | 0 | 4,410 | 4,362 | 1,331 | 1,601 | ||||||||||||||||||
To MFS Global Growth Portfolio | 2,400 | 2,400 | 4,410 | 4,362 | 1,331 | 1,601 | ||||||||||||||||||
To MFS Global Tactical Allocation Portfolio | 2,400 | 2,400 | 4,410 | 4,362 | 1,331 | 1,601 | ||||||||||||||||||
To MFS Government Securities Portfolio | 0 | 0 | 4,410 | 4,362 | 1,331 | 1,601 | ||||||||||||||||||
To MFS High Yield Portfolio | 0 | 0 | 4,410 | 4,362 | 1,331 | 1,601 | ||||||||||||||||||
To MFS International Growth Portfolio | 2,400 | 2,400 | 4,410 | 4,362 | 1,331 | 1,601 | ||||||||||||||||||
To MFS International Value Portfolio | 2,400 | 2,400 | 4,410 | 4,362 | 1,331 | 1,601 | ||||||||||||||||||
To MFS Massachusetts Investors Growth Stock Portfolio | 0 | 0 | 4,410 | 4,362 | 1,331 | 1,601 | ||||||||||||||||||
To MFS Mid Cap Growth Portfolio | 0 | 0 | 4,410 | 4,362 | 1,331 | 1,601 | ||||||||||||||||||
To MFS Money Market Portfolio | 0 | 0 | 4,410 | 4,362 | 1,331 | 1,601 | ||||||||||||||||||
To MFS New Discovery Portfolio | 0 | 0 | 4,410 | 4,362 | 1,331 | 1,601 | ||||||||||||||||||
To MFS Research International Portfolio | 2,400 | 2,400 | 4,410 | 4,362 | 1,331 | 1,601 | ||||||||||||||||||
To MFS Global Research Portfolio | 2,400 | 2,400 | 4,410 | 4,362 | 1,331 | 1,601 | ||||||||||||||||||
To MFS Strategic Income Portfolio | 0 | 0 | 4,410 | 4,362 | 1,331 | 1,601 | ||||||||||||||||||
To MFS Technology Portfolio | 2,400 | 2,400 | 4,410 | 4,362 | 1,331 | 1,601 | ||||||||||||||||||
To MFS Total Return Portfolio | 0 | 0 | 4,409 | 4,361 | 1,331 | 1,601 | ||||||||||||||||||
To MFS Utilities Portfolio | 0 | 0 | 4,409 | 4,361 | 1,331 | 1,601 | ||||||||||||||||||
To MFS Value Portfolio | 0 | 0 | 4,409 | 4,361 | 1,331 | 1,601 | ||||||||||||||||||
Total fees billed by Deloitte To above Funds: | 26,400 | 26,400 | 111,641 | 110,425 | 33,325 | 40,025 | ||||||||||||||||||
Table of Contents
| Audit-Related Fees1 | Tax Fees2 | All Other Fees3 | ||||||||||||||||||||||
| 2011 | 2010 | 2011 | 2010 | 2011 | 2010 | |||||||||||||||||||
Fees billed by Deloitte: | ||||||||||||||||||||||||
To MFS and MFS Related Entities of MFS Blended Research Core Equity Portfolio* | 1,265,664 | 1,241,490 | 0 | 0 | 53,100 | 60,000 | ||||||||||||||||||
To MFS and MFS Related Entities of MFS Blended Research Growth Portfolio* | 1,265,664 | 1,241,490 | 0 | 0 | 53,100 | 60,000 | ||||||||||||||||||
To MFS and MFS Related Entities of MFS Blended Research Value Portfolio* | 1,265,664 | 1,241,490 | 0 | 0 | 53,100 | 60,000 | ||||||||||||||||||
To MFS and MFS Related Entities of MFS Bond Portfolio* | 1,265,664 | 1,241,490 | 0 | 0 | 53,100 | 60,000 | ||||||||||||||||||
To MFS and MFS Related Entities of MFS Core Equity Portfolio* | 1,265,664 | 1,241,490 | 0 | 0 | 53,100 | 60,000 | ||||||||||||||||||
To MFS and MFS Related Entities of MFS Growth Portfolio* | 1,265,664 | 1,241,490 | 0 | 0 | 53,100 | 60,000 | ||||||||||||||||||
To MFS and MFS Related Entities of MFS Emerging Markets Equity Portfolio* | 1,265,664 | 1,241,490 | 0 | 0 | 53,100 | 60,000 | ||||||||||||||||||
To MFS and MFS Related Entities of MFS Global Governments Portfolio* | 1,265,664 | 1,241,490 | 0 | 0 | 53,100 | 60,000 | ||||||||||||||||||
To MFS and MFS Related Entities of MFS Global Growth Portfolio* | 1,265,664 | 1,241,490 | 0 | 0 | 53,100 | 60,000 | ||||||||||||||||||
To MFS Global Tactical Allocation, MFS and MFS Related Entities* | 1,265,664 | 1,241,490 | 0 | 0 | 53,100 | 60,000 | ||||||||||||||||||
To MFS and MFS Related Entities of MFS Government Securities Portfolio* | 1,265,664 | 1,241,490 | 0 | 0 | 53,100 | 60,000 | ||||||||||||||||||
To MFS and MFS Related Entities of MFS High Yield Portfolio* | 1,265,664 | 1,241,490 | 0 | 0 | 53,100 | 60,000 | ||||||||||||||||||
To MFS and MFS Related Entities of MFS International Growth Portfolio* | 1,265,664 | 1,241,490 | 0 | 0 | 53,100 | 60,000 | ||||||||||||||||||
Table of Contents
2011 | 2010 | 2011 | 2010 | 2011 | 2010 | |||||||||||||||||||
To MFS and MFS Related Entities of MFS International Value Portfolio* | 1,265,664 | 1,241,490 | 0 | 0 | 53,100 | 60,000 | ||||||||||||||||||
To MFS and MFS Related Entities of MFS Massachusetts Investors Growth Stock Portfolio* | 1,265,664 | 1,241,490 | 0 | 0 | 53,100 | 60,000 | ||||||||||||||||||
To MFS and MFS Related Entities of MFS Mid Cap Growth Portfolio* | 1,265,664 | 1,241,490 | 0 | 0 | 53,100 | 60,000 | ||||||||||||||||||
To MFS and MFS Related Entities of MFS Money Market Portfolio* | 1,265,664 | 1,241,490 | 0 | 0 | 53,100 | 60,000 | ||||||||||||||||||
To MFS and MFS Related Entities of MFS New Discovery Portfolio* | 1,265,664 | 1,241,490 | 0 | 0 | 53,100 | 60,000 | ||||||||||||||||||
To MFS and MFS Related Entities of MFS Research International Portfolio* | 1,265,664 | 1,241,490 | 0 | 0 | 53,100 | 60,000 | ||||||||||||||||||
To MFS and MFS Related Entities of MFS Global Research Portfolio* | 1,265,664 | 1,241,490 | 0 | 0 | 53,100 | 60,000 | ||||||||||||||||||
To MFS and MFS Related Entities of MFS Strategic Income Portfolio* | 1,265,664 | 1,241,490 | 0 | 0 | 53,100 | 60,000 | ||||||||||||||||||
To MFS and MFS Related Entities of MFS Technology Portfolio* | 1,265,664 | 1,241,490 | 0 | 0 | 53,100 | 60,000 | ||||||||||||||||||
To MFS and MFS Related Entities of MFS Total Return Portfolio* | 1,265,664 | 1,241,490 | 0 | 0 | 53,100 | 60,000 | ||||||||||||||||||
To MFS and MFS Related Entities of MFS Utilities Portfolio* | 1,265,664 | 1,241,490 | 0 | 0 | 53,100 | 60,000 | ||||||||||||||||||
To MFS and MFS Related Entities of MFS Value Portfolio* | 1,265,664 | 1,241,490 | 0 | 0 | 53,100 | 60,000 | ||||||||||||||||||
| 2011 | 20104 | |||||||
Aggregate fees for non-audit services: | ||||||||
To MFS Blended Research Core Equity Portfolio, MFS and MFS Related Entities# | 1,626,770 | 1,784,749 | ||||||
To MFS Blended Research Growth Portfolio, MFS and MFS Related Entities# | 1,627,467 | 1,785,438 | ||||||
Table of Contents
To MFS Blended Research Value Portfolio, MFS and MFS Related Entities# | 1,627,467 | 1,785,438 | ||||||
To MFS Bond Portfolio, MFS and MFS Related Entities# | 1,624,370 | 1,782,349 | ||||||
To MFS Core Equity Portfolio, MFS and MFS Related Entities# | 1,624,370 | 1,782,349 | ||||||
To MFS Growth Portfolio, MFS and MFS Related Entities# | 1,624,370 | 1,782,349 | ||||||
To MFS Emerging Markets Equity Portfolio, MFS and MFS Related Entities# | 1,626,770 | 1,784,749 | ||||||
To MFS Global Governments Portfolio, MFS and MFS Related Entities# | 1,624,370 | 1,782,349 | ||||||
To MFS Global Growth Portfolio MFS and MFS Related Entities# | 1,626,770 | 1,784,749 | ||||||
To MFS Global Tactical Allocation Portfolio, MFS and MFS Related Entities# | 1,626,770 | 1,784,749 | ||||||
To MFS Government Securities Portfolio, MFS and MFS Related Entities# | 1,624,370 | 1,782,349 | ||||||
To MFS High Yield Portfolio, MFS and MFS Related Entities# | 1,624,370 | 1,782,349 | ||||||
To MFS International Growth Portfolio, MFS and MFS Related Entities# | 1,626,770 | 1,784,749 | ||||||
To MFS International Value Portfolio, MFS and MFS Related Entities# | 1,626,770 | 1,784,749 | ||||||
To MFS Massachusetts Investors Growth Stock Portfolio, MFS and MFS Related Entities# | 1,624,370 | 1,782,349 | ||||||
To MFS Mid Cap Growth Portfolio, MFS and MFS Related Entities# | 1,624,370 | 1,782,349 | ||||||
To MFS Money Market Portfolio, MFS and MFS Related Entities# | 1,624,370 | 1,782,349 | ||||||
To MFS New Discovery Portfolio, MFS and MFS Related Entities# | 1,624,370 | 1,782,349 |
Table of Contents
To MFS Research International Portfolio, MFS and MFS Related Entities# | 1,626,770 | 1,784,749 | ||||||
To MFS Global Research Portfolio, MFS and MFS Related Entities# | 1,626,770 | 1,784,749 | ||||||
To MFS Strategic Income Portfolio, MFS and MFS Related Entities# | 1,624,370 | 1,782,349 | ||||||
To MFS Technology Portfolio, MFS and MFS Related Entities# | 1,626,770 | 1,784,749 | ||||||
To MFS Total Return Portfolio, MFS and MFS Related Entities# | 1,624,369 | 1,782,349 | ||||||
To MFS Utilities Portfolio, MFS and MFS Related Entities# | 1,624,369 | 1,782,348 | ||||||
To MFS Value Portfolio, MFS and MFS Related Entities# | 1,624,369 | 1,782,348 |
| * | This amount reflects the fees billed to MFS and MFS Related Entities for non-audit services relating directly to the operations and financial reporting of the Funds (portions of which services also related to the operations and financial reporting of other funds within the MFS Funds complex). |
| # | This amount reflects the aggregate fees billed by Deloitte for non-audit services rendered to the Funds and for non-audit services rendered to MFS and the MFS Related Entities. |
| 1 | The fees included under “Audit-Related Fees” are fees related to assurance and related services that are reasonably related to the performance of the audit or review of financial statements, but not reported under “Audit Fees,” including accounting consultations, agreed-upon procedure reports, attestation reports, comfort letters and internal control reviews. |
| 2 | The fees included under “Tax Fees” are fees associated with tax compliance, tax advice and tax planning, including services relating to the filing or amendment of federal, state or local income tax returns, regulated investment company qualification reviews and tax distribution and analysis. |
| 3 | The fees included under “All Other Fees” are fees for products and services provided by Deloitte other than those reported under “Audit Fees,” “Audit-Related Fees” and “Tax Fees,” including fees for services related to review of internal controls and review of Rule 38a-1 compliance program. |
| 4 | Certain Deloitte fees reported in 2010 have been restated in this filing from those reported in the Registrant’s filing for the reporting period ended December 31, 2010. |
Table of Contents
Item 4(e)(1):
Set forth below are the policies and procedures established by the Audit Committee of the Board of Trustees relating to the pre-approval of audit and non-audit related services:
To the extent required by applicable law, pre-approval by the Audit Committee of the Board is needed for all audit and permissible non-audit services rendered to the Funds and all permissible non-audit services rendered to MFS or MFS Related Entities if the services relate directly to the operations and financial reporting of the Registrant. Pre-approval is currently on an engagement-by-engagement basis. In the event pre-approval of such services is necessary between regular meetings of the Audit Committee and it is not practical to wait to seek pre-approval at the next regular meeting of the Audit Committee, pre-approval of such services may be referred to the Chair of the Audit Committee for approval; provided that the Chair may not pre-approve any individual engagement for such services exceeding $50,000 or multiple engagements for such services in the aggregate exceeding $100,000 in each period between regular meetings of the Audit Committee. Any engagement pre-approved by the Chair between regular meetings of the Audit Committee shall be presented for ratification by the entire Audit Committee at its next regularly scheduled meeting.
Item 4(e)(2):
None, or 0%, of the services relating to the Audit-Related Fees, Tax Fees and All Other Fees paid by the Fund and MFS and MFS Related Entities relating directly to the operations and financial reporting of the Registrant disclosed above were approved by the audit committee pursuant to paragraphs (c)(7)(i)(C) of Rule 2-01 of Regulation S-X (which permits audit committee approval after the start of the engagement with respect to services other than audit, review or attest services, if certain conditions are satisfied).
Item 4(f): Not applicable.
Item 4(h): The Registrant’s Audit Committee has considered whether the provision by a Registrant’s independent registered public accounting firm of non-audit services to MFS and MFS Related Entities that were not pre-approved by the Committee (because such services did not relate directly to the operations and financial reporting of the Registrant) was compatible with maintaining the independence of the independent registered public accounting firm as the Registrant’s principal auditors.
| ITEM 5. | AUDIT COMMITTEE OF LISTED REGISTRANTS. |
Not applicable to the Registrant.
| ITEM 6. | SCHEDULE OF INVESTMENTS |
A schedule of investments of the Registrant is included as part of the report to shareholders of such series under Item 1 of this Form N-CSR.
Table of Contents
| ITEM 7. | DISCLOSURE OF PROXY VOTING POLICIES AND PROCEDURES FOR CLOSED-END MANAGEMENT INVESTMENT COMPANIES. |
Not applicable to the Registrant.
| ITEM 8. | PORTFOLIO MANAGERS OF CLOSED-END MANAGEMENT INVESTMENT COMPANIES. |
Not applicable to the Registrant.
| ITEM 9. | PURCHASES OF EQUITY SECURITIES BY CLOSED-END MANAGEMENT INVESTMENT COMPANY AND AFFILIATED PURCHASERS. |
Not applicable to the Registrant.
| ITEM 10. | SUBMISSION OF MATTERS TO A VOTE OF SECURITY HOLDERS. |
There were no material changes to the procedures by which shareholders may send recommendations to the Board for nominees to the Registrant’s Board since the Registrant last provided disclosure as to such procedures in response to the requirements of Item 407 (c)(2)(iv) of Regulation S-K or this Item.
| ITEM 11. | CONTROLS AND PROCEDURES. |
| (a) | Based upon their evaluation of the effectiveness of the registrant’s disclosure controls and procedures (as defined in Rule 30a-3(c) under the Investment Company Act of 1940 (the “Act”)) as conducted within 90 days of the filing date of this report on Form N-CSR, the registrant’s principal financial officer and principal executive officer have concluded that those disclosure controls and procedures provide reasonable assurance that the material information required to be disclosed by the registrant on this report is recorded, processed, summarized and reported within the time periods specified in the Securities and Exchange Commission’s rules and forms. |
| (b) | There were no changes in the registrant’s internal controls over financial reporting (as defined in Rule 30a-3(d) under the Act) that occurred during the second fiscal quarter of the period covered by the report that have materially affected, or are reasonably likely to materially affect, the registrant’s internal control over financial reporting. |
| ITEM 12. | EXHIBITS. |
| (a) | File the exhibits listed below as part of this form. Letter or number the exhibits in the sequence indicated. |
| (1) | Any code of ethics, or amendment thereto, that is the subject of the disclosure required by Item 2, to the extent that the registrant intends to satisfy the Item 2 requirements through filing of an exhibit: Code of Ethics attached hereto. |
Table of Contents
| (2) | A separate certification for each principal executive officer and principal financial officer of the registrant as required by Rule 30a-2(a) under the Act (17 CFR 270.30a-2): Attached hereto. |
| (b) | If the report is filed under Section 13(a) or 15(d) of the Exchange Act, provide the certifications required by Rule 30a-2(b) under the Act (17 CFR 270.30a-2(b)), Rule 13a-14(b) or Rule 15d-14(b) under the Exchange Act (17 CFR 240.13a-14(b) or 240.15d-14(b)) and Section 1350 of Chapter 63 of Title 18 of the United States Code (18 U.S.C. 1350) as an exhibit. A certification furnished pursuant to this paragraph will not be deemed “filed” for the purposes of Section 18 of the Exchange Act (15 U.S.C. 78r), or otherwise subject to the liability of that section. Such certification will not be deemed to be incorporated by reference into any filing under the Securities Act of 1933 or the Exchange Act, except to the extent that the registrant specifically incorporates it by reference: Attached hereto. |
Table of Contents
Notice
A copy of the Amended and Restated Declaration of Trust, as amended, of the Registrant is on file with the Secretary of State of The Commonwealth of Massachusetts and notice is hereby given that this instrument is executed on behalf of the Registrant by an officer of the Registrant as an officer and not individually and the obligations of or arising out of this instrument are not binding upon any of the Trustees or shareholders individually, but are binding only upon the assets and property of the respective constituent series of the Registrant.
Table of Contents
SIGNATURES
Pursuant to the requirements of the Securities Exchange Act of 1934 and the Investment Company Act of 1940, the registrant has duly caused this report to be signed on its behalf by the undersigned, thereunto duly authorized.
(Registrant) MFS VARIABLE INSURANCE TRUST II
| By (Signature and Title)* | JOHN M. CORCORAN | |
| John M. Corcoran, President |
Date: February 15, 2012
Pursuant to the requirements of the Securities Exchange Act of 1934 and the Investment Company Act of 1940, this report has been signed below by the following persons on behalf of the registrant and in the capacities and on the dates indicated.
| By (Signature and Title)* | JOHN M. CORCORAN | |
John M. Corcoran, President (Principal Executive Officer) |
Date: February 15, 2012
| By (Signature and Title)* | DAVID L. DILORENZO | |
David L. DiLorenzo, Treasurer (Principal Financial Officer and Accounting Officer) |
Date: February 15, 2012
| * | Print name and title of each signing officer under his or her signature. |