Table of Contents
UNITED STATES
SECURITIES AND EXCHANGE COMMISSION
Washington, D.C. 20549
FORM N-CSR
CERTIFIED SHAREHOLDER REPORT OF
REGISTERED MANAGEMENT INVESTMENT COMPANIES
Investment Company Act file number 811-03732
MFS VARIABLE INSURANCE TRUST II
(Exact name of registrant as specified in charter)
111 Huntington Avenue, Boston, Massachusetts 02199
(Address of principal executive offices) (Zip code)
Susan S. Newton
Massachusetts Financial Services Company
111 Huntington Avenue
Boston, Massachusetts 02199
(Name and address of agents for service)
Registrant’s telephone number, including area code: (617) 954-5000
Date of fiscal year end: December 31
Date of reporting period: December 31, 2012
| * | Effective July 3, 2012, MFS Blended Research Growth Portfolio and MFS Blended Research Value Portfolio were terminated as series of the Registrant. |
| ** | Effective August 17, 2012, MFS Growth Portfolio, a series of the Registrant, was reorganized into MFS Growth Series, a series of MFS Variable Insurance Trust, and MFS Mid Cap Growth Portfolio a series of the Registrant, was reorganized into MFS Mid Cap Growth Series, a series of MFS Variable Insurance Trust. Effective August 22, 2012, MFS Growth Portfolio and MFS Mid Cap Growth Portfolio were terminated as series of the Registrant. |
Table of Contents
| ITEM 1. | REPORTS TO STOCKHOLDERS. |
MFS Blended Research Growth Portfolio, MFS Blended Research Value Portfolio, MFS Growth Portfolio, and MFS Mid Cap Growth Portfolio, each a series of the Registrant, did not have any shareholders as of period end. For further information please see the introductory footnote.
Table of Contents
ANNUAL REPORT
December 31, 2012

MFS® TECHNOLOGY PORTFOLIO
MFS® Variable Insurance Trust II

TKS-ANN
Table of Contents
MFS® TECHNOLOGY PORTFOLIO
The report is prepared for the general information of contract owners. It is authorized for distribution to prospective investors only when preceded or accompanied by a current prospectus.
NOT FDIC INSURED Ÿ MAY LOSE VALUE Ÿ NO BANK OR CREDIT UNION GUARANTEE Ÿ NOT A DEPOSIT Ÿ NOT INSURED BY ANY FEDERAL GOVERNMENT AGENCY OR NCUA/NCUSIF
Table of Contents
MFS Technology Portfolio
LETTER FROM THE CHAIRMAN AND CEO

Dear Contract Owners:
The global market outlook for 2013 is one of cautious optimism. While we are seeing some positive economic trends in the United States, Europe and China, the overall environment remains challenging. In the United States, the recent fiscal cliff agreement was received positively by investors, even though it mostly addressed pressing taxation issues and did not resolve additional concerns, including the need for spending cuts and a large-scale reduction of the federal debt. These issues will be front and center again in the spring. Despite the ongoing uncertainty, economic tailwinds are gathering strength as the U.S. housing and job markets are improving and consumer confidence is rising.
Overseas, the debt crisis continues to weigh heavily on eurozone markets, with even Germany — long an economic stalwart — experiencing some contraction. These ongoing challenges could be a drag on global market performance this year. In Asia, manufacturing activity has accelerated in emerging markets such as China and India, and we are seeing signs of stabilized loan growth in China, a leading indicator of that country’s economic health. In contrast, Japan’s economy is contracting sharply under deflationary pressures. Nevertheless, Japanese markets have responded favorably to early actions by the new government, which appears determined to act aggressively, along with the Bank of Japan, to stimulate growth.
As always, managing risk in the face of uncertainty remains a top priority for investors. At MFS®, our uniquely collaborative investment process revolves around global research and our disciplined risk management approach. Our global team of investment professionals shares ideas and evaluates opportunities across continents, investment disciplines and asset classes — all with a goal of building better insights, and ultimately better results, for our clients.
We remain mindful of the many economic challenges investors face today, and believe it is more important than ever to maintain a long-term view, employ time-tested principles, such as asset allocation and diversification, and work closely with investment advisors to identify and pursue the most suitable opportunities.
Respectfully,

Robert J. Manning
Chairman and Chief Executive Officer
MFS Investment Management®
February 15, 2013
The opinions expressed in this letter are subject to change, may not be relied upon for investment advice, and no forecasts can be guaranteed.
1
Table of Contents
MFS Technology Portfolio
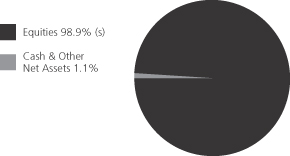
Portfolio structure (i)
| Top ten holdings (i) | ||||
| Google, Inc., “A” | 9.6% | |||
| Apple, Inc. | 9.1% | |||
| Oracle Corp. | 5.3% | |||
| Qualcomm, Inc. | 5.0% | |||
| Visa, Inc., “A” | 4.1% | |||
| MasterCard, Inc., “A” | 4.0% | |||
| Amazon.com, Inc. | 3.9% | |||
| EMC Corp. | 3.5% | |||
Apple, Inc. – June 2013 @$550 | 3.3% | |||
| Priceline.com, Inc. | 3.2% |
| Top five industries (i) | ||||
| Computer Software – Systems (s) | 22.9% | |||
| Internet | 15.3% | |||
| Computer Software (s) | 14.0% | |||
| Electronics (s) | 12.0% | |||
| Network & Telecom | 9.4% |
| (i) | For purposes of this presentation, the components include the market value of securities, less any securities sold short, and reflect the impact of the equivalent exposure of derivative positions. These amounts may be negative from time to time. Equivalent exposure is a calculated amount that translates the derivative position into a reasonable approximation of the amount of the underlying asset that the portfolio would have to hold at a given point in time to have the same price sensitivity that results from the portfolio’s ownership of the derivative contract. When dealing with derivatives, equivalent exposure is a more representative measure of the potential impact of a position on portfolio performance than market value. |
| (s) | Includes securities sold short. |
Percentages are based on net assets as of 12/31/12.
The portfolio is actively managed and current holdings may be different.
2
Table of Contents
MFS Technology Portfolio
Summary of Results
For the twelve months ended December 31, 2012, Initial Class shares of the MFS Technology Portfolio (“fund”) provided a total return of 14.60%, while Service Class shares of the fund provided a total return of 14.26%. These compare with a return of 16.00% over the same period for the fund’s benchmark, the Standard & Poor’s 500 Stock Index, and a return of 15.23% for the fund’s other benchmark, the Standard & Poor’s North American Technology Sector Index.
Market Environment
The beginning of the period was characterized by a risk-on sentiment as a result of additional liquidity measures by the Federal Reserve Bank (“Fed”) and the European Central Bank (“ECB”) as well as a commensurate improvement in macroeconomic conditions. During this time, global equity valuations rose, credit spreads contracted, and high-quality sovereign yields increased modestly.
During the middle of the period, however, conditions worsened, driven by broadly weaker global macroeconomic indicators, as well as renewed concerns over the eurozone’s capacity and determination to address its ongoing crisis. Despite this deterioration, broad market sentiment remained relatively resilient as equity markets generally maintained gains and credit spreads did not indicate deterioration.
However, this renewed weakness in the fundamentals precipitated a further round of monetary easing by both the Fed (through a third round of quantitative easing) and the ECB (through a new bond purchase facility) in the second half of the period, which soon instilled additional confidence in risk markets. Nonetheless, towards the end of the period, weaker equity earnings reports and declining forward guidance caused market sentiment to soften. In addition, as we moved toward year end, the fiscal cliff negotiations between the Republicans in the U.S. Congress and President Obama were a particular source of market attention, where uncertainty surrounding the fiscal negotiations continued right up to the end-of-year deadline.
Detractors from Performance
The combination of an underweight position and stock selection in the business services industry detracted from performance relative to the Standard & Poor’s North American Technology Sector Index. Within this industry, short positions in the common stock of IT and professional services company Computer Sciences and managed network services company Equinix (h) hindered relative results as both stocks turned in strong performance for the period.
Security selection in the consumer services industry was another factor that held back relative returns. There were no stocks within this industry that were among the fund’s top relative detractors for the reporting period.
Elsewhere, the fund’s holdings of computer products and services provider Hewlett-Packard, semiconductor manufacturer Microchip Technology, semiconductor company Atmel, Internet search giant Google, wireless communications equipment producer Aeroflex, access infrastructure software manufacturer Citrix Systems, and intellectual property licensor CEVA (b)(h) weakened relative performance as all seven stocks lagged the index over the period. Shares of Hewlett-Packard declined steadily throughout the period as the company began its business-wide strategic restructuring in the face of an uncertain macro-economic environment.
The fund’s cash and/or cash equivalents position was also a detractor from relative performance. The fund strives to be fully invested and generally holds cash to buy new holdings and to provide liquidity. In a period when equity markets rose, as measured by the fund’s benchmark, holding cash hurt performance versus the benchmark, which has no cash position.
Contributors to Performance
The combination of an underweight position and stock selection in the electronics industry was a primary factor that contributed to relative performance. Within the industry, holdings of telecommunications service provider JDS Uniphase benefited relative performance as the stock outperformed the benchmark. The fund’s avoidance in shares of the common stock of semiconductor company Intel also aided relative returns as the stock lagged the index during the reporting period.
Stock selection and an overweight position in the other banks and diversified financials industry was another contributor to relative performance. There were no stocks within this industry that were among the fund’s top relative contributors for the period.
Security selection in the computer software industry also aided relative results. Here, overweight allocations to open source software solution provider Red Hat and customer information software manager Salesforce.com benefited relative performance. Shares of Red Hat appreciated during the period as the company released strong earnings results driven by better revenues in the Red Hat Enterprise Linux segment. Additionally, the company announced the release of Red Hat Enterprise Virtualization which better positions the company in the server virtualization market. In addition, short positioning in digital entertainment technology solution provider Rovi (h) contributed to relative returns as the stock underperformed the benchmark.
3
Table of Contents
MFS Technology Portfolio
Management Review – continued
Elsewhere, holdings of specialized payment products and services company FleetCor Technologies, computer and personal electronics maker Apple, and online auctioneer eBay aided relative results as all three stocks outpaced the benchmark. Shares of FleetCor Technologies traded higher during the latter part of the period as the company announced earnings that beat analysts’ expectations as a result of revenue growth and margin expansion. This allowed management to raise its revenue and earnings guidance for the year. An underweight position in diversified technology products and services company International Business Machines (IBM), and a short position in direct-sale computer vendor Dell (h), also benefited relative returns as both stocks posted weak returns for the reporting period.
Respectfully,
Matthew Sabel
Portfolio Manager
| (b) | Security is not a benchmark constituent. |
| (h) | Security was not held in the portfolio at period end. |
The views expressed in this report are those of the portfolio manager only through the end of the period of the report as stated on the cover and do not necessarily reflect the views of MFS or any other person in the MFS organization. These views are subject to change at any time based on market or other conditions, and MFS disclaims any responsibility to update such views. These views may not be relied upon as investment advice or an indication of trading intent on behalf of any MFS portfolio. References to specific securities are not recommendations of such securities, and may not be representative of any MFS portfolio’s current or future investments.
4
Table of Contents
MFS Technology Portfolio
PERFORMANCE SUMMARY THROUGH 12/31/12
The following chart illustrates the historical performance of the fund in comparison to its benchmark(s). Benchmarks are unmanaged and may not be invested in directly. Benchmark returns do not reflect any fees or expenses. The performance of other share classes will be greater than or less than that of the class depicted below. (See Notes to Performance Summary.)
Performance data shown represents past performance and is no guarantee of future results. Investment return and principal value fluctuate so your units, when sold, may be worth more or less than the original cost; current performance may be lower or higher than quoted. The performance shown does not reflect the deduction of taxes, if any, that a contract holder would pay on fund distributions or the redemption of contract units. The returns for the fund shown also do not reflect the deduction of expenses associated with variable products, such as mortality and expense risk charges, separate account charges, and sales charges imposed by the insurance company separate accounts. Such expenses would reduce the overall returns shown.
Growth of a Hypothetical $10,000 Investment
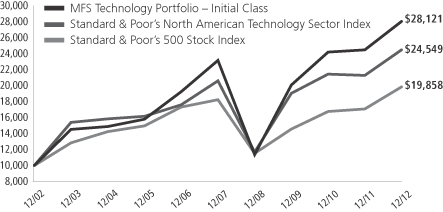
Total Returns through 12/31/12
Average annual total returns
| Share Class | Class inception date | 1-yr | 5-yr | 10-yr | ||||||||
| Initial Class | 6/16/00 | 14.60% | 3.93% | 10.89% | ||||||||
| Service Class | 8/24/01 | 14.26% | 3.68% | 10.63% | ||||||||
| Comparative benchmarks | ||||||||||||
| Standard & Poor’s 500 Stock Index (f) | 16.00% | 1.66% | 7.10% | |||||||||
| Standard & Poor’s North American Technology Sector Index (f) | 15.23% | 3.54% | 9.40% | |||||||||
| (f) | Source: FactSet Research Systems Inc. |
Benchmark Definitions
Standard & Poor’s 500 Stock Index – a market capitalization-weighted index of 500 widely held equity securities, designed to measure broad U.S. equity performance.
Standard & Poor’s North American Technology Sector Index – a modified market capitalization-weighted index that measures the performance of selected technology stocks.
It is not possible to invest directly in an index.
Notes to Performance Summary
Average annual total return represents the average annual change in value for each share class for the periods presented.
Performance results reflect any applicable expense subsidies and waivers in effect during the periods shown. Without such subsidies and waivers the fund’s performance results would be less favorable. Please see the prospectus and financial statements for complete details. All results are historical and assume the reinvestment of any dividends and capital gains distributions.
Performance results do not include adjustments made for financial reporting purposes in accordance with U.S. generally accepted accounting principles and may differ from amounts reported in the financial highlights.
From time to time the fund may receive proceeds from litigation settlements, without which performance would be lower.
5
Table of Contents
MFS Technology Portfolio
Fund Expenses Borne by the Contract Holders During the Period,
July 1, 2012 through December 31, 2012
As a contract holder of the fund, you incur ongoing costs, including management fees; distribution and/or service (12b-1) fees; and other fund expenses. This example is intended to help you understand your ongoing costs (in dollars) of investing in the fund and to compare these costs with the ongoing costs of investing in other mutual funds.
The example is based on an investment of $1,000 invested at the beginning of the period and held for the entire period July 1, 2012 through December 31, 2012.
Actual Expenses
The first line for each share class in the following table provides information about actual account values and actual expenses. You may use the information in this line, together with the amount you invested, to estimate the expenses that you paid over the period. Simply divide your account value by $1,000 (for example, an $8,600 account value divided by $1,000 = 8.6), then multiply the result by the number in the first line under the heading entitled “Expenses Paid During Period” to estimate the expenses you paid on your account during this period.
Hypothetical Example for Comparison Purposes
The second line for each share class in the following table provides information about hypothetical account values and hypothetical expenses based on the fund’s actual expense ratio and an assumed rate of return of 5% per year before expenses, which is not the fund’s actual return. The hypothetical account values and expenses may not be used to estimate the actual ending account balance or expenses you paid for the period. You may use this information to compare the ongoing costs of investing in the fund and other funds. To do so, compare this 5% hypothetical example with the 5% hypothetical examples that appear in the shareholder reports of the other funds.
Please note that the expenses shown in the table are meant to highlight the fund’s ongoing costs only and do not take into account the fees and expenses imposed under the variable contracts through which your investment in the fund is made. Therefore, the second line for each share class in the table is useful in comparing ongoing costs associated with an investment in vehicles (such as the fund) which fund benefits under variable annuity and variable life insurance contracts and to qualified pension and retirement plans only, and will not help you determine the relative total costs of investing in the fund through variable annuity and variable life insurance contracts. If the fees and expenses imposed under the variable contracts were included, your costs would have been higher.
| Share Class | Annualized Expense Ratio | Beginning Account Value 7/01/12 | Ending Account Value | Expenses Paid During Period (p) 7/01/12-12/31/12 | ||||||||||||||
| Initial Class | Actual | 1.22% | $1,000.00 | $1,053.12 | $6.30 | |||||||||||||
| Hypothetical (h) | 1.22% | $1,000.00 | $1,019.00 | $6.19 | ||||||||||||||
| Service Class | Actual | 1.51% | $1,000.00 | $1,051.98 | $7.79 | |||||||||||||
| Hypothetical (h) | 1.51% | $1,000.00 | $1,017.55 | $7.66 | ||||||||||||||
| (h) | 5% class return per year before expenses. |
| (p) | Expenses paid are equal to each class’s annualized expense ratio, as shown above, multiplied by the average account value over the period, multiplied by the number of days in the period, divided by the number of days in the year. |
Expenses Impacting Table
Expense ratios include 0.22% (Initial Class) and 0.26% (Service Class) of investment related expenses from short sale dividend and interest expenses that are outside of the expense limitation arrangement (See Note 3 of the Notes to Financial Statements).
6
Table of Contents
MFS Technology Portfolio
PORTFOLIO OF INVESTMENTS – 12/31/12
The Portfolio of Investments is a complete list of all securities owned by your fund. It is categorized by broad-based asset classes.
| Issuer | Shares/Par | Value ($) | ||||||
| COMMON STOCKS – 98.2% | ||||||||
| Broadcasting – 2.7% | ||||||||
| Discovery Communications, Inc., “C” (a) | 1,900 | $ | 111,150 | |||||
| News Corp., “A” | 24,790 | 633,137 | ||||||
| Viacom, Inc., “B” | 8,800 | 464,112 | ||||||
|
| |||||||
| $ | 1,208,399 | |||||||
|
| |||||||
| Business Services – 5.0% | ||||||||
| Accenture PLC, “A” | 11,770 | $ | 782,705 | |||||
| Cognizant Technology Solutions Corp., “A” (a) | 10,500 | 777,525 | ||||||
| FleetCor Technologies, Inc. (a) | 12,720 | 682,428 | ||||||
|
| |||||||
| $ | 2,242,658 | |||||||
|
| |||||||
| Cable TV – 0.5% | ||||||||
| Ziggo N.V. | 6,700 | $ | 216,537 | |||||
|
| |||||||
| Computer Software – 15.0% | ||||||||
| Autodesk, Inc. (a) | 10,040 | $ | 354,914 | |||||
| BMC Software, Inc. (a) | 5,030 | 199,490 | ||||||
| Check Point Software Technologies Ltd. (a) | 3,070 | 146,255 | ||||||
| Citrix Systems, Inc. (a) | 9,880 | 649,610 | ||||||
| Microsoft Corp. | 23,180 | 619,601 | ||||||
| Oracle Corp. (s) | 71,920 | 2,396,374 | ||||||
| Parametric Technology Corp. (a) | 12,540 | 282,275 | ||||||
| Qlik Technologies, Inc. (a) | 13,420 | 291,482 | ||||||
| Red Hat, Inc. (a) | 4,810 | 254,738 | ||||||
| Salesforce.com, Inc. (a) | 7,240 | 1,217,044 | ||||||
| TIBCO Software, Inc. (a) | 14,720 | 323,987 | ||||||
|
| |||||||
| $ | 6,735,770 | |||||||
|
| |||||||
| Computer Software – Systems – 20.2% | ||||||||
| Apple, Inc. (s) | 7,670 | $ | 4,088,340 | |||||
| EMC Corp. (a) | 62,280 | 1,575,684 | ||||||
| FleetMatics Group PLC (a) | 8,960 | 225,434 | ||||||
| Fusion-io, Inc. (a) | 10,700 | 245,351 | ||||||
| Guidewire Software, Inc. (a) | 10,210 | 303,441 | ||||||
| Hewlett-Packard Co. | 91,880 | 1,309,290 | ||||||
| International Business Machines Corp. | 5,920 | 1,133,976 | ||||||
| ServiceNow, Inc. (a) | 3,570 | 107,207 | ||||||
| Splunk, Inc. (a) | 3,200 | 92,864 | ||||||
|
| |||||||
| $ | 9,081,587 | |||||||
|
| |||||||
| Consumer Services – 3.2% | ||||||||
| Priceline.com, Inc. (a) | 2,340 | $ | 1,453,608 | |||||
|
| |||||||
| Electrical Equipment – 1.8% | ||||||||
| Amphenol Corp., “A” | 10,450 | $ | 676,115 | |||||
| W.W. Grainger, Inc. | 680 | 137,612 | ||||||
|
| |||||||
| $ | 813,727 | |||||||
|
| |||||||
| Electronics – 12.9% | ||||||||
| Aeroflex Holding Corp. (a) | 45,050 | $ | 315,350 | |||||
| Altera Corp. | 27,500 | 947,100 | ||||||
| ARM Holdings PLC, ADR | 1,800 | 68,094 | ||||||
| Atmel Corp. (a) | 44,930 | 294,292 | ||||||
| Issuer | Shares/Par | Value ($) | ||||||
| COMMON STOCKS – continued | ||||||||
| Electronics – continued | ||||||||
| Broadcom Corp., “A” | 16,030 | $ | 532,356 | |||||
| Corning, Inc. | 49,840 | 628,981 | ||||||
| JDS Uniphase Corp. (a) | 93,270 | 1,262,876 | ||||||
| Linear Technology Corp. | 11,500 | 394,450 | ||||||
| Mellanox Technologies Ltd. (a) | 1,000 | 59,380 | ||||||
| Microchip Technology, Inc. | 40,770 | 1,328,694 | ||||||
|
| |||||||
| $ | 5,831,573 | |||||||
|
| |||||||
| Internet – 15.3% | ||||||||
| eBay, Inc. (a) | 28,270 | $ | 1,442,335 | |||||
| Google, Inc., “A” (a)(s) | 6,070 | 4,305,876 | ||||||
| Rackspace Hosting, Inc. (a) | 2,430 | 180,476 | ||||||
| Yahoo!, Inc. (a) | 48,410 | 963,359 | ||||||
|
| |||||||
| $ | 6,892,046 | |||||||
|
| |||||||
| Network & Telecom – 9.4% | ||||||||
| Finisar Corp. (a) | 64,280 | $ | 1,047,764 | |||||
| Fortinet, Inc. (a) | 14,790 | 311,625 | ||||||
| Juniper Networks, Inc. (a) | 31,580 | 621,179 | ||||||
| Qualcomm, Inc. | 36,220 | 2,246,364 | ||||||
|
| |||||||
| $ | 4,226,932 | |||||||
|
| |||||||
| Other Banks & Diversified Financials – 8.1% | ||||||||
| MasterCard, Inc., “A” | 3,700 | $ | 1,817,736 | |||||
| Visa, Inc., “A” | 12,120 | 1,837,150 | ||||||
|
| |||||||
| $ | 3,654,886 | |||||||
|
| |||||||
| Specialty Stores – 3.9% | ||||||||
| Amazon.com, Inc. (a) | 6,920 | $ | 1,737,889 | |||||
|
| |||||||
| Telecommunications – Wireless – 0.2% | ||||||||
| SBA Communications Corp. (a) | 1,600 | $ | 113,632 | |||||
|
| |||||||
| Total Common Stocks (Identified Cost, $41,386,031) | $ | 44,209,244 | ||||||
|
| |||||||
| Issuer/Expiration Date/Strike Price | Number of Contracts | |||||||
| CALL OPTIONS PURCHASED – 0.5% | ||||||||
| Computer Software – Systems – 0.5% | ||||||||
| Apple, Inc. – June 2013 @ $550 (Identified Cost, $304,758) | 57 | $ | 232,674 | |||||
|
| |||||||
| Issuer | Shares/Par | |||||||
| MONEY MARKET FUNDS – 0.9% | ||||||||
| MFS Institutional Money Market Portfolio, 0.16%, at Cost and Net Asset Value (v) | 391,077 | $ | 391,077 | |||||
|
| |||||||
| Total Investments (Identified Cost, $42,081,866) | $ | 44,832,995 | ||||||
|
| |||||||
| SECURITIES SOLD SHORT – (2.6)% | ||||||||
| Business Services – (0.1)% | ||||||||
| Computer Sciences Corp. | (1,700 | ) | $ | (68,085 | ) | |||
|
| |||||||
7
Table of Contents
MFS Technology Portfolio
Portfolio of Investments – continued
| Issuer | Shares/Par | Value ($) | ||||||
| SECURITIES SOLD SHORT – continued | ||||||||
| Computer Software – (1.0)% | ||||||||
| Adobe Systems, Inc. (a) | (11,900 | ) | $ | (448,392 | ) | |||
|
| |||||||
| Computer Software – Systems – (0.6)% | ||||||||
| NetApp, Inc. (a) | (7,600 | ) | $ | (254,980 | ) | |||
|
| |||||||
| Electronics – (0.9)% | ||||||||
| Dolby Laboratories, Inc., “A” | (7,200 | ) | $ | (211,176 | ) | |||
| Xilinx, Inc. | (5,100 | ) | (183,090 | ) | ||||
|
| |||||||
| $ | (394,266 | ) | ||||||
|
| |||||||
| Total Securities Sold Short (Proceeds Received, $1,053,152) | $ | (1,165,723 | ) | |||||
|
| |||||||
| OTHER ASSETS, LESS LIABILITIES – 3.0% | 1,362,147 | |||||||
|
| |||||||
| Net Assets – 100.0% | $ | 45,029,419 | ||||||
|
| |||||||
| (a) | Non-income producing security. |
| (s) | Security or a portion of the security was pledged to cover collateral requirements for securities sold short and/or certain derivative transactions. |
| (v) | Underlying affiliated fund that is available only to investment companies managed by MFS. The rate quoted for the MFS Institutional Money Market Portfolio is the annualized seven-day yield of the fund at period end. |
At December 31, 2012, the fund had cash collateral of $1,133,476 and/or other liquid securities with an aggregate value of $697,645 to cover any commitments for securities sold short and/or certain derivative contracts. Cash collateral is comprised of “Deposits with brokers” in the Statement of Assets and Liabilities.
The following abbreviations are used in this report and are defined:
| ADR | American Depositary Receipt |
| PLC | Public Limited Company |
See Notes to Financial Statements
8
Table of Contents
MFS Technology Portfolio
FINANCIAL STATEMENTS | STATEMENT OF ASSETS AND LIABILITIES
This statement represents your fund’s balance sheet, which details the assets and liabilities comprising the total value of the fund.
At 12/31/12 | ||||||||
Assets | ||||||||
Investments – | ||||||||
Non-affiliated issuers, at value (identified cost, $41,690,789) | $44,441,918 | |||||||
Underlying affiliated funds, at cost and value | 391,077 | |||||||
Total investments, at value (identified cost, $42,081,866) | $44,832,995 | |||||||
Deposits with brokers | 1,133,476 | |||||||
Receivables for | ||||||||
Fund shares sold | 271,319 | |||||||
Dividends | 12,315 | |||||||
Receivable from investment adviser | 3,088 | |||||||
Other assets | 765 | |||||||
Total assets | $46,253,958 | |||||||
Liabilities | ||||||||
Payables for | ||||||||
Dividends on securities sold short | $340 | |||||||
Securities sold short, at value (proceeds received, $1,053,152) | 1,165,723 | |||||||
Fund shares reacquired | 10,159 | |||||||
Payable to affiliates | ||||||||
Shareholder servicing costs | 32 | |||||||
Distribution and/or service fees | 857 | |||||||
Payable for independent Trustees’ compensation | 47 | |||||||
Accrued expenses and other liabilities | 47,381 | |||||||
Total liabilities | $1,224,539 | |||||||
Net assets | $45,029,419 | |||||||
Net assets consist of | ||||||||
Paid-in capital | $42,483,954 | |||||||
Unrealized appreciation (depreciation) on investments | 2,638,558 | |||||||
Accumulated net realized gain (loss) on investments and foreign currency | (93,093 | ) | ||||||
Net assets | $45,029,419 | |||||||
Shares of beneficial interest outstanding | 5,805,998 |
| Net assets | Shares outstanding | Net asset value per share | ||||||||||
Initial Class | $13,019,250 | 1,641,206 | $7.93 | |||||||||
Service Class | 32,010,169 | 4,164,792 | 7.69 | |||||||||
See Notes to Financial Statements
9
Table of Contents
MFS Technology Portfolio
FINANCIAL STATEMENTS | STATEMENT OF OPERATIONS
This statement describes how much your fund earned in investment income and accrued in expenses. It also describes any gains and/or losses generated by fund operations.
Year ended 12/31/12 | ||||||||
Net investment loss | ||||||||
Income | ||||||||
Dividends | $245,087 | |||||||
Interest | 6,686 | |||||||
Dividends from underlying affiliated funds | 666 | |||||||
Foreign taxes withheld | (841 | ) | ||||||
Total investment income | $251,598 | |||||||
Expenses | ||||||||
Management fee | $288,766 | |||||||
Distribution and/or service fees | 58,343 | |||||||
Shareholder servicing costs | 3,488 | |||||||
Administrative services fee | 17,500 | |||||||
Independent Trustees’ compensation | 1,621 | |||||||
Custodian fee | 13,650 | |||||||
Shareholder communications | 13,775 | |||||||
Audit and tax fees | 56,013 | |||||||
Legal fees | 954 | |||||||
Dividend and interest expense on securities sold short | 59,247 | |||||||
Miscellaneous | 10,789 | |||||||
Total expenses | $524,146 | |||||||
Fees paid indirectly | (20 | ) | ||||||
Reduction of expenses by investment adviser | (20,949 | ) | ||||||
Net expenses | $503,177 | |||||||
Net investment loss | $(251,579 | ) | ||||||
Realized and unrealized gain (loss) on investments and foreign currency | ||||||||
Realized gain (loss) (identified cost basis) | ||||||||
Investments | $2,528,806 | |||||||
Written options | 213,431 | |||||||
Securities sold short | (589,392 | ) | ||||||
Foreign currency | (277 | ) | ||||||
Net realized gain (loss) on investments and foreign currency | $2,152,568 | |||||||
Change in unrealized appreciation (depreciation) | ||||||||
Investments | $2,521,557 | |||||||
Written options | 2,775 | |||||||
Securities sold short | (90,119 | ) | ||||||
Net unrealized gain (loss) on investments | $2,434,213 | |||||||
Net realized and unrealized gain (loss) on investments | $4,586,781 | |||||||
Change in net assets from operations | $4,335,202 |
See Notes to Financial Statements
10
Table of Contents
MFS Technology Portfolio
FINANCIAL STATEMENTS | STATEMENTS OF CHANGES IN NET ASSETS
These statements describe the increases and/or decreases in net assets resulting from operations, any distributions, and any shareholder transactions.
For years ended 12/31 | 2012 | 2011 | ||||||
Change in net assets | ||||||||
From operations | ||||||||
Net investment loss | $(251,579 | ) | $(238,755 | ) | ||||
Net realized gain (loss) on investments and foreign currency | 2,152,568 | 1,809,543 | ||||||
Net unrealized gain (loss) on investments | 2,434,213 | (1,479,013 | ) | |||||
Change in net assets from operations | $4,335,202 | $91,775 | ||||||
Change in net assets from fund share transactions | $11,415,026 | $7,691,444 | ||||||
Total change in net assets | $15,750,228 | $7,783,219 | ||||||
Net assets | ||||||||
At beginning of period | 29,279,191 | 21,495,972 | ||||||
At end of period | $45,029,419 | $29,279,191 |
See Notes to Financial Statements
11
Table of Contents
MFS Technology Portfolio
FINANCIAL STATEMENTS | FINANCIAL HIGHLIGHTS
The financial highlights table is intended to help you understand the fund’s financial performance for the past 5 years. Certain information reflects financial results for a single fund share. The total returns in the table represent the rate by which an investor would have earned (or lost) on an investment in the fund share class (assuming reinvestment of all distributions) held for the entire period.
| Initial Class | Years ended 12/31 | |||||||||||||||||||
| 2012 | 2011 | 2010 | 2009 | 2008 | ||||||||||||||||
Net asset value, beginning of period | $6.92 | $6.84 | $5.67 | $3.21 | $6.54 | |||||||||||||||
| Income (loss) from investment operations | ||||||||||||||||||||
Net investment income (loss) (d) | $(0.04 | ) | $(0.05 | ) | $(0.00 | )(w) | $(0.00 | )(w) | $(0.00 | )(w) | ||||||||||
Net realized and unrealized gain (loss) on investments | 1.05 | 0.13 | 1.17 | 2.46 | (3.33) | |||||||||||||||
Total from investment operations | $1.01 | $0.08 | $1.17 | $2.46 | $(3.33) | |||||||||||||||
Net asset value, end of period (x) | $7.93 | $6.92 | $6.84 | $5.67 | $3.21 | |||||||||||||||
Total return (%) (k)(r)(s)(x) | 14.60 | 1.17 | 20.63 | 76.64 | (50.92) | |||||||||||||||
Ratios (%) (to average net assets) and Supplemental data: | ||||||||||||||||||||
Expenses before expense reductions (f) | 1.18 | 1.28 | 1.38 | 1.60 | 1.39 | |||||||||||||||
Expenses after expense reductions (f) | 1.13 | 1.08 | 1.07 | 1.04 | 1.02 | |||||||||||||||
Net investment loss | (0.51 | ) | (0.77 | ) | (0.07 | ) | (0.05 | ) | (0.00 | )(w) | ||||||||||
Portfolio turnover | 62 | 90 | 140 | 227 | 244 | |||||||||||||||
Net assets at end of period (000 omitted) | $13,019 | $14,598 | $15,844 | $14,542 | $8,051 | |||||||||||||||
| Supplemental Ratios (%): | ||||||||||||||||||||
Ratio of expenses to average net assets after expense reductions | 1.00 | 1.00 | 1.00 | 1.00 | 1.00 | |||||||||||||||
See Notes to Financial Statements
12
Table of Contents
MFS Technology Portfolio
Financial Highlights - continued
| Service Class | Years ended 12/31 | |||||||||||||||||||
| 2012 | 2011 | 2010 | 2009 | 2008 | ||||||||||||||||
Net asset value, beginning of period | $6.73 | $6.66 | $5.54 | $3.14 | $6.42 | |||||||||||||||
| Income (loss) from investment operations | ||||||||||||||||||||
Net investment income (loss) (d) | $(0.06 | ) | $(0.08 | ) | $(0.00 | )(w) | $(0.01 | ) | $(0.02 | ) | ||||||||||
Net realized and unrealized gain (loss) on investments | 1.02 | 0.15 | 1.12 | 2.41 | (3.26 | ) | ||||||||||||||
Total from investment operations | $0.96 | $0.07 | $1.12 | $2.40 | $(3.28 | ) | ||||||||||||||
Net asset value, end of period (x) | $7.69 | $6.73 | $6.66 | $5.54 | $3.14 | |||||||||||||||
Total return (%) (k)(r)(s)(x) | 14.26 | 1.05 | 20.22 | 76.43 | (51.09 | ) | ||||||||||||||
Ratios (%) (to average net assets) and Supplemental data: | ||||||||||||||||||||
Expenses before expense reductions (f) | 1.48 | 1.53 | 1.63 | 1.85 | 1.62 | |||||||||||||||
Expenses after expense reductions (f) | 1.42 | 1.33 | 1.32 | 1.29 | 1.27 | |||||||||||||||
Net investment loss | (0.74 | ) | (1.13 | ) | (0.04 | ) | (0.32 | ) | (0.29 | ) | ||||||||||
Portfolio turnover | 62 | 90 | 140 | 227 | 244 | |||||||||||||||
Net assets at end of period (000 omitted) | $32,010 | $14,681 | $5,652 | $1,776 | $990 | |||||||||||||||
| Supplemental Ratios (%): | ||||||||||||||||||||
Ratio of expenses to average net assets after expense reductions | 1.25 | 1.25 | 1.25 | 1.25 | 1.25 | |||||||||||||||
| (d) | Per share data is based on average shares outstanding. |
| (f) | Ratios do not reflect reductions from fees paid indirectly, if applicable. |
| (k) | The total return does not reflect expenses that apply to separate accounts. Inclusion of these charges would reduce the total return figures for all periods shown. |
| (r) | Certain expenses have been reduced without which performance would have been lower. |
| (s) | From time to time the fund may receive proceeds from litigation settlements, without which performance would be lower. Excluding the effect of the proceeds received from a non-recurring litigation settlement against Nortel Networks Corp., the total returns for the year ended December 31, 2008 would have been lower by approximately 0.58%. |
| (w) | Per share amount was less than $0.01 or ratio was less than 0.01%, as applicable. |
| (x) | The net asset values per share and total returns have been calculated on net assets which include adjustments made in accordance with U.S. generally accepted accounting principles required at period end for financial reporting purposes. |
See Notes to Financial Statements
13
Table of Contents
MFS Technology Portfolio
| (1) | Business and Organization |
MFS Technology Portfolio (the fund) is a series of MFS Variable Insurance Trust II (the trust). The trust is organized as a Massachusetts business trust and is registered under the Investment Company Act of 1940, as amended, as an open-end management investment company. The shareholders of each series of the trust are separate accounts of insurance companies, which offer variable annuity and/or life insurance products, and qualified retirement and pension plans.
| (2) | Significant Accounting Policies |
General – The preparation of financial statements in conformity with U.S. generally accepted accounting principles requires management to make estimates and assumptions that affect the reported amounts of assets and liabilities, and disclosure of contingent assets and liabilities at the date of the financial statements and the reported amounts of revenues and expenses during the reporting period. Actual results could differ from those estimates. In the preparation of these financial statements, management has evaluated subsequent events occurring after the date of the fund’s Statement of Assets and Liabilities through the date that the financial statements were issued. The fund invests primarily in securities of issuers in the technology industry. Issuers in a single industry can react similarly to market, economic, political and regulatory conditions and developments.
In this reporting period the fund adopted Financial Accounting Standards Board (FASB) Accounting Standards Update 2011-04, Fair Value Measurement (Topic 820) – Amendments to Achieve Common Fair Value Measurement and Disclosure Requirements in U.S. GAAP and IFRSs (“ASU 2011-04”). ASU 2011-04 seeks to improve the comparability of fair value measurements as presented and disclosed in financial statements prepared in accordance with U.S. GAAP and International Financial Reporting Standards (IFRS) by providing common requirements for fair value measurement and disclosure.
In December 2011, the FASB issued Accounting Standards Update 2011-11, Balance Sheet (Topic 210) – Disclosures about Offsetting Assets and Liabilities (“ASU 2011-11”). Effective for annual reporting periods beginning on or after January 1, 2013 and interim periods within those annual periods, ASU 2011-11 is intended to enhance disclosure requirements on the offsetting of financial assets and liabilities. Although still evaluating the potential impacts of ASU 2011-11 to the fund, management expects that the impact of the fund’s adoption will be limited to additional financial statement disclosures.
Investment Valuations – Equity securities, including restricted equity securities, are generally valued at the last sale or official closing price as provided by a third-party pricing service on the market or exchange on which they are primarily traded. Equity securities, for which there were no sales reported that day, are generally valued at the last quoted daily bid quotation as provided by a third-party pricing service on the market or exchange on which such securities are primarily traded. Equity securities held short, for which there were no sales reported for that day, are generally valued at the last quoted daily ask quotation as provided by a third-party pricing service on the market or exchange on which such securities are primarily traded. Short-term instruments with a maturity at issuance of 60 days or less generally are valued at amortized cost, which approximates market value. Exchange-traded options are generally valued at the last sale or official closing price as provided by a third-party pricing service on the exchange on which such options are primarily traded. Exchange-traded options for which there were no sales reported that day are generally valued at the last daily bid quotation as provided by a third-party pricing service on the exchange on which such options are primarily traded. Options not traded on an exchange are generally valued at a broker/dealer bid quotation. Foreign currency options are generally valued at valuations provided by a third-party pricing service. Open-end investment companies are generally valued at net asset value per share. Securities and other assets generally valued on the basis of information from a third-party pricing service may also be valued at a broker/dealer bid quotation. Values obtained from third-party pricing services can utilize both transaction data and market information such as yield, quality, coupon rate, maturity, type of issue, trading characteristics, and other market data. The values of foreign securities and other assets and liabilities expressed in foreign currencies are converted to U.S. dollars using the mean of bid and asked prices for rates provided by a third-party pricing service.
The Board of Trustees has delegated primary responsibility for determining or causing to be determined the value of the fund’s investments (including any fair valuation) to the adviser pursuant to valuation policies and procedures approved by the Board. If the adviser determines that reliable market quotations are not readily available, investments are valued at fair value as determined in good faith by the adviser in accordance with such procedures under the oversight of the Board of Trustees. Under the fund’s valuation policies and procedures, market quotations are not considered to be readily available for most types of debt instruments and floating rate loans and many types of derivatives. These investments are generally valued at fair value based on information from third-party pricing services. In addition, investments may be valued at fair value if the adviser determines that an investment’s value has been materially affected by events occurring after the close of the exchange or market on which the investment is principally traded (such as foreign exchange or market) and prior to the determination of the fund’s net asset value, or after the halting of trading of a specific security where trading does not resume prior to the close of the exchange or market on which the security is principally traded. Events that occur on a frequent basis after foreign markets close (such as developments in foreign markets and significant movements in the U.S. markets) and prior to the determination of the fund’s net asset value may be deemed to have a material effect on the value of securities traded in foreign markets. Accordingly, the fund’s foreign equity securities may often be
14
Table of Contents
MFS Technology Portfolio
Notes to Financial Statements – continued
valued at fair value. The adviser generally relies on third-party pricing services or other information (such as the correlation with price movements of similar securities in the same or other markets; the type, cost and investment characteristics of the security; the business and financial condition of the issuer; and trading and other market data) to assist in determining whether to fair value and at what value to fair value an investment. The value of an investment for purposes of calculating the fund’s net asset value can differ depending on the source and method used to determine value. When fair valuation is used, the value of an investment used to determine the fund’s net asset value may differ from quoted or published prices for the same investment. There can be no assurance that the fund could obtain the fair value assigned to an investment if it were to sell the investment at the same time at which the fund determines its net asset value per share.
Various inputs are used in determining the value of the fund’s assets or liabilities. These inputs are categorized into three broad levels. In certain cases, the inputs used to measure fair value may fall into different levels of the fair value hierarchy. In such cases, an investment’s level within the fair value hierarchy is based on the lowest level of input that is significant to the fair value measurement. The fund’s assessment of the significance of a particular input to the fair value measurement in its entirety requires judgment, and considers factors specific to the investment. Level 1 includes unadjusted quoted prices in active markets for identical assets or liabilities. Level 2 includes other significant observable market-based inputs (including quoted prices for similar securities, interest rates, prepayment speed, and credit risk). Level 3 includes unobservable inputs, which may include the adviser’s own assumptions in determining the fair value of investments. The following is a summary of the levels used as of December 31, 2012 in valuing the fund’s assets or liabilities:
| Investments at Value | Level 1 | Level 2 | Level 3 | Total | ||||||||||||
| Equity Securities: | ||||||||||||||||
United States | $44,011,032 | $— | $— | $44,011,032 | ||||||||||||
Netherlands | — | 216,537 | — | 216,537 | ||||||||||||
Israel | 146,255 | — | — | 146,255 | ||||||||||||
United Kingdom | 68,094 | — | — | 68,094 | ||||||||||||
| Mutual Funds | 391,077 | — | — | 391,077 | ||||||||||||
| Total Investments | $44,616,458 | $216,537 | $— | $44,832,995 | ||||||||||||
| Short Sales | $(1,165,723 | ) | $— | $— | $(1,165,723 | ) | ||||||||||
For further information regarding security characteristics, see the Portfolio of Investments.
Foreign Currency Translation – Purchases and sales of foreign investments, income, and expenses are converted into U.S. dollars based upon currency exchange rates prevailing on the respective dates of such transactions or on the reporting date for foreign denominated receivables and payables. Gains and losses attributable to foreign currency exchange rates on sales of securities are recorded for financial statement purposes as net realized gains and losses on investments. Gains and losses attributable to foreign exchange rate movements on receivables, payables, income and expenses are recorded for financial statement purposes as foreign currency transaction gains and losses. That portion of both realized and unrealized gains and losses on investments that results from fluctuations in foreign currency exchange rates is not separately disclosed.
Derivatives – The fund uses derivatives for different purposes, primarily to increase or decrease exposure to a particular market or segment of the market, or security, to increase or decrease interest rate or currency exposure, or as alternatives to direct investments. Derivatives are used for hedging or non-hedging purposes. While hedging can reduce or eliminate losses, it can also reduce or eliminate gains. When the fund uses derivatives as an investment to increase market exposure, or for hedging purposes, gains and losses from derivative instruments may be substantially greater than the derivative’s original cost.
The derivative instruments used by the fund were written options and purchased options. The fund’s period end derivatives, as presented in the Portfolio of Investments, generally are indicative of the volume of its derivative activity during the period.
The following table presents, by major type of derivative contract, the fair value, on a gross basis, of the asset and liability components of derivatives held by the fund at December 31, 2012 as reported in the Statement of Assets and Liabilities:
| Fair Value (a) | ||||||
| Risk | Derivative Contracts | Asset Derivatives | ||||
| Equity | Purchased Equity Options | $232,674 | ||||
| (a) | The value of purchased options outstanding is included in total investments, at value, within the fund’s Statement of Assets and Liabilities. |
15
Table of Contents
MFS Technology Portfolio
Notes to Financial Statements – continued
The following table presents, by major type of derivative contract, the realized gain (loss) on derivatives held by the fund for the year ended December 31, 2012 as reported in the Statement of Operations:
| Risk | Investments (Purchased Options) | Written Options | ||||||
Equity | $(199,204 | ) | $213,431 | |||||
The following table presents, by major type of derivative contract, the change in unrealized appreciation (depreciation) on derivatives held by the fund for the year ended December 31, 2012 as reported in the Statement of Operations:
| Risk | Investments (Purchased Options) | Written Options | ||||||
Equity | $(62,432 | ) | $2,775 | |||||
Derivative counterparty credit risk is managed through formal evaluation of the creditworthiness of all potential counterparties. On certain over-the-counter derivatives, the fund attempts to reduce its exposure to counterparty credit risk whenever possible by entering into an International Swaps and Derivatives Association (ISDA) Master Agreement on a bilateral basis with each of the counterparties with whom it undertakes a significant volume of transactions. The ISDA Master Agreement gives each party to the agreement the right to terminate all transactions traded under such agreement if there is a certain deterioration in the credit quality of the other party. The ISDA Master Agreement gives the fund the right, upon an event of default by the applicable counterparty or a termination of the agreement, to close out all transactions traded under such agreement and to net amounts owed under each transaction to one net amount payable by one party to the other. This right to close out and net payments across all transactions traded under the ISDA Master Agreement could result in a reduction of the fund’s credit risk to such counterparty equal to any amounts payable by the fund under the applicable transactions, if any. However, absent an event of default by the counterparty or a termination of the agreement, the ISDA Master Agreement does not result in an offset of reported amounts of assets and liabilities in the Statement of Assets and Liabilities across transactions between the fund and the applicable counterparty.
Collateral requirements differ by type of derivative. Collateral or margin requirements are set by the broker or exchange clearing house for exchange traded derivatives (i.e., futures contracts and exchange-traded options) while collateral terms are contract specific for over-the-counter traded derivatives (i.e., forward foreign currency exchange contracts, swap agreements and over-the-counter options). For derivatives traded under an ISDA Master Agreement, the collateral requirements are netted across all transactions traded under such agreement and one amount is posted from one party to the other to collateralize such obligations. Cash collateral that has been pledged to cover obligations of the fund under derivative contracts, if any, will be reported separately in the Statement of Assets and Liabilities as “Deposits with brokers”. Securities collateral pledged for the same purpose, if any, is noted in the Portfolio of Investments.
Written Options – In exchange for a premium, the fund wrote call options on securities that it anticipated the price would decline and also wrote put options on securities that it anticipated the price would increase. At the time the option was written, the fund believed the premium received exceeded the potential loss that could result from adverse price changes in the options’ underlying securities. In a written option, the fund as the option writer grants the buyer the right to purchase from, or sell to, the fund a specified number of shares or units of a particular security, currency or index at a specified price within a specified period of time.
The premium received is initially recorded as a liability in the Statement of Assets and Liabilities. The option is subsequently marked-to-market daily with the difference between the premium received and the market value of the written option being recorded as unrealized appreciation or depreciation. When a written option expires, the fund realizes a gain equal to the amount of the premium received. The difference between the premium received and the amount paid on effecting a closing transaction is considered a realized gain or loss. When a written call option is exercised, the premium received is offset against the proceeds to determine the realized gain or loss. When a written put option is exercised, the premium reduces the cost basis of the security purchased by the fund.
At the initiation of the written option contract, for exchange traded options, the fund is required to deposit securities or cash as collateral with the custodian for the benefit of the broker. For over-the-counter options, the fund may post collateral subject to the terms of an ISDA Master Agreement as generally described above if the market value of the options contract moves against it. The fund, as writer of an option, may have no control over whether the underlying securities may be sold (call) or purchased (put) and, as a result, bears the market risk of an unfavorable change in the price of the securities underlying the written option. Losses from writing options can exceed the premium received and can exceed the potential loss from an ordinary buy and sell transaction. Although the fund’s market risk may be significant, the maximum counterparty credit risk to the fund is equal to the market value of any collateral posted to the broker. For over-the-counter options, this risk is mitigated in cases where there is an ISDA Master Agreement between the fund and the counterparty providing for netting as described above.
16
Table of Contents
MFS Technology Portfolio
Notes to Financial Statements – continued
Written Options
| Number of contracts | Premiums received | |||||||
Outstanding, beginning of period | 555 | $18,794 | ||||||
Options written | 8,662 | 400,244 | ||||||
Options closed | (1,999 | ) | (101,794 | ) | ||||
Options exercised | (2,114 | ) | (97,673 | ) | ||||
Options expired | (5,104 | ) | (219,571 | ) | ||||
Outstanding, end of period | — | $— | ||||||
Purchased Options – The fund purchased call and put options for a premium. Purchased call and put options entitle the holder to buy and sell a specified number of shares or units of a particular security, currency or index at a specified price at a specified date or within a specified period of time. Purchasing call options may hedge against an anticipated increase in the dollar cost of securities or currency to be acquired or increase the fund’s exposure to an underlying instrument. Purchasing put options may hedge against an anticipated decline in the value of portfolio securities or currency or decrease the fund’s exposure to an underlying instrument.
The premium paid is initially recorded as an investment in the Statement of Assets and Liabilities. That investment is subsequently marked-to-market daily with the difference between the premium paid and the market value of the purchased option being recorded as unrealized appreciation or depreciation. Premiums paid for purchased call and put options which have expired are treated as realized losses on investments in the Statement of Operations. Upon the exercise or closing of a purchased call option, the premium paid is added to the cost of the security or financial instrument purchased. Upon the exercise or closing of a purchased put option, the premium paid is offset against the proceeds on the sale of the underlying security or financial instrument in order to determine the realized gain or loss on investments.
Whether or not the option is exercised, the fund’s maximum risk of loss from purchasing an option is the amount of premium paid. All option contracts involve credit risk if the counterparty to the option contract fails to perform. For over-the-counter options, this risk is mitigated in cases where there is an ISDA Master Agreement between the fund and the counterparty providing for netting as described above and for posting of collateral by the counterparty to the fund to cover the fund’s exposure to the counterparty under such ISDA Master Agreement.
Short Sales – The fund entered into short sales whereby it sells a security it does not own in anticipation of a decline in the value of that security. The fund will realize a gain if the security price decreases and a loss if the security price increases between the date of the short sale and the date on which the fund replaces the borrowed security. Losses from short sales can exceed the proceeds of the security sold; and they can also exceed the potential loss from an ordinary buy and sell transaction. The amount of any premium, dividends, or interest the fund may be required to pay in connection with a short sale will be recognized as a fund expense. During the year ended December 31, 2012, this expense amounted to $59,247. The fund segregates cash or marketable securities in an amount that, when combined with the amount of proceeds from the short sale deposited with the broker, at least equals the current market value of the security sold short.
Indemnifications – Under the fund’s organizational documents, its officers and Trustees may be indemnified against certain liabilities and expenses arising out of the performance of their duties to the fund. Additionally, in the normal course of business, the fund enters into agreements with service providers that may contain indemnification clauses. The fund’s maximum exposure under these agreements is unknown as this would involve future claims that may be made against the fund that have not yet occurred.
Investment Transactions and Income – Investment transactions are recorded on the trade date. Interest income is recorded on the accrual basis. Dividends received in cash are recorded on the ex-dividend date. Certain dividends from foreign securities will be recorded when the fund is informed of the dividend if such information is obtained subsequent to the ex-dividend date. Dividend and interest payments received in additional securities are recorded on the ex-dividend or ex-interest date in an amount equal to the value of the security on such date.
The fund may receive proceeds from litigation settlements. Any proceeds received from litigation involving portfolio holdings are reflected in the Statement of Operations in realized gain/loss if the security has been disposed of by the fund or in unrealized gain/loss if the security is still held by the fund. Any other proceeds from litigation not related to portfolio holdings are reflected as other income in the Statement of Operations.
Fees Paid Indirectly – The fund’s custody fee may be reduced according to an arrangement that measures the value of cash deposited with the custodian by the fund. This amount, for the year ended December 31, 2012, is shown as a reduction of total expenses in the Statement of Operations.
17
Table of Contents
MFS Technology Portfolio
Notes to Financial Statements – continued
Tax Matters and Distributions – The fund intends to qualify as a regulated investment company, as defined under Subchapter M of the Internal Revenue Code, and to distribute all of its taxable income, including realized capital gains. As a result, no provision for federal income tax is required. The fund’s federal tax returns, when filed, will remain subject to examination by the Internal Revenue Service for a three year period. Foreign taxes have been accrued by the fund in the accompanying financial statements.
Distributions to shareholders are recorded on the ex-dividend date. Income and capital gain distributions are determined in accordance with income tax regulations, which may differ from U.S. generally accepted accounting principles. Certain capital accounts in the financial statements are periodically adjusted for permanent differences in order to reflect their tax character. These adjustments have no impact on net assets or net asset value per share. Temporary differences which arise from recognizing certain items of income, expense, gain or loss in different periods for financial statement and tax purposes will reverse at some time in the future. Distributions in excess of net investment income or net realized gains are temporary overdistributions for financial statement purposes resulting from differences in the recognition or classification of income or distributions for financial statement and tax purposes.
Book/tax differences primarily relate to net operating losses, wash sale loss deferrals, and straddle loss deferrals.
The fund declared no distributions for the years ended December 31, 2012 and December 31, 2011.
The federal tax cost and the tax basis components of distributable earnings were as follows:
| As of 12/31/2012 | ||||
| Cost of investments | $42,131,004 | |||
| Gross appreciation | 4,493,251 | |||
| Gross depreciation | (1,791,260 | ) | ||
| Net unrealized appreciation (depreciation) | $2,701,991 | |||
| Undistributed long-term capital gain | 56,254 | |||
| Other temporary differences | (212,780 | ) |
Multiple Classes of Shares of Beneficial Interest – The fund offers multiple classes of shares, which differ in their respective distribution and/or service fees. The fund’s income, realized and unrealized gain (loss), and common expenses are allocated to shareholders based on the daily net assets of each class. Dividends are declared separately for each class. Differences in per share dividend rates are generally due to differences in separate class expenses.
| (3) | Transactions with Affiliates |
Investment Adviser – The fund has an investment advisory agreement with MFS to provide overall investment management and related administrative services and facilities to the fund.
The management fee is computed daily and paid monthly at the following annual rates:
| First $1 billion of average daily net assets | 0.75% | |||
| Average daily net assets in excess of $1 billion | 0.70% |
The management fee incurred for the year ended December 31, 2012 was equivalent to an annual effective rate of 0.75% of the fund’s average daily net assets.
The investment adviser has agreed in writing to pay a portion of the fund’s total annual operating expenses, exclusive of interest, taxes, extraordinary expenses, brokerage and transaction costs, and investment-related expenses (such as short sale dividend and interest expenses incurred in connection with the fund’s investment activity), such that total annual operating expenses do not exceed 1.00% of average daily net assets for the Initial Class shares and 1.25% of average daily net assets for the Service Class shares. This written agreement will continue until modified by the fund’s Board of Trustees, but such agreement will continue at least until April 30, 2014. For the year ended December 31, 2012, this reduction amounted to $20,822 and is reflected as a reduction of total expenses in the Statement of Operations.
Distributor – MFS Fund Distributors, Inc. (MFD), a wholly-owned subsidiary of MFS, is the distributor of shares of the fund. The Trustees have adopted a distribution plan for the Service Class shares pursuant to Rule 12b-1 under the Investment Company Act of 1940.
The fund’s distribution plan provides that the fund will pay MFD distribution and/or service fees equal to 0.25% per annum of its average daily net assets attributable to Service Class shares as partial consideration for services performed and expenses incurred by MFD and financial intermediaries (including participating insurance companies that invest in the fund to fund variable annuity and variable life insurance contracts, sponsors of qualified retirement and pension plans that invest in the fund, and affiliates of these participating insurance companies and plan sponsors) in connection with the sale and distribution of the Service Class shares. MFD may subsequently pay all, or a portion, of the distribution and/or service fees to financial intermediaries.
18
Table of Contents
MFS Technology Portfolio
Notes to Financial Statements – continued
Shareholder Servicing Agent – MFS Service Center, Inc. (MFSC), a wholly-owned subsidiary of MFS, receives a fee from the fund for its services as shareholder servicing agent. For the year ended December 31, 2012, the fee was $3,464, which equated to 0.0090% annually of the fund’s average daily net assets. MFSC also receives payment from the fund for out-of-pocket expenses paid by MFSC on behalf of the fund. For the year ended December 31, 2012, these costs amounted to $24.
Administrator – MFS provides certain financial, legal, shareholder communications, compliance, and other administrative services to the fund. Under an administrative services agreement, the fund partially reimburses MFS the costs incurred to provide these services. The fund is charged an annual fixed amount of $17,500 plus a fee based on average daily net assets. The administrative services fee incurred for the year ended December 31, 2012, was equivalent to an annual effective rate of 0.0454% of the fund’s average daily net assets.
Trustees’ and Officers’ Compensation – The fund pays compensation to independent Trustees in the form of a retainer, attendance fees, and additional compensation to Board and Committee chairpersons. The fund does not pay compensation directly to Trustees or officers of the fund who are also officers of the investment adviser, all of whom receive remuneration for their services to the fund from MFS. Certain officers and Trustees of the fund are officers or directors of MFS, MFD, and MFSC.
Other – This fund and certain other funds managed by MFS (the funds) have entered into services agreements (the Agreements) which provide for payment of fees by the funds to Tarantino LLC and Griffin Compliance LLC in return for the provision of services of an Independent Chief Compliance Officer (ICCO) and Assistant ICCO, respectively, for the funds. The ICCO and Assistant ICCO are officers of the funds and the sole members of Tarantino LLC and Griffin Compliance LLC, respectively. The funds can terminate the Agreements with Tarantino LLC and Griffin Compliance LLC at any time under the terms of the Agreements. For the year ended December 31, 2012, the aggregate fees paid by the fund to Tarantino LLC and Griffin Compliance LLC were $303 and are included in “Miscellaneous” expense in the Statement of Operations. MFS has agreed to reimburse the fund for a portion of the payments made by the fund in the amount of $127, which is shown as a reduction of total expenses in the Statement of Operations. Additionally, MFS has agreed to bear all expenses associated with office space, other administrative support, and supplies provided to the ICCO and Assistant ICCO.
The fund invests in the MFS Institutional Money Market Portfolio which is managed by MFS and seeks current income consistent with preservation of capital and liquidity. Income earned on this investment is included in “Dividends from underlying affiliated funds” in the Statement of Operations. This money market fund does not pay a management fee to MFS.
| (4) | Portfolio Securities |
Purchases and sales of investments, other than purchased option transactions, short sales, and short-term obligations, aggregated $33,847,548 and $23,630,829, respectively.
| (5) | Shares of Beneficial Interest |
The fund’s Declaration of Trust permits the Trustees to issue an unlimited number of full and fractional shares of beneficial interest. Transactions in fund shares were as follows:
| Year ended 12/31/12 | Year ended 12/31/11 | |||||||||||||||
| Shares | Amount | Shares | Amount | |||||||||||||
| Shares sold | ||||||||||||||||
Initial Class | 183,167 | $1,425,060 | 293,666 | $2,055,628 | ||||||||||||
Service Class | 2,570,116 | 19,344,946 | 1,982,378 | 13,664,728 | ||||||||||||
| 2,753,283 | $20,770,006 | 2,276,044 | $15,720,356 | |||||||||||||
| Shares reacquired | ||||||||||||||||
Initial Class | (650,110 | ) | $(4,988,560 | ) | (502,515 | ) | $(3,535,100 | ) | ||||||||
Service Class | (586,332 | ) | (4,366,420 | ) | (649,475 | ) | (4,493,812 | ) | ||||||||
| (1,236,442 | ) | $(9,354,980 | ) | (1,151,990 | ) | $(8,028,912 | ) | |||||||||
| Net change | ||||||||||||||||
Initial Class | (466,943 | ) | $(3,563,500 | ) | (208,849 | ) | $(1,479,472 | ) | ||||||||
Service Class | 1,983,784 | 14,978,526 | 1,332,903 | 9,170,916 | ||||||||||||
| 1,516,841 | $11,415,026 | 1,124,054 | $7,691,444 | |||||||||||||
| (6) | Line of Credit |
The fund and certain other funds managed by MFS participate in a $1.1 billion unsecured committed line of credit, subject to a $1 billion sublimit, provided by a syndication of banks under a credit agreement. Borrowings may be made for temporary financing needs. Interest is charged to each fund, based on its borrowings, generally at a rate equal to the higher of the Federal Reserve funds rate or one month LIBOR plus an agreed upon spread. A commitment fee, based on the average daily, unused portion of the committed line of credit, is allocated among the participating funds at the end of each calendar quarter. In addition, the fund and
19
Table of Contents
MFS Technology Portfolio
Notes to Financial Statements – continued
other funds managed by MFS have established unsecured uncommitted borrowing arrangements with certain banks for temporary financing needs. Interest is charged to each fund, based on its borrowings, at a rate equal to the Federal Reserve funds rate plus an agreed upon spread. For the year ended December 31, 2012, the fund’s commitment fee and interest expense were $247 and $0, respectively, and are included in “Miscellaneous” expense in the Statement of Operations.
| (7) | Transactions in Underlying Affiliated Funds – Affiliated Issuers |
An affiliated issuer may be considered one in which the fund owns 5% or more of the outstanding voting securities, or a company which is under common control. For the purposes of this report, the fund assumes the following to be an affiliated issuer:
| Underlying Affiliated Fund | Beginning Shares/Par Amount | Acquisitions Shares/Par Amount | Dispositions Shares/Par Amount | Ending Shares/Par Amount | ||||||||||||
| MFS Institutional Money Market Portfolio | 543,876 | 20,102,745 | (20,255,544 | ) | 391,077 | |||||||||||
| Underlying Affiliated Fund | Realized Gain (Loss) | Capital Gain Distributions | Dividend Income | Ending Value | ||||||||||||
| MFS Institutional Money Market Portfolio | $— | $— | $666 | $391,077 | ||||||||||||
20
Table of Contents
MFS Technology Portfolio
REPORT OF INDEPENDENT REGISTERED PUBLIC ACCOUNTING FIRM
To the Board of Trustees of MFS Variable Insurance Trust II and the Shareholders of
MFS Technology Portfolio:
We have audited the accompanying statement of assets and liabilities, including the portfolio of investments, of MFS Technology Portfolio (the “Fund”) (one of the series comprising MFS Variable Insurance Trust II) as of December 31, 2012, and the related statement of operations for the year then ended, the statements of changes in net assets for each of the two years in the period then ended, and the financial highlights for each of the five years in the period then ended. These financial statements and financial highlights are the responsibility of the Fund’s management. Our responsibility is to express an opinion on these financial statements and financial highlights based on our audits.
We conducted our audits in accordance with the standards of the Public Company Accounting Oversight Board (United States). Those standards require that we plan and perform the audit to obtain reasonable assurance about whether the financial statements and financial highlights are free of material misstatement. The Fund is not required to have, nor were we engaged to perform, an audit of its internal control over financial reporting. Our audits included consideration of internal control over financial reporting as a basis for designing audit procedures that are appropriate in the circumstances, but not for the purpose of expressing an opinion on the effectiveness of the Fund’s internal control over financial reporting. Accordingly, we express no such opinion. An audit also includes examining, on a test basis, evidence supporting the amounts and disclosures in the financial statements, assessing the accounting principles used and significant estimates made by management, as well as evaluating the overall financial statement presentation. Our procedures included confirmation of securities owned as of December 31, 2012, by correspondence with the custodian and brokers; where replies were not received from brokers, we performed other auditing procedures. We believe that our audits provide a reasonable basis for our opinion.
In our opinion, the financial statements and financial highlights referred to above present fairly, in all material respects, the financial position of MFS Technology Portfolio as of December 31, 2012, the results of its operations for the year then ended, the changes in its net assets for each of the two years in the period then ended, and the financial highlights for each of the five years in the period then ended, in conformity with accounting principles generally accepted in the United States of America.
DELOITTE & TOUCHE LLP
Boston, Massachusetts
February 15, 2013
21
Table of Contents
MFS Technology Portfolio
TRUSTEES AND OFFICERS – IDENTIFICATION AND BACKGROUND
The Trustees and officers of the Trust, as of February 1, 2013, are listed below, together with their principal occupations during the past five years. (Their titles may have varied during that period.) The address of each Trustee and officer is 111 Huntington Avenue, Boston, Massachusetts 02199-7618.
Name, Age | Position(s) with Fund | Trustee/Officer Since (h) | Principal Occupations During the Past Five Years | Other Directorships (j) | ||||
| INTERESTED TRUSTEES | ||||||||
Robert J. Manning (k) (age 49) | Trustee | February 2004 | Massachusetts Financial Services Company, Chairman, Chief Executive Officer and Director; President (until December 2009); Chief Investment Officer (until July 2010) | N/A | ||||
| INDEPENDENT TRUSTEES | ||||||||
David H. Gunning (age 70) | Trustee and Chair of Trustees | January 2004 | Private investor | Lincoln Electric Holdings, Inc. (welding equipment manufacturer), Director; Development Alternatives, Inc. (consulting), Director/Non-Executive Chairman; Portman Limited (mining), Director (until 2008) | ||||
Robert E. Butler (age 71) | Trustee | January 2006 | Consultant – investment company industry regulatory and compliance matters | N/A | ||||
Maureen R. Goldfarb (age 57) | Trustee | January 2009 | Private investor | N/A | ||||
William R. Gutow (age 71) | Trustee | December 1993 | Private investor and real estate consultant; Capitol Entertainment Management Company (video franchise), Vice Chairman | Atlantic Coast Tan (tanning salons), Vice Chairman (until 2007); Texas Donuts (donut franchise), Vice Chairman (until 2010) | ||||
Michael Hegarty (age 68) | Trustee | December 2004 | Private investor; Rouse Properties Inc. (real estate), Director | N/A | ||||
John P. Kavanaugh (age 58) | Trustee | January 2009 | Private investor | N/A | ||||
J. Dale Sherratt (age 74) | Trustee | June 1989 | Insight Resources, Inc. (acquisition planning specialists), President; Wellfleet Investments (investor in health care companies), Managing General Partner | N/A | ||||
| Laurie J. Thomsen (age 55) | Trustee | March 2005 | Private investor; New Profit, Inc. (venture philanthropy), Executive Partner (until 2010) | The Travelers Companies (insurance), Director | ||||
Robert W. Uek (age 71) | Trustee | January 2006 | Consultant to investment company industry | N/A | ||||
| OFFICERS | ||||||||
John M. Corcoran (k) (age 47) | President | October 2008 | Massachusetts Financial Services Company, Senior Vice President (since October 2008); State Street Bank and Trust (financial services provider), Senior Vice President, (until September 2008) | N/A | ||||
| Christopher R. Bohane (k) (age 39) | Assistant Secretary and Assistant Clerk | July 2005 | Massachusetts Financial Services Company, Vice President and Senior Counsel | N/A | ||||
Kino Clark (k) (age 44) | Assistant Treasurer | January 2012 | Massachusetts Financial Services Company, Vice President | N/A | ||||
Thomas H. Connors (k) (age 53) | Assistant Secretary and Assistant Clerk | September 2012 | Massachusetts Financial Services Company, Vice President and Senior Counsel; Deutsche Investment Management Americas Inc. (financial service provider), Director and Senior Counsel (until 2012) | N/A | ||||
Ethan D. Corey (k) (age 49) | Assistant Secretary and Assistant Clerk | July 2005 | Massachusetts Financial Services Company, Senior Vice President and Associate General Counsel | N/A | ||||
22
Table of Contents
MFS Technology Portfolio
Trustees and Officers – continued
Name, Age | Position(s) with Fund | Trustee/Officer Since (h) | Principal Occupations During the Past Five Years | Other Directorships (j) | ||||
David L. DiLorenzo (k) (age 44) | Treasurer | July 2005 | Massachusetts Financial Services Company, Senior Vice President | N/A | ||||
Robyn L. Griffin (age 37) | Assistant Independent Chief Compliance Officer | August 2008 | Griffin Compliance LLC (provider of compliance services), Principal (since August 2008); State Street Corporation (financial services provider), Mutual Fund Administration Assistant Vice President (October 2006 – July 2008) | N/A | ||||
Brian E. Langenfeld (k) (age 39) | Assistant Secretary and Assistant Clerk | June 2006 | Massachusetts Financial Services Company, Vice President and Senior Counsel | N/A | ||||
Susan S. Newton (k) (age 62) | Assistant Secretary and Assistant Clerk | May 2005 | Massachusetts Financial Services Company, Senior Vice President and Associate General Counsel | N/A | ||||
Susan A. Pereira (k) (age 42) | Assistant Secretary and Assistant Clerk | July 2005 | Massachusetts Financial Services Company, Vice President and Senior Counsel | N/A | ||||
Kasey L. Phillips (k) (age 42) | Assistant Treasurer | September 2012 | Massachusetts Financial Services Company, Vice President; Wells Fargo Funds Management, LLC, Senior Vice President, Fund Treasurer (until 2012) | N/A | ||||
Mark N. Polebaum (k) (age 60) | Secretary and Clerk | January 2006 | Massachusetts Financial Services Company, Executive Vice President, General Counsel and Secretary | N/A | ||||
Frank L. Tarantino (age 68) | Independent Chief Compliance Officer | June 2004 | Tarantino LLC (provider of compliance services), Principal | N/A | ||||
Richard S. Weitzel (k) (age 42) | Assistant Secretary and Assistant Clerk | October 2007 | Massachusetts Financial Services Company, Senior Vice President and Associate General Counsel | N/A | ||||
James O. Yost (k) (age 52) | Deputy Treasurer | September 1990 | Massachusetts Financial Services Company, Senior Vice President | N/A | ||||
| (h) | Date first appointed to serve as Trustee/officer of an MFS fund. Each Trustee has served continuously since appointment unless indicated otherwise. For the period from December 15, 2004 until February 22, 2005, Mr. Manning served as Advisory Trustee. For the period October 2008, until January 2012, Mr. Corcoran served as Treasurer of the Funds. Prior to January 2012, Messrs. DiLorenzo and Yost served as Assistant Treasurers of the Funds. |
| (j) | Directorships or trusteeships of companies required to report to the Securities and Exchange Commission (i.e., “public companies”). |
| (k) | “Interested person” of the Trust within the meaning of the Investment Company Act of 1940 (referred to as the 1940 Act), which is the principal federal law governing investment companies like the fund, as a result of position with MFS. The address of MFS is 111 Huntington Avenue, Boston, Massachusetts 02199-7618. |
Each Trustee has been elected by shareholders and each Trustee and officer holds office until his or her successor is chosen and qualified or until his or her earlier death, resignation, retirement or removal. The Trust does not hold annual meetings for the purpose of electing Trustees, and Trustees are not elected for fixed terms. Messrs. Butler, Kavanaugh, Uek and Ms. Thomsen are members of the Trust’s Audit Committee.
Each of the Fund’s Trustees and officers holds comparable positions with certain other funds of which MFS or a subsidiary is the investment adviser or distributor, and, in the case of the officers, with certain affiliates of MFS. As of January 1, 2013, the Trustees served as board members of 143 funds within the MFS Family of Funds.
23
Table of Contents
MFS Technology Portfolio
Trustees and Officers – continued
The Statement of Additional Information for the Fund includes further information about the Trustees and is available without charge upon request by calling 1-800-225-2606.
Investment Adviser Massachusetts Financial Services Company 111 Huntington Avenue Boston, MA 02199-7618 | Custodian State Street Bank and Trust 1 Lincoln Street Boston, MA 02111-2900 | |
Distributor MFS Fund Distributors, Inc. 111 Huntington Avenue Boston, MA 02199-7618 | Independent Registered Public Accounting Firm Deloitte & Touche LLP 200 Berkeley Street Boston, MA 02116 | |
Portfolio Manager Matthew Sabel |
24
Table of Contents
MFS Technology Portfolio
BOARD REVIEW OF INVESTMENT ADVISORY AGREEMENT
A discussion regarding the board’s most recent approval of the fund’s Investment Advisory Agreement with MFS is available by clicking on the fund’s name under “Variable Insurance Portfolios – VIT II” in the “Products” section of the MFS Web site (mfs.com).
PROXY VOTING POLICIES AND INFORMATION
A general description of the MFS funds’ proxy voting policies and procedures is available without charge, upon request, by calling 1-800-225-2606, by visiting the Proxy Voting section of mfs.com or by visiting the SEC’s Web site at http://www.sec.gov.
Information regarding how the fund voted proxies relating to portfolio securities during the most recent twelve-month period ended June 30 is available without charge by visiting the Proxy Voting section of mfs.com or by visiting the SEC’s Web site at http://www.sec.gov.
QUARTERLY PORTFOLIO DISCLOSURE
The fund will file a complete schedule of portfolio holdings with the Securities and Exchange Commission (the Commission) for the first and third quarters of each fiscal year on Form N-Q. The fund’s Form N-Q is available on the EDGAR database on the Commission’s Internet Web site at http://www.sec.gov, and may be reviewed and copied at the:
Public Reference Room
Securities and Exchange Commission
100 F Street, NE, Room 1580
Washington, D.C. 20549
Information on the operation of the Public Reference Room may be obtained by calling the Commission at 1-800-SEC-0330. Copies of the fund’s Form N-Q also may be obtained, upon payment of a duplicating fee, by electronic request at the following e-mail address: publicinfo@sec.gov or by writing the Public Reference Section at the above address.
From time to time, MFS may post important information about the fund or the MFS funds on the MFS web site (mfs.com). This information is available by visiting the “News & Commentary” section of mfs.com or by clicking on the fund’s name under “Variable Insurance Portfolios – VIT II” in the “Products” section of mfs.com.
25
Table of Contents
rev. 3/11

| Why? | Financial companies choose how they share your personal information. Federal law gives consumers the right to limit some but not all sharing. Federal law also requires us to tell you how we collect, share, and protect your personal information. Please read this notice carefully to understand what we do. |
| What? | The types of personal information we collect and share depend on the product or service you have with us. This information can include:
• Social Security number and account balances • Account transactions and transaction history • Checking account information and wire transfer instructions
When you are no longer our customer, we continue to share your information as described in this notice. |
| How? | All financial companies need to share customers’ personal information to run their everyday business. In the section below, we list the reasons financial companies can share their customers’ personal information; the reasons MFS chooses to share; and whether you can limit this sharing. |
| Reasons we can share your personal information | Does MFS share? | Can you limit this sharing? | ||
For our everyday business purposes – such as to process your transactions, maintain your account(s), respond to court orders and legal investigations, or report to credit bureaus | Yes | No | ||
For our marketing purposes – to offer our products and services to you | No | We don’t share | ||
| For joint marketing with other financial companies | No | We don’t share | ||
For our affiliates’ everyday business purposes – information about your transactions and experiences | No | We don’t share | ||
For our affiliates’ everyday business purposes – information about your creditworthiness | No | We don’t share | ||
| For nonaffiliates to market to you | No | We don’t share |
| Questions? | Call 800-225-2606 or go to mfs.com. |
26
Table of Contents
| Page 2 |
| Who we are | ||
| Who is providing this notice? | MFS Funds, MFS Investment Management, MFS Institutional Advisors, Inc., MFS Fund Distributors, Inc., MFS Heritage Trust Company, and MFS Service Center, Inc. | |
| What we do | ||
| How does MFS protect my personal information? | To protect your personal information from unauthorized access and use, we use security measures that comply with federal law. These measures include procedural, electronic, and physical safeguards for the protection of the personal information we collect about you. | |
| How does MFS collect my personal information? | We collect your personal information, for example, when you
• open an account or provide account information • direct us to buy securities or direct us to sell your securities • make a wire transfer
We also collect your personal information from others, such as credit bureaus, affiliates and other companies. | |
| Why can’t I limit all sharing? | Federal law gives you the right to limit only
• sharing for affiliates’ everyday business purposes – information about your creditworthiness • affiliates from using your information to market to you • sharing for nonaffiliates to market to you
State laws and individual companies may give you additional rights to limit sharing. | |
| Definitions | ||
| Affiliates | Companies related by common ownership or control. They can be financial and nonfinancial companies.
•MFS does not share personal information with affiliates, except for everyday business purposes as described on page one of this notice. | |
| Nonaffiliates | Companies not related by common ownership or control. They can be financial and nonfinancial companies.
•MFS does not share with nonaffiliates so they can market to you. | |
| Joint Marketing | A formal agreement between nonaffiliated financial companies that together market financial products or services to you.
•MFS doesn’t jointly market. | |
| Other important information | ||
| If you own an MFS product or receive an MFS service in the name of a third party such as a bank or broker-dealer, their privacy policy may apply to you instead of ours. | ||
27
Table of Contents
Table of Contents
ANNUAL REPORT
December 31, 2012

MFS® INTERNATIONAL GROWTH PORTFOLIO
MFS® Variable Insurance Trust II

FCI-ANN
Table of Contents
MFS® INTERNATIONAL GROWTH PORTFOLIO
The report is prepared for the general information of contract owners. It is authorized for distribution to prospective investors only when preceded or accompanied by a current prospectus.
NOT FDIC INSURED Ÿ MAY LOSE VALUE Ÿ NO BANK OR CREDIT UNION GUARANTEE Ÿ NOT A DEPOSIT Ÿ NOT INSURED BY ANY FEDERAL GOVERNMENT AGENCY OR NCUA/NCUSIF
Table of Contents
MFS International Growth Portfolio
LETTER FROM THE CHAIRMAN AND CEO

Dear Contract Owners:
The global market outlook for 2013 is one of cautious optimism. While we are seeing some positive economic trends in the United States, Europe and China, the overall environment remains challenging. In the United States, the recent fiscal cliff agreement was received positively by investors, even though it mostly addressed pressing taxation issues and did not resolve additional concerns, including the need for spending cuts and a large-scale reduction of the federal debt. These issues will be front and center again in the spring. Despite the ongoing uncertainty, economic tailwinds are gathering strength as the U.S. housing and job markets are improving and consumer confidence is rising.
Overseas, the debt crisis continues to weigh heavily on eurozone markets, with even Germany — long an economic stalwart — experiencing some contraction. These ongoing challenges could be a drag on global market performance this year. In Asia, manufacturing activity has accelerated in emerging markets such as China and India, and we are seeing signs of stabilized loan growth in China, a leading indicator of that country’s economic health. In contrast, Japan’s economy is contracting sharply under deflationary pressures. Nevertheless, Japanese markets have responded favorably to early actions by the new government, which appears determined to act aggressively, along with the Bank of Japan, to stimulate growth.
As always, managing risk in the face of uncertainty remains a top priority for investors. At MFS®, our uniquely collaborative investment process revolves around global research and our disciplined risk management approach. Our global team of investment professionals shares ideas and evaluates opportunities across continents, investment disciplines and asset classes — all with a goal of building better insights, and ultimately better results, for our clients.
We remain mindful of the many economic challenges investors face today, and believe it is more important than ever to maintain a long-term view, employ time-tested principles, such as asset allocation and diversification, and work closely with investment advisors to identify and pursue the most suitable opportunities.
Respectfully,

Robert J. Manning
Chairman and Chief Executive Officer
MFS Investment Management®
February 15, 2013
The opinions expressed in this letter are subject to change, may not be relied upon for investment advice, and no forecasts can be guaranteed.
1
Table of Contents
MFS International Growth Portfolio
Portfolio structure
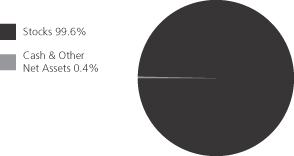
| Top ten holdings | ||||
| LVMH Moet Hennessy Louis Vuitton S.A. | 2.8% | |||
| Groupe Danone | 2.7% | |||
| Nestle S.A. | 2.4% | |||
| Diageo PLC | 2.4% | |||
| Japan Tobacco, Inc. | 2.3% | |||
| Compass Group PLC | 2.2% | |||
| Pernod Ricard S.A. | 1.9% | |||
| Reckitt Benckiser Group PLC | 1.9% | |||
| Taiwan Semiconductor Manufacturing Co. Ltd., ADR | 1.8% | |||
| Canadian National Railway Co. | 1.8% | |||
| Equity sectors | ||||
| Consumer Staples | 18.8% | |||
| Retailing | 11.3% | |||
| Financial Services | 11.2% | |||
| Technology | 10.7% | |||
| Special Products & Services | 8.1% | |||
| Health Care | 7.9% | |||
| Basic Materials | 7.8% | |||
| Industrial Goods & Services | 7.2% | |||
| Energy | 4.7% | |||
| Autos & Housing | 4.2% | |||
| Transportation | 4.0% | |||
| Leisure | 1.9% | |||
| Utilities & Communications | 1.8% | |||
| Issuer country weightings (x) | ||||
| United Kingdom | 16.7% | |||
| France | 14.1% | |||
| Japan | 11.3% | |||
| Switzerland | 9.3% | |||
| Germany | 8.4% | |||
| Hong Kong | 4.3% | |||
| Brazil | 3.5% | |||
| Canada | 3.3% | |||
| Netherlands | 2.8% | |||
| Other Countries | 26.3% | |||
| Currency exposure weightings (y) | ||||
| Euro | 28.1% | |||
| British Pound Sterling | 16.7% | |||
| Japanese Yen | 11.3% | |||
| United States Dollar | 10.0% | |||
| Swiss Franc | 9.3% | |||
| Hong Kong Dollar | 5.5% | |||
| Brazilian Real | 3.5% | |||
| Danish Krone | 2.3% | |||
| Australian Dollar | 2.3% | |||
| Other Currencies | 11.0% | |||
| (x) | Represents the portfolio’s exposure to issuer countries as a percentage of a portfolio’s net assets. |
| (y) | Represents the portfolio’s exposure to a particular currency as a percentage of a portfolio’s net assets. |
Percentages are based on net assets as of 12/31/12.
The portfolio is actively managed and current holdings may be different.
2
Table of Contents
MFS International Growth Portfolio
Summary of Results
For the twelve months ended December 31, 2012, Initial Class shares of the MFS International Growth Portfolio (“fund”) provided a total return of 19.90%, while Service Class shares of the fund provided a total return of 19.54%. These compare with a return of 17.07% over the same period for the fund’s benchmark, the MSCI All Country World (ex-U.S.) Growth Index.
Market Environment
The beginning of the period was characterized by a risk-on sentiment as a result of additional liquidity measures by the Federal Reserve Bank (“Fed”) and the European Central Bank (“ECB”) as well as a commensurate improvement in macroeconomic conditions. During this time, global equity valuations rose, credit spreads contracted, and high-quality sovereign yields increased modestly.
During the middle of the period, however, conditions worsened, driven by broadly weaker global macroeconomic indicators, as well as renewed concerns over the eurozone’s capacity and determination to address its ongoing crisis. Despite this deterioration, broad market sentiment remained relatively resilient as equity markets generally maintained gains and credit spreads did not indicate deterioration.
However, this renewed weakness in the fundamentals precipitated a further round of monetary easing by both the Fed (through a third round of quantitative easing) and the ECB (through a new bond purchase facility) in the second half of the period, which soon instilled additional confidence in risk markets. Nonetheless, towards the end of the period, weaker equity earnings reports and declining forward guidance caused market sentiment to soften. In addition, as we moved toward year end, the fiscal cliff negotiations between the Republicans in the U.S. Congress and President Obama were a particular source of market attention, where uncertainty surrounding the fiscal negotiations continued right up to the end-of-year deadline.
Contributors to Performance
Strong stock selection in both the special products & services and industrial goods & services sectors was a primary contributor to performance relative to the MSCI All Country World (ex-U.S.) Growth Index. However, there were no individual stocks within either of these sectors that were among the fund’s top relative contributors for the reporting period.
Security selection in the technology sector was another major contributor to relative results. Here, an avoidance of printers and computer peripherals maker Canon (Japan) aided relative results as the stock underperformed the broad market during the period.
Within the retailing sector, overweight allocations to fashion distributor Industria de Diseno Textil, S.A. (Spain) and LVMH Moet Hennessy Louis Vuitton S.A. (France), the world’s largest luxury goods company, benefited relative performance as both stocks turned in strong performance for the period. Holdings of LVMH outpaced the market during the reporting period on a favorable outlook for the luxury goods industry driven, in part, by anticipated improvement in growth rates in the Chinese market. Additionally, later in the period, the company raised prices at its flagship fashion and leather goods brand in Europe, which appeared to have alleviated concern about slowing demand for its products.
An underweight allocation to the basic materials sector also aided relative results as the sector underperformed the benchmark. Within this sector, not holding UK-based mining and natural resources company Anglo American benefited relative performance.
Elsewhere, the fund’s holdings of airline services provider Copa Holdings (b), Dutch brewer Heineken International N.V. (Netherlands), investment manager Aberdeen Asset Management (United Kingdom), financial services firm HSBC Holdings (b) (United Kingdom), and auto manufacturer BMW (h) (Germany) positively impacted relative performance as all five stocks outperformed the broad market. Shares of Heineken appreciated throughout the latter part of the period as the company benefited from volume growth, primarily in Russia and Mexico. Additionally, increased market share in emerging markets, primarily due to their acquisition of APB (Asia Pacific Breweries), further supported the stock. Not holding weak-performing UK-based pharmaceutical firm GlaxoSmithKline also aided relative returns.
Detractors from Performance
Security selection in the financial services sector detracted from relative performance. However, there were no individual securities within this sector that were among the fund’s top relative detractors.
Stock selection in the utilities & communications sector was another significant detractor from relative returns. Within the sector, holdings of telecommunication services providers TIM Participacoes (h) (Brazil) and China Unicom Hong Kong Ltd. (Hong Kong) held back relative results as both stocks turned in weak performance over the period. Shares of TIM Participacoes fell after Brazil’s telecommunications regulator Anatel temporarily prohibited them from selling new lines due to excessive complaints about service quality.
3
Table of Contents
MFS International Growth Portfolio
Management Review – continued
Stocks in other sectors that detracted from relative results included Israeli-headquartered security software provider Check Point Software Technologies (b), mining company Iluka Resources (Australia), oil and gas company BG Group (United Kingdom), oil and gas exploration company INPEX (Japan), energy company China Petroleum & Chemical (b)(h) (China), and food and beverage producer Groupe Danone (France) as all six stocks lagged the broad market. In addition, the timing of the fund’s ownership in shares of mining operator Rio Tinto (Australia), and not holding shares of strong-performing automaker Toyota (Japan), hindered relative returns.
The fund’s relative currency exposure, resulting primarily from differences between the fund’s and the benchmark’s exposures to holdings of securities denominated in foreign currencies, also weakened relative performance. All of MFS’ investment decisions are driven by the fundamentals of each individual opportunity and as such, it is common for our portfolios to have different currency exposure than the benchmark.
Respectfully,
| David Antonelli | Kevin Dwan | |
| Portfolio Manager | Portfolio Manager |
Note to Contract Owners: Effective January 2, 2012, Kevin Dwan became a co-manager of the fund.
| (b) | Security is not a benchmark constituent. |
| (h) | Security was not held in the portfolio at period end. |
The views expressed in this report are those of the portfolio managers only through the end of the period of the report as stated on the cover and do not necessarily reflect the views of MFS or any other person in the MFS organization. These views are subject to change at any time based on market or other conditions, and MFS disclaims any responsibility to update such views. These views may not be relied upon as investment advice or an indication of trading intent on behalf of any MFS portfolio. References to specific securities are not recommendations of such securities, and may not be representative of any MFS portfolio’s current or future investments.
4
Table of Contents
MFS International Growth Portfolio
PERFORMANCE SUMMARY THROUGH 12/31/12
The following chart illustrates the historical performance of the fund in comparison to its benchmark(s). Benchmarks are unmanaged and may not be invested in directly. Benchmark returns do not reflect any fees or expenses. The performance of other share classes will be greater than or less than that of the class depicted below. (See Notes to Performance Summary.)
Performance data shown represents past performance and is no guarantee of future results. Investment return and principal value fluctuate so your units, when sold, may be worth more or less than the original cost; current performance may be lower or higher than quoted. The performance shown does not reflect the deduction of taxes, if any, that a contract holder would pay on fund distributions or the redemption of contract units. The returns for the fund shown also do not reflect the deduction of expenses associated with variable products, such as mortality and expense risk charges, separate account charges, and sales charges imposed by the insurance company separate accounts. Such expenses would reduce the overall returns shown.
Growth of a Hypothetical $10,000 Investment
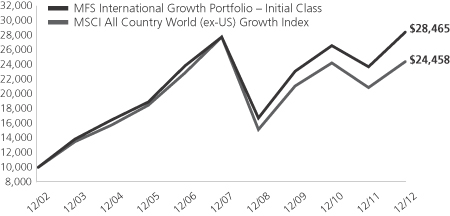
Total Returns through 12/31/12
Average annual total returns
| Share Class | Class inception date | 1-yr | 5-yr | 10-yr | ||||||||
| Initial Class | 6/03/96 | 19.90% | 0.44% | 11.03% | ||||||||
| Service Class | 8/24/01 | 19.54% | 0.18% | 10.74% | ||||||||
| Comparative benchmark | ||||||||||||
| MSCI All Country World (ex-US) Growth Index (f) | 17.07% | (2.55)% | 9.36% | |||||||||
| (f) | Source: FactSet Research Systems Inc. |
Benchmark Definition
MSCI All Country World (ex-US) Growth Index – a market capitalization-weighted index that is designed to measure equity market performance for growth securities in the global developed and emerging markets, excluding the U.S.
It is not possible to invest directly in an index.
Notes to Performance Summary
Average annual total return represents the average annual change in value for each share class for the periods presented.
Performance results reflect any applicable expense subsidies and waivers in effect during the periods shown. Without such subsidies and waivers the fund’s performance results would be less favorable. Please see the prospectus and financial statements for complete details. All results are historical and assume the reinvestment of any dividends and capital gains distributions.
Performance results do not include adjustments made for financial reporting purposes in accordance with U.S. generally accepted accounting principles and may differ from amounts reported in the financial highlights.
From time to time the fund may receive proceeds from litigation settlements, without which performance would be lower.
5
Table of Contents
MFS International Growth Portfolio
Fund Expenses Borne by the Contract Holders During the Period,
July 1, 2012 through December 31, 2012
As a contract holder of the fund, you incur ongoing costs, including management fees; distribution and/or service (12b-1) fees; and other fund expenses. This example is intended to help you understand your ongoing costs (in dollars) of investing in the fund and to compare these costs with the ongoing costs of investing in other mutual funds.
The example is based on an investment of $1,000 invested at the beginning of the period and held for the entire period July 1, 2012 through December 31, 2012.
Actual Expenses
The first line for each share class in the following table provides information about actual account values and actual expenses. You may use the information in this line, together with the amount you invested, to estimate the expenses that you paid over the period. Simply divide your account value by $1,000 (for example, an $8,600 account value divided by $1,000 = 8.6), then multiply the result by the number in the first line under the heading entitled “Expenses Paid During Period” to estimate the expenses you paid on your account during this period.
Hypothetical Example for Comparison Purposes
The second line for each share class in the following table provides information about hypothetical account values and hypothetical expenses based on the fund’s actual expense ratio and an assumed rate of return of 5% per year before expenses, which is not the fund’s actual return. The hypothetical account values and expenses may not be used to estimate the actual ending account balance or expenses you paid for the period. You may use this information to compare the ongoing costs of investing in the fund and other funds. To do so, compare this 5% hypothetical example with the 5% hypothetical examples that appear in the shareholder reports of the other funds.
Please note that the expenses shown in the table are meant to highlight the fund’s ongoing costs only and do not take into account the fees and expenses imposed under the variable contracts through which your investment in the fund is made. Therefore, the second line for each share class in the table is useful in comparing ongoing costs associated with an investment in vehicles (such as the fund) which fund benefits under variable annuity and variable life insurance contracts and to qualified pension and retirement plans only, and will not help you determine the relative total costs of investing in the fund through variable annuity and variable life insurance contracts. If the fees and expenses imposed under the variable contracts were included, your costs would have been higher.
| Share Class | Annualized Expense Ratio | Beginning Account Value 7/01/12 | Ending Account Value 12/31/12 | Expenses Paid During Period (p) | ||||||||||||||
| Initial Class | Actual | 1.03% | $1,000.00 | $1,126.75 | $5.51 | |||||||||||||
| Hypothetical (h) | 1.03% | $1,000.00 | $1,019.96 | $5.23 | ||||||||||||||
| Service Class | Actual | 1.28% | $1,000.00 | $1,124.85 | $6.84 | |||||||||||||
| Hypothetical (h) | 1.28% | $1,000.00 | $1,018.70 | $6.50 | ||||||||||||||
| (h) | 5% class return per year before expenses. |
| (p) | Expenses paid are equal to each class’s annualized expense ratio, as shown above, multiplied by the average account value over the period, multiplied by the number of days in the period, divided by the number of days in the year. |
6
Table of Contents
MFS International Growth Portfolio
PORTFOLIO OF INVESTMENTS – 12/31/12
The Portfolio of Investments is a complete list of all securities owned by your fund. It is categorized by broad-based asset classes.
| Issuer | Shares/Par | Value ($) | ||||||
| COMMON STOCKS – 99.6% | ||||||||
| Aerospace – 1.0% | ||||||||
| Rolls-Royce Holdings PLC | 143,365 | $ | 2,065,640 | |||||
|
| |||||||
| Airlines – 1.2% | ||||||||
| Copa Holdings S.A., “A” | 25,150 | $ | 2,501,168 | |||||
|
| |||||||
| Alcoholic Beverages – 7.1% | ||||||||
| Carlsberg A.S., “B” | 24,078 | $ | 2,367,219 | |||||
| Diageo PLC | 165,409 | 4,815,473 | ||||||
| Heineken N.V. | 49,655 | 3,312,134 | ||||||
| Pernod Ricard S.A. | 33,891 | 3,985,134 | ||||||
|
| |||||||
| $ | 14,479,960 | |||||||
|
| |||||||
| Apparel Manufacturers – 6.3% | ||||||||
| Cia.Hering S.A. | 64,300 | $ | 1,329,277 | |||||
| Compagnie Financiere Richemont S.A. | 31,553 | 2,523,087 | ||||||
| Li & Fung Ltd. | 1,843,200 | 3,311,313 | ||||||
| LVMH Moet Hennessy Louis Vuitton S.A. | 31,104 | 5,796,143 | ||||||
|
| |||||||
| $ | 12,959,820 | |||||||
|
| |||||||
| Automotive – 3.6% | ||||||||
| Bayerische Motoren Werke AG | 30,480 | $ | 2,939,552 | |||||
| Guangzhou Automobile Group Co. Ltd., “H” | 1,100,000 | 988,276 | ||||||
| Honda Motor Co. Ltd. | 93,000 | 3,427,832 | ||||||
|
| |||||||
| $ | 7,355,660 | |||||||
|
| |||||||
| Broadcasting – 1.1% | ||||||||
| Publicis Groupe S.A. | 36,609 | $ | 2,193,455 | |||||
|
| |||||||
| Brokerage & Asset Managers – 1.1% | ||||||||
| Aberdeen Asset Management PLC | 196,649 | $ | 1,166,103 | |||||
| BM&F Bovespa S.A. | 156,800 | 1,094,517 | ||||||
|
| |||||||
| $ | 2,260,620 | |||||||
|
| |||||||
| Business Services – 8.1% | ||||||||
| Accenture PLC, “A” | 40,780 | $ | 2,711,870 | |||||
| Amadeus IT Holding S.A. | 50,908 | 1,277,499 | ||||||
| Brenntag AG | 16,202 | 2,128,582 | ||||||
| Capita Group PLC | 175,376 | 2,171,612 | ||||||
| Compass Group PLC | 387,980 | 4,588,547 | ||||||
| Experian Group Ltd. | 94,257 | 1,522,935 | ||||||
| Intertek Group PLC | 30,931 | 1,560,962 | ||||||
| LPS Brasil – Consultoria de Imoveis S.A. | 38,300 | 708,749 | ||||||
|
| |||||||
| $ | 16,670,756 | |||||||
|
| |||||||
| Computer Software – 4.5% | ||||||||
| Check Point Software Technologies Ltd. (a) | 68,590 | $ | 3,267,628 | |||||
| Dassault Systems S.A. | 14,683 | 1,643,692 | ||||||
| OBIC Co. Ltd. | 8,110 | 1,614,792 | ||||||
| SAP AG | 32,243 | 2,582,916 | ||||||
|
| |||||||
| $ | 9,109,028 | |||||||
|
| |||||||
| Computer Software – Systems – 0.8% | ||||||||
| NICE Systems Ltd., ADR (a) | 48,670 | $ | 1,629,472 | |||||
|
| |||||||
| Issuer | Shares/Par | Value ($) | ||||||
| COMMON STOCKS – continued | ||||||||
| Construction – 0.6% | ||||||||
| Bellway PLC | 67,839 | $ | 1,153,142 | |||||
|
| |||||||
| Consumer Products – 4.0% | ||||||||
| L’Oreal S.A. | 10,860 | $ | 1,517,035 | |||||
| Reckitt Benckiser Group PLC | 61,136 | 3,829,787 | ||||||
| Uni-Charm Corp. | 54,600 | 2,842,282 | ||||||
|
| |||||||
| $ | 8,189,104 | |||||||
|
| |||||||
| Electrical Equipment – 2.5% | ||||||||
| Legrand S.A. | 19,833 | $ | 837,088 | |||||
| Mettler-Toledo International, Inc. (a) | 9,520 | 1,840,216 | ||||||
| Schneider Electric S.A. | 31,823 | 2,373,472 | ||||||
|
| |||||||
| $ | 5,050,776 | |||||||
|
| |||||||
| Electronics – 3.7% | ||||||||
| ASML Holding N.V. | 16,269 | $ | 1,047,886 | |||||
| Samsung Electronics Co. Ltd. | 1,968 | 2,816,651 | ||||||
| Taiwan Semiconductor Manufacturing Co. Ltd., ADR | 215,340 | 3,695,234 | ||||||
|
| |||||||
| $ | 7,559,771 | |||||||
|
| |||||||
| Energy – Independent – 0.8% | ||||||||
| INPEX Corp. | 294 | $ | 1,569,035 | |||||
|
| |||||||
| Energy – Integrated – 2.7% | ||||||||
| BG Group PLC | 170,659 | $ | 2,861,655 | |||||
| OAO Gazprom, ADR | 154,370 | 1,480,234 | ||||||
| Suncor Energy, Inc. | 37,855 | 1,244,835 | ||||||
|
| |||||||
| $ | 5,586,724 | |||||||
|
| |||||||
| Engineering – Construction – 0.9% | ||||||||
| JGC Corp. | 62,000 | $ | 1,931,439 | |||||
|
| |||||||
| Food & Beverages – 5.4% | ||||||||
| Groupe Danone | 84,968 | $ | 5,613,804 | |||||
| M. Dias Branco S.A. Industria e Comercio de Alimentos | 15,400 | 590,738 | ||||||
| Nestle S.A. | 74,643 | 4,863,853 | ||||||
|
| |||||||
| $ | 11,068,395 | |||||||
|
| |||||||
| Food & Drug Stores – 3.0% | ||||||||
| CP All PLC | 960,900 | $ | 1,444,962 | |||||
| Dairy Farm International Holdings Ltd. | 81,900 | 894,016 | ||||||
| Lawson, Inc. | 41,500 | 2,820,894 | ||||||
| Sundrug Co. Ltd. | 27,400 | 935,973 | ||||||
|
| |||||||
| $ | 6,095,845 | |||||||
|
| |||||||
| Gaming & Lodging – 0.8% | ||||||||
| Sands China Ltd. | 367,600 | $ | 1,646,612 | |||||
|
| |||||||
| General Merchandise – 0.9% | ||||||||
| Dollarama, Inc. | 17,370 | $ | 1,029,767 | |||||
| Lojas Renner S.A. | 19,500 | 762,963 | ||||||
|
| |||||||
| $ | 1,792,730 | |||||||
|
| |||||||
7
Table of Contents
MFS International Growth Portfolio
Portfolio of Investments – continued
| Issuer | Shares/Par | Value ($) | ||||||
| COMMON STOCKS – continued | ||||||||
| Insurance – 1.4% | ||||||||
| AIA Group Ltd. | 723,800 | $ | 2,884,661 | |||||
|
| |||||||
| Internet – 0.8% | ||||||||
| Yahoo Japan Corp. | 4,875 | $ | 1,577,886 | |||||
|
| |||||||
| Machinery & Tools – 2.8% | ||||||||
| KONE Oyj “B” | 21,789 | $ | 1,613,423 | |||||
| Schindler Holding AG | 15,264 | 2,204,750 | ||||||
| Weir Group PLC | 61,630 | 1,912,963 | ||||||
|
| |||||||
| $ | 5,731,136 | |||||||
|
| |||||||
| Major Banks – 2.5% | ||||||||
| HSBC Holdings PLC | 220,991 | $ | 2,337,384 | |||||
| Standard Chartered PLC | 105,889 | 2,684,145 | ||||||
|
| |||||||
| $ | 5,021,529 | |||||||
|
| |||||||
| Medical & Health Technology & Services – 1.2% | ||||||||
| Fleury S.A. | 52,100 | $ | 586,523 | |||||
| Fresenius Medical Care AG & Co. KGaA | 27,228 | 1,881,242 | ||||||
|
| |||||||
| $ | 2,467,765 | |||||||
|
| |||||||
| Medical Equipment – 2.2% | ||||||||
| Essilor International S.A. | 19,197 | $ | 1,946,392 | |||||
| Sonova Holding AG | 23,087 | 2,559,473 | ||||||
|
| |||||||
| $ | 4,505,865 | |||||||
|
| |||||||
| Metals & Mining – 1.8% | ||||||||
| Iluka Resources Ltd. | 59,818 | $ | 579,681 | |||||
| Rio Tinto Ltd. | 43,831 | 3,050,809 | ||||||
|
| |||||||
| $ | 3,630,490 | |||||||
|
| |||||||
| Network & Telecom – 0.9% | ||||||||
| Ericsson, Inc., “B” | 180,944 | $ | 1,819,983 | |||||
|
| |||||||
| Oil Services – 1.2% | ||||||||
| Saipem S.p.A. | 40,644 | $ | 1,576,881 | |||||
| Technip | 7,400 | 851,956 | ||||||
|
| |||||||
| $ | 2,428,837 | |||||||
|
| |||||||
| Other Banks & Diversified Financials – 6.2% | ||||||||
| Banco Santander Chile, ADR | 42,700 | $ | 1,216,523 | |||||
| Bank Rakyat Indonesia | 1,454,500 | 1,059,272 | ||||||
| Credicorp Ltd. | 14,640 | 2,145,638 | ||||||
| Grupo Financiero Santander Mexico S.A.B. de C.V., ADR (a) | 61,860 | 1,000,895 | ||||||
| HDFC Bank Ltd. | 150,488 | 1,869,356 | ||||||
| Itau Unibanco Holding S.A., ADR | 133,220 | 2,192,801 | ||||||
| Julius Baer Group Ltd. | 46,218 | 1,662,861 | ||||||
| Siam Commercial Bank Co. Ltd. | 268,800 | 1,590,481 | ||||||
|
| |||||||
| $ | 12,737,827 | |||||||
|
| |||||||
| Pharmaceuticals – 4.5% | ||||||||
| Bayer AG | 22,502 | $ | 2,136,847 | |||||
| Novo Nordisk A/S, “B” | 14,204 | 2,319,795 | ||||||
| Roche Holding AG | 15,642 | 3,186,665 | ||||||
| Santen Pharmaceutical Co. Ltd. | 42,000 | 1,607,087 | ||||||
|
| |||||||
| $ | 9,250,394 | |||||||
|
| |||||||
| Issuer | Shares/Par | Value ($) | ||||||
| COMMON STOCKS – continued | ||||||||
| Precious Metals & Minerals – 0.9% | ||||||||
| Goldcorp, Inc. | 23,320 | $ | 857,356 | |||||
| Newcrest Mining Ltd. | 44,814 | 1,046,272 | ||||||
|
| |||||||
| $ | 1,903,628 | |||||||
|
| |||||||
| Railroad & Shipping – 2.8% | ||||||||
| Canadian National Railway Co. | 40,460 | $ | 3,682,265 | |||||
| Kuehne & Nagel, Inc. AG | 17,320 | 2,107,858 | ||||||
|
| |||||||
| $ | 5,790,123 | |||||||
|
| |||||||
| Specialty Chemicals – 5.1% | ||||||||
| Akzo Nobel N.V. | 21,210 | $ | 1,399,585 | |||||
| Croda International PLC | 38,902 | 1,507,155 | ||||||
| L’Air Liquide S.A. | 16,811 | 2,106,696 | ||||||
| Linde AG | 20,822 | 3,631,137 | ||||||
| Symrise AG | 52,894 | 1,893,450 | ||||||
|
| |||||||
| $ | 10,538,023 | |||||||
|
| |||||||
| Specialty Stores – 1.1% | ||||||||
| Industria de Diseno Textil S.A. | 16,516 | $ | 2,313,856 | |||||
|
| |||||||
| Telecommunications – Wireless – 0.6% | ||||||||
| MTN Group Ltd. | 61,462 | $ | 1,291,840 | |||||
|
| |||||||
| Telephone Services – 1.2% | ||||||||
| China Unicom (Hong Kong) Ltd. | 1,492,000 | $ | 2,419,298 | |||||
|
| |||||||
| Tobacco – 2.3% | ||||||||
| Japan Tobacco, Inc. | 168,700 | $ | 4,751,290 | |||||
|
| |||||||
| Total Common Stocks (Identified Cost, $155,700,643) | $ | 203,933,583 | ||||||
|
| |||||||
| MONEY MARKET FUNDS – 0.0% | ||||||||
| MFS Institutional Money Market Portfolio, 0.16%, at Cost and Net Asset Value (v) | 63,117 | $ | 63,117 | |||||
|
| |||||||
| Total Investments (Identified Cost, $155,763,760) | $ | 203,996,700 | ||||||
|
| |||||||
| OTHER ASSETS, LESS LIABILITIES – 0.4% | 730,417 | |||||||
|
| |||||||
| Net Assets – 100.0% | $ | 204,727,117 | ||||||
|
| |||||||
| (a) | Non-income producing security. |
| (v) | Underlying affiliated fund that is available only to investment companies managed by MFS. The rate quoted for the MFS Institutional Money Market Portfolio is the annualized seven-day yield of the fund at period end. |
The following abbreviations are used in this report and are defined:
| ADR | American Depositary Receipt |
| PLC | Public Limited Company |
See Notes to Financial Statements
8
Table of Contents
MFS International Growth Portfolio
FINANCIAL STATEMENTS | STATEMENT OF ASSETS AND LIABILITIES
This statement represents your fund’s balance sheet, which details the assets and liabilities comprising the total value of the fund.
At 12/31/12 | ||||||||
Assets | ||||||||
Investments – | ||||||||
Non-affiliated issuers, at value (identified cost, $155,700,643) | $203,933,583 | |||||||
Underlying affiliated funds, at cost and value | 63,117 | |||||||
Total investments, at value (identified cost, $155,763,760) | $203,996,700 | |||||||
Cash | 10,941 | |||||||
Foreign currency, at value (identified cost, $2,269) | 2,267 | |||||||
Receivables for | ||||||||
Investments sold | 1,657,193 | |||||||
Fund shares sold | 33,772 | |||||||
Interest and dividends | 259,695 | |||||||
Other assets | 3,093 | |||||||
Total assets | $205,963,661 | |||||||
Liabilities | ||||||||
Payables for | ||||||||
Investments purchased | $274,459 | |||||||
Fund shares reacquired | 527,744 | |||||||
Payable to affiliates | ||||||||
Investment adviser | 20,484 | |||||||
Shareholder servicing costs | 147 | |||||||
Distribution and/or service fees | 782 | |||||||
Payable for independent Trustees’ compensation | 86 | |||||||
Deferred country tax expense payable | 342,625 | |||||||
Accrued expenses and other liabilities | 70,217 | |||||||
Total liabilities | $1,236,544 | |||||||
Net assets | $204,727,117 | |||||||
Net assets consist of | ||||||||
Paid-in capital | $157,073,700 | |||||||
Unrealized appreciation (depreciation) on investments and translation of assets and liabilities in foreign currencies (net of $303,259 deferred country tax) | 47,927,961 | |||||||
Accumulated net realized gain (loss) on investments and foreign currency | (3,036,798 | ) | ||||||
Undistributed net investment income | 2,762,254 | |||||||
Net assets | $204,727,117 | |||||||
Shares of beneficial interest outstanding | 15,602,297 |
| Net assets | Shares outstanding | Net asset value per share | ||||||||||
Initial Class | $175,946,444 | 13,395,626 | $13.13 | |||||||||
Service Class | 28,780,673 | 2,206,671 | 13.04 | |||||||||
See Notes to Financial Statements
9
Table of Contents
MFS International Growth Portfolio
FINANCIAL STATEMENTS | STATEMENT OF OPERATIONS
This statement describes how much your fund earned in investment income and accrued in expenses. It also describes any gains and/or losses generated by fund operations.
| Year ended 12/31/12 | ||||||||
Net investment income | ||||||||
Income | ||||||||
Dividends | $5,833,030 | |||||||
Interest | 104,485 | |||||||
Dividends from underlying affiliated funds | 2,835 | |||||||
Foreign taxes withheld | (504,545 | ) | ||||||
Total investment income | $5,435,805 | |||||||
Expenses | ||||||||
Management fee | $2,158,631 | |||||||
Distribution and/or service fees | 73,652 | |||||||
Shareholder servicing costs | 21,907 | |||||||
Administrative services fee | 44,601 | |||||||
Independent Trustees’ compensation | 11,751 | |||||||
Custodian fee | 154,148 | |||||||
Shareholder communications | 9,972 | |||||||
Audit and tax fees | 57,508 | |||||||
Legal fees | 4,051 | |||||||
Miscellaneous | 24,182 | |||||||
Total expenses | $2,560,403 | |||||||
Fees paid indirectly | (7 | ) | ||||||
Reduction of expenses by investment adviser | (847 | ) | ||||||
Net expenses | $2,559,549 | |||||||
Net investment income | $2,876,256 | |||||||
Realized and unrealized gain (loss) on investments and foreign currency | ||||||||
Realized gain (loss) (identified cost basis) | ||||||||
Investments (net of $94,625 country tax) | $23,668 | |||||||
Foreign currency | (49,672 | ) | ||||||
Net realized gain (loss) on investments and foreign currency | $(26,004 | ) | ||||||
Change in unrealized appreciation (depreciation) | ||||||||
Investments (net of $290,195 increase in deferred country tax) | $40,271,651 | |||||||
Translation of assets and liabilities in foreign currencies | 3,775 | |||||||
Net unrealized gain (loss) on investments and foreign currency translation | $40,275,426 | |||||||
Net realized and unrealized gain (loss) on investments and foreign currency | $40,249,422 | |||||||
Change in net assets from operations | $43,125,678 |
See Notes to Financial Statements
10
Table of Contents
MFS International Growth Portfolio
FINANCIAL STATEMENTS | STATEMENTS OF CHANGES IN NET ASSETS
These statements describe the increases and/or decreases in net assets resulting from operations, any distributions, and any shareholder transactions.
For years ended 12/31 | 2012 | 2011 | ||||||
Change in net assets | ||||||||
From operations | ||||||||
Net investment income | $2,876,256 | $2,687,916 | ||||||
Net realized gain (loss) on investments and foreign currency | (26,004 | ) | (2,607,608 | ) | ||||
Net unrealized gain (loss) on investments and foreign currency translation | 40,275,426 | (25,354,861 | ) | |||||
Change in net assets from operations | $43,125,678 | $(25,274,553 | ) | |||||
Distributions declared to shareholders | ||||||||
From net investment income | $(2,510,069 | ) | $(2,595,452 | ) | ||||
From net realized gain on investments | — | (20,352,060 | ) | |||||
Total distributions declared to shareholders | $(2,510,069 | ) | $(22,947,512 | ) | ||||
Change in net assets from fund share transactions | $(52,864,064 | ) | $12,393,444 | |||||
Total change in net assets | $(12,248,455 | ) | $(35,828,621 | ) | ||||
Net assets | ||||||||
At beginning of period | 216,975,572 | 252,804,193 | ||||||
At end of period (including undistributed net investment income of $2,762,254 and | $204,727,117 | $216,975,572 |
See Notes to Financial Statements
11
Table of Contents
MFS International Growth Portfolio
FINANCIAL STATEMENTS | FINANCIAL HIGHLIGHTS
The financial highlights table is intended to help you understand the fund’s financial performance for the past 5 years. Certain information reflects financial results for a single fund share. The total returns in the table represent the rate by which an investor would have earned (or lost) on an investment in the fund share class (assuming reinvestment of all distributions) held for the entire period.
| Initial Class | Years ended 12/31 | |||||||||||||||||||
| 2012 | 2011 | 2010 | 2009 | 2008 | ||||||||||||||||
Net asset value, beginning of period | $11.08 | $13.85 | $12.13 | $8.90 | $17.63 | |||||||||||||||
| Income (loss) from investment operations | ||||||||||||||||||||
Net investment income (d) | $0.15 | $0.15 | $0.15 | $0.14 | $0.16 | |||||||||||||||
Net realized and unrealized gain (loss) on investments | 2.02 | (1.60 | ) | 1.68 | 3.20 | (6.04 | ) | |||||||||||||
Total from investment operations | $2.17 | $(1.45 | ) | $1.83 | $3.34 | $(5.88 | ) | |||||||||||||
| Less distributions declared to shareholders | ||||||||||||||||||||
From net investment income | $(0.12 | ) | $(0.15 | ) | $(0.11 | ) | $(0.11 | ) | $(0.19 | ) | ||||||||||
From net realized gain on investments | — | (1.17 | ) | — | — | (2.66 | ) | |||||||||||||
Total distributions declared to shareholders | $(0.12 | ) | $(1.32 | ) | $(0.11 | ) | $(0.11 | ) | $(2.85 | ) | ||||||||||
Net asset value, end of period (x) | $13.13 | $11.08 | $13.85 | $12.13 | $8.90 | |||||||||||||||
Total return (%) (k)(r)(s)(x) | 19.71 | (10.89 | ) | 15.16 | 38.06 | (39.82 | ) | |||||||||||||
| Ratios (%) (to average net assets) and Supplemental data: | ||||||||||||||||||||
Expenses before expense reductions (f) | 1.04 | 1.06 | 1.09 | 1.25 | 1.22 | |||||||||||||||
Expenses after expense reductions (f) | 1.04 | N/A | N/A | N/A | N/A | |||||||||||||||
Net investment income | 1.23 | 1.16 | 1.21 | 1.39 | 1.25 | |||||||||||||||
Portfolio turnover | 49 | 52 | 66 | 56 | 73 | |||||||||||||||
Net assets at end of period (000 omitted) | $175,946 | $188,066 | $221,456 | $179,925 | $87,034 | |||||||||||||||
See Notes to Financial Statements
12
Table of Contents
MFS International Growth Portfolio
Financial Highlights – continued
| Service Class | Years ended 12/31 | |||||||||||||||||||
| 2012 | 2011 | 2010 | 2009 | 2008 | ||||||||||||||||
Net asset value, beginning of period | $11.00 | $13.76 | $12.06 | $8.84 | $17.53 | |||||||||||||||
| Income (loss) from investment operations | ||||||||||||||||||||
Net investment income (d) | $0.12 | $0.11 | $0.11 | $0.12 | $0.13 | |||||||||||||||
Net realized and unrealized gain (loss) on investments | 2.01 | (1.58 | ) | 1.67 | 3.18 | (6.00 | ) | |||||||||||||
Total from investment operations | $2.13 | $(1.47 | ) | $1.78 | $3.30 | $(5.87 | ) | |||||||||||||
| Less distributions declared to shareholders | ||||||||||||||||||||
From net investment income | $(0.09 | ) | $(0.12 | ) | $(0.08 | ) | $(0.08 | ) | $(0.16 | ) | ||||||||||
From net realized gain on investments | — | (1.17 | ) | — | — | (2.66 | ) | |||||||||||||
Total distributions declared to shareholders | $(0.09 | ) | $(1.29 | ) | $(0.08 | ) | $(0.08 | ) | $(2.82 | ) | ||||||||||
Net asset value, end of period (x) | $13.04 | $11.00 | $13.76 | $12.06 | $8.84 | |||||||||||||||
Total return (%) (k)(r)(s)(x) | 19.45 | (11.11 | ) | 14.86 | 37.69 | (39.96 | ) | |||||||||||||
| Ratios (%) (to average net assets) and Supplemental data: | ||||||||||||||||||||
Expenses before expense reductions (f) | 1.29 | 1.31 | 1.34 | 1.50 | 1.46 | |||||||||||||||
Expenses after expense reductions (f) | 1.29 | N/A | N/A | N/A | N/A | |||||||||||||||
Net investment income | 0.98 | 0.89 | 0.94 | 1.17 | 1.04 | |||||||||||||||
Portfolio turnover | 49 | 52 | 66 | 56 | 73 | |||||||||||||||
Net assets at end of period (000 omitted) | $28,781 | $28,910 | $31,348 | $27,338 | $18,056 | |||||||||||||||
| (d) | Per share data is based on average shares outstanding. |
| (f) | Ratios do not reflect reductions from fees paid indirectly, if applicable. |
| (k) | The total return does not reflect expenses that apply to separate accounts. Inclusion of these charges would reduce the total return figures for all periods shown. |
| (r) | Certain expenses have been reduced without which performance would have been lower. |
| (s) | From time to time the fund may receive proceeds from litigation settlements, without which performance would be lower. |
| (x) | The net asset values per share and total returns have been calculated on net assets which include adjustments made in accordance with U.S. generally accepted accounting principles required at period end for financial reporting purposes. |
See Notes to Financial Statements
13
Table of Contents
MFS International Growth Portfolio
| (1) | Business and Organization |
MFS International Growth Portfolio (the fund) is a series of MFS Variable Insurance Trust II (the trust). The trust is organized as a Massachusetts business trust and is registered under the Investment Company Act of 1940, as amended, as an open-end management investment company. The shareholders of each series of the trust are separate accounts of insurance companies, which offer variable annuity and/or life insurance products, and qualified retirement and pension plans.
| (2) | Significant Accounting Policies |
General – The preparation of financial statements in conformity with U.S. generally accepted accounting principles requires management to make estimates and assumptions that affect the reported amounts of assets and liabilities, and disclosure of contingent assets and liabilities at the date of the financial statements and the reported amounts of revenues and expenses during the reporting period. Actual results could differ from those estimates. In the preparation of these financial statements, management has evaluated subsequent events occurring after the date of the fund’s Statement of Assets and Liabilities through the date that the financial statements were issued. The fund invests in foreign securities, including securities of emerging market issuers. Investments in foreign securities are vulnerable to the effects of changes in the relative values of the local currency and the U.S. dollar and to the effects of changes in each country’s legal, political, and economic environment. The markets of emerging markets countries are generally more volatile than the markets of developed countries with more mature economies. All of the risks of investing in foreign securities previously described are heightened when investing in emerging markets countries.
In this reporting period the fund adopted Financial Accounting Standards Board (FASB) Accounting Standards Update 2011-04, Fair Value Measurement (Topic 820) – Amendments to Achieve Common Fair Value Measurement and Disclosure Requirements in U.S. GAAP and IFRSs (“ASU 2011-04”). ASU 2011-04 seeks to improve the comparability of fair value measurements as presented and disclosed in financial statements prepared in accordance with U.S. GAAP and International Financial Reporting Standards (IFRS) by providing common requirements for fair value measurement and disclosure.
In December 2011, the FASB issued Accounting Standards Update 2011-11, Balance Sheet (Topic 210) – Disclosures about Offsetting Assets and Liabilities (“ASU 2011-11”). Effective for annual reporting periods beginning on or after January 1, 2013 and interim periods within those annual periods, ASU 2011-11 is intended to enhance disclosure requirements on the offsetting of financial assets and liabilities. Although still evaluating the potential impacts of ASU 2011-11 to the fund, management expects that the impact of the fund’s adoption will be limited to additional financial statement disclosures.
Investment Valuations – Equity securities, including restricted equity securities, are generally valued at the last sale or official closing price as provided by a third-party pricing service on the market or exchange on which they are primarily traded. Equity securities, for which there were no sales reported that day, are generally valued at the last quoted daily bid quotation as provided by a third-party pricing service on the market or exchange on which such securities are primarily traded. Short-term instruments with a maturity at issuance of 60 days or less generally are valued at amortized cost, which approximates market value. Open-end investment companies are generally valued at net asset value per share. Securities and other assets generally valued on the basis of information from a third-party pricing service may also be valued at a broker/dealer bid quotation. Values obtained from third-party pricing services can utilize both transaction data and market information such as yield, quality, coupon rate, maturity, type of issue, trading characteristics, and other market data. The values of foreign securities and other assets and liabilities expressed in foreign currencies are converted to U.S. dollars using the mean of bid and asked prices for rates provided by a third-party pricing service.
The Board of Trustees has delegated primary responsibility for determining or causing to be determined the value of the fund’s investments (including any fair valuation) to the adviser pursuant to valuation policies and procedures approved by the Board. If the adviser determines that reliable market quotations are not readily available, investments are valued at fair value as determined in good faith by the adviser in accordance with such procedures under the oversight of the Board of Trustees. Under the fund’s valuation policies and procedures, market quotations are not considered to be readily available for most types of debt instruments and floating rate loans and many types of derivatives. These investments are generally valued at fair value based on information from third-party pricing services. In addition, investments may be valued at fair value if the adviser determines that an investment’s value has been materially affected by events occurring after the close of the exchange or market on which the investment is principally traded (such as foreign exchange or market) and prior to the determination of the fund’s net asset value, or after the halting of trading of a specific security where trading does not resume prior to the close of the exchange or market on which the security is principally traded. Events that occur on a frequent basis after foreign markets close (such as developments in foreign markets and significant movements in the U.S. markets) and prior to the determination of the fund’s net asset value may be deemed to have a material effect on the value of securities traded in foreign markets. Accordingly, the fund’s foreign equity securities may often be valued at fair value. The adviser generally relies on third-party pricing services or other information (such as the correlation with price movements of similar securities in the same or other markets; the type, cost and investment characteristics of the security; the business and financial condition of the issuer; and trading and other market data) to assist in determining whether to fair value and at what value to fair value an investment. The value of an investment for purposes of calculating the fund’s net asset value can differ depending on the source and method used to determine value. When fair valuation is used, the value of an investment used to
14
Table of Contents
MFS International Growth Portfolio
Notes to Financial Statements – continued
determine the fund’s net asset value may differ from quoted or published prices for the same investment. There can be no assurance that the fund could obtain the fair value assigned to an investment if it were to sell the investment at the same time at which the fund determines its net asset value per share.
Various inputs are used in determining the value of the fund’s assets or liabilities. These inputs are categorized into three broad levels. In certain cases, the inputs used to measure fair value may fall into different levels of the fair value hierarchy. In such cases, an investment’s level within the fair value hierarchy is based on the lowest level of input that is significant to the fair value measurement. The fund’s assessment of the significance of a particular input to the fair value measurement in its entirety requires judgment, and considers factors specific to the investment. Level 1 includes unadjusted quoted prices in active markets for identical assets or liabilities. Level 2 includes other significant observable market-based inputs (including quoted prices for similar securities, interest rates, prepayment speed, and credit risk). Level 3 includes unobservable inputs, which may include the adviser’s own assumptions in determining the fair value of investments. The following is a summary of the levels used as of December 31, 2012 in valuing the fund’s assets or liabilities:
| Investments at Value | Level 1 | Level 2 | Level 3 | Total | ||||||||||||
| Equity Securities: | ||||||||||||||||
United Kingdom | $— | $34,177,503 | $— | $34,177,503 | ||||||||||||
France | — | 28,864,867 | — | 28,864,867 | ||||||||||||
Japan | 7,973,169 | 15,105,341 | — | 23,078,510 | ||||||||||||
Switzerland | 7,423,326 | 11,685,221 | — | 19,108,547 | ||||||||||||
Germany | 4,476,366 | 12,717,360 | — | 17,193,726 | ||||||||||||
Hong Kong | — | 8,736,602 | — | 8,736,602 | ||||||||||||
Brazil | 2,779,324 | 4,486,244 | — | 7,265,568 | ||||||||||||
Canada | 6,814,223 | — | — | 6,814,223 | ||||||||||||
Netherlands | 1,047,886 | 4,711,719 | — | 5,759,605 | ||||||||||||
Other Countries | 21,599,125 | 31,335,307 | — | 52,934,432 | ||||||||||||
| Mutual Funds | 63,117 | — | — | 63,117 | ||||||||||||
| Total Investments | $52,176,536 | $151,820,164 | $— | $203,996,700 | ||||||||||||
For further information regarding security characteristics, see the Portfolio of Investments.
Of the level 2 investments presented above, equity investments amounting to $71,715,505 would have been considered level 1 investments at the beginning of the period. Of the level 1 investments presented above, equity investments amounting to $4,863,853 would have been considered level 2 investments at the beginning of the period. The primary reason for changes in the classifications between levels 1 and 2 occurs when foreign equity securities are fair valued using other observable market-based inputs in place of the closing exchange price due to events occurring after the close of the exchange or market on which the investment is principally traded. The fund’s foreign equity securities may often be valued at fair value. The fund’s policy is to recognize transfers between the levels as of the end of the period.
Foreign Currency Translation – Purchases and sales of foreign investments, income, and expenses are converted into U.S. dollars based upon currency exchange rates prevailing on the respective dates of such transactions or on the reporting date for foreign denominated receivables and payables. Gains and losses attributable to foreign currency exchange rates on sales of securities are recorded for financial statement purposes as net realized gains and losses on investments. Gains and losses attributable to foreign exchange rate movements on receivables, payables, income and expenses are recorded for financial statement purposes as foreign currency transaction gains and losses. That portion of both realized and unrealized gains and losses on investments that results from fluctuations in foreign currency exchange rates is not separately disclosed.
Security Loans – State Street Bank and Trust Company (“State Street”), as lending agent, loans the securities of the fund to certain qualified institutions (the “Borrowers”) approved by the fund. The loans are collateralized by cash and/or U.S. Treasury and federal agency obligations in an amount typically at least equal to the market value of the securities loaned. The market value of the loaned securities is determined at the close of business of the fund and any additional required collateral is delivered to the fund on the next business day. State Street provides the fund with indemnification against Borrower default. The fund bears the risk of loss with respect to the investment of cash collateral. On loans collateralized by cash, the cash collateral is invested in a money market fund or short-term securities. A portion of the income generated upon investment of the collateral is remitted to the Borrowers, and the remainder is allocated between the fund and the lending agent. On loans collateralized by U.S. Treasury and/or federal agency obligations, a fee is received from the Borrower, and is allocated between the fund and the lending agent. Income from securities lending is included in “Interest” income in the Statement of Operations. The dividend and interest income earned on the securities loaned is accounted for in the same manner as other dividend and interest income. At December 31, 2012, there were no securities on loan or collateral outstanding.
15
Table of Contents
MFS International Growth Portfolio
Notes to Financial Statements – continued
Indemnifications – Under the fund’s organizational documents, its officers and Trustees may be indemnified against certain liabilities and expenses arising out of the performance of their duties to the fund. Additionally, in the normal course of business, the fund enters into agreements with service providers that may contain indemnification clauses. The fund’s maximum exposure under these agreements is unknown as this would involve future claims that may be made against the fund that have not yet occurred.
Investment Transactions and Income – Investment transactions are recorded on the trade date. Interest income is recorded on the accrual basis. Dividends received in cash are recorded on the ex-dividend date. Certain dividends from foreign securities will be recorded when the fund is informed of the dividend if such information is obtained subsequent to the ex-dividend date. Dividend and interest payments received in additional securities are recorded on the ex-dividend or ex-interest date in an amount equal to the value of the security on such date.
The fund may receive proceeds from litigation settlements. Any proceeds received from litigation involving portfolio holdings are reflected in the Statement of Operations in realized gain/loss if the security has been disposed of by the fund or in unrealized gain/loss if the security is still held by the fund. Any other proceeds from litigation not related to portfolio holdings are reflected as other income in the Statement of Operations.
Fees Paid Indirectly – The fund’s custody fee may be reduced according to an arrangement that measures the value of cash deposited with the custodian by the fund. This amount, for the year ended December 31, 2012, is shown as a reduction of total expenses in the Statement of Operations.
Tax Matters and Distributions – The fund intends to qualify as a regulated investment company, as defined under Subchapter M of the Internal Revenue Code, and to distribute all of its taxable income, including realized capital gains. As a result, no provision for federal income tax is required. The fund’s federal tax returns, when filed, will remain subject to examination by the Internal Revenue Service for a three year period. Foreign taxes have been accrued by the fund in the accompanying financial statements.
Distributions to shareholders are recorded on the ex-dividend date. Income and capital gain distributions are determined in accordance with income tax regulations, which may differ from U.S. generally accepted accounting principles. Certain capital accounts in the financial statements are periodically adjusted for permanent differences in order to reflect their tax character. These adjustments have no impact on net assets or net asset value per share. Temporary differences which arise from recognizing certain items of income, expense, gain or loss in different periods for financial statement and tax purposes will reverse at some time in the future. Distributions in excess of net investment income or net realized gains are temporary overdistributions for financial statement purposes resulting from differences in the recognition or classification of income or distributions for financial statement and tax purposes.
Book/tax differences primarily relate to wash sale loss deferrals.
The tax character of distributions declared to shareholders for the last two fiscal years is as follows:
| 12/31/12 | 12/31/11 | |||||||
| Ordinary income (including any short-term capital gains) | $2,510,069 | $4,599,059 | ||||||
| Long-term capital gains | — | 18,348,453 | ||||||
| Total distributions | $2,510,069 | $22,947,512 | ||||||
The federal tax cost and the tax basis components of distributable earnings were as follows:
| As of 12/31/12 | ||||
| Cost of investments | $158,834,790 | |||
| Gross appreciation | 47,216,976 | |||
| Gross depreciation | (2,055,066 | ) | ||
| Net unrealized appreciation (depreciation) | $45,161,910 | |||
| Undistributed ordinary income | 2,765,343 | |||
| Undistributed long-term capital gain | 73,598 | |||
| Other temporary differences | (347,434 | ) |
16
Table of Contents
MFS International Growth Portfolio
Notes to Financial Statements – continued
Multiple Classes of Shares of Beneficial Interest – The fund offers multiple classes of shares, which differ in their respective distribution and/or service fees. The fund’s income, realized and unrealized gain (loss), and common expenses are allocated to shareholders based on the daily net assets of each class. Dividends are declared separately for each class. Differences in per share dividend rates are generally due to differences in separate class expenses. The fund’s distributions declared to shareholders as reported in the Statements of Changes in Net Assets are presented by class as follows:
| From net investment income | From net realized gain on investments | |||||||||||||||
| Year ended 12/31/12 | Year ended 12/31/11 | Year ended 12/31/12 | Year ended 12/31/11 | |||||||||||||
| Initial Class | $2,288,995 | $2,313,897 | $— | $17,674,412 | ||||||||||||
| Service Class | 221,074 | 281,555 | — | 2,677,648 | ||||||||||||
| Total | $2,510,069 | $2,595,452 | $— | $20,352,060 | ||||||||||||
| (3) | Transactions with Affiliates |
Investment Adviser – The fund has an investment advisory agreement with MFS to provide overall investment management and related administrative services and facilities to the fund. The management fee is computed daily and paid monthly at the following annual rates:
| First $1 billion of average daily net assets | 0.90% | |||
| Next $1 billion of average daily net assets | 0.80% | |||
| Average daily net assets in excess of $2 billion | 0.70% |
The management fee incurred for the year ended December 31, 2012 was equivalent to an annual effective rate of 0.90% of the fund’s average daily net assets.
The investment adviser has agreed in writing to pay a portion of the fund’s total annual operating expenses, exclusive of interest, taxes, extraordinary expenses, brokerage and transaction costs, and investment-related expenses, such that total annual operating expenses do not exceed 1.35% of average daily net assets for the Initial Class shares and 1.60% of average daily net assets for the Service Class shares. This written agreement will continue until modified by the fund’s Board of Trustees, but such agreement will continue at least until April 30, 2014. For the year ended December 31, 2012 the fund’s actual operating expenses did not exceed the limit and therefore, the investment adviser did not pay any portion of the fund’s expenses related to this agreement.
Distributor – MFS Fund Distributors, Inc. (MFD), a wholly-owned subsidiary of MFS, is the distributor of shares of the fund. The Trustees have adopted a distribution plan for the Service Class shares pursuant to Rule 12b-1 under the Investment Company Act of 1940.
The fund’s distribution plan provides that the fund will pay MFD distribution and/or service fees equal to 0.25% per annum of its average daily net assets attributable to Service Class shares as partial consideration for services performed and expenses incurred by MFD and financial intermediaries (including participating insurance companies that invest in the fund to fund variable annuity and variable life insurance contracts, sponsors of qualified retirement and pension plans that invest in the fund, and affiliates of these participating insurance companies and plan sponsors) in connection with the sale and distribution of the Service Class shares. MFD may subsequently pay all, or a portion, of the distribution and/or service fees to financial intermediaries.
Shareholder Servicing Agent – MFS Service Center, Inc. (MFSC), a wholly-owned subsidiary of MFS, receives a fee from the fund for its services as shareholder servicing agent. For the year ended December 31, 2012, the fee was $21,873, which equated to 0.0091% annually of the fund’s average daily net assets. MFSC also receives payment from the fund for out-of-pocket expenses paid by MFSC on behalf of the fund. For the year ended December 31, 2012, these costs amounted to $34.
Administrator – MFS provides certain financial, legal, shareholder communications, compliance, and other administrative services to the fund. Under an administrative services agreement, the fund partially reimburses MFS the costs incurred to provide these services. The fund is charged an annual fixed amount of $17,500 plus a fee based on average daily net assets. The administrative services fee incurred for the year ended December 31, 2012 was equivalent to an annual effective rate of 0.0186% of the fund’s average daily net assets.
Trustees’ and Officers’ Compensation – The fund pays compensation to independent Trustees in the form of a retainer, attendance fees, and additional compensation to Board and Committee chairpersons. The fund does not pay compensation directly to Trustees or officers of the fund who are also officers of the investment adviser, all of whom receive remuneration for their services to the fund from MFS. Certain officers and Trustees of the fund are officers or directors of MFS, MFD, and MFSC.
Other – This fund and certain other funds managed by MFS (the funds) have entered into services agreements (the Agreements) which provide for payment of fees by the funds to Tarantino LLC and Griffin Compliance LLC in return for the provision of services of an Independent Chief Compliance Officer (ICCO) and Assistant ICCO, respectively, for the funds. The ICCO and Assistant ICCO are
17
Table of Contents
MFS International Growth Portfolio
Notes to Financial Statements – continued
officers of the funds and the sole members of Tarantino LLC and Griffin Compliance LLC, respectively. The funds can terminate the Agreements with Tarantino LLC and Griffin Compliance LLC at any time under the terms of the Agreements. For the year ended December 31, 2012, the aggregate fees paid by the fund to Tarantino LLC and Griffin Compliance LLC were $1,994 and are included in “Miscellaneous” expense in the Statement of Operations. MFS has agreed to reimburse the fund for a portion of the payments made by the fund in the amount of $847, which is shown as a reduction of total expenses in the Statement of Operations. Additionally, MFS has agreed to bear all expenses associated with office space, other administrative support, and supplies provided to the ICCO and Assistant ICCO.
The fund invests in the MFS Institutional Money Market Portfolio which is managed by MFS and seeks current income consistent with preservation of capital and liquidity. Income earned on this investment is included in “Dividends from underlying affiliated funds” in the Statement of Operations. This money market fund does not pay a management fee to MFS.
| (4) | Portfolio Securities |
Purchases and sales of investments, other than short-term obligations, aggregated $114,402,577 and $165,850,237, respectively.
| (5) | Shares of Beneficial Interest |
The fund’s Declaration of Trust permits the Trustees to issue an unlimited number of full and fractional shares of beneficial interest. Transactions in fund shares were as follows:
| Year ended 12/31/12 | Year ended 12/31/11 | |||||||||||||||
| Shares | Amount | Shares | Amount | |||||||||||||
| Shares sold | ||||||||||||||||
Initial Class | 2,804,887 | $32,459,829 | 2,376,645 | $29,705,818 | ||||||||||||
Service Class | 263,326 | 3,136,358 | 529,083 | 6,566,825 | ||||||||||||
| 3,068,213 | $35,596,187 | 2,905,728 | $36,272,643 | |||||||||||||
| Shares issued to shareholders in reinvestment of distributions | ||||||||||||||||
Initial Class | 189,958 | $2,288,995 | 1,714,263 | $19,988,309 | ||||||||||||
Service Class | 18,454 | 221,074 | 255,323 | 2,959,203 | ||||||||||||
| 208,412 | $2,510,069 | 1,969,586 | $22,947,512 | |||||||||||||
| Shares reacquired | ||||||||||||||||
Initial Class | (6,567,676 | ) | $(82,323,451 | ) | (3,115,040 | ) | $(41,294,745 | ) | ||||||||
Service Class | (702,254 | ) | (8,646,869 | ) | (435,552 | ) | (5,531,966 | ) | ||||||||
| (7,269,930 | ) | $(90,970,320 | ) | (3,550,592 | ) | $(46,826,711 | ) | |||||||||
| Net change | ||||||||||||||||
Initial Class | (3,572,831 | ) | $(47,574,627 | ) | 975,868 | $8,399,382 | ||||||||||
Service Class | (420,474 | ) | (5,289,437 | ) | 348,854 | 3,994,062 | ||||||||||
| (3,993,305 | ) | $(52,864,064 | ) | 1,324,722 | $12,393,444 | |||||||||||
The fund is one of several mutual funds in which the MFS funds-of-funds may invest. The MFS funds-of-funds do not invest in the underlying MFS funds for the purpose of exercising management or control. At the end of the period, the MFS Moderate Allocation Portfolio, MFS Growth Allocation Portfolio, and MFS Conservative Allocation Portfolio were the owners of record of approximately 11%, 5%, and 4% respectively, of the value of outstanding voting shares of the fund.
| (6) | Line of Credit |
The fund and certain other funds managed by MFS participate in a $1.1 billion unsecured committed line of credit, subject to a $1 billion sublimit, provided by a syndication of banks under a credit agreement. Borrowings may be made for temporary financing needs. Interest is charged to each fund, based on its borrowings, generally at a rate equal to the higher of the Federal Reserve funds rate or one month LIBOR plus an agreed upon spread. A commitment fee, based on the average daily, unused portion of the committed line of credit, is allocated among the participating funds at the end of each calendar quarter. In addition, the fund and other funds managed by MFS have established unsecured uncommitted borrowing arrangements with certain banks for temporary financing needs. Interest is charged to each fund, based on its borrowings, at a rate equal to the Federal Reserve funds rate plus an agreed upon spread. For the year ended December 31, 2012, the fund’s commitment fee and interest expense were $1,559 and $0, respectively, and are included in “Miscellaneous” expense in the Statement of Operations.
18
Table of Contents
MFS International Growth Portfolio
Notes to Financial Statements – continued
| (7) | Transactions in Underlying Affiliated Funds – Affiliated Issuers |
An affiliated issuer may be considered one in which the fund owns 5% or more of the outstanding voting securities, or a company which is under common control. For the purposes of this report, the fund assumes the following to be an affiliated issuer:
| Underlying Affiliated Fund | Beginning Shares/Par Amount | Acquisitions Shares/Par Amount | Dispositions Shares/Par Amount | Ending Shares/Par Amount | ||||||||||||
| MFS Institutional Money Market Portfolio | 1,785,076 | 61,525,367 | (63,247,326 | ) | 63,117 | |||||||||||
| Underlying Affiliated Fund | Realized Gain (Loss) | Capital Gain Distributions | Dividend Income | Ending Value | ||||||||||||
| MFS Institutional Money Market Portfolio | $— | $— | $2,835 | $63,117 | ||||||||||||
19
Table of Contents
MFS International Growth Portfolio
REPORT OF INDEPENDENT REGISTERED PUBLIC ACCOUNTING FIRM
To the Board of Trustees of MFS Variable Insurance Trust II and the Shareholders of
MFS International Growth Portfolio:
We have audited the accompanying statement of assets and liabilities, including the portfolio of investments, of MFS International Growth Portfolio (the “Fund”) (one of the series comprising MFS Variable Insurance Trust II) as of December 31, 2012, and the related statement of operations for the year then ended, the statements of changes in net assets for each of the two years in the period then ended, and the financial highlights for each of the five years in the period then ended. These financial statements and financial highlights are the responsibility of the Fund’s management. Our responsibility is to express an opinion on these financial statements and financial highlights based on our audits.
We conducted our audits in accordance with the standards of the Public Company Accounting Oversight Board (United States). Those standards require that we plan and perform the audit to obtain reasonable assurance about whether the financial statements and financial highlights are free of material misstatement. The Fund is not required to have, nor were we engaged to perform, an audit of its internal control over financial reporting. Our audits included consideration of internal control over financial reporting as a basis for designing audit procedures that are appropriate in the circumstances, but not for the purpose of expressing an opinion on the effectiveness of the Fund’s internal control over financial reporting. Accordingly, we express no such opinion. An audit also includes examining, on a test basis, evidence supporting the amounts and disclosures in the financial statements, assessing the accounting principles used and significant estimates made by management, as well as evaluating the overall financial statement presentation. Our procedures included confirmation of securities owned as of December 31, 2012, by correspondence with the custodian and brokers; where replies were not received from brokers, we performed other auditing procedures. We believe that our audits provide a reasonable basis for our opinion.
In our opinion, the financial statements and financial highlights referred to above present fairly, in all material respects, the financial position of MFS International Growth Portfolio as of December 31, 2012, the results of its operations for the year then ended, the changes in its net assets for each of the two years in the period then ended, and the financial highlights for each of the five years in the period then ended, in conformity with accounting principles generally accepted in the United States of America.
DELOITTE & TOUCHE LLP
Boston, Massachusetts
February 15, 2013
20
Table of Contents
MFS International Growth Portfolio
TRUSTEES AND OFFICERS – IDENTIFICATION AND BACKGROUND
The Trustees and officers of the Trust, as of February 1, 2013, are listed below, together with their principal occupations during the past five years. (Their titles may have varied during that period.) The address of each Trustee and officer is 111 Huntington Avenue, Boston, Massachusetts 02199-7618.
Name, Age | Position(s) with Fund | Trustee/Officer Since (h) | Principal Occupations During the Past Five Years | Other Directorships (j) | ||||
| INTERESTED TRUSTEES | ||||||||
Robert J. Manning (k) (age 49) | Trustee | February 2004 | Massachusetts Financial Services Company, Chairman, Chief Executive Officer and Director; President (until December 2009); Chief Investment Officer (until July 2010) | N/A | ||||
| INDEPENDENT TRUSTEES | ||||||||
David H. Gunning (age 70) | Trustee and Chair of Trustees | January 2004 | Private investor | Lincoln Electric Holdings, Inc. (welding equipment manufacturer), Director; Development Alternatives, Inc. (consulting), Director/Non-Executive Chairman; Portman Limited (mining), Director (until 2008) | ||||
Robert E. Butler (age 71) | Trustee | January 2006 | Consultant – investment company industry regulatory and compliance matters | N/A | ||||
Maureen R. Goldfarb (age 57) | Trustee | January 2009 | Private investor | N/A | ||||
William R. Gutow (age 71) | Trustee | December 1993 | Private investor and real estate consultant; Capitol Entertainment Management Company (video franchise), Vice Chairman | Atlantic Coast Tan (tanning salons), Vice Chairman (until 2007); Texas Donuts (donut franchise), Vice Chairman (until 2010) | ||||
Michael Hegarty (age 68) | Trustee | December 2004 | Private investor; Rouse Properties Inc. (real estate), Director | N/A | ||||
John P. Kavanaugh (age 58) | Trustee | January 2009 | Private investor | N/A | ||||
J. Dale Sherratt (age 74) | Trustee | June 1989 | Insight Resources, Inc. (acquisition planning specialists), President; Wellfleet Investments (investor in health care companies), Managing General Partner | N/A | ||||
| Laurie J. Thomsen (age 55) | Trustee | March 2005 | Private investor; New Profit, Inc. (venture philanthropy), Executive Partner (until 2010) | The Travelers Companies (insurance), Director | ||||
Robert W. Uek (age 71) | Trustee | January 2006 | Consultant to investment company industry | N/A | ||||
| OFFICERS | ||||||||
John M. Corcoran (k) (age 47) | President | October 2008 | Massachusetts Financial Services Company, Senior Vice President (since October 2008); State Street Bank and Trust (financial services provider), Senior Vice President, (until September 2008) | N/A | ||||
| Christopher R. Bohane (k) (age 39) | Assistant Secretary and Assistant Clerk | July 2005 | Massachusetts Financial Services Company, Vice President and Senior Counsel | N/A | ||||
Kino Clark (k) (age 44) | Assistant Treasurer | January 2012 | Massachusetts Financial Services Company, Vice President | N/A | ||||
Thomas H. Connors (k) (age 53) | Assistant Secretary and Assistant Clerk | September 2012 | Massachusetts Financial Services Company, Vice President and Senior Counsel; Deutsche Investment Management Americas Inc. (financial service provider), Director and Senior Counsel (until 2012) | N/A | ||||
Ethan D. Corey (k) (age 49) | Assistant Secretary and Assistant Clerk | July 2005 | Massachusetts Financial Services Company, Senior Vice President and Associate General Counsel | N/A | ||||
21
Table of Contents
MFS International Growth Portfolio
Trustees and Officers – continued
Name, Age | Position(s) with Fund | Trustee/Officer Since (h) | Principal Occupations During the Past Five Years | Other Directorships (j) | ||||
David L. DiLorenzo (k) (age 44) | Treasurer | July 2005 | Massachusetts Financial Services Company, Senior Vice President | N/A | ||||
Robyn L. Griffin (age 37) | Assistant Independent Chief Compliance Officer | August 2008 | Griffin Compliance LLC (provider of compliance services), Principal (since August 2008); State Street Corporation (financial services provider), Mutual Fund Administration Assistant Vice President (October 2006 – July 2008) | N/A | ||||
Brian E. Langenfeld (k) (age 39) | Assistant Secretary and Assistant Clerk | June 2006 | Massachusetts Financial Services Company, Vice President and Senior Counsel | N/A | ||||
Susan S. Newton (k) (age 62) | Assistant Secretary and Assistant Clerk | May 2005 | Massachusetts Financial Services Company, Senior Vice President and Associate General Counsel | N/A | ||||
Susan A. Pereira (k) (age 42) | Assistant Secretary and Assistant Clerk | July 2005 | Massachusetts Financial Services Company, Vice President and Senior Counsel | N/A | ||||
Kasey L. Phillips (k) (age 42) | Assistant Treasurer | September 2012 | Massachusetts Financial Services Company, Vice President; Wells Fargo Funds Management, LLC, Senior Vice President, Fund Treasurer (until 2012) | N/A | ||||
Mark N. Polebaum (k) (age 60) | Secretary and Clerk | January 2006 | Massachusetts Financial Services Company, Executive Vice President, General Counsel and Secretary | N/A | ||||
Frank L. Tarantino (age 68) | Independent Chief Compliance Officer | June 2004 | Tarantino LLC (provider of compliance services), Principal | N/A | ||||
Richard S. Weitzel (k) (age 42) | Assistant Secretary and Assistant Clerk | October 2007 | Massachusetts Financial Services Company, Senior Vice President and Associate General Counsel | N/A | ||||
James O. Yost (k) (age 52) | Deputy Treasurer | September 1990 | Massachusetts Financial Services Company, Senior Vice President | N/A | ||||
| (h) | Date first appointed to serve as Trustee/officer of an MFS fund. Each Trustee has served continuously since appointment unless indicated otherwise. For the period from December 15, 2004 until February 22, 2005, Mr. Manning served as Advisory Trustee. For the period October 2008, until January 2012, Mr. Corcoran served as Treasurer of the Funds. Prior to January 2012, Messrs. DiLorenzo and Yost served as Assistant Treasurers of the Funds. |
| (j) | Directorships or trusteeships of companies required to report to the Securities and Exchange Commission (i.e., “public companies”). |
| (k) | “Interested person” of the Trust within the meaning of the Investment Company Act of 1940 (referred to as the 1940 Act), which is the principal federal law governing investment companies like the fund, as a result of position with MFS. The address of MFS is 111 Huntington Avenue, Boston, Massachusetts 02199-7618. |
Each Trustee has been elected by shareholders and each Trustee and officer holds office until his or her successor is chosen and qualified or until his or her earlier death, resignation, retirement or removal. The Trust does not hold annual meetings for the purpose of electing Trustees, and Trustees are not elected for fixed terms. Messrs. Butler, Kavanaugh, Uek and Ms. Thomsen are members of the Trust’s Audit Committee.
Each of the Fund’s Trustees and officers holds comparable positions with certain other funds of which MFS or a subsidiary is the investment adviser or distributor, and, in the case of the officers, with certain affiliates of MFS. As of January 1, 2013, the Trustees served as board members of 143 funds within the MFS Family of Funds.
22
Table of Contents
MFS International Growth Portfolio
Trustees and Officers – continued
The Statement of Additional Information for the Fund includes further information about the Trustees and is available without charge upon request by calling 1-800-225-2606.
Investment Adviser Massachusetts Financial Services Company 111 Huntington Avenue Boston, MA 02199-7618 | Custodian State Street Bank and Trust 1 Lincoln Street Boston, MA 02111-2900 | |
Distributor MFS Fund Distributors, Inc. 111 Huntington Avenue Boston, MA 02199-7618 | Independent Registered Public Accounting Firm Deloitte & Touche LLP 200 Berkeley Street Boston, MA 02116 | |
Portfolio Managers David Antonelli Kevin Dwan |
23
Table of Contents
MFS International Growth Portfolio
BOARD REVIEW OF INVESTMENT ADVISORY AGREEMENT
A discussion regarding the Board’s most recent approval of the fund’s Investment Advisory Agreement with MFS is available by clicking on the fund’s name under “Variable Insurance Portfolios – VIT II” in the “Products” section of the MFS Web site (mfs.com).
PROXY VOTING POLICIES AND INFORMATION
A general description of the MFS funds’ proxy voting policies and procedures is available without charge, upon request, by calling 1-800-225-2606, by visiting the Proxy Voting section of mfs.com or by visiting the SEC’s Web site at http://www.sec.gov.
Information regarding how the fund voted proxies relating to portfolio securities during the most recent twelve-month period ended June 30 is available without charge by visiting the Proxy Voting section of mfs.com or by visiting the SEC’s Web site at http://www.sec.gov.
QUARTERLY PORTFOLIO DISCLOSURE
The fund will file a complete schedule of portfolio holdings with the Securities and Exchange Commission (the Commission) for the first and third quarters of each fiscal year on Form N-Q. The fund’s Form N-Q is available on the EDGAR database on the Commission’s Internet Web site at http://www.sec.gov, and may be reviewed and copied at the:
Public Reference Room
Securities and Exchange Commission
100 F Street, NE, Room 1580
Washington, D.C. 20549
Information on the operation of the Public Reference Room may be obtained by calling the Commission at 1-800-SEC-0330. Copies of the fund’s Form N-Q also may be obtained, upon payment of a duplicating fee, by electronic request at the following e-mail address: publicinfo@sec.gov or by writing the Public Reference Section at the above address.
From time to time, MFS may post important information about the fund or the MFS funds on the MFS web site (mfs.com). This information is available by visiting the “News & Commentary” section of mfs.com or by clicking on the fund’s name under “Variable Insurance Portfolios – VIT II” in the “Products” section of mfs.com.
FEDERAL TAX INFORMATION (unaudited)
The following information is provided pursuant to provisions of the Internal Revenue Code.
Income derived from foreign sources was $4,877,346. The fund intends to pass through foreign tax credits of $415,663 for the fiscal year.
24
Table of Contents
rev. 3/11

| Why? | Financial companies choose how they share your personal information. Federal law gives consumers the right to limit some but not all sharing. Federal law also requires us to tell you how we collect, share, and protect your personal information. Please read this notice carefully to understand what we do. |
| What? | The types of personal information we collect and share depend on the product or service you have with us. This information can include:
• Social Security number and account balances • Account transactions and transaction history • Checking account information and wire transfer instructions
When you are no longer our customer, we continue to share your information as described in this notice. |
| How? | All financial companies need to share customers’ personal information to run their everyday business. In the section below, we list the reasons financial companies can share their customers’ personal information; the reasons MFS chooses to share; and whether you can limit this sharing. |
| Reasons we can share your personal information | Does MFS share? | Can you limit this sharing? | ||
For our everyday business purposes – such as to process your transactions, maintain your account(s), respond to court orders and legal investigations, or report to credit bureaus | Yes | No | ||
For our marketing purposes – to offer our products and services to you | No | We don’t share | ||
| For joint marketing with other financial companies | No | We don’t share | ||
For our affiliates’ everyday business purposes – information about your transactions and experiences | No | We don’t share | ||
For our affiliates’ everyday business purposes – information about your creditworthiness | No | We don’t share | ||
| For nonaffiliates to market to you | No | We don’t share |
| Questions? | Call 800-225-2606 or go to mfs.com. |
25
Table of Contents
| Page 2 |
| Who we are | ||
| Who is providing this notice? | MFS Funds, MFS Investment Management, MFS Institutional Advisors, Inc., MFS Fund Distributors, Inc., MFS Heritage Trust Company, and MFS Service Center, Inc. | |
| What we do | ||
| How does MFS protect my personal information? | To protect your personal information from unauthorized access and use, we use security measures that comply with federal law. These measures include procedural, electronic, and physical safeguards for the protection of the personal information we collect about you. | |
| How does MFS collect my personal information? | We collect your personal information, for example, when you
• open an account or provide account information • direct us to buy securities or direct us to sell your securities • make a wire transfer
We also collect your personal information from others, such as credit bureaus, affiliates and other companies. | |
| Why can’t I limit all sharing? | Federal law gives you the right to limit only
• sharing for affiliates’ everyday business purposes – information about your creditworthiness • affiliates from using your information to market to you • sharing for nonaffiliates to market to you
State laws and individual companies may give you additional rights to limit sharing. | |
| Definitions | ||
| Affiliates | Companies related by common ownership or control. They can be financial and nonfinancial companies.
• MFS does not share personal information with affiliates, except for everyday business purposes as described on page one of this notice. | |
| Nonaffiliates | Companies not related by common ownership or control. They can be financial and nonfinancial companies.
• MFS does not share with nonaffiliates so they can market to you. | |
| Joint Marketing | A formal agreement between nonaffiliated financial companies that together market financial products or services to you.
• MFS doesn’t jointly market. | |
| Other important information | ||
| If you own an MFS product or receive an MFS service in the name of a third party such as a bank or broker-dealer, their privacy policy may apply to you instead of ours. | ||
26
Table of Contents
Table of Contents
ANNUAL REPORT
December 31, 2012

MFS® INTERNATIONAL VALUE PORTFOLIO
MFS® Variable Insurance Trust II

FCG-ANN
Table of Contents
MFS® INTERNATIONAL VALUE PORTFOLIO
The report is prepared for the general information of contract owners. It is authorized for distribution to prospective investors only when preceded or accompanied by a current prospectus.
NOT FDIC INSURED Ÿ MAY LOSE VALUE Ÿ NO BANK OR CREDIT UNION GUARANTEE Ÿ NOT A DEPOSIT Ÿ NOT INSURED BY ANY FEDERAL GOVERNMENT AGENCY OR NCUA/NCUSIF
Table of Contents
MFS International Value Portfolio
LETTER FROM THE CHAIRMAN AND CEO

Dear Contract Owners:
The global market outlook for 2013 is one of cautious optimism. While we are seeing some positive economic trends in the United States, Europe and China, the overall environment remains challenging. In the United States, the recent fiscal cliff agreement was received positively by investors, even though it mostly addressed pressing taxation issues and did not resolve additional concerns, including the need for spending cuts and a large-scale reduction of the federal debt. These issues will be front and center again in the spring. Despite the ongoing uncertainty, economic tailwinds are gathering strength as the U.S. housing and job markets are improving and consumer confidence is rising.
Overseas, the debt crisis continues to weigh heavily on eurozone markets, with even Germany — long an economic stalwart — experiencing some contraction. These ongoing challenges could be a drag on global market performance this year. In Asia, manufacturing activity has accelerated in emerging markets such as China and India, and we are seeing signs of stabilized loan growth in China, a leading indicator of that country’s economic health. In contrast, Japan’s economy is contracting sharply under deflationary pressures. Nevertheless, Japanese markets have responded favorably to early actions by the new government, which appears determined to act aggressively, along with the Bank of Japan, to stimulate growth.
As always, managing risk in the face of uncertainty remains a top priority for investors. At MFS®, our uniquely collaborative investment process revolves around global research and our disciplined risk management approach. Our global team of investment professionals shares ideas and evaluates opportunities across continents, investment disciplines and asset classes — all with a goal of building better insights, and ultimately better results, for our clients.
We remain mindful of the many economic challenges investors face today, and believe it is more important than ever to maintain a long-term view, employ time-tested principles, such as asset allocation and diversification, and work closely with investment advisors to identify and pursue the most suitable opportunities.
Respectfully,

Robert J. Manning
Chairman and Chief Executive Officer
MFS Investment Management®
February 15, 2013
The opinions expressed in this letter are subject to change, may not be relied upon for investment advice, and no forecasts can be guaranteed.
1
Table of Contents
MFS International Value Portfolio
Portfolio structure (i)

| Top ten holdings | ||||
| KDDI Corp. | 3.4% | |||
| Groupe Danone | 2.9% | |||
| Royal Dutch Shell PLC, “A” | 2.8% | |||
| Heineken N.V. | 2.8% | |||
| HSBC Holdings PLC | 2.7% | |||
| Roche Holding AG | 2.6% | |||
| Nestle S.A. | 2.5% | |||
| GlaxoSmithKline PLC | 2.3% | |||
| Bayer AG | 2.3% | |||
| Kao Corp. | 2.2% |
| Equity sectors | ||||
| Financial Services | 20.1% | |||
| Consumer Staples | 19.7% | |||
| Health Care | 9.8% | |||
| Utilities & Communications | 9.5% | |||
| Technology | 9.3% | |||
| Special Products & Services | 6.1% | |||
| Energy | 5.7% | |||
| Industrial Goods & Services | 4.8% | |||
| Leisure | 3.2% | |||
| Basic Materials | 2.8% | |||
| Retailing | 1.8% | |||
| Autos & Housing | 1.4% | |||
| Transportation | 1.3% |
| Issuer country weightings (i)(x) | ||||
| United Kingdom | 26.0% | |||
| Japan | 25.1% | |||
| Switzerland | 11.1% | |||
| Germany | 9.5% | |||
| France | 6.0% | |||
| Netherlands | 4.5% | |||
| United States | 4.7% | |||
| Italy | 2.0% | |||
| Taiwan | 1.9% | |||
| Other Countries | 9.2% |
| Currency exposure weightings (i)(y) | ||||
| British Pound Sterling | 26.0% | |||
| Euro | 25.8% | |||
| Japanese Yen | 22.2% | |||
| Swiss Franc | 11.1% | |||
| United States Dollar | 6.6% | |||
| Taiwan Dollar | 1.9% | |||
| Swedish Krona | 1.8% | |||
| Danish Krone | 1.1% | |||
| Norwegian Krone | 1.1% | |||
| Other Currencies | 2.4% |
| (i) | For purposes of this presentation, the components include the market value of securities and reflect the impact of the equivalent exposure of derivative positions. These amounts may be negative from time to time. Equivalent exposure is a calculated amount that translates the derivative position into a reasonable approximation of the amount of the underlying asset that the portfolio would have to hold at a given point in time to have the same price sensitivity that results from the portfolio’s ownership of the derivative contract. When dealing with derivatives, equivalent exposure is a more representative measure of the potential impact of a position on portfolio performance than market value. |
| (x) | Represents the portfolio’s exposure to issuer countries as a percentage of a portfolio’s net assets. |
| (y) | Represents the portfolio’s exposure to a particular currency as a percentage of a portfolio’s net assets. |
Percentages are based on net assets as of 12/31/12.
The portfolio is actively managed and current holdings may be different.
2
Table of Contents
MFS International Value Portfolio
Summary of Results
For the twelve months ended December 31, 2012, Initial Class shares of the MFS International Value Portfolio (“fund”) provided a total return of 16.23%, while Service Class shares of the fund provided a total return of 15.93%. These compare with a return of 18.43% over the same period for the fund’s benchmark, the MSCI EAFE Value Index.
Market Environment
The beginning of the period was characterized by a risk-on sentiment as a result of additional liquidity measures by the Federal Reserve Bank (“Fed”) and the European Central Bank (“ECB”) as well as a commensurate improvement in macroeconomic conditions. During this time, global equity valuations rose, credit spreads contracted, and high-quality sovereign yields increased modestly.
During the middle of the period, however, conditions worsened, driven by broadly weaker global macroeconomic indicators, as well as renewed concerns over the eurozone’s capacity and determination to address its ongoing crisis. Despite this deterioration, broad market sentiment remained relatively resilient as equity markets generally maintained gains and credit spreads did not indicate deterioration.
However, this renewed weakness in the fundamentals precipitated a further round of monetary easing by both the Fed (through a third round of quantitative easing) and the ECB (through a new bond purchase facility) in the second half of the period, which soon instilled additional confidence in risk markets. Nonetheless, towards the end of the period, weaker equity earnings reports and declining forward guidance caused market sentiment to soften. In addition, as we moved toward year end, the fiscal cliff negotiations between the Republicans in the U.S. Congress and President Obama were a particular source of market attention, where uncertainty surrounding the fiscal negotiations continued right up to the end-of-year deadline.
Detractors from Performance
An underweight position in the financial services sector detracted from performance relative to the MSCI EAFE Value Index. Not holding shares of insurance company Allianz (Germany), financial services firm Barclays PLC (United Kingdom), and Australia-based diversified bank Westpac Banking held back relative performance as all three stocks outperformed the benchmark over the reporting period. Shares of Barclays rose late in the period as the bank worked to quickly put its involvement in the LIBOR scandal in the past and positive investor sentiment appeared to have reflected optimism for new CEO Antony Jenkins’ future plans for the firm.
Individual stocks in other sectors that held back relative performance included the fund’s holdings of pharmaceutical firm GlaxoSmithKline (Germany), household and industrial products manufacturer Kao Corp. (b) (Japan), Japanese parcel delivery service company Yamato Holdings (b), electronics manufacturer Neopost (France), international food producer Danone (b) (France), and Japanese video game console maker Nintendo (b). Shares of Kao Corp. declined as the company struggled with reduced demand and pricing for palm oil used in the company’s Chemical business. Additionally, management lowered guidance and announced plans to focus on sales outside of its domestic market to improve profits. Kao’s defensive nature in a strong Japan equity market also put pressure on the stock.
The fund’s cash and/or cash equivalents position was another detractor from relative performance. The fund strives to be fully invested and generally holds cash to buy new holdings and to provide liquidity. In a period when equity markets rose, as measured by the fund’s benchmark, holding cash hurt performance versus the benchmark, which has no cash position.
During the reporting period, the fund’s relative currency exposure, resulting primarily from differences between the fund’s and the benchmark’s exposures to holdings of securities denominated in foreign currencies, also weakened relative returns. All of MFS’ investment decisions are driven by the fundamentals of each individual opportunity and as such, it is common for our portfolios to have different currency exposure than the benchmark.
Contributors to Performance
Stock selection in the technology sector contributed to relative performance. The timing of the fund’s ownership in shares of mobile phone maker Nokia, which underperformed the benchmark over the reporting period, aided relative returns.
An underweight position in the utilities & communications sector also supported relative results. Not owning shares of poor-performing telecommunications company Telefónica (Spain) helped relative performance. The stock posted weak performance for the period, despite a recovery late in the period as a result of the company’s announcement that its new range of Lumia smartphones had sold out in Germany soon after its debut, signaling strong demand for its devices.
Security selection in the special products & services sector also benefited relative performance, led by the fund’s holdings of permanent and temporary staffing services company Amadeus IT Holding (Spain). Shares of the company appreciated throughout the reporting period primarily due to an increased dividend, growing demand, and increased market share.
3
Table of Contents
MFS International Value Portfolio
Management Review – continued
Individual stocks in other sectors that were among the fund’s top relative contributors included Dutch brewer Heineken (b), investment banking firm Daiwa Securities (Japan), and household products maker Henkel KGaA (b) (Germany). The fund’s underweight position in shares of global energy and petrochemicals company Royal Dutch Shell also strengthened relative results as the stock underperformed the benchmark during the reporting period. Holdings of strong-performing healthcare products maker Bayer (Germany), reinsurance company Swiss Reinsurance (Switzerland), and German real estate company Deutsche Wohnen, also helped relative performance.
Respectfully,
| Benjamin Stone | Barnaby Wiener | |
| Portfolio Manager | Portfolio Manager |
| (b) | Security is not a benchmark constituent. |
The views expressed in this report are those of the portfolio managers only through the end of the period of the report as stated on the cover and do not necessarily reflect the views of MFS or any other person in the MFS organization. These views are subject to change at any time based on market or other conditions, and MFS disclaims any responsibility to update such views. These views may not be relied upon as investment advice or an indication of trading intent on behalf of any MFS portfolio. References to specific securities are not recommendations of such securities, and may not be representative of any MFS portfolio’s current or future investments.
4
Table of Contents
MFS International Value Portfolio
PERFORMANCE SUMMARY THROUGH 12/31/12
The following chart illustrates the historical performance of the fund in comparison to its benchmark(s). Benchmarks are unmanaged and may not be invested in directly. Benchmark returns do not reflect any fees or expenses. The performance of other share classes will be greater than or less than that of the class depicted below. (See Notes to Performance Summary.)
Performance data shown represents past performance and is no guarantee of future results. Investment return and principal value fluctuate so your units, when sold, may be worth more or less than the original cost; current performance may be lower or higher than quoted. The performance shown does not reflect the deduction of taxes, if any, that a contract holder would pay on fund distributions or the redemption of contract units. The returns for the fund shown also do not reflect the deduction of expenses associated with variable products, such as mortality and expense risk charges, separate account charges, and sales charges imposed by the insurance company separate accounts. Such expenses would reduce the overall returns shown.
Growth of a Hypothetical $10,000 Investment
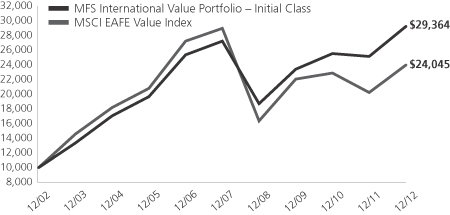
Total Returns through 12/31/12
Average annual total returns
| Share Class | Class inception date | 1-yr | 5-yr | 10-yr | ||||||||
| Initial Class | 10/02/95 | 16.23% | 1.44% | 11.37% | ||||||||
| Service Class | 8/24/01 | 15.93% | 1.18% | 11.09% | ||||||||
| Comparative benchmark | ||||||||||||
| MSCI EAFE Value Index (f) | 18.43% | (3.74)% | 9.17% | |||||||||
| (f) | Source: FactSet Research Systems Inc. |
Benchmark Definition
MSCI EAFE (Europe, Australasia, Far East) Value Index – a market capitalization-weighted index that is designed to measure equity market performance for value securities in the developed markets, excluding the U.S. and Canada.
It is not possible to invest directly in an index.
Notes to Performance Summary
Average annual total return represents the average annual change in value for each share class for the periods presented.
Performance results reflect any applicable expense subsidies and waivers in effect during the periods shown. Without such subsidies and waivers the fund’s performance results would be less favorable. Please see the prospectus and financial statements for complete details. All results are historical and assume the reinvestment of any dividends and capital gains distributions.
Performance results do not include adjustments made for financial reporting purposes in accordance with U.S. generally accepted accounting principles and may differ from amounts reported in the financial highlights.
From time to time the fund may receive proceeds from litigation settlements, without which performance would be lower.
5
Table of Contents
MFS International Value Portfolio
Fund Expenses Borne by the Contract Holders During the Period,
July 1, 2012 through December 31, 2012
As a contract holder of the fund, you incur ongoing costs, including management fees; distribution and/or service (12b-1) fees; and other fund expenses. This example is intended to help you understand your ongoing costs (in dollars) of investing in the fund and to compare these costs with the ongoing costs of investing in other mutual funds.
The example is based on an investment of $1,000 invested at the beginning of the period and held for the entire period July 1, 2012 through December 31, 2012.
Actual Expenses
The first line for each share class in the following table provides information about actual account values and actual expenses. You may use the information in this line, together with the amount you invested, to estimate the expenses that you paid over the period. Simply divide your account value by $1,000 (for example, an $8,600 account value divided by $1,000 = 8.6), then multiply the result by the number in the first line under the heading entitled “Expenses Paid During Period” to estimate the expenses you paid on your account during this period.
Hypothetical Example for Comparison Purposes
The second line for each share class in the following table provides information about hypothetical account values and hypothetical expenses based on the fund’s actual expense ratio and an assumed rate of return of 5% per year before expenses, which is not the fund’s actual return. The hypothetical account values and expenses may not be used to estimate the actual ending account balance or expenses you paid for the period. You may use this information to compare the ongoing costs of investing in the fund and other funds. To do so, compare this 5% hypothetical example with the 5% hypothetical examples that appear in the shareholder reports of the other funds.
Please note that the expenses shown in the table are meant to highlight the fund’s ongoing costs only and do not take into account the fees and expenses imposed under the variable contracts through which your investment in the fund is made. Therefore, the second line for each share class in the table is useful in comparing ongoing costs associated with an investment in vehicles (such as the fund) which fund benefits under variable annuity and variable life insurance contracts and to qualified pension and retirement plans only, and will not help you determine the relative total costs of investing in the fund through variable annuity and variable life insurance contracts. If the fees and expenses imposed under the variable contracts were included, your costs would have been higher.
| Share Class | Annualized Expense Ratio | Beginning Account Value 7/01/12 | Ending Account Value | Expenses Paid During Period (p) 7/01/12-12/31/12 | ||||||||||||||
| Initial Class | Actual | 0.97% | $1,000.00 | $1,093.73 | $5.11 | |||||||||||||
| Hypothetical (h) | 0.97% | $1,000.00 | $1,020.26 | $4.93 | ||||||||||||||
| Service Class | Actual | 1.22% | $1,000.00 | $1,092.27 | $6.42 | |||||||||||||
| Hypothetical (h) | 1.22% | $1,000.00 | $1,019.00 | $6.19 | ||||||||||||||
| (h) | 5% class return per year before expenses. |
| (p) | Expenses paid are equal to each class’s annualized expense ratio, as shown above, multiplied by the average account value over the period, multiplied by the number of days in the period, divided by the number of days in the year. |
6
Table of Contents
MFS International Value Portfolio
PORTFOLIO OF INVESTMENTS – 12/31/12
The Portfolio of Investments is a complete list of all securities owned by your fund. It is categorized by broad-based asset classes.
| Issuer | Shares/Par | Value ($) | ||||||
| COMMON STOCKS – 95.5% | ||||||||
| Aerospace – 1.1% | ||||||||
| Cobham PLC | 2,097,811 | $ | 7,629,247 | |||||
|
| |||||||
| Alcoholic Beverages – 2.8% | ||||||||
| Heineken N.V. | 300,333 | $ | 20,033,088 | |||||
|
| |||||||
| Automotive – 0.7% | ||||||||
| USS Co. Ltd. | 47,920 | $ | 4,972,595 | |||||
|
| |||||||
| Broadcasting – 1.5% | ||||||||
| Fuji Television Network, Inc. | 3,777 | $ | 5,709,541 | |||||
| Nippon Television Holdings, Inc. | 383,000 | 5,088,394 | ||||||
|
| |||||||
| $ | 10,797,935 | |||||||
|
| |||||||
| Brokerage & Asset Managers – 2.1% | ||||||||
| Computershare Ltd. | 444,615 | $ | 4,186,700 | |||||
| Daiwa Securities Group, Inc. | 1,684,000 | 9,379,350 | ||||||
| IG Group Holdings PLC | 240,285 | 1,759,284 | ||||||
|
| |||||||
| $ | 15,325,334 | |||||||
|
| |||||||
| Business Services – 6.1% | ||||||||
| Amadeus IT Holding S.A. | 432,214 | $ | 10,846,095 | |||||
| Brenntag AG | 36,926 | 4,851,255 | ||||||
| Bunzl PLC | 567,333 | 9,263,286 | ||||||
| Compass Group PLC | 1,062,235 | 12,562,801 | ||||||
| Nomura Research, Inc. | 318,000 | 6,577,665 | ||||||
|
| |||||||
| $ | 44,101,102 | |||||||
|
| |||||||
| Chemicals – 1.1% | ||||||||
| Givaudan S.A. | 7,800 | $ | 8,269,381 | |||||
|
| |||||||
| Computer Software – 0.6% | ||||||||
| OBIC Co. Ltd. | 23,510 | $ | 4,681,105 | |||||
|
| |||||||
| Computer Software – Systems – 2.3% | ||||||||
| Asustek Computer, Inc. | 302,640 | $ | 3,417,334 | |||||
| Canon, Inc. | 172,400 | 6,761,902 | ||||||
| Nintendo Co. Ltd. | 33,600 | 3,585,128 | ||||||
| Venture Corp. Ltd. | 398,000 | 2,633,298 | ||||||
|
| |||||||
| $ | 16,397,662 | |||||||
|
| |||||||
| Construction – 0.7% | ||||||||
| Geberit AG | 23,480 | $ | 5,197,959 | |||||
|
| |||||||
| Consumer Products – 6.9% | ||||||||
| Henkel KGaA, IPS | 185,384 | $ | 15,224,325 | |||||
| Kao Corp. | 617,900 | 16,099,026 | ||||||
| KOSE Corp. | 119,600 | 2,499,480 | ||||||
| Reckitt Benckiser Group PLC | 252,369 | 15,809,335 | ||||||
|
| |||||||
| $ | 49,632,166 | |||||||
|
| |||||||
| Containers – 0.4% | ||||||||
| Brambles Ltd. | 371,989 | $ | 2,960,337 | |||||
|
| |||||||
| Electrical Equipment – 2.0% | ||||||||
| Legrand S.A. | 223,324 | $ | 9,425,792 | |||||
| Spectris PLC | 143,223 | 4,797,441 | ||||||
|
| |||||||
| $ | 14,223,233 | |||||||
|
| |||||||
| Issuer | Shares/Par | Value ($) | ||||||
| COMMON STOCKS – continued | ||||||||
| Electronics – 3.6% | ||||||||
| ASM International N.V. | 66,039 | $ | 2,417,434 | |||||
| Halma PLC | 711,696 | 5,363,612 | ||||||
| Hirose Electric Co. Ltd. | 44,700 | 5,351,658 | ||||||
| Samsung Electronics Co. Ltd. | 1,560 | 2,232,711 | ||||||
| Taiwan Semiconductor Manufacturing Co. Ltd., ADR | 608,187 | 10,436,489 | ||||||
|
| |||||||
| $ | 25,801,904 | |||||||
|
| |||||||
| Energy – Independent – 0.6% | ||||||||
| Cairn Energy PLC | 1,038,036 | $ | 4,547,521 | |||||
|
| |||||||
| Energy – Integrated – 5.1% | ||||||||
| BP PLC | 2,318,028 | $ | 16,061,067 | |||||
| Royal Dutch Shell PLC, “A” | 581,100 | 20,532,894 | ||||||
|
| |||||||
| $ | 36,593,961 | |||||||
|
| |||||||
| Food & Beverages – 5.7% | ||||||||
| Groupe Danone | 322,157 | $ | 21,284,793 | |||||
| ITO EN Ltd. | 89,300 | 1,638,910 | ||||||
| Nestle S.A. | 280,470 | 18,275,856 | ||||||
|
| |||||||
| $ | 41,199,559 | |||||||
|
| |||||||
| Food & Drug Stores – 1.3% | ||||||||
| Lawson, Inc. | 133,900 | $ | 9,101,633 | |||||
|
| |||||||
| Insurance – 7.1% | ||||||||
| Amlin PLC | 382,848 | $ | 2,325,725 | |||||
| Catlin Group Ltd. | 390,376 | 3,154,889 | ||||||
| Delta Lloyd N.V. | 216,680 | 3,606,077 | ||||||
| Euler Hermes | 27,222 | 2,371,150 | ||||||
| Hiscox Ltd. | 686,528 | 4,997,415 | ||||||
| ING Groep N.V. (a) | 729,765 | 6,978,518 | ||||||
| Jardine Lloyd Thompson Group PLC | 255,814 | 3,355,843 | ||||||
| Sony Financial Holdings, Inc. | 106,300 | 1,912,136 | ||||||
| Swiss Re Ltd. | 172,305 | 12,575,553 | ||||||
| Zurich Insurance Group AG | 37,336 | 9,983,335 | ||||||
|
| |||||||
| $ | 51,260,641 | |||||||
|
| |||||||
| Leisure & Toys – 0.3% | ||||||||
| Sankyo Co. Ltd. | 48,300 | $ | 1,909,477 | |||||
|
| |||||||
| Machinery & Tools – 1.7% | ||||||||
| Glory Ltd. | 126,500 | $ | 2,930,278 | |||||
| Neopost S.A. | 108,862 | 5,756,292 | ||||||
| Schindler Holding AG | 23,897 | 3,451,711 | ||||||
|
| |||||||
| $ | 12,138,281 | |||||||
|
| |||||||
| Major Banks – 3.9% | ||||||||
| Bank of Ireland (a) | 7,144,780 | $ | 1,068,175 | |||||
| HSBC Holdings PLC | 1,872,249 | 19,802,461 | ||||||
| Sumitomo Mitsui Financial Group, Inc. | 203,900 | 7,407,488 | ||||||
|
| |||||||
| $ | 28,278,124 | |||||||
|
| |||||||
| Medical & Health Technology & Services – 0.7% | ||||||||
| Kobayashi Pharmaceutical Co. Ltd. | 108,500 | $ | 5,152,306 | |||||
|
| |||||||
7
Table of Contents
MFS International Value Portfolio
Portfolio of Investments – continued
| Issuer | Shares/Par | Value ($) | ||||||
| COMMON STOCKS – continued | ||||||||
| Medical Equipment – 0.4% | ||||||||
| Nihon Kohden Corp. | 98,700 | $ | 2,992,652 | |||||
|
| |||||||
| Network & Telecom – 2.8% | ||||||||
| Ericsson, Inc., “B” | 1,298,199 | $ | 13,057,628 | |||||
| Nokia Oyj (l) | 1,921,111 | 7,554,960 | ||||||
|
| |||||||
| $ | 20,612,588 | |||||||
|
| |||||||
| Other Banks & Diversified Financials – 4.3% | ||||||||
| Anglo Irish Bank Corp. PLC (a) | 249,800 | $ | 0 | |||||
| Chiba Bank Ltd. | 431,000 | 2,521,631 | ||||||
| DnB NOR A.S.A. | 627,099 | 7,993,584 | ||||||
| Hachijuni Bank Ltd. | 423,000 | 2,123,387 | ||||||
| Joyo Bank Ltd. | 608,000 | 2,873,180 | ||||||
| Julius Baer Group Ltd. | 102,185 | 3,676,478 | ||||||
| Jyske Bank A.S. (a) | 42,244 | 1,178,760 | ||||||
| North Pacific Bank Ltd. (a) | 546,500 | 1,526,554 | ||||||
| Sydbank A.S. (a) | 68,838 | 1,221,933 | ||||||
| UniCredit S.p.A. (a) | 1,387,570 | 6,851,948 | ||||||
| Unione di Banche Italiane S.c.p.A. | 226,047 | 1,054,363 | ||||||
|
| |||||||
| $ | 31,021,818 | |||||||
|
| |||||||
| Pharmaceuticals – 8.7% | ||||||||
| Bayer AG | 173,850 | $ | 16,509,235 | |||||
| GlaxoSmithKline PLC | 774,641 | 16,818,683 | ||||||
| Hisamitsu Pharmaceutical Co., Inc. | 35,000 | 1,735,402 | ||||||
| Roche Holding AG | 91,734 | 18,688,500 | ||||||
| Sanofi | 46,117 | 4,373,516 | ||||||
| Santen Pharmaceutical Co. Ltd. | 134,300 | 5,138,853 | ||||||
|
| |||||||
| $ | 63,264,189 | |||||||
|
| |||||||
| Printing & Publishing – 1.4% | ||||||||
| Pearson PLC | 400,390 | $ | 7,827,362 | |||||
| United Business Media Ltd. | 219,671 | 2,537,668 | ||||||
|
| |||||||
| $ | 10,365,030 | |||||||
|
| |||||||
| Real Estate – 2.7% | ||||||||
| Deutsche Wohnen AG | 437,354 | $ | 8,076,626 | |||||
| GSW Immobilien AG | 160,218 | 6,772,107 | ||||||
| TAG Immobilien AG | 388,910 | 4,887,489 | ||||||
|
| |||||||
| $ | 19,736,222 | |||||||
|
| |||||||
| Specialty Chemicals – 1.3% | ||||||||
| Shin-Etsu Chemical Co. Ltd. | 60,800 | $ | 3,713,632 | |||||
| Symrise AG | 151,275 | 5,415,201 | ||||||
|
| |||||||
| $ | 9,128,833 | |||||||
|
| |||||||
| Specialty Stores – 0.5% | ||||||||
| Esprit Holdings Ltd. | 2,686,758 | $ | 3,756,585 | |||||
|
| |||||||
| Telecommunications – Wireless – 6.4% | ||||||||
| KDDI Corp. | 352,900 | $ | 24,927,092 | |||||
| NTT DoCoMo, Inc. | 5,780 | 8,300,939 | ||||||
| Vodafone Group PLC | 5,251,070 | 13,205,738 | ||||||
|
| |||||||
| $ | 46,433,769 | |||||||
|
| |||||||
| Telephone Services – 3.1% | ||||||||
| China Unicom (Hong Kong) Ltd. | 1,350,000 | $ | 2,189,043 | |||||
| Deutsche Telekom AG | 624,970 | 7,100,431 | ||||||
| Issuer | Shares/Par | Value ($) | ||||||
| COMMON STOCKS – continued | ||||||||
| Telephone Services – continued | ||||||||
| Royal KPN N.V. | 264,107 | $ | 1,306,064 | |||||
| TDC A.S. | 804,987 | 5,702,401 | ||||||
| Telecom Italia S.p.A. | 8,045,143 | 6,366,142 | ||||||
|
| |||||||
| $ | 22,664,081 | |||||||
|
| |||||||
| Tobacco – 4.3% | ||||||||
| British American Tobacco PLC | 310,193 | $ | 15,717,489 | |||||
| Japan Tobacco, Inc. | 559,000 | 15,743,753 | ||||||
|
| |||||||
| $ | 31,461,242 | |||||||
|
| |||||||
| Trucking – 1.3% | ||||||||
| Yamato Holdings Co. Ltd. | 634,100 | $ | 9,641,818 | |||||
|
| |||||||
| Total Common Stocks (Identified Cost, $637,814,658) | $ | 691,283,378 | ||||||
|
| |||||||
| Issuer/Expiration Date/Strike Price | Par Amount of Contracts | |||||||
| PUT OPTIONS PURCHASED – 0.1% | ||||||||
| JPY Currency – July 2013 @ $0.0117 | JPY | 1,383,359,726 | $ | 545,044 | ||||
| JPY Currency – December 2013 @ $0.0106 | JPY | 973,680,094 | 158,710 | |||||
| JPY Currency – January 2013 @ $0.0119 | JPY | 360,804,000 | 137,106 | |||||
| JPY Currency – March 2013 @ $0.0110 | JPY | 374,496,993 | 21,346 | |||||
|
| |||||||
| Total Put Options Purchased (Premiums Paid, $466,158) | $ | 862,206 | ||||||
|
| |||||||
| CALL OPTIONS PURCHASED – 0.0% | ||||||||
| EUR Currency – December 2013 @ JPY 124.50 | EUR | 8,144,843 | $ | 196,877 | ||||
| EUR Currency – March 2013 @ JPY 121.25 | EUR | 17,140,165 | 118,833 | |||||
|
| |||||||
| Total Call Options Purchased (Premiums Paid, $608,233) | $ | 315,710 | ||||||
|
| |||||||
| Issuer | Shares/Par | |||||||
| MONEY MARKET FUNDS – 4.4% | ||||||||
| MFS Institutional Money Market Portfolio, 0.16%, at Cost and Net Asset Value (v) | 31,817,466 | $ | 31,817,466 | |||||
|
| |||||||
| COLLATERAL FOR SECURITIES LOANED – 0.6% | ||||||||
| Navigator Securities Lending Prime Portfolio, 0.28%, at Cost and Net Asset Value (j) | 4,100,000 | $ | 4,100,000 | |||||
|
| |||||||
| Total Investments (Identified Cost, $674,806,515) | $ | 728,378,760 | ||||||
|
| |||||||
| OTHER ASSETS, LESS LIABILITIES – (0.6)% | (4,570,382 | ) | ||||||
|
| |||||||
| Net Assets – 100.0% | $ | 723,808,378 | ||||||
|
| |||||||
8
Table of Contents
MFS International Value Portfolio
Portfolio of Investments – continued
| (a) | Non-income producing security. |
| (j) | The rate quoted is the annualized seven-day yield of the fund at period end. |
| (l) | A portion of this security is on loan. |
| (v) | Underlying affiliated fund that is available only to investment companies managed by MFS. The rate quoted for the MFS Institutional Money Market Portfolio is the annualized seven-day yield of the fund at period end. |
The following abbreviations are used in this report and are defined:
| ADR | American Depositary Receipt |
| IPS | International Preference Stock |
| PLC | Public Limited Company |
Abbreviations indicate amounts shown in currencies other than the U.S. dollar. All amounts are stated in U.S. dollars unless otherwise indicated. A list of abbreviations is shown below:
| EUR | Euro |
| JPY | Japanese Yen |
See Notes to Financial Statements
9
Table of Contents
MFS International Value Portfolio
FINANCIAL STATEMENTS | STATEMENT OF ASSETS AND LIABILITIES
This statement represents your fund’s balance sheet, which details the assets and liabilities comprising the total value of the fund.
At 12/31/12 | ||||||||
Assets | ||||||||
Investments – | ||||||||
Non-affiliated issuers, at value (identified cost, $642,989,049) | $696,561,294 | |||||||
Underlying affiliated funds, at cost and value | 31,817,466 | |||||||
Total investments, at value, including $3,862,177 of securities on loan (identified cost, $674,806,515) | $728,378,760 | |||||||
Cash | 176,799 | |||||||
Foreign currency, at value (identified cost, $31) | 31 | |||||||
Receivables for | ||||||||
Investments sold | 296,140 | |||||||
Fund shares sold | 911,769 | |||||||
Interest and dividends | 1,341,467 | |||||||
Other assets | 6,260 | |||||||
Total assets | $731,111,226 | |||||||
Liabilities | ||||||||
Payables for | ||||||||
Investments purchased | $916,806 | |||||||
Fund shares reacquired | 2,121,217 | |||||||
Collateral for securities loaned, at value | 4,100,000 | |||||||
Payable to affiliates | ||||||||
Investment adviser | 72,316 | |||||||
Shareholder servicing costs | 522 | |||||||
Distribution and/or service fees | 14,795 | |||||||
Payable for independent Trustees’ compensation | 34 | |||||||
Accrued expenses and other liabilities | 77,158 | |||||||
Total liabilities | $7,302,848 | |||||||
Net assets | $723,808,378 | |||||||
Net assets consist of | ||||||||
Paid-in capital | $679,403,854 | |||||||
Unrealized appreciation (depreciation) on investments and translation of assets and liabilities in foreign currencies | 53,574,155 | |||||||
Accumulated net realized gain (loss) on investments and foreign currency | (22,215,642 | ) | ||||||
Undistributed net investment income | 13,046,011 | |||||||
Net assets | $723,808,378 | |||||||
Shares of beneficial interest outstanding | 42,095,898 |
| Net assets | Shares outstanding | Net asset value per share | ||||||||||
Initial Class | $182,381,849 | 10,515,011 | $17.34 | |||||||||
Service Class | 541,426,529 | 31,580,887 | 17.14 | |||||||||
See Notes to Financial Statements
10
Table of Contents
MFS International Value Portfolio
FINANCIAL STATEMENTS | STATEMENT OF OPERATIONS
This statement describes how much your fund earned in investment income and accrued in expenses. It also describes any gains and/or losses generated by fund operations.
| Year ended 12/31/12 | ||||||||
Net investment income | ||||||||
Income | ||||||||
Dividends | $20,385,037 | |||||||
Interest | 229,721 | |||||||
Dividends from underlying affiliated funds | 34,088 | |||||||
Foreign taxes withheld | (1,228,355 | ) | ||||||
Total investment income | $19,420,491 | |||||||
Expenses | ||||||||
Management fee | $4,937,760 | |||||||
Distribution and/or service fees | 1,172,584 | |||||||
Shareholder servicing costs | 49,294 | |||||||
Administrative services fee | 88,002 | |||||||
Independent Trustees’ compensation | 14,126 | |||||||
Custodian fee | 136,959 | |||||||
Shareholder communications | 26,218 | |||||||
Audit and tax fees | 64,546 | |||||||
Legal fees | 8,260 | |||||||
Miscellaneous | 30,687 | |||||||
Total expenses | $6,528,436 | |||||||
Fees paid indirectly | (14 | ) | ||||||
Reduction of expenses by investment adviser | (1,801 | ) | ||||||
Net expenses | $6,526,621 | |||||||
Net investment income | $12,893,870 | |||||||
Realized and unrealized gain (loss) on investments and foreign currency | ||||||||
Realized gain (loss) (identified cost basis) | ||||||||
Investments | $2,530,081 | |||||||
Foreign currency | (70,277 | ) | ||||||
Net realized gain (loss) on investments and foreign currency | $2,459,804 | |||||||
Change in unrealized appreciation (depreciation) | ||||||||
Investments | $66,664,209 | |||||||
Translation of assets and liabilities in foreign currencies | 27,340 | |||||||
Net unrealized gain (loss) on investments and foreign currency translation | $66,691,549 | |||||||
Net realized and unrealized gain (loss) on investments and foreign currency | $69,151,353 | |||||||
Change in net assets from operations | $82,045,223 |
See Notes to Financial Statements
11
Table of Contents
MFS International Value Portfolio
FINANCIAL STATEMENTS | STATEMENTS OF CHANGES IN NET ASSETS
These statements describe the increases and/or decreases in net assets resulting from operations, any distributions, and any shareholder transactions.
For years ended 12/31 | 2012 | 2011 | ||||||
Change in net assets | ||||||||
From operations | ||||||||
Net investment income | $12,893,870 | $8,616,811 | ||||||
Net realized gain (loss) on investments and foreign currency | 2,459,804 | 2,321,685 | ||||||
Net unrealized gain (loss) on investments and foreign currency translation | 66,691,549 | (19,156,161 | ) | |||||
Change in net assets from operations | $82,045,223 | $(8,217,665 | ) | |||||
Distributions declared to shareholders | ||||||||
From net investment income | $(7,900,234 | ) | $(4,742,528 | ) | ||||
Change in net assets from fund share transactions | $207,562,600 | $61,502,991 | ||||||
Total change in net assets | $281,707,589 | $48,542,798 | ||||||
Net assets | ||||||||
At beginning of period | 442,100,789 | 393,557,991 | ||||||
At end of period (including undistributed net investment income of $13,046,011 and | $723,808,378 | $442,100,789 |
See Notes to Financial Statements
12
Table of Contents
MFS International Value Portfolio
FINANCIAL STATEMENTS | FINANCIAL HIGHLIGHTS
The financial highlights table is intended to help you understand the fund’s financial performance for the past 5 years. Certain information reflects financial results for a single fund share. The total returns in the table represent the rate by which an investor would have earned (or lost) on an investment in the fund share class (assuming reinvestment of all distributions) held for the entire period.
| Initial Class | Years ended 12/31 | |||||||||||||||||||
| 2012 | 2011 | 2010 | 2009 | 2008 | ||||||||||||||||
Net asset value, beginning of period | $15.16 | $15.59 | $14.51 | $12.03 | $18.68 | |||||||||||||||
| Income (loss) from investment operations | ||||||||||||||||||||
Net investment income (d) | $0.38 | $0.36 | $0.26 | $0.25 | $0.44 | |||||||||||||||
Net realized and unrealized gain (loss) on investments | 2.05 | (0.59 | ) | 1.05 | 2.64 | (5.94 | ) | |||||||||||||
Total from investment operations | $2.43 | $(0.23 | ) | $1.31 | $2.89 | $(5.50 | ) | |||||||||||||
| Less distributions declared to shareholders | ||||||||||||||||||||
From net investment income | $(0.25 | ) | $(0.20 | ) | $(0.23 | ) | $(0.41 | ) | $(0.16 | ) | ||||||||||
From net realized gain on investments | — | — | — | — | (0.99 | ) | ||||||||||||||
Total distributions declared to shareholders | $(0.25 | ) | $(0.20 | ) | $(0.23 | ) | $(0.41 | ) | $(1.15 | ) | ||||||||||
Net asset value, end of period (x) | $17.34 | $15.16 | $15.59 | $14.51 | $12.03 | |||||||||||||||
Total return (%) (k)(r)(s)(x) | 16.16 | (1.52 | ) | 9.11 | 25.37 | (31.41 | ) | |||||||||||||
| Ratios (%) (to average net assets) and Supplemental data: | ||||||||||||||||||||
Expenses before expense reductions (f) | 0.98 | 1.01 | 1.06 | 1.09 | 1.05 | |||||||||||||||
Expenses after expense reductions (f) | 0.98 | N/A | N/A | N/A | N/A | |||||||||||||||
Net investment income | 2.33 | 2.28 | 1.79 | 2.00 | 2.82 | |||||||||||||||
Portfolio turnover | 16 | 16 | 28 | 49 | 44 | |||||||||||||||
Net assets at end of period (000 omitted) | $182,382 | $60,532 | $68,356 | $63,978 | $57,968 | |||||||||||||||
See Notes to Financial Statements
13
Table of Contents
MFS International Value Portfolio
Financial Highlights – continued
| Service Class | Years ended 12/31 | |||||||||||||||||||
| 2012 | 2011 | 2010 | 2009 | 2008 | ||||||||||||||||
Net asset value, beginning of period | $14.99 | $15.43 | $14.38 | $11.91 | $18.53 | |||||||||||||||
| Income (loss) from investment operations | ||||||||||||||||||||
Net investment income (d) | $0.38 | $0.31 | $0.20 | $0.23 | $0.39 | |||||||||||||||
Net realized and unrealized gain (loss) on investments | 2.00 | (0.58 | ) | 1.05 | 2.62 | (5.87 | ) | |||||||||||||
Total from investment operations | $2.38 | $(0.27 | ) | $1.25 | $2.85 | $(5.48 | ) | |||||||||||||
| Less distributions declared to shareholders | ||||||||||||||||||||
From net investment income | $(0.23 | ) | $(0.17 | ) | $(0.20 | ) | $(0.38 | ) | $(0.15 | ) | ||||||||||
From net realized gain on investments | — | — | — | — | (0.99 | ) | ||||||||||||||
Total distributions declared to shareholders | $(0.23 | ) | $(0.17 | ) | $(0.20 | ) | $(0.38 | ) | $(1.14 | ) | ||||||||||
Net asset value, end of period (x) | $17.14 | $14.99 | $15.43 | $14.38 | $11.91 | |||||||||||||||
Total return (%) (k)(r)(s)(x) | 15.93 | (1.78 | ) | 8.78 | 25.11 | (31.58 | ) | |||||||||||||
| Ratios (%) (to average net assets) and Supplemental data: | ||||||||||||||||||||
Expenses before expense reductions (f) | 1.23 | 1.26 | 1.31 | 1.34 | 1.30 | |||||||||||||||
Expenses after expense reductions (f) | 1.23 | N/A | N/A | N/A | N/A | |||||||||||||||
Net investment income | 2.35 | 1.98 | 1.43 | 1.83 | 2.52 | |||||||||||||||
Portfolio turnover | 16 | 16 | 28 | 49 | 44 | |||||||||||||||
Net assets at end of period (000 omitted) | $541,427 | $381,569 | $325,202 | $206,006 | $179,067 | |||||||||||||||
| (d) | Per share data is based on average shares outstanding. |
| (f) | Ratios do not reflect reductions from fees paid indirectly, if applicable. |
| (k) | The total return does not reflect expenses that apply to separate accounts. Inclusion of these charges would reduce the total return figures for all periods shown. |
| (r) | Certain expenses have been reduced without which performance would have been lower. |
| (s) | From time to time the fund may receive proceeds from litigation settlements, without which performance would be lower. |
| (x) | The net asset values per share and total returns have been calculated on net assets which include adjustments made in accordance with U.S. generally accepted accounting principles required at period end for financial reporting purposes. |
See Notes to Financial Statements
14
Table of Contents
MFS International Value Portfolio
| (1) | Business and Organization |
MFS International Value Portfolio (the fund) is a series of MFS Variable Insurance Trust II (the trust). The trust is organized as a Massachusetts business trust and is registered under the Investment Company Act of 1940, as amended, as an open-end management investment company. The shareholders of each series of the trust are separate accounts of insurance companies, which offer variable annuity and/or life insurance products, and qualified retirement and pension plans.
| (2) | Significant Accounting Policies |
General – The preparation of financial statements in conformity with U.S. generally accepted accounting principles requires management to make estimates and assumptions that affect the reported amounts of assets and liabilities, and disclosure of contingent assets and liabilities at the date of the financial statements and the reported amounts of revenues and expenses during the reporting period. Actual results could differ from those estimates. In the preparation of these financial statements, management has evaluated subsequent events occurring after the date of the fund’s Statement of Assets and Liabilities through the date that the financial statements were issued. The fund invests in foreign securities. Investments in foreign securities are vulnerable to the effects of changes in the relative values of the local currency and the U.S. dollar and to the effects of changes in each country’s legal, political, and economic environment.
In this reporting period the fund adopted Financial Accounting Standards Board (FASB) Accounting Standards Update 2011-04, Fair Value Measurement (Topic 820) – Amendments to Achieve Common Fair Value Measurement and Disclosure Requirements in U.S. GAAP and IFRSs (“ASU 2011-04”). ASU 2011-04 seeks to improve the comparability of fair value measurements as presented and disclosed in financial statements prepared in accordance with U.S. GAAP and International Financial Reporting Standards (IFRS) by providing common requirements for fair value measurement and disclosure.
In December 2011, the FASB issued Accounting Standards Update 2011-11, Balance Sheet (Topic 210) – Disclosures about Offsetting Assets and Liabilities (“ASU 2011-11”). Effective for annual reporting periods beginning on or after January 1, 2013 and interim periods within those annual periods, ASU 2011-11 is intended to enhance disclosure requirements on the offsetting of financial assets and liabilities. Although still evaluating the potential impacts of ASU 2011-11 to the fund, management expects that the impact of the fund’s adoption will be limited to additional financial statement disclosures.
Investment Valuations – Equity securities, including restricted equity securities, are generally valued at the last sale or official closing price as provided by a third-party pricing service on the market or exchange on which they are primarily traded. Equity securities, for which there were no sales reported that day, are generally valued at the last quoted daily bid quotation as provided by a third-party pricing service on the market or exchange on which such securities are primarily traded. Short-term instruments with a maturity at issuance of 60 days or less generally are valued at amortized cost, which approximates market value. Exchange-traded options are generally valued at the last sale or official closing price as provided by a third-party pricing service on the exchange on which such options are primarily traded. Exchange-traded options for which there were no sales reported that day are generally valued at the last daily bid quotation as provided by a third-party pricing service on the exchange on which such options are primarily traded. Options not traded on an exchange are generally valued at a broker/dealer bid quotation. Foreign currency options are generally valued at valuations provided by a third-party pricing service. Open-end investment companies are generally valued at net asset value per share. Securities and other assets generally valued on the basis of information from a third-party pricing service may also be valued at a broker/dealer bid quotation. Values obtained from third-party pricing services can utilize both transaction data and market information such as yield, quality, coupon rate, maturity, type of issue, trading characteristics, and other market data. The values of foreign securities and other assets and liabilities expressed in foreign currencies are converted to U.S. dollars using the mean of bid and asked prices for rates provided by a third-party pricing service.
The Board of Trustees has delegated primary responsibility for determining or causing to be determined the value of the fund’s investments (including any fair valuation) to the adviser pursuant to valuation policies and procedures approved by the Board. If the adviser determines that reliable market quotations are not readily available, investments are valued at fair value as determined in good faith by the adviser in accordance with such procedures under the oversight of the Board of Trustees. Under the fund’s valuation policies and procedures, market quotations are not considered to be readily available for most types of debt instruments and floating rate loans and many types of derivatives. These investments are generally valued at fair value based on information from third-party pricing services. In addition, investments may be valued at fair value if the adviser determines that an investment’s value has been materially affected by events occurring after the close of the exchange or market on which the investment is principally traded (such as foreign exchange or market) and prior to the determination of the fund’s net asset value, or after the halting of trading of a specific security where trading does not resume prior to the close of the exchange or market on which the security is principally traded. Events that occur on a frequent basis after foreign markets close (such as developments in foreign markets and significant movements in the U.S. markets) and prior to the determination of the fund’s net asset value may be deemed to have a material effect on the value of securities traded in foreign markets. Accordingly, the fund’s foreign equity securities may often be valued at fair value. The adviser generally relies on third-party pricing services or other information (such as the correlation with price movements of similar securities in the same or other markets; the type, cost and investment characteristics of the security; the
15
Table of Contents
MFS International Value Portfolio
Notes to Financial Statements – continued
business and financial condition of the issuer; and trading and other market data) to assist in determining whether to fair value and at what value to fair value an investment. The value of an investment for purposes of calculating the fund’s net asset value can differ depending on the source and method used to determine value. When fair valuation is used, the value of an investment used to determine the fund’s net asset value may differ from quoted or published prices for the same investment. There can be no assurance that the fund could obtain the fair value assigned to an investment if it were to sell the investment at the same time at which the fund determines its net asset value per share.
Various inputs are used in determining the value of the fund’s assets or liabilities. These inputs are categorized into three broad levels. In certain cases, the inputs used to measure fair value may fall into different levels of the fair value hierarchy. In such cases, an investment’s level within the fair value hierarchy is based on the lowest level of input that is significant to the fair value measurement. The fund’s assessment of the significance of a particular input to the fair value measurement in its entirety requires judgment, and considers factors specific to the investment. Level 1 includes unadjusted quoted prices in active markets for identical assets or liabilities. Level 2 includes other significant observable market-based inputs (including quoted prices for similar securities, interest rates, prepayment speed, and credit risk). Level 3 includes unobservable inputs, which may include the adviser’s own assumptions in determining the fair value of investments. The following is a summary of the levels used as of December 31, 2012 in valuing the fund’s assets or liabilities:
| Investments at Value | Level 1 | Level 2 | Level 3 | Total | ||||||||||||
| Equity Securities: | ||||||||||||||||
United Kingdom | $— | $188,069,763 | $— | $188,069,763 | ||||||||||||
Japan | 47,277,305 | 134,719,659 | — | 181,996,964 | ||||||||||||
Switzerland | 18,275,856 | 61,842,917 | — | 80,118,773 | ||||||||||||
Germany | 5,415,201 | 63,421,468 | — | 68,836,669 | ||||||||||||
France | — | 43,211,543 | — | 43,211,543 | ||||||||||||
Netherlands | — | 34,341,181 | — | 34,341,181 | ||||||||||||
Italy | — | 14,272,453 | — | 14,272,453 | ||||||||||||
Taiwan | 10,436,489 | 3,417,334 | — | 13,853,823 | ||||||||||||
Sweden | — | 13,057,628 | — | 13,057,628 | ||||||||||||
Other Countries | 5,702,401 | 47,822,180 | 0 | 53,524,581 | ||||||||||||
| Purchased Currency Options | — | 1,177,916 | — | 1,177,916 | ||||||||||||
| Mutual Funds | 35,917,466 | — | — | 35,917,466 | ||||||||||||
| Total Investments | $123,024,718 | $605,354,042 | $0 | $728,378,760 | ||||||||||||
For further information regarding security characteristics, see the Portfolio of Investments. At December 31, 2012, the fund held one level 3 security valued at $0, which was also held and valued at $0 at December 31, 2011.
Of the level 2 investments presented above, equity investments amounting to $264,502,495 would have been considered level 1 investments at the beginning of the period. Of the level 1 investments presented above, equity investments amounting to $23,978,257 would have been considered level 2 investments at the beginning of the period. The primary reason for changes in the classifications between levels 1 and 2 occurs when foreign equity securities are fair valued using other observable market-based inputs in place of the closing exchange price due to events occurring after the close of the exchange or market on which the investment is principally traded. The fund’s foreign equity securities may often be valued at fair value. The fund’s policy is to recognize transfers between the levels as of the end of the period.
Foreign Currency Translation – Purchases and sales of foreign investments, income, and expenses are converted into U.S. dollars based upon currency exchange rates prevailing on the respective dates of such transactions or on the reporting date for foreign denominated receivables and payables. Gains and losses attributable to foreign currency exchange rates on sales of securities are recorded for financial statement purposes as net realized gains and losses on investments. Gains and losses attributable to foreign exchange rate movements on receivables, payables, income and expenses are recorded for financial statement purposes as foreign currency transaction gains and losses. That portion of both realized and unrealized gains and losses on investments that results from fluctuations in foreign currency exchange rates is not separately disclosed.
Derivatives – The fund uses derivatives for different purposes, primarily to increase or decrease exposure to a particular market or segment of the market, or security, to increase or decrease interest rate or currency exposure, or as alternatives to direct investments. Derivatives are used for hedging or non-hedging purposes. While hedging can reduce or eliminate losses, it can also reduce or eliminate gains. When the fund uses derivatives as an investment to increase market exposure, or for hedging purposes, gains and losses from derivative instruments may be substantially greater than the derivative’s original cost.
The derivative instruments used by the fund were purchased options. The fund’s period end derivatives, as presented in the Portfolio of Investments, generally are indicative of the volume of its derivative activity during the period.
16
Table of Contents
MFS International Value Portfolio
Notes to Financial Statements – continued
The following table presents, by major type of derivative contract, the fair value, on a gross basis, of the asset and liability components of derivatives held by the fund at December 31, 2012 as reported in the Statement of Assets and Liabilities:
| Fair Value (a) | ||||||
| Risk | Derivative Contracts | Asset Derivatives | ||||
| Foreign Exchange | Purchased Currency Options | $1,177,916 | ||||
| (a) | The value of purchased options outstanding is included in total investments, at value, within the fund’s Statement of Assets and Liabilities. |
The following table presents, by major type of derivative contract, the realized gain (loss) on derivatives held by the fund for the year ended December 31, 2012 as reported in the Statement of Operations:
| Risk | Investments (Purchased Options) | |||
| Foreign Exchange | $(413,894 | ) | ||
The following table presents, by major type of derivative contract, the change in unrealized appreciation (depreciation) on derivatives held by the fund for the year ended December 31, 2012 as reported in the Statement of Operations:
| Risk | Investments (Purchased Options) | |||
| Foreign Exchange | $412,667 | |||
Derivative counterparty credit risk is managed through formal evaluation of the creditworthiness of all potential counterparties. On certain over-the-counter derivatives, the fund attempts to reduce its exposure to counterparty credit risk whenever possible by entering into an International Swaps and Derivatives Association (ISDA) Master Agreement on a bilateral basis with each of the counterparties with whom it undertakes a significant volume of transactions. The ISDA Master Agreement gives each party to the agreement the right to terminate all transactions traded under such agreement if there is a certain deterioration in the credit quality of the other party. The ISDA Master Agreement gives the fund the right, upon an event of default by the applicable counterparty or a termination of the agreement, to close out all transactions traded under such agreement and to net amounts owed under each transaction to one net amount payable by one party to the other. This right to close out and net payments across all transactions traded under the ISDA Master Agreement could result in a reduction of the fund’s credit risk to such counterparty equal to any amounts payable by the fund under the applicable transactions, if any. However, absent an event of default by the counterparty or a termination of the agreement, the ISDA Master Agreement does not result in an offset of reported amounts of assets and liabilities in the Statement of Assets and Liabilities across transactions between the fund and the applicable counterparty.
Collateral requirements differ by type of derivative. Collateral or margin requirements are set by the broker or exchange clearing house for exchange traded derivatives (i.e., futures contracts and exchange-traded options) while collateral terms are contract specific for over-the-counter traded derivatives (i.e., forward foreign currency exchange contracts, swap agreements and over-the-counter options). For derivatives traded under an ISDA Master Agreement, the collateral requirements are netted across all transactions traded under such agreement and one amount is posted from one party to the other to collateralize such obligations. Cash collateral that has been pledged to cover obligations of the fund under derivative contracts, if any, will be reported separately in the Statement of Assets and Liabilities as restricted cash. Securities collateral pledged for the same purpose, if any, is noted in the Portfolio of Investments.
Purchased Options – The fund purchased call and put options for a premium. Purchased call and put options entitle the holder to buy and sell a specified number of shares or units of a particular security, currency or index at a specified price at a specified date or within a specified period of time. Purchasing call options may hedge against an anticipated increase in the dollar cost of securities or currency to be acquired or increase the fund’s exposure to an underlying instrument. Purchasing put options may hedge against an anticipated decline in the value of portfolio securities or currency or decrease the fund’s exposure to an underlying instrument.
The premium paid is initially recorded as an investment in the Statement of Assets and Liabilities. That investment is subsequently marked-to-market daily with the difference between the premium paid and the market value of the purchased option being recorded as unrealized appreciation or depreciation. Premiums paid for purchased call and put options which have expired are treated as realized losses on investments in the Statement of Operations. Upon the exercise or closing of a purchased call option, the premium paid is added to the cost of the security or financial instrument purchased. Upon the exercise or closing of a purchased put option, the premium paid is offset against the proceeds on the sale of the underlying security or financial instrument in order to determine the realized gain or loss on investments.
17
Table of Contents
MFS International Value Portfolio
Notes to Financial Statements – continued
Whether or not the option is exercised, the fund’s maximum risk of loss from purchasing an option is the amount of premium paid. All option contracts involve credit risk if the counterparty to the option contract fails to perform. For over-the-counter options, this risk is mitigated in cases where there is an ISDA Master Agreement between the fund and the counterparty providing for netting as described above and for posting of collateral by the counterparty to the fund to cover the fund’s exposure to the counterparty under such ISDA Master Agreement.
Security Loans – State Street Bank and Trust Company (“State Street”), as lending agent, loans the securities of the fund to certain qualified institutions (the “Borrowers”) approved by the fund. The loans are collateralized by cash and/or U.S. Treasury and federal agency obligations in an amount typically at least equal to the market value of the securities loaned. The market value of the loaned securities is determined at the close of business of the fund and any additional required collateral is delivered to the fund on the next business day. State Street provides the fund with indemnification against Borrower default. The fund bears the risk of loss with respect to the investment of cash collateral. On loans collateralized by cash, the cash collateral is invested in a money market fund or short-term securities. Collateral for securities loaned is held at carrying value, which approximates fair value. If the collateral for securities loaned was carried at fair value, its fair value would be considered level 2 under the fair value hierarchy. A portion of the income generated upon investment of the collateral is remitted to the Borrowers, and the remainder is allocated between the fund and the lending agent. On loans collateralized by U.S. Treasury and/or federal agency obligations, a fee is received from the Borrower, and is allocated between the fund and the lending agent. Income from securities lending is included in “Interest” income in the Statement of Operations. The dividend and interest income earned on the securities loaned is accounted for in the same manner as other dividend and interest income.
Indemnifications – Under the fund’s organizational documents, its officers and Trustees may be indemnified against certain liabilities and expenses arising out of the performance of their duties to the fund. Additionally, in the normal course of business, the fund enters into agreements with service providers that may contain indemnification clauses. The fund’s maximum exposure under these agreements is unknown as this would involve future claims that may be made against the fund that have not yet occurred.
Investment Transactions and Income – Investment transactions are recorded on the trade date. Interest income is recorded on the accrual basis. Dividends received in cash are recorded on the ex-dividend date. Certain dividends from foreign securities will be recorded when the fund is informed of the dividend if such information is obtained subsequent to the ex-dividend date. Dividend and interest payments received in additional securities are recorded on the ex-dividend or ex-interest date in an amount equal to the value of the security on such date.
The fund may receive proceeds from litigation settlements. Any proceeds received from litigation involving portfolio holdings are reflected in the Statement of Operations in realized gain/loss if the security has been disposed of by the fund or in unrealized gain/loss if the security is still held by the fund. Any other proceeds from litigation not related to portfolio holdings are reflected as other income in the Statement of Operations.
Fees Paid Indirectly – The fund’s custody fee may be reduced according to an arrangement that measures the value of cash deposited with the custodian by the fund. This amount, for the year ended December 31, 2012, is shown as a reduction of total expenses in the Statement of Operations.
Tax Matters and Distributions – The fund intends to qualify as a regulated investment company, as defined under Subchapter M of the Internal Revenue Code, and to distribute all of its taxable income, including realized capital gains. As a result, no provision for federal income tax is required. The fund’s federal tax returns, when filed, will remain subject to examination by the Internal Revenue Service for a three year period. Foreign taxes have been accrued by the fund in the accompanying financial statements.
Distributions to shareholders are recorded on the ex-dividend date. Income and capital gain distributions are determined in accordance with income tax regulations, which may differ from U.S. generally accepted accounting principles. Certain capital accounts in the financial statements are periodically adjusted for permanent differences in order to reflect their tax character. These adjustments have no impact on net assets or net asset value per share. Temporary differences which arise from recognizing certain items of income, expense, gain or loss in different periods for financial statement and tax purposes will reverse at some time in the future. Distributions in excess of net investment income or net realized gains are temporary overdistributions for financial statement purposes resulting from differences in the recognition or classification of income or distributions for financial statement and tax purposes.
Book/tax differences primarily relate to passive foreign investment companies and wash sale loss deferrals.
The tax character of distributions declared to shareholders for the last two fiscal years is as follows:
| 12/31/12 | 12/31/11 | |||||||
| Ordinary income (including any short-term capital gains) | $7,900,234 | $4,742,528 | ||||||
18
Table of Contents
MFS International Value Portfolio
Notes to Financial Statements – continued
The federal tax cost and the tax basis components of distributable earnings were as follows:
| As of 12/31/12 | ||||
| Cost of investments | $676,123,517 | |||
| Gross appreciation | 84,714,390 | |||
| Gross depreciation | (32,459,147 | ) | ||
| Net unrealized appreciation (depreciation) | $52,255,243 | |||
| Undistributed ordinary income | 13,072,947 | |||
| Capital loss carryforwards | (20,898,640 | ) | ||
| Other temporary differences | (25,026 | ) |
Under the Regulated Investment Company Modernization Act of 2010 (the “Act”), net capital losses recognized after December 31, 2010 may be carried forward indefinitely, and their character is retained as short-term and/or long-term losses. Previously, net capital losses were carried forward for eight years and treated as short-term losses. As a transition rule, the Act requires that post-enactment net capital losses be used before pre-enactment net capital losses.
As of December 31, 2012, the fund had capital loss carryforwards available to offset future realized gains. Such losses expire as follows:
| Pre-enactment losses: | ||||
| 12/31/16 | $(1,584,443 | ) | ||
| 12/31/17 | (18,221,256 | ) | ||
| 12/31/18 | (1,092,941 | ) | ||
| Total | $(20,898,640 | ) |
Multiple Classes of Shares of Beneficial Interest – The fund offers multiple classes of shares, which differ in their respective distribution and/or service fees. The fund’s income, realized and unrealized gain (loss), and common expenses are allocated to shareholders based on the daily net assets of each class. Dividends are declared separately for each class. Differences in per share dividend rates are generally due to differences in separate class expenses. The fund’s distributions declared to shareholders as reported in the Statements of Changes in Net Assets are presented by class as follows:
| From net investment income | ||||||||
| Year ended 12/31/12 | Year ended 12/31/11 | |||||||
| Initial Class | $1,091,327 | $789,091 | ||||||
| Service Class | 6,808,907 | 3,953,437 | ||||||
| Total | $7,900,234 | $4,742,528 | ||||||
| (3) | Transactions with Affiliates |
Investment Adviser – The fund has an investment advisory agreement with MFS to provide overall investment management and related administrative services and facilities to the fund. The management fee is computed daily and paid monthly at the following annual rates:
| First $1 billion of average daily net assets | 0.90% | |||
| Next $1 billion of average daily net assets | 0.80% | |||
| Average daily net assets in excess of $2 billion | 0.70% |
The management fee incurred for the year ended December 31, 2012 was equivalent to an annual effective rate of 0.90% of the fund’s average daily net assets.
Distributor – MFS Fund Distributors, Inc. (MFD), a wholly-owned subsidiary of MFS, is the distributor of shares of the fund. The Trustees have adopted a distribution plan for the Service Class shares pursuant to Rule 12b-1 under the Investment Company Act of 1940.
The fund’s distribution plan provides that the fund will pay MFD distribution and/or service fees equal to 0.25% per annum of its average daily net assets attributable to Service Class shares as partial consideration for services performed and expenses incurred by MFD and financial intermediaries (including participating insurance companies that invest in the fund to fund variable annuity and variable life insurance contracts, sponsors of qualified retirement and pension plans that invest in the fund, and affiliates of these participating insurance companies and plan sponsors) in connection with the sale and distribution of the Service Class shares. MFD may subsequently pay all, or a portion, of the distribution and/or service fees to financial intermediaries.
Shareholder Servicing Agent – MFS Service Center, Inc. (MFSC), a wholly-owned subsidiary of MFS, receives a fee from the fund for its services as shareholder servicing agent. For the year ended December 31, 2012, the fee was $49,177, which equated to
19
Table of Contents
MFS International Value Portfolio
Notes to Financial Statements – continued
0.0090% annually of the fund’s average daily net assets. MFSC also receives payment from the fund for out-of-pocket expenses paid by MFSC on behalf of the fund. For the year ended December 31, 2012, these costs amounted to $117.
Administrator – MFS provides certain financial, legal, shareholder communications, compliance, and other administrative services to the fund. Under an administrative services agreement, the fund partially reimburses MFS the costs incurred to provide these services. The fund is charged an annual fixed amount of $17,500 plus a fee based on average daily net assets. The administrative services fee incurred for the year ended December 31, 2012 was equivalent to an annual effective rate of 0.0160% of the fund’s average daily net assets.
Trustees’ and Officers’ Compensation – The fund pays compensation to independent Trustees in the form of a retainer, attendance fees, and additional compensation to Board and Committee chairpersons. The fund does not pay compensation directly to Trustees or officers of the fund who are also officers of the investment adviser, all of whom receive remuneration for their services to the fund from MFS. Certain officers and Trustees of the fund are officers or directors of MFS, MFD, and MFSC.
Other – This fund and certain other funds managed by MFS (the funds) have entered into services agreements (the Agreements) which provide for payment of fees by the funds to Tarantino LLC and Griffin Compliance LLC in return for the provision of services of an Independent Chief Compliance Officer (ICCO) and Assistant ICCO, respectively, for the funds. The ICCO and Assistant ICCO are officers of the funds and the sole members of Tarantino LLC and Griffin Compliance LLC, respectively. The funds can terminate the Agreements with Tarantino LLC and Griffin Compliance LLC at any time under the terms of the Agreements. For the year ended December 31, 2012, the aggregate fees paid by the fund to Tarantino LLC and Griffin Compliance LLC were $4,319 and are included in “Miscellaneous” expense in the Statement of Operations. MFS has agreed to reimburse the fund for a portion of the payments made by the fund in the amount of $1,801, which is shown as a reduction of total expenses in the Statement of Operations. Additionally, MFS has agreed to bear all expenses associated with office space, other administrative support, and supplies provided to the ICCO and Assistant ICCO.
The fund invests in the MFS Institutional Money Market Portfolio which is managed by MFS and seeks current income consistent with preservation of capital and liquidity. Income earned on this investment is included in “Dividends from underlying affiliated funds” in the Statement of Operations. This money market fund does not pay a management fee to MFS.
| (4) | Portfolio Securities |
Purchases and sales of investments, other than purchased option transactions and short-term obligations, aggregated $282,614,191 and $82,548,092, respectively.
| (5) | Shares of Beneficial Interest |
The fund’s Declaration of Trust permits the Trustees to issue an unlimited number of full and fractional shares of beneficial interest. Transactions in fund shares were as follows:
Year ended 12/31/12 | Year ended 12/31/11 | |||||||||||||||
| Shares | Amount | Shares | Amount | |||||||||||||
| Shares sold | ||||||||||||||||
Initial Class | 7,497,848 | $125,694,409 | 299,507 | $4,681,107 | ||||||||||||
Service Class | 10,941,466 | 175,785,767 | 8,945,525 | 139,378,085 | ||||||||||||
| 18,439,314 | $301,480,176 | 9,245,032 | $144,059,192 | |||||||||||||
| Shares issued to shareholders in reinvestment of distributions | ||||||||||||||||
Initial Class | 66,342 | $1,091,327 | 50,876 | $789,091 | ||||||||||||
Service Class | 418,238 | 6,808,907 | 257,385 | 3,953,437 | ||||||||||||
| 484,580 | $7,900,234 | 308,261 | $4,742,528 | |||||||||||||
| Shares reacquired | ||||||||||||||||
Initial Class | (1,042,544 | ) | $(17,035,479 | ) | (741,692 | ) | $(11,743,882 | ) | ||||||||
Service Class | (5,227,172 | ) | (84,782,331 | ) | (4,825,216 | ) | (75,554,847 | ) | ||||||||
| (6,269,716 | ) | $(101,817,810 | ) | (5,566,908 | ) | $(87,298,729 | ) | |||||||||
| Net change | ||||||||||||||||
Initial Class | 6,521,646 | $109,750,257 | (391,309 | ) | $(6,273,684 | ) | ||||||||||
Service Class | 6,132,532 | 97,812,343 | 4,377,694 | 67,776,675 | ||||||||||||
| 12,654,178 | $207,562,600 | 3,986,385 | $61,502,991 | |||||||||||||
The fund is one of several mutual funds in which the MFS funds-of-funds may invest. The MFS funds-of-funds do not invest in the underlying MFS funds for the purpose of exercising management or control. At the end of the period, the MFS Moderate Allocation Portfolio, the MFS Growth Allocation Portfolio, and the MFS Conservative Allocation Portfolio were the owners of record of approximately 8%, 4%, and 3%, respectively, of the value of outstanding voting shares of the fund.
20
Table of Contents
MFS International Value Portfolio
Notes to Financial Statements – continued
| (6) | Line of Credit |
The fund and certain other funds managed by MFS participate in a $1.1 billion unsecured committed line of credit, subject to a $1 billion sublimit, provided by a syndication of banks under a credit agreement. Borrowings may be made for temporary financing needs. Interest is charged to each fund, based on its borrowings, generally at a rate equal to the higher of the Federal Reserve funds rate or one month LIBOR plus an agreed upon spread. A commitment fee, based on the average daily, unused portion of the committed line of credit, is allocated among the participating funds at the end of each calendar quarter. In addition, the fund and other funds managed by MFS have established unsecured uncommitted borrowing arrangements with certain banks for temporary financing needs. Interest is charged to each fund, based on its borrowings, at a rate equal to the Federal Reserve funds rate plus an agreed upon spread. For the year ended December 31, 2012, the fund’s commitment fee and interest expense were $3,389 and $0, respectively, and are included in “Miscellaneous” expense in the Statement of Operations.
| (7) | Transactions in Underlying Affiliated Funds – Affiliated Issuers |
An affiliated issuer may be considered one in which the fund owns 5% or more of the outstanding voting securities, or a company which is under common control. For the purposes of this report, the fund assumes the following to be an affiliated issuer:
| Underlying Affiliated Fund | Beginning Amount | Acquisitions Shares/Par Amount | Dispositions Shares/Par Amount | Ending Shares/Par Amount | ||||||||||||
| MFS Institutional Money Market Portfolio | 19,740,443 | 227,430,728 | (215,353,705 | ) | 31,817,466 | |||||||||||
| Underlying Affiliated Fund | Realized Gain (Loss) | Capital Gain Distributions | Dividend Income | Ending Value | ||||||||||||
| MFS Institutional Money Market Portfolio | $— | $— | $34,088 | $31,817,466 | ||||||||||||
21
Table of Contents
MFS International Value Portfolio
REPORT OF INDEPENDENT REGISTERED PUBLIC ACCOUNTING FIRM
To the Board of Trustees of MFS Variable Insurance Trust II and the Shareholders of
MFS International Value Portfolio:
We have audited the accompanying statement of assets and liabilities, including the portfolio of investments, of MFS International Value Portfolio (the “Fund”) (one of the series comprising MFS Variable Insurance Trust II) as of December 31, 2012, and the related statement of operations for the year then ended, the statements of changes in net assets for each of the two years in the period then ended, and the financial highlights for each of the five years in the period then ended. These financial statements and financial highlights are the responsibility of the Fund’s management. Our responsibility is to express an opinion on these financial statements and financial highlights based on our audits.
We conducted our audits in accordance with the standards of the Public Company Accounting Oversight Board (United States). Those standards require that we plan and perform the audit to obtain reasonable assurance about whether the financial statements and financial highlights are free of material misstatement. The Fund is not required to have, nor were we engaged to perform, an audit of its internal control over financial reporting. Our audits included consideration of internal control over financial reporting as a basis for designing audit procedures that are appropriate in the circumstances, but not for the purpose of expressing an opinion on the effectiveness of the Fund’s internal control over financial reporting. Accordingly, we express no such opinion. An audit also includes examining, on a test basis, evidence supporting the amounts and disclosures in the financial statements, assessing the accounting principles used and significant estimates made by management, as well as evaluating the overall financial statement presentation. Our procedures included confirmation of securities owned as of December 31, 2012, by correspondence with the custodian and brokers; where replies were not received from brokers, we performed other auditing procedures. We believe that our audits provide a reasonable basis for our opinion.
In our opinion, the financial statements and financial highlights referred to above present fairly, in all material respects, the financial position of MFS International Value Portfolio as of December 31, 2012, the results of its operations for the year then ended, the changes in its net assets for each of the two years in the period then ended, and the financial highlights for each of the five years in the period then ended, in conformity with accounting principles generally accepted in the United States of America.
DELOITTE & TOUCHE LLP
Boston, Massachusetts
February 15, 2013
22
Table of Contents
MFS International Value Portfolio
TRUSTEES AND OFFICERS – IDENTIFICATION AND BACKGROUND
The Trustees and officers of the Trust, as of February 1, 2013, are listed below, together with their principal occupations during the past five years. (Their titles may have varied during that period.) The address of each Trustee and officer is 111 Huntington Avenue, Boston, Massachusetts 02199-7618.
Name, Age | Position(s) with Fund | Trustee/Officer Since (h) | Principal Occupations During the Past Five Years | Other Directorships (j) | ||||
| INTERESTED TRUSTEES | ||||||||
Robert J. Manning (k) (age 49) | Trustee | February 2004 | Massachusetts Financial Services Company, Chairman, Chief Executive Officer and Director; President (until December 2009); Chief Investment Officer (until July 2010) | N/A | ||||
| INDEPENDENT TRUSTEES | ||||||||
David H. Gunning (age 70) | Trustee and Chair of Trustees | January 2004 | Private investor | Lincoln Electric Holdings, Inc. (welding equipment manufacturer), Director; Development Alternatives, Inc. (consulting), Director/Non-Executive Chairman; Portman Limited (mining), Director (until 2008) | ||||
Robert E. Butler (age 71) | Trustee | January 2006 | Consultant – investment company industry regulatory and compliance matters | N/A | ||||
Maureen R. Goldfarb (age 57) | Trustee | January 2009 | Private investor | N/A | ||||
William R. Gutow (age 71) | Trustee | December 1993 | Private investor and real estate consultant; Capitol Entertainment Management Company (video franchise), Vice Chairman | Atlantic Coast Tan (tanning salons), Vice Chairman (until 2007); Texas Donuts (donut franchise), Vice Chairman (until 2010) | ||||
Michael Hegarty (age 68) | Trustee | December 2004 | Private investor; Rouse Properties Inc. (real estate), Director | N/A | ||||
John P. Kavanaugh (age 58) | Trustee | January 2009 | Private investor | N/A | ||||
J. Dale Sherratt (age 74) | Trustee | June 1989 | Insight Resources, Inc. (acquisition planning specialists), President; Wellfleet Investments (investor in health care companies), Managing General Partner | N/A | ||||
| Laurie J. Thomsen (age 55) | Trustee | March 2005 | Private investor; New Profit, Inc. (venture philanthropy), Executive Partner (until 2010) | The Travelers Companies (insurance), Director | ||||
Robert W. Uek (age 71) | Trustee | January 2006 | Consultant to investment company industry | N/A | ||||
| OFFICERS | ||||||||
John M. Corcoran (k) (age 47) | President | October 2008 | Massachusetts Financial Services Company, Senior Vice President (since October 2008); State Street Bank and Trust (financial services provider), Senior Vice President, (until September 2008) | N/A | ||||
| Christopher R. Bohane (k) (age 39) | Assistant Secretary and Assistant Clerk | July 2005 | Massachusetts Financial Services Company, Vice President and Senior Counsel | N/A | ||||
Kino Clark (k) (age 44) | Assistant Treasurer | January 2012 | Massachusetts Financial Services Company, Vice President | N/A | ||||
Thomas H. Connors (k) (age 53) | Assistant Secretary and Assistant Clerk | September 2012 | Massachusetts Financial Services Company, Vice President and Senior Counsel; Deutsche Investment Management Americas Inc. (financial service provider), Director and Senior Counsel (until 2012) | N/A | ||||
Ethan D. Corey (k) (age 49) | Assistant Secretary and Assistant Clerk | July 2005 | Massachusetts Financial Services Company, Senior Vice President and Associate General Counsel | N/A | ||||
23
Table of Contents
MFS International Value Portfolio
Trustees and Officers – continued
Name, Age | Position(s) with Fund | Trustee/Officer Since (h) | Principal Occupations During the Past Five Years | Other Directorships (j) | ||||
David L. DiLorenzo (k) (age 44) | Treasurer | July 2005 | Massachusetts Financial Services Company, Senior Vice President | N/A | ||||
Robyn L. Griffin (age 37) | Assistant Independent Chief Compliance Officer | August 2008 | Griffin Compliance LLC (provider of compliance services), Principal (since August 2008); State Street Corporation (financial services provider), Mutual Fund Administration Assistant Vice President (October 2006 – July 2008) | N/A | ||||
Brian E. Langenfeld (k) (age 39) | Assistant Secretary and Assistant Clerk | June 2006 | Massachusetts Financial Services Company, Vice President and Senior Counsel | N/A | ||||
Susan S. Newton (k) (age 62) | Assistant Secretary and Assistant Clerk | May 2005 | Massachusetts Financial Services Company, Senior Vice President and Associate General Counsel | N/A | ||||
Susan A. Pereira (k) (age 42) | Assistant Secretary and Assistant Clerk | July 2005 | Massachusetts Financial Services Company, Vice President and Senior Counsel | N/A | ||||
Kasey L. Phillips (k) (age 42) | Assistant Treasurer | September 2012 | Massachusetts Financial Services Company, Vice President; Wells Fargo Funds Management, LLC, Senior Vice President, Fund Treasurer (until 2012) | N/A | ||||
Mark N. Polebaum (k) (age 60) | Secretary and Clerk | January 2006 | Massachusetts Financial Services Company, Executive Vice President, General Counsel and Secretary | N/A | ||||
Frank L. Tarantino (age 68) | Independent Chief Compliance Officer | June 2004 | Tarantino LLC (provider of compliance services), Principal | N/A | ||||
Richard S. Weitzel (k) (age 42) | Assistant Secretary and Assistant Clerk | October 2007 | Massachusetts Financial Services Company, Senior Vice President and Associate General Counsel | N/A | ||||
James O. Yost (k) (age 52) | Deputy Treasurer | September 1990 | Massachusetts Financial Services Company, Senior Vice President | N/A | ||||
| (h) | Date first appointed to serve as Trustee/officer of an MFS fund. Each Trustee has served continuously since appointment unless indicated otherwise. For the period from December 15, 2004 until February 22, 2005, Mr. Manning served as Advisory Trustee. For the period October 2008, until January 2012, Mr. Corcoran served as Treasurer of the Funds. Prior to January 2012, Messrs. DiLorenzo and Yost served as Assistant Treasurers of the Funds. |
| (j) | Directorships or trusteeships of companies required to report to the Securities and Exchange Commission (i.e., “public companies”). |
| (k) | “Interested person” of the Trust within the meaning of the Investment Company Act of 1940 (referred to as the 1940 Act), which is the principal federal law governing investment companies like the fund, as a result of position with MFS. The address of MFS is 111 Huntington Avenue, Boston, Massachusetts 02199-7618. |
Each Trustee has been elected by shareholders and each Trustee and officer holds office until his or her successor is chosen and qualified or until his or her earlier death, resignation, retirement or removal. The Trust does not hold annual meetings for the purpose of electing Trustees, and Trustees are not elected for fixed terms. Messrs. Butler, Kavanaugh, Uek and Ms. Thomsen are members of the Trust’s Audit Committee.
Each of the Fund’s Trustees and officers holds comparable positions with certain other funds of which MFS or a subsidiary is the investment adviser or distributor, and, in the case of the officers, with certain affiliates of MFS. As of January 1, 2013, the Trustees served as board members of 143 funds within the MFS Family of Funds.
24
Table of Contents
MFS International Value Portfolio
Trustees and Officers – continued
The Statement of Additional Information for the Fund includes further information about the Trustees and is available without charge upon request by calling 1-800-225-2606.
Investment Adviser Massachusetts Financial Services Company 111 Huntington Avenue Boston, MA 02199-7618 | Custodian State Street Bank and Trust 1 Lincoln Street Boston, MA 02111-2900 | |
Distributor MFS Fund Distributors, Inc. 111 Huntington Avenue Boston, MA 02199-7618 | Independent Registered Public Accounting Firm Deloitte & Touche LLP 200 Berkeley Street Boston, MA 02116 | |
Portfolio Managers Benjamin Stone Barnaby Wiener |
25
Table of Contents
MFS International Value Portfolio
BOARD REVIEW OF INVESTMENT ADVISORY AGREEMENT
A discussion regarding the Board’s most recent approval of the fund’s Investment Advisory Agreement with MFS is available by clicking on the fund’s name under “Variable Insurance Portfolios — VIT II” in the “Products” section of the MFS Web site (mfs.com).
PROXY VOTING POLICIES AND INFORMATION
A general description of the MFS funds’ proxy voting policies and procedures is available without charge, upon request, by calling 1-800-225-2606, by visiting the Proxy Voting section of mfs.com or by visiting the SEC’s Web site at http://www.sec.gov.
Information regarding how the fund voted proxies relating to portfolio securities during the most recent twelve-month period ended June 30 is available without charge by visiting the Proxy Voting section of mfs.com or by visiting the SEC’s Web site at http://www.sec.gov.
QUARTERLY PORTFOLIO DISCLOSURE
The fund will file a complete schedule of portfolio holdings with the Securities and Exchange Commission (the Commission) for the first and third quarters of each fiscal year on Form N-Q. The fund’s Form N-Q is available on the EDGAR database on the Commission’s Internet Web site at http://www.sec.gov, and may be reviewed and copied at the:
Public Reference Room
Securities and Exchange Commission
100 F Street, NE, Room 1580
Washington, D.C. 20549
Information on the operation of the Public Reference Room may be obtained by calling the Commission at 1-800-SEC-0330. Copies of the fund’s Form N-Q also may be obtained, upon payment of a duplicating fee, by electronic request at the following e-mail address: publicinfo@sec.gov or by writing the Public Reference Section at the above address.
From time to time, MFS may post important information about the fund or the MFS funds on the MFS web site (mfs.com). This information is available by visiting the “News & Commentary” section of mfs.com or by clicking on the fund’s name under “Variable Insurance Portfolios — VIT II” in the “Products” section of mfs.com.
FEDERAL TAX INFORMATION (unaudited)
The following information is provided pursuant to provisions of the Internal Revenue Code.
Income derived from foreign sources was $18,209,591. The fund intends to pass through foreign tax credits of $898,024 for the fiscal year.
26
Table of Contents
rev. 3/11

| Why? | Financial companies choose how they share your personal information. Federal law gives consumers the right to limit some but not all sharing. Federal law also requires us to tell you how we collect, share, and protect your personal information. Please read this notice carefully to understand what we do. |
| What? | The types of personal information we collect and share depend on the product or service you have with us. This information can include:
• Social Security number and account balances • Account transactions and transaction history • Checking account information and wire transfer instructions
When you are no longer our customer, we continue to share your information as described in this notice. |
| How? | All financial companies need to share customers’ personal information to run their everyday business. In the section below, we list the reasons financial companies can share their customers’ personal information; the reasons MFS chooses to share; and whether you can limit this sharing. |
| Reasons we can share your personal information | Does MFS share? | Can you limit this sharing? | ||
For our everyday business purposes – such as to process your transactions, maintain your account(s), respond to court orders and legal investigations, or report to credit bureaus | Yes | No | ||
For our marketing purposes – to offer our products and services to you | No | We don’t share | ||
| For joint marketing with other financial companies | No | We don’t share | ||
For our affiliates’ everyday business purposes – information about your transactions and experiences | No | We don’t share | ||
For our affiliates’ everyday business purposes – information about your creditworthiness | No | We don’t share | ||
| For nonaffiliates to market to you | No | We don’t share |
| Questions? | Call 800-225-2606 or go to mfs.com. |
27
Table of Contents
| Page 2 |
| Who we are | ||
| Who is providing this notice? | MFS Funds, MFS Investment Management, MFS Institutional Advisors, Inc., MFS Fund Distributors, Inc., MFS Heritage Trust Company, and MFS Service Center, Inc. | |
| What we do | ||
| How does MFS protect my personal information? | To protect your personal information from unauthorized access and use, we use security measures that comply with federal law. These measures include procedural, electronic, and physical safeguards for the protection of the personal information we collect about you. | |
| How does MFS collect my personal information? | We collect your personal information, for example, when you
• open an account or provide account information • direct us to buy securities or direct us to sell your securities • make a wire transfer
We also collect your personal information from others, such as credit bureaus, affiliates and other companies. | |
| Why can’t I limit all sharing? | Federal law gives you the right to limit only
• sharing for affiliates’ everyday business purposes – information about your creditworthiness • affiliates from using your information to market to you • sharing for nonaffiliates to market to you
State laws and individual companies may give you additional rights to limit sharing. | |
| Definitions | ||
| Affiliates | Companies related by common ownership or control. They can be financial and nonfinancial companies.
•MFS does not share personal information with affiliates, except for everyday business purposes as described on page one of this notice. | |
| Nonaffiliates | Companies not related by common ownership or control. They can be financial and nonfinancial companies.
•MFS does not share with nonaffiliates so they can market to you. | |
| Joint Marketing | A formal agreement between nonaffiliated financial companies that together market financial products or services to you.
•MFS doesn’t jointly market. | |
| Other important information | ||
| If you own an MFS product or receive an MFS service in the name of a third party such as a bank or broker-dealer, their privacy policy may apply to you instead of ours. | ||
28
Table of Contents
Table of Contents
ANNUAL REPORT
December 31, 2012

MFS® GLOBAL
GROWTH PORTFOLIO
MFS® Variable Insurance Trust II

WGO-ANN
Table of Contents
MFS® GLOBAL GROWTH PORTFOLIO
The report is prepared for the general information of contract owners. It is authorized for distribution to prospective investors only when preceded or accompanied by a current prospectus.
NOT FDIC INSURED Ÿ MAY LOSE VALUE Ÿ NO BANK OR CREDIT UNION GUARANTEE Ÿ NOT A DEPOSIT Ÿ NOT INSURED BY ANY FEDERAL GOVERNMENT AGENCY OR NCUA/NCUSIF
Table of Contents
MFS Global Growth Portfolio
LETTER FROM THE CHAIRMAN AND CEO

Dear Contract Owners:
The global market outlook for 2013 is one of cautious optimism. While we are seeing some positive economic trends in the United States, Europe and China, the overall environment remains challenging. In the United States, the recent fiscal cliff agreement was received positively by investors, even though it mostly addressed pressing taxation issues and did not resolve additional concerns, including the need for spending cuts and a large-scale reduction of the federal debt. These issues will be front and center again in the spring. Despite the ongoing uncertainty, economic tailwinds are gathering strength as the U.S. housing and job markets are improving and consumer confidence is rising.
Overseas, the debt crisis continues to weigh heavily on eurozone markets, with even Germany — long an economic stalwart — experiencing some contraction. These ongoing challenges could be a drag on global market performance this year. In Asia, manufacturing activity has accelerated in emerging markets such as China and India, and we are seeing signs of stabilized loan growth in China, a leading indicator of that country’s economic health. In contrast, Japan’s economy is contracting sharply under deflationary pressures. Nevertheless, Japanese markets have responded favorably to early actions by the new government, which appears determined to act aggressively, along with the Bank of Japan, to stimulate growth.
As always, managing risk in the face of uncertainty remains a top priority for investors. At MFS®, our uniquely collaborative investment process revolves around global research and our disciplined risk management approach. Our global team of investment professionals shares ideas and evaluates opportunities across continents, investment disciplines and asset classes — all with a goal of building better insights, and ultimately better results, for our clients.
We remain mindful of the many economic challenges investors face today, and believe it is more important than ever to maintain a long-term view, employ time-tested principles, such as asset allocation and diversification, and work closely with investment advisors to identify and pursue the most suitable opportunities.
Respectfully,

Robert J. Manning
Chairman and Chief Executive Officer
MFS Investment Management®
February 15, 2013
The opinions expressed in this letter are subject to change, may not be relied upon for investment advice, and no forecasts can be guaranteed.
1
Table of Contents
MFS Global Growth Portfolio
Portfolio structure
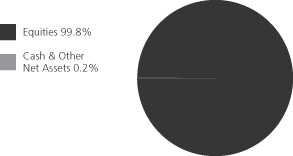
| Top ten holdings | ||||
| LVMH Moet Hennessy Louis Vuitton S.A. | 2.7% | |||
| Groupe Danone | 2.7% | |||
| Pernod Ricard S.A. | 2.3% | |||
| Google, Inc., “A” | 2.3% | |||
| Compass Group PLC | 2.2% | |||
| Danaher Corp. | 2.2% | |||
| Colgate-Palmolive Co. | 1.9% | |||
| United Technologies Corp. | 1.9% | |||
| Rio Tinto Ltd. | 1.9% | |||
| Accenture PLC, “A” | 1.8% | |||
| Equity sectors | ||||
| Consumer Staples | 15.3% | |||
| Technology | 15.1% | |||
| Industrial Goods & Services | 12.9% | |||
| Financial Services | 11.1% | |||
| Retailing | 9.3% | |||
| Health Care | 9.3% | |||
| Special Products & Services | 8.1% | |||
| Basic Materials | 6.1% | |||
| Leisure | 4.4% | |||
| Energy | 3.7% | |||
| Transportation | 2.5% | |||
| Autos & Housing | 1.5% | |||
| Utilities & Communications | 0.5% | |||
| Issuer country weightings (x) | ||||
| United States | 50.3% | |||
| France | 12.8% | |||
| United Kingdom | 11.5% | |||
| Switzerland | 6.5% | |||
| Germany | 3.8% | |||
| Brazil | 3.7% | |||
| Taiwan | 1.7% | |||
| Hong Kong | 1.5% | |||
| Netherlands | 1.2% | |||
| Other Countries | 7.0% | |||
| Currency exposure weightings (y) | ||||
| United States Dollar | 52.9% | |||
| Euro | 18.4% | |||
| British Pound Sterling | 11.5% | |||
| Swiss Franc | 6.5% | |||
| Brazilian Real | 3.7% | |||
| Taiwan Dollar | 1.7% | |||
| Hong Kong Dollar | 1.5% | |||
| South Korean Won | 1.2% | |||
| Japanese Yen | 1.0% | |||
| Other Currencies | 1.6% | |||
| (x) | Represents the portfolio’s exposure to issuer countries as a percentage of a portfolio’s net assets. |
| (y) | Represents the portfolio’s exposure to a particular currency as a percentage of a portfolio’s net assets. |
Percentages are based on net assets as of 12/31/12.
The portfolio is actively managed and current holdings may be different.
2
Table of Contents
MFS Global Growth Portfolio
Summary of Results
For the twelve months ended December 31, 2012, Initial Class shares of the MFS Global Growth Portfolio (“fund”) provided a total return of 19.72%, while Service Class shares of the fund provided a total return of 19.49%. These compare with a return of 17.17% over the same period for the fund’s benchmark, the MSCI All Country World Growth Index.
Market Environment
The beginning of the period was characterized by a risk-on sentiment as a result of additional liquidity measures by the Federal Reserve Bank (“Fed”) and the European Central Bank (“ECB”) as well as a commensurate improvement in macroeconomic conditions. During this time, global equity valuations rose, credit spreads contracted, and high-quality sovereign yields increased modestly.
During the middle of the period, however, conditions worsened, driven by broadly weaker global macroeconomic indicators, as well as renewed concerns over the eurozone’s capacity and determination to address its ongoing crisis. Despite this deterioration, broad market sentiment remained relatively resilient as equity markets generally maintained gains and credit spreads did not indicate deterioration.
However, this renewed weakness in the fundamentals precipitated a further round of monetary easing by both the Fed (through a third round of quantitative easing) and the ECB (through a new bond purchase facility) in the second half of the period, which soon instilled additional confidence in risk markets. Nonetheless, towards the end of the period, weaker equity earnings reports and declining forward guidance caused market sentiment to soften. In addition, as we moved toward year end, the fiscal cliff negotiations between the Republicans in the U.S. Congress and President Obama were a particular source of market attention, where uncertainty surrounding the fiscal negotiations continued right up to the end-of-year deadline.
Contributors to Performance
Stock selection in the industrial goods & services sector contributed to performance relative to the MSCI All Country World Growth Index. Within this sector, holdings of wiring devices and cable systems manufacturer Legrand (France) benefited relative returns. Shares of Legrand appreciated in the latter part of the period as the company reported quarterly results ahead of schedule and upgraded their earnings guidance. Additionally, the company completed their acquisition of NuVo Technologies during the period which further supported the stock.
Security selection, and to a lesser extent, an underweight position in the basic materials sector was another factor that positively contributed to relative performance. Stock selection in the special products & services and technology sectors also aided relative returns. However, there were no individual stocks within any of these three sectors that were among the fund’s top relative contributors for the reporting period.
Individual stocks in other sectors that benefited relative results included fashion distributor Industria de Diseno Textil S.A. (Spain), life sciences supply company Thermo Fisher Scientific, luxury good company LVMH Moët Hennessy Louis Vuitton, global payments technology company Visa, Inc., investment management firm Franklin Resources, Brazilian department store operator Lojas Renner, derivative trading systems provider BM&F Bovespa S.A. (b) (Brazil), and healthcare products maker Bayer AG (Germany). Holdings of LVMH outpaced the market during the reporting period on a favorable outlook for the luxury goods industry driven, in part, by anticipated improvement in growth rates in the Chinese market. Additionally, later in the period, the company raised prices at its flagship fashion and leather goods brand in Europe, which appeared to have alleviated concern about slowing demand for its products. In addition, the fund’s avoidance of oil and gas company BG Group (United Kingdom), which underperformed the index, aided relative performance.
The fund’s relative currency exposure, resulting primarily from differences between the fund’s and the benchmark’s exposures to holdings of securities denominated in foreign currencies, also strengthened relative performance. All of MFS’ investment decisions are driven by the fundamentals of each individual opportunity and as such, it is common for our portfolios to have different currency exposure than the benchmark.
Detractors from Performance
Both stock selection and an underweight position in the autos & housing sector held back relative results. There were no individual stocks within this sector that were among the fund’s top relative detractors for the reporting period.
Elsewhere, the fund’s holdings of oil and gas exploration and production company Occidental Petroleum, supermarkets and convenient stores operator Tesco PLC (h) (United Kingdom), index data provider MSCI, Inc. (b), Israeli-headquartered security software provider Check Point Software Technologies Ltd (b), wealth management firm Julius Baer Group (Switzerland), financial services firm Credit Suisse Group (h), and food and beverage producer Groupe Danone (France) held back relative performance. Shares of Occidental Petroleum declined early in the period as commodity prices for oil and gas declined significantly. Not holding cable services provider Comcast also hindered relative performance as the stock performed well during the period.
3
Table of Contents
MFS Global Growth Portfolio
Management Review – continued
The fund’s cash and/or cash equivalents position held back relative performance. The fund strives to be fully invested and generally holds cash to buy new holdings and to provide liquidity. In a period when equity markets rose, as measured by the fund’s benchmark, holding cash hurt performance versus the benchmark, which has no cash position.
Respectfully,
| David Antonelli | Jeffrey Constantino | |
| Portfolio Manager | Portfolio Manager |
| (b) | Security is not a benchmark constituent. |
| (h) | Security was not held in the portfolio at period end. |
The views expressed in this report are those of the portfolio managers only through the end of the period of the report as stated on the cover and do not necessarily reflect the views of MFS or any other person in the MFS organization. These views are subject to change at any time based on market or other conditions, and MFS disclaims any responsibility to update such views. These views may not be relied upon as investment advice or an indication of trading intent on behalf of any MFS portfolio. References to specific securities are not recommendations of such securities, and may not be representative of any MFS portfolio’s current or future investments.
4
Table of Contents
MFS Global Growth Portfolio
PERFORMANCE SUMMARY THROUGH 12/31/12
The following chart illustrates the historical performance of the fund in comparison to its benchmark(s). Benchmarks are unmanaged and may not be invested in directly. Benchmark returns do not reflect any fees or expenses. The performance of other share classes will be greater than or less than that of the class depicted below. (See Notes to Performance Summary.)
Performance data shown represents past performance and is no guarantee of future results. Investment return and principal value fluctuate so your units, when sold, may be worth more or less than the original cost; current performance may be lower or higher than quoted. The performance shown does not reflect the deduction of taxes, if any, that a contract holder would pay on fund distributions or the redemption of contract units. The returns for the fund shown also do not reflect the deduction of expenses associated with variable products, such as mortality and expense risk charges, separate account charges, and sales charges imposed by the insurance company separate accounts. Such expenses would reduce the overall returns shown.
Growth of a Hypothetical $10,000 Investment
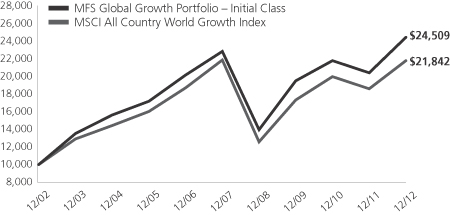
Total Returns through 12/31/12
Average annual total returns
| Share Class | Class inception date | 1-yr | 5-yr | 10-yr | ||||||||
| Initial Class | 11/16/93 | 19.72% | 1.36% | 9.38% | ||||||||
| Service Class | 8/24/01 | 19.49% | 1.11% | 9.11% | ||||||||
| Comparative benchmark | ||||||||||||
| MSCI All Country World Growth Index (f) | 17.17% | (0.10)% | 8.13% | |||||||||
| (f) | Source: FactSet Research Systems Inc. |
Benchmark Definition
MSCI All Country World Growth Index – a market capitalization-weighted index that is designed to measure equity market performance for growth securities in the global developed and emerging markets.
It is not possible to invest directly in an index.
Notes to Performance Summary
Average annual total return represents the average annual change in value for each share class for the periods presented.
Performance results reflect any applicable expense subsidies and waivers in effect during the periods shown. Without such subsidies and waivers the fund’s performance results would be less favorable. Please see the prospectus and financial statements for complete details. All results are historical and assume the reinvestment of any dividends and capital gains distributions.
Performance results do not include adjustments made for financial reporting purposes in accordance with U.S. generally accepted accounting principles and may differ from amounts reported in the financial highlights.
From time to time the fund may receive proceeds from litigation settlements, without which performance would be lower.
5
Table of Contents
MFS Global Growth Portfolio
Fund Expenses Borne by the Contract Holders During the Period,
July 1, 2012 through December 31, 2012
As a contract holder of the fund, you incur ongoing costs, including management fees; distribution and/or service (12b-1) fees; and other fund expenses. This example is intended to help you understand your ongoing costs (in dollars) of investing in the fund and to compare these costs with the ongoing costs of investing in other mutual funds.
The example is based on an investment of $1,000 invested at the beginning of the period and held for the entire period July 1, 2012 through December 31, 2012.
Actual Expenses
The first line for each share class in the following table provides information about actual account values and actual expenses. You may use the information in this line, together with the amount you invested, to estimate the expenses that you paid over the period. Simply divide your account value by $1,000 (for example, an $8,600 account value divided by $1,000 = 8.6), then multiply the result by the number in the first line under the heading entitled “Expenses Paid During Period” to estimate the expenses you paid on your account during this period.
Hypothetical Example for Comparison Purposes
The second line for each share class in the following table provides information about hypothetical account values and hypothetical expenses based on the fund’s actual expense ratio and an assumed rate of return of 5% per year before expenses, which is not the fund’s actual return. The hypothetical account values and expenses may not be used to estimate the actual ending account balance or expenses you paid for the period. You may use this information to compare the ongoing costs of investing in the fund and other funds. To do so, compare this 5% hypothetical example with the 5% hypothetical examples that appear in the shareholder reports of the other funds.
Please note that the expenses shown in the table are meant to highlight the fund’s ongoing costs only and do not take into account the fees and expenses imposed under the variable contracts through which your investment in the fund is made. Therefore, the second line for each share class in the table is useful in comparing ongoing costs associated with an investment in vehicles (such as the fund) which fund benefits under variable annuity and variable life insurance contracts and to qualified pension and retirement plans only, and will not help you determine the relative total costs of investing in the fund through variable annuity and variable life insurance contracts. If the fees and expenses imposed under the variable contracts were included, your costs would have been higher.
| Share Class | Annualized Expense Ratio | Beginning Account Value 7/01/12 | Ending Account Value 12/31/12 | Expenses Paid During Period (p) 7/01/12-12/31/12 | ||||||||||||||
| Initial Class | Actual | 1.20% | $1,000.00 | $1,117.36 | $6.39 | |||||||||||||
| Hypothetical (h) | 1.20% | $1,000.00 | $1,019.10 | $6.09 | ||||||||||||||
| Service Class | Actual | 1.45% | $1,000.00 | $1,116.26 | $7.71 | |||||||||||||
| Hypothetical (h) | 1.45% | $1,000.00 | $1,017.85 | $7.35 | ||||||||||||||
| (h) | 5% class return per year before expenses. |
| (p) | Expenses paid are equal to each class’s annualized expense ratio, as shown above, multiplied by the average account value over the period, multiplied by the number of days in the period, divided by the number of days in the year. |
6
Table of Contents
MFS Global Growth Portfolio
PORTFOLIO OF INVESTMENTS – 12/31/12
The Portfolio of Investments is a complete list of all securities owned by your fund. It is categorized by broad-based asset classes.
| Issuer | Shares/Par | Value ($) | ||||||
| COMMON STOCKS – 99.8% | ||||||||
| Aerospace – 3.4% | ||||||||
| Precision Castparts Corp. | 2,540 | $ | 481,117 | |||||
| Rolls-Royce Holdings PLC | 30,227 | 435,518 | ||||||
| United Technologies Corp. | 13,830 | 1,134,198 | ||||||
|
| |||||||
| $ | 2,050,833 | |||||||
|
| |||||||
| Alcoholic Beverages – 4.6% | ||||||||
| Diageo PLC | 30,952 | $ | 901,091 | |||||
| Heineken N.V. | 7,014 | 467,854 | ||||||
| Pernod Ricard S.A. | 11,949 | 1,405,045 | ||||||
|
| |||||||
| $ | 2,773,990 | |||||||
|
| |||||||
| Apparel Manufacturers – 6.6% | ||||||||
| Cia.Hering S.A. | 18,400 | $ | 380,384 | |||||
| Compagnie Financiere Richemont S.A. | 7,407 | 592,289 | ||||||
| Li & Fung Ltd. | 507,600 | 911,905 | ||||||
| LVMH Moet Hennessy Louis Vuitton S.A. | 8,821 | 1,643,768 | ||||||
| NIKE, Inc., “B” | 9,420 | 486,072 | ||||||
|
| |||||||
| $ | 4,014,418 | |||||||
|
| |||||||
| Automotive – 1.5% | ||||||||
| Johnson Controls, Inc. | 29,800 | $ | 914,860 | |||||
|
| |||||||
| Broadcasting – 3.3% | ||||||||
| Discovery Communications, Inc., “A” (a) | 5,070 | $ | 321,844 | |||||
| Publicis Groupe S.A. | 15,140 | 907,124 | ||||||
| Viacom, Inc., “B” | 6,100 | 321,714 | ||||||
| Walt Disney Co. | 8,630 | 429,688 | ||||||
|
| |||||||
| $ | 1,980,370 | |||||||
|
| |||||||
| Brokerage & Asset Managers – 2.8% | ||||||||
| BM&F Bovespa S.A. | 72,300 | $ | 504,678 | |||||
| Charles Schwab Corp. | 21,530 | 309,171 | ||||||
| Franklin Resources, Inc. | 6,990 | 878,643 | ||||||
|
| |||||||
| $ | 1,692,492 | |||||||
|
| |||||||
| Business Services – 8.1% | ||||||||
| Accenture PLC, “A” | 16,700 | $ | 1,110,550 | |||||
| Brenntag AG | 4,131 | 542,722 | ||||||
| Cognizant Technology Solutions Corp., “A” (a) | 7,280 | 539,084 | ||||||
| Compass Group PLC | 114,630 | 1,355,702 | ||||||
| Intertek Group PLC | 6,150 | 310,366 | ||||||
| LPS Brasil – Consultoria de Imoveis S.A. | 21,000 | 388,609 | ||||||
| MSCI, Inc., “A” (a) | 10,640 | 329,734 | ||||||
| Verisk Analytics, Inc., “A” (a) | 5,900 | 300,900 | ||||||
|
| |||||||
| $ | 4,877,667 | |||||||
|
| |||||||
| Chemicals – 0.6% | ||||||||
| Monsanto Co. | 3,620 | $ | 342,633 | |||||
|
| |||||||
| Computer Software – 4.0% | ||||||||
| Autodesk, Inc. (a) | 10,590 | $ | 374,357 | |||||
| Check Point Software Technologies Ltd. (a) | 14,280 | 680,299 | ||||||
| Dassault Systems S.A. | 2,698 | 302,028 | ||||||
| Issuer | Shares/Par | Value ($) | ||||||
| COMMON STOCKS – continued | ||||||||
| Computer Software – continued | ||||||||
| Oracle Corp. | 31,070 | $ | 1,035,252 | |||||
|
| |||||||
| $ | 2,391,936 | |||||||
|
| |||||||
| Computer Software – Systems – 3.4% | ||||||||
| Apple, Inc. | 1,950 | $ | 1,039,409 | |||||
| EMC Corp. (a) | 19,040 | 481,712 | ||||||
| International Business Machines Corp. | 2,730 | 522,932 | ||||||
|
| |||||||
| $ | 2,044,053 | |||||||
|
| |||||||
| Consumer Products – 5.3% | ||||||||
| Colgate-Palmolive Co. | 11,150 | $ | 1,165,621 | |||||
| Procter & Gamble Co. | 13,880 | 942,313 | ||||||
| Reckitt Benckiser Group PLC | 17,375 | 1,088,435 | ||||||
|
| |||||||
| $ | 3,196,369 | |||||||
|
| |||||||
| Electrical Equipment – 8.4% | ||||||||
| Amphenol Corp., “A” | 6,230 | $ | 403,081 | |||||
| Danaher Corp. | 24,050 | 1,344,395 | ||||||
| Legrand S.A. | 18,093 | 763,648 | ||||||
| Mettler-Toledo International, Inc. (a) | 3,760 | 726,808 | ||||||
| Schneider Electric S.A. | 6,522 | 486,434 | ||||||
| Sensata Technologies Holding B.V. (a) | 25,830 | 838,958 | ||||||
| W.W. Grainger, Inc. | 2,610 | 528,186 | ||||||
|
| |||||||
| $ | 5,091,510 | |||||||
|
| |||||||
| Electronics – 4.8% | ||||||||
| ASML Holding N.V. (l) | 4,259 | $ | 274,322 | |||||
| Microchip Technology, Inc. | 27,780 | 905,350 | ||||||
| Samsung Electronics Co. Ltd. | 492 | 704,163 | ||||||
| Taiwan Semiconductor Manufacturing Co. Ltd., ADR | 59,018 | 1,012,749 | ||||||
|
| |||||||
| $ | 2,896,584 | |||||||
|
| |||||||
| Energy – Independent – 1.7% | ||||||||
| Occidental Petroleum Corp. | 13,640 | $ | 1,044,960 | |||||
|
| |||||||
| Food & Beverages – 5.4% | ||||||||
| Groupe Danone | 24,613 | $ | 1,626,172 | |||||
| M. Dias Branco S.A. Industria e Comercio de Alimentos | 3,600 | 138,095 | ||||||
| Mead Johnson Nutrition Co., “A” | 8,750 | 576,538 | ||||||
| Nestle S.A. | 7,339 | 478,221 | ||||||
| PepsiCo, Inc. | 6,760 | 462,587 | ||||||
|
| |||||||
| $ | 3,281,613 | |||||||
|
| |||||||
| Food & Drug Stores – 0.3% | ||||||||
| Sundrug Co. Ltd. | 6,000 | $ | 204,958 | |||||
|
| |||||||
| General Merchandise – 1.4% | ||||||||
| Dollarama, Inc. | 5,120 | $ | 303,535 | |||||
| Lojas Renner S.A. | 6,500 | 254,321 | ||||||
| Target Corp. | 4,770 | 282,241 | ||||||
|
| |||||||
| $ | 840,097 | |||||||
|
| |||||||
7
Table of Contents
MFS Global Growth Portfolio
Portfolio of Investments – continued
| Issuer | Shares/Par | Value ($) | ||||||
| COMMON STOCKS – continued | ||||||||
| Internet – 2.9% | ||||||||
| Google, Inc., “A” (a) | 1,940 | $ | 1,376,178 | |||||
| Yahoo Japan Corp. | 1,185 | 383,548 | ||||||
|
| |||||||
| $ | 1,759,726 | |||||||
|
| |||||||
| Machinery & Tools – 1.1% | ||||||||
| Schindler Holding AG | 4,503 | $ | 650,419 | |||||
|
| |||||||
| Major Banks – 2.1% | ||||||||
| HSBC Holdings PLC | 46,107 | $ | 487,666 | |||||
| Standard Chartered PLC | 30,593 | 775,492 | ||||||
|
| |||||||
| $ | 1,263,158 | |||||||
|
| |||||||
| Medical & Health Technology & Services – 1.3% | ||||||||
| Express Scripts Holding Co. (a) | 8,590 | $ | 463,860 | |||||
| Fresenius Medical Care AG & Co. KGaA | 4,813 | 332,541 | ||||||
|
| |||||||
| $ | 796,401 | |||||||
|
| |||||||
| Medical Equipment – 5.4% | ||||||||
| DENTSPLY International, Inc. | 23,310 | $ | 923,309 | |||||
| Essilor International S.A. | 3,231 | 327,593 | ||||||
| Sonova Holding AG | 6,149 | 681,691 | ||||||
| Thermo Fisher Scientific, Inc. | 12,270 | 782,581 | ||||||
| Waters Corp. (a) | 5,990 | 521,849 | ||||||
|
| |||||||
| $ | 3,237,023 | |||||||
|
| |||||||
| Metals & Mining – 1.9% | ||||||||
| Rio Tinto Ltd. | 19,440 | $ | 1,132,817 | |||||
|
| |||||||
| Oil Services – 2.0% | ||||||||
| National Oilwell Varco, Inc. | 3,200 | $ | 218,720 | |||||
| Schlumberger Ltd. | 14,600 | 1,011,634 | ||||||
|
| |||||||
| $ | 1,230,354 | |||||||
|
| |||||||
| Other Banks & Diversified Financials – 6.2% | ||||||||
| Credicorp Ltd. | 4,100 | $ | 600,896 | |||||
| HDFC Bank Ltd. | 31,854 | 395,689 | ||||||
| Itau Unibanco Holding S.A., ADR | 35,310 | 581,203 | ||||||
| Julius Baer Group Ltd. | 21,295 | 766,165 | ||||||
| MasterCard, Inc., “A” | 1,010 | 496,193 | ||||||
| Visa, Inc., “A” | 5,920 | 897,354 | ||||||
|
| |||||||
| $ | 3,737,500 | |||||||
|
| |||||||
| Pharmaceuticals – 2.6% | ||||||||
| Allergan, Inc. | 3,960 | $ | 363,251 | |||||
| Bayer AG | 5,416 | 514,317 | ||||||
| Johnson & Johnson | 10,330 | 724,133 | ||||||
|
| |||||||
| $ | 1,601,701 | |||||||
|
| |||||||
| Railroad & Shipping – 1.3% | ||||||||
| Kuehne & Nagel, Inc. AG | 6,360 | $ | 774,017 | |||||
|
| |||||||
| Restaurants – 1.1% | ||||||||
| McDonald’s Corp. | 7,670 | $ | 676,571 | |||||
|
| |||||||
| Specialty Chemicals – 3.6% | ||||||||
| Croda International PLC | 11,382 | $ | 440,966 | |||||
| L’Air Liquide S.A. | 2,403 | 301,136 | ||||||
| Linde AG | 3,512 | 612,456 | ||||||
| Praxair, Inc. | 4,870 | 533,022 | ||||||
| Issuer | Shares/Par | Value ($) | ||||||
| COMMON STOCKS – continued | ||||||||
| Specialty Chemicals – continued | ||||||||
| Symrise AG | 8,155 | $ | 291,925 | |||||
|
| |||||||
| $ | 2,179,505 | |||||||
|
| |||||||
| Specialty Stores – 1.0% | ||||||||
| Industria de Diseno Textil S.A. | 4,264 | $ | 597,377 | |||||
|
| |||||||
| Telecommunications – Wireless – 0.5% | ||||||||
| MTN Group Ltd. | 15,317 | $ | 321,941 | |||||
|
| |||||||
| Trucking – 1.2% | ||||||||
| Expeditors International of Washington, Inc. | 18,390 | $ | 727,325 | |||||
|
| |||||||
| Total Common Stocks (Identified Cost, $52,530,557) | $ | 60,325,178 | ||||||
|
| |||||||
| MONEY MARKET FUNDS – 0.4% | ||||||||
| MFS Institutional Money Market Portfolio, 0.16%, at Cost and Net Asset Value (v) | 207,579 | $ | 207,579 | |||||
|
| |||||||
| COLLATERAL FOR SECURITIES LOANED – 0.3% | ||||||||
| Navigator Securities Lending Prime Portfolio, 0.28%, at Cost and Net Asset Value (j) | 200,531 | $ | 200,531 | |||||
|
| |||||||
| Total Investments (Identified Cost, $52,938,667) | $ | 60,733,288 | ||||||
|
| |||||||
| OTHER ASSETS, LESS LIABILITIES – (0.5)% | (281,444 | ) | ||||||
|
| |||||||
| Net Assets – 100.0% | $ | 60,451,844 | ||||||
|
| |||||||
| (a) | Non-income producing security. |
| (j) | The rate quoted is the annualized seven-day yield of the fund at period end. |
| (l) | A portion of this security is on loan. |
| (v) | Underlying affiliated fund that is available only to investment companies managed by MFS. The rate quoted for the MFS Institutional Money Market Portfolio is the annualized seven-day yield of the fund at period end. |
The following abbreviations are used in this report and are defined:
| ADR | American Depositary Receipt |
| PLC | Public Limited Company |
See Notes to Financial Statements
8
Table of Contents
MFS Global Growth Portfolio
FINANCIAL STATEMENTS | STATEMENT OF ASSETS AND LIABILITIES
This statement represents your fund’s balance sheet, which details the assets and liabilities comprising the total value of the fund.
At 12/31/12 | ||||||||
Assets | ||||||||
Investments – | ||||||||
Non-affiliated issuers, at value (identified cost, $52,731,088) | $60,525,709 | |||||||
Underlying affiliated funds, at cost and value | 207,579 | |||||||
Total investments, at value, including $200,189 of securities on loan (identified cost, $52,938,667) | $60,733,288 | |||||||
Receivables for | ||||||||
Investments sold | 152,633 | |||||||
Interest and dividends | 53,520 | |||||||
Other assets | 987 | |||||||
Total assets | $60,940,428 | |||||||
Liabilities | ||||||||
Payables for | ||||||||
Investments purchased | $81,026 | |||||||
Fund shares reacquired | 137,451 | |||||||
Collateral for securities loaned, at value | 200,531 | |||||||
Payable to affiliates | ||||||||
Investment adviser | 6,126 | |||||||
Shareholder servicing costs | 43 | |||||||
Distribution and/or service fees | 86 | |||||||
Payable for independent Trustees’ compensation | 60 | |||||||
Accrued expenses and other liabilities | 63,261 | |||||||
Total liabilities | $488,584 | |||||||
Net assets | $60,451,844 | |||||||
Net assets consist of | ||||||||
Paid-in capital | $59,307,473 | |||||||
Unrealized appreciation (depreciation) on investments and translation of assets and liabilities in foreign currencies | 7,794,254 | |||||||
Accumulated net realized gain (loss) on investments and foreign currency | (7,052,811 | ) | ||||||
Undistributed net investment income | 402,928 | |||||||
Net assets | $60,451,844 | |||||||
Shares of beneficial interest outstanding | 3,366,034 |
| Net assets | Shares outstanding | Net asset value per share | ||||||||||
Initial Class | $57,300,234 | 3,189,856 | $17.96 | |||||||||
Service Class | 3,151,610 | 176,178 | 17.89 | |||||||||
See Notes to Financial Statements
9
Table of Contents
MFS Global Growth Portfolio
FINANCIAL STATEMENTS | STATEMENT OF OPERATIONS
This statement describes how much your fund earned in investment income and accrued in expenses. It also describes any gains and/or losses generated by fund operations.
Year ended 12/31/12 | ||||||||
Net investment income | ||||||||
Income | ||||||||
Dividends | $1,196,933 | |||||||
Interest | 15,480 | |||||||
Dividends from underlying affiliated funds | 694 | |||||||
Foreign taxes withheld | (60,594 | ) | ||||||
Total investment income | $1,152,513 | |||||||
Expenses | ||||||||
Management fee | $554,969 | |||||||
Distribution and/or service fees | 8,508 | |||||||
Shareholder servicing costs | 5,650 | |||||||
Administrative services fee | 19,174 | |||||||
Independent Trustees’ compensation | 3,508 | |||||||
Custodian fee | 51,876 | |||||||
Shareholder communications | 7,873 | |||||||
Audit and tax fees | 77,368 | |||||||
Legal fees | 1,356 | |||||||
Miscellaneous | 11,302 | |||||||
Total expenses | $741,584 | |||||||
Fees paid indirectly | (1 | ) | ||||||
Reduction of expenses by investment adviser | (220 | ) | ||||||
Net expenses | $741,363 | |||||||
Net investment income | $411,150 | |||||||
Realized and unrealized gain (loss) on investments and foreign currency | ||||||||
Realized gain (loss) (identified cost basis) | ||||||||
Investments | $2,484,457 | |||||||
Foreign currency | (4,638 | ) | ||||||
Net realized gain (loss) on investments and foreign currency | $2,479,819 | |||||||
Change in unrealized appreciation (depreciation) | ||||||||
Investments | $8,177,732 | |||||||
Translation of assets and liabilities in foreign currencies | 952 | |||||||
Net unrealized gain (loss) on investments and foreign currency translation | $8,178,684 | |||||||
Net realized and unrealized gain (loss) on investments and foreign currency | $10,658,503 | |||||||
Change in net assets from operations | $11,069,653 |
See Notes to Financial Statements
10
Table of Contents
MFS Global Growth Portfolio
FINANCIAL STATEMENTS | STATEMENTS OF CHANGES IN NET ASSETS
These statements describe the increases and/or decreases in net assets resulting from operations, any distributions, and any shareholder transactions.
For years ended 12/31 | 2012 | 2011 | ||||||
Change in net assets | ||||||||
From operations | ||||||||
Net investment income | $411,150 | $479,568 | ||||||
Net realized gain (loss) on investments and foreign currency | 2,479,819 | 3,058,867 | ||||||
Net unrealized gain (loss) on investments and foreign currency translation | 8,178,684 | (7,688,985 | ) | |||||
Change in net assets from operations | $11,069,653 | $(4,150,550 | ) | |||||
Distributions declared to shareholders | ||||||||
From net investment income | $(430,008 | ) | $(453,630 | ) | ||||
Change in net assets from fund share transactions | $(9,597,983 | ) | $(11,628,987 | ) | ||||
Total change in net assets | $1,041,662 | $(16,233,167 | ) | |||||
Net assets | ||||||||
At beginning of period | 59,410,182 | 75,643,349 | ||||||
At end of period (including undistributed net investment income of $402,928 and | $60,451,844 | $59,410,182 |
See Notes to Financial Statements
11
Table of Contents
MFS Global Growth Portfolio
FINANCIAL STATEMENTS | FINANCIAL HIGHLIGHTS
The financial highlights table is intended to help you understand the fund’s financial performance for the past 5 years. Certain information reflects financial results for a single fund share. The total returns in the table represent the rate by which an investor would have earned (or lost) on an investment in the fund share class (assuming reinvestment of all distributions) held for the entire period.
| Initial Class | Years ended 12/31 | |||||||||||||||||||
| 2012 | 2011 | 2010 | 2009 | 2008 | ||||||||||||||||
Net asset value, beginning of period | $15.11 | $16.26 | $14.65 | $10.62 | $17.54 | |||||||||||||||
| Income (loss) from investment operations | ||||||||||||||||||||
Net investment income (d) | $0.11 | $0.11 | $0.10 | $0.10 | $0.13 | |||||||||||||||
Net realized and unrealized gain (loss) on investments | 2.86 | (1.15 | ) | 1.62 | 4.07 | (6.90 | ) | |||||||||||||
Total from investment operations | $2.97 | $(1.04 | ) | $1.72 | $4.17 | $(6.77 | ) | |||||||||||||
| Less distributions declared to shareholders | ||||||||||||||||||||
From net investment income | $(0.12 | ) | $(0.11 | ) | $(0.11 | ) | $(0.14 | ) | $(0.15 | ) | ||||||||||
Net asset value, end of period (x) | $17.96 | $15.11 | $16.26 | $14.65 | $10.62 | |||||||||||||||
Total return (%) (k)(r)(s)(x) | 19.72 | (6.38 | ) | 11.80 | 39.81 | (38.93 | ) | |||||||||||||
| Ratios (%) (to average net assets) and Supplemental data: | ||||||||||||||||||||
Expenses before expense reductions (f) | 1.19 | 1.22 | 1.19 | 1.34 | 1.25 | |||||||||||||||
Expenses after expense reductions (f) | 1.19 | N/A | N/A | N/A | N/A | |||||||||||||||
Net investment income | 0.68 | 0.72 | 0.66 | 0.85 | 0.90 | |||||||||||||||
Portfolio turnover | 40 | 36 | 61 | 76 | 81 | |||||||||||||||
Net assets at end of period (000 omitted) | $57,300 | $56,309 | $71,546 | $75,171 | $62,289 | |||||||||||||||
See Notes to Financial Statements
12
Table of Contents
MFS Global Growth Portfolio
Financial Highlights – continued
| Service Class | Years ended 12/31 | |||||||||||||||||||
| 2012 | 2011 | 2010 | 2009 | 2008 | ||||||||||||||||
Net asset value, beginning of period | $15.04 | $16.18 | $14.58 | $10.55 | $17.42 | |||||||||||||||
| Income (loss) from investment operations | ||||||||||||||||||||
Net investment income (d) | $0.07 | $0.08 | $0.06 | $0.07 | $0.10 | |||||||||||||||
Net realized and unrealized gain (loss) on investments | 2.86 | (1.16 | ) | 1.62 | 4.05 | (6.86 | ) | |||||||||||||
Total from investment operations | $2.93 | $(1.08 | ) | $1.68 | $4.12 | $(6.76 | ) | |||||||||||||
| Less distributions declared to shareholders | ||||||||||||||||||||
From net investment income | $(0.08 | ) | $(0.06 | ) | $(0.08 | ) | $(0.09 | ) | $(0.11 | ) | ||||||||||
Net asset value, end of period (x) | $17.89 | $15.04 | $16.18 | $14.58 | $10.55 | |||||||||||||||
Total return (%) (k)(r)(s)(x) | 19.49 | (6.67 | ) | 11.53 | 39.43 | (39.07 | ) | |||||||||||||
| Ratios (%) (to average net assets) and Supplemental data: | ||||||||||||||||||||
Expenses before expense reductions (f) | 1.44 | 1.47 | 1.44 | 1.59 | 1.49 | |||||||||||||||
Expenses after expense reductions (f) | 1.44 | N/A | N/A | N/A | N/A | |||||||||||||||
Net investment income | 0.44 | 0.49 | 0.42 | 0.58 | 0.67 | |||||||||||||||
Portfolio turnover | 40 | 36 | 61 | 76 | 81 | |||||||||||||||
Net assets at end of period (000 omitted) | $3,152 | $3,101 | $4,098 | $5,002 | $4,670 | |||||||||||||||
| (d) | Per share data is based on average shares outstanding. |
| (f) | Ratios do not reflect reductions from fees paid indirectly, if applicable. |
| (k) | The total return does not reflect expenses that apply to separate accounts. Inclusion of these charges would reduce the total return figures for all periods shown. |
| (r) | Certain expenses have been reduced without which performance would have been lower. |
| (s) | From time to time the fund may receive proceeds from litigation settlements, without which performance would be lower. |
| (x) | The net asset values per share and total returns have been calculated on net assets which include adjustments made in accordance with U.S. generally accepted accounting principles required at period end for financial reporting purposes. |
See Notes to Financial Statements
13
Table of Contents
MFS Global Growth Portfolio
| (1) | Business and Organization |
MFS Global Growth Portfolio (the fund) is a series of MFS Variable Insurance Trust II (the trust). The trust is organized as a Massachusetts business trust and is registered under the Investment Company Act of 1940, as amended, as an open-end management investment company. The shareholders of each series of the trust are separate accounts of insurance companies, which offer variable annuity and/or life insurance products, and qualified retirement and pension plans.
| (2) | Significant Accounting Policies |
General – The preparation of financial statements in conformity with U.S. generally accepted accounting principles requires management to make estimates and assumptions that affect the reported amounts of assets and liabilities, and disclosure of contingent assets and liabilities at the date of the financial statements and the reported amounts of revenues and expenses during the reporting period. Actual results could differ from those estimates. In the preparation of these financial statements, management has evaluated subsequent events occurring after the date of the fund’s Statement of Assets and Liabilities through the date that the financial statements were issued. The fund invests in foreign securities. Investments in foreign securities are vulnerable to the effects of changes in the relative values of the local currency and the U.S. dollar and to the effects of changes in each country’s legal, political, and economic environment.
In this reporting period the fund adopted Financial Accounting Standards Board (FASB) Accounting Standards Update 2011-04, Fair Value Measurement (Topic 820) – Amendments to Achieve Common Fair Value Measurement and Disclosure Requirements in U.S. GAAP and IFRSs (“ASU 2011-04”). ASU 2011-04 seeks to improve the comparability of fair value measurements as presented and disclosed in financial statements prepared in accordance with U.S. GAAP and International Financial Reporting Standards (IFRS) by providing common requirements for fair value measurement and disclosure.
In December 2011, the FASB issued Accounting Standards Update 2011-11, Balance Sheet (Topic 210) – Disclosures about Offsetting Assets and Liabilities (“ASU 2011-11”). Effective for annual reporting periods beginning on or after January 1, 2013 and interim periods within those annual periods, ASU 2011-11 is intended to enhance disclosure requirements on the offsetting of financial assets and liabilities. Although still evaluating the potential impacts of ASU 2011-11 to the fund, management expects that the impact of the fund’s adoption will be limited to additional financial statement disclosures.
Investment Valuations – Equity securities, including restricted equity securities, are generally valued at the last sale or official closing price as provided by a third-party pricing service on the market or exchange on which they are primarily traded. Equity securities, for which there were no sales reported that day, are generally valued at the last quoted daily bid quotation as provided by a third-party pricing service on the market or exchange on which such securities are primarily traded. Short-term instruments with a maturity at issuance of 60 days or less generally are valued at amortized cost, which approximates market value. Open-end investment companies are generally valued at net asset value per share. Securities and other assets generally valued on the basis of information from a third-party pricing service may also be valued at a broker/dealer bid quotation. Values obtained from third-party pricing services can utilize both transaction data and market information such as yield, quality, coupon rate, maturity, type of issue, trading characteristics, and other market data. The values of foreign securities and other assets and liabilities expressed in foreign currencies are converted to U.S. dollars using the mean of bid and asked prices for rates provided by a third-party pricing service.
The Board of Trustees has delegated primary responsibility for determining or causing to be determined the value of the fund’s investments (including any fair valuation) to the adviser pursuant to valuation policies and procedures approved by the Board. If the adviser determines that reliable market quotations are not readily available, investments are valued at fair value as determined in good faith by the adviser in accordance with such procedures under the oversight of the Board of Trustees. Under the fund’s valuation policies and procedures, market quotations are not considered to be readily available for most types of debt instruments and floating rate loans and many types of derivatives. These investments are generally valued at fair value based on information from third-party pricing services. In addition, investments may be valued at fair value if the adviser determines that an investment’s value has been materially affected by events occurring after the close of the exchange or market on which the investment is principally traded (such as foreign exchange or market) and prior to the determination of the fund’s net asset value, or after the halting of trading of a specific security where trading does not resume prior to the close of the exchange or market on which the security is principally traded. Events that occur on a frequent basis after foreign markets close (such as developments in foreign markets and significant movements in the U.S. markets) and prior to the determination of the fund’s net asset value may be deemed to have a material effect on the value of securities traded in foreign markets. Accordingly, the fund’s foreign equity securities may often be valued at fair value. The adviser generally relies on third-party pricing services or other information (such as the correlation with price movements of similar securities in the same or other markets; the type, cost and investment characteristics of the security; the business and financial condition of the issuer; and trading and other market data) to assist in determining whether to fair value and at what value to fair value an investment. The value of an investment for purposes of calculating the fund’s net asset value can differ depending on the source and method used to determine value. When fair valuation is used, the value of an investment used to determine the fund’s net asset value may differ from quoted or published prices for the same investment. There can be no assurance
14
Table of Contents
MFS Global Growth Portfolio
Notes to Financial Statements – continued
that the fund could obtain the fair value assigned to an investment if it were to sell the investment at the same time at which the fund determines its net asset value per share.
Various inputs are used in determining the value of the fund’s assets or liabilities. These inputs are categorized into three broad levels. In certain cases, the inputs used to measure fair value may fall into different levels of the fair value hierarchy. In such cases, an investment’s level within the fair value hierarchy is based on the lowest level of input that is significant to the fair value measurement. The fund’s assessment of the significance of a particular input to the fair value measurement in its entirety requires judgment, and considers factors specific to the investment. Level 1 includes unadjusted quoted prices in active markets for identical assets or liabilities. Level 2 includes other significant observable market-based inputs (including quoted prices for similar securities, interest rates, prepayment speed, and credit risk). Level 3 includes unobservable inputs, which may include the adviser’s own assumptions in determining the fair value of investments. The following is a summary of the levels used as of December 31, 2012 in valuing the fund’s assets or liabilities:
| Investments at Value | Level 1 | Level 2 | Level 3 | Total | ||||||||||||
| Equity Securities: | ||||||||||||||||
United States | $30,290,893 | $— | $— | $30,290,893 | ||||||||||||
France | — | 7,762,947 | — | 7,762,947 | ||||||||||||
United Kingdom | — | 6,928,051 | — | 6,928,051 | ||||||||||||
Switzerland | 1,159,912 | 2,782,890 | — | 3,942,802 | ||||||||||||
Germany | 291,925 | 2,002,035 | — | 2,293,960 | ||||||||||||
Brazil | 581,203 | 1,666,087 | — | 2,247,290 | ||||||||||||
Taiwan | 1,012,749 | — | — | 1,012,749 | ||||||||||||
Hong Kong | — | 911,905 | — | 911,905 | ||||||||||||
Netherlands | 274,322 | 467,854 | — | 742,176 | ||||||||||||
Other Countries | 1,584,730 | 2,607,675 | — | 4,192,405 | ||||||||||||
| Mutual Funds | 408,110 | — | — | 408,110 | ||||||||||||
| Total Investments | $35,603,844 | $25,129,444 | $— | $60,733,288 | ||||||||||||
For further information regarding security characteristics, see the Portfolio of Investments.
Of the level 2 investments presented above, equity investments amounting to $8,783,071 would have been considered level 1 investments at the beginning of the period. Of the level 1 investments presented above, equity investments amounting to $478,221 would have been considered level 2 investments at the beginning of the period. The primary reason for changes in the classifications between levels 1 and 2 occurs when foreign equity securities are fair valued using other observable market-based inputs in place of the closing exchange price due to events occurring after the close of the exchange or market on which the investment is principally traded. The fund’s foreign equity securities may often be valued at fair value. The fund’s policy is to recognize transfers between the levels as of the end of the period.
Foreign Currency Translation – Purchases and sales of foreign investments, income, and expenses are converted into U.S. dollars based upon currency exchange rates prevailing on the respective dates of such transactions or on the reporting date for foreign denominated receivables and payables. Gains and losses attributable to foreign currency exchange rates on sales of securities are recorded for financial statement purposes as net realized gains and losses on investments. Gains and losses attributable to foreign exchange rate movements on receivables, payables, income and expenses are recorded for financial statement purposes as foreign currency transaction gains and losses. That portion of both realized and unrealized gains and losses on investments that results from fluctuations in foreign currency exchange rates is not separately disclosed.
Security Loans – State Street Bank and Trust Company (“State Street”), as lending agent, loans the securities of the fund to certain qualified institutions (the “Borrowers”) approved by the fund. The loans are collateralized by cash and/or U.S. Treasury and federal agency obligations in an amount typically at least equal to the market value of the securities loaned. The market value of the loaned securities is determined at the close of business of the fund and any additional required collateral is delivered to the fund on the next business day. State Street provides the fund with indemnification against Borrower default. The fund bears the risk of loss with respect to the investment of cash collateral. On loans collateralized by cash, the cash collateral is invested in a money market fund or short-term securities. Collateral for securities loaned is held at carrying value, which approximates fair value. If the collateral for securities loaned was carried at fair value, its fair value would be considered level 2 under the fair value hierarchy. A portion of the income generated upon investment of the collateral is remitted to the Borrowers, and the remainder is allocated between the fund and the lending agent. On loans collateralized by U.S. Treasury and/or federal agency obligations, a fee is received from the Borrower, and is allocated between the fund and the lending agent. Income from securities lending is included in “Interest” income on the Statement of Operations. The dividend and interest income earned on the securities loaned is accounted for in the same manner as other dividend and interest income.
15
Table of Contents
MFS Global Growth Portfolio
Notes to Financial Statements – continued
Indemnifications – Under the fund’s organizational documents, its officers and Trustees may be indemnified against certain liabilities and expenses arising out of the performance of their duties to the fund. Additionally, in the normal course of business, the fund enters into agreements with service providers that may contain indemnification clauses. The fund’s maximum exposure under these agreements is unknown as this would involve future claims that may be made against the fund that have not yet occurred.
Investment Transactions and Income – Investment transactions are recorded on the trade date. Interest income is recorded on the accrual basis. Dividends received in cash are recorded on the ex-dividend date. Certain dividends from foreign securities will be recorded when the fund is informed of the dividend if such information is obtained subsequent to the ex-dividend date. Dividend and interest payments received in additional securities are recorded on the ex-dividend or ex-interest date in an amount equal to the value of the security on such date.
The fund may receive proceeds from litigation settlements. Any proceeds received from litigation involving portfolio holdings are reflected in the Statement of Operations in realized gain/loss if the security has been disposed of by the fund or in unrealized gain/loss if the security is still held by the fund. Any other proceeds from litigation not related to portfolio holdings are reflected as other income in the Statement of Operations.
Fees Paid Indirectly – The fund’s custody fee may be reduced according to an arrangement that measures the value of cash deposited with the custodian by the fund. This amount, for the year ended December 31, 2012, is shown as a reduction of total expenses in the Statement of Operations.
Tax Matters and Distributions – The fund intends to qualify as a regulated investment company, as defined under Subchapter M of the Internal Revenue Code, and to distribute all of its taxable income, including realized capital gains. As a result, no provision for federal income tax is required. The fund’s federal tax returns, when filed, will remain subject to examination by the Internal Revenue Service for a three year period. Foreign taxes have been accrued by the fund in the accompanying financial statements.
Distributions to shareholders are recorded on the ex-dividend date. Income and capital gain distributions are determined in accordance with income tax regulations, which may differ from U.S. generally accepted accounting principles. Certain capital accounts in the financial statements are periodically adjusted for permanent differences in order to reflect their tax character. These adjustments have no impact on net assets or net asset value per share. Temporary differences which arise from recognizing certain items of income, expense, gain or loss in different periods for financial statement and tax purposes will reverse at some time in the future. Distributions in excess of net investment income or net realized gains are temporary overdistributions for financial statement purposes resulting from differences in the recognition or classification of income or distributions for financial statement and tax purposes.
Book/tax differences primarily relate to wash sale loss deferrals.
The tax character of distributions declared to shareholders for the last two fiscal years is as follows:
| 12/31/12 | 12/31/11 | |||||||
| Ordinary income (including any short-term capital gains) | $430,008 | $453,630 | ||||||
The federal tax cost and the tax basis components of distributable earnings were as follows:
| As of 12/31/12 | ||||
| Cost of investments | $52,959,421 | |||
| Gross appreciation | 9,474,177 | |||
| Gross depreciation | (1,700,310 | ) | ||
| Net unrealized appreciation (depreciation) | $7,773,867 | |||
| Undistributed ordinary income | 402,928 | |||
| Capital loss carryforwards | (7,032,057 | ) | ||
| Other temporary differences | (367 | ) |
Under the Regulated Investment Company Modernization Act of 2010 (the “Act”), net capital losses recognized after December 31, 2010 may be carried forward indefinitely, and their character is retained as short-term and/or long-term losses. Previously, net capital losses were carried forward for eight years and treated as short-term losses. As a transition rule, the Act requires that post-enactment net capital losses be used before pre-enactment net capital losses.
As of December 31, 2012, the fund had capital loss carryforwards available to offset future realized gains. Such losses expire as follows:
| Pre-enactment losses: | ||||
| 12/13/16 | $(1,708,730 | ) | ||
| 12/31/17 | (5,323,327 | ) | ||
| Total | $(7,032,057 | ) |
16
Table of Contents
MFS Global Growth Portfolio
Notes to Financial Statements – continued
Multiple Classes of Shares of Beneficial Interest – The fund offers multiple classes of shares, which differ in their respective distribution and/or service fees. The fund’s income, realized and unrealized gain (loss), and common expenses are allocated to shareholders based on the daily net assets of each class. Dividends are declared separately for each class. Differences in per share dividend rates are generally due to differences in separate class expenses. The fund’s distributions declared to shareholders as reported in the Statements of Changes in Net Assets are presented by class as follows:
| From net investment income | ||||||||
| Year ended 12/31/12 | Year ended 12/31/11 | |||||||
| Initial Class | $414,299 | $440,257 | ||||||
| Service Class | 15,709 | 13,373 | ||||||
| Total | $430,008 | $453,630 | ||||||
| (3) | Transactions with Affiliates |
Investment Adviser – The fund has an investment advisory agreement with MFS to provide overall investment management and related administrative services and facilities to the fund.
The management fee is computed daily and paid monthly at the following annual rates:
| First $1 billion of average daily net assets | 0.90% | |||
| Next $1 billion of average daily net assets | 0.75% | |||
| Average daily net assets in excess of $2 billion | 0.65% |
The management fee incurred for the year ended December 31, 2012 was equivalent to an annual effective rate of 0.90% of the fund’s average daily net assets.
The investment adviser has agreed in writing to pay a portion of the fund’s total annual operating expenses, exclusive of interest, taxes, extraordinary expenses, brokerage and transaction costs, and investment-related expenses, such that total annual operating expenses do not exceed 1.40% of average daily net assets for the Initial Class shares and 1.65% of average daily net assets for the Service Class Shares. This written agreement will continue until modified by the fund’s Board of Trustees, but such agreement will continue at least until April 30, 2014. For the year ended December 31, 2012, the fund’s actual operating expenses did not exceed the limit and therefore, the investment adviser did not pay any portion of the fund’s expenses related to this agreement.
Distributor – MFS Fund Distributors, Inc. (MFD), a wholly-owned subsidiary of MFS, is the distributor of shares of the fund. The Trustees have adopted a distribution plan for the Service Class shares pursuant to Rule 12b-1 under the Investment Company Act of 1940.
The fund’s distribution plan provides that the fund will pay MFD distribution and/or service fees equal to 0.25% per annum of its average daily net assets attributable to Service Class shares as partial consideration for services performed and expenses incurred by MFD and financial intermediaries (including participating insurance companies that invest in the fund to fund variable annuity and variable life insurance contracts, sponsors of qualified retirement and pension plans that invest in the fund, and affiliates of these participating insurance companies and plan sponsors) in connection with the sale and distribution of the Service Class shares. MFD may subsequently pay all, or a portion, of the distribution and/or service fees to financial intermediaries.
Shareholder Servicing Agent – MFS Service Center, Inc. (MFSC), a wholly-owned subsidiary of MFS, receives a fee from the fund for its services as shareholder servicing agent. For the year ended December 31, 2012, the fee was $5,634, which equated to 0.0091% annually of the fund’s average daily net assets. MFSC also receives payment from the fund for out-of-pocket expenses paid by MFSC on behalf of the fund. For the year ended December 31, 2012, these costs amounted to $16.
Administrator – MFS provides certain financial, legal, shareholder communications, compliance, and other administrative services to the fund. Under an administrative services agreement, the fund partially reimburses MFS the costs incurred to provide these services. The fund is charged an annual fixed amount of $17,500 plus a fee based on average daily net assets. The administrative services fee incurred for the year ended December 31, 2012 was equivalent to an annual effective rate of 0.0311% of the fund’s average daily net assets.
Trustees’ and Officers’ Compensation – The fund pays compensation to independent Trustees in the form of a retainer, attendance fees, and additional compensation to Board and Committee chairpersons. The fund does not pay compensation directly to Trustees or officers of the fund who are also officers of the investment adviser, all of whom receive remuneration for their services to the fund from MFS. Certain officers and Trustees of the fund are officers or directors of MFS, MFD, and MFSC.
Other – This fund and certain other funds managed by MFS (the funds) have entered into services agreements (the Agreements) which provide for payment of fees by the funds to Tarantino LLC and Griffin Compliance LLC in return for the provision of services of an Independent Chief Compliance Officer (ICCO) and Assistant ICCO, respectively, for the funds. The ICCO and Assistant ICCO are officers of the funds and the sole members of Tarantino LLC and Griffin Compliance LLC, respectively. The funds can terminate the
17
Table of Contents
MFS Global Growth Portfolio
Notes to Financial Statements – continued
Agreements with Tarantino LLC and Griffin Compliance LLC at any time under the terms of the Agreements. For the year ended December 31, 2012, the aggregate fees paid by the fund to Tarantino LLC and Griffin Compliance LLC were $507 and are included in “Miscellaneous” expense in the Statement of Operations. MFS has agreed to reimburse the fund for a portion of the payments made by the fund in the amount of $220, which is shown as a reduction of total expenses in the Statement of Operations. Additionally, MFS has agreed to bear all expenses associated with office space, other administrative support, and supplies provided to the ICCO and Assistant ICCO.
The fund invests in the MFS Institutional Money Market Portfolio which is managed by MFS and seeks current income consistent with preservation of capital and liquidity. Income earned on this investment is included in “Dividends from underlying affiliated funds” in the Statement of Operations. This money market fund does not pay a management fee to MFS.
| (4) | Portfolio Securities |
Purchases and sales of investments, other than short-term obligations, aggregated $24,209,096 and $33,339,582, respectively.
| (5) | Shares of Beneficial Interest |
The fund’s Declaration of Trust permits the Trustees to issue an unlimited number of full and fractional shares of beneficial interest. Transactions in fund shares were as follows:
| Year ended 12/31/12 | Year ended 12/31/11 | |||||||||||||||
| Shares | Amount | Shares | Amount | |||||||||||||
| Shares sold | ||||||||||||||||
Initial Class | 26,437 | $433,659 | 27,519 | $426,605 | ||||||||||||
Service Class | 26,595 | 450,556 | 13,987 | 220,430 | ||||||||||||
| 53,032 | $884,215 | 41,506 | $647,035 | |||||||||||||
| Shares issued to shareholders in reinvestment of distributions | ||||||||||||||||
Initial Class | 24,838 | $414,299 | 28,813 | $440,257 | ||||||||||||
Service Class | 945 | 15,709 | 878 | 13,373 | ||||||||||||
| 25,783 | $430,008 | 29,691 | $453,630 | |||||||||||||
| Shares reacquired | ||||||||||||||||
Initial Class | (588,888 | ) | $(9,932,676 | ) | (728,901 | ) | $(11,745,204 | ) | ||||||||
Service Class | (57,532 | ) | (979,530 | ) | (61,974 | ) | (984,448 | ) | ||||||||
| (646,420 | ) | $(10,912,206 | ) | (790,875 | ) | $(12,729,652 | ) | |||||||||
| Net change | ||||||||||||||||
Initial Class | (537,613 | ) | $(9,084,718 | ) | (672,569 | ) | $(10,878,342 | ) | ||||||||
Service Class | (29,992 | ) | (513,265 | ) | (47,109 | ) | (750,645 | ) | ||||||||
| (567,605 | ) | $(9,597,983 | ) | (719,678 | ) | $(11,628,987 | ) | |||||||||
| (6) | Line of Credit |
The fund and certain other funds managed by MFS participate in a $1.1 billion unsecured committed line of credit, subject to a $1 billion sublimit, provided by a syndication of banks under a credit agreement. Borrowings may be made for temporary financing needs. Interest is charged to each fund, based on its borrowings, generally at a rate equal to the higher of the Federal Reserve funds rate or one month LIBOR plus an agreed upon spread. A commitment fee, based on the average daily, unused portion of the committed line of credit, is allocated among the participating funds at the end of each calendar quarter. In addition, the fund and other funds managed by MFS have established unsecured uncommitted borrowing arrangements with certain banks for temporary financing needs. Interest is charged to each fund, based on its borrowings, at a rate equal to the Federal Reserve funds rate plus an agreed upon spread. For the year ended December 31, 2012, the fund’s commitment fee and interest expense were $396 and $0, respectively, and are included in “Miscellaneous” expense in the Statement of Operations.
| (7) | Transactions in Underlying Affiliated Funds – Affiliated Issuers |
An affiliated issuer may be considered one in which the fund owns 5% or more of the outstanding voting securities, or a company which is under common control. For the purposes of this report, the fund assumes the following to be an affiliated issuer:
| Underlying Affiliated Fund | Beginning Shares/Par Amount | Acquisitions Shares/Par Amount | Dispositions Shares/Par Amount | Ending Shares/Par Amount | ||||||||||||
| MFS Institutional Money Market Portfolio | 432,111 | 12,410,789 | (12,635,321 | ) | 207,579 | |||||||||||
| Underlying Affiliated Fund | Realized Gain (Loss) | Capital Gain Distributions | Dividend Income | Ending Value | ||||||||||||
| MFS Institutional Money Market Portfolio | $— | $— | $694 | $207,579 | ||||||||||||
18
Table of Contents
MFS Global Growth Portfolio
REPORT OF INDEPENDENT REGISTERED PUBLIC ACCOUNTING FIRM
To the Board of Trustees of MFS Variable Insurance Trust II and the Shareholders of
MFS Global Growth Portfolio:
We have audited the accompanying statement of assets and liabilities, including the portfolio of investments, of MFS Global Growth Portfolio (the “Fund”) (one of the series comprising MFS Variable Insurance Trust II) as of December 31, 2012, and the related statement of operations for the year then ended, the statements of changes in net assets for each of the two years in the period then ended, and the financial highlights for each of the five years in the period then ended. These financial statements and financial highlights are the responsibility of the Fund’s management. Our responsibility is to express an opinion on these financial statements and financial highlights based on our audits.
We conducted our audits in accordance with the standards of the Public Company Accounting Oversight Board (United States). Those standards require that we plan and perform the audit to obtain reasonable assurance about whether the financial statements and financial highlights are free of material misstatement. The Fund is not required to have, nor were we engaged to perform, an audit of its internal control over financial reporting. Our audits included consideration of internal control over financial reporting as a basis for designing audit procedures that are appropriate in the circumstances, but not for the purpose of expressing an opinion on the effectiveness of the Fund’s internal control over financial reporting. Accordingly, we express no such opinion. An audit also includes examining, on a test basis, evidence supporting the amounts and disclosures in the financial statements, assessing the accounting principles used and significant estimates made by management, as well as evaluating the overall financial statement presentation. Our procedures included confirmation of securities owned as of December 31, 2012, by correspondence with the custodian and brokers; where replies were not received from brokers, we performed other auditing procedures. We believe that our audits provide a reasonable basis for our opinion.
In our opinion, the financial statements and financial highlights referred to above present fairly, in all material respects, the financial position of MFS Global Growth Portfolio as of December 31, 2012, the results of its operations for the year then ended, the changes in its net assets for each of the two years in the period then ended, and the financial highlights for each of the five years in the period then ended, in conformity with accounting principles generally accepted in the United States of America.
DELOITTE & TOUCHE LLP
Boston, Massachusetts
February 15, 2013
19
Table of Contents
MFS Global Growth Portfolio
TRUSTEES AND OFFICERS – IDENTIFICATION AND BACKGROUND
The Trustees and officers of the Trust, as of February 1, 2013, are listed below, together with their principal occupations during the past five years. (Their titles may have varied during that period.) The address of each Trustee and officer is 111 Huntington Avenue, Boston, Massachusetts 02199-7618.
Name, Age | Position(s) with Fund | Trustee/Officer Since (h) | Principal Occupations During the Past Five Years | Other Directorships (j) | ||||
| INTERESTED TRUSTEES | ||||||||
Robert J. Manning (k) (age 49) | Trustee | February 2004 | Massachusetts Financial Services Company, Chairman, Chief Executive Officer and Director; President (until December 2009); Chief Investment Officer (until July 2010) | N/A | ||||
| INDEPENDENT TRUSTEES | ||||||||
David H. Gunning (age 70) | Trustee and Chair of Trustees | January 2004 | Private investor | Lincoln Electric Holdings, Inc. (welding equipment manufacturer), Director; Development Alternatives, Inc. (consulting), Director/Non-Executive Chairman; Portman Limited (mining), Director (until 2008) | ||||
Robert E. Butler (age 71) | Trustee | January 2006 | Consultant – investment company industry regulatory and compliance matters | N/A | ||||
Maureen R. Goldfarb (age 57) | Trustee | January 2009 | Private investor | N/A | ||||
William R. Gutow (age 71) | Trustee | December 1993 | Private investor and real estate consultant; Capitol Entertainment Management Company (video franchise), Vice Chairman | Atlantic Coast Tan (tanning salons), Vice Chairman (until 2007); Texas Donuts (donut franchise), Vice Chairman (until 2010) | ||||
Michael Hegarty (age 68) | Trustee | December 2004 | Private investor; Rouse Properties Inc. (real estate), Director | N/A | ||||
John P. Kavanaugh (age 58) | Trustee | January 2009 | Private investor | N/A | ||||
J. Dale Sherratt (age 74) | Trustee | June 1989 | Insight Resources, Inc. (acquisition planning specialists), President; Wellfleet Investments (investor in health care companies), Managing General Partner | N/A | ||||
| Laurie J. Thomsen (age 55) | Trustee | March 2005 | Private investor; New Profit, Inc. (venture philanthropy), Executive Partner (until 2010) | The Travelers Companies (insurance), Director | ||||
Robert W. Uek (age 71) | Trustee | January 2006 | Consultant to investment company industry | N/A | ||||
| OFFICERS | ||||||||
John M. Corcoran (k) (age 47) | President | October 2008 | Massachusetts Financial Services Company, Senior Vice President (since October 2008); State Street Bank and Trust (financial services provider), Senior Vice President, (until September 2008) | N/A | ||||
| Christopher R. Bohane (k) (age 39) | Assistant Secretary and Assistant Clerk | July 2005 | Massachusetts Financial Services Company, Vice President and Senior Counsel | N/A | ||||
Kino Clark (k) (age 44) | Assistant Treasurer | January 2012 | Massachusetts Financial Services Company, Vice President | N/A | ||||
Thomas H. Connors (k) (age 53) | Assistant Secretary and Assistant Clerk | September 2012 | Massachusetts Financial Services Company, Vice President and Senior Counsel; Deutsche Investment Management Americas Inc. (financial service provider), Director and Senior Counsel (until 2012) | N/A | ||||
Ethan D. Corey (k) (age 49) | Assistant Secretary and Assistant Clerk | July 2005 | Massachusetts Financial Services Company, Senior Vice President and Associate General Counsel | N/A | ||||
20
Table of Contents
MFS Global Growth Portfolio
Trustees and Officers – continued
Name, Age | Position(s) with Fund | Trustee/Officer Since (h) | Principal Occupations During the Past Five Years | Other Directorships (j) | ||||
David L. DiLorenzo (k) (age 44) | Treasurer | July 2005 | Massachusetts Financial Services Company, Senior Vice President | N/A | ||||
Robyn L. Griffin (age 37) | Assistant Independent Chief Compliance Officer | August 2008 | Griffin Compliance LLC (provider of compliance services), Principal (since August 2008); State Street Corporation (financial services provider), Mutual Fund Administration Assistant Vice President (October 2006 – July 2008) | N/A | ||||
Brian E. Langenfeld (k) (age 39) | Assistant Secretary and Assistant Clerk | June 2006 | Massachusetts Financial Services Company, Vice President and Senior Counsel | N/A | ||||
Susan S. Newton (k) (age 62) | Assistant Secretary and Assistant Clerk | May 2005 | Massachusetts Financial Services Company, Senior Vice President and Associate General Counsel | N/A | ||||
Susan A. Pereira (k) (age 42) | Assistant Secretary and Assistant Clerk | July 2005 | Massachusetts Financial Services Company, Vice President and Senior Counsel | N/A | ||||
Kasey L. Phillips (k) (age 42) | Assistant Treasurer | September 2012 | Massachusetts Financial Services Company, Vice President; Wells Fargo Funds Management, LLC, Senior Vice President, Fund Treasurer (until 2012) | N/A | ||||
Mark N. Polebaum (k) (age 60) | Secretary and Clerk | January 2006 | Massachusetts Financial Services Company, Executive Vice President, General Counsel and Secretary | N/A | ||||
Frank L. Tarantino (age 68) | Independent Chief Compliance Officer | June 2004 | Tarantino LLC (provider of compliance services), Principal | N/A | ||||
Richard S. Weitzel (k) (age 42) | Assistant Secretary and Assistant Clerk | October 2007 | Massachusetts Financial Services Company, Senior Vice President and Associate General Counsel | N/A | ||||
James O. Yost (k) (age 52) | Deputy Treasurer | September 1990 | Massachusetts Financial Services Company, Senior Vice President | N/A | ||||
| (h) | Date first appointed to serve as Trustee/officer of an MFS fund. Each Trustee has served continuously since appointment unless indicated otherwise. For the period from December 15, 2004 until February 22, 2005, Mr. Manning served as Advisory Trustee. For the period October 2008, until January 2012, Mr. Corcoran served as Treasurer of the Funds. Prior to January 2012, Messrs. DiLorenzo and Yost served as Assistant Treasurers of the Funds. |
| (j) | Directorships or trusteeships of companies required to report to the Securities and Exchange Commission (i.e., “public companies”). |
| (k) | “Interested person” of the Trust within the meaning of the Investment Company Act of 1940 (referred to as the 1940 Act), which is the principal federal law governing investment companies like the fund, as a result of position with MFS. The address of MFS is 111 Huntington Avenue, Boston, Massachusetts 02199-7618. |
Each Trustee has been elected by shareholders and each Trustee and officer holds office until his or her successor is chosen and qualified or until his or her earlier death, resignation, retirement or removal. The Trust does not hold annual meetings for the purpose of electing Trustees, and Trustees are not elected for fixed terms. Messrs. Butler, Kavanaugh, Uek and Ms. Thomsen are members of the Trust’s Audit Committee.
Each of the Fund’s Trustees and officers holds comparable positions with certain other funds of which MFS or a subsidiary is the investment adviser or distributor, and, in the case of the officers, with certain affiliates of MFS. As of January 1, 2013, the Trustees served as board members of 143 funds within the MFS Family of Funds.
21
Table of Contents
MFS Global Growth Portfolio
Trustees and Officers – continued
The Statement of Additional Information for the Fund includes further information about the Trustees and is available without charge upon request by calling 1-800-225-2606.
Investment Adviser Massachusetts Financial Services Company 111 Huntington Avenue Boston, MA 02199-7618 | Custodian State Street Bank and Trust 1 Lincoln Street Boston, MA 02111-2900 | |
Distributor MFS Fund Distributors, Inc. 111 Huntington Avenue Boston, MA 02199-7618 | Independent Registered Public Accounting Firm Deloitte & Touche LLP 200 Berkeley Street Boston, MA 02116 | |
Portfolio Managers David Antonelli Jeffrey Constantino |
22
Table of Contents
MFS Global Growth Portfolio
BOARD REVIEW OF INVESTMENT ADVISORY AGREEMENT
A discussion regarding the Board’s most recent approval of the fund’s Investment Advisory Agreement with MFS is available by clicking on the fund’s name under “Variable Insurance Portfolios – VIT II” in the “Products” section of the MFS Web site (mfs.com).
PROXY VOTING POLICIES AND INFORMATION
A general description of the MFS funds’ proxy voting policies and procedures is available without charge, upon request, by calling 1-800-225-2606, by visiting the Proxy Voting section of mfs.com or by visiting the SEC’s Web site at http://www.sec.gov.
Information regarding how the fund voted proxies relating to portfolio securities during the most recent twelve-month period ended June 30 is available without charge by visiting the Proxy Voting section of mfs.com or by visiting the SEC’s Web site at http://www.sec.gov.
QUARTERLY PORTFOLIO DISCLOSURE
The fund will file a complete schedule of portfolio holdings with the Securities and Exchange Commission (the Commission) for the first and third quarters of each fiscal year on Form N-Q. The fund’s Form N-Q is available on the EDGAR database on the Commission’s Internet Web site at http://www.sec.gov, and may be reviewed and copied at the:
Public Reference Room
Securities and Exchange Commission
100 F Street, NE, Room 1580
Washington, D.C. 20549
Information on the operation of the Public Reference Room may be obtained by calling the Commission at 1-800-SEC-0330. Copies of the fund’s Form N-Q also may be obtained, upon payment of a duplicating fee, by electronic request at the following e-mail address: publicinfo@sec.gov or by writing the Public Reference Section at the above address.
From time to time, MFS may post important information about the fund or the MFS funds on the MFS web site (mfs.com). This information is available by visiting the “News & Commentary” section of mfs.com or by clicking on the fund’s name under “Variable Insurance Portfolios – VIT II” in the “Products” section of mfs.com.
FEDERAL TAX INFORMATION (unaudited)
The following information is provided pursuant to provisions of the Internal Revenue Code.
For corporate shareholders, 76.78% of the ordinary income dividends paid during the fiscal year qualify for the corporate dividends received deduction.
23
Table of Contents
rev. 3/11

| Why? | Financial companies choose how they share your personal information. Federal law gives consumers the right to limit some but not all sharing. Federal law also requires us to tell you how we collect, share, and protect your personal information. Please read this notice carefully to understand what we do. |
| What? | The types of personal information we collect and share depend on the product or service you have with us. This information can include:
• Social Security number and account balances • Account transactions and transaction history • Checking account information and wire transfer instructions
When you are no longer our customer, we continue to share your information as described in this notice. |
| How? | All financial companies need to share customers’ personal information to run their everyday business. In the section below, we list the reasons financial companies can share their customers’ personal information; the reasons MFS chooses to share; and whether you can limit this sharing. |
| Reasons we can share your personal information | Does MFS share? | Can you limit this sharing? | ||
For our everyday business purposes – such as to process your transactions, maintain your account(s), respond to court orders and legal investigations, or report to credit bureaus | Yes | No | ||
For our marketing purposes – to offer our products and services to you | No | We don’t share | ||
| For joint marketing with other financial companies | No | We don’t share | ||
For our affiliates’ everyday business purposes – information about your transactions and experiences | No | We don’t share | ||
For our affiliates’ everyday business purposes – information about your creditworthiness | No | We don’t share | ||
| For nonaffiliates to market to you | No | We don’t share |
| Questions? | Call 800-225-2606 or go to mfs.com. |
24
Table of Contents
| Page 2 |
| Who we are | ||
| Who is providing this notice? | MFS Funds, MFS Investment Management, MFS Institutional Advisors, Inc., MFS Fund Distributors, Inc., MFS Heritage Trust Company, and MFS Service Center, Inc. | |
| What we do | ||
| How does MFS protect my personal information? | To protect your personal information from unauthorized access and use, we use security measures that comply with federal law. These measures include procedural, electronic, and physical safeguards for the protection of the personal information we collect about you. | |
| How does MFS collect my personal information? | We collect your personal information, for example, when you
• open an account or provide account information • direct us to buy securities or direct us to sell your securities • make a wire transfer
We also collect your personal information from others, such as credit bureaus, affiliates and other companies. | |
| Why can’t I limit all sharing? | Federal law gives you the right to limit only
• sharing for affiliates’ everyday business purposes – information about your creditworthiness • affiliates from using your information to market to you • sharing for nonaffiliates to market to you
State laws and individual companies may give you additional rights to limit sharing. | |
| Definitions | ||
| Affiliates | Companies related by common ownership or control. They can be financial and nonfinancial companies.
•MFS does not share personal information with affiliates, except for everyday business purposes as described on page one of this notice. | |
| Nonaffiliates | Companies not related by common ownership or control. They can be financial and nonfinancial companies.
•MFS does not share with nonaffiliates so they can market to you. | |
| Joint Marketing | A formal agreement between nonaffiliated financial companies that together market financial products or services to you.
•MFS doesn’t jointly market. | |
| Other important information | ||
| If you own an MFS product or receive an MFS service in the name of a third party such as a bank or broker-dealer, their privacy policy may apply to you instead of ours. | ||
25
Table of Contents
Table of Contents
ANNUAL REPORT
December 31, 2012

MFS® BOND PORTFOLIO
MFS® Variable Insurance Trust II

BDS-ANN
Table of Contents
MFS® BOND PORTFOLIO
The report is prepared for the general information of contact owners. It is authorized for distribution to prospective investors only when preceded or accompanied by a current prospectus.
NOT FDIC INSURED Ÿ MAY LOSE VALUE Ÿ NO BANK OR CREDIT UNION GUARANTEE Ÿ NOT A DEPOSIT Ÿ NOT INSURED BY ANY FEDERAL GOVERNMENT AGENCY OR NCUA/NCUSIF
Table of Contents
MFS Bond Portfolio
LETTER FROM THE CHAIRMAN AND CEO

Dear Contract Owners:
The global market outlook for 2013 is one of cautious optimism. While we are seeing some positive economic trends in the United States, Europe and China, the overall environment remains challenging. In the United States, the recent fiscal cliff agreement was received positively by investors, even though it mostly addressed pressing taxation issues and did not resolve additional concerns, including the need for spending cuts and a large-scale reduction of the federal debt. These issues will be front and center again in the spring. Despite the ongoing uncertainty, economic tailwinds are gathering strength as the U.S. housing and job markets are improving and consumer confidence is rising.
Overseas, the debt crisis continues to weigh heavily on eurozone markets, with even Germany — long an economic stalwart — experiencing some contraction. These ongoing challenges could be a drag on global market performance this year. In Asia, manufacturing activity has accelerated in emerging markets such as China and India, and we are seeing signs of stabilized loan growth in China, a leading indicator of that country’s economic health. In contrast, Japan’s economy is contracting sharply under deflationary pressures. Nevertheless, Japanese markets have responded favorably to early actions by the new government, which appears determined to act aggressively, along with the Bank of Japan, to stimulate growth.
As always, managing risk in the face of uncertainty remains a top priority for investors. At MFS®, our uniquely collaborative investment process revolves around global research and our disciplined risk management approach. Our global team of investment professionals shares ideas and evaluates opportunities across continents, investment disciplines and asset classes — all with a goal of building better insights, and ultimately better results, for our clients.
We remain mindful of the many economic challenges investors face today, and believe it is more important than ever to maintain a long-term view, employ time-tested principles, such as asset allocation and diversification, and work closely with investment advisors to identify and pursue the most suitable opportunities.
Respectfully,

Robert J. Manning
Chairman and Chief Executive Officer
MFS Investment Management®
February 15, 2013
The opinions expressed in this letter are subject to change, may not be relied upon for investment advice, and no forecasts can be guaranteed.
1
Table of Contents
MFS Bond Portfolio
Portfolio structure (i)

| Fixed income sectors (i) | ||||
| High Grade Corporates | 72.3% | |||
| High Yield Corporates | 19.1% | |||
| Emerging Markets Bonds | 5.6% | |||
| Commercial Mortgage-Backed Securities | 1.3% | |||
| Collateralized Debt Obligations | 0.7% | |||
| Asset-Backed Securities | 0.1% | |||
| Mortgage-Backed Securities (o) | 0.0% |
| Composition including fixed income credit quality (a)(i) | ||||
| AAA (o) | 0.0% | |||
| AA | 0.8% | |||
| A | 18.1% | |||
| BBB | 59.0% | |||
| BB | 17.1% | |||
| B | 3.7% | |||
| CCC | 0.3% | |||
| C | 0.1% | |||
| Federal Agencies (o) | 0.0% | |||
| Not Rated (o) | 0.0% | |||
| Cash & Other | 0.9% | |||
| Portfolio facts (i) | ||||
| Average Duration (d) | 5.6 | |||
| Average Effective Maturity (m) | 7.8 yrs. | |||
| (a) | For all securities other than those specifically described below, ratings are assigned to underlying securities utilizing ratings from Moody’s, Fitch, and Standard & Poor’s rating agencies and applying the following hierarchy: If all three agencies provide a rating, the middle rating (after dropping the highest and lowest ratings) is assigned; if two of the three agencies rate a security, the lower of the two is assigned. Ratings are shown in the S&P and Fitch scale (e.g., AAA). Securities rated BBB or higher are considered investment grade. All ratings are subject to change. Federal Agencies includes rated and unrated U.S. Agency fixed-income securities, U.S. Agency mortgage-backed securities, and collateralized mortgage obligations of U.S. Agency mortgage-backed securities. Not Rated includes fixed income securities, including fixed income futures contracts, which have not been rated by any rating agency. Cash & Other includes cash, other assets less liabilities, offsets to derivative positions, and short-term securities. The fund may not hold all of these instruments. The fund is not rated by these agencies. |
| (d) | Duration is a measure of how much a bond’s price is likely to fluctuate with general changes in interest rates, e.g., if rates rise 1.00%, a bond with a 5-year duration is likely to lose about 5.00% of its value due to the interest rate move. |
| (i) | For purposes of this presentation, the components include the market value of securities, and reflect the impact of the equivalent exposure of derivative positions, if any. These amounts may be negative from time to time. The bond component will include any accrued interest amounts. Equivalent exposure is a calculated amount that translates the derivative position into a reasonable approximation of the amount of the underlying asset that the portfolio would have to hold at a given point in time to have the same price sensitivity that results from the portfolio’s ownership of the derivative contract. When dealing with derivatives, equivalent exposure is a more representative measure of the potential impact of a position on portfolio performance than market value. Where the fund holds convertible bonds, these are treated as part of the equity portion of the portfolio. |
| (m) | In determining an instrument’s effective maturity for purposes of calculating the fund’s dollar-weighted average effective maturity, MFS uses the instrument’s stated maturity or, if applicable, an earlier date on which MFS believes it is probable that a maturity-shortening device (such as a put, pre-refunding or prepayment) will cause the instrument to be repaid. Such an earlier date can be substantially shorter than the instrument’s stated maturity. |
| (o) | Less than 0.1% |
Percentages are based on net assets as of 12/31/12.
The portfolio is actively managed and current holdings may be different.
2
Table of Contents
MFS Bond Portfolio
Summary of Results
For the twelve months ended December 31, 2012, Initial Class shares of the MFS Bond Portfolio (“fund”) provided a total return of 11.31%, while Service Class shares of the fund provided a total return of 11.00%. These compare with a return of 9.37% over the same period for the fund’s benchmark, the Barclays U.S. Credit Bond Index.
Market Environment
The beginning of the period was characterized by a risk-on sentiment as a result of additional liquidity measures by the Federal Reserve Bank (“Fed”) and the European Central Bank (“ECB”) as well as a commensurate improvement in macroeconomic conditions. During this time, global equity valuations rose, credit spreads contracted, and high-quality sovereign yields increased modestly.
During the middle of the period, however, conditions worsened, driven by broadly weaker global macroeconomic indicators, as well as renewed concerns over the eurozone’s capacity and determination to address its ongoing crisis. Despite this deterioration, broad market sentiment remained relatively resilient as equity markets generally maintained gains and credit spreads did not indicate deterioration.
However, this renewed weakness in the fundamentals precipitated a further round of monetary easing by both the Fed (through a third round of quantitative easing) and the ECB (through a new bond purchase facility) in the second half of the period, which soon instilled additional confidence in risk markets. Nonetheless, towards the end of the period, weaker equity earnings reports and declining forward guidance caused market sentiment to soften. In addition, as we moved toward year end, the fiscal cliff negotiations between the Republicans in the U.S. Congress and President Obama were a particular source of market attention, where uncertainty surrounding the fiscal negotiations continued right up to the end-of-year deadline.
Contributors to Performance
During the reporting period, the portion of the fund’s return derived from yield, which was greater than that of the Barclays U.S. Credit Bond Index, was a key contributor to relative results.
A greater exposure to bonds rated “BBB”(r) and below also benefited relative performance as credit spreads narrowed during the period. Yield curve (y) positioning, particularly a greater exposure to shifts in the middle portion of the yield curve (centered around maturities of 7 years), was another positive factor for the fund’s results as the yield curve flattened during the reporting period.
The fund’s greater exposure to corporate bonds in the financial (which does not include banks) and industrial sectors benefited relative performance as both sectors generated positive relative performance during the period.
Detractors from performance
A lesser exposure to debt securities in the banking, supernational, and telecom sectors hindered relative performance as all three sectors turned in strong results for the reporting period.
Respectfully,
| Richard Hawkins | Robert Persons | |
| Portfolio Manager | Portfolio Manager |
| (r) | Bonds rated “BBB”, “Baa”, or higher are considered investment grade; bonds rated “BB”, “Ba”, or below are considered non-investment grade. The source for bond quality ratings is Moody’s Investors Service, Standard & Poor’s and Fitch, Inc. and are applied using the following hierarchy: If all three agencies provide a rating, the middle rating (after dropping the highest and lowest ratings) is assigned; if two of the three agencies rate a security, the lower of the two is assigned. Ratings are shown in the S&P and Fitch scale (e.g., AAA). For securities which are not rated by any of the three agencies, the security is considered Not Rated. |
| (y) | A yield curve graphically depicts the yields of different maturity bonds of the same credit quality and type; a normal yield curve is upward sloping, with short-term rates lower than long-term rates. |
The views expressed in this report are those of the portfolio managers only through the end of the period of the report as stated on the cover and do not necessarily reflect the views of MFS or any other person in the MFS organization. These views are subject to change at any time based on market or other conditions, and MFS disclaims any responsibility to update such views. These views may not be relied upon as investment advice or an indication of trading intent on behalf of any MFS portfolio. References to specific securities are not recommendations of such securities, and may not be representative of any MFS portfolio’s current or future investments.
3
Table of Contents
MFS Bond Portfolio
PERFORMANCE SUMMARY THROUGH 12/31/12
The following chart illustrates the historical performance of the fund in comparison to its benchmark(s). Benchmarks are unmanaged and may not be invested in directly. Benchmark returns do not reflect any fees or expenses. The performance of other share classes will be greater than or less than that of the class depicted below. (See Notes to Performance Summary.)
Performance data shown represents past performance and is no guarantee of future results. Investment return and principal value fluctuate so your units, when sold, may be worth more or less than the original cost; current performance may be lower or higher than quoted. The performance shown does not reflect the deduction of taxes, if any, that a contract holder would pay on fund distributions or the redemption of contract units. The returns for the fund shown also do not reflect the deduction of expenses associated with variable products, such as mortality and expense risk charges, separate account charges, and sales charges imposed by the insurance company separate accounts. Such expenses would reduce the overall returns shown.
Growth of a Hypothetical $10,000 Investment
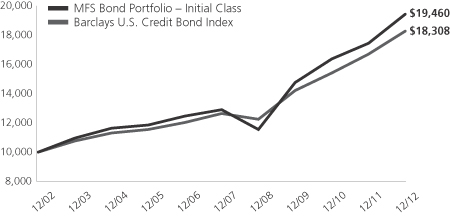
Total Returns through 12/31/12
Average annual total returns
| Share Class | Class inception date | 1-yr | 5-yr | 10-yr | ||||||||
| Initial Class | 5/06/98 | 11.31% | 8.54% | 6.88% | ||||||||
| Service Class | 8/24/01 | 11.00% | 8.27% | 6.61% | ||||||||
| Comparative benchmark | ||||||||||||
| Barclays U.S. Credit Bond Index (f) | 9.37% | 7.65% | 6.23% | |||||||||
| (f) | Source: FactSet Research Systems Inc. |
Benchmark Definition
Barclays U.S. Credit Bond Index – a market capitalization-weighted index that measures the performance of publicly issued, SEC-registered, U.S. corporate and specified foreign debentures and secured notes that meet specified maturity, liquidity, and quality requirements.
It is not possible to invest directly in an index.
Notes to Performance Summary
Average annual total return represents the average annual change in value for each share class for the periods presented.
Performance results reflect any applicable expense subsidies and waivers in effect during the periods shown. Without such subsidies and waivers the fund’s performance results would be less favorable. Please see the prospectus and financial statements for complete details. All results are historical and assume the reinvestment of any dividends and capital gains distributions.
Performance results do not include adjustments made for financial reporting purposes in accordance with U.S. generally accepted accounting principles and may differ from amounts reported in the financial highlights.
From time to time the fund may receive proceeds from litigation settlements, without which performance would be lower.
4
Table of Contents
MFS Bond Portfolio
Fund Expenses Borne by the Contract Holders During the Period,
July 1, 2012 through December 31, 2012
As a contract holder of the fund, you incur ongoing costs, including management fees; distribution and/or service (12b-1) fees; and other fund expenses. This example is intended to help you understand your ongoing costs (in dollars) of investing in the fund and to compare these costs with the ongoing costs of investing in other mutual funds.
The example is based on an investment of $1,000 invested at the beginning of the period and held for the entire period July 1, 2012 through December 31, 2012.
Actual Expenses
The first line for each share class in the following table provides information about actual account values and actual expenses. You may use the information in this line, together with the amount you invested, to estimate the expenses that you paid over the period. Simply divide your account value by $1,000 (for example, an $8,600 account value divided by $1,000 = 8.6), then multiply the result by the number in the first line under the heading entitled “Expenses Paid During Period” to estimate the expenses you paid on your account during this period.
Hypothetical Example for Comparison Purposes
The second line for each share class in the following table provides information about hypothetical account values and hypothetical expenses based on the fund’s actual expense ratio and an assumed rate of return of 5% per year before expenses, which is not the fund’s actual return. The hypothetical account values and expenses may not be used to estimate the actual ending account balance or expenses you paid for the period. You may use this information to compare the ongoing costs of investing in the fund and other funds. To do so, compare this 5% hypothetical example with the 5% hypothetical examples that appear in the shareholder reports of the other funds.
Please note that the expenses shown in the table are meant to highlight the fund’s ongoing costs only and do not take into account the fees and expenses imposed under the variable contracts through which your investment in the fund is made. Therefore, the second line for each share class in the table is useful in comparing ongoing costs associated with an investment in vehicles (such as the fund) which fund benefits under variable annuity and variable life insurance contracts and to qualified pension and retirement plans only, and will not help you determine the relative total costs of investing in the fund through variable annuity and variable life insurance contracts. If the fees and expenses imposed under the variable contracts were included, your costs would have been higher.
| Share Class | Annualized Expense Ratio | Beginning Account Value 7/01/12 | Ending Account Value | Expenses Paid During Period (p) 7/01/12-12/31/12 | ||||||||||||||
| Initial Class | Actual | 0.68% | $1,000.00 | $1,055.26 | $3.51 | |||||||||||||
| Hypothetical (h) | 0.68% | $1,000.00 | $1,021.72 | $3.46 | ||||||||||||||
| Service Class | Actual | 0.93% | $1,000.00 | $1,053.52 | $4.80 | |||||||||||||
| Hypothetical (h) | 0.93% | $1,000.00 | $1,020.46 | $4.72 | ||||||||||||||
| (h) | 5% class return per year before expenses. |
| (p) | Expenses paid are equal to each class’s annualized expense ratio, as shown above, multiplied by the average account value over the period, multiplied by the number of days in the period, divided by the number of days in the year. |
5
Table of Contents
MFS Bond Portfolio
PORTFOLIO OF INVESTMENTS – 12/31/12
The Portfolio of Investments is a complete list of all securities owned by your fund. It is categorized by broad-based asset classes.
| Issuer | Shares/Par | Value ($) | ||||||
| BONDS – 98.0% | ||||||||
| Aerospace – 0.1% | ||||||||
| BE Aerospace, Inc., 5.25%, 2022 | $ | 208,000 | $ | 220,480 | ||||
|
| |||||||
| Airlines – 0.5% | ||||||||
| Continental Airlines, Inc., 7.25%, 2021 | $ | 328,717 | $ | 379,669 | ||||
| Continental Airlines, Inc., FRN, 0.66%, 2013 | 1,233,255 | 1,208,590 | ||||||
|
| |||||||
| $ | 1,588,259 | |||||||
|
| |||||||
| Apparel Manufacturers – 0.7% | ||||||||
| PVH Corp., 7.375%, 2020 | $ | 1,702,000 | $ | 1,908,368 | ||||
| PVH Corp., 4.5%, 2022 | 190,000 | 191,900 | ||||||
|
| |||||||
| $ | 2,100,268 | |||||||
|
| |||||||
| Asset-Backed & Securitized – 2.1% | ||||||||
| Anthracite Ltd., “A”, CDO, FRN, 0.57%, 2019 (z) | $ | 310,927 | $ | 303,900 | ||||
| Bayview Financial Revolving Mortgage Loan Trust, FRN, 1.809%, 2040 (z) | 306,592 | 193,807 | ||||||
| Capital Trust Realty Ltd., CDO, 5.16%, 2035 (n) | 729,588 | 736,593 | ||||||
| Commercial Mortgage Acceptance Corp., FRN, 1.856%, 2030 (i) | 778,155 | 26,322 | ||||||
| Crest Ltd., “A2”, CDO, 4.669%, 2018 (z) | 69,746 | 70,531 | ||||||
| Falcon Franchise Loan LLC, FRN, 6.447%, 2025 (i)(z) | 472,328 | 74,250 | ||||||
| G-Force LLC, CDO, “A2”, 4.83%, 2036 (z) | 530,956 | 533,610 | ||||||
| GMAC LLC, FRN, 6.02%, 2033 (z) | 286,316 | 291,939 | ||||||
| GMAC LLC, FRN, 7.653%, 2034 (d)(n)(q) | 825,000 | 603,719 | ||||||
| Greenwich Capital Commercial Funding Corp., FRN, 5.867%, 2038 | 350,000 | 393,754 | ||||||
| JPMorgan Chase Commercial Mortgage Securities Corp., “A4”, FRN, 5.811%, 2049 | 1,195,039 | 1,393,595 | ||||||
| JPMorgan Chase Commercial Mortgage Securities Corp., FRN, 5.435%, 2042 (n) | 765,072 | 78,397 | ||||||
| KKR Financial CLO Ltd., “C”, FRN, 1.76%, 2021 (n) | 505,395 | 462,436 | ||||||
| Lehman Brothers Commercial Conduit Mortgage Trust, FRN, 1.067%, 2030 (i) | 666,590 | 12,233 | ||||||
| Morgan Stanley Capital I, Inc., FRN, 0.978%, 2030 (i)(n) | 2,109,307 | 44,675 | ||||||
| Prudential Securities Secured Financing Corp., FRN, 7.167%, 2013 (z) | 567,000 | 566,574 | ||||||
| Spirit Master Funding LLC, 5.05%, 2023 (z) | 305,549 | 288,943 | ||||||
|
| |||||||
| $ | 6,075,278 | |||||||
|
| |||||||
| Automotive – 5.8% | ||||||||
| American Honda Finance Corp., 2.125%, 2017 (n) | $ | 1,672,000 | $ | 1,710,795 | ||||
| Delphi Corp., 6.125%, 2021 | 1,271,000 | 1,410,810 | ||||||
| Ford Motor Credit Co. LLC, 8%, 2014 | 1,415,000 | 1,542,898 | ||||||
| Issuer | Shares/Par | Value ($) | ||||||
| BONDS – continued | ||||||||
| Automotive – continued | ||||||||
| Ford Motor Credit Co. LLC, 4.207%, 2016 | $ | 560,000 | $ | 597,305 | ||||
| Ford Motor Credit Co. LLC, 3.984%, 2016 | 638,000 | 677,445 | ||||||
| Harley Davidson Financial Services, 1.15%, 2015 (n) | 607,000 | 608,593 | ||||||
| Harley-Davidson Financial Services, 3.875%, 2016 (n) | 1,061,000 | 1,138,874 | ||||||
| Hyundai Capital America, 2.125%, 2017 (n) | 1,719,000 | 1,731,308 | ||||||
| Lear Corp., 8.125%, 2020 | 2,135,000 | 2,407,213 | ||||||
| Nissan Motor Acceptance Corp., 1.95%, 2017 (n) | 908,000 | 920,405 | ||||||
| TRW Automotive, Inc., 7.25%, 2017 (n) | 1,613,000 | 1,856,966 | ||||||
| Volkswagen International Finance N.V., 1.15%, 2015 (n) | 1,895,000 | 1,897,621 | ||||||
| Volkswagen International Finance N.V., 2.375%, 2017 (n) | 500,000 | 514,990 | ||||||
|
| |||||||
| $ | 17,015,223 | |||||||
|
| |||||||
| Biotechnology – 0.7% | ||||||||
| Life Technologies Corp., 6%, 2020 | $ | 1,727,000 | $ | 2,046,825 | ||||
|
| |||||||
| Broadcasting – 1.2% | ||||||||
| CBS Corp., 8.875%, 2019 | $ | 760,000 | $ | 1,025,058 | ||||
| CBS Corp., 5.75%, 2020 | 440,000 | 527,016 | ||||||
| News America, Inc., 8.5%, 2025 | 770,000 | 1,045,495 | ||||||
| WPP Finance, 8%, 2014 | 366,000 | 404,737 | ||||||
| WPP Finance, 3.625%, 2022 | 404,000 | 401,846 | ||||||
|
| |||||||
| $ | 3,404,152 | |||||||
|
| |||||||
| Brokerage & Asset Managers – 0.4% | ||||||||
| Franklin Resources, Inc., 1.375%, 2017 | $ | 374,000 | $ | 375,853 | ||||
| TD Ameritrade Holding Co., 4.15%, 2014 | 855,000 | 911,217 | ||||||
|
| |||||||
| $ | 1,287,070 | |||||||
|
| |||||||
| Building – 1.2% | ||||||||
| Mohawk Industries, Inc., 6.375%, 2016 | $ | 2,090,000 | $ | 2,351,250 | ||||
| Owens Corning, Inc., 6.5%, 2016 | 451,000 | 506,773 | ||||||
| Owens Corning, Inc., 4.2%, 2022 | 652,000 | 663,074 | ||||||
|
| |||||||
| $ | 3,521,097 | |||||||
|
| |||||||
| Business Services – 0.4% | ||||||||
| Tencent Holdings Ltd., 3.375%, 2018 (n) | $ | 1,273,000 | $ | 1,313,194 | ||||
|
| |||||||
| Cable TV – 3.5% | ||||||||
| CCO Holdings LLC, 5.25%, 2022 | $ | 1,894,000 | $ | 1,917,675 | ||||
| Comcast Corp., 4.65%, 2042 | 628,000 | 661,951 | ||||||
| Cox Communications, Inc., 6.25%, 2018 (n) | 261,000 | 318,875 | ||||||
6
Table of Contents
MFS Bond Portfolio
Portfolio of Investments – continued
| Issuer | Shares/Par | Value ($) | ||||||
| BONDS – continued | ||||||||
| Cable TV – continued | ||||||||
| DIRECTV Holdings LLC, 5.875%, 2019 | $ | 490,000 | $ | 579,154 | ||||
| DIRECTV Holdings LLC, 6.375%, 2041 | 690,000 | 798,483 | ||||||
| DIRECTV Holdings LLC, 5.15%, 2042 | 750,000 | 758,575 | ||||||
| Myriad International Holdings B.V., 6.375%, 2017 (n) | 586,000 | 660,715 | ||||||
| Time Warner Cable, Inc., 8.25%, 2019 | 850,000 | 1,131,126 | ||||||
| Time Warner Cable, Inc., 5%, 2020 | 354,000 | 412,175 | ||||||
| Time Warner Cable, Inc., 4.5%, 2042 | 1,002,000 | 977,197 | ||||||
| Time Warner Entertainment Co. LP, 8.375%, 2033 | 266,000 | 388,219 | ||||||
| Videotron Ltee, 5%, 2022 | 1,555,000 | 1,630,806 | ||||||
|
| |||||||
| $ | 10,234,951 | |||||||
|
| |||||||
| Chemicals – 2.6% | ||||||||
| Ashland, Inc., 4.75%, 2022 (n) | $ | 698,000 | $ | 725,920 | ||||
| CF Industries Holdings, Inc., 7.125%, 2020 | 1,746,000 | 2,197,407 | ||||||
| Dow Chemical Co., 8.55%, 2019 | 936,000 | 1,263,671 | ||||||
| LyondellBasell Industries N.V., 5%, 2019 | 1,614,000 | 1,783,470 | ||||||
| LyondellBasell Industries N.V., 6%, 2021 | 1,256,000 | 1,472,660 | ||||||
|
| |||||||
| $ | 7,443,128 | |||||||
|
| |||||||
| Computer Software – 0.1% | ||||||||
| Seagate Technology HDD Holdings, 6.8%, 2016 | $ | 200,000 | $ | 224,000 | ||||
|
| |||||||
| Conglomerates – 0.8% | ||||||||
| ABB Treasury Center USA, Inc., 4%, 2021 (n) | $ | 313,000 | $ | 346,261 | ||||
| Pentair Finance S.A., 1.35%, 2015 (n) | 702,000 | 701,378 | ||||||
| Roper Industries, Inc., 1.85%, 2017 | 1,171,000 | 1,170,125 | ||||||
|
| |||||||
| $ | 2,217,764 | |||||||
|
| |||||||
| Consumer Products – 0.6% | ||||||||
| Mattel, Inc., 5.45%, 2041 | $ | 630,000 | $ | 711,669 | ||||
| Newell Rubbermaid, Inc., 2.05%, 2017 | 589,000 | 596,833 | ||||||
| Newell Rubbermaid, Inc., 4.7%, 2020 | 501,000 | 553,350 | ||||||
|
| |||||||
| $ | 1,861,852 | |||||||
|
| |||||||
| Consumer Services – 0.8% | ||||||||
| eBay, Inc., 4%, 2042 | $ | 1,160,000 | $ | 1,129,752 | ||||
| Experian Finance PLC, 2.375%, 2017 (n) | 807,000 | 820,993 | ||||||
| Service Corp. International, 7%, 2019 | 450,000 | 492,750 | ||||||
|
| |||||||
| $ | 2,443,495 | |||||||
|
| |||||||
| Containers – 1.5% | ||||||||
| Ball Corp., 5%, 2022 | $ | 576,000 | $ | 616,320 | ||||
| Crown Americas LLC, 7.625%, 2017 | 2,356,000 | 2,488,525 | ||||||
| Greif, Inc., 6.75%, 2017 | 1,136,000 | 1,266,640 | ||||||
|
| |||||||
| $ | 4,371,485 | |||||||
|
| |||||||
| Defense Electronics – 0.6% | ||||||||
| BAE Systems Holdings, Inc., 6.375%, 2019 (n) | $ | 1,358,000 | $ | 1,621,187 | ||||
|
| |||||||
| Electronics – 0.9% | ||||||||
| Intel Corp., 1.35%, 2017 | $ | 1,473,000 | $ | 1,472,574 | ||||
| Jabil Circuit, Inc., 4.7%, 2022 | 399,000 | 419,449 | ||||||
| Issuer | Shares/Par | Value ($) | ||||||
| BONDS – continued | ||||||||
| Electronics – continued | ||||||||
| Tyco Electronics Group S.A., 6.55%, 2017 | $ | 360,000 | $ | 431,680 | ||||
| Tyco Electronics Group S.A., 3.5%, 2022 | 252,000 | 258,996 | ||||||
|
| |||||||
| $ | 2,582,699 | |||||||
|
| |||||||
| Emerging Market Quasi-Sovereign – 1.2% | ||||||||
| CNPC General Capital Ltd., 2.75%, 2017 (z) | $ | 1,559,000 | $ | 1,612,332 | ||||
| Gaz Capital S.A., 8.125%, 2014 (n) | 409,000 | 445,156 | ||||||
| Rosneft, 3.149%, 2017 (z) | 533,000 | 540,995 | ||||||
| Rosneft, 4.199%, 2022 (z) | 885,000 | 900,488 | ||||||
|
| |||||||
| $ | 3,498,971 | |||||||
|
| |||||||
| Energy – Independent – 4.0% | ||||||||
| Anadarko Petroleum Corp., 6.375%, 2017 | $ | 1,337,000 | $ | 1,597,040 | ||||
| Hess Corp., 8.125%, 2019 | 440,000 | 579,087 | ||||||
| Noble Energy, Inc., 4.15%, 2021 | 1,920,000 | 2,119,565 | ||||||
| Pioneer Natural Resources Co., 6.65%, 2017 | 1,100,000 | 1,295,984 | ||||||
| Pioneer Natural Resources Co., 7.5%, 2020 | 1,518,000 | 1,923,320 | ||||||
| Plains Exploration & Production Co., 6.875%, 2023 | 1,200,000 | 1,371,000 | ||||||
| QEP Resources, Inc., 5.375%, 2022 | 259,000 | 277,778 | ||||||
| QEP Resources, Inc., 5.25%, 2023 | 140,000 | 149,800 | ||||||
| Southwestern Energy Co., 7.5%, 2018 | 1,851,000 | 2,268,319 | ||||||
|
| |||||||
| $ | 11,581,893 | |||||||
|
| |||||||
| Energy – Integrated – 0.4% | ||||||||
| Murphy Oil Corp., 2.5%, 2017 | $ | 1,309,000 | $ | 1,317,073 | ||||
|
| |||||||
| Entertainment – 0.3% | ||||||||
| Viacom, Inc., 3.5%, 2017 | $ | 800,000 | $ | 863,282 | ||||
|
| |||||||
| Financial Institutions – 4.2% | ||||||||
| CIT Group, Inc., 4.25%, 2017 | $ | 353,000 | $ | 363,499 | ||||
| CIT Group, Inc., 5.25%, 2018 | 365,000 | 390,550 | ||||||
| CIT Group, Inc., 6.625%, 2018 (n) | 1,900,000 | 2,147,000 | ||||||
| CIT Group, Inc., 5.5%, 2019 (n) | 781,000 | 851,290 | ||||||
| General Electric Capital Corp., 3.75%, 2014 | 413,000 | 435,491 | ||||||
| General Electric Capital Corp., 1.6%, 2017 | 883,000 | 883,573 | ||||||
| General Electric Capital Corp., 5.5%, 2020 | 1,470,000 | 1,740,055 | ||||||
| General Electric Capital Corp., 3.15%, 2022 | 1,000,000 | 1,021,693 | ||||||
| International Lease Finance Corp., 7.125%, 2018 (n) | 570,000 | 661,200 | ||||||
| International Lease Finance Corp., 6.25%, 2019 | 1,147,000 | 1,221,555 | ||||||
| SLM Corp., 6.25%, 2016 | 727,000 | 790,613 | ||||||
| SLM Corp., 6%, 2017 | 1,147,000 | 1,241,628 | ||||||
| SLM Corp., 8%, 2020 | 468,000 | 534,690 | ||||||
|
| |||||||
| $ | 12,282,837 | |||||||
|
| |||||||
| Food & Beverages – 5.3% | ||||||||
| Anheuser-Busch InBev S.A., 7.75%, 2019 | $ | 610,000 | $ | 814,725 | ||||
| Conagra Foods, Inc., 1.35%, 2015 | 307,000 | 306,990 | ||||||
| Constellation Brands, Inc., 7.25%, 2016 | 1,119,000 | 1,292,445 | ||||||
| Constellation Brands, Inc., 4.625%, 2023 | 99,000 | 103,455 | ||||||
| Grupo Bimbo S.A.B. de C.V., 4.5%, 2022 (n) | 1,517,000 | 1,657,797 | ||||||
| Heineken N.V., 1.4%, 2017 (n) | 914,000 | 911,241 | ||||||
| Ingredion, Inc., 1.8%, 2017 | 365,000 | 362,600 | ||||||
| J.M. Smucker Co., 3.5%, 2021 | 880,000 | 934,981 | ||||||
7
Table of Contents
MFS Bond Portfolio
Portfolio of Investments – continued
| Issuer | Shares/Par | Value ($) | ||||||
| BONDS – continued | ||||||||
| Food & Beverages – continued | ||||||||
| Kraft Foods Group, Inc., 2.25%, 2017 (n) | $ | 1,256,000 | $ | 1,299,101 | ||||
| Pernod Ricard S.A., 5.75%, 2021 (n) | 831,000 | 993,982 | ||||||
| SABMiller Holdings, Inc., 3.75%, 2022 (n) | 1,341,000 | 1,448,053 | ||||||
| Smithfield Foods, Inc., 7.75%, 2017 | 1,370,000 | 1,596,050 | ||||||
| Smithfield Foods, Inc., 6.625%, 2022 | 348,000 | 384,540 | ||||||
| Tyson Foods, Inc., 6.6%, 2016 | 2,229,000 | 2,554,311 | ||||||
| Tyson Foods, Inc., 4.5%, 2022 | 598,000 | 647,345 | ||||||
|
| |||||||
| $ | 15,307,616 | |||||||
|
| |||||||
| Food & Drug Stores – 1.2% | ||||||||
| CVS Caremark Corp., 3.25%, 2015 | $ | 296,000 | $ | 313,811 | ||||
| CVS Caremark Corp., 5.75%, 2017 | 324,000 | 387,365 | ||||||
| CVS Caremark Corp., 2.75%, 2022 | 500,000 | 501,861 | ||||||
| CVS Caremark Corp., 5.75%, 2041 | 1,465,000 | 1,824,011 | ||||||
| Walgreen Co., 1.8%, 2017 | 616,000 | 619,433 | ||||||
|
| |||||||
| $ | 3,646,481 | |||||||
|
| |||||||
| Forest & Paper Products – 1.0% | ||||||||
| Fibria Overseas Finance Ltd., 7.5%, 2020 (n) | $ | 274,000 | $ | 304,140 | ||||
| Georgia-Pacific Corp., 5.4%, 2020 (n) | 806,000 | 958,845 | ||||||
| International Paper Co., 6%, 2041 | 860,000 | 1,018,353 | ||||||
| Packaging Corp. of America, 3.9%, 2022 | 712,000 | 737,312 | ||||||
|
| |||||||
| $ | 3,018,650 | |||||||
|
| |||||||
| Gaming & Lodging – 1.0% | ||||||||
| Carnival Corp., 1.875%, 2017 | $ | 435,000 | $ | 435,591 | ||||
| Host Hotels & Resorts, Inc., REIT, 6.75%, 2016 | 1,100,000 | 1,124,750 | ||||||
| Host Hotels & Resorts, Inc., REIT, 4.75%, 2023 | 157,000 | 166,420 | ||||||
| Wyndham Worldwide Corp., 6%, 2016 | 19,000 | 21,488 | ||||||
| Wyndham Worldwide Corp., 4.25%, 2022 | 1,227,000 | 1,266,898 | ||||||
|
| |||||||
| $ | 3,015,147 | |||||||
|
| |||||||
| Insurance – 2.3% | ||||||||
| American International Group, Inc., 3.8%, 2017 | $ | 937,000 | $ | 1,014,147 | ||||
| American International Group, Inc., 6.4%, 2020 | 1,200,000 | 1,488,958 | ||||||
| Metlife, Inc., 1.756%, 2017 | 397,000 | 403,250 | ||||||
| Metropolitan Life Global Funding I, 5.125%, 2014 (n) | 370,000 | 393,347 | ||||||
| Prudential Financial, Inc., 4.75%, 2015 | 631,000 | 691,669 | ||||||
| Swiss Re Ltd., 4.25%, 2042 (n) | 468,000 | 463,757 | ||||||
| Unum Group, 7.125%, 2016 | 500,000 | 589,026 | ||||||
| UnumProvident Corp., 6.85%, 2015 (n) | 1,340,000 | 1,516,097 | ||||||
|
| |||||||
| $ | 6,560,251 | |||||||
|
| |||||||
| Insurance – Health – 1.5% | ||||||||
| CIGNA Corp., 2.75%, 2016 | $ | 1,400,000 | $ | 1,472,722 | ||||
| CIGNA Corp., 5.375%, 2042 | 700,000 | 814,986 | ||||||
| Humana, Inc., 7.2%, 2018 | 1,157,000 | 1,426,726 | ||||||
| Wellpoint, Inc., 1.875%, 2018 | 618,000 | 625,675 | ||||||
|
| |||||||
| $ | 4,340,109 | |||||||
|
| |||||||
| Issuer | Shares/Par | Value ($) | ||||||
| BONDS – continued | ||||||||
| Insurance – Property & Casualty – 2.5% | ||||||||
| AXIS Capital Holdings Ltd., 5.75%, 2014 | $ | 855,000 | $ | 916,962 | ||||
| AXIS Capital Holdings Ltd., 5.875%, 2020 | 190,000 | 215,696 | ||||||
| Chubb Corp., 6.375% to 2017, FRN to 2067 | 279,000 | 304,110 | ||||||
| CNA Financial Corp., 5.875%, 2020 | 1,570,000 | 1,852,294 | ||||||
| Marsh & McLennan Cos., Inc., 4.8%, 2021 | 900,000 | 1,012,720 | ||||||
| XL Group PLC, 5.75%, 2021 | 1,110,000 | 1,318,203 | ||||||
| XL Group PLC, 6.5% to 2017, FRN to 2049 | 663,000 | 619,905 | ||||||
| ZFS Finance USA Trust V, 6.5% to 2017, FRN to 2067 (n) | 896,000 | 955,360 | ||||||
|
| |||||||
| $ | 7,195,250 | |||||||
|
| |||||||
| Machinery & Tools – 0.8% | ||||||||
| Case New Holland, Inc., 7.875%, 2017 | $ | 1,989,000 | $ | 2,351,993 | ||||
|
| |||||||
| Major Banks – 6.6% | ||||||||
| Banco Santander U.S. Debt S.A.U., 3.781%, 2015 (n) | $ | 1,400,000 | $ | 1,407,966 | ||||
| Bank of America Corp., 1.5%, 2015 | 1,820,000 | 1,829,306 | ||||||
| Bank of America Corp., 5.65%, 2018 | 580,000 | 674,797 | ||||||
| Bank of America Corp., 7.625%, 2019 | 500,000 | 639,780 | ||||||
| Bank of America Corp., 5.625%, 2020 | 185,000 | 219,341 | ||||||
| Commonwealth Bank of Australia, 5%, 2019 (n) | 400,000 | 464,840 | ||||||
| Goldman Sachs Group, Inc., 1.6%, 2015 | 1,868,000 | 1,881,126 | ||||||
| Goldman Sachs Group, Inc., 5.625%, 2017 | 1,123,000 | 1,232,130 | ||||||
| JPMorgan Chase & Co., 2%, 2017 | 1,430,000 | 1,460,739 | ||||||
| JPMorgan Chase & Co., 4.25%, 2020 | 893,000 | 993,129 | ||||||
| JPMorgan Chase & Co., 4.5%, 2022 | 500,000 | 565,619 | ||||||
| JPMorgan Chase & Co., 3.25%, 2022 | 904,000 | 930,922 | ||||||
| Merrill Lynch & Co., Inc., 6.15%, 2013 | 500,000 | 508,027 | ||||||
| Merrill Lynch & Co., Inc., 6.05%, 2016 | 349,000 | 384,199 | ||||||
| Morgan Stanley, 5.75%, 2016 | 906,000 | 1,004,363 | ||||||
| PNC Funding Corp., 5.625%, 2017 | 1,095,000 | 1,264,267 | ||||||
| Royal Bank of Scotland PLC, 2.55%, 2015 | 1,054,000 | 1,078,674 | ||||||
| Wachovia Corp., 6.605%, 2025 | 1,270,000 | 1,601,201 | ||||||
| Wells Fargo & Co., 2.625%, 2016 | 919,000 | 969,881 | ||||||
|
| |||||||
| $ | 19,110,307 | |||||||
|
| |||||||
| Medical & Health Technology & Services – 3.1% | ||||||||
| Aristotle Holding, Inc., 3.9%, 2022 (n) | $ | 983,000 | $ | 1,059,922 | ||||
| Davita, Inc., 6.625%, 2020 | 2,018,000 | 2,194,575 | ||||||
| Davita, Inc., 5.75%, 2022 | 352,000 | 370,920 | ||||||
| Fresenius Medical Care AG & Co. KGaA, 9%, 2015 (n) | 1,775,000 | 2,045,688 | ||||||
| Fresenius Medical Care US Finance II, Inc., 6.5%, 2018 (n) | 734,000 | 820,245 | ||||||
| HCA, Inc., 4.75%, 2023 | 1,409,000 | 1,433,658 | ||||||
| McKesson Corp., 5.7%, 2017 | 770,000 | 909,667 | ||||||
| McKesson Corp., 7.5%, 2019 | 120,000 | 156,240 | ||||||
| McKesson Corp., 2.7%, 2022 | 158,000 | 158,052 | ||||||
|
| |||||||
| $ | 9,148,967 | |||||||
|
| |||||||
| Metals & Mining – 1.7% | ||||||||
| Freeport-McMoRan Copper & Gold, Inc., 3.55%, 2022 | $ | 1,076,000 | $ | 1,067,151 | ||||
| Southern Copper Corp., 6.75%, 2040 | 1,764,000 | 2,123,636 | ||||||
8
Table of Contents
MFS Bond Portfolio
Portfolio of Investments – continued
| Issuer | Shares/Par | Value ($) | ||||||
| BONDS – continued | ||||||||
| Metals & Mining – continued | ||||||||
| Vale Overseas Ltd., 5.625%, 2019 | $ | 1,501,000 | $ | 1,706,648 | ||||
|
| |||||||
| $ | 4,897,435 | |||||||
|
| |||||||
| Mortgage – Backed – 0.0% | ||||||||
| Fannie Mae, 7.5%, 2030-2031 | $ | 55,707 | $ | 68,289 | ||||
|
| |||||||
| $ | 68,289 | |||||||
|
| |||||||
| Natural Gas – Distribution – 0.6% | ||||||||
| AmeriGas Finance LLC, 7%, 2022 | $ | 1,448,000 | $ | 1,610,900 | ||||
|
| |||||||
| Natural Gas – Pipeline – 4.3% | ||||||||
| El Paso Pipeline Partners LP, 6.5%, 2020 | $ | 940,000 | $ | 1,146,169 | ||||
| El Paso Pipeline Partners LP, 5%, 2021 | 311,000 | 352,445 | ||||||
| Energy Transfer Partners LP, 8.5%, 2014 | 1,004,000 | 1,091,731 | ||||||
| Energy Transfer Partners LP, 9.7%, 2019 | 213,000 | 286,915 | ||||||
| Enterprise Products Partners LP, 5.65%, 2013 | 354,000 | 357,947 | ||||||
| Enterprise Products Partners LP, 1.25%, 2015 | 758,000 | 762,655 | ||||||
| Enterprise Products Partners LP, 6.3%, 2017 | 540,000 | 653,201 | ||||||
| Enterprise Products Partners LP, 4.45%, 2043 | 473,000 | 478,916 | ||||||
| Enterprise Products Partners LP, 8.375% to 2016, FRN to 2066 | 506,000 | 577,473 | ||||||
| Enterprise Products Partners LP, 7.034% to 2018, FRN to 2068 | 267,000 | 305,715 | ||||||
| Kinder Morgan Energy Partners LP, 5.125%, 2014 | 410,000 | 441,584 | ||||||
| Kinder Morgan Energy Partners LP, 6.85%, 2020 | 370,000 | 466,177 | ||||||
| Kinder Morgan Energy Partners LP, 7.4%, 2031 | 581,000 | 756,705 | ||||||
| Kinder Morgan Energy Partners LP, 5%, 2042 | 470,000 | 498,096 | ||||||
| NiSource Finance Corp., 3.85%, 2023 | 1,106,000 | 1,136,543 | ||||||
| ONEOK Partners LP, 2%, 2017 | 447,000 | 450,715 | ||||||
| Plains All American Pipeline, LP, 3.95%, 2015 | 1,290,000 | 1,389,997 | ||||||
| Spectra Energy Capital LLC, 8%, 2019 | 942,000 | 1,244,080 | ||||||
| Williams Cos., Inc., 3.7%, 2023 | 209,000 | 210,809 | ||||||
|
| |||||||
| $ | 12,607,873 | |||||||
|
| |||||||
| Network & Telecom – 2.0% | ||||||||
| AT&T, Inc., 1.4%, 2017 | $ | 1,463,000 | $ | 1,463,275 | ||||
| AT&T, Inc., 5.55%, 2041 | 1,024,000 | 1,228,927 | ||||||
| CenturyLink, Inc., 7.6%, 2039 | 2,021,000 | 2,097,802 | ||||||
| Verizon Communications, Inc., 6%, 2041 | 690,000 | 900,573 | ||||||
|
| |||||||
| $ | 5,690,577 | |||||||
|
| |||||||
| Oil Services – 0.2% | ||||||||
| Transocean, Inc., 2.5%, 2017 | $ | 569,000 | $ | 574,986 | ||||
|
| |||||||
| Oils – 0.4% | ||||||||
| Phillips 66, 5.875%, 2042 (n) | $ | 255,000 | $ | 306,851 | ||||
| Tesoro Corp., 5.375%, 2022 | 828,000 | 881,820 | ||||||
|
| |||||||
| $ | 1,188,671 | |||||||
|
| |||||||
| Issuer | Shares/Par | Value ($) | ||||||
| BONDS – continued | ||||||||
| Other Banks & Diversified Financials – 3.9% | ||||||||
| American Express Centurion Bank, 5.5%, 2013 | $ | 590,000 | $ | 598,534 | ||||
| American Express Co., 2.65%, 2022 (z) | 368,000 | 366,535 | ||||||
| American Express Credit Corp., 2.375%, 2017 | 745,000 | 779,506 | ||||||
| BB&T Corp., 3.95%, 2016 | 500,000 | 545,226 | ||||||
| BB&T Corp., 1.45%, 2018 | 970,000 | 974,334 | ||||||
| Capital One Financial Corp., 2.15%, 2015 | 700,000 | 714,519 | ||||||
| Capital One Financial Corp., 8.8%, 2019 | 1,000,000 | 1,354,097 | ||||||
| Discover Bank, 7%, 2020 | 1,776,000 | 2,205,252 | ||||||
| Fifth Third Bancorp, 3.5%, 2022 | 673,000 | 705,354 | ||||||
| Santander UK PLC, 3.875%, 2014 (n) | 413,000 | 428,532 | ||||||
| Svenska Handelsbanken AB, 2.875%, 2017 | 767,000 | 810,413 | ||||||
| Swedbank AB, 2.125%, 2017 (n) | 1,238,000 | 1,264,914 | ||||||
| U.S. Bancorp, 2.95%, 2022 | 622,000 | 628,361 | ||||||
|
| |||||||
| $ | 11,375,577 | |||||||
|
| |||||||
| Personal Computers & Peripherals – 0.3% | ||||||||
| Equifax, Inc., 3.3%, 2022 | $ | 849,000 | $ | 842,159 | ||||
|
| |||||||
| Pharmaceuticals – 2.7% | ||||||||
| Celgene Corp., 2.45%, 2015 | $ | 606,000 | $ | 628,851 | ||||
| Celgene Corp., 1.9%, 2017 | 1,583,000 | 1,611,415 | ||||||
| Hospira, Inc., 6.05%, 2017 | 906,000 | 1,051,832 | ||||||
| Mylan Laboratories, Inc., 7.625%, 2017 (n) | 1,977,000 | 2,221,889 | ||||||
| Mylan, Inc., 3.125%, 2023 (z) | 1,000,000 | 991,375 | ||||||
| Teva Pharmaceutical Finance LLC, 2.25%, 2020 | 301,000 | 303,686 | ||||||
| Watson Pharmaceuticals, Inc., 1.875%, 2017 | 320,000 | 324,208 | ||||||
| Watson Pharmaceuticals, Inc., 3.25%, 2022 | 414,000 | 422,631 | ||||||
| Watson Pharmaceuticals, Inc., 4.625%, 2042 | 347,000 | 361,273 | ||||||
|
| |||||||
| $ | 7,917,160 | |||||||
|
| |||||||
| Pollution Control – 0.5% | ||||||||
| Republic Services, Inc., 5.25%, 2021 | $ | 1,160,000 | $ | 1,367,176 | ||||
|
| |||||||
| Precious Metals & Minerals – 0.0% | ||||||||
| Teck Resources Ltd., 3%, 2019 | $ | 68,000 | $ | 70,102 | ||||
|
| |||||||
| Printing & Publishing – 1.3% | ||||||||
| Moody’s Corp., 4.5%, 2022 | $ | 1,328,000 | $ | 1,419,827 | ||||
| Pearson Funding Four PLC, 3.75%, 2022 (n) | 693,000 | 731,177 | ||||||
| Pearson PLC, 5.5%, 2013 (n) | 260,000 | 263,900 | ||||||
| Pearson PLC, 4%, 2016 (n) | 1,320,000 | 1,419,251 | ||||||
|
| |||||||
| $ | 3,834,155 | |||||||
|
| |||||||
| Railroad & Shipping – 0.8% | ||||||||
| Canadian Pacific Railway Co., 7.25%, 2019 | $ | 424,000 | $ | 529,215 | ||||
| Canadian Pacific Railway Co., 4.5%, 2022 | 400,000 | 444,289 | ||||||
| CSX Corp., 7.375%, 2019 | 365,000 | 464,130 | ||||||
| Kansas City Southern, 8%, 2018 | 757,000 | 834,593 | ||||||
|
| |||||||
| $ | 2,272,227 | |||||||
|
| |||||||
| Real Estate – 4.8% | ||||||||
| Boston Properties LP, REIT, 3.7%, 2018 | $ | 754,000 | $ | 819,060 | ||||
| Boston Properties LP, REIT, 3.85%, 2023 | 1,131,000 | 1,188,097 | ||||||
9
Table of Contents
MFS Bond Portfolio
Portfolio of Investments – continued
| Issuer | Shares/Par | Value ($) | ||||||
| BONDS – continued | ||||||||
| Real Estate – continued | ||||||||
| DDR Corp., REIT, 4.625%, 2022 | $ | 362,000 | $ | 395,069 | ||||
| ERP Operating LP, REIT, 4.625%, 2021 | 670,000 | 754,697 | ||||||
| HCP, Inc., REIT, 2.625%, 2020 | 530,000 | 527,931 | ||||||
| HCP, Inc., REIT, 5.375%, 2021 | 1,893,000 | 2,155,665 | ||||||
| Health Care REIT, Inc., 2.25%, 2018 | 826,000 | 825,305 | ||||||
| HRPT Properties Trust, REIT, 6.25%, 2016 | 1,027,000 | 1,126,657 | ||||||
| Simon Property Group LP, REIT, 1.5%, 2018 (z) | 503,000 | 500,161 | ||||||
| Simon Property Group, Inc., REIT, 5.75%, 2015 | 440,000 | 495,635 | ||||||
| Simon Property Group, Inc., REIT, 10.35%, 2019 | 1,026,000 | 1,467,167 | ||||||
| Ventas Realty LP, REIT, 2%, 2018 | 678,000 | 678,438 | ||||||
| Ventas Realty LP, REIT, 4%, 2019 | 343,000 | 368,705 | ||||||
| WEA Finance LLC, REIT, 6.75%, 2019 (n) | 1,447,000 | 1,792,590 | ||||||
| WEA Finance LLC/WT Finance Australia, 3.375%, 2022 (n) | 921,000 | 946,522 | ||||||
|
| |||||||
| $ | 14,041,699 | |||||||
|
| |||||||
| Restaurants – 0.3% | ||||||||
| Darden Restaurants, Inc., 3.35%, 2022 | $ | 914,000 | $ | 884,410 | ||||
|
| |||||||
| Retailers – 3.5% | ||||||||
| AutoZone, Inc., 3.7%, 2022 | $ | 258,000 | $ | 271,236 | ||||
| Dollar General Corp., 4.125%, 2017 | 2,144,000 | 2,251,200 | ||||||
| Gap, Inc., 5.95%, 2021 | 2,613,000 | 2,989,363 | ||||||
| Kohl’s Corp., 4%, 2021 | 1,117,000 | 1,181,328 | ||||||
| Kohl’s Corp., 3.25%, 2023 | 848,000 | 823,375 | ||||||
| Limited Brands, Inc., 7%, 2020 | 1,441,000 | 1,657,150 | ||||||
| Limited Brands, Inc., 5.625%, 2022 | 479,000 | 520,913 | ||||||
| Macy’s Retail Holdings, Inc., 2.875%, 2023 | 435,000 | 425,966 | ||||||
|
| |||||||
| $ | 10,120,531 | |||||||
|
| |||||||
| Specialty Chemicals – 0.7% | ||||||||
| Mexichem S.A.B. de C.V., 6.75%, 2042 (z) | $ | 1,859,000 | $ | 2,086,728 | ||||
|
| |||||||
| Specialty Stores – 0.5% | ||||||||
| Advance Auto Parts, Inc., 5.75%, 2020 | $ | 965,000 | $ | 1,039,770 | ||||
| Advance Auto Parts, Inc., 4.5%, 2022 | 332,000 | 346,611 | ||||||
|
| |||||||
| $ | 1,386,381 | |||||||
|
| |||||||
| Telecommunications – Wireless – 1.9% | ||||||||
| American Tower Corp., REIT, 4.625%, 2015 | $ | 1,770,000 | $ | 1,881,437 | ||||
| American Tower Corp., REIT, 4.5%, 2018 | 1,150,000 | 1,260,646 | ||||||
| Crown Castle International Corp., 5.25%, 2023 (n) | 470,000 | 502,900 | ||||||
| Crown Castle Towers LLC, 6.113%, 2020 (n) | 955,000 | 1,150,281 | ||||||
| Rogers Cable, Inc., 5.5%, 2014 | 364,000 | 385,060 | ||||||
| Vodafone Group PLC, 5.625%, 2017 | 201,000 | 235,864 | ||||||
|
| |||||||
| $ | 5,416,188 | |||||||
|
| |||||||
| Telephone Services – 0.1% | ||||||||
| Oi S.A., 5.75%, 2022 (n) | $ | 276,000 | $ | 287,730 | ||||
|
| |||||||
| Issuer | Shares/Par | Value ($) | ||||||
| BONDS – continued | ||||||||
| Tobacco – 3.2% | ||||||||
| B.A.T. International Finance PLC, 2.125%, 2017 (n) | $ | 1,052,000 | $ | 1,077,942 | ||||
| B.A.T. International Finance PLC, 9.5%, 2018 (n) | 1,048,000 | 1,457,330 | ||||||
| Lorillard Tobacco Co., 2.3%, 2017 | 945,000 | 955,548 | ||||||
| Lorillard Tobacco Co., 8.125%, 2019 | 2,001,000 | 2,553,332 | ||||||
| Reynolds American, Inc., 6.75%, 2017 | 1,100,000 | 1,328,380 | ||||||
| Reynolds American, Inc., 4.75%, 2042 | 1,810,000 | 1,826,069 | ||||||
|
| |||||||
| $ | 9,198,601 | |||||||
|
| |||||||
| Transportation – Services – 0.4% | ||||||||
| ERAC USA Finance Co., 6.375%, 2017 (n) | $ | 200,000 | $ | 241,893 | ||||
| ERAC USA Finance Co., 7%, 2037 (n) | 654,000 | 830,468 | ||||||
|
| |||||||
| $ | 1,072,361 | |||||||
|
| |||||||
| Utilities – Electric Power – 4.0% | ||||||||
| American Electric Power Co., Inc., 1.65%, 2017 | $ | 487,000 | $ | 488,706 | ||||
| Calpine Corp., 7.875%, 2020 (n) | 1,291,000 | 1,449,140 | ||||||
| CenterPoint Energy, Inc., 5.95%, 2017 | 800,000 | 929,409 | ||||||
| CMS Energy Corp., 2.75%, 2014 | 780,000 | 790,998 | ||||||
| CMS Energy Corp., 6.25%, 2020 | 1,010,000 | 1,179,593 | ||||||
| CMS Energy Corp., 5.05%, 2022 | 209,000 | 232,923 | ||||||
| Dominion Resources, Inc., 4.9%, 2041 | 700,000 | 784,339 | ||||||
| Duke Energy Corp., 1.625%, 2017 | 488,000 | 489,275 | ||||||
| Enersis S.A., 7.375%, 2014 | 686,000 | 722,783 | ||||||
| NextEra Energy Capital Co., 1.2%, 2015 | 85,000 | 85,605 | ||||||
| Oncor Electric Delivery Co., 4.1%, 2022 | 1,400,000 | 1,525,905 | ||||||
| PPL Corp., 4.2%, 2022 | 622,000 | 668,900 | ||||||
| PPL WEM Holdings PLC, 5.375%, 2021 (n) | 1,057,000 | 1,188,805 | ||||||
| PSEG Power LLC, 5.32%, 2016 | 288,000 | 325,602 | ||||||
| System Energy Resources, Inc., 5.129%, 2014 (z) | 227,428 | 230,419 | ||||||
| Waterford 3 Funding Corp., 8.09%, 2017 | 487,952 | 503,910 | ||||||
|
| |||||||
| $ | 11,596,312 | |||||||
|
| |||||||
| Total Bonds (Identified Cost, $265,296,996) | $ | 285,219,462 | ||||||
|
| |||||||
| MONEY MARKET FUNDS – 0.9% | ||||||||
| MFS Institutional Money Market Portfolio, 0.16%, at Cost and Net Asset Value (v) | 2,689,612 | $ | 2,689,612 | |||||
|
| |||||||
| Total Investments (Identified Cost, $267,986,608) | $ | 287,909,074 | ||||||
|
| |||||||
| OTHER ASSETS, LESS LIABILITIES – 1.1% | 3,233,140 | |||||||
|
| |||||||
| Net Assets – 100.0% | $ | 291,142,214 | ||||||
|
| |||||||
| (d) | In default. Interest and/or scheduled principal payment(s) have been missed. |
| (i) | Interest only security for which the fund receives interest on notional principal (Par amount). Par amount shown is the notional principal and does not reflect the cost of the security. |
10
Table of Contents
MFS Bond Portfolio
Portfolio of Investments – continued
| (n) | Securities exempt from registration under Rule 144A of the Securities Act of 1933. These securities may be sold in the ordinary course of business in transactions exempt from registration, normally to qualified institutional buyers. At period end, the aggregate value of these securities was $57,181,037, representing 19.6% of net assets. |
| (q) | Interest received was less than stated coupon rate. |
| (v) | Underlying affiliated fund that is available only to investment companies managed by MFS. The rate quoted for the MFS Institutional Money Market Portfolio is the annualized seven-day yield of the fund at period end. |
| (z) | Restricted securities are not registered under the Securities Act of 1933 and are subject to legal restrictions on resale. These securities generally may be resold in transactions exempt from registration or to the public if the securities are subsequently registered. Disposal of these securities may involve time-consuming negotiations and prompt sale at an acceptable price may be difficult. The fund holds the following restricted securities: |
| Restricted Securities | Acquisition Date | Cost | Value | |||||||
| American Express Co., 2.65%, 2022 | 5/27/09-11/27/12 | $369,370 | $366,535 | |||||||
| Anthracite Ltd., “A”, CDO, FRN, 0.57%, 2019 | 1/15/10 | 239,783 | 303,900 | |||||||
| Bayview Financial Revolving Mortgage Loan Trust, FRN, 1.809%, 2040 | 3/01/06 | 306,592 | 193,807 | |||||||
| CNPC General Capital Ltd., 2.75%, 2017 | 4/12/12 | 1,558,878 | 1,612,332 | |||||||
| Crest Ltd., “A2”, CDO, 4.669%, 2018 | 3/02/10 | 59,560 | 70,531 | |||||||
| Falcon Franchise Loan LLC, FRN, 6.447%, 2025 | 1/29/03 | 38,626 | 74,250 | |||||||
| G-Force LLC, CDO, “A2”, 4.83%, 2036 | 1/20/11 | 515,941 | 533,610 | |||||||
| GMAC LLC, FRN, 6.02%, 2033 | 3/20/02 | 157,047 | 291,939 | |||||||
| Mexichem S.A.B. de C.V., 6.75%, 2042 | 9/12/12-10/10/12 | 1,937,311 | 2,086,728 | |||||||
| Mylan, Inc., 3.125%, 2023 | 12/12/12 | 997,935 | 991,375 | |||||||
| Prudential Securities Secured Financing Corp., FRN, 7.167%, 2013 | 12/06/04 | 570,179 | 566,574 | |||||||
| Rosneft, 3.149%, 2017 | 11/29/12 | 533,000 | 540,995 | |||||||
| Rosneft, 4.199%, 2022 | 11/29/12 | 885,000 | 900,488 | |||||||
| Simon Property Group LP, REIT, 1.5%, 2018 | 12/10/12 | 501,428 | 500,161 | |||||||
| Spirit Master Funding LLC, 5.05%, 2023 | 10/04/05 | 303,038 | 288,943 | |||||||
| System Energy Resources, Inc., 5.129%, 2014 | 4/16/04-9/08/04 | 227,492 | 230,419 | |||||||
| Total Restricted Securities | $9,552,587 | |||||||||
| % of Net assets | 3.3% | |||||||||
At December 31, 2012, the fund had cash collateral of $40,000 to cover any commitments for certain derivative contracts. Cash collateral is comprised of “Restricted cash” in the Statement of Assets and Liabilities.
The following abbreviations are used in this report and are defined:
| CDO | Collateralized Debt Obligation |
| CLO | Collateralized Loan Obligation |
| FRN | Floating Rate Note. Interest rate resets periodically and may not be the rate reported at period end. |
| PLC | Public Limited Company |
| REIT | Real Estate Investment Trust |
See Notes to Financial Statements
11
Table of Contents
MFS Bond Portfolio
FINANCIAL STATEMENTS | STATEMENT OF ASSETS AND LIABILITIES
This statement represents your fund’s balance sheet, which details the assets and liabilities comprising the total value of the fund.
At 12/31/12 | ||||||||
Assets | ||||||||
Investments – | ||||||||
Non-affiliated issuers, at value (identified cost, $265,296,996) | $285,219,462 | |||||||
Underlying affiliated funds, at cost and value | 2,689,612 | |||||||
Total investments, at value (identified cost, $267,986,608) | $287,909,074 | |||||||
Cash | 87,983 | |||||||
Restricted cash | 40,000 | |||||||
Receivables for | ||||||||
Investments sold | 529,894 | |||||||
Fund shares sold | 221,269 | |||||||
Interest | 3,367,994 | |||||||
Other assets | 3,465 | |||||||
Total assets | $292,159,679 | |||||||
Liabilities | ||||||||
Payable for fund shares reacquired | $937,946 | |||||||
Payable to affiliates | ||||||||
Investment adviser | 19,667 | |||||||
Distribution and/or service fees | 5,371 | |||||||
Payable for independent Trustees’ compensation | 84 | |||||||
Accrued expenses and other liabilities | 54,397 | |||||||
Total liabilities | $1,017,465 | |||||||
Net assets | $291,142,214 | |||||||
Net assets consist of | ||||||||
Paid-in capital | $255,752,972 | |||||||
Unrealized appreciation (depreciation) on investments | 19,922,466 | |||||||
Accumulated net realized gain (loss) on investments | 3,298,008 | |||||||
Undistributed net investment income | 12,168,768 | |||||||
Net assets | $291,142,214 | |||||||
Shares of beneficial interest outstanding | 23,718,762 |
| Net assets | Shares outstanding | Net asset value per share | ||||||||||
Initial Class | $95,361,337 | 7,715,409 | $12.36 | |||||||||
Service Class | 195,780,877 | 16,003,353 | 12.23 | |||||||||
See Notes to Financial Statements
12
Table of Contents
MFS Bond Portfolio
FINANCIAL STATEMENTS | STATEMENT OF OPERATIONS
This statement describes how much your fund earned in investment income and accrued in expenses. It also describes any gains and/or losses generated by fund operations.
Year ended 12/31/12 | ||||||||
Net investment income | ||||||||
Income | ||||||||
Interest | $13,288,982 | |||||||
Dividends from underlying affiliated funds | 14,605 | |||||||
Total investment income | $13,303,587 | |||||||
Expenses | ||||||||
Management fee | $1,663,310 | |||||||
Distribution and/or service fees | 458,451 | |||||||
Administrative services fee | 49,785 | |||||||
Independent Trustees’ compensation | 12,153 | |||||||
Custodian fee | 35,458 | |||||||
Shareholder communications | 14,490 | |||||||
Audit and tax fees | 62,350 | |||||||
Legal fees | 4,554 | |||||||
Miscellaneous | 34,693 | |||||||
Total expenses | $2,335,244 | |||||||
Fees paid indirectly | (190 | ) | ||||||
Reduction of expenses by investment adviser | (959 | ) | ||||||
Net expenses | $2,334,095 | |||||||
Net investment income | $10,969,492 | |||||||
Realized and unrealized gain (loss) on investments | ||||||||
Realized gain (loss) (identified cost basis) | ||||||||
Investments | $6,848,132 | |||||||
Swap agreements | 9,252 | |||||||
Net realized gain (loss) on investments | $6,857,384 | |||||||
Change in unrealized appreciation (depreciation) | ||||||||
Investments | $10,966,587 | |||||||
Swap agreements | 136,446 | |||||||
Net unrealized gain (loss) on investments | $11,103,033 | |||||||
Net realized and unrealized gain (loss) on investments | $17,960,417 | |||||||
Change in net assets from operations | $28,929,909 |
See Notes to Financial Statements
13
Table of Contents
MFS Bond Portfolio
FINANCIAL STATEMENTS | STATEMENTS OF CHANGES IN NET ASSETS
These statements describe the increases and/or decreases in net assets resulting from operations, any distributions, and any shareholder transactions.
For years ended 12/31 | 2012 | 2011 | ||||||
Change in net assets | ||||||||
From operations | ||||||||
Net investment income | $10,969,492 | $11,853,807 | ||||||
Net realized gain (loss) on investments | 6,857,384 | 5,367,550 | ||||||
Net unrealized gain (loss) on investments | 11,103,033 | (1,643,723 | ) | |||||
Change in net assets from operations | $28,929,909 | $15,577,634 | ||||||
Distributions declared to shareholders | ||||||||
From net investment income | $(13,345,100 | ) | $(12,189,902 | ) | ||||
Change in net assets from fund share transactions | $19,367,944 | $10,240,192 | ||||||
Total change in net assets | $34,952,753 | $13,627,924 | ||||||
Net assets | ||||||||
At beginning of period | 256,189,461 | 242,561,537 | ||||||
At end of period (including undistributed net investment income of $12,168,768 and | $291,142,214 | $256,189,461 |
See Notes to Financial Statements
14
Table of Contents
MFS Bond Portfolio
FINANCIAL STATEMENTS | FINANCIAL HIGHLIGHTS
The financial highlights table is intended to help you understand the fund’s financial performance for the past 5 years. Certain information reflects financial results for a single fund share. The total returns in the table represent the rate by which an investor would have earned (or lost) on an investment in the fund share class (assuming reinvestment of all distributions) held for the entire period.
| Initial Class | Years ended 12/31 | |||||||||||||||||||
| 2012 | 2011 | 2010 | 2009 | 2008 | ||||||||||||||||
Net asset value, beginning of period | $11.67 | $11.49 | $10.84 | $9.11 | $10.89 | |||||||||||||||
| Income (loss) from investment operations | ||||||||||||||||||||
Net investment income (d) | $0.50 | $0.57 | $0.58 | $0.59 | $0.57 | |||||||||||||||
Net realized and unrealized gain (loss) on investments | 0.80 | 0.18 | 0.57 | 1.81 | (1.64 | ) | ||||||||||||||
Total from investment operations | $1.30 | $0.75 | $1.15 | $2.40 | $(1.07 | ) | ||||||||||||||
| Less distributions declared to shareholders | ||||||||||||||||||||
From net investment income | $(0.61 | ) | $(0.57 | ) | $(0.50 | ) | $(0.67 | ) | $(0.71 | ) | ||||||||||
Net asset value, end of period (x) | $12.36 | $11.67 | $11.49 | $10.84 | $9.11 | |||||||||||||||
Total return (%) (k)(r)(s)(x) | 11.31 | 6.63 | 10.86 | 27.96 | (10.53 | ) | ||||||||||||||
Ratios (%) (to average net assets) and Supplemental data: | ||||||||||||||||||||
Expenses before expense reductions (f) | 0.68 | 0.70 | 0.72 | 0.74 | 0.74 | |||||||||||||||
Expenses after expense reductions (f) | 0.68 | N/A | N/A | N/A | N/A | |||||||||||||||
Net investment income | 4.13 | 4.85 | 5.17 | 5.93 | 5.64 | |||||||||||||||
Portfolio turnover | 57 | 55 | 58 | 71 | 46 | |||||||||||||||
Net assets at end of period (000 omitted) | $95,361 | $90,822 | $95,584 | $92,244 | $70,504 | |||||||||||||||
| Service Class | Years ended 12/31 | |||||||||||||||||||
| 2012 | 2011 | 2010 | 2009 | 2008 | ||||||||||||||||
Net asset value, beginning of period | $11.56 | $11.40 | $10.76 | $9.04 | $10.81 | |||||||||||||||
| Income (loss) from investment operations | ||||||||||||||||||||
Net investment income (d) | $0.47 | $0.53 | $0.55 | $0.56 | $0.54 | |||||||||||||||
Net realized and unrealized gain (loss) on investments | 0.78 | 0.18 | 0.57 | 1.80 | (1.63 | ) | ||||||||||||||
Total from investment operations | $1.25 | $0.71 | $1.12 | $2.36 | $(1.09 | ) | ||||||||||||||
| Less distributions declared to shareholders | ||||||||||||||||||||
From net investment income | $(0.58 | ) | $(0.55 | ) | $(0.48 | ) | $(0.64 | ) | $(0.68 | ) | ||||||||||
Net asset value, end of period (x) | $12.23 | $11.56 | $11.40 | $10.76 | $9.04 | |||||||||||||||
Total return (%) (k)(r)(s)(x) | 11.00 | 6.30 | 10.67 | 27.66 | (10.77 | ) | ||||||||||||||
Ratios (%) (to average net assets) and Supplemental data: | ||||||||||||||||||||
Expenses before expense reductions (f) | 0.93 | 0.95 | 0.97 | 0.99 | 0.99 | |||||||||||||||
Expenses after expense reductions (f) | 0.93 | N/A | N/A | N/A | N/A | |||||||||||||||
Net investment income | 3.86 | 4.59 | 4.90 | 5.64 | 5.39 | |||||||||||||||
Portfolio turnover | 57 | 55 | 58 | 71 | 46 | |||||||||||||||
Net assets at end of period (000 omitted) | $195,781 | $165,367 | $146,977 | $96,293 | $52,038 | |||||||||||||||
| (d) | Per share data is based on average shares outstanding. |
| (f) | Ratios do not reflect reductions from fees paid indirectly, if applicable. |
| (k) | The total return does not reflect expenses that apply to separate accounts. Inclusion of these charges would reduce the total return figures for all periods shown. |
| (r) | Certain expenses have been reduced without which performance would have been lower. |
| (s) | From time to time the fund may receive proceeds from litigation settlements, without which performance would be lower. |
| (x) | The net asset values per share and total returns have been calculated on net assets which include adjustments made in accordance with U.S. generally accepted accounting principles required at period end for financial reporting purposes. |
See Notes to Financial Statements
15
Table of Contents
MFS Bond Portfolio
| (1) | Business and Organization |
MFS Bond Portfolio (the fund) is a series of MFS Variable Insurance Trust II (the trust). The trust is organized as a Massachusetts business trust and is registered under the Investment Company Act of 1940, as amended, as an open-end management investment company. The shareholders of each series of the trust are separate accounts of insurance companies, which offer variable annuity and/or life insurance products, and qualified retirement and pension plans.
| (2) | Significant Accounting Policies |
General – The preparation of financial statements in conformity with U.S. generally accepted accounting principles requires management to make estimates and assumptions that affect the reported amounts of assets and liabilities, and disclosure of contingent assets and liabilities at the date of the financial statements and the reported amounts of revenues and expenses during the reporting period. Actual results could differ from those estimates. In the preparation of these financial statements, management has evaluated subsequent events occurring after the date of the fund’s Statement of Assets and Liabilities through the date that the financial statements were issued. The fund invests in high-yield securities rated below investment grade. Investments in high-yield securities involve greater degrees of credit and market risk than investments in higher-rated securities and tend to be more sensitive to economic conditions. The fund invests in foreign securities. Investments in foreign securities are vulnerable to the effects of changes in the relative values of the local currency and the U.S. dollar and to the effects of changes in each country’s legal, political, and economic environment.
In this reporting period the fund adopted Financial Accounting Standards Board (FASB) Accounting Standards Update 2011-04, Fair Value Measurement (Topic 820) – Amendments to Achieve Common Fair Value Measurement and Disclosure Requirements in U.S. GAAP and IFRSs (“ASU 2011-04”). ASU 2011-04 seeks to improve the comparability of fair value measurements as presented and disclosed in financial statements prepared in accordance with U.S. GAAP and International Financial Reporting Standards (IFRS) by providing common requirements for fair value measurement and disclosure.
In December 2011, the FASB issued Accounting Standards Update 2011-11, Balance Sheet (Topic 210) – Disclosures about Offsetting Assets and Liabilities (“ASU 2011-11”). Effective for annual reporting periods beginning on or after January 1, 2013 and interim periods within those annual periods, ASU 2011-11 is intended to enhance disclosure requirements on the offsetting of financial assets and liabilities. Although still evaluating the potential impacts of ASU 2011-11 to the fund, management expects that the impact of the fund’s adoption will be limited to additional financial statement disclosures.
Investment Valuations – Debt instruments and floating rate loans (other than short-term instruments), including restricted debt instruments, are generally valued at an evaluated or composite bid as provided by a third-party pricing service. Short-term instruments with a maturity at issuance of 60 days or less generally are valued at amortized cost, which approximates market value. Swap agreements are generally valued at valuations provided by a third-party pricing service. Open-end investment companies are generally valued at net asset value per share. Securities and other assets generally valued on the basis of information from a third-party pricing service may also be valued at a broker/dealer bid quotation. Values obtained from third-party pricing services can utilize both transaction data and market information such as yield, quality, coupon rate, maturity, type of issue, trading characteristics, and other market data. The values of foreign securities and other assets and liabilities expressed in foreign currencies are converted to U.S. dollars using the mean of bid and asked prices for rates provided by a third-party pricing service.
The Board of Trustees has delegated primary responsibility for determining or causing to be determined the value of the fund’s investments (including any fair valuation) to the adviser pursuant to valuation policies and procedures approved by the Board. If the adviser determines that reliable market quotations are not readily available, investments are valued at fair value as determined in good faith by the adviser in accordance with such procedures under the oversight of the Board of Trustees. Under the fund’s valuation policies and procedures, market quotations are not considered to be readily available for most types of debt instruments and floating rate loans and many types of derivatives. These investments are generally valued at fair value based on information from third-party pricing services. In addition, investments may be valued at fair value if the adviser determines that an investment’s value has been materially affected by events occurring after the close of the exchange or market on which the investment is principally traded (such as foreign exchange or market) and prior to the determination of the fund’s net asset value, or after the halting of trading of a specific security where trading does not resume prior to the close of the exchange or market on which the security is principally traded. The adviser generally relies on third-party pricing services or other information (such as the correlation with price movements of similar securities in the same or other markets; the type, cost and investment characteristics of the security; the business and financial condition of the issuer; and trading and other market data) to assist in determining whether to fair value and at what value to fair value an investment. The value of an investment for purposes of calculating the fund’s net asset value can differ depending on the source and method used to determine value. When fair valuation is used, the value of an investment used to determine the fund’s net asset value may differ from quoted or published prices for the same investment. There can be no assurance that the fund could obtain the fair value assigned to an investment if it were to sell the investment at the same time at which the fund determines its net asset value per share.
16
Table of Contents
MFS Bond Portfolio
Notes to Financial Statements – continued
Various inputs are used in determining the value of the fund’s assets or liabilities. These inputs are categorized into three broad levels. In certain cases, the inputs used to measure fair value may fall into different levels of the fair value hierarchy. In such cases, an investment’s level within the fair value hierarchy is based on the lowest level of input that is significant to the fair value measurement. The fund’s assessment of the significance of a particular input to the fair value measurement in its entirety requires judgment, and considers factors specific to the investment. Level 1 includes unadjusted quoted prices in active markets for identical assets or liabilities. Level 2 includes other significant observable market-based inputs (including quoted prices for similar securities, interest rates, prepayment speed, and credit risk). Level 3 includes unobservable inputs, which may include the adviser’s own assumptions in determining the fair value of investments. The following is a summary of the levels used as of December 31, 2012 in valuing the fund’s assets or liabilities:
| Investments at Value | Level 1 | Level 2 | Level 3 | Total | ||||||||||||
| Non-U.S. Sovereign Debt | $— | $3,498,971 | $— | $3,498,971 | ||||||||||||
| U.S. Corporate Bonds | — | 234,092,643 | — | 234,092,643 | ||||||||||||
| Residential Mortgage-Backed Securities | — | 68,289 | — | 68,289 | ||||||||||||
| Commercial Mortgage-Backed Securities | — | 3,774,401 | — | 3,774,401 | ||||||||||||
| Asset-Backed Securities (including CDOs) | — | 2,300,877 | — | 2,300,877 | ||||||||||||
| Foreign Bonds | — | 41,484,281 | — | 41,484,281 | ||||||||||||
| Mutual Funds | 2,689,612 | — | — | 2,689,612 | ||||||||||||
| Total Investments | $2,689,612 | $285,219,462 | $— | $287,909,074 | ||||||||||||
For further information regarding security characteristics, see the Portfolio of Investments.
Derivatives – The fund uses derivatives for different purposes, primarily to increase or decrease exposure to a particular market or segment of the market, or security, to increase or decrease interest rate or currency exposure, or as alternatives to direct investments. Derivatives are used for hedging or non-hedging purposes. While hedging can reduce or eliminate losses, it can also reduce or eliminate gains. When the fund uses derivatives as an investment to increase market exposure, or for hedging purposes, gains and losses from derivative instruments may be substantially greater than the derivative’s original cost.
The derivative instruments used by the fund were swap agreements. At December 31, 2012, the fund did not have any outstanding derivative instruments.
The following table presents, by major type of derivative contract, the realized gain (loss) on derivatives held by the fund for the year ended December 31, 2012 as reported in the Statement of Operations:
| Risk | Swap Agreements | |||
| Credit | $9,252 | |||
The following table presents, by major type of derivative contract, the change in unrealized appreciation (depreciation) on derivatives held by the fund for the year ended December 31, 2012 as reported in the Statement of Operations:
| Risk | Swap Agreements | |||
| Credit | $136,446 | |||
Derivative counterparty credit risk is managed through formal evaluation of the creditworthiness of all potential counterparties. On certain over-the-counter derivatives, the fund attempts to reduce its exposure to counterparty credit risk whenever possible by entering into an International Swaps and Derivatives Association (ISDA) Master Agreement on a bilateral basis with each of the counterparties with whom it undertakes a significant volume of transactions. The ISDA Master Agreement gives each party to the agreement the right to terminate all transactions traded under such agreement if there is a certain deterioration in the credit quality of the other party. The ISDA Master Agreement gives the fund the right, upon an event of default by the applicable counterparty or a termination of the agreement, to close out all transactions traded under such agreement and to net amounts owed under each transaction to one net amount payable by one party to the other. This right to close out and net payments across all transactions traded under the ISDA Master Agreement could result in a reduction of the fund’s credit risk to such counterparty equal to any amounts payable by the fund under the applicable transactions, if any. However, absent an event of default by the counterparty or a termination of the agreement, the ISDA Master Agreement does not result in an offset of reported amounts of assets and liabilities in the Statement of Assets and Liabilities across transactions between the fund and the applicable counterparty.
Collateral requirements differ by type of derivative. Collateral or margin requirements are set by the broker or exchange clearing house for exchange traded derivatives (i.e., futures contracts and exchange-traded options) while collateral terms are contract specific for over-the-counter traded derivatives (i.e., forward foreign currency exchange contracts, swap agreements and over-the-counter options). For derivatives traded under an ISDA Master Agreement, the collateral requirements are netted across all transactions traded under such agreement and one amount is posted from one party to the other to collateralize such obligations.
17
Table of Contents
MFS Bond Portfolio
Notes to Financial Statements – continued
Cash collateral that has been pledged to cover obligations of the fund under derivative contracts, if any, will be reported separately in the Statement of Assets and Liabilities as “Restricted cash”. Securities collateral pledged for the same purpose, if any, is noted in the Portfolio of Investments.
Swap Agreements – The fund entered into swap agreements. A swap agreement is generally an exchange of cash payments, at specified intervals or upon the occurrence of specified events, between the fund and a counterparty. The net cash payments exchanged are recorded as a realized gain or loss on swap agreements in the Statement of Operations. The value of the swap agreement, which is adjusted daily and includes any related interest accruals to be paid or received by the fund, is recorded in the Statement of Assets and Liabilities. The daily change in value, including any related interest accruals to be paid or received, is recorded as unrealized appreciation or depreciation on swap agreements in the Statement of Operations. Amounts paid or received at the inception of the swap agreement are reflected as premiums paid or received in the Statement of Assets and Liabilities and are amortized using the effective interest method over the term of the agreement. A liquidation payment received or made upon early termination is recorded as a realized gain or loss on swap agreements in the Statement of Operations.
Risks related to swap agreements include the possible lack of a liquid market, unfavorable market and interest rate movements of the underlying instrument and the failure of the counterparty to perform under the terms of the agreements. To address counterparty risk, swap agreements are limited to only highly-rated counterparties. The risk is further mitigated by having an ISDA Master Agreement between the fund and the counterparty providing for netting as described above and by the posting of collateral by the counterparty to the fund to cover the fund’s exposure to the counterparty under such ISDA Master Agreement.
The fund entered into credit default swap agreements in order to manage its exposure to the market or certain sectors of the market, to reduce its credit risk exposure to defaults of corporate and sovereign issuers or to create exposure to corporate or sovereign issuers to which it is not otherwise exposed. In a credit default swap agreement, the protection buyer can make an upfront payment and will make a stream of payments based on a fixed percentage applied to the agreement notional amount to the protection seller in exchange for the right to receive a specified return upon the occurrence of a defined credit event on the reference obligation (which may be either a single security or a basket of securities issued by corporate or sovereign issuers) and, with respect to the rare cases where physical settlement applies, the delivery by the buyer to the seller of a defined deliverable obligation. Although agreement-specific, credit events generally consist of a combination of the following: bankruptcy, failure to pay, restructuring, obligation acceleration, obligation default, or repudiation/moratorium, each as defined in the 2003 ISDA Credit Derivatives Definitions as amended by the relevant agreement. Restructuring is generally not applicable when the reference obligation is issued by a North American corporation and obligation acceleration, obligation default, or repudiation/moratorium are generally only applicable when the reference obligation is issued by a sovereign entity or an entity in an emerging country. Upon determination of the final price for the deliverable obligation (or upon delivery of the deliverable obligation in the case of physical settlement), the difference between the value of the deliverable obligation and the swap agreement’s notional amount is recorded as realized gain or loss on swap agreements in the Statement of Operations.
The fund’s maximum risk of loss from counterparty risk, either as the protection seller or as the protection buyer, is the fair value of the agreement. This risk is mitigated by having an ISDA Master Agreement between the fund and the counterparty providing for netting as described above and by the posting of collateral by the counterparty to the fund to cover the fund’s exposure to the counterparty under such ISDA Master Agreement.
Indemnifications – Under the fund’s organizational documents, its officers and Trustees may be indemnified against certain liabilities and expenses arising out of the performance of their duties to the fund. Additionally, in the normal course of business, the fund enters into agreements with service providers that may contain indemnification clauses. The fund’s maximum exposure under these agreements is unknown as this would involve future claims that may be made against the fund that have not yet occurred.
Investment Transactions and Income – Investment transactions are recorded on the trade date. Interest income is recorded on the accrual basis. All premium and discount is amortized or accreted for financial statement purposes in accordance with U.S. generally accepted accounting principles. Interest payments received in additional securities are recorded on the or ex-interest date in an amount equal to the value of the security on such date. Debt obligations may be placed on non-accrual status or set to accrue at a rate of interest less than the contractual coupon when the collection of all or a portion of interest has become doubtful. Interest income for those debt obligations may be further reduced by the write-off of the related interest receivables when deemed uncollectible.
The fund may receive proceeds from litigation settlements. Any proceeds received from litigation involving portfolio holdings are reflected in the Statement of Operations in realized gain/loss if the security has been disposed of by the fund or in unrealized gain/loss if the security is still held by the fund. Any other proceeds from litigation not related to portfolio holdings are reflected as other income in the Statement of Operations.
18
Table of Contents
MFS Bond Portfolio
Notes to Financial Statements – continued
Fees Paid Indirectly – The fund’s custody fee may be reduced according to an arrangement that measures the value of cash deposited with the custodian by the fund. This amount, for the year ended December 31, 2012, is shown as a reduction of total expenses in the Statement of Operations.
Tax Matters and Distributions – The fund intends to qualify as a regulated investment company, as defined under Subchapter M of the Internal Revenue Code, and to distribute all of its taxable income, including realized capital gains. As a result, no provision for federal income tax is required. The fund’s federal tax returns, when filed, will remain subject to examination by the Internal Revenue Service for a three year period.
Distributions to shareholders are recorded on the ex-dividend date. Income and capital gain distributions are determined in accordance with income tax regulations, which may differ from U.S. generally accepted accounting principles. Certain capital accounts in the financial statements are periodically adjusted for permanent differences in order to reflect their tax character. These adjustments have no impact on net assets or net asset value per share. Temporary differences which arise from recognizing certain items of income, expense, gain or loss in different periods for financial statement and tax purposes will reverse at some time in the future. Distributions in excess of net investment income or net realized gains are temporary overdistributions for financial statement purposes resulting from differences in the recognition or classification of income or distributions for financial statement and tax purposes.
Book/tax differences primarily relate to amortization and accretion of debt securities.
The tax character of distributions declared to shareholders for the last two fiscal years is as follows:
| 12/31/12 | 12/31/11 | |||||||
| Ordinary income (including any short-term capital gains) | $13,345,100 | $12,189,902 | ||||||
The federal tax cost and the tax basis components of distributable earnings were as follows:
| As of 12/31/12 | ||||
| Cost of investments | $269,819,151 | |||
| Gross appreciation | 19,707,113 | |||
| Gross depreciation | (1,617,190 | ) | ||
| Net unrealized appreciation (depreciation) | $18,089,923 | |||
| Undistributed ordinary income | 15,105,469 | |||
| Undistributed long-term capital gain | 2,244,177 | |||
| Other temporary differences | (50,327 | ) |
Multiple Classes of Shares of Beneficial Interest – The fund offers multiple classes of shares, which differ in their respective distribution and/or service fees. The fund’s income, realized and unrealized gain (loss), and common expenses are allocated to shareholders based on the daily net assets of each class. Dividends are declared separately for each class. Differences in per share dividend rates are generally due to differences in separate class expenses. The fund’s distributions declared to shareholders as reported in the Statements of Changes in Net Assets are presented by class as follows:
| From net investment income | ||||||||
| Year ended 12/31/12 | Year ended 12/31/11 | |||||||
| Initial Class | $4,578,734 | $4,438,708 | ||||||
| Service Class | 8,766,366 | 7,751,194 | ||||||
| Total | $13,345,100 | $12,189,902 | ||||||
| (3) | Transactions with Affiliates |
Investment Adviser – The fund has an investment advisory agreement with MFS to provide overall investment management and related administrative services and facilities to the fund. The management fee is computed daily and paid monthly at the following annual rates:
| First $1 billion of average daily net assets | 0.60% | |||
| Average daily net assets in excess of $1 billion | 0.50% |
The management fee incurred for the year ended December 31, 2012 was equivalent to an annual effective rate of 0.60% of the fund’s average daily net assets.
Distributor – MFS Fund Distributors, Inc. (MFD), a wholly-owned subsidiary of MFS, is the distributor of shares of the fund. The Trustees have adopted a distribution plan for the Service Class shares pursuant to Rule 12b-1 under the Investment Company Act of 1940.
19
Table of Contents
MFS Bond Portfolio
Notes to Financial Statements – continued
The fund’s distribution plan provides that the fund will pay MFD distribution and/or service fees equal to 0.25% per annum of its average daily net assets attributable to Service Class shares as partial consideration for services performed and expenses incurred by MFD and financial intermediaries (including participating insurance companies that invest in the fund to fund variable annuity and variable life insurance contracts, sponsors of qualified retirement and pension plans that invest in the fund, and affiliates of these participating insurance companies and plan sponsors) in connection with the sale and distribution of the Service Class shares. MFD may subsequently pay all, or a portion, of the distribution and/or service fees to financial intermediaries.
Shareholder Servicing Agent – MFS Service Center, Inc. (MFSC), a wholly-owned subsidiary of MFS, has contracted to provide transfer agent and recordkeeping functions in connection with the issuance, transfer, and redemption of each class of shares of the fund under a Shareholder Servicing Agent Agreement. During the year ended December 31, 2012, the fund did not pay MFSC a fee for this service. Effective April 1, 2013, the fund will be charged a shareholder servicing fee by MFSC.
Administrator – MFS provides certain financial, legal, shareholder communications, compliance, and other administrative services to the fund. Under an administrative services agreement, the fund partially reimburses MFS the costs incurred to provide these services. The fund is charged an annual fixed amount of $17,500 plus a fee based on average daily net assets. The administrative services fee incurred for the year ended December 31, 2012 was equivalent to an annual effective rate of 0.0180% of the fund’s average daily net assets.
Trustees’ and Officers’ Compensation – The fund pays compensation to independent Trustees in the form of a retainer, attendance fees, and additional compensation to Board and Committee chairpersons. The fund does not pay compensation directly to Trustees or officers of the fund who are also officers of the investment adviser, all of whom receive remuneration for their services to the fund from MFS. Certain officers and Trustees of the fund are officers or directors of MFS, MFD, and MFSC.
Other – This fund and certain other funds managed by MFS (the funds) have entered into services agreements (the Agreements) which provide for payment of fees by the funds to Tarantino LLC and Griffin Compliance LLC in return for the provision of services of an Independent Chief Compliance Officer (ICCO) and Assistant ICCO, respectively, for the funds. The ICCO and Assistant ICCO are officers of the funds and the sole members of Tarantino LLC and Griffin Compliance LLC, respectively. The funds can terminate the Agreements with Tarantino LLC and Griffin Compliance LLC at any time under the terms of the Agreements. For the year ended December 31, 2012, the aggregate fees paid by the fund to Tarantino LLC and Griffin Compliance LLC were $2,233 and are included in “Miscellaneous” expense in the Statement of Operations. MFS has agreed to reimburse the fund for a portion of the payments made by the fund in the amount of $959, which is shown as a reduction of total expenses in the Statement of Operations. Additionally, MFS has agreed to bear all expenses associated with office space, other administrative support, and supplies provided to the ICCO and Assistant ICCO.
The fund invests in the MFS Institutional Money Market Portfolio which is managed by MFS and seeks current income consistent with preservation of capital and liquidity. Income earned on this investment is included in “Dividends from underlying affiliated funds” in the Statement of Operations. This money market fund does not pay a management fee to MFS.
| (4) | Portfolio Securities |
Purchases and sales of investments, other than short-term obligations, were as follows:
| Purchases | Sales | |||||||
| U.S. Government securities | $— | $2,161 | ||||||
| Investments (non-U.S. Government securities) | $170,266,205 | $151,991,621 | ||||||
| (5) | Shares of Beneficial Interest |
The fund’s Declaration of Trust permits the Trustees to issue an unlimited number of full and fractional shares of beneficial interest. Transactions in fund shares were as follows:
| Year ended 12/31/12 | Year ended 12/31/11 | |||||||||||||||
| Shares | Amount | Shares | Amount | |||||||||||||
| Shares sold | ||||||||||||||||
Initial Class | 614,917 | $7,492,743 | 598,989 | $7,091,720 | ||||||||||||
Service Class | 3,732,125 | 45,035,703 | 3,224,003 | 37,338,728 | ||||||||||||
| 4,347,042 | $52,528,446 | 3,822,992 | $44,430,448 | |||||||||||||
| Shares issued to shareholders in reinvestment of distributions | ||||||||||||||||
Initial Class | 383,158 | $4,578,734 | 386,647 | $4,438,708 | ||||||||||||
Service Class | 740,403 | 8,766,366 | 680,526 | 7,751,194 | ||||||||||||
| 1,123,561 | $13,345,100 | 1,067,173 | $12,189,902 | |||||||||||||
20
Table of Contents
MFS Bond Portfolio
Notes to Financial Statements – continued
| Year ended 12/31/12 | Year ended 12/31/11 | |||||||||||||||
| Shares | Amount | Shares | Amount | |||||||||||||
| Shares reacquired | ||||||||||||||||
Initial Class | (1,067,141 | ) | $(12,999,556 | ) | (1,518,031 | ) | $(17,713,423 | ) | ||||||||
Service Class | (2,777,826 | ) | (33,506,046 | ) | (2,492,911 | ) | (28,666,735 | ) | ||||||||
| (3,844,967 | ) | $(46,505,602 | ) | (4,010,942 | ) | $(46,380,158 | ) | |||||||||
| Net change | ||||||||||||||||
Initial Class | (69,066 | ) | $(928,079 | ) | (532,395 | ) | $(6,182,995 | ) | ||||||||
Service Class | 1,694,702 | 20,296,023 | 1,411,618 | 16,423,187 | ||||||||||||
| 1,625,636 | $19,367,944 | 879,223 | $10,240,192 | |||||||||||||
| (6) | Line of Credit |
The fund and certain other funds managed by MFS participate in a $1.1 billion unsecured committed line of credit, subject to a $1 billion sublimit, provided by a syndication of banks under a credit agreement. Borrowings may be made for temporary financing needs. Interest is charged to each fund, based on its borrowings, generally at a rate equal to the higher of the Federal Reserve funds rate or one month LIBOR plus an agreed upon spread. A commitment fee, based on the average daily, unused portion of the committed line of credit, is allocated among the participating funds at the end of each calendar quarter. In addition, the fund and other funds managed by MFS have established unsecured uncommitted borrowing arrangements with certain banks for temporary financing needs. Interest is charged to each fund, based on its borrowings, at a rate equal to the Federal Reserve funds rate plus an agreed upon spread. For the year ended December 31, 2012, the fund’s commitment fee and interest expense were $1,740 and $0, respectively, and are included in “Miscellaneous” expense in the Statement of Operations.
| (7) | Transactions in Underlying Affiliated Funds – Affiliated Issuers |
An affiliated issuer may be considered one in which the fund owns 5% or more of the outstanding voting securities, or a company which is under common control. For the purposes of this report, the fund assumes the following to be an affiliated issuer:
| Underlying Affiliated Fund | Beginning Shares/Par Amount | Acquisitions Shares/Par Amount | Dispositions Shares/Par Amount | Ending Shares/Par Amount | ||||||||||||
| MFS Institutional Money Market Portfolio | 1,192,839 | 124,071,523 | (122,574,750 | ) | 2,689,612 | |||||||||||
| Underlying Affiliated Fund | Realized Gain (Loss) | Capital Gain Distributions | Dividend Income | Ending Value | ||||||||||||
| MFS Institutional Money Market Portfolio | $— | $— | $14,605 | $2,689,612 | ||||||||||||
21
Table of Contents
MFS Bond Portfolio
REPORT OF INDEPENDENT REGISTERED PUBLIC ACCOUNTING FIRM
To the Board of Trustees of MFS Variable Insurance Trust II and the Shareholders of
MFS Bond Portfolio:
We have audited the accompanying statement of assets and liabilities, including the portfolio of investments, of MFS Bond Portfolio (the “Fund”) (one of the series comprising MFS Variable Insurance Trust II) as of December 31, 2012, and the related statement of operations for the year then ended, the statements of changes in net assets for each of the two years in the period then ended, and the financial highlights for each of the five years in the period then ended. These financial statements and financial highlights are the responsibility of the Fund’s management. Our responsibility is to express an opinion on these financial statements and financial highlights based on our audits.
We conducted our audits in accordance with the standards of the Public Company Accounting Oversight Board (United States). Those standards require that we plan and perform the audit to obtain reasonable assurance about whether the financial statements and financial highlights are free of material misstatement. The Fund is not required to have, nor were we engaged to perform, an audit of its internal control over financial reporting. Our audits included consideration of internal control over financial reporting as a basis for designing audit procedures that are appropriate in the circumstances, but not for the purpose of expressing an opinion on the effectiveness of the Fund’s internal control over financial reporting. Accordingly, we express no such opinion. An audit also includes examining, on a test basis, evidence supporting the amounts and disclosures in the financial statements, assessing the accounting principles used and significant estimates made by management, as well as evaluating the overall financial statement presentation. Our procedures included confirmation of securities owned as of December 31, 2012, by correspondence with the custodian. We believe that our audits provide a reasonable basis for our opinion.
In our opinion, the financial statements and financial highlights referred to above present fairly, in all material respects, the financial position of MFS Bond Portfolio as of December 31, 2012, the results of its operations for the year then ended, the changes in its net assets for each of the two years in the period then ended, and the financial highlights for each of the five years in the period then ended, in conformity with accounting principles generally accepted in the United States of America.
DELOITTE & TOUCHE LLP
Boston, Massachusetts
February 15, 2013
22
Table of Contents
MFS Bond Portfolio
TRUSTEES AND OFFICERS – IDENTIFICATION AND BACKGROUND
The Trustees and officers of the Trust, as of February 1, 2013, are listed below, together with their principal occupations during the past five years. (Their titles may have varied during that period.) The address of each Trustee and officer is 111 Huntington Avenue, Boston, Massachusetts 02199-7618.
Name, Age | Position(s) with Fund | Trustee/Officer Since (h) | Principal Occupations During the Past Five Years | Other Directorships (j) | ||||
| INTERESTED TRUSTEES | ||||||||
Robert J. Manning (k) (age 49) | Trustee | February 2004 | Massachusetts Financial Services Company, Chairman, Chief Executive Officer and Director; President (until December 2009); Chief Investment Officer (until July 2010) | N/A | ||||
| INDEPENDENT TRUSTEES | ||||||||
David H. Gunning (age 70) | Trustee and Chair of Trustees | January 2004 | Private investor | Lincoln Electric Holdings, Inc. (welding equipment manufacturer), Director; Development Alternatives, Inc. (consulting), Director/Non-Executive Chairman; Portman Limited (mining), Director (until 2008) | ||||
Robert E. Butler (age 71) | Trustee | January 2006 | Consultant – investment company industry regulatory and compliance matters | N/A | ||||
Maureen R. Goldfarb (age 57) | Trustee | January 2009 | Private investor | N/A | ||||
William R. Gutow (age 71) | Trustee | December 1993 | Private investor and real estate consultant; Capitol Entertainment Management Company (video franchise), Vice Chairman | Atlantic Coast Tan (tanning salons), Vice Chairman (until 2007); Texas Donuts (donut franchise), Vice Chairman (until 2010) | ||||
Michael Hegarty (age 68) | Trustee | December 2004 | Private investor; Rouse Properties Inc. (real estate), Director | N/A | ||||
John P. Kavanaugh (age 58) | Trustee | January 2009 | Private investor | N/A | ||||
J. Dale Sherratt (age 74) | Trustee | June 1989 | Insight Resources, Inc. (acquisition planning specialists), President; Wellfleet Investments (investor in health care companies), Managing General Partner | N/A | ||||
| Laurie J. Thomsen (age 55) | Trustee | March 2005 | Private investor; New Profit, Inc. (venture philanthropy), Executive Partner (until 2010) | The Travelers Companies (insurance), Director | ||||
Robert W. Uek (age 71) | Trustee | January 2006 | Consultant to investment company industry | N/A | ||||
| OFFICERS | ||||||||
John M. Corcoran (k) (age 47) | President | October 2008 | Massachusetts Financial Services Company, Senior Vice President (since October 2008); State Street Bank and Trust (financial services provider), Senior Vice President, (until September 2008) | N/A | ||||
| Christopher R. Bohane (k) (age 39) | Assistant Secretary and Assistant Clerk | July 2005 | Massachusetts Financial Services Company, Vice President and Senior Counsel | N/A | ||||
Kino Clark (k) (age 44) | Assistant Treasurer | January 2012 | Massachusetts Financial Services Company, Vice President | N/A | ||||
Thomas H. Connors (k) (age 53) | Assistant Secretary and Assistant Clerk | September 2012 | Massachusetts Financial Services Company, Vice President and Senior Counsel; Deutsche Investment Management Americas Inc. (financial service provider), Director and Senior Counsel (until 2012) | N/A | ||||
Ethan D. Corey (k) (age 49) | Assistant Secretary and Assistant Clerk | July 2005 | Massachusetts Financial Services Company, Senior Vice President and Associate General Counsel | N/A | ||||
23
Table of Contents
MFS Bond Portfolio
Trustees and Officers – continued
Name, Age | Position(s) with Fund | Trustee/Officer Since (h) | Principal Occupations During the Past Five Years | Other Directorships (j) | ||||
David L. DiLorenzo (k) (age 44) | Treasurer | July 2005 | Massachusetts Financial Services Company, Senior Vice President | N/A | ||||
Robyn L. Griffin (age 37) | Assistant Independent Chief Compliance Officer | August 2008 | Griffin Compliance LLC (provider of compliance services), Principal (since August 2008); State Street Corporation (financial services provider), Mutual Fund Administration Assistant Vice President (October 2006 – July 2008) | N/A | ||||
Brian E. Langenfeld (k) (age 39) | Assistant Secretary and Assistant Clerk | June 2006 | Massachusetts Financial Services Company, Vice President and Senior Counsel | N/A | ||||
Susan S. Newton (k) (age 62) | Assistant Secretary and Assistant Clerk | May 2005 | Massachusetts Financial Services Company, Senior Vice President and Associate General Counsel | N/A | ||||
Susan A. Pereira (k) (age 42) | Assistant Secretary and Assistant Clerk | July 2005 | Massachusetts Financial Services Company, Vice President and Senior Counsel | N/A | ||||
Kasey L. Phillips (k) (age 42) | Assistant Treasurer | September 2012 | Massachusetts Financial Services Company, Vice President; Wells Fargo Funds Management, LLC, Senior Vice President, Fund Treasurer (until 2012) | N/A | ||||
Mark N. Polebaum (k) (age 60) | Secretary and Clerk | January 2006 | Massachusetts Financial Services Company, Executive Vice President, General Counsel and Secretary | N/A | ||||
Frank L. Tarantino (age 68) | Independent Chief Compliance Officer | June 2004 | Tarantino LLC (provider of compliance services), Principal | N/A | ||||
Richard S. Weitzel (k) (age 42) | Assistant Secretary and Assistant Clerk | October 2007 | Massachusetts Financial Services Company, Senior Vice President and Associate General Counsel | N/A | ||||
James O. Yost (k) (age 52) | Deputy Treasurer | September 1990 | Massachusetts Financial Services Company, Senior Vice President | N/A | ||||
| (h) | Date first appointed to serve as Trustee/officer of an MFS fund. Each Trustee has served continuously since appointment unless indicated otherwise. For the period from December 15, 2004 until February 22, 2005, Mr. Manning served as Advisory Trustee. For the period October 2008, until January 2012, Mr. Corcoran served as Treasurer of the Funds. Prior to January 2012, Messrs. DiLorenzo and Yost served as Assistant Treasurers of the Funds. |
| (j) | Directorships or trusteeships of companies required to report to the Securities and Exchange Commission (i.e., “public companies”). |
| (k) | “Interested person” of the Trust within the meaning of the Investment Company Act of 1940 (referred to as the 1940 Act), which is the principal federal law governing investment companies like the fund, as a result of position with MFS. The address of MFS is 111 Huntington Avenue, Boston, Massachusetts 02199-7618. |
Each Trustee has been elected by shareholders and each Trustee and officer holds office until his or her successor is chosen and qualified or until his or her earlier death, resignation, retirement or removal. The Trust does not hold annual meetings for the purpose of electing Trustees, and Trustees are not elected for fixed terms. Messrs. Butler, Kavanaugh, Uek and Ms. Thomsen are members of the Trust’s Audit Committee.
Each of the Fund’s Trustees and officers holds comparable positions with certain other funds of which MFS or a subsidiary is the investment adviser or distributor, and, in the case of the officers, with certain affiliates of MFS. As of January 1, 2013, the Trustees served as board members of 143 funds within the MFS Family of Funds.
24
Table of Contents
MFS Bond Portfolio
Trustees and Officers – continued
The Statement of Additional Information for the Fund includes further information about the Trustees and is available without charge upon request by calling 1-800-225-2606.
Investment Adviser Massachusetts Financial Services Company 111 Huntington Avenue Boston, MA 02199-7618 | Custodian State Street Bank and Trust 1 Lincoln Street Boston, MA 02111-2900 | |
Distributor MFS Fund Distributors, Inc. 111 Huntington Avenue Boston, MA 02199-7618 | Independent Registered Public Accounting Firm Deloitte & Touche LLP 200 Berkeley Street Boston, MA 02116 | |
Portfolio Managers Richard Hawkins Robert Persons |
25
Table of Contents
MFS Bond Portfolio
BOARD REVIEW OF INVESTMENT ADVISORY AGREEMENT
A discussion regarding the Board’s most recent approval of the fund’s Investment Advisory Agreement with MFS is available by clicking on the fund’s name under “Variable Insurance Portfolios – VIT II” in the “Products” section of the MFS Web site (mfs.com).
PROXY VOTING POLICIES AND INFORMATION
A general description of the MFS funds’ proxy voting policies and procedures is available without charge, upon request, by calling 1-800-225-2606, by visiting the Proxy Voting section of mfs.com or by visiting the SEC’s Web site at http://www.sec.gov.
Information regarding how the fund voted proxies relating to portfolio securities during the most recent twelve-month period ended June 30 is available without charge by visiting the Proxy Voting section of mfs.com or by visiting the SEC’s Web site at http://www.sec.gov.
QUARTERLY PORTFOLIO DISCLOSURE
The fund will file a complete schedule of portfolio holdings with the Securities and Exchange Commission (the Commission) for the first and third quarters of each fiscal year on Form N-Q. The fund’s Form N-Q is available on the EDGAR database on the Commission’s Internet Web site at http://www.sec.gov, and may be reviewed and copied at the:
Public Reference Room
Securities and Exchange Commission
100 F Street, NE, Room 1580
Washington, D.C. 20549
Information on the operation of the Public Reference Room may be obtained by calling the Commission at 1-800-SEC-0330. Copies of the fund’s Form N-Q also may be obtained, upon payment of a duplicating fee, by electronic request at the following e-mail address: publicinfo@sec.gov or by writing the Public Reference Section at the above address.
From time to time, MFS may post important information about the fund or the MFS funds on the MFS web site (mfs.com). This information is available by visiting the “News & Commentary” section of mfs.com or by clicking on the fund’s name under “Variable Insurance Portfolios – VIT II” in the “Products” section of mfs.com.
26
Table of Contents
rev. 3/11

| Why? | Financial companies choose how they share your personal information. Federal law gives consumers the right to limit some but not all sharing. Federal law also requires us to tell you how we collect, share, and protect your personal information. Please read this notice carefully to understand what we do. |
| What? | The types of personal information we collect and share depend on the product or service you have with us. This information can include:
• Social Security number and account balances • Account transactions and transaction history • Checking account information and wire transfer instructions
When you are no longer our customer, we continue to share your information as described in this notice. |
| How? | All financial companies need to share customers’ personal information to run their everyday business. In the section below, we list the reasons financial companies can share their customers’ personal information; the reasons MFS chooses to share; and whether you can limit this sharing. |
| Reasons we can share your personal information | Does MFS share? | Can you limit this sharing? | ||
For our everyday business purposes – such as to process your transactions, maintain your account(s), respond to court orders and legal investigations, or report to credit bureaus | Yes | No | ||
For our marketing purposes – to offer our products and services to you | No | We don’t share | ||
| For joint marketing with other financial companies | No | We don’t share | ||
For our affiliates’ everyday business purposes – information about your transactions and experiences | No | We don’t share | ||
For our affiliates’ everyday business purposes – information about your creditworthiness | No | We don’t share | ||
| For nonaffiliates to market to you | No | We don’t share |
| Questions? | Call 800-225-2606 or go to mfs.com. |
27
Table of Contents
| Page 2 |
| Who we are | ||
| Who is providing this notice? | MFS Funds, MFS Investment Management, MFS Institutional Advisors, Inc., MFS Fund Distributors, Inc., MFS Heritage Trust Company, and MFS Service Center, Inc. | |
| What we do | ||
| How does MFS protect my personal information? | To protect your personal information from unauthorized access and use, we use security measures that comply with federal law. These measures include procedural, electronic, and physical safeguards for the protection of the personal information we collect about you. | |
| How does MFS collect my personal information? | We collect your personal information, for example, when you
• open an account or provide account information • direct us to buy securities or direct us to sell your securities • make a wire transfer
We also collect your personal information from others, such as credit bureaus, affiliates and other companies. | |
| Why can’t I limit all sharing? | Federal law gives you the right to limit only
• sharing for affiliates’ everyday business purposes – information about your creditworthiness • affiliates from using your information to market to you • sharing for nonaffiliates to market to you
State laws and individual companies may give you additional rights to limit sharing. | |
| Definitions | ||
| Affiliates | Companies related by common ownership or control. They can be financial and nonfinancial companies.
•MFS does not share personal information with affiliates, except for everyday business purposes as described on page one of this notice. | |
| Nonaffiliates | Companies not related by common ownership or control. They can be financial and nonfinancial companies.
•MFS does not share with nonaffiliates so they can market to you. | |
| Joint Marketing | A formal agreement between nonaffiliated financial companies that together market financial products or services to you.
•MFS doesn’t jointly market. | |
| Other important information | ||
| If you own an MFS product or receive an MFS service in the name of a third party such as a bank or broker-dealer, their privacy policy may apply to you instead of ours. | ||
28
Table of Contents
Table of Contents
ANNUAL REPORT
December 31, 2012

MFS® UTILITIES PORTFOLIO
MFS® Variable Insurance Trust II

UTS-ANN
Table of Contents
MFS® UTILITIES PORTFOLIO
The report is prepared for the general information of contract owners. It is authorized for distribution to prospective investors only when preceded or accompanied by a current prospectus.
NOT FDIC INSURED Ÿ MAY LOSE VALUE Ÿ NO BANK OR CREDIT UNION GUARANTEE Ÿ NOT A DEPOSIT Ÿ NOT INSURED BY ANY FEDERAL GOVERNMENT AGENCY OR NCUA/NCUSIF
Table of Contents
MFS Utilities Portfolio
LETTER FROM THE CHAIRMAN AND CEO

Dear Contract Owners:
The global market outlook for 2013 is one of cautious optimism. While we are seeing some positive economic trends in the United States, Europe and China, the overall environment remains challenging. In the United States, the recent fiscal cliff agreement was received positively by investors, even though it mostly addressed pressing taxation issues and did not resolve additional concerns, including the need for spending cuts and a large-scale reduction of the federal debt. These issues will be front and center again in the spring. Despite the ongoing uncertainty, economic tailwinds are gathering strength as the U.S. housing and job markets are improving and consumer confidence is rising.
Overseas, the debt crisis continues to weigh heavily on eurozone markets, with even Germany — long an economic stalwart — experiencing some contraction. These ongoing challenges could be a drag on global market performance this year. In Asia, manufacturing activity has accelerated in emerging markets such as China and India, and we are seeing signs of stabilized loan growth in China, a leading indicator of that country’s economic health. In contrast, Japan’s economy is contracting sharply under deflationary pressures. Nevertheless, Japanese markets have responded favorably to early actions by the new government, which appears determined to act aggressively, along with the Bank of Japan, to stimulate growth.
As always, managing risk in the face of uncertainty remains a top priority for investors. At MFS®, our uniquely collaborative investment process revolves around global research and our disciplined risk management approach. Our global team of investment professionals shares ideas and evaluates opportunities across continents, investment disciplines and asset classes — all with a goal of building better insights, and ultimately better results, for our clients.
We remain mindful of the many economic challenges investors face today, and believe it is more important than ever to maintain a long-term view, employ time-tested principles, such as asset allocation and diversification, and work closely with investment advisors to identify and pursue the most suitable opportunities.
Respectfully,

Robert J. Manning
Chairman and Chief Executive Officer
MFS Investment Management®
February 15, 2013
The opinions expressed in this letter are subject to change, may not be relied upon for investment advice, and no forecasts can be guaranteed.
1
Table of Contents
MFS Utilities Portfolio
Portfolio structure (i)
| Top ten holdings (i) | ||||
| Comcast Corp., “Special A” | 3.7% | |||
| CMS Energy Corp. | 3.4% | |||
| Kinder Morgan, Inc. | 3.4% | |||
| Virgin Media, Inc. | 3.3% | |||
| Energias de Portugal S.A. | 2.7% | |||
| Edison International | 2.7% | |||
| Calpine Corp. | 2.4% | |||
| NRG Energy, Inc. | 2.3% | |||
| Time Warner Cable, Inc. | 2.3% | |||
| Williams Cos., Inc. | 2.2% |
| Top five industries (i) | ||||
| Utilities – Electric Power | 48.5% | |||
| Cable TV | 13.1% | |||
| Natural Gas-Pipeline | 9.3% | |||
| Telephone Services | 8.3% | |||
| Natural Gas-Distribution | 6.8% |
| Issuer country weightings (i)(x) | ||||
| United States | 68.9% | |||
| Brazil | 6.3% | |||
| Portugal | 4.7% | |||
| Spain | 3.4% | |||
| United Kingdom | 2.7% | |||
| Germany | 1.4% | |||
| France | 1.4% | |||
| Italy | 1.3% | |||
| Netherlands | 1.3% | |||
| Other Countries | 8.6% |
| (i) | For purposes of this presentation, the components include the market value of securities, and reflect the impact of the equivalent exposure of derivative positions, if any. These amounts may be negative from time to time. The bond component will include any accrued interest amounts. Equivalent exposure is a calculated amount that translates the derivative position into a reasonable approximation of the amount of the underlying asset that the portfolio would have to hold at a given point in time to have the same price sensitivity that results from the portfolio’s ownership of the derivative contract. When dealing with derivatives, equivalent exposure is a more representative measure of the potential impact of a position on portfolio performance than market value. Where the fund holds convertible bonds, these are treated as part of the equity portion of the portfolio. |
| (x) | Represents the portfolio’s exposure to issuer countries as a percentage of a portfolio’s net assets. |
Percentages are based on net assets as of 12/31/12.
The portfolio is actively managed and current holdings may be different.
2
Table of Contents
MFS Utilities Portfolio
Summary of Results
For the twelve months ended December 31, 2012, Initial Class shares of the MFS Utilities Portfolio (“fund”) provided a total return of 14.15%, while Service Class shares of the fund provided a total return of 13.92%. These compare with a return of 16.00% over the same period for the fund’s benchmark, the Standard & Poor’s 500 Stock Index, and a return of 1.29% for the fund’s other benchmark, the Standard & Poor’s 500 Utilities Index (“S&P Utilities Index”).
Market Environment
The beginning of the period was characterized by a risk-on sentiment as a result of additional liquidity measures by the Federal Reserve Bank (“Fed”) and the European Central Bank (“ECB”) as well as a commensurate improvement in macroeconomic conditions. During this time, global equity valuations rose, credit spreads contracted, and high-quality sovereign yields increased modestly.
During the middle of the period, however, conditions worsened, driven by broadly weaker global macroeconomic indicators, as well as renewed concerns over the eurozone’s capacity and determination to address its ongoing crisis. Despite this deterioration, broad market sentiment remained relatively resilient as equity markets generally maintained gains and credit spreads did not indicate deterioration.
However, this renewed weakness in the fundamentals precipitated a further round of monetary easing by both the Fed (through a third round of quantitative easing) and the ECB (through a new bond purchase facility) in the second half of the period, which soon instilled additional confidence in risk markets. Nonetheless, towards the end of the period, weaker equity earnings reports and declining forward guidance caused market sentiment to soften. In addition, as we moved toward year end, the fiscal cliff negotiations between the Republicans in the U.S. Congress and President Obama were a particular source of market attention, where uncertainty surrounding the fiscal negotiations continued right up to the end-of-year deadline.
Detractors from Performance
Security selection and an underweight position in the natural gas distribution industry dampened relative performance relative to the S&P Utilities Index. An underweight position in natural gas supplier Sempra Energy negatively impacted relative results as the stock posted strong returns for the reporting period. Despite an oversupply of liquefied natural gas in the U.S., Sempra began to earn commercial shipping contracts to export natural gas overseas, creating the potential to finally reduce the oversupply and allow prices to increase.
Elsewhere, underweight positions in electric power companies, NextEra Energy and American Electric Power, and in diversified energy company DTE Energy weakened relative results as all three stocks outperformed the benchmark during the period. Shares of NextEra traded higher throughout the period as the company experienced steady income growth. Other top relative detractors for the period included the fund’s holdings of cellular communications services firm Cellcom Israel (Israel), wireless communications company NII Holdings (h), wireless and telecommunications provider TIM Participacoes S.A. (Brazil), electric power company Companhia Paranaense de Energia (Brazil), natural gas supplier Williams Partners, and telecommunications services firm Bezeq-The Israeli Telecommunication Corp.
Contributors to Performance
The fund’s exposure to the cable TV industry, which is not represented in the S&P Utilities Index, was a positive factor for relative performance. The fund’s holdings of media and communications services company Virgin Media and cable providers, Comcast, Time Warner, and Kabel Deutschland (Germany), supported relative results as all four stocks generated strong performance over the period. Shares of Virgin Media traded higher during the latter half of the year on the back of strong earnings due to higher-than-expected net subscriptions in its cable segment.
The combination of an underweight position and strong stock selection in the electric power industry contributed to relative performance. An underweight position in electric power generation holding company, Exelon, and not holding shares of poor-performing retail electric company Southern Company, aided relative returns. Exelon’s stock price declined as management announced in November that if power prices did not increase $3-$6 in the next six months they would have to reevaluate its dividend. This risk to the stock’s dividend yield appeared to have negatively impacted its price performance.
The fund’s exposure to the natural gas pipeline industry, which is not represented in the S&P Utilities Index, also benefited relative results. The fund’s holdings of natural gas pipelines operators Williams Co., Kinder Morgan Energy Partners, and El Paso Corp. (h) bolstered relative performance. Shares of Williams Co. traded higher as colder temperatures during the middle of the period appeared to have drawn investors to the company’s shares. Additionally, industry discussions over efforts to export natural gas were encouraging as gas prices remained depressed due to ample supply. El Paso Corp. was spun-off from El Paso Pipeline Partners and was acquired by Kinder Morgan Energy Partners in May. After the acquisition, the El Paso Corp. stock ceased to exist. The fund
3
Table of Contents
MFS Utilities Portfolio
Management Review – continued
continued to hold shares of El Paso Pipeline Partners at the end of the year. Shares of El Paso Corp. performed well as investors appeared to view the acquisition as a positive event for the stock while shares of El Paso Pipeline Partners did not perform as well in comparison.
Elsewhere, the fund’s holding of strong-performing wireless company SBA Communications also supported relative results.
Respectfully,
| Robert Persons | Maura Shaughnessy | |
| Portfolio Manager | Portfolio Manager |
| (h) | Security was not held in the portfolio at period end. |
The views expressed in this report are those of the portfolio managers only through the end of the period of the report as stated on the cover and do not necessarily reflect the views of MFS or any other person in the MFS organization. These views are subject to change at any time based on market or other conditions, and MFS disclaims any responsibility to update such views. These views may not be relied upon as investment advice or an indication of trading intent on behalf of any MFS portfolio. References to specific securities are not recommendations of such securities, and may not be representative of any MFS portfolio’s current or future investments.
4
Table of Contents
MFS Utilities Portfolio
PERFORMANCE SUMMARY THROUGH 12/31/12
The following chart illustrates the historical performance of the fund in comparison to its benchmark(s). Benchmarks are unmanaged and may not be invested in directly. Benchmark returns do not reflect any fees or expenses. The performance of other share classes will be greater than or less than that of the class depicted below. (See Notes to Performance Summary.)
Performance data shown represents past performance and is no guarantee of future results. Investment return and principal value fluctuate so your units, when sold, may be worth more or less than the original cost; current performance may be lower or higher than quoted. The performance shown does not reflect the deduction of taxes, if any, that a contract holder would pay on fund distributions or the redemption of contract units. The returns for the fund shown also do not reflect the deduction of expenses associated with variable products, such as mortality and expense risk charges, separate account charges, and sales charges imposed by the insurance company separate accounts. Such expenses would reduce the overall returns shown.
Growth of a Hypothetical $10,000 Investment
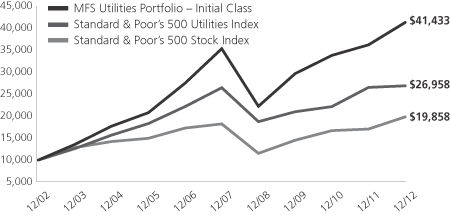
Total Returns through 12/31/12
Average annual total returns
| Share Class | Class inception date | 1-yr | 5-yr | 10-yr | ||||||||
| Initial Class | 11/16/93 | 14.15% | 3.18% | 15.27% | ||||||||
| Service Class | 8/24/01 | 13.92% | 2.93% | 14.99% | ||||||||
| Comparative benchmarks | ||||||||||||
| Standard & Poor’s 500 Stock Index (f) | 16.00% | 1.66% | 7.10% | |||||||||
| Standard & Poor’s 500 Utilities Index (f) | 1.29% | 0.36% | 10.43% | |||||||||
| (f) | Source: FactSet Research Systems Inc. |
Benchmark Definitions
Standard & Poor’s 500 Stock Index – a market capitalization-weighted index of 500 widely held equity securities, designed to measure broad U.S. equity performance.
Standard & Poor’s 500 Utilities Index – a market capitalization-weighted index designed to measure the utilities sector, including those companies considered electric, gas or water utilities, or companies that operate as independent producers and/or distributors of power.
It is not possible to invest directly in an index.
Notes to Performance Summary
Average annual total return represents the average annual change in value for each share class for the periods presented.
Performance results reflect any applicable expense subsidies and waivers in effect during the periods shown. Without such subsidies and waivers the fund’s performance results would be less favorable. Please see the prospectus and financial statements for complete details. All results are historical and assume the reinvestment of any dividends and capital gains distributions.
Performance results do not include adjustments made for financial reporting purposes in accordance with U.S. generally accepted accounting principles and may differ from amounts reported in the financial highlights.
From time to time the fund may receive proceeds from litigation settlements, without which performance would be lower.
5
Table of Contents
MFS Utilities Portfolio
Fund Expenses Borne by the Contract Holders During the Period,
July 1, 2012 through December 31, 2012
As a contract holder of the fund, you incur ongoing costs, including management fees; distribution and/or service (12b-1) fees; and other fund expenses. This example is intended to help you understand your ongoing costs (in dollars) of investing in the fund and to compare these costs with the ongoing costs of investing in other mutual funds.
The example is based on an investment of $1,000 invested at the beginning of the period and held for the entire period July 1, 2012 through December 31, 2012.
Actual Expenses
The first line for each share class in the following table provides information about actual account values and actual expenses. You may use the information in this line, together with the amount you invested, to estimate the expenses that you paid over the period. Simply divide your account value by $1,000 (for example, an $8,600 account value divided by $1,000 = 8.6), then multiply the result by the number in the first line under the heading entitled “Expenses Paid During Period” to estimate the expenses you paid on your account during this period.
Hypothetical Example for Comparison Purposes
The second line for each share class in the following table provides information about hypothetical account values and hypothetical expenses based on the fund’s actual expense ratio and an assumed rate of return of 5% per year before expenses, which is not the fund’s actual return. The hypothetical account values and expenses may not be used to estimate the actual ending account balance or expenses you paid for the period. You may use this information to compare the ongoing costs of investing in the fund and other funds. To do so, compare this 5% hypothetical example with the 5% hypothetical examples that appear in the shareholder reports of the other funds.
Please note that the expenses shown in the table are meant to highlight the fund’s ongoing costs only and do not take into account the fees and expenses imposed under the variable contracts through which your investment in the fund is made. Therefore, the second line for each share class in the table is useful in comparing ongoing costs associated with an investment in vehicles (such as the fund) which fund benefits under variable annuity and variable life insurance contracts and to qualified pension and retirement plans only, and will not help you determine the relative total costs of investing in the fund through variable annuity and variable life insurance contracts. If the fees and expenses imposed under the variable contracts were included, your costs would have been higher.
| Share Class | Annualized Expense Ratio | Beginning Account Value 7/01/12 | Ending Account Value | Expenses Paid During Period (p) 7/01/12-12/31/12 | ||||||||||||||
| Initial Class | Actual | 0.84% | $1,000.00 | $1,085.64 | $4.40 | |||||||||||||
| Hypothetical (h) | 0.84% | $1,000.00 | $1,020.91 | $4.27 | ||||||||||||||
| Service Class | Actual | 1.09% | $1,000.00 | $1,084.75 | $5.71 | |||||||||||||
| Hypothetical (h) | 1.09% | $1,000.00 | $1,019.66 | $5.53 | ||||||||||||||
| (h) | 5% class return per year before expenses. |
| (p) | Expenses paid are equal to each class’s annualized expense ratio, as shown above, multiplied by the average account value over the period, multiplied by the number of days in the period, divided by the number of days in the year. |
6
Table of Contents
MFS Utilities Portfolio
PORTFOLIO OF INVESTMENTS – 12/31/12
The Portfolio of Investments is a complete list of all securities owned by your fund. It is categorized by broad-based asset classes.
| Issuer | Shares/Par | Value ($) | ||||||
| COMMON STOCKS – 93.1% | ||||||||
| Broadcasting – 0.1% | ||||||||
| News Corp., “A” | 6,150 | $ | 157,070 | |||||
|
| |||||||
| Cable TV – 12.9% | ||||||||
| Astro Malaysia Holdings Bhd. | 1,622,600 | $ | 1,591,824 | |||||
| Charter Communications, Inc., “A” (a) | 12,600 | 960,623 | ||||||
| Comcast Corp., “Special A” | 307,790 | 11,065,050 | ||||||
| Kabel Deutschland Holding AG | 30,509 | 2,281,411 | ||||||
| Liberty Global, Inc., “A” (a) | 33,950 | 2,138,510 | ||||||
| Time Warner Cable, Inc. | 68,369 | 6,644,782 | ||||||
| Virgin Media, Inc. | 263,970 | 9,700,898 | ||||||
| Ziggo N.V. | 115,790 | 3,742,211 | ||||||
|
| |||||||
| $ | 38,125,309 | |||||||
|
| |||||||
| Energy – Independent – 4.3% | ||||||||
| Cabot Oil & Gas Corp. | 28,910 | $ | 1,437,983 | |||||
| Energen Corp. | 37,720 | 1,700,795 | ||||||
| EQT Corp. | 73,550 | 4,337,979 | ||||||
| Noble Energy, Inc. | 14,570 | 1,482,352 | ||||||
| QEP Resources, Inc. | 92,490 | 2,799,672 | ||||||
| WPX Energy, Inc. (a) | 66,404 | 988,092 | ||||||
|
| |||||||
| $ | 12,746,873 | |||||||
|
| |||||||
| Natural Gas – Distribution – 6.9% | ||||||||
| AGL Energy Ltd. | 39,970 | $ | 641,867 | |||||
| AGL Resources, Inc. | 11,610 | 464,052 | ||||||
| Atmos Energy Corp. | 9,370 | 329,074 | ||||||
| China Resources Gas Group Ltd. | 62,000 | 128,235 | ||||||
| Gas Natural SDG S.A. | 8,630 | 157,807 | ||||||
| GDF SUEZ | 161,637 | 3,322,971 | ||||||
| NiSource, Inc. | 157,290 | 3,914,948 | ||||||
| ONEOK, Inc. | 58,610 | 2,505,578 | ||||||
| Sempra Energy | 51,360 | 3,643,478 | ||||||
| Spectra Energy Corp. | 186,110 | 5,095,692 | ||||||
|
| |||||||
| $ | 20,203,702 | |||||||
|
| |||||||
| Natural Gas – Pipeline – 9.3% | ||||||||
| APA Group | 60,748 | $ | 350,655 | |||||
| Cheniere Energy, Inc. (a) | 23,410 | 439,640 | ||||||
| El Paso Pipeline Partners LP | 12,970 | 479,501 | ||||||
| Enagas S.A. | 194,040 | 4,152,275 | ||||||
| Enbridge, Inc. | 32,580 | 1,409,060 | ||||||
| Kinder Morgan, Inc. | 280,556 | 9,912,043 | ||||||
| TransCanada Corp. | 12,640 | 597,500 | ||||||
| Williams Cos., Inc. | 198,077 | 6,485,041 | ||||||
| Williams Partners LP | 75,960 | 3,696,214 | ||||||
|
| |||||||
| $ | 27,521,929 | |||||||
|
| |||||||
| Telecommunications – Wireless – 5.7% | ||||||||
| American Tower Corp., REIT | 31,270 | $ | 2,416,233 | |||||
| Cellcom Israel Ltd. | 97,202 | 804,833 | ||||||
| Mobile TeleSystems OJSC, ADR | 171,600 | 3,200,340 | ||||||
| SBA Communications Corp. (a) | 29,720 | 2,110,714 | ||||||
| Telefonica Deutschland Holding AG (a) | 98,930 | 753,985 | ||||||
| TIM Participacoes S.A., ADR | 165,427 | 3,278,763 | ||||||
| Issuer | Shares/Par | Value ($) | ||||||
| COMMON STOCKS – continued | ||||||||
| Telecommunications – Wireless – continued | ||||||||
| Turkcell Iletisim Hizmetleri A.S. (a) | 215,930 | $ | 1,398,016 | |||||
| Vodafone Group PLC | 1,114,027 | 2,801,629 | ||||||
|
| |||||||
| $ | 16,764,513 | |||||||
|
| |||||||
| Telephone Services – 8.3% | ||||||||
| Bezeq – The Israel Telecommunication Corp. Ltd. | 1,987,250 | $ | 2,294,916 | |||||
| BT Group PLC | 228,280 | 860,500 | ||||||
| CenturyLink, Inc. | 54,795 | 2,143,580 | ||||||
| China Unicom (Hong Kong) Ltd. | 268,000 | 434,566 | ||||||
| Empresa Nacional de Telecomunicaciones S.A. | 60,074 | 1,242,249 | ||||||
| Frontier Communications Corp. (l) | 245,760 | 1,051,853 | ||||||
| Portugal Telecom, SGPS, S.A. | 129,475 | 647,668 | ||||||
| PT XL Axiata Tbk | 2,323,000 | 1,379,403 | ||||||
| TDC A.S. | 485,041 | 3,435,954 | ||||||
| Telecom Italia S.p.A. | 4,828,124 | 3,820,507 | ||||||
| Telefonica Brasil S.A., ADR | 97,916 | 2,355,859 | ||||||
| Verizon Communications, Inc. | 73,930 | 3,198,951 | ||||||
| Windstream Corp. (l) | 195,880 | 1,621,886 | ||||||
|
| |||||||
| $ | 24,487,892 | |||||||
|
| |||||||
| Utilities – Electric Power – 44.1% | ||||||||
| AES Corp. | 482,230 | $ | 5,159,861 | |||||
| AES Gener S.A. | 163,330 | 105,415 | ||||||
| Alliant Energy Corp. | 3,300 | 144,903 | ||||||
| American Electric Power Co., Inc. | 101,920 | 4,349,946 | ||||||
| Calpine Corp. (a) | 383,640 | 6,955,393 | ||||||
| CenterPoint Energy, Inc. | 153,380 | 2,952,565 | ||||||
| CEZ A.S. | 58,749 | 2,101,678 | ||||||
| Cheung Kong Infrastructure Holdings Ltd. | 7,000 | 43,001 | ||||||
| China Hydroelectric Corp., ADR (a) | 27,100 | 46,612 | ||||||
| China Longyuan Power Group | 1,194,000 | 838,753 | ||||||
| Cleco Corp. | 3,600 | 144,036 | ||||||
| CLP Holdings Ltd. | 187,000 | 1,570,290 | ||||||
| CMS Energy Corp. | 410,400 | 10,005,552 | ||||||
| Companhia Energetica de Minas Gerais, IPS | 242,025 | 2,628,591 | ||||||
| Companhia Paranaense de Energia, ADR | 57,620 | 884,467 | ||||||
| Companhia Paranaense de Energia, IPS | 93,400 | 1,438,894 | ||||||
| Dominion Resources, Inc. | 11,860 | 614,348 | ||||||
| DTE Energy Co. | 12,090 | 726,005 | ||||||
| Duke Energy Corp. | 68,850 | 4,392,630 | ||||||
| E.On Russia JSC | 5,010,603 | 428,868 | ||||||
| Edison International | 178,140 | 8,050,147 | ||||||
| EDP Renovaveis S.A. (a) | 958,998 | 5,113,988 | ||||||
| Enel OGK-5 OAO (a) | 1,396,548 | 74,051 | ||||||
| Energias de Portugal S.A. | 2,691,616 | 8,090,693 | ||||||
| Energias do Brasil S.A. | 381,800 | 2,347,030 | ||||||
| Exelon Corp. | 111,040 | 3,302,330 | ||||||
| FirstEnergy Corp. | 110,630 | 4,619,909 | ||||||
| Great Plains Energy, Inc. | 88,310 | 1,793,576 | ||||||
| Iberdrola S.A. | 443,341 | 2,472,240 | ||||||
| ITC Holdings Corp. | 43,120 | 3,316,359 | ||||||
7
Table of Contents
MFS Utilities Portfolio
Portfolio of Investments – continued
| Issuer | Shares/Par | Value ($) | ||||||
| COMMON STOCKS – continued | ||||||||
| Utilities – Electric Power – continued | ||||||||
| Light S.A. | 155,350 | $ | 1,705,029 | |||||
| National Grid PLC | 103,329 | 1,183,575 | ||||||
| NextEra Energy, Inc. | 59,810 | 4,138,254 | ||||||
| Northeast Utilities | 75,420 | 2,947,414 | ||||||
| NRG Energy, Inc. | 301,375 | 6,928,614 | ||||||
| NV Energy, Inc. | 79,100 | 1,434,874 | ||||||
| OGE Energy Corp. | 88,700 | 4,994,697 | ||||||
| PG&E Corp. | 53,150 | 2,135,567 | ||||||
| Portland General Electric Co. | 26,460 | 723,946 | ||||||
| PPL Corp. | 133,520 | 3,822,678 | ||||||
| Public Service Enterprise Group, Inc. | 187,400 | 5,734,440 | ||||||
| Red Electrica de Espana | 67,936 | 3,356,553 | ||||||
| RWE AG | 29,660 | 1,224,446 | ||||||
| SSE PLC | 115,627 | 2,672,265 | ||||||
| Terna Participacoes S.A., IEU | 72,090 | 767,552 | ||||||
| Tractebel Energia S.A. | 43,700 | 711,792 | ||||||
| Xcel Energy, Inc. | 38,420 | 1,026,198 | ||||||
|
| |||||||
| $ | 130,220,025 | |||||||
|
| |||||||
| Utilities – Water – 1.5% | ||||||||
| Aguas Andinas S.A. | 1,607,215 | $ | 1,146,764 | |||||
| Companhia de Saneamento Basico do Estado de Sao Paulo | 31,500 | 1,321,683 | ||||||
| Companhia de Saneamento de MinasGerais – Copasa MG | 58,300 | 1,253,746 | ||||||
| SUEZ Environnement | 61,380 | 740,104 | ||||||
|
| |||||||
| $ | 4,462,297 | |||||||
|
| |||||||
| Total Common Stocks (Identified Cost, $268,879,800) | $ | 274,689,610 | ||||||
|
| |||||||
| BONDS – 1.2% | ||||||||
| Asset-Backed & Securitized – 0.0% | ||||||||
| Falcon Franchise Loan LLC, FRN, 6.022%, 2023 (i)(z) | $ | 164,997 | $ | 18,562 | ||||
|
| |||||||
| Energy – Independent – 0.6% | ||||||||
| EP Energy LLC, 9.375%, 2020 | $ | 1,675,000 | $ | 1,888,563 | ||||
|
| |||||||
| Utilities – Electric Power – 0.6% | ||||||||
| GenOn Energy, Inc., 9.875%, 2020 | $ | 1,010,000 | $ | 1,166,550 | ||||
| Viridian Group FundCo II, Ltd., 11.125%, 2017 (z) | 480,000 | 499,200 | ||||||
|
| |||||||
| $ | 1,665,750 | |||||||
|
| |||||||
| Total Bonds (Identified Cost, $3,179,218) | $ | 3,572,875 | ||||||
|
| |||||||
| Issuer | Shares/Par | Value ($) | ||||||
| CONVERTIBLE PREFERRED STOCKS – 3.8% | ||||||||
| Utilities – Electric Power – 3.8% | ||||||||
| NextEra Energy, Inc., 8.375% | 41,040 | $ | 2,054,462 | |||||
| NextEra Energy, Inc., 7% | 54,670 | 2,897,510 | ||||||
| PPL Corp., 9.5% | 59,860 | 3,131,277 | ||||||
| PPL Corp., 8.75% | 59,790 | 3,212,517 | ||||||
|
| |||||||
| Total Convertible Preferred Stocks (Identified Cost, $11,161,880) | $ | 11,295,766 | ||||||
|
| |||||||
| CONVERTIBLE BONDS – 1.5% | ||||||||
| Cable TV – 0.7% | ||||||||
| Virgin Media, Inc., 6.5%, 2016 | $ | 1,085,000 | $ | 2,233,066 | ||||
|
| |||||||
| Telecommunications – Wireless – 0.8% | ||||||||
| SBA Communications Corp., 4%, 2014 | $ | 951,000 | $ | 2,248,521 | ||||
|
| |||||||
| Total Convertible Bonds (Identified Cost, $2,457,471) | $ | 4,481,587 | ||||||
|
| |||||||
| MONEY MARKET FUNDS – 0.5% | ||||||||
| MFS Institutional Money Market Portfolio, 0.16%, at Cost and Net Asset Value (v) | 1,415,228 | $ | 1,415,228 | |||||
|
| |||||||
| COLLATERAL FOR SECURITIES LOANED – 0.4% | ||||||||
| Navigator Securities Lending Prime Portfolio, 0.28%, at Cost and Net Asset Value (j) | 1,269,981 | $ | 1,269,981 | |||||
|
| |||||||
| Total Investments (Identified Cost, $288,363,578) | $ | 296,725,047 | ||||||
|
| |||||||
| OTHER ASSETS, LESS LIABILITIES – (0.5)% | (1,649,545 | ) | ||||||
|
| |||||||
| Net Assets – 100.0% | $ | 295,075,502 | ||||||
|
| |||||||
| (a) | Non-income producing security. |
| (i) | Interest only security for which the series receives interest on notional principal (Par amount). Par amount shown is the notional principal and does not reflect the cost of the security. |
| (j) | The rate quoted is the annualized seven-day yield of the fund at period end. |
| (l) | A portion of this security is on loan. |
| (v) | Underlying affiliated fund that is available only to investment companies managed by MFS. The rate quoted for the MFS Institutional Money Market Portfolio is the annualized seven-day yield of the fund at period end. |
8
Table of Contents
MFS Utilities Portfolio
Portfolio of Investments – continued
| (z) | Restricted securities are not registered under the Securities Act of 1933 and are subject to legal restrictions on resale. These securities generally may be resold in transactions exempt from registration or to the public if the securities are subsequently registered. Disposal of these securities may involve time-consuming negotiations and prompt sale at an acceptable price may be difficult. The fund holds the following restricted securities: |
| Restricted Securities | Acquisition Date | Cost | Value | |||||||
| Falcon Franchise Loan LLC, FRN, 6.014%, 2023 | 1/18/02 | $7,183 | $18,562 | |||||||
| Viridian Group FundCo II, Ltd., 11.125%, 2017 | 3/01/12 | 466,250 | 499,200 | |||||||
| Total Restricted Securities | $517,762 | |||||||||
| % of Net assets | 0.2% | |||||||||
The following abbreviations are used in this report and are defined:
| ADR | American Depositary Receipt |
| FRN | Floating Rate Note. Interest rate resets periodically and may not be the rate reported at period end. |
| IEU | International Equity Unit |
| IPS | International Preference Stock |
| PLC | Public Limited Company |
| REIT | Real Estate Investment Trust |
Abbreviations indicate amounts shown in currencies other than the U.S. dollar. All amounts are stated in U.S. dollars unless otherwise indicated. A list of abbreviations is shown below:
| EUR | Euro |
| GBP | British Pound |
Derivative Contracts at 12/31/12
Forward Foreign Currency Exchange Contracts at 12/31/12
| Type | Currency | Counterparty | Contracts to Deliver/Receive | Settlement Date Range | In Exchange For | Contracts at Value | Net Unrealized Appreciation (Depreciation) | |||||||||||||||
| Asset Derivatives | ||||||||||||||||||||||
| BUY | EUR | Credit Suisse Group | 1,095,325 | 1/11/13 | $ | 1,424,286 | $ | 1,445,874 | $ | 21,588 | ||||||||||||
| BUY | EUR | Deutsche Bank AG | 776,574 | 1/11/13 | 1,012,846 | 1,025,109 | 12,263 | |||||||||||||||
| BUY | EUR | JPMorgan Chase Bank N.A. | 191,635 | 1/11/13 | 245,506 | 252,966 | 7,460 | |||||||||||||||
| BUY | EUR | Merrill Lynch International Bank | 237,675 | 1/11/13 | 308,951 | 313,741 | 4,790 | |||||||||||||||
| BUY | EUR | UBS AG | 1,407,086 | 1/11/13 | 1,826,841 | 1,857,411 | 30,570 | |||||||||||||||
| SELL | EUR | Credit Suisse Group | 177,488 | 1/11/13 | 234,877 | 234,291 | 586 | |||||||||||||||
| SELL | EUR | Deutsche Bank AG | 40,593 | 1/11/13 | 53,760 | 53,584 | 176 | |||||||||||||||
| SELL | EUR | JPMorgan Chase Bank N.A. | 8,140 | 1/11/13 | 10,745 | 10,745 | — | |||||||||||||||
| SELL | EUR | UBS AG | 40,349 | 1/11/13 | 53,392 | 53,263 | 129 | |||||||||||||||
| BUY | GBP | Barclays Bank PLC | 426,411 | 1/11/13 | 685,428 | 692,668 | 7,240 | |||||||||||||||
| BUY | GBP | Credit Suisse Group | 504,155 | 1/11/13 | 803,995 | 818,957 | 14,962 | |||||||||||||||
| BUY | GBP | Deutsche Bank AG | 509,427 | 1/11/13 | 816,472 | 827,520 | 11,048 | |||||||||||||||
| BUY | GBP | Goldman Sachs International | 104,633 | 1/11/13 | 168,756 | 169,967 | 1,211 | |||||||||||||||
| BUY | GBP | JPMorgan Chase Bank N.A. | 111,509 | 1/11/13 | 179,550 | 181,137 | 1,587 | |||||||||||||||
| BUY | GBP | UBS AG | 143,062 | 1/11/13 | 229,962 | 232,391 | 2,429 | |||||||||||||||
|
| |||||||||||||||||||||
| $ | 116,039 | |||||||||||||||||||||
|
| |||||||||||||||||||||
9
Table of Contents
MFS Utilities Portfolio
Portfolio of Investments – continued
| Type | Currency | Counterparty | Contracts to Deliver/Receive | Settlement Date Range | In Exchange For | Contracts at Value | Net Unrealized Appreciation (Depreciation) | |||||||||||||||
| Liability Derivatives | ||||||||||||||||||||||
| BUY | EUR | UBS AG | 592,337 | 1/11/13 | $ | 784,255 | $ | 781,909 | $ | (2,346 | ) | |||||||||||
| SELL | EUR | Credit Suisse Group | 160,642 | 1/11/13 | 208,991 | 212,055 | (3,064 | ) | ||||||||||||||
| SELL | EUR | Deutsche Bank AG | 2,573,451 | 1/11/13 | 3,316,545 | 3,397,059 | (80,514 | ) | ||||||||||||||
| SELL | EUR | JPMorgan Chase Bank N.A. | 6,244,425 | 1/11/13 | 8,047,290 | 8,242,896 | (195,606 | ) | ||||||||||||||
| SELL | EUR | UBS AG | 12,863,097 | 1/11/13-3/18/13 | 16,831,102 | 16,989,669 | (158,567 | ) | ||||||||||||||
| BUY | GBP | UBS AG | 114,797 | 1/11/13 | 186,720 | 186,477 | (243 | ) | ||||||||||||||
| SELL | GBP | Barclays Bank PLC | 4,855,794 | 1/11/13 | 7,763,794 | 7,887,824 | (124,030 | ) | ||||||||||||||
| SELL | GBP | Credit Suisse Group | 116,863 | 1/11/13 | 185,851 | 189,834 | (3,983 | ) | ||||||||||||||
| SELL | GBP | Deutsche Bank AG | 4,747,408 | 1/11/13 | 7,588,305 | 7,711,761 | (123,456 | ) | ||||||||||||||
|
| |||||||||||||||||||||
| $ | (691,809 | ) | ||||||||||||||||||||
|
| |||||||||||||||||||||
See Notes to Financial Statements
10
Table of Contents
MFS Utilities Portfolio
FINANCIAL STATEMENTS | STATEMENT OF ASSETS AND LIABILITIES
This statement represents your fund’s balance sheet, which details the assets and liabilities comprising the total value of the fund.
| At 12/31/12 | ||||||||
Assets | ||||||||
Investments – | ||||||||
Non-affiliated issuers, at value (identified cost, $286,948,350) | $295,309,819 | |||||||
Underlying affiliated funds, at cost and value | 1,415,228 | |||||||
Total investments, at value, including $1,235,856 of securities on loan (identified cost, $288,363,578) | $296,725,047 | |||||||
Receivables for | ||||||||
Forward foreign currency exchange contracts | 116,039 | |||||||
Investments sold | 1,243,468 | |||||||
Fund shares sold | 1,172 | |||||||
Interest and dividends | 1,147,689 | |||||||
Other assets | 3,567 | |||||||
Total assets | $299,236,982 | |||||||
Liabilities | ||||||||
Payables for | ||||||||
Forward foreign currency exchange contracts | $691,809 | |||||||
Investments purchased | 1,549,247 | |||||||
Fund shares reacquired | 388,362 | |||||||
Collateral for securities loaned, at value | 1,269,981 | |||||||
Payable to affiliates | ||||||||
Investment adviser | 24,594 | |||||||
Distribution and/or service fees | 3,223 | |||||||
Payable for independent Trustees’ compensation | 57 | |||||||
Accrued expenses and other liabilities | 234,207 | |||||||
Total liabilities | 4,161,480 | |||||||
Net assets | $295,075,502 | |||||||
Net assets consist of | ||||||||
Paid-in capital | $257,029,916 | |||||||
Unrealized appreciation (depreciation) on investments and translation of assets and liabilities in foreign currencies (net of $86,154 deferred country tax) | 7,703,253 | |||||||
Accumulated net realized gain (loss) on investments and foreign currency | 21,314,206 | |||||||
Undistributed net investment income | 9,028,127 | |||||||
Net assets | $295,075,502 | |||||||
Shares of beneficial interest outstanding | 12,181,953 |
| Net assets | Shares outstanding | Net asset value per share | ||||||||||
Initial Class | $176,525,208 | 7,255,589 | $24.33 | |||||||||
Service Class | 118,550,294 | 4,926,364 | 24.06 | |||||||||
See Notes to Financial Statements
11
Table of Contents
MFS Utilities Portfolio
FINANCIAL STATEMENTS | STATEMENT OF OPERATIONS
This statement describes how much your fund earned in investment income and accrued in expenses. It also describes any gains and/or losses generated by fund operations.
Year ended 12/31/12 | ||||||||
Net investment income | ||||||||
Income | ||||||||
Dividends | $12,476,743 | |||||||
Interest | 478,057 | |||||||
Dividends from underlying affiliated funds | 7,795 | |||||||
Foreign taxes withheld | (744,034 | ) | ||||||
Total investment income | $12,218,561 | |||||||
Expenses | ||||||||
Management fee | $2,276,982 | |||||||
Distribution and/or service fees | 314,904 | |||||||
Administrative services fee | 53,803 | |||||||
Independent Trustees’ compensation | 12,469 | |||||||
Custodian fee | 120,794 | |||||||
Shareholder communications | 19,302 | |||||||
Audit and tax fees | 53,853 | |||||||
Legal fees | 5,148 | |||||||
Miscellaneous | 29,369 | |||||||
Total expenses | $2,886,624 | |||||||
Fees paid indirectly | (64 | ) | ||||||
Reduction of expenses by investment adviser | (1,093 | ) | ||||||
Net expenses | $2,885,467 | |||||||
Net investment income | $9,333,094 | |||||||
Realized and unrealized gain (loss) on investments and foreign currency | ||||||||
Realized gain (loss) (identified cost basis) | ||||||||
Investments (net of $77,306 country tax) | $28,797,539 | |||||||
Foreign currency | 587,183 | |||||||
Net realized gain (loss) on investments and foreign currency | $29,384,722 | |||||||
Change in unrealized appreciation (depreciation) | ||||||||
Investments (net of $86,154 increase in deferred country tax) | $2,700,778 | |||||||
Translation of assets and liabilities in foreign currencies | (1,660,580 | ) | ||||||
Net unrealized gain (loss) on investments and foreign currency translation | $1,040,198 | |||||||
Net realized and unrealized gain (loss) on investments and foreign currency | $30,424,920 | |||||||
Change in net assets from operations | $39,758,014 |
See Notes to Financial Statements
12
Table of Contents
MFS Utilities Portfolio
FINANCIAL STATEMENTS | STATEMENTS OF CHANGES IN NET ASSETS
These statements describe the increases and/or decreases in net assets resulting from operations, any distributions, and any shareholder transactions.
For years ended 12/31 | 2012 | 2011 | ||||||
Change in net assets | ||||||||
From operations | ||||||||
Net investment income | $9,333,094 | $11,390,882 | ||||||
Net realized gain (loss) on investments and foreign currency | 29,384,722 | 25,795,718 | ||||||
Net unrealized gain (loss) on investments and foreign currency translation | 1,040,198 | (15,892,238 | ) | |||||
Change in net assets from operations | $39,758,014 | $21,294,362 | ||||||
Distributions declared to shareholders | ||||||||
From net investment income | $(13,720,002 | ) | $(10,670,058 | ) | ||||
Change in net assets from fund share transactions | $(39,940,105 | ) | $(18,328,446 | ) | ||||
Total change in net assets | $(13,902,093 | ) | $(7,704,142 | ) | ||||
Net assets | ||||||||
At beginning of period | 308,977,595 | 316,681,737 | ||||||
At end of period (including undistributed net investment income of $9,028,127 and | $295,075,502 | $308,977,595 |
See Notes to Financial Statements
13
Table of Contents
MFS Utilities Portfolio
FINANCIAL STATEMENTS | FINANCIAL HIGHLIGHTS
The financial highlights table is intended to help you understand the fund’s financial performance for the past 5 years Certain information reflects financial results for a single fund share. The total returns in the table represent the rate by which an investor would have earned (or lost) on an investment in the fund share class (assuming reinvestment of all distributions) held for the entire period.
| Initial Class | Years ended 12/31 | |||||||||||||||||||
| 2012 | 2011 | 2010 | 2009 | 2008 | ||||||||||||||||
Net asset value, beginning of period | $22.34 | $21.64 | $19.61 | $15.56 | $29.51 | |||||||||||||||
| Income (loss) from investment operations | ||||||||||||||||||||
Net investment income (d) | $0.74 | $0.83 | $0.67 | $0.69 | $0.62 | |||||||||||||||
Net realized and unrealized gain (loss) on investments | 2.36 | 0.67 | 1.98 | 4.21 | (9.78 | ) | ||||||||||||||
Total from investment operations | $3.10 | $1.50 | $2.65 | $4.90 | $(9.16 | ) | ||||||||||||||
| Less distributions declared to shareholders | ||||||||||||||||||||
From net investment income | $(1.11 | ) | $(0.80 | ) | $(0.62 | ) | $(0.85 | ) | $(0.47 | ) | ||||||||||
From net realized gain on investments | — | — | — | — | (4.32 | ) | ||||||||||||||
Total distributions declared to shareholders | $(1.11 | ) | $(0.80 | ) | $(0.62 | ) | $(0.85 | ) | $(4.79 | ) | ||||||||||
Net asset value, end of period (x) | $24.33 | $22.34 | $21.64 | $19.61 | $15.56 | |||||||||||||||
Total return (%) (k)(r)(s)(x) | 14.11 | 7.12 | 13.90 | 33.63 | (37.16 | ) | ||||||||||||||
Ratios (%) (to average net assets) and Supplemental data: | ||||||||||||||||||||
Expenses before expense reductions (f) | 0.84 | 0.87 | 0.88 | 0.88 | 0.86 | |||||||||||||||
Expenses after expense reductions (f) | 0.84 | N/A | N/A | N/A | N/A | |||||||||||||||
Net investment income | 3.17 | 3.69 | 3.43 | 4.14 | 2.73 | |||||||||||||||
Portfolio turnover | 48 | 52 | 55 | 70 | 63 | |||||||||||||||
Net assets at end of period (000 omitted) | $176,525 | $178,973 | $191,566 | $199,634 | $178,805 | |||||||||||||||
See Notes to Financial Statements
14
Table of Contents
MFS Utilities Portfolio
Financial Highlights – continued
| Service Class | Years ended 12/31 | |||||||||||||||||||
| 2012 | 2011 | 2010 | 2009 | 2008 | ||||||||||||||||
Net asset value, beginning of period | $22.10 | $21.42 | $19.43 | $15.41 | $29.28 | |||||||||||||||
| Income (loss) from investment operations | ||||||||||||||||||||
Net investment income (d) | $0.67 | $0.77 | $0.62 | $0.63 | $0.57 | |||||||||||||||
Net realized and unrealized gain (loss) on investments | 2.34 | 0.66 | 1.96 | 4.18 | (9.71 | ) | ||||||||||||||
Total from investment operations | $3.01 | $1.43 | $2.58 | $4.81 | $(9.14 | ) | ||||||||||||||
| Less distributions declared to shareholders | ||||||||||||||||||||
From net investment income | $(1.05 | ) | $(0.75 | ) | $(0.59 | ) | $(0.79 | ) | $(0.41 | ) | ||||||||||
From net realized gain on investments | — | — | — | — | (4.32 | ) | ||||||||||||||
Total distributions declared to shareholders | $(1.05 | ) | $(0.75 | ) | $(0.59 | ) | $(0.79 | ) | $(4.73 | ) | ||||||||||
Net asset value, end of period (x) | $24.06 | $22.10 | $21.42 | $19.43 | $15.41 | |||||||||||||||
Total return (%) (k)(r)(s)(x) | 13.83 | 6.84 | 13.60 | 33.27 | (37.31 | ) | ||||||||||||||
Ratios (%) (to average net assets) and Supplemental data: | ||||||||||||||||||||
Expenses before expense reductions (f) | 1.09 | 1.12 | 1.13 | 1.13 | 1.12 | |||||||||||||||
Expenses after expense reductions (f) | 1.09 | N/A | N/A | N/A | N/A | |||||||||||||||
Net investment income | 2.92 | 3.43 | 3.20 | 3.81 | 2.57 | |||||||||||||||
Portfolio turnover | 48 | 52 | 55 | 70 | 63 | |||||||||||||||
Net assets at end of period (000 omitted) | $118,550 | $130,005 | $125,116 | $115,435 | $83,248 | |||||||||||||||
| (d) | Per share data is based on average shares outstanding. |
| (f) | Ratios do not reflect reductions from fees paid indirectly, if applicable. |
| (k) | The total return does not reflect expenses that apply to separate accounts. Inclusion of these charges would reduce the total return figures for all periods shown. |
| (r) | Certain expenses have been reduced without which performance would have been lower. |
| (s) | From time to time the fund may receive proceeds from litigation settlements, without which performance would be lower. Excluding the effect of the proceeds received from a non-recurring litigation settlement against Enron Corp., the Initial Class and Service Class total returns for the year ended December 31, 2008 would have been lower by approximately 1.01%. |
| (x) | The net asset values per share and total returns have been calculated on net assets which include adjustments made in accordance with U.S. generally accepted accounting principles required at period end for financial reporting purposes. |
See Notes to Financial Statements
15
Table of Contents
MFS Utilities Portfolio
| (1) | Business and Organization |
MFS Utilities Portfolio (the fund) is a series of MFS Variable Insurance Trust II (the trust). The trust is organized as a Massachusetts business trust and is registered under the Investment Company Act of 1940, as amended, as an open-end management investment company. The shareholders of each series of the trust are separate accounts of insurance companies, which offer variable annuity and/or life insurance products, and qualified retirement and pension plans.
| (2) | Significant Accounting Policies |
General – The preparation of financial statements in conformity with U.S. generally accepted accounting principles requires management to make estimates and assumptions that affect the reported amounts of assets and liabilities, and disclosure of contingent assets and liabilities at the date of the financial statements and the reported amounts of revenues and expenses during the reporting period. Actual results could differ from those estimates. In the preparation of these financial statements, management has evaluated subsequent events occurring after the date of the fund’s Statement of Assets and Liabilities through the date that the financial statements were issued. The fund invests primarily in securities of issuers in the utility industry. Issuers in a single industry can react similarly to market, economic, political and regulatory conditions and developments. The fund invests in foreign securities, including securities of emerging market issuers. Investments in foreign securities are vulnerable to the effects of changes in the relative values of the local currency and the U.S. dollar and to the effects of changes in each country’s legal, political, and economic environment. The markets of emerging markets countries are generally more volatile than the markets of developed countries with more mature economies. All of the risks of investing in foreign securities previously described are heightened when investing in emerging markets countries.
In this reporting period the fund adopted Financial Accounting Standards Board (FASB) Accounting Standards Update 2011-04, Fair Value Measurement (Topic 820) – Amendments to Achieve Common Fair Value Measurement and Disclosure Requirements in U.S. GAAP and IFRSs (“ASU 2011-04”). ASU 2011-04 seeks to improve the comparability of fair value measurements as presented and disclosed in financial statements prepared in accordance with U.S. GAAP and International Financial Reporting Standards (IFRS) by providing common requirements for fair value measurement and disclosure.
In December 2011, the FASB issued Accounting Standards Update 2011-11, Balance Sheet (Topic 210) – Disclosures about Offsetting Assets and Liabilities (“ASU 2011-11”). Effective for annual reporting periods beginning on or after January 1, 2013 and interim periods within those annual periods, ASU 2011-11 is intended to enhance disclosure requirements on the offsetting of financial assets and liabilities. Although still evaluating the potential impacts of ASU 2011-11 to the fund, management expects that the impact of the fund’s adoption will be limited to additional financial statement disclosures.
Investment Valuations – Equity securities, including restricted equity securities, are generally valued at the last sale or official closing price as provided by a third-party pricing service on the market or exchange on which they are primarily traded. Equity securities, for which there were no sales reported that day, are generally valued at the last quoted daily bid quotation as provided by a third-party pricing service on the market or exchange on which such securities are primarily traded. Debt instruments and floating rate loans (other than short-term instruments), including restricted debt instruments, are generally valued at an evaluated or composite bid as provided by a third-party pricing service. Short-term instruments with a maturity at issuance of 60 days or less generally are valued at amortized cost, which approximates market value. Forward foreign currency exchange contracts are generally valued at the mean of bid and asked prices for the time period interpolated from rates provided by a third-party pricing service for proximate time periods. Open-end investment companies are generally valued at net asset value per share. Securities and other assets generally valued on the basis of information from a third-party pricing service may also be valued at a broker/dealer bid quotation. Values obtained from third-party pricing services can utilize both transaction data and market information such as yield, quality, coupon rate, maturity, type of issue, trading characteristics, and other market data. The values of foreign securities and other assets and liabilities expressed in foreign currencies are converted to U.S. dollars using the mean of bid and asked prices for rates provided by a third-party pricing service.
The Board of Trustees has delegated primary responsibility for determining or causing to be determined the value of the fund’s investments (including any fair valuation) to the adviser pursuant to valuation policies and procedures approved by the Board. If the adviser determines that reliable market quotations are not readily available, investments are valued at fair value as determined in good faith by the adviser in accordance with such procedures under the oversight of the Board of Trustees. Under the fund’s valuation policies and procedures, market quotations are not considered to be readily available for most types of debt instruments and floating rate loans and many types of derivatives. These investments are generally valued at fair value based on information from third-party pricing services. In addition, investments may be valued at fair value if the adviser determines that an investment’s value has been materially affected by events occurring after the close of the exchange or market on which the investment is principally traded (such as foreign exchange or market) and prior to the determination of the fund’s net asset value, or after the halting of trading of a specific security where trading does not resume prior to the close of the exchange or market on which the security is principally traded. Events that occur on a frequent basis after foreign markets close (such as developments in foreign markets and significant movements in the U.S. markets) and prior to the determination of the fund’s net asset value may be deemed to have a
16
Table of Contents
MFS Utilities Portfolio
Notes to Financial Statements – continued
material effect on the value of securities traded in foreign markets. Accordingly, the fund’s foreign equity securities may often be valued at fair value. The adviser generally relies on third-party pricing services or other information (such as the correlation with price movements of similar securities in the same or other markets; the type, cost and investment characteristics of the security; the business and financial condition of the issuer; and trading and other market data) to assist in determining whether to fair value and at what value to fair value an investment. The value of an investment for purposes of calculating the fund’s net asset value can differ depending on the source and method used to determine value. When fair valuation is used, the value of an investment used to determine the fund’s net asset value may differ from quoted or published prices for the same investment. There can be no assurance that the fund could obtain the fair value assigned to an investment if it were to sell the investment at the same time at which the fund determines its net asset value per share.
Various inputs are used in determining the value of the fund’s assets or liabilities. These inputs are categorized into three broad levels. In certain cases, the inputs used to measure fair value may fall into different levels of the fair value hierarchy. In such cases, an investment’s level within the fair value hierarchy is based on the lowest level of input that is significant to the fair value measurement. The fund’s assessment of the significance of a particular input to the fair value measurement in its entirety requires judgment, and considers factors specific to the investment. Level 1 includes unadjusted quoted prices in active markets for identical assets or liabilities. Level 2 includes other significant observable market-based inputs (including quoted prices for similar securities, interest rates, prepayment speed, and credit risk). Level 3 includes unobservable inputs, which may include the adviser’s own assumptions in determining the fair value of investments. Other financial instruments are derivative instruments not reflected in total investments, such as forward foreign currency exchange contracts. The following is a summary of the levels used as of December 31, 2012 in valuing the fund’s assets or liabilities:
| Investments at Value | Level 1 | Level 2 | Level 3 | Total | ||||||||||||
| Equity Securities: | ||||||||||||||||
United States | $194,632,293 | $— | $— | $194,632,293 | ||||||||||||
Brazil | 7,998,433 | 10,694,973 | — | 18,693,406 | ||||||||||||
Portugal | — | 13,852,350 | — | 13,852,350 | ||||||||||||
Spain | — | 10,138,875 | — | 10,138,875 | ||||||||||||
United Kingdom | — | 7,517,969 | — | 7,517,969 | ||||||||||||
Germany | 753,985 | 3,505,858 | — | 4,259,843 | ||||||||||||
France | 3,322,971 | 740,104 | — | 4,063,075 | ||||||||||||
Italy | — | 3,820,507 | — | 3,820,507 | ||||||||||||
Netherlands | — | 3,742,211 | — | 3,742,211 | ||||||||||||
Other Countries | 15,828,065 | 9,436,782 | — | 25,264,847 | ||||||||||||
| Corporate Bonds | — | 7,536,700 | — | 7,536,700 | ||||||||||||
| Commercial Mortgage-Backed Securities | — | 18,562 | — | 18,562 | ||||||||||||
| Foreign Bonds | — | 499,200 | — | 499,200 | ||||||||||||
| Mutual Funds | 2,685,209 | — | — | 2,685,209 | ||||||||||||
| Total Investments | $225,220,956 | $71,504,091 | $— | $296,725,047 | ||||||||||||
| Other Financial Instruments | ||||||||||||||||
| Forward Foreign Currency Exchange Contracts | $— | $(575,770 | ) | $— | $(575,770 | ) | ||||||||||
For further information regarding security characteristics, see the Portfolio of Investments.
Of the level 2 investments presented above, equity investments amounting to $31,414,805 would have been considered level 1 investments at the beginning of the period. Of the level 1 investments presented above, equity investments amounting to $3,322,971 would have been considered level 2 investments at the beginning of the period. The primary reason for changes in the classifications between levels 1 and 2 occurs when foreign equity securities are fair valued using other observable market-based inputs in place of the closing exchange price due to events occurring after the close of the exchange or market on which the investment is principally traded. The fund’s foreign equity securities may often be valued at fair value. The fund’s policy is to recognize transfers between the levels as of the end of the period.
Foreign Currency Translation – Purchases and sales of foreign investments, income, and expenses are converted into U.S. dollars based upon currency exchange rates prevailing on the respective dates of such transactions or on the reporting date for foreign denominated receivables and payables. Gains and losses attributable to foreign currency exchange rates on sales of securities are recorded for financial statement purposes as net realized gains and losses on investments. Gains and losses attributable to foreign exchange rate movements on receivables, payables, income and expenses are recorded for financial statement purposes as foreign currency transaction gains and losses. That portion of both realized and unrealized gains and losses on investments that results from fluctuations in foreign currency exchange rates is not separately disclosed.
17
Table of Contents
MFS Utilities Portfolio
Notes to Financial Statements – continued
Derivatives – The fund uses derivatives for different purposes, primarily to increase or decrease exposure to a particular market or segment of the market, or security, to increase or decrease interest rate or currency exposure, or as alternatives to direct investments. Derivatives are used for hedging or non-hedging purposes. While hedging can reduce or eliminate losses, it can also reduce or eliminate gains. When the fund uses derivatives as an investment to increase market exposure, or for hedging purposes, gains and losses from derivative instruments may be substantially greater than the derivative’s original cost.
The derivative instruments used by the fund were forward foreign currency exchange contracts. The fund’s period end derivatives, as presented in the Portfolio of Investments and the associated Derivative Contract tables, generally are indicative of the volume of its derivative activity during the period.
The following table presents, by major type of derivative contract, the fair value, on a gross basis, of the asset and liability components of derivatives held by the fund at December 31, 2012 as reported in the Statement of Assets and Liabilities:
| Fair Value | ||||||||||
| Risk | Derivative Contracts | Asset Derivatives | Liability Derivatives | |||||||
| Foreign Exchange | Forward Foreign Currency Exchange | $116,039 | $(691,809 | ) | ||||||
The following table presents, by major type of derivative contract, the realized gain (loss) on derivatives held by the fund for the year ended December 31, 2012 as reported in the Statement of Operations:
| Risk | Foreign Currency Transactions | |||
| Foreign Exchange | $694,177 | |||
The following table presents, by major type of derivative contract, the change in unrealized appreciation (depreciation) on derivatives held by the fund for the year ended December 31, 2012 as reported in the Statement of Operations:
| Risk | Translation of Assets and Liabilities in Foreign Currencies | |||
| Foreign Exchange | $(1,672,734 | ) | ||
Derivative counterparty credit risk is managed through formal evaluation of the creditworthiness of all potential counterparties. On certain over-the-counter derivatives, the fund attempts to reduce its exposure to counterparty credit risk whenever possible by entering into an International Swaps and Derivatives Association (ISDA) Master Agreement on a bilateral basis with each of the counterparties with whom it undertakes a significant volume of transactions. The ISDA Master Agreement gives each party to the agreement the right to terminate all transactions traded under such agreement if there is a certain deterioration in the credit quality of the other party. The ISDA Master Agreement gives the fund the right, upon an event of default by the applicable counterparty or a termination of the agreement, to close out all transactions traded under such agreement and to net amounts owed under each transaction to one net amount payable by one party to the other. This right to close out and net payments across all transactions traded under the ISDA Master Agreement could result in a reduction of the fund’s credit risk to such counterparty equal to any amounts payable by the fund under the applicable transactions, if any. However, absent an event of default by the counterparty or a termination of the agreement, the ISDA Master Agreement does not result in an offset of reported amounts of assets and liabilities in the Statement of Assets and Liabilities across transactions between the fund and the applicable counterparty.
Collateral requirements differ by type of derivative. Collateral or margin requirements are set by the broker or exchange clearing house for exchange traded derivatives (i.e., futures contracts and exchange-traded options) while collateral terms are contract specific for over-the-counter traded derivatives (i.e., forward foreign currency exchange contracts, swap agreements and over-the-counter options). For derivatives traded under an ISDA Master Agreement, the collateral requirements are netted across all transactions traded under such agreement and one amount is posted from one party to the other to collateralize such obligations. Cash collateral that has been pledged to cover obligations of the fund under derivative contracts, if any, will be reported separately in the Statement of Assets and Liabilities as “Restricted cash”. Securities collateral pledged for the same purpose, if any, is noted in the Portfolio of Investments.
Forward Foreign Currency Exchange Contracts – The fund entered into forward foreign currency exchange contracts for the purchase or sale of a specific foreign currency at a fixed price on a future date. These contracts may be used to hedge the fund’s currency risk or for non-hedging purposes. For hedging purposes, the fund may enter into contracts to deliver or receive foreign currency that the fund will receive from or use in its normal investment activities. The fund may also use contracts to hedge against declines in the value of foreign currency denominated securities due to unfavorable exchange rate movements. For non-hedging purposes, the fund may enter into contracts with the intent of changing the relative exposure of the fund’s portfolio of securities to different currencies to take advantage of anticipated exchange rate changes.
18
Table of Contents
MFS Utilities Portfolio
Notes to Financial Statements – continued
Forward foreign currency exchange contracts are adjusted by the daily exchange rate of the underlying currency and any unrealized gains or losses are recorded as a receivable or payable for forward foreign currency exchange contracts until the contract settlement date. On contract settlement date, any gain or loss on the contract is recorded as realized gains or losses on foreign currency.
Risks may arise upon entering into these contracts from unanticipated movements in the value of the contract and from the potential inability of counterparties to meet the terms of their contracts. Generally, the fund’s maximum risk due to counterparty credit risk is the unrealized gain on the contract due to the use of Continuous Linked Settlement, an industry accepted settlement system. This risk is mitigated in cases where there is an ISDA Master Agreement between the fund and the counterparty providing for netting as described above and for posting of collateral by the counterparty to the fund to cover the fund’s exposure to the counterparty under such ISDA Master Agreement.
Security Loans – State Street Bank and Trust Company (“State Street”), as lending agent, loans the securities of the fund to certain qualified institutions (the “Borrowers”) approved by the fund. The loans are collateralized by cash and/or U.S. Treasury and federal agency obligations in an amount typically at least equal to the market value of the securities loaned. The market value of the loaned securities is determined at the close of business of the fund and any additional required collateral is delivered to the fund on the next business day. State Street provides the fund with indemnification against Borrower default. The fund bears the risk of loss with respect to the investment of cash collateral. On loans collateralized by cash, the cash collateral is invested in a money market fund or short-term securities. Collateral for securities loaned is held at carrying value, which approximates fair value. If the collateral for securities loaned was carried at fair value, its fair value would be considered level 2 under the fair value hierarchy. A portion of the income generated upon investment of the collateral is remitted to the Borrowers, and the remainder is allocated between the fund and the lending agent. On loans collateralized by U.S. Treasury and/or federal agency obligations, a fee is received from the Borrower, and is allocated between the fund and the lending agent. Income from securities lending is included in “Interest” income in the Statement of Operations. The dividend and interest income earned on the securities loaned is accounted for in the same manner as other dividend and interest income.
Indemnifications – Under the fund’s organizational documents, its officers and Trustees may be indemnified against certain liabilities and expenses arising out of the performance of their duties to the fund. Additionally, in the normal course of business, the fund enters into agreements with service providers that may contain indemnification clauses. The fund’s maximum exposure under these agreements is unknown as this would involve future claims that may be made against the fund that have not yet occurred.
Investment Transactions and Income – Investment transactions are recorded on the trade date. Interest income is recorded on the accrual basis. All premium and discount is amortized or accreted for financial statement purposes in accordance with U.S. generally accepted accounting principles. Dividends received in cash are recorded on the ex-dividend date. Certain dividends from foreign securities will be recorded when the fund is informed of the dividend if such information is obtained subsequent to the ex-dividend date. Dividend and interest payments received in additional securities are recorded on the ex-dividend or ex-interest date in an amount equal to the value of the security on such date.
The fund may receive proceeds from litigation settlements. Any proceeds received from litigation involving portfolio holdings are reflected in the Statement of Operations in realized gain/loss if the security has been disposed of by the fund or in unrealized gain/loss if the security is still held by the fund. Any other proceeds from litigation not related to portfolio holdings are reflected as other income in the Statement of Operations.
Fees Paid Indirectly – The fund’s custody fee may be reduced according to an arrangement that measures the value of cash deposited with the custodian by the fund. This amount, for the year ended December 31, 2012, is shown as a reduction of total expenses in the Statement of Operations.
Tax Matters and Distributions – The fund intends to qualify as a regulated investment company, as defined under Subchapter M of the Internal Revenue Code, and to distribute all of its taxable income, including realized capital gains. As a result, no provision for federal income tax is required. The fund’s federal tax returns, when filed, will remain subject to examination by the Internal Revenue Service for a three year period. Foreign taxes have been accrued by the fund in the accompanying financial statements.
Distributions to shareholders are recorded on the ex-dividend date. Income and capital gain distributions are determined in accordance with income tax regulations, which may differ from U.S. generally accepted accounting principles. Certain capital accounts in the financial statements are periodically adjusted for permanent differences in order to reflect their tax character. These adjustments have no impact on net assets or net asset value per share. Temporary differences which arise from recognizing certain items of income, expense, gain or loss in different periods for financial statement and tax purposes will reverse at some time in the future. Distributions in excess of net investment income or net realized gains are temporary overdistributions for financial statement purposes resulting from differences in the recognition or classification of income or distributions for financial statement and tax purposes.
Book/tax differences primarily relate to amortization and accretion of debt securities, wash sale loss deferrals, and derivative transactions.
19
Table of Contents
MFS Utilities Portfolio
Notes to Financial Statements – continued
The tax character of distributions declared to shareholders for the last two fiscal years is as follows:
| 12/31/12 | 12/31/11 | |||||||
| Ordinary income (including any short-term capital gains) | $13,720,002 | $10,670,058 | ||||||
The federal tax cost and the tax basis components of distributable earnings were as follows:
| As of 12/31/12 | ||||
| Cost of investments | $288,815,179 | |||
| Gross appreciation | 32,889,756 | |||
| Gross depreciation | (24,979,888 | ) | ||
| Net unrealized appreciation (depreciation) | $7,909,868 | |||
| Undistributed ordinary income | 8,453,195 | |||
| Undistributed long-term capital gain | 21,843,113 | |||
| Other temporary differences | (160,590 | ) |
Multiple Classes of Shares of Beneficial Interest – The fund offers multiple classes of shares, which differ in their respective distribution and/or service fees. The fund’s income, realized and unrealized gain (loss), and common expenses are allocated to shareholders based on the daily net assets of each class. Dividends are declared separately for each class. Differences in per share dividend rates are generally due to differences in separate class expenses. The fund’s distributions declared to shareholders as reported in the Statements of Changes in Net Assets are presented by class as follows:
| From net investment income | ||||||||
| Year ended 12/31/12 | Year ended 12/31/11 | |||||||
| Initial Class | $8,178,600 | $6,480,865 | ||||||
| Service Class | 5,541,402 | 4,189,193 | ||||||
| Total | $13,720,002 | $10,670,058 | ||||||
| (3) | Transactions with Affiliates |
Investment Adviser – The fund has an investment advisory agreement with MFS to provide overall investment management and related administrative services and facilities to the fund.
The management fee is computed daily and paid monthly at the following annual rates:
| First $300 million of average daily net assets | 0.75% | |||
| Average daily net assets in excess of $300 million | 0.675% |
The management fee incurred for the year ended December 31, 2012 was equivalent to an annual effective rate of 0.75% of the fund’s average daily net assets.
Distributor – MFS Fund Distributors, Inc. (MFD), a wholly-owned subsidiary of MFS, is the distributor of shares of the fund. The Trustees have adopted a distribution plan for the Service Class shares pursuant to Rule 12b-1 under the Investment Company Act of 1940.
The fund’s distribution plan provides that the fund will pay MFD distribution and/or service fees equal to 0.25% per annum of its average daily net assets attributable to Service Class shares as partial consideration for services performed and expenses incurred by MFD and financial intermediaries (including participating insurance companies that invest in the fund to fund variable annuity and variable life insurance contracts, sponsors of qualified retirement and pension plans that invest in the fund, and affiliates of these participating insurance companies and plan sponsors) in connection with the sale and distribution of the Service Class shares. MFD may subsequently pay all, or a portion, of the distribution and/or service fees to financial intermediaries.
Shareholder Servicing Agent – MFS Service Center, Inc. (MFSC), a wholly-owned subsidiary of MFS, has contracted to provide transfer agent and recordkeeping functions in connection with the issuance, transfer, and redemption of each class of shares of the fund under a Shareholder Servicing Agent Agreement. During the year ended December 31, 2012, the fund did not pay MFSC a fee for this service. Effective April 1, 2013, the fund will be charged a shareholder servicing fee by MFSC.
Administrator – MFS provides certain financial, legal, shareholder communications, compliance, and other administrative services to the fund. Under an administrative services agreement, the fund partially reimburses MFS the costs incurred to provide these services.
20
Table of Contents
MFS Utilities Portfolio
Notes to Financial Statements – continued
The fund is charged an annual fixed amount of $17,500 plus a fee based on average daily net assets. The administrative services fee incurred for the year ended December 31, 2012 was equivalent to an annual effective rate of 0.0177% of the fund’s average daily net assets.
Trustees’ and Officers’ Compensation – The fund pays compensation to independent Trustees in the form of a retainer, attendance fees, and additional compensation to Board and Committee chairpersons. The fund does not pay compensation directly to Trustees or officers of the fund who are also officers of the investment adviser, all of whom receive remuneration for their services to the fund from MFS. Certain officers and Trustees of the fund are officers or directors of MFS, MFD, and MFSC.
Other – This fund and certain other funds managed by MFS (the funds) have entered into services agreements (the Agreements) which provide for payment of fees by the funds to Tarantino LLC and Griffin Compliance LLC in return for the provision of services of an Independent Chief Compliance Officer (ICCO) and Assistant ICCO, respectively, for the funds. The ICCO and Assistant ICCO are officers of the funds and the sole members of Tarantino LLC and Griffin Compliance LLC, respectively. The funds can terminate the Agreements with Tarantino LLC and Griffin Compliance LLC at any time under the terms of the Agreements. For the year ended December 31, 2012, the aggregate fees paid by the fund to Tarantino LLC and Griffin Compliance LLC were $2,483 and are included in “Miscellaneous” expense in the Statement of Operations. MFS has agreed to reimburse the fund for a portion of the payments made by the fund in the amount of $1,093, which is shown as a reduction of total expenses in the Statement of Operations. Additionally, MFS has agreed to bear all expenses associated with office space, other administrative support, and supplies provided to the ICCO and Assistant ICCO.
The fund invests in the MFS Institutional Money Market Portfolio which is managed by MFS and seeks current income consistent with preservation of capital and liquidity. Income earned on this investment is included in “Dividends from underlying affiliated funds” in the Statement of Operations. This money market fund does not pay a management fee to MFS.
| (4) | Portfolio Securities |
Purchases and sales of investments, other than short-term obligations, aggregated $142,564,783 and $173,842,201 respectively.
| (5) | Shares of Beneficial Interest |
The fund’s Declaration of Trust permits the Trustees to issue an unlimited number of full and fractional shares of beneficial interest. Transactions in fund shares were as follows:
| Year ended 12/31/12 | Year ended 12/31/11 | |||||||||||||||
| Shares | Amount | Shares | Amount | |||||||||||||
| Shares sold | ||||||||||||||||
Initial Class | 133,109 | $3,107,251 | 195,064 | $4,398,559 | ||||||||||||
Service Class | 318,047 | 7,418,784 | 1,112,704 | 24,780,307 | ||||||||||||
| 451,156 | $10,526,035 | 1,307,768 | $29,178,866 | |||||||||||||
| Shares issued to shareholders in reinvestment of distributions | ||||||||||||||||
Initial Class | 351,919 | $8,178,600 | 303,981 | $6,480,865 | ||||||||||||
Service Class | 240,826 | 5,541,402 | 198,352 | 4,189,193 | ||||||||||||
| 592,745 | $13,720,002 | 502,333 | $10,670,058 | |||||||||||||
| Shares reacquired | ||||||||||||||||
Initial Class | (1,241,888 | ) | $(29,070,845 | ) | (1,339,096 | ) | $(30,204,101 | ) | ||||||||
Service Class | (1,513,922 | ) | (35,115,297 | ) | (1,269,723 | ) | (27,973,269 | ) | ||||||||
| (2,755,810 | ) | $(64,186,142 | ) | (2,608,819 | ) | $(58,177,370 | ) | |||||||||
| Net change | ||||||||||||||||
Initial Class | (756,860 | ) | $(17,784,994 | ) | (840,051 | ) | $(19,324,677 | ) | ||||||||
Service Class | (955,049 | ) | (22,155,111 | ) | 41,333 | 996,231 | ||||||||||
| (1,711,909 | ) | $(39,940,105 | ) | (798,718 | ) | $(18,328,446 | ) | |||||||||
| (6) | Line of Credit |
The fund and certain other funds managed by MFS participate in a $1.1 billion unsecured committed line of credit, subject to a $1 billion sublimit, provided by a syndication of banks under a credit agreement. Borrowings may be made for temporary financing needs. Interest is charged to each fund, based on its borrowings, generally at a rate equal to the higher of the Federal Reserve funds rate or one month LIBOR plus an agreed upon spread. A commitment fee, based on the average daily, unused portion of the committed line of credit, is allocated among the participating funds at the end of each calendar quarter. In addition, the fund and other funds managed by MFS have established unsecured uncommitted borrowing arrangements with certain banks for temporary financing needs. Interest is charged to each fund, based on its borrowings, at a rate equal to the Federal Reserve funds rate plus an agreed upon spread. For the year ended December 31, 2012, the fund’s commitment fee and interest expense were $1,962 and $0, respectively, and are included in “Miscellaneous” expense in the Statement of Operations.
21
Table of Contents
MFS Utilities Portfolio
Notes to Financial Statements – continued
| (7) | Transactions in Underlying Affiliated Funds – Affiliated Issuers |
An affiliated issuer may be considered one in which the fund owns 5% or more of the outstanding voting securities, or a company which is under common control. For the purposes of this report, the fund assumes the following to be an affiliated issuer:
| Underlying Affiliated Fund | Beginning Shares/Par Amount | Acquisitions Shares/Par Amount | Dispositions Shares/Par Amount | Ending Shares/Par Amount | ||||||||||||
| MFS Institutional Money Market Portfolio | 6,151,225 | 76,597,017 | (81,333,014 | ) | 1,415,228 | |||||||||||
| Underlying Affiliated Fund | Realized Gain (Loss) | Capital Gain Distributions | Dividend Income | Ending Value | ||||||||||||
| MFS Institutional Money Market Portfolio | $— | $— | $7,795 | $1,415,228 | ||||||||||||
22
Table of Contents
MFS Utilities Portfolio
REPORT OF INDEPENDENT REGISTERED PUBLIC ACCOUNTING FIRM
To the Board of Trustees of MFS Variable Insurance Trust II and the Shareholders of
MFS Utilities Portfolio:
We have audited the accompanying statement of assets and liabilities, including the portfolio of investments, of MFS Utilities Portfolio (the “Fund”) (one of the series comprising MFS Variable Insurance Trust II) as of December 31, 2012, and the related statement of operations for the year then ended, the statements of changes in net assets for each of the two years in the period then ended, and the financial highlights for each of the five years in the period then ended. These financial statements and financial highlights are the responsibility of the Fund’s management. Our responsibility is to express an opinion on these financial statements and financial highlights based on our audits.
We conducted our audits in accordance with the standards of the Public Company Accounting Oversight Board (United States). Those standards require that we plan and perform the audit to obtain reasonable assurance about whether the financial statements and financial highlights are free of material misstatement. The Fund is not required to have, nor were we engaged to perform, an audit of its internal control over financial reporting. Our audits included consideration of internal control over financial reporting as a basis for designing audit procedures that are appropriate in the circumstances, but not for the purpose of expressing an opinion on the effectiveness of the Fund’s internal control over financial reporting. Accordingly, we express no such opinion. An audit also includes examining, on a test basis, evidence supporting the amounts and disclosures in the financial statements, assessing the accounting principles used and significant estimates made by management, as well as evaluating the overall financial statement presentation. Our procedures included confirmation of securities owned as of December 31, 2012, by correspondence with the custodian and brokers; where replies were not received from brokers, we performed other auditing procedures. We believe that our audits provide a reasonable basis for our opinion.
In our opinion, the financial statements and financial highlights referred to above present fairly, in all material respects, the financial position of MFS Utilities Portfolio as of December 31, 2012, the results of its operations for the year then ended, the changes in its net assets for each of the two years in the period then ended, and the financial highlights for each of the five years in the period then ended, in conformity with accounting principles generally accepted in the United States of America.
DELOITTE & TOUCHE LLP
Boston, Massachusetts
February 15, 2013
23
Table of Contents
MFS Utilities Portfolio
TRUSTEES AND OFFICERS – IDENTIFICATION AND BACKGROUND
The Trustees and officers of the Trust, as of February 1, 2013, are listed below, together with their principal occupations during the past five years. (Their titles may have varied during that period.) The address of each Trustee and officer is 111 Huntington Avenue, Boston, Massachusetts 02199-7618.
Name, Age | Position(s) with Fund | Trustee/Officer Since (h) | Principal Occupations During the Past Five Years | Other Directorships (j) | ||||
| INTERESTED TRUSTEES | ||||||||
Robert J. Manning (k) (age 49) | Trustee | February 2004 | Massachusetts Financial Services Company, Chairman, Chief Executive Officer and Director; President (until December 2009); Chief Investment Officer (until July 2010) | N/A | ||||
| INDEPENDENT TRUSTEES | ||||||||
David H. Gunning (age 70) | Trustee and Chair of Trustees | January 2004 | Private investor | Lincoln Electric Holdings, Inc. (welding equipment manufacturer), Director; Development Alternatives, Inc. (consulting), Director/Non-Executive Chairman; Portman Limited (mining), Director (until 2008) | ||||
Robert E. Butler (age 71) | Trustee | January 2006 | Consultant – investment company industry regulatory and compliance matters | N/A | ||||
Maureen R. Goldfarb (age 57) | Trustee | January 2009 | Private investor | N/A | ||||
William R. Gutow (age 71) | Trustee | December 1993 | Private investor and real estate consultant; Capitol Entertainment Management Company (video franchise), Vice Chairman | Atlantic Coast Tan (tanning salons), Vice Chairman (until 2007); Texas Donuts (donut franchise), Vice Chairman (until 2010) | ||||
Michael Hegarty (age 68) | Trustee | December 2004 | Private investor; Rouse Properties Inc. (real estate), Director | N/A | ||||
John P. Kavanaugh (age 58) | Trustee | January 2009 | Private investor | N/A | ||||
J. Dale Sherratt (age 74) | Trustee | June 1989 | Insight Resources, Inc. (acquisition planning specialists), President; Wellfleet Investments (investor in health care companies), Managing General Partner | N/A | ||||
| Laurie J. Thomsen (age 55) | Trustee | March 2005 | Private investor; New Profit, Inc. (venture philanthropy), Executive Partner (until 2010) | The Travelers Companies (insurance), Director | ||||
Robert W. Uek (age 71) | Trustee | January 2006 | Consultant to investment company industry | N/A | ||||
| OFFICERS | ||||||||
John M. Corcoran (k) (age 47) | President | October 2008 | Massachusetts Financial Services Company, Senior Vice President (since October 2008); State Street Bank and Trust (financial services provider), Senior Vice President, (until September 2008) | N/A | ||||
| Christopher R. Bohane (k) (age 39) | Assistant Secretary and Assistant Clerk | July 2005 | Massachusetts Financial Services Company, Vice President and Senior Counsel | N/A | ||||
Kino Clark (k) (age 44) | Assistant Treasurer | January 2012 | Massachusetts Financial Services Company, Vice President | N/A | ||||
Thomas H. Connors (k) (age 53) | Assistant Secretary and Assistant Clerk | September 2012 | Massachusetts Financial Services Company, Vice President and Senior Counsel; Deutsche Investment Management Americas Inc. (financial service provider), Director and Senior Counsel (until 2012) | N/A | ||||
Ethan D. Corey (k) (age 49) | Assistant Secretary and Assistant Clerk | July 2005 | Massachusetts Financial Services Company, Senior Vice President and Associate General Counsel | N/A | ||||
24
Table of Contents
MFS Utilities Portfolio
Trustees and Officers – continued
Name, Age | Position(s) with Fund | Trustee/Officer Since (h) | Principal Occupations During the Past Five Years | Other Directorships (j) | ||||
David L. DiLorenzo (k) (age 44) | Treasurer | July 2005 | Massachusetts Financial Services Company, Senior Vice President | N/A | ||||
Robyn L. Griffin (age 37) | Assistant Independent Chief Compliance Officer | August 2008 | Griffin Compliance LLC (provider of compliance services), Principal (since August 2008); State Street Corporation (financial services provider), Mutual Fund Administration Assistant Vice President (October 2006 – July 2008) | N/A | ||||
Brian E. Langenfeld (k) (age 39) | Assistant Secretary and Assistant Clerk | June 2006 | Massachusetts Financial Services Company, Vice President and Senior Counsel | N/A | ||||
Susan S. Newton (k) (age 62) | Assistant Secretary and Assistant Clerk | May 2005 | Massachusetts Financial Services Company, Senior Vice President and Associate General Counsel | N/A | ||||
Susan A. Pereira (k) (age 42) | Assistant Secretary and Assistant Clerk | July 2005 | Massachusetts Financial Services Company, Vice President and Senior Counsel | N/A | ||||
Kasey L. Phillips (k) (age 42) | Assistant Treasurer | September 2012 | Massachusetts Financial Services Company, Vice President; Wells Fargo Funds Management, LLC, Senior Vice President, Fund Treasurer (until 2012) | N/A | ||||
Mark N. Polebaum (k) (age 60) | Secretary and Clerk | January 2006 | Massachusetts Financial Services Company, Executive Vice President, General Counsel and Secretary | N/A | ||||
Frank L. Tarantino (age 68) | Independent Chief Compliance Officer | June 2004 | Tarantino LLC (provider of compliance services), Principal | N/A | ||||
Richard S. Weitzel (k) (age 42) | Assistant Secretary and Assistant Clerk | October 2007 | Massachusetts Financial Services Company, Senior Vice President and Associate General Counsel | N/A | ||||
James O. Yost (k) (age 52) | Deputy Treasurer | September 1990 | Massachusetts Financial Services Company, Senior Vice President | N/A | ||||
| (h) | Date first appointed to serve as Trustee/officer of an MFS fund. Each Trustee has served continuously since appointment unless indicated otherwise. For the period from December 15, 2004 until February 22, 2005, Mr. Manning served as Advisory Trustee. For the period October 2008, until January 2012, Mr. Corcoran served as Treasurer of the Funds. Prior to January 2012, Messrs. DiLorenzo and Yost served as Assistant Treasurers of the Funds. |
| (j) | Directorships or trusteeships of companies required to report to the Securities and Exchange Commission (i.e., “public companies”). |
| (k) | “Interested person” of the Trust within the meaning of the Investment Company Act of 1940 (referred to as the 1940 Act), which is the principal federal law governing investment companies like the fund, as a result of position with MFS. The address of MFS is 111 Huntington Avenue, Boston, Massachusetts 02199-7618. |
Each Trustee has been elected by shareholders and each Trustee and officer holds office until his or her successor is chosen and qualified or until his or her earlier death, resignation, retirement or removal. The Trust does not hold annual meetings for the purpose of electing Trustees, and Trustees are not elected for fixed terms. Messrs. Butler, Kavanaugh, Uek and Ms. Thomsen are members of the Trust’s Audit Committee.
Each of the Fund’s Trustees and officers holds comparable positions with certain other funds of which MFS or a subsidiary is the investment adviser or distributor, and, in the case of the officers, with certain affiliates of MFS. As of January 1, 2013, the Trustees served as board members of 143 funds within the MFS Family of Funds.
25
Table of Contents
MFS Utilities Portfolio
Trustees and Officers – continued
The Statement of Additional Information for the Fund includes further information about the Trustees and is available without charge upon request by calling 1-800-225-2606.
Investment Adviser Massachusetts Financial Services Company 111 Huntington Avenue Boston, MA 02199-7618 | Custodian State Street Bank and Trust 1 Lincoln Street Boston, MA 02111-2900 | |
Distributor MFS Fund Distributors, Inc. 111 Huntington Avenue Boston, MA 02199-7618 | Independent Registered Public Accounting Firm Deloitte & Touche LLP 200 Berkeley Street Boston, MA 02116 | |
Portfolio Managers Robert Persons Maura Shaughnessy |
26
Table of Contents
MFS Utilities Portfolio
BOARD REVIEW OF INVESTMENT ADVISORY AGREEMENT
A discussion regarding the Board’s most recent approval of the fund’s Investment Advisory Agreement with MFS is available by clicking on the fund’s name under “Variable Insurance Portfolios — VIT II” in the “Products” section of the MFS Web site (mfs.com).
PROXY VOTING POLICIES AND INFORMATION
A general description of the MFS funds’ proxy voting policies and procedures is available without charge, upon request, by calling 1-800-225-2606, by visiting the Proxy Voting section of mfs.com or by visiting the SEC’s Web site at http://www.sec.gov.
Information regarding how the fund voted proxies relating to portfolio securities during the most recent twelve-month period ended June 30 is available without charge by visiting the Proxy Voting section of mfs.com or by visiting the SEC’s Web site at http://www.sec.gov.
QUARTERLY PORTFOLIO DISCLOSURE
The fund will file a complete schedule of portfolio holdings with the Securities and Exchange Commission (the Commission) for the first and third quarters of each fiscal year on Form N-Q. The fund’s Form N-Q is available on the EDGAR database on the Commission’s Internet Web site at http://www.sec.gov, and may be reviewed and copied at the:
Public Reference Room
Securities and Exchange Commission
100 F Street, NE, Room 1580
Washington, D.C. 20549
Information on the operation of the Public Reference Room may be obtained by calling the Commission at 1-800-SEC-0330. Copies of the fund’s Form N-Q also may be obtained, upon payment of a duplicating fee, by electronic request at the following e-mail address: publicinfo@sec.gov or by writing the Public Reference Section at the above address.
From time to time, MFS may post important information about the fund or the MFS funds on the MFS web site (mfs.com). This information is available by visiting the “News & Commentary” section of mfs.com or by clicking on the fund’s name under “Variable Insurance Portfolios — VIT II” in the “Products” section of mfs.com.
FEDERAL TAX INFORMATION (unaudited)
The following information is provided pursuant to provisions of the Internal Revenue Code.
For corporate shareholders, 39.35% of the ordinary income dividends paid during the fiscal year qualify for the corporate dividends received deduction.
27
Table of Contents
rev. 3/11

| Why? | Financial companies choose how they share your personal information. Federal law gives consumers the right to limit some but not all sharing. Federal law also requires us to tell you how we collect, share, and protect your personal information. Please read this notice carefully to understand what we do. |
| What? | The types of personal information we collect and share depend on the product or service you have with us. This information can include:
• Social Security number and account balances • Account transactions and transaction history • Checking account information and wire transfer instructions
When you are no longer our customer, we continue to share your information as described in this notice. |
| How? | All financial companies need to share customers’ personal information to run their everyday business. In the section below, we list the reasons financial companies can share their customers’ personal information; the reasons MFS chooses to share; and whether you can limit this sharing. |
| Reasons we can share your personal information | Does MFS share? | Can you limit this sharing? | ||
For our everyday business purposes – such as to process your transactions, maintain your account(s), respond to court orders and legal investigations, or report to credit bureaus | Yes | No | ||
For our marketing purposes – to offer our products and services to you | No | We don’t share | ||
| For joint marketing with other financial companies | No | We don’t share | ||
For our affiliates’ everyday business purposes – information about your transactions and experiences | No | We don’t share | ||
For our affiliates’ everyday business purposes – information about your creditworthiness | No | We don’t share | ||
| For nonaffiliates to market to you | No | We don’t share |
| Questions? | Call 800-225-2606 or go to mfs.com. |
28
Table of Contents
| Page 2 |
| Who we are | ||
| Who is providing this notice? | MFS Funds, MFS Investment Management, MFS Institutional Advisors, Inc., MFS Fund Distributors, Inc., MFS Heritage Trust Company, and MFS Service Center, Inc. | |
| What we do | ||
| How does MFS protect my personal information? | To protect your personal information from unauthorized access and use, we use security measures that comply with federal law. These measures include procedural, electronic, and physical safeguards for the protection of the personal information we collect about you. | |
| How does MFS collect my personal information? | We collect your personal information, for example, when you
• open an account or provide account information • direct us to buy securities or direct us to sell your securities • make a wire transfer
We also collect your personal information from others, such as credit bureaus, affiliates and other companies. | |
| Why can’t I limit all sharing? | Federal law gives you the right to limit only
• sharing for affiliates’ everyday business purposes – information about your creditworthiness • affiliates from using your information to market to you • sharing for nonaffiliates to market to you
State laws and individual companies may give you additional rights to limit sharing. | |
| Definitions | ||
| Affiliates | Companies related by common ownership or control. They can be financial and nonfinancial companies.
•MFS does not share personal information with affiliates, except for everyday business purposes as described on page one of this notice. | |
| Nonaffiliates | Companies not related by common ownership or control. They can be financial and nonfinancial companies.
•MFS does not share with nonaffiliates so they can market to you. | |
| Joint Marketing | A formal agreement between nonaffiliated financial companies that together market financial products or services to you.
•MFS doesn’t jointly market. | |
| Other important information | ||
| If you own an MFS product or receive an MFS service in the name of a third party such as a bank or broker-dealer, their privacy policy may apply to you instead of ours. | ||
29
Table of Contents
Table of Contents
ANNUAL REPORT
December 31, 2012

MFS® MASSACHUSETTS INVESTORS GROWTH STOCK PORTFOLIO
MFS® Variable Insurance Trust II

MIS-ANN
Table of Contents
MFS® MASSACHUSETTS INVESTORS GROWTH STOCK PORTFOLIO
The report is prepared for the general information of contract owners. It is authorized for distribution to prospective investors only when preceded or accompanied by a current prospectus.
NOT FDIC INSURED Ÿ MAY LOSE VALUE Ÿ NO BANK OR CREDIT UNION GUARANTEE Ÿ NOT A DEPOSIT Ÿ NOT INSURED BY ANY FEDERAL GOVERNMENT AGENCY OR NCUA/NCUSIF
Table of Contents
MFS Massachusetts Investors Growth Stock Portfolio
LETTER FROM THE CHAIRMAN AND CEO

Dear Contract Owners:
The global market outlook for 2013 is one of cautious optimism. While we are seeing some positive economic trends in the United States, Europe and China, the overall environment remains challenging. In the United States, the recent fiscal cliff agreement was received positively by investors, even though it mostly addressed pressing taxation issues and did not resolve additional concerns, including the need for spending cuts and a large-scale reduction of the federal debt. These issues will be front and center again in the spring. Despite the ongoing uncertainty, economic tailwinds are gathering strength as the U.S. housing and job markets are improving and consumer confidence is rising.
Overseas, the debt crisis continues to weigh heavily on eurozone markets, with even Germany — long an economic stalwart — experiencing some contraction. These ongoing challenges could be a drag on global market performance this year. In Asia, manufacturing activity has accelerated in emerging markets such as China and India, and we are seeing signs of stabilized loan growth in China, a leading indicator of that country’s economic health. In contrast, Japan’s economy is contracting sharply under deflationary pressures. Nevertheless, Japanese markets have responded favorably to early actions by the new government, which appears determined to act aggressively, along with the Bank of Japan, to stimulate growth.
As always, managing risk in the face of uncertainty remains a top priority for investors. At MFS®, our uniquely collaborative investment process revolves around global research and our disciplined risk management approach. Our global team of investment professionals shares ideas and evaluates opportunities across continents, investment disciplines and asset classes — all with a goal of building better insights, and ultimately better results, for our clients.
We remain mindful of the many economic challenges investors face today, and believe it is more important than ever to maintain a long-term view, employ time-tested principles, such as asset allocation and diversification, and work closely with investment advisors to identify and pursue the most suitable opportunities.
Respectfully,

Robert J. Manning
Chairman and Chief Executive Officer
MFS Investment Management®
February 15, 2013
The opinions expressed in this letter are subject to change, may not be relied upon for investment advice, and no forecasts can be guaranteed.
1
Table of Contents
MFS Massachusetts Investors Growth Stock Portfolio
Portfolio structure
| Top ten holdings | ||||
| Google, Inc., “A” | 4.3% | |||
| Danaher Corp. | 4.0% | |||
| Apple, Inc. | 3.6% | |||
| United Technologies Corp. | 3.6% | |||
| Oracle Corp. | 3.5% | |||
| Colgate-Palmolive Co. | 3.3% | |||
| Accenture PLC, “A” | 3.3% | |||
| Visa, Inc., “A” | 3.1% | |||
| Procter & Gamble Co. | 2.7% | |||
| Franklin Resources, Inc. | 2.6% |
| Equity sectors | ||||
| Technology | 21.7% | |||
| Industrial Goods & Services | 15.5% | |||
| Consumer Staples | 13.0% | |||
| Health Care | 11.5% | |||
| Financial Services | 8.3% | |||
| Leisure | 6.3% | |||
| Retailing | 6.0% | |||
| Special Products & Services | 5.1% | |||
| Energy | 3.9% | |||
| Transportation | 3.1% | |||
| Basic Materials | 2.7% | |||
| Autos & Housing | 2.2% |
Percentages are based on net assets as of 12/31/12.
The portfolio is actively managed and current holdings may be different.
2
Table of Contents
MFS Massachusetts Investors Growth Stock Portfolio
Summary of Results
For the twelve months ended December 31, 2012, Initial Class shares of the MFS Massachusetts Investors Growth Stock Portfolio (“fund”) provided a total return of 17.25%, while Service Class shares of the fund provided a total return of 16.85%. These compare with a return of 15.26% over the same period for the fund’s benchmark, the Russell 1000 Growth Index.
Market Environment
The beginning of the period was characterized by a risk-on sentiment as a result of additional liquidity measures by the Federal Reserve Bank (“Fed”) and the European Central Bank (“ECB”) as well as a commensurate improvement in macroeconomic conditions. During this time, global equity valuations rose, credit spreads contracted, and high-quality sovereign yields increased modestly.
During the middle of the period, however, conditions worsened, driven by broadly weaker global macroeconomic indicators, as well as renewed concerns over the eurozone’s capacity and determination to address its ongoing crisis. Despite this deterioration, broad market sentiment remained relatively resilient as equity markets generally maintained gains and credit spreads did not indicate deterioration.
However, this renewed weakness in the fundamentals precipitated a further round of monetary easing by both the Fed (through a third round of quantitative easing) and the ECB (through a new bond purchase facility) in the second half of the period, which soon instilled additional confidence in risk markets. Nonetheless, towards the end of the period, weaker equity earnings reports and declining forward guidance caused market sentiment to soften. In addition, as we moved toward year end, the fiscal cliff negotiations between the Republicans in the U.S. Congress and President Obama were a particular source of market attention, where uncertainty surrounding the fiscal negotiations continued right up to the end-of-year deadline.
Contributors to Performance
The combination of stock selection and an overweight position in the financial services sector contributed to the fund’s performance relative to the Russell 1000 Growth Index. The fund’s overweight positions in shares of global payments technology company Visa Inc. and investment management firm Franklin Resources bolstered relative performance. Shares of Visa appreciated throughout the reporting period primarily due to increased dividends, a new share buyback program, and management’s increased earnings guidance.
Security selection and underweight position in the technology sector also benefited relative performance. The fund’s avoidance of poor-performing semiconductor company Intel helped results as the stock underperformed the benchmark during the reporting period. Shares of Intel depreciated as the company reported weak revenue due to competing iPads, soft demand for personal computers, and concerns over the macroeconomic environment. A significant reduction in its gross margin guidance late in the period, as a result of too much inventory and under-utilization charges, pressured earnings estimates and weighed on its share price. The fund’s overweight position in shares of strong-performing enterprise software products maker Oracle also supported positive performance.
Stock selection, and to a lesser extent, an overweight position in the industrial goods & services sector also strengthened relative returns. The fund’s holdings of electronics component manufacturer Amphenol contributed to relative performance. The stock appreciated due to increased demand, particularly in the automotive, industrial, commercial aerospace, and telecommunications markets. Increased inventories and the successful completion of the company’s acquisition of Holland Electronic further supported the stock.
Elsewhere, the fund’s position in shares of life science supply company Thermo Fisher Scientific (b) aided relative results. The timing of the fund’s ownership in shares of integrated oil and gas company Exxon Mobil (h) and fast-food company giant McDonald’s also supported relative performance. Additionally, holdings of stand-out performing Spanish fashion distributor Industria de Diseno Textil S.A. (b) and French luxury goods company LVMH Moët Hennessy Louis Vuitton (b) contributed to relative performance.
Detractors from Performance
Security selection in the health care sector detracted from relative returns during the reporting period. Not holding shares of strong-performing biotech firm Gilead Sciences held back relative performance. The stock spiked late in the reporting period as the firm announced the phase III testing of its GS-7977 drug which was created to cure the hepatitis C virus. The test, which involved 25 patients, showed a 100% cure rate after four weeks of administering the drug to patients.
Stocks in other sectors that held back relative performance included the fund’s holdings of semiconductor company Microchip Technology, index data provider MSCI, oil and gas exploration and production company Occidental Petroleum, security software provider Check Point Software Technologies (b), discount department store Kohl’s, and household products maker Procter & Gamble. Shares of Kohl’s declined as sales suffered late in the reporting period as a result of superstorm Sandy which negatively affected the
3
Table of Contents
MFS Massachusetts Investors Growth Stock Portfolio
Management Review – continued
company’s stores located in the Northeast. In addition, sales were also negatively impacted by Black Friday weakness caused by the fact that Kohl’s did not open on Thanksgiving while several other retailers did. Not holding shares of strong-performing internet retailer Amazon.Com and home improvement retailer Home Depot also held back relative performance. The fund’s underweight position in computer and personal electronics maker Apple was another top relative detractor as the stock outperformed the benchmark during the reporting period.
Respectfully,
Jeffrey Constantino
Portfolio Manager
| (b) | Security is not a benchmark constituent. |
| (h) | Security was not held in the portfolio at period end. |
The views expressed in this report are those of the portfolio manager only through the end of the period of the report as stated on the cover and do not necessarily reflect the views of MFS or any other person in the MFS organization. These views are subject to change at any time based on market or other conditions, and MFS disclaims any responsibility to update such views. These views may not be relied upon as investment advice or an indication of trading intent on behalf of any MFS portfolio. References to specific securities are not recommendations of such securities, and may not be representative of any MFS portfolio’s current or future investments.
4
Table of Contents
MFS Massachusetts Investors Growth Stock Portfolio
PERFORMANCE SUMMARY THROUGH 12/31/12
The following chart illustrates the historical performance of the fund in comparison to its benchmark(s). Benchmarks are unmanaged and may not be invested in directly. Benchmark returns do not reflect any fees or expenses. The performance of other share classes will be greater than or less than that of the class depicted below. (See Notes to Performance Summary.)
Performance data shown represents past performance and is no guarantee of future results. Investment return and principal value fluctuate so your units, when sold, may be worth more or less than the original cost; current performance may be lower or higher than quoted. The performance shown does not reflect the deduction of taxes, if any, that a contract holder would pay on fund distributions or the redemption of contract units. The returns for the fund shown also do not reflect the deduction of expenses associated with variable products, such as mortality and expense risk charges, separate account charges, and sales charges imposed by the insurance company separate accounts. Such expenses would reduce the overall returns shown.
Growth of a Hypothetical $10,000 Investment
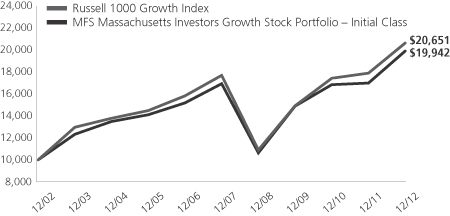
Total Returns through 12/31/12
Average annual total returns
| Share Class | Class inception date | 1-yr | 5-yr | 10-yr | ||||||||
| Initial Class | 5/06/98 | 17.25% | 3.31% | 7.15% | ||||||||
| Service Class | 8/24/01 | 16.85% | 3.03% | 6.86% | ||||||||
| Comparative benchmark | ||||||||||||
| Russell 1000 Growth Index (f) | 15.26% | 3.12% | 7.52% | |||||||||
| (f) | Source: FactSet Research Systems Inc. |
Benchmark Definition
Russell 1000 Growth Index – constructed to provide a comprehensive barometer for growth securities in the large-cap segment of the U.S. equity universe. Companies in this index generally have higher price-to-book ratios and higher forecasted growth values.
It is not possible to invest directly in an index.
Notes to Performance Summary
Average annual total return represents the average annual change in value for each share class for the periods presented.
Performance results reflect any applicable expense subsidies and waivers in effect during the periods shown. Without such subsidies and waivers the fund’s performance results would be less favorable. Please see the prospectus and financial statements for complete details. All results are historical and assume the reinvestment of any dividends and capital gains distributions.
Performance results do not include adjustments made for financial reporting purposes in accordance with U.S. generally accepted accounting principles and may differ from amounts reported in the financial highlights.
From time to time the fund may receive proceeds from litigation settlements, without which performance would be lower.
5
Table of Contents
MFS Massachusetts Investors Growth Stock Portfolio
Fund Expenses Borne by the Contract Holders During the Period,
July 1, 2012 through December 31, 2012
As a contract holder of the fund, you incur ongoing costs, including management fees; distribution and/or service (12b-1) fees; and other fund expenses. This example is intended to help you understand your ongoing costs (in dollars) of investing in the fund and to compare these costs with the ongoing costs of investing in other mutual funds.
The example is based on an investment of $1,000 invested at the beginning of the period and held for the entire period July 1, 2012 through December 31, 2012.
Actual Expenses
The first line for each share class in the following table provides information about actual account values and actual expenses. You may use the information in this line, together with the amount you invested, to estimate the expenses that you paid over the period. Simply divide your account value by $1,000 (for example, an $8,600 account value divided by $1,000 = 8.6), then multiply the result by the number in the first line under the heading entitled “Expenses Paid During Period” to estimate the expenses you paid on your account during this period.
Hypothetical Example for Comparison Purposes
The second line for each share class in the following table provides information about hypothetical account values and hypothetical expenses based on the fund’s actual expense ratio and an assumed rate of return of 5% per year before expenses, which is not the fund’s actual return. The hypothetical account values and expenses may not be used to estimate the actual ending account balance or expenses you paid for the period. You may use this information to compare the ongoing costs of investing in the fund and other funds. To do so, compare this 5% hypothetical example with the 5% hypothetical examples that appear in the shareholder reports of the other funds.
Please note that the expenses shown in the table are meant to highlight the fund’s ongoing costs only and do not take into account the fees and expenses imposed under the variable contracts through which your investment in the fund is made. Therefore, the second line for each share class in the table is useful in comparing ongoing costs associated with an investment in vehicles (such as the fund) which fund benefits under variable annuity and variable life insurance contracts and to qualified pension and retirement plans only, and will not help you determine the relative total costs of investing in the fund through variable annuity and variable life insurance contracts. If the fees and expenses imposed under the variable contracts were included, your costs would have been higher.
| Share Class | Annualized Expense Ratio | Beginning 7/01/12 | Ending Account Value 12/31/12 | Expenses Paid During Period (p) 7/01/12-12/31/12 | ||||||||||||||
| Initial Class | Actual | 0.80% | $1,000.00 | $1,084.40 | $4.19 | |||||||||||||
| Hypothetical (h) | 0.80% | $1,000.00 | $1,021.11 | $4.06 | ||||||||||||||
| Service Class | Actual | 1.05% | $1,000.00 | $1,082.83 | $5.50 | |||||||||||||
| Hypothetical (h) | 1.05% | $1,000.00 | $1,019.86 | $5.33 | ||||||||||||||
| (h) | 5% class return per year before expenses. |
| (p) | Expenses paid are equal to each class’s annualized expense ratio, as shown above, multiplied by the average account value over the period, multiplied by the number of days in the period, divided by the number of days in the year. |
6
Table of Contents
MFS Massachusetts Investors Growth Stock Portfolio
PORTFOLIO OF INVESTMENTS – 12/31/12
The Portfolio of Investments is a complete list of all securities owned by your fund. It is categorized by broad-based asset classes.
| Issuer | Shares/Par | Value ($) | ||||||
| COMMON STOCKS – 99.3% | ||||||||
| Aerospace – 5.1% | ||||||||
| Precision Castparts Corp. | 44,160 | $ | 8,364,781 | |||||
| United Technologies Corp. | 237,800 | 19,501,978 | ||||||
|
| |||||||
| $ | 27,866,759 | |||||||
|
| |||||||
| Alcoholic Beverages – 1.0% | ||||||||
| Diageo PLC | 177,030 | $ | 5,153,790 | |||||
|
| |||||||
| Apparel Manufacturers – 3.2% | ||||||||
| LVMH Moet Hennessy Louis Vuitton S.A. | 54,448 | $ | 10,146,231 | |||||
| NIKE, Inc., “B” | 137,240 | 7,081,584 | ||||||
|
| |||||||
| $ | 17,227,815 | |||||||
|
| |||||||
| Automotive – 2.2% | ||||||||
| Johnson Controls, Inc. | 397,720 | $ | 12,210,004 | |||||
|
| |||||||
| Broadcasting – 3.8% | ||||||||
| Discovery Communications, Inc., “A” (a) | 71,200 | $ | 4,519,776 | |||||
| Omnicom Group, Inc. | 61,050 | 3,050,058 | ||||||
| Viacom, Inc., “B” | 121,440 | 6,404,746 | ||||||
| Walt Disney Co. | 128,610 | 6,403,492 | ||||||
|
| |||||||
| $ | 20,378,072 | |||||||
|
| |||||||
| Brokerage & Asset Managers – 3.9% | ||||||||
| Charles Schwab Corp. | 313,730 | $ | 4,505,163 | |||||
| CME Group, Inc. | 51,570 | 2,615,115 | ||||||
| Franklin Resources, Inc. | 110,410 | 13,878,537 | ||||||
|
| |||||||
| $ | 20,998,815 | |||||||
|
| |||||||
| Business Services – 5.1% | ||||||||
| Accenture PLC, “A” | 266,010 | $ | 17,689,665 | |||||
| MSCI, Inc., “A” (a) | 155,590 | 4,821,734 | ||||||
| Verisk Analytics, Inc., “A” (a) | 98,030 | 4,999,530 | ||||||
|
| |||||||
| $ | 27,510,929 | |||||||
|
| |||||||
| Cable TV – 0.7% | ||||||||
| DIRECTV, “A” (a) | 75,410 | $ | 3,782,566 | |||||
|
| |||||||
| Chemicals – 0.6% | ||||||||
| Monsanto Co. | 34,730 | $ | 3,287,195 | |||||
|
| |||||||
| Computer Software – 5.8% | ||||||||
| Autodesk, Inc. (a) | 151,550 | $ | 5,357,293 | |||||
| Check Point Software Technologies Ltd. (a) | 145,560 | 6,934,478 | ||||||
| Oracle Corp. | 576,530 | 19,209,980 | ||||||
|
| |||||||
| $ | 31,501,751 | |||||||
|
| |||||||
| Computer Software – Systems – 6.4% | ||||||||
| Apple, Inc. | 36,630 | $ | 19,524,889 | |||||
| EMC Corp. (a) | 286,100 | 7,238,330 | ||||||
| International Business Machines Corp. | 42,420 | 8,125,551 | ||||||
|
| |||||||
| $ | 34,888,770 | |||||||
|
| |||||||
| Issuer | Shares/Par | Value ($) | ||||||
| COMMON STOCKS – continued | ||||||||
| Consumer Products – 6.7% | ||||||||
| Church & Dwight Co., Inc. | 66,270 | $ | 3,550,084 | |||||
| Colgate-Palmolive Co. | 171,480 | 17,926,519 | ||||||
| Procter & Gamble Co. | 215,861 | 14,654,803 | ||||||
|
| |||||||
| $ | 36,131,406 | |||||||
|
| |||||||
| Electrical Equipment – 10.4% | ||||||||
| Amphenol Corp., “A” | 101,370 | $ | 6,558,639 | |||||
| Danaher Corp. | 384,550 | 21,496,345 | ||||||
| Mettler-Toledo International, Inc. (a) | 43,870 | 8,480,071 | ||||||
| Sensata Technologies Holding B.V. (a) | 363,220 | 11,797,386 | ||||||
| W.W. Grainger, Inc. | 38,140 | 7,718,392 | ||||||
|
| |||||||
| $ | 56,050,833 | |||||||
|
| |||||||
| Electronics – 4.2% | ||||||||
| ASML Holding N.V. (l) | 39,799 | $ | 2,563,454 | |||||
| Microchip Technology, Inc. | 385,170 | 12,552,690 | ||||||
| Taiwan Semiconductor Manufacturing Co. Ltd., ADR | 452,269 | 7,760,936 | ||||||
|
| |||||||
| $ | 22,877,080 | |||||||
|
| |||||||
| Energy – Independent – 1.2% | ||||||||
| Occidental Petroleum Corp. | 88,750 | $ | 6,799,138 | |||||
|
| |||||||
| Food & Beverages – 5.3% | ||||||||
| Groupe Danone | 188,606 | $ | 12,461,128 | |||||
| Mead Johnson Nutrition Co., “A” | 119,370 | 7,865,289 | ||||||
| PepsiCo, Inc. | 125,220 | 8,568,805 | ||||||
|
| |||||||
| $ | 28,895,222 | |||||||
|
| |||||||
| Food & Drug Stores – 0.7% | ||||||||
| CVS Caremark Corp. | 76,836 | $ | 3,715,021 | |||||
|
| |||||||
| General Merchandise – 1.3% | ||||||||
| Kohl’s Corp. | 69,410 | $ | 2,983,242 | |||||
| Target Corp. | 67,790 | 4,011,134 | ||||||
|
| |||||||
| $ | 6,994,376 | |||||||
|
| |||||||
| Internet – 5.3% | ||||||||
| eBay, Inc. (a) | 98,910 | $ | 5,046,388 | |||||
| Google, Inc., “A” (a) | 33,110 | 23,487,241 | ||||||
|
| |||||||
| $ | 28,533,629 | |||||||
|
| |||||||
| Medical & Health Technology & Services – 1.8% | ||||||||
| Express Scripts Holding Co. (a) | 133,567 | $ | 7,212,618 | |||||
| Patterson Cos., Inc. | 78,382 | 2,683,016 | ||||||
|
| |||||||
| $ | 9,895,634 | |||||||
|
| |||||||
| Medical Equipment – 7.2% | ||||||||
| Becton, Dickinson & Co. | 44,420 | $ | 3,473,200 | |||||
| DENTSPLY International, Inc. | 302,920 | 11,998,661 | ||||||
| St. Jude Medical, Inc. | 81,930 | 2,960,950 | ||||||
| Thermo Fisher Scientific, Inc. | 208,800 | 13,317,264 | ||||||
| Waters Corp. (a) | 80,250 | 6,991,380 | ||||||
|
| |||||||
| $ | 38,741,455 | |||||||
|
| |||||||
7
Table of Contents
MFS Massachusetts Investors Growth Stock Portfolio
Portfolio of Investments – continued
| Issuer | Shares/Par | Value ($) | ||||||
| COMMON STOCKS – continued | ||||||||
| Metals & Mining – 0.6% | ||||||||
| Rio Tinto Ltd. | 58,140 | $ | 3,387,961 | |||||
|
| |||||||
| Oil Services – 2.7% | ||||||||
| National Oilwell Varco, Inc. | 34,630 | $ | 2,366,961 | |||||
| Schlumberger Ltd. | 177,150 | 12,274,724 | ||||||
|
| |||||||
| $ | 14,641,685 | |||||||
|
| |||||||
| Other Banks & Diversified Financials – 4.4% | ||||||||
| MasterCard, Inc., “A” | 13,870 | $ | 6,814,054 | |||||
| Visa, Inc., “A” | 112,030 | 16,981,507 | ||||||
|
| |||||||
| $ | 23,795,561 | |||||||
|
| |||||||
| Pharmaceuticals – 2.5% | ||||||||
| Allergan, Inc. | 43,920 | $ | 4,028,782 | |||||
| Johnson & Johnson | 133,120 | 9,331,712 | ||||||
|
| |||||||
| $ | 13,360,494 | |||||||
|
| |||||||
| Railroad & Shipping – 0.8% | ||||||||
| Kuehne & Nagel, Inc. AG | 35,790 | $ | 4,355,671 | |||||
|
| |||||||
| Restaurants – 1.8% | ||||||||
| McDonald’s Corp. | 111,800 | $ | 9,861,878 | |||||
|
| |||||||
| Specialty Chemicals – 1.5% | ||||||||
| Praxair, Inc. | 73,130 | $ | 8,004,079 | |||||
|
| |||||||
| Specialty Stores – 0.8% | ||||||||
| Industria de Diseno Textil S.A. | 29,325 | $ | 4,108,370 | |||||
|
| |||||||
| Trucking – 2.3% | ||||||||
| Expeditors International of Washington, Inc. | 312,020 | $ | 12,340,391 | |||||
|
| |||||||
| Total Common Stocks (Identified Cost, $449,238,134) | $ | 537,296,350 | ||||||
|
| |||||||
| Issuer | Shares/Par | Value ($) | ||||||
| MONEY MARKET FUNDS – 0.9% | ||||||||
| MFS Institutional Money Market Portfolio, 0.16%, at Cost and Net Asset Value (v) | 4,898,676 | $ | 4,898,676 | |||||
|
| |||||||
| COLLATERAL FOR SECURITIES LOANED – 0.3% | ||||||||
| Navigator Securities Lending Prime Portfolio, 0.28%, at Cost and Net Asset Value (j) | 1,873,919 | $ | 1,873,919 | |||||
|
| |||||||
| Total Investments (Identified Cost, $456,010,729) | $ | 544,068,945 | ||||||
|
| |||||||
| OTHER ASSETS, LESS LIABILITIES – (0.5)% | (2,856,116 | ) | ||||||
|
| |||||||
| Net Assets – 100.0% | $ | 541,212,829 | ||||||
|
| |||||||
| (a) | Non-income producing security. |
| (j) | The rate quoted is the annualized seven-day yield of the fund at period end. |
| (l) | A portion of this security is on loan. |
| (v) | Underlying affiliated fund that is available only to investment companies managed by MFS. The rate quoted for the MFS Institutional Money Market Portfolio is the annualized seven-day yield of the fund at period end. |
The following abbreviations are used in this report and are defined:
| ADR | American Depositary Receipt |
| PLC | Public Limited Company |
See Notes to Financial Statements
8
Table of Contents
MFS Massachusetts Investors Growth Stock Portfolio
FINANCIAL STATEMENTS | STATEMENT OF ASSETS AND LIABILITIES
This statement represents your fund’s balance sheet, which details the assets and liabilities comprising the total value of the fund.
At 12/31/12 | ||||||||
Assets | ||||||||
Investments – | ||||||||
Non-affiliated issuers, at value (identified cost, $451,112,053) | $539,170,269 | |||||||
Underlying affiliated funds, at cost and value | 4,898,676 | |||||||
Total investments, at value, including $1,870,723 of securities on loan (identified cost, $456,010,729) | $544,068,945 | |||||||
Cash | 67,431 | |||||||
Receivable for interest and dividends | 313,844 | |||||||
Other assets | 5,794 | |||||||
Total assets | $544,456,014 | |||||||
Liabilities | ||||||||
Payable for fund shares reacquired | $1,255,142 | |||||||
Collateral for securities loaned, at value | 1,873,919 | |||||||
Payable to affiliates | ||||||||
Investment adviser | 44,993 | |||||||
Distribution and/or service fees | 1,374 | |||||||
Payable for independent Trustees’ compensation | 71 | |||||||
Accrued expenses and other liabilities | 67,686 | |||||||
Total liabilities | $3,243,185 | |||||||
Net assets | $541,212,829 | |||||||
Net assets consist of | ||||||||
Paid-in capital | $488,384,793 | |||||||
Unrealized appreciation (depreciation) on investments and translation of assets and liabilities in foreign currencies | 88,071,212 | |||||||
Accumulated net realized gain (loss) on investments and foreign currency | (39,191,521 | ) | ||||||
Undistributed net investment income | 3,948,345 | |||||||
Net assets | $541,212,829 | |||||||
Shares of beneficial interest outstanding | 40,518,720 |
| Net assets | Shares outstanding | Net asset value per share | ||||||||||
Initial Class | $490,629,657 | 36,708,144 | $13.37 | |||||||||
Service Class | 50,583,172 | 3,810,576 | 13.27 | |||||||||
See Notes to Financial Statements
9
Table of Contents
MFS Massachusetts Investors Growth Stock Portfolio
FINANCIAL STATEMENTS | STATEMENT OF OPERATIONS
This statement describes how much your fund earned in investment income and accrued in expenses. It also describes any gains and/or losses generated by fund operations.
Year ended 12/31/12 | ||||||||
Net investment income | ||||||||
Income | ||||||||
Dividends | $8,656,981 | |||||||
Interest | 28,676 | |||||||
Dividends from underlying affiliated funds | 6,872 | |||||||
Foreign taxes withheld | (165,960 | ) | ||||||
Total investment income | $8,526,569 | |||||||
Expenses | ||||||||
Management fee | $4,157,011 | |||||||
Distribution and/or service fees | 134,062 | |||||||
Administrative services fee | 89,517 | |||||||
Independent Trustees’ compensation | 20,885 | |||||||
Custodian fee | 57,772 | |||||||
Shareholder communications | 31,118 | |||||||
Audit and tax fees | 50,379 | |||||||
Legal fees | 9,234 | |||||||
Miscellaneous | 28,155 | |||||||
Total expenses | $4,578,133 | |||||||
Fees paid indirectly | (4 | ) | ||||||
Reduction of expenses by investment adviser | (1,987 | ) | ||||||
Net expenses | $4,576,142 | |||||||
Net investment income | $3,950,427 | |||||||
Realized and unrealized gain (loss) on investments and foreign currency | ||||||||
Realized gain (loss) (identified cost basis) | ||||||||
Investments | $45,112,107 | |||||||
Foreign currency | 3,628 | |||||||
Net realized gain (loss) on investments and foreign currency | $45,115,735 | |||||||
Change in unrealized appreciation (depreciation) | ||||||||
Investments | $39,033,540 | |||||||
Translation of assets and liabilities in foreign currencies | (513 | ) | ||||||
Net unrealized gain (loss) on investments and foreign currency translation | $39,033,027 | |||||||
Net realized and unrealized gain (loss) on investments and foreign currency | $84,148,762 | |||||||
Change in net assets from operations | $88,099,189 |
See Notes to Financial Statements
10
Table of Contents
MFS Massachusetts Investors Growth Stock Portfolio
FINANCIAL STATEMENTS | STATEMENTS OF CHANGES IN NET ASSETS
These statements describe the increases and/or decreases in net assets resulting from operations, any distributions, and any shareholder transactions.
For years ended 12/31 | 2012 | 2011 | ||||||
Change in net assets | ||||||||
From operations | ||||||||
Net investment income | $3,950,427 | $2,100,396 | ||||||
Net realized gain (loss) on investments and foreign currency | 45,115,735 | 29,337,064 | ||||||
Net unrealized gain (loss) on investments and foreign currency translation | 39,033,027 | (28,669,481 | ) | |||||
Change in net assets from operations | $88,099,189 | $2,767,979 | ||||||
Distributions declared to shareholders | ||||||||
| From net investment income | $(2,110,200 | ) | $(2,503,255 | ) | ||||
Change in net assets from fund share transactions | $(83,879,993 | ) | $39,199,459 | |||||
Total change in net assets | $2,108,996 | $39,464,183 | ||||||
Net assets | ||||||||
At beginning of period | 539,103,833 | 499,639,650 | ||||||
At end of period (including undistributed net investment income of $3,948,345 and | $541,212,829 | $539,103,833 |
See Notes to Financial Statements
11
Table of Contents
MFS Massachusetts Investors Growth Stock Portfolio
FINANCIAL STATEMENTS | FINANCIAL HIGHLIGHTS
The financial highlights table is intended to help you understand the fund’s financial performance for the past 5 years. Certain information reflects financial results for a single fund share. The total returns in the table represent the rate by which an investor would have earned (or lost) on an investment in the fund share class (assuming reinvestment of all distributions) held for the entire period.
| Initial Class | Years ended 12/31 | |||||||||||||||||||
| 2012 | 2011 | 2010 | 2009 | 2008 | ||||||||||||||||
Net asset value, beginning of period | $11.45 | $11.43 | $10.13 | $7.30 | $11.69 | |||||||||||||||
| Income (loss) from investment operations | ||||||||||||||||||||
Net investment income (d) | $0.09 | $0.06 | $0.06 | $0.05 | $0.06 | |||||||||||||||
Net realized and unrealized gain (loss) on investments and foreign currency | 1.88 | 0.03 | 1.27 | 2.85 | (4.39 | ) | ||||||||||||||
Total from investment operations | $1.97 | $0.09 | $1.33 | $2.90 | $(4.33 | ) | ||||||||||||||
| Less distributions declared to shareholders | ||||||||||||||||||||
From net investment income | $(0.05 | ) | $(0.07 | ) | $(0.03 | ) | $(0.07 | ) | $(0.06 | ) | ||||||||||
Net asset value, end of period (x) | $13.37 | $11.45 | $11.43 | $10.13 | $7.30 | |||||||||||||||
Total return (%) (k)(r)(s)(x) | 17.25 | 0.80 | 13.15 | 40.14 | (37.22 | ) | ||||||||||||||
| Ratios (%) (to average net assets) and Supplemental data: | ||||||||||||||||||||
Expenses before expense reductions (f) | 0.80 | 0.83 | 0.86 | 0.87 | 0.86 | |||||||||||||||
Expenses after expense reductions (f) | 0.80 | 0.82 | 0.82 | 0.82 | 0.83 | |||||||||||||||
Net investment income | 0.74 | 0.47 | 0.55 | 0.62 | 0.62 | |||||||||||||||
Portfolio turnover | 30 | 24 | 45 | 53 | 42 | |||||||||||||||
Net assets at end of period (000 omitted) | $490,630 | $485,484 | $429,925 | $448,333 | $145,858 | |||||||||||||||
| Service Class | Years ended 12/31 | |||||||||||||||||||
| 2012 | 2011 | 2010 | 2009 | 2008 | ||||||||||||||||
Net asset value, beginning of period | $11.37 | $11.34 | $10.06 | $7.24 | $11.59 | |||||||||||||||
| Income (loss) from investment operations | ||||||||||||||||||||
Net investment income (d) | $0.06 | $0.03 | $0.03 | $0.04 | $0.04 | |||||||||||||||
Net realized and unrealized gain (loss) on investments and foreign currency | 1.86 | 0.03 | 1.26 | 2.82 | (4.36 | ) | ||||||||||||||
Total from investment operations | $1.92 | $0.06 | $1.29 | $2.86 | $(4.32 | ) | ||||||||||||||
| Less distributions declared to shareholders | ||||||||||||||||||||
From net investment income | $(0.02 | ) | $(0.03 | ) | $(0.01 | ) | $(0.04 | ) | $(0.03 | ) | ||||||||||
Net asset value, end of period (x) | $13.27 | $11.37 | $11.34 | $10.06 | $7.24 | |||||||||||||||
Total return (%) (k)(r)(s)(x) | 16.85 | 0.57 | 12.83 | 39.78 | (37.35 | ) | ||||||||||||||
| Ratios (%) (to average net assets) and Supplemental data: | ||||||||||||||||||||
Expenses before expense reductions (f) | 1.05 | 1.08 | 1.11 | 1.12 | 1.11 | |||||||||||||||
Expenses after expense reductions (f) | 1.05 | 1.07 | 1.07 | 1.07 | 1.08 | |||||||||||||||
Net investment income | 0.48 | 0.22 | 0.30 | 0.43 | 0.37 | |||||||||||||||
Portfolio turnover | 30 | 24 | 45 | 53 | 42 | |||||||||||||||
Net assets at end of period (000 omitted) | $50,583 | $53,620 | $69,714 | $80,269 | $59,579 | |||||||||||||||
| (d) | Per share data is based on average shares outstanding. |
| (f) | Ratios do not reflect reductions from fees paid indirectly, if applicable. |
| (k) | The total return does not reflect expenses that apply to separate accounts. Inclusion of these charges would reduce the total return figures for all periods shown. |
| (r) | Certain expenses have been reduced without which performance would have been lower. |
| (s) | From time to time the fund may receive proceeds from litigation settlements, without which performance would be lower. |
| (x) | The net asset values per share and total returns have been calculated on net assets which include adjustments made in accordance with U.S. generally accepted accounting principles required at period end for financial reporting purposes. |
See Notes to Financial Statements
12
Table of Contents
MFS Massachusetts Investors Growth Stock Portfolio
| (1) | Business and Organization |
MFS Massachusetts Investors Growth Stock Portfolio (the fund) is a series of MFS Variable Insurance Trust II (the trust). The trust is organized as a Massachusetts business trust and is registered under the Investment Company Act of 1940, as amended, as an open-end management investment company. The shareholders of each series of the trust are separate accounts of insurance companies, which offer variable annuity and/or life insurance products, and qualified retirement and pension plans.
| (2) | Significant Accounting Policies |
General – The preparation of financial statements in conformity with U.S. generally accepted accounting principles requires management to make estimates and assumptions that affect the reported amounts of assets and liabilities, and disclosure of contingent assets and liabilities at the date of the financial statements and the reported amounts of revenues and expenses during the reporting period. Actual results could differ from those estimates. In the preparation of these financial statements, management has evaluated subsequent events occurring after the date of the fund’s Statement of Assets and Liabilities through the date that the financial statements were issued.
In this reporting period the fund adopted Financial Accounting Standards Board (FASB) Accounting Standards Update 2011-04, Fair Value Measurement (Topic 820) – Amendments to Achieve Common Fair Value Measurement and Disclosure Requirements in U.S. GAAP and IFRSs (“ASU 2011-04”). ASU 2011-04 seeks to improve the comparability of fair value measurements as presented and disclosed in financial statements prepared in accordance with U.S. GAAP and International Financial Reporting Standards (IFRS) by providing common requirements for fair value measurement and disclosure.
In December 2011, the FASB issued Accounting Standards Update 2011-11, Balance Sheet (Topic 210) – Disclosures about Offsetting Assets and Liabilities (“ASU 2011-11”). Effective for annual reporting periods beginning on or after January 1, 2013 and interim periods within those annual periods, ASU 2011-11 is intended to enhance disclosure requirements on the offsetting of financial assets and liabilities. Although still evaluating the potential impacts of ASU 2011-11 to the fund, management expects that the impact of the fund’s adoption will be limited to additional financial statement disclosures.
Investment Valuations – Equity securities, including restricted equity securities, are generally valued at the last sale or official closing price as provided by a third-party pricing service on the market or exchange on which they are primarily traded. Equity securities, for which there were no sales reported that day, are generally valued at the last quoted daily bid quotation as provided by a third-party pricing service on the market or exchange on which such securities are primarily traded. Short-term instruments with a maturity at issuance of 60 days or less generally are valued at amortized cost, which approximates market value. Open-end investment companies are generally valued at net asset value per share. Securities and other assets generally valued on the basis of information from a third-party pricing service may also be valued at a broker/dealer bid quotation. Values obtained from third-party pricing services can utilize both transaction data and market information such as yield, quality, coupon rate, maturity, type of issue, trading characteristics, and other market data. The values of foreign securities and other assets and liabilities expressed in foreign currencies are converted to U.S. dollars using the mean of bid and asked prices for rates provided by a third-party pricing service.
The Board of Trustees has delegated primary responsibility for determining or causing to be determined the value of the fund’s investments (including any fair valuation) to the adviser pursuant to valuation policies and procedures approved by the Board. If the adviser determines that reliable market quotations are not readily available, investments are valued at fair value as determined in good faith by the adviser in accordance with such procedures under the oversight of the Board of Trustees. Under the fund’s valuation policies and procedures, market quotations are not considered to be readily available for most types of debt instruments and floating rate loans and many types of derivatives. These investments are generally valued at fair value based on information from third-party pricing services. In addition, investments may be valued at fair value if the adviser determines that an investment’s value has been materially affected by events occurring after the close of the exchange or market on which the investment is principally traded (such as foreign exchange or market) and prior to the determination of the fund’s net asset value, or after the halting of trading of a specific security where trading does not resume prior to the close of the exchange or market on which the security is principally traded. Events that occur on a frequent basis after foreign markets close (such as developments in foreign markets and significant movements in the U.S. markets) and prior to the determination of the fund’s net asset value may be deemed to have a material effect on the value of securities traded in foreign markets. Accordingly, the fund’s foreign equity securities may often be valued at fair value. The adviser generally relies on third-party pricing services or other information (such as the correlation with price movements of similar securities in the same or other markets; the type, cost and investment characteristics of the security; the business and financial condition of the issuer; and trading and other market data) to assist in determining whether to fair value and at what value to fair value an investment. The value of an investment for purposes of calculating the fund’s net asset value can differ depending on the source and method used to determine value. When fair valuation is used, the value of an investment used to determine the fund’s net asset value may differ from quoted or published prices for the same investment. There can be no assurance that the fund could obtain the fair value assigned to an investment if it were to sell the investment at the same time at which the fund determines its net asset value per share.
13
Table of Contents
MFS Massachusetts Investors Growth Stock Portfolio
Notes to Financial Statements – continued
Various inputs are used in determining the value of the fund’s assets or liabilities. These inputs are categorized into three broad levels. In certain cases, the inputs used to measure fair value may fall into different levels of the fair value hierarchy. In such cases, an investment’s level within the fair value hierarchy is based on the lowest level of input that is significant to the fair value measurement. The fund’s assessment of the significance of a particular input to the fair value measurement in its entirety requires judgment, and considers factors specific to the investment. Level 1 includes unadjusted quoted prices in active markets for identical assets or liabilities. Level 2 includes other significant observable market-based inputs (including quoted prices for similar securities, interest rates, prepayment speed, and credit risk). Level 3 includes unobservable inputs, which may include the adviser’s own assumptions in determining the fair value of investments. The following is a summary of the levels used as of December 31, 2012 in valuing the fund’s assets or liabilities:
| Investments at Value | Level 1 | Level 2 | Level 3 | Total | ||||||||||||
| Equity Securities: | ||||||||||||||||
United States | $480,424,331 | $— | $— | $480,424,331 | ||||||||||||
France | — | 22,607,359 | — | 22,607,359 | ||||||||||||
United Kingdom | — | 8,541,751 | — | 8,541,751 | ||||||||||||
Taiwan | 7,760,936 | — | — | 7,760,936 | ||||||||||||
Israel | 6,934,478 | — | — | 6,934,478 | ||||||||||||
Switzerland | — | 4,355,671 | — | 4,355,671 | ||||||||||||
Spain | — | 4,108,370 | — | 4,108,370 | ||||||||||||
Netherlands | 2,563,454 | — | — | 2,563,454 | ||||||||||||
| Mutual Funds | 6,772,595 | — | — | 6,772,595 | ||||||||||||
| Total Investments | $504,455,794 | $39,613,151 | $— | $544,068,945 | ||||||||||||
For further information regarding security characteristics, see the Portfolio of Investments.
Of the level 2 investments presented above, equity investments amounting to $17,614,919 would have been considered level 1 investments at the beginning of the period. The primary reason for changes in the classifications between levels 1 and 2 occurs when foreign equity securities are fair valued using other observable market-based inputs in place of the closing exchange price due to events occurring after the close of the exchange or market on which the investment is principally traded. The fund’s foreign equity securities may often be valued at fair value. The fund’s policy is to recognize transfers between the levels as of the end of the period.
Foreign Currency Translation – Purchases and sales of foreign investments, income, and expenses are converted into U.S. dollars based upon currency exchange rates prevailing on the respective dates of such transactions or on the reporting date for foreign denominated receivables and payables. Gains and losses attributable to foreign currency exchange rates on sales of securities are recorded for financial statement purposes as net realized gains and losses on investments. Gains and losses attributable to foreign exchange rate movements on receivables, payables, income and expenses are recorded for financial statement purposes as foreign currency transaction gains and losses. That portion of both realized and unrealized gains and losses on investments that results from fluctuations in foreign currency exchange rates is not separately disclosed.
Security Loans – State Street Bank and Trust Company (“State Street”), as lending agent, loans the securities of the fund to certain qualified institutions (the “Borrowers”) approved by the fund. The loans are collateralized by cash and/or U.S. Treasury and federal agency obligations in an amount typically at least equal to the market value of the securities loaned. The market value of the loaned securities is determined at the close of business of the fund and any additional required collateral is delivered to the fund on the next business day. State Street provides the fund with indemnification against Borrower default. The fund bears the risk of loss with respect to the investment of cash collateral. On loans collateralized by cash, the cash collateral is invested in a money market fund or short-term securities. Collateral for securities loaned is held at carrying value, which approximates fair value. If the collateral for securities loaned was carried at fair value, its fair value would be considered level 2 under the fair value hierarchy. A portion of the income generated upon investment of the collateral is remitted to the Borrowers, and the remainder is allocated between the fund and the lending agent. On loans collateralized by U.S. Treasury and/or federal agency obligations, a fee is received from the Borrower, and is allocated between the fund and the lending agent. Income from securities lending is included in “Interest” income in the Statement of Operations. The dividend and interest income earned on the securities loaned is accounted for in the same manner as other dividend and interest income.
Indemnifications – Under the fund’s organizational documents, its officers and Trustees may be indemnified against certain liabilities and expenses arising out of the performance of their duties to the fund. Additionally, in the normal course of business, the fund enters into agreements with service providers that may contain indemnification clauses. The fund’s maximum exposure under these agreements is unknown as this would involve future claims that may be made against the fund that have not yet occurred.
Investment Transactions and Income – Investment transactions are recorded on the trade date. Interest income is recorded on the accrual basis. Dividends received in cash are recorded on the ex-dividend date. Certain dividends from foreign securities will be
14
Table of Contents
MFS Massachusetts Investors Growth Stock Portfolio
Notes to Financial Statements – continued
recorded when the fund is informed of the dividend if such information is obtained subsequent to the ex-dividend date. Dividend and interest payments received in additional securities are recorded on the ex-dividend or ex-interest date in an amount equal to the value of the security on such date.
The fund may receive proceeds from litigation settlements. Any proceeds received from litigation involving portfolio holdings are reflected in the Statement of Operations in realized gain/loss if the security has been disposed of by the fund or in unrealized gain/loss if the security is still held by the fund. Any other proceeds from litigation not related to portfolio holdings are reflected as other income in the Statement of Operations.
Fees Paid Indirectly – The fund’s custody fee may be reduced according to an arrangement that measures the value of cash deposited with the custodian by the fund. This amount, for the year ended December 31, 2012, is shown as a reduction of total expenses in the Statement of Operations.
Tax Matters and Distributions – The fund intends to qualify as a regulated investment company, as defined under Subchapter M of the Internal Revenue Code, and to distribute all of its taxable income, including realized capital gains. As a result, no provision for federal income tax is required. The fund’s federal tax returns, when filed, will remain subject to examination by the Internal Revenue Service for a three year period. Foreign taxes have been accrued by the fund in the accompanying financial statements.
Distributions to shareholders are recorded on the ex-dividend date. Income and capital gain distributions are determined in accordance with income tax regulations, which may differ from U.S. generally accepted accounting principles. Certain capital accounts in the financial statements are periodically adjusted for permanent differences in order to reflect their tax character. These adjustments have no impact on net assets or net asset value per share. Temporary differences which arise from recognizing certain items of income, expense, gain or loss in different periods for financial statement and tax purposes will reverse at some time in the future. Distributions in excess of net investment income or net realized gains are temporary overdistributions for financial statement purposes resulting from differences in the recognition or classification of income or distributions for financial statement and tax purposes.
Book/tax differences primarily relate to wash sale loss deferrals.
The tax character of distributions declared to shareholders for the last two fiscal years is as follows:
| 12/31/12 | 12/31/11 | |||||||
| Ordinary income (including any short-term capital gains) | $2,110,200 | $2,503,255 | ||||||
The federal tax cost and the tax basis components of distributable earnings were as follows:
| As of 12/31/12 | ||||
| Cost of investments | $456,270,280 | |||
| Gross appreciation | 97,806,781 | |||
| Gross depreciation | (10,008,116 | ) | ||
| Net unrealized appreciation (depreciation) | $87,798,665 | |||
| Undistributed ordinary income | 3,948,345 | |||
| Capital loss carryforwards | (38,931,970 | ) | ||
| Other temporary differences | 12,996 |
Under the Regulated Investment Company Modernization Act of 2010 (the “Act”), net capital losses recognized after December 31, 2010 may be carried forward indefinitely, and their character is retained as short-term and/or long-term losses. Previously, net capital losses were carried forward for eight years and treated as short-term losses. As a transition rule, the Act requires that post-enactment net capital losses be used before pre-enactment net capital losses.
As of December 31, 2012, the fund had capital loss carryforwards available to offset future realized gains. Such losses expire as follows:
| Pre-enactment losses: | ||||
| 12/31/15 | $(12,959,471 | ) | ||
| 12/31/16 | (19,823,665 | ) | ||
| 12/31/17 | (6,148,834 | ) | ||
| Total | $(38,931,970 | ) |
The availability of $32,783,136 of the capital loss carryforwards, which were acquired on December 4, 2009 in connection with the MFS Capital Appreciation Portfolio merger, may be limited in a given year.
Multiple Classes of Shares of Beneficial Interest – The fund offers multiple classes of shares, which differ in their respective distribution and/or service fees. The fund’s income, realized and unrealized gain (loss), and common expenses are allocated to
15
Table of Contents
MFS Massachusetts Investors Growth Stock Portfolio
Notes to Financial Statements – continued
shareholders based on the daily net assets of each class. Dividends are declared separately for each class. Differences in per share dividend rates are generally due to differences in separate class expenses. The fund’s distributions declared to shareholders as reported in the Statements of Changes in Net Assets are presented by class as follows:
| From net investment income | ||||||||
| Year ended 12/31/12 | Year ended 12/31/11 | |||||||
| Initial Class | $2,044,442 | $2,330,869 | ||||||
| Service Class | 65,758 | 172,386 | ||||||
| Total | $2,110,200 | $2,503,255 | ||||||
| (3) | Transactions with Affiliates |
Investment Adviser – The fund has an investment advisory agreement with MFS to provide overall investment management and related administrative services and facilities to the fund. The management fee is computed daily and paid monthly at the following annual rates:
| First $1 billion of average daily net assets | 0.75% | |||
| Average daily net assets in excess of $1 billion | 0.65% |
The management fee incurred for the year ended December 31, 2012 was equivalent to an annual effective rate of 0.75% of the fund’s average daily net assets.
The investment adviser has agreed in writing to pay a portion of the fund’s total annual operating expenses, exclusive of interest, taxes, extraordinary expenses, brokerage and transaction costs, and investment-related expenses, such that total annual operating expenses do not exceed 0.82% of average daily net assets for the Initial Class shares and 1.07% of average daily net assets for the Service Class shares. This written agreement will continue until modified by the fund’s Board of Trustees, but such agreement will continue at least until April 30, 2014. For the year ended December 31, 2012, the fund’s actual operating expenses did not exceed the limit and therefore, the investment adviser did not pay any portion of the fund’s expenses related to this agreement.
Distributor – MFS Fund Distributors, Inc. (MFD), a wholly-owned subsidiary of MFS, is the distributor of shares of the fund. The Trustees have adopted a distribution plan for the Service Class shares pursuant to Rule 12b-1 under the Investment Company Act of 1940.
The fund’s distribution plan provides that the fund will pay MFD distribution and/or service fees equal to 0.25% per annum of its average daily net assets attributable to Service Class shares as partial consideration for services performed and expenses incurred by MFD and financial intermediaries (including participating insurance companies that invest in the fund to fund variable annuity and variable life insurance contracts, sponsors of qualified retirement and pension plans that invest in the fund, and affiliates of these participating insurance companies and plan sponsors) in connection with the sale and distribution of the Service Class shares. MFD may subsequently pay all, or a portion, of the distribution and/or service fees to financial intermediaries.
Shareholder Servicing Agent – MFS Service Center, Inc. (MFSC), a wholly-owned subsidiary of MFS, has contracted to provide transfer agent and recordkeeping functions in connection with the issuance, transfer, and redemption of each class of shares of the fund under a Shareholder Servicing Agent Agreement. During the year ended December 31, 2012, the fund did not pay MFSC a fee for this service. Effective April 1, 2013, the fund will be charged a shareholder servicing fee by MFSC.
Administrator – MFS provides certain financial, legal, shareholder communications, compliance, and other administrative services to the fund. Under an administrative services agreement, the fund partially reimburses MFS the costs incurred to provide these services. The fund is charged an annual fixed amount of $17,500 plus a fee based on average daily net assets. The administrative services fee incurred for the year ended December 31, 2012 was equivalent to an annual effective rate of 0.0161% of the fund’s average daily net assets.
Trustees’ and Officers’ Compensation – The fund pays compensation to independent Trustees in the form of a retainer, attendance fees, and additional compensation to Board and Committee chairpersons. The fund does not pay compensation directly to Trustees or officers of the fund who are also officers of the investment adviser, all of whom receive remuneration for their services to the fund from MFS. Certain officers and Trustees of the fund are officers or directors of MFS, MFD, and MFSC.
Other – This fund and certain other funds managed by MFS (the funds) have entered into services agreements (the Agreements) which provide for payment of fees by the funds to Tarantino LLC and Griffin Compliance LLC in return for the provision of services of an Independent Chief Compliance Officer (ICCO) and Assistant ICCO, respectively, for the funds. The ICCO and Assistant ICCO are
16
Table of Contents
MFS Massachusetts Investors Growth Stock Portfolio
Notes to Financial Statements – continued
officers of the funds and the sole members of Tarantino LLC and Griffin Compliance LLC, respectively. The funds can terminate the Agreements with Tarantino LLC and Griffin Compliance LLC at any time under the terms of the Agreements. For the year ended December 31, 2012, the aggregate fees paid by the fund to Tarantino LLC and Griffin Compliance LLC were $4,517 and are included in “Miscellaneous” expense in the Statement of Operations. MFS has agreed to reimburse the fund for a portion of the payments made by the fund in the amount of $1,987, which is shown as a reduction of total expenses in the Statement of Operations. Additionally, MFS has agreed to bear all expenses associated with office space, other administrative support, and supplies provided to the ICCO and Assistant ICCO.
The fund invests in the MFS Institutional Money Market Portfolio which is managed by MFS and seeks current income consistent with preservation of capital and liquidity. Income earned on this investment is included in “Dividends from underlying affiliated funds” in the Statement of Operations. This money market fund does not pay a management fee to MFS.
| (4) | Portfolio Securities |
Purchases and sales of investments, other than short-term obligations, aggregated $165,709,409 and $244,792,282, respectively.
| (5) | Shares of Beneficial Interest |
The fund’s Declaration of Trust permits the Trustees to issue an unlimited number of full and fractional shares of beneficial interest. Transactions in fund shares were as follows:
| Year ended 12/31/12 | Year ended 12/31/11 | |||||||||||||||
| Shares | Amount | Shares | Amount | |||||||||||||
| Shares sold | ||||||||||||||||
Initial Class | 95,060 | $1,196,872 | 276,271 | $3,177,926 | ||||||||||||
Service Class | 76,428 | 972,175 | 98,650 | 1,129,009 | ||||||||||||
| 171,488 | $2,169,047 | 374,921 | $4,306,935 | |||||||||||||
| Shares issued in connection with acquisition of Capital Appreciation Variable Account | ||||||||||||||||
Initial Class | 10,255,347 | $119,581,797 | ||||||||||||||
| Shares issued to shareholders in reinvestment of distributions | ||||||||||||||||
Initial Class | 158,853 | $2,044,442 | 209,422 | $2,330,869 | ||||||||||||
Service Class | 5,137 | 65,758 | 15,586 | 172,386 | ||||||||||||
| 163,990 | $2,110,200 | 225,008 | $2,503,255 | |||||||||||||
| Shares reacquired | ||||||||||||||||
Initial Class | (5,956,629 | ) | $(75,655,121 | ) | (5,943,995 | ) | $(69,272,697 | ) | ||||||||
Service Class | (988,916 | ) | (12,504,119 | ) | (1,543,209 | ) | (17,919,831 | ) | ||||||||
| (6,945,545 | ) | $(88,159,240 | ) | (7,487,204 | ) | $(87,192,528 | ) | |||||||||
| Net change | ||||||||||||||||
Initial Class | (5,702,716 | ) | $(72,413,807 | ) | 4,797,045 | $55,817,895 | ||||||||||
Service Class | (907,351 | ) | (11,466,186 | ) | (1,428,973 | ) | (16,618,436 | ) | ||||||||
| (6,610,067 | ) | $(83,879,993 | ) | 3,368,072 | $39,199,459 | |||||||||||
| (6) | Line of Credit |
The fund and certain other funds managed by MFS participate in a $1.1 billion unsecured committed line of credit, subject to a $1 billion sublimit, provided by a syndication of banks under a credit agreement. Borrowings may be made for temporary financing needs. Interest is charged to each fund, based on its borrowings, generally at a rate equal to the higher of the Federal Reserve funds rate or one month LIBOR plus an agreed upon spread. A commitment fee, based on the average daily, unused portion of the committed line of credit, is allocated among the participating funds at the end of each calendar quarter. In addition, the fund and other funds managed by MFS have established unsecured uncommitted borrowing arrangements with certain banks for temporary financing needs. Interest is charged to each fund, based on its borrowings, at a rate equal to the Federal Reserve funds rate plus an agreed upon spread. For the year ended December 31, 2012, the fund’s commitment fee and interest expense were $3,633 and $0, respectively, and are included in “Miscellaneous” expense in the Statement of Operations.
17
Table of Contents
MFS Massachusetts Investors Growth Stock Portfolio
Notes to Financial Statements – continued
| (7) | Transactions in Underlying Affiliated Funds – Affiliated Issuers |
An affiliated issuer may be considered one in which the fund owns 5% or more of the outstanding voting securities, or a company which is under common control. For the purposes of this report, the fund assumes the following to be an affiliated issuer:
| Underlying Affiliated Fund | Beginning Shares/Par Amount | Acquisitions Shares/Par Amount | Dispositions Shares/Par Amount | Ending Shares/Par Amount | ||||||||||||
| MFS Institutional Money Market Portfolio | 2,902,318 | 106,960,388 | (104,964,030 | ) | 4,898,676 | |||||||||||
| Underlying Affiliated Fund | Realized Gain (Loss) | Capital Gain Distributions | Dividend Income | Ending Value | ||||||||||||
| MFS Institutional Money Market Portfolio | $— | $— | $6,872 | $4,898,676 | ||||||||||||
| (8) | Acquisitions |
At the close of business on December 2, 2011, the fund with net assets of $439,145,630, acquired all of the investment-related assets and liabilities of Capital Appreciation Variable Account. The acquisition was part of a transaction in which the Capital Appreciation Variable Account was converted into a unit investment trust (“UIT”) that invests in the fund (the acquisition of the Account’s assets and liabilities and subsequent conversion into a UIT hereinafter referred to as the “Reorganization”). The Reorganization provided the contract owners of the Capital Appreciation Variable Account with the opportunity to participate in a larger combined portfolio with an identical investment objective and similar investment policies and strategies. The acquisition was accomplished by a tax-free exchange of 10,255,347 shares of the fund (valued at $119,581,797) for all of the investment-related assets and liabilities of Capital Appreciation Variable Account. Capital Appreciation Variable Account’s investments on that date were valued at approximately $119,481,954 with a cost basis of approximately $100,293,081. For financial reporting purposes, assets received and shares issued by the fund were recorded at fair value; however, the cost basis of the investments received from Capital Appreciation Variable Account were carried forward to align ongoing reporting of the fund’s realized and unrealized gains and losses with amounts distributable to shareholders for tax purposes.
18
Table of Contents
MFS Massachusetts Investors Growth Stock Portfolio
REPORT OF INDEPENDENT REGISTERED PUBLIC ACCOUNTING FIRM
To the Board of Trustees of MFS Variable Insurance Trust II and the Shareholders of
MFS Massachusetts Investors Growth Stock Portfolio:
We have audited the accompanying statement of assets and liabilities, including the portfolio of investments, of MFS Massachusetts Investors Growth Stock Portfolio (the “Fund”) (one of the series comprising MFS Variable Insurance Trust II) as of December 31, 2012, and the related statement of operations for the year then ended, the statements of changes in net assets for each of the two years in the period then ended, and the financial highlights for each of the five years in the period then ended. These financial statements and financial highlights are the responsibility of the Fund’s management. Our responsibility is to express an opinion on these financial statements and financial highlights based on our audits.
We conducted our audits in accordance with the standards of the Public Company Accounting Oversight Board (United States). Those standards require that we plan and perform the audit to obtain reasonable assurance about whether the financial statements and financial highlights are free of material misstatement. The Fund is not required to have, nor were we engaged to perform, an audit of its internal control over financial reporting. Our audits included consideration of internal control over financial reporting as a basis for designing audit procedures that are appropriate in the circumstances, but not for the purpose of expressing an opinion on the effectiveness of the Fund’s internal control over financial reporting. Accordingly, we express no such opinion. An audit also includes examining, on a test basis, evidence supporting the amounts and disclosures in the financial statements, assessing the accounting principles used and significant estimates made by management, as well as evaluating the overall financial statement presentation. Our procedures included confirmation of securities owned as of December 31, 2012, by correspondence with the custodian and brokers; where replies were not received from brokers, we performed other auditing procedures. We believe that our audits provide a reasonable basis for our opinion.
In our opinion, the financial statements and financial highlights referred to above present fairly, in all material respects, the financial position of MFS Massachusetts Investors Growth Stock Portfolio as of December 31, 2012, the results of its operations for the year then ended, the changes in its net assets for each of the two years in the period then ended, and the financial highlights for each of the five years in the period then ended, in conformity with accounting principles generally accepted in the United States of America.
DELOITTE & TOUCHE LLP
Boston, Massachusetts
February 15, 2013
19
Table of Contents
MFS Massachusetts Investors Growth Stock Portfolio
TRUSTEES AND OFFICERS – IDENTIFICATION AND BACKGROUND
The Trustees and officers of the Trust, as of February 1, 2013, are listed below, together with their principal occupations during the past five years. (Their titles may have varied during that period.) The address of each Trustee and officer is 111 Huntington Avenue, Boston, Massachusetts 02199-7618.
Name, Age | Position(s) with Fund | Trustee/Officer Since (h) | Principal Occupations During the Past Five Years | Other Directorships (j) | ||||
| INTERESTED TRUSTEES | ||||||||
Robert J. Manning (k) (age 49) | Trustee | February 2004 | Massachusetts Financial Services Company, Chairman, Chief Executive Officer and Director; President (until December 2009); Chief Investment Officer (until July 2010) | N/A | ||||
| INDEPENDENT TRUSTEES | ||||||||
David H. Gunning (age 70) | Trustee and Chair of Trustees | January 2004 | Private investor | Lincoln Electric Holdings, Inc. (welding equipment manufacturer), Director; Development Alternatives, Inc. (consulting), Director/Non-Executive Chairman; Portman Limited (mining), Director (until 2008) | ||||
Robert E. Butler (age 71) | Trustee | January 2006 | Consultant – investment company industry regulatory and compliance matters | N/A | ||||
Maureen R. Goldfarb (age 57) | Trustee | January 2009 | Private investor | N/A | ||||
William R. Gutow (age 71) | Trustee | December 1993 | Private investor and real estate consultant; Capitol Entertainment Management Company (video franchise), Vice Chairman | Atlantic Coast Tan (tanning salons), Vice Chairman (until 2007); Texas Donuts (donut franchise), Vice Chairman (until 2010) | ||||
Michael Hegarty (age 68) | Trustee | December 2004 | Private investor; Rouse Properties Inc. (real estate), Director | N/A | ||||
John P. Kavanaugh (age 58) | Trustee | January 2009 | Private investor | N/A | ||||
J. Dale Sherratt (age 74) | Trustee | June 1989 | Insight Resources, Inc. (acquisition planning specialists), President; Wellfleet Investments (investor in health care companies), Managing General Partner | N/A | ||||
| Laurie J. Thomsen (age 55) | Trustee | March 2005 | Private investor; New Profit, Inc. (venture philanthropy), Executive Partner (until 2010) | The Travelers Companies (insurance), Director | ||||
Robert W. Uek (age 71) | Trustee | January 2006 | Consultant to investment company industry | N/A | ||||
| OFFICERS | ||||||||
John M. Corcoran (k) (age 47) | President | October 2008 | Massachusetts Financial Services Company, Senior Vice President (since October 2008); State Street Bank and Trust (financial services provider), Senior Vice President, (until September 2008) | N/A | ||||
| Christopher R. Bohane (k) (age 39) | Assistant Secretary and Assistant Clerk | July 2005 | Massachusetts Financial Services Company, Vice President and Senior Counsel | N/A | ||||
Kino Clark (k) (age 44) | Assistant Treasurer | January 2012 | Massachusetts Financial Services Company, Vice President | N/A | ||||
Thomas H. Connors (k) (age 53) | Assistant Secretary and Assistant Clerk | September 2012 | Massachusetts Financial Services Company, Vice President and Senior Counsel; Deutsche Investment Management Americas Inc. (financial service provider), Director and Senior Counsel (until 2012) | N/A | ||||
Ethan D. Corey (k) (age 49) | Assistant Secretary and Assistant Clerk | July 2005 | Massachusetts Financial Services Company, Senior Vice President and Associate General Counsel | N/A | ||||
20
Table of Contents
MFS Massachusetts Investors Growth Stock Portfolio
Trustees and Officers – continued
Name, Age | Position(s) with Fund | Trustee/Officer Since (h) | Principal Occupations During the Past Five Years | Other Directorships (j) | ||||
David L. DiLorenzo (k) (age 44) | Treasurer | July 2005 | Massachusetts Financial Services Company, Senior Vice President | N/A | ||||
Robyn L. Griffin (age 37) | Assistant Independent Chief Compliance Officer | August 2008 | Griffin Compliance LLC (provider of compliance services), Principal (since August 2008); State Street Corporation (financial services provider), Mutual Fund Administration Assistant Vice President (October 2006 – July 2008) | N/A | ||||
Brian E. Langenfeld (k) (age 39) | Assistant Secretary and Assistant Clerk | June 2006 | Massachusetts Financial Services Company, Vice President and Senior Counsel | N/A | ||||
Susan S. Newton (k) (age 62) | Assistant Secretary and Assistant Clerk | May 2005 | Massachusetts Financial Services Company, Senior Vice President and Associate General Counsel | N/A | ||||
Susan A. Pereira (k) (age 42) | Assistant Secretary and Assistant Clerk | July 2005 | Massachusetts Financial Services Company, Vice President and Senior Counsel | N/A | ||||
Kasey L. Phillips (k) (age 42) | Assistant Treasurer | September 2012 | Massachusetts Financial Services Company, Vice President; Wells Fargo Funds Management, LLC, Senior Vice President, Fund Treasurer (until 2012) | N/A | ||||
Mark N. Polebaum (k) (age 60) | Secretary and Clerk | January 2006 | Massachusetts Financial Services Company, Executive Vice President, General Counsel and Secretary | N/A | ||||
Frank L. Tarantino (age 68) | Independent Chief Compliance Officer | June 2004 | Tarantino LLC (provider of compliance services), Principal | N/A | ||||
Richard S. Weitzel (k) (age 42) | Assistant Secretary and Assistant Clerk | October 2007 | Massachusetts Financial Services Company, Senior Vice President and Associate General Counsel | N/A | ||||
James O. Yost (k) (age 52) | Deputy Treasurer | September 1990 | Massachusetts Financial Services Company, Senior Vice President | N/A | ||||
| (h) | Date first appointed to serve as Trustee/officer of an MFS fund. Each Trustee has served continuously since appointment unless indicated otherwise. For the period from December 15, 2004 until February 22, 2005, Mr. Manning served as Advisory Trustee. For the period October 2008, until January 2012, Mr. Corcoran served as Treasurer of the Funds. Prior to January 2012, Messrs. DiLorenzo and Yost served as Assistant Treasurers of the Funds. |
| (j) | Directorships or trusteeships of companies required to report to the Securities and Exchange Commission (i.e., “public companies”). |
| (k) | “Interested person” of the Trust within the meaning of the Investment Company Act of 1940 (referred to as the 1940 Act), which is the principal federal law governing investment companies like the fund, as a result of position with MFS. The address of MFS is 111 Huntington Avenue, Boston, Massachusetts 02199-7618. |
Each Trustee has been elected by shareholders and each Trustee and officer holds office until his or her successor is chosen and qualified or until his or her earlier death, resignation, retirement or removal. The Trust does not hold annual meetings for the purpose of electing Trustees, and Trustees are not elected for fixed terms. Messrs. Butler, Kavanaugh, Uek and Ms. Thomsen are members of the Trust’s Audit Committee.
Each of the Fund’s Trustees and officers holds comparable positions with certain other funds of which MFS or a subsidiary is the investment adviser or distributor, and, in the case of the officers, with certain affiliates of MFS. As of January 1, 2013, the Trustees served as board members of 143 funds within the MFS Family of Funds.
21
Table of Contents
MFS Massachusetts Investors Growth Stock Portfolio
Trustees and Officers – continued
The Statement of Additional Information for the Fund includes further information about the Trustees and is available without charge upon request by calling 1-800-225-2606.
Investment Adviser Massachusetts Financial Services Company 111 Huntington Avenue Boston, MA 02199-7618 | Custodian State Street Bank and Trust 1 Lincoln Street Boston, MA 02111-2900 | |
Distributor MFS Fund Distributors, Inc. 111 Huntington Avenue Boston, MA 02199-7618 | Independent Registered Public Accounting Firm Deloitte & Touche LLP 200 Berkeley Street Boston, MA 02116 | |
Portfolio Manager Jeffrey Constantino |
22
Table of Contents
MFS Massachusetts Investors Growth Stock Portfolio
BOARD REVIEW OF INVESTMENT ADVISORY AGREEMENT
A discussion regarding the Board’s most recent approval of the fund’s Investment Advisory Agreement with MFS is available by clicking on the fund’s name under “Variable Insurance Portfolios – VIT II” in the “Products” section of the MFS Web site (mfs.com).
PROXY VOTING POLICIES AND INFORMATION
A general description of the MFS funds’ proxy voting policies and procedures is available without charge, upon request, by calling 1-800-225-2606, by visiting the Proxy Voting section of mfs.com or by visiting the SEC’s Web site at http://www.sec.gov.
Information regarding how the fund voted proxies relating to portfolio securities during the most recent twelve-month period ended June 30 is available without charge by visiting the Proxy Voting section of mfs.com or by visiting the SEC’s Web site at http://www.sec.gov.
QUARTERLY PORTFOLIO DISCLOSURE
The fund will file a complete schedule of portfolio holdings with the Securities and Exchange Commission (the Commission) for the first and third quarters of each fiscal year on Form N-Q. The fund’s Form N-Q is available on the EDGAR database on the Commission’s Internet Web site at http://www.sec.gov, and may be reviewed and copied at the:
Public Reference Room
Securities and Exchange Commission
100 F Street, NE, Room 1580
Washington, D.C. 20549
Information on the operation of the Public Reference Room may be obtained by calling the Commission at 1-800-SEC-0330. Copies of the fund’s Form N-Q also may be obtained, upon payment of a duplicating fee, by electronic request at the following e-mail address: publicinfo@sec.gov or by writing the Public Reference Section at the above address.
From time to time, MFS may post important information about the fund or the MFS funds on the MFS web site (mfs.com). This information is available by visiting the “News & Commentary” section of mfs.com or by clicking on the fund’s name under “Variable Insurance Portfolios – VIT II” in the “Products” section of mfs.com.
FEDERAL TAX INFORMATION (unaudited)
The following information is provided pursuant to provisions of the Internal Revenue Code.
For corporate shareholders, 100% of the ordinary income dividends paid during the fiscal year qualify for the corporate dividends received deduction.
23
Table of Contents
| FACTS | WHAT DOES MFS DO WITH YOUR PERSONAL INFORMATION? |  |
| Why? | Financial companies choose how they share your personal information. Federal law gives consumers the right to limit some but not all sharing. Federal law also requires us to tell you how we collect, share, and protect your personal information. Please read this notice carefully to understand what we do. |
| What? | The types of personal information we collect and share depend on the product or service you have with us. This information can include:
•Social Security number and account balances •Account transactions and transaction history •Checking account information and wire transfer instructions
When you are no longer our customer, we continue to share your information as described in this notice. |
| How? | All financial companies need to share customers’ personal information to run their everyday business. In the section below, we list the reasons financial companies can share their customers’ personal information; the reasons MFS chooses to share; and whether you can limit this sharing. |
| Reasons we can share your personal information | Does MFS share? | Can you limit this sharing? | ||
For our everyday business purposes – such as to process your transactions, maintain your account(s), respond to court orders and legal investigations, or report to credit bureaus | Yes | No | ||
For our marketing purposes – to offer our products and services to you | No | We don’t share | ||
| For joint marketing with other financial companies | No | We don’t share | ||
For our affiliates’ everyday business purposes – information about your transactions and experiences | No | We don’t share | ||
For our affiliates’ everyday business purposes – information about your creditworthiness | No | We don’t share | ||
| For nonaffiliates to market to you | No | We don’t share |
| Questions? | Call 800-225-2606 or go to mfs.com. |
24
Table of Contents
| Page 2 |
| Who we are | ||
| Who is providing this notice? | MFS Funds, MFS Investment Management, MFS Institutional Advisors, Inc., MFS Fund Distributors, Inc., MFS Heritage Trust Company, and MFS Service Center, Inc. | |
| What we do | ||
| How does MFS protect my personal information? | To protect your personal information from unauthorized access and use, we use security measures that comply with federal law. These measures include procedural, electronic, and physical safeguards for the protection of the personal information we collect about you. | |
| How does MFS collect my personal information? | We collect your personal information, for example, when you
•open an account or provide account information •direct us to buy securities or direct us to sell your securities •make a wire transfer
We also collect your personal information from others, such as credit bureaus, affiliates and other companies. | |
| Why can’t I limit all sharing? | Federal law gives you the right to limit only
•sharing for affiliates’ everyday business purposes – information about your creditworthiness •affiliates from using your information to market to you •sharing for nonaffiliates to market to you
State laws and individual companies may give you additional rights to limit sharing. | |
| Definitions | ||
| Affiliates | Companies related by common ownership or control. They can be financial and nonfinancial companies.
•MFS does not share personal information with affiliates, except for everyday business purposes as described on page one of this notice. | |
| Nonaffiliates | Companies not related by common ownership or control. They can be financial and nonfinancial companies.
•MFS does not share with nonaffiliates so they can market to you. | |
| Joint Marketing | A formal agreement between nonaffiliated financial companies that together market financial products or services to you.
•MFS doesn’t jointly market. | |
| Other important information | ||
| If you own an MFS product or receive an MFS service in the name of a third party such as a bank or broker-dealer, their privacy policy may apply to you instead of ours. | ||
25
Table of Contents
Table of Contents
ANNUAL REPORT
December 31, 2012

MFS® RESEARCH INTERNATIONAL PORTFOLIO
MFS® Variable Insurance Trust II

RSS-ANN
Table of Contents
MFS® RESEARCH INTERNATIONAL PORTFOLIO
The report is prepared for the general information of contract owners. It is authorized for distribution to prospective investors only when preceded or accompanied by a current prospectus.
NOT FDIC INSURED Ÿ MAY LOSE VALUE Ÿ NO BANK OR CREDIT UNION GUARANTEE Ÿ NOT A DEPOSIT Ÿ NOT INSURED BY ANY FEDERAL GOVERNMENT AGENCY OR NCUA/NCUSIF
Table of Contents
MFS Research International Portfolio
LETTER FROM THE CHAIRMAN AND CEO

Dear Contract Owners:
The global market outlook for 2013 is one of cautious optimism. While we are seeing some positive economic trends in the United States, Europe and China, the overall environment remains challenging. In the United States, the recent fiscal cliff agreement was received positively by investors, even though it mostly addressed pressing taxation issues and did not resolve additional concerns, including the need for spending cuts and a large-scale reduction of the federal debt. These issues will be front and center again in the spring. Despite the ongoing uncertainty, economic tailwinds are gathering strength as the U.S. housing and job markets are improving and consumer confidence is rising.
Overseas, the debt crisis continues to weigh heavily on eurozone markets, with even Germany — long an economic stalwart — experiencing some contraction. These ongoing challenges could be a drag on global market performance this year. In Asia, manufacturing activity has accelerated in emerging markets such as China and India, and we are seeing signs of stabilized loan growth in China, a leading indicator of that country’s economic health. In contrast, Japan’s economy is contracting sharply under deflationary pressures. Nevertheless, Japanese markets have responded favorably to early actions by the new government, which appears determined to act aggressively, along with the Bank of Japan, to stimulate growth.
As always, managing risk in the face of uncertainty remains a top priority for investors. At MFS®, our uniquely collaborative investment process revolves around global research and our disciplined risk management approach. Our global team of investment professionals shares ideas and evaluates opportunities across continents, investment disciplines and asset classes — all with a goal of building better insights, and ultimately better results, for our clients.
We remain mindful of the many economic challenges investors face today, and believe it is more important than ever to maintain a long-term view, employ time-tested principles, such as asset allocation and diversification, and work closely with investment advisors to identify and pursue the most suitable opportunities.
Respectfully,

Robert J. Manning
Chairman and Chief Executive Officer
MFS Investment Management®
February 15, 2013
The opinions expressed in this letter are subject to change, may not be relied upon for investment advice, and no forecasts can be guaranteed.
1
Table of Contents
MFS Research International Portfolio
Portfolio structure
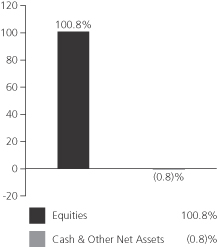
| Top ten holdings | ||||
| Royal Dutch Shell PLC, “A” | 3.1% | |||
| Roche Holding AG | 2.9% | |||
| Nestle S.A. | 2.8% | |||
| Rio Tinto Ltd. | 2.6% | |||
| Novartis AG | 2.2% | |||
| BP PLC | 2.1% | |||
| Heineken N.V. | 2.0% | |||
| Westpac Banking Corp. | 2.0% | |||
| Bayer AG | 2.0% | |||
| Barclays PLC | 1.9% | |||
| Global equity sectors | ||||
| Financial Services | 24.8% | |||
| Capital Goods | 24.5% | |||
| Energy | 11.6% | |||
| Consumer Staples | 10.0% | |||
| Health Care | 10.0% | |||
| Consumer Cyclicals | 7.6% | |||
| Technology | 7.2% | |||
| Telecommunications/Cable television | 5.1% | |||
| Issuer country weightings (x) | ||||
| Japan | 21.3% | |||
| United Kingdom | 18.5% | |||
| Switzerland | 12.9% | |||
| France | 8.8% | |||
| Germany | 6.3% | |||
| Netherlands | 5.7% | |||
| Hong Kong | 5.2% | |||
| Australia | 3.5% | |||
| Brazil | 2.6% | |||
| Other Countries | 15.2% | |||
| Currency exposure weightings (y) | ||||
| Euro | 24.9% | |||
| Japanese Yen | 21.3% | |||
| British Pound Sterling | 18.5% | |||
| Swiss Franc | 12.9% | |||
| Hong Kong Dollar | 6.8% | |||
| Australian Dollar | 3.5% | |||
| Brazilian Real | 2.6% | |||
| Swedish Krona | 1.8% | |||
| United States Dollar | 1.5% | |||
| Other Currencies | 6.2% | |||
| (x) | Represents the portfolio’s exposure to issuer countries as a percentage of a portfolio’s net assets. |
| (y) | Represents the portfolio’s exposure to a particular currency as a percentage of a portfolio’s net assets. |
From time to time “Cash & Other Net Assets” may be negative due to timing of cash receipts and/or equivalent exposure from any derivative holdings.
Percentages are based on net assets as of 12/31/12.
The portfolio is actively managed and current holdings may be different.
2
Table of Contents
MFS Research International Portfolio
Summary of Results
For the twelve months ended December 31, 2012, Initial Class shares of the MFS Research International Portfolio (“fund”) provided a total return of 16.59%, while Service Class shares of the fund provided a total return of 16.29%. These compare with a return of 17.90% over the same period for the fund’s benchmark, the MSCI EAFE Index.
Market Environment
The beginning of the period was characterized by a risk-on sentiment as a result of additional liquidity measures by the Federal Reserve Bank (“Fed”) and the European Central Bank (“ECB”) as well as a commensurate improvement in macroeconomic conditions. During this time, global equity valuations rose, credit spreads contracted, and high-quality sovereign yields increased modestly.
During the middle of the period, however, conditions worsened, driven by broadly weaker global macroeconomic indicators, as well as renewed concerns over the eurozone’s capacity and determination to address its ongoing crisis. Despite this deterioration, broad market sentiment remained relatively resilient as equity markets generally maintained gains and credit spreads did not indicate deterioration.
However, this renewed weakness in the fundamentals precipitated a further round of monetary easing by both the Fed (through a third round of quantitative easing) and the ECB (through a new bond purchase facility) in the second half of the period, which soon instilled additional confidence in risk markets. Nonetheless, towards the end of the period, weaker equity earnings reports and declining forward guidance caused market sentiment to soften. In addition, as we moved toward year end, the fiscal cliff negotiations between the Republicans in the U.S. Congress and President Obama were a particular source of market attention, where uncertainty surrounding the fiscal negotiations continued right up to the end-of-year deadline.
Detractors from Performance
Stock selection in the financial services sector detracted from performance relative to the MSCI EAFE Index. Holdings of financial services firm Itau Unibanco Holding (b) (Brazil) were among the fund’s top relative detractors for the reporting period. Shares of Itau Unibanco Holding declined after the company reported that it expected a continued increase in its loan loss provisions, attributable to slower-than-expected growth of the Brazilian economy.
Stock selection in the capital goods sector was another negative factor for relative results. Holdings of mining company Iluka Resources (Australia), Japanese parcel delivery services company Yamato Holding, and mining equipment manufacturer Joy Global (b) weighed on relative returns as all three stocks lagged the benchmark during the reporting period. Shares of Iluka Resources declined as a result of lower sales volume and softened demand for high-grade titanium dioxide products and Zircon, a mineral used widely in electronics manufacturing and one of the company’s main commodities.
Stock selection in the telecommunications/cable television sector also dampened relative performance. The fund’s holdings of Hong Kong listed telecommunication services provider China Unicom (Hong Kong) (b) held back relative results. Shares of China Unicom (Hong Kong) underperformed the market after the company reported lower-than-expected profits. Slower growth in mobile average revenue per user in the face of heightened competition in China was cited as the main reason for the lower earnings.
Stocks in other sectors that held back relative returns included oil and gas exploration company INPEX (Japan), pharmaceutical company Santen Pharmaceutical (Japan), printers and computer peripherals maker Canon (Japan), Brazilian medical diagnostics company Diagnosticos da America (b), and television broadcasting services provider Nippon Television Holdings (b) (Japan).
During the reporting period, the fund’s relative currency exposure, resulting primarily from differences between the fund’s and the benchmark’s exposures to holdings of securities denominated in foreign currencies, detracted from relative performance. All of MFS’ investment decisions are driven by the fundamentals of each individual opportunity and as such, it is common for our portfolios to have different currency exposure than the benchmark.
Contributors to Performance
Stock selection in the health care sector contributed to relative performance. Holdings of German healthcare products maker Bayer and German healthcare services provider Rhoen-Klinikum (b)(h) aided relative results as both stocks significantly outpaced the benchmark during the reporting period. Shares of Bayer appeared to have benefited from results that exceeded consensus estimates, driven primarily by positive results in the company’s crop science division which, due to favorable weather, benefited from an early start to the season. Additionally, management announced that its blockbuster Xarelto was approved by the European Union for the treatment of pulmonary embolism and the prevention of deep vein thrombosis.
Stock selection in the technology sector also supported relative results. No individual securities within this sector were among the fund’s top relative contributors for the reporting period.
3
Table of Contents
MFS Research International Portfolio
Management Review – continued
Individual stocks in other sectors that supported relative performance included the fund’s holdings of Dutch brewer Heineken, financial services firm Barclays (United Kingdom), paint and specialty chemicals manufacturer Akzo Nobel (Netherlands), casino resort operator Sands China (Hong Kong), reinsurance company Swiss Re (Switzerland), Austrian financial services company Erste Group Bank, and Australian financial services firm Westpac Banking. Shares of Heineken appreciated throughout the latter part of the period as the company benefited from volume growth, primarily in Russia and Mexico. Additionally, increased market share in emerging markets, primarily due to their acquisition of APB (Asia Pacific Breweries), further supported the stock. The fund’s avoidance of poor-performing Spanish telecommunications company Telefónica also boosted relative results.
Respectfully,
| Jose Luis Garcia | Thomas Melendez | |
| Portfolio Manager | Portfolio Manager |
| (b) | Security is not an index constituent. |
| (h) | Security was not held in the portfolio at period end. |
The views expressed in this report are those of the portfolio managers only through the end of the period of the report as stated on the cover and do not necessarily reflect the views of MFS or any other person in the MFS organization. These views are subject to change at any time based on market or other conditions, and MFS disclaims any responsibility to update such views. These views may not be relied upon as investment advice or an indication of trading intent on behalf of any MFS portfolio. References to specific securities are not recommendations of such securities, and may not be representative of any MFS portfolio’s current or future investments.
4
Table of Contents
MFS Research International Portfolio
PERFORMANCE SUMMARY THROUGH 12/31/12
The following chart illustrates the historical performance of the fund in comparison to its benchmark(s). Benchmarks are unmanaged and may not be invested in directly. Benchmark returns do not reflect any fees or expenses. The performance of other share classes will be greater than or less than that of the class depicted below. (See Notes to Performance Summary.)
Performance data shown represents past performance and is no guarantee of future results. Investment return and principal value fluctuate so your units, when sold, may be worth more or less than the original cost; current performance may be lower or higher than quoted. The performance shown does not reflect the deduction of taxes, if any, that a contract holder would pay on fund distributions or the redemption of contract units. The returns for the fund shown also do not reflect the deduction of expenses associated with variable products, such as mortality and expense risk charges, separate account charges, and sales charges imposed by the insurance company separate accounts. Such expenses would reduce the overall returns shown.
Growth of a Hypothetical $10,000 Investment
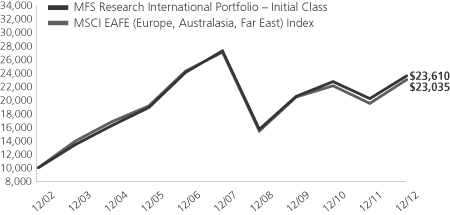
Total Returns through 12/31/12
Average annual total returns
| Share Class | Class inception date | 1-yr | 5-yr | 10-yr | ||||||||
| Initial Class | 5/06/98 | 16.59% | (2.85)% | 8.97% | ||||||||
| Service Class | 8/24/01 | 16.29% | (3.09)% | 8.69% | ||||||||
| Comparative benchmark | ||||||||||||
| MSCI EAFE (Europe, Australasia, Far East) Index (f) | 17.90% | (3.21)% | 8.70% | |||||||||
| (f) | Source: FactSet Research Systems Inc. |
Benchmark Definition
MSCI EAFE (Europe, Australasia, Far East) Index – a market capitalization-weighted index that is designed to measure equity market performance in the developed markets, excluding the U.S. and Canada.
It is not possible to invest directly in an index.
Notes to Performance Summary
Average annual total return represents the average annual change in value for each share class for the periods presented.
Performance results reflect any applicable expense subsidies and waivers in effect during the periods shown. Without such subsidies and waivers the fund’s performance results would be less favorable. Please see the prospectus and financial statements for complete details. All results are historical and assume the reinvestment of any dividends and capital gains distributions.
Performance results do not include adjustments made for financial reporting purposes in accordance with U.S. generally accepted accounting principles and may differ from amounts reported in the financial highlights.
From time to time the fund may receive proceeds from litigation settlements, without which performance would be lower.
5
Table of Contents
MFS Research International Portfolio
Fund Expenses Borne by the Contract Holders During the Period,
July 1, 2012 through December 31, 2012
As a contract holder of the fund, you incur ongoing costs, including management fees; distribution and/or service (12b-1) fees; and other fund expenses. This example is intended to help you understand your ongoing costs (in dollars) of investing in the fund and to compare these costs with the ongoing costs of investing in other mutual funds.
The example is based on an investment of $1,000 invested at the beginning of the period and held for the entire period July 1, 2012 through December 31, 2012.
Actual Expenses
The first line for each share class in the following table provides information about actual account values and actual expenses. You may use the information in this line, together with the amount you invested, to estimate the expenses that you paid over the period. Simply divide your account value by $1,000 (for example, an $8,600 account value divided by $1,000 = 8.6), then multiply the result by the number in the first line under the heading entitled “Expenses Paid During Period” to estimate the expenses you paid on your account during this period.
Hypothetical Example for Comparison Purposes
The second line for each share class in the following table provides information about hypothetical account values and hypothetical expenses based on the fund’s actual expense ratio and an assumed rate of return of 5% per year before expenses, which is not the fund’s actual return. The hypothetical account values and expenses may not be used to estimate the actual ending account balance or expenses you paid for the period. You may use this information to compare the ongoing costs of investing in the fund and other funds. To do so, compare this 5% hypothetical example with the 5% hypothetical examples that appear in the shareholder reports of the other funds.
Please note that the expenses shown in the table are meant to highlight the fund’s ongoing costs only and do not take into account the fees and expenses imposed under the variable contracts through which your investment in the fund is made. Therefore, the second line for each share class in the table is useful in comparing ongoing costs associated with an investment in vehicles (such as the fund) which fund benefits under variable annuity and variable life insurance contracts and to qualified pension and retirement plans only, and will not help you determine the relative total costs of investing in the fund through variable annuity and variable life insurance contracts. If the fees and expenses imposed under the variable contracts were included, your costs would have been higher.
| Share Class | Annualized Expense Ratio | Beginning Account Value 7/01/12 | Ending Account Value | Expenses Paid During Period (p) 7/01/12-12/31/12 | ||||||||||||||
| Initial Class | Actual | 1.05% | $1,000.00 | $1,128.15 | $5.62 | |||||||||||||
| Hypothetical (h) | 1.05% | $1,000.00 | $1,019.86 | $5.33 | ||||||||||||||
| Service Class | Actual | 1.33% | $1,000.00 | $1,126.58 | $7.11 | |||||||||||||
| Hypothetical (h) | 1.33% | $1,000.00 | $1,018.45 | $6.75 | ||||||||||||||
| (h) | 5% class return per year before expenses. |
| (p) | Expenses paid are equal to each class’s annualized expense ratio, as shown above, multiplied by the average account value over the period, multiplied by the number of days in the period, divided by the number of days in the year. |
6
Table of Contents
MFS Research International Portfolio
PORTFOLIO OF INVESTMENTS – 12/31/12
The Portfolio of Investments is a complete list of all securities owned by your fund. It is categorized by broad-based asset classes.
| Issuer | Shares/Par | Value ($) | ||||||
| COMMON STOCKS – 100.8% | ||||||||
| Alcoholic Beverages – 2.0% | ||||||||
| Heineken N.V. | 110,258 | $ | 7,354,531 | |||||
|
| |||||||
| Apparel Manufacturers – 2.0% | ||||||||
| Li & Fung Ltd. | 1,864,000 | $ | 3,348,681 | |||||
| LVMH Moet Hennessy Louis Vuitton S.A. | 19,937 | 3,715,204 | ||||||
|
| |||||||
| $ | 7,063,885 | |||||||
|
| |||||||
| Automotive – 3.6% | ||||||||
| DENSO Corp. | 135,300 | $ | 4,707,754 | |||||
| GKN PLC | 578,801 | 2,159,652 | ||||||
| Honda Motor Co. Ltd. | 167,800 | 6,184,842 | ||||||
|
| |||||||
| $ | 13,052,248 | |||||||
|
| |||||||
| Broadcasting – 1.5% | ||||||||
| Nippon Television Holdings, Inc. | 162,700 | $ | 2,161,571 | |||||
| Publicis Groupe S.A. | 56,193 | 3,366,845 | ||||||
|
| |||||||
| $ | 5,528,416 | |||||||
|
| |||||||
| Business Services – 2.8% | ||||||||
| Amadeus IT Holding S.A. | 87,282 | $ | 2,190,278 | |||||
| Cognizant Technology Solutions Corp., “A” (a) | 25,490 | 1,887,535 | ||||||
| Compass Group PLC | 153,326 | 1,813,350 | ||||||
| Mitsubishi Corp. | 124,600 | 2,395,026 | ||||||
| Nomura Research, Inc. | 90,600 | 1,874,014 | ||||||
|
| |||||||
| $ | 10,160,203 | |||||||
|
| |||||||
| Computer Software – 0.7% | ||||||||
| Dassault Systems S.A. | 20,943 | $ | 2,344,470 | |||||
|
| |||||||
| Computer Software – Systems – 1.1% | ||||||||
| Canon, Inc. | 98,900 | $ | 3,879,072 | |||||
|
| |||||||
| Conglomerates – 0.9% | ||||||||
| Hutchison Whampoa Ltd. | 301,000 | $ | 3,193,099 | |||||
|
| |||||||
| Consumer Products – 1.2% | ||||||||
| Reckitt Benckiser Group PLC | 70,027 | $ | 4,386,752 | |||||
|
| |||||||
| Electrical Equipment – 3.7% | ||||||||
| Legrand S.A. | 29,499 | $ | 1,245,059 | |||||
| Schneider Electric S.A. | 77,224 | 5,759,639 | ||||||
| Siemens AG | 59,109 | 6,424,534 | ||||||
|
| |||||||
| $ | 13,429,232 | |||||||
|
| |||||||
| Electronics – 1.0% | ||||||||
| ASML Holding N.V. | 13,117 | $ | 849,190 | |||||
| Taiwan Semiconductor Manufacturing Co. Ltd. | 841,804 | 2,817,444 | ||||||
|
| |||||||
| $ | 3,666,634 | |||||||
|
| |||||||
| Energy – Independent – 2.3% | ||||||||
| Cairn Energy PLC | 156,481 | $ | 685,526 | |||||
| Cenovus Energy, Inc. | 44,100 | 1,475,911 | ||||||
| CNOOC Ltd. | 652,000 | 1,431,633 | ||||||
| INPEX Corp. | 529 | 2,823,195 | ||||||
| Issuer | Shares/Par | Value ($) | ||||||
| COMMON STOCKS – continued | ||||||||
| Energy – Independent – continued | ||||||||
| Reliance Industries Ltd. | 121,137 | $ | 1,876,807 | |||||
|
| |||||||
| $ | 8,293,072 | |||||||
|
| |||||||
| Energy – Integrated – 6.0% | ||||||||
| BG Group PLC | 166,176 | $ | 2,786,483 | |||||
| BP PLC | 1,091,700 | 7,564,131 | ||||||
| Royal Dutch Shell PLC, “A” | 317,244 | 11,209,667 | ||||||
|
| |||||||
| $ | 21,560,281 | |||||||
|
| |||||||
| Engineering – Construction – 2.0% | ||||||||
| JGC Corp. | 154,000 | $ | 4,797,445 | |||||
| Keppel Corp. Ltd. | 241,600 | 2,195,294 | ||||||
|
| |||||||
| $ | 6,992,739 | |||||||
|
| |||||||
| Food & Beverages – 5.2% | ||||||||
| Groupe Danone | 100,622 | $ | 6,648,058 | |||||
| M. Dias Branco S.A. Industria e Comercio de Alimentos | 53,100 | 2,036,895 | ||||||
| Nestle S.A. | 155,124 | 10,108,118 | ||||||
|
| |||||||
| $ | 18,793,071 | |||||||
|
| |||||||
| Food & Drug Stores – 0.9% | ||||||||
| Lawson, Inc. | 32,300 | $ | 2,195,540 | |||||
| Wumart Stores, Inc., “H” | 462,000 | 1,003,925 | ||||||
|
| |||||||
| $ | 3,199,465 | |||||||
|
| |||||||
| Gaming & Lodging – 1.1% | ||||||||
| Sands China Ltd. | 915,600 | $ | 4,101,300 | |||||
|
| |||||||
| Insurance – 5.0% | ||||||||
| AIA Group Ltd. | 904,400 | $ | 3,604,430 | |||||
| Delta Lloyd N.V. | 76,838 | 1,278,769 | ||||||
| Hiscox Ltd. | 219,521 | 1,597,950 | ||||||
| ING Groep N.V. (a) | 496,702 | 4,749,808 | ||||||
| Sony Financial Holdings, Inc. | 96,100 | 1,728,657 | ||||||
| Swiss Re Ltd. | 68,580 | 5,005,259 | ||||||
|
| |||||||
| $ | 17,964,873 | |||||||
|
| |||||||
| Internet – 0.5% | ||||||||
| Yahoo Japan Corp. | 5,943 | $ | 1,923,565 | |||||
|
| |||||||
| Machinery & Tools – 3.3% | ||||||||
| Glory Ltd. | 116,700 | $ | 2,703,269 | |||||
| Joy Global, Inc. | 57,970 | 3,697,327 | ||||||
| Schindler Holding AG | 31,517 | 4,552,353 | ||||||
| Sinotruk Hong Kong Ltd. | 1,090,000 | 838,765 | ||||||
|
| |||||||
| $ | 11,791,714 | |||||||
|
| |||||||
| Major Banks – 11.4% | ||||||||
| Banco Santander S.A. | 297,891 | $ | 2,401,920 | |||||
| Barclays PLC | 1,615,487 | 6,976,293 | ||||||
| BNP Paribas | 90,483 | 5,100,269 | ||||||
| BOC Hong Kong Holdings Ltd. | 431,500 | 1,353,738 | ||||||
| HSBC Holdings PLC | 332,248 | 3,514,131 | ||||||
| Mitsubishi UFJ Financial Group, Inc. | 477,400 | 2,568,956 | ||||||
7
Table of Contents
MFS Research International Portfolio
Portfolio of Investments – continued
| Issuer | Shares/Par | Value ($) | ||||||
| COMMON STOCKS – continued | ||||||||
| Major Banks – continued | ||||||||
| Standard Chartered PLC | 232,437 | $ | 5,891,968 | |||||
| Sumitomo Mitsui Financial Group, Inc. | 168,200 | 6,110,542 | ||||||
| Westpac Banking Corp. | 267,890 | 7,323,687 | ||||||
|
| |||||||
| $ | 41,241,504 | |||||||
|
| |||||||
| Medical & Health Technology & Services – 1.0% | ||||||||
| Diagnosticos da America S.A. | 228,800 | $ | 1,486,867 | |||||
| Miraca Holdings, Inc. | 51,900 | 2,089,732 | ||||||
|
| |||||||
| $ | 3,576,599 | |||||||
|
| |||||||
| Medical Equipment – 0.6% | ||||||||
| Sonova Holding AG | 17,917 | $ | 1,986,316 | |||||
|
| |||||||
| Metals & Mining – 3.7% | ||||||||
| Iluka Resources Ltd. | 387,225 | $ | 3,752,500 | |||||
| Rio Tinto Ltd. | 160,772 | 9,368,579 | ||||||
|
| |||||||
| $ | 13,121,079 | |||||||
|
| |||||||
| Natural Gas – Distribution – 1.5% | ||||||||
| China Resources Gas Group Ltd. | 180,000 | $ | 372,296 | |||||
| GDF SUEZ | 105,525 | 2,169,408 | ||||||
| Tokyo Gas Co. Ltd. | 635,000 | 2,903,192 | ||||||
|
| |||||||
| $ | 5,444,896 | |||||||
|
| |||||||
| Network & Telecom – 1.1% | ||||||||
| Ericsson, Inc., “B” | 406,427 | $ | 4,087,950 | |||||
|
| |||||||
| Other Banks & Diversified Financials – 7.1% | ||||||||
| Aeon Credit Service Co. Ltd. | 94,900 | $ | 1,916,047 | |||||
| Bank Rakyat Indonesia | 1,677,000 | 1,221,312 | ||||||
| DBS Group Holdings Ltd. | 258,000 | 3,158,262 | ||||||
| Erste Group Bank AG (a) | 157,712 | 5,042,925 | ||||||
| Grupo Financiero Santander Mexico S.A.B. de C.V., ADR (a) | 90,470 | 1,463,805 | ||||||
| HDFC Bank Ltd., ADR | 39,510 | 1,608,847 | ||||||
| ICICI Bank Ltd. | 63,754 | 1,342,901 | ||||||
| Itau Unibanco Holding S.A., ADR | 69,170 | 1,138,538 | ||||||
| KBC Group N.V. | 72,174 | 2,512,203 | ||||||
| PT Bank Mandiri Tbk. | 1,404,000 | 1,187,326 | ||||||
| Siam Commercial Bank Co. Ltd. | 262,900 | 1,555,570 | ||||||
| UBS AG | 209,699 | 3,297,763 | ||||||
|
| |||||||
| $ | 25,445,499 | |||||||
|
| |||||||
| Pharmaceuticals – 8.4% | ||||||||
| Bayer AG | 75,770 | $ | 7,195,311 | |||||
| Novartis AG | 127,957 | 8,101,152 | ||||||
| Roche Holding AG | 51,104 | 10,411,158 | ||||||
| Santen Pharmaceutical Co. Ltd. | 122,700 | 4,694,990 | ||||||
|
| |||||||
| $ | 30,402,611 | |||||||
|
| |||||||
| Precious Metals & Minerals – 0.4% | ||||||||
| Newcrest Mining Ltd. | 61,648 | $ | 1,439,293 | |||||
|
| |||||||
| Railroad & Shipping – 1.4% | ||||||||
| East Japan Railway Co. | 32,700 | $ | 2,114,261 | |||||
| Kuehne & Nagel, Inc. AG | 24,481 | 2,979,357 | ||||||
|
| |||||||
| $ | 5,093,618 | |||||||
|
| |||||||
| Issuer | Shares/Par | Value ($) | ||||||
| COMMON STOCKS – continued | ||||||||
| Real Estate – 1.3% | ||||||||
| GSW Immobilien AG | 36,719 | $ | 1,552,042 | |||||
| Hang Lung Properties Ltd. | 766,000 | 3,071,281 | ||||||
|
| |||||||
| $ | 4,623,323 | |||||||
|
| |||||||
| Restaurants – 1.4% | ||||||||
| Arcos Dorados Holdings, Inc. | 204,680 | $ | 2,447,973 | |||||
| Whitbread PLC | 65,577 | 2,614,332 | ||||||
|
| |||||||
| $ | 5,062,305 | |||||||
|
| |||||||
| Specialty Chemicals – 4.4% | ||||||||
| Akzo Nobel N.V. | 94,548 | $ | 6,238,941 | |||||
| Chugoku Marine Paints Ltd. | 126,000 | 751,913 | ||||||
| Linde AG | 35,280 | 6,152,460 | ||||||
| Nippon Paint Co. Ltd. | 138,000 | 1,186,180 | ||||||
| Symrise AG | 43,335 | 1,551,266 | ||||||
|
| |||||||
| $ | 15,880,760 | |||||||
|
| |||||||
| Specialty Stores – 0.7% | ||||||||
| Hennes & Mauritz AB, “B” | 73,424 | $ | 2,551,435 | |||||
|
| |||||||
| Telecommunications – Wireless – 3.2% | ||||||||
| KDDI Corp. | 79,700 | $ | 5,629,610 | |||||
| TIM Participacoes S.A., ADR | 53,534 | 1,061,044 | ||||||
| Vodafone Group PLC | 1,936,162 | 4,869,188 | ||||||
|
| |||||||
| $ | 11,559,842 | |||||||
|
| |||||||
| Telephone Services – 1.9% | ||||||||
| Bezeq – The Israel Telecommunication Corp. Ltd. | 931,440 | $ | 1,075,645 | |||||
| BT Group PLC | 377,174 | 1,421,756 | ||||||
| China Unicom (Hong Kong) Ltd. | 1,310,000 | 2,124,183 | ||||||
| Telecom Italia S.p.A. | 746,096 | 674,413 | ||||||
| Telecom Italia S.p.A. | 2,096,656 | 1,659,089 | ||||||
|
| |||||||
| $ | 6,955,086 | |||||||
|
| |||||||
| Tobacco – 1.6% | ||||||||
| Japan Tobacco, Inc. | 198,100 | $ | 5,579,316 | |||||
|
| |||||||
| Trucking – 1.1% | ||||||||
| Yamato Holdings Co. Ltd. | 256,400 | $ | 3,898,695 | |||||
|
| |||||||
| Utilities – Electric Power – 1.1% | ||||||||
| CEZ A.S. | 43,151 | $ | 1,543,677 | |||||
| Energias do Brasil S.A. | 398,700 | 2,450,919 | ||||||
|
| |||||||
| $ | 3,994,596 | |||||||
|
| |||||||
| Utilities – Water – 0.7% | ||||||||
| Companhia de Saneamento Basico do Estado de Sao Paulo | 27,500 | $ | 1,153,850 | |||||
| SUEZ Environnement | 122,847 | 1,481,258 | ||||||
|
| |||||||
| $ | 2,635,108 | |||||||
|
| |||||||
| Total Common Stocks (Identified Cost, $353,532,024) | $ | 363,258,453 | ||||||
|
| |||||||
8
Table of Contents
MFS Research International Portfolio
Portfolio of Investments – continued
| Issuer | Shares/Par | Value ($) | ||||||
| MONEY MARKET FUNDS – 0.0% | ||||||||
| MFS Institutional Money Market Portfolio, 0.16%, at Cost and Net Asset Value (v) | 1,671 | $ | 1,671 | |||||
|
| |||||||
| Total Investments (Identified Cost, $353,533,695) | $ | 363,260,124 | ||||||
|
| |||||||
| OTHER ASSETS, LESS LIABILITIES – (0.8)% | (2,708,445 | ) | ||||||
|
| |||||||
| Net Assets – 100.0% | $ | 360,551,679 | ||||||
|
| |||||||
| (a) | Non-income producing security. |
| (v) | Underlying affiliated fund that is available only to investment companies managed by MFS. The rate quoted for the MFS Institutional Money Market Portfolio is the annualized seven-day yield of the fund at period end. |
The following abbreviations are used in this report and are defined:
| ADR | American Depositary Receipt |
| PLC | Public Limited Company |
See Notes to Financial Statements
9
Table of Contents
MFS Research International Portfolio
FINANCIAL STATEMENTS | STATEMENT OF ASSETS AND LIABILITIES
This statement represents your fund’s balance sheet, which details the assets and liabilities comprising the total value of the fund.
At 12/31/12 | ||||||||
Assets | ||||||||
Investments – | ||||||||
Non-affiliated issuers, at value (identified cost, $353,532,024) | $363,258,453 | |||||||
Underlying affiliated funds, at cost and value | 1,671 | |||||||
Total investments, at value (identified cost, $353,533,695) | $363,260,124 | |||||||
Foreign currency, at value (identified cost, $8,475) | 8,490 | |||||||
Receivables for | ||||||||
Investments sold | 207,874 | |||||||
Fund shares sold | 1,349 | |||||||
Interest and dividends | 328,282 | |||||||
Other assets | 1,764 | |||||||
Total assets | $363,807,883 | |||||||
Liabilities | ||||||||
Payable to custodian | $1,973,817 | |||||||
Payable for fund shares reacquired | 1,107,213 | |||||||
Payable to affiliates | ||||||||
Investment adviser | 35,988 | |||||||
Shareholder servicing costs | 259 | |||||||
Distribution and/or service fees | 2,492 | |||||||
Payable for independent Trustees’ compensation | 57 | |||||||
Accrued expenses and other liabilities | 136,378 | |||||||
Total liabilities | $3,256,204 | |||||||
Net assets | $360,551,679 | |||||||
Net assets consist of | ||||||||
Paid-in capital | $369,935,460 | |||||||
Unrealized appreciation (depreciation) on investments and translation of assets and liabilities in foreign currencies (net of $45,814 deferred country tax) | 9,680,444 | |||||||
Accumulated net realized gain (loss) on investments and foreign currency | (21,505,585 | ) | ||||||
Undistributed net investment income | 2,441,360 | |||||||
Net assets | $360,551,679 | |||||||
Shares of beneficial interest outstanding | 26,555,114 |
| Net assets | Shares outstanding | Net asset value per share | ||||||||||
Initial Class | $269,210,966 | 19,769,248 | $13.62 | |||||||||
Service Class | 91,340,713 | 6,785,866 | 13.46 | |||||||||
See Notes to Financial Statements
10
Table of Contents
MFS Research International Portfolio
FINANCIAL STATEMENTS | STATEMENT OF OPERATIONS
This statement describes how much your fund earned in investment income and accrued in expenses. It also describes any gains and/or losses generated by fund operations.
| Year ended 12/31/12 | ||||||||
Net investment income | ||||||||
Income | ||||||||
Dividends | $4,809,230 | |||||||
Interest | 58,072 | |||||||
Dividends from underlying affiliated funds | 2,687 | |||||||
Foreign taxes withheld | (356,507 | ) | ||||||
Total investment income | $4,513,482 | |||||||
Expenses | ||||||||
Management fee | $1,379,202 | |||||||
Distribution and/or service fees | 237,901 | |||||||
Shareholder servicing costs | 13,594 | |||||||
Administrative services fee | 31,912 | |||||||
Independent Trustees’ compensation | 6,202 | |||||||
Custodian fee | 105,996 | |||||||
Shareholder communications | 13,785 | |||||||
Audit and tax fees | 87,477 | |||||||
Legal fees | 2,512 | |||||||
Miscellaneous | 18,332 | |||||||
Total expenses | $1,896,913 | |||||||
Fees paid indirectly | (2 | ) | ||||||
Reduction of expenses by investment adviser | (490 | ) | ||||||
Net expenses | $1,896,421 | |||||||
Net investment income | $2,617,061 | |||||||
Realized and unrealized gain (loss) on investments and foreign currency | ||||||||
Realized gain (loss) (identified cost basis) | ||||||||
Investments (net of $2,859 country tax) | $2,029,862 | |||||||
Foreign currency | (171,044 | ) | ||||||
Net realized gain (loss) on investments and foreign currency | $1,858,818 | |||||||
Change in unrealized appreciation (depreciation) | ||||||||
Investments (net of $41,696 increase in deferred country tax) | $24,112,562 | |||||||
Translation of assets and liabilities in foreign currencies | 4,401 | |||||||
Net unrealized gain (loss) on investments and foreign currency translation | $24,116,963 | |||||||
Net realized and unrealized gain (loss) on investments and foreign currency | $25,975,781 | |||||||
Change in net assets from operations | $28,592,842 |
See Notes to Financial Statements
11
Table of Contents
MFS Research International Portfolio
FINANCIAL STATEMENTS | STATEMENTS OF CHANGES IN NET ASSETS
These statements describe the increases and/or decreases in net assets resulting from operations, any distributions, and any shareholder transactions.
For years ended 12/31 | 2012 | 2011 | ||||||
Change in net assets | ||||||||
From operations | ||||||||
Net investment income | $2,617,061 | $2,720,901 | ||||||
Net realized gain (loss) on investments and foreign currency | 1,858,818 | 5,649,366 | ||||||
Net unrealized gain (loss) on investments and foreign currency translation | 24,116,963 | (24,558,401 | ) | |||||
Change in net assets from operations | $28,592,842 | $(16,188,134 | ) | |||||
| Distributions declared to shareholders | ||||||||
From net investment income | $(2,715,065 | ) | $(2,878,963 | ) | ||||
Change in net assets from fund share transactions | $197,571,017 | $(17,547,891 | ) | |||||
Total change in net assets | $223,448,794 | $(36,614,988 | ) | |||||
Net assets | ||||||||
At beginning of period | 137,102,885 | 173,717,873 | ||||||
At end of period (including undistributed net investment income of $2,441,360 and | $360,551,679 | $137,102,885 |
See Notes to Financial Statements
12
Table of Contents
MFS Research International Portfolio
FINANCIAL STATEMENTS | FINANCIAL HIGHLIGHTS
The financial highlights table is intended to help you understand the fund’s financial performance for the past 5 years. Certain information reflects financial results for a single fund share. The total returns in the table represent the rate by which an investor would have earned (or lost) on an investment in the fund share class (assuming reinvestment of all distributions) held for the entire period.
| Initial Class | Years ended 12/31 | |||||||||||||||||||
| 2012 | 2011 | 2010 | 2009 | 2008 | ||||||||||||||||
Net asset value, beginning of period | $11.94 | $13.69 | $12.54 | $9.94 | �� | $19.92 | ||||||||||||||
| Income (loss) from investment operations | ||||||||||||||||||||
Net investment income (d) | $0.19 | $0.25 | $0.20 | $0.17 | $0.37 | |||||||||||||||
Net realized and unrealized gain (loss) on investments | 1.77 | (1.72 | ) | 1.12 | 2.77 | (7.71 | ) | |||||||||||||
Total from investment operations | $1.96 | $(1.47 | ) | $1.32 | $2.94 | $(7.34 | ) | |||||||||||||
| Less distributions declared to shareholders | ||||||||||||||||||||
From net investment income | $(0.28 | ) | $(0.28 | ) | $(0.17 | ) | $(0.34 | ) | $(0.29 | ) | ||||||||||
From net realized gain on investments | — | — | — | — | (2.35 | ) | ||||||||||||||
Total distributions declared to shareholders | $(0.28 | ) | $(0.28 | ) | $(0.17 | ) | $(0.34 | ) | $(2.64 | ) | ||||||||||
Net asset value, end of period (x) | $13.62 | $11.94 | $13.69 | $12.54 | $9.94 | |||||||||||||||
Total return (%) (k)(r)(s)(x) | 16.59 | (10.88 | ) | 10.63 | 30.94 | (42.49 | ) | |||||||||||||
| Ratios (%) (to average net assets) and Supplemental data: | ||||||||||||||||||||
| Expenses before expense reductions (f) | 1.07 | 1.14 | 1.12 | 1.18 | 1.17 | |||||||||||||||
| Expenses after expense reductions (f) | 1.07 | 1.10 | 1.10 | 1.10 | 1.11 | |||||||||||||||
| Net investment income | 1.44 | 1.89 | 1.66 | 1.62 | 2.43 | |||||||||||||||
| Portfolio turnover | 46 | 45 | 60 | 75 | 82 | |||||||||||||||
Net assets at end of period (000 omitted) | $269,211 | $40,134 | $52,239 | $93,714 | $45,835 | |||||||||||||||
See Notes to Financial Statements
13
Table of Contents
MFS Research International Portfolio
Financial Highlights – continued
| Service Class | Years ended 12/31 | |||||||||||||||||||
| 2012 | 2011 | 2010 | 2009 | 2008 | ||||||||||||||||
Net asset value, beginning of period | $11.80 | $13.52 | $12.39 | $9.82 | $19.70 | |||||||||||||||
| Income (loss) from investment operations | ||||||||||||||||||||
Net investment income (d) | $0.23 | $0.22 | $0.16 | $0.17 | $0.32 | |||||||||||||||
Net realized and unrealized gain (loss) on investments | 1.67 | (1.70 | ) | 1.11 | 2.70 | (7.61 | ) | |||||||||||||
Total from investment operations | $1.90 | $(1.48 | ) | $1.27 | $2.87 | $(7.29 | ) | |||||||||||||
| Less distributions declared to shareholders | ||||||||||||||||||||
From net investment income | $(0.24 | ) | $(0.24 | ) | $(0.14 | ) | $(0.30 | ) | $(0.24 | ) | ||||||||||
From net realized gain on investments | — | — | — | — | (2.35 | ) | ||||||||||||||
Total distributions declared to shareholders | $(0.24 | ) | $(0.24 | ) | $(0.14 | ) | $(0.30 | ) | $(2.59 | ) | ||||||||||
Net asset value, end of period (x) | $13.46 | $11.80 | $13.52 | $12.39 | $9.82 | |||||||||||||||
Total return (%) (k)(r)(s)(x) | 16.29 | (11.06 | ) | 10.34 | 30.50 | (42.60 | ) | |||||||||||||
| Ratios (%) (to average net assets) and Supplemental data: | ||||||||||||||||||||
| Expenses before expense reductions (f) | 1.34 | 1.39 | 1.37 | 1.43 | 1.42 | |||||||||||||||
| Expenses after expense reductions (f) | 1.34 | 1.35 | 1.35 | 1.35 | 1.36 | |||||||||||||||
| Net investment income | 1.87 | 1.64 | 1.31 | 1.64 | 2.17 | |||||||||||||||
| Portfolio turnover | 46 | 45 | 60 | 75 | 82 | |||||||||||||||
Net assets at end of period (000 omitted) | $91,341 | $96,969 | $121,479 | $126,055 | $113,966 | |||||||||||||||
| (d) | Per share data is based on average shares outstanding. |
| (f) | Ratios do not reflect reductions from fees paid indirectly, if applicable. |
| (k) | The total return does not reflect expenses that apply to separate accounts. Inclusion of these charges would reduce the total return figures for all periods shown. |
| (r) | Certain expenses have been reduced without which performance would have been lower. |
| (s) | From time to time the fund may receive proceeds from litigation settlements, without which performance would be lower. |
| (x) | The net asset values per share and total returns have been calculated on net assets which include adjustments made in accordance with U.S. generally accepted accounting principles required at period end for financial reporting purposes. |
See Notes to Financial Statements
14
Table of Contents
MFS Research International Portfolio
| (1) | Business and Organization |
MFS Research International Portfolio (the fund) is a series of MFS Variable Insurance Trust II (the trust). The trust is organized as a Massachusetts business trust and is registered under the Investment Company Act of 1940, as amended, as an open-end management investment company. The shareholders of each series of the trust are separate accounts of insurance companies, which offer variable annuity and/or life insurance products, and qualified retirement and pension plans.
| (2) | Significant Accounting Policies |
General – The preparation of financial statements in conformity with U.S. generally accepted accounting principles requires management to make estimates and assumptions that affect the reported amounts of assets and liabilities, and disclosure of contingent assets and liabilities at the date of the financial statements and the reported amounts of revenues and expenses during the reporting period. Actual results could differ from those estimates. In the preparation of these financial statements, management has evaluated subsequent events occurring after the date of the fund’s Statement of Assets and Liabilities through the date that the financial statements were issued. The fund invests in foreign securities. Investments in foreign securities are vulnerable to the effects of changes in the relative values of the local currency and the U.S. dollar and to the effects of changes in each country’s legal, political, and economic environment.
In this reporting period the fund adopted Financial Accounting Standards Board (FASB) Accounting Standards Update 2011-04, Fair Value Measurement (Topic 820) – Amendments to Achieve Common Fair Value Measurement and Disclosure Requirements in U.S. GAAP and IFRSs (“ASU 2011-04”). ASU 2011-04 seeks to improve the comparability of fair value measurements as presented and disclosed in financial statements prepared in accordance with U.S. GAAP and International Financial Reporting Standards (IFRS) by providing common requirements for fair value measurement and disclosure.
In December 2011, the FASB issued Accounting Standards Update 2011-11, Balance Sheet (Topic 210) – Disclosures about Offsetting Assets and Liabilities (“ASU 2011-11”). Effective for annual reporting periods beginning on or after January 1, 2013 and interim periods within those annual periods, ASU 2011-11 is intended to enhance disclosure requirements on the offsetting of financial assets and liabilities. Although still evaluating the potential impacts of ASU 2011-11 to the fund, management expects that the impact of the fund’s adoption will be limited to additional financial statement disclosures.
Investment Valuations – Equity securities, including restricted equity securities, are generally valued at the last sale or official closing price as provided by a third-party pricing service on the market or exchange on which they are primarily traded. Equity securities, for which there were no sales reported that day, are generally valued at the last quoted daily bid quotation as provided by a third-party pricing service on the market or exchange on which such securities are primarily traded. Short-term instruments with a maturity at issuance of 60 days or less generally are valued at amortized cost, which approximates market value. Open-end investment companies are generally valued at net asset value per share. Securities and other assets generally valued on the basis of information from a third-party pricing service may also be valued at a broker/dealer bid quotation. Values obtained from third-party pricing services can utilize both transaction data and market information such as yield, quality, coupon rate, maturity, type of issue, trading characteristics, and other market data. The values of foreign securities and other assets and liabilities expressed in foreign currencies are converted to U.S. dollars using the mean of bid and asked prices for rates provided by a third-party pricing service.
The Board of Trustees has delegated primary responsibility for determining or causing to be determined the value of the fund’s investments (including any fair valuation) to the adviser pursuant to valuation policies and procedures approved by the Board. If the adviser determines that reliable market quotations are not readily available, investments are valued at fair value as determined in good faith by the adviser in accordance with such procedures under the oversight of the Board of Trustees. Under the fund’s valuation policies and procedures, market quotations are not considered to be readily available for most types of debt instruments and floating rate loans and many types of derivatives. These investments are generally valued at fair value based on information from third-party pricing services. In addition, investments may be valued at fair value if the adviser determines that an investment’s value has been materially affected by events occurring after the close of the exchange or market on which the investment is principally traded (such as foreign exchange or market) and prior to the determination of the fund’s net asset value, or after the halting of trading of a specific security where trading does not resume prior to the close of the exchange or market on which the security is principally traded. Events that occur on a frequent basis after foreign markets close (such as developments in foreign markets and significant movements in the U.S. markets) and prior to the determination of the fund’s net asset value may be deemed to have a material effect on the value of securities traded in foreign markets. Accordingly, the fund’s foreign equity securities may often be valued at fair value. The adviser generally relies on third-party pricing services or other information (such as the correlation with price movements of similar securities in the same or other markets; the type, cost and investment characteristics of the security; the business and financial condition of the issuer; and trading and other market data) to assist in determining whether to fair value and at what value to fair value an investment. The value of an investment for purposes of calculating the fund’s net asset value can differ depending on the source and method used to determine value. When fair valuation is used, the value of an investment used to
15
Table of Contents
MFS Research International Portfolio
Notes to Financial Statements – continued
determine the fund’s net asset value may differ from quoted or published prices for the same investment. There can be no assurance that the fund could obtain the fair value assigned to an investment if it were to sell the investment at the same time at which the fund determines its net asset value per share.
Various inputs are used in determining the value of the fund’s assets or liabilities. These inputs are categorized into three broad levels. In certain cases, the inputs used to measure fair value may fall into different levels of the fair value hierarchy. In such cases, an investment’s level within the fair value hierarchy is based on the lowest level of input that is significant to the fair value measurement. The fund’s assessment of the significance of a particular input to the fair value measurement in its entirety requires judgment, and considers factors specific to the investment. Level 1 includes unadjusted quoted prices in active markets for identical assets or liabilities. Level 2 includes other significant observable market-based inputs (including quoted prices for similar securities, interest rates, prepayment speed, and credit risk). Level 3 includes unobservable inputs, which may include the adviser’s own assumptions in determining the fair value of investments. The following is a summary of the levels used as of December 31, 2012 in valuing the fund’s assets or liabilities:
| Investments at Value | Level 1 | Level 2 | Level 3 | Total | ||||||||||||
| Equity Securities: | ||||||||||||||||
Japan | $15,061,804 | $61,755,580 | $— | $76,817,384 | ||||||||||||
United Kingdom | — | 66,859,759 | — | 66,859,759 | ||||||||||||
Switzerland | 12,094,434 | 34,347,042 | — | 46,441,476 | ||||||||||||
France | 2,169,408 | 29,660,802 | — | 31,830,210 | ||||||||||||
Germany | 1,551,266 | 21,324,346 | — | 22,875,612 | ||||||||||||
Netherlands | — | 20,471,239 | — | 20,471,239 | ||||||||||||
Hong Kong | — | 18,672,530 | — | 18,672,530 | ||||||||||||
Australia | — | 12,515,480 | — | 12,515,480 | ||||||||||||
Brazil | 2,199,582 | 7,128,531 | — | 9,328,113 | ||||||||||||
Other Countries | 15,680,645 | 41,766,005 | — | 57,446,650 | ||||||||||||
| Mutual Funds | 1,671 | — | — | 1,671 | ||||||||||||
| Total Investments | $48,758,810 | $314,501,314 | $— | $363,260,124 | ||||||||||||
For further information regarding security characteristics, see the Portfolio of Investments.
Of the level 2 investments presented above, equity investments amounting to $151,325,977 would have been considered level 1 investments at the beginning of the period. Of the level 1 investments presented above, equity investments amounting to $10,108,118 would have been considered level 2 investments at the beginning of the period. The primary reason for changes in the classifications between levels 1 and 2 occurs when foreign equity securities are fair valued using other observable market-based inputs in place of the closing exchange price due to events occurring after the close of the exchange or market on which the investment is principally traded. The fund’s foreign equity securities may often be valued at fair value. The fund’s policy is to recognize transfers between the levels as of the end of the period.
Foreign Currency Translation – Purchases and sales of foreign investments, income, and expenses are converted into U.S. dollars based upon currency exchange rates prevailing on the respective dates of such transactions or on the reporting date for foreign denominated receivables and payables. Gains and losses attributable to foreign currency exchange rates on sales of securities are recorded for financial statement purposes as net realized gains and losses on investments. Gains and losses attributable to foreign exchange rate movements on receivables, payables, income and expenses are recorded for financial statement purposes as foreign currency transaction gains and losses. That portion of both realized and unrealized gains and losses on investments that results from fluctuations in foreign currency exchange rates is not separately disclosed.
Security Loans – State Street Bank and Trust Company (“State Street”), as lending agent, loans the securities of the fund to certain qualified institutions (the “Borrowers”) approved by the fund. The loans are collateralized by cash and/or U.S. Treasury and federal agency obligations in an amount typically at least equal to the market value of the securities loaned. The market value of the loaned securities is determined at the close of business of the fund and any additional required collateral is delivered to the fund on the next business day. State Street provides the fund with indemnification against Borrower default. The fund bears the risk of loss with respect to the investment of cash collateral. On loans collateralized by cash, the cash collateral is invested in a money market fund or short-term securities. A portion of the income generated upon investment of the collateral is remitted to the Borrowers, and the remainder is allocated between the fund and the lending agent. On loans collateralized by U.S. Treasury and/or federal agency obligations, a fee is received from the Borrower, and is allocated between the fund and the lending agent. Income from securities lending is included in “Interest” income on the Statement of Operations. The dividend and interest income earned on the securities loaned is accounted for in the same manner as other dividend and interest income. At December 31, 2012, there were no securities on loan or collateral outstanding.
16
Table of Contents
MFS Research International Portfolio
Notes to Financial Statements – continued
Indemnifications – Under the fund’s organizational documents, its officers and Trustees may be indemnified against certain liabilities and expenses arising out of the performance of their duties to the fund. Additionally, in the normal course of business, the fund enters into agreements with service providers that may contain indemnification clauses. The fund’s maximum exposure under these agreements is unknown as this would involve future claims that may be made against the fund that have not yet occurred.
Investment Transactions and Income – Investment transactions are recorded on the trade date. Interest income is recorded on the accrual basis. Dividends received in cash are recorded on the ex-dividend date. Certain dividends from foreign securities will be recorded when the fund is informed of the dividend if such information is obtained subsequent to the ex-dividend date. Dividend and interest payments received in additional securities are recorded on the ex-dividend or ex-interest date in an amount equal to the value of the security on such date.
The fund may receive proceeds from litigation settlements. Any proceeds received from litigation involving portfolio holdings are reflected in the Statement of Operations in realized gain/loss if the security has been disposed of by the fund or in unrealized gain/loss if the security is still held by the fund. Any other proceeds from litigation not related to portfolio holdings are reflected as other income in the Statement of Operations.
Fees Paid Indirectly – The fund’s custody fee may be reduced according to an arrangement that measures the value of cash deposited with the custodian by the fund. This amount, for the year ended December 31, 2012, is shown as a reduction of total expenses in the Statement of Operations.
Tax Matters and Distributions – The fund intends to qualify as a regulated investment company, as defined under Subchapter M of the Internal Revenue Code, and to distribute all of its taxable income, including realized capital gains. As a result, no provision for federal income tax is required. The fund’s federal tax returns, when filed, will remain subject to examination by the Internal Revenue Service for a three year period. Foreign taxes have been accrued by the fund in the accompanying financial statements.
Distributions to shareholders are recorded on the ex-dividend date. Income and capital gain distributions are determined in accordance with income tax regulations, which may differ from U.S. generally accepted accounting principles. Certain capital accounts in the financial statements are periodically adjusted for permanent differences in order to reflect their tax character. These adjustments have no impact on net assets or net asset value per share. Temporary differences which arise from recognizing certain items of income, expense, gain or loss in different periods for financial statement and tax purposes will reverse at some time in the future. Distributions in excess of net investment income or net realized gains are temporary overdistributions for financial statement purposes resulting from differences in the recognition or classification of income or distributions for financial statement and tax purposes.
Book/tax differences primarily relate to wash sale loss deferrals.
The tax character of distributions declared to shareholders for the last two fiscal years is as follows:
| 12/31/12 | 12/31/11 | |||||||
| Ordinary income (including any short-term capital gains) | $2,715,065 | $2,878,963 | ||||||
The federal tax cost and the tax basis components of distributable earnings were as follows:
| As of 12/31/12 | ||||
| Cost of investments | $354,603,349 | |||
| Gross appreciation | 17,242,998 | |||
| Gross depreciation | (8,586,223 | ) | ||
| Net unrealized appreciation (depreciation) | $8,656,775 | |||
| Undistributed ordinary income | 2,461,912 | |||
| Capital loss carryforwards | (20,435,931 | ) | ||
| Other temporary differences | (66,537 | ) |
Under the Regulated Investment Company Modernization Act of 2010 (the “Act”), net capital losses recognized after December 31, 2010 may be carried forward indefinitely, and their character is retained as short-term and/or long-term losses. Previously, net capital losses were carried forward for eight years and treated as short-term losses. As a transition rule, the Act requires that post-enactment net capital losses be used before pre-enactment net capital losses.
As of December 31, 2012, the fund had capital loss carryforwards available to offset future realized gains. Such losses expire as follows:
| Pre-enactment losses: | ||||
| 12/31/16 | $(8,391,479 | ) | ||
| 12/31/17 | (12,044,452 | ) | ||
| Total | $(20,435,931 | ) |
17
Table of Contents
MFS Research International Portfolio
Notes to Financial Statements – continued
Multiple Classes of Shares of Beneficial Interest – The fund offers multiple classes of shares, which differ in their respective distribution and/or service fees. The fund’s income, realized and unrealized gain (loss), and common expenses are allocated to shareholders based on the daily net assets of each class. Dividends are declared separately for each class. Differences in per share dividend rates are generally due to differences in separate class expenses. The fund’s distributions declared to shareholders as reported in the Statements of Changes in Net Assets are presented by class as follows:
| From net investment income | ||||||||
| Year ended 12/31/12 | Year ended 12/31/11 | |||||||
| Initial Class | $875,101 | $962,485 | ||||||
| Service Class | 1,839,964 | 1,916,478 | ||||||
| Total | $2,715,065 | $2,878,963 | ||||||
| (3) | Transactions with Affiliates |
Investment Adviser – The fund has an investment advisory agreement with MFS to provide overall investment management and related administrative services and facilities to the fund. The management fee is computed daily and paid monthly at the following annual rates:
| First $1 billion of average daily net assets | 0.90% | |||
| Next $1 billion of average daily net assets | 0.80% | |||
| Average daily net assets in excess of $2 billion | 0.70% |
The management fee incurred for the year ended December 31, 2012 was equivalent to an annual effective rate of 0.90% the fund’s average daily net assets.
The investment adviser has agreed in writing to pay a portion of the fund’s total annual operating expenses, exclusive of interest, taxes, extraordinary expenses, brokerage and transaction costs, and investment-related expenses, such that total annual operating expenses do not exceed 1.10% of average daily net assets for the Initial Class shares and 1.35% of average daily net assets for the Service Class shares. This written agreement will continue until modified by the fund’s Board of Trustees, but such agreement will continue at least until April 30, 2014. For the year ended December 31, 2012, the fund’s actual operating expenses did not exceed the limit and therefore, the investment adviser did not pay any portion of the fund’s expenses related to this agreement.
Distributor – MFS Fund Distributors, Inc. (MFD), a wholly-owned subsidiary of MFS, is the distributor of shares of the fund. The Trustees have adopted a distribution plan for the Service Class shares pursuant to Rule 12b-1 under the Investment Company Act of 1940.
The fund’s distribution plan provides that the fund will pay MFD distribution and/or service fees equal to 0.25% per annum of its average daily net assets attributable to Service Class shares as partial consideration for services performed and expenses incurred by MFD and financial intermediaries (including participating insurance companies that invest in the fund to fund variable annuity and variable life insurance contracts, sponsors of qualified retirement and pension plans that invest in the fund, and affiliates of these participating insurance companies and plan sponsors) in connection with the sale and distribution of the Service Class shares. MFD may subsequently pay all, or a portion, of the distribution and/or service fees to financial intermediaries.
Shareholder Servicing Agent – MFS Service Center, Inc. (MFSC), a wholly-owned subsidiary of MFS, receives a fee from the fund for its services as shareholder servicing agent. For the year ended December 31, 2012, the fee was $13,575, which equated to 0.0089% annually of the fund’s average daily net assets. MFSC also receives payment from the fund for out-of-pocket expenses paid by MFSC on behalf of the fund. For the year ended December 31, 2012, these costs amounted to $19.
Administrator – MFS provides certain financial, legal, shareholder communications, compliance, and other administrative services to the fund. Under an administrative services agreement, the fund partially reimburses MFS the costs incurred to provide these services. The fund is charged an annual fixed amount of $17,500 plus a fee based on average daily net assets. The administrative services fee incurred for the year ended December 31, 2012 was equivalent to an annual effective rate of 0.0208% of the fund’s average daily net assets.
Trustees’ and Officers’ Compensation – The fund pays compensation to independent Trustees in the form of a retainer, attendance fees, and additional compensation to Board and Committee chairpersons. The fund does not pay compensation directly to Trustees or officers of the fund who are also officers of the investment adviser, all of whom receive remuneration for their services to the fund from MFS. Certain officers and Trustees of the fund are officers or directors of MFS, MFD, and MFSC.
Other – This fund and certain other funds managed by MFS (the funds) have entered into services agreements (the Agreements) which provide for payment of fees by the funds to Tarantino LLC and Griffin Compliance LLC in return for the provision of services of an Independent Chief Compliance Officer (ICCO) and Assistant ICCO, respectively, for the funds. The ICCO and Assistant ICCO are
18
Table of Contents
MFS Research International Portfolio
Notes to Financial Statements – continued
officers of the funds and the sole members of Tarantino LLC and Griffin Compliance LLC, respectively. The funds can terminate the Agreements with Tarantino LLC and Griffin Compliance LLC at any time under the terms of the Agreements. For the year ended December 31, 2012, the aggregate fees paid by the fund to Tarantino LLC and Griffin Compliance LLC were $1,126 and are included in “Miscellaneous” expense in the Statement of Operations. MFS has agreed to reimburse the fund for a portion of the payments made by the fund in the amount of $490, which is shown as a reduction of total expenses in the Statement of Operations. Additionally, MFS has agreed to bear all expenses associated with office space, other administrative support, and supplies provided to the ICCO and Assistant ICCO.
The fund invests in the MFS Institutional Money Market Portfolio which is managed by MFS and seeks current income consistent with preservation of capital and liquidity. Income earned on this investment is included in “Dividends from underlying affiliated funds” in the Statement of Operations. This money market fund does not pay a management fee to MFS.
| (4) | Portfolio Securities |
Purchases and sales of investments, other than short-term obligations, aggregated $272,061,845 and $71,412,785, respectively.
| (5) | Shares of Beneficial Interest |
The fund’s Declaration of Trust permits the Trustees to issue an unlimited number of full and fractional shares of beneficial interest. Transactions in fund shares were as follows:
| Year ended 12/31/12 | Year ended 12/31/11 | |||||||||||||||
| Shares | Amount | Shares | Amount | |||||||||||||
| Shares sold | ||||||||||||||||
Initial Class | 17,478,710 | $230,319,858 | 190,579 | $2,456,622 | ||||||||||||
Service Class | 482,180 | 5,706,383 | 833,151 | 10,165,576 | ||||||||||||
| 17,960,890 | $236,026,241 | 1,023,730 | $12,622,198 | |||||||||||||
| Shares issued to shareholders in reinvestment of distributions | ||||||||||||||||
Initial Class | 69,729 | $875,101 | 74,902 | $962,485 | ||||||||||||
Service Class | 148,265 | 1,839,964 | 150,785 | 1,916,478 | ||||||||||||
| 217,994 | $2,715,065 | 225,687 | $2,878,963 | |||||||||||||
| Shares reacquired | ||||||||||||||||
Initial Class | (1,139,852 | ) | $(14,928,327 | ) | (721,768 | ) | $(9,666,839 | ) | ||||||||
Service Class | (2,060,553 | ) | (26,241,962 | ) | (1,750,964 | ) | (23,382,213 | ) | ||||||||
| (3,200,405 | ) | $(41,170,289 | ) | (2,472,732 | ) | $(33,049,052 | ) | |||||||||
| Net change | ||||||||||||||||
Initial Class | 16,408,587 | $216,266,632 | (456,287 | ) | $(6,247,732 | ) | ||||||||||
Service Class | (1,430,108 | ) | (18,695,615 | ) | (767,028 | ) | (11,300,159 | ) | ||||||||
| 14,978,479 | $197,571,017 | (1,223,315 | ) | $(17,547,891 | ) | |||||||||||
The fund is one of several mutual funds in which the MFS funds-of-funds may invest. The MFS funds-of-funds do not invest in the underlying MFS funds for the purpose of exercising management or control. At the end of the period, the MFS Moderate Allocation Portfolio, the MFS Growth Allocation Portfolio, and the MFS Conservative Allocation Portfolio were the owners of record of approximately 39%, 14%, and 11%, respectively, of the value of outstanding voting shares of the fund.
| (6) | Line of Credit |
The fund and certain other funds managed by MFS participate in a $1.1 billion unsecured committed line of credit, subject to a $1 billion sublimit, provided by a syndication of banks under a credit agreement. Borrowings may be made for temporary financing needs. Interest is charged to each fund, based on its borrowings, generally at a rate equal to the higher of the Federal Reserve funds rate or one month LIBOR plus an agreed upon spread. A commitment fee, based on the average daily, unused portion of the committed line of credit, is allocated among the participating funds at the end of each calendar quarter. In addition, the fund and other funds managed by MFS have established unsecured uncommitted borrowing arrangements with certain banks for temporary financing needs. Interest is charged to each fund, based on its borrowings, at a rate equal to the Federal Reserve funds rate plus an agreed upon spread. For the year ended December 31, 2012, the fund’s commitment fee and interest expense were $868 and $0, respectively, and are included in “Miscellaneous” expense in the Statement of Operations.
19
Table of Contents
MFS Research International Portfolio
Notes to Financial Statements – continued
| (7) | Transactions in Underlying Affiliated Funds – Affiliated Issuers |
An affiliated issuer may be considered one in which the fund owns 5% or more of the outstanding voting securities, or a company which is under common control. For the purposes of this report, the fund assumes the following to be an affiliated issuer:
| Underlying Affiliated Fund | Beginning Shares/Par Amount | Acquisitions Shares/Par Amount | Dispositions Shares/Par Amount | Ending Shares/Par Amount | ||||||||||||
| MFS Institutional Money Market Portfolio | 301,201 | 156,533,048 | (156,832,578 | ) | 1,671 | |||||||||||
| Underlying Affiliated Fund | Realized Gain (Loss) | Capital Gain Distributions | Dividend Income | Ending Value | ||||||||||||
| MFS Institutional Money Market Portfolio | $— | $— | $2,687 | $1,671 | ||||||||||||
20
Table of Contents
MFS Research International Portfolio
REPORT OF INDEPENDENT REGISTERED PUBLIC ACCOUNTING FIRM
To the Board of Trustees of MFS Variable Insurance Trust II and the Shareholders of
MFS Research International Portfolio:
We have audited the accompanying statement of assets and liabilities, including the portfolio of investments, of MFS Research International Portfolio (the “Fund”) (one of the series comprising MFS Variable Insurance Trust II) as of December 31, 2012, and the related statement of operations for the year then ended, the statements of changes in net assets for each of the two years in the period then ended, and the financial highlights for each of the five years in the period then ended. These financial statements and financial highlights are the responsibility of the Fund’s management. Our responsibility is to express an opinion on these financial statements and financial highlights based on our audits.
We conducted our audits in accordance with the standards of the Public Company Accounting Oversight Board (United States). Those standards require that we plan and perform the audit to obtain reasonable assurance about whether the financial statements and financial highlights are free of material misstatement. The Fund is not required to have, nor were we engaged to perform, an audit of its internal control over financial reporting. Our audits included consideration of internal control over financial reporting as a basis for designing audit procedures that are appropriate in the circumstances, but not for the purpose of expressing an opinion on the effectiveness of the Fund’s internal control over financial reporting. Accordingly, we express no such opinion. An audit also includes examining, on a test basis, evidence supporting the amounts and disclosures in the financial statements, assessing the accounting principles used and significant estimates made by management, as well as evaluating the overall financial statement presentation. Our procedures included confirmation of securities owned as of December 31, 2012, by correspondence with the custodian and brokers; where replies were not received from brokers, we performed other auditing procedures. We believe that our audits provide a reasonable basis for our opinion.
In our opinion, the financial statements and financial highlights referred to above present fairly, in all material respects, the financial position of MFS Research International Portfolio as of December 31, 2012, the results of its operations for the year then ended, the changes in its net assets for each of the two years in the period then ended, and the financial highlights for each of the five years in the period then ended, in conformity with accounting principles generally accepted in the United States of America.
DELOITTE & TOUCHE LLP
Boston, Massachusetts
February 15, 2013
21
Table of Contents
MFS Research International Portfolio
TRUSTEES AND OFFICERS – IDENTIFICATION AND BACKGROUND
The Trustees and officers of the Trust, as of February 1, 2013, are listed below, together with their principal occupations during the past five years. (Their titles may have varied during that period.) The address of each Trustee and officer is 111 Huntington Avenue, Boston, Massachusetts 02199-7618.
Name, Age | Position(s) with Fund | Trustee/Officer Since (h) | Principal Occupations During the Past Five Years | Other Directorships (j) | ||||
| INTERESTED TRUSTEES | ||||||||
Robert J. Manning (k) (age 49) | Trustee | February 2004 | Massachusetts Financial Services Company, Chairman, Chief Executive Officer and Director; President (until December 2009); Chief Investment Officer (until July 2010) | N/A | ||||
| INDEPENDENT TRUSTEES | ||||||||
David H. Gunning (age 70) | Trustee and Chair of Trustees | January 2004 | Private investor | Lincoln Electric Holdings, Inc. (welding equipment manufacturer), Director; Development Alternatives, Inc. (consulting), Director/Non-Executive Chairman; Portman Limited (mining), Director (until 2008) | ||||
Robert E. Butler (age 71) | Trustee | January 2006 | Consultant – investment company industry regulatory and compliance matters | N/A | ||||
Maureen R. Goldfarb (age 57) | Trustee | January 2009 | Private investor | N/A | ||||
William R. Gutow (age 71) | Trustee | December 1993 | Private investor and real estate consultant; Capitol Entertainment Management Company (video franchise), Vice Chairman | Atlantic Coast Tan (tanning salons), Vice Chairman (until 2007); Texas Donuts (donut franchise), Vice Chairman (until 2010) | ||||
Michael Hegarty (age 68) | Trustee | December 2004 | Private investor; Rouse Properties Inc. (real estate), Director | N/A | ||||
John P. Kavanaugh (age 58) | Trustee | January 2009 | Private investor | N/A | ||||
J. Dale Sherratt (age 74) | Trustee | June 1989 | Insight Resources, Inc. (acquisition planning specialists), President; Wellfleet Investments (investor in health care companies), Managing General Partner | N/A | ||||
| Laurie J. Thomsen (age 55) | Trustee | March 2005 | Private investor; New Profit, Inc. (venture philanthropy), Executive Partner (until 2010) | The Travelers Companies (insurance), Director | ||||
Robert W. Uek (age 71) | Trustee | January 2006 | Consultant to investment company industry | N/A | ||||
| OFFICERS | ||||||||
John M. Corcoran (k) (age 47) | President | October 2008 | Massachusetts Financial Services Company, Senior Vice President (since October 2008); State Street Bank and Trust (financial services provider), Senior Vice President, (until September 2008) | N/A | ||||
| Christopher R. Bohane (k) (age 39) | Assistant Secretary and Assistant Clerk | July 2005 | Massachusetts Financial Services Company, Vice President and Senior Counsel | N/A | ||||
Kino Clark (k) (age 44) | Assistant Treasurer | January 2012 | Massachusetts Financial Services Company, Vice President | N/A | ||||
Thomas H. Connors (k) (age 53) | Assistant Secretary and Assistant Clerk | September 2012 | Massachusetts Financial Services Company, Vice President and Senior Counsel; Deutsche Investment Management Americas Inc. (financial service provider), Director and Senior Counsel (until 2012) | N/A | ||||
Ethan D. Corey (k) (age 49) | Assistant Secretary and Assistant Clerk | July 2005 | Massachusetts Financial Services Company, Senior Vice President and Associate General Counsel | N/A | ||||
22
Table of Contents
MFS Research International Portfolio
Trustees and Officers – continued
Name, Age | Position(s) with Fund | Trustee/Officer Since (h) | Principal Occupations During the Past Five Years | Other Directorships (j) | ||||
David L. DiLorenzo (k) (age 44) | Treasurer | July 2005 | Massachusetts Financial Services Company, Senior Vice President | N/A | ||||
Robyn L. Griffin (age 37) | Assistant Independent Chief Compliance Officer | August 2008 | Griffin Compliance LLC (provider of compliance services), Principal (since August 2008); State Street Corporation (financial services provider), Mutual Fund Administration Assistant Vice President (October 2006 – July 2008) | N/A | ||||
Brian E. Langenfeld (k) (age 39) | Assistant Secretary and Assistant Clerk | June 2006 | Massachusetts Financial Services Company, Vice President and Senior Counsel | N/A | ||||
Susan S. Newton (k) (age 62) | Assistant Secretary and Assistant Clerk | May 2005 | Massachusetts Financial Services Company, Senior Vice President and Associate General Counsel | N/A | ||||
Susan A. Pereira (k) (age 42) | Assistant Secretary and Assistant Clerk | July 2005 | Massachusetts Financial Services Company, Vice President and Senior Counsel | N/A | ||||
Kasey L. Phillips (k) (age 42) | Assistant Treasurer | September 2012 | Massachusetts Financial Services Company, Vice President; Wells Fargo Funds Management, LLC, Senior Vice President, Fund Treasurer (until 2012) | N/A | ||||
Mark N. Polebaum (k) (age 60) | Secretary and Clerk | January 2006 | Massachusetts Financial Services Company, Executive Vice President, General Counsel and Secretary | N/A | ||||
Frank L. Tarantino (age 68) | Independent Chief Compliance Officer | June 2004 | Tarantino LLC (provider of compliance services), Principal | N/A | ||||
Richard S. Weitzel (k) (age 42) | Assistant Secretary and Assistant Clerk | October 2007 | Massachusetts Financial Services Company, Senior Vice President and Associate General Counsel | N/A | ||||
James O. Yost (k) (age 52) | Deputy Treasurer | September 1990 | Massachusetts Financial Services Company, Senior Vice President | N/A | ||||
| (h) | Date first appointed to serve as Trustee/officer of an MFS fund. Each Trustee has served continuously since appointment unless indicated otherwise. For the period from December 15, 2004 until February 22, 2005, Mr. Manning served as Advisory Trustee. For the period October 2008, until January 2012, Mr. Corcoran served as Treasurer of the Funds. Prior to January 2012, Messrs. DiLorenzo and Yost served as Assistant Treasurers of the Funds. |
| (j) | Directorships or trusteeships of companies required to report to the Securities and Exchange Commission (i.e., “public companies”). |
| (k) | “Interested person” of the Trust within the meaning of the Investment Company Act of 1940 (referred to as the 1940 Act), which is the principal federal law governing investment companies like the fund, as a result of position with MFS. The address of MFS is 111 Huntington Avenue, Boston, Massachusetts 02199-7618. |
Each Trustee has been elected by shareholders and each Trustee and officer holds office until his or her successor is chosen and qualified or until his or her earlier death, resignation, retirement or removal. The Trust does not hold annual meetings for the purpose of electing Trustees, and Trustees are not elected for fixed terms. Messrs. Butler, Kavanaugh, Uek and Ms. Thomsen are members of the Trust’s Audit Committee.
Each of the Fund’s Trustees and officers holds comparable positions with certain other funds of which MFS or a subsidiary is the investment adviser or distributor, and, in the case of the officers, with certain affiliates of MFS. As of January 1, 2013, the Trustees served as board members of 143 funds within the MFS Family of Funds.
23
Table of Contents
MFS Research International Portfolio
Trustees and Officers – continued
The Statement of Additional Information for the Fund includes further information about the Trustees and is available without charge upon request by calling 1-800-225-2606.
Investment Adviser Massachusetts Financial Services Company 111 Huntington Avenue Boston, MA 02199-7618 | Custodian State Street Bank and Trust 1 Lincoln Street Boston, MA 02111-2900 | |
Distributor MFS Fund Distributors, Inc. 111 Huntington Avenue Boston, MA 02199-7618 | Independent Registered Public Accounting Firm Deloitte & Touche LLP 200 Berkeley Street Boston, MA 02116 | |
Portfolio Managers Jose Luis Garcia Thomas Melendez |
24
Table of Contents
MFS Research International Portfolio
BOARD REVIEW OF INVESTMENT ADVISORY AGREEMENT
A discussion regarding the Board’s most recent approval of the fund’s Investment Advisory Agreement with MFS is available by clicking on the fund’s name under “Variable Insurance Portfolios – VIT II” in the “Products” section of the MFS Web site (mfs.com).
PROXY VOTING POLICIES AND INFORMATION
A general description of the MFS funds’ proxy voting policies and procedures is available without charge, upon request, by calling 1-800-225-2606, by visiting the Proxy Voting section of mfs.com or by visiting the SEC’s Web site at http://www.sec.gov.
Information regarding how the fund voted proxies relating to portfolio securities during the most recent twelve-month period ended June 30 is available without charge by visiting the Proxy Voting section of mfs.com or by visiting the SEC’s Web site at http://www.sec.gov.
QUARTERLY PORTFOLIO DISCLOSURE
The fund will file a complete schedule of portfolio holdings with the Securities and Exchange Commission (the Commission) for the first and third quarters of each fiscal year on Form N-Q. The fund’s Form N-Q is available on the EDGAR database on the Commission’s Internet Web site at http://www.sec.gov, and may be reviewed and copied at the:
Public Reference Room
Securities and Exchange Commission
100 F Street, NE, Room 1580
Washington, D.C. 20549
Information on the operation of the Public Reference Room may be obtained by calling the Commission at 1-800-SEC-0330. Copies of the fund’s Form N-Q also may be obtained, upon payment of a duplicating fee, by electronic request at the following e-mail address: publicinfo@sec.gov or by writing the Public Reference Section at the above address.
From time to time, MFS may post important information about the fund or the MFS funds on the MFS web site (mfs.com). This information is available by visiting the “News & Commentary” section of mfs.com or by clicking on the fund’s name under “Variable Insurance Portfolios – VIT II” in the “Products” section of mfs.com.
FEDERAL TAX INFORMATION (unaudited)
The following information is provided pursuant to provisions of the Internal Revenue Code.
Income derived from foreign sources was $4,302,915. The fund intends to pass through foreign tax credits of $271,786 for the fiscal year.
25
Table of Contents
rev. 3/11

| Why? | Financial companies choose how they share your personal information. Federal law gives consumers the right to limit some but not all sharing. Federal law also requires us to tell you how we collect, share, and protect your personal information. Please read this notice carefully to understand what we do. |
| What? | The types of personal information we collect and share depend on the product or service you have with us. This information can include:
• Social Security number and account balances • Account transactions and transaction history • Checking account information and wire transfer instructions
When you are no longer our customer, we continue to share your information as described in this notice. |
| How? | All financial companies need to share customers’ personal information to run their everyday business. In the section below, we list the reasons financial companies can share their customers’ personal information; the reasons MFS chooses to share; and whether you can limit this sharing. |
| Reasons we can share your personal information | Does MFS share? | Can you limit this sharing? | ||
For our everyday business purposes – such as to process your transactions, maintain your account(s), respond to court orders and legal investigations, or report to credit bureaus | Yes | No | ||
For our marketing purposes – to offer our products and services to you | No | We don’t share | ||
| For joint marketing with other financial companies | No | We don’t share | ||
For our affiliates’ everyday business purposes – information about your transactions and experiences | No | We don’t share | ||
For our affiliates’ everyday business purposes – information about your creditworthiness | No | We don’t share | ||
| For nonaffiliates to market to you | No | We don’t share |
| Questions? | Call 800-225-2606 or go to mfs.com. |
26
Table of Contents
| Page 2 |
| Who we are | ||
| Who is providing this notice? | MFS Funds, MFS Investment Management, MFS Institutional Advisors, Inc., MFS Fund Distributors, Inc., MFS Heritage Trust Company, and MFS Service Center, Inc. | |
| What we do | ||
| How does MFS protect my personal information? | To protect your personal information from unauthorized access and use, we use security measures that comply with federal law. These measures include procedural, electronic, and physical safeguards for the protection of the personal information we collect about you. | |
| How does MFS collect my personal information? | We collect your personal information, for example, when you
• open an account or provide account information • direct us to buy securities or direct us to sell your securities • make a wire transfer
We also collect your personal information from others, such as credit bureaus, affiliates and other companies. | |
| Why can’t I limit all sharing? | Federal law gives you the right to limit only
• sharing for affiliates’ everyday business purposes – information about your creditworthiness • affiliates from using your information to market to you • sharing for nonaffiliates to market to you
State laws and individual companies may give you additional rights to limit sharing. | |
| Definitions | ||
| Affiliates | Companies related by common ownership or control. They can be financial and nonfinancial companies.
•MFS does not share personal information with affiliates, except for everyday business purposes as described on page one of this notice. | |
| Nonaffiliates | Companies not related by common ownership or control. They can be financial and nonfinancial companies.
•MFS does not share with nonaffiliates so they can market to you. | |
| Joint Marketing | A formal agreement between nonaffiliated financial companies that together market financial products or services to you.
•MFS doesn’t jointly market. | |
| Other important information | ||
| If you own an MFS product or receive an MFS service in the name of a third party such as a bank or broker-dealer, their privacy policy may apply to you instead of ours. | ||
27
Table of Contents
Table of Contents
ANNUAL REPORT
December 31, 2012

MFS® GLOBAL RESEARCH PORTFOLIO
MFS® Variable Insurance Trust II

RES-ANN
Table of Contents
MFS® GLOBAL RESEARCH PORTFOLIO
The report is prepared for the general information of contract owners. It is authorized for distribution to prospective investors only when preceded or accompanied by a current prospectus.
NOT FDIC INSURED Ÿ MAY LOSE VALUE Ÿ NO BANK OR CREDIT UNION GUARANTEE Ÿ NOT A DEPOSIT Ÿ NOT INSURED BY ANY FEDERAL GOVERNMENT AGENCY OR NCUA/NCUSIF
Table of Contents
MFS Global Research Portfolio
LETTER FROM THE CHAIRMAN AND CEO

Dear Contract Owners:
The global market outlook for 2013 is one of cautious optimism. While we are seeing some positive economic trends in the United States, Europe and China, the overall environment remains challenging. In the United States, the recent fiscal cliff agreement was received positively by investors, even though it mostly addressed pressing taxation issues and did not resolve additional concerns, including the need for spending cuts and a large-scale reduction of the federal debt. These issues will be front and center again in the spring. Despite the ongoing uncertainty, economic tailwinds are gathering strength as the U.S. housing and job markets are improving and consumer confidence is rising.
Overseas, the debt crisis continues to weigh heavily on eurozone markets, with even Germany — long an economic stalwart — experiencing some contraction. These ongoing challenges could be a drag on global market performance this year. In Asia, manufacturing activity has accelerated in emerging markets such as China and India, and we are seeing signs of stabilized loan growth in China, a leading indicator of that country’s economic health. In contrast, Japan’s economy is contracting sharply under deflationary pressures. Nevertheless, Japanese markets have responded favorably to early actions by the new government, which appears determined to act aggressively, along with the Bank of Japan, to stimulate growth.
As always, managing risk in the face of uncertainty remains a top priority for investors. At MFS®, our uniquely collaborative investment process revolves around global research and our disciplined risk management approach. Our global team of investment professionals shares ideas and evaluates opportunities across continents, investment disciplines and asset classes — all with a goal of building better insights, and ultimately better results, for our clients.
We remain mindful of the many economic challenges investors face today, and believe it is more important than ever to maintain a long-term view, employ time-tested principles, such as asset allocation and diversification, and work closely with investment advisors to identify and pursue the most suitable opportunities.
Respectfully,

Robert J. Manning
Chairman and Chief Executive Officer
MFS Investment Management®
February 15, 2013
The opinions expressed in this letter are subject to change, may not be relied upon for investment advice, and no forecasts can be guaranteed.
1
Table of Contents
MFS Global Research Portfolio
Portfolio structure
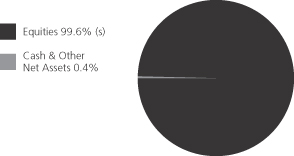
| Top ten holdings | ||||
| Apple, Inc. | 2.7% | |||
| Exxon Mobil Corp. | 2.4% | |||
| Target Corp. | 1.7% | |||
| Royal Dutch Shell PLC, “A” | 1.7% | |||
| Japan Tobacco, Inc. | 1.6% | |||
| Groupe Danone | 1.5% | |||
| Pfizer, Inc. | 1.5% | |||
| Roche Holding AG | 1.4% | |||
| Heineken N.V. | 1.4% | |||
| Danaher Corp. | 1.4% | |||
| Global equity sectors | ||||
| Financial Services | 21.0% | |||
| Capital Goods (s) | 19.7% | |||
| Energy | 13.5% | |||
| Technology | 13.0% | |||
| Health Care | 9.5% | |||
| Consumer Cyclicals | 9.2% | |||
| Consumer Staples | 8.0% | |||
| Telecommunications/Cable Television | 5.7% | |||
| Issuer country weightings (s)(x) | ||||
| United States | 50.7% | |||
| United Kingdom | 8.5% | |||
| Japan | 8.4% | |||
| Switzerland | 5.8% | |||
| France | 3.6% | |||
| Hong Kong | 3.6% | |||
| Netherlands | 3.6% | |||
| Germany | 2.8% | |||
| China | 1.8% | |||
| Other Countries | 11.2% | |||
| Currency exposure weightings (s)(y) | ||||
| United States Dollar | 51.5% | |||
| Euro | 11.5% | |||
| British Pound Sterling | 8.5% | |||
| Japanese Yen | 8.4% | |||
| Swiss Franc | 5.8% | |||
| Hong Kong Dollar | 5.5% | |||
| Brazilian Real | 1.8% | |||
| Indian Rupee | 1.5% | |||
| Singapore Dollar | 1.1% | |||
| Other Currencies | 4.4% | |||
| (s) | Includes securities sold short. |
| (x) | Represents the portfolio’s exposure to issuer countries as a percentage of a portfolio’s net assets. |
| (y) | Represents the portfolio’s exposure to a particular currency as a percentage of a portfolio’s net assets. |
Percentages are based on net assets as of 12/31/12.
The portfolio is actively managed and current holdings may be different.
2
Table of Contents
MFS Global Research Portfolio
Summary of Results
For the twelve months ended December 31, 2012, Initial Class shares of the MFS Global Research Portfolio (“fund”) provided a total return of 16.81%, while Service Class shares of the fund provided a total return of 16.57%. These compare with a return of 16.80% over the same period for the fund’s benchmark, the MSCI All Country World Index.
Market Environment
The beginning of the period was characterized by a risk-on sentiment as a result of additional liquidity measures by the Federal Reserve Bank (“Fed”) and the European Central Bank (“ECB”) as well as a commensurate improvement in macroeconomic conditions. During this time, global equity valuations rose, credit spreads contracted, and high-quality sovereign yields increased modestly.
During the middle of the period, however, conditions worsened, driven by broadly weaker global macroeconomic indicators, as well as renewed concerns over the eurozone’s capacity and determination to address its ongoing crisis. Despite this deterioration, broad market sentiment remained relatively resilient as equity markets generally maintained gains and credit spreads did not indicate deterioration.
However, this renewed weakness in the fundamentals precipitated a further round of monetary easing by both the Fed (through a third round of quantitative easing) and the ECB (through a new bond purchase facility) in the second half of the period, which soon instilled additional confidence in risk markets. Nonetheless, towards the end of the period, weaker equity earnings reports and declining forward guidance caused market sentiment to soften. In addition, as we moved toward year end, the fiscal cliff negotiations between the Republicans in the U.S. Congress and President Obama were a particular source of market attention, where uncertainty surrounding the fiscal negotiations continued right up to the end-of-year deadline.
Detractors from Performance
Stock selection in the consumer cyclicals sector was a primary detractor from performance relative to the MSCI All Country World Index. The timing of the fund’s ownership in shares of supermarkets and convenient stores operator Tesco (h) (United Kingdom) negatively affected relative results. Shares of Tesco continued to struggle throughout the year due to the weak retail environment in the U.K.
Stock selection in the financial services sector was another factor that held back relative returns. Not holding financial services firm Bank of America hurt relative performance as the bank outperformed the benchmark during the period. Shares of Bank of America traded higher as the firm’s successful cost-cutting efforts and improvements in its risk weighted capital profile appeared to have supported the share price. The fund’s holdings of Brazilian bank Itau Unibanco Holding also dampened relative results as the stock declined during the period.
Elsewhere, the fund’s holdings in weak-performing mining company Iluka Resources (Australia), computer products and services provider Hewlett-Packard, medical diagnostics company Diagnosticos da America (h) (Brazil), mining equipment manufacturer Joy Global, oil and gas exploration company Occidental Petroleum, oil and gas company Royal Dutch Shell (Netherlands), and mobile telecommunications service company TIM Participacoes (Brazil) weighed on relative performance. The stock price of Iluka Resources declined over the period as overstocking in the industry caused commodity prices to decline which appeared to have weighed on the profitability of the company. Shares of Hewlett-Packard fell as the company experienced lower profitability due to its restructuring efforts.
During the reporting period, the fund’s relative currency exposure, resulting primarily from differences between the fund’s and the benchmark’s exposures to holdings of securities denominated in foreign currencies, was another detractor from relative performance. All of MFS’ investment decisions are driven by the fundamentals of each individual opportunity and as such, it is common for our portfolios to have different currency exposure than the benchmark.
Contributors to Performance
Stock selection in the technology sector benefited relative performance. The fund’s holdings of computer and personal electronics maker Apple supported relative results as the company continued to deliver strong results for its iPhone and iPad products. A favorable outcome from its patent infringement lawsuit with Samsung Electronics also supported the share price.
Stock selection in the health care sector was another positive factor for relative returns. The fund’s holdings of German healthcare products maker Bayer strengthened relative results. Shares of Bayer appreciated throughout much of the period as strong results from its Crop Science division, a favorable currency environment, and positive developments in its late-stage drug pipeline combined to benefit the company. The fund’s holdings of biotech firm Gilead Sciences and analytical instruments company Thermo Fisher Scientific also contributed to relative performance.
3
Table of Contents
MFS Global Research Portfolio
Management Review – continued
Stocks in other sectors that helped relative results included Dutch brewer Heineken, financial products and services provider Siam Commercial Bank (Thailand), global payments technology company Visa Inc., specialty chemical company Akzo Nobel (Netherlands), cable and internet provider Virgin Media, and global reinsurer Swiss Re (Switzerland) as all six stocks delivered strong performance during the period. Shares of Heineken benefited from its efforts to reduce input costs and its successful acquisition of Asia Pacific Breweries which increased its exposure to the strong Asian market.
Respectfully,
| Michael Cantara | Ben Kottler | |
| Portfolio Manager | Portfolio Manager |
| (h) | Security was not held in the portfolio at period end. |
The views expressed in this report are those of the portfolio managers only through the end of the period of the report as stated on the cover and do not necessarily reflect the views of MFS or any other person in the MFS organization. These views are subject to change at any time based on market or other conditions, and MFS disclaims any responsibility to update such views. These views may not be relied upon as investment advice or an indication of trading intent on behalf of any MFS portfolio. References to specific securities are not recommendations of such securities, and may not be representative of any MFS portfolio’s current or future investments.
4
Table of Contents
MFS Global Research Portfolio
PERFORMANCE SUMMARY THROUGH 12/31/12
The following chart illustrates the historical performance of the fund in comparison to its benchmark(s). Benchmarks are unmanaged and may not be invested in directly. Benchmark returns do not reflect any fees or expenses. The performance of other share classes will be greater than or less than that of the class depicted below. (See Notes to Performance Summary.)
Performance data shown represents past performance and is no guarantee of future results. Investment return and principal value fluctuate so your units, when sold, may be worth more or less than the original cost; current performance may be lower or higher than quoted. The performance shown does not reflect the deduction of taxes, if any, that a contract holder would pay on fund distributions or the redemption of contract units. The returns for the fund shown also do not reflect the deduction of expenses associated with variable products, such as mortality and expense risk charges, separate account charges, and sales charges imposed by the insurance company separate accounts. Such expenses would reduce the overall returns shown.
Growth of a Hypothetical $10,000 Investment
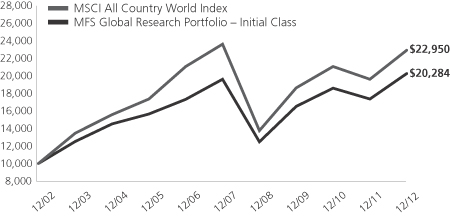
Total Returns through 12/31/12
Average annual total returns
| Share Class | Class inception date | 1-yr | 5-yr | 10-yr | ||||||||
| Initial Class | 11/07/94 | 16.81% | 0.66% | 7.33% | ||||||||
| Service Class | 8/24/01 | 16.57% | 0.41% | 7.06% | ||||||||
| Comparative benchmark | ||||||||||||
| MSCI All Country World Index (f) | 16.80% | (0.61)% | 8.66% | |||||||||
| (f) | Source: FactSet Research Systems Inc. |
Benchmark Definition
MSCI All Country World Index – a market capitalization-weighted index that is designed to measure equity market performance in the global developed and emerging markets.
It is not possible to invest directly in an index.
Notes to Performance Summary
Average annual total return represents the average annual change in value for each share class for the periods presented.
Performance results reflect any applicable expense subsidies and waivers in effect during the periods shown. Without such subsidies and waivers the fund’s performance results would be less favorable. Please see the prospectus and financial statements for complete details. All results are historical and assume the reinvestment of any dividends and capital gains distributions.
Performance results do not include adjustments made for financial reporting purposes in accordance with U.S. generally accepted accounting principles and may differ from amounts reported in the financial highlights.
Prior to October 6, 2008, MFS primarily invested the fund’s assets in U.S. equity securities. Effective October 6, 2008, MFS primarily invests the fund’s assets in U.S. and foreign equity securities, including emerging market equity securities.
From time to time the fund may receive proceeds from litigation settlements, without which performance would be lower.
5
Table of Contents
MFS Global Research Portfolio
Fund Expenses Borne by the Contract Holders During the Period,
July 1, 2012 through December 31, 2012
As a contract holder of the fund, you incur ongoing costs, including management fees; distribution and/or service (12b-1) fees; and other fund expenses. This example is intended to help you understand your ongoing costs (in dollars) of investing in the fund and to compare these costs with the ongoing costs of investing in other mutual funds.
The example is based on an investment of $1,000 invested at the beginning of the period and held for the entire period July 1, 2012 through December 31, 2012.
Actual Expenses
The first line for each share class in the following table provides information about actual account values and actual expenses. You may use the information in this line, together with the amount you invested, to estimate the expenses that you paid over the period. Simply divide your account value by $1,000 (for example, an $8,600 account value divided by $1,000 = 8.6), then multiply the result by the number in the first line under the heading entitled “Expenses Paid During Period” to estimate the expenses you paid on your account during this period.
Hypothetical Example for Comparison Purposes
The second line for each share class in the following table provides information about hypothetical account values and hypothetical expenses based on the fund’s actual expense ratio and an assumed rate of return of 5% per year before expenses, which is not the fund’s actual return. The hypothetical account values and expenses may not be used to estimate the actual ending account balance or expenses you paid for the period. You may use this information to compare the ongoing costs of investing in the fund and other funds. To do so, compare this 5% hypothetical example with the 5% hypothetical examples that appear in the shareholder reports of the other funds.
Please note that the expenses shown in the table are meant to highlight the fund’s ongoing costs only and do not take into account the fees and expenses imposed under the variable contracts through which your investment in the fund is made. Therefore, the second line for each share class in the table is useful in comparing ongoing costs associated with an investment in vehicles (such as the fund) which fund benefits under variable annuity and variable life insurance contracts and to qualified pension and retirement plans only, and will not help you determine the relative total costs of investing in the fund through variable annuity and variable life insurance contracts. If the fees and expenses imposed under the variable contracts were included, your costs would have been higher.
| Share Class | Annualized Expense Ratio | Beginning Account Value 7/01/12 | Ending Account Value | Expenses Paid During Period (p) 7/01/12-12/31/12 | ||||||||||||||
| Initial Class | Actual | 0.94% | $1,000.00 | $1,100.40 | $4.96 | |||||||||||||
| Hypothetical (h) | 0.94% | $1,000.00 | $1,020.41 | $4.77 | ||||||||||||||
| Service Class | Actual | 1.19% | $1,000.00 | $1,099.52 | $6.28 | |||||||||||||
| Hypothetical (h) | 1.19% | $1,000.00 | $1,019.15 | $6.04 | ||||||||||||||
| (h) | 5% class return per year before expenses. |
| (p) | Expenses paid are equal to each class’s annualized expense ratio, as shown above, multiplied by the average account value over the period, multiplied by the number of days in the period, divided by the number of days in the year. |
Expenses Impacting Table
Expense ratios include 0.01% of investment - related expenses from short sale dividend and interest expenses.
6
Table of Contents
MFS Global Research Portfolio
PORTFOLIO OF INVESTMENTS – 12/31/12
The Portfolio of Investments is a complete list of all securities owned by your fund. It is categorized by broad-based asset classes.
| Issuer | Shares/Par | Value ($) | ||||||
| COMMON STOCKS – 99.8% | ||||||||
| Aerospace – 1.9% | ||||||||
| Honeywell International, Inc. | 14,710 | $ | 933,644 | |||||
| Precision Castparts Corp. | 4,990 | 945,206 | ||||||
| United Technologies Corp. | 7,650 | 627,377 | ||||||
|
| |||||||
| $ | 2,506,227 | |||||||
|
| |||||||
| Alcoholic Beverages – 1.4% | ||||||||
| Heineken N.V. | 27,444 | $ | 1,830,595 | |||||
|
| |||||||
| Apparel Manufacturers – 2.5% | ||||||||
| Guess?, Inc. | 15,610 | $ | 383,069 | |||||
| Li & Fung Ltd. | 450,000 | 808,426 | ||||||
| LVMH Moet Hennessy Louis Vuitton S.A. | 2,325 | 433,257 | ||||||
| NIKE, Inc., “B” | 16,560 | 854,496 | ||||||
| VF Corp. | 4,790 | 723,146 | ||||||
|
| |||||||
| $ | 3,202,394 | |||||||
|
| |||||||
| Automotive – 2.6% | ||||||||
| Delphi Automotive PLC (a) | 16,400 | $ | 627,300 | |||||
| DENSO Corp. | 19,000 | 661,104 | ||||||
| GKN PLC | 140,822 | 525,442 | ||||||
| Guangzhou Automobile Group Co. Ltd., “H” | 390,000 | 350,389 | ||||||
| Honda Motor Co. Ltd. | 22,100 | 814,571 | ||||||
| Kia Motors Corp. | 7,690 | 409,194 | ||||||
|
| |||||||
| $ | 3,388,000 | |||||||
|
| |||||||
| Biotechnology – 0.5% | ||||||||
| Gilead Sciences, Inc. (a) | 8,840 | $ | 649,298 | |||||
|
| |||||||
| Broadcasting – 1.8% | ||||||||
| News Corp., “A” | 27,440 | $ | 700,818 | |||||
| Nippon Television Holdings, Inc. | 28,440 | 377,843 | ||||||
| Publicis Groupe S.A. | 5,928 | 355,180 | ||||||
| Walt Disney Co. | 18,530 | 922,609 | ||||||
|
| |||||||
| $ | 2,356,450 | |||||||
|
| |||||||
| Brokerage & Asset Managers – 0.9% | ||||||||
| BlackRock, Inc. | 2,861 | $ | 591,397 | |||||
| Franklin Resources, Inc. | 4,940 | 620,958 | ||||||
|
| |||||||
| $ | 1,212,355 | |||||||
|
| |||||||
| Business Services – 1.3% | ||||||||
| Accenture PLC, “A” | 13,750 | $ | 914,375 | |||||
| Cognizant Technology Solutions Corp., “A” (a) | 9,530 | 705,697 | ||||||
|
| |||||||
| $ | 1,620,072 | |||||||
|
| |||||||
| Cable TV – 1.5% | ||||||||
| Comcast Corp., “Special A” | 34,710 | $ | 1,247,825 | |||||
| Virgin Media, Inc. | 18,170 | 667,748 | ||||||
|
| |||||||
| $ | 1,915,573 | |||||||
|
| |||||||
| Chemicals – 0.4% | ||||||||
| Celanese Corp. | 12,310 | $ | 548,164 | |||||
|
| |||||||
| Computer Software – 3.2% | ||||||||
| Autodesk, Inc. (a) | 7,370 | $ | 260,530 | |||||
| Issuer | Shares/Par | Value ($) | ||||||
| COMMON STOCKS – continued | ||||||||
| Computer Software – continued | ||||||||
| Check Point Software Technologies Ltd. (a) | 12,160 | $ | 579,302 | |||||
| Citrix Systems, Inc. (a) | 7,300 | 479,975 | ||||||
| Microsoft Corp. | 4,000 | 106,920 | ||||||
| Oracle Corp. | 45,840 | 1,527,389 | ||||||
| Salesforce.com, Inc. (a) | 4,740 | 796,794 | ||||||
| TIBCO Software, Inc. (a) | 17,360 | 382,094 | ||||||
|
| |||||||
| $ | 4,133,004 | |||||||
|
| |||||||
| Computer Software – Systems – 4.2% | ||||||||
| Apple, Inc. (s) | 6,530 | $ | 3,480,686 | |||||
| EMC Corp. (a) | 47,260 | 1,195,678 | ||||||
| Hewlett-Packard Co. | 49,880 | 710,790 | ||||||
|
| |||||||
| $ | 5,387,154 | |||||||
|
| |||||||
| Conglomerates – 0.4% | ||||||||
| Hutchison Whampoa Ltd. | 42,000 | $ | 445,549 | |||||
|
| |||||||
| Construction – 1.1% | ||||||||
| Anhui Conch Cement Co. Ltd. | 125,000 | $ | 465,074 | |||||
| Stanley Black & Decker, Inc. | 10,590 | 783,342 | ||||||
| Urbi Desarrollos Urbanos S.A. de C.V. (a) | 291,250 | 182,281 | ||||||
|
| |||||||
| $ | 1,430,697 | |||||||
|
| |||||||
| Electrical Equipment – 2.7% | ||||||||
| Danaher Corp. (s) | 32,380 | $ | 1,810,042 | |||||
| Schneider Electric S.A. | 10,020 | 747,327 | ||||||
| Siemens AG | 8,105 | 880,929 | ||||||
|
| |||||||
| $ | 3,438,298 | |||||||
|
| |||||||
| Electronics – 2.0% | ||||||||
| Altera Corp. | 20,960 | $ | 721,862 | |||||
| ASML Holding N.V. (l) | 2,037 | 131,203 | ||||||
| Microchip Technology, Inc. | 27,770 | 905,024 | ||||||
| Taiwan Semiconductor Manufacturing Co. Ltd. | 263,000 | 880,238 | ||||||
|
| |||||||
| $ | 2,638,327 | |||||||
|
| |||||||
| Energy – Independent – 3.8% | ||||||||
| Cabot Oil & Gas Corp. | 22,620 | $ | 1,125,119 | |||||
| Cairn Energy PLC | 48,022 | 210,379 | ||||||
| Cenovus Energy, Inc. | 11,040 | 369,480 | ||||||
| CNOOC Ltd. | 252,000 | 553,331 | ||||||
| EOG Resources, Inc. | 7,190 | 868,480 | ||||||
| INPEX Corp. | 98 | 523,012 | ||||||
| Occidental Petroleum Corp. | 12,920 | 989,801 | ||||||
| WPX Energy, Inc. (a) | 17,540 | 260,995 | ||||||
|
| |||||||
| $ | 4,900,597 | |||||||
|
| |||||||
| Energy – Integrated – 5.5% | ||||||||
| BG Group PLC | 27,615 | $ | 463,056 | |||||
| BP PLC | 195,310 | 1,353,257 | ||||||
| Exxon Mobil Corp. (s) | 36,350 | 3,146,093 | ||||||
| Royal Dutch Shell PLC, “A” | 61,698 | 2,180,070 | ||||||
|
| |||||||
| $ | 7,142,476 | |||||||
|
| |||||||
7
Table of Contents
MFS Global Research Portfolio
Portfolio of Investments – continued
| Issuer | Shares/Par | Value ($) | ||||||
| COMMON STOCKS – continued | ||||||||
| Engineering – Construction – 1.8% | ||||||||
| Fluor Corp. | 12,410 | $ | 728,963 | |||||
| JGC Corp. | 40,000 | 1,246,090 | ||||||
| Keppel Corp. Ltd. | 42,400 | 385,267 | ||||||
|
| |||||||
| $ | 2,360,320 | |||||||
|
| |||||||
| Food & Beverages – 4.0% | ||||||||
| Groupe Danone | 29,378 | $ | 1,940,994 | |||||
| M. Dias Branco S.A. Industria e Comercio de Alimentos | 11,500 | 441,135 | ||||||
| Mondelez International, Inc. | 42,620 | 1,085,531 | ||||||
| Nestle S.A. | 21,603 | 1,407,685 | ||||||
| Want Want China Holdings Ltd. | 227,000 | 316,251 | ||||||
|
| |||||||
| $ | 5,191,596 | |||||||
|
| |||||||
| Food & Drug Stores – 0.8% | ||||||||
| Jeronimo Martins SGPS S.A. | 26,852 | $ | 518,153 | |||||
| Lawson, Inc. | 6,700 | 455,422 | ||||||
|
| |||||||
| $ | 973,575 | |||||||
|
| |||||||
| Gaming & Lodging – 0.7% | ||||||||
| Sands China Ltd. | 205,200 | $ | 919,164 | |||||
|
| |||||||
| General Merchandise – 1.7% | ||||||||
| Target Corp. | 37,380 | $ | 2,211,775 | |||||
|
| |||||||
| Insurance – 4.7% | ||||||||
| ACE Ltd. | 17,430 | $ | 1,390,914 | |||||
| AIA Group Ltd. | 282,600 | 1,126,285 | ||||||
| Delta Lloyd N.V. | 41,860 | 696,651 | ||||||
| Hiscox Ltd. | 127,036 | 924,728 | ||||||
| ING Groep N.V. (a) | 64,906 | 620,676 | ||||||
| MetLife, Inc. | 16,360 | 538,898 | ||||||
| Swiss Re Ltd. | 11,847 | 864,645 | ||||||
|
| |||||||
| $ | 6,162,797 | |||||||
|
| |||||||
| Internet – 1.9% | ||||||||
| eBay, Inc. (a) | 10,380 | $ | 529,588 | |||||
| Google, Inc., “A” (a) | 2,260 | 1,603,176 | ||||||
| Rackspace Hosting, Inc. (a) | 3,930 | 291,881 | ||||||
|
| |||||||
| $ | 2,424,645 | |||||||
|
| |||||||
| Machinery & Tools – 2.5% | ||||||||
| Eaton Corp. PLC | 12,000 | $ | 650,400 | |||||
| Glory Ltd. | 20,700 | 479,500 | ||||||
| Joy Global, Inc. | 15,820 | 1,009,000 | ||||||
| Schindler Holding AG | 5,545 | 800,926 | ||||||
| Sinotruk Hong Kong Ltd. | 431,000 | 331,658 | ||||||
|
| |||||||
| $ | 3,271,484 | |||||||
|
| |||||||
| Major Banks – 6.5% | ||||||||
| Barclays PLC | 183,828 | $ | 793,840 | |||||
| BNP Paribas | 10,485 | 591,010 | ||||||
| BOC Hong Kong Holdings Ltd. | 203,000 | 636,868 | ||||||
| Goldman Sachs Group, Inc. | 7,720 | 984,763 | ||||||
| JPMorgan Chase & Co. | 36,730 | 1,615,018 | ||||||
| PNC Financial Services Group, Inc. | 9,450 | 551,030 | ||||||
| Standard Chartered PLC | 52,621 | 1,333,872 | ||||||
| State Street Corp. | 17,010 | 799,640 | ||||||
| Issuer | Shares/Par | Value ($) | ||||||
| COMMON STOCKS – continued | ||||||||
| Major Banks – continued | ||||||||
| Wells Fargo & Co. | 33,000 | $ | 1,127,940 | |||||
|
| |||||||
| $ | 8,433,981 | |||||||
|
| |||||||
| Medical & Health Technology & Services – 0.7% | ||||||||
| Kobayashi Pharmaceutical Co. Ltd. | 17,600 | $ | 835,766 | |||||
|
| |||||||
| Medical Equipment – 2.7% | ||||||||
| Covidien PLC | 18,700 | $ | 1,079,738 | |||||
| Sonova Holding AG | 5,446 | 603,755 | ||||||
| St. Jude Medical, Inc. | 20,500 | 740,870 | ||||||
| Thermo Fisher Scientific, Inc. | 17,200 | 1,097,016 | ||||||
|
| |||||||
| $ | 3,521,379 | |||||||
|
| |||||||
| Metals & Mining – 2.0% | ||||||||
| Iluka Resources Ltd. | 63,532 | $ | 615,673 | |||||
| Nippon Steel & Sumitomo Metal Corp. | 124,000 | 305,014 | ||||||
| Rio Tinto Ltd. | 23,590 | 1,374,647 | ||||||
| Steel Authority of India Ltd. | 208,253 | 346,167 | ||||||
|
| |||||||
| $ | 2,641,501 | |||||||
|
| |||||||
| Natural Gas – Distribution – 0.8% | ||||||||
| GDF SUEZ | 31,406 | $ | 645,652 | |||||
| Tokyo Gas Co. Ltd. | 96,000 | 438,908 | ||||||
|
| |||||||
| $ | 1,084,560 | |||||||
|
| |||||||
| Network & Telecom – 0.4% | ||||||||
| Finisar Corp. (a) | 31,840 | $ | 518,992 | |||||
|
| |||||||
| Oil Services – 0.8% | ||||||||
| Dresser-Rand Group, Inc. (a) | 8,170 | $ | 458,664 | |||||
| Schlumberger Ltd. | 8,970 | 621,531 | ||||||
|
| |||||||
| $ | 1,080,195 | |||||||
|
| |||||||
| Other Banks & Diversified Financials – 7.9% | ||||||||
| Bank Rakyat Indonesia | 1,003,000 | $ | 730,457 | |||||
| DBS Group Holdings Ltd. | 89,000 | 1,089,478 | ||||||
| Discover Financial Services | 18,650 | 718,958 | ||||||
| Erste Group Bank AG (a) | 26,972 | 862,444 | ||||||
| Federal Bank Ltd. | 82,041 | 814,039 | ||||||
| Fifth Third Bancorp | 49,290 | 748,715 | ||||||
| Grupo Financiero Santander Mexico S.A.B. de C.V., ADR (a) | 50,230 | 812,721 | ||||||
| ICICI Bank Ltd. | 38,529 | 811,567 | ||||||
| Itau Unibanco Holding S.A., IPS | 33,800 | 558,303 | ||||||
| Siam Commercial Bank Co. Ltd. | 124,200 | 734,887 | ||||||
| UBS AG | 48,245 | 758,709 | ||||||
| Visa, Inc., “A” | 10,290 | 1,559,758 | ||||||
|
| |||||||
| $ | 10,200,036 | |||||||
|
| |||||||
| Pharmaceuticals – 5.6% | ||||||||
| Bayer AG | 14,325 | $ | 1,360,338 | |||||
| Novartis AG | 20,720 | 1,311,815 | ||||||
| Pfizer, Inc. | 77,200 | 1,936,176 | ||||||
| Roche Holding AG | 9,025 | 1,838,617 | ||||||
| Santen Pharmaceutical Co. Ltd. | 23,100 | 883,898 | ||||||
|
| |||||||
| $ | 7,330,844 | |||||||
|
| |||||||
8
Table of Contents
MFS Global Research Portfolio
Portfolio of Investments – continued
| Issuer | Shares/Par | Value ($) | ||||||
| COMMON STOCKS – continued | ||||||||
| Precious Metals & Minerals – 0.3% | ||||||||
| Newcrest Mining Ltd. | 17,790 | $ | 415,342 | |||||
|
| |||||||
| Railroad & Shipping – 0.7% | ||||||||
| East Japan Railway Co. | 3,500 | $ | 226,297 | |||||
| Union Pacific Corp. | 5,010 | 629,857 | ||||||
|
| |||||||
| $ | 856,154 | |||||||
|
| |||||||
| Real Estate – 1.0% | ||||||||
| GSW Immobilien AG | 13,414 | $ | 566,984 | |||||
| Hang Lung Properties Ltd. | 193,000 | 773,835 | ||||||
|
| |||||||
| $ | 1,340,819 | |||||||
|
| |||||||
| Restaurants – 1.0% | ||||||||
| Arcos Dorados Holdings, Inc. | 34,750 | $ | 415,610 | |||||
| McDonald’s Corp. | 10,180 | 897,978 | ||||||
|
| |||||||
| $ | 1,313,588 | |||||||
|
| |||||||
| Specialty Chemicals – 2.4% | ||||||||
| Airgas, Inc. | 10,450 | $ | 953,981 | |||||
| Akzo Nobel N.V. | 20,681 | 1,364,678 | ||||||
| Linde AG | 4,856 | 846,835 | ||||||
|
| |||||||
| $ | 3,165,494 | |||||||
|
| |||||||
| Specialty Stores – 0.7% | ||||||||
| Tiffany & Co. | 6,960 | $ | 399,086 | |||||
| Urban Outfitters, Inc. (a) | 13,800 | 543,168 | ||||||
|
| |||||||
| $ | 942,254 | |||||||
|
| |||||||
| Telecommunications – Wireless – 2.4% | ||||||||
| American Tower Corp., REIT | 5,940 | $ | 458,984 | |||||
| KDDI Corp. | 13,823 | 976,388 | ||||||
| TIM Participacoes S.A., ADR | 22,680 | 449,518 | ||||||
| Vodafone Group PLC | 508,415 | 1,278,596 | ||||||
|
| |||||||
| $ | 3,163,486 | |||||||
|
| |||||||
| Telephone Services – 1.8% | ||||||||
| BT Group PLC | 178,490 | $ | 672,817 | |||||
| China Unicom (Hong Kong) Ltd. | 220,000 | 356,728 | ||||||
| Telecom Italia S.p.A. | 276,877 | 250,275 | ||||||
| Telecom Italia S.p.A. | 515,500 | 407,916 | ||||||
| Verizon Communications, Inc. | 16,080 | 695,782 | ||||||
|
| |||||||
| $ | 2,383,518 | |||||||
|
| |||||||
| Tobacco – 2.6% | ||||||||
| Japan Tobacco, Inc. | 73,200 | $ | 2,061,615 | |||||
| Philip Morris International, Inc. | 15,470 | 1,293,911 | ||||||
|
| |||||||
| $ | 3,355,526 | |||||||
|
| |||||||
| Trucking – 1.1% | ||||||||
| Expeditors International of Washington, Inc. | 21,370 | $ | 845,184 | |||||
| Yamato Holdings Co. Ltd. | 39,900 | 606,700 | ||||||
|
| |||||||
| $ | 1,451,884 | |||||||
|
| |||||||
| Utilities – Electric Power – 2.5% | ||||||||
| CEZ A.S. | 13,813 | $ | 494,144 | |||||
| CMS Energy Corp. | 53,300 | 1,299,454 | ||||||
| Issuer | Shares/Par | Value ($) | ||||||
| COMMON STOCKS – continued | ||||||||
| Utilities – Electric Power – continued | ||||||||
| Edison International | 16,320 | $ | 737,501 | |||||
| Energias do Brasil S.A. | 111,800 | 687,265 | ||||||
|
| |||||||
| $ | 3,218,364 | |||||||
|
| |||||||
| Utilities – Water – 0.1% | ||||||||
| Companhia de Saneamento Basico do Estado de Sao Paulo | 4,100 | $ | 172,029 | |||||
|
| |||||||
| Total Common Stocks (Identified Cost, $115,367,471) | $ | 129,686,298 | ||||||
|
| |||||||
| MONEY MARKET FUNDS – 0.3% | ||||||||
| MFS Institutional Money Market Portfolio, 0.16%, at Cost and Net Asset Value (v) | 480,187 | $ | 480,187 | |||||
|
| |||||||
| COLLATERAL FOR SECURITIES LOANED – 0.1% | ||||||||
| Navigator Securities Lending Prime Portfolio, 0.28%, at Cost and Net Asset Value (j) | 95,847 | $ | 95,847 | |||||
|
| |||||||
| Total Investments (Identified Cost, $115,943,505) | $ | 130,262,332 | ||||||
|
| |||||||
| SECURITIES SOLD SHORT – (0.2)% | ||||||||
| Machinery & Tools – (0.2)% | ||||||||
| Manitowoc Co., Inc. | (8,800 | ) | $ | (137,984 | ) | |||
| Terex Corp. (a) | (5,520 | ) | (155,167 | ) | ||||
|
| |||||||
| Total Securities Sold Short (Proceeds Received, $284,435) | $ | (293,151 | ) | |||||
|
| |||||||
| OTHER ASSETS, LESS LIABILITIES – (0.0)% | (3,311 | ) | ||||||
|
| |||||||
| Net Assets – 100.0% | $ | 129,965,870 | ||||||
|
| |||||||
| (a) | Non-income producing security. |
| (j) | The rate quoted is the annualized seven-day yield of the fund at period end. |
| (l) | A portion of this security is on loan. |
| (s) | Security or a portion of the security was pledged to cover collateral requirements for securities sold short. |
| (v) | Underlying affiliated fund that is available only to investment companies managed by MFS. The rate quoted for the MFS Institutional Money Market Portfolio is the annualized seven-day yield of the fund at period end. |
The following abbreviations are used in this report and are defined:
| ADR | American Depositary Receipt |
| IPS | International Preference Stock |
| PLC | Public Limited Company |
| REIT | Real Estate Investment Trust |
At December 31, 2012, the fund had cash collateral of $144,949 and other liquid securities with an aggregate value of $746,815 to cover any commitments for securities sold short. Cash collateral includes “Deposits with brokers” in the Statement of Assets and Liabilities.
See Notes to Financial Statements
9
Table of Contents
MFS Global Research Portfolio
FINANCIAL STATEMENTS | STATEMENT OF ASSETS AND LIABILITIES
This statement represents your fund’s balance sheet, which details the assets and liabilities comprising the total value of the fund.
At 12/31/12 | ||||||||
Assets | ||||||||
Investments – | ||||||||
Non-affiliated issuers, at value (identified cost, $115,463,318) | $129,782,145 | |||||||
Underlying affiliated funds, at cost and value | 480,187 | |||||||
Total investments, at value, including $95,684 of securities on loan (identified cost, $115,943,505) | $130,262,332 | |||||||
Cash | 18,840 | |||||||
Foreign currency, at value (identified cost, $8,444) | 8,440 | |||||||
Deposits with brokers | 144,949 | |||||||
Receivable for interest and dividends | 167,026 | |||||||
Other assets | 1,746 | |||||||
Total assets | $130,603,333 | |||||||
Liabilities | ||||||||
Payables for | ||||||||
Securities sold short, at value (proceeds received, $284,435) | $293,151 | |||||||
Fund shares reacquired | 106,457 | |||||||
Collateral for securities loaned, at value | 95,847 | |||||||
Payable to affiliates | ||||||||
Investment adviser | 10,886 | |||||||
Shareholder servicing costs | 93 | |||||||
Distribution and/or service fees | 342 | |||||||
Payable for independent Trustees’ compensation | 27 | |||||||
Deferred country tax expense payable | 47,824 | |||||||
Accrued expenses and other liabilities | 82,836 | |||||||
Total liabilities | $637,463 | |||||||
Net assets | $129,965,870 | |||||||
Net assets consist of | ||||||||
Paid-in capital | $153,329,979 | |||||||
Unrealized appreciation (depreciation) on investments and translation of assets and liabilities | 14,262,494 | |||||||
Accumulated net realized gain (loss) on investments and foreign currency | (39,662,654 | ) | ||||||
Undistributed net investment income | 2,036,051 | |||||||
Net assets | $129,965,870 | |||||||
Shares of beneficial interest outstanding | 6,387,125 |
| Net assets | Shares outstanding | Net asset value per share | ||||||||||
Initial Class | $117,388,070 | 5,765,911 | $20.36 | |||||||||
Service Class | 12,577,800 | 621,214 | 20.25 | |||||||||
See Notes to Financial Statements
10
Table of Contents
MFS Global Research Portfolio
FINANCIAL STATEMENTS | STATEMENT OF OPERATIONS
This statement describes how much your fund earned in investment income and accrued in expenses. It also describes any gains and/or losses generated by fund operations.
Year ended 12/31/12 | ||||||||
Net investment income | ||||||||
Income | ||||||||
Dividends | $3,481,597 | |||||||
Interest | 26,871 | |||||||
Dividends from underlying affiliated funds | 1,017 | |||||||
Foreign taxes withheld | (168,899 | ) | ||||||
Total investment income | $3,340,586 | |||||||
Expenses | ||||||||
Management fee | $992,173 | |||||||
Distribution and/or service fees | 32,207 | |||||||
Shareholder servicing costs | 12,107 | |||||||
Administrative services fee | 29,265 | |||||||
Independent Trustees’ compensation | 6,045 | |||||||
Custodian fee | 78,060 | |||||||
Shareholder communications | 14,134 | |||||||
Audit and tax fees | 84,348 | |||||||
Legal fees | 2,482 | |||||||
Dividend and interest expense on securities sold short | 11,913 | |||||||
Miscellaneous | 18,861 | |||||||
Total expenses | $1,281,595 | |||||||
Fees paid indirectly | (5 | ) | ||||||
Reduction of expenses by investment adviser | (475 | ) | ||||||
Net expenses | $1,281,115 | |||||||
Net investment income | $2,059,471 | |||||||
Realized and unrealized gain (loss) on investments and foreign currency | ||||||||
Realized gain (loss) (identified cost basis) | ||||||||
Investments (net of $15,187 country tax) | $7,032,325 | |||||||
Written options | 6,193 | |||||||
Securities sold short | (328,268 | ) | ||||||
Foreign currency | (15,145 | ) | ||||||
Net realized gain (loss) on investments and foreign currency | $6,695,105 | |||||||
Change in unrealized appreciation (depreciation) | ||||||||
Investments (net of $44,879 increase in deferred country tax) | $11,760,032 | |||||||
Written options | (673 | ) | ||||||
Securities sold short | 131,222 | |||||||
Translation of assets and liabilities in foreign currencies | 2,955 | |||||||
Net unrealized gain (loss) on investments and foreign currency translation | $11,893,536 | |||||||
Net realized and unrealized gain (loss) on investments and foreign currency | $18,588,641 | |||||||
Change in net assets from operations | $20,648,112 |
See Notes to Financial Statements
11
Table of Contents
MFS Global Research Portfolio
FINANCIAL STATEMENTS | STATEMENTS OF CHANGES IN NET ASSETS
These statements describe the increases and/or decreases in net assets resulting from operations, any distributions, and any shareholder transactions.
For years ended 12/31 | 2012 | 2011 | ||||||
Change in net assets | ||||||||
From operations | ||||||||
Net investment income | $2,059,471 | $2,037,782 | ||||||
Net realized gain (loss) on investments and foreign currency | 6,695,105 | 6,955,216 | ||||||
Net unrealized gain (loss) on investments and foreign currency translation | 11,893,536 | (18,310,024 | ) | |||||
Change in net assets from operations | $20,648,112 | $(9,317,026 | ) | |||||
Distributions declared to shareholders | ||||||||
From net investment income | $(2,040,059 | ) | $(1,734,310 | ) | ||||
Change in net assets from fund share transactions | $(19,027,284 | ) | $(19,755,648 | ) | ||||
Total change in net assets | $(419,231 | ) | $(30,806,984 | ) | ||||
Net assets | ||||||||
At beginning of period | 130,385,101 | 161,192,085 | ||||||
At end of period (including undistributed net investment income of $2,036,051 and | $129,965,870 | $130,385,101 |
See Notes to Financial Statements
12
Table of Contents
MFS Global Research Portfolio
FINANCIAL STATEMENTS | FINANCIAL HIGHLIGHTS
The financial highlights table is intended to help you understand the fund’s financial performance for the past 5 years. Certain information reflects financial results for a single fund share. The total returns in the table represent the rate by which an investor would have earned (or lost) on an investment in the fund share class (assuming reinvestment of all distributions) held for the entire period.
| Initial Class | Years ended 12/31 | |||||||||||||||||||
| 2012 | 2011 | 2010 | 2009 | 2008 | ||||||||||||||||
Net asset value, beginning of period | $17.71 | $19.23 | $17.29 | $13.30 | $21.04 | |||||||||||||||
| Income (loss) from investment operations | ||||||||||||||||||||
Net investment income (d) | $0.30 | $0.27 | $0.20 | $0.20 | $0.19 | |||||||||||||||
Net realized and unrealized gain (loss) on investments | 2.66 | (1.56 | ) | 1.97 | 4.03 | (7.81 | ) | |||||||||||||
Total from investment operations | $2.96 | $(1.29 | ) | $2.17 | $4.23 | $(7.62 | ) | |||||||||||||
| Less distributions declared to shareholders | ||||||||||||||||||||
From net investment income | $(0.31 | ) | $(0.23 | ) | $(0.23 | ) | $(0.24 | ) | $(0.12 | ) | ||||||||||
Net asset value, end of period (x) | $20.36 | $17.71 | $19.23 | $17.29 | $13.30 | |||||||||||||||
Total return (%) (k)(r)(s)(x) | 16.81 | (6.73 | ) | 12.66 | 32.44 | (36.43 | ) | |||||||||||||
| Ratios (%) (to average net assets) and Supplemental data: | ||||||||||||||||||||
Expenses before expense reductions (f) | 0.94 | 0.97 | 0.97 | 0.98 | 0.87 | |||||||||||||||
Expenses after expense reductions (f) | 0.94 | N/A | N/A | N/A | N/A | |||||||||||||||
Net investment income | 1.58 | 1.38 | 1.18 | 1.42 | 1.06 | |||||||||||||||
Portfolio turnover | 40 | 54 | 59 | 63 | 144 | |||||||||||||||
Net assets at end of period (000 omitted) | $117,388 | $117,312 | $144,156 | $149,758 | $134,672 | |||||||||||||||
| Supplemental Ratios (%): | ||||||||||||||||||||
Ratio of expenses to average net assets after expense reductions | 0.93 | 0.96 | 0.96 | 0.98 | N/A | |||||||||||||||
See Notes to Financial Statements
13
Table of Contents
MFS Global Research Portfolio
Financial Highlights – continued
| Service Class | Years ended 12/31 | |||||||||||||||||||
| 2012 | 2011 | 2010 | 2009 | 2008 | ||||||||||||||||
Net asset value, beginning of period | $17.60 | $19.11 | $17.18 | $13.21 | $20.89 | |||||||||||||||
| Income (loss) from investment operations | ||||||||||||||||||||
Net investment income (d) | $0.26 | $0.22 | $0.16 | $0.17 | $0.14 | |||||||||||||||
Net realized and unrealized gain (loss) on investments | 2.64 | (1.55 | ) | 1.96 | 3.99 | (7.76 | ) | |||||||||||||
Total from investment operations | $2.90 | $(1.33 | ) | $2.12 | $4.16 | $(7.62 | ) | |||||||||||||
| Less distributions declared to shareholders | ||||||||||||||||||||
From net investment income | $(0.25 | ) | $(0.18 | ) | $(0.19 | ) | $(0.19 | ) | $(0.06 | ) | ||||||||||
Net asset value, end of period (x) | $20.25 | $17.60 | $19.11 | $17.18 | $13.21 | |||||||||||||||
Total return (%) (k)(r)(s)(x) | 16.57 | (7.00 | ) | 12.42 | 32.03 | (36.57 | ) | |||||||||||||
| Ratios (%) (to average net assets) and Supplemental data: | ||||||||||||||||||||
Expenses before expense reductions (f) | 1.19 | 1.22 | 1.22 | 1.23 | 1.12 | |||||||||||||||
Expenses after expense reductions (f) | 1.19 | N/A | N/A | N/A | N/A | |||||||||||||||
Net investment income | 1.35 | 1.13 | 0.93 | 1.21 | 0.81 | |||||||||||||||
Portfolio turnover | 40 | 54 | 59 | 63 | 144 | |||||||||||||||
Net assets at end of period (000 omitted) | $12,578 | $13,073 | $17,036 | $17,901 | $18,199 | |||||||||||||||
| Supplemental Ratios (%): | ||||||||||||||||||||
Ratio of expenses to average net assets after expense reductions | 1.18 | 1.21 | 1.21 | 1.23 | N/A | |||||||||||||||
| (d) | Per share data is based on average shares outstanding. |
| (f) | Ratios do not reflect reductions from fees paid indirectly, if applicable. |
| (k) | The total return does not reflect expenses that apply to separate accounts. Inclusion of these charges would reduce the total return figures for all periods shown. |
| (r) | Certain expenses have been reduced without which performance would have been lower. |
| (s) | From time to time the fund may receive proceeds from litigation settlements, without which performance would be lower. Excluding the effect of the proceeds received from a non-recurring litigation settlement against Enron Corp., the Initial Class and Service Class total returns for the year ended December 31, 2008 would have each been lower by approximately 0.86%. Excluding the effect of the proceeds received from a non-recurring litigation settlement against Tyco International Ltd., the Initial Class and Service Class total returns for the year ended December 31, 2010 would have been lower by approximately 0.71% and 0.70%, respectively. |
| (x) | The net asset values per share and total returns have been calculated on net assets which include adjustments made in accordance with U.S. generally accepted accounting principles required at period end for financial reporting purposes. |
See Notes to Financial Statements
14
Table of Contents
MFS Global Research Portfolio
| (1) | Business and Organization |
MFS Global Research Portfolio (the fund) is a series of MFS Variable Insurance Trust II (the trust). The trust is organized as a Massachusetts business trust and is registered under the Investment Company Act of 1940, as amended, as an open-end management investment company. The shareholders of each series of the trust are separate accounts of insurance companies, which offer variable annuity and/or life insurance products, and qualified retirement and pension plans.
| (2) | Significant Accounting Policies |
General – The preparation of financial statements in conformity with U.S. generally accepted accounting principles requires management to make estimates and assumptions that affect the reported amounts of assets and liabilities, and disclosure of contingent assets and liabilities at the date of the financial statements and the reported amounts of revenues and expenses during the reporting period. Actual results could differ from those estimates. In the preparation of these financial statements, management has evaluated subsequent events occurring after the date of the fund’s Statement of Assets and Liabilities through the date that the financial statements were issued. The fund invests in foreign securities. Investments in foreign securities are vulnerable to the effects of changes in the relative values of the local currency and the U.S. dollar and to the effects of changes in each country’s legal, political, and economic environment.
In this reporting period the fund adopted Financial Accounting Standards Board (FASB) Accounting Standards Update 2011-04, Fair Value Measurement (Topic 820) – Amendments to Achieve Common Fair Value Measurement and Disclosure Requirements in U.S. GAAP and IFRSs (“ASU 2011-04”). ASU 2011-04 seeks to improve the comparability of fair value measurements as presented and disclosed in financial statements prepared in accordance with U.S. GAAP and International Financial Reporting Standards (IFRS) by providing common requirements for fair value measurement and disclosure.
In December 2011, the FASB issued Accounting Standards Update 2011-11, Balance Sheet (Topic 210) – Disclosures about Offsetting Assets and Liabilities (“ASU 2011-11”). Effective for annual reporting periods beginning on or after January 1, 2013 and interim periods within those annual periods, ASU 2011-11 is intended to enhance disclosure requirements on the offsetting of financial assets and liabilities. Although still evaluating the potential impacts of ASU 2011-11 to the fund, management expects that the impact of the fund’s adoption will be limited to additional financial statement disclosures.
Investment Valuations – Equity securities, including restricted equity securities, are generally valued at the last sale or official closing price as provided by a third-party pricing service on the market or exchange on which they are primarily traded. Equity securities, for which there were no sales reported that day, are generally valued at the last quoted daily bid quotation as provided by a third-party pricing service on the market or exchange on which such securities are primarily traded. Equity securities held short, for which there were no sales reported for that day, are generally valued at the last quoted daily ask quotation as provided by a third-party pricing service on the market or exchange on which such securities are primarily traded. Short-term instruments with a maturity at issuance of 60 days or less generally are valued at amortized cost, which approximates market value. Exchange-traded options are generally valued at the last sale or official closing price as provided by a third-party pricing service on the exchange on which such options are primarily traded. Exchange-traded options for which there were no sales reported that day are generally valued at the last daily bid quotation as provided by a third-party pricing service on the exchange on which such options are primarily traded. Options not traded on an exchange are generally valued at a broker/dealer bid quotation. Foreign currency options are generally valued at valuations provided by a third-party pricing service. Open-end investment companies are generally valued at net asset value per share. Securities and other assets generally valued on the basis of information from a third-party pricing service may also be valued at a broker/dealer bid quotation. Values obtained from third-party pricing services can utilize both transaction data and market information such as yield, quality, coupon rate, maturity, type of issue, trading characteristics, and other market data. The values of foreign securities and other assets and liabilities expressed in foreign currencies are converted to U.S. dollars using the mean of bid and asked prices for rates provided by a third-party pricing service.
The Board of Trustees has delegated primary responsibility for determining or causing to be determined the value of the fund’s investments (including any fair valuation) to the adviser pursuant to valuation policies and procedures approved by the Board. If the adviser determines that reliable market quotations are not readily available, investments are valued at fair value as determined in good faith by the adviser in accordance with such procedures under the oversight of the Board of Trustees. Under the fund’s valuation policies and procedures, market quotations are not considered to be readily available for most types of debt instruments and floating rate loans and many types of derivatives. These investments are generally valued at fair value based on information from third-party pricing services. In addition, investments may be valued at fair value if the adviser determines that an investment’s value has been materially affected by events occurring after the close of the exchange or market on which the investment is principally traded (such as foreign exchange or market) and prior to the determination of the fund’s net asset value, or after the halting of trading of a specific security where trading does not resume prior to the close of the exchange or market on which the security is principally traded. Events that occur on a frequent basis after foreign markets close (such as developments in foreign markets and significant movements in the U.S. markets) and prior to the determination of the fund’s net asset value may be deemed to have a material effect on the value of securities traded in foreign markets. Accordingly, the fund’s foreign equity securities may often be
15
Table of Contents
MFS Global Research Portfolio
Notes to Financial Statements – continued
valued at fair value. The adviser generally relies on third-party pricing services or other information (such as the correlation with price movements of similar securities in the same or other markets; the type, cost and investment characteristics of the security; the business and financial condition of the issuer; and trading and other market data) to assist in determining whether to fair value and at what value to fair value an investment. The value of an investment for purposes of calculating the fund’s net asset value can differ depending on the source and method used to determine value. When fair valuation is used, the value of an investment used to determine the fund’s net asset value may differ from quoted or published prices for the same investment. There can be no assurance that the fund could obtain the fair value assigned to an investment if it were to sell the investment at the same time at which the fund determines its net asset value per share.
Various inputs are used in determining the value of the fund’s assets or liabilities. These inputs are categorized into three broad levels. In certain cases, the inputs used to measure fair value may fall into different levels of the fair value hierarchy. In such cases, an investment’s level within the fair value hierarchy is based on the lowest level of input that is significant to the fair value measurement. The fund’s assessment of the significance of a particular input to the fair value measurement in its entirety requires judgment, and considers factors specific to the investment. Level 1 includes unadjusted quoted prices in active markets for identical assets or liabilities. Level 2 includes other significant observable market-based inputs (including quoted prices for similar securities, interest rates, prepayment speed, and credit risk). Level 3 includes unobservable inputs, which may include the adviser’s own assumptions in determining the fair value of investments. The following is a summary of the levels used as of December 31, 2012 in valuing the fund’s assets or liabilities:
| Investments at Value | Level 1 | Level 2 | Level 3 | Total | ||||||||||||
| Equity Securities: | ||||||||||||||||
United States | $65,568,558 | $— | $— | $65,568,558 | ||||||||||||
United Kingdom | — | 11,110,704 | — | 11,110,704 | ||||||||||||
Japan | 3,323,356 | 7,568,769 | — | 10,892,125 | ||||||||||||
Switerland | 2,011,440 | 5,574,712 | — | 7,586,152 | ||||||||||||
France | 645,652 | 4,067,768 | — | 4,713,420 | ||||||||||||
Hong Kong | — | 4,710,127 | — | 4,710,127 | ||||||||||||
Netherlands | 131,203 | 4,512,600 | — | 4,643,803 | ||||||||||||
Germany | — | 3,655,087 | — | 3,655,087 | ||||||||||||
China | — | 2,373,435 | — | 2,373,435 | ||||||||||||
Other Countries | 4,037,943 | 10,394,944 | — | 14,432,887 | ||||||||||||
| Mutual Funds | 576,034 | — | — | 576,034 | ||||||||||||
| Total Investments | $76,294,186 | $53,968,146 | $— | $130,262,332 | ||||||||||||
| Short Sales | $(293,151 | ) | $— | $— | $(293,151 | ) | ||||||||||
For further information regarding security characteristics, see the Portfolio of Investments.
Of the level 2 investments presented above, equity investments amounting to $25,326,282 would have been considered level 1 investments at the beginning of the period. Of the level 1 investments presented above, equity investments amounting to $1,407,685 would have been considered level 2 investments at the beginning of the period. The primary reason for changes in the classifications between levels 1 and 2 occurs when foreign equity securities are fair valued using other observable market-based inputs in place of the closing exchange price due to events occurring after the close of the exchange or market on which the investment is principally traded. The fund’s foreign equity securities may often be valued at fair value. The fund’s policy is to recognize transfers between the levels as of the end of the period.
Foreign Currency Translation – Purchases and sales of foreign investments, income, and expenses are converted into U.S. dollars based upon currency exchange rates prevailing on the respective dates of such transactions or on the reporting date for foreign denominated receivables and payables. Gains and losses attributable to foreign currency exchange rates on sales of securities are recorded for financial statement purposes as net realized gains and losses on investments. Gains and losses attributable to foreign exchange rate movements on receivables, payables, income and expenses are recorded for financial statement purposes as foreign currency transaction gains and losses. That portion of both realized and unrealized gains and losses on investments that results from fluctuations in foreign currency exchange rates is not separately disclosed.
Derivatives – The fund uses derivatives for different purposes, primarily to increase or decrease exposure to a particular market or segment of the market, or security, to increase or decrease interest rate or currency exposure, or as alternatives to direct investments. Derivatives are used for hedging or non-hedging purposes. While hedging can reduce or eliminate losses, it can also reduce or eliminate gains. When the fund uses derivatives as an investment to increase market exposure, or for hedging purposes, gains and losses from derivative instruments may be substantially greater than the derivative’s original cost.
The derivative instruments used by the fund were written options and purchased options. At December 31, 2012, the fund did not have any outstanding derivative instruments.
16
Table of Contents
MFS Global Research Portfolio
Notes to Financial Statements – continued
The following table presents, by major type of derivative contract, the realized gain (loss) on derivatives held by the fund for the year ended December 31, 2012 as reported in the Statement of Operations:
| Risk | Investments (Purchased Options) | Written Options | ||||||
| Equity | $(36,797 | ) | $6,193 | |||||
The following table presents, by major type of derivative contract, the change in unrealized appreciation (depreciation) on derivatives held by the fund for the year ended December 31, 2012 as reported in the Statement of Operations:
| Risk | Written Options | |||
| Equity | $(673 | ) | ||
Derivative counterparty credit risk is managed through formal evaluation of the creditworthiness of all potential counterparties. On certain over-the-counter derivatives, the fund attempts to reduce its exposure to counterparty credit risk whenever possible by entering into an International Swaps and Derivatives Association (ISDA) Master Agreement on a bilateral basis with each of the counterparties with whom it undertakes a significant volume of transactions. The ISDA Master Agreement gives each party to the agreement the right to terminate all transactions traded under such agreement if there is a certain deterioration in the credit quality of the other party. The ISDA Master Agreement gives the fund the right, upon an event of default by the applicable counterparty or a termination of the agreement, to close out all transactions traded under such agreement and to net amounts owed under each transaction to one net amount payable by one party to the other. This right to close out and net payments across all transactions traded under the ISDA Master Agreement could result in a reduction of the fund’s credit risk to such counterparty equal to any amounts payable by the fund under the applicable transactions, if any. However, absent an event of default by the counterparty or a termination of the agreement, the ISDA Master Agreement does not result in an offset of reported amounts of assets and liabilities in the Statement of Assets and Liabilities across transactions between the fund and the applicable counterparty.
Collateral requirements differ by type of derivative. Collateral or margin requirements are set by the broker or exchange clearing house for exchange traded derivatives (i.e., futures contracts and exchange-traded options) while collateral terms are contract specific for over-the-counter traded derivatives (i.e., forward foreign currency exchange contracts, swap agreements and over-the-counter options). For derivatives traded under an ISDA Master Agreement, the collateral requirements are netted across all transactions traded under such agreement and one amount is posted from one party to the other to collateralize such obligations. Cash collateral that has been pledged to cover obligations of the fund under derivative contracts, if any, will be reported separately in the Statement of Assets and Liabilities as “Deposits with brokers.” Securities collateral pledged for the same purpose, if any, is noted in the Portfolio of Investments.
Written Options – In exchange for a premium, the fund wrote call options on securities that it anticipated the price would decline and also wrote put options on securities that it anticipated the price would increase. At the time the option was written, the fund believed the premium received exceeded the potential loss that could result from adverse price changes in the options’ underlying securities. In a written option, the fund as the option writer grants the buyer the right to purchase from, or sell to, the fund a specified number of shares or units of a particular security, currency or index at a specified price within a specified period of time.
The premium received is initially recorded as a liability on the Statement of Assets and Liabilities. The option is subsequently marked-to-market daily with the difference between the premium received and the market value of the written option being recorded as unrealized appreciation or depreciation. When a written option expires, the fund realizes a gain equal to the amount of the premium received. The difference between the premium received and the amount paid on effecting a closing transaction is considered a realized gain or loss. When a written call option is exercised, the premium received is offset against the proceeds to determine the realized gain or loss. When a written put option is exercised, the premium reduces the cost basis of the security purchased by the fund.
At the initiation of the written option contract, for exchange traded options, the fund is required to deposit securities or cash as collateral with the custodian for the benefit of the broker. For over-the-counter options, the fund may post collateral subject to the terms of an ISDA Master Agreement as generally described above if the market value of the options contract moves against it. The fund, as writer of an option, may have no control over whether the underlying securities may be sold (call) or purchased (put) and, as a result, bears the market risk of an unfavorable change in the price of the securities underlying the written option. Losses from writing options can exceed the premium received and can exceed the potential loss from an ordinary buy and sell transaction. Although the fund’s market risk may be significant, the maximum counterparty credit risk to the fund is equal to the market value of any collateral posted to the broker. For over-the-counter options, this risk is mitigated in cases where there is an ISDA Master Agreement between the fund and the counterparty providing for netting as described above.
17
Table of Contents
MFS Global Research Portfolio
Notes to Financial Statements – continued
Written Options
| Number of contracts | Premiums received | |||||||
| Outstanding, beginning of period | 32 | $2,369 | ||||||
| Options written | 82 | 7,447 | ||||||
| Options closed | (35 | ) | (5,624 | ) | ||||
| Options exercised | (57 | ) | (2,540 | ) | ||||
| Options expired | (22 | ) | (1,652 | ) | ||||
| Outstanding, end of period | — | $— | ||||||
Purchased Options – The fund purchased put options for a premium. Purchased put options entitle the holder to sell a specified number of shares or units of a particular security, currency or index at a specified price at a specified date or within a specified period of time. Purchasing put options may hedge against an anticipated decline in the value of portfolio securities or currency or decrease the fund’s exposure to an underlying instrument.
The premium paid is initially recorded as an investment in the Statement of Assets and Liabilities. That investment is subsequently marked-to-market daily with the difference between the premium paid and the market value of the purchased option being recorded as unrealized appreciation or depreciation. Premiums paid for purchased put options which have expired are treated as realized losses on investments in the Statement of Operations. Upon the exercise or closing of a purchased put option, the premium paid is offset against the proceeds on the sale of the underlying security or financial instrument in order to determine the realized gain or loss on investments.
Whether or not the option is exercised, the fund’s maximum risk of loss from purchasing an option is the amount of premium paid. All option contracts involve credit risk if the counterparty to the option contract fails to perform. For over-the-counter options, this risk is mitigated in cases where there is an ISDA Master Agreement between the fund and the counterparty providing for netting as described above and for posting of collateral by the counterparty to the fund to cover the fund’s exposure to the counterparty under such ISDA Master Agreement.
Short Sales – The fund entered into short sales whereby it sells a security it does not own in anticipation of a decline in the value of that security. The fund will realize a gain if the security price decreases and a loss if the security price increases between the date of the short sale and the date on which the fund replaces the borrowed security. Losses from short sales can exceed the proceeds of the security sold; and they can also exceed the potential loss from an ordinary buy and sell transaction. The amount of any premium, dividends, or interest the fund may be required to pay in connection with a short sale will be recognized as a fund expense. During the year ended December 31, 2012, this expense amounted to $11,913. The fund segregates cash or marketable securities in an amount that, when combined with the amount of proceeds from the short sale deposited with the broker, at least equals the current market value of the security sold short.
Security Loans – State Street Bank and Trust Company (“State Street”), as lending agent, loans the securities of the fund to certain qualified institutions (the “Borrowers”) approved by the fund. The loans are collateralized by cash and/or U.S. Treasury and federal agency obligations in an amount typically at least equal to the market value of the securities loaned. The market value of the loaned securities is determined at the close of business of the fund and any additional required collateral is delivered to the fund on the next business day. State Street provides the fund with indemnification against Borrower default. The fund bears the risk of loss with respect to the investment of cash collateral. On loans collateralized by cash, the cash collateral is invested in a money market fund or short-term securities. Collateral for securities loaned is held at carrying value, which approximates fair value. If the collateral for securities loaned was carried at fair value, its fair value would be considered level 2 under the fair value hierarchy. A portion of the income generated upon investment of the collateral is remitted to the Borrowers, and the remainder is allocated between the fund and the lending agent. On loans collateralized by U.S. Treasury and/or federal agency obligations, a fee is received from the Borrower, and is allocated between the fund and the lending agent. Income from securities lending is included in “Interest” income, in the Statement of Operations. The dividend and interest income earned on the securities loaned is accounted for in the same manner as other dividend and interest income.
Indemnifications – Under the fund’s organizational documents, its officers and Trustees may be indemnified against certain liabilities and expenses arising out of the performance of their duties to the fund. Additionally, in the normal course of business, the fund enters into agreements with service providers that may contain indemnification clauses. The fund’s maximum exposure under these agreements is unknown as this would involve future claims that may be made against the fund that have not yet occurred.
Investment Transactions and Income – Investment transactions are recorded on the trade date. Interest income is recorded on the accrual basis. Dividends received in cash are recorded on the ex-dividend date. Certain dividends from foreign securities will be recorded when the fund is informed of the dividend if such information is obtained subsequent to the ex-dividend date. Dividend and interest payments received in additional securities are recorded on the ex-dividend or ex-interest date in an amount equal to the value of the security on such date.
18
Table of Contents
MFS Global Research Portfolio
Notes to Financial Statements – continued
The fund may receive proceeds from litigation settlements. Any proceeds received from litigation involving portfolio holdings are reflected in the Statement of Operations in realized gain/loss if the security has been disposed of by the fund or in unrealized gain/loss if the security is still held by the fund. Any other proceeds from litigation not related to portfolio holdings are reflected as other income in the Statement of Operations.
Fees Paid Indirectly – The fund’s custody fee may be reduced according to an arrangement that measures the value of cash deposited with the custodian by the fund. This amount, for the year ended December 31, 2012, is shown as a reduction of total expenses in the Statement of Operations.
Tax Matters and Distributions – The fund intends to qualify as a regulated investment company, as defined under Subchapter M of the Internal Revenue Code, and to distribute all of its taxable income, including realized capital gains. As a result, no provision for federal income tax is required. The fund’s federal tax returns, when filed, will remain subject to examination by the Internal Revenue Service for a three year period. Foreign taxes have been accrued by the fund in the accompanying financial statements.
Distributions to shareholders are recorded on the ex-dividend date. Income and capital gain distributions are determined in accordance with income tax regulations, which may differ from U.S. generally accepted accounting principles. Certain capital accounts in the financial statements are periodically adjusted for permanent differences in order to reflect their tax character. These adjustments have no impact on net assets or net asset value per share. Temporary differences which arise from recognizing certain items of income, expense, gain or loss in different periods for financial statement and tax purposes will reverse at some time in the future. Distributions in excess of net investment income or net realized gains are temporary overdistributions for financial statement purposes resulting from differences in the recognition or classification of income or distributions for financial statement and tax purposes.
Book/tax differences primarily relate to wash sale loss deferrals and straddle loss deferrals.
The tax character of distributions declared to shareholders for the last two fiscal years is as follows:
| 12/31/12 | 12/31/11 | |||||||
| Ordinary income (including any short-term capital gains) | $2,040,059 | $1,734,310 | ||||||
The federal tax cost and the tax basis components of distributable earnings were as follows:
| As of 12/31/12 | ||||
| Cost of investments | $116,032,629 | |||
| Gross appreciation | 20,098,625 | |||
| Gross depreciation | (5,868,922 | ) | ||
| Net unrealized appreciation (depreciation) | $14,229,703 | |||
| Undistributed ordinary income | 2,036,051 | |||
| Capital loss carryforwards | (39,522,841 | ) | ||
| Other temporary differences | (107,022 | ) |
Under the Regulated Investment Company Modernization Act of 2010 (the “Act”), net capital losses recognized after December 31, 2010 may be carried forward indefinitely, and their character is retained as short-term and/or long-term losses. Previously, net capital losses were carried forward for eight years and treated as short-term losses. As a transition rule, the Act requires that post-enactment net capital losses be used before pre-enactment net capital losses.
As of December 31, 2012, the fund had capital loss carryforwards available to offset future realized gains. Such losses expire as follows:
| Pre-enactment losses: | ||||
| 12/31/16 | $(20,801,086 | ) | ||
| 12/31/17 | (18,721,755 | ) | ||
| Total | $(39,522,841 | ) |
Multiple Classes of Shares of Beneficial Interest – The fund offers multiple classes of shares, which differ in their respective distribution and/or service fees. The fund’s income, realized and unrealized gain (loss), and common expenses are allocated to
19
Table of Contents
MFS Global Research Portfolio
Notes to Financial Statements – continued
shareholders based on the daily net assets of each class. Dividends are declared separately for each class. Differences in per share dividend rates are generally due to differences in separate class expenses. The fund’s distributions declared to shareholders as reported in the Statements of Changes in Net Assets are presented by class as follows:
| From net investment income | ||||||||
| Year ended 12/31/12 | Year ended 12/31/11 | |||||||
| Initial Class | $1,870,542 | $1,599,294 | ||||||
| Service Class | 169,517 | 135,016 | ||||||
| Total | $2,040,059 | $1,734,310 | ||||||
| (3) | Transactions with Affiliates |
Investment Adviser – The fund has an investment advisory agreement with MFS to provide overall investment management and related administrative services and facilities to the fund. The management fee is computed daily and paid monthly at the following annual rates:
| First $300 million of average daily net assets | 0.75% | |||
| Average daily net assets in excess of $300 million | 0.675% |
The management fee incurred for the year ended December 31, 2012 was equivalent to an annual effective rate of 0.75% of the fund’s average daily net assets.
Distributor – MFS Fund Distributors, Inc. (MFD), a wholly-owned subsidiary of MFS, is the distributor of shares of the fund. The Trustees have adopted a distribution plan for the Service Class shares pursuant to Rule 12b-1 under the Investment Company Act of 1940.
The fund’s distribution plan provides that the fund will pay MFD distribution and/or service fees equal to 0.25% per annum of its average daily net assets attributable to Service Class shares as partial consideration for services performed and expenses incurred by MFD and financial intermediaries (including participating insurance companies that invest in the fund to fund variable annuity and variable life insurance contracts, sponsors of qualified retirement and pension plans that invest in the fund, and affiliates of these participating insurance companies and plan sponsors) in connection with the sale and distribution of the Service Class shares. MFD may subsequently pay all, or a portion, of the distribution and/or service fees to financial intermediaries.
Shareholder Servicing Agent – MFS Service Center, Inc. (MFSC), a wholly-owned subsidiary of MFS, receives a fee from the fund for its services as shareholder servicing agent. For the year ended December 31, 2012, the fee was $12,096, which equated to 0.0091% annually of the fund’s average daily net assets. MFSC also receives payment from the fund for out-of-pocket expenses paid by MFSC on behalf of the fund. For the year ended December 31, 2012, these costs amounted to $11.
Administrator – MFS provides certain financial, legal, shareholder communications, compliance, and other administrative services to the fund. Under an administrative services agreement, the fund partially reimburses MFS the costs incurred to provide these services. The fund is charged an annual fixed amount of $17,500 plus a fee based on average daily net assets. The administrative services fee incurred for the year ended December 31, 2012 was equivalent to an annual effective rate of 0.0221% of the fund’s average daily net assets.
Trustees’ and Officers’ Compensation – The fund pays compensation to independent Trustees in the form of a retainer, attendance fees, and additional compensation to Board and Committee chairpersons. The fund does not pay compensation directly to Trustees or officers of the fund who are also officers of the investment adviser, all of whom receive remuneration for their services to the fund from MFS. Certain officers and Trustees of the fund are officers or directors of MFS, MFD, and MFSC.
Other – This fund and certain other funds managed by MFS (the funds) have entered into services agreements (the Agreements) which provide for payment of fees by the funds to Tarantino LLC and Griffin Compliance LLC in return for the provision of services of an Independent Chief Compliance Officer (ICCO) and Assistant ICCO, respectively, for the funds. The ICCO and Assistant ICCO are officers of the funds and the sole members of Tarantino LLC and Griffin Compliance LLC, respectively. The funds can terminate the Agreements with Tarantino LLC and Griffin Compliance LLC at any time under the terms of the Agreements. For the year ended December 31, 2012, the aggregate fees paid by the fund to Tarantino LLC and Griffin Compliance LLC were $1,093 and are included in “Miscellaneous” expense in the Statement of Operations. MFS has agreed to reimburse the fund for a portion of the payments made by the fund in the amount of $475, which is shown as a reduction of total expenses in the Statement of Operations. Additionally, MFS has agreed to bear all expenses associated with office space, other administrative support, and supplies provided to the ICCO and Assistant ICCO.
The fund invests in the MFS Institutional Money Market Portfolio which is managed by MFS and seeks current income consistent with preservation of capital and liquidity. Income earned on this investment is included in “Dividends from underlying affiliated funds” in the Statement of Operations. This money market fund does not pay a management fee to MFS.
20
Table of Contents
MFS Global Research Portfolio
Notes to Financial Statements – continued
| (4) | Portfolio Securities |
Purchases and sales of investments, other than purchased option transactions, short sales, and short-term obligations, aggregated $53,174,109 and $72,489,998, respectively.
| (5) | Shares of Beneficial Interest |
The fund’s Declaration of Trust permits the Trustees to issue an unlimited number of full and fractional shares of beneficial interest. Transactions in fund shares were as follows:
| Year ended 12/31/12 | Year ended 12/31/11 | |||||||||||||||
| Shares | Amount | Shares | Amount | |||||||||||||
| Shares sold | ||||||||||||||||
Initial Class | 30,009 | $587,110 | 28,690 | $520,163 | ||||||||||||
Service Class | 51,613 | 977,622 | 74,343 | 1,365,536 | ||||||||||||
| 81,622 | $1,564,732 | 103,033 | $1,885,699 | |||||||||||||
| Shares issued to shareholders in reinvestment of distributions | ||||||||||||||||
Initial Class | 97,020 | $1,870,542 | 87,537 | $1,599,294 | ||||||||||||
Service Class | 8,834 | 169,517 | 7,427 | 135,016 | ||||||||||||
| 105,854 | $2,040,059 | 94,964 | $1,734,310 | |||||||||||||
| Shares reacquired | ||||||||||||||||
Initial Class | (986,978 | ) | $(19,101,113 | ) | (985,079 | ) | $(18,958,720 | ) | ||||||||
Service Class | (181,973 | ) | (3,530,962 | ) | (230,372 | ) | (4,416,937 | ) | ||||||||
| (1,168,951 | ) | $(22,632,075 | ) | (1,215,451 | ) | $(23,375,657 | ) | |||||||||
| Net change | ||||||||||||||||
Initial Class | (859,949 | ) | $(16,643,461 | ) | (868,852 | ) | $(16,839,263 | ) | ||||||||
Service Class | (121,526 | ) | (2,383,823 | ) | (148,602 | ) | (2,916,385 | ) | ||||||||
| (981,475 | ) | $(19,027,284 | ) | (1,017,454 | ) | $(19,755,648 | ) | |||||||||
| (6) | Line of Credit |
The fund and certain other funds managed by MFS participate in a $1.1 billion unsecured committed line of credit, subject to a $1 billion sublimit, provided by a syndication of banks under a credit agreement. Borrowings may be made for temporary financing needs. Interest is charged to each fund, based on its borrowings, generally at a rate equal to the higher of the Federal Reserve funds rate or one month LIBOR plus an agreed upon spread. A commitment fee, based on the average daily, unused portion of the committed line of credit, is allocated among the participating funds at the end of each calendar quarter. In addition, the fund and other funds managed by MFS have established unsecured uncommitted borrowing arrangements with certain banks for temporary financing needs. Interest is charged to each fund, based on its borrowings, at a rate equal to the Federal Reserve funds rate plus an agreed upon spread. For the year ended December 31, 2012, the fund’s commitment fee and interest expense were $853 and $0, respectively, and are included in “Miscellaneous” expense in the Statement of Operations.
| (7) | Transactions in Underlying Affiliated Funds – Affiliated Issuers |
An affiliated issuer may be considered one in which the fund owns 5% or more of the outstanding voting securities, or a company which is under common control. For the purposes of this report, the fund assumes the following to be an affiliated issuer:
| Underlying Affiliated Fund | Beginning Shares/Par Amount | Acquisitions Shares/Par Amount | Dispositions Shares/Par Amount | Ending Shares/Par Amount | ||||||||||||
| MFS Institutional Money Market Portfolio | 316,413 | 29,178,557 | (29,014,783 | ) | 480,187 | |||||||||||
| Underlying Affiliated Fund | Realized Gain (Loss) | Capital Gain Distributions | Dividend Income | Ending Value | ||||||||||||
| MFS Institutional Money Market Portfolio | $— | $— | $1,017 | $480,187 | ||||||||||||
21
Table of Contents
MFS Global Research Portfolio
REPORT OF INDEPENDENT REGISTERED PUBLIC ACCOUNTING FIRM
To the Board of Trustees of MFS Variable Insurance Trust II and the Shareholders of
MFS Global Research Portfolio:
We have audited the accompanying statement of assets and liabilities, including the portfolio of investments, of MFS Global Research Portfolio (the “Fund”) (one of the series comprising MFS Variable Insurance Trust II) as of December 31, 2012, and the related statement of operations for the year then ended, the statements of changes in net assets for each of the two years in the period then ended, and the financial highlights for each of the five years in the period then ended. These financial statements and financial highlights are the responsibility of the Fund’s management. Our responsibility is to express an opinion on these financial statements and financial highlights based on our audits.
We conducted our audits in accordance with the standards of the Public Company Accounting Oversight Board (United States). Those standards require that we plan and perform the audit to obtain reasonable assurance about whether the financial statements and financial highlights are free of material misstatement. The Fund is not required to have, nor were we engaged to perform, an audit of its internal control over financial reporting. Our audits included consideration of internal control over financial reporting as a basis for designing audit procedures that are appropriate in the circumstances, but not for the purpose of expressing an opinion on the effectiveness of the Fund’s internal control over financial reporting. Accordingly, we express no such opinion. An audit also includes examining, on a test basis, evidence supporting the amounts and disclosures in the financial statements, assessing the accounting principles used and significant estimates made by management, as well as evaluating the overall financial statement presentation. Our procedures included confirmation of securities owned as of December 31, 2012, by correspondence with the custodian and brokers; where replies were not received from brokers, we performed other auditing procedures. We believe that our audits provide a reasonable basis for our opinion.
In our opinion, the financial statements and financial highlights referred to above present fairly, in all material respects, the financial position of MFS Global Research Portfolio as of December 31, 2012, the results of its operations for the year then ended, the changes in its net assets for each of the two years in the period then ended, and the financial highlights for each of the five years in the period then ended, in conformity with accounting principles generally accepted in the United States of America.
DELOITTE & TOUCHE LLP
Boston, Massachusetts
February 15, 2013
22
Table of Contents
MFS Global Research Portfolio
TRUSTEES AND OFFICERS – IDENTIFICATION AND BACKGROUND
The Trustees and officers of the Trust, as of February 1, 2013, are listed below, together with their principal occupations during the past five years. (Their titles may have varied during that period.) The address of each Trustee and officer is 111 Huntington Avenue, Boston, Massachusetts 02199-7618.
Name, Age | Position(s) with Fund | Trustee/Officer Since (h) | Principal Occupations During the Past Five Years | Other Directorships (j) | ||||
| INTERESTED TRUSTEES | ||||||||
Robert J. Manning (k) (age 49) | Trustee | February 2004 | Massachusetts Financial Services Company, Chairman, Chief Executive Officer and Director; President (until December 2009); Chief Investment Officer (until July 2010) | N/A | ||||
| INDEPENDENT TRUSTEES | ||||||||
David H. Gunning (age 70) | Trustee and Chair of Trustees | January 2004 | Private investor | Lincoln Electric Holdings, Inc. (welding equipment manufacturer), Director; Development Alternatives, Inc. (consulting), Director/Non-Executive Chairman; Portman Limited (mining), Director (until 2008) | ||||
Robert E. Butler (age 71) | Trustee | January 2006 | Consultant – investment company industry regulatory and compliance matters | N/A | ||||
Maureen R. Goldfarb (age 57) | Trustee | January 2009 | Private investor | N/A | ||||
William R. Gutow (age 71) | Trustee | December 1993 | Private investor and real estate consultant; Capitol Entertainment Management Company (video franchise), Vice Chairman | Atlantic Coast Tan (tanning salons), Vice Chairman (until 2007); Texas Donuts (donut franchise), Vice Chairman (until 2010) | ||||
Michael Hegarty (age 68) | Trustee | December 2004 | Private investor; Rouse Properties Inc. (real estate), Director | N/A | ||||
John P. Kavanaugh (age 58) | Trustee | January 2009 | Private investor | N/A | ||||
J. Dale Sherratt (age 74) | Trustee | June 1989 | Insight Resources, Inc. (acquisition planning specialists), President; Wellfleet Investments (investor in health care companies), Managing General Partner | N/A | ||||
| Laurie J. Thomsen (age 55) | Trustee | March 2005 | Private investor; New Profit, Inc. (venture philanthropy), Executive Partner (until 2010) | The Travelers Companies (insurance), Director | ||||
Robert W. Uek (age 71) | Trustee | January 2006 | Consultant to investment company industry | N/A | ||||
| OFFICERS | ||||||||
John M. Corcoran (k) (age 47) | President | October 2008 | Massachusetts Financial Services Company, Senior Vice President (since October 2008); State Street Bank and Trust (financial services provider), Senior Vice President, (until September 2008) | N/A | ||||
| Christopher R. Bohane (k) (age 39) | Assistant Secretary and Assistant Clerk | July 2005 | Massachusetts Financial Services Company, Vice President and Senior Counsel | N/A | ||||
Kino Clark (k) (age 44) | Assistant Treasurer | January 2012 | Massachusetts Financial Services Company, Vice President | N/A | ||||
Thomas H. Connors (k) (age 53) | Assistant Secretary and Assistant Clerk | September 2012 | Massachusetts Financial Services Company, Vice President and Senior Counsel; Deutsche Investment Management Americas Inc. (financial service provider), Director and Senior Counsel (until 2012) | N/A | ||||
Ethan D. Corey (k) (age 49) | Assistant Secretary and Assistant Clerk | July 2005 | Massachusetts Financial Services Company, Senior Vice President and Associate General Counsel | N/A | ||||
23
Table of Contents
MFS Global Research Portfolio
Trustees and Officers – continued
Name, Age | Position(s) with Fund | Trustee/Officer Since (h) | Principal Occupations During the Past Five Years | Other Directorships (j) | ||||
David L. DiLorenzo (k) (age 44) | Treasurer | July 2005 | Massachusetts Financial Services Company, Senior Vice President | N/A | ||||
Robyn L. Griffin (age 37) | Assistant Independent Chief Compliance Officer | August 2008 | Griffin Compliance LLC (provider of compliance services), Principal (since August 2008); State Street Corporation (financial services provider), Mutual Fund Administration Assistant Vice President (October 2006 – July 2008) | N/A | ||||
Brian E. Langenfeld (k) (age 39) | Assistant Secretary and Assistant Clerk | June 2006 | Massachusetts Financial Services Company, Vice President and Senior Counsel | N/A | ||||
Susan S. Newton (k) (age 62) | Assistant Secretary and Assistant Clerk | May 2005 | Massachusetts Financial Services Company, Senior Vice President and Associate General Counsel | N/A | ||||
Susan A. Pereira (k) (age 42) | Assistant Secretary and Assistant Clerk | July 2005 | Massachusetts Financial Services Company, Vice President and Senior Counsel | N/A | ||||
Kasey L. Phillips (k) (age 42) | Assistant Treasurer | September 2012 | Massachusetts Financial Services Company, Vice President; Wells Fargo Funds Management, LLC, Senior Vice President, Fund Treasurer (until 2012) | N/A | ||||
Mark N. Polebaum (k) (age 60) | Secretary and Clerk | January 2006 | Massachusetts Financial Services Company, Executive Vice President, General Counsel and Secretary | N/A | ||||
Frank L. Tarantino (age 68) | Independent Chief Compliance Officer | June 2004 | Tarantino LLC (provider of compliance services), Principal | N/A | ||||
Richard S. Weitzel (k) (age 42) | Assistant Secretary and Assistant Clerk | October 2007 | Massachusetts Financial Services Company, Senior Vice President and Associate General Counsel | N/A | ||||
James O. Yost (k) (age 52) | Deputy Treasurer | September 1990 | Massachusetts Financial Services Company, Senior Vice President | N/A | ||||
| (h) | Date first appointed to serve as Trustee/officer of an MFS fund. Each Trustee has served continuously since appointment unless indicated otherwise. For the period from December 15, 2004 until February 22, 2005, Mr. Manning served as Advisory Trustee. For the period October 2008, until January 2012, Mr. Corcoran served as Treasurer of the Funds. Prior to January 2012, Messrs. DiLorenzo and Yost served as Assistant Treasurers of the Funds. |
| (j) | Directorships or trusteeships of companies required to report to the Securities and Exchange Commission (i.e., “public companies”). |
| (k) | “Interested person” of the Trust within the meaning of the Investment Company Act of 1940 (referred to as the 1940 Act), which is the principal federal law governing investment companies like the fund, as a result of position with MFS. The address of MFS is 111 Huntington Avenue, Boston, Massachusetts 02199-7618. |
Each Trustee has been elected by shareholders and each Trustee and officer holds office until his or her successor is chosen and qualified or until his or her earlier death, resignation, retirement or removal. The Trust does not hold annual meetings for the purpose of electing Trustees, and Trustees are not elected for fixed terms. Messrs. Butler, Kavanaugh, Uek and Ms. Thomsen are members of the Trust’s Audit Committee.
Each of the Fund’s Trustees and officers holds comparable positions with certain other funds of which MFS or a subsidiary is the investment adviser or distributor, and, in the case of the officers, with certain affiliates of MFS. As of January 1, 2013, the Trustees served as board members of 143 funds within the MFS Family of Funds.
24
Table of Contents
MFS Global Research Portfolio
Trustees and Officers – continued
The Statement of Additional Information for the Fund includes further information about the Trustees and is available without charge upon request by calling 1-800-225-2606.
Investment Adviser Massachusetts Financial Services Company 111 Huntington Avenue Boston, MA 02199-7618 | Custodian State Street Bank and Trust 1 Lincoln Street Boston, MA 02111-2900 | |
Distributor MFS Fund Distributors, Inc. 111 Huntington Avenue Boston, MA 02199-7618 | Independent Registered Public Accounting Firm Deloitte & Touche LLP 200 Berkeley Street Boston, MA 02116 | |
Portfolio Managers Michael Cantara Ben Kottler |
25
Table of Contents
MFS Global Research Portfolio
BOARD REVIEW OF INVESTMENT ADVISORY AGREEMENT
A discussion regarding the Board’s most recent approval of the fund’s Investment Advisory Agreement with MFS is available by clicking on the fund’s name under “Variable Insurance Portfolios – VIT II” in the “Products” section of the MFS Web site (mfs.com).
PROXY VOTING POLICIES AND INFORMATION
A general description of the MFS funds’ proxy voting policies and procedures is available without charge, upon request, by calling 1-800-225-2606, by visiting the Proxy Voting section of mfs.com or by visiting the SEC’s Web site at http://www.sec.gov.
Information regarding how the fund voted proxies relating to portfolio securities during the most recent twelve-month period ended June 30 is available without charge by visiting the Proxy Voting section of mfs.com or by visiting the SEC’s Web site at http://www.sec.gov.
QUARTERLY PORTFOLIO DISCLOSURE
The fund will file a complete schedule of portfolio holdings with the Securities and Exchange Commission (the Commission) for the first and third quarters of each fiscal year on Form N-Q. The fund’s Form N-Q is available on the EDGAR database on the Commission’s Internet Web site at http://www.sec.gov, and may be reviewed and copied at the:
Public Reference Room
Securities and Exchange Commission
100 F Street, NE, Room 1580
Washington, D.C. 20549
Information on the operation of the Public Reference Room may be obtained by calling the Commission at 1-800-SEC-0330. Copies of the fund’s Form N-Q also may be obtained, upon payment of a duplicating fee, by electronic request at the following e-mail address: publicinfo@sec.gov or by writing the Public Reference Section at the above address.
From time to time, MFS may post important information about the fund or the MFS funds on the MFS web site (mfs.com). This information is available by visiting the “News & Commentary” section of mfs.com or by clicking on the fund’s name under “Variable Insurance Portfolios – VIT II” in the “Products” section of mfs.com.
FEDERAL TAX INFORMATION (unaudited)
The following information is provided pursuant to provisions of the Internal Revenue Code.
For corporate shareholders, 54.39% of the ordinary income dividends paid during the fiscal year qualify for the corporate dividends received deduction.
26
Table of Contents
rev. 3/11

| Why? | Financial companies choose how they share your personal information. Federal law gives consumers the right to limit some but not all sharing. Federal law also requires us to tell you how we collect, share, and protect your personal information. Please read this notice carefully to understand what we do. |
| What? | The types of personal information we collect and share depend on the product or service you have with us. This information can include:
• Social Security number and account balances • Account transactions and transaction history • Checking account information and wire transfer instructions
When you are no longer our customer, we continue to share your information as described in this notice. |
| How? | All financial companies need to share customers’ personal information to run their everyday business. In the section below, we list the reasons financial companies can share their customers’ personal information; the reasons MFS chooses to share; and whether you can limit this sharing. |
| Reasons we can share your personal information | Does MFS share? | Can you limit this sharing? | ||
For our everyday business purposes – such as to process your transactions, maintain your account(s), respond to court orders and legal investigations, or report to credit bureaus | Yes | No | ||
For our marketing purposes – to offer our products and services to you | No | We don’t share | ||
| For joint marketing with other financial companies | No | We don’t share | ||
For our affiliates’ everyday business purposes – information about your transactions and experiences | No | We don’t share | ||
For our affiliates’ everyday business purposes – information about your creditworthiness | No | We don’t share | ||
| For nonaffiliates to market to you | No | We don’t share |
| Questions? | Call 800-225-2606 or go to mfs.com. |
27
Table of Contents
| Page 2 |
| Who we are | ||
| Who is providing this notice? | MFS Funds, MFS Investment Management, MFS Institutional Advisors, Inc., MFS Fund Distributors, Inc., MFS Heritage Trust Company, and MFS Service Center, Inc. | |
| What we do | ||
| How does MFS protect my personal information? | To protect your personal information from unauthorized access and use, we use security measures that comply with federal law. These measures include procedural, electronic, and physical safeguards for the protection of the personal information we collect about you. | |
| How does MFS collect my personal information? | We collect your personal information, for example, when you
• open an account or provide account information • direct us to buy securities or direct us to sell your securities • make a wire transfer
We also collect your personal information from others, such as credit bureaus, affiliates and other companies. | |
| Why can’t I limit all sharing? | Federal law gives you the right to limit only
• sharing for affiliates’ everyday business purposes – information about your creditworthiness • affiliates from using your information to market to you • sharing for nonaffiliates to market to you
State laws and individual companies may give you additional rights to limit sharing. | |
| Definitions | ||
| Affiliates | Companies related by common ownership or control. They can be financial and nonfinancial companies.
•MFS does not share personal information with affiliates, except for everyday business purposes as described on page one of this notice. | |
| Nonaffiliates | Companies not related by common ownership or control. They can be financial and nonfinancial companies.
•MFS does not share with nonaffiliates so they can market to you. | |
| Joint Marketing | A formal agreement between nonaffiliated financial companies that together market financial products or services to you.
•MFS doesn’t jointly market. | |
| Other important information | ||
| If you own an MFS product or receive an MFS service in the name of a third party such as a bank or broker-dealer, their privacy policy may apply to you instead of ours. | ||
28
Table of Contents
Table of Contents
ANNUAL REPORT
December 31, 2012

MFS® GLOBAL
GOVERNMENTS PORTFOLIO
MFS® Variable Insurance Trust II

WGS-ANN
Table of Contents
MFS® GLOBAL GOVERNMENTS PORTFOLIO
The report is prepared for the general information of contract owners. It is authorized for distribution to prospective investors only when preceded or accompanied by a current prospectus.
NOT FDIC INSURED Ÿ MAY LOSE VALUE Ÿ NO BANK OR CREDIT UNION GUARANTEE Ÿ NOT A DEPOSIT Ÿ NOT INSURED BY ANY FEDERAL GOVERNMENT AGENCY OR NCUA/NCUSIF
Table of Contents
MFS Global Governments Portfolio
LETTER FROM THE CHAIRMAN AND CEO

Dear Contract Owners:
The global market outlook for 2013 is one of cautious optimism. While we are seeing some positive economic trends in the United States, Europe and China, the overall environment remains challenging. In the United States, the recent fiscal cliff agreement was received positively by investors, even though it mostly addressed pressing taxation issues and did not resolve additional concerns, including the need for spending cuts and a large-scale reduction of the federal debt. These issues will be front and center again in the spring. Despite the ongoing uncertainty, economic tailwinds are gathering strength as the U.S. housing and job markets are improving and consumer confidence is rising.
Overseas, the debt crisis continues to weigh heavily on eurozone markets, with even Germany — long an economic stalwart — experiencing some contraction. These ongoing challenges could be a drag on global market performance this year. In Asia, manufacturing activity has accelerated in emerging markets such as China and India, and we are seeing signs of stabilized loan growth in China, a leading indicator of that country’s economic health. In contrast, Japan’s economy is contracting sharply under deflationary pressures. Nevertheless, Japanese markets have responded favorably to early actions by the new government, which appears determined to act aggressively, along with the Bank of Japan, to stimulate growth.
As always, managing risk in the face of uncertainty remains a top priority for investors. At MFS®, our uniquely collaborative investment process revolves around global research and our disciplined risk management approach. Our global team of investment professionals shares ideas and evaluates opportunities across continents, investment disciplines and asset classes — all with a goal of building better insights, and ultimately better results, for our clients.
We remain mindful of the many economic challenges investors face today, and believe it is more important than ever to maintain a long-term view, employ time-tested principles, such as asset allocation and diversification, and work closely with investment advisors to identify and pursue the most suitable opportunities.
Respectfully,

Robert J. Manning
Chairman and Chief Executive Officer
MFS Investment Management®
February 15, 2013
The opinions expressed in this letter are subject to change, may not be relied upon for investment advice, and no forecasts can be guaranteed.
1
Table of Contents
MFS Global Governments Portfolio
Portfolio structure (i)

| Fixed income sectors (i) | ||||
| Non-U.S. Government Bonds | 65.5% | |||
| U.S. Treasury Securities | 28.0% | |||
| Mortgage-Backed Securities | 0.4% | |||
| U.S. Government Agencies | 0.4% | |||
| High Grade Corporates | 0.1% | |||
| Commercial Mortgage-Backed Securities | 0.1% | |||
| Composition including fixed income credit quality (a)(i) | ||||
| AAA | 23.8% | |||
| AA | 4.8% | |||
| A | 21.9% | |||
| BBB | 15.1% | |||
| BB | 0.1% | |||
| B (o) | 0.0% | |||
| CCC (o) | 0.0% | |||
| U.S. Government | 28.0% | |||
| Federal Agencies | 0.8% | |||
| Cash & Other | 5.5% | |||
| Portfolio facts (i) | ||||
| Average Duration (d) | 6.9 | |||
| Average Effective Maturity (m) | 8.9 yrs. | |||
| Issuer country weightings (i)(x) | ||||
| United States | 34.3% | |||
| Japan | 21.8% | |||
| Italy | 9.9% | |||
| Germany | 6.8% | |||
| United Kingdom | 5.6% | |||
| Spain | 4.7% | |||
| France | 3.1% | |||
| Netherlands | 2.8% | |||
| Canada | 2.6% | |||
| Other Countries | 8.4% | |||
| Currency exposure (i)(y) | ||||
| United States Dollar | 35.7% | |||
| Japanese Yen | 27.5% | |||
| Euro | 25.7% | |||
| British Pound Sterling | 7.3% | |||
| Canadian Dollar | 1.7% | |||
| Australian Dollar | 1.0% | |||
| Danish Krone | 0.6% | |||
| Swedish Krona | 0.5% | |||
| Norwegian Krone (o) | 0.0% | |||
| Other Countries (o) | (0.0)% | |||
| (a) | For all securities other than those specifically described below, ratings are assigned to underlying securities utilizing ratings from Moody’s, Fitch, and Standard & Poor’s rating agencies and applying the following hierarchy: If all three agencies provide a rating, the middle rating (after dropping the highest and lowest ratings) is assigned; if two of the three agencies rate a security, the lower of the two is assigned. Ratings are shown in the S&P and Fitch scale (e.g., AAA). Securities rated BBB or higher are considered investment grade. All ratings are subject to change. U.S. Government includes securities issued by the U.S. Department of the Treasury. Federal Agencies includes rated and unrated U.S. Agency fixed-income securities, U.S. Agency mortgage-backed securities, and collateralized mortgage obligations of U.S. Agency mortgage-backed securities. Cash & Other includes cash, other assets less liabilities, offsets to derivative positions, and short-term securities. The fund may not hold all of these instruments. The fund is not rated by these agencies. |
| (d) | Duration is a measure of how much a bond’s price is likely to fluctuate with general changes in interest rates, e.g., if rates rise 1.00%, a bond with a 5-year duration is likely to lose about 5.00% of its value due to the interest rate move. |
| (i) | For purposes of this presentation, the components include the market value of securities, and reflect the impact of the equivalent exposure of derivative positions, if any. These amounts may be negative from time to time. The bond component will include any accrued interest amounts. Equivalent exposure is a calculated amount that translates the derivative position into a reasonable approximation of the amount of the underlying asset that the portfolio would have to hold at a given point in time to have the same price sensitivity that results from the portfolio’s ownership of the derivative contract. When dealing with derivatives, equivalent exposure is a more representative measure of the potential impact of a position on portfolio performance than market value. Where the fund holds convertible bonds, these are treated as part of the equity portion of the portfolio. |
| (m) | In determining an instrument’s effective maturity for purposes of calculating the fund’s dollar-weighted average effective maturity, MFS uses the instrument’s stated maturity or, if applicable, an earlier date on which MFS believes it is probable that a maturity-shortening device (such as a put, pre-refunding or prepayment) will cause the instrument to be repaid. Such an earlier date can be substantially shorter than the instrument’s stated maturity. |
| (o) | Less than 0.1% |
2
Table of Contents
MFS Global Governments Portfolio
Portfolio Composition – continued
| (x) | Represents the portfolio’s exposure to issuer countries as a percentage of a portfolio’s net assets. |
| (y) | Represents the portfolio’s exposure to a particular currency as a percentage of a portfolio’s net assets. |
Percentages are based on net assets as of 12/31/12.
The portfolio is actively managed and current holdings may be different.
3
Table of Contents
MFS Global Governments Portfolio
Summary of Results
For the twelve months ended December 31, 2012, Initial Class shares of the MFS Global Governments Portfolio (“fund”) provided a total return of 0.64%, while Service Class shares of the fund provided a total return of 0.33%. These compare with a return of 1.30% over the same period for the fund’s benchmark, the JPMorgan Global Government Bond Index (Unhedged).
Market Environment
The beginning of the period was characterized by a risk-on sentiment as a result of additional liquidity measures by the Federal Reserve Bank (“Fed”) and the European Central Bank (“ECB”) as well as a commensurate improvement in macroeconomic conditions. During this time, global equity valuations rose, credit spreads contracted, and high-quality sovereign yields increased modestly.
During the middle of the period, however, conditions worsened, driven by broadly weaker global macroeconomic indicators, as well as renewed concerns over the eurozone’s capacity and determination to address its ongoing crisis. Despite this deterioration, broad market sentiment remained relatively resilient as equity markets generally maintained gains and credit spreads did not indicate deterioration.
However, this renewed weakness in the fundamentals precipitated a further round of monetary easing by both the Fed (through a third round of quantitative easing) and the ECB (through a new bond purchase facility) in the second half of the period, which soon instilled additional confidence in risk markets. Nonetheless, towards the end of the period, weaker equity earnings reports and declining forward guidance caused market sentiment to soften. In addition, as we moved toward year end, the fiscal cliff negotiations between the Republicans in the U.S. Congress and President Obama were a particular source of market attention, where uncertainty surrounding the fiscal negotiations continued right up to the end-of-year deadline.
Detractors from Performance
The fund’s yield curve (y) exposure in the U.S., particularly a lesser exposure to shifts in the middle portion of the yield curve (centered around maturities of 7 years) was a negative factor for performance relative to the JPMorgan Global Government Bond Index (Unhedged) as the yield curve flattened during the reporting period.
The fund’s exposure to the euro also weakened relative results. In addition, the fund’s underweight exposure to Ireland held back relative performance.
Contributors to Performance
The portion of the fund’s return derived from yield, which was greater than that of the benchmark, contributed to performance relative to the benchmark.
An out-of-benchmark exposure to bonds in the financial sector was a positive factor for relative performance as this sector performed well over the period. Additionally, an underweight exposure to Spain, and an overweight exposure to Australia and Norway, benefited relative performance.
Respectfully,
| Matthew Ryan | Erik Weisman | |
| Portfolio Manager | Portfolio Manager |
| (y) | A yield curve graphically depicts the yields of different maturity bonds of the same credit quality and type; a normal yield curve is upward sloping, with short-term rates lower than long-term rates. |
The views expressed in this report are those of the portfolio managers only through the end of the period of the report as stated on the cover and do not necessarily reflect the views of MFS or any other person in the MFS organization. These views are subject to change at any time based on market or other conditions, and MFS disclaims any responsibility to update such views. These views may not be relied upon as investment advice or an indication of trading intent on behalf of any MFS portfolio. References to specific securities are not recommendations of such securities, and may not be representative of any MFS portfolio’s current or future investments.
4
Table of Contents
MFS Global Governments Portfolio
PERFORMANCE SUMMARY THROUGH 12/31/12
The following chart illustrates the historical performance of the fund in comparison to its benchmark(s). Benchmarks are unmanaged and may not be invested in directly. Benchmark returns do not reflect any fees or expenses. The performance of other share classes will be greater than or less than that of the class depicted below. (See Notes to Performance Summary.)
Performance data shown represents past performance and is no guarantee of future results. Investment return and principal value fluctuate so your units, when sold, may be worth more or less than the original cost; current performance may be lower or higher than quoted. The performance shown does not reflect the deduction of taxes, if any, that a contract holder would pay on fund distributions or the redemption of contract units. The returns for the fund shown also do not reflect the deduction of expenses associated with variable products, such as mortality and expense risk charges, separate account charges, and sales charges imposed by the insurance company separate accounts. Such expenses would reduce the overall returns shown.
Growth of a Hypothetical $10,000 Investment
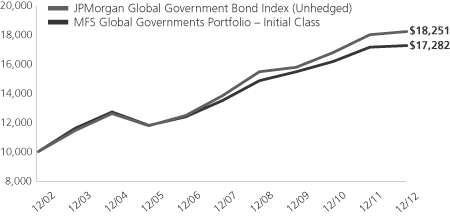
Total Returns through 12/31/12
Average annual total returns
| Share Class | Class inception date | 1-yr | 5-yr | 10-yr | ||||||||
| Initial Class | 5/16/88 | 0.64% | 5.05% | 5.62% | ||||||||
| Service Class | 8/24/01 | 0.33% | 4.79% | 5.35% | ||||||||
| Comparative benchmark | ||||||||||||
| JPMorgan Global Government Bond Index (Unhedged) (f) | 1.30% | 5.70% | 6.20% | |||||||||
| (f) | Source: FactSet Research Systems Inc. |
Benchmark Definition
JPMorgan Global Government Bond Index (Unhedged) – measures developed government bond markets around the world.
It is not possible to invest directly in an index.
Notes to Performance Summary
Average annual total return represents the average annual change in value for each share class for the periods presented.
Performance results reflect any applicable expense subsidies and waivers in effect during the periods shown. Without such subsidies and waivers the fund’s performance results would be less favorable. Please see the prospectus and financial statements for complete details. All results are historical and assume the reinvestment of any dividends and capital gains distributions.
Performance results do not include adjustments made for financial reporting purposes in accordance with U.S. generally accepted accounting principles and may differ from amounts reported in the financial highlights.
From time to time the fund may receive proceeds from litigation settlements, without which performance would be lower.
5
Table of Contents
MFS Global Governments Portfolio
Fund Expenses Borne by the Contract Holders During the Period,
July 1, 2012 through December 31, 2012
As a contract holder of the fund, you incur ongoing costs, including management fees; distribution and/or service (12b-1) fees; and other fund expenses. This example is intended to help you understand your ongoing costs (in dollars) of investing in the fund and to compare these costs with the ongoing costs of investing in other mutual funds.
The example is based on an investment of $1,000 invested at the beginning of the period and held for the entire period July 1, 2012 through December 31, 2012.
Actual Expenses
The first line for each share class in the following table provides information about actual account values and actual expenses. You may use the information in this line, together with the amount you invested, to estimate the expenses that you paid over the period. Simply divide your account value by $1,000 (for example, an $8,600 account value divided by $1,000 = 8.6), then multiply the result by the number in the first line under the heading entitled “Expenses Paid During Period” to estimate the expenses you paid on your account during this period.
Hypothetical Example for Comparison Purposes
The second line for each share class in the following table provides information about hypothetical account values and hypothetical expenses based on the fund’s actual expense ratio and an assumed rate of return of 5% per year before expenses, which is not the fund’s actual return. The hypothetical account values and expenses may not be used to estimate the actual ending account balance or expenses you paid for the period. You may use this information to compare the ongoing costs of investing in the fund and other funds. To do so, compare this 5% hypothetical example with the 5% hypothetical examples that appear in the shareholder reports of the other funds.
Please note that the expenses shown in the table are meant to highlight the fund’s ongoing costs only and do not take into account the fees and expenses imposed under the variable contracts through which your investment in the fund is made. Therefore, the second line for each share class in the table is useful in comparing ongoing costs associated with an investment in vehicles (such as the fund) which fund benefits under variable annuity and variable life insurance contracts and to qualified pension and retirement plans only, and will not help you determine the relative total costs of investing in the fund through variable annuity and variable life insurance contracts. If the fees and expenses imposed under the variable contracts were included, your costs would have been higher.
| Share Class | Annualized Expense Ratio | Beginning Account Value 7/01/12 | Ending Account Value 12/31/12 | Expenses Paid During Period (p) 7/01/12-12/31/12 | ||||||||||||||
| Initial Class | Actual | 0.97% | $1,000.00 | $1,007.31 | $4.89 | |||||||||||||
| Hypothetical (h) | 0.97% | $1,000.00 | $1,020.26 | $4.93 | ||||||||||||||
| Service Class | Actual | 1.24% | $1,000.00 | $1,005.14 | $6.25 | |||||||||||||
| Hypothetical (h) | 1.24% | $1,000.00 | $1,018.90 | $6.29 | ||||||||||||||
| (h) | 5% class return per year before expenses. |
| (p) | Expenses paid are equal to each class’s annualized expense ratio, as shown above, multiplied by the average account value over the period, multiplied by the number of days in the period, divided by the number of days in the year. |
6
Table of Contents
MFS Global Governments Portfolio
PORTFOLIO OF INVESTMENTS – 12/31/12
The Portfolio of Investments is a complete list of all securities owned by your fund. It is categorized by broad-based asset classes.
| Issuer | Shares/Par | Value ($) | ||||||
| BONDS – 93.5% | ||||||||
| Foreign Bonds – 65.0% | ||||||||
| Australia – 1.7% | ||||||||
| Commonwealth of Australia, 5.75%, 2021 | AUD | 3,162,000 | $ | 3,911,463 | ||||
|
| |||||||
| Belgium – 1.3% | ||||||||
| Kingdom of Belgium, 4.25%, 2021 | EUR | 1,857,000 | $ | 2,927,407 | ||||
|
| |||||||
| Canada – 2.6% | ||||||||
| Bayview Commercial Asset Trust, FRN, 1.725%, 2023 (z) | CAD | 180,000 | $ | 173,996 | ||||
| Government of Canada, 4.5%, 2015 | CAD | 2,570,000 | 2,788,064 | |||||
| Government of Canada, 4.25%, 2018 | CAD | 12,000 | 13,825 | |||||
| Government of Canada, 3.25%, 2021 | CAD | 924,000 | 1,040,914 | |||||
| Government of Canada, 5.75%, 2033 | CAD | 1,262,000 | 1,969,872 | |||||
|
| |||||||
| $ | 5,986,671 | |||||||
|
| |||||||
| Denmark – 1.5% | ||||||||
| Kingdom of Denmark, 3%, 2021 | DKK | 17,146,000 | $ | 3,528,706 | ||||
|
| |||||||
| Finland – 0.4% | ||||||||
| Republic of Finland, 4%, 2025 | EUR | 507,000 | $ | 834,556 | ||||
|
| |||||||
| France – 3.1% | ||||||||
| Republic of France, 6%, 2025 | EUR | 1,428,000 | $ | 2,656,941 | ||||
| Republic of France, 4.75%, 2035 | EUR | 2,505,000 | 4,331,485 | |||||
|
| |||||||
| $ | 6,988,426 | |||||||
|
| |||||||
| Germany – 6.6% | ||||||||
| Federal Republic of Germany, 3.75%, 2013 | EUR | 1,244,000 | $ | 1,671,936 | ||||
| Federal Republic of Germany, 3.75%, 2015 | EUR | 4,516,000 | 6,409,759 | |||||
| Federal Republic of Germany, 4.25%, 2018 | EUR | 1,521,000 | 2,424,312 | |||||
| Federal Republic of Germany, 3.25%, 2021 | EUR | 1,287,000 | 1,996,686 | |||||
| Federal Republic of Germany, 6.25%, 2030 | EUR | 1,234,000 | 2,630,789 | |||||
|
| |||||||
| $ | 15,133,482 | |||||||
|
| |||||||
| Ireland – 0.5% | ||||||||
| Republic of Ireland, 5.5%, 2017 | EUR | 800,000 | $ | 1,153,370 | ||||
|
| |||||||
| Italy – 9.7% | ||||||||
| Republic of Italy, 4.25%, 2015 | EUR | 3,440,000 | $ | 4,735,878 | ||||
| Republic of Italy, 5.25%, 2017 | EUR | 9,746,000 | 13,989,090 | |||||
| Republic of Italy, 3.75%, 2021 | EUR | 2,747,000 | 3,564,990 | |||||
|
| |||||||
| $ | 22,289,958 | |||||||
|
| |||||||
| Japan – 21.7% | ||||||||
| Government of Japan, 1.7%, 2017 | JPY | 1,210,450,000 | $ | 14,878,873 | ||||
| Government of Japan, 1.1%, 2020 | JPY | 731,200,000 | 8,822,787 | |||||
| Government of Japan, 2.1%, 2024 | JPY | 671,550,000 | 8,715,097 | |||||
| Government of Japan, 2.2%, 2027 | JPY | 819,900,000 | 10,591,232 | |||||
| Government of Japan, 2.4%, 2037 | JPY | 527,000,000 | 6,705,653 | |||||
|
| |||||||
| $ | 49,713,642 | |||||||
|
| |||||||
| Issuer | Shares/Par | Value ($) | ||||||
| BONDS – continued | ||||||||
| Foreign Bonds – continued | ||||||||
| Netherlands – 2.7% | ||||||||
| ABN AMRO Bank N.V., FRN, 2.083%, 2014 (n) | $ | 200,000 | $ | 202,318 | ||||
| Kingdom of the Netherlands, 3.75%, 2014 | EUR | 3,510,000 | 4,894,807 | |||||
| Kingdom of the Netherlands, 5.5%, 2028 | EUR | 622,000 | 1,194,490 | |||||
|
| |||||||
| $ | 6,291,615 | |||||||
|
| |||||||
| New Zealand – 0.5% | ||||||||
| Government of New Zealand, 6%, 2021 | NZD | 1,049,000 | $ | 1,030,480 | ||||
|
| |||||||
| Norway – 0.7% | ||||||||
| Eksportfinans A.S.A., 1.875%, 2013 | $ | 205,000 | $ | 204,804 | ||||
| Government of Norway, 3.75%, 2021 | NOK | 6,790,000 | 1,392,197 | |||||
|
| |||||||
| $ | 1,597,001 | |||||||
|
| |||||||
| Spain – 4.6% | ||||||||
| Kingdom of Spain, 4%, 2015 | EUR | 4,679,000 | $ | 6,288,330 | ||||
| Kingdom of Spain, 5.5%, 2017 | EUR | 1,332,000 | 1,861,731 | |||||
| Kingdom of Spain, 4.6%, 2019 | EUR | 1,795,000 | 2,366,677 | |||||
|
| |||||||
| $ | 10,516,738 | |||||||
|
| |||||||
| Sweden – 1.8% | ||||||||
| Kingdom of Sweden, 5%, 2020 | SEK | 20,650,000 | $ | 4,023,047 | ||||
|
| |||||||
| United Kingdom – 5.6% | ||||||||
| United Kingdom Treasury, 8%, 2021 | GBP | 926,100 | $ | 2,283,654 | ||||
| United Kingdom Treasury, 4.25%, 2027 | GBP | 2,182,000 | 4,395,561 | |||||
| United Kingdom Treasury, 4.25%, 2036 | GBP | 3,051,000 | 6,068,665 | |||||
|
| |||||||
| $ | 12,747,880 | |||||||
|
| |||||||
| Total Foreign Bonds | $ | 148,674,442 | ||||||
|
| |||||||
| U.S. Bonds – 28.5% | ||||||||
| Asset-Backed & Securitized – 0.0% | ||||||||
| Commercial Mortgage Asset Trust, FRN, 0.646%, 2032 (i)(z) | $ | 3,996,431 | $ | 21,173 | ||||
First Union National Bank Commercial Mortgage Trust, FRN, 1.583%, 2043 (i)(z) | 271,574 | 356 | ||||||
|
| |||||||
| $ | 21,529 | |||||||
|
| |||||||
| Mortgage-Backed – 0.4% | ||||||||
| Fannie Mae, 4.78%, 2015 | $ | 87,976 | $ | 94,672 | ||||
| Fannie Mae, 4.856%, 2015 | 42,325 | 45,508 | ||||||
| Fannie Mae, 5.5%, 2015 | 47,334 | 50,710 | ||||||
| Fannie Mae, 5.09%, 2016 | 84,000 | 93,192 | ||||||
| Fannie Mae, 5.424%, 2016 | 86,686 | 97,322 | ||||||
| Fannie Mae, 5.05%, 2017 | 51,871 | 57,705 | ||||||
| Fannie Mae, 5.16%, 2018 | 136,738 | 149,885 | ||||||
| Fannie Mae, 5.1%, 2019 | 62,015 | 70,994 | ||||||
7
Table of Contents
MFS Global Governments Portfolio
Portfolio of Investments – continued
| Issuer | Shares/Par | Value ($) | ||||||
| BONDS – continued | ||||||||
| U.S. Bonds – continued | ||||||||
| Mortgage-Backed – continued | ||||||||
| Fannie Mae, 5.18%, 2019 | $ | 62,062 | $ | 71,245 | ||||
| Fannie Mae, 6.16%, 2019 | 43,803 | 49,958 | ||||||
| Freddie Mac, 3.882%, 2017 | 89,000 | 100,019 | ||||||
| Freddie Mac, 5.085%, 2019 | 43,000 | 50,975 | ||||||
|
| |||||||
| $ | 932,185 | |||||||
|
| |||||||
| U.S. Government Agencies and Equivalents – 0.3% | ||||||||
| Aid-Egypt, 4.45%, 2015 | $ | 301,000 | $ | 333,273 | ||||
| Small Business Administration, 4.57%, 2025 | 22,020 | 24,545 | ||||||
| Small Business Administration, 5.09%, 2025 | 24,525 | 27,582 | ||||||
| Small Business Administration, 5.21%, 2026 | 362,276 | 407,041 | ||||||
|
| |||||||
| $ | 792,441 | |||||||
|
| |||||||
| U.S. Treasury Obligations – 27.8% | ||||||||
| U.S. Treasury Bonds, 6.875%, 2025 | $ | 4,355,000 | $ | 6,707,379 | ||||
| U.S. Treasury Bonds, 5.25%, 2029 | 701,000 | 970,776 | ||||||
| U.S. Treasury Bonds, 4.5%, 2039 | 5,931,400 | 7,860,030 | ||||||
| Issuer | Shares/Par | Value ($) | ||||||
| BONDS – continued | ||||||||
| U.S. Bonds – continued | ||||||||
| U.S. Treasury Obligations – continued | ||||||||
| U.S. Treasury Notes, 4.125%, 2015 | $ | 17,544,000 | $ | 19,121,592 | ||||
| U.S. Treasury Notes, 4.75%, 2017 | 12,625,000 | 14,989,233 | ||||||
| U.S. Treasury Notes, 3.5%, 2020 | 11,998,000 | 13,929,870 | ||||||
|
| |||||||
| $ | 63,578,880 | |||||||
|
| |||||||
| Total U.S. Bonds | $ | 65,325,035 | ||||||
|
| |||||||
| Total Bonds (Identified Cost, $211,933,669) | $ | 213,999,477 | ||||||
|
| |||||||
| MONEY MARKET FUNDS – 4.9% | ||||||||
| MFS Institutional Money Market Portfolio, 0.16%, at Cost and Net Asset Value (v) | 11,270,805 | $ | 11,270,805 | |||||
|
| |||||||
| Total Investments (Identified Cost, $223,204,474) | $ | 225,270,282 | ||||||
|
| |||||||
| OTHER ASSETS, LESS LIABILITIES – 1.6% | 3,665,551 | |||||||
|
| |||||||
| Net Assets – 100.0% | $ | 228,935,833 | ||||||
|
| |||||||
| (i) | Interest only security for which the fund receives interest on notional principal (Par amount). Par amount shown is the notional principal and does not reflect the cost of the security. |
| (n) | Securities exempt from registration under Rule 144A of the Securities Act of 1933. These securities may be sold in the ordinary course of business in transactions exempt from registration, normally to qualified institutional buyers. At period end, the aggregate value of these securities was $202,318, representing 0.1% of net assets. |
| (v) | Underlying affiliated fund that is available only to investment companies managed by MFS. The rate quoted for the MFS Institutional Money Market Portfolio is the annualized seven-day yield of the fund at period end. |
| (z) | Restricted securities are not registered under the Securities Act of 1933 and are subject to legal restrictions on resale. These securities generally may be resold in transactions exempt from registration or to the public if the securities are subsequently registered. Disposal of these securities may involve time-consuming negotiations and prompt sale at an acceptable price may be difficult. The fund holds the following restricted securities: |
| Restricted Securities | Acquisition Date | Cost | Value | |||||||
| Bayview Commercial Asset Trust, FRN, 1.725%, 2023 | 5/25/06 | $180,261 | $173,996 | |||||||
| Commercial Mortgage Asset Trust, FRN, 0.646%, 2032 | 8/25/03-12/02/11 | 23,264 | 21,173 | |||||||
| First Union National Bank Commercial Mortgage Trust, FRN, 1.583%, 2043 | 12/11/03-11/30/11 | 321 | 356 | |||||||
| Total Restricted Securities | $195,525 | |||||||||
| % of Net assets | 0.1% | |||||||||
The following abbreviations are used in this report and are defined:
| FRN | Floating Rate Note. Interest rate resets periodically and may not be the rate reported at period end. |
Abbreviations indicate amounts shown in currencies other than the U.S. dollar. All amounts are stated in U.S. dollars unless otherwise indicated. A list of abbreviations is shown below:
| AUD | Australian Dollar |
| CAD | Canadian Dollar |
| DKK | Danish Krone |
| EUR | Euro |
| GBP | British Pound |
| JPY | Japanese Yen |
| MXN | Mexican Peso |
| NOK | Norwegian Krone |
| NZD | New Zealand Dollar |
| SEK | Swedish Krona |
8
Table of Contents
MFS Global Governments Portfolio
Portfolio of Investments – continued
Derivative Contracts at 12/31/12
Forward Foreign Currency Exchange Contracts at 12/31/12
| Type | Currency | Counterparty | Contracts to Deliver/Receive | Settlement Date Range | In Exchange For | Contracts at Value | Net Unrealized Appreciation (Depreciation) | |||||||||||||||||
| Asset Derivatives | ||||||||||||||||||||||||
| BUY | AUD | Deutsche Bank AG | 8,000 | 1/11/13 | $ | 8,295 | $ | 8,303 | $ | 8 | ||||||||||||||
| SELL | AUD | Barclays Bank PLC | 1,256,000 | 1/11/13 | 1,307,779 | 1,303,519 | 4,260 | |||||||||||||||||
| SELL | AUD | Goldman Sachs International | 42,000 | 1/11/13 | 43,878 | 43,589 | 289 | |||||||||||||||||
| BUY | CAD | Credit Suisse Group | 102,000 | 1/11/13 | 102,509 | 102,525 | 16 | |||||||||||||||||
| SELL | CAD | Merrill Lynch International Bank | 448,235 | 1/11/13 | 456,968 | 450,543 | 6,425 | |||||||||||||||||
| BUY | DKK | Deutsche Bank AG | 59,000 | 1/11/13 | 10,117 | 10,439 | 322 | |||||||||||||||||
| BUY | EUR | Deutsche Bank AG | 170,190 | 1/11/13 | 219,295 | 224,657 | 5,362 | |||||||||||||||||
| BUY | EUR | Goldman Sachs International | 52,024 | 1/11/13 | 68,345 | 68,674 | 329 | |||||||||||||||||
| BUY | EUR | JPMorgan Chase Bank N.A. | 53,079 | 1/11/13 | 68,404 | 70,067 | 1,663 | |||||||||||||||||
| BUY | EUR | UBS AG | 746,537 | 1/11/13 | 965,303 | 985,460 | 20,157 | |||||||||||||||||
| BUY | GBP | Barclays Bank PLC | 209,440 | 1/11/13 | 335,255 | 340,218 | 4,963 | |||||||||||||||||
| BUY | GBP | Deutsche Bank AG | 157,440 | 1/11/13 | 251,654 | 255,749 | 4,095 | |||||||||||||||||
| BUY | GBP | UBS AG | 2,016,000 | 1/11/13 | 3,228,484 | 3,274,820 | 46,336 | |||||||||||||||||
| SELL | JPY | Barclays Bank PLC | 25,494,000 | 1/11/13 | 296,631 | 294,279 | 2,352 | |||||||||||||||||
| SELL | JPY | Citibank N.A. | 116,085,000 | 1/11/13 | 1,413,251 | 1,339,976 | 73,275 | |||||||||||||||||
| SELL | JPY | Credit Suisse Group | 35,275,000 | 1/11/13 | 426,308 | 407,181 | 19,127 | |||||||||||||||||
| SELL | JPY | Goldman Sachs International | 5,872,000 | 1/11/13 | 72,115 | 67,781 | 4,334 | |||||||||||||||||
| SELL | JPY | Merrill Lynch International Bank | 46,098,000 | 1/11/13 | 538,706 | 532,112 | 6,594 | |||||||||||||||||
| SELL | JPY | UBS AG | 13,731,000 | 1/11/13 | 164,556 | 158,498 | 6,058 | |||||||||||||||||
| BUY | SEK | Citibank N.A. | 1,368,000 | 1/11/13 | 207,492 | 210,320 | 2,828 | |||||||||||||||||
| BUY | SEK | Credit Suisse Group | 68,000 | 1/11/13 | 10,322 | 10,455 | 133 | |||||||||||||||||
|
| |||||||||||||||||||||||
| $ | 208,926 | |||||||||||||||||||||||
|
| |||||||||||||||||||||||
| Liability Derivatives | ||||||||||||||||||||||||
| BUY | AUD | Barclays Bank PLC | 13,000 | 1/11/13 | $ | 13,497 | $ | 13,492 | $ | (5 | ) | |||||||||||||
| SELL | AUD | Barclays Bank PLC | 5,000 | 1/11/13 | 5,168 | 5,189 | (21 | ) | ||||||||||||||||
| SELL | AUD | Westpac Bank Corp. | 239,068 | 1/11/13 | 242,494 | 248,113 | (5,619 | ) | ||||||||||||||||
| BUY | CAD | Merrill Lynch International Bank | 16,000 | 1/11/13 | 16,259 | 16,082 | (177 | ) | ||||||||||||||||
| SELL | CAD | UBS AG | 1,695,000 | 1/11/13 | 1,702,643 | 1,703,728 | (1,085 | ) | ||||||||||||||||
| SELL | DKK | Citibank N.A. | 1,630,543 | 1/11/13 | 285,990 | 288,507 | (2,517 | ) | ||||||||||||||||
| SELL | DKK | Credit Suisse Group | 181,000 | 1/11/13 | 31,202 | 32,026 | (824 | ) | ||||||||||||||||
| SELL | DKK | Deutsche Bank AG | 10,946,000 | 1/11/13 | 1,899,968 | 1,936,780 | (36,812 | ) | ||||||||||||||||
| SELL | DKK | Goldman Sachs International | 51,000 | 1/11/13 | 8,708 | 9,024 | (316 | ) | ||||||||||||||||
| BUY | EUR | Goldman Sachs International | 71,000 | 1/11/13 | 94,034 | 93,723 | (311 | ) | ||||||||||||||||
| SELL | EUR | Barclays Bank PLC | 574,289 | 1/11/13 | 739,990 | 758,085 | (18,095 | ) | ||||||||||||||||
| SELL | EUR | Citibank N.A. | 42,000 | 1/11/13 | 54,220 | 55,442 | (1,222 | ) | ||||||||||||||||
| SELL | EUR | Credit Suisse Group | 91,000 | 1/11/13 | 118,041 | 120,124 | (2,083 | ) | ||||||||||||||||
| SELL | EUR | Deutsche Bank AG | 4,543,000 | 1/11/13 | 5,877,467 | 5,996,945 | (119,478 | ) | ||||||||||||||||
| SELL | EUR | UBS AG | 2,233,232 | 1/11/13-3/18/13 | 2,911,690 | 2,949,015 | (37,325 | ) | ||||||||||||||||
| SELL | GBP | Credit Suisse Group | 23,000 | 1/11/13 | 36,619 | 37,362 | (743 | ) | ||||||||||||||||
| SELL | GBP | Deutsche Bank AG | 6,000 | 1/11/13 | 9,540 | 9,746 | (206 | ) | ||||||||||||||||
| BUY | JPY | Citibank N.A. | 8,777,000 | 1/11/13 | 106,606 | 101,313 | (5,293 | ) | ||||||||||||||||
| BUY | JPY | Credit Suisse Group | 88,550,797 | 1/11/13 | 1,132,432 | 1,022,147 | (110,285 | ) | ||||||||||||||||
| BUY | JPY | Deutsche Bank AG | 983,569,000 | 1/11/13 | 11,978,602 | 11,353,396 | (625,206 | ) | ||||||||||||||||
| BUY | JPY | Merrill Lynch International Bank | 101,918,638 | 1/11/13 | 1,300,682 | 1,176,453 | (124,229 | ) | ||||||||||||||||
| BUY | JPY | UBS AG | 192,704,818 | 1/11/13 | 2,239,847 | 2,224,403 | (15,444 | ) | ||||||||||||||||
| SELL | MXN | Citibank N.A. | 500 | 1/14/13 | 39 | 39 | — | |||||||||||||||||
| SELL | MXN | UBS AG | 500 | 1/14/13 | 38 | 39 | (1 | ) | ||||||||||||||||
| SELL | NOK | Deutsche Bank AG | 7,878,391 | 1/11/13 | 1,380,413 | 1,417,139 | (36,726 | ) | ||||||||||||||||
| SELL | NZD | Deutsche Bank AG | 1,078,465 | 1/11/13 | 882,004 | 890,838 | (8,834 | ) | ||||||||||||||||
9
Table of Contents
MFS Global Governments Portfolio
Portfolio of Investments – continued
Derivative Contracts at 12/31/12 – continued
| Type | Currency | Counterparty | Contracts to Deliver/Receive | Settlement Date Range | In Exchange For | Contracts at Value | Net Unrealized Appreciation (Depreciation) | |||||||||||||||||
| Liability Derivatives – continued | ||||||||||||||||||||||||
| SELL | NZD | Westpac Bank Corp. | 180,912 | 1/11/13 | $ | 147,319 | $ | 149,438 | $ | (2,119 | ) | |||||||||||||
| SELL | SEK | Deutsche Bank AG | 21,016,874 | 1/11/13 | 3,138,145 | 3,231,193 | (93,048 | ) | ||||||||||||||||
| SELL | SEK | UBS AG | 81,000 | 1/11/13 | 12,070 | 12,453 | (383 | ) | ||||||||||||||||
|
| |||||||||||||||||||||||
| $ | (1,248,407 | ) | ||||||||||||||||||||||
|
| |||||||||||||||||||||||
At December 31, 2012, the series had sufficient cash and/or securities to cover any commitments under these derivative contracts.
See Notes to Financial Statements
10
Table of Contents
MFS Global Governments Portfolio
FINANCIAL STATEMENTS | STATEMENT OF ASSETS AND LIABILITIES
This statement represents your fund’s balance sheet, which details the assets and liabilities comprising the total value of the fund.
At 12/31/12 | ||||||||
Assets | ||||||||
Investments – | ||||||||
Non-affiliated issuers, at value (identified cost, $211,933,669) | $213,999,477 | |||||||
Underlying affiliated funds, at cost and value | 11,270,805 | |||||||
Total investments, at value (identified cost, $223,204,474) | $225,270,282 | |||||||
Receivables for | ||||||||
Forward foreign currency exchange contracts | 208,926 | |||||||
Investments sold | 2,239,790 | |||||||
Fund shares sold | 265,236 | |||||||
Interest | 2,355,364 | |||||||
Other assets | 695 | |||||||
Total assets | $230,340,293 | |||||||
Liabilities | ||||||||
Payables for | ||||||||
Forward foreign currency exchange contracts | $1,248,407 | |||||||
Fund shares reacquired | 65,269 | |||||||
Payable to affiliates | ||||||||
Investment adviser | 49,483 | |||||||
Distribution and/or service fees | 62 | |||||||
Payable for independent Trustees’ compensation | 23 | |||||||
Accrued expenses and other liabilities | 41,216 | |||||||
Total liabilities | $1,404,460 | |||||||
Net assets | $228,935,833 | |||||||
Net assets consist of | ||||||||
Paid-in capital | $228,400,293 | |||||||
Unrealized appreciation (depreciation) on investments and translation of assets and liabilities in foreign currencies | 1,039,507 | |||||||
Accumulated net realized gain (loss) on investments and foreign currency | (1,087,182 | ) | ||||||
Undistributed net investment income | 583,215 | |||||||
Net assets | $228,935,833 | |||||||
Shares of beneficial interest outstanding | 20,764,898 |
| Net assets | Shares outstanding | Net asset value per share | ||||||||||
Initial Class | $226,668,011 | 20,556,349 | $11.03 | |||||||||
Service Class | 2,267,822 | 208,549 | 10.87 | |||||||||
See Notes to Financial Statements
11
Table of Contents
MFS Global Governments Portfolio
FINANCIAL STATEMENTS | STATEMENT OF OPERATIONS
This statement describes how much your fund earned in investment income and accrued in expenses. It also describes any gains and/or losses generated by fund operations.
| Year ended 12/31/12 | ||||||||
Net investment income | ||||||||
Income | ||||||||
Interest | $1,031,183 | |||||||
Dividends from underlying affiliated funds | 4,372 | |||||||
Total investment income | $1,035,555 | |||||||
Expenses | ||||||||
Management fee | $400,210 | |||||||
Distribution and/or service fees | 6,050 | |||||||
Administrative services fee | 19,563 | |||||||
Independent Trustees’ compensation | 1,684 | |||||||
Custodian fee | 22,799 | |||||||
Shareholder communications | 7,389 | |||||||
Audit and tax fees | 60,056 | |||||||
Legal fees | 925 | |||||||
Miscellaneous | 11,713 | |||||||
Total expenses | $530,389 | |||||||
Fees paid indirectly | (15 | ) | ||||||
Reduction of expenses by investment adviser | (127 | ) | ||||||
Net expenses | $530,247 | |||||||
Net investment income | $505,308 | |||||||
Realized and unrealized gain (loss) on investments and foreign currency | ||||||||
Realized gain (loss) (identified cost basis) | ||||||||
Investments | $(6,494 | ) | ||||||
Foreign currency | (316,045 | ) | ||||||
Net realized gain (loss) on investments and foreign currency | $(322,539 | ) | ||||||
Change in unrealized appreciation (depreciation) | ||||||||
Investments | $(647,059 | ) | ||||||
Translation of assets and liabilities in foreign currencies | (957,221 | ) | ||||||
Net unrealized gain (loss) on investments and foreign currency translation | $(1,604,280 | ) | ||||||
Net realized and unrealized gain (loss) on investments and foreign currency | $(1,926,819 | ) | ||||||
Change in net assets from operations | $(1,421,511 | ) |
See Notes to Financial Statements
12
Table of Contents
MFS Global Governments Portfolio
FINANCIAL STATEMENTS | STATEMENTS OF CHANGES IN NET ASSETS
These statements describe the increases and/or decreases in net assets resulting from operations, any distributions, and any shareholder transactions.
For years ended 12/31 | 2012 | 2011 | ||||||
Change in net assets | ||||||||
From operations | ||||||||
Net investment income | $505,308 | $505,450 | ||||||
Net realized gain (loss) on investments and foreign currency | (322,539 | ) | 485,865 | |||||
Net unrealized gain (loss) on investments and foreign currency translation | (1,604,280 | ) | 890,990 | |||||
Change in net assets from operations | $(1,421,511 | ) | $1,882,305 | |||||
Distributions declared to shareholders | ||||||||
From net investment income | $(996,242 | ) | $(707,802 | ) | ||||
From net realized gain on investments | — | (327,622 | ) | |||||
From tax return of capital | (3,795 | ) | — | |||||
Total distributions declared to shareholders | $(1,000,037 | ) | $(1,035,424 | ) | ||||
Change in net assets from fund share transactions | $194,488,112 | $2,882,411 | ||||||
Total change in net assets | $192,066,564 | $3,729,292 | ||||||
Net assets | ||||||||
At beginning of period | 36,869,269 | 33,139,977 | ||||||
At end of period (including undistributed net investment income of $583,215 and | $228,935,833 | $36,869,269 |
See Notes to Financial Statements
13
Table of Contents
MFS Global Governments Portfolio
FINANCIAL STATEMENTS | FINANCIAL HIGHLIGHTS
The financial highlights table is intended to help you understand the fund’s financial performance for the past 5 years. Certain information reflects financial results for a single fund share. The total returns in the table represent the rate by which an investor would have earned (or lost) on an investment in the fund share class (assuming reinvestment of all distributions) held for the entire period.
| Initial Class | Years ended 12/31 | |||||||||||||||||||
| 2012 | 2011 | 2010 | 2009 | 2008 | ||||||||||||||||
Net asset value, beginning of period | $11.29 | $11.00 | $10.60 | $11.59 | $11.43 | |||||||||||||||
| Income (loss) from investment operations | ||||||||||||||||||||
Net investment income (d) | $0.11 | $0.18 | $0.18 | $0.22 | $0.26 | |||||||||||||||
Net realized and unrealized gain (loss) on investments | (0.04 | ) | 0.49 | 0.30 | 0.13 | 0.84 | ||||||||||||||
Total from investment operations | $0.07 | $0.67 | $0.48 | $0.35 | $1.10 | |||||||||||||||
| Less distributions declared to shareholders | ||||||||||||||||||||
From net investment income | $(0.33 | ) | $(0.26 | ) | $— | $(1.34 | ) | $(0.94 | ) | |||||||||||
From net realized gain on investments | — | (0.12 | ) | (0.08 | ) | — | — | |||||||||||||
From tax return of capital | (0.00 | )(w) | — | — | — | — | ||||||||||||||
Total distributions declared to shareholders | $(0.33 | ) | $(0.38 | ) | $(0.08 | ) | $(1.34 | ) | $(0.94 | ) | ||||||||||
Net asset value, end of period (x) | $11.03 | $11.29 | $11.00 | $10.60 | $11.59 | |||||||||||||||
Total return (%) (k)(r)(s)(x) | 0.64 | 6.06 | 4.61 | 4.06 | 10.12 | |||||||||||||||
| Ratios (%) (to average net assets) and Supplemental data: | ||||||||||||||||||||
Expenses before expense reductions (f) | 0.98 | 1.14 | 1.15 | 1.16 | 1.09 | |||||||||||||||
Expenses after expense reductions (f) | 0.98 | 1.00 | 1.00 | 1.00 | 1.00 | |||||||||||||||
Net investment income | 0.96 | 1.59 | 1.64 | 2.08 | 2.31 | |||||||||||||||
Portfolio turnover | 15 | 70 | 66 | 84 | 113 | |||||||||||||||
Net assets at end of period (000 omitted) | $226,668 | $34,252 | $30,047 | $32,034 | $36,813 | |||||||||||||||
See Notes to Financial Statements
14
Table of Contents
MFS Global Governments Portfolio
Financial Highlights – continued
| Service Class | Years ended 12/31 | |||||||||||||||||||
| 2012 | 2011 | 2010 | 2009 | 2008 | ||||||||||||||||
Net asset value, beginning of period | $11.13 | $10.85 | $10.48 | $11.47 | $11.32 | |||||||||||||||
| Income (loss) from investment operations | ||||||||||||||||||||
Net investment income (d) | $0.08 | $0.15 | $0.15 | $0.19 | $0.23 | |||||||||||||||
Net realized and unrealized gain (loss) on investments | (0.04 | ) | 0.48 | 0.30 | 0.12 | 0.84 | ||||||||||||||
Total from investment operations | $0.04 | $0.63 | $0.45 | $0.31 | $1.07 | |||||||||||||||
| Less distributions declared to shareholders | ||||||||||||||||||||
From net investment income | $(0.30 | ) | $(0.23 | ) | $— | $(1.30 | ) | $(0.92 | ) | |||||||||||
From net realized gain on investments | — | (0.12 | ) | (0.08 | ) | — | — | |||||||||||||
From tax return of capital | (0.00 | )(w) | — | — | — | — | ||||||||||||||
Total distributions declared to shareholders | $(0.30 | ) | $(0.35 | ) | $(0.08 | ) | $(1.30 | ) | $(0.92 | ) | ||||||||||
Net asset value, end of period (x) | $10.87 | $11.13 | $10.85 | $10.48 | $11.47 | |||||||||||||||
Total return (%) (k)(r)(s)(x) | 0.33 | 5.75 | 4.38 | 3.77 | 9.93 | |||||||||||||||
| Ratios (%) (to average net assets) and Supplemental data: | ||||||||||||||||||||
Expenses before expense reductions (f) | 1.25 | 1.39 | 1.40 | 1.41 | 1.35 | |||||||||||||||
Expenses after expense reductions (f) | 1.25 | 1.25 | 1.25 | 1.25 | 1.25 | |||||||||||||||
Net investment income | 0.71 | 1.34 | 1.39 | 1.78 | 2.03 | |||||||||||||||
Portfolio turnover | 15 | 70 | 66 | 84 | 113 | |||||||||||||||
Net assets at end of period (000 omitted) | $2,268 | $2,617 | $3,093 | $3,573 | $6,371 | |||||||||||||||
| (d) | Per share data is based on average shares outstanding. |
| (f) | Ratios do not reflect reductions from fees paid indirectly, if applicable. |
| (k) | The total return does not reflect expenses that apply to separate accounts. Inclusion of these charges would reduce the total return figures for all periods shown. |
| (r) | Certain expenses have been reduced without which performance would have been lower. |
| (s) | From time to time the fund may receive proceeds from litigation settlements, without which performance would be lower. |
| (w) | Per share amount was less than $0.01. |
| (x) | The net asset values per share and total returns have been calculated on net assets which include adjustments made in accordance with U.S. generally accepted accounting principles required at period end for financial reporting purposes. |
See Notes to Financial Statements
15
Table of Contents
MFS Global Governments Portfolio
| (1) | Business and Organization |
MFS Global Governments Portfolio (the fund) is a series of MFS Variable Insurance Trust II (the trust). The trust is organized as a Massachusetts business trust and is registered under the Investment Company Act of 1940, as amended, as an open-end management investment company. The shareholders of each series of the trust are separate accounts of insurance companies, which offer variable annuity and/or life insurance products, and qualified retirement and pension plans.
| (2) | Significant Accounting Policies |
General – The preparation of financial statements in conformity with U.S. generally accepted accounting principles requires management to make estimates and assumptions that affect the reported amounts of assets and liabilities, and disclosure of contingent assets and liabilities at the date of the financial statements and the reported amounts of revenues and expenses during the reporting period. Actual results could differ from those estimates. In the preparation of these financial statements, management has evaluated subsequent events occurring after the date of the fund’s Statement of Assets and Liabilities through the date that the financial statements were issued. The fund invests in foreign securities. Investments in foreign securities are vulnerable to the effects of changes in the relative values of the local currency and the U.S. dollar and to the effects of changes in each country’s legal, political, and economic environment.
In this reporting period the fund adopted Financial Accounting Standards Board (FASB) Accounting Standards Update 2011-04, Fair Value Measurement (Topic 820) – Amendments to Achieve Common Fair Value Measurement and Disclosure Requirements in U.S. GAAP and IFRSs (“ASU 2011-04”). ASU 2011-04 seeks to improve the comparability of fair value measurements as presented and disclosed in financial statements prepared in accordance with U.S. GAAP and International Financial Reporting Standards (IFRS) by providing common requirements for fair value measurement and disclosure.
In December 2011, the FASB issued Accounting Standards Update 2011-11, Balance Sheet (Topic 210) – Disclosures about Offsetting Assets and Liabilities (“ASU 2011-11”). Effective for annual reporting periods beginning on or after January 1, 2013 and interim periods within those annual periods, ASU 2011-11 is intended to enhance disclosure requirements on the offsetting of financial assets and liabilities. Although still evaluating the potential impacts of ASU 2011-11 to the fund, management expects that the impact of the fund’s adoption will be limited to additional financial statement disclosures.
Investment Valuations – Debt instruments and floating rate loans (other than short-term instruments), including restricted debt instruments, are generally valued at an evaluated or composite bid as provided by a third-party pricing service. Short-term instruments with a maturity at issuance of 60 days or less generally are valued at amortized cost, which approximates market value. Forward foreign currency exchange contracts are generally valued at the mean of bid and asked prices for the time period interpolated from rates provided by a third-party pricing service for proximate time periods. Open-end investment companies are generally valued at net asset value per share. Securities and other assets generally valued on the basis of information from a third-party pricing service may also be valued at a broker/dealer bid quotation. Values obtained from third-party pricing services can utilize both transaction data and market information such as yield, quality, coupon rate, maturity, type of issue, trading characteristics, and other market data. The values of foreign securities and other assets and liabilities expressed in foreign currencies are converted to U.S. dollars using the mean of bid and asked prices for rates provided by a third-party pricing service.
The Board of Trustees has delegated primary responsibility for determining or causing to be determined the value of the fund’s investments (including any fair valuation) to the adviser pursuant to valuation policies and procedures approved by the Board. If the adviser determines that reliable market quotations are not readily available, investments are valued at fair value as determined in good faith by the adviser in accordance with such procedures under the oversight of the Board of Trustees. Under the fund’s valuation policies and procedures, market quotations are not considered to be readily available for most types of debt instruments and floating rate loans and many types of derivatives. These investments are generally valued at fair value based on information from third-party pricing services. In addition, investments may be valued at fair value if the adviser determines that an investment’s value has been materially affected by events occurring after the close of the exchange or market on which the investment is principally traded (such as foreign exchange or market) and prior to the determination of the fund’s net asset value, or after the halting of trading of a specific security where trading does not resume prior to the close of the exchange or market on which the security is principally traded. The adviser generally relies on third-party pricing services or other information (such as the correlation with price movements of similar securities in the same or other markets; the type, cost and investment characteristics of the security; the business and financial condition of the issuer; and trading and other market data) to assist in determining whether to fair value and at what value to fair value an investment. The value of an investment for purposes of calculating the fund’s net asset value can differ depending on the source and method used to determine value. When fair valuation is used, the value of an investment used to determine the fund’s net asset value may differ from quoted or published prices for the same investment. There can be no assurance that the fund could obtain the fair value assigned to an investment if it were to sell the investment at the same time at which the fund determines its net asset value per share.
16
Table of Contents
MFS Global Governments Portfolio
Notes to Financial Statements – continued
Various inputs are used in determining the value of the fund’s assets or liabilities. These inputs are categorized into three broad levels. In certain cases, the inputs used to measure fair value may fall into different levels of the fair value hierarchy. In such cases, an investment’s level within the fair value hierarchy is based on the lowest level of input that is significant to the fair value measurement. The fund’s assessment of the significance of a particular input to the fair value measurement in its entirety requires judgment, and considers factors specific to the investment. Level 1 includes unadjusted quoted prices in active markets for identical assets or liabilities. Level 2 includes other significant observable market-based inputs (including quoted prices for similar securities, interest rates, prepayment speed, and credit risk). Level 3 includes unobservable inputs, which may include the adviser’s own assumptions in determining the fair value of investments. Other financial instruments are derivative instruments not reflected in total investments, such as forward foreign currency exchange contracts. The following is a summary of the levels used as of December 31, 2012 in valuing the fund’s assets or liabilities:
| Investments at Value | Level 1 | Level 2 | Level 3 | Total | ||||||||||||
| U.S. Treasury Bonds & U.S. Government Agency & Equivalents | $— | $64,371,321 | $— | $64,371,321 | ||||||||||||
| Non-U.S. Sovereign Debt | — | 148,298,128 | — | 148,298,128 | ||||||||||||
| Residential Mortgage-Backed Securities | — | 932,185 | — | 932,185 | ||||||||||||
| Commercial Mortgage-Backed Securities | — | 195,525 | — | 195,525 | ||||||||||||
| Foreign Bonds | — | 202,318 | — | 202,318 | ||||||||||||
| Mutual Funds | 11,270,805 | — | — | 11,270,805 | ||||||||||||
| Total Investments | $11,270,805 | $213,999,477 | $— | $225,270,282 | ||||||||||||
| Other Financial Instruments | ||||||||||||||||
| Forward Foreign Currency Exchange Contracts | $— | $(1,039,481 | ) | $— | $(1,039,481 | ) | ||||||||||
For further information regarding security characteristics, see the Portfolio of Investments.
Repurchase Agreements – The fund entered into repurchase agreements with approved counterparties. Each repurchase agreement is recorded at cost. The fund requires that the securities collateral in a repurchase transaction be transferred to a custodian. The fund monitors, on a daily basis, the value of the collateral to ensure that its value, including accrued interest, is greater than amounts owed to the fund under each such repurchase agreement. The fund and other funds managed by MFS may utilize a joint trading account for the purpose of entering into one or more repurchase agreements.
Foreign Currency Translation – Purchases and sales of foreign investments, income, and expenses are converted into U.S. dollars based upon currency exchange rates prevailing on the respective dates of such transactions or on the reporting date for foreign denominated receivables and payables. Gains and losses attributable to foreign currency exchange rates on sales of securities are recorded for financial statement purposes as net realized gains and losses on investments. Gains and losses attributable to foreign exchange rate movements on receivables, payables, income and expenses are recorded for financial statement purposes as foreign currency transaction gains and losses. That portion of both realized and unrealized gains and losses on investments that results from fluctuations in foreign currency exchange rates is not separately disclosed.
Derivatives – The fund uses derivatives for different purposes, primarily to increase or decrease exposure to a particular market or segment of the market, or security, to increase or decrease interest rate or currency exposure, or as alternatives to direct investments. Derivatives are used for hedging or non-hedging purposes. While hedging can reduce or eliminate losses, it can also reduce or eliminate gains. When the fund uses derivatives as an investment to increase market exposure, or for hedging purposes, gains and losses from derivative instruments may be substantially greater than the derivative’s original cost.
The derivative instruments used by the fund were forward foreign currency exchange contracts. The fund’s period end derivatives, as presented in the Portfolio of Investments and the associated Derivative Contract tables, generally are indicative of the volume of its derivative activity during the period.
The following table presents, by major type of derivative contract, the fair value, on a gross basis, of the asset and liability components of derivatives held by the fund at December 31, 2012 as reported in the Statement of Assets and Liabilities:
| Fair Value | ||||||||||
| Risk | Derivative Contracts | Asset Derivatives | Liability Derivatives | |||||||
| Foreign Exchange | Forward Foreign Currency Exchange | $208,926 | $(1,248,407 | ) | ||||||
The following table presents, by major type of derivative contract, the realized gain (loss) on derivatives held by the fund for the year ended December 31, 2012 as reported in the Statement of Operations:
| Risk | Foreign Currency | |||
| Foreign Exchange | $(272,312 | ) | ||
17
Table of Contents
MFS Global Governments Portfolio
Notes to Financial Statements – continued
The following table presents, by major type of derivative contract, the change in unrealized appreciation (depreciation) on derivatives held by the fund for the year ended December 31, 2012 as reported in the Statement of Operations:
| Risk | Translation of Assets and Liabilities in Foreign Currencies | |||
| Foreign Exchange | $(981,567 | ) | ||
Derivative counterparty credit risk is managed through formal evaluation of the creditworthiness of all potential counterparties. On certain over-the-counter derivatives, the fund attempts to reduce its exposure to counterparty credit risk whenever possible by entering into an International Swaps and Derivatives Association (ISDA) Master Agreement on a bilateral basis with each of the counterparties with whom it undertakes a significant volume of transactions. The ISDA Master Agreement gives each party to the agreement the right to terminate all transactions traded under such agreement if there is a certain deterioration in the credit quality of the other party. The ISDA Master Agreement gives the fund the right, upon an event of default by the applicable counterparty or a termination of the agreement, to close out all transactions traded under such agreement and to net amounts owed under each transaction to one net amount payable by one party to the other. This right to close out and net payments across all transactions traded under the ISDA Master Agreement could result in a reduction of the fund’s credit risk to such counterparty equal to any amounts payable by the fund under the applicable transactions, if any. However, absent an event of default by the counterparty or a termination of the agreement, the ISDA Master Agreement does not result in an offset of reported amounts of assets and liabilities in the Statement of Assets and Liabilities across transactions between the fund and the applicable counterparty.
Collateral requirements differ by type of derivative. Collateral or margin requirements are set by the broker or exchange clearing house for exchange traded derivatives (i.e., futures contracts and exchange-traded options) while collateral terms are contract specific for over-the-counter traded derivatives (i.e., forward foreign currency exchange contracts, swap agreements and over-the-counter options). For derivatives traded under an ISDA Master Agreement, the collateral requirements are netted across all transactions traded under such agreement and one amount is posted from one party to the other to collateralize such obligations. Cash collateral that has been pledged to cover obligations of the fund under derivative contracts, if any, will be reported separately in the Statement of Assets and Liabilities as restricted cash. Securities collateral pledged for the same purpose, if any, is noted in the Portfolio of Investments.
Forward Foreign Currency Exchange Contracts – The fund entered into forward foreign currency exchange contracts for the purchase or sale of a specific foreign currency at a fixed price on a future date. These contracts may be used to hedge the fund’s currency risk or for non-hedging purposes. For hedging purposes, the fund may enter into contracts to deliver or receive foreign currency that the fund will receive from or use in its normal investment activities. The fund may also use contracts to hedge against declines in the value of foreign currency denominated securities due to unfavorable exchange rate movements. For non-hedging purposes, the fund may enter into contracts with the intent of changing the relative exposure of the fund’s portfolio of securities to different currencies to take advantage of anticipated exchange rate changes.
Forward foreign currency exchange contracts are adjusted by the daily exchange rate of the underlying currency and any unrealized gains or losses are recorded as a receivable or payable for forward foreign currency exchange contracts until the contract settlement date. On contract settlement date, any gain or loss on the contract is recorded as realized gains or losses on foreign currency.
Risks may arise upon entering into these contracts from unanticipated movements in the value of the contract and from the potential inability of counterparties to meet the terms of their contracts. Generally, the fund’s maximum risk due to counterparty credit risk is the unrealized gain on the contract due to the use of Continuous Linked Settlement, an industry accepted settlement system. This risk is mitigated in cases where there is an ISDA Master Agreement between the fund and the counterparty providing for netting as described above and for posting of collateral by the counterparty to the fund to cover the fund’s exposure to the counterparty under such ISDA Master Agreement.
Indemnifications – Under the fund’s organizational documents, its officers and Trustees may be indemnified against certain liabilities and expenses arising out of the performance of their duties to the fund. Additionally, in the normal course of business, the fund enters into agreements with service providers that may contain indemnification clauses. The fund’s maximum exposure under these agreements is unknown as this would involve future claims that may be made against the fund that have not yet occurred.
Investment Transactions and Income – Investment transactions are recorded on the trade date. Interest income is recorded on the accrual basis. All premium and discount is amortized or accreted for financial statement purposes in accordance with U.S. generally accepted accounting principles. Interest payments received in additional securities are recorded on the ex-interest date in an amount equal to the value of the security on such date.
18
Table of Contents
MFS Global Governments Portfolio
Notes to Financial Statements – continued
The fund may receive proceeds from litigation settlements. Any proceeds received from litigation involving portfolio holdings are reflected in the Statement of Operations in realized gain/loss if the security has been disposed of by the fund or in unrealized gain/loss if the security is still held by the fund. Any other proceeds from litigation not related to portfolio holdings are reflected as other income in the Statement of Operations.
Fees Paid Indirectly – The fund’s custody fee may be reduced according to an arrangement that measures the value of cash deposited with the custodian by the fund. This amount, for the year ended December 31, 2012, is shown as a reduction of total expenses in the Statement of Operations.
Tax Matters and Distributions – The fund intends to qualify as a regulated investment company, as defined under Subchapter M of the Internal Revenue Code, and to distribute all of its taxable income, including realized capital gains. As a result, no provision for federal income tax is required. The fund’s federal tax returns, when filed, will remain subject to examination by the Internal Revenue Service for a three year period.
Distributions to shareholders are recorded on the ex-dividend date. Income and capital gain distributions are determined in accordance with income tax regulations, which may differ from U.S. generally accepted accounting principles. Certain capital accounts in the financial statements are periodically adjusted for permanent differences in order to reflect their tax character. These adjustments have no impact on net assets or net asset value per share. Temporary differences which arise from recognizing certain items of income, expense, gain or loss in different periods for financial statement and tax purposes will reverse at some time in the future. Distributions in excess of net investment income or net realized gains are temporary overdistributions for financial statement purposes resulting from differences in the recognition or classification of income or distributions for financial statement and tax purposes.
Book/tax differences primarily relate to amortization and accretion of debt securities, straddle loss deferrals, and derivative transactions.
The tax character of distributions declared to shareholders for the last two fiscal years is as follows:
| 12/31/12 | 12/31/11 | |||||||
| Ordinary income (including any short-term capital gains) | $996,242 | $863,984 | ||||||
| Long-term capital gains | — | 171,440 | ||||||
| $996,242 | $1,035,424 | |||||||
| Tax return of capital (b) | 3,795 | — | ||||||
| Total distributions | $1,000,037 | $1,035,424 | ||||||
| (b) | Distributions in excess of tax basis earnings and profits are reported in the financial statements as a tax return of capital. |
The federal tax cost and the tax basis components of distributable earnings were as follows:
| As of 12/31/12 | ||||
| Cost of investments | $224,120,443 | |||
| Gross appreciation | 2,894,274 | |||
| Gross depreciation | (1,744,435 | ) | ||
| Net unrealized appreciation (depreciation) | $1,149,839 | |||
| Capital loss carryforwards | (142,224 | ) | ||
| Other temporary differences | (472,075 | ) |
Under the Regulated Investment Company Modernization Act of 2010 (the “Act”), net capital losses recognized after December 31, 2010 may be carried forward indefinitely, and their character is retained as short-term and/or long-term losses. Previously, net capital losses were carried forward for eight years and treated as short-term losses. As a transition rule, the Act requires that post-enactment net capital losses be used before pre-enactment net capital losses.
As of December 31, 2012, the fund had capital loss carryforwards available to offset future realized gains. Such losses are characterized as follows:
| Post-enactment losses: | ||||
| Short-Term | $(32,762 | ) | ||
| Long-Term | (109,462 | ) | ||
| Total | $(142,224 | ) |
Multiple Classes of Shares of Beneficial Interest – The fund offers multiple classes of shares, which differ in their respective distribution and/or service fees. The fund’s income, realized and unrealized gain (loss), and common expenses are allocated to
19
Table of Contents
MFS Global Governments Portfolio
Notes to Financial Statements – continued
shareholders based on the daily net assets of each class. Dividends are declared separately for each class. Differences in per share dividend rates are generally due to differences in separate class expenses. The fund’s distributions declared to shareholders as reported in the Statements of Changes in Net Assets are presented by class as follows:
| From net investment income | From net realized gain on investments | From tax return of capital | ||||||||||||||||||||||
| Year ended 12/31/12 | Year ended 12/31/11 | Year ended 12/31/12 | Year ended 12/31/11 | Year ended 12/31/12 | Year ended 12/31/11 | |||||||||||||||||||
| Initial Class | $935,868 | $652,562 | $— | $298,684 | $3,565 | $— | ||||||||||||||||||
| Service Class | 60,374 | 55,240 | — | 28,938 | 230 | — | ||||||||||||||||||
| Total | $996,242 | $707,802 | $— | $327,622 | $3,795 | $— | ||||||||||||||||||
| (3) | Transactions with Affiliates |
Investment Adviser – The fund has an investment advisory agreement with MFS to provide overall investment management and related administrative services and facilities to the fund. The management fee is computed daily and paid monthly at the following annual rates:
| First $300 million of average daily net assets | 0.75% | |||
| Average daily net assets in excess of $300 million | 0.675% |
The management fee incurred for the year ended December 31, 2012 was equivalent to an annual effective rate of 0.75% of the fund’s average daily net assets.
The investment adviser has agreed in writing to pay a portion of the fund’s total annual operating expenses, exclusive of interest, taxes, extraordinary expenses, brokerage and transaction costs, and investment-related expenses, such that total annual operating expenses do not exceed 1.00% of average daily net assets for the Initial Class shares and 1.25% of average daily net assets for the Service Class shares. This written agreement will continue until modified by the fund’s Board of Trustees, but such agreement will continue at least until April 30, 2015. For the year ended December 31, 2012, the fund’s actual operating expenses did not exceed the limit and therefore, the investment adviser did not pay any portion of the fund’s expenses related to this agreement.
Distributor – MFS Fund Distributors, Inc. (MFD), a wholly-owned subsidiary of MFS, is the distributor of shares of the fund. The Trustees have adopted a distribution plan for the Service Class shares pursuant to Rule 12b-1 under the Investment Company Act of 1940.
The fund’s distribution plan provides that the fund will pay MFD distribution and/or service fees equal to 0.25% per annum of its average daily net assets attributable to Service Class shares as partial consideration for services performed and expenses incurred by MFD and financial intermediaries (including participating insurance companies that invest in the fund to fund variable annuity and variable life insurance contracts, sponsors of qualified retirement and pension plans that invest in the fund, and affiliates of these participating insurance companies and plan sponsors) in connection with the sale and distribution of the Service Class shares. MFD may subsequently pay all, or a portion, of the distribution and/or service fees to financial intermediaries.
Shareholder Servicing Agent – MFS Service Center, Inc. (MFSC), a wholly-owned subsidiary of MFS, has contracted to provide transfer agent and recordkeeping functions in connection with the issuance, transfer, and redemption of each class of shares of the fund under a Shareholder Servicing Agent Agreement. During the year ended December 31, 2012, the fund did not pay MFSC a fee for this service. Effective April 1, 2013, the fund will be charged a shareholder servicing fee by MFSC.
Administrator – MFS provides certain financial, legal, shareholder communications, compliance, and other administrative services to the fund. Under an administrative services agreement, the fund partially reimburses MFS the costs incurred to provide these services. The fund is charged an annual fixed amount of $17,500 plus a fee based on average daily net assets. The administrative services fee incurred for the year ended December 31, 2012 was equivalent to an annual effective rate of 0.0367% of the fund’s average daily net assets.
Trustees’ and Officers’ Compensation – The fund pays compensation to independent Trustees in the form of a retainer, attendance fees, and additional compensation to Board and Committee chairpersons. The fund does not pay compensation directly to Trustees or officers of the fund who are also officers of the investment adviser, all of whom receive remuneration for their services to the fund from MFS. Certain officers and Trustees of the fund are officers or directors of MFS, MFD, and MFSC.
Other – This fund and certain other funds managed by MFS (the funds) have entered into services agreements (the Agreements) which provide for payment of fees by the funds to Tarantino LLC and Griffin Compliance LLC in return for the provision of services of an Independent Chief Compliance Officer (ICCO) and Assistant ICCO, respectively, for the funds. The ICCO and Assistant ICCO are officers of the funds and the sole members of Tarantino LLC and Griffin Compliance LLC, respectively. The funds can terminate the Agreements with Tarantino LLC and Griffin Compliance LLC at any time under the terms of the Agreements. For the year ended December 31, 2012, the aggregate fees paid by the fund to Tarantino LLC and Griffin Compliance LLC were $285 and are included
20
Table of Contents
MFS Global Governments Portfolio
Notes to Financial Statements – continued
in “Miscellaneous” expense in the Statement of Operations. MFS has agreed to reimburse the fund for a portion of the payments made by the fund in the amount of $127, which is shown as a reduction of total expenses in the Statement of Operations. Additionally, MFS has agreed to bear all expenses associated with office space, other administrative support, and supplies provided to the ICCO and Assistant ICCO.
The fund invests in the MFS Institutional Money Market Portfolio which is managed by MFS and seeks current income consistent with preservation of capital and liquidity. Income earned on this investment is included in “Dividends from underlying affiliated funds” in the Statement of Operations. This money market fund does not pay a management fee to MFS.
| (4) | Portfolio Securities |
Purchases and sales of investments, other than short-term obligations, were as follows:
| Purchases | Sales | |||||||
| U.S. Government securities | $— | $319,377 | ||||||
| Investments (non-U.S. Government securities) | $192,181,016 | $8,521,727 | ||||||
| (5) | Shares of Beneficial Interest |
The fund’s Declaration of Trust permits the Trustees to issue an unlimited number of full and fractional shares of beneficial interest. Transactions in fund shares were as follows:
| Year ended 12/31/12 | Year ended 12/31/11 | |||||||||||||||
| Shares | Amount | Shares | Amount | |||||||||||||
| Shares sold | ||||||||||||||||
Initial Class | 18,036,331 | $200,579,042 | 202,675 | $2,304,762 | ||||||||||||
Service Class | 54,810 | 604,238 | 19,493 | 215,069 | ||||||||||||
| 18,091,141 | $201,183,280 | 222,168 | $2,519,831 | |||||||||||||
| Shares issued in connection with acquisition of Global Government Variable Account | ||||||||||||||||
Initial Class | — | $— | 528,467 | $5,924,201 | ||||||||||||
| Shares issued to shareholders in reinvestment of distributions | ||||||||||||||||
Initial Class | 85,248 | $939,433 | 82,933 | $951,246 | ||||||||||||
Service Class | 5,565 | 60,604 | 7,436 | 84,178 | ||||||||||||
| 90,813 | $1,000,037 | 90,369 | $1,035,424 | |||||||||||||
| Shares reacquired | ||||||||||||||||
Initial Class | (599,556 | ) | $(6,730,887 | ) | (511,532 | ) | $(5,748,742 | ) | ||||||||
Service Class | (86,883 | ) | (964,318 | ) | (76,992 | ) | (848,303 | ) | ||||||||
| (686,439 | ) | $(7,695,205 | ) | (588,524 | ) | $(6,597,045 | ) | |||||||||
| Net change | ||||||||||||||||
Initial Class | 17,522,023 | $194,787,588 | 302,543 | $3,431,467 | ||||||||||||
Service Class | (26,508 | ) | (299,476 | ) | (50,063 | ) | (549,056 | ) | ||||||||
| 17,495,515 | $194,488,112 | 252,480 | $2,882,411 | |||||||||||||
The fund is one of several mutual funds in which the MFS funds-of-funds may invest. The MFS funds-of-funds do not invest in the underlying MFS funds for the purpose of exercising management or control. At the end of the period, the MFS Moderate Allocation Portfolio, the MFS Conservative Allocation Portfolio and the MFS Growth Allocation Portfolio were the owners of record of approximately 43%, 33%, and 10%, respectively, of the value of outstanding voting shares of the fund.
| (6) | Line of Credit |
The fund and certain other funds managed by MFS participate in a $1.1 billion unsecured committed line of credit, subject to a $1 billion sublimit, provided by a syndication of banks under a credit agreement. Borrowings may be made for temporary financing needs. Interest is charged to each fund, based on its borrowings, generally at a rate equal to the higher of the Federal Reserve funds rate or one month LIBOR plus an agreed upon spread. A commitment fee, based on the average daily, unused portion of the committed line of credit, is allocated among the participating funds at the end of each calendar quarter. In addition, the fund and other funds managed by MFS have established unsecured uncommitted borrowing arrangements with certain banks for temporary financing needs. Interest is charged to each fund, based on its borrowings, at a rate equal to the Federal Reserve funds rate plus an agreed upon spread. For the year ended December 31, 2012, the fund’s commitment fee and interest expense were $225 and $0, respectively, and are included in “Miscellaneous” expense in the Statement of Operations.
21
Table of Contents
MFS Global Governments Portfolio
Notes to Financial Statements – continued
| (7) | Transactions in Underlying Affiliated Funds – Affiliated Issuers |
An affiliated issuer may be considered one in which the fund owns 5% or more of the outstanding voting securities, or a company which is under common control. For the purposes of this report, the fund assumes the following to be an affiliated issuer:
| Underlying Affiliated Fund | Beginning Shares/Par Amount | Acquisitions Shares/Par Amount | Dispositions Shares/Par Amount | Ending Shares/Par Amount | ||||||||||||
| MFS Institutional Money Market Portfolio | 923,205 | 148,721,215 | (138,373,615 | ) | 11,270,805 | |||||||||||
| Underlying Affiliated Fund | Realized Gain (Loss) | Capital Gain Distributions | Dividend Income | Ending Value | ||||||||||||
| MFS Institutional Money Market Portfolio | $— | $— | $4,372 | $11,270,805 | ||||||||||||
| (8) | Acquisitions |
At close of business on December 2, 2011, the fund with net assets of $31,193,981, acquired all of the investment-related assets and liabilities of Global Governments Variable Account. The acquisition was part of a transaction in which the Global Governments Variable Account was converted into a unit investment trust (“UIT’) that invests in the fund (the acquisition of the Account’s assets and liabilities and subsequent conversion into a UIT hereinafter referred to as the “Reorganization”). The Reorganization provided the contract owners of the Global Governments Variable Account with the opportunity to participate in a larger combined portfolio with an identical investment objective and similar investment policies and strategies. The acquisition was accomplished by a tax-free exchange of 528,467 shares of the fund (valued at $5,924,201) for all of the investment-related assets and liabilities of Global Governments Variable Account. Global Governments Variable Account’s investments on that date were valued at approximately $5,952,050 with a cost basis of approximately $5,657,871. For financial reporting purposes, assets received and shares issued by the fund were recorded at fair value; however, the cost basis of the investments received from Global Governments Variable Account were carried forward to align ongoing reporting of the fund’s realized and unrealized gains and losses with amounts distributable to shareholders for tax purposes.
22
Table of Contents
MFS Global Governments Portfolio
REPORT OF INDEPENDENT REGISTERED PUBLIC ACCOUNTING FIRM
To the Board of Trustees of MFS Variable Insurance Trust II and the Shareholders of
MFS Global Governments Portfolio:
We have audited the accompanying statement of assets and liabilities, including the portfolio of investments, of MFS Global Governments Portfolio (the “Fund”) (one of the series comprising MFS Variable Insurance Trust II) as of December 31, 2012, and the related statement of operations for the year then ended, the statements of changes in net assets for each of the two years in the period then ended, and the financial highlights for each of the five years in the period then ended. These financial statements and financial highlights are the responsibility of the Fund’s management. Our responsibility is to express an opinion on these financial statements and financial highlights based on our audits.
We conducted our audits in accordance with the standards of the Public Company Accounting Oversight Board (United States). Those standards require that we plan and perform the audit to obtain reasonable assurance about whether the financial statements and financial highlights are free of material misstatement. The Fund is not required to have, nor were we engaged to perform, an audit of its internal control over financial reporting. Our audits included consideration of internal control over financial reporting as a basis for designing audit procedures that are appropriate in the circumstances, but not for the purpose of expressing an opinion on the effectiveness of the Fund’s internal control over financial reporting. Accordingly, we express no such opinion. An audit also includes examining, on a test basis, evidence supporting the amounts and disclosures in the financial statements, assessing the accounting principles used and significant estimates made by management, as well as evaluating the overall financial statement presentation. Our procedures included confirmation of securities owned as of December 31, 2012, by correspondence with the custodian and brokers; where replies were not received from brokers, we performed other auditing procedures. We believe that our audits provide a reasonable basis for our opinion.
In our opinion, the financial statements and financial highlights referred to above present fairly, in all material respects, the financial position of MFS Global Governments Portfolio as of December 31, 2012, the results of its operations for the year then ended, the changes in its net assets for each of the two years in the period then ended, and the financial highlights for each of the five years in the period then ended, in conformity with accounting principles generally accepted in the United States of America.
DELOITTE & TOUCHE LLP
Boston, Massachusetts
February 15, 2013
23
Table of Contents
MFS Global Governments Portfolio
TRUSTEES AND OFFICERS – IDENTIFICATION AND BACKGROUND
The Trustees and officers of the Trust, as of February 1, 2013, are listed below, together with their principal occupations during the past five years. (Their titles may have varied during that period.) The address of each Trustee and officer is 111 Huntington Avenue, Boston, Massachusetts 02199-7618.
Name, Age | Position(s) with Fund | Trustee/Officer Since (h) | Principal Occupations During the Past Five Years | Other Directorships (j) | ||||
| INTERESTED TRUSTEES | ||||||||
Robert J. Manning (k) (age 49) | Trustee | February 2004 | Massachusetts Financial Services Company, Chairman, Chief Executive Officer and Director; President (until December 2009); Chief Investment Officer (until July 2010) | N/A | ||||
| INDEPENDENT TRUSTEES | ||||||||
David H. Gunning (age 70) | Trustee and Chair of Trustees | January 2004 | Private investor | Lincoln Electric Holdings, Inc. (welding equipment manufacturer), Director; Development Alternatives, Inc. (consulting), Director/Non-Executive Chairman; Portman Limited (mining), Director (until 2008) | ||||
Robert E. Butler (age 71) | Trustee | January 2006 | Consultant – investment company industry regulatory and compliance matters | N/A | ||||
Maureen R. Goldfarb (age 57) | Trustee | January 2009 | Private investor | N/A | ||||
William R. Gutow (age 71) | Trustee | December 1993 | Private investor and real estate consultant; Capitol Entertainment Management Company (video franchise), Vice Chairman | Atlantic Coast Tan (tanning salons), Vice Chairman (until 2007); Texas Donuts (donut franchise), Vice Chairman (until 2010) | ||||
Michael Hegarty (age 68) | Trustee | December 2004 | Private investor; Rouse Properties Inc. (real estate), Director | N/A | ||||
John P. Kavanaugh (age 58) | Trustee | January 2009 | Private investor | N/A | ||||
J. Dale Sherratt (age 74) | Trustee | June 1989 | Insight Resources, Inc. (acquisition planning specialists), President; Wellfleet Investments (investor in health care companies), Managing General Partner | N/A | ||||
| Laurie J. Thomsen (age 55) | Trustee | March 2005 | Private investor; New Profit, Inc. (venture philanthropy), Executive Partner (until 2010) | The Travelers Companies (insurance), Director | ||||
Robert W. Uek (age 71) | Trustee | January 2006 | Consultant to investment company industry | N/A | ||||
| OFFICERS | ||||||||
John M. Corcoran (k) (age 47) | President | October 2008 | Massachusetts Financial Services Company, Senior Vice President (since October 2008); State Street Bank and Trust (financial services provider), Senior Vice President, (until September 2008) | N/A | ||||
| Christopher R. Bohane (k) (age 39) | Assistant Secretary and Assistant Clerk | July 2005 | Massachusetts Financial Services Company, Vice President and Senior Counsel | N/A | ||||
Kino Clark (k) (age 44) | Assistant Treasurer | January 2012 | Massachusetts Financial Services Company, Vice President | N/A | ||||
Thomas H. Connors (k) (age 53) | Assistant Secretary and Assistant Clerk | September 2012 | Massachusetts Financial Services Company, Vice President and Senior Counsel; Deutsche Investment Management Americas Inc. (financial service provider), Director and Senior Counsel (until 2012) | N/A | ||||
Ethan D. Corey (k) (age 49) | Assistant Secretary and Assistant Clerk | July 2005 | Massachusetts Financial Services Company, Senior Vice President and Associate General Counsel | N/A | ||||
24
Table of Contents
MFS Global Governments Portfolio
Trustees and Officers – continued
Name, Age | Position(s) with Fund | Trustee/Officer Since (h) | Principal Occupations During the Past Five Years | Other Directorships (j) | ||||
David L. DiLorenzo (k) (age 44) | Treasurer | July 2005 | Massachusetts Financial Services Company, Senior Vice President | N/A | ||||
Robyn L. Griffin (age 37) | Assistant Independent Chief Compliance Officer | August 2008 | Griffin Compliance LLC (provider of compliance services), Principal (since August 2008); State Street Corporation (financial services provider), Mutual Fund Administration Assistant Vice President (October 2006 – July 2008) | N/A | ||||
Brian E. Langenfeld (k) (age 39) | Assistant Secretary and Assistant Clerk | June 2006 | Massachusetts Financial Services Company, Vice President and Senior Counsel | N/A | ||||
Susan S. Newton (k) (age 62) | Assistant Secretary and Assistant Clerk | May 2005 | Massachusetts Financial Services Company, Senior Vice President and Associate General Counsel | N/A | ||||
Susan A. Pereira (k) (age 42) | Assistant Secretary and Assistant Clerk | July 2005 | Massachusetts Financial Services Company, Vice President and Senior Counsel | N/A | ||||
Kasey L. Phillips (k) (age 42) | Assistant Treasurer | September 2012 | Massachusetts Financial Services Company, Vice President; Wells Fargo Funds Management, LLC, Senior Vice President, Fund Treasurer (until 2012) | N/A | ||||
Mark N. Polebaum (k) (age 60) | Secretary and Clerk | January 2006 | Massachusetts Financial Services Company, Executive Vice President, General Counsel and Secretary | N/A | ||||
Frank L. Tarantino (age 68) | Independent Chief Compliance Officer | June 2004 | Tarantino LLC (provider of compliance services), Principal | N/A | ||||
Richard S. Weitzel (k) (age 42) | Assistant Secretary and Assistant Clerk | October 2007 | Massachusetts Financial Services Company, Senior Vice President and Associate General Counsel | N/A | ||||
James O. Yost (k) (age 52) | Deputy Treasurer | September 1990 | Massachusetts Financial Services Company, Senior Vice President | N/A | ||||
| (h) | Date first appointed to serve as Trustee/officer of an MFS fund. Each Trustee has served continuously since appointment unless indicated otherwise. For the period from December 15, 2004 until February 22, 2005, Mr. Manning served as Advisory Trustee. For the period October 2008, until January 2012, Mr. Corcoran served as Treasurer of the Funds. Prior to January 2012, Messrs. DiLorenzo and Yost served as Assistant Treasurers of the Funds. |
| (j) | Directorships or trusteeships of companies required to report to the Securities and Exchange Commission (i.e., “public companies”). |
| (k) | “Interested person” of the Trust within the meaning of the Investment Company Act of 1940 (referred to as the 1940 Act), which is the principal federal law governing investment companies like the fund, as a result of position with MFS. The address of MFS is 111 Huntington Avenue, Boston, Massachusetts 02199-7618. |
Each Trustee has been elected by shareholders and each Trustee and officer holds office until his or her successor is chosen and qualified or until his or her earlier death, resignation, retirement or removal. The Trust does not hold annual meetings for the purpose of electing Trustees, and Trustees are not elected for fixed terms. Messrs. Butler, Kavanaugh, Uek and Ms. Thomsen are members of the Trust’s Audit Committee.
Each of the Fund’s Trustees and officers holds comparable positions with certain other funds of which MFS or a subsidiary is the investment adviser or distributor, and, in the case of the officers, with certain affiliates of MFS. As of January 1, 2013, the Trustees served as board members of 143 funds within the MFS Family of Funds.
25
Table of Contents
MFS Global Governments Portfolio
Trustees and Officers – continued
The Statement of Additional Information for the Fund includes further information about the Trustees and is available without charge upon request by calling 1-800-225-2606.
Investment Adviser Massachusetts Financial Services Company 111 Huntington Avenue Boston, MA 02199-7618 | Custodian State Street Bank and Trust 1 Lincoln Street Boston, MA 02111-2900 | |
Distributor MFS Fund Distributors, Inc. 111 Huntington Avenue Boston, MA 02199-7618 | Independent Registered Public Accounting Firm Deloitte & Touche LLP 200 Berkeley Street Boston, MA 02116 | |
Portfolio Managers Matthew Ryan Erik Weisman |
26
Table of Contents
MFS Global Governments Portfolio
BOARD REVIEW OF INVESTMENT ADVISORY AGREEMENT
A discussion regarding the Board’s most recent approval of the fund’s Investment Advisory Agreement with MFS is available by clicking on the fund’s name under “Variable Insurance Portfolios – VIT II” in the “Products” section of the MFS Web site (mfs.com).
PROXY VOTING POLICIES AND INFORMATION
A general description of the MFS funds’ proxy voting policies and procedures is available without charge, upon request, by calling 1-800-225-2606, by visiting the Proxy Voting section of mfs.com or by visiting the SEC’s Web site at http://www.sec.gov.
Information regarding how the fund voted proxies relating to portfolio securities during the most recent twelve-month period ended June 30 is available without charge by visiting the Proxy Voting section of mfs.com or by visiting the SEC’s Web site at http://www.sec.gov.
QUARTERLY PORTFOLIO DISCLOSURE
The fund will file a complete schedule of portfolio holdings with the Securities and Exchange Commission (the Commission) for the first and third quarters of each fiscal year on Form N-Q. The fund’s Form N-Q is available on the EDGAR database on the Commission’s Internet Web site at http://www.sec.gov, and may be reviewed and copied at the:
Public Reference Room
Securities and Exchange Commission
100 F Street, NE, Room 1580
Washington, D.C. 20549
Information on the operation of the Public Reference Room may be obtained by calling the Commission at 1-800-SEC-0330. Copies of the fund’s Form N-Q also may be obtained, upon payment of a duplicating fee, by electronic request at the following e-mail address: publicinfo@sec.gov or by writing the Public Reference Section at the above address.
From time to time, MFS may post important information about the fund or the MFS funds on the MFS web site (mfs.com). This information is available by visiting the “News & Commentary” section of mfs.com or by clicking on the fund’s name under “Variable Insurance Portfolios – VIT II” in the “Products” section of mfs.com.
27
Table of Contents
rev. 3/11

| Why? | Financial companies choose how they share your personal information. Federal law gives consumers the right to limit some but not all sharing. Federal law also requires us to tell you how we collect, share, and protect your personal information. Please read this notice carefully to understand what we do. |
| What? | The types of personal information we collect and share depend on the product or service you have with us. This information can include:
• Social Security number and account balances • Account transactions and transaction history • Checking account information and wire transfer instructions
When you are no longer our customer, we continue to share your information as described in this notice. |
| How? | All financial companies need to share customers’ personal information to run their everyday business. In the section below, we list the reasons financial companies can share their customers’ personal information; the reasons MFS chooses to share; and whether you can limit this sharing. |
| Reasons we can share your personal information | Does MFS share? | Can you limit this sharing? | ||
For our everyday business purposes – such as to process your transactions, maintain your account(s), respond to court orders and legal investigations, or report to credit bureaus | Yes | No | ||
For our marketing purposes – to offer our products and services to you | No | We don’t share | ||
| For joint marketing with other financial companies | No | We don’t share | ||
For our affiliates’ everyday business purposes – information about your transactions and experiences | No | We don’t share | ||
For our affiliates’ everyday business purposes – information about your creditworthiness | No | We don’t share | ||
| For nonaffiliates to market to you | No | We don’t share |
| Questions? | Call 800-225-2606 or go to mfs.com. |
28
Table of Contents
| Page 2 |
| Who we are | ||
| Who is providing this notice? | MFS Funds, MFS Investment Management, MFS Institutional Advisors, Inc., MFS Fund Distributors, Inc., MFS Heritage Trust Company, and MFS Service Center, Inc. | |
| What we do | ||
| How does MFS protect my personal information? | To protect your personal information from unauthorized access and use, we use security measures that comply with federal law. These measures include procedural, electronic, and physical safeguards for the protection of the personal information we collect about you. | |
| How does MFS collect my personal information? | We collect your personal information, for example, when you
• open an account or provide account information • direct us to buy securities or direct us to sell your securities • make a wire transfer
We also collect your personal information from others, such as credit bureaus, affiliates and other companies. | |
| Why can’t I limit all sharing? | Federal law gives you the right to limit only
• sharing for affiliates’ everyday business purposes – information about your creditworthiness • affiliates from using your information to market to you • sharing for nonaffiliates to market to you
State laws and individual companies may give you additional rights to limit sharing. | |
| Definitions | ||
| Affiliates | Companies related by common ownership or control. They can be financial and nonfinancial companies.
• MFS does not share personal information with affiliates, except for everyday business purposes as described on page one of this notice. | |
| Nonaffiliates | Companies not related by common ownership or control. They can be financial and nonfinancial companies.
• MFS does not share with nonaffiliates so they can market to you. | |
| Joint Marketing | A formal agreement between nonaffiliated financial companies that together market financial products or services to you.
• MFS doesn’t jointly market. | |
| Other important information | ||
| If you own an MFS product or receive an MFS service in the name of a third party such as a bank or broker-dealer, their privacy policy may apply to you instead of ours. | ||
29
Table of Contents
Table of Contents
ANNUAL REPORT
December 31, 2012

MFS®MONEY MARKET PORTFOLIO
MFS® Variable Insurance Trust II

MKS-ANN
Table of Contents
MFS® MONEY MARKET PORTFOLIO
The report is prepared for the general information of contract owners. It is authorized for distribution to prospective investors only when preceded or accompanied by a current prospectus.
NOT FDIC INSURED Ÿ MAY LOSE VALUE Ÿ NO BANK OR CREDIT UNION GUARANTEE Ÿ NOT A DEPOSIT Ÿ NOT INSURED BY ANY FEDERAL GOVERNMENT AGENCY OR NCUA/NCUSIF
Table of Contents
MFS Money Market Portfolio
LETTER FROM THE CHAIRMAN AND CEO

Dear Contract Owners:
The global market outlook for 2013 is one of cautious optimism. While we are seeing some positive economic trends in the United States, Europe and China, the overall environment remains challenging. In the United States, the recent fiscal cliff agreement was received positively by investors, even though it mostly addressed pressing taxation issues and did not resolve additional concerns, including the need for spending cuts and a large-scale reduction of the federal debt. These issues will be front and center again in the spring. Despite the ongoing uncertainty, economic tailwinds are gathering strength as the U.S. housing and job markets are improving and consumer confidence is rising.
Overseas, the debt crisis continues to weigh heavily on eurozone markets, with even Germany — long an economic stalwart — experiencing some contraction. These ongoing challenges could be a drag on global market performance this year. In Asia, manufacturing activity has accelerated in emerging markets such as China and India, and we are seeing signs of stabilized loan growth in China, a leading indicator of that country’s economic health. In contrast, Japan’s economy is contracting sharply under deflationary pressures. Nevertheless, Japanese markets have responded favorably to early actions by the new government, which appears determined to act aggressively, along with the Bank of Japan, to stimulate growth.
As always, managing risk in the face of uncertainty remains a top priority for investors. At MFS®, our uniquely collaborative investment process revolves around global research and our disciplined risk management approach. Our global team of investment professionals shares ideas and evaluates opportunities across continents, investment disciplines and asset classes — all with a goal of building better insights, and ultimately better results, for our clients.
We remain mindful of the many economic challenges investors face today, and believe it is more important than ever to maintain a long-term view, employ time-tested principles, such as asset allocation and diversification, and work closely with investment advisors to identify and pursue the most suitable opportunities.
Respectfully,

Robert J. Manning
Chairman and Chief Executive Officer
MFS Investment Management®
February 15, 2013
The opinions expressed in this letter are subject to change, may not be relied upon for investment advice, and no forecasts can be guaranteed.
1
Table of Contents
MFS Money Market Portfolio
Portfolio structure (u)
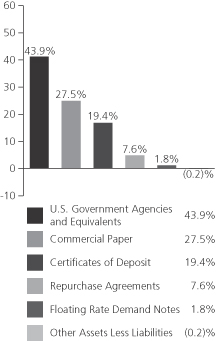
| Composition including fixed income credit quality (a)(u) | ||||
| A-1+ | 8.9% | |||
| A-1 | 90.3% | |||
| Not Rated | 1.0% | |||
| Cash & Other | (0.2)% | |||
| Maturity breakdown (u) | ||||
| 0 - 7 days | 22.9% | |||
| 8 - 29 days | 26.0% | |||
| 30 - 59 days | 25.9% | |||
| 60 - 89 days | 13.2% | |||
| 90 - 365 days | 12.2% | |||
| Other Assets Less Liabilities | (0.2)% |
| (a) | Ratings are assigned to portfolio securities utilizing ratings from Moody’s, Fitch, and Standard & Poor’s rating agencies and applying the following hierarchy: If all three agencies provide a rating, the middle rating (after dropping the highest and lowest ratings) is assigned; if two of the three agencies rate a security, the lower of the two is assigned. Cash & Other portfolio assets that are not securities are not included in the categories mentioned above. Ratings are shown in the S&P scale. All ratings are subject to change. The fund is not rated by these agencies. |
| (u) | For purposes of this presentation, accrued interest, where applicable, is included. |
From time to time, “Other Assets Less Liabilities”, may be negative due to timing of cash receipts.
Percentages are based on net assets as of 12/31/12.
The portfolio is actively managed and current holdings may be different.
2
Table of Contents
MFS Money Market Portfolio
PERFORMANCE SUMMARY THROUGH 12/31/12
Total returns as well as the current 7-day yield have been provided for the applicable time periods. Performance results reflect the percentage change in net asset value, including the reinvestment of any dividends and capital gains distributions. (See Notes to Performance Summary.) An investment in the portfolio is not insured or guaranteed by the Federal Deposit Insurance Corporation or any other government agency. Although the fund seeks to preserve the value of your investment at $1.00 per unit, it is possible to lose money by investing in the fund.
Performance data shown represents past performance and is no guarantee of future results. Investment return and principal value fluctuate so your units, when sold, may be worth more or less than the original cost; current performance may be lower or higher than quoted. The performance shown does not reflect the deduction of taxes, if any, that a contract holder would pay on fund distributions or the redemption of contract units. The returns for the fund shown also do not reflect the deduction of expenses associated with variable products, such as mortality and expense risk charges, separate account charges, and sales charges imposed by the insurance company separate accounts. Such expenses would reduce the overall returns shown.
| Share Class | Inception | 1-Year Total Return | Current 7-day yield | |||||||
| Initial Class | 7/19/85 | 0.00% | 0.00% | |||||||
| Service Class | 8/24/01 | 0.00% | 0.00% |
Notes to Performance Summary
Yields quoted are based on the latest seven days ended as of December 31, 2012, with dividends annualized. The yield quotations more closely reflect the current earnings of the fund than the total return quotations.
Performance results reflect any applicable expense subsidies, waivers and adjustments in effect during the periods shown. Subsidies and fee waivers may be imposed to enhance a fund’s yield or to avoid a negative yield during periods when the fund’s operating expenses have a significant impact on the fund’s yield due to lower interest rates. Without such subsidies and waivers the fund’s performance results would be less favorable. Please see the prospectus and financial statements for complete details. All results are historical and assume the reinvestment of any dividends and capital gains distributions.
3
Table of Contents
MFS Money Market Portfolio
Fund Expenses Borne by the Contract Holders During the Period,
July 1, 2012 through December 31, 2012
As a contract holder of the fund, you incur ongoing costs, including management fees; distribution and/or service (12b-1) fees; and other fund expenses. This example is intended to help you understand your ongoing costs (in dollars) of investing in the fund and to compare these costs with the ongoing costs of investing in other mutual funds.
The example is based on an investment of $1,000 invested at the beginning of the period and held for the entire period July 1, 2012 through December 31, 2012.
Actual Expenses
The first line for each share class in the following table provides information about actual account values and actual expenses. You may use the information in this line, together with the amount you invested, to estimate the expenses that you paid over the period. Simply divide your account value by $1,000 (for example, an $8,600 account value divided by $1,000 = 8.6), then multiply the result by the number in the first line under the heading entitled “Expenses Paid During Period” to estimate the expenses you paid on your account during this period.
Hypothetical Example for Comparison Purposes
The second line for each share class in the following table provides information about hypothetical account values and hypothetical expenses based on the fund’s actual expense ratio and an assumed rate of return of 5% per year before expenses, which is not the fund’s actual return. The hypothetical account values and expenses may not be used to estimate the actual ending account balance or expenses you paid for the period. You may use this information to compare the ongoing costs of investing in the fund and other funds. To do so, compare this 5% hypothetical example with the 5% hypothetical examples that appear in the shareholder reports of the other funds.
Please note that the expenses shown in the table are meant to highlight the fund’s ongoing costs only and do not take into account the fees and expenses imposed under the variable contracts through which your investment in the fund is made. Therefore, the second line for each share class in the table is useful in comparing ongoing costs associated with an investment in vehicles (such as the fund) which fund benefits under variable annuity and variable life insurance contracts and to qualified pension and retirement plans only, and will not help you determine the relative total costs of investing in the fund through variable annuity and variable life insurance contracts. If the fees and expenses imposed under the variable contracts were included, your costs would have been higher.
| Share Class | Annualized Expense Ratio | Beginning Account Value 7/01/12 | Ending Account Value | Expenses Paid During Period (p) 7/01/12-12/31/12 | ||||||||||||||
| Initial Class | Actual | 0.18% | $1,000.00 | $1,000.00 | $0.90 | |||||||||||||
| Hypothetical (h) | 0.18% | $1,000.00 | $1,024.23 | $0.92 | ||||||||||||||
| Service Class | Actual | 0.18% | $1,000.00 | $1,000.00 | $0.90 | |||||||||||||
| Hypothetical (h) | 0.18% | $1,000.00 | $1,024.23 | $0.92 | ||||||||||||||
| (h) | 5% class return per year before expenses. |
| (p) | Expenses paid are equal to each class’s annualized expense ratio, as shown above, multiplied by the average account value over the period, multiplied by the number of days in the period, divided by the number of days in the year. |
Expense Changes Impacting Table
As more fully disclosed in footnote 3 to the financial statements, the expense ratios reported above include additional expense reductions to avoid a negative yield.
4
Table of Contents
MFS Money Market Portfolio
PORTFOLIO OF INVESTMENTS – 12/31/12
The Portfolio of Investments is a complete list of all securities owned by your fund. It is categorized by broad-based asset classes.
| Issuer | Shares/Par | Value ($) | ||||||
| COMMERCIAL PAPER (y) – 27.5% | ||||||||
| Automotive – 4.0% | ||||||||
| American Honda Finance Corp., 0.13%, due 1/10/13 | $ | 15,262,000 | $ | 15,261,504 | ||||
| American Honda Finance Corp., 0.13%, due 1/09/13 | 3,514,000 | 3,513,898 | ||||||
| American Honda Finance Corp., 0.17%, due 1/22/13 | 2,375,000 | 2,374,764 | ||||||
|
| |||||||
| $ | 21,150,166 | |||||||
|
| |||||||
| Consumer Products – 2.2% | ||||||||
| Procter & Gamble Co., 0.16%, due 2/11/13 (t) | $ | 9,183,000 | $ | 9,181,327 | ||||
| Procter & Gamble Co., 0.14%, due 1/02/13 (t) | 2,880,000 | 2,879,989 | ||||||
|
| |||||||
| $ | 12,061,316 | |||||||
|
| |||||||
| Electronics – 2.3% | ||||||||
| Emerson Electric Co., 0.16%, due 2/21/13 (t) | $ | 12,200,000 | $ | 12,197,235 | ||||
|
| |||||||
| Financial Institutions – 4.0% | ||||||||
| General Electric Capital Corp., 0.22%, due 4/12/13 | $ | 21,186,000 | $ | 21,172,924 | ||||
|
| |||||||
| Food & Beverages – 4.8% | ||||||||
| Anheuser-Busch InBev Worldwide, Inc., 0.24%, due 1/29/13 (t) | $ | 4,335,000 | $ | 4,334,191 | ||||
| Coca-Cola Co., 0.19%, due 4/08/13 (t) | 8,985,000 | 8,980,400 | ||||||
| Coca-Cola Co., 0.23%, due 2/20/13 (t) | 2,590,000 | 2,589,173 | ||||||
| Coca-Cola Co., 0.19%, due 1/25/13 (t) | 2,560,000 | 2,559,676 | ||||||
| Coca-Cola Co., 0.24%, due 1/23/13 (t) | 7,045,000 | 7,043,967 | ||||||
|
| |||||||
| $ | 25,507,407 | |||||||
|
| |||||||
| Machinery & Tools – 3.9% | ||||||||
| Deere and Co., 0.13%, due 1/15/13 (t) | $ | 21,076,000 | $ | 21,074,934 | ||||
|
| |||||||
| Major Banks – 2.6% | ||||||||
| ANZ National (International) Ltd., 0.35%, due 1/25/13 (t) | $ | 2,000,000 | $ | 1,999,533 | ||||
| Bank of Nova Scotia, 0.205%, due 1/16/13 | 753,000 | 752,936 | ||||||
| JPMorgan Chase & Co., 0.2%, due 1/15/13 | 2,573,000 | 2,572,800 | ||||||
| JPMorgan Chase & Co., 0.25%, due 6/19/13 | 477,000 | 476,440 | ||||||
| National Australia Funding (Delaware), Inc., 0.28%, due 2/19/13 (t) | 1,613,000 | 1,612,385 | ||||||
| Wells Fargo & Co., 0.14%, due 2/25/13 | 6,333,000 | 6,331,645 | ||||||
|
| |||||||
| $ | 13,745,739 | |||||||
|
| |||||||
| Tobacco – 3.7% | ||||||||
| Philip Morris International, Inc., 0.16%, due 2/04/13 (t) | $ | 16,000,000 | $ | 15,997,582 | ||||
| Philip Morris International, Inc., 0.16%, due 1/22/13 (t) | 3,530,000 | 3,529,671 | ||||||
|
| |||||||
| $ | 19,527,253 | |||||||
|
| |||||||
| Total Commercial Paper, at Amortized Cost and Value | $ | 146,436,974 | ||||||
|
| |||||||
| Issuer | Shares/Par | Value ($) | ||||||
| U.S. GOVERNMENT AGENCIES AND EQUIVALENTS (y) – 43.9% | ||||||||
| Fannie Mae, 0.085%, due 1/09/13 | $ | 11,715,000 | $ | 11,714,779 | ||||
| Fannie Mae, 0.125%, due 3/06/13 | 5,555,000 | 5,553,766 | ||||||
| Fannie Mae, 0.09%, due 3/13/13 | 16,555,000 | 16,552,062 | ||||||
| Fannie Mae, 0.15%, due 3/13/13 | 2,544,000 | 2,543,247 | ||||||
| Fannie Mae, 0.16%, due 3/20/13 | 10,070,000 | 10,066,509 | ||||||
| Federal Home Loan Bank, 0.07%, due 1/04/13 | 50,000,000 | 49,999,708 | ||||||
| Federal Home Loan Bank, 0.09%, due 1/11/13 | 4,655,000 | 4,654,884 | ||||||
| Federal Home Loan Bank, 0.09%, due 1/23/13 | 740,000 | 739,959 | ||||||
| Federal Home Loan Bank, 0.095%, due 1/23/13 | 8,495,000 | 8,494,507 | ||||||
| Federal Home Loan Bank, 0.1%, due 1/23/13 | 8,535,000 | 8,534,478 | ||||||
| Federal Home Loan Bank, 0.11%, due 2/01/13 | 4,342,000 | 4,341,589 | ||||||
| Federal Home Loan Bank, 0.133%, due 2/01/13 | 12,060,000 | 12,058,619 | ||||||
| Federal Home Loan Bank, 0.138%, due 2/13/13 | 11,200,000 | 11,198,154 | ||||||
| Federal Home Loan Bank, 0.123%, due 2/15/13 | 4,670,000 | 4,669,282 | ||||||
| Federal Home Loan Bank, 0.125%, due 2/15/13 | 12,140,000 | 12,138,103 | ||||||
| Federal Home Loan Bank, 0.115%, due 3/01/13 | 12,055,000 | 12,052,728 | ||||||
| Federal Home Loan Bank, 0.075%, due 3/20/13 | 11,016,000 | 11,014,210 | ||||||
| Federal Home Loan Bank, 0.15%, due 5/03/13 | 4,955,000 | 4,952,481 | ||||||
| Freddie Mac, 0.085%, due 1/03/13 | 8,100,000 | 8,099,962 | ||||||
| Freddie Mac, 0.155%, due 2/19/13 | 1,530,000 | 1,529,677 | ||||||
| Freddie Mac, 0.15%, due 3/04/13 | 535,000 | 534,862 | ||||||
| Freddie Mac, 0.085%, due 3/11/13 | 2,670,000 | 2,669,565 | ||||||
| Freddie Mac, 0.078%, due 3/12/13 | 3,170,000 | 3,169,519 | ||||||
| Freddie Mac, 0.11%, due 4/04/13 | 21,085,000 | 21,079,008 | ||||||
| Tennessee Valley Authority, 0.06%, due 1/03/13 | 5,263,000 | 5,262,982 | ||||||
|
| |||||||
| Total U.S. Government Agencies and Equivalents, at Amortized Cost and Value | $ | 233,624,640 | ||||||
|
| |||||||
| CERTIFICATES OF DEPOSIT – 19.4% | ||||||||
| Major Banks – 15.5% | ||||||||
| Bank of Montreal/Chicago Branch, 0.19%, due 1/08/13 | $ | 1,355,000 | $ | 1,355,000 | ||||
| Bank of Montreal/Chicago Branch, 0.21%, due 1/28/13 | 10,720,000 | 10,720,000 | ||||||
| Bank of Nova Scotia/Houston Branch, 0.27%, due 2/01/13 | 8,600,000 | 8,600,000 | ||||||
5
Table of Contents
MFS Money Market Portfolio
Portfolio of Investments – continued
| Issuer | Shares/Par | Value ($) | ||||||
| CERTIFICATES OF DEPOSIT – continued | ||||||||
| Major Banks – continued | ||||||||
| Canadian Imperial Bank of Commerce/New York Branch, 0.16%, due 2/07/13 | $ | 2,780,000 | $ | 2,780,000 | ||||
| Canadian Imperial Bank of Commerce/New York Branch, 0.29%, due 1/22/13 | 9,400,000 | 9,400,000 | ||||||
| Chase Bank USA N.A., 0.22%, due 3/13/13 | 9,100,000 | 9,100,000 | ||||||
| Chase Bank USA N.A., 0.2%, due 1/24/13 | 8,785,000 | 8,785,000 | ||||||
| National Australia Bank/New York Branch, 0.27%, due 2/19/13 | 10,650,000 | 10,650,000 | ||||||
| Toronto-Dominion Holdings (USA), Inc., 0.21%, due 2/04/13 | 5,960,000 | 5,960,000 | ||||||
| Toronto-Dominion Holdings (USA), Inc., 0.2%, due 1/28/13 | 1,360,000 | 1,360,000 | ||||||
| Toronto-Dominion Holdings (USA), Inc., 0.24%, due 6/05/13 | 4,790,000 | 4,790,000 | ||||||
| Toronto-Dominion Holdings (USA), Inc., 0.18%, due 1/22/13 | 8,825,000 | 8,825,000 | ||||||
|
| |||||||
| $ | 82,325,000 | |||||||
|
| |||||||
| Other Banks & Diversified Financials – 3.9% | ||||||||
| Mizuho Corporate Bank (USA)/New York Branch, 0.24%, due 3/13/13 | $ | 9,000,000 | $ | 9,000,000 | ||||
| Mizuho Corporate Bank (USA)/New York Branch, 0.27%, due 4/18/13 | 3,390,000 | 3,390,000 | ||||||
| Mizuho Corporate Bank (USA)/New York Branch, 0.26%, due 1/02/13 | 4,540,000 | 4,540,000 | ||||||
| Mizuho Corporate Bank (USA)/New York Branch, 0.24%, due 2/26/13 | 3,995,000 | 3,995,000 | ||||||
|
| |||||||
| $ | 20,925,000 | |||||||
|
| |||||||
| Total Certificates of Deposit, at Cost and Value | $ | 103,250,000 | ||||||
|
| |||||||
| Issuer | Shares/Par | Value ($) | ||||||
| FLOATING RATE DEMAND NOTES – 1.8% | ||||||||
| East Baton Rouge, LA, Pollution Control Rev. (Exxon Mobil Corp.), 0.09%, due 1/02/13 | $ | 3,300,000 | $ | 3,300,000 | ||||
| Lincoln County, WY, Pollution Control Rev. (Exxon Mobil Corp.), 0.09%, due 1/02/13 | 2,900,000 | 2,900,000 | ||||||
| Lincoln County, WY, Pollution Control Rev. (Exxon Mobil Corp.), “C”, 0.09%, due 1/02/13 | 3,200,000 | 3,200,000 | ||||||
|
| |||||||
| Total Floating Rate Demand Notes, at Cost and Value | $ | 9,400,000 | ||||||
|
| |||||||
| REPURCHASE AGREEMENTS – 7.6% | ||||||||
| Merrill Lynch, Pierce, Fenner & Smith, Inc., 0.15%, dated 12/31/12, due 1/02/13, total to be received $40,585,338 (secured by U.S. Treasury and Federal Agency obligations valued at $41,396,928 in a jointly traded account), at Cost and Value | $ | 40,585,000 | $ | 40,585,000 | ||||
|
| |||||||
| Total Investments, at Amortized Cost and Value | $ | 533,296,614 | ||||||
|
| |||||||
| OTHER ASSETS, LESS LIABILITIES – (0.2)% | (889,113 | ) | ||||||
|
| |||||||
| Net Assets – 100.0% | $ | 532,407,501 | ||||||
|
| |||||||
| (t) | Security exempt from registration with the U.S. Securities and Exchange Commission under Section 4(2) of the Securities Act of 1933. |
| (y) | The rate shown represents an annualized yield at time of purchase. |
See Notes to Financial Statements
6
Table of Contents
MFS Money Market Portfolio
FINANCIAL STATEMENTS | STATEMENT OF ASSETS AND LIABILITIES
This statement represents your fund’s balance sheet, which details the assets and liabilities comprising the total value of the fund.
At 12/31/12 | ||||||||
Assets | ||||||||
Investments, at amortized cost and value | $533,296,614 | |||||||
Cash | 457 | |||||||
Receivables for | ||||||||
Fund shares sold | 867,506 | |||||||
Interest | 52,887 | |||||||
Other assets | 3,530 | |||||||
Total assets | $534,220,994 | |||||||
Liabilities | ||||||||
Payable for fund shares reacquired | $1,765,973 | |||||||
Payable to investment adviser | 7,703 | |||||||
Payable for independent Trustees’ compensation | 30 | |||||||
Accrued expenses and other liabilities | 39,787 | |||||||
Total liabilities | $1,813,493 | |||||||
Net assets | $532,407,501 | |||||||
Net assets consist of | ||||||||
Paid-in capital | $532,630,946 | |||||||
Accumulated net realized gain (loss) on investments | (223,445 | ) | ||||||
Net assets | $532,407,501 | |||||||
Shares of beneficial interest outstanding | 532,632,041 |
| Net assets | Shares outstanding | Net asset value per share | ||||||||||
Initial Class | $242,645,658 | 242,771,286 | $1.00 | |||||||||
Service Class | 289,761,843 | 289,860,755 | 1.00 | |||||||||
See Notes to Financial Statements
7
Table of Contents
MFS Money Market Portfolio
FINANCIAL STATEMENTS | STATEMENT OF OPERATIONS
This statement describes how much your fund earned in investment income and accrued in expenses. It also describes any gains and/or losses generated by fund operations.
| Year ended 12/31/12 | ||||||||
Net investment income | ||||||||
Interest income | $492,591 | |||||||
Expenses | ||||||||
Management fee | $1,589,173 | |||||||
Distribution and/or service fees | 330,328 | |||||||
Administrative services fee | 55,448 | |||||||
Independent Trustees’ compensation | 12,612 | |||||||
Custodian fee | 25,631 | |||||||
Shareholder communications | 18,852 | |||||||
Audit and tax fees | 30,839 | |||||||
Legal fees | 5,055 | |||||||
Miscellaneous | 17,761 | |||||||
Total expenses | $2,085,699 | |||||||
Fees paid indirectly | (76 | ) | ||||||
Reduction of expenses by investment adviser and distributor | (1,593,032 | ) | ||||||
Net expenses | $492,591 | |||||||
Net investment income | $0 | |||||||
Net realized gain (loss) on investments | $0 | |||||||
Change in net assets from operations | $0 |
See Notes to Financial Statements
8
Table of Contents
MFS Money Market Portfolio
FINANCIAL STATEMENTS | STATEMENTS OF CHANGES IN NET ASSETS
These statements describe the increases and/or decreases in net assets resulting from operations, any distributions, and any shareholder transactions.
For years ended 12/31 | 2012 | 2011 | ||||||
Change in net assets | ||||||||
From operations | ||||||||
Net investment income | $0 | $0 | ||||||
Net realized gain (loss) on investments | 0 | 366 | ||||||
Change in net assets from operations | $0 | $366 | ||||||
Change in net assets from fund share transactions | $212,377,435 | $(20,794,103 | ) | |||||
Total change in net assets | $212,377,435 | $(20,793,737 | ) | |||||
Net assets | ||||||||
At beginning of period | 320,030,066 | 340,823,803 | ||||||
At end of period | $532,407,501 | $320,030,066 |
See Notes to Financial Statements
9
Table of Contents
MFS Money Market Portfolio
FINANCIAL STATEMENTS | FINANCIAL HIGHLIGHTS
The financial highlights table is intended to help you understand the fund’s financial performance for the past 5 years. Certain information reflects financial results for a single fund share. The total returns in the table represent the rate by which an investor would have earned (or lost) on an investment in the fund share class (assuming reinvestment of all distributions) held for the entire period.
| Initial Class | Years ended 12/31 | |||||||||||||||||||
| 2012 | 2011 | 2010 | 2009 | 2008 | ||||||||||||||||
Net asset value, beginning of period | $1.00 | $1.00 | $1.00 | $1.00 | $1.00 | |||||||||||||||
| Income (loss) from investment operations | �� | |||||||||||||||||||
Net investment income (d) | $0.00 | $0.00 | $0.00 | $0.00 | (w) | $0.02 | ||||||||||||||
Net realized and unrealized gain (loss) on investments | 0.00 | 0.00 | (w) | 0.00 | (w) | 0.00 | (0.00 | )(w) | ||||||||||||
Total from investment operations | $0.00 | $0.00 | (w) | $0.00 | (w) | $0.00 | (w) | $0.02 | ||||||||||||
| Less distributions declared to shareholders | ||||||||||||||||||||
From net investment income | $— | $— | $— | $(0.00 | )(w) | $(0.02 | ) | |||||||||||||
Net asset value, end of period (m) | $1.00 | $1.00 | $1.00 | $1.00 | $1.00 | |||||||||||||||
Total return (%) (k)(r)(m) | 0.00 | 0.00 | 0.00 | 0.00 | (x) | 2.03 | ||||||||||||||
| Ratios (%) (to average net assets) and Supplemental data: | ||||||||||||||||||||
Expenses before expense reductions (f) | 0.55 | 0.58 | 0.59 | 0.60 | 0.59 | |||||||||||||||
Expenses after expense reductions (f) | 0.16 | 0.15 | 0.27 | 0.33 | 0.57 | |||||||||||||||
Net investment income | 0.00 | 0.00 | 0.00 | 0.00 | 2.02 | |||||||||||||||
Net assets at end of period (000 omitted) | $242,646 | $188,106 | $172,365 | $206,513 | $322,980 | |||||||||||||||
| Service Class | Years ended 12/31 | |||||||||||||||||||
| 2012 | 2011 | 2010 | 2009 | 2008 | ||||||||||||||||
Net asset value, beginning of period | $1.00 | $1.00 | $1.00 | $1.00 | $1.00 | |||||||||||||||
| Income (loss) from investment operations | ||||||||||||||||||||
Net investment income (d) | $0.00 | $0.00 | $0.00 | $0.00 | $0.02 | |||||||||||||||
Net realized and unrealized gain (loss) on investments | 0.00 | 0.00 | (w) | 0.00 | (w) | 0.00 | (0.00 | )(w) | ||||||||||||
Total from investment operations | $0.00 | $0.00 | (w) | $0.00 | (w) | $0.00 | $0.02 | |||||||||||||
| Less distributions declared to shareholders | ||||||||||||||||||||
From net investment income | $— | $— | $— | $(0.00 | )(w) | $(0.02 | ) | |||||||||||||
Net asset value, end of period (m) | $1.00 | $1.00 | $1.00 | $1.00 | $1.00 | |||||||||||||||
Total return (%) (k)(r)(m) | 0.00 | 0.00 | 0.00 | 0.00 | (x) | 1.80 | ||||||||||||||
| Ratios (%) (to average net assets) and Supplemental data: | ||||||||||||||||||||
Expenses before expense reductions (f) | 0.80 | 0.83 | 0.84 | 0.85 | 0.84 | |||||||||||||||
Expenses after expense reductions (f) | 0.15 | 0.16 | 0.27 | 0.33 | 0.80 | |||||||||||||||
Net investment income | 0.00 | 0.00 | 0.00 | 0.00 | 1.76 | |||||||||||||||
Net assets at end of period (000 omitted) | $289,762 | $131,924 | $168,459 | $192,109 | $241,404 | |||||||||||||||
| (d) | Per share data is based on average shares outstanding. |
| (f) | Ratios do not reflect reductions from fees paid indirectly, if applicable. |
| (k) | The total return does not reflect expenses that apply to separate accounts. Inclusion of these charges would reduce the total return figures for all periods shown. |
| (m) | The net asset values per share and total returns have been calculated on net assets which include adjustments made in accordance with U.S. generally accepted accounting principles required at period end for financial reporting purposes. |
| (r) | Certain expenses have been reduced without which performance would have been lower. |
| (w) | Per share amount was less than $0.01. |
| (x) | Total return was less than 0.01%. |
See Notes to Financial Statements
10
Table of Contents
MFS Money Market Portfolio
| (1) | Business and Organization |
MFS Money Market Portfolio (the fund) is a series of MFS Variable Insurance Trust II (the trust). The trust is organized as a Massachusetts business trust and is registered under the Investment Company Act of 1940, as amended, as an open-end management investment company. The shareholders of each series of the trust are separate accounts of insurance companies, which offer variable annuity and/or life insurance products, and qualified retirement and pension plans.
| (2) | Significant Accounting Policies |
General – The preparation of financial statements in conformity with U.S. generally accepted accounting principles requires management to make estimates and assumptions that affect the reported amounts of assets and liabilities, and disclosure of contingent assets and liabilities at the date of the financial statements and the reported amounts of revenues and expenses during the reporting period. Actual results could differ from those estimates. In the preparation of these financial statements, management has evaluated subsequent events occurring after the date of the fund’s Statement of Assets and Liabilities through the date that the financial statements were issued.
In this reporting period the fund adopted Financial Accounting Standards Board (FASB) Accounting Standards Update 2011-04, Fair Value Measurement (Topic 820) – Amendments to Achieve Common Fair Value Measurement and Disclosure Requirements in U.S. GAAP and IFRSs (“ASU 2011-04”). ASU 2011-04 seeks to improve the comparability of fair value measurements as presented and disclosed in financial statements prepared in accordance with U.S. GAAP and International Financial Reporting Standards (IFRS) by providing common requirements for fair value measurement and disclosure.
In December 2011, the FASB issued Accounting Standards Update 2011-11, Balance Sheet (Topic 210) – Disclosures about Offsetting Assets and Liabilities (“ASU 2011-11”). Effective for annual reporting periods beginning on or after January 1, 2013 and interim periods within those annual periods, ASU 2011-11 is intended to enhance disclosure requirements on the offsetting of financial assets and liabilities. Although still evaluating the potential impacts of ASU 2011-11 to the fund, management expects that the impact of the fund’s adoption will be limited to additional financial statement disclosures.
Investment Valuations – Pursuant to procedures approved by the Board of Trustees, investments held by the fund are generally valued at amortized cost, which approximates market value. Amortized cost involves valuing an instrument at its cost as adjusted for amortization of premium or accretion of discount rather than its current market value. The amortized cost value of an instrument can be different from the market value of an instrument.
Various inputs are used in determining the value of the fund’s assets or liabilities. These inputs are categorized into three broad levels. In certain cases, the inputs used to measure fair value may fall into different levels of the fair value hierarchy. In such cases, an investment’s level within the fair value hierarchy is based on the lowest level of input that is significant to the fair value measurement. The fund’s assessment of the significance of a particular input to the fair value measurement in its entirety requires judgment, and considers factors specific to the investment. Level 1 includes unadjusted quoted prices in active markets for identical assets or liabilities. Level 2 includes other significant observable market-based inputs (including quoted prices for similar securities, interest rates, prepayment speed, and credit risk). Level 3 includes unobservable inputs, which may include the adviser’s own assumptions in determining the fair value of investments. The following is a summary of the levels used as of December 31, 2012 in valuing the fund’s assets or liabilities:
| Investments at Value | Level 1 | Level 2 | Level 3 | Total | ||||||||||||
| Short term securities | $— | $533,296,614 | $— | $533,296,614 | ||||||||||||
For further information regarding security characteristics, see the Portfolio of Investments.
Repurchase Agreements – The fund entered into repurchase agreements with approved counterparties. Each repurchase agreement is recorded at cost. The fund requires that the securities collateral in a repurchase transaction be transferred to a custodian. The fund monitors, on a daily basis, the value of the collateral to ensure that its value, including accrued interest, is greater than amounts owed to the fund under each such repurchase agreement. The fund and other funds managed by MFS may utilize a joint trading account for the purpose of entering into one or more repurchase agreements.
Indemnifications – Under the fund’s organizational documents, its officers and Trustees may be indemnified against certain liabilities and expenses arising out of the performance of their duties to the fund. Additionally, in the normal course of business, the fund enters into agreements with service providers that may contain indemnification clauses. The fund’s maximum exposure under these agreements is unknown as this would involve future claims that may be made against the fund that have not yet occurred.
Investment Transactions and Income – Investment transactions are recorded on the trade date. Interest income is recorded on the accrual basis. All premium and discount is amortized or accreted for financial statement purposes in accordance with U.S. generally accepted accounting principles.
11
Table of Contents
MFS Money Market Portfolio
Notes to Financial Statements – continued
Fees Paid Indirectly – The fund’s custody fee may be reduced according to an arrangement that measures the value of cash deposited with the custodian by the fund. This amount, for the year ended December 31, 2012, is shown as a reduction of total expenses in the Statement of Operations.
Tax Matters and Distributions – The fund intends to qualify as a regulated investment company, as defined under Subchapter M of the Internal Revenue Code, and to distribute all of its taxable income, including realized capital gains. As a result, no provision for federal income tax is required. The fund’s federal tax returns, when filed, will remain subject to examination by the Internal Revenue Service for a three year period.
Distributions to shareholders are recorded on the ex-dividend date. Income and capital gain distributions are determined in accordance with income tax regulations, which may differ from U.S. generally accepted accounting principles. Certain capital accounts in the financial statements are periodically adjusted for permanent differences in order to reflect their tax character. These adjustments have no impact on net assets or net asset value per share. Temporary differences which arise from recognizing certain items of income, expense, gain or loss in different periods for financial statement and tax purposes will reverse at some time in the future. Distributions in excess of net investment income or net realized gains are temporary overdistributions for financial statement purposes resulting from differences in the recognition or classification of income or distributions for financial statement and tax purposes.
During the year ended December 31, 2012, there were no significant adjustments due to differences between book and tax accounting.
The fund declared no distributions for the years ended December 31, 2012 and December 31, 2011.
The federal tax cost and the tax basis components of distributable earnings were as follows:
| As of 12/31/12 | ||||
| Cost of investments | $533,296,614 | |||
| Capital loss carryforwards | (223,445 | ) |
Under the Regulated Investment Company Modernization Act of 2010 (the “Act”), net capital losses recognized after December 31, 2010 may be carried forward indefinitely, and their character is retained as short-term and/or long-term losses. Previously, net capital losses were carried forward for eight years and treated as short-term losses. As a transition rule, the Act requires that post-enactment net capital losses be used before pre-enactment net capital losses.
As of December 31, 2012, the fund had capital loss carryforwards available to offset future realized gains. Such losses expire as follows:
| Pre-enactment losses: | ||||
| 12/31/15 | $(30,520 | ) | ||
| 12/31/16 | (192,925 | ) | ||
| Total | $(223,445 | ) |
Multiple Classes of Shares of Beneficial Interest – The fund offers multiple classes of shares, which differ in their respective distribution and/or service fees. The fund’s income and common expenses are allocated to shareholders based on the value of settled shares outstanding of each class. The fund’s realized and unrealized gain (loss) are allocated to shareholders based on the daily net assets of each class. Dividends are declared separately for each class. Differences in per share dividend rates are generally due to differences in separate class expenses.
| (3) | Transactions with Affiliates |
Investment Adviser – The fund has an investment advisory agreement with MFS to provide overall investment management and related administrative services and facilities to the fund. The management fee is computed daily and paid monthly at the following annual rates:
| First $500 million of average daily net assets | 0.50% | |||
| Average daily net assets in excess of $500 million | 0.45% |
During the year ended December 31, 2012, MFS voluntarily waived receipt of $1,261,613 of the fund’s management fee in order to avoid a negative yield. For the year ended December 31, 2012, this voluntary waiver had the effect of reducing the management fee by 0.40% of average daily net assets on an annualized basis. The management fee incurred for the year ended December 31, 2012 was equivalent to an annual effective rate of 0.10% of the fund’s average daily net assets.
The investment adviser has agreed in writing to pay a portion of the fund’s total annual operating expenses, exclusive of interest, taxes, extraordinary expenses, brokerage and transaction costs, and investment-related expenses, such that total annual operating expenses do not exceed 0.57% of average daily net assets for the Initial Class shares and 0.82% of average daily net assets for the
12
Table of Contents
MFS Money Market Portfolio
Notes to Financial Statements – continued
Service Class shares. This written agreement will continue until modified by the fund’s Board of Trustees, but such agreement will continue at least until April 30, 2014. For the year ended December 31, 2012, the fund’s actual operating expenses did not exceed the limit and therefore, the investment adviser did not pay any portion of the fund’s expenses related to this agreement.
Distributor – MFS Fund Distributors, Inc. (MFD), a wholly-owned subsidiary of MFS, is the distributor of shares of the fund. The Trustees have adopted a distribution plan for the Service Class shares pursuant to Rule 12b-1 under the Investment Company Act of 1940.
The fund’s distribution plan provides that the fund will pay MFD distribution and/or service fees equal to 0.25% per annum of its average daily net assets attributable to Service Class shares as partial consideration for services performed and expenses incurred by MFD and financial intermediaries (including participating insurance companies that invest in the fund to fund variable annuity and variable life insurance contracts, sponsors of qualified retirement and pension plans that invest in the fund, and affiliates of these participating insurance companies and plan sponsors) in connection with the sale and distribution of the Service Class shares. MFD may subsequently pay all, or a portion, of the distribution and/or service fees to financial intermediaries. During the year ended December 31, 2012, MFD voluntarily waived receipt of $330,328 of the fund’s distribution and/or service fees in order to avoid a negative yield. For the year ended December 31, 2012, this voluntary waiver had the effect of reducing the distribution and/or service fees by 0.25% of average daily net assets attributable to Service Class shares on an annualized basis. The distribution and/or service fees incurred for the year ended December 31, 2012 were equivalent to an annual effective rate of 0.00% of the average daily net assets attributable to Service Class shares.
Shareholder Servicing Agent – MFS Service Center, Inc. (MFSC), a wholly-owned subsidiary of MFS, has contracted to provide transfer agent and recordkeeping functions in connection with the issuance, transfer, and redemption of each class of shares of the fund under a Shareholder Servicing Agent Agreement. During the year ended December 31, 2012, the fund did not pay MFSC a fee for this service. Effective April 1, 2013, the fund will be charged a shareholder servicing fee by MFSC.
Administrator – MFS provides certain financial, legal, shareholder communications, compliance, and other administrative services to the fund. Under an administrative services agreement, the fund partially reimburses MFS the costs incurred to provide these services. The fund is charged an annual fixed amount of $17,500 plus a fee based on average daily net assets. The administrative services fee incurred for the year ended December 31, 2012 was equivalent to an annual effective rate of 0.0174% of the fund’s average daily net assets.
Trustees’ and Officers’ Compensation – The fund pays compensation to independent Trustees in the form of a retainer, attendance fees, and additional compensation to Board and Committee chairpersons. The fund does not pay compensation directly to Trustees or officers of the fund who are also officers of the investment adviser, all of whom receive remuneration for their services to the fund from MFS. Certain officers and Trustees of the fund are officers or directors of MFS, MFD, and MFSC.
Other – This fund and certain other funds managed by MFS (the funds) have entered into services agreements (the Agreements) which provide for payment of fees by the funds to Tarantino LLC and Griffin Compliance LLC in return for the provision of services of an Independent Chief Compliance Officer (ICCO) and Assistant ICCO, respectively, for the funds. The ICCO and Assistant ICCO are officers of the funds and the sole members of Tarantino LLC and Griffin Compliance LLC, respectively. The funds can terminate the Agreements with Tarantino LLC and Griffin Compliance LLC at any time under the terms of the Agreements. For the year ended December 31, 2012, the aggregate fees paid by the fund to Tarantino LLC and Griffin Compliance LLC were $2,501 and are included in “Miscellaneous” expense in the Statement of Operations. MFS has agreed to reimburse the fund for a portion of the payments made by the fund in the amount of $1,091, which is shown as a reduction of total expenses in the Statement of Operations. Additionally, MFS has agreed to bear all expenses associated with office space, other administrative support, and supplies provided to the ICCO and Assistant ICCO.
13
Table of Contents
MFS Money Market Portfolio
Notes to Financial Statements – continued
| (4) | Shares of Beneficial Interest |
The fund’s Declaration of Trust permits the Trustees to issue an unlimited number of full and fractional shares of beneficial interest. Transactions in fund shares were as follows:
| Year ended 12/31/12 | Year ended 12/31/11 | |||||||||||||||
| Shares | Amount | Shares | Amount | |||||||||||||
| Shares sold | ||||||||||||||||
Initial Class | 119,845,606 | $119,845,605 | 66,388,299 | $66,388,299 | ||||||||||||
Service Class | 211,996,646 | 211,996,647 | 52,062,057 | 52,062,056 | ||||||||||||
| 331,842,252 | $331,842,252 | 118,450,356 | $118,450,355 | |||||||||||||
| Shares issued in connection with acquisition of Money Market Variable Account | ||||||||||||||||
Initial Class | 24,205,785 | $24,205,785 | ||||||||||||||
| Shares reacquired | ||||||||||||||||
Initial Class | (65,306,019 | ) | $(65,306,019 | ) | (74,853,361 | ) | $(74,853,361 | ) | ||||||||
Service Class | (54,158,798 | ) | (54,158,798 | ) | (88,596,882 | ) | (88,596,882 | ) | ||||||||
| (119,464,817 | ) | $(119,464,817 | ) | (163,450,243 | ) | $(163,450,243 | ) | |||||||||
| Net change | ||||||||||||||||
Initial Class | 54,539,587 | $54,539,586 | 15,740,723 | $15,740,723 | ||||||||||||
Service Class | 157,837,848 | 157,837,849 | (36,534,825 | ) | (36,534,826 | ) | ||||||||||
| 212,377,435 | $212,377,435 | (20,794,102 | ) | $(20,794,103 | ) | |||||||||||
| (5) | Line of Credit |
The fund and certain other funds managed by MFS participate in a $1.1 billion unsecured committed line of credit, subject to a $1 billion sublimit, provided by a syndication of banks under a credit agreement. Borrowings may be made for temporary financing needs. Interest is charged to each fund, based on its borrowings, generally at a rate equal to the higher of the Federal Reserve funds rate or one month LIBOR plus an agreed upon spread. A commitment fee, based on the average daily, unused portion of the committed line of credit, is allocated among the participating funds at the end of each calendar quarter. In addition, the fund and other funds managed by MFS have established unsecured uncommitted borrowing arrangements with certain banks for temporary financing needs. Interest is charged to each fund, based on its borrowings, at a rate equal to the Federal Reserve funds rate plus an agreed upon spread. For the year ended December 31, 2012, the fund’s commitment fee and interest expense were $1,911 and $0, respectively, and are included in “Miscellaneous” expense in the Statement of Operations.
| (6) | Acquisitions |
At the close of business on December 2, 2011, the fund with net assets of $297,118,105, acquired all of the investment-related assets and liabilities of Money Market Variable Account. The acquisition was part of a transaction in which the Money Market Variable Account was converted into a unit investment trust (“UIT”) that invests in the fund (the acquisition of the Account’s assets and liabilities and subsequent conversion into a UIT hereinafter referred to as the “Reorganization”). The Reorganization provided the contract owners of the Money Market Variable Account with the opportunity to participate in a larger combined portfolio with an identical investment objective and similar investment policies and strategies. The acquisition was accomplished by a tax-free exchange of 24,205,785 shares of the fund (valued at $24,205,785) for all of the investment-related assets and liabilities of Money Market Variable Account. Money Market Variable Account’s investments on that date were valued at approximately $24,276,204 with a cost basis of approximately $24,276,204. For financial reporting purposes, assets received and shares issued by the fund were recorded at fair value; however, the cost basis of the investments received from Money Market Variable Account were carried forward to align ongoing reporting of the fund’s realized and unrealized gains and losses with amounts distributable to shareholders for tax purposes.
14
Table of Contents
MFS Money Market Portfolio
REPORT OF INDEPENDENT REGISTERED PUBLIC ACCOUNTING FIRM
To the Board of Trustees of MFS Variable Insurance Trust II and the Shareholders of
MFS Money Market Portfolio:
We have audited the accompanying statement of assets and liabilities, including the portfolio of investments, of MFS Money Market Portfolio (the “Fund) (one of the series comprising MFS Variable Insurance Trust II) as of December 31, 2012, and the related statement of operations for the year then ended, the statements of changes in net assets for each of the two years in the period then ended, and the financial highlights for each of the five years in the period then ended. These financial statements and financial highlights are the responsibility of the Fund’s management. Our responsibility is to express an opinion on these financial statements and financial highlights based on our audits.
We conducted our audits in accordance with the standards of the Public Company Accounting Oversight Board (United States). Those standards require that we plan and perform the audit to obtain reasonable assurance about whether the financial statements and financial highlights are free of material misstatement. The Fund is not required to have, nor were we engaged to perform, an audit of its internal control over financial reporting. Our audits included consideration of internal control over financial reporting as a basis for designing audit procedures that are appropriate in the circumstances, but not for the purpose of expressing an opinion on the effectiveness of the Fund’s internal control over financial reporting. Accordingly, we express no such opinion. An audit also includes examining, on a test basis, evidence supporting the amounts and disclosures in the financial statements, assessing the accounting principles used and significant estimates made by management, as well as evaluating the overall financial statement presentation. Our procedures included confirmation of securities owned as of December 31, 2012, by correspondence with the custodian. We believe that our audits provide a reasonable basis for our opinion.
In our opinion, the financial statements and financial highlights referred to above present fairly, in all material respects, the financial position of MFS Money Market Portfolio as of December 31, 2012, the results of its operations for the year then ended, the changes in its net assets for each of the two years in the period then ended, and the financial highlights for each of the five years in the period then ended, in conformity with accounting principles generally accepted in the United States of America.
DELOITTE & TOUCHE LLP
Boston, Massachusetts
February 15, 2013
15
Table of Contents
MFS Money Market Portfolio
TRUSTEES AND OFFICERS – IDENTIFICATION AND BACKGROUND
The Trustees and officers of the Trust, as of February 1, 2013, are listed below, together with their principal occupations during the past five years. (Their titles may have varied during that period.) The address of each Trustee and officer is 111 Huntington Avenue, Boston, Massachusetts 02199-7618.
Name, Age | Position(s) with Fund | Trustee/Officer Since (h) | Principal Occupations During the Past Five Years | Other Directorships (j) | ||||
| INTERESTED TRUSTEES | ||||||||
Robert J. Manning (k) (age 49) | Trustee | February 2004 | Massachusetts Financial Services Company, Chairman, Chief Executive Officer and Director; President (until December 2009); Chief Investment Officer (until July 2010) | N/A | ||||
| INDEPENDENT TRUSTEES | ||||||||
David H. Gunning (age 70) | Trustee and Chair of Trustees | January 2004 | Private investor | Lincoln Electric Holdings, Inc. (welding equipment manufacturer), Director; Development Alternatives, Inc. (consulting), Director/Non-Executive Chairman; Portman Limited (mining), Director (until 2008) | ||||
Robert E. Butler (age 71) | Trustee | January 2006 | Consultant – investment company industry regulatory and compliance matters | N/A | ||||
Maureen R. Goldfarb (age 57) | Trustee | January 2009 | Private investor | N/A | ||||
William R. Gutow (age 71) | Trustee | December 1993 | Private investor and real estate consultant; Capitol Entertainment Management Company (video franchise), Vice Chairman | Atlantic Coast Tan (tanning salons), Vice Chairman (until 2007); Texas Donuts (donut franchise), Vice Chairman (until 2010) | ||||
Michael Hegarty (age 68) | Trustee | December 2004 | Private investor; Rouse Properties Inc. (real estate), Director | N/A | ||||
John P. Kavanaugh (age 58) | Trustee | January 2009 | Private investor | N/A | ||||
J. Dale Sherratt (age 74) | Trustee | June 1989 | Insight Resources, Inc. (acquisition planning specialists), President; Wellfleet Investments (investor in health care companies), Managing General Partner | N/A | ||||
| Laurie J. Thomsen (age 55) | Trustee | March 2005 | Private investor; New Profit, Inc. (venture philanthropy), Executive Partner (until 2010) | The Travelers Companies (insurance), Director | ||||
Robert W. Uek (age 71) | Trustee | January 2006 | Consultant to investment company industry | N/A | ||||
| OFFICERS | ||||||||
John M. Corcoran (k) (age 47) | President | October 2008 | Massachusetts Financial Services Company, Senior Vice President (since October 2008); State Street Bank and Trust (financial services provider), Senior Vice President, (until September 2008) | N/A | ||||
| Christopher R. Bohane (k) (age 39) | Assistant Secretary and Assistant Clerk | July 2005 | Massachusetts Financial Services Company, Vice President and Senior Counsel | N/A | ||||
Kino Clark (k) (age 44) | Assistant Treasurer | January 2012 | Massachusetts Financial Services Company, Vice President | N/A | ||||
Thomas H. Connors (k) (age 53) | Assistant Secretary and Assistant Clerk | September 2012 | Massachusetts Financial Services Company, Vice President and Senior Counsel; Deutsche Investment Management Americas Inc. (financial service provider), Director and Senior Counsel (until 2012) | N/A | ||||
Ethan D. Corey (k) (age 49) | Assistant Secretary and Assistant Clerk | July 2005 | Massachusetts Financial Services Company, Senior Vice President and Associate General Counsel | N/A | ||||
16
Table of Contents
MFS Money Market Portfolio
Trustees and Officers – continued
Name, Age | Position(s) with Fund | Trustee/Officer Since (h) | Principal Occupations During the Past Five Years | Other Directorships (j) | ||||
David L. DiLorenzo (k) (age 44) | Treasurer | July 2005 | Massachusetts Financial Services Company, Senior Vice President | N/A | ||||
Robyn L. Griffin (age 37) | Assistant Independent Chief Compliance Officer | August 2008 | Griffin Compliance LLC (provider of compliance services), Principal (since August 2008); State Street Corporation (financial services provider), Mutual Fund Administration Assistant Vice President (October 2006 – July 2008) | N/A | ||||
Brian E. Langenfeld (k) (age 39) | Assistant Secretary and Assistant Clerk | June 2006 | Massachusetts Financial Services Company, Vice President and Senior Counsel | N/A | ||||
Susan S. Newton (k) (age 62) | Assistant Secretary and Assistant Clerk | May 2005 | Massachusetts Financial Services Company, Senior Vice President and Associate General Counsel | N/A | ||||
Susan A. Pereira (k) (age 42) | Assistant Secretary and Assistant Clerk | July 2005 | Massachusetts Financial Services Company, Vice President and Senior Counsel | N/A | ||||
Kasey L. Phillips (k) (age 42) | Assistant Treasurer | September 2012 | Massachusetts Financial Services Company, Vice President; Wells Fargo Funds Management, LLC, Senior Vice President, Fund Treasurer (until 2012) | N/A | ||||
Mark N. Polebaum (k) (age 60) | Secretary and Clerk | January 2006 | Massachusetts Financial Services Company, Executive Vice President, General Counsel and Secretary | N/A | ||||
Frank L. Tarantino (age 68) | Independent Chief Compliance Officer | June 2004 | Tarantino LLC (provider of compliance services), Principal | N/A | ||||
Richard S. Weitzel (k) (age 42) | Assistant Secretary and Assistant Clerk | October 2007 | Massachusetts Financial Services Company, Senior Vice President and Associate General Counsel | N/A | ||||
James O. Yost (k) (age 52) | Deputy Treasurer | September 1990 | Massachusetts Financial Services Company, Senior Vice President | N/A | ||||
| (h) | Date first appointed to serve as Trustee/officer of an MFS fund. Each Trustee has served continuously since appointment unless indicated otherwise. For the period from December 15, 2004 until February 22, 2005, Mr. Manning served as Advisory Trustee. For the period October 2008, until January 2012, Mr. Corcoran served as Treasurer of the Funds. Prior to January 2012, Messrs. DiLorenzo and Yost served as Assistant Treasurers of the Funds. |
| (j) | Directorships or trusteeships of companies required to report to the Securities and Exchange Commission (i.e., “public companies”). |
| (k) | “Interested person” of the Trust within the meaning of the Investment Company Act of 1940 (referred to as the 1940 Act), which is the principal federal law governing investment companies like the fund, as a result of position with MFS. The address of MFS is 111 Huntington Avenue, Boston, Massachusetts 02199-7618. |
Each Trustee has been elected by shareholders and each Trustee and officer holds office until his or her successor is chosen and qualified or until his or her earlier death, resignation, retirement or removal. The Trust does not hold annual meetings for the purpose of electing Trustees, and Trustees are not elected for fixed terms. Messrs. Butler, Kavanaugh, Uek and Ms. Thomsen are members of the Trust’s Audit Committee.
Each of the Fund’s Trustees and officers holds comparable positions with certain other funds of which MFS or a subsidiary is the investment adviser or distributor, and, in the case of the officers, with certain affiliates of MFS. As of January 1, 2013, the Trustees served as board members of 143 funds within the MFS Family of Funds.
17
Table of Contents
MFS Money Market Portfolio
Trustees and Officers – continued
The Statement of Additional Information for the Fund includes further information about the Trustees and is available without charge upon request by calling 1-800-225-2606.
Investment Adviser Massachusetts Financial Services Company 111 Huntington Avenue Boston, MA 02199-7618 | Custodian State Street Bank and Trust 1 Lincoln Street Boston, MA 02111-2900 | |
Distributor MFS Fund Distributors, Inc. 111 Huntington Avenue Boston, MA 02199-7618 | Independent Registered Public Accounting Firm Deloitte & Touche LLP 200 Berkeley Street Boston, MA 02116 | |
Portfolio Manager Edward O’Dette |
18
Table of Contents
MFS Money Market Portfolio
BOARD REVIEW OF INVESTMENT ADVISORY AGREEMENT
A discussion regarding the Board’s recent approval of the fund’s Investment Advisory Agreement with MFS is available by clicking on the fund’s name under “Variable Insurance Portfolios – VIT II” in the “Products” section of the MFS Web site (mfs.com).
PROXY VOTING POLICIES AND INFORMATION
A general description of the MFS funds’ proxy voting policies and procedures is available without charge, upon request, by calling
1-800-225-2606, by visiting the Proxy Voting section of mfs.com or by visiting the SEC’s Web site at http://www.sec.gov.
Information regarding how the fund voted proxies relating to portfolio securities during the most recent twelve-month period ended June 30 is available without charge by visiting the Proxy Voting section of mfs.com or by visiting the SEC’s Web site at http://www.sec.gov.
QUARTERLY PORTFOLIO DISCLOSURE
The fund will file a complete schedule of portfolio holdings with the Securities and Exchange Commission (the Commission) for the first and third quarters of each fiscal year on Form N-Q. The fund’s Form N-Q is available on the EDGAR database on the Commission’s Internet Web site at http://www.sec.gov, and may be reviewed and copied at the:
Public Reference Room
Securities and Exchange Commission
100 F Street, NE, Room 1580
Washington, D.C. 20549
Information on the operation of the Public Reference Room may be obtained by calling the Commission at 1-800-SEC-0330. Copies of the fund’s Form N-Q also may be obtained, upon payment of a duplicating fee, by electronic request at the following e-mail address: publicinfo@sec.gov or by writing the Public Reference Section at the above address.
From time to time, MFS may post important information about the fund or the MFS funds on the MFS web site (mfs.com). This information is available by visiting the “News & Commentary” section of mfs.com or by clicking on the fund’s name under “Variable Insurance Portfolios – VIT II” in the “Products” section of mfs.com.
19
Table of Contents
rev. 3/11

| Why? | Financial companies choose how they share your personal information. Federal law gives consumers the right to limit some but not all sharing. Federal law also requires us to tell you how we collect, share, and protect your personal information. Please read this notice carefully to understand what we do. |
| What? | The types of personal information we collect and share depend on the product or service you have with us. This information can include:
• Social Security number and account balances • Account transactions and transaction history • Checking account information and wire transfer instructions
When you are no longer our customer, we continue to share your information as described in this notice. |
| How? | All financial companies need to share customers’ personal information to run their everyday business. In the section below, we list the reasons financial companies can share their customers’ personal information; the reasons MFS chooses to share; and whether you can limit this sharing. |
| Reasons we can share your personal information | Does MFS share? | Can you limit this sharing? | ||
For our everyday business purposes – such as to process your transactions, maintain your account(s), respond to court orders and legal investigations, or report to credit bureaus | Yes | No | ||
For our marketing purposes – to offer our products and services to you | No | We don’t share | ||
| For joint marketing with other financial companies | No | We don’t share | ||
For our affiliates’ everyday business purposes – information about your transactions and experiences | No | We don’t share | ||
For our affiliates’ everyday business purposes – information about your creditworthiness | No | We don’t share | ||
| For nonaffiliates to market to you | No | We don’t share |
| Questions? | Call 800-225-2606 or go to mfs.com. |
20
Table of Contents
| Page 2 |
| Who we are | ||
| Who is providing this notice? | MFS Funds, MFS Investment Management, MFS Institutional Advisors, Inc., MFS Fund Distributors, Inc., MFS Heritage Trust Company, and MFS Service Center, Inc. | |
| What we do | ||
| How does MFS protect my personal information? | To protect your personal information from unauthorized access and use, we use security measures that comply with federal law. These measures include procedural, electronic, and physical safeguards for the protection of the personal information we collect about you. | |
| How does MFS collect my personal information? | We collect your personal information, for example, when you
• open an account or provide account information • direct us to buy securities or direct us to sell your securities • make a wire transfer
We also collect your personal information from others, such as credit bureaus, affiliates and other companies. | |
| Why can’t I limit all sharing? | Federal law gives you the right to limit only
• sharing for affiliates’ everyday business purposes – information about your creditworthiness • affiliates from using your information to market to you • sharing for nonaffiliates to market to you
State laws and individual companies may give you additional rights to limit sharing. | |
| Definitions | ||
| Affiliates | Companies related by common ownership or control. They can be financial and nonfinancial companies.
•MFS does not share personal information with affiliates, except for everyday business purposes as described on page one of this notice. | |
| Nonaffiliates | Companies not related by common ownership or control. They can be financial and nonfinancial companies.
•MFS does not share with nonaffiliates so they can market to you. | |
| Joint Marketing | A formal agreement between nonaffiliated financial companies that together market financial products or services to you.
•MFS doesn’t jointly market. | |
| Other important information | ||
| If you own an MFS product or receive an MFS service in the name of a third party such as a bank or broker-dealer, their privacy policy may apply to you instead of ours. | ||
21
Table of Contents
Table of Contents
ANNUAL REPORT
December 31, 2012

MFS® NEW DISCOVERY PORTFOLIO
MFS® Variable Insurance Trust II

NWD-ANN
Table of Contents
MFS® NEW DISCOVERY PORTFOLIO
The report is prepared for the general information of contract owners. It is authorized for distribution to prospective investors only when preceded or accompanied by a current prospectus.
NOT FDIC INSURED Ÿ MAY LOSE VALUE Ÿ NO BANK OR CREDIT UNION GUARANTEE Ÿ NOT A DEPOSIT Ÿ NOT INSURED BY ANY FEDERAL GOVERNMENT AGENCY OR NCUA/NCUSIF
Table of Contents
MFS New Discovery Portfolio
LETTER FROM THE CHAIRMAN AND CEO

Dear Contract Owners:
The global market outlook for 2013 is one of cautious optimism. While we are seeing some positive economic trends in the United States, Europe and China, the overall environment remains challenging. In the United States, the recent fiscal cliff agreement was received positively by investors, even though it mostly addressed pressing taxation issues and did not resolve additional concerns, including the need for spending cuts and a large-scale reduction of the federal debt. These issues will be front and center again in the spring. Despite the ongoing uncertainty, economic tailwinds are gathering strength as the U.S. housing and job markets are improving and consumer confidence is rising.
Overseas, the debt crisis continues to weigh heavily on eurozone markets, with even Germany — long an economic stalwart — experiencing some contraction. These ongoing challenges could be a drag on global market performance this year. In Asia, manufacturing activity has accelerated in emerging markets such as China and India, and we are seeing signs of stabilized loan growth in China, a leading indicator of that country’s economic health. In contrast, Japan’s economy is contracting sharply under deflationary pressures. Nevertheless, Japanese markets have responded favorably to early actions by the new government, which appears determined to act aggressively, along with the Bank of Japan, to stimulate growth.
As always, managing risk in the face of uncertainty remains a top priority for investors. At MFS®, our uniquely collaborative investment process revolves around global research and our disciplined risk management approach. Our global team of investment professionals shares ideas and evaluates opportunities across continents, investment disciplines and asset classes — all with a goal of building better insights, and ultimately better results, for our clients.
We remain mindful of the many economic challenges investors face today, and believe it is more important than ever to maintain a long-term view, employ time-tested principles, such as asset allocation and diversification, and work closely with investment advisors to identify and pursue the most suitable opportunities.
Respectfully,

Robert J. Manning
Chairman and Chief Executive Officer
MFS Investment Management®
February 15, 2013
The opinions expressed in this letter are subject to change, may not be relied upon for investment advice, and no forecasts can be guaranteed.
1
Table of Contents
MFS New Discovery Portfolio
Portfolio structure

| Top ten holdings | ||||
| Cabot Oil & Gas Corp. | 2.2% | |||
| Conceptus, Inc. | 2.1% | |||
| Atwood Oceanics, Inc. | 1.9% | |||
| Green Mountain Coffee Roasters, Inc. | 1.8% | |||
| Diana Shipping, Inc. | 1.8% | |||
| Swift Transportation Co. | 1.7% | |||
| Polypore International, Inc. | 1.7% | |||
| HomeAway, Inc. | 1.7% | |||
| FleetMatics Group PLC | 1.6% | |||
| Joy Global, Inc. | 1.6% |
| Equity sectors | ||||
| Technology | 19.7% | |||
| Health Care | 17.9% | |||
| Industrial Goods & Services | 14.4% | |||
| Energy | 11.4% | |||
| Special Products & Services | 7.6% | |||
| Basic Materials | 6.6% | |||
| Retailing | 6.5% | |||
| Transportation | 5.4% | |||
| Leisure | 3.9% | |||
| Consumer Staples | 2.5% | |||
| Autos & Housing | 1.2% | |||
| Financial Services | 0.9% |
Percentages are based on net assets as of 12/31/12.
The portfolio is actively managed and current holdings may be different.
2
Table of Contents
MFS New Discovery Portfolio
Summary of Results
For the twelve months ended December 31, 2012, Initial Class shares of the MFS New Discovery Portfolio (“fund”) provided a total return of 21.22%, while Service Class shares of the fund provided a total return of 20.88%. These compare with a return of 14.59% over the same period for the fund’s benchmark, the Russell 2000 Growth Index.
Market Environment
The beginning of the period was characterized by a risk-on sentiment as a result of additional liquidity measures by the Federal Reserve Bank (“Fed”) and the European Central Bank (“ECB”) as well as a commensurate improvement in macroeconomic conditions. During this time, global equity valuations rose, credit spreads contracted, and high-quality sovereign yields increased modestly.
During the middle of the period, however, conditions worsened, driven by broadly weaker global macroeconomic indicators, as well as renewed concerns over the eurozone’s capacity and determination to address its ongoing crisis. Despite this deterioration, broad market sentiment remained relatively resilient as equity markets generally maintained gains and credit spreads did not indicate deterioration.
However, this renewed weakness in the fundamentals precipitated a further round of monetary easing by both the Fed (through a third round of quantitative easing) and the ECB (through a new bond purchase facility) in the second half of the period, which soon instilled additional confidence in risk markets. Nonetheless, towards the end of the period, weaker equity earnings reports and declining forward guidance caused market sentiment to soften. In addition, as we moved toward year end, the fiscal cliff negotiations between the Republicans in the U.S. Congress and President Obama were a particular source of market attention, where uncertainty surrounding the fiscal negotiations continued right up to the end-of-year deadline.
Contributors to Performance
Strong stock selection in both the industrial goods & services and retailing sectors was a principal contributor to the fund’s relative performance. Within industrial goods & services, holdings of optical fiber-based lasers manufacturer IPG Photonics (b) boosted relative returns. Within retailing, the fund’s overweight position in strong-performing women’s apparel retailer Francesca’s Holdings (h) also strengthened relative performance.
Security selection in the energy sector benefited relative returns during the period, led by the fund’s holdings of strong-performing oil and gas exploration company Cabot Oil & Gas Corp (b).
The combination of strong stock selection and an underweight position in the health care sector also supported relative performance. Holdings of permanent birth control device maker Conceptus and retirement community operator Brookdale Senior Living (b), both of which outperformed the benchmark during the period, aided relative returns.
Stock selection in the autos & housing sector was another positive factor for relative returns. Here, holdings of construction equipment company Eagle Materials (h) and homebuilder Pulte Group (b)(h) contributed to relative results as both stocks outperformed the benchmark over the reporting period.
Elsewhere, the fund’s holdings of information technology infrastructure management provider SolarWinds, specialized payment products provider FleetCor Technologies (b), and data and information management software provider CommVault Systems supported relative results. Shares of FleetCor Technologies traded higher due, in part, to favorable acquisition activity and fuel spreads which positively affected earnings.
During the reporting period, the fund’s currency exposure contributed to relative performance. All of MFS’ investment decisions are driven by the fundamentals of each individual opportunity and, as such, it is common for our portfolios to have different currency exposure than the benchmark.
Detractors from Performance
Security selection and, to a lesser extent, the fund’s underweight position in the financial services sector was a negative factor for relative performance. There were no individual holdings within this sector that were among the fund’s top relative detractors for the reporting period.
Stock selection in the special products & services sector also hindered relative performance. Holding shares of weak-performing marketing software provider Constant Contact and Indian e-commerce travel agency MakeMyTrip Limited (b) held back relative returns. Constant Contact’s stock declined during the reporting period after investors appeared to have reacted negatively to the firm’s acquisition of internet software and services provider SinglePlatform.
Stocks in other sectors that were among the fund’s top relative detractors for the period included holdings of the world’s largest McDonald’s franchisee Arcos Dorados Holdings (b), semiconductor company CEVA (h), medical device manufacturer NxStage Medical,
3
Table of Contents
MFS New Discovery Portfolio
Management Review – continued
cloud software and services company ServiceSource International (h), independent oil exploration and production company Midstates Petroleum (h), health information services provider WebMD (b)(h), and mobile advertising platform company Millennial Media. Not owning shares of strong-performing biopharmaceutical company Pharmacyclics also weakened relative performance.
Respectfully,
Thomas Wetherald
Portfolio Manager
| (b) | Security is not a benchmark constituent. |
| (h) | Security was not held in the portfolio at period end. |
The views expressed in this report are those of the portfolio manager only through the end of the period of the report as stated on the cover and do not necessarily reflect the views of MFS or any other person in the MFS organization. These views are subject to change at any time based on market or other conditions, and MFS disclaims any responsibility to update such views. These views may not be relied upon as investment advice or an indication of trading intent on behalf of any MFS portfolio. References to specific securities are not recommendations of such securities, and may not be representative of any MFS portfolio’s current or future investments.
4
Table of Contents
MFS New Discovery Portfolio
PERFORMANCE SUMMARY THROUGH 12/31/12
The following chart illustrates the historical performance of the fund in comparison to its benchmark(s). Benchmarks are unmanaged and may not be invested in directly. Benchmark returns do not reflect any fees or expenses. The performance of other share classes will be greater than or less than that of the class depicted below. (See Notes to Performance Summary.)
Performance data shown represents past performance and is no guarantee of future results. Investment return and principal value fluctuate so your units, when sold, may be worth more or less than the original cost; current performance may be lower or higher than quoted. The performance shown does not reflect the deduction of taxes, if any, that a contract holder would pay on fund distributions or the redemption of contract units. The returns for the fund shown also do not reflect the deduction of expenses associated with variable products, such as mortality and expense risk charges, separate account charges, and sales charges imposed by the insurance company separate accounts. Such expenses would reduce the overall returns shown.
Growth of a Hypothetical $10,000 Investment
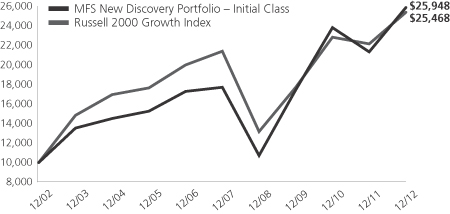
Total Returns through 12/31/12
Average annual total returns
| Share Class | Class inception date | 1-yr | 5-yr | 10-yr | ||||||||
| Initial Class | 5/06/98 | 21.22% | 7.88% | 10.00% | ||||||||
| Service Class | 8/24/01 | 20.88% | 7.62% | 9.74% | ||||||||
| Comparative benchmark | ||||||||||||
| Russell 2000 Growth Index (f) | 14.59% | 3.49% | 9.80% | |||||||||
| (f) | Source: FactSet Research Systems Inc. |
Benchmark Definition
Russell 2000 Growth Index – constructed to provide a comprehensive barometer for growth securities in the small-cap segment of the U.S. equity universe. Companies in this index generally have higher price-to-book ratios and higher forecasted growth values.
It is not possible to invest directly in an index.
Notes to Performance Summary
Average annual total return represents the average annual change in value for each share class for the periods presented.
Performance results reflect any applicable expense subsidies and waivers in effect during the periods shown. Without such subsidies and waivers the fund’s performance results would be less favorable. Please see the prospectus and financial statements for complete details. All results are historical and assume the reinvestment of any dividends and capital gains distributions.
Performance results do not include adjustments made for financial reporting purposes in accordance with U.S. generally accepted accounting principles and may differ from amounts reported in the financial highlights.
From time to time the fund may receive proceeds from litigation settlements, without which performance would be lower.
5
Table of Contents
MFS New Discovery Portfolio
Fund Expenses Borne by the Contract Holders During the Period,
July 1, 2012 through December 31, 2012
As a contract holder of the fund, you incur ongoing costs, including management fees; distribution and/or service (12b-1) fees; and other fund expenses. This example is intended to help you understand your ongoing costs (in dollars) of investing in the fund and to compare these costs with the ongoing costs of investing in other mutual funds.
The example is based on an investment of $1,000 invested at the beginning of the period and held for the entire period July 1, 2012 through December 31, 2012.
Actual Expenses
The first line for each share class in the following table provides information about actual account values and actual expenses. You may use the information in this line, together with the amount you invested, to estimate the expenses that you paid over the period. Simply divide your account value by $1,000 (for example, an $8,600 account value divided by $1,000 = 8.6), then multiply the result by the number in the first line under the heading entitled “Expenses Paid During Period” to estimate the expenses you paid on your account during this period.
Hypothetical Example for Comparison Purposes
The second line for each share class in the following table provides information about hypothetical account values and hypothetical expenses based on the fund’s actual expense ratio and an assumed rate of return of 5% per year before expenses, which is not the fund’s actual return. The hypothetical account values and expenses may not be used to estimate the actual ending account balance or expenses you paid for the period. You may use this information to compare the ongoing costs of investing in the fund and other funds. To do so, compare this 5% hypothetical example with the 5% hypothetical examples that appear in the shareholder reports of the other funds.
Please note that the expenses shown in the table are meant to highlight the fund’s ongoing costs only and do not take into account the fees and expenses imposed under the variable contracts through which your investment in the fund is made. Therefore, the second line for each share class in the table is useful in comparing ongoing costs associated with an investment in vehicles (such as the fund) which fund benefits under variable annuity and variable life insurance contracts and to qualified pension and retirement plans only, and will not help you determine the relative total costs of investing in the fund through variable annuity and variable life insurance contracts. If the fees and expenses imposed under the variable contracts were included, your costs would have been higher.
| Share Class | Annualized Expense Ratio | Beginning Account Value 7/01/12 | Ending Account Value 12/31/12 | Expenses Paid During Period (p) 7/01/12-12/31/12 | ||||||||||||||
| Initial Class | Actual | 0.95% | $1,000.00 | $1,082.59 | $4.97 | |||||||||||||
| Hypothetical (h) | 0.95% | $1,000.00 | $1,020.36 | $4.82 | ||||||||||||||
| Service Class | Actual | 1.20% | $1,000.00 | $1,081.67 | $6.28 | |||||||||||||
| Hypothetical (h) | 1.20% | $1,000.00 | $1,019.10 | $6.09 | ||||||||||||||
| (h) | 5% class return per year before expenses. |
| (p) | Expenses paid are equal to each class’s annualized expense ratio, as shown above, multiplied by the average account value over the period, multiplied by the number of days in the period, divided by the number of days in the year. |
6
Table of Contents
MFS New Discovery Portfolio
PORTFOLIO OF INVESTMENTS – 12/31/12
The Portfolio of Investments is a complete list of all securities owned by your fund. It is categorized by broad-based asset classes.
| Issuer | Shares/Par | Value ($) | ||||||
| COMMON STOCKS – 98.0% | ||||||||
| Aerospace – 0.5% | ||||||||
| Kaman Corp. | 21,247 | $ | 781,890 | |||||
|
| |||||||
| Automotive – 0.4% | ||||||||
| Delphi Automotive PLC (a) | 16,960 | $ | 648,720 | |||||
|
| |||||||
| Biotechnology – 1.1% | ||||||||
| Anacor Pharmaceuticals, Inc. (a) | 82,838 | $ | 430,758 | |||||
| Hyperion Therapeutics, Inc. (a) | 13,440 | 151,603 | ||||||
| ViroPharma, Inc. (a) | 52,970 | 1,205,597 | ||||||
|
| |||||||
| $ | 1,787,958 | |||||||
|
| |||||||
| Business Services – 5.3% | ||||||||
| Concur Technologies, Inc. (a) | 26,380 | $ | 1,781,178 | |||||
| Constant Contact, Inc. (a) | 176,178 | 2,503,489 | ||||||
| FleetCor Technologies, Inc. (a) | 21,952 | 1,177,725 | ||||||
| Gartner, Inc. (a) | 31,550 | 1,451,931 | ||||||
| Performant Financial Corp. (a) | 129,100 | 1,303,910 | ||||||
|
| |||||||
| $ | 8,218,233 | |||||||
|
| |||||||
| Chemicals – 0.9% | ||||||||
| Intrepid Potash, Inc. | 68,940 | $ | 1,467,733 | |||||
|
| |||||||
| Computer Software – 4.9% | ||||||||
| ANSYS, Inc. (a) | 24,890 | $ | 1,676,093 | |||||
| CommVault Systems, Inc. (a) | 19,600 | 1,366,316 | ||||||
| Nuance Communications, Inc. (a) | 71,572 | 1,597,487 | ||||||
| Qlik Technologies, Inc. (a) | 79,514 | 1,727,044 | ||||||
| SolarWinds, Inc. (a) | 23,448 | 1,229,848 | ||||||
|
| |||||||
| $ | 7,596,788 | |||||||
|
| |||||||
| Computer Software – Systems – 7.3% | ||||||||
| E2open, Inc. (a) | 28,320 | $ | 401,011 | |||||
| Ellie Mae, Inc. (a) | 21,890 | 607,448 | ||||||
| Exa Corp. (a) | 61,760 | 600,925 | ||||||
| ExactTarget, Inc. (a) | 59,380 | 1,187,600 | ||||||
| FleetMatics Group PLC (a) | 102,200 | 2,571,352 | ||||||
| Fusion-io, Inc. (a) | 40,118 | 919,906 | ||||||
| Greenway Medical Technologies, Inc. (a) | 44,450 | 682,752 | ||||||
| Guidewire Software, Inc. (a) | 43,320 | 1,287,470 | ||||||
| PROS Holdings, Inc. (a) | 42,254 | 772,826 | ||||||
| SciQuest, Inc. (a) | 145,688 | 2,310,612 | ||||||
|
| |||||||
| $ | 11,341,902 | |||||||
|
| |||||||
| Construction – 0.8% | ||||||||
| NVR, Inc. (a) | 1,293 | $ | 1,189,560 | |||||
|
| |||||||
| Consumer Services – 2.3% | ||||||||
| HomeAway, Inc. (a) | 117,848 | $ | 2,592,656 | |||||
| MakeMyTrip Ltd. (a) | 79,980 | 994,951 | ||||||
|
| |||||||
| $ | 3,587,607 | |||||||
|
| |||||||
| Electrical Equipment – 2.7% | ||||||||
| MSC Industrial Direct Co., Inc., “A” | 27,212 | $ | 2,051,241 | |||||
| Sensata Technologies Holding B.V. (a) | 68,988 | 2,240,730 | ||||||
|
| |||||||
| $ | 4,291,971 | |||||||
|
| |||||||
| Issuer | Shares/Par | Value ($) | ||||||
| COMMON STOCKS – continued | ||||||||
| Electronics – 4.4% | ||||||||
| 3D Systems, Inc. (a) | 11,280 | $ | 601,788 | |||||
| Monolithic Power Systems, Inc. | 92,641 | 2,064,041 | ||||||
| Stratasys Ltd. (a) | 7,377 | 591,267 | ||||||
| Ultratech, Inc. (a) | 42,160 | 1,572,568 | ||||||
| Universal Display Corp. (a) | 14,691 | 376,383 | ||||||
| Veeco Instruments, Inc. (a) | 57,950 | 1,710,684 | ||||||
|
| |||||||
| $ | 6,916,731 | |||||||
|
| |||||||
| Energy – Independent – 3.8% | ||||||||
| Cabot Oil & Gas Corp. | 69,748 | $ | 3,469,266 | |||||
| Range Resources Corp. | 40,097 | 2,519,295 | ||||||
|
| |||||||
| $ | 5,988,561 | |||||||
|
| |||||||
| Entertainment – 0.5% | ||||||||
| Six Flags Entertainment Corp. | 12,889 | $ | 788,807 | |||||
|
| |||||||
| Food & Beverages – 2.5% | ||||||||
| Flowers Foods, Inc. | 48,000 | $ | 1,116,960 | |||||
| Green Mountain Coffee Roasters, Inc. (a) | 68,250 | 2,822,820 | ||||||
|
| |||||||
| $ | 3,939,780 | |||||||
|
| |||||||
| General Merchandise – 1.2% | ||||||||
| Five Below, Inc. (a) | 57,130 | $ | 1,830,445 | |||||
|
| |||||||
| Internet – 3.1% | ||||||||
| Millennial Media, Inc. (a) | 82,500 | $ | 1,033,725 | |||||
| Rackspace Hosting, Inc. (a) | 21,690 | 1,610,916 | ||||||
| Shutterfly, Inc. (a) | 57,140 | 1,706,772 | ||||||
| Shutterstock, Inc. (a) | 20,160 | 524,160 | ||||||
|
| |||||||
| $ | 4,875,573 | |||||||
|
| |||||||
| Machinery & Tools – 11.2% | ||||||||
| Allison Transmission Holdings, Inc. | 82,640 | $ | 1,687,509 | |||||
| IPG Photonics Corp. | 27,172 | 1,811,014 | ||||||
| Joy Global, Inc. | 39,524 | 2,520,841 | ||||||
| Kennametal, Inc. | 53,020 | 2,120,800 | ||||||
| Polypore International, Inc. (a) | 55,993 | 2,603,675 | ||||||
| Proto Labs, Inc. (a) | 41,790 | 1,647,362 | ||||||
| Titan Machinery, Inc. (a) | 67,400 | 1,664,780 | ||||||
| United Rentals, Inc. (a) | 34,706 | 1,579,817 | ||||||
| WABCO Holdings, Inc. (a) | 27,817 | 1,813,390 | ||||||
|
| |||||||
| $ | 17,449,188 | |||||||
|
| |||||||
| Medical & Health Technology & Services – 5.5% | ||||||||
| Advisory Board Co. (a) | 22,766 | $ | 1,065,221 | |||||
| Brookdale Senior Living, Inc. (a) | 94,504 | 2,392,841 | ||||||
| Capital Senior Living Corp. (a) | 68,700 | 1,284,003 | ||||||
| Healthcare Services Group, Inc. | 61,356 | 1,425,300 | ||||||
| HMS Holdings Corp. (a) | 55,640 | 1,442,189 | ||||||
| IDEXX Laboratories, Inc. (a) | 11,080 | 1,028,224 | ||||||
|
| |||||||
| $ | 8,637,778 | |||||||
|
| |||||||
7
Table of Contents
MFS New Discovery Portfolio
Portfolio of Investments – continued
| Issuer | Shares/Par | Value ($) | ||||||
| COMMON STOCKS – continued | ||||||||
| Medical Equipment – 10.8% | ||||||||
| Align Technology, Inc. (a) | 80,711 | $ | 2,239,730 | |||||
| Cepheid, Inc. (a) | 66,631 | 2,252,794 | ||||||
| Conceptus, Inc. (a) | 153,722 | 3,229,699 | ||||||
| DexCom, Inc. (a) | 74,809 | 1,018,150 | ||||||
| Endologix, Inc. (a) | 155,772 | 2,218,193 | ||||||
| EnteroMedics, Inc. (a) | 149,400 | 418,320 | ||||||
| Globus Medical, Inc., “A” (a) | 97,140 | 1,018,999 | ||||||
| Novadaq Technologies, Inc. (a) | 23,040 | 204,595 | ||||||
| NxStage Medical, Inc. (a) | 132,095 | 1,486,069 | ||||||
| Uroplasty, Inc. (a) | 157,935 | 510,130 | ||||||
| Varian Medical Systems, Inc. (a) | 15,740 | 1,105,578 | ||||||
| Volcano Corp. (a) | 48,624 | 1,148,013 | ||||||
|
| |||||||
| $ | 16,850,270 | |||||||
|
| |||||||
| Metals & Mining – 3.9% | ||||||||
| Globe Specialty Metals, Inc. | 159,207 | $ | 2,189,096 | |||||
| GrafTech International Ltd. (a) | 132,780 | 1,246,804 | ||||||
| Iluka Resources Ltd. | 205,808 | 1,994,434 | ||||||
| Molycorp, Inc. (a)(l) | 66,630 | 628,987 | ||||||
|
| |||||||
| $ | 6,059,321 | |||||||
|
| |||||||
| Oil Services – 7.6% | ||||||||
| Atwood Oceanics, Inc. (a) | 63,979 | $ | 2,929,598 | |||||
| Basic Energy Services, Inc. (a) | 108,240 | 1,235,018 | ||||||
| Core Laboratories N.V. | 7,280 | 795,777 | ||||||
| Dresser-Rand Group, Inc. (a) | 44,683 | 2,508,504 | ||||||
| Helmerich & Payne, Inc. | 21,670 | 1,213,737 | ||||||
| Key Energy Services, Inc. (a) | 170,320 | 1,183,724 | ||||||
| Superior Energy Services, Inc. (a) | 93,410 | 1,935,455 | ||||||
|
| |||||||
| $ | 11,801,813 | |||||||
|
| |||||||
| Other Banks & Diversified Financials – 0.9% | ||||||||
| Air Lease Corp. (a) | 43,488 | $ | 934,992 | |||||
| First Republic Bank | 12,260 | 401,883 | ||||||
|
| |||||||
| $ | 1,336,875 | |||||||
|
| |||||||
| Pharmaceuticals – 0.5% | ||||||||
| Kythera Biopharmaceuticals, Inc. (a) | 28,090 | $ | 852,251 | |||||
|
| |||||||
| Precious Metals & Minerals – 0.3% | ||||||||
| Colossus Minerals, Inc. (a) | 96,493 | $ | 447,203 | |||||
|
| |||||||
| Railroad & Shipping – 2.2% | ||||||||
| Diana Shipping, Inc. (a) | 377,108 | $ | 2,752,888 | |||||
| Navios Maritime Holdings, Inc. | 213,470 | 719,394 | ||||||
|
| |||||||
| $ | 3,472,282 | |||||||
|
| |||||||
| Restaurants – 3.4% | ||||||||
| Arcos Dorados Holdings, Inc. | 184,384 | $ | 2,205,228 | |||||
| BJ’s Restaurants, Inc. (a) | 22,540 | 741,566 | ||||||
| Chuy’s Holdings, Inc. (a) | 53,290 | 1,190,499 | ||||||
| Dunkin Brands Group, Inc. | 35,080 | 1,163,954 | ||||||
|
| |||||||
| $ | 5,301,247 | |||||||
|
| |||||||
| Issuer | Shares/Par | Value ($) | ||||||
| COMMON STOCKS – continued | ||||||||
| Specialty Chemicals – 1.5% | ||||||||
| Rockwood Holdings, Inc. | 24,060 | $ | 1,190,008 | |||||
| Tronox Ltd., “A” | 65,950 | 1,203,588 | ||||||
|
| |||||||
| $ | 2,393,596 | |||||||
|
| |||||||
| Specialty Stores – 5.3% | ||||||||
| Citi Trends, Inc. (a) | 130,783 | $ | 1,799,574 | |||||
| Monro Muffler Brake, Inc. | 58,133 | 2,032,911 | ||||||
| Tiffany & Co. | 16,670 | 955,858 | ||||||
| Tile Shop Holdings, Inc. (a) | 23,530 | 396,010 | ||||||
| Urban Outfitters, Inc. (a) | 19,918 | 783,972 | ||||||
| Zumiez, Inc. (a) | 120,140 | 2,331,917 | ||||||
|
| |||||||
| $ | 8,300,242 | |||||||
|
| |||||||
| Trucking – 3.2% | ||||||||
| Atlas Air Worldwide Holdings, Inc. (a) | 52,445 | $ | 2,323,838 | |||||
| Swift Transportation Co. (a) | 289,166 | 2,637,194 | ||||||
|
| |||||||
| $ | 4,961,032 | |||||||
|
| |||||||
| Total Common Stocks (Identified Cost, $137,369,550) | $ | 153,115,357 | ||||||
|
| |||||||
| MONEY MARKET FUNDS – 1.9% | ||||||||
| MFS Institutional Money Market Portfolio, 0.16%, at Cost and Net Asset Value (v) | 3,002,788 | $ | 3,002,788 | |||||
|
| |||||||
| COLLATERAL FOR SECURITIES LOANED – 0.1% | ||||||||
| Navigator Securities Lending Prime Portfolio, 0.28%, at Cost and Net Asset Value (j) | 84,275 | $ | 84,275 | |||||
|
| |||||||
| Total Investments (Identified Cost, $140,456,613) | $ | 156,202,420 | ||||||
|
| |||||||
| OTHER ASSETS, LESS LIABILITIES – (0.0)% | (65,932 | ) | ||||||
|
| |||||||
| Net Assets – 100.0% | $ | 156,136,488 | ||||||
|
| |||||||
| (a) | Non-income producing security. |
| (j) | The rate quoted is the annualized seven-day yield of the portfolio at period end. |
| (l) | A portion of this security is on loan. |
| (v) | Underlying affiliated fund that is available only to investment companies managed by MFS. The rate quoted for the MFS Institutional Money Market Portfolio is the annualized seven-day yield of the fund at period end. |
The following abbreviations are used in this report and are defined:
| PLC | Public Limited Company |
See Notes to Financial Statements
8
Table of Contents
MFS New Discovery Portfolio
FINANCIAL STATEMENTS | STATEMENT OF ASSETS AND LIABILITIES
This statement represents your fund’s balance sheet, which details the assets and liabilities comprising the total value of the fund.
At 12/31/12 | ||||||||
Assets | ||||||||
Investments – | ||||||||
Non-affiliated issuers, at value (identified cost, $137,453,825) | $153,199,632 | |||||||
Underlying affiliated funds, at cost and value | 3,002,788 | |||||||
Total investments, at value, including $83,742 of securities on loan (identified cost, $140,456,613) | $156,202,420 | |||||||
Cash | 128,787 | |||||||
Foreign currency, at value (identified cost, $67,816) | 67,073 | |||||||
Receivables for | ||||||||
Investments sold | 27,275 | |||||||
Fund shares sold | 50,873 | |||||||
Interest and dividends | 20,982 | |||||||
Other assets | 2,040 | |||||||
Total assets | $156,499,450 | |||||||
Liabilities | ||||||||
Payables for | ||||||||
Investments purchased | $2,912 | |||||||
Fund shares reacquired | 202,321 | |||||||
Collateral for securities loaned, at value | 84,275 | |||||||
Payable to affiliates | ||||||||
Investment adviser | 12,044 | |||||||
Distribution and/or service fees | 2,232 | |||||||
Payable for independent Trustees’ compensation | 98 | |||||||
Accrued expenses and other liabilities | 59,080 | |||||||
Total liabilities | $362,962 | |||||||
Net assets | $156,136,488 | |||||||
Net assets consist of | ||||||||
Paid-in capital | $140,360,777 | |||||||
Unrealized appreciation (depreciation) on investments and translation of assets and liabilities in foreign currencies | 15,745,064 | |||||||
Accumulated net realized gain (loss) on investments and foreign currency | 30,647 | |||||||
Net assets | $156,136,488 | |||||||
Shares of beneficial interest outstanding | 9,561,267 |
| Net assets | Shares outstanding | Net asset value per share | ||||||||||
Initial Class | $72,879,741 | 4,371,267 | $16.67 | |||||||||
Service Class | 83,256,747 | 5,190,000 | 16.04 | |||||||||
See Notes to Financial Statements
9
Table of Contents
MFS New Discovery Portfolio
FINANCIAL STATEMENTS | STATEMENT OF OPERATIONS
This statement describes how much your fund earned in investment income and accrued in expenses. It also describes any gains and/or losses generated by fund operations.
Year ended 12/31/12 | ||||||||
Net investment loss | ||||||||
Income | ||||||||
Dividends | $942,213 | |||||||
Income on securities loaned | 69,323 | |||||||
Dividends from underlying affiliated funds | 905 | |||||||
Foreign taxes withheld | (5,664 | ) | ||||||
Total investment income | $1,006,777 | |||||||
Expenses | ||||||||
Management fee | $1,403,184 | |||||||
Distribution and/or service fees | 204,733 | |||||||
Administrative services fee | 32,637 | |||||||
Independent Trustees’ compensation | 6,330 | |||||||
Custodian fee | 40,156 | |||||||
Shareholder communications | 21,818 | |||||||
Audit and tax fees | 45,135 | |||||||
Legal fees | 2,839 | |||||||
Miscellaneous | 17,024 | |||||||
Total expenses | $1,773,856 | |||||||
Fees paid indirectly | (16 | ) | ||||||
Reduction of expenses by investment adviser | (86,608 | ) | ||||||
Net expenses | $1,687,232 | |||||||
Net investment loss | $(680,455 | ) | ||||||
Realized and unrealized gain (loss) on investments and foreign currency | ||||||||
Realized gain (loss) (identified cost basis) | ||||||||
Investments | $5,397,631 | |||||||
Foreign currency | (26,278 | ) | ||||||
Net realized gain (loss) on investments and foreign currency | $5,371,353 | |||||||
Change in unrealized appreciation (depreciation) | ||||||||
Investments | $25,675,826 | |||||||
Translation of assets and liabilities in foreign currencies | (163 | ) | ||||||
Net unrealized gain (loss) on investments and foreign currency translation | $25,675,663 | |||||||
Net realized and unrealized gain (loss) on investments and foreign currency | $31,047,016 | |||||||
Change in net assets from operations | $30,366,561 |
See Notes to Financial Statements
10
Table of Contents
MFS New Discovery Portfolio
FINANCIAL STATEMENTS | STATEMENTS OF CHANGES IN NET ASSETS
These statements describe the increases and/or decreases in net assets resulting from operations, any distributions, and any shareholder transactions.
For years ended 12/31 | 2012 | 2011 | ||||||
Change in net assets | ||||||||
From operations | ||||||||
Net investment loss | $(680,455 | ) | $(1,232,958 | ) | ||||
Net realized gain (loss) on investments and foreign currency | 5,371,353 | 11,911,446 | ||||||
Net unrealized gain (loss) on investments and foreign currency translation | 25,675,663 | (27,205,896 | ) | |||||
Change in net assets from operations | $30,366,561 | $(16,527,408 | ) | |||||
Distributions declared to shareholders | ||||||||
From net realized gain on investments | $(15,102,700 | ) | $(14,519,487 | ) | ||||
Change in net assets from fund share transactions | $(8,449,969 | ) | $(14,650,729 | ) | ||||
Total change in net assets | $6,813,892 | $(45,697,624 | ) | |||||
Net assets | ||||||||
At beginning of period | 149,322,596 | 195,020,220 | ||||||
At end of period | $156,136,488 | $149,322,596 |
See Notes to Financial Statements
11
Table of Contents
MFS New Discovery Portfolio
FINANCIAL STATEMENTS | FINANCIAL HIGHLIGHTS
The financial highlights table is intended to help you understand the fund’s financial performance for the past 5 years. Certain information reflects financial results for a single fund share. The total returns in the table represent the rate by which an investor would have earned (or lost) on an investment in the fund share class (assuming reinvestment of all distributions) held for the entire period.
| Initial Class | Years ended 12/31 | |||||||||||||||||||
| 2012 | 2011 | 2010 | 2009 | 2008 | ||||||||||||||||
Net asset value, beginning of period | $15.20 | $18.63 | $13.64 | $8.37 | $16.24 | |||||||||||||||
| Income (loss) from investment operations | ||||||||||||||||||||
Net investment loss (d) | $(0.05 | ) | $(0.10 | ) | $(0.07 | ) | $(0.05 | ) | $(0.04 | ) | ||||||||||
Net realized and unrealized gain (loss) on investments | 3.19 | (1.78 | ) | 5.06 | 5.32 | (5.42 | ) | |||||||||||||
Total from investment operations | $3.14 | $(1.88 | ) | $4.99 | $5.27 | $(5.46 | ) | |||||||||||||
| Less distributions declared to shareholders | ||||||||||||||||||||
From net realized gain on investments | $(1.67 | ) | $(1.55 | ) | $— | $— | $(2.41 | ) | ||||||||||||
Net asset value, end of period (x) | $16.67 | $15.20 | $18.63 | $13.64 | $8.37 | |||||||||||||||
Total return (%) (k)(r)(s)(x) | 21.22 | (10.37 | ) | 36.58 | 62.96 | (39.57 | ) | |||||||||||||
| Ratios (%) (to average net assets) and Supplemental data: | ||||||||||||||||||||
Expenses before expense reductions (f) | 1.01 | 1.04 | 1.09 | 1.05 | 1.02 | |||||||||||||||
Expenses after expense reductions (f) | 0.95 | 0.95 | 0.95 | 0.95 | 0.95 | |||||||||||||||
Net investment loss | (0.31 | ) | (0.55 | ) | (0.48 | ) | (0.49 | ) | (0.28 | ) | ||||||||||
Portfolio turnover | 120 | 176 | 192 | 153 | 127 | |||||||||||||||
Net assets at end of period (000 omitted) | $72,880 | $69,664 | $87,806 | $78,620 | $59,861 | |||||||||||||||
See Notes to Financial Statements
12
Table of Contents
MFS New Discovery Portfolio
Financial Highlights – continued
| Service Class | Years ended 12/31 | |||||||||||||||||||
| 2012 | 2011 | 2010 | 2009 | 2008 | ||||||||||||||||
Net asset value, beginning of period | $14.72 | $18.13 | $13.31 | $8.18 | $15.97 | |||||||||||||||
| Income (loss) from investment operations | ||||||||||||||||||||
Net investment loss (d) | $(0.09 | ) | $(0.14 | ) | $(0.11 | ) | $(0.07 | ) | $(0.07 | ) | ||||||||||
Net realized and unrealized gain (loss) on investments | 3.08 | (1.72 | ) | 4.93 | 5.20 | (5.31 | ) | |||||||||||||
Total from investment operations | $2.99 | $(1.86 | ) | $4.82 | $5.13 | $(5.38 | ) | |||||||||||||
| Less distributions declared to shareholders | ||||||||||||||||||||
From net realized gain on investments | $(1.67 | ) | $(1.55 | ) | $— | $— | $(2.41 | ) | ||||||||||||
Net asset value, end of period (x) | $16.04 | $14.72 | $18.13 | $13.31 | $8.18 | |||||||||||||||
Total return (%) (k)(r)(s)(x) | 20.88 | (10.55 | ) | 36.21 | 62.71 | (39.76 | ) | |||||||||||||
| Ratios (%) (to average net assets) and Supplemental data: | ||||||||||||||||||||
Expenses before expense reductions (f) | 1.26 | 1.29 | 1.34 | 1.30 | 1.27 | |||||||||||||||
Expenses after expense reductions (f) | 1.20 | 1.20 | 1.20 | 1.20 | 1.20 | |||||||||||||||
Net investment loss | (0.55 | ) | (0.80 | ) | (0.73 | ) | (0.74 | ) | (0.54 | ) | ||||||||||
Portfolio turnover | 120 | 176 | 192 | 153 | 127 | |||||||||||||||
Net assets at end of period (000 omitted) | $83,257 | $79,659 | $107,214 | $115,516 | $104,937 | |||||||||||||||
| (d) | Per share data is based on average shares outstanding. |
| (f) | Ratios do not reflect reductions from fees paid indirectly, if applicable. |
| (k) | The total return does not reflect expenses that apply to separate accounts. Inclusion of these charges would reduce the total return figures for all periods shown. |
| (r) | Certain expenses have been reduced without which performance would have been lower. |
| (s) | From time to time the fund may receive proceeds from litigation settlements, without which performance would be lower. |
| (x) | The net asset values per share and total returns have been calculated on net assets which include adjustments made in accordance with U.S. generally accepted accounting principles required at period end for financial reporting purposes. |
See Notes to Financial Statements
13
Table of Contents
MFS New Discovery Portfolio
| (1) | Business and Organization |
MFS New Discovery Portfolio (the fund) is a series of MFS Variable Insurance Trust II (the trust). The trust is organized as a Massachusetts business trust and is registered under the Investment Company Act of 1940, as amended, as an open-end management investment company. The shareholders of each series of the trust are separate accounts of insurance companies, which offer variable annuity and/or life insurance products, and qualified retirement and pension plans.
| (2) | Significant Accounting Policies |
General – The preparation of financial statements in conformity with U.S. generally accepted accounting principles requires management to make estimates and assumptions that affect the reported amounts of assets and liabilities, and disclosure of contingent assets and liabilities at the date of the financial statements and the reported amounts of revenues and expenses during the reporting period. Actual results could differ from those estimates. In the preparation of these financial statements, management has evaluated subsequent events occurring after the date of the fund’s Statement of Assets and Liabilities through the date that the financial statements were issued.
In this reporting period the fund adopted Financial Accounting Standards Board (FASB) Accounting Standards Update 2011-04, Fair Value Measurement (Topic 820) – Amendments to Achieve Common Fair Value Measurement and Disclosure Requirements in U.S. GAAP and IFRSs (“ASU 2011-04”). ASU 2011-04 seeks to improve the comparability of fair value measurements as presented and disclosed in financial statements prepared in accordance with U.S. GAAP and International Financial Reporting Standards (IFRS) by providing common requirements for fair value measurement and disclosure.
In December 2011, the FASB issued Accounting Standards Update 2011-11, Balance Sheet (Topic 210) – Disclosures about Offsetting Assets and Liabilities (“ASU 2011-11”). Effective for annual reporting periods beginning on or after January 1, 2013 and interim periods within those annual periods, ASU 2011-11 is intended to enhance disclosure requirements on the offsetting of financial assets and liabilities. Although still evaluating the potential impacts of ASU 2011-11 to the fund, management expects that the impact of the fund’s adoption will be limited to additional financial statement disclosures.
Investment Valuations – Equity securities, including restricted equity securities, are generally valued at the last sale or official closing price as provided by a third-party pricing service on the market or exchange on which they are primarily traded. Equity securities, for which there were no sales reported that day, are generally valued at the last quoted daily bid quotation as provided by a third-party pricing service on the market or exchange on which such securities are primarily traded. Short-term instruments with a maturity at issuance of 60 days or less generally are valued at amortized cost, which approximates market value. Open-end investment companies are generally valued at net asset value per share. Securities and other assets generally valued on the basis of information from a third-party pricing service may also be valued at a broker/dealer bid quotation. Values obtained from third-party pricing services can utilize both transaction data and market information such as yield, quality, coupon rate, maturity, type of issue, trading characteristics, and other market data. The values of foreign securities and other assets and liabilities expressed in foreign currencies are converted to U.S. dollars using the mean of bid and asked prices for rates provided by a third-party pricing service.
The Board of Trustees has delegated primary responsibility for determining or causing to be determined the value of the fund’s investments (including any fair valuation) to the adviser pursuant to valuation policies and procedures approved by the Board. If the adviser determines that reliable market quotations are not readily available, investments are valued at fair value as determined in good faith by the adviser in accordance with such procedures under the oversight of the Board of Trustees. Under the fund’s valuation policies and procedures, market quotations are not considered to be readily available for most types of debt instruments and floating rate loans and many types of derivatives. These investments are generally valued at fair value based on information from third-party pricing services. In addition, investments may be valued at fair value if the adviser determines that an investment’s value has been materially affected by events occurring after the close of the exchange or market on which the investment is principally traded (such as foreign exchange or market) and prior to the determination of the fund’s net asset value, or after the halting of trading of a specific security where trading does not resume prior to the close of the exchange or market on which the security is principally traded. Events that occur on a frequent basis after foreign markets close (such as developments in foreign markets and significant movements in the U.S. markets) and prior to the determination of the fund’s net asset value may be deemed to have a material effect on the value of securities traded in foreign markets. Accordingly, the fund’s foreign equity securities may often be valued at fair value. The adviser generally relies on third-party pricing services or other information (such as the correlation with price movements of similar securities in the same or other markets; the type, cost and investment characteristics of the security; the business and financial condition of the issuer; and trading and other market data) to assist in determining whether to fair value and at what value to fair value an investment. The value of an investment for purposes of calculating the fund’s net asset value can differ depending on the source and method used to determine value. When fair valuation is used, the value of an investment used to determine the fund’s net asset value may differ from quoted or published prices for the same investment. There can be no assurance that the fund could obtain the fair value assigned to an investment if it were to sell the investment at the same time at which the fund determines its net asset value per share.
14
Table of Contents
MFS New Discovery Portfolio
Notes to Financial Statements – continued
Various inputs are used in determining the value of the fund’s assets or liabilities. These inputs are categorized into three broad levels. In certain cases, the inputs used to measure fair value may fall into different levels of the fair value hierarchy. In such cases, an investment’s level within the fair value hierarchy is based on the lowest level of input that is significant to the fair value measurement. The fund’s assessment of the significance of a particular input to the fair value measurement in its entirety requires judgment, and considers factors specific to the investment. Level 1 includes unadjusted quoted prices in active markets for identical assets or liabilities. Level 2 includes other significant observable market-based inputs (including quoted prices for similar securities, interest rates, prepayment speed, and credit risk). Level 3 includes unobservable inputs, which may include the adviser’s own assumptions in determining the fair value of investments. The following is a summary of the levels used as of December 31, 2012 in valuing the fund’s assets or liabilities:
| Investments at Value | Level 1 | Level 2 | Level 3 | Total | ||||||||||||
| Equity Securities: | ||||||||||||||||
United States | $143,205,393 | $— | $— | $143,205,393 | ||||||||||||
Greece | 3,472,282 | — | — | 3,472,282 | ||||||||||||
British Virgin Islands | 2,205,233 | — | — | 2,205,233 | ||||||||||||
Australia | — | 1,994,434 | — | 1,994,434 | ||||||||||||
India | 994,951 | — | — | 994,951 | ||||||||||||
Canada | 651,798 | — | — | 651,798 | ||||||||||||
Israel | 591,266 | — | — | 591,266 | ||||||||||||
| Mutual Funds | 3,087,063 | — | — | 3,087,063 | ||||||||||||
| Total Investments | $154,207,986 | $1,994,434 | $— | $156,202,420 | ||||||||||||
For further information regarding security characteristics, see the Portfolio of Investments.
Foreign Currency Translation – Purchases and sales of foreign investments, income, and expenses are converted into U.S. dollars based upon currency exchange rates prevailing on the respective dates of such transactions or on the reporting date for foreign denominated receivables and payables. Gains and losses attributable to foreign currency exchange rates on sales of securities are recorded for financial statement purposes as net realized gains and losses on investments. Gains and losses attributable to foreign exchange rate movements on receivables, payables, income and expenses are recorded for financial statement purposes as foreign currency transaction gains and losses. That portion of both realized and unrealized gains and losses on investments that results from fluctuations in foreign currency exchange rates is not separately disclosed.
Security Loans – State Street Bank and Trust Company (“State Street”), as lending agent, loans the securities of the fund to certain qualified institutions (the “Borrowers”) approved by the fund. The loans are collateralized by cash and/or U.S. Treasury and federal agency obligations in an amount typically at least equal to the market value of the securities loaned. The market value of the loaned securities is determined at the close of business of the fund and any additional required collateral is delivered to the fund on the next business day. State Street provides the fund with indemnification against Borrower default. The fund bears the risk of loss with respect to the investment of cash collateral. On loans collateralized by cash, the cash collateral is invested in a money market fund or short-term securities. Collateral for securities loaned is held at carrying value, which approximates fair value. If the collateral for securities loaned was carried at fair value, its fair value would be considered level 2 under the fair value hierarchy. A portion of the income generated upon investment of the collateral is remitted to the Borrowers, and the remainder is allocated between the fund and the lending agent. On loans collateralized by U.S. Treasury and/or federal agency obligations, a fee is received from the Borrower, and is allocated between the fund and the lending agent. Income from securities lending is separately reported in the Statement of Operations. The dividend and interest income earned on the securities loaned is accounted for in the same manner as other dividend and interest income.
Indemnifications – Under the fund’s organizational documents, its officers and Trustees may be indemnified against certain liabilities and expenses arising out of the performance of their duties to the fund. Additionally, in the normal course of business, the fund enters into agreements with service providers that may contain indemnification clauses. The fund’s maximum exposure under these agreements is unknown as this would involve future claims that may be made against the fund that have not yet occurred.
Investment Transactions and Income – Investment transactions are recorded on the trade date. Interest income is recorded on the accrual basis. Dividends received in cash are recorded on the ex-dividend date. Certain dividends from foreign securities will be recorded when the fund is informed of the dividend if such information is obtained subsequent to the ex-dividend date. Dividend payments received in additional securities are recorded on the ex-dividend date in an amount equal to the value of the security on such date.
The fund may receive proceeds from litigation settlements. Any proceeds received from litigation involving portfolio holdings are reflected in the Statement of Operations in realized gain/loss if the security has been disposed of by the fund or in unrealized gain/loss if the security is still held by the fund. Any other proceeds from litigation not related to portfolio holdings are reflected as other income in the Statement of Operations.
15
Table of Contents
MFS New Discovery Portfolio
Notes to Financial Statements – continued
Fees Paid Indirectly – The fund’s custody fee may be reduced according to an arrangement that measures the value of cash deposited with the custodian by the fund. This amount, for the year ended December 31, 2012, is shown as a reduction of total expenses in the Statement of Operations.
Tax Matters and Distributions – The fund intends to qualify as a regulated investment company, as defined under Subchapter M of the Internal Revenue Code, and to distribute all of its taxable income, including realized capital gains. As a result, no provision for federal income tax is required. The fund’s federal tax returns, when filed, will remain subject to examination by the Internal Revenue Service for a three year period. Foreign taxes have been accrued by the fund in the accompanying financial statements.
Distributions to shareholders are recorded on the ex-dividend date. Income and capital gain distributions are determined in accordance with income tax regulations, which may differ from U.S. generally accepted accounting principles. Certain capital accounts in the financial statements are periodically adjusted for permanent differences in order to reflect their tax character. These adjustments have no impact on net assets or net asset value per share. Temporary differences which arise from recognizing certain items of income, expense, gain or loss in different periods for financial statement and tax purposes will reverse at some time in the future. Distributions in excess of net investment income or net realized gains are temporary overdistributions for financial statement purposes resulting from differences in the recognition or classification of income or distributions for financial statement and tax purposes.
Book/tax differences primarily relate to wash sale loss deferrals.
The tax character of distributions declared to shareholders for the last two fiscal years is as follows:
| 12/31/12 | 12/31/11 | |||||||
| Ordinary income (including any short-term capital gains) | $15,102,700 | $10,192,031 | ||||||
| Long-term capital gains | — | 4,327,456 | ||||||
| Total distributions | $15,102,700 | $14,519,487 | ||||||
The federal tax cost and the tax basis components of distributable earnings were as follows:
| As of 12/31/12 | ||||
| Cost of investments | $143,053,208 | |||
| Gross appreciation | 20,271,846 | |||
| Gross depreciation | (7,122,634 | ) | ||
| Net unrealized appreciation (depreciation) | $13,149,212 | |||
| Undistributed ordinary income | 2,627,242 | |||
| Other temporary differences | (743 | ) |
Multiple Classes of Shares of Beneficial Interest – The fund offers multiple classes of shares, which differ in their respective distribution and/or service fees. The fund’s income, realized and unrealized gain (loss), and common expenses are allocated to shareholders based on the daily net assets of each class. Dividends are declared separately for each class. Differences in per share dividend rates are generally due to differences in separate class expenses. The fund’s distributions declared to shareholders as reported in the Statements of Changes in Net Assets are presented by class as follows:
| From net realized gain on investments | ||||||||
| Year ended 12/31/12 | Year ended 12/31/11 | |||||||
| Initial Class | $7,020,338 | $6,701,669 | ||||||
| Service Class | 8,082,362 | 7,817,818 | ||||||
| Total | $15,102,700 | $14,519,487 | ||||||
| (3) | Transactions with Affiliates |
Investment Adviser – The fund has an investment advisory agreement with MFS to provide overall investment management and related administrative services and facilities to the fund. The management fee is computed daily and paid monthly at the following annual rates:
| First $1 billion of average daily net assets | 0.90% | |||
| Average daily net assets in excess of $1 billion | 0.80% |
The investment adviser has agreed in writing to reduce its management fee to 0.75% of average daily net assets in excess of $2.5 billion. This written agreement will continue until modified by the fund’s Board of Trustees, but such agreement will continue at least until April 30, 2014. For the year ended December 31, 2012, the fund’s average daily net assets did not exceed $2.5 billion and therefore, the management fee was not reduced. The management fee incurred for the year ended December 31, 2012 was equivalent to an annual effective rate of 0.90% of the fund’s average daily net assets.
16
Table of Contents
MFS New Discovery Portfolio
Notes to Financial Statements – continued
The investment adviser has agreed in writing to pay a portion of the fund’s total annual operating expenses, exclusive of interest, taxes, extraordinary expenses, brokerage and transaction costs, and investment-related expenses, such that total annual operating expenses do not exceed 0.95% of average daily net assets for the Initial Class shares and 1.20% of average daily net assets for the Service Class shares. This written agreement will continue until modified by the fund’s Board of Trustees, but such agreement will continue at least until April 30, 2014. For the year ended December 31, 2012, this reduction amounted to $86,050 and is reflected as a reduction of total expenses in the Statement of Operations.
Distributor – MFS Fund Distributors, Inc. (MFD), a wholly-owned subsidiary of MFS, is the distributor of shares of the fund. The Trustees have adopted a distribution plan for the Service Class shares pursuant to Rule 12b-1 under the Investment Company Act of 1940.
The fund’s distribution plan provides that the fund will pay MFD distribution and/or service fees equal to 0.25% per annum of its average daily net assets attributable to Service Class shares as partial consideration for services performed and expenses incurred by MFD and financial intermediaries (including participating insurance companies that invest in the fund to fund variable annuity and variable life insurance contracts, sponsors of qualified retirement and pension plans that invest in the fund, and affiliates of these participating insurance companies and plan sponsors) in connection with the sale and distribution of the Service Class shares. MFD may subsequently pay all, or a portion, of the distribution and/or service fees to financial intermediaries.
Shareholder Servicing Agent – MFS Service Center, Inc. (MFSC), a wholly-owned subsidiary of MFS, has contracted to provide transfer agent and recordkeeping functions in connection with the issuance, transfer, and redemption of each class of shares of the fund under a Shareholder Servicing Agent Agreement. During the year ended December 31, 2012, the fund did not pay MFSC a fee for this service. Effective April 1, 2013, the fund will be charged a shareholder servicing fee by MFSC.
Administrator – MFS provides certain financial, legal, shareholder communications, compliance, and other administrative services to the fund. Under an administrative services agreement, the fund partially reimburses MFS the costs incurred to provide these services. The fund is charged an annual fixed amount of $17,500 plus a fee based on average daily net assets. The administrative services fee incurred for the year ended December 31, 2012 was equivalent to an annual effective rate of 0.0209% of the fund’s average daily net assets.
Trustees’ and Officers’ Compensation – The fund pays compensation to independent Trustees in the form of a retainer, attendance fees, and additional compensation to Board and Committee chairpersons. The fund does not pay compensation directly to Trustees or officers of the fund who are also officers of the investment adviser, all of whom receive remuneration for their services to the fund from MFS. Certain officers and Trustees of the fund are officers or directors of MFS, MFD, and MFSC.
Other – This fund and certain other funds managed by MFS (the funds) have entered into services agreements (the Agreements) which provide for payment of fees by the funds to Tarantino LLC and Griffin Compliance LLC in return for the provision of services of an Independent Chief Compliance Officer (ICCO) and Assistant ICCO, respectively, for the funds. The ICCO and Assistant ICCO are officers of the funds and the sole members of Tarantino LLC and Griffin Compliance LLC, respectively. The funds can terminate the Agreements with Tarantino LLC and Griffin Compliance LLC at any time under the terms of the Agreements. For the year ended December 31, 2012, the aggregate fees paid by the fund to Tarantino LLC and Griffin Compliance LLC were $1,294 and are included in “Miscellaneous” expense in the Statement of Operations. MFS has agreed to reimburse the fund for a portion of the payments made by the fund in the amount of $558, which is shown as a reduction of total expenses in the Statement of Operations. Additionally, MFS has agreed to bear all expenses associated with office space, other administrative support, and supplies provided to the ICCO and Assistant ICCO.
The fund invests in the MFS Institutional Money Market Portfolio which is managed by MFS and seeks current income consistent with preservation of capital and liquidity. Income earned on this investment is included in “Dividends from underlying affiliated funds” in the Statement of Operations. This money market fund does not pay a management fee to MFS.
| (4) | Portfolio Securities |
Purchases and sales of investments, other than short-term obligations, aggregated $186,226,444 and $212,583,640, respectively.
17
Table of Contents
MFS New Discovery Portfolio
Notes to Financial Statements – continued
| (5) | Shares of Beneficial Interest |
The fund’s Declaration of Trust permits the Trustees to issue an unlimited number of full and fractional shares of beneficial interest. Transactions in fund shares were as follows:
| Year ended 12/31/12 | Year ended 12/31/11 | |||||||||||||||
| Shares | Amount | Shares | Amount | |||||||||||||
| Shares sold | ||||||||||||||||
Initial Class | 185,133 | $3,029,396 | 389,956 | $6,770,709 | ||||||||||||
Service Class | 707,513 | 11,160,128 | 488,436 | 7,547,690 | ||||||||||||
| 892,646 | $14,189,524 | 878,392 | $14,318,399 | |||||||||||||
| Shares issued to shareholders in reinvestment of distributions | ||||||||||||||||
Initial Class | 443,203 | $7,020,338 | 424,694 | $6,701,669 | ||||||||||||
Service Class | 529,644 | 8,082,362 | 511,303 | 7,817,818 | ||||||||||||
| 972,847 | $15,102,700 | 935,997 | $14,519,487 | |||||||||||||
| Shares reacquired | ||||||||||||||||
Initial Class | (839,595 | ) | $(14,044,726 | ) | (944,373 | ) | $(17,044,090 | ) | ||||||||
Service Class | (1,460,233 | ) | (23,697,467 | ) | (1,498,709 | ) | (26,444,525 | ) | ||||||||
| (2,299,828 | ) | $(37,742,193 | ) | (2,443,082 | ) | $(43,488,615 | ) | |||||||||
| Net change | ||||||||||||||||
Initial Class | (211,259 | ) | $(3,994,992 | ) | (129,723 | ) | $(3,571,712 | ) | ||||||||
Service Class | (223,076 | ) | (4,454,977 | ) | (498,970 | ) | (11,079,017 | ) | ||||||||
| (434,335 | ) | $(8,449,969 | ) | (628,693 | ) | $(14,650,729 | ) | |||||||||
| (6) | Line of Credit |
The fund and certain other funds managed by MFS participate in a $1.1 billion unsecured committed line of credit, subject to a $1 billion sublimit, provided by a syndication of banks under a credit agreement. Borrowings may be made for temporary financing needs. Interest is charged to each fund, based on its borrowings, generally at a rate equal to the higher of the Federal Reserve funds rate or one month LIBOR plus an agreed upon spread. A commitment fee, based on the average daily, unused portion of the committed line of credit, is allocated among the participating funds at the end of each calendar quarter. In addition, the fund and other funds managed by MFS have established unsecured uncommitted borrowing arrangements with certain banks for temporary financing needs. Interest is charged to each fund, based on its borrowings, at a rate equal to the Federal Reserve funds rate plus an agreed upon spread. For the year ended December 31, 2012, the fund’s commitment fee and interest expense were $1,009 and $0, respectively, and are included in “Miscellaneous” expense in the Statement of Operations.
| (7) | Transactions in Underlying Affiliated Funds – Affiliated Issuers |
An affiliated issuer may be considered one in which the fund owns 5% or more of the outstanding voting securities, or a company which is under common control. For the purposes of this report, the fund assumes the following to be an affiliated issuer:
| Underlying Affiliated Fund | Beginning Shares/Par Amount | Acquisitions Shares/Par Amount | Dispositions Shares/Par Amount | Ending Shares/Par Amount | ||||||||||||
| MFS Institutional Money Market Portfolio | 529,518 | 41,906,720 | (39,433,450 | ) | 3,002,788 | |||||||||||
| Underlying Affiliated Fund | Realized Gain (Loss) | Capital Gain Distributions | Dividend Income | Ending Value | ||||||||||||
| MFS Institutional Money Market Portfolio | $— | $— | $905 | $3,002,788 | ||||||||||||
18
Table of Contents
MFS New Discovery Portfolio
REPORT OF INDEPENDENT REGISTERED PUBLIC ACCOUNTING FIRM
To the Board of Trustees of MFS Variable Insurance Trust II and the Shareholders of
MFS New Discovery Portfolio:
We have audited the accompanying statement of assets and liabilities, including the portfolio of investments, of MFS New Discovery Portfolio (the “Fund”) (one of the series comprising MFS Variable Insurance Trust II) as of December 31, 2012, and the related statement of operations for the year then ended, the statements of changes in net assets for each of the two years in the period then ended, and the financial highlights for each of the five years in the period then ended. These financial statements and financial highlights are the responsibility of the Fund’s management. Our responsibility is to express an opinion on these financial statements and financial highlights based on our audits.
We conducted our audits in accordance with the standards of the Public Company Accounting Oversight Board (United States). Those standards require that we plan and perform the audit to obtain reasonable assurance about whether the financial statements and financial highlights are free of material misstatement. The Fund is not required to have, nor were we engaged to perform, an audit of its internal control over financial reporting. Our audits included consideration of internal control over financial reporting as a basis for designing audit procedures that are appropriate in the circumstances, but not for the purpose of expressing an opinion on the effectiveness of the Fund’s internal control over financial reporting. Accordingly, we express no such opinion. An audit also includes examining, on a test basis, evidence supporting the amounts and disclosures in the financial statements, assessing the accounting principles used and significant estimates made by management, as well as evaluating the overall financial statement presentation. Our procedures included confirmation of securities owned as of December 31, 2012, by correspondence with the custodian and brokers; where replies were not received from brokers, we performed other auditing procedures. We believe that our audits provide a reasonable basis for our opinion.
In our opinion, the financial statements and financial highlights referred to above present fairly, in all material respects, the financial position of MFS New Discovery Portfolio as of December 31, 2012, the results of its operations for the year then ended, the changes in its net assets for each of the two years in the period then ended, and the financial highlights for each of the five years in the period then ended, in conformity with accounting principles generally accepted in the United States of America.
DELOITTE & TOUCHE LLP
Boston, Massachusetts
February 15, 2013
19
Table of Contents
MFS New Discovery Portfolio
TRUSTEES AND OFFICERS – IDENTIFICATION AND BACKGROUND
The Trustees and officers of the Trust, as of February 1, 2013, are listed below, together with their principal occupations during the past five years. (Their titles may have varied during that period.) The address of each Trustee and officer is 111 Huntington Avenue, Boston, Massachusetts 02199-7618.
Name, Age | Position(s) with Fund | Trustee/Officer Since (h) | Principal Occupations During the Past Five Years | Other Directorships (j) | ||||
| INTERESTED TRUSTEES | ||||||||
Robert J. Manning (k) (age 49) | Trustee | February 2004 | Massachusetts Financial Services Company, Chairman, Chief Executive Officer and Director; President (until December 2009); Chief Investment Officer (until July 2010) | N/A | ||||
| INDEPENDENT TRUSTEES | ||||||||
David H. Gunning (age 70) | Trustee and Chair of Trustees | January 2004 | Private investor | Lincoln Electric Holdings, Inc. (welding equipment manufacturer), Director; Development Alternatives, Inc. (consulting), Director/Non-Executive Chairman; Portman Limited (mining), Director (until 2008) | ||||
Robert E. Butler (age 71) | Trustee | January 2006 | Consultant – investment company industry regulatory and compliance matters | N/A | ||||
Maureen R. Goldfarb (age 57) | Trustee | January 2009 | Private investor | N/A | ||||
William R. Gutow (age 71) | Trustee | December 1993 | Private investor and real estate consultant; Capitol Entertainment Management Company (video franchise), Vice Chairman | Atlantic Coast Tan (tanning salons), Vice Chairman (until 2007); Texas Donuts (donut franchise), Vice Chairman (until 2010) | ||||
Michael Hegarty (age 68) | Trustee | December 2004 | Private investor; Rouse Properties Inc. (real estate), Director | N/A | ||||
John P. Kavanaugh (age 58) | Trustee | January 2009 | Private investor | N/A | ||||
J. Dale Sherratt (age 74) | Trustee | June 1989 | Insight Resources, Inc. (acquisition planning specialists), President; Wellfleet Investments (investor in health care companies), Managing General Partner | N/A | ||||
| Laurie J. Thomsen (age 55) | Trustee | March 2005 | Private investor; New Profit, Inc. (venture philanthropy), Executive Partner (until 2010) | The Travelers Companies (insurance), Director | ||||
Robert W. Uek (age 71) | Trustee | January 2006 | Consultant to investment company industry | N/A | ||||
| OFFICERS | ||||||||
John M. Corcoran (k) (age 47) | President | October 2008 | Massachusetts Financial Services Company, Senior Vice President (since October 2008); State Street Bank and Trust (financial services provider), Senior Vice President, (until September 2008) | N/A | ||||
| Christopher R. Bohane (k) (age 39) | Assistant Secretary and Assistant Clerk | July 2005 | Massachusetts Financial Services Company, Vice President and Senior Counsel | N/A | ||||
Kino Clark (k) (age 44) | Assistant Treasurer | January 2012 | Massachusetts Financial Services Company, Vice President | N/A | ||||
Thomas H. Connors (k) (age 53) | Assistant Secretary and Assistant Clerk | September 2012 | Massachusetts Financial Services Company, Vice President and Senior Counsel; Deutsche Investment Management Americas Inc. (financial service provider), Director and Senior Counsel (until 2012) | N/A | ||||
Ethan D. Corey (k) (age 49) | Assistant Secretary and Assistant Clerk | July 2005 | Massachusetts Financial Services Company, Senior Vice President and Associate General Counsel | N/A | ||||
20
Table of Contents
MFS New Discovery Portfolio
Trustees and Officers – continued
Name, Age | Position(s) with Fund | Trustee/Officer Since (h) | Principal Occupations During the Past Five Years | Other Directorships (j) | ||||
David L. DiLorenzo (k) (age 44) | Treasurer | July 2005 | Massachusetts Financial Services Company, Senior Vice President | N/A | ||||
Robyn L. Griffin (age 37) | Assistant Independent Chief Compliance Officer | August 2008 | Griffin Compliance LLC (provider of compliance services), Principal (since August 2008); State Street Corporation (financial services provider), Mutual Fund Administration Assistant Vice President (October 2006 – July 2008) | N/A | ||||
Brian E. Langenfeld (k) (age 39) | Assistant Secretary and Assistant Clerk | June 2006 | Massachusetts Financial Services Company, Vice President and Senior Counsel | N/A | ||||
Susan S. Newton (k) (age 62) | Assistant Secretary and Assistant Clerk | May 2005 | Massachusetts Financial Services Company, Senior Vice President and Associate General Counsel | N/A | ||||
Susan A. Pereira (k) (age 42) | Assistant Secretary and Assistant Clerk | July 2005 | Massachusetts Financial Services Company, Vice President and Senior Counsel | N/A | ||||
Kasey L. Phillips (k) (age 42) | Assistant Treasurer | September 2012 | Massachusetts Financial Services Company, Vice President; Wells Fargo Funds Management, LLC, Senior Vice President, Fund Treasurer (until 2012) | N/A | ||||
Mark N. Polebaum (k) (age 60) | Secretary and Clerk | January 2006 | Massachusetts Financial Services Company, Executive Vice President, General Counsel and Secretary | N/A | ||||
Frank L. Tarantino (age 68) | Independent Chief Compliance Officer | June 2004 | Tarantino LLC (provider of compliance services), Principal | N/A | ||||
Richard S. Weitzel (k) (age 42) | Assistant Secretary and Assistant Clerk | October 2007 | Massachusetts Financial Services Company, Senior Vice President and Associate General Counsel | N/A | ||||
James O. Yost (k) (age 52) | Deputy Treasurer | September 1990 | Massachusetts Financial Services Company, Senior Vice President | N/A | ||||
| (h) | Date first appointed to serve as Trustee/officer of an MFS fund. Each Trustee has served continuously since appointment unless indicated otherwise. For the period from December 15, 2004 until February 22, 2005, Mr. Manning served as Advisory Trustee. For the period October 2008, until January 2012, Mr. Corcoran served as Treasurer of the Funds. Prior to January 2012, Messrs. DiLorenzo and Yost served as Assistant Treasurers of the Funds. |
| (j) | Directorships or trusteeships of companies required to report to the Securities and Exchange Commission (i.e., “public companies”). |
| (k) | “Interested person” of the Trust within the meaning of the Investment Company Act of 1940 (referred to as the 1940 Act), which is the principal federal law governing investment companies like the fund, as a result of position with MFS. The address of MFS is 111 Huntington Avenue, Boston, Massachusetts 02199-7618. |
Each Trustee has been elected by shareholders and each Trustee and officer holds office until his or her successor is chosen and qualified or until his or her earlier death, resignation, retirement or removal. The Trust does not hold annual meetings for the purpose of electing Trustees, and Trustees are not elected for fixed terms. Messrs. Butler, Kavanaugh, Uek and Ms. Thomsen are members of the Trust’s Audit Committee.
Each of the Fund’s Trustees and officers holds comparable positions with certain other funds of which MFS or a subsidiary is the investment adviser or distributor, and, in the case of the officers, with certain affiliates of MFS. As of January 1, 2013, the Trustees served as board members of 143 funds within the MFS Family of Funds.
21
Table of Contents
MFS New Discovery Portfolio
Trustees and Officers – continued
The Statement of Additional Information for the Fund includes further information about the Trustees and is available without charge upon request by calling 1-800-225-2606.
Investment Adviser Massachusetts Financial Services Company 111 Huntington Avenue Boston, MA 02199-7618 | Custodian State Street Bank and Trust 1 Lincoln Street Boston, MA 02111-2900 | |
Distributor MFS Fund Distributors, Inc. 111 Huntington Avenue Boston, MA 02199-7618 | Independent Registered Public Accounting Firm Deloitte & Touche LLP 200 Berkeley Street Boston, MA 02116 | |
Portfolio Manager Thomas Wetherald |
22
Table of Contents
MFS New Discovery Portfolio
BOARD REVIEW OF INVESTMENT ADVISORY AGREEMENT
A discussion regarding the Board’s most recent approval of the fund’s Investment Advisory Agreement with MFS is available by clicking on the fund’s name under “Variable Insurance Portfolios – VIT II” in the “Products” section of the MFS Web site (mfs.com).
PROXY VOTING POLICIES AND INFORMATION
A general description of the MFS funds’ proxy voting policies and procedures is available without charge, upon request, by calling 1-800-225-2606, by visiting the Proxy Voting section of mfs.com or by visiting the SEC’s Web site at http://www.sec.gov.
Information regarding how the fund voted proxies relating to portfolio securities during the most recent twelve-month period ended June 30 is available without charge by visiting the Proxy Voting section of mfs.com or by visiting the SEC’s Web site at http://www.sec.gov.
QUARTERLY PORTFOLIO DISCLOSURE
The fund will file a complete schedule of portfolio holdings with the Securities and Exchange Commission (the Commission) for the first and third quarters of each fiscal year on Form N-Q. The fund’s Form N-Q is available on the EDGAR database on the Commission’s Internet Web site at http://www.sec.gov, and may be reviewed and copied at the:
Public Reference Room
Securities and Exchange Commission
100 F Street, NE, Room 1580
Washington, D.C. 20549
Information on the operation of the Public Reference Room may be obtained by calling the Commission at 1-800-SEC-0330. Copies of the fund’s Form N-Q also may be obtained, upon payment of a duplicating fee, by electronic request at the following e-mail address: publicinfo@sec.gov or by writing the Public Reference Section at the above address.
From time to time, MFS may post important information about the fund or the MFS funds on the MFS web site (mfs.com). This information is available by visiting the “News & Commentary” section of mfs.com or by clicking on the fund’s name under “Variable Insurance Portfolios – VIT II” in the “Products” section of mfs.com.
23
Table of Contents
rev. 3/11

| Why? | Financial companies choose how they share your personal information. Federal law gives consumers the right to limit some but not all sharing. Federal law also requires us to tell you how we collect, share, and protect your personal information. Please read this notice carefully to understand what we do. |
| What? | The types of personal information we collect and share depend on the product or service you have with us. This information can include:
• Social Security number and account balances • Account transactions and transaction history • Checking account information and wire transfer instructions
When you are no longer our customer, we continue to share your information as described in this notice. |
| How? | All financial companies need to share customers’ personal information to run their everyday business. In the section below, we list the reasons financial companies can share their customers’ personal information; the reasons MFS chooses to share; and whether you can limit this sharing. |
| Reasons we can share your personal information | Does MFS share? | Can you limit this sharing? | ||
For our everyday business purposes – such as to process your transactions, maintain your account(s), respond to court orders and legal investigations, or report to credit bureaus | Yes | No | ||
For our marketing purposes – to offer our products and services to you | No | We don’t share | ||
| For joint marketing with other financial companies | No | We don’t share | ||
For our affiliates’ everyday business purposes – information about your transactions and experiences | No | We don’t share | ||
For our affiliates’ everyday business purposes – information about your creditworthiness | No | We don’t share | ||
| For nonaffiliates to market to you | No | We don’t share |
| Questions? | Call 800-225-2606 or go to mfs.com. |
24
Table of Contents
| Page 2 |
| Who we are | ||
| Who is providing this notice? | MFS Funds, MFS Investment Management, MFS Institutional Advisors, Inc., MFS Fund Distributors, Inc., MFS Heritage Trust Company, and MFS Service Center, Inc. | |
| What we do | ||
| How does MFS protect my personal information? | To protect your personal information from unauthorized access and use, we use security measures that comply with federal law. These measures include procedural, electronic, and physical safeguards for the protection of the personal information we collect about you. | |
| How does MFS collect my personal information? | We collect your personal information, for example, when you
• open an account or provide account information • direct us to buy securities or direct us to sell your securities • make a wire transfer
We also collect your personal information from others, such as credit bureaus, affiliates and other companies. | |
| Why can’t I limit all sharing? | Federal law gives you the right to limit only
• sharing for affiliates’ everyday business purposes – information about your creditworthiness • affiliates from using your information to market to you • sharing for nonaffiliates to market to you
State laws and individual companies may give you additional rights to limit sharing. | |
| Definitions | ||
| Affiliates | Companies related by common ownership or control. They can be financial and nonfinancial companies.
•MFS does not share personal information with affiliates, except for everyday business purposes as described on page one of this notice. | |
| Nonaffiliates | Companies not related by common ownership or control. They can be financial and nonfinancial companies.
•MFS does not share with nonaffiliates so they can market to you. | |
| Joint Marketing | A formal agreement between nonaffiliated financial companies that together market financial products or services to you.
•MFS doesn’t jointly market. | |
| Other important information | ||
| If you own an MFS product or receive an MFS service in the name of a third party such as a bank or broker-dealer, their privacy policy may apply to you instead of ours. | ||
25
Table of Contents
Table of Contents
ANNUAL REPORT
December 31, 2012

MFS® VALUE PORTFOLIO
MFS® Variable Insurance Trust II

EIS-ANN
Table of Contents
MFS® VALUE PORTFOLIO
The report is prepared for the general information of contract owners. It is authorized for distribution to prospective investors only when preceded or accompanied by a current prospectus.
NOT FDIC INSURED Ÿ MAY LOSE VALUE Ÿ NO BANK OR CREDIT UNION GUARANTEE Ÿ NOT A DEPOSIT Ÿ NOT INSURED BY ANY FEDERAL GOVERNMENT AGENCY OR NCUA/NCUSIF
Table of Contents
MFS Value Portfolio
LETTER FROM THE CHAIRMAN AND CEO

Dear Contract Owners:
The global market outlook for 2013 is one of cautious optimism. While we are seeing some positive economic trends in the United States, Europe and China, the overall environment remains challenging. In the United States, the recent fiscal cliff agreement was received positively by investors, even though it mostly addressed pressing taxation issues and did not resolve additional concerns, including the need for spending cuts and a large-scale reduction of the federal debt. These issues will be front and center again in the spring. Despite the ongoing uncertainty, economic tailwinds are gathering strength as the U.S. housing and job markets are improving and consumer confidence is rising.
Overseas, the debt crisis continues to weigh heavily on eurozone markets, with even Germany — long an economic stalwart — experiencing some contraction. These ongoing challenges could be a drag on global market performance this year. In Asia, manufacturing activity has accelerated in emerging markets such as China and India, and we are seeing signs of stabilized loan growth in China, a leading indicator of that country’s economic health. In contrast, Japan’s economy is contracting sharply under deflationary pressures. Nevertheless, Japanese markets have responded favorably to early actions by the new government, which appears determined to act aggressively, along with the Bank of Japan, to stimulate growth.
As always, managing risk in the face of uncertainty remains a top priority for investors. At MFS®, our uniquely collaborative investment process revolves around global research and our disciplined risk management approach. Our global team of investment professionals shares ideas and evaluates opportunities across continents, investment disciplines and asset classes — all with a goal of building better insights, and ultimately better results, for our clients.
We remain mindful of the many economic challenges investors face today, and believe it is more important than ever to maintain a long-term view, employ time-tested principles, such as asset allocation and diversification, and work closely with investment advisors to identify and pursue the most suitable opportunities.
Respectfully,

Robert J. Manning
Chairman and Chief Executive Officer
MFS Investment Management®
February 15, 2013
The opinions expressed in this letter are subject to change, may not be relied upon for investment advice, and no forecasts can be guaranteed.
1
Table of Contents
MFS Value Portfolio
Portfolio structure

| Top ten holdings | ||||
| Philip Morris International, Inc. | 3.5% | |||
| JPMorgan Chase & Co. | 3.5% | |||
| Pfizer, Inc. | 3.4% | |||
| Lockheed Martin Corp. | 3.4% | |||
| Johnson & Johnson | 3.2% | |||
| Goldman Sachs Group, Inc. | 2.6% | |||
| Accenture PLC, “A” | 2.2% | |||
| Chevron Corp. | 2.1% | |||
| AT&T, Inc. | 2.1% | |||
| United Technologies Corp. | 2.0% |
| Equity sectors | ||||
| Financial Services | 21.7% | |||
| Health Care | 13.4% | |||
| Consumer Staples | 13.0% | |||
| Industrial Goods & Services | 12.2% | |||
| Leisure | 7.3% | |||
| Energy | 7.0% | |||
| Utilities & Communications | 4.6% | |||
| Technology | 4.2% | |||
| Retailing | 4.1% | |||
| Basic Materials | 4.0% | |||
| Special Products & Services | 3.1% | |||
| Autos & Housing | 2.9% | |||
| Transportation | 2.0% |
Percentages are based on net assets as of 12/31/12.
The portfolio is actively managed and current holdings may be different.
2
Table of Contents
MFS Value Portfolio
Summary of Results
For the twelve months ended December 31, 2012, Initial Class shares of the MFS Value Portfolio (“fund”) provided a total return of 16.22%, while Service Class shares of the fund provided a total return of 15.97%. These compare with a return of 17.51% over the same period for the fund’s benchmark, the Russell 1000 Value Index.
Market Environment
The beginning of the period was characterized by a risk-on sentiment as a result of additional liquidity measures by the Federal Reserve Bank (“Fed”) and the European Central Bank (“ECB”) as well as a commensurate improvement in macroeconomic conditions. During this time, global equity valuations rose, credit spreads contracted, and high-quality sovereign yields increased modestly.
During the middle of the period, however, conditions worsened, driven by broadly weaker global macroeconomic indicators, as well as renewed concerns over the eurozone’s capacity and determination to address its ongoing crisis. Despite this deterioration, broad market sentiment remained relatively resilient as equity markets generally maintained gains and credit spreads did not indicate deterioration.
However, this renewed weakness in the fundamentals precipitated a further round of monetary easing by both the Fed (through a third round of quantitative easing) and the ECB (through a new bond purchase facility) in the second half of the period, which soon instilled additional confidence in risk markets. Nonetheless, towards the end of the period, weaker equity earnings reports and declining forward guidance caused market sentiment to soften. In addition, as we moved toward year end, the fiscal cliff negotiations between the Republicans in the U.S. Congress and President Obama were a particular source of market attention, where uncertainty surrounding the fiscal negotiations continued right up to the end-of-year deadline.
Detractors from Performance
The combination of weak stock selection and an underweight position in the financial services sector detracted from performance relative to the Russell 1000 Value Index. The fund’s underweight position in financial services firm Bank of America (h), and holdings of consumer and business payment processor Western Union (b), held back relative performance. Shares of Bank of America traded higher as the company reported earnings results that beat analysts’ expectations which demonstrated the effectiveness of the bank’s cost-cutting efforts. In addition, banks as a group were among the best-performing stocks during the reporting period. Not holding shares of strong-performing financial services firm Citigroup also weakened relative results.
Stock selection in the retailing sector dampened relative returns. There were no individual securities within this sector that were among the fund’s top relative detractors for the reporting period.
Stocks in other sectors that detracted from relative performance included oil and gas exploration and production company Occidental Petroleum, tobacco company Philip Morris International, global food company General Mills, and diversified technology products and services company International Business Machines (b). Holdings of voice and data communications services company Vodafone Group (b), and the timing of the fund’s ownership in shares of semiconductor company Intel, also hurt relative results. Shares of Vodafone struggled as weak economic conditions in Europe weighed on the shares of many telecommunications companies in 2012.
The fund’s cash and/or cash equivalents position was also a detractor from relative performance. The fund strives to be fully invested and generally holds cash to buy new holdings and to provide liquidity. In a period when equity markets rose, as measured by the fund’s benchmark, holding cash hurt performance versus the benchmark, which has no cash position.
Contributors to Performance
Security selection in the technology sector aided relative performance. The fund’s underweight position in shares of poor-performing computer products and services provider Hewlett-Packard helped relative returns. The stock declined as management provided guidance for fiscal 2013 which was below analysts’ expectations. Management expressed caution regarding current trends and forecasted the fiscal year to be a “fix and rebuild year” with broad-based profit declines. Additionally, the market’s concern over potential accounting issues associated with the company’s acquisition of Autonomy (h) appeared to have weighed on results. Holdings of enterprise software products maker Oracle (b) also supported relative returns as the stock outperformed the benchmark during the reporting period.
An underweight allocation to the utilities & communications sector boosted relative performance. Within this sector, the fund’s avoidance of poor-performing electric company Exelon strengthened relative results. Management announced that in an effort to
3
Table of Contents
MFS Value Portfolio
Management Review – continued
retain its investment grade rating, in the face of rising debt levels, it would be reducing its capital expenditure plans and also indicated that if power prices did not increase, the company would have to reevaluate its dividend. The risk of a potential dividend cut appeared to have weighed heavily on its share price.
Stock selection in the basic materials sector also supported relative performance. Holdings of stand-out-performing chemical company PPG Industries (b) aided results during the reporting period.
Elsewhere, holdings of investment banking firm Goldman Sachs Group, alcoholic drink producer Diageo (b), household products maker Procter & Gamble, paint and coatings manufacturer Sherwin Williams (b)(h), management consulting firm Accenture (b), and financial services firm JPMorgan Chase, were among the fund’s top relative contributors.
Respectfully,
| Nevin Chitkara | Steven Gorham | |
| Portfolio Manager | Portfolio Manager |
| (b) | Security is not a benchmark constituent. |
| (h) | Security was not held in the portfolio at period end. |
The views expressed in this report are those of the portfolio managers only through the end of the period of the report as stated on the cover and do not necessarily reflect the views of MFS or any other person in the MFS organization. These views are subject to change at any time based on market or other conditions, and MFS disclaims any responsibility to update such views. These views may not be relied upon as investment advice or an indication of trading intent on behalf of any MFS portfolio. References to specific securities are not recommendations of such securities, and may not be representative of any MFS portfolio’s current or future investments.
4
Table of Contents
MFS Value Portfolio
PERFORMANCE SUMMARY THROUGH 12/31/12
The following chart illustrates the historical performance of the fund in comparison to its benchmark(s). Benchmarks are unmanaged and may not be invested in directly. Benchmark returns do not reflect any fees or expenses. The performance of other share classes will be greater than or less than that of the class depicted below. (See Notes to Performance Summary.)
Performance data shown represents past performance and is no guarantee of future results. Investment return and principal value fluctuate so your units, when sold, may be worth more or less than the original cost; current performance may be lower or higher than quoted. The performance shown does not reflect the deduction of taxes, if any, that a contract holder would pay on fund distributions or the redemption of contract units. The returns for the fund shown also do not reflect the deduction of expenses associated with variable products, such as mortality and expense risk charges, separate account charges, and sales charges imposed by the insurance company separate accounts. Such expenses would reduce the overall returns shown.
Growth of a Hypothetical $10,000 Investment
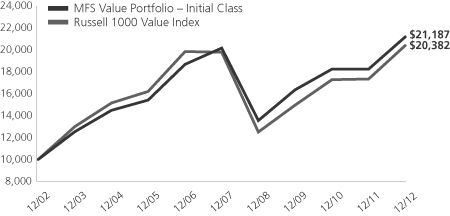
Total Returns through 12/31/12
Average annual total returns
| Share Class | Class inception date | 1-yr | 5-yr | 10-yr | ||||||||
| Initial Class | 5/06/98 | 16.22% | 1.01% | 7.80% | ||||||||
| Service Class | 8/24/01 | 15.97% | 0.76% | 7.53% | ||||||||
| Comparative benchmark | ||||||||||||
| Russell 1000 Value Index (f) | 17.51% | 0.59% | 7.38% | |||||||||
| (f) | Source: FactSet Research Systems Inc. |
Benchmark Definition
Russell 1000 Value Index – constructed to provide a comprehensive barometer for the value securities in the large-cap segment of the U.S. equity universe. Companies in this index generally have lower price-to-book ratios and lower forecasted growth values.
It is not possible to invest directly in an index.
Notes to Performance Summary
Average annual total return represents the average annual change in value for each share class for the periods presented.
Performance results reflect any applicable expense subsidies and waivers in effect during the periods shown. Without such subsidies and waivers the fund’s performance results would be less favorable. Please see the prospectus and financial statements for complete details. All results are historical and assume the reinvestment of any dividends and capital gains distributions.
Performance results do not include adjustments made for financial reporting purposes in accordance with U.S. generally accepted accounting principles and may differ from amounts reported in the financial highlights.
From time to time the fund may receive proceeds from litigation settlements, without which performance would be lower.
5
Table of Contents
MFS Value Portfolio
Fund Expenses Borne by the Contract Holders During the Period,
July 1, 2012 through December 31, 2012
As a contract holder of the fund, you incur ongoing costs, including management fees; distribution and/or service (12b-1) fees; and other fund expenses. This example is intended to help you understand your ongoing costs (in dollars) of investing in the fund and to compare these costs with the ongoing costs of investing in other mutual funds.
The example is based on an investment of $1,000 invested at the beginning of the period and held for the entire period July 1, 2012 through December 31, 2012.
Actual Expenses
The first line for each share class in the following table provides information about actual account values and actual expenses. You may use the information in this line, together with the amount you invested, to estimate the expenses that you paid over the period. Simply divide your account value by $1,000 (for example, an $8,600 account value divided by $1,000 = 8.6), then multiply the result by the number in the first line under the heading entitled “Expenses Paid During Period” to estimate the expenses you paid on your account during this period.
Hypothetical Example for Comparison Purposes
The second line for each share class in the following table provides information about hypothetical account values and hypothetical expenses based on the fund’s actual expense ratio and an assumed rate of return of 5% per year before expenses, which is not the fund’s actual return. The hypothetical account values and expenses may not be used to estimate the actual ending account balance or expenses you paid for the period. You may use this information to compare the ongoing costs of investing in the fund and other funds. To do so, compare this 5% hypothetical example with the 5% hypothetical examples that appear in the shareholder reports of the other funds.
Please note that the expenses shown in the table are meant to highlight the fund’s ongoing costs only and do not take into account the fees and expenses imposed under the variable contracts through which your investment in the fund is made. Therefore, the second line for each share class in the table is useful in comparing ongoing costs associated with an investment in vehicles (such as the fund) which fund benefits under variable annuity and variable life insurance contracts and to qualified pension and retirement plans only, and will not help you determine the relative total costs of investing in the fund through variable annuity and variable life insurance contracts. If the fees and expenses imposed under the variable contracts were included, your costs would have been higher.
| Share Class | Annualized Expense Ratio | Beginning Account Value 7/01/12 | Ending Account Value | Expenses Paid During Period (p) 7/01/12-12/31/12 | ||||||||||||||
| Initial Class | Actual | 0.80% | $1,000.00 | $1,076.18 | $4.18 | |||||||||||||
| Hypothetical (h) | 0.80% | $1,000.00 | $1,021.11 | $4.06 | ||||||||||||||
| Service Class | Actual | 1.05% | $1,000.00 | $1,074.72 | $5.48 | |||||||||||||
| Hypothetical (h) | 1.05% | $1,000.00 | $1,019.86 | $5.33 | ||||||||||||||
| (h) | 5% class return per year before expenses. |
| (p) | Expenses paid are equal to each class’s annualized expense ratio, as shown above, multiplied by the average account value over the period, multiplied by the number of days in the period, divided by the number of days in the year. |
6
Table of Contents
MFS Value Portfolio
PORTFOLIO OF INVESTMENTS – 12/31/12
The Portfolio of Investments is a complete list of all securities owned by your fund. It is categorized by broad-based asset classes.
| Issuer | Shares/Par | Value ($) | ||||||
| COMMON STOCKS – 99.3% | ||||||||
| Aerospace – 8.2% | ||||||||
| Honeywell International, Inc. | 87,780 | $ | 5,571,397 | |||||
| Lockheed Martin Corp. | 115,007 | 10,613,996 | ||||||
| Northrop Grumman Corp. | 48,350 | 3,267,493 | ||||||
| United Technologies Corp. | 75,655 | 6,204,467 | ||||||
|
| |||||||
| $ | 25,657,353 | |||||||
|
| |||||||
| Alcoholic Beverages – 1.9% | ||||||||
| Diageo PLC | 204,242 | $ | 5,946,000 | |||||
|
| |||||||
| Automotive – 1.9% | ||||||||
| Delphi Automotive PLC (a) | 49,840 | $ | 1,906,380 | |||||
| General Motors Co. (a) | 24,390 | 703,164 | ||||||
| Johnson Controls, Inc. | 108,955 | 3,344,919 | ||||||
|
| |||||||
| $ | 5,954,463 | |||||||
|
| |||||||
| Broadcasting – 4.0% | ||||||||
| Omnicom Group, Inc. | 70,798 | $ | 3,537,068 | |||||
| Viacom, Inc., “B” | 69,040 | 3,641,170 | ||||||
| Walt Disney Co. | 110,542 | 5,503,886 | ||||||
|
| |||||||
| $ | 12,682,124 | |||||||
|
| |||||||
| Brokerage & Asset Managers – 2.0% | ||||||||
| BlackRock, Inc. | 20,942 | $ | 4,328,921 | |||||
| Franklin Resources, Inc. | 16,480 | 2,071,536 | ||||||
|
| |||||||
| $ | 6,400,457 | |||||||
|
| |||||||
| Business Services – 3.1% | ||||||||
| Accenture PLC, “A” | 101,717 | $ | 6,764,181 | |||||
| Dun & Bradstreet Corp. | 18,887 | 1,485,463 | ||||||
| Fiserv, Inc. (a) | 20,380 | 1,610,631 | ||||||
|
| |||||||
| $ | 9,860,275 | |||||||
|
| |||||||
| Cable TV – 1.0% | ||||||||
| Comcast Corp., “Special A” | 87,070 | $ | 3,130,166 | |||||
|
| |||||||
| Chemicals – 3.1% | ||||||||
| 3M Co. | 57,648 | $ | 5,352,617 | |||||
| PPG Industries, Inc. | 32,537 | 4,403,883 | ||||||
|
| |||||||
| $ | 9,756,500 | |||||||
|
| |||||||
| Computer Software – 1.5% | ||||||||
| Oracle Corp. | 142,323 | $ | 4,742,202 | |||||
|
| |||||||
| Computer Software – Systems – 2.0% | ||||||||
| Hewlett-Packard Co. | 32,070 | $ | 456,998 | |||||
| International Business Machines Corp. | 30,175 | 5,780,021 | ||||||
|
| |||||||
| $ | 6,237,019 | |||||||
|
| |||||||
| Construction – 1.0% | ||||||||
| Stanley Black & Decker, Inc. | 44,126 | $ | 3,264,000 | |||||
|
| |||||||
| Consumer Products – 0.5% | ||||||||
| Procter & Gamble Co. | 22,508 | $ | 1,528,068 | |||||
|
| |||||||
| Electrical Equipment – 2.8% | ||||||||
| Danaher Corp. | 71,590 | $ | 4,001,881 | |||||
| Pentair Ltd. | 25,806 | 1,268,365 | ||||||
| Issuer | Shares/Par | Value ($) | ||||||
| COMMON STOCKS – continued | ||||||||
| Electrical Equipment – continued | ||||||||
| Tyco International Ltd. | 114,900 | $ | 3,360,825 | |||||
|
| |||||||
| $ | 8,631,071 | |||||||
|
| |||||||
| Electronics – 0.7% | ||||||||
| Intel Corp. | 104,382 | $ | 2,153,401 | |||||
|
| |||||||
| Energy – Independent – 2.8% | ||||||||
| Apache Corp. | 23,455 | $ | 1,841,217 | |||||
| EOG Resources, Inc. | 18,092 | 2,185,333 | ||||||
| Occidental Petroleum Corp. | 61,787 | 4,733,502 | ||||||
|
| |||||||
| $ | 8,760,052 | |||||||
|
| |||||||
| Energy – Integrated – 4.0% | ||||||||
| Chevron Corp. | 61,273 | $ | 6,626,062 | |||||
| Exxon Mobil Corp. | 67,387 | 5,832,345 | ||||||
|
| |||||||
| $ | 12,458,407 | |||||||
|
| |||||||
| Engineering – Construction – 0.2% | ||||||||
| Fluor Corp. | 8,330 | $ | 489,304 | |||||
|
| |||||||
| Food & Beverages – 5.5% | ||||||||
| Coca-Cola Enterprises, Inc. | 27,070 | $ | 858,931 | |||||
| Dr Pepper Snapple Group, Inc. | 33,860 | 1,495,935 | ||||||
| General Mills, Inc. | 118,170 | 4,775,250 | ||||||
| Groupe Danone | 48,333 | 3,193,343 | ||||||
| J.M. Smucker Co. | 10,030 | 864,987 | ||||||
| Kellogg Co. | 20,600 | 1,150,510 | ||||||
| Nestle S.A. | 54,586 | 3,556,908 | ||||||
| PepsiCo, Inc. | 20,143 | 1,378,385 | ||||||
|
| |||||||
| $ | 17,274,249 | |||||||
|
| |||||||
| Food & Drug Stores – 1.5% | ||||||||
| CVS Caremark Corp. | 93,933 | $ | 4,541,661 | |||||
|
| |||||||
| General Merchandise – 1.7% | ||||||||
| Kohl’s Corp. | 19,710 | $ | 847,136 | |||||
| Target Corp. | 72,990 | 4,318,818 | ||||||
|
| |||||||
| $ | 5,165,954 | |||||||
|
| |||||||
| Insurance – 7.2% | ||||||||
| ACE Ltd. | 45,780 | $ | 3,653,244 | |||||
| Aon PLC | 59,770 | 3,323,212 | ||||||
| Chubb Corp. | 32,325 | 2,434,719 | ||||||
| MetLife, Inc. | 159,858 | 5,265,723 | ||||||
| Prudential Financial, Inc. | 69,507 | 3,706,808 | ||||||
| Travelers Cos., Inc. | 59,085 | 4,243,485 | ||||||
|
| |||||||
| $ | 22,627,191 | |||||||
|
| |||||||
| Leisure & Toys – 0.8% | ||||||||
| Hasbro, Inc. | 72,483 | $ | 2,602,140 | |||||
|
| |||||||
| Machinery & Tools – 0.9% | ||||||||
| Eaton Corp. PLC | 51,310 | $ | 2,781,002 | |||||
|
| |||||||
7
Table of Contents
MFS Value Portfolio
Portfolio of Investments – continued
| Issuer | Shares/Par | Value ($) | ||||||
| COMMON STOCKS – continued | ||||||||
| Major Banks – 11.3% | ||||||||
| Bank of New York Mellon Corp. | 195,765 | $ | 5,031,160 | |||||
| Goldman Sachs Group, Inc. | 63,242 | 8,067,150 | ||||||
| JPMorgan Chase & Co. | 249,072 | 10,951,696 | ||||||
| PNC Financial Services Group, Inc. | 37,405 | 2,181,086 | ||||||
| State Street Corp. | 66,345 | 3,118,878 | ||||||
| Wells Fargo & Co. | 178,922 | 6,115,554 | ||||||
|
| |||||||
| $ | 35,465,524 | |||||||
|
| |||||||
| Medical & Health Technology & Services – 0.5% | ||||||||
| Quest Diagnostics, Inc. | 27,830 | $ | 1,621,654 | |||||
|
| |||||||
| Medical Equipment – 3.3% | ||||||||
| Becton, Dickinson & Co. | 20,682 | $ | 1,617,126 | |||||
| Medtronic, Inc. | 83,680 | 3,432,554 | ||||||
| St. Jude Medical, Inc. | 66,470 | 2,402,226 | ||||||
| Thermo Fisher Scientific, Inc. | 47,555 | 3,033,058 | ||||||
|
| |||||||
| $ | 10,484,964 | |||||||
|
| |||||||
| Oil Services – 0.2% | ||||||||
| Transocean, Inc. | 16,290 | $ | 727,348 | |||||
|
| |||||||
| Other Banks & Diversified Financials – 1.2% | ||||||||
| MasterCard, Inc., “A” | 2,980 | $ | 1,464,014 | |||||
| Western Union Co. | 161,715 | 2,200,941 | ||||||
|
| |||||||
| $ | 3,664,955 | |||||||
|
| |||||||
| Pharmaceuticals – 9.6% | ||||||||
| Abbott Laboratories | 70,702 | $ | 4,630,981 | |||||
| Johnson & Johnson | 142,797 | 10,010,070 | ||||||
| Merck & Co., Inc. | 69,742 | 2,855,237 | ||||||
| Pfizer, Inc. | 425,628 | 10,674,750 | ||||||
| Roche Holding AG | 9,101 | 1,854,100 | ||||||
|
| |||||||
| $ | 30,025,138 | |||||||
|
| |||||||
| Printing & Publishing – 1.1% | ||||||||
| McGraw-Hill Cos., Inc. | 29,430 | $ | 1,608,938 | |||||
| Moody’s Corp. | 39,000 | 1,962,480 | ||||||
|
| |||||||
| $ | 3,571,418 | |||||||
|
| |||||||
| Railroad & Shipping – 0.5% | ||||||||
| Canadian National Railway Co. | 16,720 | $ | 1,521,687 | |||||
|
| |||||||
| Restaurants – 0.4% | ||||||||
| McDonald’s Corp. | 14,360 | $ | 1,266,696 | |||||
|
| |||||||
| Specialty Chemicals – 0.9% | ||||||||
| Air Products & Chemicals, Inc. | 33,307 | $ | 2,798,454 | |||||
|
| |||||||
| Specialty Stores – 0.9% | ||||||||
| Advance Auto Parts, Inc. | 25,210 | $ | 1,823,943 | |||||
| Staples, Inc. | 93,840 | 1,069,776 | ||||||
|
| |||||||
| $ | 2,893,719 | |||||||
|
| |||||||
| Telecommunications – Wireless – 1.6% | ||||||||
| Vodafone Group PLC | 2,038,048 | $ | 5,125,418 | |||||
|
| |||||||
| Telephone Services – 2.1% | ||||||||
| AT&T, Inc. | 194,172 | $ | 6,545,538 | |||||
|
| |||||||
| Issuer | Shares/Par | Value ($) | ||||||
| COMMON STOCKS – continued | ||||||||
| Tobacco – 5.1% | ||||||||
| Altria Group, Inc. | 52,222 | $ | 1,640,815 | |||||
| Lorillard, Inc. | 28,100 | 3,278,427 | ||||||
| Philip Morris International, Inc. | 132,935 | 11,118,683 | ||||||
|
| |||||||
| $ | 16,037,925 | |||||||
|
| |||||||
| Trucking – 1.5% | ||||||||
| United Parcel Service, Inc., “B” | 63,610 | $ | 4,689,965 | |||||
|
| |||||||
| Utilities – Electric Power – 0.8% | ||||||||
| PG&E Corp. | 30,758 | $ | 1,235,856 | |||||
| PPL Corp. | 20,552 | 588,404 | ||||||
| Public Service Enterprise Group, Inc. | 20,443 | 625,556 | ||||||
|
| |||||||
| $ | 2,449,816 | |||||||
|
| |||||||
| Total Common Stocks (Identified Cost, $254,033,767) | $ | 311,533,278 | ||||||
|
| |||||||
| CONVERTIBLE PREFERRED STOCKS – 0.2% | ||||||||
| Aerospace – 0.1% | ||||||||
| United Technologies Corp., 7.5% | 5,450 | $ | 303,619 | |||||
|
| |||||||
| Utilities – Electric Power – 0.1% | ||||||||
| PPL Corp., 9.5% | 6,380 | $ | 333,738 | |||||
|
| |||||||
| Total Convertible Preferred Stocks (Identified Cost, $591,500) | $ | 637,357 | ||||||
|
| |||||||
| MONEY MARKET FUNDS – 0.5% | ||||||||
| MFS Institutional Money Market Portfolio, 0.16%, at Cost and Net Asset Value (v) | 1,687,422 | $ | 1,687,422 | |||||
|
| |||||||
| Total Investments (Identified Cost, $256,312,689) | $ | 313,858,057 | ||||||
|
| |||||||
| OTHER ASSETS, LESS LIABILITIES – (0.0)% | (87,786 | ) | ||||||
|
| |||||||
| Net Assets – 100.0% | $ | 313,770,271 | ||||||
|
| |||||||
| (a) | Non-income producing security. |
| (v) | Underlying affiliated fund that is available only to investment companies managed by MFS. The rate quoted for the MFS Institutional Money Market Portfolio is the annualized seven-day yield of the fund at period end. |
The following abbreviations are used in this report and are defined:
| PLC | Public Limited Company |
See Notes to Financial Statements
8
Table of Contents
MFS Value Portfolio
FINANCIAL STATEMENTS | STATEMENT OF ASSETS AND LIABILITIES
This statement represents your fund’s balance sheet, which details the assets and liabilities comprising the total value of the fund.
At 12/31/12 | ||||||||
Assets | ||||||||
Investments – | ||||||||
Non-affiliated issuers, at value (identified cost, $254,625,267) | $312,170,635 | |||||||
Underlying affiliated funds, at cost and value | 1,687,422 | |||||||
Total investments, at value (identified cost, $256,312,689) | $313,858,057 | |||||||
Cash | 5,393 | |||||||
Receivables for | ||||||||
Fund shares sold | 1,611 | |||||||
Interest and dividends | 571,379 | |||||||
Other assets | 5,467 | |||||||
Total assets | $314,441,907 | |||||||
Liabilities | ||||||||
Payables for | ||||||||
Investments purchased | $40,451 | |||||||
Fund shares reacquired | 549,287 | |||||||
Payable to affiliates | ||||||||
Investment adviser | 26,191 | |||||||
Distribution and/or service fees | 5,260 | |||||||
Accrued expenses and other liabilities | 50,447 | |||||||
Total liabilities | $671,636 | |||||||
Net assets | $313,770,271 | |||||||
Net assets consist of | ||||||||
Paid-in capital | $230,366,785 | |||||||
Unrealized appreciation (depreciation) on investments and translation of assets and liabilities in foreign currencies | 57,548,569 | |||||||
Accumulated net realized gain (loss) on investments and foreign currency | 16,685,038 | |||||||
Undistributed net investment income | 9,169,879 | |||||||
Net assets | $313,770,271 | |||||||
Shares of beneficial interest outstanding | 22,994,421 |
| Net assets | Shares outstanding | Net asset value per share | ||||||||||
Initial Class | $120,664,767 | 8,790,517 | $13.73 | |||||||||
Service Class | 193,105,504 | 14,203,904 | 13.60 | |||||||||
See Notes to Financial Statements
9
Table of Contents
MFS Value Portfolio
FINANCIAL STATEMENTS | STATEMENT OF OPERATIONS
This statement describes how much your fund earned in investment income and accrued in expenses. It also describes any gains and/or losses generated by fund operations.
Year ended 12/31/12 | ||||||||
Net investment income | ||||||||
Income | ||||||||
Dividends | $13,744,171 | |||||||
Interest | 10,779 | |||||||
Dividends from underlying affiliated funds | 5,961 | |||||||
Foreign taxes withheld | (90,207 | ) | ||||||
Total investment income | $13,670,704 | |||||||
Expenses | ||||||||
Management fee | $3,720,685 | |||||||
Distribution and/or service fees | 510,427 | |||||||
Administrative services fee | 81,568 | |||||||
Independent Trustees’ compensation | 20,797 | |||||||
Custodian fee | 54,319 | |||||||
Shareholder communications | 16,240 | |||||||
Audit and tax fees | 46,840 | |||||||
Legal fees | 8,497 | |||||||
Miscellaneous | 29,337 | |||||||
Total expenses | $4,488,710 | |||||||
Fees paid indirectly | (5 | ) | ||||||
Reduction of expenses by investment adviser | (1,844 | ) | ||||||
Net expenses | $4,486,861 | |||||||
Net investment income | $9,183,843 | |||||||
Realized and unrealized gain (loss) on investments and foreign currency | ||||||||
Realized gain (loss) (identified cost basis) | ||||||||
Investments | $19,848,464 | |||||||
Foreign currency | (7,000 | ) | ||||||
Net realized gain (loss) on investments and foreign currency | $19,841,464 | |||||||
Change in unrealized appreciation (depreciation) | ||||||||
Investments | $44,591,348 | |||||||
Translation of assets and liabilities in foreign currencies | 10,343 | |||||||
Net unrealized gain (loss) on investments and foreign currency translation | $44,601,691 | |||||||
Net realized and unrealized gain (loss) on investments and foreign currency | $64,443,155 | |||||||
Change in net assets from operations | $73,626,998 |
See Notes to Financial Statements
10
Table of Contents
MFS Value Portfolio
FINANCIAL STATEMENTS | STATEMENTS OF CHANGES IN NET ASSETS
These statements describe the increases and/or decreases in net assets resulting from operations, any distributions, and any shareholder transactions.
For years ended 12/31 | 2012 | 2011 | ||||||
Change in net assets | ||||||||
From operations | ||||||||
Net investment income | $9,183,843 | $8,824,407 | ||||||
Net realized gain (loss) on investments and foreign currency | 19,841,464 | 25,313,395 | ||||||
Net unrealized gain (loss) on investments and foreign currency translation | 44,601,691 | (32,312,741 | ) | |||||
Change in net assets from operations | $73,626,998 | $1,825,061 | ||||||
Distributions declared to shareholders | ||||||||
From net investment income | $(8,840,197 | ) | $(7,907,338 | ) | ||||
From net realized gain on investments | (24,335,355 | ) | (35,328,011 | ) | ||||
Total distributions declared to shareholders | $(33,175,552 | ) | $(43,235,349 | ) | ||||
Change in net assets from fund share transactions | $(238,128,206 | ) | $21,633,004 | |||||
Total change in net assets | $(197,676,760 | ) | $(19,777,284 | ) | ||||
Net assets | ||||||||
At beginning of period | 511,447,031 | 531,224,315 | ||||||
At end of period (including undistributed net investment income of $9,169,879 and | $313,770,271 | $511,447,031 |
See Notes to Financial Statements
11
Table of Contents
MFS Value Portfolio
FINANCIAL STATEMENTS | FINANCIAL HIGHLIGHTS
The financial highlights table is intended to help you understand the fund’s financial performance for the past 5 years. Certain information reflects financial results for a single fund share. The total returns in the table represent the rate by which an investor would have earned (or lost) on an investment in the fund share class (assuming reinvestment of all distributions) held for the entire period.
| Initial Class | Years ended 12/31 | |||||||||||||||||||
| 2012 | 2011 | 2010 | 2009 | 2008 | ||||||||||||||||
Net asset value, beginning of period | $12.64 | $13.91 | $12.64 | $10.70 | $18.78 | |||||||||||||||
| Income (loss) from investment operations | ||||||||||||||||||||
Net investment income (d) | $0.26 | $0.24 | $0.20 | $0.22 | $0.25 | |||||||||||||||
Net realized and unrealized gain (loss) on investments | 1.76 | (0.31 | ) | 1.25 | 1.92 | (5.50 | ) | |||||||||||||
Total from investment operations | $2.02 | $(0.07 | ) | $1.45 | $2.14 | $(5.25 | ) | |||||||||||||
| Less distributions declared to shareholders | ||||||||||||||||||||
From net investment income | $(0.26 | ) | $(0.23 | ) | $(0.18 | ) | $(0.20 | ) | $(0.30 | ) | ||||||||||
From net realized gain on investments | (0.67 | ) | (0.97 | ) | — | — | (2.53 | ) | ||||||||||||
Total distributions declared to shareholders | $(0.93 | ) | $(1.20 | ) | $(0.18 | ) | $(0.20 | ) | $(2.83 | ) | ||||||||||
Net asset value, end of period (x) | $13.73 | $12.64 | $13.91 | $12.64 | $10.70 | |||||||||||||||
Total return (%) (k)(r)(s)(x) | 16.22 | (0.00 | )(w) | 11.51 | 20.49 | (32.64 | ) | |||||||||||||
| Ratios (%) (to average net assets) and Supplemental data: | ||||||||||||||||||||
Expenses before expense reductions (f) | 0.80 | 0.82 | 0.84 | 0.85 | 0.84 | |||||||||||||||
Expenses after expense reductions (f) | 0.80 | N/A | N/A | N/A | N/A | |||||||||||||||
Net investment income | 1.93 | 1.81 | 1.59 | 1.98 | 1.75 | |||||||||||||||
Portfolio turnover | 15 | 22 | 34 | 27 | 44 | |||||||||||||||
Net assets at end of period (000 omitted) | $120,665 | $307,523 | $298,799 | $268,001 | $146,011 | |||||||||||||||
See Notes to Financial Statements
12
Table of Contents
MFS Value Portfolio
Financial Highlights – continued
| Service Class | Years ended 12/31 | |||||||||||||||||||
| 2012 | 2011 | 2010 | 2009 | 2008 | ||||||||||||||||
Net asset value, beginning of period | $12.52 | $13.79 | $12.54 | $10.61 | $18.66 | |||||||||||||||
| Income (loss) from investment operations | ||||||||||||||||||||
Net investment income (d) | $0.23 | $0.21 | $0.17 | $0.19 | $0.22 | |||||||||||||||
Net realized and unrealized gain (loss) on investments | 1.74 | (0.31 | ) | 1.23 | 1.91 | (5.48 | ) | |||||||||||||
Total from investment operations | $1.97 | $(0.10 | ) | $1.40 | $2.10 | $(5.26 | ) | |||||||||||||
| Less distributions declared to shareholders | ||||||||||||||||||||
From net investment income | $(0.22 | ) | $(0.20 | ) | $(0.15 | ) | $(0.17 | ) | $(0.26 | ) | ||||||||||
From net realized gain on investments | (0.67 | ) | (0.97 | ) | — | — | (2.53 | ) | ||||||||||||
Total distributions declared to shareholders | $(0.89 | ) | $(1.17 | ) | $(0.15 | ) | $(0.17 | ) | $(2.79 | ) | ||||||||||
Net asset value, end of period (x) | $13.60 | $12.52 | $13.79 | $12.54 | $10.61 | |||||||||||||||
Total return (%) (k)(r)(s)(x) | 15.97 | (0.29 | ) | 11.22 | 20.30 | (32.87 | ) | |||||||||||||
| Ratios (%) (to average net assets) and Supplemental data: | ||||||||||||||||||||
Expenses before expense reductions (f) | 1.05 | 1.07 | 1.09 | 1.10 | 1.09 | |||||||||||||||
Expenses after expense reductions (f) | 1.05 | N/A | N/A | N/A | N/A | |||||||||||||||
Net investment income | 1.73 | 1.54 | 1.33 | 1.73 | 1.62 | |||||||||||||||
Portfolio turnover | 15 | 22 | 34 | 27 | 44 | |||||||||||||||
Net assets at end of period (000 omitted) | $193,106 | $203,924 | $232,425 | $228,388 | $165,519 | |||||||||||||||
| (d) | Per share data is based on average shares outstanding. |
| (f) | Ratios do not reflect reductions from fees paid indirectly, if applicable. |
| (k) | The total return does not reflect expenses that apply to separate accounts. Inclusion of these charges would reduce the total return figures for all periods shown. |
| (r) | Certain expenses have been reduced without which performance would have been lower. |
| (s) | From time to time the fund may receive proceeds from litigation settlements, without which performance would be lower. |
| (w) | Per share amount was less than $0.01. |
| (x) | The net asset values per share and total returns have been calculated on net assets which include adjustments made in accordance with U.S. generally accepted accounting principles required at period end for financial reporting purposes. |
See Notes to Financial Statements
13
Table of Contents
MFS Value Portfolio
| (1) | Business and Organization |
MFS Value Portfolio (the fund) is a series of MFS Variable Insurance Trust II (the trust). The trust is organized as a Massachusetts business trust and is registered under the Investment Company Act of 1940, as amended, as an open-end management investment company. The shareholders of each series of the trust are separate accounts of insurance companies, which offer variable annuity and/or life insurance products, and qualified retirement and pension plans.
| (2) | Significant Accounting Policies |
General – The preparation of financial statements in conformity with U.S. generally accepted accounting principles requires management to make estimates and assumptions that affect the reported amounts of assets and liabilities, and disclosure of contingent assets and liabilities at the date of the financial statements and the reported amounts of revenues and expenses during the reporting period. Actual results could differ from those estimates. In the preparation of these financial statements, management has evaluated subsequent events occurring after the date of the fund’s Statement of Assets and Liabilities through the date that the financial statements were issued.
In this reporting period the fund adopted Financial Accounting Standards Board (FASB) Accounting Standards Update 2011-04, Fair Value Measurement (Topic 820) – Amendments to Achieve Common Fair Value Measurement and Disclosure Requirements in U.S. GAAP and IFRSs (“ASU 2011-04”). ASU 2011-04 seeks to improve the comparability of fair value measurements as presented and disclosed in financial statements prepared in accordance with U.S. GAAP and International Financial Reporting Standards (IFRS) by providing common requirements for fair value measurement and disclosure.
In December 2011, the FASB issued Accounting Standards Update 2011-11, Balance Sheet (Topic 210) – Disclosures about Offsetting Assets and Liabilities (“ASU 2011-11”). Effective for annual reporting periods beginning on or after January 1, 2013 and interim periods within those annual periods, ASU 2011-11 is intended to enhance disclosure requirements on the offsetting of financial assets and liabilities. Although still evaluating the potential impacts of ASU 2011-11 to the fund, management expects that the impact of the fund’s adoption will be limited to additional financial statement disclosures.
Investment Valuations – Equity securities, including restricted equity securities, are generally valued at the last sale or official closing price as provided by a third-party pricing service on the market or exchange on which they are primarily traded. Equity securities, for which there were no sales reported that day, are generally valued at the last quoted daily bid quotation as provided by a third-party pricing service on the market or exchange on which such securities are primarily traded. Short-term instruments with a maturity at issuance of 60 days or less generally are valued at amortized cost, which approximates market value. Open-end investment companies are generally valued at net asset value per share. Securities and other assets generally valued on the basis of information from a third-party pricing service may also be valued at a broker/dealer bid quotation. Values obtained from third-party pricing services can utilize both transaction data and market information such as yield, quality, coupon rate, maturity, type of issue, trading characteristics, and other market data. The values of foreign securities and other assets and liabilities expressed in foreign currencies are converted to U.S. dollars using the mean of bid and asked prices for rates provided by a third-party pricing service.
The Board of Trustees has delegated primary responsibility for determining or causing to be determined the value of the fund’s investments (including any fair valuation) to the adviser pursuant to valuation policies and procedures approved by the Board. If the adviser determines that reliable market quotations are not readily available, investments are valued at fair value as determined in good faith by the adviser in accordance with such procedures under the oversight of the Board of Trustees. Under the fund’s valuation policies and procedures, market quotations are not considered to be readily available for most types of debt instruments and floating rate loans and many types of derivatives. These investments are generally valued at fair value based on information from third-party pricing services. In addition, investments may be valued at fair value if the adviser determines that an investment’s value has been materially affected by events occurring after the close of the exchange or market on which the investment is principally traded (such as foreign exchange or market) and prior to the determination of the fund’s net asset value, or after the halting of trading of a specific security where trading does not resume prior to the close of the exchange or market on which the security is principally traded. Events that occur on a frequent basis after foreign markets close (such as developments in foreign markets and significant movements in the U.S. markets) and prior to the determination of the fund’s net asset value may be deemed to have a material effect on the value of securities traded in foreign markets. Accordingly, the fund’s foreign equity securities may often be valued at fair value. The adviser generally relies on third-party pricing services or other information (such as the correlation with price movements of similar securities in the same or other markets; the type, cost and investment characteristics of the security; the business and financial condition of the issuer; and trading and other market data) to assist in determining whether to fair value and at what value to fair value an investment. The value of an investment for purposes of calculating the fund’s net asset value can differ depending on the source and method used to determine value. When fair valuation is used, the value of an investment used to determine the fund’s net asset value may differ from quoted or published prices for the same investment. There can be no assurance that the fund could obtain the fair value assigned to an investment if it were to sell the investment at the same time at which the fund determines its net asset value per share.
14
Table of Contents
MFS Value Portfolio
Notes to Financial Statements – continued
Various inputs are used in determining the value of the fund’s assets or liabilities. These inputs are categorized into three broad levels. In certain cases, the inputs used to measure fair value may fall into different levels of the fair value hierarchy. In such cases, an investment’s level within the fair value hierarchy is based on the lowest level of input that is significant to the fair value measurement. The fund’s assessment of the significance of a particular input to the fair value measurement in its entirety requires judgment, and considers factors specific to the investment. Level 1 includes unadjusted quoted prices in active markets for identical assets or liabilities. Level 2 includes other significant observable market-based inputs (including quoted prices for similar securities, interest rates, prepayment speed, and credit risk). Level 3 includes unobservable inputs, which may include the adviser’s own assumptions in determining the fair value of investments. The following is a summary of the levels used as of December 31, 2012 in valuing the fund’s assets or liabilities:
| Investments at Value | Level 1 | Level 2 | Level 3 | Total | ||||||||||||
| Equity Securities: | ||||||||||||||||
United States | $290,973,179 | $— | $— | $290,973,179 | ||||||||||||
United Kingdom | — | 11,071,418 | — | 11,071,418 | ||||||||||||
Switzerland | 3,556,908 | 1,854,100 | — | 5,411,008 | ||||||||||||
France | — | 3,193,343 | — | 3,193,343 | ||||||||||||
Canada | 1,521,687 | — | — | 1,521,687 | ||||||||||||
| Mutual Funds | 1,687,422 | — | — | 1,687,422 | ||||||||||||
| Total Investments | $297,739,196 | $16,118,861 | $— | $313,858,057 | ||||||||||||
For further information regarding security characteristics, see the Portfolio of Investments.
Of the level 2 investments presented above, equity investments amounting to $11,071,418 would have been considered level 1 investments at the beginning of the period. Of the level 1 investments presented above, equity investments amounting to $3,556,908 would have been considered level 2 investments at the beginning of the period. The primary reason for changes in the classifications between levels 1 and 2 occurs when foreign equity securities are fair valued using other observable market-based inputs in place of the closing exchange price due to events occurring after the close of the exchange or market on which the investment is principally traded. The fund’s foreign equity securities may often be valued at fair value. The fund’s policy is to recognize transfers between the levels as of the end of the period.
Foreign Currency Translation – Purchases and sales of foreign investments, income, and expenses are converted into U.S. dollars based upon currency exchange rates prevailing on the respective dates of such transactions or on the reporting date for foreign denominated receivables and payables. Gains and losses attributable to foreign currency exchange rates on sales of securities are recorded for financial statement purposes as net realized gains and losses on investments. Gains and losses attributable to foreign exchange rate movements on receivables, payables, income and expenses are recorded for financial statement purposes as foreign currency transaction gains and losses. That portion of both realized and unrealized gains and losses on investments that results from fluctuations in foreign currency exchange rates is not separately disclosed.
Security Loans – State Street Bank and Trust Company (“State Street”), as lending agent, loans the securities of the fund to certain qualified institutions (the “Borrowers”) approved by the fund. The loans are collateralized by cash and/or U.S. Treasury and federal agency obligations in an amount typically at least equal to the market value of the securities loaned. The market value of the loaned securities is determined at the close of business of the fund and any additional required collateral is delivered to the fund on the next business day. State Street provides the fund with indemnification against Borrower default. The fund bears the risk of loss with respect to the investment of cash collateral. On loans collateralized by cash, the cash collateral is invested in a money market fund or short-term securities. A portion of the income generated upon investment of the collateral is remitted to the Borrowers, and the remainder is allocated between the fund and the lending agent. On loans collateralized by U.S. Treasury and/or federal agency obligations, a fee is received from the Borrower, and is allocated between the fund and the lending agent. Income from securities lending is included in “Interest” income on the Statement of Operations. The dividend and interest income earned on the securities loaned is accounted for in the same manner as other dividend and interest income. At December 31, 2012, there were no securities on loan or collateral outstanding.
Indemnifications – Under the fund’s organizational documents, its officers and Trustees may be indemnified against certain liabilities and expenses arising out of the performance of their duties to the fund. Additionally, in the normal course of business, the fund enters into agreements with service providers that may contain indemnification clauses. The fund’s maximum exposure under these agreements is unknown as this would involve future claims that may be made against the fund that have not yet occurred.
Investment Transactions and Income – Investment transactions are recorded on the trade date. Interest income is recorded on the accrual basis. Dividends received in cash are recorded on the ex-dividend date. Certain dividends from foreign securities will be recorded when the fund is informed of the dividend if such information is obtained subsequent to the ex-dividend date. Dividend and interest payments received in additional securities are recorded on the ex-dividend or ex-interest date in an amount equal to the value of the security on such date.
15
Table of Contents
MFS Value Portfolio
Notes to Financial Statements – continued
The fund may receive proceeds from litigation settlements. Any proceeds received from litigation involving portfolio holdings are reflected in the Statement of Operations in realized gain/loss if the security has been disposed of by the fund or in unrealized gain/loss if the security is still held by the fund. Any other proceeds from litigation not related to portfolio holdings are reflected as other income in the Statement of Operations.
Fees Paid Indirectly – The fund’s custody fee may be reduced according to an arrangement that measures the value of cash deposited with the custodian by the fund. This amount, for the year ended December 31, 2012, is shown as a reduction of total expenses in the Statement of Operations.
Tax Matters and Distributions – The fund intends to qualify as a regulated investment company, as defined under Subchapter M of the Internal Revenue Code, and to distribute all of its taxable income, including realized capital gains. As a result, no provision for federal income tax is required. The fund’s federal tax returns, when filed, will remain subject to examination by the Internal Revenue Service for a three year period. Foreign taxes have been accrued by the fund in the accompanying financial statements.
Distributions to shareholders are recorded on the ex-dividend date. Income and capital gain distributions are determined in accordance with income tax regulations, which may differ from U.S. generally accepted accounting principles. Certain capital accounts in the financial statements are periodically adjusted for permanent differences in order to reflect their tax character. These adjustments have no impact on net assets or net asset value per share. Temporary differences which arise from recognizing certain items of income, expense, gain or loss in different periods for financial statement and tax purposes will reverse at some time in the future. Distributions in excess of net investment income or net realized gains are temporary overdistributions for financial statement purposes resulting from differences in the recognition or classification of income or distributions for financial statement and tax purposes.
Book/tax differences primarily relate to expiration of capital loss carryforwards and wash sale loss deferrals.
The tax character of distributions declared to shareholders for the last two fiscal years is as follows:
| 12/31/12 | 12/31/11 | |||||||
| Ordinary income (including any short-term capital gains) | $12,869,003 | $9,458,810 | ||||||
| Long-term capital gains | 20,306,549 | 33,776,539 | ||||||
| Total distributions | $33,175,552 | $43,235,349 | ||||||
The federal tax cost and the tax basis components of distributable earnings were as follows:
| As of 12/31/12 | ||||
| Cost of investments | $257,029,198 | |||
| Gross appreciation | 63,391,324 | |||
| Gross depreciation | (6,562,465 | ) | ||
| Net unrealized appreciation (depreciation) | $56,828,859 | |||
| Undistributed ordinary income | 12,307,197 | |||
| Undistributed long-term capital gain | 16,253,160 | |||
| Capital loss carryforwards | (1,988,931 | ) | ||
| Other temporary differences | 3,201 |
Under the Regulated Investment Company Modernization Act of 2010 (the “Act”), net capital losses recognized after December 31, 2010 may be carried forward indefinitely, and their character is retained as short-term and/or long-term losses. Previously, net capital losses were carried forward for eight years and treated as short-term losses. As a transition rule, the Act requires that post-enactment net capital losses be used before pre-enactment net capital losses.
As of December 31, 2012, the fund had capital loss carryforwards available to offset future realized gains. Such losses expire as follows:
| Pre-enactment losses: | ||||
| 12/31/15 | $(1,874,262 | ) | ||
| 12/31/16 | (114,669 | ) | ||
| Total | $(1,988,931 | ) |
The availability of $1,988,931 of the capital loss carryforwards, which were acquired on June 26, 2009 in connection with the MFS Strategic Value Portfolio and on December 4, 2009 in connection with the Mid Cap Value Portfolio mergers, may be limited in a given year.
Multiple Classes of Shares of Beneficial Interest – The fund offers multiple classes of shares, which differ in their respective distribution and/or service fees. The fund’s income, realized and unrealized gain (loss), and common expenses are allocated to
16
Table of Contents
MFS Value Portfolio
Notes to Financial Statements – continued
shareholders based on the daily net assets of each class. Dividends are declared separately for each class. Differences in per share dividend rates are generally due to differences in separate class expenses. The fund’s distributions declared to shareholders as reported in the Statements of Changes in Net Assets are presented by class as follows:
| From net investment income | From net realized gain on investments | |||||||||||||||
| Year ended 12/31/12 | Year ended 12/31/11 | Year ended 12/31/12 | Year ended 12/31/11 | |||||||||||||
| Initial Class | $5,626,721 | $4,858,021 | $14,575,946 | $20,263,116 | ||||||||||||
| Service Class | 3,213,476 | 3,049,317 | 9,759,409 | 15,064,895 | ||||||||||||
| Total | $8,840,197 | $7,907,338 | $24,335,355 | $35,328,011 | ||||||||||||
| (3) | Transactions with Affiliates |
Investment Adviser – The fund has an investment advisory agreement with MFS to provide overall investment management and related administrative services and facilities to the fund. The management fee is computed daily and paid monthly at the following annual rates:
| First $1 billion of average daily net assets | 0.75% | |||
| Average daily net assets in excess of $1 billion | 0.65% |
The management fee incurred for the year ended December 31, 2012 was equivalent to an annual effective rate of 0.75% of the fund’s average daily net assets.
The investment adviser has agreed in writing to pay a portion of the fund’s total annual operating expenses, exclusive of interest, taxes, extraordinary expenses, brokerage and transaction costs, and investment-related expenses, such that total annual operating expenses do not exceed 0.90% of average daily net assets for the Initial Class shares and 1.15% of average daily net assets for the Service Class shares. This written agreement will continue until modified by the fund’s Board of Trustees, but such agreement will continue at least until April 30, 2014. For the year ended December 31, 2012 , the fund’s actual operating expenses did not exceed the limit and therefore, the investment adviser did not pay any portion of the fund’s expenses related to this agreement.
Distributor – MFS Fund Distributors, Inc. (MFD), a wholly-owned subsidiary of MFS, is the distributor of shares of the fund. The Trustees have adopted a distribution plan for the Service Class shares pursuant to Rule 12b-1 under the Investment Company Act of 1940.
The fund’s distribution plan provides that the fund will pay MFD distribution and/or service fees equal to 0.25% per annum of its average daily net assets attributable to Service Class shares as partial consideration for services performed and expenses incurred by MFD and financial intermediaries (including participating insurance companies that invest in the fund to fund variable annuity and variable life insurance contracts, sponsors of qualified retirement and pension plans that invest in the fund, and affiliates of these participating insurance companies and plan sponsors) in connection with the sale and distribution of the Service Class shares. MFD may subsequently pay all, or a portion, of the distribution and/or service fees to financial intermediaries.
Shareholder Servicing Agent – MFS Service Center, Inc. (MFSC), a wholly-owned subsidiary of MFS, has contracted to provide transfer agent and recordkeeping functions in connection with the issuance, transfer, and redemption of each class of shares of the fund under a Shareholder Servicing Agent Agreement. During the year ended December 31, 2012, the fund did not pay MFSC a fee for this service. Effective April 1, 2013, the fund will be charged a shareholder servicing fee by MFSC.
Administrator – MFS provides certain financial, legal, shareholder communications, compliance, and other administrative services to the fund. Under an administrative services agreement, the fund partially reimburses MFS the costs incurred to provide these services. The fund is charged an annual fixed amount of $17,500 plus a fee based on average daily net assets. The administrative services fee incurred for the year ended December 31, 2012 was equivalent to an annual effective rate of 0.0164% of the fund’s average daily net assets.
Trustees’ and Officers’ Compensation – The fund pays compensation to independent Trustees in the form of a retainer, attendance fees, and additional compensation to Board and Committee chairpersons. The fund does not pay compensation directly to Trustees or officers of the fund who are also officers of the investment adviser, all of whom receive remuneration for their services to the fund from MFS. Certain officers and Trustees of the fund are officers or directors of MFS, MFD, and MFSC.
Other – This fund and certain other funds managed by MFS (the funds) have entered into services agreements (the Agreements) which provide for payment of fees by the funds to Tarantino LLC and Griffin Compliance LLC in return for the provision of services of an Independent Chief Compliance Officer (ICCO) and Assistant ICCO, respectively, for the funds. The ICCO and Assistant ICCO are officers of the funds and the sole members of Tarantino LLC and Griffin Compliance LLC, respectively. The funds can terminate the Agreements with Tarantino LLC and Griffin Compliance LLC at any time under the terms of the Agreements. For the year ended December 31, 2012, the aggregate fees paid by the fund to Tarantino LLC and Griffin Compliance LLC were $4,143 and are
17
Table of Contents
MFS Value Portfolio
Notes to Financial Statements – continued
included in “Miscellaneous” expense in the Statement of Operations. MFS has agreed to reimburse the fund for a portion of the payments made by the fund in the amount of $1,844, which is shown as a reduction of total expenses in the Statement of Operations. Additionally, MFS has agreed to bear all expenses associated with office space, other administrative support, and supplies provided to the ICCO and Assistant ICCO.
The fund invests in the MFS Institutional Money Market Portfolio which is managed by MFS and seeks current income consistent with preservation of capital and liquidity. Income earned on this investment is included in “Dividends from underlying affiliated funds” in the Statement of Operations. This money market fund does not pay a management fee to MFS.
| (4) | Portfolio Securities |
Purchases and sales of investments, other than short-term obligations, aggregated $73,756,291 and $328,998,280, respectively.
| (5) | Shares of Beneficial Interest |
The fund’s Declaration of Trust permits the Trustees to issue an unlimited number of full and fractional shares of beneficial interest. Transactions in fund shares were as follows:
| Year ended 12/31/12 | Year ended 12/31/11 | |||||||||||||||
| Shares | Amount | Shares | Amount | |||||||||||||
| Shares sold | ||||||||||||||||
Initial Class | 807,884 | $10,887,580 | 4,023,037 | $52,098,813 | ||||||||||||
Service Class | 408,431 | 5,468,944 | 1,151,500 | 14,661,660 | ||||||||||||
| 1,216,315 | $16,356,524 | 5,174,537 | $66,760,473 | |||||||||||||
| Shares issued to shareholders in reinvestment of distributions | ||||||||||||||||
Initial Class | 1,522,432 | $20,202,667 | 2,096,923 | $25,121,137 | ||||||||||||
Service Class | 985,782 | 12,972,885 | 1,524,766 | 18,114,212 | ||||||||||||
| 2,508,214 | $33,175,552 | 3,621,689 | $43,235,349 | |||||||||||||
| Shares reacquired | ||||||||||||||||
Initial Class | (17,870,918 | ) | $(240,747,874 | ) | (3,262,487 | ) | $(45,265,120 | ) | ||||||||
Service Class | (3,477,370 | ) | (46,912,408 | ) | (3,242,419 | ) | (43,097,698 | ) | ||||||||
| (21,348,288 | ) | $(287,660,282 | ) | (6,504,906 | ) | $(88,362,818 | ) | |||||||||
| Net change | ||||||||||||||||
Initial Class | (15,540,602 | ) | $(209,657,627 | ) | 2,857,473 | $31,954,830 | ||||||||||
Service Class | (2,083,157 | ) | (28,470,579 | ) | (566,153 | ) | (10,321,826 | ) | ||||||||
| (17,623,759 | ) | $(238,128,206 | ) | 2,291,320 | $21,633,004 | |||||||||||
| (6) | Line of Credit |
The fund and certain other funds managed by MFS participate in a $1.1 billion unsecured committed line of credit, subject to a $1 billion sublimit, provided by a syndication of banks under a credit agreement. Borrowings may be made for temporary financing needs. Interest is charged to each fund, based on its borrowings, generally at a rate equal to the higher of the Federal Reserve funds rate or one month LIBOR plus an agreed upon spread. A commitment fee, based on the average daily, unused portion of the committed line of credit, is allocated among the participating funds at the end of each calendar quarter. In addition, the fund and other funds managed by MFS have established unsecured uncommitted borrowing arrangements with certain banks for temporary financing needs. Interest is charged to each fund, based on its borrowings, at a rate equal to the Federal Reserve funds rate plus an agreed upon spread. For the year ended December 31, 2012, the fund’s commitment fee and interest expense were $3,315 and $0, respectively, and are included in “Miscellaneous” expense in the Statement of Operations.
| (7) | Transactions in Underlying Affiliated Funds – Affiliated Issuers |
An affiliated issuer may be considered one in which the fund owns 5% or more of the outstanding voting securities, or a company which is under common control. For the purposes of this report, the fund assumes the following to be an affiliated issuer:
| Underlying Affiliated Fund | Beginning Shares/Par Amount | Acquisitions Shares/Par Amount | Dispositions Shares/Par Amount | Ending Shares/Par Amount | ||||||||||||
| MFS Institutional Money Market Portfolio | 4,110,358 | 228,133,998 | (230,556,934 | ) | 1,687,422 | |||||||||||
| Underlying Affiliated Fund | Realized Gain(Loss) | Capital Gain Distributions | Dividend Income | Ending Value | ||||||||||||
| MFS Institutional Money Market Portfolio | $— | $— | $5,961 | $1,687,422 | ||||||||||||
18
Table of Contents
MFS Value Portfolio
REPORT OF INDEPENDENT REGISTERED PUBLIC ACCOUNTING FIRM
To the Board of Trustees of MFS Variable Insurance Trust II and the Shareholders of MFS Value Portfolio:
We have audited the accompanying statement of assets and liabilities, including the portfolio of investments, of MFS Value Portfolio (the “Fund”) (one of the series comprising MFS Variable Insurance Trust II) as of December 31, 2012, and the related statement of operations for the year then ended, the statements of changes in net assets for each of the two years in the period then ended, and the financial highlights for each of the five years in the period then ended. These financial statements and financial highlights are the responsibility of the Fund’s management. Our responsibility is to express an opinion on these financial statements and financial highlights based on our audits.
We conducted our audits in accordance with the standards of the Public Company Accounting Oversight Board (United States). Those standards require that we plan and perform the audit to obtain reasonable assurance about whether the financial statements and financial highlights are free of material misstatement. The Fund is not required to have, nor were we engaged to perform, an audit of its internal control over financial reporting. Our audits included consideration of internal control over financial reporting as a basis for designing audit procedures that are appropriate in the circumstances, but not for the purpose of expressing an opinion on the effectiveness of the Fund’s internal control over financial reporting. Accordingly, we express no such opinion. An audit also includes examining, on a test basis, evidence supporting the amounts and disclosures in the financial statements, assessing the accounting principles used and significant estimates made by management, as well as evaluating the overall financial statement presentation. Our procedures included confirmation of securities owned as of December 31, 2012, by correspondence with the custodian and brokers; where replies were not received from brokers, we performed other auditing procedures. We believe that our audits provide a reasonable basis for our opinion.
In our opinion, the financial statements and financial highlights referred to above present fairly, in all material respects, the financial position of MFS Value Portfolio as of December 31, 2012, the results of its operations for the year then ended, the changes in its net assets for each of the two years in the period then ended, and the financial highlights for each of the five years in the period then ended, in conformity with accounting principles generally accepted in the United States of America.
DELOITTE & TOUCHE LLP
Boston, Massachusetts
February 15, 2013
19
Table of Contents
MFS Value Portfolio
TRUSTEES AND OFFICERS – IDENTIFICATION AND BACKGROUND
The Trustees and officers of the Trust, as of February 1, 2013, are listed below, together with their principal occupations during the past five years. (Their titles may have varied during that period.) The address of each Trustee and officer is 111 Huntington Avenue, Boston, Massachusetts 02199-7618.
Name, Age | Position(s) with Fund | Trustee/Officer Since (h) | Principal Occupations During the Past Five Years | Other Directorships (j) | ||||
| INTERESTED TRUSTEES | ||||||||
Robert J. Manning (k) (age 49) | Trustee | February 2004 | Massachusetts Financial Services Company, Chairman, Chief Executive Officer and Director; President (until December 2009); Chief Investment Officer (until July 2010) | N/A | ||||
| INDEPENDENT TRUSTEES | ||||||||
David H. Gunning (age 70) | Trustee and Chair of Trustees | January 2004 | Private investor | Lincoln Electric Holdings, Inc. (welding equipment manufacturer), Director; Development Alternatives, Inc. (consulting), Director/Non-Executive Chairman; Portman Limited (mining), Director (until 2008) | ||||
Robert E. Butler (age 71) | Trustee | January 2006 | Consultant – investment company industry regulatory and compliance matters | N/A | ||||
Maureen R. Goldfarb (age 57) | Trustee | January 2009 | Private investor | N/A | ||||
William R. Gutow (age 71) | Trustee | December 1993 | Private investor and real estate consultant; Capitol Entertainment Management Company (video franchise), Vice Chairman | Atlantic Coast Tan (tanning salons), Vice Chairman (until 2007); Texas Donuts (donut franchise), Vice Chairman (until 2010) | ||||
Michael Hegarty (age 68) | Trustee | December 2004 | Private investor; Rouse Properties Inc. (real estate), Director | N/A | ||||
John P. Kavanaugh (age 58) | Trustee | January 2009 | Private investor | N/A | ||||
J. Dale Sherratt (age 74) | Trustee | June 1989 | Insight Resources, Inc. (acquisition planning specialists), President; Wellfleet Investments (investor in health care companies), Managing General Partner | N/A | ||||
| Laurie J. Thomsen (age 55) | Trustee | March 2005 | Private investor; New Profit, Inc. (venture philanthropy), Executive Partner (until 2010) | The Travelers Companies (insurance), Director | ||||
Robert W. Uek (age 71) | Trustee | January 2006 | Consultant to investment company industry | N/A | ||||
| OFFICERS | ||||||||
John M. Corcoran (k) (age 47) | President | October 2008 | Massachusetts Financial Services Company, Senior Vice President (since October 2008); State Street Bank and Trust (financial services provider), Senior Vice President, (until September 2008) | N/A | ||||
| Christopher R. Bohane (k) (age 39) | Assistant Secretary and Assistant Clerk | July 2005 | Massachusetts Financial Services Company, Vice President and Senior Counsel | N/A | ||||
Kino Clark (k) (age 44) | Assistant Treasurer | January 2012 | Massachusetts Financial Services Company, Vice President | N/A | ||||
Thomas H. Connors (k) (age 53) | Assistant Secretary and Assistant Clerk | September 2012 | Massachusetts Financial Services Company, Vice President and Senior Counsel; Deutsche Investment Management Americas Inc. (financial service provider), Director and Senior Counsel (until 2012) | N/A | ||||
Ethan D. Corey (k) (age 49) | Assistant Secretary and Assistant Clerk | July 2005 | Massachusetts Financial Services Company, Senior Vice President and Associate General Counsel | N/A | ||||
20
Table of Contents
MFS Value Portfolio
Trustees and Officers – continued
Name, Age | Position(s) with Fund | Trustee/Officer Since (h) | Principal Occupations During the Past Five Years | Other Directorships (j) | ||||
David L. DiLorenzo (k) (age 44) | Treasurer | July 2005 | Massachusetts Financial Services Company, Senior Vice President | N/A | ||||
Robyn L. Griffin (age 37) | Assistant Independent Chief Compliance Officer | August 2008 | Griffin Compliance LLC (provider of compliance services), Principal (since August 2008); State Street Corporation (financial services provider), Mutual Fund Administration Assistant Vice President (October 2006 – July 2008) | N/A | ||||
Brian E. Langenfeld (k) (age 39) | Assistant Secretary and Assistant Clerk | June 2006 | Massachusetts Financial Services Company, Vice President and Senior Counsel | N/A | ||||
Susan S. Newton (k) (age 62) | Assistant Secretary and Assistant Clerk | May 2005 | Massachusetts Financial Services Company, Senior Vice President and Associate General Counsel | N/A | ||||
Susan A. Pereira (k) (age 42) | Assistant Secretary and Assistant Clerk | July 2005 | Massachusetts Financial Services Company, Vice President and Senior Counsel | N/A | ||||
Kasey L. Phillips (k) (age 42) | Assistant Treasurer | September 2012 | Massachusetts Financial Services Company, Vice President; Wells Fargo Funds Management, LLC, Senior Vice President, Fund Treasurer (until 2012) | N/A | ||||
Mark N. Polebaum (k) (age 60) | Secretary and Clerk | January 2006 | Massachusetts Financial Services Company, Executive Vice President, General Counsel and Secretary | N/A | ||||
Frank L. Tarantino (age 68) | Independent Chief Compliance Officer | June 2004 | Tarantino LLC (provider of compliance services), Principal | N/A | ||||
Richard S. Weitzel (k) (age 42) | Assistant Secretary and Assistant Clerk | October 2007 | Massachusetts Financial Services Company, Senior Vice President and Associate General Counsel | N/A | ||||
James O. Yost (k) (age 52) | Deputy Treasurer | September 1990 | Massachusetts Financial Services Company, Senior Vice President | N/A | ||||
| (h) | Date first appointed to serve as Trustee/officer of an MFS fund. Each Trustee has served continuously since appointment unless indicated otherwise. For the period from December 15, 2004 until February 22, 2005, Mr. Manning served as Advisory Trustee. For the period October 2008, until January 2012, Mr. Corcoran served as Treasurer of the Funds. Prior to January 2012, Messrs. DiLorenzo and Yost served as Assistant Treasurers of the Funds. |
| (j) | Directorships or trusteeships of companies required to report to the Securities and Exchange Commission (i.e., “public companies”). |
| (k) | “Interested person” of the Trust within the meaning of the Investment Company Act of 1940 (referred to as the 1940 Act), which is the principal federal law governing investment companies like the fund, as a result of position with MFS. The address of MFS is 111 Huntington Avenue, Boston, Massachusetts 02199-7618. |
Each Trustee has been elected by shareholders and each Trustee and officer holds office until his or her successor is chosen and qualified or until his or her earlier death, resignation, retirement or removal. The Trust does not hold annual meetings for the purpose of electing Trustees, and Trustees are not elected for fixed terms. Messrs. Butler, Kavanaugh, Uek and Ms. Thomsen are members of the Trust’s Audit Committee.
Each of the Fund’s Trustees and officers holds comparable positions with certain other funds of which MFS or a subsidiary is the investment adviser or distributor, and, in the case of the officers, with certain affiliates of MFS. As of January 1, 2013, the Trustees served as board members of 143 funds within the MFS Family of Funds.
21
Table of Contents
MFS Value Portfolio
Trustees and Officers – continued
The Statement of Additional Information for the Fund includes further information about the Trustees and is available without charge upon request by calling 1-800-225-2606.
Investment Adviser Massachusetts Financial Services Company 111 Huntington Avenue Boston, MA 02199-7618 | Custodian State Street Bank and Trust 1 Lincoln Street Boston, MA 02111-2900 | |
Distributor MFS Fund Distributors, Inc. 111 Huntington Avenue Boston, MA 02199-7618 | Independent Registered Public Accounting Firm Deloitte & Touche LLP 200 Berkeley Street Boston, MA 02116 | |
Portfolio Managers Nevin Chitkara Steven Gorham |
22
Table of Contents
MFS Value Portfolio
BOARD REVIEW OF INVESTMENT ADVISORY AGREEMENT
A discussion regarding the Board’s most recent approval of the fund’s Investment Advisory Agreement with MFS is available by clicking on the fund’s name under “Variable Insurance Portfolios – VIT II” in the “Products” section of the MFS Web site (mfs.com).
PROXY VOTING POLICIES AND INFORMATION
A general description of the MFS funds’ proxy voting policies and procedures is available without charge, upon request, by calling 1-800-225-2606, by visiting the Proxy Voting section of mfs.com or by visiting the SEC’s Web site at http://www.sec.gov.
Information regarding how the fund voted proxies relating to portfolio securities during the most recent twelve-month period ended June 30 is available without charge by visiting the Proxy Voting section of mfs.com or by visiting the SEC’s Web site at http://www.sec.gov.
QUARTERLY PORTFOLIO DISCLOSURE
The fund will file a complete schedule of portfolio holdings with the Securities and Exchange Commission (the Commission) for the first and third quarters of each fiscal year on Form N-Q. The fund’s Form N-Q is available on the EDGAR database on the Commission’s Internet Web site at http://www.sec.gov, and may be reviewed and copied at the:
Public Reference Room
Securities and Exchange Commission
100 F Street, NE, Room 1580
Washington, D.C. 20549
Information on the operation of the Public Reference Room may be obtained by calling the Commission at 1-800-SEC-0330. Copies of the fund’s Form N-Q also may be obtained, upon payment of a duplicating fee, by electronic request at the following e-mail address: publicinfo@sec.gov or by writing the Public Reference Section at the above address.
From time to time, MFS may post important information about the fund or the MFS funds on the MFS web site (mfs.com). This information is available by visiting the “News & Commentary” section of mfs.com or by clicking on the fund’s name under “Variable Insurance Portfolios – VIT II” in the “Products” section of mfs.com.
FEDERAL TAX INFORMATION (unaudited)
The following information is provided pursuant to provisions of the Internal Revenue Code.
The fund designates $22,338,000 as capital gain dividends paid during the fiscal year.
For corporate shareholders, 92.81% of the ordinary income dividends paid during the fiscal year qualify for the corporate dividends received deduction.
23
Table of Contents
rev. 3/11

| Why? | Financial companies choose how they share your personal information. Federal law gives consumers the right to limit some but not all sharing. Federal law also requires us to tell you how we collect, share, and protect your personal information. Please read this notice carefully to understand what we do. |
| What? | The types of personal information we collect and share depend on the product or service you have with us. This information can include:
• Social Security number and account balances • Account transactions and transaction history • Checking account information and wire transfer instructions
When you are no longer our customer, we continue to share your information as described in this notice. |
| How? | All financial companies need to share customers’ personal information to run their everyday business. In the section below, we list the reasons financial companies can share their customers’ personal information; the reasons MFS chooses to share; and whether you can limit this sharing. |
| Reasons we can share your personal information | Does MFS share? | Can you limit this sharing? | ||
For our everyday business purposes – such as to process your transactions, maintain your account(s), respond to court orders and legal investigations, or report to credit bureaus | Yes | No | ||
For our marketing purposes – to offer our products and services to you | No | We don’t share | ||
| For joint marketing with other financial companies | No | We don’t share | ||
For our affiliates’ everyday business purposes – information about your transactions and experiences | No | We don’t share | ||
For our affiliates’ everyday business purposes – information about your creditworthiness | No | We don’t share | ||
| For nonaffiliates to market to you | No | We don’t share |
| Questions? | Call 800-225-2606 or go to mfs.com. |
24
Table of Contents
| Page 2 |
| Who we are | ||
| Who is providing this notice? | MFS Funds, MFS Investment Management, MFS Institutional Advisors, Inc., MFS Fund Distributors, Inc., MFS Heritage Trust Company, and MFS Service Center, Inc. | |
| What we do | ||
| How does MFS protect my personal information? | To protect your personal information from unauthorized access and use, we use security measures that comply with federal law. These measures include procedural, electronic, and physical safeguards for the protection of the personal information we collect about you. | |
| How does MFS collect my personal information? | We collect your personal information, for example, when you
• open an account or provide account information • direct us to buy securities or direct us to sell your securities • make a wire transfer
We also collect your personal information from others, such as credit bureaus, affiliates and other companies. | |
| Why can’t I limit all sharing? | Federal law gives you the right to limit only
• sharing for affiliates’ everyday business purposes – information about your creditworthiness • affiliates from using your information to market to you • sharing for nonaffiliates to market to you
State laws and individual companies may give you additional rights to limit sharing. | |
| Definitions | ||
| Affiliates | Companies related by common ownership or control. They can be financial and nonfinancial companies.
•MFS does not share personal information with affiliates, except for everyday business purposes as described on page one of this notice. | |
| Nonaffiliates | Companies not related by common ownership or control. They can be financial and nonfinancial companies.
•MFS does not share with nonaffiliates so they can market to you. | |
| Joint Marketing | A formal agreement between nonaffiliated financial companies that together market financial products or services to you.
•MFS doesn’t jointly market. | |
| Other important information | ||
| If you own an MFS product or receive an MFS service in the name of a third party such as a bank or broker-dealer, their privacy policy may apply to you instead of ours. | ||
25
Table of Contents
Table of Contents
ANNUAL REPORT
December 31, 2012

MFS® CORE EQUITY PORTFOLIO
MFS® Variable Insurance Trust II

RGS-ANN
Table of Contents
MFS® CORE EQUITY PORTFOLIO
The report is prepared for the general information of contract owners. It is authorized for distribution to prospective investors only when preceded or accompanied by a current prospectus.
NOT FDIC INSURED Ÿ MAY LOSE VALUE Ÿ NO BANK OR CREDIT UNION GUARANTEE Ÿ NOT A DEPOSIT Ÿ NOT INSURED BY ANY FEDERAL GOVERNMENT AGENCY OR NCUA/NCUSIF
Table of Contents
MFS Core Equity Portfolio
LETTER FROM THE CHAIRMAN AND CEO

Dear Contract Owners:
The global market outlook for 2013 is one of cautious optimism. While we are seeing some positive economic trends in the United States, Europe and China, the overall environment remains challenging. In the United States, the recent fiscal cliff agreement was received positively by investors, even though it mostly addressed pressing taxation issues and did not resolve additional concerns, including the need for spending cuts and a large-scale reduction of the federal debt. These issues will be front and center again in the spring. Despite the ongoing uncertainty, economic tailwinds are gathering strength as the U.S. housing and job markets are improving and consumer confidence is rising.
Overseas, the debt crisis continues to weigh heavily on eurozone markets, with even Germany — long an economic stalwart — experiencing some contraction. These ongoing challenges could be a drag on global market performance this year. In Asia, manufacturing activity has accelerated in emerging markets such as China and India, and we are seeing signs of stabilized loan growth in China, a leading indicator of that country’s economic health. In contrast, Japan’s economy is contracting sharply under deflationary pressures. Nevertheless, Japanese markets have responded favorably to early actions by the new government, which appears determined to act aggressively, along with the Bank of Japan, to stimulate growth.
As always, managing risk in the face of uncertainty remains a top priority for investors. At MFS®, our uniquely collaborative investment process revolves around global research and our disciplined risk management approach. Our global team of investment professionals shares ideas and evaluates opportunities across continents, investment disciplines and asset classes — all with a goal of building better insights, and ultimately better results, for our clients.
We remain mindful of the many economic challenges investors face today, and believe it is more important than ever to maintain a long-term view, employ time-tested principles, such as asset allocation and diversification, and work closely with investment advisors to identify and pursue the most suitable opportunities.
Respectfully,

Robert J. Manning
Chairman and Chief Executive Officer
MFS Investment Management®
February 15, 2013
The opinions expressed in this letter are subject to change, may not be relied upon for investment advice, and no forecasts can be guaranteed.
1
Table of Contents
MFS Core Equity Portfolio
Portfolio structure (i)
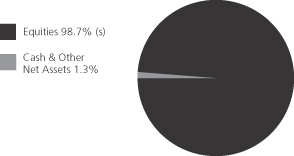
| Top ten holdings (i) | ||||
| Exxon Mobil Corp. | 4.9% | |||
| Apple, Inc. | 4.2% | |||
| Pfizer, Inc. | 2.2% | |||
| ACE Ltd. | 2.1% | |||
| Philip Morris International, Inc. | 1.6% | |||
| JPMorgan Chase & Co. | 1.6% | |||
| Google, Inc., “A” | 1.4% | |||
| Visa, Inc., “A” | 1.2% | |||
| Verizon Communications, Inc. | 1.2% | |||
| Oracle Corp. | 1.2% |
| Equity sectors (i) | ||||
| Financial Services | 17.7% | |||
| Technology (s) | 15.7% | |||
| Health Care | 10.7% | |||
| Energy | 9.7% | |||
| Industrial Goods & Services | 7.8% | |||
| Consumer Staples | 7.4% | |||
| Utilities & Communications | 6.7% | |||
| Leisure | 6.3% | |||
| Retailing | 6.0% | |||
| Basic Materials | 3.8% | |||
| Special Products & Services | 2.5% | |||
| Autos & Housing | 2.3% | |||
| Transportation | 2.1% |
| (i) | For purposes of this presentation, the components include the market value of securities, less any securities sold short, and reflect the impact of the equivalent exposure of derivative positions. These amounts may be negative from time to time. Equivalent exposure is a calculated amount that translates the derivative position into a reasonable approximation of the amount of the underlying asset that the portfolio would have to hold at a given point in time to have the same price sensitivity that results from the portfolio’s ownership of the derivative contract. When dealing with derivatives, equivalent exposure is a more representative measure of the potential impact of a position on portfolio performance than market value. |
| (s) | Includes securities sold short. |
Percentages are based on net assets as of 12/31/12.
The portfolio is actively managed and current holdings may be different.
2
Table of Contents
MFS Core Equity Portfolio
Summary of Results
For the twelve months ended December 31, 2012, Initial Class shares of the MFS Core Equity Portfolio (“fund”) provided a total return of 16.46%, while Service Class shares of the fund provided a total return of 16.24%. These compare with a return of 16.42% over the same period for the fund’s benchmark, the Russell 3000 Index.
Market Environment
The beginning of the period was characterized by a risk-on sentiment as a result of additional liquidity measures by the Federal Reserve Bank (“Fed”) and the European Central Bank (“ECB”) as well as a commensurate improvement in macroeconomic conditions. During this time, global equity valuations rose, credit spreads contracted, and high-quality sovereign yields increased modestly.
During the middle of the period, however, conditions worsened, driven by broadly weaker global macroeconomic indicators, as well as renewed concerns over the eurozone’s capacity and determination to address its ongoing crisis. Despite this deterioration, broad market sentiment remained relatively resilient as equity markets generally maintained gains and credit spreads did not indicate deterioration.
However, this renewed weakness in the fundamentals precipitated a further round of monetary easing by both the Fed (through a third round of quantitative easing) and the ECB (through a new bond purchase facility) in the second half of the period, which soon instilled additional confidence in risk markets. Nonetheless, towards the end of the period, weaker equity earnings reports and declining forward guidance caused market sentiment to soften. In addition, as we moved toward year end, the fiscal cliff negotiations between the Republicans in the U.S. Congress and President Obama were a particular source of market attention, where uncertainty surrounding the fiscal negotiations continued right up to the end-of-year deadline.
Contributors to Performance
Stock selection in the technology sector was a positive factor for relative performance. Within this sector, the fund’s holdings of computer and personal electronics maker Apple and information technology infrastructure management provider SolarWinds aided relative results as both stocks outperformed the benchmark. Shares of Apple traded higher throughout most of the period due to continued strong demand for its iPhone and iPad products as well as favorable rulings for the firm’s patent infringement lawsuit against Samsung allowing the company to solidify its market share in the smartphone and tablet markets. The fund’s avoidance of poor-performing semiconductor company Intel also helped relative results.
Security selection in the leisure sector contributed to relative performance, led by the fund’s holdings of media and entertainment company News Corp.
Elsewhere, the fund’s overweight positions in specialized payment products and services provider FleetCor Technologies, auto parts manufacturer Delphi Automotive, biotech firm Gilead Sciences, global payments technology company Visa, Inc., and global financial services firm JPMorgan Chase strengthened relative returns. Visa’s shares traded higher over the period as consumer spending improved relative to prior years, allowing the company to consistently beat earnings expectations throughout the year. The fund’s timing of ownership in shares of pharmaceutical company Merck (h) contributed to relative performance.
Detractors from Performance
Security selection in the financial services sector detracted from performance relative to the Russell 3000 Index. Not owning shares of strong-performing financial services firm Bank of America, as well as timing of ownership in shares of global bank Citigroup and diversified financial services firm Wells-Fargo, held back relative results. Shares of Bank of America traded higher as the company reported earnings results that beat analysts’ expectations which appeared to have demonstrated the effectiveness of the bank’s cost-cutting efforts.
Stock selection in the basic materials sector hindered relative performance during the quarter. There were no individual holdings within this sector that were among the fund’s top relative detractors for the period.
Elsewhere, holding shares of computer products and service provider Hewlett-Packard Co., higher education company DeVry (h), mining equipment manufacturer Joy Global, semiconductor manufacturer Microchip Technology, Israeli-headquartered security software provider Check Point Software Technologies Ltd (b), and integrated oil and gas company Exxon Mobil weakened relative returns. Shares of Check Point Software Technologies traded lower as stronger competitive forces in its industry and a challenging global economic landscape weighed on the firm’s profitability. The fund’s timing of ownership in shares of home improvement retailer Home Depot (h) held back relative results.
3
Table of Contents
MFS Core Equity Portfolio
Management Review – continued
The fund’s cash and/or cash equivalents position was also a detractor from relative performance. The fund strives to be fully invested and generally holds cash to buy new holdings and to provide liquidity. In a period when equity markets rose, as measured by the fund’s benchmark, holding cash hurt performance versus the benchmark, which has no cash position.
Respectfully,
Joseph MacDougall
Portfolio Manager
| (b) | Security is not a benchmark constituent. |
| (h) | Security was not held in the portfolio at period end. |
The views expressed in this report are those of the portfolio manager only through the end of the period of the report as stated on the cover and do not necessarily reflect the views of MFS or any other person in the MFS organization. These views are subject to change at any time based on market or other conditions, and MFS disclaims any responsibility to update such views. These views may not be relied upon as investment advice or an indication of trading intent on behalf of any MFS portfolio. References to specific securities are not recommendations of such securities, and may not be representative of any MFS portfolio’s current or future investments.
4
Table of Contents
MFS Core Equity Portfolio
PERFORMANCE SUMMARY THROUGH 12/31/12
The following chart illustrates the historical performance of the fund in comparison to its benchmark(s). Benchmarks are unmanaged and may not be invested in directly. Benchmark returns do not reflect any fees or expenses. The performance of other share classes will be greater than or less than that of the class depicted below. (See Notes to Performance Summary.)
Performance data shown represents past performance and is no guarantee of future results. Investment return and principal value fluctuate so your units, when sold, may be worth more or less than the original cost; current performance may be lower or higher than quoted. The performance shown does not reflect the deduction of taxes, if any, that a contract holder would pay on fund distributions or the redemption of contract units. The returns for the fund shown also do not reflect the deduction of expenses associated with variable products, such as mortality and expense risk charges, separate account charges, and sales charges imposed by the insurance company separate accounts. Such expenses would reduce the overall returns shown.
Growth of a Hypothetical $10,000 Investment
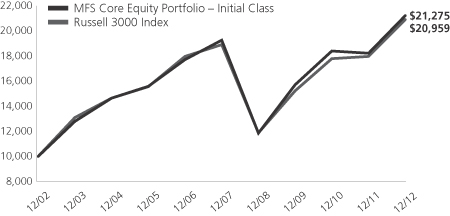
Total Returns through 12/31/12
Average annual total returns
| Share Class | Class inception date | 1-yr | 5-yr | 10-yr | ||||||||
| Initial Class | 5/12/97 | 16.46% | 1.96% | 7.84% | ||||||||
| Service Class | 8/24/01 | 16.24% | 1.70% | 7.57% | ||||||||
| Comparative benchmark | ||||||||||||
| Russell 3000 Index (f) | 16.42% | 2.04% | 7.68% | |||||||||
| (f) | Source: FactSet Research Systems Inc. |
Benchmark Definition
Russell 3000 Index – constructed to provide a comprehensive barometer for the 3,000 largest U.S. companies based on total market capitalization, which represents approximately 98% of the investable U.S. equity market.
It is not possible to invest directly in an index.
Notes to Performance Summary
Average annual total return represents the average annual change in value for each share class for the periods presented.
Performance results reflect any applicable expense subsidies and waivers in effect during the periods shown. Without such subsidies and waivers the fund’s performance results would be less favorable. Please see the prospectus and financial statements for complete details. All results are historical and assume the reinvestment of any dividends and capital gains distributions.
Performance results do not include adjustments made for financial reporting purposes in accordance with U.S. generally accepted accounting principles and may differ from amounts reported in the financial highlights.
From time to time the fund may receive proceeds from litigation settlements, without which performance would be lower.
5
Table of Contents
MFS Core Equity Portfolio
Fund Expenses Borne by the Contract Holders During the Period,
July 1, 2012 through December 31, 2012
As a contract holder of the fund, you incur ongoing costs, including management fees; distribution and/or service (12b-1) fees; and other fund expenses. This example is intended to help you understand your ongoing costs (in dollars) of investing in the fund and to compare these costs with the ongoing costs of investing in other mutual funds.
The example is based on an investment of $1,000 invested at the beginning of the period and held for the entire period July 1, 2012 through December 31, 2012.
Actual Expenses
The first line for each share class in the following table provides information about actual account values and actual expenses. You may use the information in this line, together with the amount you invested, to estimate the expenses that you paid over the period. Simply divide your account value by $1,000 (for example, an $8,600 account value divided by $1,000 = 8.6), then multiply the result by the number in the first line under the heading entitled “Expenses Paid During Period” to estimate the expenses you paid on your account during this period.
Hypothetical Example for Comparison Purposes
The second line for each share class in the following table provides information about hypothetical account values and hypothetical expenses based on the fund’s actual expense ratio and an assumed rate of return of 5% per year before expenses, which is not the fund’s actual return. The hypothetical account values and expenses may not be used to estimate the actual ending account balance or expenses you paid for the period. You may use this information to compare the ongoing costs of investing in the fund and other funds. To do so, compare this 5% hypothetical example with the 5% hypothetical examples that appear in the shareholder reports of the other funds.
Please note that the expenses shown in the table are meant to highlight the fund’s ongoing costs only and do not take into account the fees and expenses imposed under the variable contracts through which your investment in the fund is made. Therefore, the second line for each share class in the table is useful in comparing ongoing costs associated with an investment in vehicles (such as the fund) which fund benefits under variable annuity and variable life insurance contracts and to qualified pension and retirement plans only, and will not help you determine the relative total costs of investing in the fund through variable annuity and variable life insurance contracts. If the fees and expenses imposed under the variable contracts were included, your costs would have been higher.
| Share Class | Annualized Expense Ratio | Beginning Account Value 7/01/12 | Ending Account Value 12/31/12 | Expenses Paid During Period (p) 7/01/12-12/31/12 | ||||||||||||||
| Initial Class | Actual | 0.85% | $1,000.00 | $1,078.05 | $4.44 | |||||||||||||
| Hypothetical (h) | 0.85% | $1,000.00 | $1,020.86 | $4.32 | ||||||||||||||
| Service Class | Actual | 1.10% | $1,000.00 | $1,077.55 | $5.74 | |||||||||||||
| Hypothetical (h) | 1.10% | $1,000.00 | $1,019.61 | $5.58 | ||||||||||||||
| (h) | 5% class return per year before expenses. |
| (p) | Expenses paid are equal to each class’s annualized expense ratio, as shown above, multiplied by the average account value over the period, multiplied by the number of days in the period, divided by the number of days in the year. |
6
Table of Contents
MFS Core Equity Portfolio
PORTFOLIO OF INVESTMENTS – 12/31/12
The Portfolio of Investments is a complete list of all securities owned by your fund. It is categorized by broad-based asset classes.
| Issuer | Shares/Par | Value ($) | ||||||
| COMMON STOCKS – 98.7% | ||||||||
| Aerospace – 3.1% | ||||||||
| Embraer S.A., ADR | 7,930 | $ | 226,084 | |||||
| Honeywell International, Inc. | 22,900 | 1,453,463 | ||||||
| Lockheed Martin Corp. | 4,500 | 415,305 | ||||||
| Precision Castparts Corp. | 5,400 | 1,022,868 | ||||||
| United Technologies Corp. | 15,310 | 1,255,573 | ||||||
|
| |||||||
| $ | 4,373,293 | |||||||
|
| |||||||
| Apparel Manufacturers – 1.3% | ||||||||
| Guess?, Inc. | 20,040 | $ | 491,782 | |||||
| NIKE, Inc., “B” | 13,480 | 695,568 | ||||||
| VF Corp. | 3,680 | 555,570 | ||||||
|
| |||||||
| $ | 1,742,920 | |||||||
|
| |||||||
| Automotive – 1.5% | ||||||||
| Delphi Automotive PLC (a) | 36,550 | $ | 1,398,035 | |||||
| General Motors Co. (a) | 23,300 | 671,739 | ||||||
|
| |||||||
| $ | 2,069,774 | |||||||
|
| |||||||
| Biotechnology – 1.9% | ||||||||
| Biogen Idec, Inc. (a) | 4,140 | $ | 607,214 | |||||
| Celgene Corp. (a) | 9,860 | 776,179 | ||||||
| Gilead Sciences, Inc. (a) | 10,550 | 774,898 | ||||||
| ViroPharma, Inc. (a) | 23,820 | 542,143 | ||||||
|
| |||||||
| $ | 2,700,434 | |||||||
|
| |||||||
| Broadcasting – 2.0% | ||||||||
| Interpublic Group of Companies, Inc. | 18,680 | $ | 205,854 | |||||
| News Corp., “A” | 54,900 | 1,402,146 | ||||||
| Walt Disney Co. | 24,020 | 1,195,956 | ||||||
|
| |||||||
| $ | 2,803,956 | |||||||
|
| |||||||
| Brokerage & Asset Managers – 1.1% | ||||||||
| BlackRock, Inc. | 2,369 | $ | 489,696 | |||||
| Franklin Resources, Inc. | 2,050 | 257,685 | ||||||
| FXCM, Inc. “A” | 16,880 | 169,982 | ||||||
| GFI Group, Inc. | 34,170 | 110,711 | ||||||
| NASDAQ OMX Group, Inc. | 18,575 | 464,561 | ||||||
|
| |||||||
| $ | 1,492,635 | |||||||
|
| |||||||
| Business Services – 1.7% | ||||||||
| Accenture PLC, “A” | 8,590 | $ | 571,235 | |||||
| Automatic Data Processing, Inc. | 11,600 | 661,316 | ||||||
| FleetCor Technologies, Inc. (a) | 14,490 | 777,389 | ||||||
| Performant Financial Corp. (a) | 32,250 | 325,725 | ||||||
|
| |||||||
| $ | 2,335,665 | |||||||
|
| |||||||
| Cable TV – 1.3% | ||||||||
| Comcast Corp., “Special A” | 26,640 | $ | 957,708 | |||||
| Time Warner Cable, Inc. | 8,570 | 832,918 | ||||||
|
| |||||||
| $ | 1,790,626 | |||||||
|
| |||||||
| Issuer | Shares/Par | Value ($) | ||||||
| COMMON STOCKS – continued | ||||||||
| Chemicals – 0.9% | ||||||||
| Celanese Corp. | 17,680 | $ | 787,290 | |||||
| PPG Industries, Inc. | 2,980 | 403,343 | ||||||
|
| |||||||
| $ | 1,190,633 | |||||||
|
| |||||||
| Computer Software – 4.6% | ||||||||
| Autodesk, Inc. (a) | 9,940 | $ | 351,379 | |||||
| Check Point Software Technologies Ltd. (a) | 22,440 | 1,069,042 | ||||||
| Citrix Systems, Inc. (a) | 13,540 | 890,255 | ||||||
| Microsoft Corp. | 6,430 | 171,874 | ||||||
| Nuance Communications, Inc. (a) | 15,660 | 349,531 | ||||||
| Oracle Corp. | 48,340 | 1,610,689 | ||||||
| Salesforce.com, Inc. (a) | 7,260 | 1,220,406 | ||||||
| SolarWinds, Inc. (a) | 7,700 | 403,865 | ||||||
| TIBCO Software, Inc. (a) | 13,530 | 297,795 | ||||||
|
| |||||||
| $ | 6,364,836 | |||||||
|
| |||||||
| Computer Software – Systems – 6.2% | ||||||||
| Apple, Inc. (s) | 10,990 | $ | 5,858,000 | |||||
| EMC Corp. (a) | 50,520 | 1,278,156 | ||||||
| FleetMatics Group PLC (a) | 8,610 | 216,628 | ||||||
| Hewlett-Packard Co. | 53,590 | 763,655 | ||||||
| International Business Machines Corp. | 730 | 139,830 | ||||||
| Verifone Systems, Inc. (a) | 13,630 | 404,538 | ||||||
|
| |||||||
| $ | 8,660,807 | |||||||
|
| |||||||
| Construction – 0.8% | ||||||||
| Eagle Materials, Inc. | 3,600 | $ | 210,600 | |||||
| Stanley Black & Decker, Inc. | 12,590 | 931,282 | ||||||
|
| |||||||
| $ | 1,141,882 | |||||||
|
| |||||||
| Consumer Products – 2.0% | ||||||||
| Colgate-Palmolive Co. | 14,370 | $ | 1,502,240 | |||||
| International Flavors & Fragrances, Inc. | 8,930 | 594,202 | ||||||
| Newell Rubbermaid, Inc. | 30,030 | 668,768 | ||||||
|
| |||||||
| $ | 2,765,210 | |||||||
|
| |||||||
| Consumer Services – 0.8% | ||||||||
| Grand Canyon Education, Inc. (a) | 6,930 | $ | 162,647 | |||||
| Priceline.com, Inc. (a) | 1,520 | 944,224 | ||||||
|
| |||||||
| $ | 1,106,871 | |||||||
|
| |||||||
| Containers – 1.2% | ||||||||
| Packaging Corp. of America | 15,150 | $ | 582,821 | |||||
| Silgan Holdings, Inc. | 24,820 | 1,032,264 | ||||||
|
| |||||||
| $ | 1,615,085 | |||||||
|
| |||||||
| Electrical Equipment – 1.9% | ||||||||
| AMETEK, Inc. | 16,100 | $ | 604,877 | |||||
| Danaher Corp. | 25,270 | 1,412,593 | ||||||
| Sensata Technologies Holding B.V. (a) | 9,750 | 316,680 | ||||||
| W.W. Grainger, Inc. | 1,510 | 305,579 | ||||||
|
| |||||||
| $ | 2,639,729 | |||||||
|
| |||||||
7
Table of Contents
MFS Core Equity Portfolio
Portfolio of Investments – continued
| Issuer | Shares/Par | Value ($) | ||||||
| COMMON STOCKS – continued | ||||||||
| Electronics – 2.5% | ||||||||
| Altera Corp. | 39,380 | $ | 1,356,247 | |||||
| ASML Holding N.V. | 7,099 | 457,247 | ||||||
| KLA-Tencor Corp. | 2,660 | 127,042 | ||||||
| Linear Technology Corp. | 13,060 | 447,958 | ||||||
| Microchip Technology, Inc. | 32,890 | 1,071,885 | ||||||
|
| |||||||
| $ | 3,460,379 | |||||||
|
| |||||||
| Energy – Independent – 3.2% | ||||||||
| Cabot Oil & Gas Corp. | 11,120 | $ | 553,109 | |||||
| Concho Resources, Inc. (a) | 4,270 | 343,991 | ||||||
| CONSOL Energy, Inc. | 3,790 | 121,659 | ||||||
| EOG Resources, Inc. | 4,630 | 559,258 | ||||||
| EQT Corp. | 8,890 | 524,332 | ||||||
| Noble Energy, Inc. | 8,650 | 880,051 | ||||||
| Occidental Petroleum Corp. | 6,110 | 468,087 | ||||||
| Peabody Energy Corp. | 4,020 | 106,972 | ||||||
| Pioneer Natural Resources Co. | 5,560 | 592,640 | ||||||
| SM Energy Co. | 4,632 | 241,837 | ||||||
|
| |||||||
| $ | 4,391,936 | |||||||
|
| |||||||
| Energy – Integrated – 4.9% | ||||||||
| Exxon Mobil Corp. (s) | 79,486 | $ | 6,879,513 | |||||
|
| |||||||
| Food & Beverages – 3.1% | ||||||||
| Coca-Cola Co. | 41,340 | $ | 1,498,575 | |||||
| Coca-Cola Enterprises, Inc. | 15,050 | 477,534 | ||||||
| General Mills, Inc. | 20,260 | 818,707 | ||||||
| Mead Johnson Nutrition Co., “A” | 7,340 | 483,633 | ||||||
| Mondelez International, Inc. | 39,680 | 1,010,650 | ||||||
|
| |||||||
| $ | 4,289,099 | |||||||
|
| |||||||
| Food & Drug Stores – 1.0% | ||||||||
| CVS Caremark Corp. | 22,360 | $ | 1,081,106 | |||||
| Kroger Co. | 10,390 | 270,348 | ||||||
|
| |||||||
| $ | 1,351,454 | |||||||
|
| |||||||
| Gaming & Lodging – 0.6% | ||||||||
| Las Vegas Sands Corp. | 12,750 | $ | 588,540 | |||||
| Wynn Resorts Ltd. | 2,480 | 278,975 | ||||||
|
| |||||||
| $ | 867,515 | |||||||
|
| |||||||
| General Merchandise – 1.1% | ||||||||
| Target Corp. | 26,410 | $ | 1,562,680 | |||||
|
| |||||||
| Health Maintenance Organizations – 0.8% | ||||||||
| Aetna, Inc. | 21,230 | $ | 982,949 | |||||
| UnitedHealth Group, Inc. | 1,240 | 67,258 | ||||||
|
| |||||||
| $ | 1,050,207 | |||||||
|
| |||||||
| Insurance – 3.9% | ||||||||
| ACE Ltd. | 36,540 | $ | 2,915,892 | |||||
| American International Group, Inc. (a) | 27,840 | 982,752 | ||||||
| MetLife, Inc. | 32,910 | 1,084,055 | ||||||
| Validus Holdings Ltd. | 11,640 | 402,511 | ||||||
|
| |||||||
| $ | 5,385,210 | |||||||
|
| |||||||
| Issuer | Shares/Par | Value ($) | ||||||
| COMMON STOCKS – continued | ||||||||
| Internet – 2.6% | ||||||||
| eBay, Inc. (a) | 9,620 | $ | 490,812 | |||||
| Google, Inc., “A” (a) | 2,740 | 1,943,674 | ||||||
| Millennial Media, Inc. (a) | 20,960 | 262,629 | ||||||
| Rackspace Hosting, Inc. (a) | 8,420 | 625,353 | ||||||
| Shutterfly, Inc. (a) | 9,590 | 286,453 | ||||||
|
| |||||||
| $ | 3,608,921 | |||||||
|
| |||||||
| Leisure & Toys – 0.3% | ||||||||
| Activision Blizzard, Inc. | 20,240 | $ | 214,949 | |||||
| Brunswick Corp. | 6,140 | 178,613 | ||||||
|
| |||||||
| $ | 393,562 | |||||||
|
| |||||||
| Machinery & Tools – 2.8% | ||||||||
| Eaton Corp. PLC | 19,000 | $ | 1,029,800 | |||||
| Joy Global, Inc. | 15,110 | 963,716 | ||||||
| Kennametal, Inc. | 13,860 | 554,400 | ||||||
| Roper Industries, Inc. | 12,580 | 1,402,418 | ||||||
|
| |||||||
| $ | 3,950,334 | |||||||
|
| |||||||
| Major Banks – 4.5% | ||||||||
| Goldman Sachs Group, Inc. | 5,800 | $ | 739,848 | |||||
| JPMorgan Chase & Co. (s) | 49,610 | 2,181,352 | ||||||
| PNC Financial Services Group, Inc. | 18,230 | 1,062,991 | ||||||
| State Street Corp. | 17,740 | 833,957 | ||||||
| Wells Fargo & Co. | 41,670 | 1,424,281 | ||||||
|
| |||||||
| $ | 6,242,429 | |||||||
|
| |||||||
| Medical & Health Technology & Services – 1.2% | ||||||||
| AmerisourceBergen Corp. | 10,520 | $ | 454,254 | |||||
| Cerner Corp. (a) | 2,190 | 170,032 | ||||||
| Express Scripts Holding Co. (a) | 12,260 | 662,040 | ||||||
| Henry Schein, Inc. (a) | 2,810 | 226,093 | ||||||
| Quest Diagnostics, Inc. | 2,180 | 127,029 | ||||||
|
| |||||||
| $ | 1,639,448 | |||||||
|
| |||||||
| Medical Equipment – 2.3% | ||||||||
| Cooper Cos., Inc. | 8,170 | $ | 755,562 | |||||
| Covidien PLC | 18,490 | 1,067,613 | ||||||
| Sirona Dental Systems, Inc. (a) | 3,440 | 221,742 | ||||||
| St. Jude Medical, Inc. | 19,370 | 700,032 | ||||||
| Thermo Fisher Scientific, Inc. | 8,100 | 516,618 | ||||||
|
| |||||||
| $ | 3,261,567 | |||||||
|
| |||||||
| Metals & Mining – 0.6% | ||||||||
| Cliffs Natural Resources, Inc. | 6,270 | $ | 241,771 | |||||
| Lundin Mining Corp. (a) | 52,960 | 272,600 | ||||||
| Teck Resources Ltd., “B” | 10,364 | 376,655 | ||||||
|
| |||||||
| $ | 891,026 | |||||||
|
| |||||||
| Natural Gas – Distribution – 0.4% | ||||||||
| Spectra Energy Corp. | 22,250 | $ | 609,205 | |||||
|
| |||||||
| Natural Gas – Pipeline – 0.3% | ||||||||
| Kinder Morgan, Inc. | 10,778 | $ | 380,787 | |||||
|
| |||||||
8
Table of Contents
MFS Core Equity Portfolio
Portfolio of Investments – continued
| Issuer | Shares/Par | Value ($) | ||||||
| COMMON STOCKS – continued | ||||||||
| Network & Telecom – 0.5% | ||||||||
| Fortinet, Inc. (a) | 26,150 | $ | 550,980 | |||||
| Juniper Networks, Inc. (a) | 9,340 | 183,718 | ||||||
|
| |||||||
| $ | 734,698 | |||||||
|
| |||||||
| Oil Services – 1.6% | ||||||||
| Cameron International Corp. (a) | 11,380 | $ | 642,515 | |||||
| Dresser-Rand Group, Inc. (a) | 9,590 | 538,383 | ||||||
| FMC Technologies, Inc. (a) | 6,860 | 293,814 | ||||||
| Oil States International, Inc. (a) | 1,990 | 142,365 | ||||||
| Schlumberger Ltd. | 6,830 | 473,251 | ||||||
| Transocean, Inc. | 4,080 | 182,172 | ||||||
|
| |||||||
| $ | 2,272,500 | |||||||
|
| |||||||
| Other Banks & Diversified Financials – 4.6% | ||||||||
| American Express Co. | 4,900 | $ | 281,652 | |||||
| BancorpSouth, Inc. | 10,760 | 156,450 | ||||||
| CapitalSource, Inc. | 52,240 | 395,979 | ||||||
| CIT Group, Inc. (a) | 22,550 | 871,332 | ||||||
| Citigroup, Inc. | 25,940 | 1,026,186 | ||||||
| EuroDekania Ltd. (a)(z) | 100,530 | 130,373 | ||||||
| Fifth Third Bancorp | 58,940 | 895,299 | ||||||
| PrivateBancorp, Inc. | 30,510 | 467,413 | ||||||
| Visa, Inc., “A” | 11,290 | 1,711,338 | ||||||
| Western Union Co. | 29,180 | 397,140 | ||||||
|
| |||||||
| $ | 6,333,162 | |||||||
|
| |||||||
| Pharmaceuticals – 4.5% | ||||||||
| Abbott Laboratories | 16,610 | $ | 1,087,955 | |||||
| Eli Lilly & Co. | 6,830 | 336,856 | ||||||
| Johnson & Johnson | 16,790 | 1,176,979 | ||||||
| Perrigo Co. | 2,330 | 242,390 | ||||||
| Pfizer, Inc. | 119,612 | 2,999,869 | ||||||
| Teva Pharmaceutical Industries Ltd., ADR | 9,940 | 371,160 | ||||||
|
| |||||||
| $ | 6,215,209 | |||||||
|
| |||||||
| Printing & Publishing – 0.5% | ||||||||
| Moody’s Corp. | 13,190 | $ | 663,721 | |||||
|
| |||||||
| Railroad & Shipping – 0.9% | ||||||||
| Union Pacific Corp. | 10,230 | $ | 1,286,116 | |||||
|
| |||||||
| Real Estate – 3.6% | ||||||||
| Atrium European Real Estate Ltd. | 32,650 | $ | 191,779 | |||||
| BioMed Realty Trust, Inc., REIT | 53,190 | 1,028,163 | ||||||
| Equity Lifestyle Properties, Inc., REIT | 5,000 | 336,450 | ||||||
| Mid-America Apartment Communities, Inc., REIT | 23,580 | 1,526,805 | ||||||
| Public Storage, Inc., REIT | 5,600 | 811,776 | ||||||
| Tanger Factory Outlet Centers, Inc., REIT | 34,040 | 1,164,168 | ||||||
|
| |||||||
| $ | 5,059,141 | |||||||
|
| |||||||
| Restaurants – 1.6% | ||||||||
| McDonald’s Corp. | 17,210 | $ | 1,518,094 | |||||
| Starbucks Corp. | 13,040 | 699,205 | ||||||
|
| |||||||
| $ | 2,217,299 | |||||||
|
| |||||||
| Issuer | Shares/Par | Value ($) | ||||||
| COMMON STOCKS – continued | ||||||||
| Specialty Chemicals – 1.1% | ||||||||
| Airgas, Inc. | 4,970 | $ | 453,711 | |||||
| Albemarle Corp. | 6,510 | 404,401 | ||||||
| Ecolab, Inc. | 9,500 | 683,050 | ||||||
|
| |||||||
| $ | 1,541,162 | |||||||
|
| |||||||
| Specialty Stores – 2.6% | ||||||||
| Amazon.com, Inc. (a) | 880 | $ | 221,003 | |||||
| AutoZone, Inc. (a) | 1,790 | 634,430 | ||||||
| Bed Bath & Beyond, Inc. (a) | 10,540 | 589,291 | ||||||
| Children’s Place Retail Store, Inc. (a) | 8,760 | 387,980 | ||||||
| Express, Inc. (a) | 33,620 | 507,326 | ||||||
| rue21, Inc. (a) | 16,420 | 466,164 | ||||||
| Tiffany & Co. | 8,570 | 491,404 | ||||||
| Urban Outfitters, Inc. (a) | 9,230 | 363,293 | ||||||
|
| |||||||
| $ | 3,660,891 | |||||||
|
| |||||||
| Telecommunications – Wireless – 0.7% | ||||||||
| American Tower Corp., REIT | 7,310 | $ | 564,844 | |||||
| SBA Communications Corp. (a) | 4,820 | 342,316 | ||||||
|
| |||||||
| $ | 907,160 | |||||||
|
| |||||||
| Telephone Services – 2.2% | ||||||||
| AT&T, Inc. | 35,790 | $ | 1,206,481 | |||||
| Frontier Communications Corp. | 62,110 | 265,831 | ||||||
| Verizon Communications, Inc. | 38,120 | 1,649,452 | ||||||
|
| |||||||
| $ | 3,121,764 | |||||||
|
| |||||||
| Tobacco – 2.3% | ||||||||
| Lorillard, Inc. | 8,770 | $ | 1,023,196 | |||||
| Philip Morris International, Inc. | 26,260 | 2,196,386 | ||||||
|
| |||||||
| $ | 3,219,582 | |||||||
|
| |||||||
| Trucking – 1.2% | ||||||||
| Expeditors International of Washington, Inc. | 17,650 | $ | 698,058 | |||||
| Swift Transportation Co. (a) | 106,600 | 972,192 | ||||||
|
| |||||||
| $ | 1,670,250 | |||||||
|
| |||||||
| Utilities – Electric Power – 2.4% | ||||||||
| AES Corp. | 31,900 | $ | 341,330 | |||||
| American Electric Power Co., Inc. | 11,720 | 500,210 | ||||||
| Calpine Corp. (a) | 27,590 | 500,207 | ||||||
| CMS Energy Corp. | 25,680 | 626,078 | ||||||
| Edison International | 9,400 | 424,786 | ||||||
| Great Plains Energy, Inc. | 24,630 | 500,235 | ||||||
| PG&E Corp. | 9,880 | 396,978 | ||||||
|
| |||||||
| $ | 3,289,824 | |||||||
|
| |||||||
| Total Common Stocks (Identified Cost, $122,387,004) | $ | 137,202,107 | ||||||
|
| |||||||
| CONVERTIBLE PREFERRED STOCKS – 0.6% | ||||||||
| Utilities – Electric Power – 0.6% | ||||||||
| PPL Corp., 9.5% | 8,010 | $ | 419,003 | |||||
| PPL Corp., 8.75% | 7,350 | 394,916 | ||||||
|
| |||||||
| Total Convertible Preferred Stocks (Identified Cost, $780,978) | $ | 813,919 | ||||||
|
| |||||||
9
Table of Contents
MFS Core Equity Portfolio
Portfolio of Investments – continued
| Issuer | Strike Price | First Exercise | Shares/Par | Value ($) | ||||||||||||
| WARRANTS – 0.0% | ||||||||||||||||
| Natural Gas – Pipeline – 0.0% | ||||||||||||||||
| Kinder Morgan, Inc. (1 share for 1 warrant) (Identified Cost, $14,373) (a) | $ | 40 | 2/15/12 | 7,545 | $ | 28,520 | ||||||||||
|
| |||||||||||||||
| Issuer/Expiration Date/Strike Price | Number of Contracts | |||||||||||||||
| CALL OPTIONS PURCHASED – 0.0% | ||||||||||||||||
| Internet – 0.0% | ||||||||||||||||
| Pandora Media, Inc. – January 2013 @ $13 (Premiums Paid $9,467) | 110 | $ | 110 | |||||||||||||
|
| |||||||||||||||
| Issuer | Shares/Par | |||||||||||||||
| MONEY MARKET FUNDS – 0.6% | ||||||||||||||||
| MFS Institutional Money Market Portfolio, 0.16%, at Cost and Net Asset Value (v) | 896,829 | $ | 896,829 | |||||||||||||
|
| |||||||||||||||
| Total Investments (Identified Cost, $124,088,651) | $ | 138,941,485 | ||||||||||||||
|
| |||||||||||||||
| Issuer/Expiration Date/ Strike Price | Number of Contracts | |||||||||||||||
| CALL OPTIONS WRITTEN – (0.0)% | ||||||||||||||||
| Computer Software – 0.0% | ||||||||||||||||
| Solarwinds Inc. – January 2014 @ $65 | (77 | ) | $ | (25,410 | ) | |||||||||||
|
| |||||||||||||||
| Issuer/Expiration Date/ Strike Price | Number of Contracts | Value ($) | ||||||||||
| CALL OPTIONS WRITTEN – continued | ||||||||||||
| Internet – 0.0% | ||||||||||||
| Rackspace Hosting Inc. – January 2014 @ $90 | (84 | ) | $ | (42,840 | ) | |||||||
|
| |||||||||||
| Network & Telecom – 0.0% | ||||||||||||
| Fortinet Inc. – January 2014 @ $30 | (26 | ) | $ | (3,250 | ) | |||||||
|
| |||||||||||
| Total Call Options Written (Premiums Received, $79,396) | $ | (71,500 | ) | |||||||||
|
| |||||||||||
| Issuer | Shares/Par | |||||||||||
| SECURITIES SOLD SHORT – (0.4)% | ||||||||||||
| Electronics – (0.2)% | ||||||||||||
| Xilinx, Inc. | (8,500 | ) | $ | (305,150 | ) | |||||||
|
| |||||||||||
| Network & Telecom – (0.2)% | ||||||||||||
| EZchip Semiconductor Ltd., Inc. (a) | (7,800 | ) | $ | (257,946 | ) | |||||||
|
| |||||||||||
| Total Securities Sold Short (Proceeds Received, $541,098) | $ | (563,096 | ) | |||||||||
|
| |||||||||||
| OTHER ASSETS, LESS LIABILITIES – 0.5% | 748,522 | |||||||||||
|
| |||||||||||
| Net Assets – 100.0% | $ | 139,055,411 | ||||||||||
|
| |||||||||||
| (a) | Non-income producing security. |
| (s) | Security or a portion of the security was pledged to cover collateral requirements for securities sold short and/or certain derivative transactions. |
| (v) | Underlying affiliated fund that is available only to investment companies managed by MFS. The rate quoted for the MFS Institutional Money Market Portfolio is the annualized seven-day yield of the fund at period end. |
| (z) | Restricted securities are not registered under the Securities Act of 1933 and are subject to legal restrictions on resale. These securities generally may be resold in transactions exempt from registration or to the public if the securities are subsequently registered. Disposal of these securities may involve time-consuming negotiations and prompt sale at an acceptable price may be difficult. The fund holds the following restricted securities: |
| Restricted Securities | Acquisition Date | Cost | Value | |||||||
| EuroDekania Ltd. | 3/08/07-6/25/07 | $1,412,164 | $130,373 | |||||||
| % of Net assets | 0.1% | |||||||||
The following abbreviations are used in this report and are defined:
| ADR | American Depositary Receipt |
| PLC | Public Limited Company |
| REIT | Real Estate Investment Trust |
At December 31, 2012, the fund had cash collateral of $570,054 and/or other liquid securities with an aggregate value of $606,875 to cover any commitments for securities sold short and certain derivative contracts. Cash collateral is comprised of “Deposits with brokers” in the Statement of Assets and Liabilities.
See Notes to Financial Statements
10
Table of Contents
MFS Core Equity Portfolio
FINANCIAL STATEMENTS | STATEMENT OF ASSETS AND LIABILITIES
This statement represents your fund’s balance sheet, which details the assets and liabilities comprising the total value of the fund.
At 12/31/12 | ||||||||
Assets | ||||||||
Investments – | ||||||||
Non-affiliated issuers, at value (identified cost, $123,191,822) | $138,044,656 | |||||||
Underlying affiliated funds, at cost and value | 896,829 | |||||||
Total investments, at value (identified cost, $124,088,651) | $138,941,485 | |||||||
Deposits with brokers | 570,054 | |||||||
Receivables for | ||||||||
Investments sold | 249,425 | |||||||
Fund shares sold | 223,929 | |||||||
Interest and dividends | 111,591 | |||||||
Other assets | 1,816 | |||||||
Total assets | $140,098,300 | |||||||
Liabilities | ||||||||
Payables for | ||||||||
Securities sold short, at value (proceeds received, $541,098) | $563,096 | |||||||
Investments purchased | 132,521 | |||||||
Fund shares reacquired | 221,905 | |||||||
Written options outstanding, at value (premiums received, $79,396) | 71,500 | |||||||
Payable to affiliates | ||||||||
Investment adviser | 11,593 | |||||||
Distribution and/or service fees | 1,122 | |||||||
Payable for independent Trustees’ compensation | 13 | |||||||
Accrued expenses and other liabilities | 41,139 | |||||||
Total liabilities | $1,042,889 | |||||||
Net assets | $139,055,411 | |||||||
Net assets consist of | ||||||||
Paid-in capital | $142,353,869 | |||||||
Unrealized appreciation (depreciation) on investments and translation of assets and liabilities in foreign currencies | 14,838,670 | |||||||
Accumulated net realized gain (loss) on investments and foreign currency | (19,561,494 | ) | ||||||
Undistributed net investment income | 1,424,366 | |||||||
Net assets | $139,055,411 | |||||||
Shares of beneficial interest outstanding | 8,645,156 |
| Net assets | Shares outstanding | Net asset value per share | ||||||||||
Initial Class | $97,348,673 | 6,038,273 | $16.12 | |||||||||
Service Class | 41,706,738 | 2,606,883 | 16.00 | |||||||||
See Notes to Financial Statements
11
Table of Contents
MFS Core Equity Portfolio
FINANCIAL STATEMENTS | STATEMENT OF OPERATIONS
This statement describes how much your fund earned in investment income and accrued in expenses. It also describes any gains and/or losses generated by fund operations.
Year ended 12/31/12 | ||||||||
Net investment income | ||||||||
Income | ||||||||
Dividends | $2,713,096 | |||||||
Interest | 1,997 | |||||||
Dividends from underlying affiliated funds | 1,543 | |||||||
Foreign taxes withheld | (5,808 | ) | ||||||
Total investment income | $2,710,828 | |||||||
Expenses | ||||||||
Management fee | $1,040,309 | |||||||
Distribution and/or service fees | 99,045 | |||||||
Administrative services fee | 30,162 | |||||||
Independent Trustees’ compensation | 6,052 | |||||||
Custodian fee | 21,659 | |||||||
Shareholder communications | 14,635 | |||||||
Audit and tax fees | 48,762 | |||||||
Legal fees | 2,561 | |||||||
Dividend and interest expense on securities sold short | 2,678 | |||||||
Miscellaneous | 15,629 | |||||||
Total expenses | $1,281,492 | |||||||
Fees paid indirectly | (9 | ) | ||||||
Reduction of expenses by investment adviser | (493 | ) | ||||||
Net expenses | $1,280,990 | |||||||
Net investment income | $1,429,838 | |||||||
Realized and unrealized gain (loss) on investments and foreign currency | ||||||||
Realized gain (loss) (identified cost basis) | ||||||||
Investments | $10,442,086 | |||||||
Written options | 20,593 | |||||||
Securities sold short | 10,018 | |||||||
Foreign currency | (335 | ) | ||||||
Net realized gain (loss) on investments and foreign currency | $10,472,362 | |||||||
Change in unrealized appreciation (depreciation) | ||||||||
Investments | $9,171,927 | |||||||
Written options | 5,306 | |||||||
Securities sold short | (21,998 | ) | ||||||
Translation of assets and liabilities in foreign currencies | (109 | ) | ||||||
Net unrealized gain (loss) on investments and foreign currency translation | $9,155,126 | |||||||
Net realized and unrealized gain (loss) on investments and foreign currency | $19,627,488 | |||||||
Change in net assets from operations | $21,057,326 |
See Notes to Financial Statements
12
Table of Contents
MFS Core Equity Portfolio
FINANCIAL STATEMENTS | STATEMENTS OF CHANGES IN NET ASSETS
These statements describe the increases and/or decreases in net assets resulting from operations, any distributions, and any shareholder transactions.
For years ended 12/31 | 2012 | 2011 | ||||||
Change in net assets | ||||||||
From operations | ||||||||
Net investment income | $1,429,838 | $977,380 | ||||||
Net realized gain (loss) on investments and foreign currency | 10,472,362 | 7,098,901 | ||||||
Net unrealized gain (loss) on investments and foreign currency translation | 9,155,126 | (9,380,672 | ) | |||||
Change in net assets from operations | $21,057,326 | $(1,304,391 | ) | |||||
Distributions declared to shareholders | ||||||||
From net investment income | $(980,068 | ) | $(1,287,609 | ) | ||||
Change in net assets from fund share transactions | $(14,733,806 | ) | $(11,636,008 | ) | ||||
Total change in net assets | $5,343,452 | $(14,228,008 | ) | |||||
Net assets | ||||||||
At beginning of period | 133,711,959 | 147,939,967 | ||||||
At end of period (including undistributed net investment income of $1,424,366 and | $139,055,411 | $133,711,959 |
See Notes to Financial Statements
13
Table of Contents
MFS Core Equity Portfolio
FINANCIAL STATEMENTS | FINANCIAL HIGHLIGHTS
The financial highlights table is intended to help you understand the fund’s financial performance for the past 5 years. Certain information reflects financial results for a single fund share. The total returns in the table represent the rate by which an investor would have earned (or lost) on an investment in the fund share class (assuming reinvestment of all distributions) held for the entire period.
| Initial Class | Years ended 12/31 | |||||||||||||||||||
| 2012 | 2011 | 2010 | 2009 | 2008 | ||||||||||||||||
Net asset value, beginning of period | $13.95 | $14.23 | $12.27 | $9.43 | $16.52 | |||||||||||||||
| Income (loss) from investment operations | ||||||||||||||||||||
Net investment income (d) | $0.17 | $0.11 | $0.12 | $0.13 | $0.16 | |||||||||||||||
Net realized and unrealized gain (loss) on investments | 2.12 | (0.25 | ) | 1.98 | 2.89 | (6.11 | ) | |||||||||||||
Total from investment operations | $2.29 | $(0.14 | ) | $2.10 | $3.02 | $(5.95 | ) | |||||||||||||
| Less distributions declared to shareholders | ||||||||||||||||||||
From net investment income | $(0.12 | ) | $(0.14 | ) | $(0.14 | ) | $(0.18 | ) | $(0.09 | ) | ||||||||||
From net realized gain on investments | — | — | — | — | (1.05 | ) | ||||||||||||||
Total distributions declared to shareholders | $(0.12 | ) | $(0.14 | ) | $(0.14 | ) | $(0.18 | ) | $(1.14 | ) | ||||||||||
Net asset value, end of period (x) | $16.12 | $13.95 | $14.23 | $12.27 | $9.43 | |||||||||||||||
Total return (%) (k)(r)(s)(x) | 16.46 | (0.94 | ) | 17.22 | 32.74 | (38.63 | ) | |||||||||||||
| Ratios (%) (to average net assets) and Supplemental data: | ||||||||||||||||||||
Expenses before expense reductions (f) | 0.85 | 0.88 | 0.90 | 0.89 | 0.88 | |||||||||||||||
Expenses after expense reductions (f) | 0.85 | 0.87 | 0.86 | 0.85 | 0.85 | |||||||||||||||
Net investment income | 1.10 | 0.75 | 0.98 | 1.28 | 1.22 | |||||||||||||||
Portfolio turnover | 63 | 65 | 69 | 91 | 109 | |||||||||||||||
Net assets at end of period (000 omitted) | $97,349 | $96,375 | $112,121 | $109,322 | $97,648 | |||||||||||||||
| Supplemental Ratios (%): | ||||||||||||||||||||
Ratio of expenses to average net assets after expense reductions excluding short sale dividend and interest expense (f) | 0.85 | 0.87 | 0.85 | 0.85 | N/A | |||||||||||||||
See Notes to Financial Statements
14
Table of Contents
MFS Core Equity Portfolio
Financial Highlights – continued
| Service Class | Years ended 12/31 | |||||||||||||||||||
| 2012 | 2011 | 2010 | 2009 | 2008 | ||||||||||||||||
Net asset value, beginning of period | $13.84 | $14.13 | $12.19 | $9.36 | $16.42 | |||||||||||||||
| Income (loss) from investment operations | ||||||||||||||||||||
Net investment income (d) | $0.13 | $0.07 | $0.09 | $0.10 | $0.13 | |||||||||||||||
Net realized and unrealized gain (loss) on investments | 2.11 | (0.25 | ) | 1.97 | 2.88 | (6.08 | ) | |||||||||||||
Total from investment operations | $2.24 | $(0.18 | ) | $2.06 | $2.98 | $(5.95 | ) | |||||||||||||
| Less distributions declared to shareholders | ||||||||||||||||||||
From net investment income | $(0.08 | ) | $(0.11 | ) | $(0.12 | ) | $(0.15 | ) | $(0.06 | ) | ||||||||||
From net realized gain on investments | — | — | — | — | (1.05 | ) | ||||||||||||||
Total distributions declared to shareholders | $(0.08 | ) | $(0.11 | ) | $(0.12 | ) | $(0.15 | ) | $(1.11 | ) | ||||||||||
Net asset value, end of period (x) | $16.00 | $13.84 | $14.13 | $12.19 | $9.36 | |||||||||||||||
Total return (%) (k)(r)(s)(x) | 16.24 | (1.25 | ) | 16.95 | 32.44 | (38.79 | ) | |||||||||||||
| Ratios (%) (to average net assets) and Supplemental data: | ||||||||||||||||||||
Expenses before expense reductions (f) | 1.10 | 1.13 | 1.15 | 1.14 | 1.13 | |||||||||||||||
Expenses after expense reductions (f) | 1.10 | 1.12 | 1.11 | 1.10 | 1.10 | |||||||||||||||
Net investment income | 0.85 | 0.51 | 0.73 | 1.02 | 1.00 | |||||||||||||||
Portfolio turnover | 63 | 65 | 69 | 91 | 109 | |||||||||||||||
Net assets at end of period (000 omitted) | $41,707 | $37,337 | $35,819 | $33,583 | $21,684 | |||||||||||||||
| Supplemental Ratios (%): | ||||||||||||||||||||
Ratio of expenses to average net assets after expense reductions excluding short sale dividend and interest expense (f) | 1.10 | 1.12 | 1.10 | 1.10 | N/A | |||||||||||||||
| (d) | Per share data is based on average shares outstanding. |
| (f) | Ratios do not reflect reductions from fees paid indirectly, if applicable. |
| (k) | The total return does not reflect expenses that apply to separate accounts. Inclusion of these charges would reduce the total return figures for all periods shown. |
| (r) | Certain expenses have been reduced without which performance would have been lower. |
| (s) | From time to time the fund may receive proceeds from litigation settlements, without which performance would be lower. |
| (x) | The net asset values per share and total returns have been calculated on net assets which include adjustments made in accordance with U.S. generally accepted accounting principles required at period end for financial reporting purposes. |
See Notes to Financial Statements
15
Table of Contents
MFS Core Equity Portfolio
| (1) | Business and Organization |
MFS Core Equity Portfolio (the fund) is a series of MFS Variable Insurance Trust II (the trust). The trust is organized as a Massachusetts business trust and is registered under the Investment Company Act of 1940, as amended, as an open-end management investment company. The shareholders of each series of the trust are separate accounts of insurance companies, which offer variable annuity and/or life insurance products, and qualified retirement and pension plans.
| (2) | Significant Accounting Policies |
General – The preparation of financial statements in conformity with U.S. generally accepted accounting principles requires management to make estimates and assumptions that affect the reported amounts of assets and liabilities, and disclosure of contingent assets and liabilities at the date of the financial statements and the reported amounts of revenues and expenses during the reporting period. Actual results could differ from those estimates. In the preparation of these financial statements, management has evaluated subsequent events occurring after the date of the fund’s Statement of Assets and Liabilities through the date that the financial statements were issued.
In this reporting period the fund adopted Financial Accounting Standards Board (FASB) Accounting Standards Update 2011-04, Fair Value Measurement (Topic 820) – Amendments to Achieve Common Fair Value Measurement and Disclosure Requirements in U.S. GAAP and IFRSs (“ASU 2011-04”). ASU 2011-04 seeks to improve the comparability of fair value measurements as presented and disclosed in financial statements prepared in accordance with U.S. GAAP and International Financial Reporting Standards (IFRS) by providing common requirements for fair value measurement and disclosure.
In December 2011, the FASB issued Accounting Standards Update 2011-11, Balance Sheet (Topic 210) – Disclosures about Offsetting Assets and Liabilities (“ASU 2011-11”). Effective for annual reporting periods beginning on or after January 1, 2013 and interim periods within those annual periods, ASU 2011-11 is intended to enhance disclosure requirements on the offsetting of financial assets and liabilities. Although still evaluating the potential impacts of ASU 2011-11 to the fund, management expects that the impact of the fund’s adoption will be limited to additional financial statement disclosures.
Investment Valuations – Equity securities, including restricted equity securities, are generally valued at the last sale or official closing price as provided by a third-party pricing service on the market or exchange on which they are primarily traded. Equity securities, for which there were no sales reported that day, are generally valued at the last quoted daily bid quotation as provided by a third-party pricing service on the market or exchange on which such securities are primarily traded. Equity securities held short, for which there were no sales reported for that day, are generally valued at the last quoted daily ask quotation as provided by a third-party pricing service on the market or exchange on which such securities are primarily traded. Short-term instruments with a maturity at issuance of 60 days or less generally are valued at amortized cost, which approximates market value. Exchange-traded options are generally valued at the last sale or official closing price as provided by a third-party pricing service on the exchange on which such options are primarily traded. Exchange-traded options for which there were no sales reported that day are generally valued at the last daily bid quotation as provided by a third-party pricing service on the exchange on which such options are primarily traded. Options not traded on an exchange are generally valued at a broker/dealer bid quotation. Foreign currency options are generally valued at valuations provided by a third-party pricing service. Open-end investment companies are generally valued at net asset value per share. Securities and other assets generally valued on the basis of information from a third-party pricing service may also be valued at a broker/dealer bid quotation. Values obtained from third-party pricing services can utilize both transaction data and market information such as yield, quality, coupon rate, maturity, type of issue, trading characteristics, and other market data. The values of foreign securities and other assets and liabilities expressed in foreign currencies are converted to U.S. dollars using the mean of bid and asked prices for rates provided by a third-party pricing service.
The Board of Trustees has delegated primary responsibility for determining or causing to be determined the value of the fund’s investments (including any fair valuation) to the adviser pursuant to valuation policies and procedures approved by the Board. If the adviser determines that reliable market quotations are not readily available, investments are valued at fair value as determined in good faith by the adviser in accordance with such procedures under the oversight of the Board of Trustees. Under the fund’s valuation policies and procedures, market quotations are not considered to be readily available for most types of debt instruments and floating rate loans and many types of derivatives. These investments are generally valued at fair value based on information from third-party pricing services. In addition, investments may be valued at fair value if the adviser determines that an investment’s value has been materially affected by events occurring after the close of the exchange or market on which the investment is principally traded (such as foreign exchange or market) and prior to the determination of the fund’s net asset value, or after the halting of trading of a specific security where trading does not resume prior to the close of the exchange or market on which the security is principally traded. Events that occur on a frequent basis after foreign markets close (such as developments in foreign markets and significant movements in the U.S. markets) and prior to the determination of the fund’s net asset value may be deemed to have a material effect on the value of securities traded in foreign markets. Accordingly, the fund’s foreign equity securities may often be valued at fair value. The adviser generally relies on third-party pricing services or other information (such as the correlation with price movements of similar securities in the same or other markets; the type, cost and investment characteristics of the security; the
16
Table of Contents
MFS Core Equity Portfolio
Notes to Financial Statements – continued
business and financial condition of the issuer; and trading and other market data) to assist in determining whether to fair value and at what value to fair value an investment. The value of an investment for purposes of calculating the fund’s net asset value can differ depending on the source and method used to determine value. When fair valuation is used, the value of an investment used to determine the fund’s net asset value may differ from quoted or published prices for the same investment. There can be no assurance that the fund could obtain the fair value assigned to an investment if it were to sell the investment at the same time at which the fund determines its net asset value per share.
Various inputs are used in determining the value of the fund’s assets or liabilities. These inputs are categorized into three broad levels. In certain cases, the inputs used to measure fair value may fall into different levels of the fair value hierarchy. In such cases, an investment’s level within the fair value hierarchy is based on the lowest level of input that is significant to the fair value measurement. The fund’s assessment of the significance of a particular input to the fair value measurement in its entirety requires judgment, and considers factors specific to the investment. Level 1 includes unadjusted quoted prices in active markets for identical assets or liabilities. Level 2 includes other significant observable market-based inputs (including quoted prices for similar securities, interest rates, prepayment speed, and credit risk). Level 3 includes unobservable inputs, which may include the adviser’s own assumptions in determining the fair value of investments. Other financial instruments are derivative instruments not reflected in total investments, such as written options. The following is a summary of the levels used as of December 31, 2012 in valuing the fund’s assets or liabilities:
| Investments at Value | Level 1 | Level 2 | Level 3 | Total | ||||||||||||
| Equity Securities: | ||||||||||||||||
United States | $134,949,606 | $110 | $— | $134,949,716 | ||||||||||||
Israel | 1,440,202 | — | — | 1,440,202 | ||||||||||||
Canada | 649,255 | — | — | 649,255 | ||||||||||||
Netherlands | 457,247 | — | — | 457,247 | ||||||||||||
Brazil | 226,084 | — | — | 226,084 | ||||||||||||
Austria | 191,779 | — | — | 191,779 | ||||||||||||
United Kingdom | — | — | 130,373 | 130,373 | ||||||||||||
| Mutual Funds | 896,829 | — | — | 896,829 | ||||||||||||
| Total Investments | $138,811,002 | $110 | $130,373 | $138,941,485 | ||||||||||||
| Short Sales | $(563,096 | ) | $— | $— | $(563,096 | ) | ||||||||||
| Other Financial Instruments | ||||||||||||||||
| Written Options | $(71,500 | ) | $— | $— | $(71,500 | ) | ||||||||||
For further information regarding security characteristics, see the Portfolio of Investments.
The following is a reconciliation of level 3 assets for which significant unobservable inputs were used to determine fair value. The fund’s policy is to recognize transfers between the levels as of the end of the period. The table presents the activity of level 3 securities held at the beginning and the end of the period.
| Equity Securities | ||||
| Balance as of 12/31/11 | $252,783 | |||
Change in unrealized appreciation (depreciation) | (122,410 | ) | ||
| Balance as of 12/31/12 | $130,373 | |||
The net change in unrealized appreciation (depreciation) from investments still held as level 3 at December 31, 2012 is $(122,410).
Foreign Currency Translation – Purchases and sales of foreign investments, income, and expenses are converted into U.S. dollars based upon currency exchange rates prevailing on the respective dates of such transactions or on the reporting date for foreign denominated receivables and payables. Gains and losses attributable to foreign currency exchange rates on sales of securities are recorded for financial statement purposes as net realized gains and losses on investments. Gains and losses attributable to foreign exchange rate movements on receivables, payables, income and expenses are recorded for financial statement purposes as foreign currency transaction gains and losses. That portion of both realized and unrealized gains and losses on investments that results from fluctuations in foreign currency exchange rates is not separately disclosed.
Derivatives – The fund uses derivatives for different purposes, primarily to increase or decrease exposure to a particular market or segment of the market, or security, to increase or decrease interest rate or currency exposure, or as alternatives to direct investments. Derivatives are used for hedging or non-hedging purposes. While hedging can reduce or eliminate losses, it can also reduce or eliminate gains. When the fund uses derivatives as an investment to increase market exposure, or for hedging purposes, gains and losses from derivative instruments may be substantially greater than the derivative’s original cost.
17
Table of Contents
MFS Core Equity Portfolio
Notes to Financial Statements – continued
The derivative instruments used by the fund were written options and purchased options. The fund’s period end derivatives, as presented in the Portfolio of Investments, generally are indicative of the volume of its derivative activity during the period.
The following table presents, by major type of derivative contract, the fair value, on a gross basis, of the asset and liability components of derivatives held by the fund at December 31, 2012 as reported in the Statement of Assets and Liabilities:
| Fair Value (a) | ||||||||||
| Risk | Derivative Contracts | Asset Derivatives | Liability Derivatives | |||||||
| Equity | Purchased Equity Options | $110 | $— | |||||||
| Equity | Written Equity Options | — | (71,500 | ) | ||||||
| (a) | The value of purchased options outstanding is included in total investments, at value, within the fund’s Statement of Assets and Liabilities. |
The following table presents, by major type of derivative contract, the realized gain (loss) on derivatives held by the fund for the year ended December 31, 2012 as reported in the Statement of Operations:
| Risk | Investments (Purchased Options) | Written Options | ||||||
| Equity | $36,323 | $20,593 | ||||||
The following table presents, by major type of derivative contract, the change in unrealized appreciation (depreciation) on derivatives held by the fund for the year ended December 31, 2012 as reported in the Statement of Operations:
| Risk | Investments (Purchased Options) | Written Options | ||||||
| Equity | $(9,357 | ) | $5,306 | |||||
Derivative counterparty credit risk is managed through formal evaluation of the creditworthiness of all potential counterparties. On certain over-the-counter derivatives, the fund attempts to reduce its exposure to counterparty credit risk whenever possible by entering into an International Swaps and Derivatives Association (ISDA) Master Agreement on a bilateral basis with each of the counterparties with whom it undertakes a significant volume of transactions. The ISDA Master Agreement gives each party to the agreement the right to terminate all transactions traded under such agreement if there is a certain deterioration in the credit quality of the other party. The ISDA Master Agreement gives the fund the right, upon an event of default by the applicable counterparty or a termination of the agreement, to close out all transactions traded under such agreement and to net amounts owed under each transaction to one net amount payable by one party to the other. This right to close out and net payments across all transactions traded under the ISDA Master Agreement could result in a reduction of the fund’s credit risk to such counterparty equal to any amounts payable by the fund under the applicable transactions, if any. However, absent an event of default by the counterparty or a termination of the agreement, the ISDA Master Agreement does not result in an offset of reported amounts of assets and liabilities in the Statement of Assets and Liabilities across transactions between the fund and the applicable counterparty.
Collateral requirements differ by type of derivative. Collateral or margin requirements are set by the broker or exchange clearing house for exchange traded derivatives (i.e., futures contracts and exchange-traded options) while collateral terms are contract specific for over-the-counter traded derivatives (i.e., forward foreign currency exchange contracts, swap agreements and over-the-counter options). For derivatives traded under an ISDA Master Agreement, the collateral requirements are netted across all transactions traded under such agreement and one amount is posted from one party to the other to collateralize such obligations. Cash collateral that has been pledged to cover obligations of the fund under derivative contracts, if any, will be reported separately in the Statement of Assets and Liabilities as “Deposits with brokers”. Securities collateral pledged for the same purpose, if any, is noted in the Portfolio of Investments.
Written Options – In exchange for a premium, the fund wrote call options on securities that it anticipated the price would decline and also wrote put options on securities that it anticipated the price would increase. At the time the option was written, the fund believed the premium received exceeded the potential loss that could result from adverse price changes in the options’ underlying securities. In a written option, the fund as the option writer grants the buyer the right to purchase from, or sell to, the fund a specified number of shares or units of a particular security, currency or index at a specified price within a specified period of time.
The premium received is initially recorded as a liability in the Statement of Assets and Liabilities. The option is subsequently marked-to-market daily with the difference between the premium received and the market value of the written option being recorded as unrealized appreciation or depreciation. When a written option expires, the fund realizes a gain equal to the amount of the premium received. The difference between the premium received and the amount paid on effecting a closing transaction is considered a realized gain or loss. When a written call option is exercised, the premium received is offset against the proceeds to determine the realized gain or loss. When a written put option is exercised, the premium reduces the cost basis of the security purchased by the fund.
18
Table of Contents
MFS Core Equity Portfolio
Notes to Financial Statements – continued
At the initiation of the written option contract, for exchange traded options, the fund is required to deposit securities or cash as collateral with the custodian for the benefit of the broker. For over-the-counter options, the fund may post collateral subject to the terms of an ISDA Master Agreement as generally described above if the market value of the options contract moves against it. The fund, as writer of an option, may have no control over whether the underlying securities may be sold (call) or purchased (put) and, as a result, bears the market risk of an unfavorable change in the price of the securities underlying the written option. Losses from writing options can exceed the premium received and can exceed the potential loss from an ordinary buy and sell transaction. Although the fund’s market risk may be significant, the maximum counterparty credit risk to the fund is equal to the market value of any collateral posted to the broker. For over-the-counter options, this risk is mitigated in cases where there is an ISDA Master Agreement between the fund and the counterparty providing for netting as described above.
Written Options
| Number of contracts | Premiums received | |||||||
| Outstanding, beginning of period | 36 | $3,850 | ||||||
| Options written | 471 | 109,313 | ||||||
| Options closed | (211 | ) | (25,363 | ) | ||||
| Options expired | (109 | ) | (8,404 | ) | ||||
| Outstanding, end of period | 187 | $79,396 | ||||||
Purchased Options – The fund purchased call and put options for a premium. Purchased call and put options entitle the holder to buy and sell a specified number of shares or units of a particular security, currency or index at a specified price at a specified date or within a specified period of time. Purchasing call options may hedge against an anticipated increase in the dollar cost of securities or currency to be acquired or increase the fund’s exposure to an underlying instrument. Purchasing put options may hedge against an anticipated decline in the value of portfolio securities or currency or decrease the fund’s exposure to an underlying instrument.
The premium paid is initially recorded as an investment in the Statement of Assets and Liabilities. That investment is subsequently marked-to-market daily with the difference between the premium paid and the market value of the purchased option being recorded as unrealized appreciation or depreciation. Premiums paid for purchased call and put options which have expired are treated as realized losses on investments in the Statement of Operations. Upon the exercise or closing of a purchased call option, the premium paid is added to the cost of the security or financial instrument purchased. Upon the exercise or closing of a purchased put option, the premium paid is offset against the proceeds on the sale of the underlying security or financial instrument in order to determine the realized gain or loss on investments.
Whether or not the option is exercised, the fund’s maximum risk of loss from purchasing an option is the amount of premium paid. All option contracts involve credit risk if the counterparty to the option contract fails to perform. For over-the-counter options, this risk is mitigated in cases where there is an ISDA Master Agreement between the fund and the counterparty providing for netting as described above and for posting of collateral by the counterparty to the fund to cover the fund’s exposure to the counterparty under such ISDA Master Agreement.
Short Sales – The fund entered into short sales whereby it sells a security it does not own in anticipation of a decline in the value of that security. The fund will realize a gain if the security price decreases and a loss if the security price increases between the date of the short sale and the date on which the fund replaces the borrowed security. Losses from short sales can exceed the proceeds of the security sold; and they can also exceed the potential loss from an ordinary buy and sell transaction. The amount of any premium, dividends, or interest the fund may be required to pay in connection with a short sale will be recognized as a fund expense. During the year ended December 31, 2012, this expense amounted to $2,678. The fund segregates cash or marketable securities in an amount that, when combined with the amount of proceeds from the short sale deposited with the broker, at least equals the current market value of the security sold short.
Security Loans – State Street Bank and Trust Company (“State Street”), as lending agent, loans the securities of the fund to certain qualified institutions (the “Borrowers”) approved by the fund. The loans are collateralized by cash and/or U.S. Treasury and federal agency obligations in an amount typically at least equal to the market value of the securities loaned. The market value of the loaned securities is determined at the close of business of the fund and any additional required collateral is delivered to the fund on the next business day. State Street provides the fund with indemnification against Borrower default. The fund bears the risk of loss with respect to the investment of cash collateral. On loans collateralized by cash, the cash collateral is invested in a money market fund or short-term securities. A portion of the income generated upon investment of the collateral is remitted to the Borrowers, and the remainder is allocated between the fund and the lending agent. On loans collateralized by U.S. Treasury and/or federal agency obligations, a fee is received from the Borrower, and is allocated between the fund and the lending agent. Income from securities lending is included in “Interest” income on the Statement of Operations. The dividend and interest income earned on the securities loaned is accounted for in the same manner as other dividend and interest income. At December 31, 2012, there were no securities on loan or collateral outstanding.
19
Table of Contents
MFS Core Equity Portfolio
Notes to Financial Statements – continued
Indemnifications – Under the fund’s organizational documents, its officers and Trustees may be indemnified against certain liabilities and expenses arising out of the performance of their duties to the fund. Additionally, in the normal course of business, the fund enters into agreements with service providers that may contain indemnification clauses. The fund’s maximum exposure under these agreements is unknown as this would involve future claims that may be made against the fund that have not yet occurred.
Investment Transactions and Income – Investment transactions are recorded on the trade date. Interest income is recorded on the accrual basis. Dividends received in cash are recorded on the ex-dividend date. Certain dividends from foreign securities will be recorded when the fund is informed of the dividend if such information is obtained subsequent to the ex-dividend date. Dividend and interest payments received in additional securities are recorded on the ex-dividend or ex-interest date in an amount equal to the value of the security on such date.
The fund may receive proceeds from litigation settlements. Any proceeds received from litigation involving portfolio holdings are reflected in the Statement of Operations in realized gain/loss if the security has been disposed of by the fund or in unrealized gain/loss if the security is still held by the fund. Any other proceeds from litigation not related to portfolio holdings are reflected as other income in the Statement of Operations.
Fees Paid Indirectly – The fund’s custody fee may be reduced according to an arrangement that measures the value of cash deposited with the custodian by the fund. This amount, for the year ended December 31, 2012, is shown as a reduction of total expenses in the Statement of Operations.
Tax Matters and Distributions – The fund intends to qualify as a regulated investment company, as defined under Subchapter M of the Internal Revenue Code, and to distribute all of its taxable income, including realized capital gains. As a result, no provision for federal income tax is required. The fund’s federal tax returns, when filed, will remain subject to examination by the Internal Revenue Service for a three year period. Foreign taxes have been accrued by the fund in the accompanying financial statements.
Distributions to shareholders are recorded on the ex-dividend date. Income and capital gain distributions are determined in accordance with income tax regulations, which may differ from U.S. generally accepted accounting principles. Certain capital accounts in the financial statements are periodically adjusted for permanent differences in order to reflect their tax character. These adjustments have no impact on net assets or net asset value per share. Temporary differences which arise from recognizing certain items of income, expense, gain or loss in different periods for financial statement and tax purposes will reverse at some time in the future. Distributions in excess of net investment income or net realized gains are temporary overdistributions for financial statement purposes resulting from differences in the recognition or classification of income or distributions for financial statement and tax purposes.
Book/tax differences primarily relate to wash sale loss deferrals.
The tax character of distributions declared to shareholders for the last two fiscal years is as follows:
| 12/31/12 | 12/31/11 | |||||||
| Ordinary income (including any short-term capital gains) | $980,068 | $1,287,609 | ||||||
The federal tax cost and the tax basis components of distributable earnings were as follows:
| As of 12/31/12 | ||||
| Cost of investments | $124,188,636 | |||
| Gross appreciation | 20,046,490 | |||
| Gross depreciation | (5,293,641 | ) | ||
| Net unrealized appreciation (depreciation) | $14,752,849 | |||
| Undistributed ordinary income | 1,424,366 | |||
| Capital loss carryforwards | (19,428,682 | ) | ||
| Other temporary differences | (46,991 | ) |
Under the Regulated Investment Company Modernization Act of 2010 (the “Act”), net capital losses recognized after December 31, 2010 may be carried forward indefinitely, and their character is retained as short-term and/or long-term losses. Previously, net capital losses were carried forward for eight years and treated as short-term losses. As a transition rule, the Act requires that post-enactment net capital losses be used before pre-enactment net capital losses.
As of December 31, 2012, the fund had capital loss carryforwards available to offset future realized gains. Such losses are characterized as follows:
| Pre-enactment losses: | ||||
| 12/31/16 | $(3,057,756 | ) | ||
| 12/31/17 | (16,370,926 | ) | ||
| Total | $(19,428,682 | ) |
20
Table of Contents
MFS Core Equity Portfolio
Notes to Financial Statements – continued
Multiple Classes of Shares of Beneficial Interest – The fund offers multiple classes of shares, which differ in their respective distribution and/or service fees. The fund’s income, realized and unrealized gain (loss), and common expenses are allocated to shareholders based on the daily net assets of each class. Dividends are declared separately for each class. Differences in per share dividend rates are generally due to differences in separate class expenses. The fund’s distributions declared to shareholders as reported in the Statements of Changes in Net Assets are presented by class as follows:
| From net investment income | ||||||||
| Year ended 12/31/12 | Year ended 12/31/11 | |||||||
| Initial Class | $764,938 | $1,006,030 | ||||||
| Service Class | 215,130 | 281,579 | ||||||
| Total | $980,068 | $1,287,609 | ||||||
| (3) | Transactions with Affiliates |
Investment Adviser – The fund has an investment advisory agreement with MFS to provide overall investment management and related administrative services and facilities to the fund. The management fee is computed daily and paid monthly at the following annual rates:
| First $1 billion of average daily net assets | 0.75% | |||
| Average daily net assets in excess of $1 billion | 0.65% |
The investment adviser has agreed in writing to reduce its management fee to 0.60% of average daily net assets in excess of $2.5 billion. This written agreement will continue until modified by the fund’s Board of Trustees, but such agreement will continue at least until April 30, 2014. For the year ended December 31, 2012, the fund’s average daily net assets did not exceed $2.5 billion and therefore, the management fee was not reduced. The management fee incurred for the year ended December 31, 2012 was equivalent to an annual effective rate of 0.75% of the fund’s average daily net assets.
Distributor – MFS Fund Distributors, Inc. (MFD), a wholly-owned subsidiary of MFS, is the distributor of shares of the fund. The Trustees have adopted a distribution plan for the Service Class shares pursuant to Rule 12b-1 under the Investment Company Act of 1940.
The fund’s distribution plan provides that the fund will pay MFD distribution and/or service fees equal to 0.25% per annum of its average daily net assets attributable to Service Class shares as partial consideration for services performed and expenses incurred by MFD and financial intermediaries (including participating insurance companies that invest in the fund to fund variable annuity and variable life insurance contracts, sponsors of qualified retirement and pension plans that invest in the fund, and affiliates of these participating insurance companies and plan sponsors) in connection with the sale and distribution of the Service Class shares. MFD may subsequently pay all, or a portion, of the distribution and/or service fees to financial intermediaries.
Shareholder Servicing Agent – MFS Service Center, Inc. (MFSC), a wholly-owned subsidiary of MFS, has contracted to provide transfer agent and recordkeeping functions in connection with the issuance, transfer, and redemption of each class of shares of the fund under a Shareholder Servicing Agent Agreement. During the year ended December 31, 2012, the fund did not pay MFSC a fee for this service. Effective April 1, 2013, the fund will be charged a shareholder servicing fee by MFSC.
Administrator – MFS provides certain financial, legal, shareholder communications, compliance, and other administrative services to the fund. Under an administrative services agreement, the fund partially reimburses MFS the costs incurred to provide these services. The fund is charged an annual fixed amount of $17,500 plus a fee based on average daily net assets. The administrative services fee incurred for the year ended December 31, 2012 was equivalent to an annual effective rate of 0.0217% of the fund’s average daily net assets.
Trustees’ and Officers’ Compensation – The fund pays compensation to independent Trustees in the form of a retainer, attendance fees, and additional compensation to Board and Committee chairpersons. The fund does not pay compensation directly to Trustees or officers of the fund who are also officers of the investment adviser, all of whom receive remuneration for their services to the fund from MFS. Certain officers and Trustees of the fund are officers or directors of MFS, MFD, and MFSC.
Other – This fund and certain other funds managed by MFS (the funds) have entered into services agreements (the Agreements) which provide for payment of fees by the funds to Tarantino LLC and Griffin Compliance LLC in return for the provision of services of an Independent Chief Compliance Officer (ICCO) and Assistant ICCO, respectively, for the funds. The ICCO and Assistant ICCO are officers of the funds and the sole members of Tarantino LLC and Griffin Compliance LLC, respectively. The funds can terminate the Agreements with Tarantino LLC and Griffin Compliance LLC at any time under the terms of the Agreements. For the year ended December 31, 2012, the aggregate fees paid by the fund to Tarantino LLC and Griffin Compliance LLC were $1,132 and are included in “Miscellaneous” expense in the Statement of Operations. MFS has agreed to reimburse the fund for a portion of the
21
Table of Contents
MFS Core Equity Portfolio
Notes to Financial Statements – continued
payments made by the fund in the amount of $493, which is shown as a reduction of total expenses in the Statement of Operations. Additionally, MFS has agreed to bear all expenses associated with office space, other administrative support, and supplies provided to the ICCO and Assistant ICCO.
The fund invests in the MFS Institutional Money Market Portfolio which is managed by MFS and seeks current income consistent with preservation of capital and liquidity. Income earned on this investment is included in “Dividends from underlying affiliated funds” in the Statement of Operations. This money market fund does not pay a management fee to MFS.
| (4) | Portfolio Securities |
Purchases and sales of investments, other than purchased option transactions, short sales, and short-term obligations, aggregated $85,914,643 and $99,214,198, respectively.
| (5) | Shares of Beneficial Interest |
The fund’s Declaration of Trust permits the Trustees to issue an unlimited number of full and fractional shares of beneficial interest. Transactions in fund shares were as follows:
| Year ended 12/31/12 | Year ended 12/31/11 | |||||||||||||||
| Shares | Amount | Shares | Amount | |||||||||||||
| Shares sold | ||||||||||||||||
Initial Class | 49,337 | $773,627 | 84,615 | $1,181,327 | ||||||||||||
Service Class | 406,072 | 6,223,938 | 634,165 | 8,900,700 | ||||||||||||
| 455,409 | $6,997,565 | 718,780 | $10,082,027 | |||||||||||||
| Shares issued to shareholders in reinvestment of distributions | ||||||||||||||||
Initial Class | 49,415 | $764,938 | 75,471 | $1,006,030 | ||||||||||||
Service Class | 13,988 | 215,130 | 21,267 | 281,579 | ||||||||||||
| 63,403 | $980,068 | 96,738 | $1,287,609 | |||||||||||||
| Shares reacquired | ||||||||||||||||
Initial Class | (971,381 | ) | $(14,911,745 | ) | (1,125,770 | ) | $(16,146,864 | ) | ||||||||
Service Class | (510,896 | ) | (7,799,694 | ) | (492,675 | ) | (6,858,780 | ) | ||||||||
| (1,482,277 | ) | $(22,711,439 | ) | (1,618,445 | ) | $(23,005,644 | ) | |||||||||
| Net change | ||||||||||||||||
Initial Class | (872,629 | ) | $(13,373,180 | ) | (965,684 | ) | $(13,959,507 | ) | ||||||||
Service Class | (90,836 | ) | (1,360,626 | ) | 162,757 | 2,323,499 | ||||||||||
| (963,465 | ) | $(14,733,806 | ) | (802,927 | ) | $(11,636,008 | ) | |||||||||
| (6) | Line of Credit |
The fund and certain other funds managed by MFS participate in a $1.1 billion unsecured committed line of credit, subject to a $1 billion sublimit, provided by a syndication of banks under a credit agreement. Borrowings may be made for temporary financing needs. Interest is charged to each fund, based on its borrowings, generally at a rate equal to the higher of the Federal Reserve funds rate or one month LIBOR plus an agreed upon spread. A commitment fee, based on the average daily, unused portion of the committed line of credit, is allocated among the participating funds at the end of each calendar quarter. In addition, the fund and other funds managed by MFS have established unsecured uncommitted borrowing arrangements with certain banks for temporary financing needs. Interest is charged to each fund, based on its borrowings, at a rate equal to the Federal Reserve funds rate plus an agreed upon spread. For the year ended December 31, 2012, the fund’s commitment fee and interest expense were $894 and $0, respectively, and are included in “Miscellaneous” expense in the Statement of Operations.
| (7) | Transactions in Underlying Affiliated Funds – Affiliated Issuers |
An affiliated issuer may be considered one in which the fund owns 5% or more of the outstanding voting securities, or a company which is under common control. For the purposes of this report, the fund assumes the following to be an affiliated issuer:
| Underlying Affiliated Fund | Beginning Shares/Par Amount | Acquisitions Shares/Par Amount | Dispositions Shares/Par Amount | Ending Shares/Par Amount | ||||||||||||
| MFS Institutional Money Market Portfolio | 757,029 | 29,202,060 | (29,062,260 | ) | 896,829 | |||||||||||
| Underlying Affiliated Fund | Realized Gain (Loss) | Capital Gain Distributions | Dividend Income | Ending Value | ||||||||||||
| MFS Institutional Money Market Portfolio | $— | $— | $1,543 | $896,829 | ||||||||||||
22
Table of Contents
MFS Core Equity Portfolio
REPORT OF INDEPENDENT REGISTERED PUBLIC ACCOUNTING FIRM
To the Board of Trustees of MFS Variable Insurance Trust II and the Shareholders of
MFS Core Equity Portfolio:
We have audited the accompanying statement of assets and liabilities, including the portfolio of investments, of MFS Core Equity Portfolio (the “Fund”) (one of the series comprising MFS Variable Insurance Trust II) as of December 31, 2012, and the related statement of operations for the year then ended, the statements of changes in net assets for each of the two years in the period then ended, and the financial highlights for each of the five years in the period then ended. These financial statements and financial highlights are the responsibility of the Fund’s management. Our responsibility is to express an opinion on these financial statements and financial highlights based on our audits.
We conducted our audits in accordance with the standards of the Public Company Accounting Oversight Board (United States). Those standards require that we plan and perform the audit to obtain reasonable assurance about whether the financial statements and financial highlights are free of material misstatement. The Fund is not required to have, nor were we engaged to perform, an audit of its internal control over financial reporting. Our audits included consideration of internal control over financial reporting as a basis for designing audit procedures that are appropriate in the circumstances, but not for the purpose of expressing an opinion on the effectiveness of the Fund’s internal control over financial reporting. Accordingly, we express no such opinion. An audit also includes examining, on a test basis, evidence supporting the amounts and disclosures in the financial statements, assessing the accounting principles used and significant estimates made by management, as well as evaluating the overall financial statement presentation. Our procedures included confirmation of securities owned as of December 31, 2012, by correspondence with the custodian and brokers; where replies were not received from brokers, we performed other auditing procedures. We believe that our audits provide a reasonable basis for our opinion.
In our opinion, the financial statements and financial highlights referred to above present fairly, in all material respects, the financial position of MFS Core Equity Portfolio as of December 31, 2012, the results of its operations for the year then ended, the changes in its net assets for each of the two years in the period then ended, and the financial highlights for each of the five years in the period then ended, in conformity with accounting principles generally accepted in the United States of America.
DELOITTE & TOUCHE LLP
Boston, Massachusetts
February 15, 2013
23
Table of Contents
MFS Core Equity Portfolio
TRUSTEES AND OFFICERS – IDENTIFICATION AND BACKGROUND
The Trustees and officers of the Trust, as of February 1, 2013, are listed below, together with their principal occupations during the past five years. (Their titles may have varied during that period.) The address of each Trustee and officer is 111 Huntington Avenue, Boston, Massachusetts 02199-7618.
Name, Age | Position(s) with Fund | Trustee/Officer Since (h) | Principal Occupations During the Past Five Years | Other Directorships (j) | ||||
| INTERESTED TRUSTEES | ||||||||
Robert J. Manning (k) (age 49) | Trustee | February 2004 | Massachusetts Financial Services Company, Chairman, Chief Executive Officer and Director; President (until December 2009); Chief Investment Officer (until July 2010) | N/A | ||||
| INDEPENDENT TRUSTEES | ||||||||
David H. Gunning (age 70) | Trustee and Chair of Trustees | January 2004 | Private investor | Lincoln Electric Holdings, Inc. (welding equipment manufacturer), Director; Development Alternatives, Inc. (consulting), Director/Non-Executive Chairman; Portman Limited (mining), Director (until 2008) | ||||
Robert E. Butler (age 71) | Trustee | January 2006 | Consultant – investment company industry regulatory and compliance matters | N/A | ||||
Maureen R. Goldfarb (age 57) | Trustee | January 2009 | Private investor | N/A | ||||
William R. Gutow (age 71) | Trustee | December 1993 | Private investor and real estate consultant; Capitol Entertainment Management Company (video franchise), Vice Chairman | Atlantic Coast Tan (tanning salons), Vice Chairman (until 2007); Texas Donuts (donut franchise), Vice Chairman (until 2010) | ||||
Michael Hegarty (age 68) | Trustee | December 2004 | Private investor; Rouse Properties Inc. (real estate), Director | N/A | ||||
John P. Kavanaugh (age 58) | Trustee | January 2009 | Private investor | N/A | ||||
J. Dale Sherratt (age 74) | Trustee | June 1989 | Insight Resources, Inc. (acquisition planning specialists), President; Wellfleet Investments (investor in health care companies), Managing General Partner | N/A | ||||
| Laurie J. Thomsen (age 55) | Trustee | March 2005 | Private investor; New Profit, Inc. (venture philanthropy), Executive Partner (until 2010) | The Travelers Companies (insurance), Director | ||||
Robert W. Uek (age 71) | Trustee | January 2006 | Consultant to investment company industry | N/A | ||||
| OFFICERS | ||||||||
John M. Corcoran (k) (age 47) | President | October 2008 | Massachusetts Financial Services Company, Senior Vice President (since October 2008); State Street Bank and Trust (financial services provider), Senior Vice President, (until September 2008) | N/A | ||||
| Christopher R. Bohane (k) (age 39) | Assistant Secretary and Assistant Clerk | July 2005 | Massachusetts Financial Services Company, Vice President and Senior Counsel | N/A | ||||
Kino Clark (k) (age 44) | Assistant Treasurer | January 2012 | Massachusetts Financial Services Company, Vice President | N/A | ||||
Thomas H. Connors (k) (age 53) | Assistant Secretary and Assistant Clerk | September 2012 | Massachusetts Financial Services Company, Vice President and Senior Counsel; Deutsche Investment Management Americas Inc. (financial service provider), Director and Senior Counsel (until 2012) | N/A | ||||
Ethan D. Corey (k) (age 49) | Assistant Secretary and Assistant Clerk | July 2005 | Massachusetts Financial Services Company, Senior Vice President and Associate General Counsel | N/A | ||||
24
Table of Contents
MFS Core Equity Portfolio
Trustees and Officers – continued
Name, Age | Position(s) with Fund | Trustee/Officer Since (h) | Principal Occupations During the Past Five Years | Other Directorships (j) | ||||
David L. DiLorenzo (k) (age 44) | Treasurer | July 2005 | Massachusetts Financial Services Company, Senior Vice President | N/A | ||||
Robyn L. Griffin (age 37) | Assistant Independent Chief Compliance Officer | August 2008 | Griffin Compliance LLC (provider of compliance services), Principal (since August 2008); State Street Corporation (financial services provider), Mutual Fund Administration Assistant Vice President (October 2006 – July 2008) | N/A | ||||
Brian E. Langenfeld (k) (age 39) | Assistant Secretary and Assistant Clerk | June 2006 | Massachusetts Financial Services Company, Vice President and Senior Counsel | N/A | ||||
Susan S. Newton (k) (age 62) | Assistant Secretary and Assistant Clerk | May 2005 | Massachusetts Financial Services Company, Senior Vice President and Associate General Counsel | N/A | ||||
Susan A. Pereira (k) (age 42) | Assistant Secretary and Assistant Clerk | July 2005 | Massachusetts Financial Services Company, Vice President and Senior Counsel | N/A | ||||
Kasey L. Phillips (k) (age 42) | Assistant Treasurer | September 2012 | Massachusetts Financial Services Company, Vice President; Wells Fargo Funds Management, LLC, Senior Vice President, Fund Treasurer (until 2012) | N/A | ||||
Mark N. Polebaum (k) (age 60) | Secretary and Clerk | January 2006 | Massachusetts Financial Services Company, Executive Vice President, General Counsel and Secretary | N/A | ||||
Frank L. Tarantino (age 68) | Independent Chief Compliance Officer | June 2004 | Tarantino LLC (provider of compliance services), Principal | N/A | ||||
Richard S. Weitzel (k) (age 42) | Assistant Secretary and Assistant Clerk | October 2007 | Massachusetts Financial Services Company, Senior Vice President and Associate General Counsel | N/A | ||||
James O. Yost (k) (age 52) | Deputy Treasurer | September 1990 | Massachusetts Financial Services Company, Senior Vice President | N/A | ||||
| (h) | Date first appointed to serve as Trustee/officer of an MFS fund. Each Trustee has served continuously since appointment unless indicated otherwise. For the period from December 15, 2004 until February 22, 2005, Mr. Manning served as Advisory Trustee. For the period October 2008, until January 2012, Mr. Corcoran served as Treasurer of the Funds. Prior to January 2012, Messrs. DiLorenzo and Yost served as Assistant Treasurers of the Funds. |
| (j) | Directorships or trusteeships of companies required to report to the Securities and Exchange Commission (i.e., “public companies”). |
| (k) | “Interested person” of the Trust within the meaning of the Investment Company Act of 1940 (referred to as the 1940 Act), which is the principal federal law governing investment companies like the fund, as a result of position with MFS. The address of MFS is 111 Huntington Avenue, Boston, Massachusetts 02199-7618. |
Each Trustee has been elected by shareholders and each Trustee and officer holds office until his or her successor is chosen and qualified or until his or her earlier death, resignation, retirement or removal. The Trust does not hold annual meetings for the purpose of electing Trustees, and Trustees are not elected for fixed terms. Messrs. Butler, Kavanaugh, Uek and Ms. Thomsen are members of the Trust’s Audit Committee.
Each of the Fund’s Trustees and officers holds comparable positions with certain other funds of which MFS or a subsidiary is the investment adviser or distributor, and, in the case of the officers, with certain affiliates of MFS. As of January 1, 2013, the Trustees served as board members of 143 funds within the MFS Family of Funds.
25
Table of Contents
MFS Core Equity Portfolio
Trustees and Officers – continued
The Statement of Additional Information for the Fund includes further information about the Trustees and is available without charge upon request by calling 1-800-225-2606.
Investment Adviser Massachusetts Financial Services Company 111 Huntington Avenue Boston, MA 02199-7618 | Custodian State Street Bank and Trust 1 Lincoln Street Boston, MA 02111-2900 | |
Distributor MFS Fund Distributors, Inc. 111 Huntington Avenue Boston, MA 02199-7618 | Independent Registered Public Accounting Firm Deloitte & Touche LLP 200 Berkeley Street Boston, MA 02116 | |
Portfolio Manager Joseph MacDougall |
26
Table of Contents
MFS Core Equity Portfolio
BOARD REVIEW OF INVESTMENT ADVISORY AGREEMENT
A discussion regarding the Board’s most recent approval of the fund’s Investment Advisory Agreement with MFS is available by clicking on the fund’s name under “Variable Insurance Portfolios – VIT II” in the “Products” section of the MFS Web site (mfs.com).
PROXY VOTING POLICIES AND INFORMATION
A general description of the MFS funds’ proxy voting policies and procedures is available without charge, upon request, by calling 1-800-225-2606, by visiting the Proxy Voting section of mfs.com or by visiting the SEC’s Web site at http://www.sec.gov.
Information regarding how the fund voted proxies relating to portfolio securities during the most recent twelve-month period ended June 30 is available without charge by visiting the Proxy Voting section of mfs.com or by visiting the SEC’s Web site at http://www.sec.gov.
QUARTERLY PORTFOLIO DISCLOSURE
The fund will file a complete schedule of portfolio holdings with the Securities and Exchange Commission (the Commission) for the first and third quarters of each fiscal year on Form N-Q. The fund’s Form N-Q is available on the EDGAR database on the Commission’s Internet Web site at http://www.sec.gov, and may be reviewed and copied at the:
Public Reference Room
Securities and Exchange Commission
100 F Street, NE, Room 1580
Washington, D.C. 20549
Information on the operation of the Public Reference Room may be obtained by calling the Commission at 1-800-SEC-0330. Copies of the fund’s Form N-Q also may be obtained, upon payment of a duplicating fee, by electronic request at the following e-mail address: publicinfo@sec.gov or by writing the Public Reference Section at the above address.
From time to time, MFS may post important information about the fund or the MFS funds on the MFS web site (mfs.com). This information is available by visiting the “News & Commentary” section of mfs.com or by clicking on the fund’s name under “Variable Insurance Portfolios – VIT II” in the “Products” section of mfs.com.
FEDERAL TAX INFORMATION (unaudited)
The following information is provided pursuant to provisions of the Internal Revenue Code.
For corporate shareholders, 100% of the ordinary income dividends paid during the fiscal year qualify for the corporate dividends received deduction.
27
Table of Contents
rev. 3/11

| Why? | Financial companies choose how they share your personal information. Federal law gives consumers the right to limit some but not all sharing. Federal law also requires us to tell you how we collect, share, and protect your personal information. Please read this notice carefully to understand what we do. |
| What? | The types of personal information we collect and share depend on the product or service you have with us. This information can include:
• Social Security number and account balances • Account transactions and transaction history • Checking account information and wire transfer instructions
When you are no longer our customer, we continue to share your information as described in this notice. |
| How? | All financial companies need to share customers’ personal information to run their everyday business. In the section below, we list the reasons financial companies can share their customers’ personal information; the reasons MFS chooses to share; and whether you can limit this sharing. |
| Reasons we can share your personal information | Does MFS share? | Can you limit this sharing? | ||
For our everyday business purposes – such as to process your transactions, maintain your account(s), respond to court orders and legal investigations, or report to credit bureaus | Yes | No | ||
For our marketing purposes – to offer our products and services to you | No | We don’t share | ||
| For joint marketing with other financial companies | No | We don’t share | ||
For our affiliates’ everyday business purposes – information about your transactions and experiences | No | We don’t share | ||
For our affiliates’ everyday business purposes – information about your creditworthiness | No | We don’t share | ||
| For nonaffiliates to market to you | No | We don’t share |
| Questions? | Call 800-225-2606 or go to mfs.com. |
28
Table of Contents
| Page 2 |
| Who we are | ||
| Who is providing this notice? | MFS Funds, MFS Investment Management, MFS Institutional Advisors, Inc., MFS Fund Distributors, Inc., MFS Heritage Trust Company, and MFS Service Center, Inc. | |
| What we do | ||
| How does MFS protect my personal information? | To protect your personal information from unauthorized access and use, we use security measures that comply with federal law. These measures include procedural, electronic, and physical safeguards for the protection of the personal information we collect about you. | |
| How does MFS collect my personal information? | We collect your personal information, for example, when you
• open an account or provide account information • direct us to buy securities or direct us to sell your securities • make a wire transfer
We also collect your personal information from others, such as credit bureaus, affiliates and other companies. | |
| Why can’t I limit all sharing? | Federal law gives you the right to limit only
• sharing for affiliates’ everyday business purposes – information about your creditworthiness • affiliates from using your information to market to you • sharing for nonaffiliates to market to you
State laws and individual companies may give you additional rights to limit sharing. | |
| Definitions | ||
| Affiliates | Companies related by common ownership or control. They can be financial and nonfinancial companies.
•MFS does not share personal information with affiliates, except for everyday business purposes as described on page one of this notice. | |
| Nonaffiliates | Companies not related by common ownership or control. They can be financial and nonfinancial companies.
•MFS does not share with nonaffiliates so they can market to you. | |
| Joint Marketing | A formal agreement between nonaffiliated financial companies that together market financial products or services to you.
•MFS doesn’t jointly market. | |
| Other important information | ||
| If you own an MFS product or receive an MFS service in the name of a third party such as a bank or broker-dealer, their privacy policy may apply to you instead of ours. | ||
29
Table of Contents
Table of Contents
ANNUAL REPORT
December 31, 2012

MFS® GOVERNMENT SECURITIES PORTFOLIO
MFS® Variable Insurance Trust II

GSS-ANN
Table of Contents
MFS® GOVERNMENT SECURITIES PORTFOLIO
The report is prepared for the general information of contract owners. It is authorized for distribution to prospective investors only when preceded or accompanied by a current prospectus.
NOT FDIC INSURED Ÿ MAY LOSE VALUE Ÿ NO BANK OR CREDIT UNION GUARANTEE Ÿ NOT A DEPOSIT Ÿ NOT INSURED BY ANY FEDERAL GOVERNMENT AGENCY OR NCUA/NCUSIF
Table of Contents
MFS Government Securities Portfolio
LETTER FROM THE CHAIRMAN AND CEO

Dear Contract Owners:
The global market outlook for 2013 is one of cautious optimism. While we are seeing some positive economic trends in the United States, Europe and China, the overall environment remains challenging. In the United States, the recent fiscal cliff agreement was received positively by investors, even though it mostly addressed pressing taxation issues and did not resolve additional concerns, including the need for spending cuts and a large-scale reduction of the federal debt. These issues will be front and center again in the spring. Despite the ongoing uncertainty, economic tailwinds are gathering strength as the U.S. housing and job markets are improving and consumer confidence is rising.
Overseas, the debt crisis continues to weigh heavily on eurozone markets, with even Germany — long an economic stalwart — experiencing some contraction. These ongoing challenges could be a drag on global market performance this year. In Asia, manufacturing activity has accelerated in emerging markets such as China and India, and we are seeing signs of stabilized loan growth in China, a leading indicator of that country’s economic health. In contrast, Japan’s economy is contracting sharply under deflationary pressures. Nevertheless, Japanese markets have responded favorably to early actions by the new government, which appears determined to act aggressively, along with the Bank of Japan, to stimulate growth.
As always, managing risk in the face of uncertainty remains a top priority for investors. At MFS®, our uniquely collaborative investment process revolves around global research and our disciplined risk management approach. Our global team of investment professionals shares ideas and evaluates opportunities across continents, investment disciplines and asset classes — all with a goal of building better insights, and ultimately better results, for our clients.
We remain mindful of the many economic challenges investors face today, and believe it is more important than ever to maintain a long-term view, employ time-tested principles, such as asset allocation and diversification, and work closely with investment advisors to identify and pursue the most suitable opportunities.
Respectfully,

Robert J. Manning
Chairman and Chief Executive Officer
MFS Investment Management®
February 15, 2013
The opinions expressed in this letter are subject to change, may not be relied upon for investment advice, and no forecasts can be guaranteed.
1
Table of Contents
MFS Government Securities Portfolio
Portfolio structure (i)
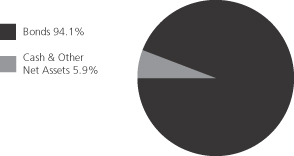
| Fixed income sectors (i) | ||||
| Mortgage-Backed Securities | 49.9% | |||
| U.S. Treasury Securities | 36.1% | |||
| U.S. Government Agencies | 5.7% | |||
| Commercial Mortgage-Backed Securities | 1.3% | |||
| High Grade Corporates | 1.1% |
| Composition including fixed income credit quality (a)(i) | ||||
| AAA | 1.0% | |||
| AA | 0.7% | |||
| A | 0.4% | |||
| BBB | 0.3% | |||
| U.S. Government | 36.1% | |||
| Federal Agencies | 55.6% | |||
| Cash & Other | 5.9% | |||
| Portfolio facts (i) | ||||
| Average Duration (d) | 4.0 | |||
| Average Effective Maturity (m) | 5.3 yrs. | |||
| (a) | For all securities other than those specifically described below, ratings are assigned to underlying securities utilizing ratings from Moody’s, Fitch, and Standard & Poor’s rating agencies and applying the following hierarchy: If all three agencies provide a rating, the middle rating (after dropping the highest and lowest ratings) is assigned; if two of the three agencies rate a security, the lower of the two is assigned. Ratings are shown in the S&P and Fitch scale (e.g., AAA). Securities rated BBB or higher are considered investment grade. All ratings are subject to change. U.S. Government includes securities issued by the U.S. Department of the Treasury. Federal Agencies includes rated and unrated U.S. Agency fixed-income securities, U.S. Agency mortgage-backed securities, and collateralized mortgage obligations of U.S. Agency mortgage-backed securities. Cash & Other includes cash, other assets less liabilities, offsets to derivative positions, and short-term securities. The fund may not hold all of these instruments. The fund is not rated by these agencies. |
| (d) | Duration is a measure of how much a bond’s price is likely to fluctuate with general changes in interest rates, e.g., if rates rise 1.00%, a bond with a 5-year duration is likely to lose about 5.00% of its value due to the interest rate move. |
| (i) | For purposes of this presentation, the components include the market value of securities, and reflect the impact of the equivalent exposure of derivative positions, if any. These amounts may be negative from time to time. The bond component will include any accrued interest amounts. Equivalent exposure is a calculated amount that translates the derivative position into a reasonable approximation of the amount of the underlying asset that the portfolio would have to hold at a given point in time to have the same price sensitivity that results from the portfolio’s ownership of the derivative contract. When dealing with derivatives, equivalent exposure is a more representative measure of the potential impact of a position on portfolio performance than market value. Where the fund holds convertible bonds, these are treated as part of the equity portion of the portfolio. |
| (m) | In determining an instrument’s effective maturity for purposes of calculating the fund’s dollar-weighted average effective maturity, MFS uses the instrument’s stated maturity or, if applicable, an earlier date on which MFS believes it is probable that a maturity-shortening device (such as a put, pre-refunding or prepayment) will cause the instrument to be repaid. Such an earlier date can be substantially shorter than the instrument’s stated maturity. |
Percentages are based on net assets as of 12/31/12.
The portfolio is actively managed and current holdings may be different.
2
Table of Contents
MFS Government Securities Portfolio
Summary of Results
For the twelve months ended December 31, 2012, Initial Class shares of the MFS Government Securities Portfolio (“fund”) provided a total return of 2.53%, while Service Class shares of the fund provided a total return of 2.27%. These compare with a return of 2.27% over the same period for the fund’s benchmark, the Barclays U.S. Government/Mortgage Bond Index.
Market Environment
The beginning of the period was characterized by a risk-on sentiment as a result of additional liquidity measures by the Federal Reserve Bank (“Fed”) and the European Central Bank (“ECB”) as well as a commensurate improvement in macroeconomic conditions. During this time, global equity valuations rose, credit spreads contracted, and high-quality sovereign yields increased modestly.
During the middle of the period, however, conditions worsened, driven by broadly weaker global macroeconomic indicators, as well as renewed concerns over the eurozone’s capacity and determination to address its ongoing crisis. Despite this deterioration, broad market sentiment remained relatively resilient as equity markets generally maintained gains and credit spreads did not indicate deterioration.
However, this renewed weakness in the fundamentals precipitated a further round of monetary easing by both the Fed (through a third round of quantitative easing) and the ECB (through a new bond purchase facility) in the second half of the period, which soon instilled additional confidence in risk markets. Nonetheless, towards the end of the period, weaker equity earnings reports and declining forward guidance caused market sentiment to soften. In addition, as we moved toward year end, the fiscal cliff negotiations between the Republicans in the U.S. Congress and President Obama were a particular source of market attention, where uncertainty surrounding the fiscal negotiations continued right up to the end-of-year deadline.
Contributors to Performance
Relative to the Barclays U.S. Government/Mortgage Bond Index, bond selection was a primary contributor to relative results. The fund’s exposure to corporate debt in the financial sector, which is not represented in the benchmark, also benefited relative results as this sector posted strong returns for the reporting period.
The portion of the fund’s return derived from yield, which was greater than that of the benchmark, was another positive factor for relative performance.
Detractors from Performance
The fund’s longer duration (d) stance during the middle portion of the reporting period weighed on relative results.
Respectfully,
Geoffrey Schechter
Portfolio Manager
| (d) | Duration is a measure of how much a bond’s price is likely to fluctuate with general changes in interest rates, e.g., if rates rise 1.00%, a bond with a 5-year duration is likely to lose about 5.00% of its value. |
The views expressed in this report are those of the portfolio manager only through the end of the period of the report as stated on the cover and do not necessarily reflect the views of MFS or any other person in the MFS organization. These views are subject to change at any time based on market or other conditions, and MFS disclaims any responsibility to update such views. These views may not be relied upon as investment advice or an indication of trading intent on behalf of any MFS portfolio. References to specific securities are not recommendations of such securities, and may not be representative of any MFS portfolio’s current or future investments.
3
Table of Contents
MFS Government Securities Portfolio
PERFORMANCE SUMMARY THROUGH 12/31/12
The following chart illustrates the historical performance of the fund in comparison to its benchmark(s). Benchmarks are unmanaged and may not be invested in directly. Benchmark returns do not reflect any fees or expenses. The performance of other share classes will be greater than or less than that of the class depicted below. (See Notes to Performance Summary.)
Performance data shown represents past performance and is no guarantee of future results. Investment return and principal value fluctuate so your units, when sold, may be worth more or less than the original cost; current performance may be lower or higher than quoted. The performance shown does not reflect the deduction of taxes, if any, that a contract holder would pay on fund distributions or the redemption of contract units. The returns for the fund shown also do not reflect the deduction of expenses associated with variable products, such as mortality and expense risk charges, separate account charges, and sales charges imposed by the insurance company separate accounts. Such expenses would reduce the overall returns shown.
Growth of a Hypothetical $10,000 Investment
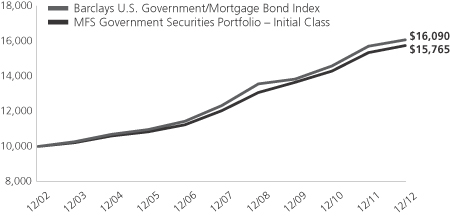
Total Returns through 12/31/12
Average annual total returns
| Share Class | Class inception date | 1-yr | 5-yr | 10-yr | ||||||||
| Initial Class | 6/12/85 | 2.53% | 5.52% | 4.66% | ||||||||
| Service Class | 8/24/01 | 2.27% | 5.26% | 4.40% | ||||||||
| Comparative benchmark | ||||||||||||
| Barclays U.S. Government/Mortgage Bond Index (f) | 2.27% | 5.46% | 4.87% | |||||||||
| (f) | Source: FactSet Research Systems Inc. |
Benchmark Definition
Barclays U.S. Government/Mortgage Bond Index – measures debt issued by the U.S. Government, and its agencies, as well as mortgage-backed pass-through securities of Ginnie Mae (GNMA), Fannie Mae (FNMA), and Freddie Mac (FHLMC).
It is not possible to invest directly in an index.
Notes to Performance Summary
Average annual total return represents the average annual change in value for each share class for the periods presented.
Performance results reflect any applicable expense subsidies and waivers in effect during the periods shown. Without such subsidies and waivers the fund’s performance results would be less favorable. Please see the prospectus and financial statements for complete details. All results are historical and assume the reinvestment of any dividends and capital gains distributions.
Performance results do not include adjustments made for financial reporting purposes in accordance with U.S. generally accepted accounting principles and may differ from amounts reported in the financial highlights.
From time to time the fund may receive proceeds from litigation settlements, without which performance would be lower.
4
Table of Contents
MFS Government Securities Portfolio
Fund Expenses Borne by the Contract Holders During the Period,
July 1, 2012 through December 31, 2012
As a contract holder of the fund, you incur ongoing costs, including management fees; distribution and/or service (12b-1) fees; and other fund expenses. This example is intended to help you understand your ongoing costs (in dollars) of investing in the fund and to compare these costs with the ongoing costs of investing in other mutual funds.
The example is based on an investment of $1,000 invested at the beginning of the period and held for the entire period July 1, 2012 through December 31, 2012.
Actual Expenses
The first line for each share class in the following table provides information about actual account values and actual expenses. You may use the information in this line, together with the amount you invested, to estimate the expenses that you paid over the period. Simply divide your account value by $1,000 (for example, an $8,600 account value divided by $1,000 = 8.6), then multiply the result by the number in the first line under the heading entitled “Expenses Paid During Period” to estimate the expenses you paid on your account during this period.
Hypothetical Example for Comparison Purposes
The second line for each share class in the following table provides information about hypothetical account values and hypothetical expenses based on the fund’s actual expense ratio and an assumed rate of return of 5% per year before expenses, which is not the fund’s actual return. The hypothetical account values and expenses may not be used to estimate the actual ending account balance or expenses you paid for the period. You may use this information to compare the ongoing costs of investing in the fund and other funds. To do so, compare this 5% hypothetical example with the 5% hypothetical examples that appear in the shareholder reports of the other funds.
Please note that the expenses shown in the table are meant to highlight the fund’s ongoing costs only and do not take into account the fees and expenses imposed under the variable contracts through which your investment in the fund is made. Therefore, the second line for each share class in the table is useful in comparing ongoing costs associated with an investment in vehicles (such as the fund) which fund benefits under variable annuity and variable life insurance contracts and to qualified pension and retirement plans only, and will not help you determine the relative total costs of investing in the fund through variable annuity and variable life insurance contracts. If the fees and expenses imposed under the variable contracts were included, your costs would have been higher.
| Share Class | Annualized Expense Ratio | Beginning Account Value 7/01/12 | Ending Account Value | Expenses Paid During Period (p) 7/01/12-12/31/12 | ||||||||||||||
| Initial Class | Actual | 0.60% | $1,000.00 | $1,009.10 | $3.03 | |||||||||||||
| Hypothetical (h) | 0.60% | $1,000.00 | $1,022.12 | $3.05 | ||||||||||||||
| Service Class | Actual | 0.85% | $1,000.00 | $1,007.90 | $4.29 | |||||||||||||
| Hypothetical (h) | 0.85% | $1,000.00 | $1,020.86 | $4.32 | ||||||||||||||
| (h) | 5% class return per year before expenses. |
| (p) | Expenses paid are equal to each class’s annualized expense ratio, as shown above, multiplied by the average account value over the period, multiplied by the number of days in the period, divided by the number of days in the year. |
5
Table of Contents
MFS Government Securities Portfolio
PORTFOLIO OF INVESTMENTS – 12/31/12
The Portfolio of Investments is a complete list of all securities owned by your fund. It is categorized by broad-based asset classes.
| Issuer | Shares/Par | Value ($) | ||||||
| BONDS – 93.7% | ||||||||
| Agency – Other – 3.8% | ||||||||
| Financing Corp., 9.4%, 2018 | $ | 6,495,000 | $ | 9,083,316 | ||||
| Financing Corp., 9.8%, 2018 | 7,760,000 | 11,098,158 | ||||||
| Financing Corp., 10.35%, 2018 | 3,915,000 | 5,802,300 | ||||||
| Financing Corp., STRIPS, 0%, 2017 | 10,160,000 | 9,542,770 | ||||||
|
| |||||||
| $ | 35,526,544 | |||||||
|
| |||||||
| Asset-Backed & Securitized – 1.2% | ||||||||
| Citigroup/Deutsche Bank Commercial Mortgage Trust, 5.322%, 2049 | $ | 1,860,000 | $ | 2,133,625 | ||||
| Commercial Mortgage Pass-Through Certificates, “A4”, 5.306%, 2046 | 3,870,649 | 4,447,546 | ||||||
| JPMorgan Chase Commercial Mortgage Securities Corp., “A3”, FRN, 5.929%, 2051 | 2,223,578 | 2,365,436 | ||||||
| JPMorgan Chase Commercial Mortgage Securities Corp., “A4”, FRN, 5.811%, 2049 | 2,275,833 | 2,653,963 | ||||||
|
| |||||||
| $ | 11,600,570 | |||||||
|
| |||||||
| Local Authorities – 0.9% | ||||||||
| Nashville & Davidson County, TN, Metropolitan Government Convention Center Authority (Build America Bonds), 6.731%, 2043 | $ | 2,225,000 | $ | 2,688,089 | ||||
| Port Authority NY & NJ (168th Series), 4.926%, 2051 | 2,735,000 | 3,030,517 | ||||||
| San Francisco, CA, City & County Public Utilities Commission, Water Rev. (Build America Bonds), 6%, 2040 | 320,000 | 398,195 | ||||||
| State of California (Build America Bonds), 7.625%, 2040 | 435,000 | 628,445 | ||||||
| University of California Rev. (Build America Bonds), 5.77%, 2043 | 1,345,000 | 1,658,802 | ||||||
|
| |||||||
| $ | 8,404,048 | |||||||
|
| |||||||
| Medical & Health Technology & Services – 0.1% | ||||||||
| Catholic Health Initiatives, 2.95%, 2022 | $ | 1,504,000 | $ | 1,518,062 | ||||
|
| |||||||
| Mortgage-Backed – 49.8% | ||||||||
| Fannie Mae, 4.325%, 2013 | $ | 335,751 | $ | 336,676 | ||||
| Fannie Mae, 4.557%, 2013 | 431,177 | 431,559 | ||||||
| Fannie Mae, 4.579%, 2013 | 693,239 | 693,852 | ||||||
| Fannie Mae, 5%, 2013-2041 | 30,475,217 | 33,145,351 | ||||||
| Fannie Mae, 5.06%, 2013 | 891,690 | 913,673 | ||||||
| Fannie Mae, 5.14%, 2013 | 1,717,130 | 1,735,095 | ||||||
| Fannie Mae, 4.561%, 2014 | 914,649 | 946,433 | ||||||
| Fannie Mae, 4.6%, 2014 | 880,005 | 905,026 | ||||||
| Fannie Mae, 4.607%, 2014 | 3,170,293 | 3,261,362 | ||||||
| Fannie Mae, 4.77%, 2014 | 751,147 | 782,783 | ||||||
| Fannie Mae, 4.82%, 2014-2015 | 904,235 | 965,498 | ||||||
| Fannie Mae, 4.825%, 2014 | 4,865,787 | 5,075,400 | ||||||
| Fannie Mae, 4.858%, 2014 | 2,950,717 | 2,980,516 | ||||||
| Fannie Mae, 4.88%, 2014-2020 | 809,728 | 883,671 | ||||||
| Issuer | Shares/Par | Value ($) | ||||||
| BONDS – continued | ||||||||
| Mortgage-Backed – continued | ||||||||
| Fannie Mae, 5.1%, 2014-2019 | $ | 1,215,645 | $ | 1,297,930 | ||||
| Fannie Mae, 2.38%, 2015 | 625,000 | 648,467 | ||||||
| Fannie Mae, 4.56%, 2015 | 1,141,448 | 1,223,782 | ||||||
| Fannie Mae, 4.62%, 2015 | 1,553,403 | 1,643,786 | ||||||
| Fannie Mae, 4.665%, 2015 | 772,134 | 821,831 | ||||||
| Fannie Mae, 4.74%, 2015 | 725,667 | 775,745 | ||||||
| Fannie Mae, 4.78%, 2015 | 878,004 | 944,831 | ||||||
| Fannie Mae, 4.79%, 2015 | 1,008,549 | 1,086,541 | ||||||
| Fannie Mae, 4.81%, 2015 | 997,520 | 1,073,777 | ||||||
| Fannie Mae, 4.815%, 2015 | 907,165 | 972,065 | ||||||
| Fannie Mae, 4.85%, 2015 | 553,372 | 588,785 | ||||||
| Fannie Mae, 4.856%, 2015 | 299,801 | 322,350 | ||||||
| Fannie Mae, 4.87%, 2015 | 582,193 | 624,106 | ||||||
| Fannie Mae, 4.89%, 2015 | 737,264 | 786,671 | ||||||
| Fannie Mae, 4.907%, 2015 | 1,197,935 | 1,295,072 | ||||||
| Fannie Mae, 4.997%, 2015 | 154,257 | 168,991 | ||||||
| Fannie Mae, 5.464%, 2015 | 3,038,538 | 3,337,427 | ||||||
| Fannie Mae, 5.152%, 2016 | 1,762,400 | 1,963,774 | ||||||
| Fannie Mae, 5.35%, 2016 | 52,290 | 58,328 | ||||||
| Fannie Mae, 5.424%, 2016 | 1,781,869 | 2,000,513 | ||||||
| Fannie Mae, 5.725%, 2016 | 1,627,076 | 1,843,539 | ||||||
| Fannie Mae, 6.5%, 2016-2037 | 3,448,502 | 3,892,611 | ||||||
| Fannie Mae, 1.18%, 2017 | 897,005 | 909,756 | ||||||
| Fannie Mae, 4.992%, 2017 | 3,263,354 | 3,476,446 | ||||||
| Fannie Mae, 5.5%, 2017-2038 | 47,947,513 | 52,379,202 | ||||||
| Fannie Mae, 6%, 2017-2037 | 6,071,704 | 6,651,863 | ||||||
| Fannie Mae, 3.739%, 2018 | 642,306 | 723,593 | ||||||
| Fannie Mae, 3.8%, 2018 | 642,663 | 716,552 | ||||||
| Fannie Mae, 3.99%, 2018 | 600,000 | 677,002 | ||||||
| Fannie Mae, 4%, 2018 | 684,730 | 770,396 | ||||||
| Fannie Mae, 4.19%, 2018 | 391,619 | 443,680 | ||||||
| Fannie Mae, 5.16%, 2018 | 1,374,611 | 1,506,782 | ||||||
| Fannie Mae, 5.68%, 2018 | 501,158 | 572,646 | ||||||
| Fannie Mae, 1.97%, 2019 | 399,405 | 412,504 | ||||||
| Fannie Mae, 4.5%, 2019-2041 | 15,038,908 | 16,374,586 | ||||||
| Fannie Mae, 4.67%, 2019 | 525,000 | 612,216 | ||||||
| Fannie Mae, 4.83%, 2019 | 383,666 | 445,333 | ||||||
| Fannie Mae, 4.877%, 2019 | 2,552,022 | 2,966,683 | ||||||
| Fannie Mae, 5.05%, 2019 | 321,606 | 369,668 | ||||||
| Fannie Mae, 5.6%, 2019 | 591,336 | 668,298 | ||||||
| Fannie Mae, 3.87%, 2020 | 747,158 | 844,048 | ||||||
| Fannie Mae, 4.14%, 2020 | 460,556 | 527,319 | ||||||
| Fannie Mae, 7.5%, 2022-2031 | 473,969 | 577,321 | ||||||
| Fannie Mae, 4.5%, 2025 | 665,149 | 717,751 | ||||||
| Fannie Mae, 3%, 2027 | 1,289,084 | 1,362,442 | ||||||
| Fannie Mae, 5.5%, 2037 | 3,030,000 | 3,305,012 | ||||||
| Fannie Mae, 3.5%, 2042 | 3,919,543 | 4,219,561 | ||||||
| Fannie Mae, STRIPS, 1.99%, 2019 (i) | 1,000,000 | 1,033,050 | ||||||
| Fannie Mae, TBA, 5%, 2028 | 4,800,000 | 5,193,750 | ||||||
| Fannie Mae, TBA, 3%, 2043 | 22,156,000 | 23,187,312 | ||||||
| Fannie Mae, TBA, 3.5%, 2043 | 4,310,000 | 4,586,951 | ||||||
| Fannie Mae, TBA, 4%, 2043 | 6,105,000 | 6,543,797 | ||||||
6
Table of Contents
MFS Government Securities Portfolio
Portfolio of Investments – continued
| Issuer | Shares/Par | Value ($) | ||||||
| BONDS – continued | ||||||||
| Mortgage-Backed – continued | ||||||||
| Fannie Mae, TBA, 4.5%, 2043 | $ | 13,500,000 | $ | 14,574,199 | ||||
| Fannie Mae, TBA, 5.5%, 2043 | 4,800,000 | 5,217,000 | ||||||
| Freddie Mac, 1.655%, 2016 | 2,969,038 | 3,059,834 | ||||||
| Freddie Mac, 5%, 2016-2040 | 7,906,105 | 8,500,036 | ||||||
| Freddie Mac, 3.882%, 2017 | 2,158,000 | 2,425,178 | ||||||
| Freddie Mac, 2.303%, 2018 | 2,800,000 | 2,947,221 | ||||||
| Freddie Mac, 3.154%, 2018 | 2,151,000 | 2,352,942 | ||||||
| Freddie Mac, 1.883%, 2019 | 5,750,000 | 5,900,558 | ||||||
| Freddie Mac, 2.086%, 2019 | 2,800,000 | 2,908,749 | ||||||
| Freddie Mac, 4.186%, 2019 | 814,000 | 939,071 | ||||||
| Freddie Mac, 5.085%, 2019 | 3,191,000 | 3,782,857 | ||||||
| Freddie Mac, 6%, 2019-2038 | 14,172,241 | 15,688,545 | ||||||
| Freddie Mac, 3.32%, 2020 | 942,076 | 1,023,867 | ||||||
| Freddie Mac, 4.224%, 2020 | 1,911,350 | 2,220,131 | ||||||
| Freddie Mac, 4.251%, 2020 | 1,449,000 | 1,674,351 | ||||||
| Freddie Mac, 4.5%, 2022-2040 | 4,579,817 | 4,907,335 | ||||||
| Freddie Mac, 5.5%, 2022-2036 | 7,675,778 | 8,460,830 | ||||||
| Freddie Mac, 4%, 2025 | 2,587,670 | 2,735,706 | ||||||
| Freddie Mac, 6.5%, 2032-2037 | 2,239,662 | 2,561,214 | ||||||
| Freddie Mac, 3.5%, 2041-2042 | 4,777,569 | 5,134,539 | ||||||
| Freddie Mac, TBA, 3%, 2043 | 20,890,000 | 21,794,146 | ||||||
| Freddie Mac, TBA, 2.5%, 2028 | 30,699,000 | 32,015,943 | ||||||
| Freddie Mac, TBA, 3.5%, 2043 | 23,960,000 | 25,442,063 | ||||||
| Ginnie Mae, 5.5%, 2033-2042 | 6,787,065 | 7,482,396 | ||||||
| Ginnie Mae, 4%, 2039-2040 | 1,351,863 | 1,490,827 | ||||||
| Ginnie Mae, 4.5%, 2039-2041 | 12,720,691 | 14,069,683 | ||||||
| Ginnie Mae, 3.5%, 2041-2042 | 3,526,617 | 3,864,831 | ||||||
| Ginnie Mae, 5.612%, 2058 | 3,918,317 | 4,183,893 | ||||||
| Ginnie Mae, 6.357%, 2058 | 1,983,085 | 2,145,601 | ||||||
| Ginnie Mae, TBA, 3%, 2043 | 32,340,000 | 34,344,278 | ||||||
| Ginnie Mae, TBA, 3.5%, 2043 | 1,500,000 | 1,626,914 | ||||||
|
| |||||||
| $ | 468,678,075 | |||||||
|
| |||||||
| U.S. Government Agencies and Equivalents – 1.9% | ||||||||
| Aid-Egypt, 4.45%, 2015 | $ | 3,162,000 | $ | 3,501,030 | ||||
| Freddie Mac, 2.375%, 2022 | 3,990,000 | 4,168,253 | ||||||
| Small Business Administration, 6.35%, 2021 | 596,396 | 666,133 | ||||||
| Small Business Administration, 6.34%, 2021 | 468,715 | 521,530 | ||||||
| Small Business Administration, 6.44%, 2021 | 802,073 | 900,234 | ||||||
| Small Business Administration, 6.625%, 2021 | 1,087,652 | 1,216,483 | ||||||
| Small Business Administration, 6.07%, 2022 | 662,963 | 738,475 | ||||||
| Small Business Administration, 4.98%, 2023 | 799,059 | 889,600 | ||||||
| Small Business Administration, 4.77%, 2024 | 1,532,746 | 1,711,314 | ||||||
| Small Business Administration, 5.52%, 2024 | 960,150 | 1,089,080 | ||||||
| Small Business Administration, 4.99%, 2024 | 128,110 | 144,574 | ||||||
| Issuer | Shares/Par | Value ($) | ||||||
| BONDS – continued | ||||||||
| U.S. Government Agencies and Equivalents – continued | ||||||||
| Small Business Administration, 5.11%, 2025 | $ | 1,235,835 | $ | 1,391,114 | ||||
| U.S. Department of Housing & Urban Development, 6.36%, 2016 | 467,000 | 467,826 | ||||||
| U.S. Department of Housing & Urban Development, 6.59%, 2016 | 239,000 | 239,340 | ||||||
|
| |||||||
| $ | 17,644,986 | |||||||
|
| |||||||
| U.S. Treasury Obligations – 36.0% | ||||||||
| U.S. Treasury Bonds, 9.25%, 2016 | $ | 19,000 | $ | 24,215 | ||||
| U.S. Treasury Bonds, 7.5%, 2016 | 218,000 | 276,281 | ||||||
| U.S. Treasury Bonds, 7.875%, 2021 | 177,000 | 266,385 | ||||||
| U.S. Treasury Bonds, 6.25%, 2023 | 2,891,000 | 4,144,971 | ||||||
| U.S. Treasury Bonds, 6%, 2026 | 2,699,000 | 3,905,537 | ||||||
| U.S. Treasury Bonds, 6.75%, 2026 | 1,862,000 | 2,876,790 | ||||||
| U.S. Treasury Bonds, 6.375%, 2027 | 326,000 | 493,941 | ||||||
| U.S. Treasury Bonds, 5.25%, 2029 | 284,000 | 393,296 | ||||||
| U.S. Treasury Bonds, 4.5%, 2036 | 1,226,000 | 1,613,531 | ||||||
| U.S. Treasury Bonds, 5%, 2037 | 488,000 | 688,538 | ||||||
| U.S. Treasury Bonds, 4.375%, 2038 | 1,501,000 | 1,947,548 | ||||||
| U.S. Treasury Bonds, 4.5%, 2039 | 32,648,500 | 43,264,356 | ||||||
| U.S. Treasury Notes, 1.375%, 2013 | 57,000 | 57,025 | ||||||
| U.S. Treasury Notes, 1.375%, 2013 | 648,000 | 649,645 | ||||||
| U.S. Treasury Notes, 4%, 2014 | 211,000 | 219,943 | ||||||
| U.S. Treasury Notes, 1.875%, 2014 | 52,060,000 | 53,062,571 | ||||||
| U.S. Treasury Notes, 1.875%, 2014 | 12,853,000 | 13,134,661 | ||||||
| U.S. Treasury Notes, 4%, 2015 | 6,718,000 | 7,244,947 | ||||||
| U.S. Treasury Notes, 2.125%, 2015 | 34,052,000 | 35,528,461 | ||||||
| U.S. Treasury Notes, 2.625%, 2016 | 201,000 | 215,573 | ||||||
| U.S. Treasury Notes, 0.875%, 2016 | 129,431,000 | 131,210,676 | ||||||
| U.S. Treasury Notes, 2.625%, 2018 | 9,719,000 | 10,651,421 | ||||||
| U.S. Treasury Notes, 2.75%, 2019 | 5,047,400 | 5,588,814 | ||||||
| U.S. Treasury Notes, 3.125%, 2019 | 1,637,000 | 1,853,903 | ||||||
| U.S. Treasury Notes, 3.5%, 2020 | 4,084,000 | 4,741,589 | ||||||
| U.S. Treasury Notes, 2.625%, 2020 | 3,987,000 | 4,378,224 | ||||||
| U.S. Treasury Notes, 3.125%, 2021 | 1,901,000 | 2,155,704 | ||||||
| U.S. Treasury Notes, 1.75%, 2022 | 8,057,000 | 8,126,870 | ||||||
|
| |||||||
| $ | 338,715,416 | |||||||
|
| |||||||
| Total Bonds (Identified Cost, $842,512,666) | $ | 882,087,701 | ||||||
|
| |||||||
| MONEY MARKET FUNDS – 27.0% | ||||||||
| MFS Institutional Money Market Portfolio, 0.16%, at Cost and Net Asset Value (v) | 254,827,213 | $ | 254,827,213 | |||||
|
| |||||||
| Total Investments (Identified Cost, $1,097,339,879) | $ | 1,136,914,914 | ||||||
|
| |||||||
| OTHER ASSETS, LESS LIABILITIES – (20.7)% | (195,196,930 | ) | ||||||
|
| |||||||
| Net Assets – 100.0% | $ | 941,717,984 | ||||||
|
| |||||||
7
Table of Contents
MFS Government Securities Portfolio
Portfolio of Investments – continued
| (i) | Interest only security for which the fund receives interest on notional principal (Par amount). Par amount shown is the notional principal and does not reflect the cost of the security. |
| (v) | Underlying affiliated fund that is available only to investment companies managed by MFS. The rate quoted for the MFS Institutional Money Market Portfolio is the annualized seven-day yield of the fund at period end. |
The following abbreviations are used in this report and are defined:
| FRN | Floating Rate Note. Interest rate resets periodically and may not be the rate reported at period end. |
| STRIPS | Separate Trading of Registered Interest and Principal of Securities |
| TBA | To Be Announced |
See Notes to Financial Statements
8
Table of Contents
MFS Government Securities Portfolio
FINANCIAL STATEMENTS | STATEMENT OF ASSETS AND LIABILITIES
This statement represents your fund’s balance sheet, which details the assets and liabilities comprising the total value of the fund.
At 12/31/12 | ||||||||
Assets | ||||||||
Investments – | ||||||||
Non-affiliated issuers, at value (identified cost, $842,512,666) | $882,087,701 | |||||||
Underlying affiliated funds, at cost and value | 254,827,213 | |||||||
Total investments, at value (identified cost, $1,097,339,879) | $1,136,914,914 | |||||||
Receivables for | ||||||||
TBA sale commitments | 19,791,805 | |||||||
Fund shares sold | 98,711 | |||||||
Interest | 3,777,825 | |||||||
Other assets | 7,048 | |||||||
Total assets | $1,160,590,303 | |||||||
Liabilities | ||||||||
Payables for | ||||||||
Investments purchased | $20,106,879 | |||||||
TBA purchase commitments | 197,641,690 | |||||||
Fund shares reacquired | 979,116 | |||||||
Payable to affiliates | ||||||||
Investment adviser | 58,080 | |||||||
Distribution and/or service fees | 11,068 | |||||||
Payable for independent Trustees’ compensation | 8 | |||||||
Accrued expenses and other liabilities | 75,478 | |||||||
Total liabilities | $218,872,319 | |||||||
Net assets | $941,717,984 | |||||||
Net assets consist of | ||||||||
Paid-in capital | $883,503,176 | |||||||
Unrealized appreciation (depreciation) on investments | 39,575,035 | |||||||
Accumulated gain (loss) on investments | (215,380 | ) | ||||||
Undistributed net investment income | 18,855,153 | |||||||
Net assets | $941,717,984 | |||||||
Shares of beneficial interest outstanding | 70,017,047 |
| Net assets | Shares outstanding | Net asset value per share | ||||||||||
Initial Class | $537,396,685 | 39,828,725 | $13.49 | |||||||||
Service Class | 404,321,299 | 30,188,322 | 13.39 | |||||||||
See Notes to Financial Statements
9
Table of Contents
MFS Government Securities Portfolio
FINANCIAL STATEMENTS | STATEMENT OF OPERATIONS
This statement describes how much your fund earned in investment income and accrued in expenses. It also describes any gains and/or losses generated by fund operations.
Year ended 12/31/12 | ||||||||
Net investment income | ||||||||
Income | ||||||||
Interest | $20,593,533 | |||||||
Dividends | 98,629 | |||||||
Total investment income | $20,692,162 | |||||||
Expenses | ||||||||
Management fee | $3,824,166 | |||||||
Distribution and/or service fees | 1,034,304 | |||||||
Administrative services fee | 109,052 | |||||||
Independent Trustees’ compensation | 22,430 | |||||||
Custodian fee | 71,023 | |||||||
Shareholder communications | 37,120 | |||||||
Audit and tax fees | 52,208 | |||||||
Legal fees | 10,919 | |||||||
Miscellaneous | 35,393 | |||||||
Total expenses | $5,196,615 | |||||||
Fees paid indirectly | (126 | ) | ||||||
Reduction of expenses by investment adviser | (2,400 | ) | ||||||
Net expenses | $5,194,089 | |||||||
Net investment income | $15,498,073 | |||||||
Realized and unrealized gain (loss) on investments | ||||||||
Realized gain (loss) (identified cost basis) | ||||||||
Investments | $8,964,734 | |||||||
Futures contracts | 111,123 | |||||||
Net realized gain (loss) on investments | $9,075,857 | |||||||
Change in unrealized appreciation (depreciation) on investments | $(9,104,959 | ) | ||||||
Net realized and unrealized gain (loss) on investments | $(29,102 | ) | ||||||
Change in net assets from operations | $15,468,971 |
See Notes to Financial Statements
10
Table of Contents
MFS Government Securities Portfolio
FINANCIAL STATEMENTS | STATEMENTS OF CHANGES IN NET ASSETS
These statements describe the increases and/or decreases in net assets resulting from operations, any distributions, and any shareholder transactions.
For years ended 12/31 | 2012 | 2011 | ||||||
Change in net assets | ||||||||
From operations | ||||||||
Net investment income | $15,498,073 | $17,572,400 | ||||||
Net realized gain (loss) on investments | 9,075,857 | 7,435,824 | ||||||
Net unrealized gain (loss) on investments | (9,104,959 | ) | 20,361,037 | |||||
Change in net assets from operations | $15,468,971 | $45,369,261 | ||||||
Distributions declared to shareholders | ||||||||
From net investment income | $(19,810,017 | ) | $(23,218,426 | ) | ||||
From net realized gain on investments | (5,909,509 | ) | (228,585 | ) | ||||
Total distributions declared to shareholders | $(25,719,526 | ) | $(23,447,011 | ) | ||||
Change in net assets from fund share transactions | $267,475,908 | $(6,053,896 | ) | |||||
Total change in net assets | $257,225,353 | $15,868,354 | ||||||
| Net assets | ||||||||
At beginning of period | 684,492,631 | 668,624,277 | ||||||
At end of period (including undistributed net investment income of $18,855,153 and | $941,717,984 | $684,492,631 |
See Notes to Financial Statements
11
Table of Contents
MFS Government Securities Portfolio
FINANCIAL STATEMENTS | FINANCIAL HIGHLIGHTS
The financial highlights table is intended to help you understand the fund’s financial performance for the past 5 years. Certain information reflects financial results for a single fund share. The total returns in the table represent the rate by which an investor would have earned (or lost) on an investment in the fund share class (assuming reinvestment of all distributions) held for the entire period.
| Initial Class | Years ended 12/31 | |||||||||||||||||||
| 2012 | 2011 | 2010 | 2009 | 2008 | ||||||||||||||||
Net asset value, beginning of period | $13.72 | $13.27 | $13.14 | $13.23 | $12.89 | |||||||||||||||
| Income (loss) from investment operations | ||||||||||||||||||||
Net investment income (d) | $0.32 | $0.39 | $0.45 | $0.50 | $0.55 | |||||||||||||||
Net realized and unrealized gain (loss) on investments | 0.03 | (g) | 0.58 | 0.16 | 0.08 | 0.51 | ||||||||||||||
Total from investment operations | $0.35 | $0.97 | $0.61 | $0.58 | $1.06 | |||||||||||||||
| Less distributions declared to shareholders | ||||||||||||||||||||
From net investment income | $(0.45 | ) | $(0.52 | ) | $(0.48 | ) | $(0.67 | ) | $(0.72 | ) | ||||||||||
From net realized gain on investments | (0.13 | ) | (0.00 | )(w) | — | — | — | |||||||||||||
Total distributions declared to shareholders | $(0.58 | ) | $(0.52 | ) | $(0.48 | ) | $(0.67 | ) | $(0.72 | ) | ||||||||||
Net asset value, end of period (x) | $13.49 | $13.72 | $13.27 | $13.14 | $13.23 | |||||||||||||||
Total return (%) (k)(r)(s)(x) | 2.53 | 7.40 | 4.75 | 4.49 | 8.55 | |||||||||||||||
| Ratios (%) (to average net assets) and Supplemental data: | ||||||||||||||||||||
Expenses before expense reductions (f) | 0.60 | 0.63 | 0.64 | 0.64 | 0.65 | |||||||||||||||
Expenses after expense reductions (f) | 0.60 | N/A | N/A | N/A | N/A | |||||||||||||||
Net investment income | 2.33 | 2.88 | 3.39 | 3.85 | 4.31 | |||||||||||||||
Portfolio turnover | 78 | 29 | 36 | 36 | 52 | |||||||||||||||
Net assets at end of period (000 omitted) | $537,397 | $264,328 | $227,694 | $250,133 | $266,170 | |||||||||||||||
See Notes to Financial Statements
12
Table of Contents
MFS Government Securities Portfolio
Financial Highlights – continued
| Service Class | Years ended 12/31 | |||||||||||||||||||
| 2012 | 2011 | 2010 | 2009 | 2008 | ||||||||||||||||
Net asset value, beginning of period | $13.62 | $13.18 | $13.06 | $13.15 | $12.81 | |||||||||||||||
| Income (loss) from investment operations | ||||||||||||||||||||
Net investment income (d) | $0.29 | $0.35 | $0.41 | $0.46 | $0.52 | |||||||||||||||
Net realized and unrealized gain (loss) on investments | 0.02 | (g) | 0.57 | 0.17 | 0.08 | 0.50 | ||||||||||||||
Total from investment operations | $0.31 | $0.92 | $0.58 | $0.54 | $1.02 | |||||||||||||||
| Less distributions declared to shareholders | ||||||||||||||||||||
From net investment income | $(0.41 | ) | $(0.48 | ) | $(0.46 | ) | $(0.63 | ) | $(0.68 | ) | ||||||||||
From net realized gain on investments | (0.13 | ) | (0.00 | )(w) | — | — | — | |||||||||||||
Total distributions declared to shareholders | $(0.54 | ) | $(0.48 | ) | $(0.46 | ) | $(0.63 | ) | $(0.68 | ) | ||||||||||
Net asset value, end of period (x) | $13.39 | $13.62 | $13.18 | $13.06 | $13.15 | |||||||||||||||
Total return (%) (k)(r)(s)(x) | 2.27 | 7.11 | 4.49 | 4.23 | 8.29 | |||||||||||||||
| Ratios (%) (to average net assets) and Supplemental data: | ||||||||||||||||||||
Expenses before expense reductions (f) | 0.85 | 0.88 | 0.89 | 0.89 | 0.90 | |||||||||||||||
Expenses after expense reductions (f) | 0.85 | N/A | N/A | N/A | N/A | |||||||||||||||
Net investment income | 2.16 | 2.64 | 3.13 | 3.54 | 4.06 | |||||||||||||||
Portfolio turnover | 78 | 29 | 36 | 36 | 52 | |||||||||||||||
Net assets at end of period (000 omitted) | $404,321 | $420,164 | $440,930 | $417,263 | $271,052 | |||||||||||||||
| (d) | Per share data is based on average shares outstanding. |
| (f) | Ratios do not reflect reductions from fees paid indirectly, if applicable. |
| (g) | The per share amount varies from the net realized and unrealized gain/loss for the period because of the timing of sales of fund shares and the per share amount of realized and unrealized gains and losses at such time. |
| (k) | The total return does not reflect expenses that apply to separate accounts. Inclusion of these charges would reduce the total return figures for all periods shown. |
| (r) | Certain expenses have been reduced without which performance would have been lower. |
| (s) | From time to time the fund may receive proceeds from litigation settlements, without which performance would be lower. |
| (w) | Per share amount was less than $0.01. |
| (x) | The net asset values per share and total returns have been calculated on net assets which include adjustments made in accordance with U.S. generally accepted accounting principles required at period end for financial reporting purposes. |
See Notes to Financial Statements
13
Table of Contents
MFS Government Securities Portfolio
| (1) | Business and Organization |
MFS Government Securities Portfolio (the fund) is a series of MFS Variable Insurance Trust II (the trust). The trust is organized as a Massachusetts business trust and is registered under the Investment Company Act of 1940, as amended, as an open-end management investment company. The shareholders of each series of the trust are separate accounts of insurance companies, which offer variable annuity and/or life insurance products, and qualified retirement and pension plans.
| (2) | Significant Accounting Policies |
General – The preparation of financial statements in conformity with U.S. generally accepted accounting principles requires management to make estimates and assumptions that affect the reported amounts of assets and liabilities, and disclosure of contingent assets and liabilities at the date of the financial statements and the reported amounts of revenues and expenses during the reporting period. Actual results could differ from those estimates. In the preparation of these financial statements, management has evaluated subsequent events occurring after the date of the fund’s Statement of Assets and Liabilities through the date that the financial statements were issued. The fund invests a significant portion of its assets in asset-backed and/or mortgage-backed securities. The value of these securities may depend, in part, on the issuer’s or borrower’s credit quality or ability to pay principal and interest when due and may fall if an issuer or borrower defaults on its obligation to pay principal or interest or if the instrument’s credit rating is downgraded by a credit rating agency. U.S. Government securities not supported as to the payment of principal or interest by the U.S. Treasury, such as those issued by Fannie Mae, Freddie Mac, and the Federal Home Loan Banks, are subject to greater credit risk than are U.S. Government securities supported by the U.S. Treasury, such as those issued by Ginnie Mae.
In this reporting period the fund adopted Financial Accounting Standards Board (FASB) Accounting Standards Update 2011-04, Fair Value Measurement (Topic 820) – Amendments to Achieve Common Fair Value Measurement and Disclosure Requirements in U.S. GAAP and IFRSs (“ASU 2011-04”). ASU 2011-04 seeks to improve the comparability of fair value measurements as presented and disclosed in financial statements prepared in accordance with U.S. GAAP and International Financial Reporting Standards (IFRS) by providing common requirements for fair value measurement and disclosure.
In December 2011, the FASB issued Accounting Standards Update 2011-11, Balance Sheet (Topic 210) – Disclosures about Offsetting Assets and Liabilities (“ASU 2011-11”). Effective for annual reporting periods beginning on or after January 1, 2013 and interim periods within those annual periods, ASU 2011-11 is intended to enhance disclosure requirements on the offsetting of financial assets and liabilities. Although still evaluating the potential impacts of ASU 2011-11 to the fund, management expects that the impact of the fund’s adoption will be limited to additional financial statement disclosures.
Investment Valuations – Debt instruments and floating rate loans (other than short-term instruments), including restricted debt instruments, are generally valued at an evaluated or composite bid as provided by a third-party pricing service. Short-term instruments with a maturity at issuance of 60 days or less generally are valued at amortized cost, which approximates market value. Futures contracts are generally valued at last posted settlement price as provided by a third-party pricing service on the market on which they are primarily traded. Futures contracts for which there were no trades that day for a particular position are generally valued at the closing bid quotation as provided by a third-party pricing service on the market on which such futures contracts are primarily traded. Open-end investment companies are generally valued at net asset value per share. Securities and other assets generally valued on the basis of information from a third-party pricing service may also be valued at a broker/dealer bid quotation. Values obtained from third-party pricing services can utilize both transaction data and market information such as yield, quality, coupon rate, maturity, type of issue, trading characteristics, and other market data.
The Board of Trustees has delegated primary responsibility for determining or causing to be determined the value of the fund’s investments (including any fair valuation) to the adviser pursuant to valuation policies and procedures approved by the Board. If the adviser determines that reliable market quotations are not readily available, investments are valued at fair value as determined in good faith by the adviser in accordance with such procedures under the oversight of the Board of Trustees. Under the fund’s valuation policies and procedures, market quotations are not considered to be readily available for most types of debt instruments and floating rate loans and many types of derivatives. These investments are generally valued at fair value based on information from third-party pricing services. In addition, investments may be valued at fair value if the adviser determines that an investment’s value has been materially affected by events occurring after the close of the exchange or market on which the investment is principally traded (such as foreign exchange or market) and prior to the determination of the fund’s net asset value, or after the halting of trading of a specific security where trading does not resume prior to the close of the exchange or market on which the security is principally traded. The adviser generally relies on third-party pricing services or other information (such as the correlation with price movements of similar securities in the same or other markets; the type, cost and investment characteristics of the security; the business and financial condition of the issuer; and trading and other market data) to assist in determining whether to fair value and at what value to fair value an investment. The value of an investment for purposes of calculating the fund’s net asset value can differ depending on the source and method used to determine value. When fair valuation is used, the value of an investment used to
14
Table of Contents
MFS Government Securities Portfolio
Notes to Financial Statements – continued
determine the fund’s net asset value may differ from quoted or published prices for the same investment. There can be no assurance that the fund could obtain the fair value assigned to an investment if it were to sell the investment at the same time at which the fund determines its net asset value per share.
Various inputs are used in determining the value of the fund’s assets or liabilities. These inputs are categorized into three broad levels. In certain cases, the inputs used to measure fair value may fall into different levels of the fair value hierarchy. In such cases, an investment’s level within the fair value hierarchy is based on the lowest level of input that is significant to the fair value measurement. The fund’s assessment of the significance of a particular input to the fair value measurement in its entirety requires judgment, and considers factors specific to the investment. Level 1 includes unadjusted quoted prices in active markets for identical assets or liabilities. Level 2 includes other significant observable market-based inputs (including quoted prices for similar securities, interest rates, prepayment speed, and credit risk). Level 3 includes unobservable inputs, which may include the adviser’s own assumptions in determining the fair value of investments. The following is a summary of the levels used as of December 31, 2012 in valuing the fund’s assets or liabilities:
| Investments at Value | Level 1 | Level 2 | Level 3 | Total | ||||||||||||
| U.S. Treasury Bonds & U.S. Government Agency & Equivalents | $— | $391,886,946 | $— | $391,886,946 | ||||||||||||
| U.S. Corporate Bonds | — | 9,922,110 | — | 9,922,110 | ||||||||||||
| Residential Mortgage-Backed Securities | — | 468,678,075 | — | 468,678,075 | ||||||||||||
| Commercial Mortgage-Backed Securities | — | 11,600,570 | — | 11,600,570 | ||||||||||||
| Mutual Funds | 254,827,213 | — | — | 254,827,213 | ||||||||||||
| Total Investments | $254,827,213 | $882,087,701 | $— | $1,136,914,914 | ||||||||||||
For further information regarding security characteristics, see the Portfolio of Investments.
Derivatives – The fund uses derivatives for different purposes, primarily to increase or decrease exposure to a particular market or segment of the market, or security, to increase or decrease interest rate or currency exposure, or as alternatives to direct investments. Derivatives are used for hedging or non-hedging purposes. While hedging can reduce or eliminate losses, it can also reduce or eliminate gains. When the fund uses derivatives as an investment to increase market exposure, or for hedging purposes, gains and losses from derivative instruments may be substantially greater than the derivative’s original cost.
The derivative instruments used by the fund were futures contracts. At December 31, 2012, the fund did not have any outstanding derivative instruments.
The following table presents, by major type of derivative contract, the realized gain (loss) on derivatives held by the fund for the year ended December 31, 2012 as reported in the Statement of Operations:
| Risk | Futures Contracts | |||
| Interest Rate | $111,123 | |||
There is no change in unrealized gain (loss) from derivative transactions at period end.
Derivative counterparty credit risk is managed through formal evaluation of the creditworthiness of all potential counterparties. On certain over-the-counter derivatives, the fund attempts to reduce its exposure to counterparty credit risk whenever possible by entering into an International Swaps and Derivatives Association (ISDA) Master Agreement on a bilateral basis with each of the counterparties with whom it undertakes a significant volume of transactions. The ISDA Master Agreement gives each party to the agreement the right to terminate all transactions traded under such agreement if there is a certain deterioration in the credit quality of the other party. The ISDA Master Agreement gives the fund the right, upon an event of default by the applicable counterparty or a termination of the agreement, to close out all transactions traded under such agreement and to net amounts owed under each transaction to one net amount payable by one party to the other. This right to close out and net payments across all transactions traded under the ISDA Master Agreement could result in a reduction of the fund’s credit risk to such counterparty equal to any amounts payable by the fund under the applicable transactions, if any. However, absent an event of default by the counterparty or a termination of the agreement, the ISDA Master Agreement does not result in an offset of reported amounts of assets and liabilities in the Statement of Assets and Liabilities across transactions between the fund and the applicable counterparty.
Collateral requirements differ by type of derivative. Collateral or margin requirements are set by the broker or exchange clearing house for exchange traded derivatives (i.e., futures contracts and exchange-traded options) while collateral terms are contract specific for over-the-counter traded derivatives (i.e., forward foreign currency exchange contracts, swap agreements and over-the-counter options). For derivatives traded under an ISDA Master Agreement, the collateral requirements are netted across all transactions traded under such agreement and one amount is posted from one party to the other to collateralize such obligations. Cash collateral that has been pledged to cover obligations of the fund under derivative contracts, if any, will be reported separately in the Statement of Assets and Liabilities as restricted cash. Securities collateral pledged for the same purpose, if any, is noted in the Portfolio of Investments.
15
Table of Contents
MFS Government Securities Portfolio
Notes to Financial Statements – continued
Futures Contracts – The fund entered into futures contracts which may be used to hedge against or obtain broad market exposure, interest rate exposure, currency exposure, or to manage duration. A futures contract represents a commitment for the future purchase or sale of an asset at a specified price on a specified date.
Upon entering into a futures contract, the fund is required to deposit with the broker, either in cash or securities, an initial margin in an amount equal to a certain percentage of the notional amount of the contract. Subsequent payments (variation margin) are made or received by the fund each day, depending on the daily fluctuations in the value of the contract, and are recorded for financial statement purposes as unrealized gain or loss by the fund until the contract is closed or expires at which point the gain or loss on futures contracts is realized.
The fund bears the risk of interest rates, exchange rates or securities prices moving unexpectedly, in which case, the fund may not achieve the anticipated benefits of the futures contracts and may realize a loss. While futures contracts may present less counterparty risk to the fund since the contracts are exchange traded and the exchange’s clearinghouse guarantees payments to the broker, there is still counterparty credit risk due to the insolvency of the broker. The fund’s maximum risk of loss due to counterparty credit risk is equal to the margin posted by the fund to the broker plus any gains or minus any losses on the outstanding futures contracts.
Indemnifications – Under the fund’s organizational documents, its officers and Trustees may be indemnified against certain liabilities and expenses arising out of the performance of their duties to the fund. Additionally, in the normal course of business, the fund enters into agreements with service providers that may contain indemnification clauses. The fund’s maximum exposure under these agreements is unknown as this would involve future claims that may be made against the fund that have not yet occurred.
Investment Transactions and Income – Investment transactions are recorded on the trade date. Interest income is recorded on the accrual basis. All premium and discount is amortized or accreted for financial statement purposes in accordance with U.S. generally accepted accounting principles. Interest payments received in additional securities are recorded on the ex-interest date in an amount equal to the value of the security on such date.
The fund may receive proceeds from litigation settlements. Any proceeds received from litigation involving portfolio holdings are reflected in the Statement of Operations in realized gain/loss if the security has been disposed of by the fund or in unrealized gain/loss if the security is still held by the fund. Any other proceeds from litigation not related to portfolio holdings are reflected as other income in the Statement of Operations.
The fund purchased or sold debt securities on a when-issued or delayed delivery basis, or in a “To Be Announced” (TBA) or “forward commitment” transaction with delivery or payment to occur at a later date beyond the normal settlement period. TBA securities resulting from these transactions are included in the Portfolio of Investments. At the time a fund enters into a commitment to purchase or sell a security, the transaction is recorded and the value of the security acquired is reflected in the fund’s net asset value. The price of such security and the date that the security will be delivered and paid for are fixed at the time the transaction is negotiated. The value of the security may vary with market fluctuations. No interest accrues to the fund until payment takes place. At the time that a fund enters into this type of transaction, the fund is required to have sufficient cash and/or liquid securities to cover its commitments. Losses may arise due to changes in the value of the underlying securities or if the counterparty does not perform under the contract’s terms, or if the issuer does not issue the securities due to political, economic or other factors. Additionally, losses may arise due to declines in the value of the securities prior to settlement date.
Fees Paid Indirectly – The fund’s custody fee may be reduced according to an arrangement that measures the value of cash deposited with the custodian by the fund. This amount, for the year ended December 31, 2012, is shown as a reduction of total expenses in the Statement of Operations.
Tax Matters and Distributions – The fund intends to qualify as a regulated investment company, as defined under Subchapter M of the Internal Revenue Code, and to distribute all of its taxable income, including realized capital gains. As a result, no provision for federal income tax is required. The fund’s federal tax returns, when filed, will remain subject to examination by the Internal Revenue Service for a three year period.
Distributions to shareholders are recorded on the ex-dividend date. Income and capital gain distributions are determined in accordance with income tax regulations, which may differ from U.S. generally accepted accounting principles. Certain capital accounts in the financial statements are periodically adjusted for permanent differences in order to reflect their tax character. These adjustments have no impact on net assets or net asset value per share. Temporary differences which arise from recognizing certain items of income, expense, gain or loss in different periods for financial statement and tax purposes will reverse at some time in the future. Distributions in excess of net investment income or net realized gains are temporary overdistributions for financial statement purposes resulting from differences in the recognition or classification of income or distributions for financial statement and tax purposes.
Book/tax differences primarily relate to amortization and accretion of debt securities and wash sale loss deferrals.
16
Table of Contents
MFS Government Securities Portfolio
Notes to Financial Statements – continued
The tax character of distributions declared to shareholders for the last two fiscal years is as follows:
| 12/31/12 | 12/31/11 | |||||||
| Ordinary income (including any short-term capital gains) | $23,925,510 | $23,218,426 | ||||||
| Long-term capital gains | 1,794,016 | 228,585 | ||||||
| Total distributions | $25,719,526 | $23,447,011 | ||||||
The federal tax cost and the tax basis components of distributable earnings were as follows:
| As of 12/31/12 | ||||
| Cost of investments | $1,104,701,452 | |||
| Gross appreciation | 33,756,905 | |||
| Gross depreciation | (1,543,443 | ) | ||
| Net unrealized appreciation (depreciation) | $32,213,462 | |||
| Undistributed ordinary income | 21,589,316 | |||
| Undistributed long-term capital gain | 4,481,763 | |||
| Other temporary differences | (69,733 | ) |
Multiple Classes of Shares of Beneficial Interest – The fund offers multiple classes of shares, which differ in their respective distribution and/or service fees. The fund’s income, realized and unrealized gain (loss), and common expenses are allocated to shareholders based on the daily net assets of each class. Dividends are declared separately for each class. Differences in per share dividend rates are generally due to differences in separate class expenses. The fund’s distributions declared to shareholders as reported in the Statements of Changes in Net Assets are presented by class as follows:
| From net investment income | From net realized gain on investments | |||||||||||||||
| Year ended 12/31/12 | Year ended 12/31/11 | Year ended 12/31/12 | Year ended 12/31/11 | |||||||||||||
| Initial Class | $7,988,058 | $7,932,135 | $2,260,778 | $74,653 | ||||||||||||
| Service Class | 11,821,959 | 15,286,291 | 3,648,731 | 153,932 | ||||||||||||
| Total | $19,810,017 | $23,218,426 | $5,909,509 | $228,585 | ||||||||||||
| (3) | Transactions with Affiliates |
Investment Adviser – The fund has an investment advisory agreement with MFS to provide overall investment management and related administrative services and facilities to the fund.
The management fee is computed daily and paid monthly at the following annual rates:
| First $1 billion of average daily net assets | 0.55% | |||
| Average daily net assets in excess of $1 billion | 0.50% |
The management fee incurred for the year ended December 31, 2012 was equivalent to an annual effective rate of 0.55% of the fund’s average daily net assets.
The investment adviser has agreed in writing to pay a portion of the fund’s total annual operating expenses, exclusive of interest, taxes, extraordinary expenses, brokerage and transaction costs, and investment-related expenses, such that total annual operating expenses do not exceed 0.61% of average daily net assets for the Initial Class shares and 0.86% of average daily net assets for the Service Class shares. This written agreement will continue until modified by the fund’s Board of Trustees, but such agreement will continue at least until April 30, 2014. For the year ended December 31, 2012, the fund’s actual operating expenses did not exceed the limit and therefore, the investment adviser did not pay any portion of the fund’s expenses related to this agreement.
Distributor – MFS Fund Distributors, Inc. (MFD), a wholly-owned subsidiary of MFS, is the distributor of shares of the fund. The Trustees have adopted a distribution plan for the Service Class shares pursuant to Rule 12b-1 under the Investment Company Act of 1940.
The fund’s distribution plan provides that the fund will pay MFD distribution and/or service fees equal to 0.25% per annum of its average daily net assets attributable to Service Class shares as partial consideration for services performed and expenses incurred by MFD and financial intermediaries (including participating insurance companies that invest in the fund to fund variable annuity and variable life insurance contracts, sponsors of qualified retirement and pension plans that invest in the fund, and affiliates of these participating insurance companies and plan sponsors) in connection with the sale and distribution of the Service Class shares. MFD may subsequently pay all, or a portion, of the distribution and/or service fees to financial intermediaries.
17
Table of Contents
MFS Government Securities Portfolio
Notes to Financial Statements – continued
Shareholder Servicing Agent – MFS Service Center, Inc. (MFSC), a wholly-owned subsidiary of MFS, has contracted to provide transfer agent and recordkeeping functions in connection with the issuance, transfer, and redemption of each class of shares of the fund under a Shareholder Servicing Agent Agreement. During the year ended December 31, 2012, the fund did not pay MFSC a fee for this service. Effective April 1, 2013, the fund will be charged a shareholder servicing fee by MFSC.
Administrator – MFS provides certain financial, legal, shareholder communications, compliance, and other administrative services to the fund. Under an administrative services agreement, the fund partially reimburses MFS the costs incurred to provide these services. The fund is charged an annual fixed amount of $17,500 plus a fee based on average daily net assets. The administrative services fee incurred for the year ended December 31, 2012 was equivalent to an annual effective rate of 0.0157% of the fund’s average daily net assets.
Trustees’ and Officers’ Compensation – The fund pays compensation to independent Trustees in the form of a retainer, attendance fees, and additional compensation to Board and Committee chairpersons. The fund does not pay compensation directly to Trustees or officers of the fund who are also officers of the investment adviser, all of whom receive remuneration for their services to the fund from MFS. Certain officers and Trustees of the fund are officers or directors of MFS, MFD, and MFSC.
Other – This fund and certain other funds managed by MFS (the funds) have entered into services agreements (the Agreements) which provide for payment of fees by the funds to Tarantino LLC and Griffin Compliance LLC in return for the provision of services of an Independent Chief Compliance Officer (ICCO) and Assistant ICCO, respectively, for the funds. The ICCO and Assistant ICCO are officers of the funds and the sole members of Tarantino LLC and Griffin Compliance LLC, respectively. The funds can terminate the Agreements with Tarantino LLC and Griffin Compliance LLC at any time under the terms of the Agreements. For the year ended December 31, 2012, the aggregate fees paid by the fund to Tarantino LLC and Griffin Compliance LLC were $5,484 and are included in “Miscellaneous” expense in the Statement of Operations. MFS has agreed to reimburse the fund for a portion of the payments made by the fund in the amount of $2,400, which is shown as a reduction of total expenses in the Statement of Operations. Additionally, MFS has agreed to bear all expenses associated with office space, other administrative support, and supplies provided to the ICCO and Assistant ICCO.
The fund invests in the MFS Institutional Money Market Portfolio which is managed by MFS and seeks current income consistent with preservation of capital and liquidity. Income earned on this investment is included in “Dividends from underlying affiliated funds” in the Statement of Operations. This money market fund does not pay a management fee to MFS.
| (4) | Portfolio Securities |
Purchases and sales of investments, other than short-term obligations, were as follows:
| Purchases | Sales | |||||||
| U.S. Government securities | $466,122,396 | $286,835,361 | ||||||
| Investments (non-U.S. Government securities) | $406,830,600 | $255,907,399 | ||||||
| (5) | Shares of Beneficial Interest |
The fund’s Declaration of Trust permits the Trustees to issue an unlimited number of full and fractional shares of beneficial interest. Transactions in fund shares were as follows:
| Year ended 12/31/12 | Year ended 12/31/11 | |||||||||||||||
| Shares | Amount | Shares | Amount | |||||||||||||
| Shares sold | ||||||||||||||||
Initial Class | 22,950,076 | $310,242,152 | 1,368,448 | $18,583,787 | ||||||||||||
Service Class | 4,062,154 | 54,796,819 | 3,457,872 | 46,547,288 | ||||||||||||
| 27,012,230 | $365,038,971 | 4,826,320 | $65,131,075 | |||||||||||||
| Shares issued in connection with acquisition of Government Securities Variable Account | ||||||||||||||||
Initial Class | 3,911,252 | $53,310,360 | ||||||||||||||
| Shares issued to shareholders in reinvestment of distributions | ||||||||||||||||
Initial Class | 764,268 | $10,248,836 | 593,095 | $8,006,788 | ||||||||||||
Service Class | 1,161,463 | 15,470,690 | 1,151,396 | 15,440,223 | ||||||||||||
| 1,925,731 | $25,719,526 | 1,744,491 | $23,447,011 | |||||||||||||
| Shares reacquired | ||||||||||||||||
Initial Class | (3,144,680 | ) | $(43,168,053 | ) | (3,767,855 | ) | $(50,830,241 | ) | ||||||||
Service Class | (5,878,104 | ) | (80,114,536 | ) | (7,224,647 | ) | (97,112,101 | ) | ||||||||
| (9,022,784 | ) | $(123,282,589 | ) | (10,992,502 | ) | $(147,942,342 | ) | |||||||||
| Net change | ||||||||||||||||
Initial Class | 20,569,664 | $277,322,935 | 2,104,940 | $29,070,694 | ||||||||||||
Service Class | (654,487 | ) | (9,847,027 | ) | (2,615,379 | ) | (35,124,590 | ) | ||||||||
| 19,915,177 | $267,475,908 | (510,439 | ) | $(6,053,896 | ) | |||||||||||
18
Table of Contents
MFS Government Securities Portfolio
Notes to Financial Statements – continued
The fund is one of several mutual funds in which the MFS funds-of-funds may invest. The MFS funds-of-funds do not invest in the underlying MFS funds for the purpose of exercising management or control. At the end of the period, the MFS Conservative Allocation Portfolio and the MFS Moderate Allocation Portfolio were the owners of record of approximately 10% and 21%, respectively, of the value of outstanding voting shares of the fund.
| (6) | Line of Credit |
The fund and certain other funds managed by MFS participate in a $1.1 billion unsecured committed line of credit, subject to a $1 billion sublimit, provided by a syndication of banks under a credit agreement. Borrowings may be made for temporary financing needs. Interest is charged to each fund, based on its borrowings, generally at a rate equal to the higher of the Federal Reserve funds rate or one month LIBOR plus an agreed upon spread. A commitment fee, based on the average daily, unused portion of the committed line of credit, is allocated among the participating funds at the end of each calendar quarter. In addition, the fund and other funds managed by MFS have established unsecured uncommitted borrowing arrangements with certain banks for temporary financing needs. Interest is charged to each fund, based on its borrowings, at a rate equal to the Federal Reserve funds rate plus an agreed upon spread. For the year ended December 31, 2012, the fund’s commitment fee and interest expense were $4,263 and $0, respectively, and are included in “Miscellaneous” expense in the Statement of Operations.
| (7) | Transactions in Underlying Affiliated Funds – Affiliated Issuers |
An affiliated issuer may be considered one in which the fund owns 5% or more of the outstanding voting securities, or a company which is under common control. For the purposes of this report, the fund assumes the following to be an affiliated issuer:
| Underlying Affiliated Fund | Beginning Shares/Par Amount | Acquisitions Shares/Par Amount | Dispositions Shares/Par Amount | Ending Shares/Par | ||||||||||||
| MFS Institutional Money Market Portfolio | 21,906,213 | 432,871,591 | (199,950,591 | ) | 254,827,213 | |||||||||||
| Underlying Affiliated Fund | Realized Gain (Loss) | Capital Gain Distributions | Dividend Income | Ending Value | ||||||||||||
| MFS Institutional Money Market Portfolio | $— | $— | $98,629 | $254,827,213 | ||||||||||||
| (8) | Acquisitions |
At the close of business on December 2, 2011, the fund with net assets of $622,179,000, acquired all of the investment-related assets and liabilities of Government Securities Variable Account. The acquisition was part of a transaction in which the Government Securities Variable Account was converted into a unit investment trust (“UIT”) that invests in the fund (the acquisition of the Account’s assets and liabilities and subsequent conversion into a UIT hereinafter referred to as the “Reorganization”). The Reorganization provided the contract owners of the Government Securities Variable Account with the opportunity to participate in a larger combined portfolio with an identical investment objective and similar investment policies and strategies. The acquisition was accomplished by a tax-free exchange of 3,911,252 shares of the fund (valued at $53,310,360) for all of the investment-related assets and liabilities of Government Securities Variable Account. Government Securities Variable Account’s investments on that date were valued at approximately $53,536,440 with a cost basis of approximately $50,354,919. For financial reporting purposes, assets received and shares issued by the fund were recorded at fair value; however, the cost basis of the investments received from Government Securities Variable Account were carried forward to align ongoing reporting of the fund’s realized and unrealized gains and losses with amounts distributable to shareholders for tax purposes.
19
Table of Contents
MFS Government Securities Portfolio
REPORT OF INDEPENDENT REGISTERED PUBLIC ACCOUNTING FIRM
To the Board of Trustees of MFS Variable Insurance Trust II and the Shareholders of
MFS Government Securities Portfolio:
We have audited the accompanying statement of assets and liabilities, including the portfolio of investments, of MFS Government Securities Portfolio (the “Fund”) (one of the series comprising MFS Variable Insurance Trust II) as of December 31, 2012, and the related statement of operations for the year then ended, the statements of changes in net assets for each of the two years in the period then ended, and the financial highlights for each of the five years in the period then ended. These financial statements and financial highlights are the responsibility of the Fund’s management. Our responsibility is to express an opinion on these financial statements and financial highlights based on our audits.
We conducted our audits in accordance with the standards of the Public Company Accounting Oversight Board (United States). Those standards require that we plan and perform the audit to obtain reasonable assurance about whether the financial statements and financial highlights are free of material misstatement. The Fund is not required to have, nor were we engaged to perform, an audit of its internal control over financial reporting. Our audits included consideration of internal control over financial reporting as a basis for designing audit procedures that are appropriate in the circumstances, but not for the purpose of expressing an opinion on the effectiveness of the Fund’s internal control over financial reporting. Accordingly, we express no such opinion. An audit also includes examining, on a test basis, evidence supporting the amounts and disclosures in the financial statements, assessing the accounting principles used and significant estimates made by management, as well as evaluating the overall financial statement presentation. Our procedures included confirmation of securities owned as of December 31, 2012, by correspondence with the custodian and brokers; where replies were not received from brokers, we performed other auditing procedures. We believe that our audits provide a reasonable basis for our opinion.
In our opinion, the financial statements and financial highlights referred to above present fairly, in all material respects, the financial position of MFS Government Securities Portfolio as of December 31, 2012, the results of its operations for the year then ended, the changes in its net assets for each of the two years in the period then ended, and the financial highlights for each of the five years in the period then ended, in conformity with accounting principles generally accepted in the United States of America.
DELOITTE & TOUCHE LLP
Boston, Massachusetts
February 15, 2013
20
Table of Contents
MFS Government Securities Portfolio
TRUSTEES AND OFFICERS – IDENTIFICATION AND BACKGROUND
The Trustees and officers of the Trust, as of February 1, 2013, are listed below, together with their principal occupations during the past five years. (Their titles may have varied during that period.) The address of each Trustee and officer is 111 Huntington Avenue, Boston, Massachusetts 02199-7618.
Name, Age | Position(s) with Fund | Trustee/Officer Since (h) | Principal Occupations During the Past Five Years | Other Directorships (j) | ||||
| INTERESTED TRUSTEES | ||||||||
Robert J. Manning (k) (age 49) | Trustee | February 2004 | Massachusetts Financial Services Company, Chairman, Chief Executive Officer and Director; President (until December 2009); Chief Investment Officer (until July 2010) | N/A | ||||
| INDEPENDENT TRUSTEES | ||||||||
David H. Gunning (age 70) | Trustee and Chair of Trustees | January 2004 | Private investor | Lincoln Electric Holdings, Inc. (welding equipment manufacturer), Director; Development Alternatives, Inc. (consulting), Director/Non-Executive Chairman; Portman Limited (mining), Director (until 2008) | ||||
Robert E. Butler (age 71) | Trustee | January 2006 | Consultant – investment company industry regulatory and compliance matters | N/A | ||||
Maureen R. Goldfarb (age 57) | Trustee | January 2009 | Private investor | N/A | ||||
William R. Gutow (age 71) | Trustee | December 1993 | Private investor and real estate consultant; Capitol Entertainment Management Company (video franchise), Vice Chairman | Atlantic Coast Tan (tanning salons), Vice Chairman (until 2007); Texas Donuts (donut franchise), Vice Chairman (until 2010) | ||||
Michael Hegarty (age 68) | Trustee | December 2004 | Private investor; Rouse Properties Inc. (real estate), Director | N/A | ||||
John P. Kavanaugh (age 58) | Trustee | January 2009 | Private investor | N/A | ||||
J. Dale Sherratt (age 74) | Trustee | June 1989 | Insight Resources, Inc. (acquisition planning specialists), President; Wellfleet Investments (investor in health care companies), Managing General Partner | N/A | ||||
| Laurie J. Thomsen (age 55) | Trustee | March 2005 | Private investor; New Profit, Inc. (venture philanthropy), Executive Partner (until 2010) | The Travelers Companies (insurance), Director | ||||
Robert W. Uek (age 71) | Trustee | January 2006 | Consultant to investment company industry | N/A | ||||
| OFFICERS | ||||||||
John M. Corcoran (k) (age 47) | President | October 2008 | Massachusetts Financial Services Company, Senior Vice President (since October 2008); State Street Bank and Trust (financial services provider), Senior Vice President, (until September 2008) | N/A | ||||
| Christopher R. Bohane (k) (age 39) | Assistant Secretary and Assistant Clerk | July 2005 | Massachusetts Financial Services Company, Vice President and Senior Counsel | N/A | ||||
Kino Clark (k) (age 44) | Assistant Treasurer | January 2012 | Massachusetts Financial Services Company, Vice President | N/A | ||||
Thomas H. Connors (k) (age 53) | Assistant Secretary and Assistant Clerk | September 2012 | Massachusetts Financial Services Company, Vice President and Senior Counsel; Deutsche Investment Management Americas Inc. (financial service provider), Director and Senior Counsel (until 2012) | N/A | ||||
Ethan D. Corey (k) (age 49) | Assistant Secretary and Assistant Clerk | July 2005 | Massachusetts Financial Services Company, Senior Vice President and Associate General Counsel | N/A | ||||
21
Table of Contents
MFS Government Securities Portfolio
Trustees and Officers – continued
Name, Age | Position(s) with Fund | Trustee/Officer Since (h) | Principal Occupations During the Past Five Years | Other Directorships (j) | ||||
David L. DiLorenzo (k) (age 44) | Treasurer | July 2005 | Massachusetts Financial Services Company, Senior Vice President | N/A | ||||
Robyn L. Griffin (age 37) | Assistant Independent Chief Compliance Officer | August 2008 | Griffin Compliance LLC (provider of compliance services), Principal (since August 2008); State Street Corporation (financial services provider), Mutual Fund Administration Assistant Vice President (October 2006 – July 2008) | N/A | ||||
Brian E. Langenfeld (k) (age 39) | Assistant Secretary and Assistant Clerk | June 2006 | Massachusetts Financial Services Company, Vice President and Senior Counsel | N/A | ||||
Susan S. Newton (k) (age 62) | Assistant Secretary and Assistant Clerk | May 2005 | Massachusetts Financial Services Company, Senior Vice President and Associate General Counsel | N/A | ||||
Susan A. Pereira (k) (age 42) | Assistant Secretary and Assistant Clerk | July 2005 | Massachusetts Financial Services Company, Vice President and Senior Counsel | N/A | ||||
Kasey L. Phillips (k) (age 42) | Assistant Treasurer | September 2012 | Massachusetts Financial Services Company, Vice President; Wells Fargo Funds Management, LLC, Senior Vice President, Fund Treasurer (until 2012) | N/A | ||||
Mark N. Polebaum (k) (age 60) | Secretary and Clerk | January 2006 | Massachusetts Financial Services Company, Executive Vice President, General Counsel and Secretary | N/A | ||||
Frank L. Tarantino (age 68) | Independent Chief Compliance Officer | June 2004 | Tarantino LLC (provider of compliance services), Principal | N/A | ||||
Richard S. Weitzel (k) (age 42) | Assistant Secretary and Assistant Clerk | October 2007 | Massachusetts Financial Services Company, Senior Vice President and Associate General Counsel | N/A | ||||
James O. Yost (k) (age 52) | Deputy Treasurer | September 1990 | Massachusetts Financial Services Company, Senior Vice President | N/A | ||||
| (h) | Date first appointed to serve as Trustee/officer of an MFS fund. Each Trustee has served continuously since appointment unless indicated otherwise. For the period from December 15, 2004 until February 22, 2005, Mr. Manning served as Advisory Trustee. For the period October 2008, until January 2012, Mr. Corcoran served as Treasurer of the Funds. Prior to January 2012, Messrs. DiLorenzo and Yost served as Assistant Treasurers of the Funds. |
| (j) | Directorships or trusteeships of companies required to report to the Securities and Exchange Commission (i.e., “public companies”). |
| (k) | “Interested person” of the Trust within the meaning of the Investment Company Act of 1940 (referred to as the 1940 Act), which is the principal federal law governing investment companies like the fund, as a result of position with MFS. The address of MFS is 111 Huntington Avenue, Boston, Massachusetts 02199-7618. |
Each Trustee has been elected by shareholders and each Trustee and officer holds office until his or her successor is chosen and qualified or until his or her earlier death, resignation, retirement or removal. The Trust does not hold annual meetings for the purpose of electing Trustees, and Trustees are not elected for fixed terms. Messrs. Butler, Kavanaugh, Uek and Ms. Thomsen are members of the Trust’s Audit Committee.
Each of the Fund’s Trustees and officers holds comparable positions with certain other funds of which MFS or a subsidiary is the investment adviser or distributor, and, in the case of the officers, with certain affiliates of MFS. As of January 1, 2013, the Trustees served as board members of 143 funds within the MFS Family of Funds.
22
Table of Contents
MFS Government Securities Portfolio
Trustees and Officers – continued
The Statement of Additional Information for the Fund includes further information about the Trustees and is available without charge upon request by calling 1-800-225-2606.
Investment Adviser Massachusetts Financial Services Company 111 Huntington Avenue Boston, MA 02199-7618 | Custodian State Street Bank and Trust 1 Lincoln Street Boston, MA 02111-2900 | |
Distributor MFS Fund Distributors, Inc. 111 Huntington Avenue Boston, MA 02199-7618 | Independent Registered Public Accounting Firm Deloitte & Touche LLP 200 Berkeley Street Boston, MA 02116 | |
Portfolio Manager Geoffrey Schechter |
23
Table of Contents
MFS Government Securities Portfolio
BOARD REVIEW OF INVESTMENT ADVISORY AGREEMENT
A discussion regarding the Board’s most recent approval of the fund’s Investment Advisory Agreement with MFS is available by clicking on the fund’s name under “Variable Insurance Portfolio – VIT II” in the “Products” section of the MFS Web site (mfs.com).
PROXY VOTING POLICIES AND INFORMATION
A general description of the MFS funds’ proxy voting policies and procedures is available without charge, upon request, by calling 1-800-225-2606, by visiting the Proxy Voting section of mfs.com or by visiting the SEC’s Web site at http://www.sec.gov.
Information regarding how the fund voted proxies relating to portfolio securities during the most recent twelve-month period ended June 30 is available without charge by visiting the Proxy Voting section of mfs.com or by visiting the SEC’s Web site at http://www.sec.gov.
QUARTERLY PORTFOLIO DISCLOSURE
The fund will file a complete schedule of portfolio holdings with the Securities and Exchange Commission (the Commission) for the first and third quarters of each fiscal year on Form N-Q. The fund’s Form N-Q is available on the EDGAR database on the Commission’s Internet Web site at http://www.sec.gov, and may be reviewed and copied at the:
Public Reference Room
Securities and Exchange Commission
100 F Street, NE, Room 1580
Washington, D.C. 20549
Information on the operation of the Public Reference Room may be obtained by calling the Commission at 1-800-SEC-0330. Copies of the fund’s Form N-Q also may be obtained, upon payment of a duplicating fee, by electronic request at the following e-mail address: publicinfo@sec.gov or by writing the Public Reference Section at the above address.
From time to time, MFS may post important information about the fund or the MFS funds on the MFS web site (mfs.com). This information is available by visiting the “News & Commentary” section of mfs.com or by clicking on the fund’s name under “Variable Insurance Portfolios – VIT II” in the “Products” section of mfs.com.
FEDERAL TAX INFORMATION (unaudited)
The following information is provided pursuant to provisions of the Internal Revenue Code.
The fund designates $1,974,000 as capital gain dividends paid during the fiscal year.
24
Table of Contents
rev. 3/11

| Why? | Financial companies choose how they share your personal information. Federal law gives consumers the right to limit some but not all sharing. Federal law also requires us to tell you how we collect, share, and protect your personal information. Please read this notice carefully to understand what we do. |
| What? | The types of personal information we collect and share depend on the product or service you have with us. This information can include:
• Social Security number and account balances • Account transactions and transaction history • Checking account information and wire transfer instructions
When you are no longer our customer, we continue to share your information as described in this notice. |
| How? | All financial companies need to share customers’ personal information to run their everyday business. In the section below, we list the reasons financial companies can share their customers’ personal information; the reasons MFS chooses to share; and whether you can limit this sharing. |
| Reasons we can share your personal information | Does MFS share? | Can you limit this sharing? | ||
For our everyday business purposes – such as to process your transactions, maintain your account(s), respond to court orders and legal investigations, or report to credit bureaus | Yes | No | ||
For our marketing purposes – to offer our products and services to you | No | We don’t share | ||
| For joint marketing with other financial companies | No | We don’t share | ||
For our affiliates’ everyday business purposes – information about your transactions and experiences | No | We don’t share | ||
For our affiliates’ everyday business purposes – information about your creditworthiness | No | We don’t share | ||
| For nonaffiliates to market to you | No | We don’t share |
| Questions? | Call 800-225-2606 or go to mfs.com. |
25
Table of Contents
| Page 2 |
| Who we are | ||
| Who is providing this notice? | MFS Funds, MFS Investment Management, MFS Institutional Advisors, Inc., MFS Fund Distributors, Inc., MFS Heritage Trust Company, and MFS Service Center, Inc. | |
| What we do | ||
| How does MFS protect my personal information? | To protect your personal information from unauthorized access and use, we use security measures that comply with federal law. These measures include procedural, electronic, and physical safeguards for the protection of the personal information we collect about you. | |
| How does MFS collect my personal information? | We collect your personal information, for example, when you
• open an account or provide account information • direct us to buy securities or direct us to sell your securities • make a wire transfer
We also collect your personal information from others, such as credit bureaus, affiliates and other companies. | |
| Why can’t I limit all sharing? | Federal law gives you the right to limit only
• sharing for affiliates’ everyday business purposes – information about your creditworthiness • affiliates from using your information to market to you • sharing for nonaffiliates to market to you
State laws and individual companies may give you additional rights to limit sharing. | |
| Definitions | ||
| Affiliates | Companies related by common ownership or control. They can be financial and nonfinancial companies.
•MFS does not share personal information with affiliates, except for everyday business purposes as described on page one of this notice. | |
| Nonaffiliates | Companies not related by common ownership or control. They can be financial and nonfinancial companies.
•MFS does not share with nonaffiliates so they can market to you. | |
| Joint Marketing | A formal agreement between nonaffiliated financial companies that together market financial products or services to you.
•MFS doesn’t jointly market. | |
| Other important information | ||
| If you own an MFS product or receive an MFS service in the name of a third party such as a bank or broker-dealer, their privacy policy may apply to you instead of ours. | ||
26
Table of Contents
Table of Contents
ANNUAL REPORT
December 31, 2012

MFS® TOTAL RETURN PORTFOLIO
MFS® Variable Insurance Trust II

TRS-ANN
Table of Contents
MFS® TOTAL RETURN PORTFOLIO
The report is prepared for the general information of contract owners. It is authorized for distribution to prospective investors only when preceded or accompanied by a current prospectus.
NOT FDIC INSURED • MAY LOSE VALUE • NO BANK OR CREDIT UNION GUARANTEE •
NOT A DEPOSIT • NOT INSURED BY ANY FEDERAL GOVERNMENT AGENCY OR NCUA/NCUSIF
Table of Contents
MFS Total Return Portfolio
LETTER FROM THE CHAIRMAN AND CEO

Dear Contract Owners:
The global market outlook for 2013 is one of cautious optimism. While we are seeing some positive economic trends in the United States, Europe and China, the overall environment remains challenging. In the United States, the recent fiscal cliff agreement was received positively by investors, even though it mostly addressed pressing taxation issues and did not resolve additional concerns, including the need for spending cuts and a large-scale reduction of the federal debt. These issues will be front and center again in the spring. Despite the ongoing uncertainty, economic tailwinds are gathering strength as the U.S. housing and job markets are improving and consumer confidence is rising.
Overseas, the debt crisis continues to weigh heavily on eurozone markets, with even Germany — long an economic stalwart — experiencing some contraction. These ongoing challenges could be a drag on global market performance this year. In Asia, manufacturing activity has accelerated in emerging markets such as China and India, and we are seeing signs of stabilized loan growth in China, a leading indicator of that country’s economic health. In contrast, Japan’s economy is contracting sharply under deflationary pressures. Nevertheless, Japanese markets have responded favorably to early actions by the new government, which appears determined to act aggressively, along with the Bank of Japan, to stimulate growth.
As always, managing risk in the face of uncertainty remains a top priority for investors. At MFS®, our uniquely collaborative investment process revolves around global research and our disciplined risk management approach. Our global team of investment professionals shares ideas and evaluates opportunities across continents, investment disciplines and asset classes — all with a goal of building better insights, and ultimately better results, for our clients.
We remain mindful of the many economic challenges investors face today, and believe it is more important than ever to maintain a long-term view, employ time-tested principles, such as asset allocation and diversification, and work closely with investment advisors to identify and pursue the most suitable opportunities.
Respectfully,

Robert J. Manning
Chairman and Chief Executive Officer
MFS Investment Management®
February 15, 2013
The opinions expressed in this letter are subject to change, may not be relied upon for investment advice, and no forecasts can be guaranteed.
1
Table of Contents
MFS Total Return Portfolio
Portfolio structure (i)
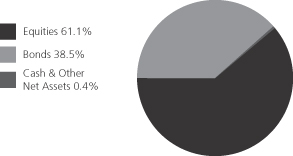
| Top ten holdings (i) | ||||
| JPMorgan Chase & Co. | 2.3% | |||
| Philip Morris International, Inc. | 2.0% | |||
| U.S. Treasury Notes, 1.875%, 2014 | 2.0% | |||
| U.S. Treasury Notes, 0.875%, 2016 | 1.9% | |||
| Pfizer, Inc. | 1.7% | |||
| Fannie Mae, 5.5%, 30 Years | 1.7% | |||
| Exxon Mobil Corp. | 1.7% | |||
| Johnson & Johnson | 1.6% | |||
| Lockheed Martin Corp. | 1.5% | |||
| U.S. Treasury Bonds, 4.5%, 2039 | 1.5% | |||
| Composition including fixed income credit quality (a)(i) | ||||
| AAA | 1.8% | |||
| AA | 1.4% | |||
| A | 4.0% | |||
| BBB | 5.5% | |||
| BB | 0.4% | |||
| CCC | 0.1% | |||
| CC | 0.1% | |||
| C | 0.1% | |||
| U.S. Government | 12.3% | |||
| Federal Agencies | 12.8% | |||
| Not Rated (o) | 0.0% | |||
| Non-Fixed Income | 61.1% | |||
| Cash & Other | 0.4% | |||
| Equity sectors | ||||
| Financial Services | 13.5% | |||
| Health Care | 7.4% | |||
| Consumer Staples | 7.3% | |||
| Industrial Goods & Services | 6.9% | |||
| Energy | 5.9% | |||
| Leisure | 4.2% | |||
| Utilities & Communications | 3.6% | |||
| Basic Materials | 3.0% | |||
| Retailing | 2.8% | |||
| Technology | 2.5% | |||
| Autos & Housing | 1.9% | |||
| Special Products & Services | 1.1% | |||
| Transportation | 1.0% | |||
| Fixed income sectors (i) | ||||
| Mortgage-Backed Securities | 12.4% | |||
| U.S. Treasury Securities | 12.3% | |||
| High Grade Corporates | 9.4% | |||
| Commercial Mortgage-Backed Securities | 1.8% | |||
| Emerging Markets Bonds | 0.9% | |||
| Non-U.S. Government Bonds | 0.9% | |||
| U.S. Government Agencies | 0.4% | |||
| Asset-Backed Securities | 0.2% | |||
| High Yield Corporates | 0.1% | |||
| Collateralized Debt Obligations | 0.1% | |||
| Residential Mortgage-Backed Securities (o) | 0.0% | |||
| (a) | For all securities other than those specifically described below, ratings are assigned to underlying securities utilizing ratings from Moody’s, Fitch, and Standard & Poor’s rating agencies and applying the following hierarchy: If all three agencies provide a rating, the middle rating (after dropping the highest and lowest ratings) is assigned; if two of the three agencies rate a security, the lower of the two is assigned. Ratings are shown in the S&P and Fitch scale (e.g., AAA). Securities rated BBB or higher are considered investment grade. All ratings are subject to change. U.S. Government includes securities issued by the U.S. Department of the Treasury. Federal Agencies includes rated and unrated U.S. Agency fixed-income securities, U.S. Agency mortgage-backed securities, and collateralized mortgage obligations of U.S. Agency mortgage-backed securities. Not Rated includes fixed income securities, including fixed income futures contracts, which have not been rated by any rating agency. Non-Fixed Income includes equity securities (including convertible bonds and equity derivatives) and commodities. Cash & Other includes cash, other assets less liabilities, offsets to derivative positions, and short-term securities. The fund may not hold all of these instruments. The fund is not rated by these agencies. |
2
Table of Contents
MFS Total Return Portfolio
Portfolio Composition – continued
| (i) | For purposes of this presentation, the components include the market value of securities, and reflect the impact of the equivalent exposure of derivative positions, if any. These amounts may be negative from time to time. The bond component will include any accrued interest amounts. Equivalent exposure is a calculated amount that translates the derivative position into a reasonable approximation of the amount of the underlying asset that the portfolio would have to hold at a given point in time to have the same price sensitivity that results from the portfolio’s ownership of the derivative contract. When dealing with derivatives, equivalent exposure is a more representative measure of the potential impact of a position on portfolio performance than market value. Where the fund holds convertible bonds, these are treated as part of the equity portion of the portfolio. |
| (o) | Less than 0.1%. |
Percentages are based on net assets as of 12/31/12.
The portfolio is actively managed and current holdings may be different.
3
Table of Contents
MFS Total Return Portfolio
Summary of Results
For the twelve months ended December 31, 2012, Initial Class shares of the MFS Total Return Portfolio (“fund”) provided a total return of 11.34%, while Service Class shares of the fund provided a total return of 11.02%. These compare with returns of 16.00% and 4.21% over the same period for the fund’s benchmarks, the Standard & Poor’s 500 Stock Index (“S&P 500 Index”) and the Barclays U.S. Aggregate Bond Index (“Barclays Index”), respectively. The fund’s other benchmark, the MFS Total Return Blended Index (“Blended Index”), generated a return of 11.31%. The Blended Index reflects the blended returns of the equity and fixed income market indices, with percentage allocations to each index designed to resemble the equity and fixed income allocations of the fund. The market indices and related percentage allocations used to compile the Blended Index are set forth in the Performance Summary.
Market Environment
The beginning of the period was characterized by a risk-on sentiment as a result of additional liquidity measures by the Federal Reserve Bank (“Fed”) and the European Central Bank (“ECB”) as well as a commensurate improvement in macroeconomic conditions. During this time, global equity valuations rose, credit spreads contracted, and high-quality sovereign yields increased modestly.
During the middle of the period, however, conditions worsened, driven by broadly weaker global macroeconomic indicators, as well as renewed concerns over the eurozone’s capacity and determination to address its ongoing crisis. Despite this deterioration, broad market sentiment remained relatively resilient as equity markets generally maintained gains and credit spreads did not indicate deterioration.
However, this renewed weakness in the fundamentals precipitated a further round of monetary easing by both the Fed (through a third round of quantitative easing) and the ECB (through a new bond purchase facility) in the second half of the period, which soon instilled additional confidence in risk markets. Nonetheless, towards the end of the period, weaker equity earnings reports and declining forward guidance caused market sentiment to soften. In addition, as we moved toward year end, the fiscal cliff negotiations between the Republicans in the U.S. Congress and President Obama were a particular source of market attention, where uncertainty surrounding the fiscal negotiations continued right up to the end-of-year deadline.
Detractors from Performance
Within the equity portion of the fund, stock selection in the retailing sector was a primary detractor from performance relative to the S&P 500 Index. Within this sector, holdings of discount department store Kohl’s, and not holding shares of strong-performing home improvement retailer Home Depot, held back relative results. During the reporting period, shares of Home Depot benefited from increased growth in existing home sales and continued momentum in the company’s home maintenance and repair divisions.
Stocks in other sectors that held back relative performance included voice and data communications services company Vodafone Group (b) (United Kingdom), oil and gas exploration and production company Occidental Petroleum, oil and gas exploration and production company Apache, and payment service provider Western Union as all four stocks lagged the benchmark. Not holding shares of strong-performing computer and personal electronics maker Apple, financial services firm Citigroup, biotech firm Gilead Sciences, and online auctioneer Ebay also weakened relative results. Shares of Gilead Sciences spiked late in the reporting period as the firm announced the phase III testing of its GS-7977 drug which was created to cure the hepatitis C virus. The test, which involved 25 patients, showed a 100% cure rate after four weeks of administering the drug to patients.
Contributors to Performance
Within the equity portion of the fund, an overweight allocation to the financial services sector contributed to performance relative to the S&P 500 Index. Within this sector, holdings of global financial services firm JPMorgan Chase, investment banking firm Goldman Sachs Group, and global financial services provider Bank of New York Mellon benefited relative results as all three stocks turned in strong performance for the period.
Stock selection in both the industrial goods & services and leisure sectors also benefited relative performance. Within the leisure sector, holdings of media conglomerate Walt Disney and cable and internet provider Comcast positively impacted relative results. The fund’s timing of ownership in fast-food giant McDonald’s also aided relative performance. There were no stocks within the industrial goods & services sector that were among the fund’s top relative contributors.
Elsewhere, holdings of protective and decorative coatings manufacturer PPG Industries, alcoholic beverage producer Diageo (b) (United Kingdom), and life sciences supply company Thermo Fisher Scientific strengthened relative returns as all three stocks outperformed the benchmark over the reporting period. An underweight allocation to weak-performing semiconductor company Intel was another factor that positively affected relative performance. Shares of Intel depreciated as the company reported weak
4
Table of Contents
MFS Total Return Portfolio
Management Review – continued
revenue due to competing tablets, soft demand for personal computers, and concerns over the macroeconomic environment. A significant reduction in its gross margin guidance late in the period, as a result of too much inventory and under-utilization charges, pressured earnings estimates and weighed on its share price.
Within the fixed income segment, the fund’s greater exposure to the banking and financial sectors, and to BBB (r) rated corporate debt, aided performance relative to the Barclays Index. The portion of the fund’s return derived from yield, which was greater than that of the Barclays Index, was another positive factor for relative results.
Respectfully,
| Nevin Chitkara | William Douglas | Steven Gorham | Richard Hawkins | |||
| Portfolio Manager | Portfolio Manager | Portfolio Manager | Portfolio Manager | |||
| Joshua Marston | Brooks Taylor | |||||
| Portfolio Manager | Portfolio Manager | |||||
| (b) | Security is not a benchmark constituent. |
| (r) | Bonds rated “BBB”, “Baa”, or higher are considered investment grade; bonds rated “BB”, “Ba”, or below are considered non-investment grade. The source for bond quality ratings is Moody’s Investors Service, Standard & Poor’s and Fitch, Inc. and are applied using the following hierarchy: If all three agencies provide a rating, the middle rating (after dropping the highest and lowest ratings) is assigned; if two of the three agencies rate a security, the lower of the two is assigned. Ratings are shown in the S&P and Fitch scale (e.g., AAA). For securities which are not rated by any of the three agencies, the security is considered Not Rated. |
The views expressed in this report are those of the portfolio managers only through the end of the period of the report as stated on the cover and do not necessarily reflect the views of MFS or any other person in the MFS organization. These views are subject to change at any time based on market or other conditions, and MFS disclaims any responsibility to update such views. These views may not be relied upon as investment advice or an indication of trading intent on behalf of any MFS portfolio. References to specific securities are not recommendations of such securities, and may not be representative of any MFS portfolio’s current or future investments.
5
Table of Contents
MFS Total Return Portfolio
PERFORMANCE SUMMARY THROUGH 12/31/12
The following chart illustrates the historical performance of the fund in comparison to its benchmark(s). Benchmarks are unmanaged and may not be invested in directly. Benchmark returns do not reflect any fees or expenses. The performance of other share classes will be greater than or less than that of the class depicted below. (See Notes to Performance Summary.)
Performance data shown represents past performance and is no guarantee of future results. Investment return and principal value fluctuate so your units, when sold, may be worth more or less than the original cost; current performance may be lower or higher than quoted. The performance shown does not reflect the deduction of taxes, if any, that a contract holder would pay on fund distributions or the redemption of contract units. The returns for the fund shown also do not reflect the deduction of expenses associated with variable products, such as mortality and expense risk charges, separate account charges, and sales charges imposed by the insurance company separate accounts. Such expenses would reduce the overall returns shown.
Growth of a Hypothetical $10,000 Investment
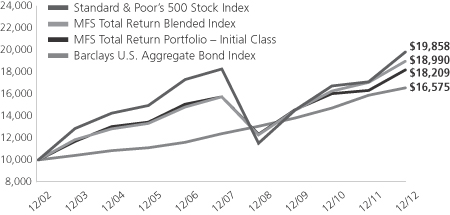
Total Returns through 12/31/12
Average annual total returns
| Share Class | Class inception date | 1-yr | 5-yr | 10-yr | ||||||||
| Initial Class | 5/11/88 | 11.34% | 2.94% | 6.18% | ||||||||
| Service Class | 8/24/01 | 11.02% | 2.68% | 5.90% | ||||||||
| Comparative benchmarks | ||||||||||||
| Standard & Poor’s 500 Stock Index (f) | 16.00% | 1.66% | 7.10% | |||||||||
| Barclays U.S. Aggregate Bond Index (f) | 4.21% | 5.95% | 5.18% | |||||||||
| MFS Total Return Blended Index (f)(x) | 11.31% | 3.81% | 6.62% | |||||||||
| (f) | Source: FactSet Research Systems Inc. |
| (x) | MFS Total Return Blended Index consists of 60% Standard & Poor’s 500 Stock Index and 40% Barclays U.S. Aggregate Bond Index. |
Benchmark Definitions
Barclays U.S. Aggregate Bond Index – a market capitalization-weighted index that measures the performance of the U.S. investment-grade, fixed rate bond market, with index components for government and corporate securities, mortgage pass-through securities, and asset-backed securities with at least one year to final maturity.
Standard & Poor’s 500 Stock Index – a market capitalization-weighted index of 500 widely held equity securities, designed to measure broad U.S. equity performance.
It is not possible to invest directly in an index.
Notes to Performance Summary
Average annual total return represents the average annual change in value for each share class for the periods presented.
Performance results reflect any applicable expense subsidies and waivers in effect during the periods shown. Without such subsidies and waivers the fund’s performance results would be less favorable. Please see the prospectus and financial statements for complete details. All results are historical and assume the reinvestment of any dividends and capital gains distributions.
6
Table of Contents
MFS Total Return Portfolio
Performance Summary – continued
Performance results do not include adjustments made for financial reporting purposes in accordance with U.S. generally accepted accounting principles and may differ from amounts reported in the financial highlights.
From time to time the fund may receive proceeds from litigation settlements, without which performance would be lower.
7
Table of Contents
MFS Total Return Portfolio
Fund Expenses Borne by the Contract Holders During the Period,
July 1, 2012 through December 31, 2012
As a contract holder of the fund, you incur ongoing costs, including management fees; distribution and/or service (12b-1) fees; and other fund expenses. This example is intended to help you understand your ongoing costs (in dollars) of investing in the fund and to compare these costs with the ongoing costs of investing in other mutual funds.
The example is based on an investment of $1,000 invested at the beginning of the period and held for the entire period July 1, 2012 through December 31, 2012.
Actual Expenses
The first line for each share class in the following table provides information about actual account values and actual expenses. You may use the information in this line, together with the amount you invested, to estimate the expenses that you paid over the period. Simply divide your account value by $1,000 (for example, an $8,600 account value divided by $1,000 = 8.6), then multiply the result by the number in the first line under the heading entitled “Expenses Paid During Period” to estimate the expenses you paid on your account during this period.
Hypothetical Example for Comparison Purposes
The second line for each share class in the following table provides information about hypothetical account values and hypothetical expenses based on the fund’s actual expense ratio and an assumed rate of return of 5% per year before expenses, which is not the fund’s actual return. The hypothetical account values and expenses may not be used to estimate the actual ending account balance or expenses you paid for the period. You may use this information to compare the ongoing costs of investing in the fund and other funds. To do so, compare this 5% hypothetical example with the 5% hypothetical examples that appear in the shareholder reports of the other funds.
Please note that the expenses shown in the table are meant to highlight the fund’s ongoing costs only and do not take into account the fees and expenses imposed under the variable contracts through which your investment in the fund is made. Therefore, the second line for each share class in the table is useful in comparing ongoing costs associated with an investment in vehicles (such as the fund) which fund benefits under variable annuity and variable life insurance contracts and to qualified pension and retirement plans only, and will not help you determine the relative total costs of investing in the fund through variable annuity and variable life insurance contracts. If the fees and expenses imposed under the variable contracts were included, your costs would have been higher.
| Share Class | Annualized Expense Ratio | Beginning Account Value 7/01/12 | Ending Account Value 12/31/12 | Expenses Paid During Period (p) 7/01/12-12/31/12 | ||||||||||||||
| Initial Class | Actual | 0.72% | $1,000.00 | $1,057.41 | $3.72 | |||||||||||||
| Hypothetical (h) | 0.72% | $1,000.00 | $1,021.52 | $3.66 | ||||||||||||||
| Service Class | Actual | 0.97% | $1,000.00 | $1,055.65 | $5.01 | |||||||||||||
| Hypothetical (h) | 0.97% | $1,000.00 | $1,020.26 | $4.93 | ||||||||||||||
| (h) | 5% class return per year before expenses. |
| (p) | Expenses paid are equal to each class’s annualized expense ratio, as shown above, multiplied by the average account value over the period, multiplied by the number of days in the period, divided by the number of days in the year. |
8
Table of Contents
MFS Total Return Portfolio
PORTFOLIO OF INVESTMENTS – 12/31/12
The Portfolio of Investments is a complete list of all securities owned by your fund. It is categorized by broad-based asset classes.
| Issuer | Shares/Par | Value ($) | ||||||
| COMMON STOCKS – 60.8% | ||||||||
| Aerospace – 4.4% | ||||||||
| Honeywell International, Inc. | 210,650 | $ | 13,369,955 | |||||
| Lockheed Martin Corp. | 209,310 | 19,317,219 | ||||||
| Northrop Grumman Corp. | 60,120 | 4,062,909 | ||||||
| Precision Castparts Corp. | 14,420 | 2,731,435 | ||||||
| United Technologies Corp. | 188,670 | 15,472,826 | ||||||
|
| |||||||
| $ | 54,954,344 | |||||||
|
| |||||||
| Alcoholic Beverages – 0.9% | ||||||||
| Diageo PLC | 392,796 | $ | 11,435,282 | |||||
|
| |||||||
| Automotive – 1.2% | ||||||||
| Delphi Automotive PLC (a) | 133,460 | $ | 5,104,844 | |||||
| General Motors Co. (a) | 61,300 | 1,767,278 | ||||||
| Johnson Controls, Inc. | 267,670 | 8,217,469 | ||||||
|
| |||||||
| $ | 15,089,591 | |||||||
|
| |||||||
| Broadcasting – 2.3% | ||||||||
| Omnicom Group, Inc. | 151,910 | $ | 7,589,424 | |||||
| Viacom, Inc., “B” | 160,280 | 8,453,167 | ||||||
| Walt Disney Co. | 254,560 | 12,674,542 | ||||||
|
| |||||||
| $ | 28,717,133 | |||||||
|
| |||||||
| Brokerage & Asset Managers – 1.1% | ||||||||
| BlackRock, Inc. | 38,689 | $ | 7,997,403 | |||||
| Franklin Resources, Inc. | 46,710 | 5,871,447 | ||||||
|
| |||||||
| $ | 13,868,850 | |||||||
|
| |||||||
| Business Services – 1.1% | ||||||||
| Accenture PLC, “A” | 153,820 | $ | 10,229,030 | |||||
| Dun & Bradstreet Corp. | 23,370 | 1,838,051 | ||||||
| Fiserv, Inc. (a) | 25,640 | 2,026,329 | ||||||
|
| |||||||
| $ | 14,093,410 | |||||||
|
| |||||||
| Cable TV – 0.8% | ||||||||
| Comcast Corp., “Special A” | 288,790 | $ | 10,382,001 | |||||
|
| |||||||
| Chemicals – 2.3% | ||||||||
| 3M Co. | 135,580 | $ | 12,588,603 | |||||
| Celanese Corp. | 55,860 | 2,487,446 | ||||||
| E.I. du Pont de Nemours & Co. | 37,870 | 1,703,014 | ||||||
| PPG Industries, Inc. | 85,970 | 11,636,040 | ||||||
|
| |||||||
| $ | 28,415,103 | |||||||
|
| |||||||
| Computer Software – 1.0% | ||||||||
| Check Point Software Technologies Ltd. (a) | 41,780 | $ | 1,990,399 | |||||
| Oracle Corp. | 324,020 | 10,796,346 | ||||||
|
| |||||||
| $ | 12,786,745 | |||||||
|
| |||||||
| Computer Software – Systems – 1.1% | ||||||||
| Hewlett-Packard Co. | 236,850 | $ | 3,375,113 | |||||
| International Business Machines Corp. | 50,300 | 9,634,965 | ||||||
|
| |||||||
| $ | 13,010,078 | |||||||
|
| |||||||
| Issuer | Shares/Par | Value ($) | ||||||
| COMMON STOCKS – continued | ||||||||
| Construction – 0.5% | ||||||||
| Stanley Black & Decker, Inc. | 78,967 | $ | 5,841,189 | |||||
|
| |||||||
| Consumer Products – 0.6% | ||||||||
| Procter & Gamble Co. | 83,844 | $ | 5,692,169 | |||||
| Reckitt Benckiser Group PLC | 36,206 | 2,268,079 | ||||||
|
| |||||||
| $ | 7,960,248 | |||||||
|
| |||||||
| Electrical Equipment – 1.8% | ||||||||
| Danaher Corp. | 258,160 | $ | 14,431,144 | |||||
| Pentair Ltd. | 41,391 | 2,034,368 | ||||||
| Tyco International Ltd. | 212,270 | 6,208,898 | ||||||
|
| |||||||
| $ | 22,674,410 | |||||||
|
| |||||||
| Electronics – 0.4% | ||||||||
| Intel Corp. | 133,260 | $ | 2,749,154 | |||||
| Microchip Technology, Inc. | 55,980 | 1,824,388 | ||||||
|
| |||||||
| $ | 4,573,542 | |||||||
|
| |||||||
| Energy – Independent – 2.7% | ||||||||
| Anadarko Petroleum Corp. | 73,060 | $ | 5,429,089 | |||||
| Apache Corp. | 95,070 | 7,462,995 | ||||||
| EOG Resources, Inc. | 22,450 | 2,711,736 | ||||||
| EQT Corp. | 42,960 | 2,533,781 | ||||||
| Noble Energy, Inc. | 58,660 | 5,968,068 | ||||||
| Occidental Petroleum Corp. | 125,220 | 9,593,104 | ||||||
|
| |||||||
| $ | 33,698,773 | |||||||
|
| |||||||
| Energy – Integrated – 2.8% | ||||||||
| Chevron Corp. | 133,662 | $ | 14,454,209 | |||||
| Exxon Mobil Corp. | 243,138 | 21,043,594 | ||||||
|
| |||||||
| $ | 35,497,803 | |||||||
|
| |||||||
| Engineering – Construction – 0.2% | ||||||||
| Fluor Corp. | 41,920 | $ | 2,462,381 | |||||
|
| |||||||
| Food & Beverages – 3.1% | ||||||||
| Coca-Cola Enterprises, Inc. | 33,610 | $ | 1,066,445 | |||||
| Dr Pepper Snapple Group, Inc. | 37,320 | 1,648,798 | ||||||
| General Mills, Inc. | 214,120 | 8,652,589 | ||||||
| Groupe Danone | 102,701 | 6,785,417 | ||||||
| J.M. Smucker Co. | 12,500 | 1,078,000 | ||||||
| Kellogg Co. | 25,580 | 1,428,643 | ||||||
| Kraft Foods Group, Inc. | 15,846 | 720,518 | ||||||
| Mondelez International, Inc. | 86,540 | 2,204,174 | ||||||
| Nestle S.A. | 163,760 | 10,670,853 | ||||||
| PepsiCo, Inc. | 71,610 | 4,900,272 | ||||||
|
| |||||||
| $ | 39,155,709 | |||||||
|
| |||||||
| Food & Drug Stores – 1.2% | ||||||||
| CVS Caremark Corp. | 216,946 | $ | 10,489,339 | |||||
| Kroger Co. | 84,320 | 2,194,006 | ||||||
| Walgreen Co. | 51,830 | 1,918,228 | ||||||
|
| |||||||
| $ | 14,601,573 | |||||||
|
| |||||||
9
Table of Contents
MFS Total Return Portfolio
Portfolio of Investments – continued
| Issuer | Shares/Par | Value ($) | ||||||
| COMMON STOCKS – continued | ||||||||
| General Merchandise – 1.1% | ||||||||
| Kohl’s Corp. | 97,820 | $ | 4,204,304 | |||||
| Target Corp. | 166,460 | 9,849,438 | ||||||
|
| |||||||
| $ | 14,053,742 | |||||||
|
| |||||||
| Insurance – 4.0% | ||||||||
| ACE Ltd. | 146,620 | $ | 11,700,276 | |||||
| Aon PLC | 121,210 | 6,739,276 | ||||||
| Chubb Corp. | 38,610 | 2,908,105 | ||||||
| MetLife, Inc. | 291,770 | 9,610,904 | ||||||
| Prudential Financial, Inc. | 181,510 | 9,679,928 | ||||||
| Travelers Cos., Inc. | 125,460 | 9,010,537 | ||||||
|
| |||||||
| $ | 49,649,026 | |||||||
|
| |||||||
| Leisure & Toys – 0.4% | ||||||||
| Hasbro, Inc. | 130,570 | $ | 4,687,463 | |||||
|
| |||||||
| Machinery & Tools – 0.5% | ||||||||
| Eaton Corp. PLC | 120,840 | $ | 6,549,528 | |||||
|
| |||||||
| Major Banks – 7.2% | ||||||||
| Bank of America Corp. | 424,390 | $ | 4,922,924 | |||||
| Bank of New York Mellon Corp. | 491,229 | 12,624,585 | ||||||
| Goldman Sachs Group, Inc. | 123,050 | 15,696,258 | ||||||
| JPMorgan Chase & Co. | 640,184 | 28,148,890 | ||||||
| Morgan Stanley | 107,750 | 2,060,180 | ||||||
| PNC Financial Services Group, Inc. | 79,540 | 4,637,977 | ||||||
| State Street Corp. | 168,400 | 7,916,484 | ||||||
| Wells Fargo & Co. | 417,400 | 14,266,732 | ||||||
|
| |||||||
| $ | 90,274,030 | |||||||
|
| |||||||
| Medical & Health Technology & Services – 0.5% | ||||||||
| AmerisourceBergen Corp. | 55,530 | $ | 2,397,785 | |||||
| Express Scripts Holding Co. (a) | 34,460 | 1,860,840 | ||||||
| Quest Diagnostics, Inc. | 34,050 | 1,984,094 | ||||||
|
| |||||||
| $ | 6,242,719 | |||||||
|
| |||||||
| Medical Equipment – 2.1% | ||||||||
| Becton, Dickinson & Co. | 25,450 | $ | 1,989,936 | |||||
| Covidien PLC | 95,530 | 5,515,902 | ||||||
| Medtronic, Inc. | 103,810 | 4,258,286 | ||||||
| St. Jude Medical, Inc. | 163,810 | 5,920,093 | ||||||
| Thermo Fisher Scientific, Inc. | 134,380 | 8,570,756 | ||||||
|
| |||||||
| $ | 26,254,973 | |||||||
|
| |||||||
| Metals & Mining – 0.1% | ||||||||
| Cliffs Natural Resources, Inc. | 19,640 | $ | 757,318 | |||||
|
| |||||||
| Natural Gas – Pipeline – 0.3% | ||||||||
| Williams Cos., Inc. | 127,840 | $ | 4,185,482 | |||||
|
| |||||||
| Oil Services – 0.4% | ||||||||
| Schlumberger Ltd. | 27,330 | $ | 1,893,696 | |||||
| Transocean, Inc. | 77,840 | 3,475,556 | ||||||
|
| |||||||
| $ | 5,369,252 | |||||||
|
| |||||||
| Other Banks & Diversified Financials – 1.2% | ||||||||
| American Express Co. | 34,530 | $ | 1,984,784 | |||||
| MasterCard, Inc., “A” | 3,686 | 1,810,858 | ||||||
| Issuer | Shares/Par | Value ($) | ||||||
| COMMON STOCKS – continued | ||||||||
| Other Banks & Diversified Financials – continued | ||||||||
| SunTrust Banks, Inc. | 60,760 | $ | 1,722,546 | |||||
| Visa, Inc., “A” | 33,580 | 5,090,056 | ||||||
| Western Union Co. | 199,790 | 2,719,142 | ||||||
| Zions Bancorporation | 87,740 | 1,877,636 | ||||||
|
| |||||||
| $ | 15,205,022 | |||||||
|
| |||||||
| Pharmaceuticals – 4.8% | ||||||||
| Abbott Laboratories | 159,310 | $ | 10,434,805 | |||||
| Bayer AG | 25,022 | 2,376,152 | ||||||
| Johnson & Johnson | 285,100 | 19,985,510 | ||||||
| Merck & Co., Inc. | 86,640 | 3,547,042 | ||||||
| Pfizer, Inc. | 860,748 | 21,587,560 | ||||||
| Roche Holding AG | 10,854 | 2,211,230 | ||||||
|
| |||||||
| $ | 60,142,299 | |||||||
|
| |||||||
| Printing & Publishing – 0.4% | ||||||||
| McGraw-Hill Cos., Inc. | 36,540 | $ | 1,997,642 | |||||
| Moody’s Corp. | 48,430 | 2,436,998 | ||||||
|
| |||||||
| $ | 4,434,640 | |||||||
|
| |||||||
| Railroad & Shipping – 0.3% | ||||||||
| Canadian National Railway Co. | 20,700 | $ | 1,883,907 | |||||
| Union Pacific Corp. | 13,980 | 1,757,566 | ||||||
|
| |||||||
| $ | 3,641,473 | |||||||
|
| |||||||
| Restaurants – 0.3% | ||||||||
| McDonald’s Corp. | 43,460 | $ | 3,833,607 | |||||
|
| |||||||
| Specialty Chemicals – 0.6% | ||||||||
| Air Products & Chemicals, Inc. | 85,330 | $ | 7,169,427 | |||||
|
| |||||||
| Specialty Stores – 0.5% | ||||||||
| Advance Auto Parts, Inc. | 54,660 | $ | 3,954,651 | |||||
| Staples, Inc. | 227,620 | 2,594,868 | ||||||
|
| |||||||
| $ | 6,549,519 | |||||||
|
| |||||||
| Telecommunications – Wireless – 0.8% | ||||||||
| Vodafone Group PLC | 4,127,144 | $ | 10,379,215 | |||||
|
| |||||||
| Telephone Services – 1.3% | ||||||||
| AT&T, Inc. | 409,480 | $ | 13,803,571 | |||||
| CenturyLink, Inc. | 46,738 | 1,828,391 | ||||||
|
| |||||||
| $ | 15,631,962 | |||||||
|
| |||||||
| Tobacco – 2.7% | ||||||||
| Altria Group, Inc. | 64,870 | $ | 2,038,215 | |||||
| Lorillard, Inc. | 57,060 | 6,657,190 | ||||||
| Philip Morris International, Inc. | 300,260 | 25,113,746 | ||||||
|
| |||||||
| $ | 33,809,151 | |||||||
|
| |||||||
| Trucking – 0.7% | ||||||||
| United Parcel Service, Inc., “B” | 118,220 | $ | 8,716,361 | |||||
|
| |||||||
| Utilities – Electric Power – 1.1% | ||||||||
| Duke Energy Corp. | 30,920 | $ | 1,972,696 | |||||
| NRG Energy, Inc. | 77,330 | 1,777,817 | ||||||
| PG&E Corp. | 64,200 | 2,579,556 | ||||||
| PPL Corp. | 144,630 | 4,140,757 | ||||||
10
Table of Contents
MFS Total Return Portfolio
Portfolio of Investments – continued
| Issuer | Shares/Par | Value ($) | ||||||
| COMMON STOCKS – continued | ||||||||
| Utilities – Electric Power – continued | ||||||||
| Public Service Enterprise Group, Inc. | 102,320 | $ | 3,130,992 | |||||
|
| |||||||
| $ | 13,601,818 | |||||||
|
| |||||||
| Total Common Stocks (Identified Cost, $685,488,211) | $ | 760,356,192 | ||||||
|
| |||||||
| BONDS – 38.2% | ||||||||
| Agency – Other – 0.1% | ||||||||
| Financing Corp., 9.65%, 2018 | $ | 535,000 | $ | 781,914 | ||||
|
| |||||||
| Asset-Backed & Securitized – 2.0% | ||||||||
| Bayview Financial Revolving Mortgage Loan Trust, FRN, 1.809%, 2040 (z) | $ | 1,369,881 | $ | 865,946 | ||||
| BlackRock Capital Finance LP, 7.75%, 2026 (n) | 165,536 | 20,899 | ||||||
| Capital Trust Realty Ltd., CDO, 5.16%, 2035 (n) | 557,058 | 562,406 | ||||||
| Citigroup Commercial Mortgage Trust, FRN, 5.702%, 2017 | 3,050,000 | 3,593,391 | ||||||
| Citigroup/Deutsche Bank Commercial Mortgage Trust, 5.322%, 2049 | 137,638 | 157,886 | ||||||
| Credit Suisse Mortgage Capital Certificate, FRN, 5.695%, 2017 | 2,034,095 | 2,357,121 | ||||||
| GMAC Mortgage Corp. Loan Trust, FRN, 5.805%, 2036 | 722,537 | 641,498 | ||||||
| JPMorgan Chase Commercial Mortgage Securities Corp., 4.78%, 2042 | 1,772,000 | 1,913,441 | ||||||
| JPMorgan Chase Commercial Mortgage Securities Corp., 5.552%, 2045 | 1,131,871 | 1,300,228 | ||||||
| JPMorgan Chase Commercial Mortgage Securities Corp., “A3”, FRN, 5.929%, 2051 | 2,664,573 | 2,834,565 | ||||||
| JPMorgan Chase Commercial Mortgage Securities Corp., “A4”, FRN, 5.811%, 2049 | 777,548 | 906,738 | ||||||
| JPMorgan Chase Commercial Mortgage Securities Corp., FRN, 5.213%, 2041 | 2,024,903 | 2,126,691 | ||||||
| JPMorgan Chase Commercial Mortgage Securities Corp., FRN, 5.475%, 2043 | 1,806,931 | 2,040,740 | ||||||
| Merrill Lynch Mortgage Trust, “A3”, FRN, 5.849%, 2050 | 28,792 | 30,617 | ||||||
| Merrill Lynch/Countrywide Commercial Mortgage Trust, FRN, 5.736%, 2050 | 2,460,824 | 2,819,130 | ||||||
| Morgan Stanley Capital I, Inc., FRN, 0.978%, 2030 (i)(n) | 6,555,740 | 138,851 | ||||||
| Residential Asset Mortgage Products, Inc., FRN, 4.97%, 2034 | 136,315 | 136,462 | ||||||
| Residential Funding Mortgage Securities, Inc., FRN, 5.32%, 2035 | 1,509,961 | 907,429 | ||||||
| Spirit Master Funding LLC, 5.05%, 2023 (z) | 1,222,197 | 1,155,770 | ||||||
| Wachovia Bank Commercial Mortgage Trust, “A4”, FRN, 5.921%, 2017 | 772,500 | 906,313 | ||||||
|
| |||||||
| $ | 25,416,122 | |||||||
|
| |||||||
| Issuer | Shares/Par | Value ($) | ||||||
| BONDS – continued | ||||||||
| Automotive – 0.3% | ||||||||
| Hyundai Capital America, 2.125%, 2017 (n) | $ | 296,000 | $ | 298,119 | ||||
| Toyota Motor Credit Corp., 3.2%, 2015 | 770,000 | 816,514 | ||||||
| Toyota Motor Credit Corp., 3.4%, 2021 | 1,120,000 | 1,219,751 | ||||||
| Volkswagen International Finance N.V., 2.375%, 2017 (n) | 1,084,000 | 1,116,498 | ||||||
|
| |||||||
| $ | 3,450,882 | |||||||
|
| |||||||
| Broadcasting – 0.1% | ||||||||
| News America, Inc., 8.5%, 2025 | $ | 1,253,000 | $ | 1,701,306 | ||||
|
| |||||||
| Cable TV – 0.5% | ||||||||
| Cox Communications, Inc., 4.625%, 2013 | $ | 1,282,000 | $ | 1,304,072 | ||||
| DIRECTV Holdings LLC, 4.6%, 2021 | 1,610,000 | 1,742,891 | ||||||
| Time Warner Entertainment Co. LP, 8.375%, 2033 | 1,940,000 | 2,831,372 | ||||||
|
| |||||||
| $ | 5,878,335 | |||||||
|
| |||||||
| Conglomerates – 0.2% | ||||||||
| ABB Finance (USA), Inc., 2.875%, 2022 | $ | 393,000 | $ | 402,370 | ||||
| General Electric Co., 2.7%, 2022 | 1,330,000 | 1,355,678 | ||||||
| United Technologies Corp., 3.1%, 2022 | 540,000 | 571,854 | ||||||
|
| |||||||
| $ | 2,329,902 | |||||||
|
| |||||||
| Consumer Services – 0.0% | ||||||||
| eBay, Inc., 1.35%, 2017 | $ | 367,000 | $ | 371,274 | ||||
|
| |||||||
| Defense Electronics – 0.1% | ||||||||
| BAE Systems Holdings, Inc., 5.2%, 2015 (n) | $ | 862,000 | $ | 943,968 | ||||
|
| |||||||
| Emerging Market Quasi-Sovereign – 0.4% | ||||||||
| CNOOC Finance (2012) Ltd., 3.875%, 2022 (n) | $ | 1,280,000 | $ | 1,360,228 | ||||
| Corporacion Nacional del Cobre de Chile, 3.75%, 2020 (n) | 342,000 | 369,812 | ||||||
| Petrobras International Finance Co., 5.375%, 2021 | 481,000 | 541,519 | ||||||
| Petrobras International Finance Co., 6.75%, 2041 | 340,000 | 430,810 | ||||||
| Petroleos Mexicanos, 8%, 2019 | 918,000 | 1,200,285 | ||||||
| Ras Laffan Liquefied Natural Gas Co. Ltd., 5.832%, 2016 (n) | 730,432 | 804,571 | ||||||
|
| |||||||
| $ | 4,707,225 | |||||||
|
| |||||||
| Emerging Market Sovereign – 0.4% | ||||||||
| Republic of Peru, 7.35%, 2025 | $ | 103,000 | $ | 149,247 | ||||
| Russian Federation, 3.625%, 2015 (z) | 2,700,000 | 2,852,550 | ||||||
| United Mexican States, 4.75%, 2044 | 1,739,000 | 1,965,070 | ||||||
|
| |||||||
| $ | 4,966,867 | |||||||
|
| |||||||
| Energy – Independent – 0.1% | ||||||||
| Apache Corp., 3.25%, 2022 | $ | 534,000 | $ | 565,936 | ||||
| Apache Corp., 4.75%, 2043 | 407,000 | 443,063 | ||||||
| EOG Resources, Inc., 2.625%, 2023 | 382,000 | 384,688 | ||||||
| Hess Corp., 8.125%, 2019 | 350,000 | 460,637 | ||||||
|
| |||||||
| $ | 1,854,324 | |||||||
|
| |||||||
11
Table of Contents
MFS Total Return Portfolio
Portfolio of Investments – continued
| Issuer | Shares/Par | Value ($) | ||||||
| BONDS – continued | ||||||||
| Energy – Integrated – 0.6% | ||||||||
| BP Capital Markets PLC, 4.5%, 2020 | $ | 371,000 | $ | 427,563 | ||||
| BP Capital Markets PLC, 4.742%, 2021 | 1,061,000 | 1,242,467 | ||||||
| Husky Energy, Inc., 5.9%, 2014 | 944,000 | 1,011,824 | ||||||
| Husky Energy, Inc., 7.25%, 2019 | 959,000 | 1,245,383 | ||||||
| Petro-Canada, 6.05%, 2018 | 1,942,000 | 2,361,699 | ||||||
| Total Capital International S.A., 1.55%, 2017 | 1,570,000 | 1,594,205 | ||||||
|
| |||||||
| $ | 7,883,141 | |||||||
|
| |||||||
| Financial Institutions – 0.0% | ||||||||
| General Electric Capital Corp., 5.45%, 2013 | $ | 179,000 | $ | 179,308 | ||||
|
| |||||||
| Food & Beverages – 0.2% | ||||||||
| Anheuser-Busch InBev S.A., 8%, 2039 | $ | 1,270,000 | $ | 2,056,131 | ||||
| Kraft Foods Group, Inc., 3.5%, 2022 (n) | 525,000 | 560,368 | ||||||
| Molson Coors Brewing Co., 5%, 2042 | 446,000 | 499,815 | ||||||
|
| |||||||
| $ | 3,116,314 | |||||||
|
| |||||||
| Gaming & Lodging – 0.0% | ||||||||
| Wyndham Worldwide Corp., 6%, 2016 | $ | 9,000 | $ | 10,179 | ||||
|
| |||||||
| Insurance – 0.1% | ||||||||
| Metropolitan Life Global Funding I, 5.125%, 2013 (n) | $ | 690,000 | $ | 698,641 | ||||
| Metropolitan Life Global Funding I, 5.125%, 2014 (n) | 680,000 | 722,908 | ||||||
|
| |||||||
| $ | 1,421,549 | |||||||
|
| |||||||
| Insurance – Health – 0.1% | ||||||||
| WellPoint, Inc., 3.3%, 2023 | $ | 759,000 | $ | 778,738 | ||||
|
| |||||||
| Insurance – Property & Casualty – 0.3% | ||||||||
| Chubb Corp., 6.375% to 2017, FRN to 2067 | $ | 1,910,000 | $ | 2,081,900 | ||||
| Marsh & McLennan Cos., Inc., 4.8%, 2021 | 1,160,000 | 1,305,283 | ||||||
| ZFS Finance USA Trust V, 6.5% to 2017, FRN to 2067 (n) | 524,000 | 558,715 | ||||||
|
| |||||||
| $ | 3,945,898 | |||||||
|
| |||||||
| International Market Quasi-Sovereign – 0.7% | ||||||||
| Achmea Hypotheekbank N.V., 3.2%, 2014 (n) | $ | 663,000 | $ | 695,016 | ||||
| ING Bank N.V., 3.9%, 2014 (n) | 1,560,000 | 1,621,778 | ||||||
| Irish Life & Permanent PLC, 3.6%, 2013 (e)(n) | 1,900,000 | 1,900,013 | ||||||
| KFW International Finance, Inc., 4.875%, 2019 | 1,580,000 | 1,923,334 | ||||||
| Societe Financement de l’ Economie Francaise, 3.375%, 2014 (n) | 900,000 | 935,087 | ||||||
| Temasek Financial I Ltd., 2.375%, 2023 (n) | 2,270,000 | 2,235,737 | ||||||
|
| |||||||
| $ | 9,310,965 | |||||||
|
| |||||||
| Issuer | Shares/Par | Value ($) | ||||||
| BONDS – continued | ||||||||
| Local Authorities – 0.1% | ||||||||
| New Jersey Turnpike Authority Rev. (Build America Bonds), “F”, 7.414%, 2040 | $ | 1,280,000 | $ | 1,889,203 | ||||
|
| |||||||
| Machinery & Tools – 0.2% | ||||||||
| Atlas Copco AB, 5.6%, 2017 (n) | $ | 1,850,000 | $ | 2,157,418 | ||||
|
| |||||||
| Major Banks – 1.7% | ||||||||
| ABN AMRO Bank N.V., FRN, 2.083%, 2014 (n) | $ | 1,310,000 | $ | 1,325,183 | ||||
| Banco Santander U.S. Debt S.A.U., 3.781%, 2015 (n) | 700,000 | 703,983 | ||||||
| Bank of America Corp., 7.375%, 2014 | 590,000 | 638,880 | ||||||
| Bank of America Corp., 5.49%, 2019 | 829,000 | 920,868 | ||||||
| Bank of America Corp., 7.625%, 2019 | 840,000 | 1,074,840 | ||||||
| BNP Paribas, 7.195% to 2037, FRN to 2049 (n) | 800,000 | 820,000 | ||||||
| Commonwealth Bank of Australia, 5%, 2019 (n) | 840,000 | 976,165 | ||||||
| Credit Suisse New York, 5.5%, 2014 | 1,200,000 | 1,276,792 | ||||||
| Goldman Sachs Group, Inc., 5.625%, 2017 | 1,547,000 | 1,697,333 | ||||||
| HSBC Holdings PLC, 5.1%, 2021 | 842,000 | 994,302 | ||||||
| ING Bank N.V., 3.75%, 2017 (n) | 1,048,000 | 1,113,783 | ||||||
| JPMorgan Chase & Co., 6.3%, 2019 | 1,410,000 | 1,739,604 | ||||||
| JPMorgan Chase & Co., 3.25%, 2022 | 426,000 | 438,687 | ||||||
| Merrill Lynch & Co., Inc., 6.15%, 2013 | 1,320,000 | 1,341,190 | ||||||
| Morgan Stanley, 6.625%, 2018 | 1,790,000 | 2,109,649 | ||||||
| PNC Funding Corp., 5.625%, 2017 | 1,270,000 | 1,466,319 | ||||||
| Royal Bank of Scotland PLC, 2.55%, 2015 | 312,000 | 319,304 | ||||||
| Wachovia Corp., 5.25%, 2014 | 868,000 | 925,583 | ||||||
| Wells Fargo & Co., 2.1%, 2017 | 1,570,000 | 1,623,179 | ||||||
|
| |||||||
| $ | 21,505,644 | |||||||
|
| |||||||
| Medical & Health Technology & Services – 0.3% | ||||||||
| Aristotle Holding, Inc., 2.65%, 2017 (n) | $ | 1,640,000 | $ | 1,704,598 | ||||
| CareFusion Corp., 6.375%, 2019 | 1,400,000 | 1,669,427 | ||||||
|
| |||||||
| $ | 3,374,025 | |||||||
|
| |||||||
| Metals & Mining – 0.1% | ||||||||
| Vale Overseas Ltd., 4.625%, 2020 | $ | 337,000 | $ | 364,129 | ||||
| Vale Overseas Ltd., 6.875%, 2039 | 257,000 | 322,228 | ||||||
|
| |||||||
| $ | 686,357 | |||||||
|
| |||||||
| Mortgage-Backed – 12.3% | ||||||||
| Fannie Mae, 4.01%, 2013 | $ | 185,394 | $ | 186,418 | ||||
| Fannie Mae, 4.561%, 2014 | 781,585 | 808,745 | ||||||
| Fannie Mae, 4.826%, 2014 | 729,337 | 760,756 | ||||||
| Fannie Mae, 4.88%, 2014 | 288,643 | 303,677 | ||||||
| Fannie Mae, 4.56%, 2015 | 318,963 | 341,970 | ||||||
| Fannie Mae, 4.78%, 2015 | 441,641 | 475,256 | ||||||
| Fannie Mae, 4.856%, 2015 | 290,983 | 312,869 | ||||||
| Fannie Mae, 4.907%, 2015 | 41,582 | 44,954 | ||||||
| Fannie Mae, 4.997%, 2015 | 128,185 | 140,430 | ||||||
| Fannie Mae, 5.1%, 2015 | 480,000 | 524,181 | ||||||
| Fannie Mae, 5.09%, 2016 | 500,000 | 554,712 | ||||||
12
Table of Contents
MFS Total Return Portfolio
Portfolio of Investments – continued
| Issuer | Shares/Par | Value ($) | ||||||
| BONDS – continued | ||||||||
| Mortgage-Backed – continued | ||||||||
| Fannie Mae, 5.27%, 2016 | $ | 531,196 | $ | 614,613 | ||||
| Fannie Mae, 5.5%, 2016 - 2040 | 21,159,972 | 23,177,554 | ||||||
| Fannie Mae, 5.662%, 2016 | 412,397 | 461,988 | ||||||
| Fannie Mae, 5.725%, 2016 | 302,817 | 343,103 | ||||||
| Fannie Mae, 4.992%, 2017 | 75,980 | 80,942 | ||||||
| Fannie Mae, 5.05%, 2017 | 479,327 | 533,241 | ||||||
| Fannie Mae, 6%, 2017 - 2037 | 12,471,781 | 13,827,699 | ||||||
| Fannie Mae, 2.578%, 2018 | 843,000 | 902,646 | ||||||
| Fannie Mae, 3.849%, 2018 | 197,638 | 222,125 | ||||||
| Fannie Mae, 4.5%, 2018 - 2041 | 3,825,084 | 4,185,016 | ||||||
| Fannie Mae, 5%, 2018 - 2041 | 11,481,589 | 12,489,385 | ||||||
| Fannie Mae, 5.37%, 2018 | 600,000 | 684,152 | ||||||
| Fannie Mae, 4.6%, 2019 | 185,443 | 216,052 | ||||||
| Fannie Mae, 3%, 2027 | 1,642,237 | 1,735,691 | ||||||
| Fannie Mae, 7.5%, 2030 - 2031 | 161,696 | 198,187 | ||||||
| Fannie Mae, 6.5%, 2031 - 2037 | 3,450,164 | 3,903,180 | ||||||
| Fannie Mae, 4%, 2040 | 445,476 | 483,217 | ||||||
| Fannie Mae, 3.5%, 2041 - 2042 | 3,070,962 | 3,304,506 | ||||||
| Fannie Mae, TBA, 3%, 2042 | 1,670,000 | 1,746,194 | ||||||
| Fannie Mae, TBA, 3.5%, 2042 | 6,443,000 | 6,869,094 | ||||||
| Freddie Mac, 6%, 2016 - 2037 | 4,703,226 | 5,185,207 | ||||||
| Freddie Mac, 3.882%, 2017 | 406,817 | 457,184 | ||||||
| Freddie Mac, 5%, 2017 - 2039 | 6,987,459 | 7,597,674 | ||||||
| Freddie Mac, 2.303%, 2018 | 216,058 | 227,418 | ||||||
| Freddie Mac, 2.412%, 2018 | 594,000 | 628,418 | ||||||
| Freddie Mac, 3.154%, 2018 | 156,000 | 170,646 | ||||||
| Freddie Mac, 4.5%, 2018 - 2035 | 3,719,175 | 3,980,837 | ||||||
| Freddie Mac, 5.085%, 2019 | 1,523,000 | 1,805,481 | ||||||
| Freddie Mac, 5.5%, 2019 - 2037 | 5,801,592 | 6,322,762 | ||||||
| Freddie Mac, 3.808%, 2020 | 1,303,000 | 1,472,363 | ||||||
| Freddie Mac, 6.5%, 2034 - 2038 | 1,952,317 | 2,215,501 | ||||||
| Freddie Mac, 4%, 2040 - 2041 | 6,051,262 | 6,465,738 | ||||||
| Freddie Mac, 3%, 2042 | 1,290,000 | 1,349,950 | ||||||
| Freddie Mac, 3.5%, 2042 | 2,580,532 | 2,763,412 | ||||||
| Freddie Mac, TBA, 2.5%, 2027 | 1,662,000 | 1,734,453 | ||||||
| Freddie Mac, TBA, 3%, 2042 | 1,600,000 | 1,672,750 | ||||||
| Ginnie Mae, 4.5%, 2033 - 2041 | 6,957,553 | 7,668,108 | ||||||
| Ginnie Mae, 5%, 2033 - 2041 | 4,866,077 | 5,352,813 | ||||||
| Ginnie Mae, 5.5%, 2033 - 2035 | 2,398,431 | 2,649,832 | ||||||
| Ginnie Mae, 6%, 2033 - 2038 | 2,745,182 | 3,090,231 | ||||||
| Ginnie Mae, 3.5%, 2041 - 2042 | 2,246,077 | 2,450,160 | ||||||
| Ginnie Mae, 4%, 2041 | 3,411,540 | 3,747,655 | ||||||
| Ginnie Mae, TBA, 3%, 2042 | 4,110,000 | 4,363,035 | ||||||
|
| |||||||
| $ | 153,804,181 | |||||||
|
| |||||||
| Natural Gas – Pipeline – 0.4% | ||||||||
| Enterprise Products Operating LLC, 6.5%, 2019 | $ | 1,042,000 | $ | 1,305,840 | ||||
| Kinder Morgan Energy Partners LP, 7.4%, 2031 | 804,000 | 1,047,145 | ||||||
| Kinder Morgan Energy Partners LP, 7.75%, 2032 | 661,000 | 889,197 | ||||||
| Spectra Energy Capital LLC, 8%, 2019 | 1,040,000 | 1,373,506 | ||||||
|
| |||||||
| $ | 4,615,688 | |||||||
|
| |||||||
| Issuer | Shares/Par | Value ($) | ||||||
| BONDS – continued | ||||||||
| Network & Telecom – 0.2% | ||||||||
| AT&T, Inc., 5.55%, 2041 | $ | 539,000 | $ | 646,867 | ||||
| AT&T, Inc., 4.35%, 2045 (z) | 1,614,000 | 1,621,257 | ||||||
| Telecom Italia Capital, 5.25%, 2013 | 812,000 | 834,330 | ||||||
|
| |||||||
| $ | 3,102,454 | |||||||
|
| |||||||
| Oil Services – 0.1% | ||||||||
| Transocean, Inc., 3.8%, 2022 | $ | 638,000 | $ | 653,907 | ||||
|
| |||||||
| Other Banks & Diversified Financials – 0.6% | ||||||||
| American Express Co., 5.5%, 2016 | $ | 1,034,000 | $ | 1,182,133 | ||||
| Banco Bradesco S.A., 6.75%, 2019 (n) | 681,000 | 771,233 | ||||||
| Capital One Financial Corp., 6.15%, 2016 | 1,670,000 | 1,910,513 | ||||||
| Groupe BPCE S.A., 12.5% to 2019, FRN to 2049 (n) | 1,081,000 | 1,252,803 | ||||||
| Nordea Bank AB, 4.875%, 2021 (z) | 820,000 | 951,290 | ||||||
| Svenska Handelsbanken AB, 4.875%, 2014 (n) | 1,220,000 | 1,289,247 | ||||||
| Swedbank AB, 2.125%, 2017 (n) | 294,000 | 300,392 | ||||||
|
| |||||||
| $ | 7,657,611 | |||||||
|
| |||||||
| Pharmaceuticals – 0.6% | ||||||||
| AbbVie, Inc., 1.2%, 2015 (n) | $ | 2,310,000 | $ | 2,325,433 | ||||
| Hospira, Inc., 6.05%, 2017 | 1,164,000 | 1,351,360 | ||||||
| Roche Holdings, Inc., 6%, 2019 (n) | 1,578,000 | 1,964,283 | ||||||
| Teva Pharmaceutical Finance IV LLC, 3.65%, 2021 | 1,610,000 | 1,723,074 | ||||||
|
| |||||||
| $ | 7,364,150 | |||||||
|
| |||||||
| Real Estate – 0.8% | ||||||||
| Boston Properties, Inc., REIT, 5%, 2015 | $ | 411,000 | $ | 448,992 | ||||
| ERP Operating LP, REIT, 5.375%, 2016 | 320,000 | 364,282 | ||||||
| ERP Operating LP, REIT, 4.625%, 2021 | 1,141,000 | 1,285,237 | ||||||
| HCP, Inc., REIT, 5.375%, 2021 | 919,000 | 1,046,517 | ||||||
| HRPT Properties Trust, REIT, 6.25%, 2016 | 2,725,000 | 2,989,426 | ||||||
| Simon Property Group, Inc., REIT, 5.875%, 2017 | 1,131,000 | 1,339,098 | ||||||
| WEA Finance LLC, REIT, 6.75%, 2019 (n) | 457,000 | 566,146 | ||||||
| WEA Finance LLC, REIT, 4.625%, 2021 (n) | 1,240,000 | 1,388,443 | ||||||
|
| |||||||
| $ | 9,428,141 | |||||||
|
| |||||||
| Retailers – 0.4% | ||||||||
| Home Depot, Inc., 5.95%, 2041 | $ | 346,000 | $ | 467,194 | ||||
| Limited Brands, Inc., 5.25%, 2014 | 440,000 | 462,000 | ||||||
| Target Corp., 4%, 2042 | 1,292,000 | 1,327,374 | ||||||
| Wal-Mart Stores, Inc., 5.25%, 2035 | 2,435,000 | 2,958,031 | ||||||
|
| |||||||
| $ | 5,214,599 | |||||||
|
| |||||||
| Supranational – 0.2% | ||||||||
| Asian Development Bank, 2.75%, 2014 | $ | 1,120,000 | $ | 1,157,542 | ||||
| Asian Development Bank, 1.125%, 2017 | 729,000 | 742,238 | ||||||
|
| |||||||
| $ | 1,899,780 | |||||||
|
| |||||||
| Telecommunications – Wireless – 0.3% | ||||||||
| Crown Castle Towers LLC, 6.113%, 2020 (n) | $ | 888,000 | $ | 1,069,581 | ||||
13
Table of Contents
MFS Total Return Portfolio
Portfolio of Investments – continued
| Issuer | Shares/Par | Value ($) | ||||||
| BONDS – continued | ||||||||
| Telecommunications – Wireless – continued | ||||||||
| Crown Castle Towers LLC, 4.883%, 2020 (n) | $ | 440,000 | $ | 496,480 | ||||
| Rogers Communications, Inc., 6.8%, 2018 | 1,686,000 | 2,132,728 | ||||||
|
| |||||||
| $ | 3,698,789 | |||||||
|
| |||||||
| Tobacco – 0.1% | ||||||||
| B.A.T. International Finance PLC, 3.25%, 2022 (n) | $ | 1,302,000 | $ | 1,357,127 | ||||
|
| |||||||
| Transportation – Services – 0.1% | ||||||||
| ERAC USA Finance Co., 7%, 2037 (n) | $ | 1,423,000 | $ | 1,806,967 | ||||
|
| |||||||
| U.S. Government Agencies and Equivalents – 0.3% | ||||||||
| Aid-Egypt, 4.45%, 2015 | $ | 152,000 | $ | 168,297 | ||||
| Small Business Administration, 4.35%, 2023 | 18,122 | 19,859 | ||||||
| Small Business Administration, 4.77%, 2024 | 451,749 | 504,379 | ||||||
| Small Business Administration, 5.18%, 2024 | 768,199 | 860,381 | ||||||
| Small Business Administration, 5.52%, 2024 | 97,812 | 110,947 | ||||||
| Small Business Administration, 4.99%, 2024 | 721,194 | 813,878 | ||||||
| Small Business Administration, 4.95%, 2025 | 46,400 | 51,240 | ||||||
| Small Business Administration, 5.11%, 2025 | 1,462,231 | 1,639,729 | ||||||
|
| |||||||
| $ | 4,168,710 | |||||||
|
| |||||||
| U.S. Treasury Obligations – 12.3% | ||||||||
| U.S. Treasury Bonds, 8.5%, 2020 | $ | 2,604,000 | $ | 3,919,832 | ||||
| U.S. Treasury Bonds, 8%, 2021 | 357,000 | 551,258 | ||||||
| U.S. Treasury Bonds, 6%, 2026 | 499,000 | 722,068 | ||||||
| U.S. Treasury Bonds, 6.75%, 2026 | 440,000 | 679,800 | ||||||
| U.S. Treasury Bonds, 5.25%, 2029 | 159,000 | 220,190 | ||||||
| U.S. Treasury Bonds, 5.375%, 2031 | 79,000 | 112,773 | ||||||
| U.S. Treasury Bonds, 4.5%, 2036 | 94,000 | 123,713 | ||||||
| U.S. Treasury Bonds, 5%, 2037 | 7,130,000 | 10,059,988 | ||||||
| U.S. Treasury Bonds, 4.5%, 2039 | 14,282,200 | 18,926,143 | ||||||
| U.S. Treasury Notes, 1.375%, 2013 | 733,000 | 733,315 | ||||||
| U.S. Treasury Notes, 3.875%, 2013 | 281,000 | 282,273 | ||||||
| U.S. Treasury Notes, 1.375%, 2013 | 849,000 | 851,156 | ||||||
| U.S. Treasury Notes, 3.5%, 2013 | 420,000 | 425,841 | ||||||
| U.S. Treasury Notes, 2.75%, 2013 | 1,218,000 | 1,243,835 | ||||||
| U.S. Treasury Notes, 2%, 2013 | 2,545,000 | 2,586,952 | ||||||
| U.S. Treasury Notes, 1.5%, 2013 | 280,000 | 283,642 | ||||||
| U.S. Treasury Notes, 1.875%, 2014 | 24,095,000 | 24,559,022 | ||||||
| U.S. Treasury Notes, 1.875%, 2014 | 15,111,000 | 15,442,142 | ||||||
| U.S. Treasury Notes, 4.75%, 2014 | 150,000 | 159,258 | ||||||
| U.S. Treasury Notes, 0.5%, 2014 | 4,732,000 | 4,752,703 | ||||||
| U.S. Treasury Notes, 4.125%, 2015 | 4,512,000 | 4,917,728 | ||||||
| U.S. Treasury Notes, 2.125%, 2015 | 15,410,000 | 16,078,162 | ||||||
| U.S. Treasury Notes, 2.625%, 2016 | 936,000 | 1,001,593 | ||||||
| U.S. Treasury Notes, 5.125%, 2016 | 488,000 | 564,250 | ||||||
| U.S. Treasury Notes, 0.875%, 2016 | 24,042,000 | 24,372,578 | ||||||
| Issuer | Shares/Par | Value ($) | ||||||
| BONDS – continued | ||||||||
| U.S. Treasury Obligations – continued | ||||||||
| U.S. Treasury Notes, 4.75%, 2017 | $ | 1,507,000 | $ | 1,789,210 | ||||
| U.S. Treasury Notes, 3.75%, 2018 | 1,633,000 | 1,901,552 | ||||||
| U.S. Treasury Notes, 2.75%, 2019 | 405,500 | 448,996 | ||||||
| U.S. Treasury Notes, 3.5%, 2020 | 13,238,000 | 15,369,530 | ||||||
| U.S. Treasury Notes, 3.125%, 2021 | 150,000 | 170,098 | ||||||
|
| |||||||
| $ | 153,249,601 | |||||||
|
| |||||||
| Utilities – Electric Power – 0.9% | ||||||||
| Bruce Mansfield Unit, 6.85%, 2034 | $ | 1,023,973 | $ | 1,066,979 | ||||
| MidAmerican Funding LLC, 6.927%, 2029 | 2,816,000 | 3,740,228 | ||||||
| Oncor Electric Delivery Co., 7%, 2022 | 1,658,000 | 2,107,301 | ||||||
| Progress Energy, Inc., 3.15%, 2022 | 1,374,000 | 1,390,936 | ||||||
| PSEG Power LLC, 5.32%, 2016 | 1,014,000 | 1,146,390 | ||||||
| System Energy Resources, Inc., 5.129%, 2014 (z) | 305,886 | 309,908 | ||||||
| Waterford 3 Funding Corp., 8.09%, 2017 | 1,356,768 | 1,401,138 | ||||||
|
| |||||||
| $ | 11,162,880 | |||||||
|
| |||||||
| Total Bonds (Identified Cost, $441,879,778) | $ | 477,845,443 | ||||||
|
| |||||||
| CONVERTIBLE PREFERRED STOCKS – 0.3% | ||||||||
| Aerospace – 0.0% | ||||||||
| United Technologies Corp. | 9,520 | $ | 530,359 | |||||
|
| |||||||
| Automotive – 0.2% | ||||||||
| General Motors Co. | 45,390 | $ | 2,003,061 | |||||
|
| |||||||
| Utilities – Electric Power – 0.1% | ||||||||
| PPL Corp. | 13,190 | $ | 689,969 | |||||
|
| |||||||
| Total Convertible Preferred Stocks (Identified Cost, $3,407,282) | $ | 3,223,389 | ||||||
|
| |||||||
| MONEY MARKET FUNDS – 1.9% | ||||||||
| MFS Institutional Money Market Portfolio, 0.16%, at Cost and Net Asset Value (v) | 24,125,189 | $ | 24,125,189 | |||||
|
| |||||||
| Total Investments (Identified Cost, $1,154,900,460) | $ | 1,265,550,213 | ||||||
|
| |||||||
| OTHER ASSETS, LESS LIABILITIES – (1.2)% | (15,415,399 | ) | ||||||
|
| |||||||
| Net Assets – 100.0% | $ | 1,250,134,814 | ||||||
|
| |||||||
14
Table of Contents
MFS Total Return Portfolio
Portfolio of Investments – continued
| (a) | Non-income producing security. |
| (e) | Guaranteed by Minister for Finance of Ireland. |
| (i) | Interest only security for which the fund receives interest on notional principal (Par amount). Par amount shown is the notional principal and does not reflect the cost of the security. |
| (n) | Securities exempt from registration under Rule 144A of the Securities Act of 1933. These securities may be sold in the ordinary course of business in transactions exempt from registration, normally to qualified institutional buyers. At period end, the aggregate value of these securities was $38,932,880, representing 3.1% of net assets. |
| (v) | Underlying affiliated fund that is available only to investment companies managed by MFS. The rate quoted for the MFS Institutional Money Market Portfolio is the annualized seven-day yield of the fund at period end. |
| (z) | Restricted securities are not registered under the Securities Act of 1933 and are subject to legal restrictions on resale. These securities generally may be resold in transactions exempt from registration or to the public if the securities are subsequently registered. Disposal of these securities may involve time-consuming negotiations and prompt sale at an acceptable price may be difficult. The fund holds the following restricted securities: |
| Restricted Securities | Acquisition Date | Cost | Value | |||||||
| AT&T, Inc., 4.35%, 2045 | 12/13/12 | $1,651,995 | $1,621,257 | |||||||
| Bayview Financial Revolving Mortgage Loan Trust, FRN, 1.809%, 2040 | 3/01/06 | 1,369,881 | 865,946 | |||||||
| Nordea Bank AB, 4.875%, 2021 | 1/11/11 | 816,714 | 951,290 | |||||||
| Russian Federation, 3.625%, 2015 | 4/22/10 | 2,693,087 | 2,852,550 | |||||||
| Spirit Master Funding LLC, 5.05%, 2023 | 10/04/05 | 1,212,157 | 1,155,770 | |||||||
| System Energy Resources, Inc., 5.129%, 2014 | 4/16/04 | 305,886 | 309,908 | |||||||
| Total Restricted Securities | $7,756,721 | |||||||||
| % of Net assets | 0.6% | |||||||||
The following abbreviations are used in this report and are defined:
| CDO | Collateralized Debt Obligation |
| FRN | Floating Rate Note. Interest rate resets periodically and may not be the rate reported at period end. |
| PLC | Public Limited Company |
| REIT | Real Estate Investment Trust |
| TBA | To Be Announced |
See Notes to Financial Statements
15
Table of Contents
MFS Total Return Portfolio
FINANCIAL STATEMENTS | STATEMENT OF ASSETS AND LIABILITIES
This statement represents your fund’s balance sheet, which details the assets and liabilities comprising the total value of the fund.
At 12/31/12 | ||||||||
Assets | ||||||||
Investments – | ||||||||
Non-affiliated issuers, at value (identified cost, $1,130,775,271) | $1,241,425,024 | |||||||
Underlying affiliated funds, at cost and value | 24,125,189 | |||||||
Total investments, at value (identified cost, $1,154,900,460) | $1,265,550,213 | |||||||
Cash | 7,718 | |||||||
Receivables for | ||||||||
Fund shares sold | 285 | |||||||
Interest and dividends | 4,298,905 | |||||||
Other assets | 12,773 | |||||||
Total assets | $1,269,869,894 | |||||||
Liabilities | ||||||||
Payables for | ||||||||
Investments purchased | $1,310,910 | |||||||
TBA purchase commitments | 16,469,632 | |||||||
Fund shares reacquired | 1,739,668 | |||||||
Payable to affiliates | ||||||||
Investment adviser | 94,312 | |||||||
Distribution and/or service fees | 18,376 | |||||||
Payable for independent Trustees’ compensation | 100 | |||||||
Accrued expenses and other liabilities | 102,082 | |||||||
Total liabilities | $19,735,080 | |||||||
Net assets | $1,250,134,814 | |||||||
Net assets consist of | ||||||||
Paid-in capital | $1,147,557,625 | |||||||
Unrealized appreciation (depreciation) on investments and translation of assets and liabilities in foreign currencies | 110,657,007 | |||||||
Accumulated net realized gain (loss) on investments and foreign currency | (38,591,725 | ) | ||||||
Undistributed net investment income | 30,511,907 | |||||||
Net assets | $1,250,134,814 | |||||||
Shares of beneficial interest outstanding | 69,712,831 |
| Net assets | Shares outstanding | Net asset value per share | ||||||||||
Initial Class | $576,174,370 | 31,962,462 | $18.03 | |||||||||
Service Class | 673,960,444 | 37,750,369 | 17.85 | |||||||||
See Notes to Financial Statements
16
Table of Contents
MFS Total Return Portfolio
FINANCIAL STATEMENTS | STATEMENT OF OPERATIONS
This statement describes how much your fund earned in investment income and accrued in expenses. It also describes any gains and/or losses generated by fund operations.
| Year ended 12/31/12 | ||||||||
Net investment income | ||||||||
Income | ||||||||
Dividends | $21,141,916 | |||||||
Interest | 18,797,559 | |||||||
Dividends from underlying affiliated funds | 26,425 | |||||||
Foreign taxes withheld | (116,901 | ) | ||||||
Total investment income | $39,848,999 | |||||||
Expenses | ||||||||
Management fee | $8,809,276 | |||||||
Distribution and/or service fees | 1,779,373 | |||||||
Administrative services fee | 196,871 | |||||||
Independent Trustees’ compensation | 36,962 | |||||||
Custodian fee | 135,288 | |||||||
Shareholder communications | 44,960 | |||||||
Audit and tax fees | 61,050 | |||||||
Legal fees | 21,070 | |||||||
Miscellaneous | 62,813 | |||||||
Total expenses | $11,147,663 | |||||||
Fees paid indirectly | (101 | ) | ||||||
Reduction of expenses by investment adviser | (4,710 | ) | ||||||
Net expenses | $11,142,852 | |||||||
Net investment income | $28,706,147 | |||||||
Realized and unrealized gain (loss) on investments and foreign currency | ||||||||
Realized gain (loss) (identified cost basis) | ||||||||
Investments | $50,132,672 | |||||||
Foreign currency | (4,578 | ) | ||||||
Net realized gain (loss) on investments and foreign currency | $50,128,094 | |||||||
Change in unrealized appreciation (depreciation) | ||||||||
Investments | $60,264,030 | |||||||
Translation of assets and liabilities in foreign currencies | 14,589 | |||||||
Net unrealized gain (loss) on investments and foreign currency translation | $60,278,619 | |||||||
Net realized and unrealized gain (loss) on investments and foreign currency | $110,406,713 | |||||||
Change in net assets from operations | $139,112,860 |
See Notes to Financial Statements
17
Table of Contents
MFS Total Return Portfolio
FINANCIAL STATEMENTS | STATEMENTS OF CHANGES IN NET ASSETS
These statements describe the increases and/or decreases in net assets resulting from operations, any distributions, and any shareholder transactions.
For years ended 12/31 | 2012 | 2011 | ||||||
Change in net assets | ||||||||
From operations | ||||||||
Net investment income | $28,706,147 | $29,779,694 | ||||||
Net realized gain (loss) on investments and foreign currency | 50,128,094 | 45,159,844 | ||||||
Net unrealized gain (loss) on investments and foreign currency translation | 60,278,619 | (49,901,548 | ) | |||||
Change in net assets from operations | $139,112,860 | $25,037,990 | ||||||
Distributions declared to shareholders | ||||||||
From net investment income | $(31,575,153 | ) | $(33,161,222 | ) | ||||
Change in net assets from fund share transactions | $(181,788,269 | ) | $(72,331,661 | ) | ||||
Total change in net assets | $(74,250,562 | ) | $(80,454,893 | ) | ||||
Net assets | ||||||||
At beginning of period | 1,324,385,376 | 1,404,840,269 | ||||||
At end of period (including undistributed net investment income of $30,511,907 and | $1,250,134,814 | $1,324,385,376 |
See Notes to Financial Statements
18
Table of Contents
MFS Total Return Portfolio
FINANCIAL STATEMENTS | FINANCIAL HIGHLIGHTS
The financial highlights table is intended to help you understand the fund’s financial performance for the past 5 years. Certain information reflects financial results for a single fund share. The total returns in the table represent the rate by which an investor would have earned (or lost) on an investment in the fund share class (assuming reinvestment of all distributions) held for the entire period.
| Initial Class | Years ended 12/31 | |||||||||||||||||||
| 2012 | 2011 | 2010 | 2009 | 2008 | ||||||||||||||||
Net asset value, beginning of period | $16.62 | $16.77 | $15.66 | $13.83 | $19.50 | |||||||||||||||
| Income (loss) from investment operations | ||||||||||||||||||||
Net investment income (d) | $0.41 | $0.40 | $0.38 | $0.40 | $0.49 | |||||||||||||||
Net realized and unrealized gain (loss) on investments | 1.46 | (0.09 | ) | 1.16 | 1.98 | (4.30 | ) | |||||||||||||
Total from investment operations | $1.87 | $0.31 | $1.54 | $2.38 | $(3.81 | ) | ||||||||||||||
| Less distributions declared to shareholders | ||||||||||||||||||||
From net investment income | $(0.46 | ) | $(0.46 | ) | $(0.43 | ) | $(0.55 | ) | $(0.60 | ) | ||||||||||
From net realized gain on investments | — | — | — | — | (1.26 | ) | ||||||||||||||
Total distributions declared to shareholders | $(0.46 | ) | $(0.46 | ) | $(0.43 | ) | $(0.55 | ) | $(1.86 | ) | ||||||||||
Net asset value, end of period (x) | $18.03 | $16.62 | $16.77 | $15.66 | $13.83 | |||||||||||||||
Total return (%) (k)(r)(s)(x) | 11.34 | 1.93 | 9.97 | 18.09 | (21.55 | ) | ||||||||||||||
| Ratios (%) (to average net assets) and Supplemental data: | ||||||||||||||||||||
Expenses before expense reductions (f) | 0.72 | 0.76 | 0.75 | 0.76 | 0.74 | |||||||||||||||
Expenses after expense reductions (f) | 0.72 | 0.74 | 0.74 | N/A | N/A | |||||||||||||||
Net investment income | 2.33 | 2.38 | 2.37 | 2.87 | 2.93 | |||||||||||||||
Portfolio turnover | 22 | 20 | 32 | 45 | 62 | |||||||||||||||
Net assets at end of period (000 omitted) | $576,174 | $593,602 | $571,781 | $604,214 | $604,843 | |||||||||||||||
See Notes to Financial Statements
19
Table of Contents
MFS Total Return Portfolio
Financial Highlights – continued
| Service Class | Years ended 12/31 | |||||||||||||||||||
| 2012 | 2011 | 2010 | 2009 | 2008 | ||||||||||||||||
Net asset value, beginning of period | $16.46 | $16.61 | $15.52 | $13.70 | $19.33 | |||||||||||||||
| Income (loss) from investment operations | ||||||||||||||||||||
Net investment income (d) | $0.36 | $0.36 | $0.33 | $0.36 | $0.44 | |||||||||||||||
Net realized and unrealized gain (loss) on investments | 1.44 | (0.10 | ) | 1.16 | 1.97 | (4.26 | ) | |||||||||||||
Total from investment operations | $1.80 | $0.26 | $1.49 | $2.33 | $(3.82 | ) | ||||||||||||||
| Less distributions declared to shareholders | ||||||||||||||||||||
From net investment income | $(0.41 | ) | $(0.41 | ) | $(0.40 | ) | $(0.51 | ) | $(0.55 | ) | ||||||||||
From net realized gain on investments | — | — | — | — | (1.26 | ) | ||||||||||||||
Total distributions declared to shareholders | $(0.41 | ) | $(0.41 | ) | $(0.40 | ) | $(0.51 | ) | $(1.81 | ) | ||||||||||
Net asset value, end of period (x) | $17.85 | $16.46 | $16.61 | $15.52 | $13.70 | |||||||||||||||
Total return (%) (k)(r)(s)(x) | 11.02 | 1.66 | 9.69 | 17.81 | (21.74 | ) | ||||||||||||||
| Ratios (%) (to average net assets) and Supplemental data: | ||||||||||||||||||||
Expenses before expense reductions (f) | 0.97 | 1.01 | 1.00 | 1.00 | 0.99 | |||||||||||||||
Expenses after expense reductions (f) | 0.97 | 0.99 | 0.99 | N/A | N/A | |||||||||||||||
Net investment income | 2.08 | 2.13 | 2.12 | 2.60 | 2.69 | |||||||||||||||
Portfolio turnover | 22 | 20 | 32 | 45 | 62 | |||||||||||||||
Net assets at end of period (000 omitted) | $673,960 | $730,783 | $833,059 | $855,092 | $708,517 | |||||||||||||||
| (d) | Per share data is based on average shares outstanding. |
| (f) | Ratios do not reflect reductions from fees paid indirectly, if applicable. |
| (k) | The total return does not reflect expenses that apply to separate accounts. Inclusion of these charges would reduce the total return figures for all periods shown. |
| (r) | Certain expenses have been reduced without which performance would have been lower. |
| (s) | From time to time the fund may receive proceeds from litigation settlements, without which performance would be lower. |
| (x) | The net asset values per share and total returns have been calculated on net assets which include adjustments made in accordance with U.S. generally accepted accounting principles required at period end for financial reporting purposes. |
See Notes to Financial Statements
20
Table of Contents
MFS Total Return Portfolio
| (1) | Business and Organization |
MFS Total Return Portfolio (the fund) is a series of MFS Variable Insurance Trust II (the trust). The trust is organized as a Massachusetts business trust and is registered under the Investment Company Act of 1940, as amended, as an open-end management investment company. The shareholders of each series of the trust are separate accounts of insurance companies, which offer variable annuity and/or life insurance products, and qualified retirement and pension plans.
| (2) | Significant Accounting Policies |
General – The preparation of financial statements in conformity with U.S. generally accepted accounting principles requires management to make estimates and assumptions that affect the reported amounts of assets and liabilities, and disclosure of contingent assets and liabilities at the date of the financial statements and the reported amounts of revenues and expenses during the reporting period. Actual results could differ from those estimates. In the preparation of these financial statements, management has evaluated subsequent events occurring after the date of the fund’s Statement of Assets and Liabilities through the date that the financial statements were issued. The fund invests a significant portion of its assets in asset-backed and/or mortgage-backed securities. The value of these securities may depend, in part, on the issuer’s or borrower’s credit quality or ability to pay principal and interest when due and may fall if an issuer or borrower defaults on its obligation to pay principal or interest or if the instrument’s credit rating is downgraded by a credit rating agency. U.S. Government securities not supported as to the payment of principal or interest by the U.S. Treasury, such as those issued by Fannie Mae, Freddie Mac, and the Federal Home Loan Banks, are subject to greater credit risk than are U.S. Government securities supported by the U.S. Treasury, such as those issued by Ginnie Mae.
In this reporting period the fund adopted Financial Accounting Standards Board (FASB) Accounting Standards Update 2011-04, Fair Value Measurement (Topic 820) – Amendments to Achieve Common Fair Value Measurement and Disclosure Requirements in U.S. GAAP and IFRSs (“ASU 2011-04”). ASU 2011-04 seeks to improve the comparability of fair value measurements as presented and disclosed in financial statements prepared in accordance with U.S. GAAP and International Financial Reporting Standards (IFRS) by providing common requirements for fair value measurement and disclosure.
In December 2011, the FASB issued Accounting Standards Update 2011-11, Balance Sheet (Topic 210) – Disclosures about Offsetting Assets and Liabilities (“ASU 2011-11”). Effective for annual reporting periods beginning on or after January 1, 2013 and interim periods within those annual periods, ASU 2011-11 is intended to enhance disclosure requirements on the offsetting of financial assets and liabilities. Although still evaluating the potential impacts of ASU 2011-11 to the fund, management expects that the impact of the fund’s adoption will be limited to additional financial statement disclosures.
Investment Valuations – Equity securities, including restricted equity securities, are generally valued at the last sale or official closing price as provided by a third-party pricing service on the market or exchange on which they are primarily traded. Equity securities, for which there were no sales reported that day, are generally valued at the last quoted daily bid quotation as provided by a third-party pricing service on the market or exchange on which such securities are primarily traded. Debt instruments and floating rate loans (other than short-term instruments), including restricted debt instruments, are generally valued at an evaluated or composite bid as provided by a third-party pricing service. Short-term instruments with a maturity at issuance of 60 days or less generally are valued at amortized cost, which approximates market value. Open-end investment companies are generally valued at net asset value per share. Securities and other assets generally valued on the basis of information from a third-party pricing service may also be valued at a broker/dealer bid quotation. Values obtained from third-party pricing services can utilize both transaction data and market information such as yield, quality, coupon rate, maturity, type of issue, trading characteristics, and other market data. The values of foreign securities and other assets and liabilities expressed in foreign currencies are converted to U.S. dollars using the mean of bid and asked prices for rates provided by a third-party pricing service.
The Board of Trustees has delegated primary responsibility for determining or causing to be determined the value of the fund’s investments (including any fair valuation) to the adviser pursuant to valuation policies and procedures approved by the Board. If the adviser determines that reliable market quotations are not readily available, investments are valued at fair value as determined in good faith by the adviser in accordance with such procedures under the oversight of the Board of Trustees. Under the fund’s valuation policies and procedures, market quotations are not considered to be readily available for most types of debt instruments and floating rate loans and many types of derivatives. These investments are generally valued at fair value based on information from third-party pricing services. In addition, investments may be valued at fair value if the adviser determines that an investment’s value has been materially affected by events occurring after the close of the exchange or market on which the investment is principally traded (such as foreign exchange or market) and prior to the determination of the fund’s net asset value, or after the halting of trading of a specific security where trading does not resume prior to the close of the exchange or market on which the security is principally traded. Events that occur on a frequent basis after foreign markets close (such as developments in foreign markets and significant movements in the U.S. markets) and prior to the determination of the fund’s net asset value may be deemed to have a material effect on the value of securities traded in foreign markets. Accordingly, the fund’s foreign equity securities may often be valued at fair value. The adviser generally relies on third-party pricing services or other information (such as the correlation with price movements of similar securities in the same or other markets; the type, cost and investment characteristics of the security; the
21
Table of Contents
MFS Total Return Portfolio
Notes to Financial Statements – continued
business and financial condition of the issuer; and trading and other market data) to assist in determining whether to fair value and at what value to fair value an investment. The value of an investment for purposes of calculating the fund’s net asset value can differ depending on the source and method used to determine value. When fair valuation is used, the value of an investment used to determine the fund’s net asset value may differ from quoted or published prices for the same investment. There can be no assurance that the fund could obtain the fair value assigned to an investment if it were to sell the investment at the same time at which the fund determines its net asset value per share.
Various inputs are used in determining the value of the fund’s assets or liabilities. These inputs are categorized into three broad levels. In certain cases, the inputs used to measure fair value may fall into different levels of the fair value hierarchy. In such cases, an investment’s level within the fair value hierarchy is based on the lowest level of input that is significant to the fair value measurement. The fund’s assessment of the significance of a particular input to the fair value measurement in its entirety requires judgment, and considers factors specific to the investment. Level 1 includes unadjusted quoted prices in active markets for identical assets or liabilities. Level 2 includes other significant observable market-based inputs (including quoted prices for similar securities, interest rates, prepayment speed, and credit risk). Level 3 includes unobservable inputs, which may include the adviser’s own assumptions in determining the fair value of investments. The following is a summary of the levels used as of December 31, 2012 in valuing the fund’s assets or liabilities:
| Investments at Value | Level 1 | Level 2 | Level 3 | Total | ||||||||||||
| Equity Securities | ||||||||||||||||
United States | $713,579,050 | $— | $— | $713,579,050 | ||||||||||||
United Kingdom | — | 24,082,577 | — | 24,082,577 | ||||||||||||
Switzerland | 10,670,853 | 2,211,230 | — | 12,882,083 | ||||||||||||
France | — | 6,785,417 | — | 6,785,417 | ||||||||||||
Germany | — | 2,376,152 | — | 2,376,152 | ||||||||||||
Israel | 1,990,399 | — | — | 1,990,399 | ||||||||||||
Canada | 1,883,907 | — | — | 1,883,907 | ||||||||||||
| U.S. Treasury Bonds & U.S. Government Agency & Equivalents | — | 158,200,224 | — | 158,200,224 | ||||||||||||
| Non-U.S. Sovereign Debt | — | 20,884,838 | — | 20,884,838 | ||||||||||||
| Corporate Bonds | — | 84,304,869 | — | 84,304,869 | ||||||||||||
| Residential Mortgage-Backed Securities | — | 155,510,470 | — | 155,510,470 | ||||||||||||
| Commercial Mortgage-Backed Securities | — | 22,281,481 | — | 22,281,481 | ||||||||||||
| Asset-Backed Securities (including CDOs) | — | 1,428,352 | — | 1,428,352 | ||||||||||||
| Foreign Bonds | — | 35,235,205 | — | 35,235,205 | ||||||||||||
| Mutual Funds | 24,125,189 | — | — | 24,125,189 | ||||||||||||
| Total Investments | $752,249,398 | $513,300,815 | $— | $1,265,550,213 | ||||||||||||
For further information regarding security characteristics, see the Portfolio of Investments.
Of the level 2 investments presented above, equity investments amounting to $30,976,067 would have been considered level 1 investments at the beginning of the period. Of the level 1 investments presented above, equity investments amounting to $41,646,920 would have been considered level 2 investments at the beginning of the period. The primary reason for changes in the classifications between levels 1 and 2 occurs when foreign equity securities are fair valued using other observable market-based inputs in place of the closing exchange price due to events occurring after the close of the exchange or market on which the investment is principally traded. The fund’s foreign equity securities may often be valued at fair value. The fund’s policy is to recognize transfers between the levels as of the end of the period.
Foreign Currency Translation – Purchases and sales of foreign investments, income, and expenses are converted into U.S. dollars based upon currency exchange rates prevailing on the respective dates of such transactions or on the reporting date for foreign denominated receivables and payables. Gains and losses attributable to foreign currency exchange rates on sales of securities are recorded for financial statement purposes as net realized gains and losses on investments. Gains and losses attributable to foreign exchange rate movements on receivables, payables, income and expenses are recorded for financial statement purposes as foreign currency transaction gains and losses. That portion of both realized and unrealized gains and losses on investments that results from fluctuations in foreign currency exchange rates is not separately disclosed.
Security Loans – State Street Bank and Trust Company (“State Street”), as lending agent, loans the securities of the fund to certain qualified institutions (the “Borrowers”) approved by the fund. The loans are collateralized by cash and/or U.S. Treasury and federal agency obligations in an amount typically at least equal to the market value of the securities loaned. The market value of the loaned securities is determined at the close of business of the fund and any additional required collateral is delivered to the fund on the next business day. State Street provides the fund with indemnification against Borrower default. The fund bears the risk of loss with respect to the investment of cash collateral. On loans collateralized by cash, the cash collateral is invested in a money market fund or
22
Table of Contents
MFS Total Return Portfolio
Notes to Financial Statements – continued
short-term securities. A portion of the income generated upon investment of the collateral is remitted to the Borrowers, and the remainder is allocated between the fund and the lending agent. On loans collateralized by U.S. Treasury and/or federal agency obligations, a fee is received from the Borrower, and is allocated between the fund and the lending agent. Income from securities lending is included in “Interest” income in the Statement of Operations. The dividend and interest income earned on the securities loaned is accounted for in the same manner as other dividend and interest income. At December 31, 2012, there were no securities on loan or collateral outstanding.
Indemnifications – Under the fund’s organizational documents, its officers and Trustees may be indemnified against certain liabilities and expenses arising out of the performance of their duties to the fund. Additionally, in the normal course of business, the fund enters into agreements with service providers that may contain indemnification clauses. The fund’s maximum exposure under these agreements is unknown as this would involve future claims that may be made against the fund that have not yet occurred.
Investment Transactions and Income – Investment transactions are recorded on the trade date. Interest income is recorded on the accrual basis. All premium and discount is amortized or accreted for financial statement purposes in accordance with U.S. generally accepted accounting principles. Dividends received in cash are recorded on the ex-dividend date. Certain dividends from foreign securities will be recorded when the fund is informed of the dividend if such information is obtained subsequent to the ex-dividend date. Dividend and interest payments received in additional securities are recorded on the ex-dividend or ex-interest date in an amount equal to the value of the security on such date.
The fund may receive proceeds from litigation settlements. Any proceeds received from litigation involving portfolio holdings are reflected in the Statement of Operations in realized gain/loss if the security has been disposed of by the fund or in unrealized gain/loss if the security is still held by the fund. Any other proceeds from litigation not related to portfolio holdings are reflected as other income in the Statement of Operations.
The fund purchased or sold debt securities on a when-issued or delayed delivery basis, or in a “To Be Announced” (TBA) or “forward commitment” transaction with delivery or payment to occur at a later date beyond the normal settlement period. TBA securities resulting from these transactions are included in the Portfolio of Investments. At the time a fund enters into a commitment to purchase or sell a security, the transaction is recorded and the value of the security acquired is reflected in the fund’s net asset value. The price of such security and the date that the security will be delivered and paid for are fixed at the time the transaction is negotiated. The value of the security may vary with market fluctuations. TBA purchase commitments are held at carrying amount, which approximates fair value and are categorized as Level 2 within the fair value hierarchy disclosure. No interest accrues to the fund until payment takes place. At the time that a fund enters into this type of transaction, the fund is required to have sufficient cash and/or liquid securities to cover its commitments. Losses may arise due to changes in the value of the underlying securities or if the counterparty does not perform under the contract’s terms, or if the issuer does not issue the securities due to political, economic or other factors. Additionally, losses may arise due to declines in the value of the securities prior to settlement date.
Fees Paid Indirectly – The fund’s custody fee may be reduced according to an arrangement that measures the value of cash deposited with the custodian by the fund. This amount, for the year ended December 31, 2012, is shown as a reduction of total expenses in the Statement of Operations.
Tax Matters and Distributions – The fund intends to qualify as a regulated investment company, as defined under Subchapter M of the Internal Revenue Code, and to distribute all of its taxable income, including realized capital gains. As a result, no provision for federal income tax is required. The fund’s federal tax returns, when filed, will remain subject to examination by the Internal Revenue Service for a three year period. Foreign taxes have been accrued by the fund in the accompanying financial statements.
Distributions to shareholders are recorded on the ex-dividend date. Income and capital gain distributions are determined in accordance with income tax regulations, which may differ from U.S. generally accepted accounting principles. Certain capital accounts in the financial statements are periodically adjusted for permanent differences in order to reflect their tax character. These adjustments have no impact on net assets or net asset value per share. Temporary differences which arise from recognizing certain items of income, expense, gain or loss in different periods for financial statement and tax purposes will reverse at some time in the future. Distributions in excess of net investment income or net realized gains are temporary overdistributions for financial statement purposes resulting from differences in the recognition or classification of income or distributions for financial statement and tax purposes.
Book/tax differences primarily relate to amortization and accretion of debt securities and wash sale loss deferrals.
The tax character of distributions declared to shareholders for the last two fiscal years is as follows:
| 12/31/12 | 12/31/11 | |||||||
| Ordinary income (including any short-term capital gains) | $31,575,153 | $33,161,222 | ||||||
23
Table of Contents
MFS Total Return Portfolio
Notes to Financial Statements – continued
The federal tax cost and the tax basis components of distributable earnings were as follows:
| As of 12/31/12 | ||||
| Cost of investments | $1,163,543,758 | |||
| Gross appreciation | 148,343,475 | |||
| Gross depreciation | (46,337,020 | ) | ||
| Net unrealized appreciation (depreciation) | $102,006,455 | |||
| Undistributed ordinary income | 30,511,907 | |||
| Capital loss carryforwards | (29,948,427 | ) | ||
| Other temporary differences | 7,254 |
Under the Regulated Investment Company Modernization Act of 2010 (the “Act”), net capital losses recognized after December 31, 2010 may be carried forward indefinitely, and their character is retained as short-term and/or long-term losses. Previously, net capital losses were carried forward for eight years and treated as short-term losses. As a transition rule, the Act requires that post-enactment net capital losses be used before pre-enactment net capital losses.
As of December 31, 2012, the fund had capital loss carryforwards available to offset future realized gains. Such losses expire as follows:
| Pre-enactment losses: | ||||
| 12/31/16 | $(13,894,109 | ) | ||
| 12/31/17 | (16,054,318 | ) | ||
| Total | $(29,948,427 | ) |
Multiple Classes of Shares of Beneficial Interest – The fund offers multiple classes of shares, which differ in their respective distribution and/or service fees. The fund’s income, realized and unrealized gain (loss), and common expenses are allocated to shareholders based on the daily net assets of each class. Dividends are declared separately for each class. Differences in per share dividend rates are generally due to differences in separate class expenses. The fund’s distributions declared to shareholders as reported in the Statements of Changes in Net Assets are presented by class as follows:
| From net investment income | ||||||||
| Year ended 12/31/12 | Year ended 12/31/11 | |||||||
| Initial Class | $15,190,277 | $14,376,700 | ||||||
| Service Class | 16,384,876 | 18,784,522 | ||||||
| Total | $31,575,153 | $33,161,222 | ||||||
| (3) | Transactions with Affiliates |
Investment Adviser – The fund has an investment advisory agreement with MFS to provide overall investment management and related administrative services and facilities to the fund.
The management fee is computed daily and paid monthly at the following annual rates:
| First $300 million of average daily net assets | 0.75% | |||
| Next $700 million of average daily net assets | 0.675% | |||
| Average daily net assets in excess of $1 billion | 0.60% |
The management fee incurred for the year ended December 31, 2012 was equivalent to an annual effective rate of 0.67% of the fund’s average daily net assets.
The investment adviser has agreed in writing to pay a portion of the fund’s total annual operating expenses, exclusive of interest, taxes, extraordinary expenses, brokerage and transactions costs, and investment-related expenses such that total annual operating expenses do not exceed 0.74% of average daily net assets for the Initial Class shares and 0.99% of average daily net assets for the Service Class shares. This written agreement will continue until modified by the fund’s Board of Trustees, but such agreement will continue at least until April 30, 2014. For the year ended December 31, 2012, the fund’s actual operating expenses did not exceed the limit and therefore, the investment adviser did not pay any portion of the fund’s expenses, related to this agreement.
Distributor – MFS Fund Distributors, Inc. (MFD), a wholly-owned subsidiary of MFS, is the distributor of shares of the fund. The Trustees have adopted a distribution plan for the Service Class shares pursuant to Rule 12b-1 under the Investment Company Act of 1940.
The fund’s distribution plan provides that the fund will pay MFD distribution and/or service fees equal to 0.25% per annum of its average daily net assets attributable to Service Class shares as partial consideration for services performed and expenses incurred by
24
Table of Contents
MFS Total Return Portfolio
Notes to Financial Statements – continued
MFD and financial intermediaries (including participating insurance companies that invest in the fund to fund variable annuity and variable life insurance contracts, sponsors of qualified retirement and pension plans that invest in the fund, and affiliates of these participating insurance companies and plan sponsors) in connection with the sale and distribution of the Service Class shares. MFD may subsequently pay all, or a portion, of the distribution and/or service fees to financial intermediaries.
Shareholder Servicing Agent – MFS Service Center, Inc. (MFSC), a wholly-owned subsidiary of MFS, has contracted to provide transfer agent and recordkeeping functions in connection with the issuance, transfer, and redemption of each class of shares of the fund under a Shareholder Servicing Agent Agreement. During the year ended December 31, 2012, the fund did not pay MFSC a fee for this service. Effective April 1, 2013, the fund will be charged a shareholder servicing fee by MFSC.
Administrator – MFS provides certain financial, legal, shareholder communications, compliance, and other administrative services to the fund. Under an administrative services agreement, the fund partially reimburses MFS the costs incurred to provide these services. The fund is charged an annual fixed amount of $17,500 plus a fee based on average daily net assets. The administrative services fee incurred for the year ended December 31, 2012 was equivalent to an annual effective rate of 0.0151% of the fund’s average daily net assets.
Trustees’ and Officers’ Compensation – The fund pays compensation to Trustees in the form of a retainer, attendance fees, and additional compensation to the Board chairperson. The fund does not pay compensation directly to officers of the fund who are also officers of the investment adviser, all of whom receive remuneration for their services to the fund from MFS. Certain officers of the fund are officers or directors of MFS, MFD, and MFSC.
Other – This fund and certain other funds managed by MFS (the funds) have entered into services agreements (the Agreements) which provide for payment of fees by the funds to Tarantino LLC and Griffin Compliance LLC in return for the provision of services of an Independent Chief Compliance Officer (ICCO) and Assistant ICCO, respectively, for the funds. The ICCO and Assistant ICCO are officers of the funds and the sole members of Tarantino LLC and Griffin Compliance LLC, respectively. The funds can terminate the Agreements with Tarantino LLC and Griffin Compliance LLC at any time under the terms of the Agreements. For the year ended December 31, 2012, the aggregate fees paid by the fund to Tarantino LLC and Griffin Compliance LLC were $10,721 and are included in “Miscellaneous” expense in the Statement of Operations. MFS has agreed to reimburse the fund for a portion of the payments made by the fund in the amount of $4,710, which is shown as a reduction of total expenses in the Statement of Operations. Additionally, MFS has agreed to bear all expenses associated with office space, other administrative support, and supplies provided to the ICCO and Assistant ICCO.
The fund invests in the MFS Institutional Money Market Portfolio which is managed by MFS and seeks current income consistent with preservation of capital and liquidity. Income earned on this investment is included in “Dividends from underlying affiliated funds” in the Statement of Operations. This money market fund does not pay a management fee to MFS.
| (4) | Portfolio Securities |
Purchases and sales of investments, other than short-term obligations, were as follows:
| Purchases | Sales | |||||||
| U.S. Government securities | $68,524,229 | $77,345,591 | ||||||
| Investments (non-U.S. Government securities) | $217,228,902 | $376,396,251 | ||||||
| (5) | Shares of Beneficial Interest |
The fund’s Declaration of Trust permits the Trustees to issue an unlimited number of full and fractional shares of beneficial interest. Transactions in fund shares were as follows:
| Year ended 12/31/12 | Year ended 12/31/11 | |||||||||||||||
| Shares | Amount | Shares | Amount | |||||||||||||
| Shares sold | ||||||||||||||||
Initial Class | 254,736 | $4,488,706 | 217,705 | $3,698,442 | ||||||||||||
Service Class | 294,390 | 5,092,764 | 903,326 | 14,964,933 | ||||||||||||
| 549,126 | $9,581,470 | 1,121,031 | $18,663,375 | |||||||||||||
| Shares issued in connection with acquisition of Total Return Variable Account | ||||||||||||||||
Initial Class | 5,309,597 | $87,449,070 | ||||||||||||||
| Shares issued to shareholders in reinvestment of distributions | ||||||||||||||||
Initial Class | 867,520 | $15,190,277 | 890,750 | $14,376,700 | ||||||||||||
Service Class | 943,829 | 16,384,876 | 1,174,032 | 18,784,522 | ||||||||||||
| 1,811,349 | $31,575,153 | 2,064,782 | $33,161,222 | |||||||||||||
25
Table of Contents
MFS Total Return Portfolio
Notes to Financial Statements – continued
| Year ended 12/31/12 | Year ended 12/31/11 | |||||||||||||||
| Shares | Amount | Shares | Amount | |||||||||||||
| Shares reacquired | ||||||||||||||||
Initial Class | (4,874,788 | ) | $(85,781,901 | ) | (4,791,148 | ) | $(80,701,035 | ) | ||||||||
Service Class | (7,886,087 | ) | (137,162,991 | ) | (7,830,688 | ) | (130,904,293 | ) | ||||||||
| (12,760,875 | ) | $(222,944,892 | ) | (12,621,836 | ) | $(211,605,328 | ) | |||||||||
| Net change | ||||||||||||||||
Initial Class | (3,752,532 | ) | $(66,102,918 | ) | 1,626,904 | $24,823,177 | ||||||||||
Service Class | (6,647,868 | ) | (115,685,351 | ) | (5,753,330 | ) | (97,154,838 | ) | ||||||||
| (10,400,400 | ) | $(181,788,269 | ) | (4,126,426 | ) | $(72,331,661 | ) | |||||||||
| (6) | Line of Credit |
The fund and certain other funds managed by MFS participate in a $1.1 billion unsecured committed line of credit, subject to a $1 billion sublimit, provided by a syndication of banks under a credit agreement. Borrowings may be made for temporary financing needs. Interest is charged to each fund, based on its borrowings, generally at a rate equal to the higher of the Federal Reserve funds rate or one month LIBOR plus an agreed upon spread. A commitment fee, based on the average daily, unused portion of the committed line of credit, is allocated among the participating funds at the end of each calendar quarter. In addition, the fund and other funds managed by MFS have established unsecured uncommitted borrowing arrangements with certain banks for temporary financing needs. Interest is charged to each fund, based on its borrowings, at a rate equal to the Federal Reserve funds rate plus an agreed upon spread. For the year ended December 31, 2012, the fund’s commitment fee and interest expense were $8,404 and $0, respectively, and are included in “Miscellaneous” expense in the Statement of Operations.
| (7) | Transactions in Underlying Affiliated Funds – Affiliated Issuers |
An affiliated issuer may be considered one in which the fund owns 5% or more of the outstanding voting securities, or a company which is under common control. For the purposes of this report, the fund assumes the following to be an affiliated issuer:
| Underlying Affiliated Fund | Beginning Shares/Par Amount | Acquisitions Shares/Par Amount | Dispositions Shares/Par Amount | Ending Shares/Par Amount | ||||||||||||
| MFS Institutional Money Market Portfolio | 17,677,046 | 221,317,441 | (214,869,298 | ) | 24,125,189 | |||||||||||
Underlying Affiliated Fund | Realized Gain (Loss) | Capital Gain Distributions | Dividend Income | Ending Value | ||||||||||||
| MFS Institutional Money Market Portfolio | $— | $— | $26,425 | $24,125,189 | ||||||||||||
| (8) | Acquisitions |
At the close of business on December 2, 2011, the fund with net assets of $1,241,377,323, acquired all of the investment-related assets and liabilities of Total Return Variable Account. The acquisition was part of a transaction in which the Total Return Variable Account was converted into a unit investment trust (“UIT”) that invests in the fund (the acquisition of the Account’s assets and liabilities and subsequent conversion into a UIT hereinafter referred to as the “Reorganization”). The Reorganization provided the contract owners of the Total Return Variable Account with the opportunity to participate in a larger combined portfolio with an identical investment objective and similar investment policies and strategies. The acquisition was accomplished by a tax-free exchange of 5,309,597 shares of the fund (valued at $87,449,070) for all of the investment-related assets and liabilities of Total Return Variable Account. Total Return Variable Account’s investments on that date were valued at approximately $87,136,582 with a cost basis of approximately $78,638,088. For financial reporting purposes, assets received and shares issued by the fund were recorded at fair value; however, the cost basis of the investments received from Total Return Variable Account were carried forward to align ongoing reporting of the fund’s realized and unrealized gains and losses with amounts distributable to shareholders for tax purposes. No pro forma information is provided as it is not material to the combined fund results.
26
Table of Contents
MFS Total Return Portfolio
REPORT OF INDEPENDENT REGISTERED PUBLIC ACCOUNTING FIRM
To the Board of Trustees of MFS Variable Insurance Trust II and the Shareholders of
MFS Total Return Portfolio:
We have audited the accompanying statement of assets and liabilities, including the portfolio of investments, of MFS Total Return Portfolio (the “Fund”) (one of the series comprising MFS Variable Insurance Trust II) as of December 31, 2012, and the related statement of operations for the year then ended, the statements of changes in net assets for each of the two years in the period then ended, and the financial highlights for each of the five years in the period then ended. These financial statements and financial highlights are the responsibility of the Fund’s management. Our responsibility is to express an opinion on these financial statements and financial highlights based on our audits.
We conducted our audits in accordance with the standards of the Public Company Accounting Oversight Board (United States). Those standards require that we plan and perform the audit to obtain reasonable assurance about whether the financial statements and financial highlights are free of material misstatement. The Fund is not required to have, nor were we engaged to perform, an audit of its internal control over financial reporting. Our audits included consideration of internal control over financial reporting as a basis for designing audit procedures that are appropriate in the circumstances, but not for the purpose of expressing an opinion on the effectiveness of the Fund’s internal control over financial reporting. Accordingly, we express no such opinion. An audit also includes examining, on a test basis, evidence supporting the amounts and disclosures in the financial statements, assessing the accounting principles used and significant estimates made by management, as well as evaluating the overall financial statement presentation. Our procedures included confirmation of securities owned as of December 31, 2012, by correspondence with the custodian and brokers; where replies were not received from brokers, we performed other auditing procedures. We believe that our audits provide a reasonable basis for our opinion.
In our opinion, the financial statements and financial highlights referred to above present fairly, in all material respects, the financial position of MFS Total Return Portfolio as of December 31, 2012, the results of its operations for the year then ended, the changes in its net assets for each of the two years in the period then ended, and the financial highlights for each of the five years in the period then ended, in conformity with accounting principles generally accepted in the United States of America.
DELOITTE & TOUCHE LLP
Boston, Massachusetts
February 15, 2013
27
Table of Contents
MFS Total Return Portfolio
TRUSTEES AND OFFICERS – IDENTIFICATION AND BACKGROUND
The Trustees and officers of the Trust, as of February 1, 2013, are listed below, together with their principal occupations during the past five years. (Their titles may have varied during that period.) The address of each Trustee and officer is 111 Huntington Avenue, Boston, Massachusetts 02199-7618.
Name, Age | Position(s) with Fund | Trustee/Officer Since (h) | Principal Occupations During the Past Five Years | Other Directorships (j) | ||||
| INTERESTED TRUSTEES | ||||||||
Robert J. Manning (k) (age 49) | Trustee | February 2004 | Massachusetts Financial Services Company, Chairman, Chief Executive Officer and Director; President (until December 2009); Chief Investment Officer (until July 2010) | N/A | ||||
| INDEPENDENT TRUSTEES | ||||||||
David H. Gunning (age 70) | Trustee and Chair of Trustees | January 2004 | Private investor | Lincoln Electric Holdings, Inc. (welding equipment manufacturer), Director; Development Alternatives, Inc. (consulting), Director/Non-Executive Chairman; Portman Limited (mining), Director (until 2008) | ||||
Robert E. Butler (age 71) | Trustee | January 2006 | Consultant – investment company industry regulatory and compliance matters | N/A | ||||
Maureen R. Goldfarb (age 57) | Trustee | January 2009 | Private investor | N/A | ||||
William R. Gutow (age 71) | Trustee | December 1993 | Private investor and real estate consultant; Capitol Entertainment Management Company (video franchise), Vice Chairman | Atlantic Coast Tan (tanning salons), Vice Chairman (until 2007); Texas Donuts (donut franchise), Vice Chairman (until 2010) | ||||
Michael Hegarty (age 68) | Trustee | December 2004 | Private investor; Rouse Properties Inc. (real estate), Director | N/A | ||||
John P. Kavanaugh (age 58) | Trustee | January 2009 | Private investor | N/A | ||||
J. Dale Sherratt (age 74) | Trustee | June 1989 | Insight Resources, Inc. (acquisition planning specialists), President; Wellfleet Investments (investor in health care companies), Managing General Partner | N/A | ||||
| Laurie J. Thomsen (age 55) | Trustee | March 2005 | Private investor; New Profit, Inc. (venture philanthropy), Executive Partner (until 2010) | The Travelers Companies (insurance), Director | ||||
Robert W. Uek (age 71) | Trustee | January 2006 | Consultant to investment company industry | N/A | ||||
| OFFICERS | ||||||||
John M. Corcoran (k) (age 47) | President | October 2008 | Massachusetts Financial Services Company, Senior Vice President (since October 2008); State Street Bank and Trust (financial services provider), Senior Vice President, (until September 2008) | N/A | ||||
| Christopher R. Bohane (k) (age 39) | Assistant Secretary and Assistant Clerk | July 2005 | Massachusetts Financial Services Company, Vice President and Senior Counsel | N/A | ||||
Kino Clark (k) (age 44) | Assistant Treasurer | January 2012 | Massachusetts Financial Services Company, Vice President | N/A | ||||
Thomas H. Connors (k) (age 53) | Assistant Secretary and Assistant Clerk | September 2012 | Massachusetts Financial Services Company, Vice President and Senior Counsel; Deutsche Investment Management Americas Inc. (financial service provider), Director and Senior Counsel (until 2012) | N/A | ||||
Ethan D. Corey (k) (age 49) | Assistant Secretary and Assistant Clerk | July 2005 | Massachusetts Financial Services Company, Senior Vice President and Associate General Counsel | N/A | ||||
28
Table of Contents
MFS Total Return Portfolio
Trustees and Officers – continued
Name, Age | Position(s) with Fund | Trustee/Officer Since (h) | Principal Occupations During the Past Five Years | Other Directorships (j) | ||||
David L. DiLorenzo (k) (age 44) | Treasurer | July 2005 | Massachusetts Financial Services Company, Senior Vice President | N/A | ||||
Robyn L. Griffin (age 37) | Assistant Independent Chief Compliance Officer | August 2008 | Griffin Compliance LLC (provider of compliance services), Principal (since August 2008); State Street Corporation (financial services provider), Mutual Fund Administration Assistant Vice President (October 2006 – July 2008) | N/A | ||||
Brian E. Langenfeld (k) (age 39) | Assistant Secretary and Assistant Clerk | June 2006 | Massachusetts Financial Services Company, Vice President and Senior Counsel | N/A | ||||
Susan S. Newton (k) (age 62) | Assistant Secretary and Assistant Clerk | May 2005 | Massachusetts Financial Services Company, Senior Vice President and Associate General Counsel | N/A | ||||
Susan A. Pereira (k) (age 42) | Assistant Secretary and Assistant Clerk | July 2005 | Massachusetts Financial Services Company, Vice President and Senior Counsel | N/A | ||||
Kasey L. Phillips (k) (age 42) | Assistant Treasurer | September 2012 | Massachusetts Financial Services Company, Vice President; Wells Fargo Funds Management, LLC, Senior Vice President, Fund Treasurer (until 2012) | N/A | ||||
Mark N. Polebaum (k) (age 60) | Secretary and Clerk | January 2006 | Massachusetts Financial Services Company, Executive Vice President, General Counsel and Secretary | N/A | ||||
Frank L. Tarantino (age 68) | Independent Chief Compliance Officer | June 2004 | Tarantino LLC (provider of compliance services), Principal | N/A | ||||
Richard S. Weitzel (k) (age 42) | Assistant Secretary and Assistant Clerk | October 2007 | Massachusetts Financial Services Company, Senior Vice President and Associate General Counsel | N/A | ||||
James O. Yost (k) (age 52) | Deputy Treasurer | September 1990 | Massachusetts Financial Services Company, Senior Vice President | N/A | ||||
| (h) | Date first appointed to serve as Trustee/officer of an MFS fund. Each Trustee has served continuously since appointment unless indicated otherwise. For the period from December 15, 2004 until February 22, 2005, Mr. Manning served as Advisory Trustee. For the period October 2008, until January 2012, Mr. Corcoran served as Treasurer of the Funds. Prior to January 2012, Messrs. DiLorenzo and Yost served as Assistant Treasurers of the Funds. |
| (j) | Directorships or trusteeships of companies required to report to the Securities and Exchange Commission (i.e., “public companies”). |
| (k) | “Interested person” of the Trust within the meaning of the Investment Company Act of 1940 (referred to as the 1940 Act), which is the principal federal law governing investment companies like the fund, as a result of position with MFS. The address of MFS is 111 Huntington Avenue, Boston, Massachusetts 02199-7618. |
Each Trustee has been elected by shareholders and each Trustee and officer holds office until his or her successor is chosen and qualified or until his or her earlier death, resignation, retirement or removal. The Trust does not hold annual meetings for the purpose of electing Trustees, and Trustees are not elected for fixed terms. Messrs. Butler, Kavanaugh, Uek and Ms. Thomsen are members of the Trust’s Audit Committee.
Each of the Fund’s Trustees and officers holds comparable positions with certain other funds of which MFS or a subsidiary is the investment adviser or distributor, and, in the case of the officers, with certain affiliates of MFS. As of January 1, 2013, the Trustees served as board members of 143 funds within the MFS Family of Funds.
29
Table of Contents
MFS Total Return Portfolio
Trustees and Officers – continued
The Statement of Additional Information for the Fund includes further information about the Trustees and is available without charge upon request by calling 1-800-225-2606.
Investment Adviser Massachusetts Financial Services Company 111 Huntington Avenue Boston, MA 02199-7618 | Custodian State Street Bank and Trust 1 Lincoln Street Boston, MA 02111-2900 | |
Distributor MFS Fund Distributors, Inc. 111 Huntington Avenue Boston, MA 02199-7618 | Independent Registered Public Accounting Firm Deloitte & Touche LLP 200 Berkeley Street Boston, MA 02116 | |
Portfolio Managers Nevin Chitkara William Douglas Steven Gorham Richard Hawkins Joshua Marston Brooks Taylor |
30
Table of Contents
MFS Total Return Portfolio
BOARD REVIEW OF INVESTMENT ADVISORY AGREEMENT
A discussion regarding the Board’s most recent approval of the fund’s Investment Advisory Agreement with MFS is available by clicking on the fund’s name under “Variable Insurance Portfolios – VIT II” in the “Products” section of the MFS Web site (mfs.com).
PROXY VOTING POLICIES AND INFORMATION
A general description of the MFS funds’ proxy voting policies and procedures is available without charge, upon request, by calling 1-800-225-2606, by visiting the Proxy Voting section of mfs.com or by visiting the SEC’s Web site at http://www.sec.gov.
Information regarding how the fund voted proxies relating to portfolio securities during the most recent twelve-month period ended June 30 is available without charge by visiting the Proxy Voting section of mfs.com or by visiting the SEC’s Web site at http://www.sec.gov.
QUARTERLY PORTFOLIO DISCLOSURE
The fund will file a complete schedule of portfolio holdings with the Securities and Exchange Commission (the Commission) for the first and third quarters of each fiscal year on Form N-Q. The fund’s Form N-Q is available on the EDGAR database on the Commission’s Internet Web site at http://www.sec.gov, and may be reviewed and copied at the:
Public Reference Room
Securities and Exchange Commission
100 F Street, NE, Room 1580
Washington, D.C. 20549
Information on the operation of the Public Reference Room may be obtained by calling the Commission at 1-800-SEC-0330. Copies of the fund’s Form N-Q also may be obtained, upon payment of a duplicating fee, by electronic request at the following e-mail address: publicinfo@sec.gov or by writing the Public Reference Section at the above address.
From time to time, MFS may post important information about the fund or the MFS funds on the MFS web site (mfs.com). This information is available by visiting the “News & Commentary” section of mfs.com or by clicking on the fund’s name under “Variable Insurance Portfolios – VIT II” in the “Products” section of mfs.com.
FEDERAL TAX INFORMATION (unaudited)
The following information is provided pursuant to provisions of the Internal Revenue Code.
For corporate shareholders, 56.13% of the ordinary income dividends paid during the fiscal year qualify for the corporate dividends received deduction.
31
Table of Contents
rev. 3/11

| Why? | Financial companies choose how they share your personal information. Federal law gives consumers the right to limit some but not all sharing. Federal law also requires us to tell you how we collect, share, and protect your personal information. Please read this notice carefully to understand what we do. |
| What? | The types of personal information we collect and share depend on the product or service you have with us. This information can include:
• Social Security number and account balances • Account transactions and transaction history • Checking account information and wire transfer instructions
When you are no longer our customer, we continue to share your information as described in this notice. |
| How? | All financial companies need to share customers’ personal information to run their everyday business. In the section below, we list the reasons financial companies can share their customers’ personal information; the reasons MFS chooses to share; and whether you can limit this sharing. |
| Reasons we can share your personal information | Does MFS share? | Can you limit this sharing? | ||
For our everyday business purposes – such as to process your transactions, maintain your account(s), respond to court orders and legal investigations, or report to credit bureaus | Yes | No | ||
For our marketing purposes – to offer our products and services to you | No | We don’t share | ||
| For joint marketing with other financial companies | No | We don’t share | ||
For our affiliates’ everyday business purposes – information about your transactions and experiences | No | We don’t share | ||
For our affiliates’ everyday business purposes – information about your creditworthiness | No | We don’t share | ||
| For nonaffiliates to market to you | No | We don’t share |
| Questions? | Call 800-225-2606 or go to mfs.com. |
32
Table of Contents
| Page 2 |
| Who we are | ||
| Who is providing this notice? | MFS Funds, MFS Investment Management, MFS Institutional Advisors, Inc., MFS Fund Distributors, Inc., MFS Heritage Trust Company, and MFS Service Center, Inc. | |
| What we do | ||
| How does MFS protect my personal information? | To protect your personal information from unauthorized access and use, we use security measures that comply with federal law. These measures include procedural, electronic, and physical safeguards for the protection of the personal information we collect about you. | |
| How does MFS collect my personal information? | We collect your personal information, for example, when you
• open an account or provide account information • direct us to buy securities or direct us to sell your securities • make a wire transfer
We also collect your personal information from others, such as credit bureaus, affiliates and other companies. | |
| Why can’t I limit all sharing? | Federal law gives you the right to limit only
• sharing for affiliates’ everyday business purposes – information about your creditworthiness • affiliates from using your information to market to you • sharing for nonaffiliates to market to you
State laws and individual companies may give you additional rights to limit sharing. | |
| Definitions | ||
| Affiliates | Companies related by common ownership or control. They can be financial and nonfinancial companies.
•MFS does not share personal information with affiliates, except for everyday business purposes as described on page one of this notice. | |
| Nonaffiliates | Companies not related by common ownership or control. They can be financial and nonfinancial companies.
•MFS does not share with nonaffiliates so they can market to you. | |
| Joint Marketing | A formal agreement between nonaffiliated financial companies that together market financial products or services to you.
•MFS doesn’t jointly market. | |
| Other important information | ||
| If you own an MFS product or receive an MFS service in the name of a third party such as a bank or broker-dealer, their privacy policy may apply to you instead of ours. | ||
33
Table of Contents
Table of Contents
ANNUAL REPORT
December 31, 2012

MFS® GLOBAL TACTICAL ALLOCATION PORTFOLIO
MFS® Variable Insurance Trust II

WTS-ANN
Table of Contents
MFS® GLOBAL TACTICAL ALLOCATION PORTFOLIO
The report is prepared for the general information of contract owners. It is authorized for distribution to prospective investors only when preceded or accompanied by a current prospectus.
NOT FDIC INSURED Ÿ MAY LOSE VALUE Ÿ NO BANK OR CREDIT UNION GUARANTEE Ÿ
NOT A DEPOSIT Ÿ NOT INSURED BY ANY FEDERAL GOVERNMENT AGENCY OR NCUA/NCUSIF
Table of Contents
MFS Global Tactical Allocation Portfolio
LETTER FROM THE CHAIRMAN AND CEO

Dear Contract Owners:
The global market outlook for 2013 is one of cautious optimism. While we are seeing some positive economic trends in the United States, Europe and China, the overall environment remains challenging. In the United States, the recent fiscal cliff agreement was received positively by investors, even though it mostly addressed pressing taxation issues and did not resolve additional concerns, including the need for spending cuts and a large-scale reduction of the federal debt. These issues will be front and center again in the spring. Despite the ongoing uncertainty, economic tailwinds are gathering strength as the U.S. housing and job markets are improving and consumer confidence is rising.
Overseas, the debt crisis continues to weigh heavily on eurozone markets, with even Germany — long an economic stalwart — experiencing some contraction. These ongoing challenges could be a drag on global market performance this year. In Asia, manufacturing activity has accelerated in emerging markets such as China and India, and we are seeing signs of stabilized loan growth in China, a leading indicator of that country’s economic health. In contrast, Japan’s economy is contracting sharply under deflationary pressures. Nevertheless, Japanese markets have responded favorably to early actions by the new government, which appears determined to act aggressively, along with the Bank of Japan, to stimulate growth.
As always, managing risk in the face of uncertainty remains a top priority for investors. At MFS®, our uniquely collaborative investment process revolves around global research and our disciplined risk management approach. Our global team of investment professionals shares ideas and evaluates opportunities across continents, investment disciplines and asset classes — all with a goal of building better insights, and ultimately better results, for our clients.
We remain mindful of the many economic challenges investors face today, and believe it is more important than ever to maintain a long-term view, employ time-tested principles, such as asset allocation and diversification, and work closely with investment advisors to identify and pursue the most suitable opportunities.
Respectfully,

Robert J. Manning
Chairman and Chief Executive Officer
MFS Investment Management®
February 15, 2013
The opinions expressed in this letter are subject to change, may not be relied upon for investment advice, and no forecasts can be guaranteed.
1
Table of Contents
MFS Global Tactical Allocation Portfolio
Portfolio structure
| Active Security Selection (a) | Tactical Overlay (b) | Net Market Exposure (c) | ||||||||||||
| Fixed Income | U.S. | 21.0% | 5.5% | 26.5% | ||||||||||
| Europe ex-U.K. | 17.1% | (3.3)% | 13.8% | |||||||||||
| Japan | 8.3% | 0.0% | 8.3% | |||||||||||
| Asia/Pacific ex-Japan | 2.0% | 4.4% | 6.4% | |||||||||||
| Emerging Markets | 2.6% | 0.0% | 2.6% | |||||||||||
| Developed - Middle East/Africa | 0.1% | 0.0% | 0.1% | |||||||||||
| United Kingdom | 5.4% | (7.2)% | (1.8)% | |||||||||||
| North America ex-U.S. | 2.7% | (5.2)% | (2.5)% | |||||||||||
| Total | 59.2% | (5.8)% | 53.4% | |||||||||||
| Equity | Europe ex-U.K. | 6.9% | 11.3% | 18.2% | ||||||||||
| U.S. Large Cap | 16.0% | (2.9)% | 13.1% | |||||||||||
| Emerging Markets | 0.5% | 7.1% | 7.6% | |||||||||||
| United Kingdom | 5.0% | 1.7% | 6.7% | |||||||||||
| Japan | 4.3% | (1.2)% | 3.1% | |||||||||||
| U.S. Small/Mid Cap | 0.7% | (2.8)% | (2.1)% | |||||||||||
| Asia/Pacific ex-Japan | 0.2% | (2.4)% | (2.2)% | |||||||||||
| North America ex-U.S. | 0.2% | (4.8)% | (4.6)% | |||||||||||
| Total | 33.8% | 6.0% | 39.8% | |||||||||||
| Real Estate-related | Non-U.S. | 0.6% | 0.0% | 0.6% | ||||||||||
| U.S. | 0.3% | 0.0% | 0.3% | |||||||||||
| Total | 0.9% | 0.0% | 0.9% | |||||||||||
| Cash | Cash & Equivalents (d) | 2.0% | 4.0% | 6.0% | ||||||||||
| Derivative Offsets (e) | 0.1% | (0.2)% | (0.1)% | |||||||||||
| Total | 2.1% | 3.8% | 5.9% | |||||||||||
| Total Net Exposure Summary | 96.0% | 4.0% | 100.0% | |||||||||||
Strategic Allocation Targets & Net Exposure Ranges |
| |||||||
| Asset Class | Target (w) | Ranges (z) | ||||||
Equities | 35% | 0 to 70% | ||||||
Fixed Income, Cash and Cash Equivalents | 65% | 30 to 100% | ||||||
| Top ten holdings (c) | ||||
| US Treasury Note 10 Yr Future MAR 2013 | 5.5% | |||
| Australian Government Bond 10 Yr Future MAR 2013 | 4.4% | |||
| CAC 40 Index Future JAN 2013 | 4.2% | |||
| Dax Index Future MAR 2013 | 3.8% | |||
| Japan Govt Bond, 1.1%, 2020 | 3.0% | |||
| S&P 500 E-Mini Future MAR 2013 | (2.9)% | |||
| Euro-Bund 10 Yr Future MAR 2013 | (3.3)% | |||
| S&P TSE 60 Index Future Mar 2013 | (4.8)% | |||
| Govt of Canada Bond 10 Yr Future MAR 2013 | (5.2)% | |||
| UK Long Gilt Bond 10 Yr Future MAR 2013 | (7.2)% |
| (a) | Represents the actively managed portion of the portfolio and for purposes of this presentation, components include the market value of securities, less any securities sold short. The bond component will include any accrued interest amounts. This also reflects the equivalent exposure of certain derivative positions. These amounts may be negative from time to time. |
| (b) | Represents the tactical overlay portion of the portfolio which is how the fund manages its exposure to markets and currencies through use of derivative positions. Percentages reflect the equivalent exposure of those derivative positions. |
| (c) | For purposes of this presentation, the components include the market value of securities, less any securities sold short, and reflect the impact of the equivalent exposure of derivative positions. These amounts may be negative from time to time. The bond component will include any accrued interest amounts. |
2
Table of Contents
MFS Global Tactical Allocation Portfolio
Portfolio Composition – continued
| (d) | Cash & Equivalents includes cash, other assets (excluding interest receivables) less liabilities, short term securities, and the unrealized gain or loss in connection with all forward currency exchange contracts. |
| (e) | Derivative Offsets represent the offsetting of the leverage produced by the fund’s derivative positions. |
| (w) | The strategic asset class allocations have been selected for investment over longer time periods. The actual strategic asset class weightings can deviate due to market movements and cash flows. |
| (z) | The fund’s net exposures to the asset classes referenced will normally fall within theses ranges after taking into account the tactical overlay. |
Equivalent exposure is a calculated amount that translates the derivative position into a reasonable approximation of the amount of the underlying asset that the portfolio would have to hold at a given point in time to have the same price sensitivity that results from the portfolio’s ownership of the derivative contract. When dealing with derivatives, equivalent exposure is a more representative measure of the potential impact of a position on portfolio performance than market value. The market value of derivatives may be different.
Where the fund holds convertible bonds, these are treated as part of the equity portion of the portfolio.
Percentages are based on net assets as of 12/31/12.
The portfolio is actively managed and current holdings may be different.
3
Table of Contents
MFS Global Tactical Allocation Portfolio
Summary of Results
For the twelve months ended December 31, 2012, Initial Class shares of the MFS Global Tactical Allocation Portfolio (“fund”) provided a total return of 9.56%, while Service Class shares of the fund provided a total return of 9.26%. These compare with a return of 4.32% over the same period for the fund’s benchmark, the Barclays Global Aggregate Bond Index. The fund’s other benchmarks, the MSCI World Index and the MFS Global Tactical Allocation Blended Index (“Blended Index”), generated total returns of 16.54% and 9.44%, respectively. The Blended Index reflects the blended returns of equity and fixed income indices, with percentage allocations to each index designed to resemble the strategic allocations of the fund. The market indices and related percentage allocations used to compile the Blended Index are set forth in the Performance Summary.
The fund’s investment objective is to seek total return. MFS seeks to achieve the fund’s objective by generating returns from a combination of (1) individual security selection of a combination of debt instruments and equity securities and (2) a tactical asset allocation overlay primarily using derivative instruments to manage the fund’s exposure to asset classes (e.g. equity and fixed income), markets (e.g. U.S. and foreign countries), and currencies (e.g. U.S. dollar and Japanese yen). Derivatives include futures, forward contracts, options, structured securities, inverse floating rate instruments, and swaps.
Market Environment
The beginning of the period was characterized by a risk-on sentiment as a result of additional liquidity measures by the Federal Reserve Bank (“Fed”) and the European Central Bank (“ECB”) as well as a commensurate improvement in macroeconomic conditions. During this time, global equity valuations rose, credit spreads contracted, and high-quality sovereign yields increased modestly.
During the middle of the period, however, conditions worsened, driven by broadly weaker global macroeconomic indicators, as well as renewed concerns over the eurozone’s capacity and determination to address its ongoing crisis. Despite this deterioration, broad market sentiment remained relatively resilient as equity markets generally maintained gains and credit spreads did not indicate deterioration.
However, this renewed weakness in the fundamentals precipitated a further round of monetary easing by both the Fed (through a third round of quantitative easing) and the ECB (through a new bond purchase facility) in the second half of the period, which soon instilled additional confidence in risk markets. Nonetheless, towards the end of the period, weaker equity earnings reports and declining forward guidance caused market sentiment to soften. In addition, as we moved toward year end, the fiscal cliff negotiations between the Republicans in the U.S. Congress and President Obama were a particular source of market attention, where uncertainty surrounding the fiscal negotiations continued right up to the end-of-year deadline.
Detractors from Performance
Within the equity portion of the fund, stock selection in the autos & housing sector held back performance relative to the MSCI World Index. However, there were no individual securities within this sector that were among the fund’s top relative detractors for the reporting period.
The combination of an underweight position and stock selection in the financial services sector also weighed on relative results. The fund’s underweight position in shares of financial services firm Bank of America hindered relative returns as the stock posted strong results for the period.
Other top individual detractors included the fund’s holdings of oil and gas exploration and production company Occidental Petroleum, voice and data communications services company Vodafone Group (United Kingdom), parcel delivery services company Yamato Holding (Japan), pharmaceutical firm GlaxoSmithKline (United Kingdom), household and industrial products manufacturer Kao Corp. (Japan), Hong Kong listed telecommunications service provider China Unicom (Hong Kong) (b), and mail room equipment supplier Neopost (France). Not holding shares of strong-performing computer and personal electronics maker Apple also dampened relative performance.
Within the fixed income portion of the fund, a longer duration (d) stance in the North American region dampened results relative to the Barclays Global Aggregate Bond Index as rates rallied over the reporting period. The fund’s lack of exposure to bonds in the European banking and financial sectors also held back relative returns as both sectors generated strong performance during the reporting period.
Within the fund’s tactical overlay, short exposures to developed Asian equity markets, such as Japan, Hong Kong, and Australia, was a detractor from relative performance as these markets delivered solid performance during the period.
4
Table of Contents
MFS Global Tactical Allocation Portfolio
Management Review – continued
Contributors to Performance
Within the equity portion of the fund, the combination of stock selection and an underweight position in the technology sector benefited performance relative to the MSCI World Index. The timing of the fund’s ownership in shares of mobile phone maker Nokia (Finland), and holdings of contract semiconductor manufacturer Taiwan Semiconductor (b) (Taiwan), contributed to relative results.
Strong stock selection and an underweight position in the basic materials sector were also positive factors for relative performance. Holdings of protective and decorative coatings manufacturer PPG Industries were among the fund’s top relative contributors for the reporting period.
Individual securities in other sectors that aided relative results included Dutch brewer Heineken International N.V., healthcare products maker Bayer AG (Germany), diversified household products company Henkel KGaA (Germany), transaction processing power and technology solutions provider Amadeus Holdings AG (h) (Spain), Japanese securities brokerage firm Daiwa Securities, Switzerland-based reinsurance company Swiss Reinsurance, and real estate company Deutsche Wohnen (Germany).
Within the fixed income portion of the fund, an overweight exposure to U.S. corporate bonds in the banking and financial sectors contributed to results relative to the Barclays Global Aggregate Bond Index as both sectors outpaced the benchmark during the reporting period. The fund’s greater exposure to “BBB” (r) rated securities also supported positive relative results. This quality bucket performed well as these issues appeared to have benefited from strong investor demand due to a liquidity-fueled rally. The portion of the fund’s return derived from yield, which was greater than that of the benchmark, was another positive factor for relative results.
The fund’s tactical overlay contributed to relative performance, led by a short position in Japanese yen which depreciated during the period. The overlay’s short exposure to Canadian bonds also supported relative results. Exposure to emerging markets equity, particularly in Turkey, South Africa and China aided relative returns. Additionally, long exposure to the strong performing German equity market and short exposure to the Canadian equity market, which posted positive absolute performance but did not perform as well as other equity markets, benefited relative results.
Respectfully,
| Nevin Chitkara | Steven Gorham | Richard Hawkins | Benjamin Nastou | |||
| Portfolio Manager | Portfolio Manager | Portfolio Manager | Portfolio Manager | |||
| Natalie Shapiro | Benjamin Stone | Erik Weisman | Barnaby Wiener | |||
| Portfolio Manager | Portfolio Manager | Portfolio Manager | Portfolio Manager | |||
Note to Contract Owners: Linda Zhang is no longer a co-manager of the fund.
| (b) | Security is not a benchmark constituent. |
| (d) | Duration is a measure of how much a bond’s price is likely to fluctuate with general changes in interest rates, e.g., if rates rise 1.00%, a bond with a 5-year duration is likely to lose about 5.00% of its value. |
| (h) | Security was not held in the portfolio at period end. |
| (r) | Bonds rated “BBB”, “Baa”, or higher are considered investment grade; bonds rated “BB”, “Ba”, or below are considered non-investment grade. The sources for bond quality ratings are Moody’s Investors Service, Standard & Poor’s and Fitch, Inc. and are applied using the following hierarchy: If all three agencies provide a rating, the middle rating (after dropping the highest and lowest ratings) is assigned; if two of the three agencies rate a security, the lower of the two is assigned. Ratings are shown in the S&P and Fitch scale (e.g., AAA). For securities which are not rated by any of the three agencies, the security is considered Not Rated. |
The views expressed in this report are those of the portfolio managers only through the end of the period of the report as stated on the cover and do not necessarily reflect the views of MFS or any other person in the MFS organization. These views are subject to change at any time based on market or other conditions, and MFS disclaims any responsibility to update such views. These views may not be relied upon as investment advice or an indication of trading intent on behalf of any MFS portfolio. References to specific securities are not recommendations of such securities, and may not be representative of any MFS portfolio’s current or future investments.
5
Table of Contents
MFS Global Tactical Allocation Portfolio
PERFORMANCE SUMMARY THROUGH 12/31/12
The following chart illustrates the historical performance of the fund in comparison to its benchmark(s). Benchmarks are unmanaged and may not be invested in directly. Benchmark returns do not reflect any fees or expenses. The performance of other share classes will be greater than or less than that of the class depicted below. (See Notes to Performance Summary.)
Performance data shown represents past performance and is no guarantee of future results. Investment return and principal value fluctuate so your units, when sold, may be worth more or less than the original cost; current performance may be lower or higher than quoted. The performance shown does not reflect the deduction of taxes, if any, that a contract holder would pay on fund distributions or the redemption of contract units. The returns for the fund shown also do not reflect the deduction of expenses associated with variable products, such as mortality and expense risk charges, separate account charges, and sales charges imposed by the insurance company separate accounts. Such expenses would reduce the overall returns shown.
Growth of a Hypothetical $10,000 Investment

Total Returns through 12/31/12
Average annual total returns
| Share Class | Class inception date | 1-yr | 5-yr | 10-yr | ||||||||
| Initial Class | 11/7/94 | 9.56% | 2.72% | 8.11% | ||||||||
| Service Class | 8/24/01 | 9.26% | 2.46% | 7.84% | ||||||||
| Comparative benchmarks | ||||||||||||
| Barclays Global Aggregate Bond Index (f) | 4.32% | 5.44% | 5.98% | |||||||||
| MSCI World Index (f) | 16.54% | (0.60)% | 8.08% | |||||||||
| MFS Global Tactical Allocation Blended Index (f)(y) | 9.44% | 3.72% | 6.38% | |||||||||
| Barclays Global Aggregate Bond Index Hedged (f) | 5.72% | 5.28% | 4.76% | |||||||||
| (f) | Source: FactSet Research Systems Inc. |
| (y) | The MFS Global Tactical Allocation Blended Index is at a point in time and allocations during the period can change. As of December 31, 2012, the blended index was comprised of 35% MSCI World Index, 54% Barclays Global Aggregate Bond Index Hedged, and 11% Barclays Global Aggregate Bond Index. |
Benchmark Definitions
Barclays Global Aggregate Bond Index – provides a broad-based measure of the global investment-grade fixed income markets. The three major components of this index are the U.S. Aggregate, the Pan-European Aggregate, and the Asian-Pacific Aggregate Indices. The index also includes Eurodollar and Euro-Yen corporate bonds, Canadian government, agency and corporate securities, and USD investment grade 144A securities.
Barclays Global Aggregate Bond Index Hedged – provides a broad-based measure of the currency-hedged performance of global investment-grade fixed income markets. The three major components of this index are the U.S. Aggregate, the Pan-European Aggregate, and the Asian-Pacific Aggregate Indices. The index also includes Eurodollar and Euro-Yen corporate bonds, Canadian government, agency and corporate securities, and USD investment grade 144A securities.
6
Table of Contents
MFS Global Tactical Allocation Portfolio
Performance Summary – continued
MSCI World Index – a market capitalization-weighted index that is designed to measure equity market performance in the global developed markets.
It is not possible to invest directly in an index.
Notes to Performance Summary
Average annual total return represents the average annual change in value for each share class for the periods presented.
Performance results reflect any applicable expense subsidies and waivers in effect during the periods shown. Without such subsidies and waivers the fund’s performance results would be less favorable. Please see the prospectus and financial statements for complete details. All results are historical and assume the reinvestment of any dividends and capital gains distributions.
Performance results do not include adjustments made for financial reporting purposes in accordance with U.S. generally accepted accounting principles and may differ from amounts reported in the financial highlights.
From time to time the fund may receive proceeds from litigation settlements, without which performance would be lower.
7
Table of Contents
MFS Global Tactical Allocation Portfolio
Fund Expenses Borne by the Contract Holders During the Period,
July 1, 2012 through December 31, 2012
As a contract holder of the fund, you incur ongoing costs, including management fees; distribution and/or service (12b-1) fees; and other fund expenses. This example is intended to help you understand your ongoing costs (in dollars) of investing in the fund and to compare these costs with the ongoing costs of investing in other mutual funds.
The example is based on an investment of $1,000 invested at the beginning of the period and held for the entire period July 1, 2012 through December 31, 2012.
Actual Expenses
The first line for each share class in the following table provides information about actual account values and actual expenses. You may use the information in this line, together with the amount you invested, to estimate the expenses that you paid over the period. Simply divide your account value by $1,000 (for example, an $8,600 account value divided by $1,000 = 8.6), then multiply the result by the number in the first line under the heading entitled “Expenses Paid During Period” to estimate the expenses you paid on your account during this period.
Hypothetical Example for Comparison Purposes
The second line for each share class in the following table provides information about hypothetical account values and hypothetical expenses based on the fund’s actual expense ratio and an assumed rate of return of 5% per year before expenses, which is not the fund’s actual return. The hypothetical account values and expenses may not be used to estimate the actual ending account balance or expenses you paid for the period. You may use this information to compare the ongoing costs of investing in the fund and other funds. To do so, compare this 5% hypothetical example with the 5% hypothetical examples that appear in the shareholder reports of the other funds.
Please note that the expenses shown in the table are meant to highlight the fund’s ongoing costs only and do not take into account the fees and expenses imposed under the variable contracts through which your investment in the fund is made. Therefore, the second line for each share class in the table is useful in comparing ongoing costs associated with an investment in vehicles (such as the fund) which fund benefits under variable annuity and variable life insurance contracts and to qualified pension and retirement plans only, and will not help you determine the relative total costs of investing in the fund through variable annuity and variable life insurance contracts. If the fees and expenses imposed under the variable contracts were included, your costs would have been higher.
| Share Class | Annualized Expense Ratio | Beginning Account Value 7/01/12 | Ending Account Value 12/31/12 | Expenses Paid During Period (p) 7/01/12-12/31/12 | ||||||||||||||
| Initial Class | Actual | 0.75% | $1,000.00 | $1,071.48 | $3.91 | |||||||||||||
| Hypothetical (h) | 0.75% | $1,000.00 | $1,021.37 | $3.81 | ||||||||||||||
| Service Class | Actual | 1.00% | $1,000.00 | $1,069.82 | $5.20 | |||||||||||||
| Hypothetical (h) | 1.00% | $1,000.00 | $1,020.11 | $5.08 | ||||||||||||||
| (h) | 5% class return per year before expenses. |
| (p) | Expenses paid are equal to each class’s annualized expense ratio, as shown above, multiplied by the average account value over the period, multiplied by the number of days in the period, divided by the number of days in the year. |
8
Table of Contents
MFS Global Tactical Allocation Portfolio
PORTFOLIO OF INVESTMENTS – 12/31/12
The Portfolio of Investments is a complete list of all securities owned by your fund. It is categorized by broad-based asset classes.
| Issuer | Shares/Par | Value ($) | ||||||
| COMMON STOCKS – 34.3% | ||||||||
| Aerospace – 1.9% | ||||||||
| Cobham PLC | 559,240 | $ | 2,033,821 | |||||
| Honeywell International, Inc. | 66,741 | 4,235,987 | ||||||
| Lockheed Martin Corp. (s) | 88,540 | 8,171,357 | ||||||
| Northrop Grumman Corp. | 23,370 | 1,579,345 | ||||||
| United Technologies Corp. | 55,430 | 4,545,814 | ||||||
|
| |||||||
| $ | 20,566,324 | |||||||
|
| |||||||
| Alcoholic Beverages – 0.7% | ||||||||
| Heineken N.V. | 105,085 | $ | 7,009,476 | |||||
|
| |||||||
| Automotive – 0.3% | ||||||||
| Johnson Controls, Inc. | 64,510 | $ | 1,980,457 | |||||
| USS Co. Ltd. | 15,070 | 1,563,794 | ||||||
|
| |||||||
| $ | 3,544,251 | |||||||
|
| |||||||
| Broadcasting – 1.1% | ||||||||
| Fuji Television Network, Inc. | 968 | $ | 1,463,287 | |||||
| Nippon Television Holdings, Inc. | 104,200 | 1,384,362 | ||||||
| Omnicom Group, Inc. | 51,840 | 2,589,926 | ||||||
| Viacom, Inc., “B” | 45,680 | 2,409,163 | ||||||
| Walt Disney Co. | 81,530 | 4,059,379 | ||||||
|
| |||||||
| $ | 11,906,117 | |||||||
|
| |||||||
| Brokerage & Asset Managers – 0.7% | ||||||||
| BlackRock, Inc. | 16,442 | $ | 3,398,726 | |||||
| Computershare Ltd. | 124,231 | 1,169,816 | ||||||
| Daiwa Securities Group, Inc. | 453,000 | 2,523,068 | ||||||
|
| |||||||
| $ | 7,091,610 | |||||||
|
| |||||||
| Business Services – 1.8% | ||||||||
| Accenture PLC, “A” | 91,050 | $ | 6,054,825 | |||||
| Amadeus IT Holding S.A. | 132,765 | 3,331,641 | ||||||
| Bunzl PLC | 152,658 | 2,492,565 | ||||||
| Compass Group PLC | 308,260 | 3,645,718 | ||||||
| Dun & Bradstreet Corp. | 20,300 | 1,596,595 | ||||||
| Nomura Research, Inc. | 75,500 | 1,561,678 | ||||||
|
| |||||||
| $ | 18,683,022 | |||||||
|
| |||||||
| Cable TV – 0.3% | ||||||||
| Comcast Corp., “Special A” | 73,680 | $ | 2,648,796 | |||||
|
| |||||||
| Chemicals – 0.9% | ||||||||
| 3M Co. | 41,680 | $ | 3,869,988 | |||||
| Givaudan S.A. | 2,230 | 2,364,195 | ||||||
| PPG Industries, Inc. | 24,460 | 3,310,661 | ||||||
|
| |||||||
| $ | 9,544,844 | |||||||
|
| |||||||
| Computer Software – 0.4% | ||||||||
| Oracle Corp. | 117,030 | $ | 3,899,440 | |||||
|
| |||||||
| Computer Software – Systems – 0.7% | ||||||||
| Canon, Inc. | 64,400 | $ | 2,525,908 | |||||
| International Business Machines Corp. | 27,080 | 5,187,174 | ||||||
|
| |||||||
| $ | 7,713,082 | |||||||
|
| |||||||
| Issuer | Shares/Par | Value ($) | ||||||
| COMMON STOCKS – continued | ||||||||
| Construction – 0.4% | ||||||||
| Geberit AG | 7,811 | $ | 1,729,185 | |||||
| Stanley Black & Decker, Inc. | 38,140 | 2,821,216 | ||||||
|
| |||||||
| $ | 4,550,401 | |||||||
|
| |||||||
| Consumer Products – 1.6% | ||||||||
| Henkel KGaA, IPS | 63,645 | $ | 5,226,730 | |||||
| Kao Corp. | 141,800 | 3,694,517 | ||||||
| KOSE Corp. | 36,000 | 752,352 | ||||||
| Procter & Gamble Co. | 52,690 | 3,577,124 | ||||||
| Reckitt Benckiser Group PLC | 60,590 | 3,795,583 | ||||||
|
| |||||||
| $ | 17,046,306 | |||||||
|
| |||||||
| Electrical Equipment – 0.9% | ||||||||
| Danaher Corp. | 44,530 | $ | 2,489,227 | |||||
| Legrand S.A. | 74,291 | 3,135,586 | ||||||
| Pentair Ltd. | 8,975 | 441,121 | ||||||
| Spectris PLC | 44,556 | 1,492,461 | ||||||
| Tyco International Ltd. | 78,700 | 2,301,975 | ||||||
|
| |||||||
| $ | 9,860,370 | |||||||
|
| |||||||
| Electronics – 0.8% | ||||||||
| Halma PLC | 201,173 | $ | 1,516,116 | |||||
| Hirose Electric Co. Ltd. | 13,900 | 1,664,162 | ||||||
| Intel Corp. | 50,790 | 1,047,798 | ||||||
| Taiwan Semiconductor Manufacturing Co. Ltd., ADR | 250,038 | 4,290,652 | ||||||
|
| |||||||
| $ | 8,518,728 | |||||||
|
| |||||||
| Energy – Independent – 0.5% | ||||||||
| Cairn Energy PLC | 334,426 | $ | 1,465,083 | |||||
| Occidental Petroleum Corp. | 49,670 | 3,805,219 | ||||||
|
| |||||||
| $ | 5,270,302 | |||||||
|
| |||||||
| Energy – Integrated – 1.8% | ||||||||
| BP PLC | 703,575 | $ | 4,874,904 | |||||
| Chevron Corp. | 37,810 | 4,088,773 | ||||||
| Exxon Mobil Corp. | 50,940 | 4,408,857 | ||||||
| Royal Dutch Shell PLC, “A” | 150,929 | 5,333,005 | ||||||
|
| |||||||
| $ | 18,705,539 | |||||||
|
| |||||||
| Food & Beverages – 1.4% | ||||||||
| General Mills, Inc. | 67,230 | $ | 2,716,764 | |||||
| Groupe Danone | 104,775 | 6,922,445 | ||||||
| Nestle S.A. | 80,863 | 5,269,157 | ||||||
|
| |||||||
| $ | 14,908,366 | |||||||
|
| |||||||
| Food & Drug Stores – 0.6% | ||||||||
| CVS Caremark Corp. | 72,940 | $ | 3,526,649 | |||||
| Lawson, Inc. | 36,700 | 2,494,622 | ||||||
|
| |||||||
| $ | 6,021,271 | |||||||
|
| |||||||
| General Merchandise – 0.3% | ||||||||
| Target Corp. | 57,950 | $ | 3,428,902 | |||||
|
| |||||||
9
Table of Contents
MFS Global Tactical Allocation Portfolio
Portfolio of Investments – continued
| Issuer | Shares/Par | Value ($) | ||||||
| COMMON STOCKS – continued | ||||||||
| Insurance – 2.0% | ||||||||
| Aon PLC | 42,020 | $ | 2,336,312 | |||||
| Hiscox Ltd. | 208,734 | 1,519,429 | ||||||
| ING Groep N.V. (a) | 268,861 | 2,571,035 | ||||||
| Jardine Lloyd Thompson Group PLC | 73,725 | 967,146 | ||||||
| MetLife, Inc. | 106,370 | 3,503,828 | ||||||
| Prudential Financial, Inc. | 37,970 | 2,024,940 | ||||||
| Swiss Re Ltd. | 45,698 | 3,335,235 | ||||||
| Travelers Cos., Inc. | 42,940 | 3,083,951 | ||||||
| Zurich Insurance Group AG | 9,065 | 2,423,905 | ||||||
|
| |||||||
| $ | 21,765,781 | |||||||
|
| |||||||
| Leisure & Toys – 0.2% | ||||||||
| Hasbro, Inc. | 64,540 | $ | 2,316,986 | |||||
|
| |||||||
| Machinery & Tools – 0.2% | ||||||||
| Glory Ltd. | 37,700 | $ | 873,292 | |||||
| Neopost S.A. | 28,728 | 1,519,049 | ||||||
|
| |||||||
| $ | 2,392,341 | |||||||
|
| |||||||
| Major Banks – 2.6% | ||||||||
| Bank of New York Mellon Corp. | 148,751 | $ | 3,822,901 | |||||
| Goldman Sachs Group, Inc. | 22,910 | 2,922,400 | ||||||
| HSBC Holdings PLC | 476,854 | 5,043,604 | ||||||
| JPMorgan Chase & Co. | 138,810 | 6,103,476 | ||||||
| State Street Corp. | 63,860 | 3,002,059 | ||||||
| Sumitomo Mitsui Financial Group, Inc. | 35,100 | 1,275,149 | ||||||
| Toronto-Dominion Bank | 15,498 | 1,304,873 | ||||||
| Wells Fargo & Co. | 131,410 | 4,491,594 | ||||||
|
| |||||||
| $ | 27,966,056 | |||||||
|
| |||||||
| Medical & Health Technology & Services – 0.3% | ||||||||
| Kobayashi Pharmaceutical Co. Ltd. | 35,200 | $ | 1,671,532 | |||||
| Quest Diagnostics, Inc. | 24,410 | 1,422,371 | ||||||
|
| |||||||
| $ | 3,093,903 | |||||||
|
| |||||||
| Medical Equipment – 0.5% | ||||||||
| Medtronic, Inc. | 73,950 | $ | 3,033,429 | |||||
| St. Jude Medical, Inc. | 50,870 | 1,838,442 | ||||||
|
| |||||||
| $ | 4,871,871 | |||||||
|
| |||||||
| Network & Telecom – 0.6% | ||||||||
| Ericsson, Inc., “B” | 391,218 | $ | 3,934,974 | |||||
| Nokia Oyj | 597,617 | 2,350,188 | ||||||
|
| |||||||
| $ | 6,285,162 | |||||||
|
| |||||||
| Oil Services – 0.1% | ||||||||
| Transocean, Inc. | 14,030 | $ | 626,440 | |||||
|
| |||||||
| Other Banks & Diversified Financials – 0.5% | ||||||||
| DnB NOR A.S.A. | 181,838 | $ | 2,317,875 | |||||
| Hachijuni Bank Ltd. | 124,000 | 622,459 | ||||||
| MasterCard, Inc., “A” | 1,863 | 915,255 | ||||||
| North Pacific Bank Ltd. (a) | 177,700 | 496,374 | ||||||
| Western Union Co. | 96,090 | 1,307,785 | ||||||
|
| |||||||
| $ | 5,659,748 | |||||||
|
| |||||||
| Issuer | Shares/Par | Value ($) | ||||||
| COMMON STOCKS – continued | ||||||||
| Pharmaceuticals – 4.0% | ||||||||
| Abbott Laboratories | 69,250 | $ | 4,535,875 | |||||
| Bayer AG | 77,844 | 7,392,263 | ||||||
| GlaxoSmithKline PLC | 269,525 | 5,851,815 | ||||||
| Johnson & Johnson | 113,690 | 7,969,669 | ||||||
| Pfizer, Inc. (s) | 326,030 | 8,176,832 | ||||||
| Roche Holding AG | 34,879 | 7,105,721 | ||||||
| Santen Pharmaceutical Co. Ltd. | 36,400 | 1,392,809 | ||||||
|
| |||||||
| $ | 42,424,984 | |||||||
|
| |||||||
| Printing & Publishing – 0.2% | ||||||||
| Pearson PLC | 115,530 | $ | 2,258,536 | |||||
|
| |||||||
| Railroad & Shipping – 0.1% | ||||||||
| Canadian National Railway Co. | 11,650 | $ | 1,060,267 | |||||
|
| |||||||
| Real Estate – 0.5% | ||||||||
| Deutsche Wohnen AG | 186,793 | $ | 3,449,511 | |||||
| GSW Immobilien AG | 52,228 | 2,207,577 | ||||||
|
| |||||||
| $ | 5,657,088 | |||||||
|
| |||||||
| Restaurants – 0.2% | ||||||||
| McDonald’s Corp. | 26,940 | $ | 2,376,377 | |||||
|
| |||||||
| Specialty Chemicals – 0.1% | ||||||||
| Shin-Etsu Chemical Co. Ltd. | 18,900 | $ | 1,154,402 | |||||
|
| |||||||
| Specialty Stores – 0.1% | ||||||||
| Esprit Holdings Ltd. | 911,100 | $ | 1,273,886 | |||||
|
| |||||||
| Telecommunications – Wireless – 1.5% | ||||||||
| KDDI Corp. | 121,500 | $ | 8,582,153 | |||||
| NTT DoCoMo, Inc. | 1,316 | 1,889,972 | ||||||
| Vodafone Group PLC | 2,207,492 | 5,551,547 | ||||||
|
| |||||||
| $ | 16,023,672 | |||||||
|
| |||||||
| Telephone Services – 1.1% | ||||||||
| AT&T, Inc. | 134,480 | $ | 4,533,321 | |||||
| China Unicom (Hong Kong) Ltd. | 744,000 | 1,206,406 | ||||||
| Deutsche Telekom AG | 195,850 | 2,225,098 | ||||||
| TDC A.S. | 212,280 | 1,503,758 | ||||||
| Telecom Italia S.p.A. | 2,942,047 | 2,328,049 | ||||||
|
| |||||||
| $ | 11,796,632 | |||||||
|
| |||||||
| Tobacco – 1.9% | ||||||||
| British American Tobacco PLC | 103,945 | $ | 5,266,896 | |||||
| Japan Tobacco, Inc. | 161,200 | 4,540,059 | ||||||
| Lorillard, Inc. | 20,580 | 2,401,069 | ||||||
| Philip Morris International, Inc. (s) | 96,116 | 8,039,142 | ||||||
|
| |||||||
| $ | 20,247,166 | |||||||
|
| |||||||
| Trucking – 0.4% | ||||||||
| United Parcel Service, Inc., “B” | 20,000 | $ | 1,474,600 | |||||
| Yamato Holdings Co. Ltd. | 212,600 | 3,232,693 | ||||||
|
| |||||||
| $ | 4,707,293 | |||||||
|
| |||||||
| Utilities – Electric Power – 0.1% | ||||||||
| PG&E Corp. | 36,510 | $ | 1,466,972 | |||||
|
| |||||||
| Total Common Stocks (Identified Cost, $313,835,108) | $ | 366,342,710 | ||||||
|
| |||||||
10
Table of Contents
MFS Global Tactical Allocation Portfolio
Portfolio of Investments – continued
| Issuer | Shares/Par | Value ($) | ||||||
| BONDS – 59.1% | ||||||||
| Asset-Backed & Securitized – 2.4% | ||||||||
| Bayview Commercial Asset Trust, FRN, 1.725%, 2023 (z) | CAD | 170,000 | $ | 164,329 | ||||
| Citigroup/Deutsche Bank Commercial Mortgage Trust, 5.322%, 2049 | $ | 1,729,018 | 1,983,374 | |||||
| Commercial Mortgage Pass-Through Certificates, “A3”, 5.293%, 2049 | 532,759 | 553,409 | ||||||
| Commercial Mortgage Pass-Through Certificates, “A4”, 5.306%, 2046 | 1,432,759 | 1,646,303 | ||||||
| Credit Suisse Mortgage Capital Certificate, 5.311%, 2039 | 2,310,000 | 2,622,739 | ||||||
| CWCapital LLC, 5.223%, 2048 | 2,310,000 | 2,618,537 | ||||||
| G-Force LLC, CDO, “A2”, 4.83%, 2036 (z) | 443,304 | 445,521 | ||||||
| JPMorgan Chase Commercial Mortgage Securities Corp., “A3”, FRN, 5.811%, 2049 | 1,230,759 | 1,320,266 | ||||||
| JPMorgan Chase Commercial Mortgage Securities Corp., “A3”, FRN, 5.929%, 2051 | 1,808,573 | 1,923,955 | ||||||
| JPMorgan Chase Commercial Mortgage Securities Corp., “A4”, FRN, 5.811%, 2049 | 2,310,000 | 2,693,807 | ||||||
| Merrill Lynch Mortgage Trust, “A3”, FRN, 5.849%, 2050 | 2,373,000 | 2,523,401 | ||||||
| Merrill Lynch Mortgage Trust, FRN, 5.849%, 2050 | 3,310,000 | 3,807,791 | ||||||
| Merrill Lynch/Countrywide Commercial Mortgage Trust, FRN, 5.736%, 2050 | 2,460,000 | 2,818,186 | ||||||
| Wachovia Bank Commercial Mortgage Trust, “A3”, FRN, 5.921%, 2051 | 536,719 | 561,465 | ||||||
|
| |||||||
| $ | 25,683,083 | |||||||
|
| |||||||
| Automotive – 1.0% | ||||||||
| Daimler Finance North America LLC, 1.3%, 2015 (n) | $ | 3,180,000 | $ | 3,198,460 | ||||
| Hyundai Capital America, 2.125%, 2017 (n) | 266,000 | 267,905 | ||||||
| Nissan Motor Acceptance Corp., 1.95%, 2017 (n) | 420,000 | 425,738 | ||||||
| Toyota Motor Credit Corp., 0.875%, 2015 | 3,110,000 | 3,122,810 | ||||||
| Volkswagen International Finance N.V., 1.15%, 2015 (n) | 3,117,000 | 3,121,311 | ||||||
|
| |||||||
| $ | 10,136,224 | |||||||
|
| |||||||
| Biotechnology – 0.3% | ||||||||
| Life Technologies Corp., 6%, 2020 | $ | 2,750,000 | $ | 3,259,275 | ||||
|
| |||||||
| Broadcasting – 0.5% | ||||||||
| British Sky Broadcasting Group PLC, 3.125%, 2022 (n) | $ | 3,440,000 | $ | 3,428,029 | ||||
| NBCUniversal Media LLC, 5.15%, 2020 | 1,166,000 | 1,382,241 | ||||||
|
| |||||||
| $ | 4,810,270 | |||||||
|
| |||||||
| Building – 0.0% | ||||||||
| Owens Corning, Inc., 6.5%, 2016 | $ | 220,000 | $ | 247,206 | ||||
|
| |||||||
| Issuer | Shares/Par | Value ($) | ||||||
| BONDS – continued | ||||||||
| Cable TV – 0.4% | ||||||||
| Cox Communications, Inc., 3.25%, 2022 (n) | $ | 998,000 | $ | 1,029,195 | ||||
| DIRECTV Holdings LLC, 5.2%, 2020 | 1,656,000 | 1,879,252 | ||||||
| Time Warner Cable, Inc., 5%, 2020 | 1,020,000 | 1,187,622 | ||||||
|
| |||||||
| $ | 4,096,069 | |||||||
|
| |||||||
| Chemicals – 0.1% | ||||||||
| Dow Chemical Co., 8.55%, 2019 | $ | 930,000 | $ | 1,255,571 | ||||
|
| |||||||
| Conglomerates – 0.0% | ||||||||
| Roper Industries, Inc., 1.85%, 2017 | $ | 511,000 | $ | 510,618 | ||||
|
| |||||||
| Consumer Products – 0.1% | ||||||||
| Newell Rubbermaid, Inc., 4.7%, 2020 | $ | 1,350,000 | $ | 1,491,063 | ||||
|
| |||||||
| Electrical Equipment – 0.1% | ||||||||
| Ericsson, Inc., 4.125%, 2022 | $ | 780,000 | $ | 810,650 | ||||
|
| |||||||
| Emerging Market Quasi-Sovereign – 1.5% | ||||||||
| Banco do Brasil (Cayman Branch), 6%, 2020 (n) | $ | 910,000 | $ | 1,057,875 | ||||
| Banco do Nordeste do Brasil (BNB), 3.625%, 2015 (n) | 519,000 | 537,165 | ||||||
| BNDES Participacoes S.A., 6.5%, 2019 (n) | 700,000 | 857,500 | ||||||
| CEZ A.S., 4.25%, 2022 (n) | 1,645,000 | 1,760,874 | ||||||
| CNPC (HK) Overseas Capital Ltd., 4.5%, 2021 (n) | 669,000 | 748,330 | ||||||
| Comision Federal de Electricidad, 5.75%, 2042 (n) | 1,163,000 | 1,317,098 | ||||||
| Corporacion Nacional del Cobre de Chile, 3.75%, 2020 (n) | 474,000 | 512,547 | ||||||
| Empresa Nacional del Petroleo, 6.25%, 2019 | 619,000 | 711,708 | ||||||
| Pemex Project Funding Master Trust, 5.75%, 2018 | 1,003,000 | 1,171,003 | ||||||
| Petrobras International Finance Co., 5.375%, 2021 | 2,072,000 | 2,332,699 | ||||||
| Petroleos Mexicanos, 6%, 2020 | 600,000 | 717,000 | ||||||
| Petroleos Mexicanos, 5.5%, 2021 | 664,000 | 775,884 | ||||||
| PTT PLC, 3.375%, 2022 (z) | 2,610,000 | 2,594,596 | ||||||
| Rosneft, 3.149%, 2017 (z) | 348,000 | 353,220 | ||||||
| Rosneft, 4.199%, 2022 (z) | 578,000 | 588,115 | ||||||
|
| |||||||
| $ | 16,035,614 | |||||||
|
| |||||||
| Emerging Market Sovereign – 0.6% | ||||||||
| Federative Republic of Brazil, 5.625%, 2041 | $ | 1,255,000 | $ | 1,644,050 | ||||
| Republic of Colombia, 6.125%, 2041 | 1,241,000 | 1,703,893 | ||||||
| Republic of Peru, 7.35%, 2025 | 1,400,000 | 2,028,600 | ||||||
| Republic of Peru, 5.625%, 2050 | 51,000 | 66,122 | ||||||
| Russian Federation, 4.5%, 2022 (n) | 400,000 | 458,000 | ||||||
| Russian Federation, 5.625%, 2042 (n) | 200,000 | 248,500 | ||||||
|
| |||||||
| $ | 6,149,165 | |||||||
|
| |||||||
| Energy – Independent – 0.1% | ||||||||
| Apache Corp., 4.75%, 2043 | $ | 526,000 | $ | 572,607 | ||||
|
| |||||||
11
Table of Contents
MFS Global Tactical Allocation Portfolio
Portfolio of Investments – continued
| Issuer | Shares/Par | Value ($) | ||||||
| BONDS – continued | ||||||||
| Financial Institutions – 0.1% | ||||||||
| General Electric Capital Corp., 4.625%, 2021 | $ | 900,000 | $ | 1,020,866 | ||||
| SLM Corp., 6.25%, 2016 | 493,000 | 536,138 | ||||||
|
| |||||||
| $ | 1,557,004 | |||||||
|
| |||||||
| Food & Beverages – 0.8% | ||||||||
| Anheuser-Busch InBev S.A., 5.375%, 2020 | $ | 1,310,000 | $ | 1,594,315 | ||||
| Grupo Bimbo S.A.B. de C.V., 4.5%, 2022 (n) | 1,924,000 | 2,102,572 | ||||||
| Kraft Foods, Inc., 6.125%, 2018 | 470,000 | 571,882 | ||||||
| SABMiller Holdings, Inc., 3.75%, 2022 (n) | 466,000 | 503,201 | ||||||
| Tyson Foods, Inc., 6.6%, 2016 | 3,213,000 | 3,681,921 | ||||||
|
| |||||||
| $ | 8,453,891 | |||||||
|
| |||||||
| Food & Drug Stores – 0.0% | ||||||||
| CVS Caremark Corp., 5.75%, 2017 | $ | 444,000 | $ | 530,834 | ||||
|
| |||||||
| Forest & Paper Products – 0.2% | ||||||||
| Georgia-Pacific Corp., 5.4%, 2020 (n) | $ | 1,590,000 | $ | 1,891,518 | ||||
| Votorantim Participacoes S.A., 6.75%, 2021 (n) | 600,000 | 703,500 | ||||||
|
| |||||||
| $ | 2,595,018 | |||||||
|
| |||||||
| Insurance – 0.6% | ||||||||
| American International Group, Inc., 4.875%, 2016 | $ | 1,460,000 | $ | 1,632,982 | ||||
| Swiss Re Ltd., 2.875%, 2022 (n) | 1,550,000 | 1,551,178 | ||||||
| Unum Group, 7.125%, 2016 | 800,000 | 942,441 | ||||||
| UnumProvident Corp., 6.85%, 2015 (n) | 2,429,000 | 2,748,209 | ||||||
|
| |||||||
| $ | 6,874,810 | |||||||
|
| |||||||
| Insurance – Health – 0.1% | ||||||||
| UnitedHealth Group, Inc., 2.75%, 2023 | $ | 1,410,000 | $ | 1,422,684 | ||||
|
| |||||||
| Insurance – Property & Casualty – 0.7% | ||||||||
| AXIS Capital Holdings Ltd., 5.75%, 2014 | $ | 320,000 | $ | 343,190 | ||||
| Chubb Corp., 6.375% to 2017, FRN to 2067 | 1,010,000 | 1,100,900 | ||||||
| CNA Financial Corp., 5.875%, 2020 | 2,000,000 | 2,359,610 | ||||||
| Liberty Mutual Group, Inc., 4.95%, 2022 (n) | 677,000 | 737,854 | ||||||
| QBE Capital Funding III Ltd., FRN, 7.25%, 2041 (n) | 1,089,000 | 1,127,115 | ||||||
| ZFS Finance USA Trust II, 6.45% to 2016, FRN to 2065 (n) | 2,000,000 | 2,140,000 | ||||||
|
| |||||||
| $ | 7,808,669 | |||||||
|
| |||||||
| International Market Quasi-Sovereign – 0.4% | ||||||||
| Statoil A.S.A., 4.25%, 2041 | $ | 1,260,000 | $ | 1,355,637 | ||||
| Temasek Financial I Ltd., 2.375%, 2023 (n) | 2,880,000 | 2,836,529 | ||||||
|
| |||||||
| $ | 4,192,166 | |||||||
|
| |||||||
| Issuer | Shares/Par | Value ($) | ||||||
| BONDS – continued | ||||||||
| International Market Sovereign – 32.4% | ||||||||
| Commonwealth of Australia, 5.75%, 2021 | AUD | 8,443,000 | $ | 10,444,177 | ||||
| Federal Republic of Germany, 3.75%, 2015 | EUR | 7,276,000 | 10,327,150 | |||||
| Federal Republic of Germany, 3.25%, 2021 | EUR | 3,370,000 | 5,228,308 | |||||
| Federal Republic of Germany, 6.25%, 2030 | EUR | 4,184,000 | 8,919,953 | |||||
| Government of Canada, 4.5%, 2015 | CAD | 8,181,000 | 8,875,155 | |||||
| Government of Canada, 4.25%, 2018 | CAD | 13,100,000 | 15,092,459 | |||||
| Government of Canada, 3.25%, 2021 | CAD | 2,318,000 | 2,611,298 | |||||
| Government of Canada, 5.75%, 2033 | CAD | 1,478,000 | 2,307,029 | |||||
| Government of Japan, 1.7%, 2017 | JPY | 1,509,900,000 | 18,559,718 | |||||
| Government of Japan, 1.1%, 2020 | JPY | 2,627,700,000 | 31,706,286 | |||||
| Government of Japan, 2.1%, 2024 | JPY | 1,412,200,000 | 18,326,944 | |||||
| Government of Japan, 2.2%, 2027 | JPY | 553,450,000 | 7,149,308 | |||||
| Government of Japan, 2.4%, 2037 | JPY | 724,200,000 | 9,214,865 | |||||
| Government of New Zealand, 6%, 2021 | NZD | 5,323,000 | 5,229,021 | |||||
| Government of Norway, 3.75%, 2021 | NOK | 32,298,000 | 6,622,265 | |||||
| Kingdom of Belgium, 4.25%, 2021 | EUR | 3,219,000 | 5,074,487 | |||||
| Kingdom of Denmark, 3%, 2021 | DKK | 37,381,000 | 7,693,140 | |||||
| Kingdom of Spain, 4%, 2015 | EUR | 9,383,000 | 12,610,259 | |||||
| Kingdom of Spain, 5.5%, 2017 | EUR | 2,511,000 | 3,509,614 | |||||
| Kingdom of Spain, 4.6%, 2019 | EUR | 4,095,000 | 5,399,188 | |||||
| Kingdom of Sweden, 5%, 2020 | SEK | 59,740,000 | 11,638,586 | |||||
| Kingdom of the Netherlands, 3.75%, 2014 | EUR | 8,345,000 | 11,637,369 | |||||
| Kingdom of the Netherlands, 5.5%, 2028 | EUR | 1,387,000 | 2,663,597 | |||||
| Republic of Austria, 4.65%, 2018 | EUR | 3,314,000 | 5,227,746 | |||||
| Republic of Finland, 3.875%, 2017 | EUR | 1,557,000 | 2,382,054 | |||||
| Republic of Finland, 4%, 2025 | EUR | 1,331,000 | 2,190,915 | |||||
| Republic of France, 6%, 2025 | EUR | 3,219,000 | 5,989,280 | |||||
| Republic of France, 4.75%, 2035 | EUR | 5,220,000 | 9,026,088 | |||||
| Republic of Iceland, 4.875%, 2016 (n) | $ | 1,518,000 | 1,594,899 | |||||
| Republic of Ireland, 5.5%, 2017 | EUR | 4,406,000 | 6,352,184 | |||||
| Republic of Italy, 4.25%, 2015 | EUR | 8,082,000 | 11,126,560 | |||||
| Republic of Italy, 5.25%, 2017 | EUR | 13,734,000 | 19,713,334 | |||||
| Republic of Italy, 3.75%, 2021 | EUR | 5,720,000 | 7,423,277 | |||||
| United Kingdom Treasury, 8%, 2015 | GBP | 7,479,000 | 14,854,780 | |||||
| United Kingdom Treasury, 5%, 2018 | GBP | 6,369,000 | 12,479,802 | |||||
| United Kingdom Treasury, 8%, 2021 | GBP | 4,705,000 | 11,601,977 | |||||
| United Kingdom Treasury, 4.25%, 2027 | GBP | 2,843,000 | 5,727,121 | |||||
12
Table of Contents
MFS Global Tactical Allocation Portfolio
Portfolio of Investments – continued
| Issuer | Shares/Par | Value ($) | ||||||
| BONDS – continued | ||||||||
| International Market Sovereign – continued | ||||||||
| United Kingdom Treasury, 4.25%, 2036 | GBP | 4,570,000 | $ | 9,090,068 | ||||
|
| |||||||
| $ | 345,620,261 | |||||||
|
| |||||||
| Major Banks – 2.2% | ||||||||
| ABN AMRO Bank N.V., 4.25%, 2017 (n) | $ | 835,000 | $ | 910,747 | ||||
| Banco Santander U.S. Debt S.A.U., 3.781%, 2015 (n) | 1,300,000 | 1,307,397 | ||||||
| Bank of America Corp., 5.65%, 2018 | 1,535,000 | 1,785,885 | ||||||
| Bank of America Corp., 7.625%, 2019 | 2,225,000 | 2,847,045 | ||||||
| Goldman Sachs Group, Inc., 1.6%, 2015 | 492,000 | 495,457 | ||||||
| Goldman Sachs Group, Inc., 5.75%, 2022 | 1,056,000 | 1,248,416 | ||||||
| HSBC USA, Inc., 4.875%, 2020 | 1,870,000 | 2,083,999 | ||||||
| ING Bank N.V., FRN, 1.71%, 2014 (n) | 1,900,000 | 1,917,828 | ||||||
| JPMorgan Chase & Co., 4.25%, 2020 | 2,760,000 | 3,069,471 | ||||||
| Macquarie Bank Ltd., 5%, 2017 (n) | 1,502,000 | 1,642,737 | ||||||
| Morgan Stanley, 7.3%, 2019 | 1,772,000 | 2,153,370 | ||||||
| PNC Financial Services Group, Inc., FRN, 6.75%, 2049 | 860,000 | 976,736 | ||||||
| Wells Fargo & Co., 2.1%, 2017 | 3,160,000 | 3,267,036 | ||||||
|
| |||||||
| $ | 23,706,124 | |||||||
|
| |||||||
| Medical & Health Technology & Services – 0.3% | ||||||||
| Aristotle Holding, Inc., 2.65%, 2017 (n) | $ | 2,800,000 | $ | 2,910,289 | ||||
| Aristotle Holding, Inc., 3.9%, 2022 (n) | 285,000 | 307,302 | ||||||
|
| |||||||
| $ | 3,217,591 | |||||||
|
| |||||||
| Metals & Mining – 0.2% | ||||||||
| Southern Copper Corp., 6.75%, 2040 | $ | 407,000 | $ | 489,977 | ||||
| Vale Overseas Ltd., 4.625%, 2020 | 410,000 | 443,005 | ||||||
| Vale Overseas Ltd., 4.375%, 2022 | 998,000 | 1,065,372 | ||||||
|
| |||||||
| $ | 1,998,354 | |||||||
|
| |||||||
| Mortgage-Backed – 6.9% | ||||||||
| Fannie Mae, 4.561%, 2014 | $ | 65,559 | $ | 67,837 | ||||
| Fannie Mae, 4.606%, 2014 | 111,444 | 114,645 | ||||||
| Fannie Mae, 4.801%, 2014 | 368,845 | 377,575 | ||||||
| Fannie Mae, 4.564%, 2015 | 636,432 | 663,013 | ||||||
| Fannie Mae, 4.78%, 2015 | 89,736 | 96,566 | ||||||
| Fannie Mae, 4.815%, 2015 | 236,191 | 253,088 | ||||||
| Fannie Mae, 4.856%, 2015 | 71,423 | 76,795 | ||||||
| Fannie Mae, 4.997%, 2015 | 282,805 | 309,818 | ||||||
| Fannie Mae, 5.464%, 2015 | 138,043 | 151,622 | ||||||
| Fannie Mae, 5.5%, 2015-2037 | 1,802,764 | 1,954,258 | ||||||
| Fannie Mae, 5.09%, 2016 | 99,000 | 109,833 | ||||||
| Fannie Mae, 5.273%, 2016 | 542,322 | 604,818 | ||||||
| Fannie Mae, 5.424%, 2016 | 94,566 | 106,170 | ||||||
| Fannie Mae, 5.725%, 2016 | 677,948 | 768,141 | ||||||
| Fannie Mae, 3.308%, 2017 | 1,659,049 | 1,816,007 | ||||||
| Fannie Mae, 4.992%, 2017 | 37,990 | 40,471 | ||||||
| Fannie Mae, 5.05%, 2017 | 480,287 | 534,310 | ||||||
| Fannie Mae, 2.578%, 2018 | 1,800,000 | 1,927,357 | ||||||
| Fannie Mae, 3.84%, 2018 | 488,246 | 545,837 | ||||||
| Fannie Mae, 3.849%, 2018 | 1,769,894 | 1,989,179 | ||||||
| Fannie Mae, 5.341%, 2018 | 601,673 | 708,427 | ||||||
| Issuer | Shares/Par | Value ($) | ||||||
| BONDS – continued | ||||||||
| Mortgage-Backed – continued | ||||||||
| Fannie Mae, 4.45%, 2019 | $ | 431,640 | $ | 499,734 | ||||
| Fannie Mae, 4.57%, 2019 | 237,533 | 274,572 | ||||||
| Fannie Mae, 4.6%, 2019 | 613,159 | 714,367 | ||||||
| Fannie Mae, 6.16%, 2019 | 58,404 | 66,610 | ||||||
| Fannie Mae, 5%, 2020-2040 | 7,563,095 | 8,282,501 | ||||||
| Fannie Mae, 4.5%, 2023-2040 | 1,346,579 | 1,472,400 | ||||||
| Fannie Mae, 4%, 2025 | 309,172 | 338,695 | ||||||
| Fannie Mae, 4.5%, 2034 (f) | 7,084,306 | 7,690,472 | ||||||
| Fannie Mae, 6%, 2037-2038 | 2,150,625 | 2,350,810 | ||||||
| Fannie Mae, TBA, 3%, 2042 | 6,630,000 | 6,932,494 | ||||||
| Freddie Mac, 3.882%, 2017 | 1,357,000 | 1,525,007 | ||||||
| Freddie Mac, 2.323%, 2018 | 447,000 | 471,648 | ||||||
| Freddie Mac, 2.412%, 2018 | 2,482,000 | 2,625,812 | ||||||
| Freddie Mac, 2.699%, 2018 | 705,000 | 756,932 | ||||||
| Freddie Mac, 4.186%, 2019 | 650,000 | 749,873 | ||||||
| Freddie Mac, 5.085%, 2019 | 30,000 | 35,564 | ||||||
| Freddie Mac, 2.757%, 2020 | 315,373 | 335,915 | ||||||
| Freddie Mac, 3.32%, 2020 | 1,780,523 | 1,935,108 | ||||||
| Freddie Mac, 4%, 2025 | 730,546 | 772,339 | ||||||
| Freddie Mac, 5.5%, 2034-2037 | 292,215 | 318,506 | ||||||
| Freddie Mac, 5%, 2036-2038 | 2,258,946 | 2,432,799 | ||||||
| Freddie Mac, 4.5%, 2040 | 1,952,801 | 2,102,858 | ||||||
| Freddie Mac, 4.5%, 2040 (f) | 5,391,743 | 5,806,055 | ||||||
| Ginnie Mae, 5%, 2040-2041 | 4,433,235 | 4,893,678 | ||||||
| Ginnie Mae, TBA, 3%, 2042 | 6,400,000 | 6,804,001 | ||||||
|
| |||||||
| $ | 73,404,517 | |||||||
|
| |||||||
| Natural Gas – Pipeline – 0.2% | ||||||||
| Energy Transfer Partners LP, 4.65%, 2021 | $ | 1,664,000 | $ | 1,828,288 | ||||
|
| |||||||
| Oil Services – 0.2% | ||||||||
| Transocean, Inc., 6.5%, 2020 | $ | 1,320,000 | $ | 1,598,682 | ||||
|
| |||||||
| Other Banks & Diversified Financials – 0.6% | ||||||||
| BB&T Corp., 3.95%, 2016 | $ | 1,820,000 | $ | 1,984,621 | ||||
| Capital One Financial Corp., 8.8%, 2019 | 815,000 | 1,103,589 | ||||||
| Citigroup, Inc., 6.125%, 2018 | 733,000 | 878,435 | ||||||
| SunTrust Banks, Inc., 3.5%, 2017 | 550,000 | 590,658 | ||||||
| Svenska Handelsbanken AB, 2.875%, 2017 | 757,000 | 799,847 | ||||||
| Swedbank AB, 2.125%, 2017 (n) | 421,000 | 430,153 | ||||||
| U.S. Bancorp, 2.95%, 2022 | 402,000 | 406,111 | ||||||
|
| |||||||
| $ | 6,193,414 | |||||||
|
| |||||||
| Pharmaceuticals – 0.4% | ||||||||
| AbbVie, Inc., 1.2%, 2015 (n) | $ | 3,080,000 | $ | 3,100,577 | ||||
| Teva Pharmaceutical Finance B.V., 2.95%, 2022 | 1,134,000 | 1,147,107 | ||||||
|
| |||||||
| $ | 4,247,684 | |||||||
|
| |||||||
| Railroad & Shipping – 0.2% | ||||||||
| CSX Corp., 4.1%, 2044 | $ | 1,882,000 | $ | 1,857,799 | ||||
|
| |||||||
13
Table of Contents
MFS Global Tactical Allocation Portfolio
Portfolio of Investments – continued
| Issuer | Shares/Par | Value ($) | ||||||
| BONDS – continued | ||||||||
| Real Estate – 0.3% | ||||||||
| Simon Property Group, Inc., REIT, 5.65%, 2020 | $ | 2,330,000 | $ | 2,796,035 | ||||
| WEA Finance LLC/WT Finance Australia, 3.375%, 2022 (n) | 631,000 | 648,486 | ||||||
|
| |||||||
| $ | 3,444,521 | |||||||
|
| |||||||
| Retailers – 0.2% | ||||||||
| Home Depot, Inc., 5.95%, 2041 | $ | 1,469,000 | $ | 1,983,548 | ||||
|
| |||||||
| Telecommunications – Wireless – 0.3% | ||||||||
| American Tower Corp., REIT, 4.7%, 2022 | $ | 327,000 | $ | 361,798 | ||||
| Crown Castle Towers LLC, 6.113%, 2040 (n) | 2,030,000 | 2,445,100 | ||||||
|
| |||||||
| $ | 2,806,898 | |||||||
|
| |||||||
| Telephone Services – 0.0% | ||||||||
| Oi S.A., 5.75%, 2022 (n) | $ | 432,000 | $ | 450,360 | ||||
|
| |||||||
| Tobacco – 0.1% | ||||||||
| Altria Group, Inc., 9.7%, 2018 | $ | 492,000 | $ | 688,765 | ||||
|
| |||||||
| Transportation – Services – 0.2% | ||||||||
| ERAC USA Finance Co., 2.75%, 2017 (n) | $ | 376,000 | $ | 392,462 | ||||
| ERAC USA Finance Co., 7%, 2037 (n) | 1,224,000 | 1,554,271 | ||||||
|
| |||||||
| $ | 1,946,733 | |||||||
|
| |||||||
| U.S. Government Agencies and Equivalents – 0.2% | ||||||||
| Aid-Egypt, 4.45%, 2015 | $ | 649,000 | $ | 718,586 | ||||
| Small Business Administration, 5.09%, 2025 | 31,713 | 35,666 | ||||||
| Small Business Administration, 5.21%, 2026 | 1,132,113 | 1,272,004 | ||||||
| Small Business Administration, 5.31%, 2027 | 259,339 | 298,187 | ||||||
|
| |||||||
| $ | 2,324,443 | |||||||
|
| |||||||
| Issuer | Shares/Par | Value ($) | ||||||
| BONDS – continued | ||||||||
| U.S. Treasury Obligations – 3.7% | ||||||||
| U.S. Treasury Bonds, 6.875%, 2025 (f) | $ | 10,986,000 | $ | 16,920,154 | ||||
| U.S. Treasury Bonds, 5.25%, 2029 | 855,000 | 1,184,042 | ||||||
| U.S. Treasury Bonds, 4.5%, 2039 (f) | 5,503,000 | 7,292,333 | ||||||
| U.S. Treasury Notes, 4.75%, 2017 (f) | 6,127,000 | 7,274,379 | ||||||
| U.S. Treasury Notes, 3.5%, 2020 (f) | 6,328,000 | 7,346,909 | ||||||
|
| |||||||
| $ | 40,017,817 | |||||||
|
| |||||||
| Utilities – Electric Power – 0.5% | ||||||||
| Enel Finance International S.A., 6%, 2039 (n) | $ | 894,000 | $ | 865,702 | ||||
| Progress Energy, Inc., 7.05%, 2019 | 2,150,000 | 2,702,043 | ||||||
| TECO Energy, Inc., 6.572%, 2017 | 1,361,000 | 1,641,358 | ||||||
|
| |||||||
| $ | 5,209,103 | |||||||
|
| |||||||
| Total Bonds (Identified Cost, $599,365,312) | $ | 631,037,393 | ||||||
|
| |||||||
| Issuer/Expiration Date/ Strike Price | Number of Contracts | |||||||
| PUT OPTIONS PURCHASED – 0.0% | ||||||||
| iShares Russell 2000 Index – January 2013 @ $68 (Premiums Paid, $666,505) | 8,125 | $ | 32,500 | |||||
|
| |||||||
| Issuer | Shares/Par | |||||||
| MONEY MARKET FUNDS – 6.1% | ||||||||
| MFS Institutional Money Market Portfolio, 0.16%, at Cost and Net Asset Value (v) | 64,672,375 | $ | 64,672,375 | |||||
|
| |||||||
| Total Investments (Identified Cost, $978,539,300) | $ | 1,062,084,978 | ||||||
|
| |||||||
| OTHER ASSETS, LESS LIABILITIES – 0.5% | 5,269,077 | |||||||
|
| |||||||
| Net Assets – 100.0% | $ | 1,067,354,055 | ||||||
|
| |||||||
| (a) | Non-income producing security. |
| (f) | All or a portion of the security has been segregated as collateral for open futures contracts. |
| (n) | Securities exempt from registration under Rule 144A of the Securities Act of 1933. These securities may be sold in the ordinary course of business in transactions exempt from registration, normally to qualified institutional buyers. At period end, the aggregate value of these securities was $55,788,513, representing 5.2% of net assets. |
| (s) | Security or a portion of the security was pledged to cover collateral requirements for certain derivative transactions. |
| (v) | Underlying affiliated fund that is available only to investment companies managed by MFS. The rate quoted for the MFS Institutional Money Market Portfolio is the annualized seven-day yield of the fund at period end. |
14
Table of Contents
MFS Global Tactical Allocation Portfolio
Portfolio of Investments – continued
| (z) | Restricted securities are not registered under the Securities Act of 1933 and are subject to legal restrictions on resale. These securities generally may be resold in transactions exempt from registration or to the public if the securities are subsequently registered. Disposal of these securities may involve time-consuming negotiations and prompt sale at an acceptable price may be difficult. The fund holds the following restricted securities: |
| Restricted Securities | Acquisition Date | Cost | Value | |||||||
| Bayview Commercial Asset Trust, FRN, 1.725%, 2023 | 5/25/2006 | $170,247 | $164,329 | |||||||
| G-Force LLC, CDO, “A2”, 4.83%, 2036 | 1/20/2011 | 430,768 | 445,521 | |||||||
| PTT PLC, 3.375%, 2022 | 10/22/2012 | 2,578,925 | 2,594,596 | |||||||
| Rosneft, 3.149%, 2017 | 11/29/2012 | 348,000 | 353,220 | |||||||
| Rosneft, 4.199%, 2022 | 11/29/2012 | 578,000 | 588,115 | |||||||
| Total Restricted Securities | $4,145,781 | |||||||||
| % of Net assets | 0.4% | |||||||||
The following abbreviations are used in this report and are defined:
| ADR | American Depositary Receipt |
| CDO | Collateralized Debt Obligation |
| FRN | Floating Rate Note. Interest rate resets periodically and may not be the rate reported at period end. |
| IPS | International Preference Stock |
| PLC | Public Limited Company |
| REIT | Real Estate Investment Trust |
| TBA | To Be Announced |
Abbreviations indicate amounts shown in currencies other than the U.S. dollar. All amounts are stated in U.S. dollars unless otherwise indicated. A list of abbreviations is shown below:
| AUD | Australian Dollar |
| BRL | Brazilian Real |
| CAD | Canadian Dollar |
| CHF | Swiss Franc |
| CZK | Czech Koruna |
| DKK | Danish Krone |
| EUR | Euro |
| GBP | British Pound |
| HKD | Hong Kong Dollar |
| INR | Indian Rupee |
| JPY | Japanese Yen |
| KRW | Korean Won |
| MXN | Mexican Peso |
| MYR | Malaysian Ringgit |
| NOK | Norwegian Krone |
| NZD | New Zealand Dollar |
| PLN | Polish Zloty |
| SEK | Swedish Krona |
| SGD | Singapore Dollar |
| THB | Thailand Baht |
| TRY | Turkish Lira |
| ZAR | South African Rand |
15
Table of Contents
MFS Global Tactical Allocation Portfolio
Portfolio of Investments – continued
Derivative Contracts at 12/31/12
Forward Foreign Currency Exchange Contracts at 12/31/12
| Type | Currency | Counterparty | Contracts to Deliver/Receive | Settlement Date Range | In Exchange For | Contracts at Value | Net Unrealized Appreciation (Depreciation) | |||||||||||||||
| Asset Derivatives | ||||||||||||||||||||||
| BUY | AUD | Barclays Bank PLC | 128,000 | 1/11/13 | $ | 132,294 | $ | 132,843 | $ | 549 | ||||||||||||
| BUY | AUD | Deutsche Bank AG | 185,000 | 1/11/13 | 191,820 | 191,999 | 179 | |||||||||||||||
| BUY | AUD | Goldman Sachs International | 130,000 | 1/11/13 | 132,231 | 134,918 | 2,687 | |||||||||||||||
| SELL | AUD | Goldman Sachs International | 114,000 | 1/11/13 | 119,099 | 118,313 | 786 | |||||||||||||||
| BUY | CAD | Deutsche Bank AG | 7,000 | 1/11/13 | 7,018 | 7,036 | 18 | |||||||||||||||
| BUY | CAD | Goldman Sachs International | 442,000 | 1/11/13 | 444,165 | 444,276 | 111 | |||||||||||||||
| BUY | CAD | JPMorgan Chase Bank | 21,501,506 | 2/08/13 | 21,435,292 | 21,600,095 | 164,803 | |||||||||||||||
| SELL | CAD | JPMorgan Chase Bank | 60,862,021 | 2/08/13 | 61,210,000 | 61,141,087 | 68,913 | |||||||||||||||
| SELL | CAD | Merrill Lynch International Bank | 11,254,694 | 1/11/13 | 11,473,961 | 11,312,645 | 161,316 | |||||||||||||||
| BUY | CHF | Goldman Sachs International | 85,000 | 1/11/13 | 92,676 | 92,945 | 269 | |||||||||||||||
| BUY | CHF | UBS AG | 4,476,000 | 1/11/13 | 4,825,278 | 4,894,376 | 69,098 | |||||||||||||||
| BUY | CZK | Goldman Sachs International | 14,915,000 | 1/11/13 | 782,549 | 784,705 | 2,156 | |||||||||||||||
| BUY | DKK | Goldman Sachs International | 647,000 | 1/11/13 | 111,914 | 114,480 | 2,566 | |||||||||||||||
| BUY | EUR | Barclays Bank PLC | 2,928,013 | 1/11/13 | 3,810,393 | 3,865,096 | 54,703 | |||||||||||||||
| BUY | EUR | Citibank N.A. | 649,000 | 1/11/13 | 833,675 | 856,706 | 23,031 | |||||||||||||||
| BUY | EUR | Deutsche Bank AG | 10,353,044 | 1/11/13 | 13,340,177 | 13,666,440 | 326,263 | |||||||||||||||
| BUY | EUR | Goldman Sachs International | 18,013,769 | 2/08/13 | 23,164,000 | 23,784,622 | 620,622 | |||||||||||||||
| BUY | EUR | Merrill Lynch International Bank | 194,000 | 1/11/13 | 252,548 | 256,088 | 3,540 | |||||||||||||||
| BUY | EUR | UBS AG | 14,848,047 | 1/11/13-318/13 | 19,385,509 | 19,609,413 | 223,904 | |||||||||||||||
| SELL | EUR | Barclays Bank PLC | 543,000 | 1/11/13 | 720,849 | 716,782 | 4,067 | |||||||||||||||
| SELL | EUR | Citibank N.A. | 204,000 | 1/11/13 | 270,635 | 269,288 | 1,347 | |||||||||||||||
| BUY | GBP | Barclays Bank PLC | 355,000 | 1/11/13 | 570,440 | 576,667 | 6,227 | |||||||||||||||
| BUY | GBP | Goldman Sachs International | 12,000 | 1/11/13 | 19,264 | 19,493 | 229 | |||||||||||||||
| BUY | GBP | JPMorgan Chase Bank | 422,556 | 2/08/13 | 675,000 | 686,353 | 11,353 | |||||||||||||||
| BUY | GBP | UBS AG | 459,000 | 1/11/13 | 736,565 | 745,606 | 9,041 | |||||||||||||||
| BUY | INR | Deutsche Bank AG | 92,274,000 | 1/25/13 | 1,650,403 | 1,676,697 | 26,294 | |||||||||||||||
| SELL | JPY | Barclays Bank PLC | 132,186,000 | 1/11/13 | 1,538,025 | 1,525,831 | 12,194 | |||||||||||||||
| SELL | JPY | Citibank N.A. | 83,677,000 | 1/11/13 | 1,025,149 | 965,889 | 59,260 | |||||||||||||||
| SELL | JPY | Credit Suisse Group | 65,007,000 | 1/11/13 | 803,662 | 750,380 | 53,282 | |||||||||||||||
| SELL | JPY | Deutsche Bank AG | 35,837,000 | 1/11/13 | 457,876 | 413,669 | 44,207 | |||||||||||||||
| SELL | JPY | Goldman Sachs International | 7,455,558,328 | 1/11/13-2/08/13 | 93,267,484 | 86,078,291 | 7,189,193 | |||||||||||||||
| SELL | JPY | JPMorgan Chase Bank | 10,943,912,998 | 2/08/13 | 137,147,693 | 126,355,376 | 10,792,317 | |||||||||||||||
| SELL | JPY | UBS AG | 256,996,924 | 1/11/13 | 3,196,839 | 2,966,531 | 230,308 | |||||||||||||||
| BUY | KRW | JPMorgan Chase Bank | 6,932,661,000 | 2/07/13 | 6,389,550 | 6,461,266 | 71,716 | |||||||||||||||
| BUY | MXN | Citibank N.A. | 23,952,794 | 1/14/13 | 1,844,438 | 1,851,238 | 6,800 | |||||||||||||||
| BUY | MXN | UBS AG | 23,952,794 | 1/14/13 | 1,843,501 | 1,851,238 | 7,737 | |||||||||||||||
| BUY | MYR | JPMorgan Chase Bank | 9,036,756 | 2/05/13 | 2,947,889 | 2,948,353 | 464 | |||||||||||||||
| BUY | NOK | Goldman Sachs International | 264,942,104 | 1/11/13-2/08/13 | 46,443,748 | 47,608,394 | 1,164,646 | |||||||||||||||
| BUY | NOK | JPMorgan Chase Bank | 48,349,295 | 2/08/13 | 8,464,640 | 8,688,048 | 223,408 | |||||||||||||||
| BUY | NZD | Citibank N.A. | 56,000 | 1/11/13 | 45,842 | 46,257 | 415 | |||||||||||||||
| BUY | NZD | Deutsche Bank AG | 73,000 | 1/11/13 | 59,543 | 60,300 | 757 | |||||||||||||||
| BUY | NZD | Goldman Sachs International | 12,357,361 | 2/08/13 | 10,147,000 | 10,188,938 | 41,938 | |||||||||||||||
| BUY | NZD | JPMorgan Chase Bank | 21,990,953 | 2/08/13 | 18,109,000 | 18,132,064 | 23,064 | |||||||||||||||
| BUY | PLN | Citibank N.A. | 5,546,000 | 1/25/13 | 1,698,895 | 1,787,714 | 88,819 | |||||||||||||||
| BUY | SEK | Citibank N.A. | 3,343,000 | 1/11/13 | 506,616 | 513,962 | 7,346 | |||||||||||||||
| BUY | SEK | Goldman Sachs International | 301,818,498 | 1/11/13-2/08/13 | 45,355,036 | 46,372,145 | 1,017,109 | |||||||||||||||
| BUY | SEK | JPMorgan Chase Bank | 158,868,690 | 2/08/13 | 23,886,243 | 24,408,951 | 522,708 | |||||||||||||||
| BUY | SGD | Citibank N.A. | 1,308,000 | 1/11/13 | 1,062,503 | 1,070,751 | 8,248 | |||||||||||||||
| BUY | THB | HSBC BANKUSA | 44,082,000 | 3/18/13 | 1,434,028 | 1,435,896 | 1,868 | |||||||||||||||
| BUY | THB | JPMorgan Chase Bank | 3,284,000 | 1/29/13 | 106,624 | 107,227 | 603 | |||||||||||||||
| BUY | ZAR | Deutsche Bank AG | 2,232,000 | 1/11/13 | 250,998 | 262,994 | 11,996 | |||||||||||||||
| BUY | ZAR | JPMorgan Chase Bank | 13,131,135 | 1/11/13 | 1,470,518 | 1,547,229 | 76,711 | |||||||||||||||
|
| |||||||||||||||||||||
| $ | 23,441,186 | |||||||||||||||||||||
|
| |||||||||||||||||||||
16
Table of Contents
MFS Global Tactical Allocation Portfolio
Portfolio of Investments – continued
Forward Foreign Currency Exchange Contracts at 12/31/12 – continued
| Type | Currency | Counterparty | Contracts to Deliver/Receive | Settlement Date Range | In Exchange For | Contracts at Value | Net Unrealized Appreciation (Depreciation) | |||||||||||||||
| Liability Derivatives | ||||||||||||||||||||||
| BUY | AUD | Barclays Bank PLC | 358,560 | 1/11/13 | $ | 376,720 | $ | 372,126 | $ | (4,594 | ) | |||||||||||
| BUY | AUD | Citibank N.A. | 88,000 | 1/11/13 | 91,566 | 91,329 | (237 | ) | ||||||||||||||
| BUY | AUD | JPMorgan Chase Bank | 9,703,043 | 2/08/13 | 10,090,000 | 10,049,280 | (40,720 | ) | ||||||||||||||
| SELL | AUD | Goldman Sachs International | 1,692,852 | 2/08/13 | 1,742,775 | 1,753,259 | (10,484 | ) | ||||||||||||||
| SELL | AUD | JPMorgan Chase Bank | 26,932,129 | 2/08/13 | 27,850,735 | 27,893,158 | (42,423 | ) | ||||||||||||||
| SELL | AUD | Westpac Banking Corp. | 2,123,754 | 1/11/13 | 2,154,187 | 2,204,103 | (49,916 | ) | ||||||||||||||
| BUY | CAD | Merrill Lynch International Bank | 13,000 | 1/11/13 | 13,210 | 13,067 | (143 | ) | ||||||||||||||
| BUY | CAD | UBS AG | 65,000 | 1/11/13 | 66,230 | 65,335 | (895 | ) | ||||||||||||||
| SELL | CAD | Credit Suisse Group | 204,000 | 1/11/13 | 204,622 | 205,050 | (428 | ) | ||||||||||||||
| SELL | CAD | JPMorgan Chase Bank | 16,613,844 | 2/08/13 | 16,673,000 | 16,690,022 | (17,022 | ) | ||||||||||||||
| SELL | CHF | Goldman Sachs International | 3,059,887 | 1/11/13-2/08/13 | 3,296,871 | 3,347,661 | (50,790 | ) | ||||||||||||||
| SELL | CHF | JPMorgan Chase Bank | 944,657 | 2/08/13 | 1,017,133 | 1,033,535 | (16,402 | ) | ||||||||||||||
| SELL | DKK | Barclays Bank PLC | 1,414,000 | 1/11/13 | 243,762 | 250,192 | (6,430 | ) | ||||||||||||||
| SELL | DKK | Citibank N.A. | 29,287,621 | 1/11/13 | 5,136,917 | 5,182,136 | (45,219 | ) | ||||||||||||||
| SELL | DKK | Goldman Sachs International | 10,498,333 | 2/08/13 | 1,830,467 | 1,858,373 | (27,906 | ) | ||||||||||||||
| BUY | EUR | Citibank N.A. | 199,000 | 1/11/13 | 263,257 | 262,688 | (569 | ) | ||||||||||||||
| BUY | EUR | Merrill Lynch International Bank | 115,000 | 1/11/13 | 152,101 | 151,805 | (296 | ) | ||||||||||||||
| SELL | EUR | Barclays Bank PLC | 1,954,000 | 1/11/13 | 2,492,845 | 2,579,360 | (86,515 | ) | ||||||||||||||
| SELL | EUR | Credit Suisse Group | 529,000 | 1/11/13 | 686,193 | 698,302 | (12,109 | ) | ||||||||||||||
| SELL | EUR | Deutsche Bank AG | 186,000 | 1/11/13 | 238,447 | 245,528 | (7,081 | ) | ||||||||||||||
| SELL | EUR | Goldman Sachs International | 75,126,866 | 2/08/13 | 97,615,718 | 99,194,353 | (1,578,635 | ) | ||||||||||||||
| SELL | EUR | JPMorgan Chase Bank | 33,726,182 | 2/08/13 | 43,835,234 | 44,530,632 | (695,398 | ) | ||||||||||||||
| SELL | EUR | UBS AG | 4,952,818 | 1/11/13 | 6,420,091 | 6,537,922 | (117,831 | ) | ||||||||||||||
| SELL | GBP | Barclays Bank PLC | 4,690,170 | 1/11/13 | 7,501,153 | 7,618,783 | (117,630 | ) | ||||||||||||||
| SELL | GBP | Citibank N.A. | 61,000 | 1/11/13 | 98,110 | 99,089 | (979 | ) | ||||||||||||||
| SELL | GBP | Credit Suisse Group | 153,000 | 1/11/13 | 243,597 | 248,535 | (4,938 | ) | ||||||||||||||
| SELL | GBP | Deutsche Bank AG | 4,487,170 | 1/11/13 | 7,172,338 | 7,289,027 | (116,689 | ) | ||||||||||||||
| SELL | GBP | Goldman Sachs International | 121,000 | 1/11/13 | 192,225 | 196,554 | (4,329 | ) | ||||||||||||||
| SELL | GBP | JPMorgan Chase Bank | 7,155,887 | 2/08/13 | 11,515,102 | 11,623,224 | (108,122 | ) | ||||||||||||||
| SELL | INR | JPMorgan Chase Bank | 92,215,000 | 1/25/13 | 1,668,446 | 1,675,625 | (7,179 | ) | ||||||||||||||
| BUY | JPY | Barclays Bank PLC | 119,416,000 | 1/11/13 | 1,497,783 | 1,378,426 | (119,357 | ) | ||||||||||||||
| BUY | JPY | Citibank N.A. | 14,169,000 | 1/11/13 | 172,099 | 163,554 | (8,545 | ) | ||||||||||||||
| BUY | JPY | Credit Suisse Group | 1,770,976,488 | 1/11/13 | 22,654,580 | 20,442,488 | (2,212,092 | ) | ||||||||||||||
| BUY | JPY | Goldman Sachs International | 20,101,000 | 1/11/13 | 244,773 | 232,027 | (12,746 | ) | ||||||||||||||
| BUY | JPY | JPMorgan Chase Bank | 2,291,446,259 | 2/08/13 | 27,866,000 | 26,456,401 | (1,409,599 | ) | ||||||||||||||
| BUY | JPY | Merrill Lynch International Bank | 1,770,976,490 | 1/11/13 | 22,642,531 | 20,442,488 | (2,200,043 | ) | ||||||||||||||
| SELL | KRW | JPMorgan Chase Bank | 5,601,930,800 | 2/07/13 | 5,163,070 | 5,221,020 | (57,950 | ) | ||||||||||||||
| SELL | MXN | Citibank N.A. | 20,694,000 | 1/14/13 | 1,554,503 | 1,599,376 | (44,873 | ) | ||||||||||||||
| SELL | MYR | JPMorgan Chase Bank | 4,978,000 | 2/05/13 | 1,616,339 | 1,624,134 | (7,795 | ) | ||||||||||||||
| SELL | NOK | Deutsche Bank AG | 31,533,208 | 1/11/13 | 5,500,298 | 5,672,091 | (171,793 | ) | ||||||||||||||
| SELL | NOK | Merrill Lynch International Bank | 452,000 | 1/11/13 | 78,567 | 81,304 | (2,737 | ) | ||||||||||||||
| BUY | NZD | Barclays Bank PLC | 534,812 | 1/11/13 | 450,272 | 441,768 | (8,504 | ) | ||||||||||||||
| BUY | NZD | Goldman Sachs International | 70,000 | 1/11/13 | 59,021 | 57,822 | (1,199 | ) | ||||||||||||||
| SELL | NZD | Goldman Sachs International | 23,969,775 | 2/08/13 | 19,547,592 | 19,763,650 | (216,058 | ) | ||||||||||||||
| SELL | NZD | JPMorgan Chase Bank | 6,497,139 | 2/08/13 | 5,296,597 | 5,357,045 | (60,448 | ) | ||||||||||||||
| SELL | NZD | Westpac Banking Corp. | 5,967,325 | 1/11/13 | 4,859,252 | 4,929,156 | (69,904 | ) | ||||||||||||||
| SELL | SEK | Deutsche Bank AG | 53,287,026 | 1/11/13 | 7,975,428 | 8,192,496 | (217,068 | ) | ||||||||||||||
| SELL | SEK | Goldman Sachs International | 255,075,732 | 2/08/13 | 37,985,000 | 39,190,422 | (1,205,422 | ) | ||||||||||||||
| SELL | SEK | UBS AG | 662,000 | 1/11/13 | 98,642 | 101,778 | (3,136 | ) | ||||||||||||||
|
| |||||||||||||||||||||
| $ | (11,201,178 | ) | ||||||||||||||||||||
|
| |||||||||||||||||||||
17
Table of Contents
MFS Global Tactical Allocation Portfolio
Portfolio of Investments – continued
Futures Contracts Outstanding at 12/31/12
| Description | Currency | Contracts | Value | Expiration Date | Unrealized Appreciation (Depreciation) | |||||||||||||
| Asset Derivatives | ||||||||||||||||||
| Equity Futures | ||||||||||||||||||
| AEX Index (Long) | EUR | 174 | $15,979,812 | January - 2013 | $166,282 | |||||||||||||
| Bovespa Index (Long) | BRL | 932 | 27,897,184 | February - 2013 | 869,330 | |||||||||||||
| CAC 40 Index (Long) | EUR | 930 | 45,620,945 | January - 2013 | 965,878 | |||||||||||||
| DAX Index (Long) | EUR | 160 | 40,799,426 | March - 2013 | 725,034 | |||||||||||||
| FTSE 100 Index (Long) | GBP | 193 | 18,639,375 | March - 2013 | 183,537 | |||||||||||||
| FTSE Jse Top 40 Index (Long) | ZAR | 380 | 15,951,112 | March - 2013 | 438,947 | |||||||||||||
| FTSE MIB Index (Long) | EUR | 153 | 16,806,505 | March - 2013 | 755,188 | |||||||||||||
| Hang Seng China ENT Index (Long) | HKD | 134 | 10,097,498 | January - 2013 | 312,246 | |||||||||||||
| IBEX 35 Index (Long) | EUR | 156 | 17,022,099 | January - 2013 | 710,821 | |||||||||||||
| MSCI Taiwan Index (Long) | USD | 469 | 13,077,807 | January - 2013 | 318,301 | |||||||||||||
| S&P 500 E-Mini Index (Short) | USD | 433 | 30,745,165 | March - 2013 | 19,260 | |||||||||||||
| TURKDEK ISE 30 Index (Long) | TRY | 4,116 | 22,681,985 | February - 2013 | 357,071 | |||||||||||||
|
| |||||||||||||||||
| $5,821,895 | ||||||||||||||||||
|
| |||||||||||||||||
| Interest Rate Futures | ||||||||||||||||||
| Govt Of Canada Bond 10 yr (Short) | CAD | 408 | 55,594,973 | March - 2013 | $174,585 | |||||||||||||
| UK Long Gilt Bond (Short) | GBP | 399 | 77,078,654 | March - 2013 | 92,515 | |||||||||||||
|
| |||||||||||||||||
| 267,100 | ||||||||||||||||||
|
| |||||||||||||||||
| $6,088,995 | ||||||||||||||||||
|
| |||||||||||||||||
| Liability Derivatives | ||||||||||||||||||
| Equity Futures | ||||||||||||||||||
| AUST SPI 200 Index (Short) | AUD | 154 | 18,706,766 | March - 2013 | $(476,333 | ) | ||||||||||||
| Hang Seng Index (Short) | HKD | 52 | 7,721,492 | January - 2013 | (178,663 | ) | ||||||||||||
| KOSPI 200 Index (Short) | KRW | 55 | 6,917,992 | March - 2013 | (262,929 | ) | ||||||||||||
| MexBol Index (Short) | MXN | 16 | 545,072 | March - 2013 | (4,522 | ) | ||||||||||||
| NIKKEI 225 Index (Short) | JPY | 103 | 12,413,379 | March - 2013 | (1,102,009 | ) | ||||||||||||
| OMX 30 Index (Short) | SEK | 762 | 13,159,357 | January - 2013 | (267,274 | ) | ||||||||||||
| Russell 2000 Index (Short) | USD | 338 | 28,615,080 | March - 2013 | (707,441 | ) | ||||||||||||
| S&P TSE 60 Index (Short) | CAD | 358 | 51,207,640 | March - 2013 | (495,444 | ) | ||||||||||||
| S&P CNX Nifty Index (Short) | USD | 527 | 6,343,337 | January - 2013 | (46,751 | ) | ||||||||||||
|
| |||||||||||||||||
| $(3,541,366 | ) | |||||||||||||||||
|
| |||||||||||||||||
| Interest Rate Futures | ||||||||||||||||||
| Australian Treasury Bond 10 yr (Long) | AUD | 366 | 46,869,992 | March - 2013 | $(386,859 | ) | ||||||||||||
| German Euro Bund (Short) | EUR | 184 | 35,371,725 | March - 2013 | (150,629 | ) | ||||||||||||
| US Treasury Note 10 yr (Long) | USD | 439 | 58,290,969 | March - 2013 | (300,993 | ) | ||||||||||||
|
| |||||||||||||||||
| (838,481 | ) | |||||||||||||||||
|
| |||||||||||||||||
| $(4,379,847 | ) | |||||||||||||||||
|
| |||||||||||||||||
At December 31, 2012, the fund had cash collateral of $513,495 and other liquid securities with an aggregate value of $36,401,368 to cover any commitments for certain derivative contracts. Cash collateral includes “Restricted cash“ on the Statement of Assets and Liabilities.
See Notes to Financial Statements
18
Table of Contents
MFS Global Tactical Allocation Portfolio
FINANCIAL STATEMENTS | STATEMENT OF ASSETS AND LIABILITIES
This statement represents your fund’s balance sheet, which details the assets and liabilities comprising the total value of the fund.
At 12/31/12 | ||||||||
Assets | ||||||||
Investments – | ||||||||
Non-affiliated issuers, at value (identified cost, $913,866,925) | $997,412,603 | |||||||
Underlying affiliated funds, at cost and value | 64,672,375 | |||||||
Total investments, at value (identified cost, $978,539,300) | $1,062,084,978 | |||||||
Restricted cash | 513,495 | |||||||
Foreign currency, at value (identified cost, $61) | 61 | |||||||
Receivables for | ||||||||
Forward foreign currency exchange contracts | 23,441,186 | |||||||
Daily variation margin on open futures contracts | 409,331 | |||||||
Interest and dividends | 6,839,340 | |||||||
Other assets | 10,803 | |||||||
Total assets | $1,093,299,194 | |||||||
Liabilities | ||||||||
Payable to custodian | $470 | |||||||
Payables for | ||||||||
Forward foreign currency exchange contracts | 11,201,178 | |||||||
Investments purchased | 156,216 | |||||||
TBA purchase commitments | 13,782,345 | |||||||
Fund shares reacquired | 595,220 | |||||||
Payable to affiliates | ||||||||
Investment adviser | 82,665 | |||||||
Shareholder servicing costs | 769 | |||||||
Distribution and/or service fees | 27,123 | |||||||
Payable for independent Trustees’ compensation | 61 | |||||||
Accrued expenses and other liabilities | 99,092 | |||||||
Total liabilities | $25,945,139 | |||||||
Net assets | $1,067,354,055 | |||||||
Net assets consist of | ||||||||
Paid-in capital | $989,930,274 | |||||||
Unrealized appreciation (depreciation) on investments and translation of assets and liabilities in foreign currencies | 97,562,009 | |||||||
Accumulated net realized gain (loss) on investments and foreign currency | (21,567,571 | ) | ||||||
Undistributed net investment income | 1,429,343 | |||||||
Net assets | $1,067,354,055 | |||||||
Shares of beneficial interest outstanding | 70,685,008 |
| Net assets | Shares outstanding | Net asset value per share | ||||||||||
Initial Class | $73,188,677 | 4,791,498 | $15.27 | |||||||||
Service Class | 994,165,378 | 65,893,510 | 15.09 | |||||||||
See Notes to Financial Statements
19
Table of Contents
MFS Global Tactical Allocation Portfolio
FINANCIAL STATEMENTS | STATEMENT OF OPERATIONS
This statement describes how much your fund earned in investment income and accrued in expenses. It also describes any gains and/or losses generated by fund operations.
Year ended 12/31/12 | ||||||||
Net investment income | ||||||||
Income | ||||||||
Interest | $17,813,860 | |||||||
Dividends | 11,521,662 | |||||||
Dividends from underlying affiliated funds | 97,637 | |||||||
Foreign taxes withheld | (490,578 | ) | ||||||
Total investment income | $28,942,581 | |||||||
Expenses | ||||||||
Management fee | $7,267,715 | |||||||
Distribution and/or service fees | 2,420,944 | |||||||
Shareholder servicing costs | 94,967 | |||||||
Administrative services fee | 159,066 | |||||||
Independent Trustees’ compensation | 24,062 | |||||||
Custodian fee | 187,906 | |||||||
Shareholder communications | 18,661 | |||||||
Audit and tax fees | 70,399 | |||||||
Legal fees | 17,391 | |||||||
Miscellaneous | 66,169 | |||||||
Total expenses | $10,327,280 | |||||||
Fees paid indirectly | (373 | ) | ||||||
Reduction of expenses by investment adviser | (3,679 | ) | ||||||
Net expenses | $10,323,228 | |||||||
Net investment income | $18,619,353 | |||||||
Realized and unrealized gain (loss) on investments and foreign currency | ||||||||
Realized gain (loss) (identified cost basis) | ||||||||
Investments | $(5,561,579 | ) | ||||||
Futures contracts | (6,677,237 | ) | ||||||
Foreign currency | (2,855,931 | ) | ||||||
Net realized gain (loss) on investments and foreign currency | $(15,094,747 | ) | ||||||
Change in unrealized appreciation (depreciation) | ||||||||
Investments | $74,492,466 | |||||||
Futures contracts | 3,603,412 | |||||||
Translation of assets and liabilities in foreign currencies | 10,850,047 | |||||||
Net unrealized gain (loss) on investments and foreign currency translation | $88,945,925 | |||||||
Net realized and unrealized gain (loss) on investments and foreign currency | $73,851,178 | |||||||
Change in net assets from operations | $92,470,531 |
See Notes to Financial Statements
20
Table of Contents
MFS Global Tactical Allocation Portfolio
FINANCIAL STATEMENTS | STATEMENTS OF CHANGES IN NET ASSETS
These statements describe the increases and/or decreases in net assets resulting from operations, any distributions, and any shareholder transactions.
For years ended 12/31 | 2012 | 2011 | ||||||
Change in net assets | ||||||||
From operations | ||||||||
Net investment income | $18,619,353 | $14,754,429 | ||||||
Net realized gain (loss) on investments and foreign currency | (15,094,747 | ) | (11,393,785 | ) | ||||
Net unrealized gain (loss) on investments and foreign currency translation | 88,945,925 | (1,169,106 | ) | |||||
Change in net assets from operations | $92,470,531 | $2,191,538 | ||||||
Distributions declared to shareholders | ||||||||
From net investment income | $(18,750,120 | ) | $(7,688,343 | ) | ||||
From net realized gain on investments | — | (3,394,452 | ) | |||||
Total distributions declared to shareholders | $(18,750,120 | ) | $(11,082,795 | ) | ||||
Change in net assets from fund share transactions | $(6,063,932 | ) | $521,134,406 | |||||
Total change in net assets | $67,656,479 | $512,243,149 | ||||||
Net assets | ||||||||
At beginning of period | 999,697,576 | 487,454,427 | ||||||
At end of period (including undistributed net investment income of $1,429,343 and | $1,067,354,055 | $999,697,576 |
See Notes to Financial Statements
21
Table of Contents
MFS Global Tactical Allocation Portfolio
FINANCIAL STATEMENTS | FINANCIAL HIGHLIGHTS
The financial highlights table is intended to help you understand the fund’s financial performance for the past 5 years. Certain information reflects financial results for a single fund share. The total returns in the table represent the rate by which an investor would have earned (or lost) on an investment in the fund share class (assuming reinvestment of all distributions) held for the entire period.
| Initial Class | Years ended 12/31 | |||||||||||||||||||
| 2012 | 2011 | 2010 | 2009 | 2008 | ||||||||||||||||
Net asset value, beginning of period | $14.22 | $14.20 | $13.56 | $12.89 | $17.59 | |||||||||||||||
| Income (loss) from investment operations | ||||||||||||||||||||
Net investment income (d) | $0.30 | $0.32 | $0.24 | $0.27 | $0.37 | |||||||||||||||
Net realized and unrealized gain (loss) on investments | 1.04 | (0.10 | ) | 0.51 | 1.44 | (2.68 | ) | |||||||||||||
Total from investment operations | $1.34 | $0.22 | $0.75 | $1.71 | $(2.31 | ) | ||||||||||||||
| Less distributions declared to shareholders | ||||||||||||||||||||
From net investment income | $(0.29 | ) | $(0.14 | ) | $(0.11 | ) | $(1.04 | ) | $(0.86 | ) | ||||||||||
From net realized gain on investments | — | (0.06 | ) | — | — | (1.53 | ) | |||||||||||||
Total distributions declared to shareholders | $(0.29 | ) | $(0.20 | ) | $(0.11 | ) | $(1.04 | ) | $(2.39 | ) | ||||||||||
Net asset value, end of period (x) | $15.27 | $14.22 | $14.20 | $13.56 | $12.89 | |||||||||||||||
Total return (%) (k)(r)(s)(x) | 9.49 | 1.55 | 5.53 | 15.16 | (15.42 | ) | ||||||||||||||
| Ratios (%) (to average net assets) and Supplemental data: | ||||||||||||||||||||
Expenses before expense reductions (f) | 0.76 | 0.80 | 0.93 | 1.06 | 0.98 | |||||||||||||||
Expenses after expense reductions (f) | 0.76 | 0.80 | 0.90 | 0.90 | 0.90 | |||||||||||||||
Net investment income | 2.02 | 2.21 | 1.76 | 2.17 | 2.48 | |||||||||||||||
Portfolio turnover | 38 | 56 | 73 | 66 | 75 | |||||||||||||||
Net assets at end of period (000 omitted) | $73,189 | $77,255 | $87,137 | $92,880 | $93,254 | |||||||||||||||
See Notes to Financial Statements
22
Table of Contents
MFS Global Tactical Allocation Portfolio
Financial Highlights – continued
| Service Class | Years ended 12/31 | |||||||||||||||||||
| 2012 | 2011 | 2010 | 2009 | 2008 | ||||||||||||||||
Net asset value, beginning of period | $14.06 | $14.07 | $13.46 | $12.79 | $17.46 | |||||||||||||||
| Income (loss) from investment operations | ||||||||||||||||||||
Net investment income (d) | $0.26 | $0.27 | $0.20 | $0.24 | $0.34 | |||||||||||||||
Net realized and unrealized gain (loss) on investments | 1.03 | (0.09 | ) | 0.51 | 1.42 | (2.66 | ) | |||||||||||||
Total from investment operations | $1.29 | $0.18 | $0.71 | $1.66 | $(2.32 | ) | ||||||||||||||
| Less distributions declared to shareholders | ||||||||||||||||||||
From net investment income | $(0.26 | ) | $(0.13 | ) | $(0.10 | ) | $(0.99 | ) | $(0.82 | ) | ||||||||||
From net realized gain on investments | — | (0.06 | ) | — | — | (1.53 | ) | |||||||||||||
Total distributions declared to shareholders | $(0.26 | ) | $(0.19 | ) | $(0.10 | ) | $(0.99 | ) | $(2.35 | ) | ||||||||||
Net asset value, end of period (x) | $15.09 | $14.06 | $14.07 | $13.46 | $12.79 | |||||||||||||||
Total return (%) (k)(r)(s)(x) | 9.26 | 1.29 | 5.31 | 14.78 | (15.59 | ) | ||||||||||||||
| Ratios (%) (to average net assets) and Supplemental data: | ||||||||||||||||||||
Expenses before expense reductions (f) | 1.01 | 1.05 | 1.18 | 1.31 | 1.23 | |||||||||||||||
Expenses after expense reductions (f) | 1.01 | 1.05 | 1.15 | 1.15 | 1.15 | |||||||||||||||
Net investment income | 1.77 | 1.92 | 1.48 | 1.92 | 2.25 | |||||||||||||||
Portfolio turnover | 38 | 56 | 73 | 66 | 75 | |||||||||||||||
Net assets at end of period (000 omitted) | $994,165 | $922,442 | $400,318 | $11,228 | $12,451 | |||||||||||||||
| (d) | Per share data is based on average shares outstanding. |
| (f) | Ratios do not reflect reductions from fees paid indirectly, if applicable. |
| (k) | The total return does not reflect expenses that apply to separate accounts. Inclusion of these charges would reduce the total return figures for all periods shown. |
| (r) | Certain expenses have been reduced without which performance would have been lower. |
| (s) | From time to time the fund may receive proceeds from litigation settlements, without which performance would be lower. |
| (x) | The net asset values per share and total returns have been calculated on net assets which include adjustments made in accordance with U.S. generally accepted accounting principles required at period end for financial reporting purposes. |
See Notes to Financial Statements
23
Table of Contents
MFS Global Tactical Allocation Portfolio
| (1) | Business and Organization |
MFS Global Tactical Allocation Portfolio (the fund) is a series of MFS Variable Insurance Trust II (the trust). The trust is organized as a Massachusetts business trust and is registered under the Investment Company Act of 1940, as amended, as an open-end management investment company. The shareholders of each series of the trust are separate accounts of insurance companies, which offer variable annuity and/or life insurance products, and qualified retirement and pension plans.
| (2) | Significant Accounting Policies |
General – The preparation of financial statements in conformity with U.S. generally accepted accounting principles requires management to make estimates and assumptions that affect the reported amounts of assets and liabilities, and disclosure of contingent assets and liabilities at the date of the financial statements and the reported amounts of revenues and expenses during the reporting period. Actual results could differ from those estimates. In the preparation of these financial statements, management has evaluated subsequent events occurring after the date of the fund’s Statement of Assets and Liabilities through the date that the financial statements were issued. The fund invests in derivatives as part of its principal investment strategy. Derivatives can be highly volatile and involve risks in addition to the risks of the underlying indicators on which the derivative is based. The fund invests in foreign securities. Investments in foreign securities are vulnerable to the effects of changes in the relative values of the local currency and the U.S. dollar and to the effects of changes in each country’s legal, political, and economic environment.
In this reporting period the fund adopted Financial Accounting Standards Board (FASB) Accounting Standards Update 2011-04, Fair Value Measurement (Topic 820) – Amendments to Achieve Common Fair Value Measurement and Disclosure Requirements in U.S. GAAP and IFRSs (“ASU 2011-04”). ASU 2011-04 seeks to improve the comparability of fair value measurements as presented and disclosed in financial statements prepared in accordance with U.S. GAAP and International Financial Reporting Standards (IFRS) by providing common requirements for fair value measurement and disclosure.
In December 2011, the FASB issued Accounting Standards Update 2011-11, Balance Sheet (Topic 210) – Disclosures about Offsetting Assets and Liabilities (“ASU 2011-11”). Effective for annual reporting periods beginning on or after January 1, 2013 and interim periods within those annual periods, ASU 2011-11 is intended to enhance disclosure requirements on the offsetting of financial assets and liabilities. Although still evaluating the potential impacts of ASU 2011-11 to the fund, management expects that the impact of the fund’s adoption will be limited to additional financial statement disclosures.
Investment Valuations – Equity securities, including restricted equity securities, are generally valued at the last sale or official closing price as provided by a third-party pricing service on the market or exchange on which they are primarily traded. Equity securities, for which there were no sales reported that day, are generally valued at the last quoted daily bid quotation as provided by a third-party pricing service on the market or exchange on which such securities are primarily traded. Debt instruments and floating rate loans (other than short-term instruments), including restricted debt instruments, are generally valued at an evaluated or composite bid as provided by a third-party pricing service. Short-term instruments with a maturity at issuance of 60 days or less generally are valued at amortized cost, which approximates market value. Exchange-traded options are generally valued at the last sale or official closing price as provided by a third-party pricing service on the exchange on which such options are primarily traded. Exchange-traded options for which there were no sales reported that day are generally valued at the last daily bid quotation as provided by a third-party pricing service on the exchange on which such options are primarily traded. Options not traded on an exchange are generally valued at a broker/dealer bid quotation. Foreign currency options are generally valued at valuations provided by a third-party pricing service. Futures contracts are generally valued at last posted settlement price as provided by a third-party pricing service on the market on which they are primarily traded. Futures contracts for which there were no trades that day for a particular position are generally valued at the closing bid quotation as provided by a third-party pricing service on the market on which such futures contracts are primarily traded. Forward foreign currency exchange contracts are generally valued at the mean of bid and asked prices for the time period interpolated from rates provided by a third-party pricing service for proximate time periods. Open-end investment companies are generally valued at net asset value per share. Securities and other assets generally valued on the basis of information from a third-party pricing service may also be valued at a broker/dealer bid quotation. Values obtained from third-party pricing services can utilize both transaction data and market information such as yield, quality, coupon rate, maturity, type of issue, trading characteristics, and other market data. The values of foreign securities and other assets and liabilities expressed in foreign currencies are converted to U.S. dollars using the mean of bid and asked prices for rates provided by a third-party pricing service.
The Board of Trustees has delegated primary responsibility for determining or causing to be determined the value of the fund’s investments (including any fair valuation) to the adviser pursuant to valuation policies and procedures approved by the Board. If the adviser determines that reliable market quotations are not readily available, investments are valued at fair value as determined in good faith by the adviser in accordance with such procedures under the oversight of the Board of Trustees. Under the fund’s valuation policies and procedures, market quotations are not considered to be readily available for most types of debt instruments and floating rate loans and many types of derivatives. These investments are generally valued at fair value based on information from third-party pricing services. In addition, investments may be valued at fair value if the adviser determines that an investment’s value
24
Table of Contents
MFS Global Tactical Allocation Portfolio
Notes to Financial Statements – continued
has been materially affected by events occurring after the close of the exchange or market on which the investment is principally traded (such as foreign exchange or market) and prior to the determination of the fund’s net asset value, or after the halting of trading of a specific security where trading does not resume prior to the close of the exchange or market on which the security is principally traded. Events that occur on a frequent basis after foreign markets close (such as developments in foreign markets and significant movements in the U.S. markets) and prior to the determination of the fund’s net asset value may be deemed to have a material effect on the value of securities traded in foreign markets. Accordingly, the fund’s foreign equity securities may often be valued at fair value. The adviser generally relies on third-party pricing services or other information (such as the correlation with price movements of similar securities in the same or other markets; the type, cost and investment characteristics of the security; the business and financial condition of the issuer; and trading and other market data) to assist in determining whether to fair value and at what value to fair value an investment. The value of an investment for purposes of calculating the fund’s net asset value can differ depending on the source and method used to determine value. When fair valuation is used, the value of an investment used to determine the fund’s net asset value may differ from quoted or published prices for the same investment. There can be no assurance that the fund could obtain the fair value assigned to an investment if it were to sell the investment at the same time at which the fund determines its net asset value per share.
Various inputs are used in determining the value of the fund’s assets or liabilities. These inputs are categorized into three broad levels. In certain cases, the inputs used to measure fair value may fall into different levels of the fair value hierarchy. In such cases, an investment’s level within the fair value hierarchy is based on the lowest level of input that is significant to the fair value measurement. The fund’s assessment of the significance of a particular input to the fair value measurement in its entirety requires judgment, and considers factors specific to the investment. Level 1 includes unadjusted quoted prices in active markets for identical assets or liabilities. Level 2 includes other significant observable market-based inputs (including quoted prices for similar securities, interest rates, prepayment speed, and credit risk). Level 3 includes unobservable inputs, which may include the adviser’s own assumptions in determining the fair value of investments. Other financial instruments are derivative instruments not reflected in total investments, such as futures contracts and forward foreign currency exchange contracts. The following is a summary of the levels used as of December 31, 2012 in valuing the fund’s assets or liabilities:
| Investments at Value | Level 1 | Level 2 | Level 3 | Total | ||||||||||||
| Equity Securities: | ||||||||||||||||
United States | $177,949,781 | $— | $— | $177,949,781 | ||||||||||||
United Kingdom | — | 53,108,232 | — | 53,108,232 | ||||||||||||
Japan | 10,939,077 | 34,419,565 | — | 45,358,642 | ||||||||||||
Switzerland | 5,269,158 | 16,958,240 | — | 22,227,398 | ||||||||||||
Germany | — | 20,501,179 | — | 20,501,179 | ||||||||||||
France | — | 11,577,081 | — | 11,577,081 | ||||||||||||
Netherlands | — | 9,580,511 | — | 9,580,511 | ||||||||||||
Taiwan | 4,290,652 | — | — | 4,290,652 | ||||||||||||
Sweden | — | 3,934,973 | — | 3,934,973 | ||||||||||||
Other Countries | 3,868,899 | 13,977,862 | — | 17,846,761 | ||||||||||||
| U.S. Treasury Bonds & U.S. Government Agency & Equivalents | — | 42,342,260 | — | 42,342,260 | ||||||||||||
| Non-U.S. Sovereign Debt | — | 371,997,206 | — | 371,997,206 | ||||||||||||
| U.S. Corporate Bonds | — | 84,540,318 | — | 84,540,318 | ||||||||||||
| Residential Mortgage-Backed Securities | — | 73,404,517 | — | 73,404,517 | ||||||||||||
| Commercial Mortgage-Backed Securities | — | 25,237,562 | — | 25,237,562 | ||||||||||||
| Asset-Backed Securities (including CDOs) | — | 445,521 | — | 445,521 | ||||||||||||
| Foreign Bonds | — | 33,070,009 | — | 33,070,009 | ||||||||||||
Mutual Funds | 64,672,375 | — | — | 64,672,375 | ||||||||||||
| Total Investments | $266,989,942 | $795,095,036 | $— | $1,062,084,978 | ||||||||||||
| Other Financial Instruments | ||||||||||||||||
| Futures Contracts | $(890,198 | ) | $2,599,346 | $— | $1,709,148 | |||||||||||
| Forward Foreign Currency Exchange Contracts | — | 12,240,008 | — | 12,240,008 | ||||||||||||
For further information regarding security characteristics, see the Portfolio of Investments.
Of the level 2 investments presented above, equity investments amounting to $74,148,467 would have been considered level 1 investments at the beginning of the period. Of the level 1 investments presented above, equity investments amounting to $6,772,915 would have been considered level 2 investments at the beginning of the period. The primary reason for changes in the classifications between levels 1 and 2 occurs when foreign equity securities are fair valued using other observable market-based
25
Table of Contents
MFS Global Tactical Allocation Portfolio
Notes to Financial Statements – continued
inputs in place of the closing exchange price due to events occurring after the close of the exchange or market on which the investment is principally traded. The fund’s foreign equity securities may often be valued at fair value. The fund’s policy is to recognize transfers between the levels as of the end of the period.
Foreign Currency Translation – Purchases and sales of foreign investments, income, and expenses are converted into U.S. dollars based upon currency exchange rates prevailing on the respective dates of such transactions or on the reporting date for foreign denominated receivables and payables. Gains and losses attributable to foreign currency exchange rates on sales of securities are recorded for financial statement purposes as net realized gains and losses on investments. Gains and losses attributable to foreign exchange rate movements on receivables, payables, income and expenses are recorded for financial statement purposes as foreign currency transaction gains and losses. That portion of both realized and unrealized gains and losses on investments that results from fluctuations in foreign currency exchange rates is not separately disclosed.
Derivatives – The fund uses derivatives in an attempt to adjust exposure to markets, asset classes, and currencies based on the adviser’s assessment of the relative attractiveness of such markets, asset classes, and currencies. Derivatives are used to increase or decrease the fund’s exposure to markets, asset classes, or currencies resulting from the fund’s individual security selections, and to expose the fund to markets, asset classes, or currencies in which the fund’s individual security selection has resulted in little or no exposure. Derivatives are used for hedging or non-hedging purposes. While hedging can reduce or eliminate losses, it can also reduce or eliminate gains. When the fund uses derivatives as an investment to increase or decrease market exposure, or for hedging purposes, gains and losses from derivative instruments may be substantially greater than the derivative’s original cost.
The derivative instruments used by the fund were purchased options, futures contracts, and forward foreign currency exchange contracts. The fund’s period end derivatives, as presented in the Portfolio of Investments generally are indicative of the volume of its derivative activity during the period.
The following table presents, by major type of derivative contract, the fair value, on a gross basis, of the asset and liability components of derivatives held by the fund at December 31, 2012 as reported in the Statement of Assets and Liabilities:
| Fair Value (a) | ||||||||||
| Risk | Derivative Contracts | Asset Derivatives | Liability Derivatives | |||||||
| Interest Rate | Interest Rate Futures | $267,100 | $(838,481 | ) | ||||||
| Foreign Exchange | Forward Foreign Currency Exchange | 23,441,186 | (11,201,178 | ) | ||||||
| Equity | Equity Futures | 5,821,895 | (3,541,366 | ) | ||||||
| Equity | Purchased Equity Options | 32,500 | — | |||||||
| Total | $29,562,681 | $(15,581,025 | ) | |||||||
| (a) | The value of purchased options outstanding is included in total investments, at value, within the fund’s Statement of Assets and Liabilities. The value of futures contracts outstanding includes cumulative appreciation (depreciation) as reported in the fund’s Portfolio of Investments. Only the current day variation margin for futures contracts is separately reported within the fund’s Statement of Assets and Liabilities. |
The following table presents, by major type of derivative contract, the realized gain (loss) on derivatives held by the fund for the year ended December 31, 2012 as reported in the Statement of Operations:
| Risk | Futures Contracts | Foreign Currency | Investments (Purchased Options) | |||||||||
| Interest Rate | $(4,125,339 | ) | $— | $— | ||||||||
| Foreign Exchange | — | (2,467,824 | ) | — | ||||||||
| Equity | (2,551,898 | ) | — | (3,287,606 | ) | |||||||
| Total | $(6,677,237 | ) | $(2,467,824 | ) | $(3,287,606 | ) | ||||||
The following table presents, by major type of derivative contract, the change in unrealized appreciation (depreciation) on derivatives held by the fund for the year ended December 31, 2012 as reported in the Statement of Operations:
| Risk | Futures Contracts | Translation of Assets and Liabilities in Foreign Currencies | Investments (Purchased Options) | |||||||||
| Interest Rate | $2,597,999 | $— | $— | |||||||||
| Foreign Exchange | — | 10,618,289 | — | |||||||||
| Equity | 1,005,413 | — | 536,416 | |||||||||
| Total | $3,603,412 | $10,618,289 | $536,416 | |||||||||
26
Table of Contents
MFS Global Tactical Allocation Portfolio
Notes to Financial Statements – continued
Derivative counterparty credit risk is managed through formal evaluation of the creditworthiness of all potential counterparties. On certain over-the-counter derivatives, the fund attempts to reduce its exposure to counterparty credit risk whenever possible by entering into an International Swaps and Derivatives Association (ISDA) Master Agreement on a bilateral basis with each of the counterparties with whom it undertakes a significant volume of transactions. The ISDA Master Agreement gives each party to the agreement the right to terminate all transactions traded under such agreement if there is a certain deterioration in the credit quality of the other party. The ISDA Master Agreement gives the fund the right, upon an event of default by the applicable counterparty or a termination of the agreement, to close out all transactions traded under such agreement and to net amounts owed under each transaction to one net amount payable by one party to the other. This right to close out and net payments across all transactions traded under the ISDA Master Agreement could result in a reduction of the fund’s credit risk to such counterparty equal to any amounts payable by the fund under the applicable transactions, if any. However, absent an event of default by the counterparty or a termination of the agreement, the ISDA Master Agreement does not result in an offset of reported amounts of assets and liabilities in the Statement of Assets and Liabilities across transactions between the fund and the applicable counterparty.
Collateral requirements differ by type of derivative. Collateral or margin requirements are set by the broker or exchange clearing house for exchange traded derivatives (i.e., futures contracts and exchange-traded options) while collateral terms are contract specific for over-the-counter traded derivatives (i.e., forward foreign currency exchange contracts, swap agreements and over-the-counter options). For derivatives traded under an ISDA Master Agreement, the collateral requirements are netted across all transactions traded under such agreement and one amount is posted from one party to the other to collateralize such obligations. Cash collateral that has been pledged to cover obligations of the fund under derivative contracts, if any, will be reported separately in the Statement of Assets and Liabilities as “Restricted cash”. Securities collateral pledged for the same purpose, if any, is noted in the Portfolio of Investments.
Purchased Options – The fund purchased put options for a premium. Purchased put options entitle the holder to sell a specified number of shares or units of a particular security, currency or index at a specified price at a specified date or within a specified period of time. Purchasing put options may hedge against an anticipated decline in the value of portfolio securities or currency or decrease the fund’s exposure to an underlying instrument.
The premium paid is initially recorded as an investment in the Statement of Assets and Liabilities. That investment is subsequently marked-to-market daily with the difference between the premium paid and the market value of the purchased option being recorded as unrealized appreciation or depreciation. Premiums paid for purchased put options which have expired are treated as realized losses on investments in the Statement of Operations. Upon the exercise or closing of a purchased put option, the premium paid is offset against the proceeds on the sale of the underlying security or financial instrument in order to determine the realized gain or loss on investments.
Whether or not the option is exercised, the fund’s maximum risk of loss from purchasing an option is the amount of premium paid. All option contracts involve credit risk if the counterparty to the option contract fails to perform. For over-the-counter options, this risk is mitigated in cases where there is an ISDA Master Agreement between the fund and the counterparty providing for netting as described above and for posting of collateral by the counterparty to the fund to cover the fund’s exposure to the counterparty under such ISDA Master Agreement.
Futures Contracts – The fund entered into futures contracts which may be used to hedge against or obtain broad market exposure, interest rate exposure, currency exposure, or to manage duration. A futures contract represents a commitment for the future purchase or sale of an asset at a specified price on a specified date.
Upon entering into a futures contract, the fund is required to deposit with the broker, either in cash or securities, an initial margin in an amount equal to a certain percentage of the notional amount of the contract. Subsequent payments (variation margin) are made or received by the fund each day, depending on the daily fluctuations in the value of the contract, and are recorded for financial statement purposes as unrealized gain or loss by the fund until the contract is closed or expires at which point the gain or loss on futures contracts is realized.
The fund bears the risk of interest rates, exchange rates or securities prices moving unexpectedly, in which case, the fund may not achieve the anticipated benefits of the futures contracts and may realize a loss. While futures contracts may present less counterparty risk to the fund since the contracts are exchange traded and the exchange’s clearinghouse guarantees payments to the broker, there is still counterparty credit risk due to the insolvency of the broker. The fund’s maximum risk of loss due to counterparty credit risk is equal to the margin posted by the fund to the broker plus any gains or minus any losses on the outstanding futures contracts.
Forward Foreign Currency Exchange Contracts – The fund entered into forward foreign currency exchange contracts for the purchase or sale of a specific foreign currency at a fixed price on a future date. These contracts may be used to hedge the fund’s currency risk or for non-hedging purposes. For hedging purposes, the fund may enter into contracts to deliver or receive foreign currency that the fund will receive from or use in its normal investment activities. The fund may also use contracts to hedge against
27
Table of Contents
MFS Global Tactical Allocation Portfolio
Notes to Financial Statements – continued
declines in the value of foreign currency denominated securities due to unfavorable exchange rate movements. For non-hedging purposes, the fund may enter into contracts with the intent of changing the relative exposure of the fund’s portfolio of securities to different currencies to take advantage of anticipated exchange rate changes.
Forward foreign currency exchange contracts are adjusted by the daily exchange rate of the underlying currency and any unrealized gains or losses are recorded as a receivable or payable for forward foreign currency exchange contracts until the contract settlement date. On contract settlement date, any gain or loss on the contract is recorded as realized gains or losses on foreign currency.
Risks may arise upon entering into these contracts from unanticipated movements in the value of the contract and from the potential inability of counterparties to meet the terms of their contracts. Generally, the fund’s maximum risk due to counterparty credit risk is the unrealized gain on the contract due to the use of Continuous Linked Settlement, an industry accepted settlement system. This risk is mitigated in cases where there is an ISDA Master Agreement between the fund and the counterparty providing for netting as described above and for posting of collateral by the counterparty to the fund to cover the fund’s exposure to the counterparty under such ISDA Master Agreement.
Security Loans – State Street Bank and Trust Company (“State Street”), as lending agent, loans the securities of the fund to certain qualified institutions (the “Borrowers”) approved by the fund. The loans are collateralized by cash and/or U.S. Treasury and federal agency obligations in an amount typically at least equal to the market value of the securities loaned. The market value of the loaned securities is determined at the close of business of the fund and any additional required collateral is delivered to the fund on the next business day. State Street provides the fund with indemnification against Borrower default. The fund bears the risk of loss with respect to the investment of cash collateral. On loans collateralized by cash, the cash collateral is invested in a money market fund or short-term securities. A portion of the income generated upon investment of the collateral is remitted to the Borrowers, and the remainder is allocated between the fund and the lending agent. On loans collateralized by U.S. Treasury and/or federal agency obligations, a fee is received from the Borrower, and is allocated between the fund and the lending agent. Income from securities lending is included in “Interest” income in the Statement of Operations. The dividend and interest income earned on the securities loaned is accounted for in the same manner as other dividend and interest income. At December 31, 2012 there were no securities on loan or collateral outstanding.
Indemnifications – Under the fund’s organizational documents, its officers and Trustees may be indemnified against certain liabilities and expenses arising out of the performance of their duties to the fund. Additionally, in the normal course of business, the fund enters into agreements with service providers that may contain indemnification clauses. The fund’s maximum exposure under these agreements is unknown as this would involve future claims that may be made against the fund that have not yet occurred.
Investment Transactions and Income – Investment transactions are recorded on the trade date. Interest income is recorded on the accrual basis. All premium and discount is amortized or accreted for financial statement purposes in accordance with U.S. generally accepted accounting principles. Dividends received in cash are recorded on the ex-dividend date. Certain dividends from foreign securities will be recorded when the fund is informed of the dividend if such information is obtained subsequent to the ex-dividend date. Dividend and interest payments received in additional securities are recorded on the ex-dividend or ex-interest date in an amount equal to the value of the security on such date.
The fund may receive proceeds from litigation settlements. Any proceeds received from litigation involving portfolio holdings are reflected in the Statement of Operations in realized gain/loss if the security has been disposed of by the fund or in unrealized gain/loss if the security is still held by the fund. Any other proceeds from litigation not related to portfolio holdings are reflected as other income in the Statement of Operations.
The fund purchased or sold debt securities on a when-issued or delayed delivery basis, or in a “To Be Announced” (TBA) or “forward commitment” transaction with delivery or payment to occur at a later date beyond the normal settlement period. TBA securities resulting from these transactions are included in the Portfolio of Investments. At the time a fund enters into a commitment to purchase or sell a security, the transaction is recorded and the value of the security acquired is reflected in the fund’s net asset value. The price of such security and the date that the security will be delivered and paid for are fixed at the time the transaction is negotiated. The value of the security may vary with market fluctuations. TBA purchase commitments are held at carrying amount, which approximates fair value and are categorized as Level 2 within the fair value hierarchy disclosure. No interest accrues to the fund until payment takes place. At the time that a fund enters into this type of transaction, the fund is required to have sufficient cash and/or liquid securities to cover its commitments. Losses may arise due to changes in the value of the underlying securities or if the counterparty does not perform under the contract’s terms, or if the issuer does not issue the securities due to political, economic or other factors. Additionally, losses may arise due to declines in the value of the securities prior to settlement date.
Fees Paid Indirectly – The fund’s custody fee may be reduced according to an arrangement that measures the value of cash deposited with the custodian by the fund. This amount, for the year ended December 31, 2012, is shown as a reduction of total expenses in the Statement of Operations.
28
Table of Contents
MFS Global Tactical Allocation Portfolio
Notes to Financial Statements – continued
Tax Matters and Distributions – The fund intends to qualify as a regulated investment company, as defined under Subchapter M of the Internal Revenue Code, and to distribute all of its taxable income, including realized capital gains. As a result, no provision for federal income tax is required. The fund’s federal tax returns, when filed, will remain subject to examination by the Internal Revenue Service for a three year period. Foreign taxes have been accrued by the fund in the accompanying financial statements.
Distributions to shareholders are recorded on the ex-dividend date. Income and capital gain distributions are determined in accordance with income tax regulations, which may differ from U.S. generally accepted accounting principles. Certain capital accounts in the financial statements are periodically adjusted for permanent differences in order to reflect their tax character. These adjustments have no impact on net assets or net asset value per share. Temporary differences which arise from recognizing certain items of income, expense, gain or loss in different periods for financial statement and tax purposes will reverse at some time in the future. Distributions in excess of net investment income or net realized gains are temporary overdistributions for financial statement purposes resulting from differences in the recognition or classification of income or distributions for financial statement and tax purposes.
Book/tax differences primarily relate to amortization and accretion of debt securities, wash sale loss deferrals, straddle loss deferrals and derivative transactions.
The tax character of distributions declared to shareholders for the last two fiscal years is as follows:
| 12/31/12 | 12/31/11 | |||||||
| Ordinary income (including any short-term capital gains) | $18,750,120 | $10,385,167 | ||||||
| Long-term capital gains | — | 697,628 | ||||||
| Total distributions | $18,750,120 | $11,082,795 | ||||||
The federal tax cost and the tax basis components of distributable earnings were as follows:
| As of 12/31/2012 | ||||
| Cost of investments | $987,910,151 | |||
| Gross appreciation | 86,182,837 | |||
| Gross depreciation | (12,008,010 | ) | ||
| Net unrealized appreciation (depreciation) | $74,174,827 | |||
| Undistributed ordinary income | 25,034,765 | |||
| Capital loss carryforwards | (12,367,899 | ) | ||
| Other temporary differences | (9,417,912 | ) |
As of December 31, 2012, the fund had capital loss carryforwards available to offset future realized gains. Such losses are characterized as follows:
| Post-enactment losses: | ||||
| Short-Term losses | $(8,510,865 | ) | ||
| Long-Term losses | (3,857,034 | ) | ||
| Total | $(12,367,899 | ) |
Under the Regulated Investment Company Modernization Act of 2010 (the “Act”), the above net capital losses may be carried forward indefinitely, and their character is retained as short-term and/or long-term losses. Previously, net capital losses were carried forward for eight years and treated as short-term losses.
Multiple Classes of Shares of Beneficial Interest – The fund offers multiple classes of shares, which differ in their respective distribution and/or service fees. The fund’s income, realized and unrealized gain (loss), and common expenses are allocated to shareholders based on the daily net assets of each class. Dividends are declared separately for each class. Differences in per share dividend rates are generally due to differences in separate class expenses. The fund’s distributions declared to shareholders as reported in the Statements of Changes in Net Assets are presented by class as follows:
| From net investment income | From net realized gain on investments | |||||||||||||||
| Year ended 12/31/12 | Year ended 12/31/11 | Year ended 12/31/12 | Year ended 12/31/11 | |||||||||||||
| Initial Class | $1,419,916 | $791,643 | $— | $331,440 | ||||||||||||
| Service Class | 17,330,204 | 6,896,700 | — | 3,063,012 | ||||||||||||
| Total | $18,750,120 | $7,688,343 | $— | $3,394,452 | ||||||||||||
29
Table of Contents
MFS Global Tactical Allocation Portfolio
Notes to Financial Statements – continued
| (3) | Transactions with Affiliates |
Investment Adviser – The fund has an investment advisory agreement with MFS to provide overall investment management and related administrative services and facilities to the fund. The management fee is computed daily and paid monthly at the following annual rates:
| First $300 million of average daily net assets | 0.75% | |||
| Average daily net assets in excess of $300 million | 0.675% |
The management fee incurred for the year ended December 31, 2012 was equivalent to an annual effective rate of 0.70% of the fund’s average daily net assets.
The investment adviser has agreed in writing to pay a portion of the fund’s total annual operating expenses, exclusive of interest, taxes, extraordinary expenses, brokerage and transaction costs, and investment-related expenses, such that total annual operating expenses do not exceed 0.90% of average daily net assets for the Initial Class shares and 1.15% of average daily net assets for the Service Class shares. This written agreement will continue until modified by the fund’s Board of Trustees, but such agreement will continue at least until April 30, 2014. For the year ended December 31, 2012, the fund’s actual operating expenses did not exceed the limit and therefore, the investment adviser did not pay any portion of the fund’s expenses related to this agreement.
Distributor – MFS Fund Distributors, Inc. (MFD), a wholly-owned subsidiary of MFS, is the distributor of shares of the fund. The Trustees have adopted a distribution plan for the Service Class shares pursuant to Rule 12b-1 under the Investment Company Act of 1940.
The fund’s distribution plan provides that the fund will pay MFD distribution and/or service fees equal to 0.25% per annum of its average daily net assets attributable to Service Class shares as partial consideration for services performed and expenses incurred by MFD and financial intermediaries (including participating insurance companies that invest in the fund to fund variable annuity and variable life insurance contracts, sponsors of qualified retirement and pension plans that invest in the fund, and affiliates of these participating insurance companies and plan sponsors) in connection with the sale and distribution of the Service Class shares. MFD may subsequently pay all, or a portion, of the distribution and/or service fees to financial intermediaries.
Shareholder Servicing Agent – MFS Service Center, Inc. (MFSC), a wholly-owned subsidiary of MFS, receives a fee from the fund for its services as shareholder servicing agent. For the year ended December 31, 2012, the fee was $94,951, which equated to 0.0091% annually of the fund’s average daily net assets. MFSC also receives payment from the fund for out-of-pocket expenses paid by MFSC on behalf of the fund. For the year ended December 31, 2012, these costs amounted to $16.
Administrator – MFS provides certain financial, legal, shareholder communications, compliance, and other administrative services to the fund. Under an administrative services agreement, the fund partially reimburses MFS the costs incurred to provide these services. The fund is charged an annual fixed amount of $17,500 plus a fee based on average daily net assets. The administrative services fee incurred for the year ended December 31, 2012 was equivalent to an annual effective rate of 0.0152% of the fund’s average daily net assets.
Trustees’ and Officers’ Compensation – The fund pays compensation to independent Trustees in the form of a retainer, attendance fees, and additional compensation to Board and Committee chairpersons. The fund does not pay compensation directly to Trustees or officers of the fund who are also officers of the investment adviser, all of whom receive remuneration for their services to the fund from MFS. Certain officers and Trustees of the fund are officers or directors of MFS, MFD, and MFSC.
Other – This fund and certain other funds managed by MFS (the funds) have entered into services agreements (the Agreements) which provide for payment of fees by the funds to Tarantino LLC and Griffin Compliance LLC in return for the provision of services of an Independent Chief Compliance Officer (ICCO) and Assistant ICCO, respectively, for the funds. The ICCO and Assistant ICCO are officers of the funds and the sole members of Tarantino LLC and Griffin Compliance LLC, respectively. The funds can terminate the Agreements with Tarantino LLC and Griffin Compliance LLC at any time under the terms of the Agreements. For the year ended December 31, 2012, the aggregate fees paid by the fund to Tarantino LLC and Griffin Compliance LLC were $7,823 and are included in “Miscellaneous” expense in the Statement of Operations. MFS has agreed to reimburse the fund for a portion of the payments made by the fund in the amount of $3,679, which is shown as a reduction of total expenses in the Statement of Operations. Additionally, MFS has agreed to bear all expenses associated with office space, other administrative support, and supplies provided to the ICCO and Assistant ICCO.
The fund invests in the MFS Institutional Money Market Portfolio which is managed by MFS and seeks current income consistent with preservation of capital and liquidity. Income earned on this investment is included in “Dividends from underlying affiliated funds” in the Statement of Operations. This money market fund does not pay a management fee to MFS.
30
Table of Contents
MFS Global Tactical Allocation Portfolio
Notes to Financial Statements – continued
| (4) | Portfolio Securities |
Purchases and sales of investments, other than purchased option transactions, and short-term obligations, were as follows:
| Purchases | Sales | |||||||
| U.S. Government securities | $47,625,016 | $46,401,382 | ||||||
| Investments (non-U.S. Government securities) | $360,738,737 | $321,218,800 | ||||||
| (5) | Shares of Beneficial Interest |
The fund’s Declaration of Trust permits the Trustees to issue an unlimited number of full and fractional shares of beneficial interest. Transactions in fund shares were as follows:
| Year ended 12/31/12 | Year ended 12/31/11 | |||||||||||||||
| Shares | Amount | Shares | Amount | |||||||||||||
| Shares sold | ||||||||||||||||
Initial Class | 106,254 | $1,569,305 | 110,258 | $1,587,233 | ||||||||||||
Service Class | 2,551,791 | 36,807,230 | 36,627,946 | 523,715,652 | ||||||||||||
| 2,658,045 | $38,376,535 | 36,738,204 | $525,302,885 | |||||||||||||
| Shares issued to shareholders in reinvestment of distributions | ||||||||||||||||
Initial Class | 96,923 | $1,419,916 | 78,758 | $1,123,083 | ||||||||||||
Service Class | 1,196,838 | 17,330,204 | 705,862 | 9,959,712 | ||||||||||||
| 1,293,761 | $18,750,120 | 784,620 | $11,082,795 | |||||||||||||
| Shares reacquired | ||||||||||||||||
Initial Class | (844,895 | ) | $(12,446,323 | ) | (890,632 | ) | $(12,863,612 | ) | ||||||||
Service Class | (3,468,462 | ) | (50,744,264 | ) | (166,320 | ) | (2,387,662 | ) | ||||||||
| (4,313,357 | ) | $(63,190,587 | ) | (1,056,952 | ) | $(15,251,274 | ) | |||||||||
| Net change | ||||||||||||||||
Initial Class | (641,718 | ) | $(9,457,102 | ) | (701,616 | ) | $(10,153,296 | ) | ||||||||
Service Class | 280,167 | 3,393,170 | 37,167,488 | 531,287,702 | ||||||||||||
| (361,551 | ) | $(6,063,932 | ) | 36,465,872 | $521,134,406 | |||||||||||
| (6) | Line of Credit |
The fund and certain other funds managed by MFS participate in a $1.1 billion unsecured committed line of credit, subject to a $1 billion sublimit, provided by a syndication of banks under a credit agreement. Borrowings may be made for temporary financing needs. Interest is charged to each fund, based on its borrowings, generally at a rate equal to the higher of the Federal Reserve funds rate or one month LIBOR plus an agreed upon spread. A commitment fee, based on the average daily, unused portion of the committed line of credit, is allocated among the participating funds at the end of each calendar quarter. In addition, the fund and other funds managed by MFS have established unsecured uncommitted borrowing arrangements with certain banks for temporary financing needs. Interest is charged to each fund, based on its borrowings, at a rate equal to the Federal Reserve funds rate plus an agreed upon spread. For the year ended December 31, 2012, the fund’s commitment fee and interest expense were $6,706 and $0, respectively, and are included in “Miscellaneous” expense in the Statement of Operations.
| (7) | Transactions in Underlying Affiliated Funds – Affiliated Issuers |
An affiliated issuer may be considered one in which the fund owns 5% or more of the outstanding voting securities, or a company which is under common control. For the purposes of this report, the fund assumes the following to be an affiliated issuer:
| Underlying Affiliated Fund | Beginning Shares/Par Amount | Acquisitions Shares/Par Amount | Dispositions Shares/Par Amount | Ending Shares/Par Amount | ||||||||||||
| MFS Institutional Money Market Portfolio | 101,959,847 | 314,760,295 | (352,047,767 | ) | 64,672,375 | |||||||||||
| Underlying Affiliated Fund | Realized Gain (Loss) | Capital Gain Distributions | Dividend Income | Ending Value | ||||||||||||
| MFS Institutional Money Market Portfolio | $— | $— | $97,637 | $64,672,375 | ||||||||||||
31
Table of Contents
MFS Global Tactical Allocation Portfolio
REPORT OF INDEPENDENT REGISTERED PUBLIC ACCOUNTING FIRM
To the Board of Trustees of MFS Variable Insurance Trust II and the Shareholders of MFS Global Tactical Allocation Portfolio:
We have audited the accompanying statement of assets and liabilities, including the portfolio of investments, of MFS Global Tactical Allocation Portfolio (the “Fund”) (one of the series comprising MFS Variable Insurance Trust II) as of December 31, 2012, and the related statement of operations for the year then ended, the statements of changes in net assets for each of the two years in the period then ended, and the financial highlights for each of the five years in the period then ended. These financial statements and financial highlights are the responsibility of the Fund’s management. Our responsibility is to express an opinion on these financial statements and financial highlights based on our audits.
We conducted our audits in accordance with the standards of the Public Company Accounting Oversight Board (United States). Those standards require that we plan and perform the audit to obtain reasonable assurance about whether the financial statements and financial highlights are free of material misstatement. The Fund is not required to have, nor were we engaged to perform, an audit of its internal control over financial reporting. Our audits included consideration of internal control over financial reporting as a basis for designing audit procedures that are appropriate in the circumstances, but not for the purpose of expressing an opinion on the effectiveness of the Fund’s internal control over financial reporting. Accordingly, we express no such opinion. An audit also includes examining, on a test basis, evidence supporting the amounts and disclosures in the financial statements, assessing the accounting principles used and significant estimates made by management, as well as evaluating the overall financial statement presentation. Our procedures included confirmation of securities owned as of December 31, 2012, by correspondence with the custodian and brokers; where replies were not received from brokers, we performed other auditing procedures. We believe that our audits provide a reasonable basis for our opinion.
In our opinion, the financial statements and financial highlights referred to above present fairly, in all material respects, the financial position of MFS Global Tactical Allocation Portfolio as of December 31, 2012, the results of its operations for the year then ended, the changes in its net assets for each of the two years in the period then ended, and the financial highlights for each of the five years in the period then ended, in conformity with accounting principles generally accepted in the United States of America.
DELOITTE & TOUCHE LLP
Boston, Massachusetts
February 15, 2013
32
Table of Contents
MFS Global Tactical Allocation Portfolio
TRUSTEES AND OFFICERS – IDENTIFICATION AND BACKGROUND
The Trustees and officers of the Trust, as of February 1, 2013, are listed below, together with their principal occupations during the past five years. (Their titles may have varied during that period.) The address of each Trustee and officer is 111 Huntington Avenue, Boston, Massachusetts 02199-7618.
Name, Age | Position(s) with Fund | Trustee/Officer Since (h) | Principal Occupations During the Past Five Years | Other Directorships (j) | ||||
| INTERESTED TRUSTEES | ||||||||
Robert J. Manning (k) (age 49) | Trustee | February 2004 | Massachusetts Financial Services Company, Chairman, Chief Executive Officer and Director; President (until December 2009); Chief Investment Officer (until July 2010) | N/A | ||||
| INDEPENDENT TRUSTEES | ||||||||
David H. Gunning (age 70) | Trustee and Chair of Trustees | January 2004 | Private investor | Lincoln Electric Holdings, Inc. (welding equipment manufacturer), Director; Development Alternatives, Inc. (consulting), Director/Non-Executive Chairman; Portman Limited (mining), Director (until 2008) | ||||
Robert E. Butler (age 71) | Trustee | January 2006 | Consultant – investment company industry regulatory and compliance matters | N/A | ||||
Maureen R. Goldfarb (age 57) | Trustee | January 2009 | Private investor | N/A | ||||
William R. Gutow (age 71) | Trustee | December 1993 | Private investor and real estate consultant; Capitol Entertainment Management Company (video franchise), Vice Chairman | Atlantic Coast Tan (tanning salons), Vice Chairman (until 2007); Texas Donuts (donut franchise), Vice Chairman (until 2010) | ||||
Michael Hegarty (age 68) | Trustee | December 2004 | Private investor; Rouse Properties Inc. (real estate), Director | N/A | ||||
John P. Kavanaugh (age 58) | Trustee | January 2009 | Private investor | N/A | ||||
J. Dale Sherratt (age 74) | Trustee | June 1989 | Insight Resources, Inc. (acquisition planning specialists), President; Wellfleet Investments (investor in health care companies), Managing General Partner | N/A | ||||
| Laurie J. Thomsen (age 55) | Trustee | March 2005 | Private investor; New Profit, Inc. (venture philanthropy), Executive Partner (until 2010) | The Travelers Companies (insurance), Director | ||||
Robert W. Uek (age 71) | Trustee | January 2006 | Consultant to investment company industry | N/A | ||||
| OFFICERS | ||||||||
John M. Corcoran (k) (age 47) | President | October 2008 | Massachusetts Financial Services Company, Senior Vice President (since October 2008); State Street Bank and Trust (financial services provider), Senior Vice President, (until September 2008) | N/A | ||||
| Christopher R. Bohane (k) (age 39) | Assistant Secretary and Assistant Clerk | July 2005 | Massachusetts Financial Services Company, Vice President and Senior Counsel | N/A | ||||
Kino Clark (k) (age 44) | Assistant Treasurer | January 2012 | Massachusetts Financial Services Company, Vice President | N/A | ||||
Thomas H. Connors (k) (age 53) | Assistant Secretary and Assistant Clerk | September 2012 | Massachusetts Financial Services Company, Vice President and Senior Counsel; Deutsche Investment Management Americas Inc. (financial service provider), Director and Senior Counsel (until 2012) | N/A | ||||
Ethan D. Corey (k) (age 49) | Assistant Secretary and Assistant Clerk | July 2005 | Massachusetts Financial Services Company, Senior Vice President and Associate General Counsel | N/A | ||||
33
Table of Contents
MFS Global Tactical Allocation Portfolio
Trustees and Officers – continued
Name, Age | Position(s) with Fund | Trustee/Officer Since (h) | Principal Occupations During the Past Five Years | Other Directorships (j) | ||||
David L. DiLorenzo (k) (age 44) | Treasurer | July 2005 | Massachusetts Financial Services Company, Senior Vice President | N/A | ||||
Robyn L. Griffin (age 37) | Assistant Independent Chief Compliance Officer | August 2008 | Griffin Compliance LLC (provider of compliance services), Principal (since August 2008); State Street Corporation (financial services provider), Mutual Fund Administration Assistant Vice President (October 2006 – July 2008) | N/A | ||||
Brian E. Langenfeld (k) (age 39) | Assistant Secretary and Assistant Clerk | June 2006 | Massachusetts Financial Services Company, Vice President and Senior Counsel | N/A | ||||
Susan S. Newton (k) (age 62) | Assistant Secretary and Assistant Clerk | May 2005 | Massachusetts Financial Services Company, Senior Vice President and Associate General Counsel | N/A | ||||
Susan A. Pereira (k) (age 42) | Assistant Secretary and Assistant Clerk | July 2005 | Massachusetts Financial Services Company, Vice President and Senior Counsel | N/A | ||||
Kasey L. Phillips (k) (age 42) | Assistant Treasurer | September 2012 | Massachusetts Financial Services Company, Vice President; Wells Fargo Funds Management, LLC, Senior Vice President, Fund Treasurer (until 2012) | N/A | ||||
Mark N. Polebaum (k) (age 60) | Secretary and Clerk | January 2006 | Massachusetts Financial Services Company, Executive Vice President, General Counsel and Secretary | N/A | ||||
Frank L. Tarantino (age 68) | Independent Chief Compliance Officer | June 2004 | Tarantino LLC (provider of compliance services), Principal | N/A | ||||
Richard S. Weitzel (k) (age 42) | Assistant Secretary and Assistant Clerk | October 2007 | Massachusetts Financial Services Company, Senior Vice President and Associate General Counsel | N/A | ||||
James O. Yost (k) (age 52) | Deputy Treasurer | September 1990 | Massachusetts Financial Services Company, Senior Vice President | N/A | ||||
| (h) | Date first appointed to serve as Trustee/officer of an MFS fund. Each Trustee has served continuously since appointment unless indicated otherwise. For the period from December 15, 2004 until February 22, 2005, Mr. Manning served as Advisory Trustee. For the period October 2008, until January 2012, Mr. Corcoran served as Treasurer of the Funds. Prior to January 2012, Messrs. DiLorenzo and Yost served as Assistant Treasurers of the Funds. |
| (j) | Directorships or trusteeships of companies required to report to the Securities and Exchange Commission (i.e., “public companies”). |
| (k) | “Interested person” of the Trust within the meaning of the Investment Company Act of 1940 (referred to as the 1940 Act), which is the principal federal law governing investment companies like the fund, as a result of position with MFS. The address of MFS is 111 Huntington Avenue, Boston, Massachusetts 02199-7618. |
Each Trustee has been elected by shareholders and each Trustee and officer holds office until his or her successor is chosen and qualified or until his or her earlier death, resignation, retirement or removal. The Trust does not hold annual meetings for the purpose of electing Trustees, and Trustees are not elected for fixed terms. Messrs. Butler, Kavanaugh, Uek and Ms. Thomsen are members of the Trust’s Audit Committee.
Each of the Fund’s Trustees and officers holds comparable positions with certain other funds of which MFS or a subsidiary is the investment adviser or distributor, and, in the case of the officers, with certain affiliates of MFS. As of January 1, 2013, the Trustees served as board members of 143 funds within the MFS Family of Funds.
34
Table of Contents
MFS Global Tactical Allocation Portfolio
Trustees and Officers – continued
The Statement of Additional Information for the Fund includes further information about the Trustees and is available without charge upon request by calling 1-800-225-2606.
Investment Adviser Massachusetts Financial Services Company 111 Huntington Avenue Boston, MA 02199-7618 | Custodian State Street Bank and Trust 1 Lincoln Street Boston, MA 02111-2900 | |
Distributor MFS Fund Distributors, Inc. 111 Huntington Avenue Boston, MA 02199-7618 | Independent Registered Public Accounting Firm Deloitte & Touche LLP 200 Berkeley Street Boston, MA 02116 | |
Portfolio Managers Nevin Chitkara Steven Gorham Richard Hawkins Benjamin Nastou Natalie Shapiro Benjamin Stone Erik Weisman Barnaby Wiener |
35
Table of Contents
MFS Global Tactical Allocation Portfolio
BOARD REVIEW OF INVESTMENT ADVISORY AGREEMENT
A discussion regarding the Board’s most recent approval of the fund’s Investment Advisory Agreement with MFS is available by clicking on the fund’s name under “Variable Insurance Portfolios – VIT II” in the “Products” section of the MFS Web site (mfs.com).
PROXY VOTING POLICIES AND INFORMATION
A general description of the MFS funds’ proxy voting policies and procedures is available without charge, upon request, by calling 1-800-225-2606, by visiting the Proxy Voting section of mfs.com or by visiting the SEC’s Web site at http://www.sec.gov.
Information regarding how the fund voted proxies relating to portfolio securities during the most recent twelve-month period ended June 30 is available without charge by visiting the Proxy Voting section of mfs.com or by visiting the SEC’s Web site at http://www.sec.gov.
QUARTERLY PORTFOLIO DISCLOSURE
The fund will file a complete schedule of portfolio holdings with the Securities and Exchange Commission (the Commission) for the first and third quarters of each fiscal year on Form N-Q. The fund’s Form N-Q is available on the EDGAR database on the Commission’s Internet Web site at http://www.sec.gov, and may be reviewed and copied at the:
Public Reference Room
Securities and Exchange Commission
100 F Street, NE, Room 1580
Washington, D.C. 20549
Information on the operation of the Public Reference Room may be obtained by calling the Commission at 1-800-SEC-0330. Copies of the fund’s Form N-Q also may be obtained, upon payment of a duplicating fee, by electronic request at the following e-mail address: publicinfo@sec.gov or by writing the Public Reference Section at the above address.
From time to time, MFS may post important information about the fund or the MFS funds on the MFS web site (mfs.com). This information is available by visiting the “News & Commentary” section of mfs.com or by clicking on the fund’s name under “Variable Insurance Portfolios – VIT II” in the “Products” section of mfs.com.
FEDERAL TAX INFORMATION (unaudited)
The following information is provided pursuant to provisions of the Internal Revenue Code.
For corporate shareholders, 21.31% of the ordinary income dividends paid during the fiscal year qualify for the corporate dividends received deduction.
36
Table of Contents
rev. 3/11

| Why? | Financial companies choose how they share your personal information. Federal law gives consumers the right to limit some but not all sharing. Federal law also requires us to tell you how we collect, share, and protect your personal information. Please read this notice carefully to understand what we do. |
| What? | The types of personal information we collect and share depend on the product or service you have with us. This information can include:
• Social Security number and account balances • Account transactions and transaction history • Checking account information and wire transfer instructions
When you are no longer our customer, we continue to share your information as described in this notice. |
| How? | All financial companies need to share customers’ personal information to run their everyday business. In the section below, we list the reasons financial companies can share their customers’ personal information; the reasons MFS chooses to share; and whether you can limit this sharing. |
| Reasons we can share your personal information | Does MFS share? | Can you limit this sharing? | ||
For our everyday business purposes – such as to process your transactions, maintain your account(s), respond to court orders and legal investigations, or report to credit bureaus | Yes | No | ||
For our marketing purposes – to offer our products and services to you | No | We don’t share | ||
| For joint marketing with other financial companies | No | We don’t share | ||
For our affiliates’ everyday business purposes – information about your transactions and experiences | No | We don’t share | ||
For our affiliates’ everyday business purposes – information about your creditworthiness | No | We don’t share | ||
| For nonaffiliates to market to you | No | We don’t share |
| Questions? | Call 800-225-2606 or go to mfs.com. |
37
Table of Contents
| Page 2 |
| Who we are | ||
| Who is providing this notice? | MFS Funds, MFS Investment Management, MFS Institutional Advisors, Inc., MFS Fund Distributors, Inc., MFS Heritage Trust Company, and MFS Service Center, Inc. | |
| What we do | ||
| How does MFS protect my personal information? | To protect your personal information from unauthorized access and use, we use security measures that comply with federal law. These measures include procedural, electronic, and physical safeguards for the protection of the personal information we collect about you. | |
| How does MFS collect my personal information? | We collect your personal information, for example, when you
• open an account or provide account information • direct us to buy securities or direct us to sell your securities • make a wire transfer
We also collect your personal information from others, such as credit bureaus, affiliates and other companies. | |
| Why can’t I limit all sharing? | Federal law gives you the right to limit only
• sharing for affiliates’ everyday business purposes – information about your creditworthiness • affiliates from using your information to market to you • sharing for nonaffiliates to market to you
State laws and individual companies may give you additional rights to limit sharing. | |
| Definitions | ||
| Affiliates | Companies related by common ownership or control. They can be financial and nonfinancial companies.
•MFS does not share personal information with affiliates, except for everyday business purposes as described on page one of this notice. | |
| Nonaffiliates | Companies not related by common ownership or control. They can be financial and nonfinancial companies.
•MFS does not share with nonaffiliates so they can market to you. | |
| Joint Marketing | A formal agreement between nonaffiliated financial companies that together market financial products or services to you.
•MFS doesn’t jointly market. | |
| Other important information | ||
| If you own an MFS product or receive an MFS service in the name of a third party such as a bank or broker-dealer, their privacy policy may apply to you instead of ours. | ||
38
Table of Contents
Table of Contents
ANNUAL REPORT
December 31, 2012

MFS® HIGH YIELD PORTFOLIO
MFS® Variable Insurance Trust II

HYS-ANN
Table of Contents
MFS® HIGH YIELD PORTFOLIO
The report is prepared for the general information of contract owners. It is authorized for distribution to prospective investors only when preceded or accompanied by a current prospectus.
NOT FDIC INSURED Ÿ MAY LOSE VALUE Ÿ NO BANK OR CREDIT UNION GUARANTEE Ÿ NOT A DEPOSIT Ÿ NOT INSURED BY ANY FEDERAL GOVERNMENT AGENCY OR NCUA/NCUSIF
Table of Contents
MFS High Yield Portfolio
LETTER FROM THE CHAIRMAN AND CEO

Dear Contract Owners:
The global market outlook for 2013 is one of cautious optimism. While we are seeing some positive economic trends in the United States, Europe and China, the overall environment remains challenging. In the United States, the recent fiscal cliff agreement was received positively by investors, even though it mostly addressed pressing taxation issues and did not resolve additional concerns, including the need for spending cuts and a large-scale reduction of the federal debt. These issues will be front and center again in the spring. Despite the ongoing uncertainty, economic tailwinds are gathering strength as the U.S. housing and job markets are improving and consumer confidence is rising.
Overseas, the debt crisis continues to weigh heavily on eurozone markets, with even Germany — long an economic stalwart — experiencing some contraction. These ongoing challenges could be a drag on global market performance this year. In Asia, manufacturing activity has accelerated in emerging markets such as China and India, and we are seeing signs of stabilized loan growth in China, a leading indicator of that country’s economic health. In contrast, Japan’s economy is contracting sharply under deflationary pressures. Nevertheless, Japanese markets have responded favorably to early actions by the new government, which appears determined to act aggressively, along with the Bank of Japan, to stimulate growth.
As always, managing risk in the face of uncertainty remains a top priority for investors. At MFS®, our uniquely collaborative investment process revolves around global research and our disciplined risk management approach. Our global team of investment professionals shares ideas and evaluates opportunities across continents, investment disciplines and asset classes — all with a goal of building better insights, and ultimately better results, for our clients.
We remain mindful of the many economic challenges investors face today, and believe it is more important than ever to maintain a long-term view, employ time-tested principles, such as asset allocation and diversification, and work closely with investment advisors to identify and pursue the most suitable opportunities.
Respectfully,
Robert J. Manning
Chairman and Chief Executive Officer
MFS Investment Management®
February 15, 2013
The opinions expressed in this letter are subject to change, may not be relied upon for investment advice, and no forecasts can be guaranteed.
1
Table of Contents
MFS High Yield Portfolio
Portfolio structure (i)
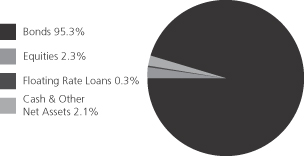
| Top five industries (i) | ||||
| Energy – Independent | 8.4% | |||
| Broadcasting | 5.6% | |||
| Medical & Health Technology & Services | 5.5% | |||
| Utilities – Electric Power | 4.8% | |||
| Wireless Communications | 4.2% |
| Composition including fixed income credit quality (a)(i) | ||||
| A | 0.2% | |||
| BBB | 5.6% | |||
| BB | 31.3% | |||
| B | 45.0% | |||
| CCC | 13.1% | |||
| CC | 0.1% | |||
| C (o) | 0.0% | |||
| D | 0.1% | |||
| Not Rated | 0.2% | |||
| Non-Fixed Income | 2.3% | |||
| Cash & Other | 2.1% | |||
| Portfolio facts (i) | ||||
| Average Duration (d) | 3.8 | |||
| Average Effective Maturity (m) | 7.1 yrs. | |||
| (a) | For all securities other than those specifically described below, ratings are assigned to underlying securities utilizing ratings from Moody’s, Fitch, and Standard & Poor’s rating agencies and applying the following hierarchy: If all three agencies provide a rating, the middle rating (after dropping the highest and lowest ratings) is assigned; if two of the three agencies rate a security, the lower of the two is assigned. Ratings are shown in the S&P and Fitch scale (e.g., AAA). Securities rated BBB or higher are considered investment grade. All ratings are subject to change. Not Rated includes fixed income securities, including fixed income futures contracts, which have not been rated by any rating agency. Non-Fixed Income includes equity securities (including convertible bonds and equity derivatives) and commodities. Cash & Other includes cash, other assets less liabilities, offsets to derivative positions, and short-term securities. The fund may not hold all of these instruments. The fund is not rated by these agencies. |
| (d) | Duration is a measure of how much a bond’s price is likely to fluctuate with general changes in interest rates, e.g., if rates rise 1.00%, a bond with a 5-year duration is likely to lose about 5.00% of its value due to the interest rate move. |
| (i) | For purposes of this presentation, the components include the market value of securities, and reflect the impact of the equivalent exposure of derivative positions, if any. These amounts may be negative from time to time. The bond component will include any accrued interest amounts. Equivalent exposure is a calculated amount that translates the derivative position into a reasonable approximation of the amount of the underlying asset that the portfolio would have to hold at a given point in time to have the same price sensitivity that results from the portfolio’s ownership of the derivative contract. When dealing with derivatives, equivalent exposure is a more representative measure of the potential impact of a position on portfolio performance than market value. Where the fund holds convertible bonds, these are treated as part of the equity portion of the portfolio. |
| (m) | In determining an instrument’s effective maturity for purposes of calculating the fund’s dollar-weighted average effective maturity, MFS uses the instrument’s stated maturity or, if applicable, an earlier date on which MFS believes it is probable that a maturity-shortening device (such as a put, pre-refunding or prepayment) will cause the instrument to be repaid. Such an earlier date can be substantially shorter than the instrument’s stated maturity. |
| (o) | Less than 0.1%. |
Percentages are based on net assets as of 12/31/12.
The portfolio is actively managed and current holdings may be different.
2
Table of Contents
MFS High Yield Portfolio
Summary of Results
For the twelve months ended December 31, 2012, Initial Class shares of the MFS High Yield Portfolio (“fund”) provided a total return of 14.91%, while Service Class shares of the fund provided a total return of 14.54%. These compare with a return of 15.78% over the same period for the fund’s benchmark, the Barclays U.S. High-Yield Corporate Bond 2% Issuer Capped Index.
Market Environment
The beginning of the period was characterized by a risk-on sentiment as a result of additional liquidity measures by the Federal Reserve Bank (“Fed”) and the European Central Bank (“ECB”) as well as a commensurate improvement in macroeconomic conditions. During this time, global equity valuations rose, credit spreads contracted, and high-quality sovereign yields increased modestly.
During the middle of the period, however, conditions worsened, driven by broadly weaker global macroeconomic indicators, as well as renewed concerns over the eurozone’s capacity and determination to address its ongoing crisis. Despite this deterioration, broad market sentiment remained relatively resilient as equity markets generally maintained gains and credit spreads did not indicate deterioration.
However, this renewed weakness in the fundamentals precipitated a further round of monetary easing by both the Fed (through a third round of quantitative easing) and the ECB (through a new bond purchase facility) in the second half of the period, which soon instilled additional confidence in risk markets. Nonetheless, towards the end of the period, weaker equity earnings reports and declining forward guidance caused market sentiment to soften. In addition, as we moved toward year end, the fiscal cliff negotiations between the Republicans in the U.S. Congress and President Obama were a particular source of market attention, where uncertainty surrounding the fiscal negotiations continued right up to the end-of-year deadline.
Detractors from Performance
Relative to the Barclays U.S. High-Yield Corporate Bond 2% Issuer Capped Index, the fund’s lesser exposure to “BB” (r) and “B” rated securities detracted from performance as lower-quality issues benefited from strong investor demand due to a liquidity-fueled rally during the reporting period.
The portion of the fund’s return derived from yield, which was less than that of the benchmark, weighed on relative results. The fund’s lesser exposure to the telecom sector also hindered relative returns as this market segment performed well during the reporting period.
Bond selection detracted from relative performance. Among individual securities, debt holdings of Spanish language radio and television station owner and operator LBI Media, oil and natural gas exploration and production company OGX Petroleo, oil and natural gas property company ATP Oil & Gas (h), and financial services firm Citigroup were among the fund’s top relative detractors for the reporting period.
Contributors to Performance
The fund’s greater exposure to the financial sector contributed to relative results. A greater exposure to “BBB” rated securities further supported positive relative performance.
Top individual contributors during the reporting period included the fund’s debt holdings of insurance firm American International Group, financial services firm Royal Bank of Scotland, cement producer CEMEX, banker Santander UK, and investment bank LBG Capital.
Respectfully,
| William Adams | David Cole | |
| Portfolio Manager | Portfolio Manager |
| (h) | Security was not held in the portfolio at period end. |
| (r) | Bonds rated “BBB”, “Baa”, or higher are considered investment grade; bonds rated “BB”, “Ba”, or below are considered non-investment grade. The sources for bond quality ratings are Moody’s Investors Service, Standard & Poor’s and Fitch, Inc. and are applied using the following hierarchy: If all three agencies provide a rating, the middle rating (after dropping the highest and lowest ratings) is assigned; if two of the three agencies rate a security, the lower of the two is assigned. Ratings are shown in the S&P and Fitch scale (e.g., AAA). For securities which are not rated by any of the three agencies, the security is considered Not Rated. |
The views expressed in this report are those of the portfolio managers only through the end of the period of the report as stated on the cover and do not necessarily reflect the views of MFS or any other person in the MFS organization. These views are subject to change at any time based on market or other conditions, and MFS disclaims any responsibility to update such views. These views may not be relied upon as investment advice or an indication of trading intent on behalf of any MFS portfolio. References to specific securities are not recommendations of such securities, and may not be representative of any MFS portfolio’s current or future investments.
3
Table of Contents
MFS High Yield Portfolio
PERFORMANCE SUMMARY THROUGH 12/31/12
The following chart illustrates the historical performance of the fund in comparison to its benchmark(s). Benchmarks are unmanaged and may not be invested in directly. Benchmark returns do not reflect any fees or expenses. The performance of other share classes will be greater than or less than that of the class depicted below. (See Notes to Performance Summary.)
Performance data shown represents past performance and is no guarantee of future results. Investment return and principal value fluctuate so your units, when sold, may be worth more or less than the original cost; current performance may be lower or higher than quoted. The performance shown does not reflect the deduction of taxes, if any, that a contract holder would pay on fund distributions or the redemption of contract units. The returns for the fund shown also do not reflect the deduction of expenses associated with variable products, such as mortality and expense risk charges, separate account charges, and sales charges imposed by the insurance company separate accounts. Such expenses would reduce the overall returns shown.
Growth of a Hypothetical $10,000 Investment
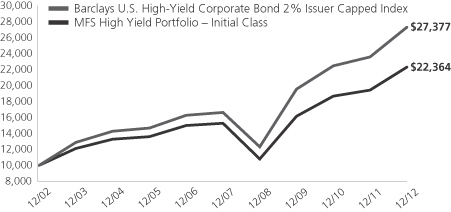
Total Returns through 12/31/12
Average annual total returns
| Share Class | Class inception date | 1-yr | 5-yr | 10-yr | ||||||||
| Initial Class | 6/12/85 | 14.91% | 7.89% | 8.38% | ||||||||
| Service Class | 8/24/01 | 14.54% | 7.65% | 8.12% | ||||||||
| Comparative benchmark | ||||||||||||
| Barclays U.S. High-Yield Corporate Bond 2% Issuer Capped Index (f) | 15.78% | 10.45% | 10.60% | |||||||||
| (f) | Source: FactSet Research Systems Inc. |
Benchmark Definition
Barclays U.S. High-Yield Corporate Bond 2% Issuer Capped Index – a component of the Barclays U.S. High-Yield Corporate Bond Index, which measures performance of non-investment grade, fixed rate debt. The index limits the maximum exposure to any one issuer to 2%.
It is not possible to invest directly in an index.
Notes to Performance Summary
Average annual total return represents the average annual change in value for each share class for the periods presented.
Performance results reflect any applicable expense subsidies and waivers in effect during the periods shown. Without such subsidies and waivers the fund’s performance results would be less favorable. Please see the prospectus and financial statements for complete details. All results are historical and assume the reinvestment of any dividends and capital gains distributions.
Performance results do not include adjustments made for financial reporting purposes in accordance with U.S. generally accepted accounting principles and may differ from amounts reported in the financial highlights.
From time to time the fund may receive proceeds from litigation settlements, without which performance would be lower.
4
Table of Contents
MFS High Yield Portfolio
Fund Expenses Borne by the Contract Holders During the Period,
July 1, 2012 through December 31, 2012
As a contract holder of the fund, you incur ongoing costs, including management fees; distribution and/or service (12b-1) fees; and other fund expenses. This example is intended to help you understand your ongoing costs (in dollars) of investing in the fund and to compare these costs with the ongoing costs of investing in other mutual funds.
The example is based on an investment of $1,000 invested at the beginning of the period and held for the entire period July 1, 2012 through December 31, 2012.
Actual Expenses
The first line for each share class in the following table provides information about actual account values and actual expenses. You may use the information in this line, together with the amount you invested, to estimate the expenses that you paid over the period. Simply divide your account value by $1,000 (for example, an $8,600 account value divided by $1,000 = 8.6), then multiply the result by the number in the first line under the heading entitled “Expenses Paid During Period” to estimate the expenses you paid on your account during this period.
Hypothetical Example for Comparison Purposes
The second line for each share class in the following table provides information about hypothetical account values and hypothetical expenses based on the fund’s actual expense ratio and an assumed rate of return of 5% per year before expenses, which is not the fund’s actual return. The hypothetical account values and expenses may not be used to estimate the actual ending account balance or expenses you paid for the period. You may use this information to compare the ongoing costs of investing in the fund and other funds. To do so, compare this 5% hypothetical example with the 5% hypothetical examples that appear in the shareholder reports of the other funds.
Please note that the expenses shown in the table are meant to highlight the fund’s ongoing costs only and do not take into account the fees and expenses imposed under the variable contracts through which your investment in the fund is made. Therefore, the second line for each share class in the table is useful in comparing ongoing costs associated with an investment in vehicles (such as the fund) which fund benefits under variable annuity and variable life insurance contracts and to qualified pension and retirement plans only, and will not help you determine the relative total costs of investing in the fund through variable annuity and variable life insurance contracts. If the fees and expenses imposed under the variable contracts were included, your costs would have been higher.
| Share Class | Annualized Expense Ratio | Beginning Account Value 7/01/12 | Ending Account Value 12/31/12 | Expenses Paid During Period (p) 7/01/12-12/31/12 | ||||||||||||||
| Initial Class | Actual | 0.80% | $1,000.00 | $1,074.75 | $4.17 | |||||||||||||
| Hypothetical (h) | 0.80% | $1,000.00 | $1,021.11 | $4.06 | ||||||||||||||
| Service Class | Actual | 1.05% | $1,000.00 | $1,072.45 | $5.47 | |||||||||||||
| Hypothetical (h) | 1.05% | $1,000.00 | $1,019.86 | $5.33 | ||||||||||||||
| (h) | 5% class return per year before expenses. |
| (p) | Expenses paid are equal to each class’s annualized expense ratio, as shown above, multiplied by the average account value over the period, multiplied by the number of days in the period, divided by the number of days in the year. |
Changes to the fund’s fee arrangements occurred during the six month period. Had these fee changes been in effect throughout the entire six month period, the annualized expense ratios would have been 0.75% for the Initial Class shares and 1.00% for the Service Class shares; the actual expenses paid during the period would have been approximately $3.91 for the Initial Class shares and $5.21 for the Service Class shares; and the hypothetical expenses paid during the period would have been approximately $3.81 for the Initial Class shares and $5.08 for the Service Class shares. For further information about the fund’s fee arrangements and changes to those fee arrangements, please see Note 3 in the Notes to Financial Statements.
5
Table of Contents
MFS High Yield Portfolio
PORTFOLIO OF INVESTMENTS – 12/31/12
The Portfolio of Investments is a complete list of all securities owned by your fund. It is categorized by broad-based asset classes.
| Issuer | Shares/Par | Value ($) | ||||||
| BONDS – 93.6% | ||||||||
| Aerospace – 2.0% | ||||||||
| Bombardier, Inc., 7.5%, 2018 (n) | $ | 2,795,000 | $ | 3,112,931 | ||||
| Bombardier, Inc., 7.75%, 2020 (n) | 525,000 | 595,875 | ||||||
| CPI International, Inc., 8%, 2018 | 755,000 | 737,035 | ||||||
| Heckler & Koch GmbH, 9.5%, 2018 (z) | EUR | 390,000 | 445,285 | |||||
| Huntington Ingalls Industries, Inc., 6.875%, 2018 | $ | 250,000 | 271,875 | |||||
| Huntington Ingalls Industries, Inc., 7.125%, 2021 | 2,100,000 | 2,283,750 | ||||||
| Kratos Defense & Security Solutions, Inc., 10%, 2017 | 1,900,000 | 2,085,250 | ||||||
|
| |||||||
| $ | 9,532,001 | |||||||
|
| |||||||
| Apparel Manufacturers – 0.9% | ||||||||
| Hanesbrands, Inc., 6.375%, 2020 | $ | 890,000 | $ | 979,000 | ||||
| Jones Group, Inc., 6.875%, 2019 | 1,055,000 | 1,097,200 | ||||||
| Levi Strauss & Co., 7.625%, 2020 | 225,000 | 245,250 | ||||||
| Levi Strauss & Co., 6.875%, 2022 | 110,000 | 117,975 | ||||||
| PVH Corp., 7.375%, 2020 | 1,295,000 | 1,452,019 | ||||||
| PVH Corp., 4.5%, 2022 | 430,000 | 434,300 | ||||||
|
| |||||||
| $ | 4,325,744 | |||||||
|
| |||||||
| Asset-Backed & Securitized – 0.3% | ||||||||
| Arbor Realty Mortgage Securities, CDO, FRN, 2.618%, 2038 (z) | $ | 568,229 | $ | 170,469 | ||||
| Citigroup Commercial Mortgage Trust, FRN, 5.702%, 2049 | 1,100,911 | 208,887 | ||||||
| Crest Ltd., CDO, 7%, 2040 (a)(p) | 183,174 | 9,159 | ||||||
| CWCapital Cobalt Ltd., CDO, 6.23%, 2045 (a)(p)(z) | 1,216,510 | 12,165 | ||||||
| CWCapital Cobalt Ltd., CDO, “F”, FRN, 1.614%, 2050 (z) | 525,913 | 1,315 | ||||||
| First Union National Bank Commercial Mortgage Trust, 6.75%, 2032 | 745,915 | 373,032 | ||||||
| G-Force LLC, CDO, “A2”, 4.83%, 2036 (z) | 343,335 | 345,051 | ||||||
| JPMorgan Chase Commercial Mortgage Securities Corp., “C”, FRN, 6.001%, 2051 | 800,000 | 239,899 | ||||||
|
| |||||||
| $ | 1,359,977 | |||||||
|
| |||||||
| Automotive – 3.4% | ||||||||
| Accuride Corp., 9.5%, 2018 | $ | 1,550,000 | $ | 1,495,750 | ||||
| Allison Transmission, Inc., 7.125%, 2019 (n) | 2,235,000 | 2,385,863 | ||||||
| Conti-Gummi Finance B.V., 8.5%, 2015 | EUR | 75,000 | 106,873 | |||||
| Conti-Gummi Finance B.V., 7.5%, 2017 | EUR | 100,000 | 141,367 | |||||
| Conti-Gummi Finance B.V., 7.125%, 2018 | EUR | 250,000 | 352,559 | |||||
| Continental Rubber of America Corp., 4.5%, 2019 (n) | $ | 165,000 | 168,860 | |||||
| Ford Motor Co., 7.45%, 2031 | 225,000 | 285,750 | ||||||
| Ford Motor Credit Co. LLC, 8%, 2014 | 100,000 | 109,039 | ||||||
| Ford Motor Credit Co. LLC, 12%, 2015 | 2,264,000 | 2,779,060 | ||||||
| Ford Motor Credit Co. LLC, 8%, 2016 | 500,000 | 603,734 | ||||||
| Ford Motor Credit Co. LLC, 6.625%, 2017 | 500,000 | 584,233 | ||||||
| Ford Motor Credit Co. LLC, 8.125%, 2020 | 280,000 | 358,786 | ||||||
| Issuer | Shares/Par | Value ($) | ||||||
| BONDS – continued | ||||||||
| Automotive – continued | ||||||||
| General Motors Financial Co., Inc., 4.75%, 2017 (n) | $ | 330,000 | $ | 346,992 | ||||
| General Motors Financial Co., Inc., 6.75%, 2018 | 1,610,000 | 1,846,965 | ||||||
| Goodyear Tire & Rubber Co., 8.25%, 2020 | 160,000 | 175,600 | ||||||
| Goodyear Tire & Rubber Co., 7%, 2022 | 795,000 | 852,638 | ||||||
| Jaguar Land Rover PLC, 7.75%, 2018 (n) | 325,000 | 354,250 | ||||||
| Jaguar Land Rover PLC, 8.125%, 2021 (n) | 2,665,000 | 2,931,500 | ||||||
| Lear Corp., 8.125%, 2020 | 405,000 | 456,638 | ||||||
|
| |||||||
| $ | 16,336,457 | |||||||
|
| |||||||
| Broadcasting – 5.4% | ||||||||
| Allbritton Communications Co., 8%, 2018 | $ | 840,000 | $ | 911,400 | ||||
| AMC Networks, Inc., 7.75%, 2021 | 1,654,000 | 1,893,830 | ||||||
| Clear Channel Communications, Inc., 9%, 2021 | 1,646,000 | 1,469,055 | ||||||
| Clear Channel Worldwide Holdings, Inc., 6.5%, 2022 (n) | 415,000 | 426,413 | ||||||
| Clear Channel Worldwide Holdings, Inc., 6.5%, 2022 (n) | 700,000 | 726,250 | ||||||
| Clear Channel Worldwide Holdings, Inc., “A”, 7.625%, 2020 | 35,000 | 34,913 | ||||||
| Clear Channel Worldwide Holdings, Inc., “B”, 7.625%, 2020 | 870,000 | 876,525 | ||||||
| Hughes Network Systems LLC, 6.5%, 2019 | 125,000 | 137,813 | ||||||
| Hughes Network Systems LLC, 7.625%, 2021 | 655,000 | 745,063 | ||||||
| IAC/InterActiveCorp, 4.75%, 2022 (z) | 200,000 | 199,000 | ||||||
| Inmarsat Finance PLC, 7.375%, 2017 (n) | 1,110,000 | 1,193,250 | ||||||
| Intelsat Bermuda Ltd., 11.25%, 2017 | 1,490,000 | 1,575,675 | ||||||
| Intelsat Bermuda Ltd., 11.5%, 2017 (p) | 1,751,621 | 1,861,097 | ||||||
| Intelsat Jackson Holdings Ltd., 7.25%, 2019 | 350,000 | 376,250 | ||||||
| Intelsat Jackson Holdings Ltd., 8.5%, 2019 | 500,000 | 560,000 | ||||||
| Intelsat Jackson Holdings Ltd., 7.25%, 2020 | 500,000 | 543,750 | ||||||
| Intelsat Jackson Holdings Ltd., 7.25%, 2020 | 400,000 | 434,000 | ||||||
| Intelsat Jackson Holdings Ltd., 7.5%, 2021 | 500,000 | 551,250 | ||||||
| Intelsat Jackson Holdings Ltd., 6.625%, 2022 (n) | 555,000 | 573,038 | ||||||
| LBI Media, Inc., 13.5% to 2015, 11.5% to 2020 (p)(z) | 470,000 | 197,400 | ||||||
| Liberty Media Corp., 8.5%, 2029 | 965,000 | 1,044,613 | ||||||
| Local TV Finance LLC, 9.25%, 2015 (p)(z) | 1,072,186 | 1,084,248 | ||||||
| Nexstar Broadcasting Group, Inc., 8.875%, 2017 | 315,000 | 345,713 | ||||||
| Nexstar Broadcasting Group, Inc., 6.875%, 2020 (n) | 585,000 | 600,356 | ||||||
| Sinclair Broadcast Group, Inc., 9.25%, 2017 (n) | 465,000 | 511,500 | ||||||
| Sinclair Broadcast Group, Inc., 8.375%, 2018 | 875,000 | 977,813 | ||||||
| SIRIUS XM Radio, Inc., 8.75%, 2015 (n) | 535,000 | 605,888 | ||||||
| SIRIUS XM Radio, Inc., 7.625%, 2018 (n) | 595,000 | 663,425 | ||||||
6
Table of Contents
MFS High Yield Portfolio
Portfolio of Investments – continued
| Issuer | Shares/Par | Value ($) | ||||||
| BONDS – continued | ||||||||
| Broadcasting – continued | ||||||||
| SIRIUS XM Radio, Inc., 5.25%, 2022 (n) | $ | 1,605,000 | $ | 1,621,050 | ||||
| Starz LLC/Starz Finance Corp., 5%, 2019 (n) | 260,000 | 266,500 | ||||||
| Townsquare Radio LLC, 9%, 2019 (z) | 285,000 | 312,788 | ||||||
| Univision Communications, Inc., 6.875%, 2019 (n) | 940,000 | 977,600 | ||||||
| Univision Communications, Inc., 7.875%, 2020 (n) | 700,000 | 757,750 | ||||||
| Univision Communications, Inc., 8.5%, 2021 (n) | 745,000 | 769,213 | ||||||
| Univision Communications, Inc., 6.75%, 2022 | 250,000 | 258,125 | ||||||
|
| |||||||
| $ | 26,082,554 | |||||||
|
| |||||||
| Brokerage & Asset Managers – 0.4% | ||||||||
| E*TRADE Financial Corp., 6.75%, 2016 | $ | 100,000 | $ | 105,250 | ||||
| E*TRADE Financial Corp., 6.375%, 2019 | 1,590,000 | 1,629,750 | ||||||
|
| |||||||
| $ | 1,735,000 | |||||||
|
| |||||||
| Building – 2.7% | ||||||||
| Boise Cascade LLC/Finance Corp., 6.375%, 2020 (n) | $ | 300,000 | $ | 309,000 | ||||
| Building Materials Holding Corp., 6.875%, 2018 (n) | 1,415,000 | 1,528,200 | ||||||
| Building Materials Holding Corp., 7%, 2020 (n) | 345,000 | 376,050 | ||||||
| Building Materials Holding Corp., 7.5%, 2020 | 250,000 | 275,000 | ||||||
| Building Materials Holding Corp., 6.75%, 2021 (n) | 555,000 | 613,275 | ||||||
| CEMEX Espana S.A., 9.25%, 2020 | 750,000 | 813,750 | ||||||
| CEMEX S.A.B. de C.V., 9%, 2018 (n) | 500,000 | 541,250 | ||||||
| CEMEX S.A.B. de C.V., 9.25%, 2020 | 575,000 | 623,875 | ||||||
| HD Supply, Inc., 13.5%, 2015 | 935,000 | 958,375 | ||||||
| HD Supply, Inc., 8.125%, 2019 (n) | 575,000 | 655,500 | ||||||
| HD Supply, Inc., 11%, 2020 | 250,000 | 295,000 | ||||||
| HD Supply, Inc., 11.5%, 2020 (n) | 260,000 | 292,825 | ||||||
| Masonite International Corp., 8.25%, 2021 (n) | 1,180,000 | 1,262,600 | ||||||
| Nortek, Inc., 8.5%, 2021 | 1,930,000 | 2,142,300 | ||||||
| Roofing Supply Group LLC/Roofing Supply Finance, Inc., 10%, 2020 (n) | 375,000 | 420,000 | ||||||
| USG Corp., 6.3%, 2016 | 1,576,000 | 1,631,160 | ||||||
| USG Corp., 7.875%, 2020 (n) | 340,000 | 378,250 | ||||||
|
| |||||||
| $ | 13,116,410 | |||||||
|
| |||||||
| Business Services – 2.0% | ||||||||
| Ceridian Corp., 12.25%, 2015 (p) | $ | 440,000 | $ | 441,100 | ||||
| Ceridian Corp., 8.875%, 2019 (n) | 745,000 | 808,325 | ||||||
| Fidelity National Information Services, Inc., 7.625%, 2017 | 550,000 | 598,125 | ||||||
| Fidelity National Information Services, Inc., 5%, 2022 | 1,470,000 | 1,576,575 | ||||||
| iGATE Corp., 9%, 2016 | 1,771,000 | 1,919,321 | ||||||
| Iron Mountain, Inc., 8.375%, 2021 | 1,845,000 | 2,047,950 | ||||||
| Legend Acquisition Sub, Inc., 10.75%, 2020 (n) | 480,000 | 434,400 | ||||||
| Issuer | Shares/Par | Value ($) | ||||||
| BONDS – continued | ||||||||
| Business Services – continued | ||||||||
| Lender Processing Services, Inc., 5.75%, 2023 | $ | 870,000 | $ | 902,625 | ||||
| SunGard Data Systems, Inc., 7.375%, 2018 | 650,000 | 696,313 | ||||||
| SunGard Data Systems, Inc., 7.625%, 2020 | 250,000 | 273,125 | ||||||
|
| |||||||
| $ | 9,697,859 | |||||||
|
| |||||||
| Cable TV – 3.8% | ||||||||
| Bresnan Broadband Holdings LLC, 8%, 2018 (n) | $ | 185,000 | $ | 199,800 | ||||
| Cablevision Systems Corp., 7.75%, 2018 | 250,000 | 278,125 | ||||||
| CCO Holdings LLC, 7.875%, 2018 | 910,000 | 979,388 | ||||||
| CCO Holdings LLC, 8.125%, 2020 | 2,180,000 | 2,441,600 | ||||||
| CCO Holdings LLC, 7.375%, 2020 | 520,000 | 577,200 | ||||||
| CCO Holdings LLC, 6.5%, 2021 | 500,000 | 539,375 | ||||||
| CCO Holdings LLC, 5.25%, 2022 | 250,000 | 253,125 | ||||||
| CCO Holdings LLC, 5.125%, 2023 | 495,000 | 493,763 | ||||||
| Cequel Communications Holdings, 6.375%, 2020 (z) | 930,000 | 968,363 | ||||||
| CSC Holdings, Inc., 7.875%, 2018 | 750,000 | 868,125 | ||||||
| CSC Holdings, Inc., 7.625%, 2018 | 210,000 | 242,550 | ||||||
| DISH DBS Corp., 7.75%, 2015 | 75,000 | 83,906 | ||||||
| DISH DBS Corp., 7.875%, 2019 | 100,000 | 118,500 | ||||||
| DISH DBS Corp., 6.75%, 2021 | 635,000 | 723,900 | ||||||
| DISH DBS Corp., 5.875%, 2022 | 500,000 | 537,500 | ||||||
| DISH DBS Corp., 5%, 2023 (z) | 410,000 | 410,000 | ||||||
| EchoStar Corp., 7.125%, 2016 | 1,355,000 | 1,517,600 | ||||||
| Telenet Finance Luxembourg, 6.375%, 2020 (n) | EUR | 165,000 | 233,037 | |||||
| UPC Holding B.V., 8%, 2016 | EUR | 250,000 | 340,547 | |||||
| UPC Holding B.V., 9.75%, 2018 | EUR | 100,000 | 141,103 | |||||
| UPC Holding B.V., 9.875%, 2018 (n) | $ | 485,000 | 548,050 | |||||
| UPC Holding B.V., 8.375%, 2020 | EUR | 500,000 | 740,492 | |||||
| UPC Holding B.V., 6.375%, 2022 (z) | EUR | 250,000 | 336,587 | |||||
| UPCB Finance III Ltd., 6.625%, 2020 (n) | $ | 908,000 | 972,695 | |||||
| UPCB Finance Ltd., 7.625%, 2020 | EUR | 250,000 | 362,986 | |||||
| UPCB Finance VI Ltd., 6.875%, 2022 | $ | 350,000 | 378,875 | |||||
| Virgin Media Finance PLC, 8.375%, 2019 | 184,000 | 208,840 | ||||||
| Virgin Media Finance PLC, 5.25%, 2022 | 1,730,000 | 1,833,800 | ||||||
| Ziggo Bond Co. B.V., 8%, 2018 (n) | EUR | 495,000 | 718,713 | |||||
|
| |||||||
| $ | 18,048,545 | |||||||
|
| |||||||
| Chemicals – 2.0% | ||||||||
| Celanese U.S. Holdings LLC, 6.625%, 2018 | $ | 755,000 | $ | 830,500 | ||||
| Celanese U.S. Holdings LLC, 5.875%, 2021 | 250,000 | 280,000 | ||||||
| Hexion U.S. Finance Corp./Hexion Nova Scotia Finance, 8.875%, 2018 | 1,230,000 | 1,263,825 | ||||||
| Hexion U.S. Finance Corp./Hexion Nova Scotia Finance, 9%, 2020 | 940,000 | 857,750 | ||||||
| Huntsman International LLC, 8.625%, 2020 | 400,000 | 453,000 | ||||||
| Huntsman International LLC, 8.625%, 2021 | 875,000 | 999,688 | ||||||
7
Table of Contents
MFS High Yield Portfolio
Portfolio of Investments – continued
| Issuer | Shares/Par | Value ($) | ||||||
| BONDS – continued | ||||||||
| Chemicals – continued | ||||||||
| INEOS Finance PLC, 9%, 2015 | $ | 500,000 | $ | 531,250 | ||||
| INEOS Finance PLC, 8.375%, 2019 (n) | 470,000 | 506,425 | ||||||
| INEOS Finance PLC, 7.5%, 2020 | 100,000 | 104,750 | ||||||
| INEOS Group Holdings PLC, 7.875%, 2016 | EUR | 750,000 | 981,548 | |||||
| INEOS Group Holdings PLC, 8.5%, 2016 (n) | $ | 625,000 | 621,875 | |||||
| LyondellBasell Industries N.V., 5%, 2019 | 620,000 | 685,100 | ||||||
| LyondellBasell Industries N.V., 6%, 2021 | 625,000 | 732,813 | ||||||
| LyondellBasell Industries N.V., 5.75%, 2024 | 200,000 | 235,000 | ||||||
| Momentive Performance Materials, Inc., 11.5%, 2016 | 172,000 | 100,620 | ||||||
| Polypore International, Inc., 7.5%, 2017 | 570,000 | 621,300 | ||||||
|
| |||||||
| $ | 9,805,444 | |||||||
|
| |||||||
| Computer Software – 1.2% | ||||||||
| Infor U.S., Inc., 11.5%, 2018 | $ | 1,280,000 | $ | 1,497,600 | ||||
| Nuance Communications, Inc., 5.375%, 2020 (n) | 1,040,000 | 1,086,800 | ||||||
| Seagate HDD Cayman, 6.875%, 2020 | 420,000 | 446,775 | ||||||
| Syniverse Holdings, Inc., 9.125%, 2019 | 1,595,000 | 1,702,663 | ||||||
| TransUnion Holding Co., Inc., 8.125%, 2018 | 100,000 | 103,250 | ||||||
| TransUnion Holding Co., Inc., 9.625%, 2018 | 290,000 | 306,675 | ||||||
| TransUnion LLC/TransUnion Financing Corp., 11.375%, 2018 | 640,000 | 745,600 | ||||||
|
| |||||||
| $ | 5,889,363 | |||||||
|
| |||||||
| Computer Software – Systems – 1.0% | ||||||||
| Audatex North America, Inc., 6.75%, 2018 (n) | $ | 695,000 | $ | 743,650 | ||||
| CDW LLC/CDW Finance Corp., 12.535%, 2017 | 448,000 | 478,800 | ||||||
| CDW LLC/CDW Finance Corp., 8.5%, 2019 | 2,215,000 | 2,397,738 | ||||||
| DuPont Fabros Technology, Inc., REIT, 8.5%, 2017 | 915,000 | 999,638 | ||||||
|
| |||||||
| $ | 4,619,826 | |||||||
|
| |||||||
| Conglomerates – 1.1% | ||||||||
| Amsted Industries, Inc., 8.125%, 2018 (n) | $ | 1,455,000 | $ | 1,556,850 | ||||
| Dynacast International LLC, 9.25%, 2019 | 1,030,000 | 1,102,100 | ||||||
| Griffon Corp., 7.125%, 2018 | 1,895,000 | 2,008,700 | ||||||
| Silver II Borrower SCA/Silver II US Holdings, 7.75%, 2020 (z) | 515,000 | 533,025 | ||||||
|
| |||||||
| $ | 5,200,675 | |||||||
|
| |||||||
| Consumer Products – 1.0% | ||||||||
| Easton-Bell Sports, Inc., 9.75%, 2016 | $ | 230,000 | $ | 247,273 | ||||
| Elizabeth Arden, Inc., 7.375%, 2021 | 1,400,000 | 1,564,500 | ||||||
| FGI Operating Co./FGI Finance, Inc., 7.875%, 2020 (n) | 55,000 | 56,650 | ||||||
| Jarden Corp., 8%, 2016 | 250,000 | 265,625 | ||||||
| Jarden Corp., 7.5%, 2017 | 500,000 | 563,125 | ||||||
| Issuer | Shares/Par | Value ($) | ||||||
| BONDS – continued | ||||||||
| Consumer Products – continued | ||||||||
| Jarden Corp., 7.5%, 2020 | $ | 545,000 | $ | 598,138 | ||||
| Libbey Glass, Inc., 6.875%, 2020 | 225,000 | 241,875 | ||||||
| Prestige Brands, Inc., 8.125%, 2020 | 215,000 | 239,188 | ||||||
| Spectrum Brands Escrow Corp., 6.375%, 2020 (n) | 705,000 | 740,250 | ||||||
| Spectrum Brands Escrow Corp., 6.625%, 2022 (z) | 50,000 | 53,625 | ||||||
|
| |||||||
| $ | 4,570,249 | |||||||
|
| |||||||
| Consumer Services – 0.8% | ||||||||
| QVC, Inc., 7.125%, 2017 | $ | 150,000 | $ | 157,303 | ||||
| QVC, Inc., 7.5%, 2019 | 250,000 | 275,830 | ||||||
| QVC, Inc., 7.375%, 2020 (n) | 440,000 | 489,560 | ||||||
| Service Corp. International, 6.75%, 2015 | 380,000 | 418,000 | ||||||
| Service Corp. International, 7%, 2017 | 2,325,000 | 2,673,750 | ||||||
|
| |||||||
| $ | 4,014,443 | |||||||
|
| |||||||
| Containers – 2.4% | ||||||||
| ARD Finance S.A., 11.125%, 2018 | $ | 236,160 | $ | 250,330 | ||||
| Ardagh Packaging Finance PLC, 7.375%, 2017 (n) | 535,000 | 581,144 | ||||||
| Ardagh Packaging Finance PLC, 7.375%, 2017 | 200,000 | 217,500 | ||||||
| Ardagh Packaging Finance PLC, 7.375%, 2017 | EUR | 200,000 | 287,353 | |||||
| Ardagh Packaging Finance PLC, 9.125%, 2020 (n) | $ | 690,000 | 748,650 | |||||
| Ardagh Packaging Finance PLC, 9.25%, 2020 | EUR | 100,000 | 143,743 | |||||
| Ball Corp., 5%, 2022 | $ | 872,000 | 933,040 | |||||
| Berry Plastics Group, Inc., 9.5%, 2018 | 735,000 | 808,500 | ||||||
| Crown Americas LLC, 7.625%, 2017 | 150,000 | 158,438 | ||||||
| Crown Euro Holdings S.A., 7.125%, 2018 | EUR | 50,000 | 72,597 | |||||
| Greif, Inc., 6.75%, 2017 | $ | 770,000 | 858,550 | |||||
| Greif, Inc., 7.75%, 2019 | 1,090,000 | 1,258,950 | ||||||
| Reynolds Group, 8.5%, 2018 | 250,000 | 256,250 | ||||||
| Reynolds Group, 7.125%, 2019 | 920,000 | 989,000 | ||||||
| Reynolds Group, 9%, 2019 | 500,000 | 520,000 | ||||||
| Reynolds Group, 7.875%, 2019 | 250,000 | 278,125 | ||||||
| Reynolds Group, 9.875%, 2019 | 990,000 | 1,059,300 | ||||||
| Reynolds Group, 5.75%, 2020 (n) | 760,000 | 784,700 | ||||||
| Reynolds Group, 6.875%, 2021 | 100,000 | 107,750 | ||||||
| Reynolds Group, 8.25%, 2021 | 995,000 | 1,009,925 | ||||||
|
| |||||||
| $ | 11,323,845 | |||||||
|
| |||||||
| Defense Electronics – 0.4% | ||||||||
| Ducommun, Inc., 9.75%, 2018 | $ | 664,000 | $ | 713,800 | ||||
| MOOG, Inc., 7.25%, 2018 | 1,020,000 | 1,072,275 | ||||||
|
| |||||||
| $ | 1,786,075 | |||||||
|
| |||||||
| Electrical Equipment – 0.3% | ||||||||
| Avaya, Inc., 9.75%, 2015 | $ | 445,000 | $ | 396,050 | ||||
| Avaya, Inc., 7%, 2019 (n) | 1,175,000 | 1,098,625 | ||||||
|
| |||||||
| $ | 1,494,675 | |||||||
|
| |||||||
8
Table of Contents
MFS High Yield Portfolio
Portfolio of Investments – continued
| Issuer | Shares/Par | Value ($) | ||||||
| BONDS – continued | ||||||||
| Electronics – 0.9% | ||||||||
| Freescale Semiconductor, Inc., 9.25%, 2018 (n) | $ | 1,855,000 | $ | 2,026,588 | ||||
| Nokia Corp., 5.375%, 2019 | 235,000 | 223,838 | ||||||
| Nokia Corp., 6.625%, 2039 | 655,000 | 587,863 | ||||||
| NXP B.V., 9.75%, 2018 (n) | 100,000 | 115,875 | ||||||
| Sensata Technologies B.V., 6.5%, 2019 (n) | 1,465,000 | 1,560,225 | ||||||
|
| |||||||
| $ | 4,514,389 | |||||||
|
| |||||||
| Energy – Independent – 8.3% | ||||||||
| BreitBurn Energy Partners LP, 8.625%, 2020 | $ | 1,325,000 | $ | 1,444,250 | ||||
| BreitBurn Energy Partners LP, 7.875%, 2022 (n) | 660,000 | 684,750 | ||||||
| Carrizo Oil & Gas, Inc., 8.625%, 2018 | 280,000 | 302,400 | ||||||
| Chaparral Energy, Inc., 7.625%, 2022 | 855,000 | 897,750 | ||||||
| Chesapeake Energy Corp., 6.875%, 2020 | 1,555,000 | 1,685,231 | ||||||
| Concho Resources, Inc., 8.625%, 2017 | 440,000 | 479,050 | ||||||
| Concho Resources, Inc., 7%, 2021 | 200,000 | 223,000 | ||||||
| Concho Resources, Inc., 6.5%, 2022 | 2,210,000 | 2,431,000 | ||||||
| Continental Resources, Inc., 8.25%, 2019 | 1,215,000 | 1,360,800 | ||||||
| Continental Resources, Inc., 7.375%, 2020 | 50,000 | 56,500 | ||||||
| Continental Resources, Inc., 7.125%, 2021 | 75,000 | 84,750 | ||||||
| Denbury Resources, Inc., 9.75%, 2016 | 250,000 | 265,000 | ||||||
| Denbury Resources, Inc., 8.25%, 2020 | 1,844,000 | 2,074,500 | ||||||
| Energy XXI Gulf Coast, Inc., 9.25%, 2017 | 2,300,000 | 2,627,750 | ||||||
| EP Energy LLC, 6.875%, 2019 | 100,000 | 108,500 | ||||||
| EP Energy LLC, 9.375%, 2020 | 2,900,000 | 3,269,750 | ||||||
| EPL Oil & Gas, Inc., 8.25%, 2018 (n) | 725,000 | 744,938 | ||||||
| EXCO Resources, Inc., 7.5%, 2018 | 710,000 | 688,700 | ||||||
| Harvest Operations Corp., 6.875%, 2017 | 885,000 | 982,350 | ||||||
| Hilcorp Energy I/Hilcorp Finance Co., 8%, 2020 (n) | 255,000 | 279,225 | ||||||
| Laredo Petroleum, Inc., 9.5%, 2019 | 445,000 | 497,288 | ||||||
| Laredo Petroleum, Inc., 7.375%, 2022 | 250,000 | 271,250 | ||||||
| LINN Energy LLC, 6.5%, 2019 | 310,000 | 313,100 | ||||||
| LINN Energy LLC, 8.625%, 2020 | 1,895,000 | 2,065,550 | ||||||
| LINN Energy LLC, 7.75%, 2021 | 428,000 | 455,820 | ||||||
| MEG Energy Corp., 6.5%, 2021 (n) | 710,000 | 747,275 | ||||||
| Newfield Exploration Co., 7.125%, 2018 | 330,000 | 348,150 | ||||||
| Newfield Exploration Co., 6.875%, 2020 | 885,000 | 946,950 | ||||||
| OGX Petroleo e Gas Participacoes S.A., 8.5%, 2018 (n) | 401,000 | 360,900 | ||||||
| Plains Exploration & Production Co., 8.625%, 2019 | 645,000 | 733,688 | ||||||
| Plains Exploration & Production Co., 7.625%, 2020 | 325,000 | 362,375 | ||||||
| Plains Exploration & Production Co., 6.5%, 2020 | 390,000 | 431,925 | ||||||
| Plains Exploration & Production Co., 6.625%, 2021 | 500,000 | 550,625 | ||||||
| Plains Exploration & Production Co., 6.75%, 2022 | 985,000 | 1,105,663 | ||||||
| QEP Resources, Inc., 6.875%, 2021 | 1,940,000 | 2,235,850 | ||||||
| Range Resources Corp., 7.25%, 2018 | 25,000 | 26,250 | ||||||
| Range Resources Corp., 8%, 2019 | 650,000 | 719,875 | ||||||
| Range Resources Corp., 6.75%, 2020 | 150,000 | 162,750 | ||||||
| Issuer | Shares/Par | Value ($) | ||||||
| BONDS – continued | ||||||||
| Energy – Independent – continued | ||||||||
| Range Resources Corp., 5.75%, 2021 | $ | 250,000 | $ | 267,500 | ||||
| Range Resources Corp., 5%, 2022 | 210,000 | 219,450 | ||||||
| Samson Investment Co., 9.75%, 2020 (n) | 870,000 | 920,025 | ||||||
| SandRidge Energy, Inc., 8%, 2018 (n) | 1,160,000 | 1,229,600 | ||||||
| SandRidge Energy, Inc., 7.5%, 2021 | 1,250,000 | 1,337,500 | ||||||
| SandRidge Energy, Inc., 8.125%, 2022 | 250,000 | 273,750 | ||||||
| SM Energy Co., 6.5%, 2021 | 1,395,000 | 1,492,650 | ||||||
| Whiting Petroleum Corp., 6.5%, 2018 | 915,000 | 983,625 | ||||||
|
| |||||||
| $ | 39,749,578 | |||||||
|
| |||||||
| Energy – Integrated – 0.1% | ||||||||
| Pacific Rubiales Energy Corp., 7.25%, 2021 (n) | $ | 290,000 | $ | 334,950 | ||||
|
| |||||||
| Engineering – Construction – 0.2% | ||||||||
| BakerCorp International, Inc., 8.25%, 2019 | $ | 990,000 | $ | 990,000 | ||||
|
| |||||||
| Entertainment – 1.4% | ||||||||
| AMC Entertainment, Inc., 8.75%, 2019 | $ | 1,310,000 | $ | 1,450,825 | ||||
| AMC Entertainment, Inc., 9.75%, 2020 | 500,000 | 577,500 | ||||||
| Cedar Fair LP, 9.125%, 2018 | 1,420,000 | 1,597,500 | ||||||
| Cinemark USA, Inc., 8.625%, 2019 | 1,300,000 | 1,439,750 | ||||||
| Cinemark USA, Inc., 5.125%, 2022 (z) | 125,000 | 126,563 | ||||||
| NAI Entertainment Holdings LLC, 8.25%, 2017 (n) | 297,000 | 327,071 | ||||||
| Six Flags Entertainment Corp., 5.25%, 2021 (z) | 1,010,000 | 1,010,000 | ||||||
|
| |||||||
| $ | 6,529,209 | |||||||
|
| |||||||
| Financial Institutions – 5.9% | ||||||||
| Ally Financial, Inc., 4.5%, 2014 | $ | 1,000,000 | $ | 1,028,750 | ||||
| Ally Financial, Inc., 8.3%, 2015 | 500,000 | 556,875 | ||||||
| Ally Financial, Inc., 0%, 2015 | 500,000 | 452,600 | ||||||
| Ally Financial, Inc., 5.5%, 2017 | 1,770,000 | 1,893,481 | ||||||
| Ally Financial, Inc., 6.25%, 2017 | 250,000 | 276,804 | ||||||
| Ally Financial, Inc., 7.5%, 2020 | 500,000 | 603,750 | ||||||
| CIT Group, Inc., 5.25%, 2014 (n) | 1,005,000 | 1,040,175 | ||||||
| CIT Group, Inc., 5%, 2017 | 250,000 | 265,000 | ||||||
| CIT Group, Inc., 4.25%, 2017 | 500,000 | 514,871 | ||||||
| CIT Group, Inc., 5.25%, 2018 | 975,000 | 1,043,250 | ||||||
| CIT Group, Inc., 6.625%, 2018 (n) | 1,006,000 | 1,136,780 | ||||||
| CIT Group, Inc., 5.5%, 2019 (n) | 777,000 | 846,930 | ||||||
| CIT Group, Inc., 5%, 2022 | 500,000 | 533,158 | ||||||
| Credit Acceptance Corp., 9.125%, 2017 | 1,085,000 | 1,185,363 | ||||||
| General Motors Acceptance Corp., 8%, 2031 | 770,000 | 972,125 | ||||||
| GMAC, Inc., 8%, 2031 | 130,000 | 164,613 | ||||||
| Icahn Enterprises LP, 8%, 2018 | 1,759,000 | 1,888,726 | ||||||
| International Lease Finance Corp., 6.625%, 2013 | 100,000 | 103,750 | ||||||
| International Lease Finance Corp., 4.875%, 2015 | 290,000 | 300,173 | ||||||
| International Lease Finance Corp., 8.625%, 2015 | 1,045,000 | 1,174,319 | ||||||
| International Lease Finance Corp., 8.75%, 2017 | 475,000 | 548,625 | ||||||
| International Lease Finance Corp., 7.125%, 2018 (n) | 1,191,000 | 1,381,560 | ||||||
9
Table of Contents
MFS High Yield Portfolio
Portfolio of Investments – continued
| Issuer | Shares/Par | Value ($) | ||||||
| BONDS – continued | ||||||||
| Financial Institutions – continued | ||||||||
| International Lease Finance Corp., 6.25%, 2019 | $ | 200,000 | $ | 213,000 | ||||
| International Lease Finance Corp., 8.25%, 2020 | 400,000 | 477,000 | ||||||
| Nationstar Mortgage LLC/Capital Corp., 10.875%, 2015 | 800,000 | 856,000 | ||||||
| Nationstar Mortgage LLC/Capital Corp., 9.625%, 2019 (n) | 245,000 | 275,625 | ||||||
| Nationstar Mortgage LLC/Capital Corp., 7.875%, 2020 (n) | 1,700,000 | 1,793,500 | ||||||
| PHH Corp., 9.25%, 2016 | 1,615,000 | 1,885,513 | ||||||
| PHH Corp., 7.375%, 2019 | 965,000 | 1,071,150 | ||||||
| SLM Corp., 8.45%, 2018 | 645,000 | 754,650 | ||||||
| SLM Corp., 8%, 2020 | 2,060,000 | 2,353,550 | ||||||
| SLM Corp., 7.25%, 2022 | 665,000 | 733,163 | ||||||
|
| |||||||
| $ | 28,324,829 | |||||||
|
| |||||||
| Food & Beverages – 1.3% | ||||||||
| ARAMARK Corp., 8.5%, 2015 | $ | 560,000 | $ | 562,806 | ||||
| ARAMARK Corp., FRN, 3.812%, 2015 | 525,000 | 523,031 | ||||||
| B&G Foods, Inc., 7.625%, 2018 | 1,406,000 | 1,511,450 | ||||||
| Constellation Brands, Inc., 7.25%, 2016 | 230,000 | 265,650 | ||||||
| Constellation Brands, Inc., 7.25%, 2017 | 150,000 | 176,625 | ||||||
| Constellation Brands, Inc., 6%, 2022 | 150,000 | 171,750 | ||||||
| Constellation Brands, Inc., 4.625%, 2023 | 250,000 | 261,250 | ||||||
| JBS USA LLC/JBS USA Finance, 8.25%, 2020 (n) | 170,000 | 180,200 | ||||||
| Pinnacle Foods Finance LLC, 8.25%, 2017 | 695,000 | 740,175 | ||||||
| TreeHouse Foods, Inc., 7.75%, 2018 | 1,840,000 | 1,996,400 | ||||||
|
| |||||||
| $ | 6,389,337 | |||||||
|
| |||||||
| Forest & Paper Products – 1.2% | ||||||||
| Ainsworth Lumber Co. Ltd., 7.5%, 2017 (n) | $ | 75,000 | $ | 78,563 | ||||
| Boise, Inc., 8%, 2020 | 585,000 | 646,425 | ||||||
| Georgia-Pacific Corp., 8%, 2024 | 64,000 | 89,482 | ||||||
| Graphic Packaging Holding Co., 7.875%, 2018 | 775,000 | 856,375 | ||||||
| Millar Western Forest Products Ltd., 8.5%, 2021 | 145,000 | 131,225 | ||||||
| Sappi Papier Holding GmbH, 7.75%, 2017 (n) | 430,000 | 468,700 | ||||||
| Sappi Papier Holding GmbH, 6.625%, 2021 | 200,000 | 197,500 | ||||||
| Smurfit Kappa Group PLC, 7.75%, 2019 (n) | EUR | 1,565,000 | 2,284,690 | |||||
| Tembec Industries, Inc., 11.25%, 2018 | $ | 845,000 | 895,700 | |||||
| Xerium Technologies, Inc., 8.875%, 2018 | 258,000 | 232,200 | ||||||
|
| |||||||
| $ | 5,880,860 | |||||||
|
| |||||||
| Gaming & Lodging – 3.8% | ||||||||
| Boyd Gaming Corp., 9%, 2020 (z) | $ | 510,000 | $ | 502,350 | ||||
| Caesars Entertainment Operating Co., Inc., 8.5%, 2020 | 1,700,000 | 1,687,250 | ||||||
| Choice Hotels International, Inc., 5.75%, 2022 | 105,000 | 116,288 | ||||||
| Issuer | Shares/Par | Value ($) | ||||||
| BONDS – continued | ||||||||
| Gaming & Lodging – continued | ||||||||
| CityCenter Holdings LLC, 10.75%, 2017 (p) | $ | 510,000 | $ | 553,350 | ||||
| FelCor Lodging LP, 5.625%, 2023 (z) | 200,000 | 199,000 | ||||||
| Fontainebleau Las Vegas Holdings LLC, 10.25%, 2015 (a)(d)(n) | 1,450,000 | 906 | ||||||
| GWR Operating Partnership LLP, 10.875%, 2017 | 340,000 | 386,750 | ||||||
| Host Hotels & Resorts, Inc., REIT, 6%, 2020 | 500,000 | 550,000 | ||||||
| Host Hotels & Resorts, Inc., REIT, 5.25%, 2022 | 350,000 | 383,250 | ||||||
| Isle of Capri Casinos, Inc., 8.875%, 2020 | 1,550,000 | 1,689,500 | ||||||
| MGM Mirage, 6.625%, 2015 | 260,000 | 278,850 | ||||||
| MGM Resorts International, 7.625%, 2017 | 1,250,000 | 1,337,500 | ||||||
| MGM Resorts International, 11.375%, 2018 | 630,000 | 762,300 | ||||||
| MGM Resorts International, 6.625%, 2021 | 255,000 | 255,000 | ||||||
| Penn National Gaming, Inc., 8.75%, 2019 | 2,050,000 | 2,337,000 | ||||||
| Pinnacle Entertainment, Inc., 8.75%, 2020 | 795,000 | 858,600 | ||||||
| Rivers Pittsburgh Borrower LP/Rivers Pittsburgh Finance Corp., 9.5%, 2019 (n) | 110,000 | 119,350 | ||||||
| Seven Seas Cruises S. DE R.L., 9.125%, 2019 | 1,840,000 | 1,945,800 | ||||||
| Viking Cruises Ltd., 8.5%, 2022 (n) | 895,000 | 966,600 | ||||||
| Wyndham Worldwide Corp., 7.375%, 2020 | 375,000 | 451,395 | ||||||
| Wynn Las Vegas LLC, 7.875%, 2017 | 500,000 | 542,500 | ||||||
| Wynn Las Vegas LLC, 7.75%, 2020 | 1,830,000 | 2,086,200 | ||||||
|
| |||||||
| $ | 18,009,739 | |||||||
|
| |||||||
| Industrial – 0.7% | ||||||||
| Dematic S.A., 7.75%, 2020 (z) | $ | 905,000 | $ | 905,000 | ||||
| Hyva Global B.V., 8.625%, 2016 (n) | 717,000 | 681,150 | ||||||
| Mueller Water Products, Inc., 8.75%, 2020 | 550,000 | 627,000 | ||||||
| Rexel S.A., 6.125%, 2019 (n) | 945,000 | 992,250 | ||||||
| SPL Logistics Escrow LLC, 8.875%, 2020 (n) | 315,000 | 333,900 | ||||||
|
| |||||||
| $ | 3,539,300 | |||||||
|
| |||||||
| Insurance – 1.0% | ||||||||
| American International Group, Inc., 8.25%, 2018 | $ | 635,000 | $ | 834,318 | ||||
| American International Group, Inc., 8.175% to 2038, FRN to 2068 | 3,185,000 | 4,148,463 | ||||||
|
| |||||||
| $ | 4,982,781 | |||||||
|
| |||||||
| Insurance – Health – 0.1% | ||||||||
| AMERIGROUP Corp., 7.5%, 2019 | $ | 267,000 | $ | 320,400 | ||||
|
| |||||||
| Insurance – Property & Casualty – 0.8% | ||||||||
| Liberty Mutual Group, Inc., 10.75% to 2038, FRN to 2088 (n) | $ | 1,765,000 | $ | 2,629,850 | ||||
| XL Group PLC, 6.5% to 2017, FRN to 2049 | 1,275,000 | 1,192,125 | ||||||
|
| |||||||
| $ | 3,821,975 | |||||||
|
| |||||||
| Machinery & Tools – 2.2% | ||||||||
| Ashtead Capital, Inc., 6.5%, 2022 (n) | $ | 210,000 | $ | 227,850 | ||||
| Case New Holland, Inc., 7.875%, 2017 | 3,610,000 | 4,268,825 | ||||||
| CNH America LLC, 7.25%, 2016 | 390,000 | 438,750 | ||||||
| CNH Capital LLC, 3.875%, 2015 (n) | 130,000 | 134,063 | ||||||
| CNH Capital LLC, 6.25%, 2016 | 175,000 | 192,938 | ||||||
| H&E Equipment Services LLC, 7%, 2022 (n) | 895,000 | 953,175 | ||||||
10
Table of Contents
MFS High Yield Portfolio
Portfolio of Investments – continued
| Issuer | Shares/Par | Value ($) | ||||||
| BONDS – continued | ||||||||
| Machinery & Tools – continued | ||||||||
| NESCO LLC/NESCO Holdings Corp., 11.75%, 2017 (n) | $ | 1,430,000 | $ | 1,537,250 | ||||
| RSC Equipment Rental, Inc., 8.25%, 2021 | 1,165,000 | 1,313,538 | ||||||
| United Rentals North America, Inc., 6.125%, 2023 | 100,000 | 105,500 | ||||||
| UR Financing Escrow Corp., 5.75%, 2018 (n) | 570,000 | 614,175 | ||||||
| UR Financing Escrow Corp., 7.375%, 2020 | 250,000 | 274,375 | ||||||
| UR Financing Escrow Corp., 7.625%, 2022 (n) | 574,000 | 641,445 | ||||||
|
| |||||||
| $ | 10,701,884 | |||||||
|
| |||||||
| Major Banks – 0.9% | ||||||||
| Bank of America Corp., 5.65%, 2018 | $ | 655,000 | $ | 762,055 | ||||
| Barclays Bank PLC, 7.625%, 2022 | 900,000 | 898,875 | ||||||
| RBS Capital Trust A, FRN, 2.285%, 2049 | EUR | 50,000 | 45,829 | |||||
| Royal Bank of Scotland Group PLC, 6.99% to 2017, FRN to 2049 (n) | $ | 320,000 | 302,400 | |||||
| Royal Bank of Scotland Group PLC, 7.648% to 2031, FRN to 2049 | 2,500,000 | 2,525,000 | ||||||
|
| |||||||
| $ | 4,534,159 | |||||||
|
| |||||||
| Medical & Health Technology & Services – 5.4% | ||||||||
| AmSurg Corp., 5.625%, 2020 (n) | $ | 650,000 | $ | 676,000 | ||||
| Biomet, Inc., 6.5%, 2020 (n) | 1,065,000 | 1,131,563 | ||||||
| CDRT Holding Corp., 9.25%, 2017 (p)(z) | 305,000 | 311,100 | ||||||
| Davita, Inc., 6.375%, 2018 | 2,155,000 | 2,311,238 | ||||||
| Davita, Inc., 6.625%, 2020 | 1,665,000 | 1,810,688 | ||||||
| Davita, Inc., 5.75%, 2022 | 350,000 | 368,813 | ||||||
| Fresenius Medical Care AG & Co. KGaA, 9%, 2015 (n) | 720,000 | 829,800 | ||||||
| Fresenius Medical Care Capital Trust III, 5.625%, 2019 (n) | 480,000 | 515,400 | ||||||
| Fresenius Medical Care Capital Trust III, 5.875%, 2022 | 250,000 | 271,250 | ||||||
| HCA, Inc., 9.875%, 2017 | 250,000 | 264,063 | ||||||
| HCA, Inc., 8.5%, 2019 | 1,545,000 | 1,722,675 | ||||||
| HCA, Inc., 6.5%, 2020 | 900,000 | 1,012,500 | ||||||
| HCA, Inc., 7.25%, 2020 | 400,000 | 443,000 | ||||||
| HCA, Inc., 7.5%, 2022 | 1,910,000 | 2,186,950 | ||||||
| HCA, Inc., 5.875%, 2022 | 475,000 | 516,563 | ||||||
| HCA, Inc., 4.75%, 2023 | 200,000 | 203,500 | ||||||
| HCA, Inc., 5.875%, 2023 | 250,000 | 258,750 | ||||||
| HealthSouth Corp., 8.125%, 2020 | 2,005,000 | 2,208,006 | ||||||
| Hologic, Inc., 6.25%, 2020 (n) | 1,160,000 | 1,249,900 | ||||||
| IASIS Healthcare LLC/IASIS Capital Corp., 8.375%, 2019 | 1,730,000 | 1,634,850 | ||||||
| Physio-Control International, Inc., 9.875%, 2019 (n) | 425,000 | 466,438 | ||||||
| Select Medical Corp., 7.625%, 2015 | 93,000 | 93,116 | ||||||
| Teleflex, Inc., 6.875%, 2019 | 340,000 | 367,200 | ||||||
| Tenet Healthcare Corp., 9.25%, 2015 | 425,000 | 477,063 | ||||||
| Tenet Healthcare Corp., 8%, 2020 | 760,000 | 818,425 | ||||||
| Universal Health Services, Inc., 7%, 2018 | 1,015,000 | 1,119,038 | ||||||
| Issuer | Shares/Par | Value ($) | ||||||
| BONDS – continued | ||||||||
| Medical & Health Technology & Services – continued | ||||||||
| Universal Hospital Services, Inc., 7.625%, 2020 (n) | $ | 1,550,000 | $ | 1,633,313 | ||||
| Universal Hospital Services, Inc., FRN, 3.902%, 2015 | 335,000 | 333,534 | ||||||
| Vanguard Health Systems, Inc., 0%, 2016 | 3,000 | 2,250 | ||||||
| Vanguard Health Systems, Inc., 8%, 2018 | 700,000 | 724,500 | ||||||
|
| |||||||
| $ | 25,961,486 | |||||||
|
| |||||||
| Metals & Mining – 2.0% | ||||||||
| Arch Coal, Inc., 7%, 2019 | $ | 250,000 | $ | 232,500 | ||||
| Arch Coal, Inc., 7.25%, 2020 | 570,000 | 528,675 | ||||||
| Arch Coal, Inc., 7.25%, 2021 | 250,000 | 230,625 | ||||||
| Cloud Peak Energy, Inc., 8.25%, 2017 | 1,185,000 | 1,267,950 | ||||||
| Cloud Peak Energy, Inc., 8.5%, 2019 | 1,575,000 | 1,728,563 | ||||||
| Consol Energy, Inc., 8%, 2017 | 1,305,000 | 1,412,663 | ||||||
| Consol Energy, Inc., 8.25%, 2020 | 395,000 | 427,588 | ||||||
| Consol Energy, Inc., 6.375%, 2021 | 150,000 | 153,750 | ||||||
| First Quantum Minerals Ltd., 7.25%, 2019 (n) | 777,000 | 784,770 | ||||||
| FMG Resources, 6%, 2017 (n) | 175,000 | 178,500 | ||||||
| FMG Resources, 6.875%, 2022 (z) | 500,000 | 511,250 | ||||||
| Fortescue Metals Group Ltd., 8.25%, 2019 (n) | 975,000 | 1,038,375 | ||||||
| Peabody Energy Corp., 6%, 2018 | 805,000 | 855,313 | ||||||
| Peabody Energy Corp., 6.5%, 2020 | 100,000 | 107,250 | ||||||
| Peabody Energy Corp., 6.25%, 2021 | 305,000 | 324,063 | ||||||
|
| |||||||
| $ | 9,781,835 | |||||||
|
| |||||||
| Natural Gas – Distribution – 0.5% | ||||||||
| AmeriGas Finance LLC, 6.75%, 2020 | $ | 1,510,000 | $ | 1,657,225 | ||||
| Ferrellgas LP/Ferrellgas Finance Corp., 6.5%, 2021 | 890,000 | 881,100 | ||||||
|
| |||||||
| $ | 2,538,325 | |||||||
|
| |||||||
| Natural Gas – Pipeline – 2.8% | ||||||||
| Access Midstream Partners Co., 4.875%, 2023 | $ | 495,000 | $ | 502,425 | ||||
| Atlas Pipeline Partners LP, 8.75%, 2018 | 850,000 | 905,250 | ||||||
| Crosstex Energy, Inc., 8.875%, 2018 | 2,540,000 | 2,743,200 | ||||||
| El Paso Corp., 7%, 2017 | 660,000 | 753,943 | ||||||
| El Paso Corp., 8.05%, 2030 | 1,010,000 | 1,176,529 | ||||||
| El Paso Corp., 7.8%, 2031 | 200,000 | 233,190 | ||||||
| El Paso Corp., 7.75%, 2032 | 1,040,000 | 1,221,993 | ||||||
| Energy Transfer Equity LP, 7.5%, 2020 | 1,955,000 | 2,258,025 | ||||||
| Enterprise Products Partners LP, 8.375% to 2016, FRN to 2066 | 965,000 | 1,101,306 | ||||||
| Enterprise Products Partners LP, 7.034% to 2018, FRN to 2068 | 287,000 | 328,615 | ||||||
| Inergy Midstream LP, 6%, 2020 (n) | 860,000 | 887,950 | ||||||
| MarkWest Energy Partners LP, 6.75%, 2020 | 100,000 | 109,000 | ||||||
| MarkWest Energy Partners LP, 5.5%, 2023 | 575,000 | 623,875 | ||||||
| Rockies Express Pipeline LLC, 5.625%, 2020 (n) | 828,000 | 813,510 | ||||||
|
| |||||||
| $ | 13,658,811 | |||||||
|
| |||||||
11
Table of Contents
MFS High Yield Portfolio
Portfolio of Investments – continued
| Issuer | Shares/Par | Value ($) | ||||||
| BONDS – continued | ||||||||
| Network & Telecom – 1.8% | ||||||||
| Centurylink, Inc., 7.65%, 2042 | $ | 1,605,000 | $ | 1,677,402 | ||||
| Cincinnati Bell, Inc., 8.25%, 2017 | 230,000 | 247,825 | ||||||
| Citizens Communications Co., 9%, 2031 | 485,000 | 533,500 | ||||||
| Eileme 2 AB, 11.625%, 2020 (n) | 1,004,000 | 1,169,660 | ||||||
| Frontier Communications Corp., 7.875%, 2015 | 125,000 | 139,688 | ||||||
| Frontier Communications Corp., 8.25%, 2017 | 200,000 | 231,000 | ||||||
| Frontier Communications Corp., 8.125%, 2018 | 585,000 | 672,750 | ||||||
| Frontier Communications Corp., 7.125%, 2019 | 550,000 | 598,125 | ||||||
| Frontier Communications Corp., 8.5%, 2020 | 250,000 | 287,500 | ||||||
| Qwest Communications International, Inc., 7.125%, 2018 (n) | 1,075,000 | 1,121,658 | ||||||
| TW Telecom Holdings, Inc., 8%, 2018 | 100,000 | 109,500 | ||||||
| TW Telecom Holdings, Inc., 5.375%, 2022 (n) | 260,000 | 272,350 | ||||||
| Windstream Corp., 7.875%, 2017 | 200,000 | 225,000 | ||||||
| Windstream Corp., 8.125%, 2018 | 150,000 | 163,875 | ||||||
| Windstream Corp., 7.75%, 2020 | 490,000 | 529,200 | ||||||
| Windstream Corp., 7.75%, 2021 | 500,000 | 540,000 | ||||||
|
| |||||||
| $ | 8,519,033 | |||||||
|
| |||||||
| Oil Services – 1.4% | ||||||||
| Bristow Group, Inc., 6.25%, 2022 | $ | 755,000 | $ | 807,850 | ||||
| Chesapeake Energy Corp., 6.625%, 2019 (n) | 230,000 | 216,775 | ||||||
| Dresser-Rand Group, Inc., 6.5%, 2021 | 500,000 | �� | 530,000 | |||||
| Edgen Murray Corp., 8.75%, 2020 (n) | 1,530,000 | 1,545,300 | ||||||
| Pioneer Energy Services Corp., 9.875%, 2018 | 445,000 | 483,938 | ||||||
| Shale-Inland Holdings LLC/Finance Co., 8.75%, 2019 (n) | 1,160,000 | 1,215,100 | ||||||
| Unit Corp., 6.625%, 2021 (n) | 295,000 | 302,744 | ||||||
| Unit Corp., 6.625%, 2021 | 1,450,000 | 1,488,063 | ||||||
|
| |||||||
| $ | 6,589,770 | |||||||
|
| |||||||
| Other Banks & Diversified Financials – 1.5% | ||||||||
| Groupe BPCE S.A., 12.5% to 2019, FRN to 2049 (n) | $ | 1,045,000 | $ | 1,211,082 | ||||
| LBG Capital No. 1 PLC, 7.875%, 2020 (n) | 2,235,000 | 2,404,404 | ||||||
| Santander UK PLC, 8.963% to 2030, FRN to 2049 | 2,749,000 | 3,116,679 | ||||||
| UBS AG, 7.625%, 2022 | 300,000 | 331,361 | ||||||
|
| |||||||
| $ | 7,063,526 | |||||||
|
| |||||||
| Pharmaceuticals – 0.8% | ||||||||
| Capsugel FinanceCo. SCA, 9.875%, 2019 (n) | EUR | 375,000 | $ | 556,854 | ||||
| Mylan Laboratories, Inc., 7.625%, 2017 (n) | $ | 200,000 | 224,774 | |||||
| Mylan Laboratories, Inc., 7.875%, 2020 | 500,000 | 590,881 | ||||||
| Valeant Pharmaceuticals International, Inc., 6.5%, 2016 (n) | 250,000 | 262,813 | ||||||
| Issuer | Shares/Par | Value ($) | ||||||
| BONDS – continued | ||||||||
| Pharmaceuticals – continued | ||||||||
| Valeant Pharmaceuticals International, Inc., 6.75%, 2017 (n) | $ | 100,000 | $ | 108,000 | ||||
| Valeant Pharmaceuticals International, Inc., 7%, 2020 (n) | 1,115,000 | 1,212,563 | ||||||
| Valeant Pharmaceuticals International, Inc., 7.25%, 2022 (n) | 615,000 | 671,888 | ||||||
|
| |||||||
| $ | 3,627,773 | |||||||
|
| |||||||
| Pollution Control – 0.2% | ||||||||
| Heckmann Corp., 9.875%, 2018 | $ | 970,000 | $ | 1,001,525 | ||||
| Heckmann Corp., 9.875%, 2018 | 150,000 | 153,750 | ||||||
|
| |||||||
| $ | 1,155,275 | |||||||
|
| |||||||
| Precious Metals & Minerals – 0.4% | ||||||||
| Eldorado Gold Corp., 6.125%, 2020 (z) | $ | 805,000 | $ | 819,088 | ||||
| IAMGOLD Corp., 6.75%, 2020 (n) | 972,000 | 947,700 | ||||||
|
| |||||||
| $ | 1,766,788 | |||||||
|
| |||||||
| Printing & Publishing – 0.4% | ||||||||
| American Media, Inc., 13.5%, 2018 (z) | $ | 100,346 | $ | 88,304 | ||||
| Nielsen Finance LLC, 7.75%, 2018 | 1,005,000 | 1,123,088 | ||||||
| Nielsen Finance LLC, 4.5%, 2020 (n) | 560,000 | 557,200 | ||||||
|
| |||||||
| $ | 1,768,592 | |||||||
|
| |||||||
| Railroad & Shipping – 0.1% | ||||||||
| Kansas City Southern de Mexico S.A. de C.V., 6.125%, 2021 | $ | 310,000 | $ | 350,300 | ||||
|
| |||||||
| Real Estate – 1.1% | ||||||||
| CB Richard Ellis Group, Inc., 11.625%, 2017 | $ | 290,000 | $ | 319,000 | ||||
| CNL Lifestyle Properties, Inc., REIT, 7.25%, 2019 | 325,000 | 310,375 | ||||||
| Entertainment Properties Trust, REIT, 7.75%, 2020 | 755,000 | 872,575 | ||||||
| Entertainment Properties Trust, REIT, 5.75%, 2022 | 1,115,000 | 1,156,151 | ||||||
| Kennedy Wilson, Inc., 8.75%, 2019 | 280,000 | 298,200 | ||||||
| MPT Operating Partnership LP, REIT, 6.875%, 2021 | 1,560,000 | 1,692,600 | �� | |||||
| MPT Operating Partnership LP, REIT, 6.375%, 2022 | 430,000 | 451,500 | ||||||
|
| |||||||
| $ | 5,100,401 | |||||||
|
| |||||||
| Retailers – 2.3% | ||||||||
| Academy Ltd., 9.25%, 2019 (n) | $ | 330,000 | $ | 366,300 | ||||
| Burlington Coat Factory Warehouse Corp., 10%, 2019 | 1,405,000 | 1,517,400 | ||||||
| J. Crew Group, Inc., 8.125%, 2019 | 1,305,000 | 1,380,038 | ||||||
| Limited Brands, Inc., 6.9%, 2017 | 1,550,000 | 1,778,625 | ||||||
| Limited Brands, Inc., 7%, 2020 | 280,000 | 322,000 | ||||||
| Limited Brands, Inc., 6.625%, 2021 | 175,000 | 200,375 | ||||||
| Limited Brands, Inc., 6.95%, 2033 | 320,000 | 325,600 | ||||||
| Pantry, Inc., 8.375%, 2020 (n) | 265,000 | 276,925 | ||||||
| Rite Aid Corp., 9.25%, 2020 | 930,000 | 990,450 | ||||||
| Sally Beauty Holdings, Inc., 6.875%, 2019 | 415,000 | 458,575 | ||||||
| Sally Beauty Holdings, Inc., 5.75%, 2022 | 150,000 | 162,750 | ||||||
| Toys “R” Us Property Co. II LLC, 8.5%, 2017 | 249,000 | 263,940 | ||||||
12
Table of Contents
MFS High Yield Portfolio
Portfolio of Investments – continued
| Issuer | Shares/Par | Value ($) | ||||||
| BONDS – continued | ||||||||
| Retailers – continued | ||||||||
| Toys “R” Us, Inc., 10.75%, 2017 | $ | 2,550,000 | $ | 2,747,625 | ||||
| Yankee Acquisition Corp., 8.5%, 2015 | 5,000 | 5,025 | ||||||
| YCC Holdings LLC/Yankee Finance, Inc., 10.25%, 2016 (p) | 320,000 | 330,432 | ||||||
|
| |||||||
| $ | 11,126,060 | |||||||
|
| |||||||
| Specialty Chemicals – 0.1% | ||||||||
| Koppers, Inc., 7.875%, 2019 | $ | 295,000 | $ | 324,500 | ||||
|
| |||||||
| Specialty Stores – 0.4% | ||||||||
| Gymboree Corp., 9.125%, 2018 | $ | 520,000 | $ | 462,800 | ||||
| Michaels Stores, Inc., 11.375%, 2016 | 325,000 | 339,625 | ||||||
| Michaels Stores, Inc., 7.75%, 2018 | 855,000 | 938,363 | ||||||
|
| |||||||
| $ | 1,740,788 | |||||||
|
| |||||||
| Supermarkets – 0.0% | ||||||||
| SUPERVALU, Inc., 7.5%, 2014 | $ | 120,000 | $ | 116,400 | ||||
|
| |||||||
| Telecommunications – Wireless – 4.1% | ||||||||
| Clearwire Corp., 12%, 2015 (n) | $ | 1,340,000 | $ | 1,440,500 | ||||
| Cricket Communications, Inc., 7.75%, 2016 | 95,000 | 100,581 | ||||||
| Cricket Communications, Inc., 7.75%, 2020 | 1,545,000 | 1,575,900 | ||||||
| Crown Castle International Corp., 7.125%, 2019 | 1,950,000 | 2,154,750 | ||||||
| Crown Castle International Corp., 5.25%, 2023 (n) | 670,000 | 716,900 | ||||||
| Digicel Group Ltd., 12%, 2014 (n) | 140,000 | 152,250 | ||||||
| Digicel Group Ltd., 8.25%, 2017 (n) | 1,895,000 | 2,027,650 | ||||||
| Digicel Group Ltd., 10.5%, 2018 (n) | 280,000 | 308,000 | ||||||
| Digicel Group Ltd., 8.25%, 2020 (n) | 250,000 | 275,000 | ||||||
| MetroPCS Wireless, Inc., 7.875%, 2018 | 1,000,000 | 1,082,500 | ||||||
| MetroPCS Wireless, Inc., 6.625%, 2020 | 250,000 | 265,625 | ||||||
| Sprint Capital Corp., 6.9%, 2019 | 1,500,000 | 1,635,000 | ||||||
| Sprint Capital Corp., 6.875%, 2028 | 665,000 | 691,600 | ||||||
| Sprint Nextel Corp., 6%, 2016 | 745,000 | 810,188 | ||||||
| Sprint Nextel Corp., 8.375%, 2017 | 1,175,000 | 1,365,938 | ||||||
| Sprint Nextel Corp., 9%, 2018 (n) | 310,000 | 382,850 | ||||||
| Sprint Nextel Corp., 6%, 2022 | 1,215,000 | 1,248,413 | ||||||
| Sprint Nextel Corp., 8.75%, 2032 | 500,000 | 611,250 | ||||||
| Wind Acquisition Finance S.A., 11.75%, 2017 (n) | 1,605,000 | 1,681,238 | ||||||
| Wind Acquisition Finance S.A., 7.25%, 2018 (n) | 1,355,000 | 1,371,938 | ||||||
|
| |||||||
| $ | 19,898,071 | |||||||
|
| |||||||
| Telephone Services – 0.5% | ||||||||
| Cogent Communications Group, Inc., 8.375%, 2018 (n) | $ | 320,000 | $ | 351,200 | ||||
| Level 3 Financing, Inc., 9.375%, 2019 | 1,385,000 | 1,547,738 | ||||||
| Level 3 Financing, Inc., 7%, 2020 (n) | 160,000 | 167,200 | ||||||
| Level 3 Financing, Inc., 8.625%, 2020 | 295,000 | 327,450 | ||||||
| Sable International Finance Ltd., 8.75%, 2020 (n) | 200,000 | 229,000 | ||||||
|
| |||||||
| $ | 2,622,588 | |||||||
|
| |||||||
| Issuer | Shares/Par | Value ($) | ||||||
| BONDS – continued | ||||||||
| Transportation – 0.1% | ||||||||
| Navios South American Logistics, Inc., 9.25%, 2019 | $ | 547,000 | $ | 536,744 | ||||
|
| |||||||
| Transportation – Services – 3.1% | ||||||||
| ACL I Corp., 10.625%, 2016 (p) | $ | 788,194 | $ | 761,458 | ||||
| Aguila American Resources Ltd., 7.875%, 2018 (n) | 1,065,000 | 1,128,900 | ||||||
| Avis Budget Car Rental LLC, 8.25%, 2019 | 1,430,000 | 1,580,150 | ||||||
| Avis Budget Car Rental LLC, 9.75%, 2020 | 260,000 | 300,300 | ||||||
| CEVA Group PLC, 8.375%, 2017 (n) | 1,835,000 | 1,807,475 | ||||||
| Commercial Barge Line Co., 12.5%, 2017 | 2,370,000 | 2,612,925 | ||||||
| HDTFS, Inc., 5.875%, 2020 (n) | 115,000 | 120,175 | ||||||
| Hertz Corp., 6.75%, 2019 | 500,000 | 545,625 | ||||||
| Hertz Corp., 7.375%, 2021 | 250,000 | 275,000 | ||||||
| Navios Maritime Acquisition Corp., 8.625%, 2017 | 1,540,000 | 1,443,750 | ||||||
| Navios Maritime Holdings, Inc., 8.875%, 2017 | 1,655,000 | 1,650,863 | ||||||
| Swift Services Holdings, Inc., 10%, 2018 | 2,280,000 | 2,502,300 | ||||||
|
| |||||||
| $ | 14,728,921 | |||||||
|
| |||||||
| Utilities – Electric Power – 4.7% | ||||||||
| AES Corp., 7.75%, 2015 | $ | 175,000 | $ | 196,438 | ||||
| AES Corp., 9.75%, 2016 | 250,000 | 298,750 | ||||||
| AES Corp., 8%, 2017 | 965,000 | 1,114,575 | ||||||
| AES Corp., 8%, 2020 | 500,000 | 575,000 | ||||||
| AES Corp., 7.375%, 2021 | 300,000 | 333,000 | ||||||
| Atlantic Power Corp., 9%, 2018 | 25,000 | 26,125 | ||||||
| Calpine Corp., 8%, 2016 (n) | 625,000 | 664,063 | ||||||
| Calpine Corp., 7.875%, 2020 (n) | 1,206,000 | 1,353,735 | ||||||
| Calpine Corp., 7.5%, 2021 | 675,000 | 745,875 | ||||||
| Calpine Corp., 7.875%, 2023 | 225,000 | 254,250 | ||||||
| CMS Energy Corp., 8.75%, 2019 | 150,000 | 195,153 | ||||||
| Covanta Holding Corp., 7.25%, 2020 | 1,935,000 | 2,131,977 | ||||||
| Covanta Holding Corp., 6.375%, 2022 | 190,000 | 206,334 | ||||||
| DPL, Inc., 7.25%, 2021 | 285,000 | 304,950 | ||||||
| EDP Finance B.V., 6%, 2018 (n) | 1,440,000 | 1,509,823 | ||||||
| Energy Future Holdings Corp., 9.75%, 2019 | 39,000 | 43,095 | ||||||
| Energy Future Holdings Corp., 10%, 2020 | 1,445,000 | 1,614,788 | ||||||
| Energy Future Holdings Corp., 10%, 2020 | 3,560,000 | 4,013,900 | ||||||
| Energy Future Holdings Corp., 11.75%, 2022 (n) | 665,000 | 738,150 | ||||||
| Energy Future Intermediate Holding Co. LLC, 9.75%, 2019 | 47,000 | 51,935 | ||||||
| GenOn Energy, Inc., 9.875%, 2020 | 1,940,000 | 2,240,700 | ||||||
| NRG Energy, Inc., 7.625%, 2018 | 250,000 | 277,500 | ||||||
| NRG Energy, Inc., 8.5%, 2019 | 1,050,000 | 1,155,000 | ||||||
| NRG Energy, Inc., 8.25%, 2020 | 685,000 | 767,200 | ||||||
| NRG Energy, Inc., 7.875%, 2021 | 150,000 | 166,500 | ||||||
| NRG Energy, Inc., 6.625%, 2023 | 350,000 | 374,500 | ||||||
| Texas Competitive Electric Holdings Co. LLC, 11.5%, 2020 (n) | 1,340,000 | 1,048,550 | ||||||
|
| |||||||
| $ | 22,401,866 | |||||||
|
| |||||||
| Total Bonds (Identified Cost, $430,997,662) | $ | 448,940,385 | ||||||
|
| |||||||
13
Table of Contents
MFS High Yield Portfolio
Portfolio of Investments – continued
| Issuer | Shares/Par | Value ($) | ||||||
| FLOATING RATE LOANS (g)(r) – 0.3% | ||||||||
| Financial Institutions – 0.1% | ||||||||
| Springleaf Financial Funding Co., Term Loan, 5.5%, 2017 | $ | 326,932 | $ | 324,787 | ||||
|
| |||||||
| Specialty Chemicals – 0.2% | ||||||||
| Georgia Gulf Corp., Bridge Term Loan, 2013 (o)(q) | $ | 750,000 | $ | 744,375 | ||||
|
| |||||||
| Utilities – Electric Power – 0.0% | ||||||||
| Dynegy Midwest Generation LLC, Term Loan, 9.25%, 2016 | $ | 75,859 | $ | 78,665 | ||||
| Dynegy Power LLC, Term Loan, 9.25%, 2016 | 100,334 | 104,634 | ||||||
|
| |||||||
| $ | 183,299 | |||||||
|
| |||||||
| Total Floating Rate Loans (Identified Cost, $1,243,798) | $ | 1,252,461 | ||||||
|
| |||||||
| CONVERTIBLE PREFERRED STOCKS – 0.2% | ||||||||
| Automotive – 0.2% | ||||||||
| General Motors Co., 4.75% (Identified Cost, $1,109,973) | 24,070 | $ | 1,062,209 | |||||
|
| |||||||
| PREFERRED STOCKS – 0.2% | ||||||||
| Other Banks & Diversified Financials – 0.2% | ||||||||
| Ally Financial, Inc., 7% (z) | 363 | $ | 356,523 | |||||
| GMAC Capital Trust I, 8.125% | 19,950 | 531,668 | ||||||
|
| |||||||
| Total Preferred Stocks (Identified Cost, $845,303) | $ | 888,191 | ||||||
|
| |||||||
| CONVERTIBLE BONDS – 0.1% | ||||||||
| Network & Telecom – 0.1% | ||||||||
| Nortel Networks Corp., 2.125%, 2014 (Identified Cost, $676,063) (a)(d) | $ | 685,000 | $ | 694,419 | ||||
|
| |||||||
| COMMON STOCKS – 0.1% | ||||||||
| Automotive – 0.0% | ||||||||
| Accuride Corp. (a) | 17,214 | $ | 55,257 | |||||
|
| |||||||
| Broadcasting – 0.1% | ||||||||
| New Young Broadcasting Holding Co., Inc. (a) | 62 | $ | 232,500 | |||||
|
| |||||||
| Pharmaceuticals – 0.0% | ||||||||
| NVHL S.A., “A” (a) | 1,640 | $ | 2,684 | |||||
| NVHL S.A., “B” (a) | 1,640 | 2,684 | ||||||
| Issuer | Shares/Par | Value ($) | ||||||
| COMMON STOCKS – continued | ||||||||
| Pharmaceuticals – continued | ||||||||
| NVHL S.A., “C” (a) | 1,640 | $ | 2,684 | |||||
| NVHL S.A., “D” (a) | 1,640 | 2,684 | ||||||
| NVHL S.A., “E” (a) | 1,640 | 2,684 | ||||||
| NVHL S.A., “F” (a) | 1,640 | 2,684 | ||||||
| NVHL S.A., “G” (a) | 1,640 | 2,684 | ||||||
| NVHL S.A., “H” (a) | 1,640 | 2,684 | ||||||
| NVHL S.A., “I” (a) | 1,640 | 2,684 | ||||||
| NVHL S.A., “J” (a) | 1,640 | 2,684 | ||||||
|
| |||||||
| $ | 26,840 | |||||||
|
| |||||||
| Printing & Publishing – 0.0% | ||||||||
| American Media Operations, Inc. (a) | 25,715 | $ | 122,146 | |||||
|
| |||||||
| Total Common Stocks (Identified Cost, $820,451) | $ | 436,743 | ||||||
|
| |||||||
| Strike Price | First Exercise | |||||||||||||||
| WARRANTS – 0.0% | ||||||||||||||||
| Broadcasting – 0.0% | ||||||||||||||||
| New Young Broadcasting Holding Co., Inc. (1 share for 1 warrant) (Identified Cost, $67,667) (a) | $ | 0.01 | 7/14/10 | 35 | $ | 131,250 | ||||||||||
|
| |||||||||||||||
| Issuer/Expiration Date/ Strike Price | Number of Contracts | |||||||
| CALL OPTIONS PURCHASED – 0.1% | ||||||||
| Market Index Securities – 0.1% | ||||||||
| Russell 2000 Index – March 2013 @ $880 (Premiums Paid, $365,677) | 281 | $ | 375,135 | |||||
|
| |||||||
| Issuer | Shares/Par | |||||||
| MONEY MARKET FUNDS – 2.8% | ||||||||
| MFS Institutional Money Market Portfolio, 0.16%, at Cost and Net Asset Value (v) | 13,317,185 | $ | 13,317,185 | |||||
|
| |||||||
| Total Investments (Identified Cost, $449,443,779) | $ | 467,097,978 | ||||||
|
| |||||||
| OTHER ASSETS, LESS LIABILITIES – 2.6% | 12,227,287 | |||||||
|
| |||||||
| Net Assets – 100.0% | $ | 479,325,265 | ||||||
|
| |||||||
| (a) | Non-income producing security. |
| (d) | In default. Interest and/or scheduled principal payment(s) have been missed. |
| (g) | The rate shown represents a weighted average coupon rate on settled positions at period end, unless otherwise indicated. |
| (n) | Securities exempt from registration under Rule 144A of the Securities Act of 1933. These securities may be sold in the ordinary course of business in transactions exempt from registration, normally to qualified institutional buyers. At period end, the aggregate value of these securities was $110,172,368, representing 23.0% of net assets. |
| (o) | All or a portion of this position has not settled. Upon settlement date, interest rates for unsettled amounts will be determined. The rate shown represents the weighted average coupon rate for settled amounts. |
| (p) | Payment-in-kind security. |
| (q) | All or a portion of this position represents an unfunded loan commitment. The rate shown represents a weighted average coupon rate on the full position, including the unfunded loan commitment which has no current coupon rate. |
| (r) | Remaining maturities of floating rate loans may be less than stated maturities shown as a result of contractual or optional prepayments by the borrower. Such prepayments cannot be predicted with certainty. These loans may be subject to restrictions on resale. Floating rate loans generally have rates of interest which are determined periodically by reference to a base lending rate plus a premium. |
| (v) | Underlying affiliated fund that is available only to investment companies managed by MFS. The rate quoted for the MFS Institutional Money Market Portfolio is the annualized seven-day yield of the fund at period end. |
14
Table of Contents
MFS High Yield Portfolio
Portfolio of Investments – continued
| (z) | Restricted securities are not registered under the Securities Act of 1933 and are subject to legal restrictions on resale. These securities generally may be resold in transactions exempt from registration or to the public if the securities are subsequently registered. Disposal of these securities may involve time-consuming negotiations and prompt sale at an acceptable price may be difficult. The fund holds the following restricted securities: |
| Restricted Securities | Acquisition Date | Cost | Value | |||||||
| Ally Financial, Inc., 7% (Preferred Stock) | 4/13/11-4/14/11 | $340,313 | $356,523 | |||||||
| American Media, Inc., 13.5%, 2018 | 12/22/10 | 101,655 | 88,304 | |||||||
| Arbor Realty Mortgage Securities, CDO, FRN, 2.618%, 2038 | 12/20/05 | 568,229 | 170,469 | |||||||
| Boyd Gaming Corp., 9%, 2020 | 12/19/12-12/21/12 | 509,681 | 502,350 | |||||||
| CDRT Holding Corp., 9.25%, 2017 | 12/12/12-12/13/12 | 314,064 | 311,100 | |||||||
| CWCapital Cobalt Ltd., CDO, 6.23%, 2045 | 3/20/06 | 966,723 | 12,165 | |||||||
| CWCapital Cobalt Ltd., CDO, “F”, FRN, 1.614%, 2050 | 4/12/06 | 526,135 | 1,315 | |||||||
| Cequel Communications Holdings, 6.375%, 2020 | 12/13/12-12/24/12 | 965,808 | 968,363 | |||||||
| Cinemark USA, Inc., 5.125%, 2022 | 12/04/12 | 125,000 | 126,563 | |||||||
| DISH DBS Corp., 5%, 2023 | 12/19/12 | 410,000 | 410,000 | |||||||
| Dematic S.A., 7.75%, 2020 | 12/13/12 | 905,000 | 905,000 | |||||||
| Eldorado Gold Corp., 6.125%, 2020 | 12/10/12-12/12/12 | 813,814 | 819,088 | |||||||
| FMG Resources, 6.875%, 2022 | 3/14/12-3/21/12 | 500,406 | 511,250 | |||||||
| FelCor Lodging LP, 5.625%, 2023 | 12/12/12 | 200,000 | 199,000 | |||||||
| G-Force LLC, CDO, “A2”, 4.83%, 2036 | 1/20/11 | 333,626 | 345,051 | |||||||
| Heckler & Koch GmbH, 9.5%, 2018 | 5/06/11-5/10/11 | 553,606 | 445,285 | |||||||
| IAC/InterActiveCorp, 4.75%, 2022 | 12/18/12 | 200,000 | 199,000 | |||||||
| LBI Media, Inc., 13.5% to 2015, 11.5% to 2020 | 12/26/12 | 223,608 | 197,400 | |||||||
| Local TV Finance LLC, 9.25%, 2015 | 12/10/07-12/06/12 | 1,082,260 | 1,084,248 | |||||||
| Silver II Borrower SCA/Silver II US Holdings, 7.75%, 2020 | 12/05/12-12/17/12 | 531,373 | 533,025 | |||||||
| Six Flags Entertainment Corp., 5.25%, 2021 | 12/11/12 | 1,010,000 | 1,010,000 | |||||||
| Spectrum Brands Escrow Corp., 6.625%, 2022 | 11/01/12 | 50,000 | 53,625 | |||||||
| Townsquare Radio LLC, 9%, 2019 | 3/30/12 | 282,376 | 312,788 | |||||||
| UPC Holding B.V., 6.375%, 2022 | 9/26/12 | 309,798 | 336,587 | |||||||
| Total Restricted Securities | $9,898,499 | |||||||||
| % of Net assets | 2.1% | |||||||||
The following abbreviations are used in this report and are defined:
| CDO | Collateralized Debt Obligation |
| FRN | Floating Rate Note. Interest rate resets periodically and may not be the rate reported at period end. |
| PLC | Public Limited Company |
| REIT | Real Estate Investment Trust |
Abbreviations indicate amounts shown in currencies other than the U.S. dollar. All amounts are stated in U.S. dollars unless otherwise indicated. A list of abbreviations is shown below:
| EUR | Euro |
15
Table of Contents
MFS High Yield Portfolio
Portfolio of Investments – continued
Derivative Contracts at 12/31/12
Forward Foreign Currency Exchange Contracts at 12/31/12
| Type | Currency | Counterparty | Contracts to Deliver/Receive | Settlement Date Range | In Exchange For | Contracts at Value | Net Unrealized Appreciation (Depreciation) | |||||||||||||
| Liability Derivatives | ||||||||||||||||||||
| SELL | EUR | Deutsche Bank AG | 1,030,752 | 1/11/13 | $ | 1,328,157 | $ | 1,360,635 | $ | (32,478 | ) | |||||||||
| SELL | EUR | UBS AG | 1,030,752 | 1/11/13 | 1,328,475 | 1,360,635 | (32,160 | ) | ||||||||||||
|
| |||||||||||||||||||
| $ | (64,638 | ) | ||||||||||||||||||
|
| |||||||||||||||||||
See Notes to Financial Statements
16
Table of Contents
MFS High Yield Portfolio
FINANCIAL STATEMENTS | STATEMENT OF ASSETS AND LIABILITIES
This statement represents your fund’s balance sheet, which details the assets and liabilities comprising the total value of the fund.
At 12/31/12 | ||||||||
Assets | ||||||||
Investments – | ||||||||
Non-affiliated issuers, at value (identified cost, $436,126,594) | $453,780,793 | |||||||
Underlying affiliated funds, at cost and value | 13,317,185 | |||||||
Total investments, at value (identified cost, $449,443,779) | $467,097,978 | |||||||
Cash | 3,286,992 | |||||||
Foreign currency, at value (identified cost, $442) | 391 | |||||||
Receivables for | ||||||||
Investments sold | 3,677,902 | |||||||
Interest | 8,208,288 | |||||||
Receivable from investment adviser | 6,872 | |||||||
Other assets | 5,155 | |||||||
Total assets | $482,283,578 | |||||||
Liabilities | ||||||||
Payables for | ||||||||
Forward foreign currency exchange contracts | $64,638 | |||||||
Investments purchased | 2,351,630 | |||||||
Fund shares reacquired | 461,387 | |||||||
Payable to affiliates for distribution and/or service fees | 3,020 | |||||||
Payable for independent Trustees’ compensation | 96 | |||||||
Accrued expenses and other liabilities | 77,542 | |||||||
Total liabilities | $2,958,313 | |||||||
Net assets | $479,325,265 | |||||||
Net assets consist of | ||||||||
Paid-in capital | $493,620,396 | |||||||
Unrealized appreciation (depreciation) on investments and translation of assets and liabilities in foreign currencies | 17,587,864 | |||||||
Accumulated net realized gain (loss) on investments and foreign currency | (48,852,263 | ) | ||||||
Undistributed net investment income | 16,969,268 | |||||||
Net assets | $479,325,265 | |||||||
Shares of beneficial interest outstanding | 79,471,033 |
| Net assets | Shares outstanding | Net asset value per share | ||||||||||
Initial Class | $368,899,060 | 61,021,533 | $6.05 | |||||||||
Service Class | 110,426,205 | 18,449,500 | 5.99 | |||||||||
See Notes to Financial Statements
17
Table of Contents
MFS High Yield Portfolio
FINANCIAL STATEMENTS | STATEMENT OF OPERATIONS
This statement describes how much your fund earned in investment income and accrued in expenses. It also describes any gains and/or losses generated by fund operations.
Year ended 12/31/12 | ||||||||
Net investment income | ||||||||
Income | ||||||||
Interest | $18,255,264 | |||||||
Dividends | 154,346 | |||||||
Dividends from underlying affiliated funds | 9,176 | |||||||
Total investment income | $18,418,786 | |||||||
Expenses | ||||||||
Management fee | $1,727,138 | |||||||
Distribution and/or service fees | 207,157 | |||||||
Administrative services fee | 45,233 | |||||||
Independent Trustees’ compensation | 11,706 | |||||||
Custodian fee | 28,085 | |||||||
Shareholder communications | 28,964 | |||||||
Audit and tax fees | 68,698 | |||||||
Legal fees | 43,939 | |||||||
Miscellaneous | 47,695 | |||||||
Total expenses | $2,208,615 | |||||||
Fees paid indirectly | (139 | ) | ||||||
Reduction of expenses by investment adviser | (45,159 | ) | ||||||
Net expenses | $2,163,317 | |||||||
Net investment income | $16,255,469 | |||||||
Realized and unrealized gain (loss) on investments and foreign currency | ||||||||
Realized gain (loss) (identified cost basis) | ||||||||
Investments | $968,338 | |||||||
Foreign currency | 131,415 | |||||||
Net realized gain (loss) on investments and foreign currency | $1,099,753 | |||||||
Change in unrealized appreciation (depreciation) | ||||||||
Investments | $15,694,922 | |||||||
Translation of assets and liabilities in foreign currencies | (177,487 | ) | ||||||
Net unrealized gain (loss) on investments and foreign currency translation | $15,517,435 | |||||||
Net realized and unrealized gain (loss) on investments and foreign currency | $16,617,188 | |||||||
Change in net assets from operations | $32,872,657 |
See Notes to Financial Statements
18
Table of Contents
MFS High Yield Portfolio
FINANCIAL STATEMENTS | STATEMENTS OF CHANGES IN NET ASSETS
These statements describe the increases and/or decreases in net assets resulting from operations, any distributions, and any shareholder transactions.
For years ended 12/31 | 2012 | 2011 | ||||||
Change in net assets | ||||||||
From operations | ||||||||
Net investment income | $16,255,469 | $14,433,915 | ||||||
Net realized gain (loss) on investments and foreign currency | 1,099,753 | (29,817 | ) | |||||
Net unrealized gain (loss) on investments and foreign currency translation | 15,517,435 | (5,240,877 | ) | |||||
Change in net assets from operations | $32,872,657 | $9,163,221 | ||||||
Distributions declared to shareholders | ||||||||
From net investment income | $(15,115,079 | ) | $(17,370,717 | ) | ||||
Change in net assets from fund share transactions | $232,394,674 | $13,526,079 | ||||||
Total change in net assets | $250,152,252 | $5,318,583 | ||||||
Net assets | ||||||||
At beginning of period | 229,173,013 | 223,854,430 | ||||||
At end of period (including undistributed net investment income of $16,969,268 and | $479,325,265 | $229,173,013 |
See Notes to Financial Statements
19
Table of Contents
MFS High Yield Portfolio
FINANCIAL STATEMENTS | FINANCIAL HIGHLIGHTS
The financial highlights table is intended to help you understand the fund’s financial performance for the past 5 years. Certain information reflects financial results for a single fund share. The total returns in the table represent the rate by which an investor would have earned (or lost) on an investment in the fund share class (assuming reinvestment of all distributions) held for the entire period.
| Initial Class | Years ended 12/31 | |||||||||||||||||||
| 2012 | 2011 | 2010 | 2009 | 2008 | ||||||||||||||||
Net asset value, beginning of period | $5.64 | $5.96 | $5.67 | $4.25 | $6.56 | |||||||||||||||
| Income (loss) from investment operations | ||||||||||||||||||||
Net investment income (d) | $0.40 | $0.41 | $0.42 | $0.44 | $0.49 | |||||||||||||||
Net realized and unrealized gain (loss) on investments | 0.42 | (0.18 | ) | 0.42 | 1.49 | (2.26 | ) | |||||||||||||
Total from investment operations | $0.82 | $0.23 | $0.84 | $1.93 | $(1.77 | ) | ||||||||||||||
| Less distributions declared to shareholders | ||||||||||||||||||||
From net investment income | $(0.41 | ) | $(0.55 | ) | $(0.55 | ) | $(0.51 | ) | $(0.54 | ) | ||||||||||
Net asset value, end of period (x) | $6.05 | $5.64 | $5.96 | $5.67 | $4.25 | |||||||||||||||
Total return (%) (k)(r)(s)(x) | 14.91 | 4.13 | 15.53 | 50.00 | (29.50 | ) | ||||||||||||||
| Ratios (%) (to average net assets) and Supplemental data: | ||||||||||||||||||||
Expenses before expense reductions (f) | 0.81 | 0.86 | 0.88 | 0.87 | 0.89 | |||||||||||||||
Expenses after expense reductions (f) | 0.79 | 0.81 | 0.83 | 0.82 | 0.84 | |||||||||||||||
Net investment income | 6.65 | 6.97 | 7.42 | 9.21 | 8.60 | |||||||||||||||
Portfolio turnover | 48 | 57 | 62 | 58 | 63 | |||||||||||||||
Net assets at end of period (000 omitted) | $368,899 | $145,773 | $122,666 | $121,416 | $96,605 | |||||||||||||||
| Service Class | Years ended 12/31 | |||||||||||||||||||
| 2012 | 2011 | 2010 | 2009 | 2008 | ||||||||||||||||
Net asset value, beginning of period | $5.59 | $5.91 | $5.63 | $4.21 | $6.50 | |||||||||||||||
| Income (loss) from investment operations | ||||||||||||||||||||
Net investment income (d) | $0.38 | $0.40 | $0.41 | $0.43 | $0.47 | |||||||||||||||
Net realized and unrealized gain (loss) on investments | 0.41 | (0.19 | ) | 0.40 | 1.49 | (2.24 | ) | |||||||||||||
Total from investment operations | $0.79 | $0.21 | $0.81 | $1.92 | $(1.77 | ) | ||||||||||||||
| Less distributions declared to shareholders | ||||||||||||||||||||
From net investment income | $(0.39 | ) | $(0.53 | ) | $(0.53 | ) | $(0.50 | ) | $(0.52 | ) | ||||||||||
Net asset value, end of period (x) | $5.99 | $5.59 | $5.91 | $5.63 | $4.21 | |||||||||||||||
Total return (%) (k)(r)(s)(x) | 14.54 | 3.86 | 15.17 | 49.97 | (29.64 | ) | ||||||||||||||
| Ratios (%) (to average net assets) and Supplemental data: | ||||||||||||||||||||
Expenses before expense reductions (f) | 1.06 | 1.11 | 1.13 | 1.12 | 1.14 | |||||||||||||||
Expenses after expense reductions (f) | 1.04 | 1.06 | 1.08 | 1.07 | 1.09 | |||||||||||||||
Net investment income | 6.46 | 6.73 | 7.18 | 9.01 | 8.38 | |||||||||||||||
Portfolio turnover | 48 | 57 | 62 | 58 | 63 | |||||||||||||||
Net assets at end of period (000 omitted) | $110,426 | $83,400 | $101,189 | $108,217 | $103,169 | |||||||||||||||
| (d) | Per share data is based on average shares outstanding. |
| (f) | Ratios do not reflect reductions from fees paid indirectly, if applicable. |
| (k) | The total return does not reflect expenses that apply to separate accounts. Inclusion of these charges would reduce the total return figures for all periods shown. |
| (r) | Certain expenses have been reduced without which performance would have been lower. |
| (s) | From time to time the fund may receive proceeds from litigation settlements, without which performance would be lower. |
| (x) | The net asset values per share and total returns have been calculated on net assets which include adjustments made in accordance with U.S. generally accepted accounting principles required at period end for financial reporting purposes. |
See Notes to Financial Statements
20
Table of Contents
MFS High Yield Portfolio
| (1) | Business and Organization |
MFS High Yield Portfolio (the fund) is a series of MFS Variable Insurance Trust II (the trust). The trust is organized as a Massachusetts business trust and is registered under the Investment Company Act of 1940, as amended, as an open-end management investment company. The shareholders of each series of the trust are separate accounts of insurance companies, which offer variable annuity and/or life insurance products, and qualified retirement and pension plans.
| (2) | Significant Accounting Policies |
General – The preparation of financial statements in conformity with U.S. generally accepted accounting principles requires management to make estimates and assumptions that affect the reported amounts of assets and liabilities, and disclosure of contingent assets and liabilities at the date of the financial statements and the reported amounts of revenues and expenses during the reporting period. Actual results could differ from those estimates. In the preparation of these financial statements, management has evaluated subsequent events occurring after the date of the fund’s Statement of Assets and Liabilities through the date that the financial statements were issued. The fund invests in high-yield securities rated below investment grade. Investments in high-yield securities involve greater degrees of credit and market risk than investments in higher-rated securities and tend to be more sensitive to economic conditions. The fund invests in foreign securities. Investments in foreign securities are vulnerable to the effects of changes in the relative values of the local currency and the U.S. dollar and to the effects of changes in each country’s legal, political, and economic environment.
In this reporting period the fund adopted Financial Accounting Standards Board (FASB) Accounting Standards Update 2011-04, Fair Value Measurement (Topic 820) – Amendments to Achieve Common Fair Value Measurement and Disclosure Requirements in U.S. GAAP and IFRSs (“ASU 2011-04”). ASU 2011-04 seeks to improve the comparability of fair value measurements as presented and disclosed in financial statements prepared in accordance with U.S. GAAP and International Financial Reporting Standards (IFRS) by providing common requirements for fair value measurement and disclosure.
In December 2011, the FASB issued Accounting Standards Update 2011-11, Balance Sheet (Topic 210) – Disclosures about Offsetting Assets and Liabilities (“ASU 2011-11”). Effective for annual reporting periods beginning on or after January 1, 2013 and interim periods within those annual periods, ASU 2011-11 is intended to enhance disclosure requirements on the offsetting of financial assets and liabilities. Although still evaluating the potential impacts of ASU 2011-11 to the fund, management expects that the impact of the fund’s adoption will be limited to additional financial statement disclosures.
Investment Valuations – Debt instruments and floating rate loans (other than short-term instruments), including restricted debt instruments, are generally valued at an evaluated or composite bid as provided by a third-party pricing service. Equity securities, including restricted equity securities, are generally valued at the last sale or official closing price as provided by a third-party pricing service on the market or exchange on which they are primarily traded. Equity securities, for which there were no sales reported that day, are generally valued at the last quoted daily bid quotation as provided by a third-party pricing service on the market or exchange on which such securities are primarily traded. Short-term instruments with a maturity at issuance of 60 days or less generally are valued at amortized cost, which approximates market value. Exchange-traded options are generally valued at the last sale or official closing price as provided by a third-party pricing service on the exchange on which such options are primarily traded. Exchange-traded options for which there were no sales reported that day are generally valued at the last daily bid quotation as provided by a third-party pricing service on the exchange on which such options are primarily traded. Options not traded on an exchange are generally valued at a broker/dealer bid quotation. Foreign currency options are generally valued at valuations provided by a third-party pricing service. Forward foreign currency exchange contracts are generally valued at the mean of bid and asked prices for the time period interpolated from rates provided by a third-party pricing service for proximate time periods. Open-end investment companies are generally valued at net asset value per share. Securities and other assets generally valued on the basis of information from a third-party pricing service may also be valued at a broker/dealer bid quotation. Values obtained from third-party pricing services can utilize both transaction data and market information such as yield, quality, coupon rate, maturity, type of issue, trading characteristics, and other market data. The values of foreign securities and other assets and liabilities expressed in foreign currencies are converted to U.S. dollars using the mean of bid and asked prices for rates provided by a third-party pricing service.
The Board of Trustees has delegated primary responsibility for determining or causing to be determined the value of the fund’s investments (including any fair valuation) to the adviser pursuant to valuation policies and procedures approved by the Board. If the adviser determines that reliable market quotations are not readily available, investments are valued at fair value as determined in good faith by the adviser in accordance with such procedures under the oversight of the Board of Trustees. Under the fund’s valuation policies and procedures, market quotations are not considered to be readily available for most types of debt instruments and floating rate loans and many types of derivatives. These investments are generally valued at fair value based on information from third-party pricing services. In addition, investments may be valued at fair value if the adviser determines that an investment’s value has been materially affected by events occurring after the close of the exchange or market on which the investment is principally traded (such as foreign exchange or market) and prior to the determination of the fund’s net asset value, or after the halting of
21
Table of Contents
MFS High Yield Portfolio
Notes to Financial Statements – continued
trading of a specific security where trading does not resume prior to the close of the exchange or market on which the security is principally traded. The adviser generally relies on third-party pricing services or other information (such as the correlation with price movements of similar securities in the same or other markets; the type, cost and investment characteristics of the security; the business and financial condition of the issuer; and trading and other market data) to assist in determining whether to fair value and at what value to fair value an investment. The value of an investment for purposes of calculating the fund’s net asset value can differ depending on the source and method used to determine value. When fair valuation is used, the value of an investment used to determine the fund’s net asset value may differ from quoted or published prices for the same investment. There can be no assurance that the fund could obtain the fair value assigned to an investment if it were to sell the investment at the same time at which the fund determines its net asset value per share.
Various inputs are used in determining the value of the fund’s assets or liabilities. These inputs are categorized into three broad levels. In certain cases, the inputs used to measure fair value may fall into different levels of the fair value hierarchy. In such cases, an investment’s level within the fair value hierarchy is based on the lowest level of input that is significant to the fair value measurement. The fund’s assessment of the significance of a particular input to the fair value measurement in its entirety requires judgment, and considers factors specific to the investment. Level 1 includes unadjusted quoted prices in active markets for identical assets or liabilities. Level 2 includes other significant observable market-based inputs (including quoted prices for similar securities, interest rates, prepayment speed, and credit risk). Level 3 includes unobservable inputs, which may include the adviser’s own assumptions in determining the fair value of investments. Other financial instruments are derivative instruments not reflected in total investments, such as forward foreign currency exchange contracts. The following is a summary of the levels used as of December 31, 2012 in valuing the fund’s assets or liabilities:
| Investments at Value | Level 1 | Level 2 | Level 3 | Total | ||||||||||||
| Equity Securities | $2,024,269 | $720,273 | $148,986 | $2,893,528 | ||||||||||||
| U.S. Corporate Bonds | — | 374,593,200 | — | 374,593,200 | ||||||||||||
| Commercial Mortgage-Backed Securities | — | 821,818 | — | 821,818 | ||||||||||||
| Asset-Backed Securities (including CDOs) | — | 538,159 | — | 538,159 | ||||||||||||
| Foreign Bonds | — | 73,681,627 | — | �� | 73,681,627 | |||||||||||
| Floating Rate Loans | — | 1,252,461 | — | 1,252,461 | ||||||||||||
| Mutual Funds | 13,317,185 | — | — | 13,317,185 | ||||||||||||
| Total Investments | $15,341,454 | $451,607,538 | $148,986 | $467,097,978 | ||||||||||||
| Other Financial Instruments | ||||||||||||||||
| Forward Foreign Currency Exchange Contracts | $— | $(64,638 | ) | $— | $(64,638 | ) | ||||||||||
For further information regarding security characteristics, see the Portfolio of Investments.
The following is a reconciliation of level 3 assets for which significant unobservable inputs were used to determine fair value. The fund’s policy is to recognize transfers between the levels as of the end of the period. The table presents the activity of level 3 securities held at the beginning and the end of the period.
| Equity Securities | ||||
| Balance as of 12/31/11 | $305,751 | |||
Change in unrealized appreciation (depreciation) | (183,605 | ) | ||
Acquired in merger | 26,840 | |||
| Balance as of 12/31/12 | $148,986 | |||
The net change in unrealized appreciation (depreciation) from investments still held as level 3 at December 31, 2012 is $(183,605).
Foreign Currency Translation – Purchases and sales of foreign investments, income, and expenses are converted into U.S. dollars based upon currency exchange rates prevailing on the respective dates of such transactions or on the reporting date for foreign denominated receivables and payables. Gains and losses attributable to foreign currency exchange rates on sales of securities are recorded for financial statement purposes as net realized gains and losses on investments. Gains and losses attributable to foreign exchange rate movements on receivables, payables, income and expenses are recorded for financial statement purposes as foreign currency transaction gains and losses. That portion of both realized and unrealized gains and losses on investments that results from fluctuations in foreign currency exchange rates is not separately disclosed.
Derivatives – The fund uses derivatives for different purposes, primarily to increase or decrease exposure to a particular market or segment of the market, or security, to increase or decrease interest rate or currency exposure, or as alternatives to direct investments. Derivatives are used for hedging or non-hedging purposes. While hedging can reduce or eliminate losses, it can also reduce or eliminate gains. When the fund uses derivatives as an investment to increase market exposure, or for hedging purposes, gains and losses from derivative instruments may be substantially greater than the derivative’s original cost.
22
Table of Contents
MFS High Yield Portfolio
Notes to Financial Statements – continued
The derivative instruments used by the fund were purchased options and forward foreign currency exchange contracts. The fund’s period end derivatives, as presented in the Portfolio of Investments and the associated Derivative Contract tables, generally are indicative of the volume of its derivative activity during the period.
The following table presents, by major type of derivative contract, the fair value, on a gross basis, of the asset and liability components of derivatives held by the fund at December 31, 2012 as reported in the Statement of Assets and Liabilities:
| Fair Value (a) | ||||||||||
| Risk | Derivative Contracts | Asset Derivatives | Liability Derivatives | |||||||
| Foreign Exchange | Forward Foreign Currency Exchange | $— | $(64,638 | ) | ||||||
| Equity | Purchased Equity Options | 375,135 | — | |||||||
| Total | $375,135 | $(64,638 | ) | |||||||
| (a) | The value of purchased options outstanding is included in total investments, at value, within the fund’s Statement of Assets and Liabilities. |
The following table presents, by major type of derivative contract, the realized gain (loss) on derivatives held by the fund for the year ended December 31, 2012 as reported in the Statement of Operations:
| Risk | Foreign Currency | Investments (Purchased Options) | ||||||
| Foreign Exchange | $136,477 | $— | ||||||
| Equity | — | (51,908 | ) | |||||
| Total | $136,477 | $(51,908 | ) | |||||
The following table presents, by major type of derivative contract, the change in unrealized appreciation (depreciation) on derivatives held by the fund for the year ended December 31, 2012 as reported in the Statement of Operations:
| Risk | Translation of Liabilities in Foreign Currencies | Investments (Purchased Options) | ||||||
| Foreign Exchange | $(177,781 | ) | $— | |||||
| Equity | — | 104,558 | ||||||
| Total | $(177,781 | ) | $104,558 | |||||
Derivative counterparty credit risk is managed through formal evaluation of the creditworthiness of all potential counterparties. On certain over-the-counter derivatives, the fund attempts to reduce its exposure to counterparty credit risk whenever possible by entering into an International Swaps and Derivatives Association (ISDA) Master Agreement on a bilateral basis with each of the counterparties with whom it undertakes a significant volume of transactions. The ISDA Master Agreement gives each party to the agreement the right to terminate all transactions traded under such agreement if there is a certain deterioration in the credit quality of the other party. The ISDA Master Agreement gives the fund the right, upon an event of default by the applicable counterparty or a termination of the agreement, to close out all transactions traded under such agreement and to net amounts owed under each transaction to one net amount payable by one party to the other. This right to close out and net payments across all transactions traded under the ISDA Master Agreement could result in a reduction of the fund’s credit risk to such counterparty equal to any amounts payable by the fund under the applicable transactions, if any. However, absent an event of default by the counterparty or a termination of the agreement, the ISDA Master Agreement does not result in an offset of reported amounts of assets and liabilities in the Statement of Assets and Liabilities across transactions between the fund and the applicable counterparty.
Collateral requirements differ by type of derivative. Collateral or margin requirements are set by the broker or exchange clearing house for exchange traded derivatives (i.e., futures contracts and exchange-traded options) while collateral terms are contract specific for over-the-counter traded derivatives (i.e., forward foreign currency exchange contracts, swap agreements and over-the-counter options). For derivatives traded under an ISDA Master Agreement, the collateral requirements are netted across all transactions traded under such agreement and one amount is posted from one party to the other to collateralize such obligations. Cash collateral that has been pledged to cover obligations of the fund under derivative contracts, if any, will be reported separately in the Statement of Assets and Liabilities as restricted cash. Securities collateral pledged for the same purpose, if any, is noted in the Portfolio of Investments.
Purchased Options – The fund purchased call and put options for a premium. Purchased call and put options entitle the holder to buy and sell a specified number of shares or units of a particular security, currency or index at a specified price at a specified date or within a specified period of time. Purchasing call options may hedge against an anticipated increase in the dollar cost of securities or currency to be acquired or increase the fund’s exposure to an underlying instrument. Purchasing put options may hedge against an anticipated decline in the value of portfolio securities or currency or decrease the fund’s exposure to an underlying instrument.
23
Table of Contents
MFS High Yield Portfolio
Notes to Financial Statements – continued
The premium paid is initially recorded as an investment in the Statement of Assets and Liabilities. That investment is subsequently marked-to-market daily with the difference between the premium paid and the market value of the purchased option being recorded as unrealized appreciation or depreciation. Premiums paid for purchased call and put options which have expired are treated as realized losses on investments in the Statement of Operations. Upon the exercise or closing of a purchased call option, the premium paid is added to the cost of the security or financial instrument purchased. Upon the exercise or closing of a purchased put option, the premium paid is offset against the proceeds on the sale of the underlying security or financial instrument in order to determine the realized gain or loss on investments.
Whether or not the option is exercised, the fund’s maximum risk of loss from purchasing an option is the amount of premium paid. All option contracts involve credit risk if the counterparty to the option contract fails to perform. For over-the-counter options, this risk is mitigated in cases where there is an ISDA Master Agreement between the fund and the counterparty providing for netting as described above and for posting of collateral by the counterparty to the fund to cover the fund’s exposure to the counterparty under such ISDA Master Agreement.
Forward Foreign Currency Exchange Contracts – The fund entered into forward foreign currency exchange contracts for the purchase or sale of a specific foreign currency at a fixed price on a future date. These contracts may be used to hedge the fund’s currency risk or for non-hedging purposes. For hedging purposes, the fund may enter into contracts to deliver or receive foreign currency that the fund will receive from or use in its normal investment activities. The fund may also use contracts to hedge against declines in the value of foreign currency denominated securities due to unfavorable exchange rate movements. For non-hedging purposes, the fund may enter into contracts with the intent of changing the relative exposure of the fund’s portfolio of securities to different currencies to take advantage of anticipated exchange rate changes.
Forward foreign currency exchange contracts are adjusted by the daily exchange rate of the underlying currency and any unrealized gains or losses are recorded as a receivable or payable for forward foreign currency exchange contracts until the contract settlement date. On contract settlement date, any gain or loss on the contract is recorded as realized gains or losses on foreign currency.
Risks may arise upon entering into these contracts from unanticipated movements in the value of the contract and from the potential inability of counterparties to meet the terms of their contracts. Generally, the fund’s maximum risk due to counterparty credit risk is the unrealized gain on the contract due to the use of Continuous Linked Settlement, an industry accepted settlement system. This risk is mitigated in cases where there is an ISDA Master Agreement between the fund and the counterparty providing for netting as described above and for posting of collateral by the counterparty to the fund to cover the fund’s exposure to the counterparty under such ISDA Master Agreement.
Loans and Other Direct Debt Instruments – The fund invests in loans and loan participations or other receivables. These investments may include standby financing commitments, including revolving credit facilities, which obligate the fund to supply additional cash to the borrower on demand. At December 31, 2012, the fund had unfunded loan commitments of $750,000, which could be extended at the option of the borrower and which are covered by sufficient cash and/or liquid securities held by the fund. The market value and obligation of the fund on these unfunded loan commitments is included in “Investments, at value” and “Payable for investments purchased”, respectively, in the Statement of Assets and Liabilities. Loan participations involve a risk of insolvency of the lending bank or other financial intermediary.
Indemnifications – Under the fund’s organizational documents, its officers and Trustees may be indemnified against certain liabilities and expenses arising out of the performance of their duties to the fund. Additionally, in the normal course of business, the fund enters into agreements with service providers that may contain indemnification clauses. The fund’s maximum exposure under these agreements is unknown as this would involve future claims that may be made against the fund that have not yet occurred.
Investment Transactions and Income – Investment transactions are recorded on the trade date. Interest income is recorded on the accrual basis. All premium and discount is amortized or accreted for financial statement purposes in accordance with U.S. generally accepted accounting principles. The fund earns certain fees in connection with its floating rate loan purchasing activities. These fees are in addition to interest payments earned and may include amendment fees, commitment fees, facility fees, consent fees, and prepayment fees. Commitment fees are recorded on an accrual basis as income in the accompanying financial statements. Dividends received in cash are recorded on the ex-dividend date. Certain dividends from foreign securities will be recorded when the fund is informed of the dividend if such information is obtained subsequent to the ex-dividend date. Dividend and interest payments received in additional securities are recorded on the ex-dividend or ex-interest date in an amount equal to the value of the security on such date. Debt obligations may be placed on non-accrual status or set to accrue at a rate of interest less than the contractual coupon when the collection of all or a portion of interest has become doubtful. Interest income for those debt obligations may be further reduced by the write-off of the related interest receivables when deemed uncollectible.
The fund may receive proceeds from litigation settlements. Any proceeds received from litigation involving portfolio holdings are reflected in the Statement of Operations in realized gain/loss if the security has been disposed of by the fund or in unrealized gain/loss if the security is still held by the fund. Any other proceeds from litigation not related to portfolio holdings are reflected as other income in the Statement of Operations.
24
Table of Contents
MFS High Yield Portfolio
Notes to Financial Statements – continued
Fees Paid Indirectly – The fund’s custody fee may be reduced according to an arrangement that measures the value of cash deposited with the custodian by the fund. This amount, for the year ended December 31, 2012, is shown as a reduction of total expenses in the Statement of Operations.
Tax Matters and Distributions – The fund intends to qualify as a regulated investment company, as defined under Subchapter M of the Internal Revenue Code, and to distribute all of its taxable income, including realized capital gains. As a result, no provision for federal income tax is required. The fund’s federal tax returns, when filed, will remain subject to examination by the Internal Revenue Service for a three year period.
Distributions to shareholders are recorded on the ex-dividend date. Income and capital gain distributions are determined in accordance with income tax regulations, which may differ from U.S. generally accepted accounting principles. Certain capital accounts in the financial statements are periodically adjusted for permanent differences in order to reflect their tax character. These adjustments have no impact on net assets or net asset value per share. Temporary differences which arise from recognizing certain items of income, expense, gain or loss in different periods for financial statement and tax purposes will reverse at some time in the future. Distributions in excess of net investment income or net realized gains are temporary overdistributions for financial statement purposes resulting from differences in the recognition or classification of income or distributions for financial statement and tax purposes.
Book/tax differences primarily relate to amortization and accretion of debt securities.
The tax character of distributions declared to shareholders for the last two fiscal years is as follows:
| 12/31/12 | 12/31/11 | |||||||
| Ordinary income (including any short-term capital gains) | $15,115,079 | $17,370,717 | ||||||
The federal tax cost and the tax basis components of distributable earnings were as follows:
| As of 12/31/12 | ||||
| Cost of investments | $450,701,000 | |||
| Gross appreciation | 23,153,055 | |||
| Gross depreciation | (6,756,077 | ) | ||
| Net unrealized appreciation (depreciation) | $16,396,978 | |||
| Undistributed ordinary income | 17,011,962 | |||
| Capital loss carryforwards | (47,585,584 | ) | ||
| Other temporary differences | (118,487 | ) |
Under the Regulated Investment Company Modernization Act of 2010 (the “Act”), net capital losses recognized after December 31, 2010 may be carried forward indefinitely, and their character is retained as short-term and/or long-term losses. Previously, net capital losses were carried forward for eight years and treated as short-term losses. As a transition rule, the Act requires that post-enactment net capital losses be used before pre-enactment net capital losses.
As of December 31, 2012, the fund had capital loss carryforwards available to offset future realized gains. Such losses expire as follows:
| Pre-enactment losses: | ||||
| 12/31/13 | $(5,089,839 | ) | ||
| 12/31/14 | (7,011,353 | ) | ||
| 12/31/16 | (23,243,372 | ) | ||
| 12/31/17 | (11,194,472 | ) | ||
| Total | $(46,539,036 | ) | ||
| Post-enactment losses: | ||||
| Long-Term | $(1,046,548 | ) | ||
25
Table of Contents
MFS High Yield Portfolio
Notes to Financial Statements – continued
Multiple Classes of Shares of Beneficial Interest – The fund offers multiple classes of shares, which differ in their respective distribution and/or service fees. The fund’s income, realized and unrealized gain (loss), and common expenses are allocated to shareholders based on the daily net assets of each class. Dividends are declared separately for each class. Differences in per share dividend rates are generally due to differences in separate class expenses. The fund’s distributions declared to shareholders as reported in the Statements of Changes in Net Assets are presented by class as follows:
| From net investment income | ||||||||
| Year ended 12/31/12 | Year ended 12/31/11 | |||||||
| Initial Class | $9,977,961 | $9,741,063 | ||||||
| Service Class | 5,137,118 | 7,629,654 | ||||||
| Total | $15,115,079 | $17,370,717 | ||||||
| (3) | Transactions with Affiliates |
Investment Adviser – The fund has an investment advisory agreement with MFS to provide overall investment management and related administrative services and facilities to the fund. The management fee is computed daily and paid monthly at the following annual rates:
| First $1 billion of average daily net assets | 0.70% | |||
| Average daily net assets in excess of $1 billion | 0.65% |
The management fee incurred for the year ended December 31, 2012 was equivalent to an annual effective rate of 0.70% of the fund’s average daily net assets.
Effective December 8, 2012, the investment adviser has agreed in writing to pay a portion of the fund’s total annual operating expenses, exclusive of interest, taxes, extraordinary expenses, brokerage and transaction costs, and investment-related expenses, such that total annual operating expenses do not exceed 0.75% of average daily net assets for the Initial Class shares and 1.00% of average daily net assets for the Service Class shares. This written agreement will continue until modified by the fund’s Board of Trustees, but such agreement will continue at least until December 31, 2014. For the year ended December 31, 2012, this reduction amounted to $44,339 and is reflected as a reduction of total expenses in the Statement of Operations.
Distributor – MFS Fund Distributors, Inc. (MFD), a wholly-owned subsidiary of MFS, is the distributor of shares of the fund. The Trustees have adopted a distribution plan for the Service Class shares pursuant to Rule 12b-1 under the Investment Company Act of 1940.
The fund’s distribution plan provides that the fund will pay MFD distribution and/or service fees equal to 0.25% per annum of its average daily net assets attributable to Service Class shares as partial consideration for services performed and expenses incurred by MFD and financial intermediaries (including participating insurance companies that invest in the fund to fund variable annuity and variable life insurance contracts, sponsors of qualified retirement and pension plans that invest in the fund, and affiliates of these participating insurance companies and plan sponsors) in connection with the sale and distribution of the Service Class shares. MFD may subsequently pay all, or a portion, of the distribution and/or service fees to financial intermediaries.
Shareholder Servicing Agent – MFS Service Center, Inc. (MFSC), a wholly-owned subsidiary of MFS, has contracted to provide transfer agent and recordkeeping functions in connection with the issuance, transfer, and redemption of each class of shares of the fund under a Shareholder Servicing Agent Agreement. During the year ended December 31, 2012, the fund did not pay MFSC a fee for this service. Effective April 1, 2013, the fund will be charged a shareholder servicing fee by MFSC.
Administrator – MFS provides certain financial, legal, shareholder communications, compliance, and other administrative services to the fund. Under an administrative services agreement, the fund partially reimburses MFS the costs incurred to provide these services. The fund is charged an annual fixed amount of $17,500 plus a fee based on average daily net assets. The administrative services fee incurred for the year ended December 31, 2012 was equivalent to an annual effective rate of 0.0183% of the fund’s average daily net assets.
Trustees’ and Officers’ Compensation – The fund pays compensation to independent Trustees in the form of a retainer, attendance fees, and additional compensation to Board and Committee chairpersons. The fund does not pay compensation directly to Trustees or officers of the fund who are also officers of the investment adviser, all of whom receive remuneration for their services to the fund from MFS. Certain officers and Trustees of the fund are officers or directors of MFS, MFD, and MFSC.
Other – This fund and certain other funds managed by MFS (the funds) have entered into services agreements (the Agreements) which provide for payment of fees by the funds to Tarantino LLC and Griffin Compliance LLC in return for the provision of services of an Independent Chief Compliance Officer (ICCO) and Assistant ICCO, respectively, for the funds. The ICCO and Assistant ICCO are officers of the funds and the sole members of Tarantino LLC and Griffin Compliance LLC, respectively. The funds can terminate the
26
Table of Contents
MFS High Yield Portfolio
Notes to Financial Statements – continued
Agreements with Tarantino LLC and Griffin Compliance LLC at any time under the terms of the Agreements. For the year ended December 31, 2012, the aggregate fees paid by the fund to Tarantino LLC and Griffin Compliance LLC were $1,895 and are included in “Miscellaneous” expense in the Statement of Operations. MFS has agreed to reimburse the fund for a portion of the payments made by the fund in the amount of $820, which is shown as a reduction of total expenses in the Statement of Operations. Additionally, MFS has agreed to bear all expenses associated with office space, other administrative support, and supplies provided to the ICCO and Assistant ICCO.
The fund invests in the MFS Institutional Money Market Portfolio which is managed by MFS and seeks current income consistent with preservation of capital and liquidity. Income earned on this investment is included in “Dividends from underlying affiliated funds” in the Statement of Operations. This money market fund does not pay a management fee to MFS.
| (4) | Portfolio Securities |
Purchases and sales of investments, other than purchased option transactions and short-term obligations, aggregated $107,157,231 and $105,991,015, respectively. Purchases exclude the value of securities acquired in connection with the SC PIMCO High Yield Fund merger (See Note 8.)
| (5) | Shares of Beneficial Interest |
The fund’s Declaration of Trust permits the Trustees to issue an unlimited number of full and fractional shares of beneficial interest. Transactions in fund shares were as follows:
| Year ended 12/31/12 | Year ended 12/31/11 | |||||||||||||||
| Shares | Amount | Shares | Amount | |||||||||||||
| Shares sold | ||||||||||||||||
Initial Class | 1,603,075 | $9,608,510 | 2,391,503 | $13,890,676 | ||||||||||||
Service Class | 1,053,975 | 6,297,096 | 915,930 | 5,120,442 | ||||||||||||
| 2,657,050 | $15,905,606 | 3,307,433 | $19,011,118 | |||||||||||||
| Shares issued in connection with acquisition of High Yield Variable Account | ||||||||||||||||
Initial Class | 6,689,850 | $37,062,971 | ||||||||||||||
| Shares issued in connection with acquisition of SC PIMCO High Yield Fund | ||||||||||||||||
Initial Class | 36,405,923 | $218,799,595 | ||||||||||||||
Service Class | 5,600,264 | 33,321,569 | ||||||||||||||
| 42,006,187 | $252,121,164 | |||||||||||||||
| Shares issued to shareholders in reinvestment of distributions | ||||||||||||||||
Initial Class | 1,726,291 | $9,977,961 | 1,774,328 | $9,741,063 | ||||||||||||
Service Class | 898,098 | 5,137,118 | 1,402,510 | 7,629,654 | ||||||||||||
| 2,624,389 | $15,115,079 | 3,176,838 | $17,370,717 | |||||||||||||
| Shares reacquired | ||||||||||||||||
Initial Class | (4,555,720) | $(27,054,094) | (5,578,901) | $(33,317,490) | ||||||||||||
Service Class | (4,035,220) | (23,693,081) | (4,510,215) | (26,601,237) | ||||||||||||
| (8,590,940) | $(50,747,175) | (10,089,116) | $(59,918,727) | |||||||||||||
| Net change | ||||||||||||||||
Initial Class | 35,179,569 | $211,331,972 | 5,276,780 | $27,377,220 | ||||||||||||
Service Class | 3,517,117 | 21,062,702 | (2,191,775) | (13,851,141) | ||||||||||||
| 38,696,686 | $232,394,674 | 3,085,005 | $13,526,079 | |||||||||||||
The fund is one of several mutual funds in which the MFS funds-of-funds may invest. The MFS funds-of-funds do not invest in the underlying MFS funds for the purpose of exercising management or control. At the end of the period, the MFS Moderate Allocation Portfolio, the MFS Conservative Allocation Portfolio, and the MFS Growth Allocation Portfolio were the owners of record of approximately 21%, 10%, and 6%, respectively, of the value of outstanding voting shares of the fund.
| (6) | Line of Credit |
The fund and certain other funds managed by MFS participate in a $1.1 billion unsecured committed line of credit, subject to a $1 billion sublimit, provided by a syndication of banks under a credit agreement. Borrowings may be made for temporary financing needs. Interest is charged to each fund, based on its borrowings, generally at a rate equal to the higher of the Federal Reserve funds rate or one month LIBOR plus an agreed upon spread. A commitment fee, based on the average daily, unused portion of the committed line of credit, is allocated among the participating funds at the end of each calendar quarter. In addition, the fund and other funds managed by MFS have established unsecured uncommitted borrowing arrangements with certain banks for temporary
27
Table of Contents
MFS High Yield Portfolio
Notes to Financial Statements – continued
financing needs. Interest is charged to each fund, based on its borrowings, at a rate equal to the Federal Reserve funds rate plus an agreed upon spread. For the year ended December 31, 2012, the fund’s commitment fee and interest expense were $1,490 and $0, respectively, and are included in “Miscellaneous” expense in the Statement of Operations.
| (7) | Transactions in Underlying Affiliated Funds – Affiliated Issuers |
An affiliated issuer may be considered one in which the fund owns 5% or more of the outstanding voting securities, or a company which is under common control. For the purposes of this report, the fund assumes the following to be an affiliated issuer:
| Underlying Affiliated Fund | Beginning Shares/Par Amount | Acquisitions Shares/Par Amount | Dispositions Shares/Par Amount | Ending Shares/Par Amount | ||||||||||||
| MFS Institutional Money Market Portfolio | 8,583,165 | 86,490,254 | (81,756,234 | ) | 13,317,185 | |||||||||||
| Underlying Affiliated Fund | Realized Gain (Loss) | Capital Gain Distributions | Dividend Income | Ending Value | ||||||||||||
| MFS Institutional Money Market Portfolio | $— | $— | $9,176 | $13,317,185 | ||||||||||||
| (8) | Acquisitions |
At the close of business on December 2, 2011, the fund with net assets of $189,041,440, acquired all of the investment-related assets and liabilities of High Yield Variable Account. The acquisition was part of a transaction in which the High Yield Variable Account was converted into a unit investment trust (“UIT”) that invests in the fund (the acquisition of the Account’s assets and liabilities and subsequent conversion into a UIT hereinafter referred to as the “Reorganization”). The Reorganization provided the contract owners of the High Yield Variable Account with the opportunity to participate in a larger combined portfolio with an identical investment objective and similar investment policies and strategies. The acquisition was accomplished by a tax-free exchange of 6,689,850 shares of the fund (valued at $37,062,971) for all of the investment-related assets and liabilities of High Yield Variable Account. High Yield Variable Account’s investments on that date were valued at $36,182,636 with a cost basis of $37,558,906. For financial reporting purposes, assets received and shares issued by the fund were recorded at fair value; however, the cost basis of the investments received from High Yield Variable Account were carried forward to align ongoing reporting of the fund’s realized and unrealized gains and losses with amounts distributable to shareholders for tax purposes.
At close of business on December 7, 2012, the fund with net assets of approximately $230,425,881, acquired all of the assets and liabilities of SC PIMCO High Yield Fund, a series of Sun Capital Advisers Trust. The purpose of the transaction was to provide shareholders of SC PIMCO High Yield Fund the opportunity to participate in a larger combined portfolio with a similar investment objective and similar investment policies and strategies. The acquisition was accomplished by a tax-free exchange of approximately 42,006,187 shares of the fund (valued at approximately $252,121,164) for all of the assets and liabilities of SC PIMCO High Yield Fund. SC PIMCO High Yield Fund then distributed the shares of the fund that SC PIMCO High Yield Fund received from the fund to its shareholders. SC PIMCO High Yield Fund’s investments on that date were valued at approximately $229,224,942 with a cost basis of approximately $219,889,002. For financial reporting purposes, assets received and shares issued by the fund were recorded at fair value; however, the cost basis of the investments received from SC PIMCO High Yield Fund were carried forward to align ongoing reporting of the fund’s realized and unrealized gains and losses with amounts distributable to shareholders for tax purposes. Because the combined investment portfolios have been managed as a single integrated portfolio since the acquisition was completed, it is not practicable to separate the amounts of revenue and earnings of SC PIMCO High Yield Fund that have been included in the fund’s Statement of Operations since December 7, 2012.
Assuming the acquisition had been completed on January 1, 2012, the fund’s pro forma results of operations for the year ended December 31, 2012 are as follows:
| Net investment income | $26,106,564 | |||
| Net realized and unrealized gain (loss) on investments and foreign currency | 92,251,361 | |||
| Change in net assets from operations | $118,357,925 |
28
Table of Contents
MFS High Yield Portfolio
REPORT OF INDEPENDENT REGISTERED PUBLIC ACCOUNTING FIRM
To the Board of Trustees of MFS Variable Insurance Trust II and the Shareholders of
MFS High Yield Portfolio:
We have audited the accompanying statement of assets and liabilities, including the portfolio of investments, of MFS High Yield Portfolio (the “Fund”) (one of the series comprising MFS Variable Insurance Trust II) as of December 31, 2012, and the related statement of operations for the year then ended, the statements of changes in net assets for each of the two years in the period then ended, and the financial highlights for each of the five years in the period then ended. These financial statements and financial highlights are the responsibility of the Fund’s management. Our responsibility is to express an opinion on these financial statements and financial highlights based on our audits.
We conducted our audits in accordance with the standards of the Public Company Accounting Oversight Board (United States). Those standards require that we plan and perform the audit to obtain reasonable assurance about whether the financial statements and financial highlights are free of material misstatement. The Fund is not required to have, nor were we engaged to perform, an audit of its internal control over financial reporting. Our audits included consideration of internal control over financial reporting as a basis for designing audit procedures that are appropriate in the circumstances, but not for the purpose of expressing an opinion on the effectiveness of the Fund’s internal control over financial reporting. Accordingly, we express no such opinion. An audit also includes examining, on a test basis, evidence supporting the amounts and disclosures in the financial statements, assessing the accounting principles used and significant estimates made by management, as well as evaluating the overall financial statement presentation. Our procedures included confirmation of securities owned as of December 31, 2012, by correspondence with the custodian and brokers; where replies were not received from brokers, we performed other auditing procedures. We believe that our audits provide a reasonable basis for our opinion.
In our opinion, the financial statements and financial highlights referred to above present fairly, in all material respects, the financial position of MFS High Yield Portfolio as of December 31, 2012, the results of its operations for the year then ended, the changes in its net assets for each of the two years in the period then ended, and the financial highlights for each of the five years in the period then ended, in conformity with accounting principles generally accepted in the United States of America.
DELOITTE & TOUCHE LLP
Boston, Massachusetts
February 15, 2013
29
Table of Contents
MFS High Yield Portfolio
TRUSTEES AND OFFICERS – IDENTIFICATION AND BACKGROUND
The Trustees and officers of the Trust, as of February 1, 2013, are listed below, together with their principal occupations during the past five years. (Their titles may have varied during that period.) The address of each Trustee and officer is 111 Huntington Avenue, Boston, Massachusetts 02199-7618.
Name, Age | Position(s) with Fund | Trustee/Officer Since (h) | Principal Occupations During the Past Five Years | Other Directorships (j) | ||||
| INTERESTED TRUSTEES | ||||||||
Robert J. Manning (k) (age 49) | Trustee | February 2004 | Massachusetts Financial Services Company, Chairman, Chief Executive Officer and Director; President (until December 2009); Chief Investment Officer (until July 2010) | N/A | ||||
| INDEPENDENT TRUSTEES | ||||||||
David H. Gunning (age 70) | Trustee and Chair of Trustees | January 2004 | Private investor | Lincoln Electric Holdings, Inc. (welding equipment manufacturer), Director; Development Alternatives, Inc. (consulting), Director/Non-Executive Chairman; Portman Limited (mining), Director (until 2008) | ||||
Robert E. Butler (age 71) | Trustee | January 2006 | Consultant – investment company industry regulatory and compliance matters | N/A | ||||
Maureen R. Goldfarb (age 57) | Trustee | January 2009 | Private investor | N/A | ||||
William R. Gutow (age 71) | Trustee | December 1993 | Private investor and real estate consultant; Capitol Entertainment Management Company (video franchise), Vice Chairman | Atlantic Coast Tan (tanning salons), Vice Chairman (until 2007); Texas Donuts (donut franchise), Vice Chairman (until 2010) | ||||
Michael Hegarty (age 68) | Trustee | December 2004 | Private investor; Rouse Properties Inc. (real estate), Director | N/A | ||||
John P. Kavanaugh (age 58) | Trustee | January 2009 | Private investor | N/A | ||||
J. Dale Sherratt (age 74) | Trustee | June 1989 | Insight Resources, Inc. (acquisition planning specialists), President; Wellfleet Investments (investor in health care companies), Managing General Partner | N/A | ||||
| Laurie J. Thomsen (age 55) | Trustee | March 2005 | Private investor; New Profit, Inc. (venture philanthropy), Executive Partner (until 2010) | The Travelers Companies (insurance), Director | ||||
Robert W. Uek (age 71) | Trustee | January 2006 | Consultant to investment company industry | N/A | ||||
| OFFICERS | ||||||||
John M. Corcoran (k) (age 47) | President | October 2008 | Massachusetts Financial Services Company, Senior Vice President (since October 2008); State Street Bank and Trust (financial services provider), Senior Vice President, (until September 2008) | N/A | ||||
| Christopher R. Bohane (k) (age 39) | Assistant Secretary and Assistant Clerk | July 2005 | Massachusetts Financial Services Company, Vice President and Senior Counsel | N/A | ||||
Kino Clark (k) (age 44) | Assistant Treasurer | January 2012 | Massachusetts Financial Services Company, Vice President | N/A | ||||
Thomas H. Connors (k) (age 53) | Assistant Secretary and Assistant Clerk | September 2012 | Massachusetts Financial Services Company, Vice President and Senior Counsel; Deutsche Investment Management Americas Inc. (financial service provider), Director and Senior Counsel (until 2012) | N/A | ||||
Ethan D. Corey (k) (age 49) | Assistant Secretary and Assistant Clerk | July 2005 | Massachusetts Financial Services Company, Senior Vice President and Associate General Counsel | N/A | ||||
30
Table of Contents
MFS High Yield Portfolio
Trustees and Officers – continued
Name, Age | Position(s) with Fund | Trustee/Officer Since (h) | Principal Occupations During the Past Five Years | Other Directorships (j) | ||||
David L. DiLorenzo (k) (age 44) | Treasurer | July 2005 | Massachusetts Financial Services Company, Senior Vice President | N/A | ||||
Robyn L. Griffin (age 37) | Assistant Independent Chief Compliance Officer | August 2008 | Griffin Compliance LLC (provider of compliance services), Principal (since August 2008); State Street Corporation (financial services provider), Mutual Fund Administration Assistant Vice President (October 2006 – July 2008) | N/A | ||||
Brian E. Langenfeld (k) (age 39) | Assistant Secretary and Assistant Clerk | June 2006 | Massachusetts Financial Services Company, Vice President and Senior Counsel | N/A | ||||
Susan S. Newton (k) (age 62) | Assistant Secretary and Assistant Clerk | May 2005 | Massachusetts Financial Services Company, Senior Vice President and Associate General Counsel | N/A | ||||
Susan A. Pereira (k) (age 42) | Assistant Secretary and Assistant Clerk | July 2005 | Massachusetts Financial Services Company, Vice President and Senior Counsel | N/A | ||||
Kasey L. Phillips (k) (age 42) | Assistant Treasurer | September 2012 | Massachusetts Financial Services Company, Vice President; Wells Fargo Funds Management, LLC, Senior Vice President, Fund Treasurer (until 2012) | N/A | ||||
Mark N. Polebaum (k) (age 60) | Secretary and Clerk | January 2006 | Massachusetts Financial Services Company, Executive Vice President, General Counsel and Secretary | N/A | ||||
Frank L. Tarantino (age 68) | Independent Chief Compliance Officer | June 2004 | Tarantino LLC (provider of compliance services), Principal | N/A | ||||
Richard S. Weitzel (k) (age 42) | Assistant Secretary and Assistant Clerk | October 2007 | Massachusetts Financial Services Company, Senior Vice President and Associate General Counsel | N/A | ||||
James O. Yost (k) (age 52) | Deputy Treasurer | September 1990 | Massachusetts Financial Services Company, Senior Vice President | N/A | ||||
| (h) | Date first appointed to serve as Trustee/officer of an MFS fund. Each Trustee has served continuously since appointment unless indicated otherwise. For the period from December 15, 2004 until February 22, 2005, Mr. Manning served as Advisory Trustee. For the period October 2008, until January 2012, Mr. Corcoran served as Treasurer of the Funds. Prior to January 2012, Messrs. DiLorenzo and Yost served as Assistant Treasurers of the Funds. |
| (j) | Directorships or trusteeships of companies required to report to the Securities and Exchange Commission (i.e., “public companies”). |
| (k) | “Interested person” of the Trust within the meaning of the Investment Company Act of 1940 (referred to as the 1940 Act), which is the principal federal law governing investment companies like the fund, as a result of position with MFS. The address of MFS is 111 Huntington Avenue, Boston, Massachusetts 02199-7618. |
Each Trustee has been elected by shareholders and each Trustee and officer holds office until his or her successor is chosen and qualified or until his or her earlier death, resignation, retirement or removal. The Trust does not hold annual meetings for the purpose of electing Trustees, and Trustees are not elected for fixed terms. Messrs. Butler, Kavanaugh, Uek and Ms. Thomsen are members of the Trust’s Audit Committee.
Each of the Fund’s Trustees and officers holds comparable positions with certain other funds of which MFS or a subsidiary is the investment adviser or distributor, and, in the case of the officers, with certain affiliates of MFS. As of January 1, 2013, the Trustees served as board members of 143 funds within the MFS Family of Funds.
31
Table of Contents
MFS High Yield Portfolio
Trustees and Officers – continued
The Statement of Additional Information for the Fund includes further information about the Trustees and is available without charge upon request by calling 1-800-225-2606.
Investment Adviser Massachusetts Financial Services Company 111 Huntington Avenue Boston, MA 02199-7618 | Custodian State Street Bank and Trust 1 Lincoln Street Boston, MA 02111-2900 | |
Distributor MFS Fund Distributors, Inc. 111 Huntington Avenue Boston, MA 02199-7618 | Independent Registered Public Accounting Firm Deloitte & Touche LLP 200 Berkeley Street Boston, MA 02116 | |
Portfolio Managers William Adams David Cole |
32
Table of Contents
MFS High Yield Portfolio
BOARD REVIEW OF INVESTMENT ADVISORY AGREEMENT
A discussion regarding the Board’s most recent approval of the fund’s Investment Advisory Agreement with MFS is available by clicking on the fund’s name under “Variable Insurance Portfolios – VIT II” in the “Products” section of the MFS Web site (mfs.com).
PROXY VOTING POLICIES AND INFORMATION
A general description of the MFS funds’ proxy voting policies and procedures is available without charge, upon request, by calling 1-800-225-2606, by visiting the Proxy Voting section of mfs.com or by visiting the SEC’s Web site at http://www.sec.gov.
Information regarding how the fund voted proxies relating to portfolio securities during the most recent twelve-month period ended June 30 is available without charge by visiting the Proxy Voting section of mfs.com or by visiting the SEC’s Web site at http://www.sec.gov.
QUARTERLY PORTFOLIO DISCLOSURE
The fund will file a complete schedule of portfolio holdings with the Securities and Exchange Commission (the Commission) for the first and third quarters of each fiscal year on Form N-Q. The fund’s Form N-Q is available on the EDGAR database on the Commission’s Internet Web site at http://www.sec.gov, and may be reviewed and copied at the:
Public Reference Room
Securities and Exchange Commission
100 F Street, NE, Room 1580
Washington, D.C. 20549
Information on the operation of the Public Reference Room may be obtained by calling the Commission at 1-800-SEC-0330. Copies of the fund’s Form N-Q also may be obtained, upon payment of a duplicating fee, by electronic request at the following e-mail address: publicinfo@sec.gov or by writing the Public Reference Section at the above address.
From time to time, MFS may post important information about the fund or the MFS funds on the MFS web site (mfs.com). This information is available by visiting the “News & Commentary” section of mfs.com or by clicking on the fund’s name under “Variable Insurance Portfolios – VIT II” in the “Products” section of mfs.com.
33
Table of Contents
rev. 3/11

| Why? | Financial companies choose how they share your personal information. Federal law gives consumers the right to limit some but not all sharing. Federal law also requires us to tell you how we collect, share, and protect your personal information. Please read this notice carefully to understand what we do. |
| What? | The types of personal information we collect and share depend on the product or service you have with us. This information can include:
• Social Security number and account balances • Account transactions and transaction history • Checking account information and wire transfer instructions
When you are no longer our customer, we continue to share your information as described in this notice. |
| How? | All financial companies need to share customers’ personal information to run their everyday business. In the section below, we list the reasons financial companies can share their customers’ personal information; the reasons MFS chooses to share; and whether you can limit this sharing. |
| Reasons we can share your personal information | Does MFS share? | Can you limit this sharing? | ||
For our everyday business purposes – such as to process your transactions, maintain your account(s), respond to court orders and legal investigations, or report to credit bureaus | Yes | No | ||
For our marketing purposes – to offer our products and services to you | No | We don’t share | ||
| For joint marketing with other financial companies | No | We don’t share | ||
For our affiliates’ everyday business purposes – information about your transactions and experiences | No | We don’t share | ||
For our affiliates’ everyday business purposes – information about your creditworthiness | No | We don’t share | ||
| For nonaffiliates to market to you | No | We don’t share |
| Questions? | Call 800-225-2606 or go to mfs.com. |
34
Table of Contents
| Page 2 |
| Who we are | ||
| Who is providing this notice? | MFS Funds, MFS Investment Management, MFS Institutional Advisors, Inc., MFS Fund Distributors, Inc., MFS Heritage Trust Company, and MFS Service Center, Inc. | |
| What we do | ||
| How does MFS protect my personal information? | To protect your personal information from unauthorized access and use, we use security measures that comply with federal law. These measures include procedural, electronic, and physical safeguards for the protection of the personal information we collect about you. | |
| How does MFS collect my personal information? | We collect your personal information, for example, when you
• open an account or provide account information • direct us to buy securities or direct us to sell your securities • make a wire transfer
We also collect your personal information from others, such as credit bureaus, affiliates and other companies. | |
| Why can’t I limit all sharing? | Federal law gives you the right to limit only
• sharing for affiliates’ everyday business purposes – information about your creditworthiness • affiliates from using your information to market to you • sharing for nonaffiliates to market to you
State laws and individual companies may give you additional rights to limit sharing. | |
| Definitions | ||
| Affiliates | Companies related by common ownership or control. They can be financial and nonfinancial companies.
•MFS does not share personal information with affiliates, except for everyday business purposes as described on page one of this notice. | |
| Nonaffiliates | Companies not related by common ownership or control. They can be financial and nonfinancial companies.
•MFS does not share with nonaffiliates so they can market to you. | |
| Joint Marketing | A formal agreement between nonaffiliated financial companies that together market financial products or services to you.
•MFS doesn’t jointly market. | |
| Other important information | ||
| If you own an MFS product or receive an MFS service in the name of a third party such as a bank or broker-dealer, their privacy policy may apply to you instead of ours. | ||
35
Table of Contents
Table of Contents
ANNUAL REPORT
December 31, 2012

MFS® BLENDED RESEARCH® CORE EQUITY PORTFOLIO
MFS® Variable Insurance Trust II

CGS-ANN
Table of Contents
MFS® BLENDED RESEARCH® CORE EQUITY PORTFOLIO
The report is prepared for the general information of contract owners. It is authorized for distribution to prospective investors only when preceded or accompanied by a current prospectus.
NOT FDIC INSURED Ÿ MAY LOSE VALUE Ÿ NO BANK OR CREDIT UNION GUARANTEE Ÿ NOT A DEPOSIT Ÿ NOT INSURED BY ANY FEDERAL GOVERNMENT AGENCY OR NCUA/NCUSIF
Table of Contents
MFS Blended Research Core Equity Portfolio
LETTER FROM THE CHAIRMAN AND CEO

Dear Contract Owners:
The global market outlook for 2013 is one of cautious optimism. While we are seeing some positive economic trends in the United States, Europe and China, the overall environment remains challenging. In the United States, the recent fiscal cliff agreement was received positively by investors, even though it mostly addressed pressing taxation issues and did not resolve additional concerns, including the need for spending cuts and a large-scale reduction of the federal debt. These issues will be front and center again in the spring. Despite the ongoing uncertainty, economic tailwinds are gathering strength as the U.S. housing and job markets are improving and consumer confidence is rising.
Overseas, the debt crisis continues to weigh heavily on eurozone markets, with even Germany — long an economic stalwart — experiencing some contraction. These ongoing challenges could be a drag on global market performance this year. In Asia, manufacturing activity has accelerated in emerging markets such as China and India, and we are seeing signs of stabilized loan growth in China, a leading indicator of that country’s economic health. In contrast, Japan’s economy is contracting sharply under deflationary pressures. Nevertheless, Japanese markets have responded favorably to early actions by the new government, which appears determined to act aggressively, along with the Bank of Japan, to stimulate growth.
As always, managing risk in the face of uncertainty remains a top priority for investors. At MFS®, our uniquely collaborative investment process revolves around global research and our disciplined risk management approach. Our global team of investment professionals shares ideas and evaluates opportunities across continents, investment disciplines and asset classes — all with a goal of building better insights, and ultimately better results, for our clients.
We remain mindful of the many economic challenges investors face today, and believe it is more important than ever to maintain a long-term view, employ time-tested principles, such as asset allocation and diversification, and work closely with investment advisors to identify and pursue the most suitable opportunities.
Respectfully,

Robert J. Manning
Chairman and Chief Executive Officer
MFS Investment Management®
February 15, 2013
The opinions expressed in this letter are subject to change, may not be relied upon for investment advice, and no forecasts can be guaranteed.
1
Table of Contents
MFS Blended Research Core Equity Portfolio
Portfolio structure
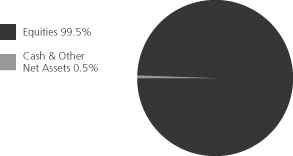
| Top ten holdings | ||||
| Apple, Inc. | 4.9% | |||
| Exxon Mobil Corp. | 4.5% | |||
| Chevron Corp. | 2.8% | |||
| JPMorgan Chase & Co. | 2.5% | |||
| Microsoft Corp. | 2.4% | |||
| Pfizer, Inc. | 2.2% | |||
| Abbott Laboratories | 2.0% | |||
| Procter & Gamble Co. | 1.9% | |||
| Amgen, Inc. | 1.8% | |||
| Google, Inc., “A” | 1.7% |
| Equity sectors | ||||
| Technology | 16.3% | |||
| Financial Services | 15.3% | |||
| Health Care | 12.2% | |||
| Energy | 11.0% | |||
| Consumer Staples | 8.9% | |||
| Utilities & Communications | 8.3% | |||
| Retailing | 7.0% | |||
| Industrial Goods & Services | 5.8% | |||
| Leisure | 4.9% | |||
| Basic Materials | 3.3% | |||
| Special Products & Services | 2.8% | |||
| Autos & Housing | 2.1% | |||
| Transportation | 1.6% |
Percentages are based on net assets as of 12/31/12.
The portfolio is actively managed and current holdings may be different.
2
Table of Contents
MFS Blended Research Core Equity Portfolio
Summary of Results
For the twelve months ended December 31, 2012, Initial Class shares of the MFS Blended Research Core Equity Portfolio (“fund”) provided a total return of 15.37%, while Service Class shares of the fund provided a total return of 15.10%. These compare with a return of 16.00% over the same period for the fund’s benchmark, the Standard & Poor’s 500 Stock Index (“S&P 500 Index”).
Market Environment
The beginning of the period was characterized by a risk-on sentiment as a result of additional liquidity measures by the Federal Reserve Bank (“Fed”) and the European Central Bank (“ECB”) as well as a commensurate improvement in macroeconomic conditions. During this time, global equity valuations rose, credit spreads contracted, and high-quality sovereign yields increased modestly.
During the middle of the period, however, conditions worsened, driven by broadly weaker global macroeconomic indicators, as well as renewed concerns over the eurozone’s capacity and determination to address its ongoing crisis. Despite this deterioration, broad market sentiment remained relatively resilient as equity markets generally maintained gains and credit spreads did not indicate deterioration.
However, this renewed weakness in the fundamentals precipitated a further round of monetary easing by both the Fed (through a third round of quantitative easing) and the ECB (through a new bond purchase facility) in the second half of the period, which soon instilled additional confidence in risk markets. Nonetheless, towards the end of the period, weaker equity earnings reports and declining forward guidance caused market sentiment to soften. In addition, as we moved toward year end, the fiscal cliff negotiations between the Republicans in the U.S. Congress and President Obama were a particular source of market attention, where uncertainty surrounding the fiscal negotiations continued right up to the end-of-year deadline.
Detractors from Performance
Stock selection in the basic materials sector was a primary detractor from performance relative to the S&P 500 Index. The fund’s holdings of iron ore miner Cliffs Natural Resources (h) and silver and gold miner Coeur d’Alene Mines (b) dampened relative results as both stocks underperformed the benchmark during the period. Shares of Cliffs Natural Resources struggled throughout the period as lower steel prices, higher costs, and lower-than-expected productivity from some of its mining sites weighed on the stock price.
Stock selection in the financial services sector was another negative factor for relative returns. Not holding shares of financial services firm Bank of America weighed on relative performance. Shares of the company delivered strong performance throughout the year due to its strengthened capital position and successful cost cutting efforts.
Stock selection in the consumer staples sector also hampered relative results. The fund’s holdings of anti-aging personal care products provider Nu Skin Enterprises (b) hurt relative returns as the stock delivered weak performance.
Elsewhere, the fund’s holdings of computer products and services provider Hewlett-Packard were a detractor from relative performance. Shares of the company traded lower as the firm continued to work through its restructuring efforts. Other stocks that held back relative returns included software giant Microsoft, integrated electric power company AES, fast-food company giant McDonald’s, oilfield services provider Halliburton, and power provider FirstEnergy as all six stocks underperformed the benchmark during the period.
Contributors to Performance
Stock selection in the health care sector was a positive factor for relative performance. The fund’s holdings of hospital operator HCA (b) benefited relative results as the stock delivered strong performance during the period. The company paid out three special dividends to shareholders throughout the year, totaling nearly three billion dollars, which boosted the stock price. The fund’s holdings of biotechnology firm Amgen also supported relative results.
Stock selection in the energy sector also strengthened relative performance. The fund’s holdings of strong-performing independent petroleum refiner HollyFrontier (b) boosted relative results. Shares of the company spiked late in the period after management raised its regular dividend and announced a special dividend of fifty cents per share. The company was successful throughout the year as a result of its strong financial position, improved cost controls, and increased sales volume.
Stock selection in the retailing sector was another contributor to relative performance. However, there were no individual stocks within this sector that were among the fund’s top relative contributors.
3
Table of Contents
MFS Blended Research Core Equity Portfolio
Management Review – continued
Stocks in other sectors that benefited relative returns included the fund’s holdings of strong-performing credit card company Discover Financial Services, information technology infrastructure management provider SolarWinds (b), media firm Time Warner Cable, computer and personal electronics maker Apple, clothing retailer Gap, broadcast and communication tower management firm American Tower, and financial services firm Citigroup.
Respectfully,
Matthew Krummell
Portfolio Manager
| (b) | Security is not a benchmark constituent. |
The views expressed in this report are those of the portfolio manager only through the end of the period of the report as stated on the cover and do not necessarily reflect the views of MFS or any other person in the MFS organization. These views are subject to change at any time based on market or other conditions, and MFS disclaims any responsibility to update such views. These views may not be relied upon as investment advice or an indication of trading intent on behalf of any MFS portfolio. References to specific securities are not recommendations of such securities, and may not be representative of any MFS portfolio’s current or future investments.
4
Table of Contents
MFS Blended Research Core Equity Portfolio
PERFORMANCE SUMMARY THROUGH 12/31/12
The following chart illustrates the historical performance of the fund in comparison to its benchmark(s). Benchmarks are unmanaged and may not be invested in directly. Benchmark returns do not reflect any fees or expenses. The performance of other share classes will be greater than or less than that of the class depicted below. (See Notes to Performance Summary.)
Performance data shown represents past performance and is no guarantee of future results. Investment return and principal value fluctuate so your units, when sold, may be worth more or less than the original cost; current performance may be lower or higher than quoted. The performance shown does not reflect the deduction of taxes, if any, that a contract holder would pay on fund distributions or the redemption of contract units. The returns for the fund shown also do not reflect the deduction of expenses associated with variable products, such as mortality and expense risk charges, separate account charges, and sales charges imposed by the insurance company separate accounts. Such expenses would reduce the overall returns shown.
Growth of a Hypothetical $10,000 Investment
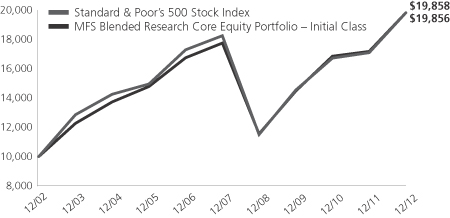
Total Returns through 12/31/12
Average annual total returns
| Share Class | Class inception date | 1-yr | 5-yr | 10-yr | ||||||||
| Initial Class | 11/14/86 | 15.37% | 2.23% | 7.10% | ||||||||
| Service Class | 8/24/01 | 15.10% | 1.97% | 6.83% | ||||||||
| Comparative benchmark | ||||||||||||
| Standard & Poor’s 500 Stock Index (f) | 16.00% | 1.66% | 7.10% | |||||||||
| (f) | Source: FactSet Research Systems Inc. |
Benchmark Definition
Standard & Poor’s 500 Stock Index – a market capitalization-weighted index of 500 widely held equity securities, designed to measure broad U.S. equity performance.
It is not possible to invest directly in an index.
Notes to Performance Summary
Average annual total return represents the average annual change in value for each share class for the periods presented.
Performance results reflect any applicable expense subsidies and waivers in effect during the periods shown. Without such subsidies and waivers the fund’s performance results would be less favorable. Please see the prospectus and financial statements for complete details. All results are historical and assume the reinvestment of any dividends and capital gains distributions.
Performance results do not include adjustments made for financial reporting purposes in accordance with U.S. generally accepted accounting principles and may differ from amounts reported in the financial highlights.
Prior to June 22, 2007, the fund’s investments were primarily selected based on fundamental analysis. Beginning June 22, 2007, the fund’s investments are selected based on fundamental and quantitative analysis.
From time to time the fund may receive proceeds from litigation settlements, without which performance would be lower.
5
Table of Contents
MFS Blended Research Core Equity Portfolio
Fund Expenses Borne by the Contract Holders During the Period,
July 1, 2012 through December 31, 2012
As a contract holder of the fund, you incur ongoing costs, including management fees; distribution and/or service (12b-1) fees; and other fund expenses. This example is intended to help you understand your ongoing costs (in dollars) of investing in the fund and to compare these costs with the ongoing costs of investing in other mutual funds.
The example is based on an investment of $1,000 invested at the beginning of the period and held for the entire period July 1, 2012 through December 31, 2012.
Actual Expenses
The first line for each share class in the following table provides information about actual account values and actual expenses. You may use the information in this line, together with the amount you invested, to estimate the expenses that you paid over the period. Simply divide your account value by $1,000 (for example, an $8,600 account value divided by $1,000 = 8.6), then multiply the result by the number in the first line under the heading entitled “Expenses Paid During Period” to estimate the expenses you paid on your account during this period.
Hypothetical Example for Comparison Purposes
The second line for each share class in the following table provides information about hypothetical account values and hypothetical expenses based on the fund’s actual expense ratio and an assumed rate of return of 5% per year before expenses, which is not the fund’s actual return. The hypothetical account values and expenses may not be used to estimate the actual ending account balance or expenses you paid for the period. You may use this information to compare the ongoing costs of investing in the fund and other funds. To do so, compare this 5% hypothetical example with the 5% hypothetical examples that appear in the shareholder reports of the other funds.
Please note that the expenses shown in the table are meant to highlight the fund’s ongoing costs only and do not take into account the fees and expenses imposed under the variable contracts through which your investment in the fund is made. Therefore, the second line for each share class in the table is useful in comparing ongoing costs associated with an investment in vehicles (such as the fund) which fund benefits under variable annuity and variable life insurance contracts and to qualified pension and retirement plans only, and will not help you determine the relative total costs of investing in the fund through variable annuity and variable life insurance contracts. If the fees and expenses imposed under the variable contracts were included, your costs would have been higher.
| Share Class | Annualized Expense Ratio | Beginning Account Value 7/01/12 | Ending Account Value | Expenses Paid During Period (p) 7/01/12-12/31/12 | ||||||||||||||
| Initial Class | Actual | 0.60% | $1,000.00 | $1,061.76 | $3.11 | |||||||||||||
| Hypothetical (h) | 0.60% | $1,000.00 | $1,022.12 | $3.05 | ||||||||||||||
| Service Class | Actual | 0.85% | $1,000.00 | $1,060.55 | $4.40 | |||||||||||||
| Hypothetical (h) | 0.85% | $1,000.00 | $1,020.86 | $4.32 | ||||||||||||||
| (h) | 5% class return per year before expenses. |
| (p) | Expenses paid are equal to each class’s annualized expense ratio, as shown above, multiplied by the average account value over the period, multiplied by the number of days in the period, divided by the number of days in the year. |
6
Table of Contents
MFS Blended Research Core Equity Portfolio
PORTFOLIO OF INVESTMENTS – 12/31/12
The Portfolio of Investments is a complete list of all securities owned by your fund. It is categorized by broad-based asset classes.
| Issuer | Shares/Par | Value ($) | ||||||
| COMMON STOCKS – 99.5% | ||||||||
| Aerospace – 3.0% | ||||||||
| Lockheed Martin Corp. | 49,170 | $ | 4,537,898 | |||||
| Northrop Grumman Corp. | 48,360 | 3,268,169 | ||||||
| United Technologies Corp. | 68,600 | 5,625,886 | ||||||
|
| |||||||
| $ | 13,431,953 | |||||||
|
| |||||||
| Automotive – 2.1% | ||||||||
| Delphi Automotive PLC (a) | 131,580 | $ | 5,032,935 | |||||
| Johnson Controls, Inc. | 140,940 | 4,326,858 | ||||||
|
| |||||||
| $ | 9,359,793 | |||||||
|
| |||||||
| Biotechnology – 2.3% | ||||||||
| Amgen, Inc. | 94,420 | $ | 8,150,334 | |||||
| Gilead Sciences, Inc. (a) | 26,620 | 1,955,239 | ||||||
|
| |||||||
| $ | 10,105,573 | |||||||
|
| |||||||
| Broadcasting – 1.1% | ||||||||
| Viacom, Inc., “B” | 89,660 | $ | 4,728,668 | |||||
|
| |||||||
| Business Services – 1.8% | ||||||||
| Accenture PLC, “A” | 87,130 | $ | 5,794,145 | |||||
| CoreLogic, Inc. (a) | 77,200 | 2,078,224 | ||||||
|
| |||||||
| $ | 7,872,369 | |||||||
|
| |||||||
| Cable TV – 2.8% | ||||||||
| Comcast Corp., “A” | 144,570 | $ | 5,404,027 | |||||
| Time Warner Cable, Inc. | 71,320 | 6,931,591 | ||||||
|
| |||||||
| $ | 12,335,618 | |||||||
|
| |||||||
| Chemicals – 2.0% | ||||||||
| CF Industries Holdings, Inc. | 25,860 | $ | 5,253,718 | |||||
| PPG Industries, Inc. | 27,200 | 3,681,520 | ||||||
|
| |||||||
| $ | 8,935,238 | |||||||
|
| |||||||
| Computer Software – 4.6% | ||||||||
| Microsoft Corp. | 399,520 | $ | 10,679,170 | |||||
| Oracle Corp. | 118,070 | 3,934,092 | ||||||
| SolarWinds, Inc. (a) | 113,310 | 5,943,110 | ||||||
|
| |||||||
| $ | 20,556,372 | |||||||
|
| |||||||
| Computer Software – Systems – 6.8% | ||||||||
| Apple, Inc. | 40,650 | $ | 21,667,670 | |||||
| Hewlett-Packard Co. | 302,850 | 4,315,613 | ||||||
| International Business Machines Corp. | 14,550 | 2,787,053 | ||||||
| Seagate Technology PLC | 55,500 | 1,691,640 | ||||||
|
| |||||||
| $ | 30,461,976 | |||||||
|
| |||||||
| Consumer Products – 2.7% | ||||||||
| Nu Skin Enterprises, Inc., “A” | 105,670 | $ | 3,915,074 | |||||
| Procter & Gamble Co. | 122,200 | 8,296,158 | ||||||
|
| |||||||
| $ | 12,211,232 | |||||||
|
| |||||||
| Consumer Services – 1.0% | ||||||||
| Expedia, Inc. | 67,070 | $ | 4,121,452 | |||||
| Priceline.com, Inc. (a) | 840 | 521,808 | ||||||
|
| |||||||
| $ | 4,643,260 | |||||||
|
| |||||||
| Issuer | Shares/Par | Value ($) | ||||||
| COMMON STOCKS – continued | ||||||||
| Electrical Equipment – 0.9% | ||||||||
| General Electric Co. | 185,960 | $ | 3,903,300 | |||||
|
| |||||||
| Electronics – 1.4% | ||||||||
| Intel Corp. | 296,080 | $ | 6,108,130 | |||||
|
| |||||||
| Energy – Independent – 2.4% | ||||||||
| Energy XXI (Bermuda) Ltd. | 92,595 | $ | 2,980,633 | |||||
| EOG Resources, Inc. | 15,380 | 1,857,750 | ||||||
| HollyFrontier Corp. | 88,900 | 4,138,295 | ||||||
| Marathon Petroleum Corp. | 24,060 | 1,515,780 | ||||||
|
| |||||||
| $ | 10,492,458 | |||||||
|
| |||||||
| Energy – Integrated – 7.3% | ||||||||
| Chevron Corp. | 114,570 | $ | 12,389,600 | |||||
| Exxon Mobil Corp. | 230,240 | 19,927,272 | ||||||
|
| |||||||
| $ | 32,316,872 | |||||||
|
| |||||||
| Food & Beverages – 3.8% | ||||||||
| Coca-Cola Co. | 16,360 | $ | 593,050 | |||||
| Coca-Cola Enterprises, Inc. | 164,840 | 5,230,373 | ||||||
| General Mills, Inc. | 130,680 | 5,280,779 | ||||||
| PepsiCo, Inc. | 21,240 | 1,453,453 | ||||||
| Tyson Foods, Inc., “A” | 232,860 | 4,517,484 | ||||||
|
| |||||||
| $ | 17,075,139 | |||||||
|
| |||||||
| Food & Drug Stores – 4.0% | ||||||||
| CVS Caremark Corp. | 155,510 | $ | 7,518,909 | |||||
| Kroger Co. | 200,970 | 5,229,239 | ||||||
| Walgreen Co. | 139,700 | 5,170,297 | ||||||
|
| |||||||
| $ | 17,918,445 | |||||||
|
| |||||||
| General Merchandise – 2.1% | ||||||||
| Dillard’s, Inc. | 31,570 | $ | 2,644,619 | |||||
| Macy’s, Inc. | 127,720 | 4,983,634 | ||||||
| Target Corp. | 28,440 | 1,682,795 | ||||||
|
| |||||||
| $ | 9,311,048 | |||||||
|
| |||||||
| Insurance – 5.3% | ||||||||
| American International Group, Inc. (a) | 167,770 | $ | 5,922,281 | |||||
| Berkshire Hathaway, Inc., “B” (a) | 6,670 | 598,299 | ||||||
| Everest Re Group Ltd. | 32,410 | 3,563,480 | ||||||
| MetLife, Inc. | 139,270 | 4,587,554 | ||||||
| Prudential Financial, Inc. | 106,870 | 5,699,377 | ||||||
| Travelers Cos., Inc. | 5,260 | 377,773 | ||||||
| Validus Holdings Ltd. | 84,170 | 2,910,599 | ||||||
|
| |||||||
| $ | 23,659,363 | |||||||
|
| |||||||
| Internet – 2.7% | ||||||||
| AOL, Inc. | 57,620 | $ | 1,706,128 | |||||
| Google, Inc., “A” (a) | 10,990 | 7,795,976 | ||||||
| Yahoo!, Inc. (a) | 118,710 | 2,362,329 | ||||||
|
| |||||||
| $ | 11,864,433 | |||||||
|
| |||||||
7
Table of Contents
MFS Blended Research Core Equity Portfolio
Portfolio of Investments – continued
| Issuer | Shares/Par | Value ($) | ||||||
| COMMON STOCKS – continued | ||||||||
| Machinery & Tools – 1.9% | ||||||||
| Cummins, Inc. | 52,040 | $ | 5,638,534 | |||||
| Kennametal, Inc. | 65,650 | 2,626,000 | ||||||
|
| |||||||
| $ | 8,264,534 | |||||||
|
| |||||||
| Major Banks – 6.9% | ||||||||
| Goldman Sachs Group, Inc. | 52,150 | $ | 6,652,254 | |||||
| JPMorgan Chase & Co. | 250,610 | 11,019,322 | ||||||
| KeyCorp | 316,690 | 2,666,530 | ||||||
| PNC Financial Services Group, Inc. | 98,180 | 5,724,876 | ||||||
| State Street Corp. | 26,920 | 1,265,509 | ||||||
| Wells Fargo & Co. | 103,710 | 3,544,808 | ||||||
|
| |||||||
| $ | 30,873,299 | |||||||
|
| |||||||
| Medical & Health Technology & Services – 1.1% | ||||||||
| HCA Holdings, Inc. | 158,350 | $ | 4,777,420 | |||||
|
| |||||||
| Medical Equipment – 1.9% | ||||||||
| Medtronic, Inc. | 79,770 | $ | 3,272,165 | |||||
| Thermo Fisher Scientific, Inc. | 82,140 | 5,238,889 | ||||||
|
| |||||||
| $ | 8,511,054 | |||||||
|
| |||||||
| Network & Telecom – 0.8% | ||||||||
| Qualcomm, Inc. | 56,090 | $ | 3,478,702 | |||||
|
| |||||||
| Oil Services – 1.3% | ||||||||
| Halliburton Co. | 74,820 | $ | 2,595,506 | |||||
| Oil States International, Inc. (a) | 45,610 | 3,262,939 | ||||||
|
| |||||||
| $ | 5,858,445 | |||||||
|
| |||||||
| Other Banks & Diversified Financials – 2.8% | ||||||||
| Citigroup, Inc. | 102,783 | $ | 4,066,095 | |||||
| Discover Financial Services | 156,890 | 6,048,110 | ||||||
| Visa, Inc., “A” | 16,440 | 2,491,975 | ||||||
|
| |||||||
| $ | 12,606,180 | |||||||
|
| |||||||
| Pharmaceuticals – 6.9% | ||||||||
| Abbott Laboratories | 134,770 | $ | 8,827,435 | |||||
| Johnson & Johnson | 103,620 | 7,263,762 | ||||||
| Merck & Co., Inc. | 124,490 | 5,096,621 | ||||||
| Pfizer, Inc. | 389,980 | 9,780,698 | ||||||
|
| |||||||
| $ | 30,968,516 | |||||||
|
| |||||||
| Railroad & Shipping – 0.5% | ||||||||
| Union Pacific Corp. | 17,540 | $ | 2,205,129 | |||||
|
| |||||||
| Real Estate – 0.3% | ||||||||
| Public Storage, Inc., REIT | 9,980 | $ | 1,446,701 | |||||
|
| |||||||
| Restaurants – 1.0% | ||||||||
| McDonald’s Corp. | 48,600 | $ | 4,287,006 | |||||
| Starbucks Corp. | 6,950 | 372,659 | ||||||
|
| |||||||
| $ | 4,659,665 | |||||||
|
| |||||||
| Specialty Chemicals – 1.3% | ||||||||
| Airgas, Inc. | 61,060 | $ | 5,574,167 | |||||
|
| |||||||
| Issuer | Shares/Par | Value ($) | ||||||
| COMMON STOCKS – continued | ||||||||
| Specialty Stores – 0.9% | ||||||||
| American Eagle Outfitters, Inc. | 91,510 | $ | 1,876,870 | |||||
| Gap, Inc. | 73,620 | 2,285,165 | ||||||
|
| |||||||
| $ | 4,162,035 | |||||||
|
| |||||||
| Telecommunications – Wireless – 1.8% | ||||||||
| American Tower Corp., REIT | 81,120 | $ | 6,268,142 | |||||
| Sprint Nextel Corp. (a) | 294,570 | 1,670,212 | ||||||
|
| |||||||
| $ | 7,938,354 | |||||||
|
| |||||||
| Telephone Services – 3.2% | ||||||||
| AT&T, Inc. | 97,020 | $ | 3,270,544 | |||||
| CenturyLink, Inc. | 124,980 | 4,889,218 | ||||||
| Verizon Communications, Inc. | 137,530 | 5,950,923 | ||||||
|
| |||||||
| $ | 14,110,685 | |||||||
|
| |||||||
| Tobacco – 2.4% | ||||||||
| Lorillard, Inc. | 43,120 | $ | 5,030,810 | |||||
| Philip Morris International, Inc. | 69,680 | 5,828,035 | ||||||
|
| |||||||
| $ | 10,858,845 | |||||||
|
| |||||||
| Trucking – 1.1% | ||||||||
| United Parcel Service, Inc., “B” | 68,080 | $ | 5,019,538 | |||||
|
| |||||||
| Utilities – Electric Power – 3.3% | ||||||||
| AES Corp. | 446,240 | $ | 4,774,768 | |||||
| American Electric Power Co., Inc. | 124,140 | 5,298,295 | ||||||
| FirstEnergy Corp. | 111,290 | 4,647,470 | ||||||
|
| |||||||
| $ | 14,720,533 | |||||||
|
| |||||||
| Total Common Stocks (Identified Cost, $394,826,136) | $ | 443,325,042 | ||||||
|
| |||||||
| MONEY MARKET FUNDS – 0.6% | ||||||||
| MFS Institutional Money Market Portfolio, 0.16%, at Cost and Net Asset Value (v) | 2,624,089 | $ | 2,624,089 | |||||
|
| |||||||
| Total Investments (Identified Cost, $397,450,225) | $ | 445,949,131 | ||||||
|
| |||||||
| OTHER ASSETS, LESS LIABILITIES – (0.1)% | (304,678 | ) | ||||||
|
| |||||||
| Net Assets – 100.0% | $ | 445,644,453 | ||||||
|
| |||||||
| (a) | Non-income producing security. |
| (v) | Underlying affiliated fund that is available only to investment companies managed by MFS. The rate quoted for the MFS Institutional Money Market Portfolio is the annualized seven-day yield of the fund at period end. |
The following abbreviations are used in this report and are defined:
| PLC | Public Limited Company |
| REIT | Real Estate Investment Trust |
See Notes to Financial Statements
8
Table of Contents
MFS Blended Research Core Equity Portfolio
FINANCIAL STATEMENTS | STATEMENT OF ASSETS AND LIABILITIES
This statement represents your fund’s balance sheet, which details the assets and liabilities comprising the total value of the fund.
At 12/31/12 | ||||||||
Assets | ||||||||
Investments – | ||||||||
Non-affiliated issuers, at value (identified cost, $394,826,136) | $443,325,042 | |||||||
Underlying affiliated funds, at cost and value | 2,624,089 | |||||||
Total investments, at value (identified cost, $397,450,225) | $445,949,131 | |||||||
Receivables for | ||||||||
Dividends | 310,866 | |||||||
Other assets | 4,911 | |||||||
Total assets | $446,264,908 | |||||||
Liabilities | ||||||||
Payable for fund shares reacquired | $511,687 | |||||||
Payable to affiliates | ||||||||
Investment adviser | 29,211 | |||||||
Shareholder servicing costs | 319 | |||||||
Distribution and/or service fees | 3,642 | |||||||
Payable for independent Trustees’ compensation | 53 | |||||||
Accrued expenses and other liabilities | 75,543 | |||||||
Total liabilities | $620,455 | |||||||
Net assets | $445,644,453 | |||||||
Net assets consist of | ||||||||
Paid-in capital | $479,488,552 | |||||||
Unrealized appreciation (depreciation) on investments | 48,498,906 | |||||||
Accumulated net realized gain (loss) on investments | (91,578,621 | ) | ||||||
Undistributed net investment income | 9,235,616 | |||||||
Net assets | $445,644,453 | |||||||
Shares of beneficial interest outstanding | 12,349,709 |
| Net assets | Shares outstanding | Net asset value per share | ||||||||||
Initial Class | $311,265,304 | 8,609,623 | $36.15 | |||||||||
Service Class | 134,379,149 | 3,740,086 | 35.93 | |||||||||
See Notes to Financial Statements
9
Table of Contents
MFS Blended Research Core Equity Portfolio
FINANCIAL STATEMENTS | STATEMENT OF OPERATIONS
This statement describes how much your fund earned in investment income and accrued in expenses. It also describes any gains and/or losses generated by fund operations.
Year ended 12/31/12 | ||||||||
Net investment income | ||||||||
Income | ||||||||
Dividends | $12,403,225 | |||||||
Interest | 4,318 | |||||||
Dividends from underlying affiliated funds | 2,956 | |||||||
Total investment income | $12,410,499 | |||||||
Expenses | ||||||||
Management fee | $2,570,573 | |||||||
Distribution and/or service fees | 360,531 | |||||||
Shareholder servicing costs | 42,773 | |||||||
Administrative services fee | 77,136 | |||||||
Independent Trustees’ compensation | 14,056 | |||||||
Custodian fee | 37,794 | |||||||
Shareholder communications | 16,492 | |||||||
Audit and tax fees | 47,768 | |||||||
Legal fees | 7,819 | |||||||
Miscellaneous | 26,225 | |||||||
Total expenses | $3,201,167 | |||||||
Fees paid indirectly | (19 | ) | ||||||
Reduction of expenses by investment adviser | (33,329 | ) | ||||||
Net expenses | $3,167,819 | |||||||
Net investment income | $9,242,680 | |||||||
Realized and unrealized gain (loss) on investments | ||||||||
Realized gain (loss) on investments (identified cost basis) | $26,292,756 | |||||||
Change in unrealized appreciation (depreciation) on investments | $31,981,039 | |||||||
Net realized and unrealized gain (loss) on investments | $58,273,795 | |||||||
Change in net assets from operations | $67,516,475 |
See Notes to Financial Statements
10
Table of Contents
MFS Blended Research Core Equity Portfolio
FINANCIAL STATEMENTS | STATEMENTS OF CHANGES IN NET ASSETS
These statements describe the increases and/or decreases in net assets resulting from operations, any distributions, and any shareholder transactions.
For years ended 12/31 | 2012 | 2011 | ||||||
Change in net assets | ||||||||
From operations | ||||||||
Net investment income | $9,242,680 | $7,344,092 | ||||||
Net realized gain (loss) on investments | 26,292,756 | 30,452,125 | ||||||
Net unrealized gain (loss) on investments | 31,981,039 | (26,479,652 | ) | |||||
Change in net assets from operations | $67,516,475 | $11,316,565 | ||||||
Distributions declared to shareholders | ||||||||
From net investment income | $(7,350,033 | ) | $(9,057,199 | ) | ||||
Change in net assets from fund share transactions | $(77,518,816 | ) | $(84,728,511 | ) | ||||
Total change in net assets | $(17,352,374 | ) | $(82,469,145 | ) | ||||
Net assets | ||||||||
At beginning of period | 462,996,827 | 545,465,972 | ||||||
At end of period (including undistributed net investment income of $9,235,616 and | $445,644,453 | $462,996,827 |
See Notes to Financial Statements
11
Table of Contents
MFS Blended Research Core Equity Portfolio
FINANCIAL STATEMENTS | FINANCIAL HIGHLIGHTS
The financial highlights table is intended to help you understand the fund’s financial performance for the past 5 years. Certain information reflects financial results for a single fund share. The total returns in the table represent the rate by which an investor would have earned (or lost) on an investment in the fund share class (assuming reinvestment of all distributions) held for the entire period.
| Initial Class | Years ended 12/31 | |||||||||||||||||||
| 2012 | 2011 | 2010 | 2009 | 2008 | ||||||||||||||||
Net asset value, beginning of period | $31.86 | $31.89 | $27.84 | $22.80 | $35.51 | |||||||||||||||
| Income (loss) from investment operations | ||||||||||||||||||||
Net investment income (d) | $0.72 | $0.49 | $0.51 | $0.43 | $0.48 | |||||||||||||||
Net realized and unrealized gain (loss) on investments | 4.17 | 0.10 | 4.05 | 5.16 | (12.74 | ) | ||||||||||||||
Total from investment operations | $4.89 | $0.59 | $4.56 | $5.59 | $(12.26 | ) | ||||||||||||||
| Less distributions declared to shareholders | ||||||||||||||||||||
From net investment income | $(0.60 | ) | $(0.62 | ) | $(0.51 | ) | $(0.55 | ) | $(0.45 | ) | ||||||||||
Net asset value, end of period (x) | $36.15 | $31.86 | $31.89 | $27.84 | $22.80 | |||||||||||||||
Total return (%) (k)(r)(s)(x) | 15.37 | 1.97 | 16.46 | 25.26 | (34.95 | ) | ||||||||||||||
Ratios (%) (to average net assets) and Supplemental data: | ||||||||||||||||||||
Expenses before expense reductions (f) | 0.61 | 0.64 | 0.65 | 0.66 | 0.64 | |||||||||||||||
Expenses after expense reductions (f) | 0.60 | 0.60 | 0.60 | 0.60 | 0.60 | |||||||||||||||
Net investment income | 2.06 | 1.52 | 1.77 | 1.81 | 1.60 | |||||||||||||||
Portfolio turnover | 54 | 77 | 68 | 74 | 76 | |||||||||||||||
Net assets at end of period (000 omitted) | $311,265 | $315,115 | $360,667 | $361,105 | $342,241 | |||||||||||||||
| Service Class | Years ended 12/31 | |||||||||||||||||||
| 2012 | 2011 | 2010 | 2009 | 2008 | ||||||||||||||||
Net asset value, beginning of period | $31.65 | $31.66 | $27.66 | $22.62 | $35.23 | |||||||||||||||
| Income (loss) from investment operations | ||||||||||||||||||||
Net investment income (d) | $0.62 | $0.41 | $0.44 | $0.37 | $0.41 | |||||||||||||||
Net realized and unrealized gain (loss) on investments | 4.15 | 0.11 | 4.00 | 5.14 | (12.66 | ) | ||||||||||||||
Total from investment operations | $4.77 | $0.52 | $4.44 | $5.51 | $(12.25 | ) | ||||||||||||||
| Less distributions declared to shareholders | ||||||||||||||||||||
From net investment income | $(0.49 | ) | $(0.53 | ) | $(0.44 | ) | $(0.47 | ) | $(0.36 | ) | ||||||||||
Net asset value, end of period (x) | $35.93 | $31.65 | $31.66 | $27.66 | $22.62 | |||||||||||||||
Total return (%) (k)(r)(s)(x) | 15.10 | 1.74 | 16.12 | 25.00 | (35.12 | ) | ||||||||||||||
Ratios (%) (to average net assets) and Supplemental data: | ||||||||||||||||||||
Expenses before expense reductions (f) | 0.86 | 0.89 | 0.90 | 0.91 | 0.90 | |||||||||||||||
Expenses after expense reductions (f) | 0.85 | 0.85 | 0.85 | 0.85 | 0.85 | |||||||||||||||
Net investment income | 1.80 | 1.26 | 1.52 | 1.57 | 1.35 | |||||||||||||||
Portfolio turnover | 54 | 77 | 68 | 74 | 76 | |||||||||||||||
Net assets at end of period (000 omitted) | $134,379 | $147,882 | $184,799 | $199,348 | $193,658 | |||||||||||||||
| (d) | Per share data is based on average shares outstanding. |
| (f) | Ratios do not reflect reductions from fees paid indirectly, if applicable. |
| (k) | The total return does not reflect expenses that apply to separate accounts. Inclusion of these charges would reduce the total return figures for all periods shown. |
| (r) | Certain expenses have been reduced without which performance would have been lower. |
| (s) | From time to time the fund may receive proceeds from litigation settlements, without which performance would be lower. |
| (x) | The net asset values per share and total returns have been calculated on net assets which include adjustments made in accordance with U.S. generally accepted accounting principles required at period end for financial reporting purposes. |
See Notes to Financial Statements
12
Table of Contents
MFS Blended Research Core Equity Portfolio
| (1) | Business and Organization |
MFS Blended Research Core Equity Portfolio (the fund) is a series of MFS Variable Insurance Trust II (the trust). The trust is organized as a Massachusetts business trust and is registered under the Investment Company Act of 1940, as amended, as an open-end management investment company. The shareholders of each series of the trust are separate accounts of insurance companies, which offer variable annuity and/or life insurance products, and qualified retirement and pension plans.
| (2) | Significant Accounting Policies |
General – The preparation of financial statements in conformity with U.S. generally accepted accounting principles requires management to make estimates and assumptions that affect the reported amounts of assets and liabilities, and disclosure of contingent assets and liabilities at the date of the financial statements and the reported amounts of revenues and expenses during the reporting period. Actual results could differ from those estimates. In the preparation of these financial statements, management has evaluated subsequent events occurring after the date of the fund’s Statement of Assets and Liabilities through the date that the financial statements were issued.
In this reporting period the fund adopted Financial Accounting Standards Board (FASB) Accounting Standards Update 2011-04, Fair Value Measurement (Topic 820) – Amendments to Achieve Common Fair Value Measurement and Disclosure Requirements in U.S. GAAP and IFRSs (“ASU 2011-04”). ASU 2011-04 seeks to improve the comparability of fair value measurements as presented and disclosed in financial statements prepared in accordance with U.S. GAAP and International Financial Reporting Standards (IFRS) by providing common requirements for fair value measurement and disclosure.
In December 2011, the FASB issued Accounting Standards Update 2011-11, Balance Sheet (Topic 210) – Disclosures about Offsetting Assets and Liabilities (“ASU 2011-11”). Effective for annual reporting periods beginning on or after January 1, 2013 and interim periods within those annual periods, ASU 2011-11 is intended to enhance disclosure requirements on the offsetting of financial assets and liabilities. Although still evaluating the potential impacts of ASU 2011-11 to the fund, management expects that the impact of the fund’s adoption will be limited to additional financial statement disclosures.
Investment Valuations – Equity securities, including restricted equity securities, are generally valued at the last sale or official closing price as provided by a third-party pricing service on the market or exchange on which they are primarily traded. Equity securities, for which there were no sales reported that day, are generally valued at the last quoted daily bid quotation as provided by a third-party pricing service on the market or exchange on which such securities are primarily traded. Short-term instruments with a maturity at issuance of 60 days or less generally are valued at amortized cost, which approximates market value. Open-end investment companies are generally valued at net asset value per share. Securities and other assets generally valued on the basis of information from a third-party pricing service may also be valued at a broker/dealer bid quotation. Values obtained from third-party pricing services can utilize both transaction data and market information such as yield, quality, coupon rate, maturity, type of issue, trading characteristics, and other market data.
The Board of Trustees has delegated primary responsibility for determining or causing to be determined the value of the fund’s investments (including any fair valuation) to the adviser pursuant to valuation policies and procedures approved by the Board. If the adviser determines that reliable market quotations are not readily available, investments are valued at fair value as determined in good faith by the adviser in accordance with such procedures under the oversight of the Board of Trustees. Under the fund’s valuation policies and procedures, market quotations are not considered to be readily available for most types of debt instruments and floating rate loans and many types of derivatives. These investments are generally valued at fair value based on information from third-party pricing services. In addition, investments may be valued at fair value if the adviser determines that an investment’s value has been materially affected by events occurring after the close of the exchange or market on which the investment is principally traded (such as foreign exchange or market) and prior to the determination of the fund’s net asset value, or after the halting of trading of a specific security where trading does not resume prior to the close of the exchange or market on which the security is principally traded. Events that occur on a frequent basis after foreign markets close (such as developments in foreign markets and significant movements in the U.S. markets) and prior to the determination of the fund’s net asset value may be deemed to have a material effect on the value of securities traded in foreign markets. Accordingly, the fund’s foreign equity securities may often be valued at fair value. The adviser generally relies on third-party pricing services or other information (such as the correlation with price movements of similar securities in the same or other markets; the type, cost and investment characteristics of the security; the business and financial condition of the issuer; and trading and other market data) to assist in determining whether to fair value and at what value to fair value an investment. The value of an investment for purposes of calculating the fund’s net asset value can differ depending on the source and method used to determine value. When fair valuation is used, the value of an investment used to determine the fund’s net asset value may differ from quoted or published prices for the same investment. There can be no assurance that the fund could obtain the fair value assigned to an investment if it were to sell the investment at the same time at which the fund determines its net asset value per share.
Various inputs are used in determining the value of the fund’s assets or liabilities. These inputs are categorized into three broad levels. In certain cases, the inputs used to measure fair value may fall into different levels of the fair value hierarchy. In such cases, an
13
Table of Contents
MFS Blended Research Core Equity Portfolio
Notes to Financial Statements – continued
investment’s level within the fair value hierarchy is based on the lowest level of input that is significant to the fair value measurement. The fund’s assessment of the significance of a particular input to the fair value measurement in its entirety requires judgment, and considers factors specific to the investment. Level 1 includes unadjusted quoted prices in active markets for identical assets or liabilities. Level 2 includes other significant observable market-based inputs (including quoted prices for similar securities, interest rates, prepayment speed, and credit risk). Level 3 includes unobservable inputs, which may include the adviser’s own assumptions in determining the fair value of investments. The following is a summary of the levels used as of December 31, 2012 in valuing the fund’s assets or liabilities:
| Investments at Value | Level 1 | Level 2 | Level 3 | Total | ||||||||||||
| Equity Securities | $443,325,042 | $— | $— | $443,325,042 | ||||||||||||
| Mutual Funds | 2,624,089 | — | — | 2,624,089 | ||||||||||||
| Total Investments | $445,949,131 | $— | $— | $445,949,131 | ||||||||||||
For further information regarding security characteristics, see the Portfolio of Investments.
Security Loans – State Street Bank and Trust Company (“State Street”), as lending agent, loans the securities of the fund to certain qualified institutions (the “Borrowers”) approved by the fund. The loans are collateralized by cash and/or U.S. Treasury and federal agency obligations in an amount typically at least equal to the market value of the securities loaned. The market value of the loaned securities is determined at the close of business of the fund and any additional required collateral is delivered to the fund on the next business day. State Street provides the fund with indemnification against Borrower default. The fund bears the risk of loss with respect to the investment of cash collateral. On loans collateralized by cash, the cash collateral is invested in a money market fund or short-term securities. A portion of the income generated upon investment of the collateral is remitted to the Borrowers, and the remainder is allocated between the fund and the lending agent. On loans collateralized by U.S. Treasury and/or federal agency obligations, a fee is received from the Borrower, and is allocated between the fund and the lending agent. Income from securities lending is included in “Interest” income in the Statement of Operations. The dividend and interest income earned on the securities loaned is accounted for in the same manner as other dividend and interest income. At December 31, 2012, there were no securities on loan or collateral outstanding.
Indemnifications – Under the fund’s organizational documents, its officers and Trustees may be indemnified against certain liabilities and expenses arising out of the performance of their duties to the fund. Additionally, in the normal course of business, the fund enters into agreements with service providers that may contain indemnification clauses. The fund’s maximum exposure under these agreements is unknown as this would involve future claims that may be made against the fund that have not yet occurred.
Investment Transactions and Income – Investment transactions are recorded on the trade date. Interest income is recorded on the accrual basis. Dividends received in cash are recorded on the ex-dividend date. Certain dividends from foreign securities will be recorded when the fund is informed of the dividend if such information is obtained subsequent to the ex-dividend date. Dividend and interest payments received in additional securities are recorded on the ex-dividend or ex-interest date in an amount equal to the value of the security on such date.
The fund may receive proceeds from litigation settlements. Any proceeds received from litigation involving portfolio holdings are reflected in the Statement of Operations in realized gain/loss if the security has been disposed of by the fund or in unrealized gain/loss if the security is still held by the fund. Any other proceeds from litigation not related to portfolio holdings are reflected as other income in the Statement of Operations.
Fees Paid Indirectly – The fund’s custody fee may be reduced according to an arrangement that measures the value of cash deposited with the custodian by the fund. This amount, for the year ended December 31, 2012, is shown as a reduction of total expenses in the Statement of Operations.
Tax Matters and Distributions – The fund intends to qualify as a regulated investment company, as defined under Subchapter M of the Internal Revenue Code, and to distribute all of its taxable income, including realized capital gains. As a result, no provision for federal income tax is required. The fund’s federal tax returns, when filed, will remain subject to examination by the Internal Revenue Service for a three year period.
Distributions to shareholders are recorded on the ex-dividend date. Income and capital gain distributions are determined in accordance with income tax regulations, which may differ from U.S. generally accepted accounting principles. Certain capital accounts in the financial statements are periodically adjusted for permanent differences in order to reflect their tax character. These adjustments have no impact on net assets or net asset value per share. Temporary differences which arise from recognizing certain items of income, expense, gain or loss in different periods for financial statement and tax purposes will reverse at some time in the future. Distributions in excess of net investment income or net realized gains are temporary overdistributions for financial statement purposes resulting from differences in the recognition or classification of income or distributions for financial statement and tax purposes.
14
Table of Contents
MFS Blended Research Core Equity Portfolio
Notes to Financial Statements – continued
Book/tax differences primarily relate to wash sale loss deferrals.
The tax character of distributions declared to shareholders for the last two fiscal years is as follows:
| 12/31/12 | 12/31/11 | |||||||
| Ordinary income (including any short-term capital gains) | $7,350,033 | $9,057,199 | ||||||
The federal tax cost and the tax basis components of distributable earnings were as follows:
| As of 12/31/12 | ||||
| Cost of investments | $397,564,511 | |||
| Gross appreciation | 63,677,536 | |||
| Gross depreciation | (15,292,916 | ) | ||
| Net unrealized appreciation (depreciation) | $48,384,620 | |||
| Undistributed ordinary income | 9,235,616 | |||
| Capital loss carryforwards | (91,464,335 | ) | ||
Under the Regulated Investment Company Modernization Act of 2010 (the “Act”), net capital losses recognized after December 31, 2010 may be carried forward indefinitely, and their character is retained as short-term and/or long-term losses. Previously, net capital losses were carried forward for eight years and treated as short-term losses. As a transition rule, the Act requires that post-enactment net capital losses be used before pre-enactment net capital losses.
As of December 31, 2012, the fund had capital loss carryforwards available to offset future realized gains. Such losses expire as follows:
| Pre-enactment losses: | ||||
| 12/31/16 | $(19,639,670 | ) | ||
| 12/31/17 | (71,824,665 | ) | ||
| Total | $(91,464,335 | ) | ||
Multiple Classes of Shares of Beneficial Interest – The fund offers multiple classes of shares, which differ in their respective distribution and/or service fees. The fund’s income, realized and unrealized gain (loss), and common expenses are allocated to shareholders based on the daily net assets of each class. Dividends are declared separately for each class. Differences in per share dividend rates are generally due to differences in separate class expenses. The fund’s distributions declared to shareholders as reported in the Statements of Changes in Net Assets are presented by class as follows:
| From net investment income | ||||||||
| Year ended 12/31/12 | Year ended 12/31/11 | |||||||
| Initial Class | $5,385,734 | $6,388,464 | ||||||
| Service Class | 1,964,299 | 2,668,735 | ||||||
| Total | $7,350,033 | $9,057,199 | ||||||
| (3) | Transactions with Affiliates |
Investment Adviser – The fund has an investment advisory agreement with MFS to provide overall investment management and related administrative services and facilities to the fund. The management fee is computed daily and paid monthly at an annual rate of 0.55% of the fund’s average daily net assets.
Effective May 1, 2013, the investment adviser has agreed in writing to reduce its management fee to 0.40% of the fund’s average daily net assets. This written agreement will continue until modified by the fund’s Board of Trustees, but such agreement will continue at least until April 30, 2014.
The investment adviser has agreed in writing to pay a portion of the fund’s total annual operating expenses, exclusive of interest, taxes, extraordinary expenses, brokerage and transaction costs, and investment-related expenses, such that total annual operating expenses do not exceed 0.60% of average daily net assets for the Initial Class shares and 0.85% of average daily net assets for the Service Class shares. This written agreement will continue until April 30, 2013. For the year ended December 31, 2012, this reduction amounted to $31,647 and is reflected as a reduction of total expenses in the Statement of Operations.
Distributor – MFS Fund Distributors, Inc. (MFD), a wholly-owned subsidiary of MFS, is the distributor of shares of the fund. The Trustees have adopted a distribution plan for the Service Class shares pursuant to Rule 12b-1 under the Investment Company Act of 1940.
The fund’s distribution plan provides that the fund will pay MFD distribution and/or service fees equal to 0.25% per annum of its average daily net assets attributable to Service Class shares as partial consideration for services performed and expenses incurred by
15
Table of Contents
MFS Blended Research Core Equity Portfolio
Notes to Financial Statements – continued
MFD and financial intermediaries (including participating insurance companies that invest in the fund to fund variable annuity and variable life insurance contracts, sponsors of qualified retirement and pension plans that invest in the fund, and affiliates of these participating insurance companies and plan sponsors) in connection with the sale and distribution of the Service Class shares. MFD may subsequently pay all, or a portion, of the distribution and/or service fees to financial intermediaries.
Shareholder Servicing Agent – MFS Service Center, Inc. (MFSC), a wholly-owned subsidiary of MFS, receives a fee from the fund for its services as shareholder servicing agent. For the year ended December 31, 2012, the fee was $42,753, which equated to 0.0091% annually of the fund’s average daily net assets. MFSC also receives payment from the fund for out-of-pocket expenses paid by MFSC on behalf of the fund. For the year ended December 31, 2012, these costs amounted to $20.
Administrator – MFS provides certain financial, legal, shareholder communications, compliance, and other administrative services to the fund. Under an administrative services agreement, the fund partially reimburses MFS the costs incurred to provide these services. The fund is charged an annual fixed amount of $17,500 plus a fee based on average daily net assets. The administrative services fee incurred for the year ended December 31, 2012 was equivalent to an annual effective rate of 0.0165% of the fund’s average daily net assets.
Trustees’ and Officers’ Compensation – The fund pays compensation to independent Trustees in the form of a retainer, attendance fees, and additional compensation to Board and Committee chairpersons. The fund does not pay compensation directly to Trustees or officers of the fund who are also officers of the investment adviser, all of whom receive remuneration for their services to the fund from MFS. Certain officers and Trustees of the fund are officers or directors of MFS, MFD, and MFSC.
Other – This fund and certain other funds managed by MFS (the funds) have entered into services agreements (the Agreements) which provide for payment of fees by the funds to Tarantino LLC and Griffin Compliance LLC in return for the provision of services of an Independent Chief Compliance Officer (ICCO) and Assistant ICCO, respectively, for the funds. The ICCO and Assistant ICCO are officers of the funds and the sole members of Tarantino LLC and Griffin Compliance LLC, respectively. The funds can terminate the Agreements with Tarantino LLC and Griffin Compliance LLC at any time under the terms of the Agreements. For the year ended December 31, 2012, the aggregate fees paid by the fund to Tarantino LLC and Griffin Compliance LLC were $3,854 and are included in “Miscellaneous” expense in the Statement of Operations. MFS has agreed to reimburse the fund for a portion of the payments made by the fund in the amount of $1,682, which is shown as a reduction of total expenses in the Statement of Operations. Additionally, MFS has agreed to bear all expenses associated with office space, other administrative support, and supplies provided to the ICCO and Assistant ICCO.
The fund invests in the MFS Institutional Money Market Portfolio which is managed by MFS and seeks current income consistent with preservation of capital and liquidity. Income earned on this investment is included in “Dividends from underlying affiliated funds” in the Statement of Operations. This money market fund does not pay a management fee to MFS.
| (4) | Portfolio Securities |
Purchases and sales of investments, other than short-term obligations, aggregated $248,376,920 and $322,483,941, respectively.
| (5) | Shares of Beneficial Interest |
The fund’s Declaration of Trust permits the Trustees to issue an unlimited number of full and fractional shares of beneficial interest. Transactions in fund shares were as follows:
| Year ended 12/31/12 | Year ended 12/31/11 | |||||||||||||||
| Shares | Amount | Shares | Amount | |||||||||||||
| Shares sold | ||||||||||||||||
Initial Class | 47,190 | $1,656,069 | 101,422 | $3,234,643 | ||||||||||||
Service Class | 61,692 | 2,204,861 | 107,431 | 3,177,466 | ||||||||||||
| 108,882 | $3,860,930 | 208,853 | $6,412,109 | |||||||||||||
| Shares issued to shareholders in reinvestment of distributions | ||||||||||||||||
Initial Class | 151,839 | $5,385,734 | 212,171 | $6,388,464 | ||||||||||||
Service Class | 55,677 | 1,964,299 | 89,136 | 2,668,735 | ||||||||||||
| 207,516 | $7,350,033 | 301,307 | $9,057,199 | |||||||||||||
| Shares reacquired | ||||||||||||||||
Initial Class | (1,481,040 | ) | $(52,044,470 | ) | (1,733,153 | ) | $(56,314,858 | ) | ||||||||
Service Class | (1,050,058 | ) | (36,685,309 | ) | (1,360,219 | ) | (43,882,961 | ) | ||||||||
| (2,531,098 | ) | $(88,729,779 | ) | (3,093,372 | ) | $(100,197,819 | ) | |||||||||
16
Table of Contents
MFS Blended Research Core Equity Portfolio
Notes to Financial Statements – continued
| Year ended 12/31/12 | Year ended 12/31/11 | |||||||||||||||
| Shares | Amount | Shares | Amount | |||||||||||||
| Net change | ||||||||||||||||
Initial Class | (1,282,011 | ) | $(45,002,667 | ) | (1,419,560 | ) | $(46,691,751 | ) | ||||||||
Service Class | (932,689 | ) | (32,516,149 | ) | (1,163,652 | ) | (38,036,760 | ) | ||||||||
| (2,214,700 | ) | $(77,518,816 | ) | (2,583,212 | ) | $(84,728,511 | ) | |||||||||
| (6) | Line of Credit |
The fund and certain other funds managed by MFS participate in a $1.1 billion unsecured committed line of credit, subject to a $1 billion sublimit, provided by a syndication of banks under a credit agreement. Borrowings may be made for temporary financing needs. Interest is charged to each fund, based on its borrowings, generally at a rate equal to the higher of the Federal Reserve funds rate or one month LIBOR plus an agreed upon spread. A commitment fee, based on the average daily, unused portion of the committed line of credit, is allocated among the participating funds at the end of each calendar quarter. In addition, the fund and other funds managed by MFS have established unsecured uncommitted borrowing arrangements with certain banks for temporary financing needs. Interest is charged to each fund, based on its borrowings, at a rate equal to the Federal Reserve funds rate plus an agreed upon spread. For the year ended December 31, 2012, the fund’s commitment fee and interest expense were $3,017 and $0, respectively, and are included in “Miscellaneous” expense in the Statement of Operations.
| (7) | Transactions in Underlying Affiliated Funds – Affiliated Issuers |
An affiliated issuer may be considered one in which the fund owns 5% or more of the outstanding voting securities, or a company which is under common control. For the purposes of this report, the fund assumes the following to be an affiliated issuer:
| Underlying Affiliated Fund | Beginning Shares/Par Amount | Acquisitions Shares/Par Amount | Dispositions Shares/Par Amount | Ending Shares/Par Amount | ||||||||||||
| MFS Institutional Money Market Portfolio | 632,653 | 72,150,054 | (70,158,618 | ) | 2,624,089 | |||||||||||
| Underlying Affiliated Fund | Realized Gain (Loss) | Capital Gain Distributions | Dividend Income | �� | Ending Value | |||||||||||
| MFS Institutional Money Market Portfolio | $— | $— | $2,956 | $2,624,089 | ||||||||||||
17
Table of Contents
MFS Blended Research Core Equity Portfolio
REPORT OF INDEPENDENT REGISTERED PUBLIC ACCOUNTING FIRM
To the Board of Trustees of MFS Variable Insurance Trust II and the Shareholders of
MFS Blended Research Core Equity Portfolio:
We have audited the accompanying statement of assets and liabilities, including the portfolio of investments, of MFS Blended Research Core Equity Portfolio (the “Fund”) (one of the series comprising MFS Variable Insurance Trust II) as of December 31, 2012, and the related statement of operations for the year then ended, the statements of changes in net assets for each of the two years in the period then ended, and the financial highlights for each of the five years in the period then ended. These financial statements and financial highlights are the responsibility of the Fund’s management. Our responsibility is to express an opinion on these financial statements and financial highlights based on our audits.
We conducted our audits in accordance with the standards of the Public Company Accounting Oversight Board (United States). Those standards require that we plan and perform the audit to obtain reasonable assurance about whether the financial statements and financial highlights are free of material misstatement. The Fund is not required to have, nor were we engaged to perform, an audit of its internal control over financial reporting. Our audits included consideration of internal control over financial reporting as a basis for designing audit procedures that are appropriate in the circumstances, but not for the purpose of expressing an opinion on the effectiveness of the Fund’s internal control over financial reporting. Accordingly, we express no such opinion. An audit also includes examining, on a test basis, evidence supporting the amounts and disclosures in the financial statements, assessing the accounting principles used and significant estimates made by management, as well as evaluating the overall financial statement presentation. Our procedures included confirmation of securities owned as of December 31, 2012, by correspondence with the custodian and brokers; where replies were not received from brokers, we performed other auditing procedures. We believe that our audits provide a reasonable basis for our opinion.
In our opinion, the financial statements and financial highlights referred to above present fairly, in all material respects, the financial position of MFS Blended Research Core Equity Portfolio as of December 31, 2012, the results of its operations for the year then ended, the changes in its net assets for each of the two years in the period then ended, and the financial highlights for each of the five years in the period then ended, in conformity with accounting principles generally accepted in the United States of America.
DELOITTE & TOUCHE LLP
Boston, Massachusetts
February 15, 2013
18
Table of Contents
MFS Blended Research Core Equity Portfolio
TRUSTEES AND OFFICERS – IDENTIFICATION AND BACKGROUND
The Trustees and officers of the Trust, as of February 1, 2013, are listed below, together with their principal occupations during the past five years. (Their titles may have varied during that period.) The address of each Trustee and officer is 111 Huntington Avenue, Boston, Massachusetts 02199-7618.
Name, Age | Position(s) with Fund | Trustee/Officer Since (h) | Principal Occupations During the Past Five Years | Other Directorships (j) | ||||
| INTERESTED TRUSTEES | ||||||||
Robert J. Manning (k) (age 49) | Trustee | February 2004 | Massachusetts Financial Services Company, Chairman, Chief Executive Officer and Director; President (until December 2009); Chief Investment Officer (until July 2010) | N/A | ||||
| INDEPENDENT TRUSTEES | ||||||||
David H. Gunning (age 70) | Trustee and Chair of Trustees | January 2004 | Private investor | Lincoln Electric Holdings, Inc. (welding equipment manufacturer), Director; Development Alternatives, Inc. (consulting), Director/Non-Executive Chairman; Portman Limited (mining), Director (until 2008) | ||||
Robert E. Butler (age 71) | Trustee | January 2006 | Consultant – investment company industry regulatory and compliance matters | N/A | ||||
Maureen R. Goldfarb (age 57) | Trustee | January 2009 | Private investor | N/A | ||||
William R. Gutow (age 71) | Trustee | December 1993 | Private investor and real estate consultant; Capitol Entertainment Management Company (video franchise), Vice Chairman | Atlantic Coast Tan (tanning salons), Vice Chairman (until 2007); Texas Donuts (donut franchise), Vice Chairman (until 2010) | ||||
Michael Hegarty (age 68) | Trustee | December 2004 | Private investor; Rouse Properties Inc. (real estate), Director | N/A | ||||
John P. Kavanaugh (age 58) | Trustee | January 2009 | Private investor | N/A | ||||
J. Dale Sherratt (age 74) | Trustee | June 1989 | Insight Resources, Inc. (acquisition planning specialists), President; Wellfleet Investments (investor in health care companies), Managing General Partner | N/A | ||||
| Laurie J. Thomsen (age 55) | Trustee | March 2005 | Private investor; New Profit, Inc. (venture philanthropy), Executive Partner (until 2010) | The Travelers Companies (insurance), Director | ||||
Robert W. Uek (age 71) | Trustee | January 2006 | Consultant to investment company industry | N/A | ||||
| OFFICERS | ||||||||
John M. Corcoran (k) (age 47) | President | October 2008 | Massachusetts Financial Services Company, Senior Vice President (since October 2008); State Street Bank and Trust (financial services provider), Senior Vice President, (until September 2008) | N/A | ||||
| Christopher R. Bohane (k) (age 39) | Assistant Secretary and Assistant Clerk | July 2005 | Massachusetts Financial Services Company, Vice President and Senior Counsel | N/A | ||||
Kino Clark (k) (age 44) | Assistant Treasurer | January 2012 | Massachusetts Financial Services Company, Vice President | N/A | ||||
Thomas H. Connors (k) (age 53) | Assistant Secretary and Assistant Clerk | September 2012 | Massachusetts Financial Services Company, Vice President and Senior Counsel; Deutsche Investment Management Americas Inc. (financial service provider), Director and Senior Counsel (until 2012) | N/A | ||||
Ethan D. Corey (k) (age 49) | Assistant Secretary and Assistant Clerk | July 2005 | Massachusetts Financial Services Company, Senior Vice President and Associate General Counsel | N/A | ||||
19
Table of Contents
MFS Blended Research Core Equity Portfolio
Trustees and Officers – continued
Name, Age | Position(s) with Fund | Trustee/Officer Since (h) | Principal Occupations During the Past Five Years | Other Directorships (j) | ||||
David L. DiLorenzo (k) (age 44) | Treasurer | July 2005 | Massachusetts Financial Services Company, Senior Vice President | N/A | ||||
Robyn L. Griffin (age 37) | Assistant Independent Chief Compliance Officer | August 2008 | Griffin Compliance LLC (provider of compliance services), Principal (since August 2008); State Street Corporation (financial services provider), Mutual Fund Administration Assistant Vice President (October 2006 – July 2008) | N/A | ||||
Brian E. Langenfeld (k) (age 39) | Assistant Secretary and Assistant Clerk | June 2006 | Massachusetts Financial Services Company, Vice President and Senior Counsel | N/A | ||||
Susan S. Newton (k) (age 62) | Assistant Secretary and Assistant Clerk | May 2005 | Massachusetts Financial Services Company, Senior Vice President and Associate General Counsel | N/A | ||||
Susan A. Pereira (k) (age 42) | Assistant Secretary and Assistant Clerk | July 2005 | Massachusetts Financial Services Company, Vice President and Senior Counsel | N/A | ||||
Kasey L. Phillips (k) (age 42) | Assistant Treasurer | September 2012 | Massachusetts Financial Services Company, Vice President; Wells Fargo Funds Management, LLC, Senior Vice President, Fund Treasurer (until 2012) | N/A | ||||
Mark N. Polebaum (k) (age 60) | Secretary and Clerk | January 2006 | Massachusetts Financial Services Company, Executive Vice President, General Counsel and Secretary | N/A | ||||
Frank L. Tarantino (age 68) | Independent Chief Compliance Officer | June 2004 | Tarantino LLC (provider of compliance services), Principal | N/A | ||||
Richard S. Weitzel (k) (age 42) | Assistant Secretary and Assistant Clerk | October 2007 | Massachusetts Financial Services Company, Senior Vice President and Associate General Counsel | N/A | ||||
James O. Yost (k) (age 52) | Deputy Treasurer | September 1990 | Massachusetts Financial Services Company, Senior Vice President | N/A | ||||
| (h) | Date first appointed to serve as Trustee/officer of an MFS fund. Each Trustee has served continuously since appointment unless indicated otherwise. For the period from December 15, 2004 until February 22, 2005, Mr. Manning served as Advisory Trustee. For the period October 2008, until January 2012, Mr. Corcoran served as Treasurer of the Funds. Prior to January 2012, Messrs. DiLorenzo and Yost served as Assistant Treasurers of the Funds. |
| (j) | Directorships or trusteeships of companies required to report to the Securities and Exchange Commission (i.e., “public companies”). |
| (k) | “Interested person” of the Trust within the meaning of the Investment Company Act of 1940 (referred to as the 1940 Act), which is the principal federal law governing investment companies like the fund, as a result of position with MFS. The address of MFS is 111 Huntington Avenue, Boston, Massachusetts 02199-7618. |
Each Trustee has been elected by shareholders and each Trustee and officer holds office until his or her successor is chosen and qualified or until his or her earlier death, resignation, retirement or removal. The Trust does not hold annual meetings for the purpose of electing Trustees, and Trustees are not elected for fixed terms. Messrs. Butler, Kavanaugh, Uek and Ms. Thomsen are members of the Trust’s Audit Committee.
Each of the Fund’s Trustees and officers holds comparable positions with certain other funds of which MFS or a subsidiary is the investment adviser or distributor, and, in the case of the officers, with certain affiliates of MFS. As of January 1, 2013, the Trustees served as board members of 143 funds within the MFS Family of Funds.
20
Table of Contents
MFS Blended Research Core Equity Portfolio
Trustees and Officers – continued
The Statement of Additional Information for the Fund includes further information about the Trustees and is available without charge upon request by calling 1-800-225-2606.
Investment Adviser Massachusetts Financial Services Company 111 Huntington Avenue Boston, MA 02199-7618 | Custodian State Street Bank and Trust 1 Lincoln Street Boston, MA 02111-2900 | |
Distributor MFS Fund Distributors, Inc. 111 Huntington Avenue Boston, MA 02199-7618 | Independent Registered Public Accounting Firm Deloitte & Touche LLP 200 Berkeley Street Boston, MA 02116 | |
Portfolio Manager Matthew Krummell |
21
Table of Contents
MFS Blended Research Core Equity Portfolio
BOARD REVIEW OF INVESTMENT ADVISORY AGREEMENT
A discussion regarding the Board’s most recent approval of the fund’s Investment Advisory Agreement with MFS is available by clicking on the fund’s name under “Variable Insurance Portfolios – VIT II” in the “Products” section of the MFS Web site (mfs.com).
PROXY VOTING POLICIES AND INFORMATION
A general description of the MFS funds’ proxy voting policies and procedures is available without charge, upon request, by calling 1-800-225-2606, by visiting the Proxy Voting section of mfs.com or by visiting the SEC’s Web site at http://www.sec.gov.
Information regarding how the fund voted proxies relating to portfolio securities during the most recent twelve-month period ended June 30 is available without charge by visiting the Proxy Voting section of mfs.com or by visiting the SEC’s Web site at http://www.sec.gov.
QUARTERLY PORTFOLIO DISCLOSURE
The fund will file a complete schedule of portfolio holdings with the Securities and Exchange Commission (the Commission) for the first and third quarters of each fiscal year on Form N-Q. The fund’s Form N-Q is available on the EDGAR database on the Commission’s Internet Web site at http://www.sec.gov, and may be reviewed and copied at the:
Public Reference Room
Securities and Exchange Commission
100 F Street, NE, Room 1580
Washington, D.C. 20549
Information on the operation of the Public Reference Room may be obtained by calling the Commission at 1-800-SEC-0330. Copies of the fund’s Form N-Q also may be obtained, upon payment of a duplicating fee, by electronic request at the following e-mail address: publicinfo@sec.gov or by writing the Public Reference Section at the above address.
From time to time, MFS may post important information about the fund or the MFS funds on the MFS web site (mfs.com). This information is available by visiting the “News & Commentary” section of mfs.com or by clicking on the fund’s name under “Variable Insurance Portfolios – VIT II” in the “Products” section of mfs.com.
FEDERAL TAX INFORMATION (unaudited)
The following information is provided pursuant to provisions of the Internal Revenue Code.
For corporate shareholders, 100% of the ordinary income dividends paid during the fiscal year qualify for the corporate dividends received deduction.
22
Table of Contents
rev. 3/11

| Why? | Financial companies choose how they share your personal information. Federal law gives consumers the right to limit some but not all sharing. Federal law also requires us to tell you how we collect, share, and protect your personal information. Please read this notice carefully to understand what we do. |
| What? | The types of personal information we collect and share depend on the product or service you have with us. This information can include:
• Social Security number and account balances • Account transactions and transaction history • Checking account information and wire transfer instructions
When you are no longer our customer, we continue to share your information as described in this notice. |
| How? | All financial companies need to share customers’ personal information to run their everyday business. In the section below, we list the reasons financial companies can share their customers’ personal information; the reasons MFS chooses to share; and whether you can limit this sharing. |
| Reasons we can share your personal information | Does MFS share? | Can you limit this sharing? | ||
For our everyday business purposes – such as to process your transactions, maintain your account(s), respond to court orders and legal investigations, or report to credit bureaus | Yes | No | ||
For our marketing purposes – to offer our products and services to you | No | We don’t share | ||
| For joint marketing with other financial companies | No | We don’t share | ||
For our affiliates’ everyday business purposes – information about your transactions and experiences | No | We don’t share | ||
For our affiliates’ everyday business purposes – information about your creditworthiness | No | We don’t share | ||
| For nonaffiliates to market to you | No | We don’t share |
| Questions? | Call 800-225-2606 or go to mfs.com. |
23
Table of Contents
| Page 2 |
| Who we are | ||
| Who is providing this notice? | MFS Funds, MFS Investment Management, MFS Institutional Advisors, Inc., MFS Fund Distributors, Inc., MFS Heritage Trust Company, and MFS Service Center, Inc. | |
| What we do | ||
| How does MFS protect my personal information? | To protect your personal information from unauthorized access and use, we use security measures that comply with federal law. These measures include procedural, electronic, and physical safeguards for the protection of the personal information we collect about you. | |
| How does MFS collect my personal information? | We collect your personal information, for example, when you
• open an account or provide account information • direct us to buy securities or direct us to sell your securities • make a wire transfer
We also collect your personal information from others, such as credit bureaus, affiliates and other companies. | |
| Why can’t I limit all sharing? | Federal law gives you the right to limit only
• sharing for affiliates’ everyday business purposes – information about your creditworthiness • affiliates from using your information to market to you • sharing for nonaffiliates to market to you
State laws and individual companies may give you additional rights to limit sharing. | |
| Definitions | ||
| Affiliates | Companies related by common ownership or control. They can be financial and nonfinancial companies.
•MFS does not share personal information with affiliates, except for everyday business purposes as described on page one of this notice. | |
| Nonaffiliates | Companies not related by common ownership or control. They can be financial and nonfinancial companies.
•MFS does not share with nonaffiliates so they can market to you. | |
| Joint Marketing | A formal agreement between nonaffiliated financial companies that together market financial products or services to you.
•MFS doesn’t jointly market. | |
| Other important information | ||
| If you own an MFS product or receive an MFS service in the name of a third party such as a bank or broker-dealer, their privacy policy may apply to you instead of ours. | ||
24
Table of Contents
Table of Contents
ANNUAL REPORT
December 31, 2012

MFS® EMERGING MARKETS EQUITY PORTFOLIO
MFS® Variable Insurance Trust II

FCE-ANN
Table of Contents
MFS® EMERGING MARKETS EQUITY PORTFOLIO
The report is prepared for the general information of contract owners. It is authorized for distribution to prospective investors only when preceded or accompanied by a current prospectus.
NOT FDIC INSURED Ÿ MAY LOSE VALUE Ÿ NO BANK OR CREDIT UNION GUARANTEE Ÿ NOT A DEPOSIT Ÿ NOT INSURED BY ANY FEDERAL GOVERNMENT AGENCY OR NCUA/NCUSIF
Table of Contents
MFS Emerging Markets Equity Portfolio
LETTER FROM THE CHAIRMAN AND CEO

Dear Contract Owners:
The global market outlook for 2013 is one of cautious optimism. While we are seeing some positive economic trends in the United States, Europe and China, the overall environment remains challenging. In the United States, the recent fiscal cliff agreement was received positively by investors, even though it mostly addressed pressing taxation issues and did not resolve additional concerns, including the need for spending cuts and a large-scale reduction of the federal debt. These issues will be front and center again in the spring. Despite the ongoing uncertainty, economic tailwinds are gathering strength as the U.S. housing and job markets are improving and consumer confidence is rising.
Overseas, the debt crisis continues to weigh heavily on eurozone markets, with even Germany — long an economic stalwart — experiencing some contraction. These ongoing challenges could be a drag on global market performance this year. In Asia, manufacturing activity has accelerated in emerging markets such as China and India, and we are seeing signs of stabilized loan growth in China, a leading indicator of that country’s economic health. In contrast, Japan’s economy is contracting sharply under deflationary pressures. Nevertheless, Japanese markets have responded favorably to early actions by the new government, which appears determined to act aggressively, along with the Bank of Japan, to stimulate growth.
As always, managing risk in the face of uncertainty remains a top priority for investors. At MFS®, our uniquely collaborative investment process revolves around global research and our disciplined risk management approach. Our global team of investment professionals shares ideas and evaluates opportunities across continents, investment disciplines and asset classes — all with a goal of building better insights, and ultimately better results, for our clients.
We remain mindful of the many economic challenges investors face today, and believe it is more important than ever to maintain a long-term view, employ time-tested principles, such as asset allocation and diversification, and work closely with investment advisors to identify and pursue the most suitable opportunities.
Respectfully,

Robert J. Manning
Chairman and Chief Executive Officer
MFS Investment Management®
February 15, 2013
The opinions expressed in this letter are subject to change, may not be relied upon for investment advice, and no forecasts can be guaranteed.
1
Table of Contents
MFS Emerging Markets Equity Portfolio
Portfolio structure

| Top ten holdings | ||||
| Samsung Electronics Co. Ltd. | 4.6% | |||
| Taiwan Semiconductor Manufacturing Co. Ltd. | 3.5% | |||
| Hon Hai Precision Industry Co. Ltd. | 1.9% | |||
| China Construction Bank | 1.8% | |||
| Vale S.A., ADR | 1.7% | |||
| Naspers Ltd. | 1.7% | |||
| China Unicom (Hong Kong) Ltd. | 1.6% | |||
| Li & Fung Ltd. | 1.6% | |||
| Standard Chartered PLC | 1.5% | |||
| OAO Gazprom, ADR | 1.5% | |||
| Equity sectors | ||||
| Financial Services | 24.9% | |||
| Technology | 14.0% | |||
| Retailing | 11.7% | |||
| Energy | 8.9% | |||
| Utilities & Communications | 8.7% | |||
| Basic Materials | 8.1% | |||
| Autos & Housing | 5.4% | |||
| Leisure | 4.7% | |||
| Special Products & Services | 4.2% | |||
| Consumer Staples | 4.0% | |||
| Industrial Goods & Services | 3.3% | |||
| Health Care | 1.4% | |||
| Transportation | 0.6% | |||
| Issuer country weightings (x) | ||||
| Brazil | 15.7% | |||
| China | 12.7% | |||
| South Korea | 9.8% | |||
| Taiwan | 9.0% | |||
| India | 7.8% | |||
| Russia | 7.0% | |||
| Hong Kong | 6.2% | |||
| Mexico | 6.1% | |||
| South Africa | 5.0% | |||
| Other Countries | 20.7% | |||
| Currency exposure weightings (y) | ||||
| Hong Kong Dollar | 19.9% | |||
| Brazilian Real | 15.7% | |||
| South Korean Won | 9.8% | |||
| Taiwan Dollar | 9.0% | |||
| United States Dollar | 8.9% | |||
| Indian Rupee | 7.8% | |||
| Mexican Peso | 6.1% | |||
| South African Rand | 5.0% | |||
| Thailand Baht | 2.8% | |||
| Other Currencies | 15.0% | |||
| (x) | Represents the portfolio’s exposure to issuer countries as a percentage of a portfolio’s net assets. |
| (y) | Represents the portfolio’s exposure to a particular currency as a percentage of a portfolio’s net assets. |
Percentages are based on net assets as of 12/31/12.
The portfolio is actively managed and current holdings may be different.
2
Table of Contents
MFS Emerging Markets Equity Portfolio
Summary of Results
For the twelve months ended December 31, 2012, Initial Class shares of the MFS Emerging Markets Equity Portfolio (“fund”) provided a total return of 18.99%, while Service Class shares of the fund provided a total return of 18.60%. These compare with a return of 18.63% over the same period for the fund’s benchmark, the MSCI Emerging Markets Index.
Market Environment
The beginning of the period was characterized by a risk-on sentiment as a result of additional liquidity measures by the Federal Reserve Bank (“Fed”) and the European Central Bank (“ECB”) as well as a commensurate improvement in macroeconomic conditions. During this time, global equity valuations rose, credit spreads contracted, and high-quality sovereign yields increased modestly.
During the middle of the period, however, conditions worsened, driven by broadly weaker global macroeconomic indicators, as well as renewed concerns over the eurozone’s capacity and determination to address its ongoing crisis. Despite this deterioration, broad market sentiment remained relatively resilient as equity markets generally maintained gains and credit spreads did not indicate deterioration.
However, this renewed weakness in the fundamentals precipitated a further round of monetary easing by both the Fed (through a third round of quantitative easing) and the ECB (through a new bond purchase facility) in the second half of the period, which soon instilled additional confidence in risk markets. Nonetheless, towards the end of the period, weaker equity earnings reports and declining forward guidance caused market sentiment to soften. In addition, as we moved toward year end, the fiscal cliff negotiations between the Republicans in the U.S. Congress and President Obama were a particular source of market attention, where uncertainty surrounding the fiscal negotiations continued right up to the end-of-year deadline.
Contributors to Performance
Stock selection and, to a lesser extent, an overweight position in the retailing sector contributed to performance relative to the MSCI Emerging Markets Index. Within this sector, holdings of retailer Mr Price Group (South Africa), retail chain operator O’Key Group (b) (Russia), and convenience store operator CP ALL (Thailand) benefited relative returns as all three stocks turned in strong performance over the period. Shares of Mr Price Group appreciated, particularly during the middle of the period, as the company reported strong earnings per share that were in line with consensus estimates. A combination of continued refinement of its supply chain, strong cost containment, and operating margin expansion in both Apparel and Home segments also contributed to positive results.
Stock selection in the special products & services sector was another primary contributor to relative performance. Here, holdings of private education provider Kroton Educacional (Brazil) benefited relative performance as the stock outpaced the benchmark over the reporting period. Shares of Kroton Educacional appreciated significantly towards the end of the period as the company reported better-than-expected results driven by healthy gross margins, lower expenses in both distance-learning and on-campus operations, and higher-than-expected net tuition revenue.
Favorable security selection in the technology, transportation, and leisure sectors also positively impacted relative results. Within the transportation sector, holdings of airport facilities manager Grupo Aeroportuario del Sureste (b) (Mexico) strengthened relative performance as the stock traded significantly higher during the period. There were no individual securities within either the technology or leisure sectors that were among the fund’s top relative contributors for the period.
Elsewhere, holdings of automaker Geely Automobile Holdings (Hong Kong), banking firm ICICI Bank (India), and commercial banking firm Sberbank (Russia) aided relative results as all three stocks outperformed the benchmark. An underweight position in poor-performing oil company Petroleo Brasileiro (Brazil), and not holding shares of OGX Petroleo e Gas Participacoes (Brazil), also aided relative performance.
Detractors from Performance
Stock selection in the autos & housing sector held back relative performance. The fund’s holdings of automotive parts manufacturer Mando (South Korea), automaker Kia Motors (South Korea), and housing construction company Urbi Desarrollos Urbanos (Mexico) hindered relative results as all three stocks turned in weak performance over the period. Shares of Urbi Desarrollos Urbanos declined as the company reported second quarter earnings that were below consensus expectations on the back of weak demand for units sold and an FX loss intended to hedge its U.S. dollar-denominated debt.
Weak security selection in the energy and health care sectors was another factor that detracted from relative performance. Within the energy sector, holdings of oil drilling rig manufacturer Lamprell (b) (United Arab Emirates) and oil and gas exploration companies, INPEX (b) (Japan) and Bankers Petroleum (b)(h) (Canada), weakened relative results.
3
Table of Contents
MFS Emerging Markets Equity Portfolio
Management Review – continued
Stocks in other sectors that held back relative performance included telecommunications service provider China Unicom Hong Kong (Hong Kong), mining company Iluka Resources (b) (Australia), and supermarket operator E-Mart Company (South Korea).
The fund’s relative currency exposure, resulting primarily from differences between the fund’s and the benchmark’s exposures to holdings of securities denominated in foreign currencies, also weakened relative performance. All of MFS’ investment decisions are driven by the fundamentals of each individual opportunity and as such, it is common for our portfolios to have different currency exposure than the benchmark.
Respectfully,
| Jose Luis Garcia | Robert Lau | |
| Portfolio Manager | Portfolio Manager |
| (b) | Security is not a benchmark constituent. |
| (h) | Security was not held in the portfolio at period end. |
The views expressed in this report are those of the portfolio managers only through the end of the period of the report as stated on the cover and do not necessarily reflect the views of MFS or any other person in the MFS organization. These views are subject to change at any time based on market or other conditions, and MFS disclaims any responsibility to update such views. These views may not be relied upon as investment advice or an indication of trading intent on behalf of any MFS portfolio. References to specific securities are not recommendations of such securities, and may not be representative of any MFS portfolio’s current or future investments.
4
Table of Contents
MFS Emerging Markets Equity Portfolio
PERFORMANCE SUMMARY THROUGH 12/31/12
The following chart illustrates the historical performance of the fund in comparison to its benchmark(s). Benchmarks are unmanaged and may not be invested in directly. Benchmark returns do not reflect any fees or expenses. The performance of other share classes will be greater than or less than that of the class depicted below. (See Notes to Performance Summary.)
Performance data shown represents past performance and is no guarantee of future results. Investment return and principal value fluctuate so your units, when sold, may be worth more or less than the original cost; current performance may be lower or higher than quoted. The performance shown does not reflect the deduction of taxes, if any, that a contract holder would pay on fund distributions or the redemption of contract units. The returns for the fund shown also do not reflect the deduction of expenses associated with variable products, such as mortality and expense risk charges, separate account charges, and sales charges imposed by the insurance company separate accounts. Such expenses would reduce the overall returns shown.
Growth of a Hypothetical $10,000 Investment
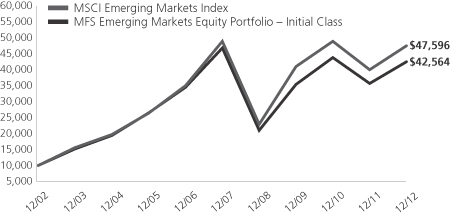
Total Returns through 12/31/12
Average annual total returns
| Share Class | Class inception date | 1-yr | 5-yr | 10-yr | ||||||||
| Initial Class | 6/05/96 | 18.99% | (1.92)% | 15.59% | ||||||||
| Service Class | 8/24/01 | 18.60% | (2.17)% | 15.29% | ||||||||
| Comparative benchmark | ||||||||||||
MSCI Emerging Markets Index (f) | 18.63% | (0.61)% | 16.88% | |||||||||
| (f) | Source: FactSet Research Systems Inc. |
Benchmark Definition
MSCI Emerging Markets Index – a market capitalization-weighted index that is designed to measure equity market performance in the global emerging markets.
It is not possible to invest directly in an index.
Notes to Performance Summary
Average annual total return represents the average annual change in value for each share class for the periods presented.
Performance results reflect any applicable expense subsidies and waivers in effect during the periods shown. Without such subsidies and waivers the fund’s performance results would be less favorable. Please see the prospectus and financial statements for complete details. All results are historical and assume the reinvestment of any dividends and capital gains distributions.
Performance results do not include adjustments made for financial reporting purposes in accordance with U.S. generally accepted accounting principles and may differ from amounts reported in the financial highlights.
From time to time the fund may receive proceeds from litigation settlements, without which performance would be lower.
5
Table of Contents
MFS Emerging Markets Equity Portfolio
Fund Expenses Borne by the Contract Holders During the Period,
July 1, 2012 through December 31, 2012
As a contract holder of the fund, you incur ongoing costs, including management fees; distribution and/or service (12b-1) fees; and other fund expenses. This example is intended to help you understand your ongoing costs (in dollars) of investing in the fund and to compare these costs with the ongoing costs of investing in other mutual funds.
The example is based on an investment of $1,000 invested at the beginning of the period and held for the entire period July 1, 2012 through December 31, 2012.
Actual Expenses
The first line for each share class in the following table provides information about actual account values and actual expenses. You may use the information in this line, together with the amount you invested, to estimate the expenses that you paid over the period. Simply divide your account value by $1,000 (for example, an $8,600 account value divided by $1,000 = 8.6), then multiply the result by the number in the first line under the heading entitled “Expenses Paid During Period” to estimate the expenses you paid on your account during this period.
Hypothetical Example for Comparison Purposes
The second line for each share class in the following table provides information about hypothetical account values and hypothetical expenses based on the fund’s actual expense ratio and an assumed rate of return of 5% per year before expenses, which is not the fund’s actual return. The hypothetical account values and expenses may not be used to estimate the actual ending account balance or expenses you paid for the period. You may use this information to compare the ongoing costs of investing in the fund and other funds. To do so, compare this 5% hypothetical example with the 5% hypothetical examples that appear in the shareholder reports of the other funds.
Please note that the expenses shown in the table are meant to highlight the fund’s ongoing costs only and do not take into account the fees and expenses imposed under the variable contracts through which your investment in the fund is made. Therefore, the second line for each share class in the table is useful in comparing ongoing costs associated with an investment in vehicles (such as the fund) which fund benefits under variable annuity and variable life insurance contracts and to qualified pension and retirement plans only, and will not help you determine the relative total costs of investing in the fund through variable annuity and variable life insurance contracts. If the fees and expenses imposed under the variable contracts were included, your costs would have been higher.
| Share Class | Annualized Expense Ratio | Beginning Account Value 7/01/12 | Ending Account Value 12/31/12 | Expenses Paid During Period (p) 7/01/12-12/31/12 | ||||||||||||||
| Initial Class | Actual | 1.35% | $1,000.00 | $1,126.38 | $7.22 | |||||||||||||
| Hypothetical (h) | 1.35% | $1,000.00 | $1,018.35 | $6.85 | ||||||||||||||
| Service Class | Actual | 1.60% | $1,000.00 | $1,124.21 | $8.54 | |||||||||||||
| Hypothetical (h) | 1.60% | $1,000.00 | $1,017.09 | $8.11 | ||||||||||||||
| (h) | 5% class return per year before expenses. |
| (p) | Expenses paid are equal to each class’s annualized expense ratio, as shown above, multiplied by the average account value over the period, multiplied by the number of days in the period, divided by the number of days in the year. |
6
Table of Contents
MFS Emerging Markets Equity Portfolio
PORTFOLIO OF INVESTMENTS – 12/31/12
The Portfolio of Investments is a complete list of all securities owned by your fund. It is categorized by broad-based asset classes.
| Issuer | Shares/Par | Value ($) | ||||||
| COMMON STOCKS – 99.9% | ||||||||
| Aerospace – 0.4% | ||||||||
| Embraer S.A., ADR | 12,670 | $ | 361,222 | |||||
|
| |||||||
| Airlines – 0.6% | ||||||||
| Copa Holdings S.A., “A” | 2,377 | $ | 236,393 | |||||
| Grupo Aeroportuario del Sureste S.A. de C.V., ADR | 2,740 | 312,360 | ||||||
|
| |||||||
| $ | 548,753 | |||||||
|
| |||||||
| Alcoholic Beverages – 1.0% | ||||||||
| Companhia de Bebidas das Americas, ADR | 21,495 | $ | 902,575 | |||||
|
| |||||||
| Apparel Manufacturers – 3.9% | ||||||||
| Arezzo Industria e Comercio S.A. | 13,470 | $ | 260,190 | |||||
| Cia.Hering S.A. | 11,200 | 231,538 | ||||||
| Li & Fung Ltd. | 778,000 | 1,397,679 | ||||||
| Stella International Holdings | 416,500 | 1,128,457 | ||||||
| Top Glove Corp. | 275,500 | 508,031 | ||||||
|
| |||||||
| $ | 3,525,895 | |||||||
|
| |||||||
| Automotive – 3.9% | ||||||||
| Exide Industries Ltd. | 116,350 | $ | 307,347 | |||||
| Geely Automobile Holdings Ltd. | 1,400,000 | 667,779 | ||||||
| Guangzhou Automobile Group Co. Ltd., “H” | 658,000 | 591,169 | ||||||
| Kia Motors Corp. | 25,790 | 1,372,317 | ||||||
| Mando Corp. | 4,222 | 509,731 | ||||||
|
| |||||||
| $ | 3,448,343 | |||||||
|
| |||||||
| Broadcasting – 0.3% | ||||||||
| Astro Malaysia Holdings Bhd. | 281,400 | $ | 276,063 | |||||
|
| |||||||
| Brokerage & Asset Managers – 1.9% | ||||||||
| BM&F Bovespa S.A. | 120,200 | $ | 839,036 | |||||
| Bolsa Mexicana de Valores S.A. de C.V. | 144,500 | 364,316 | ||||||
| CETIP S.A. – Balcao Organizado de Ativos e Derivativos | 36,127 | 450,935 | ||||||
|
| |||||||
| $ | 1,654,287 | |||||||
|
| |||||||
| Business Services – 1.9% | ||||||||
| Cognizant Technology Solutions Corp., “A” (a) | 16,420 | $ | 1,215,901 | |||||
| LPS Brasil – Consultoria de Imoveis S.A. | 27,400 | 507,042 | ||||||
|
| |||||||
| $ | 1,722,943 | |||||||
|
| |||||||
| Cable TV – 2.6% | ||||||||
| Dish TV India Ltd. (a) | 588,632 | $ | 820,795 | |||||
| Naspers Ltd. | 23,676 | 1,521,251 | ||||||
|
| |||||||
| $ | 2,342,046 | |||||||
|
| |||||||
| Computer Software – 0.2% | ||||||||
| Totvs S.A. | 10,700 | $ | 211,074 | |||||
|
| |||||||
| Computer Software – Systems – 2.9% | ||||||||
| Asustek Computer, Inc. | 85,000 | $ | 959,798 | |||||
| Hon Hai Precision Industry Co. Ltd. | 544,281 | 1,677,851 | ||||||
|
| |||||||
| $ | 2,637,649 | |||||||
|
| |||||||
| Issuer | Shares/Par | Value ($) | ||||||
| COMMON STOCKS – continued | ||||||||
| Conglomerates – 0.8% | ||||||||
| Alfa S.A de C.V., “A” | 114,670 | $ | 242,890 | |||||
| First Pacific Co. Ltd. | 438,800 | 484,464 | ||||||
|
| |||||||
| $ | 727,354 | |||||||
|
| |||||||
| Construction – 1.5% | ||||||||
| Anhui Conch Cement Co. Ltd. | 243,000 | $ | 904,104 | |||||
| PDG Realty S.A. | 127,300 | 210,451 | ||||||
| Urbi Desarrollos Urbanos S.A. de C.V. (a) | 404,179 | 252,958 | ||||||
|
| |||||||
| $ | 1,367,513 | |||||||
|
| |||||||
| Consumer Products – 1.9% | ||||||||
| Dabur India Ltd. | 450,683 | $ | 1,060,285 | |||||
| Hengan International Group Co. Ltd. | 34,000 | 307,306 | ||||||
| Kimberly-Clark de Mexico S.A. de C.V., “A” | 115,910 | 295,552 | ||||||
|
| |||||||
| $ | 1,663,143 | |||||||
|
| |||||||
| Consumer Services – 1.5% | ||||||||
| Abril Educacao S.A., IEU | 15,930 | $ | 313,486 | |||||
| Anhanguera Educacional Participacoes S.A. | 19,300 | 329,720 | ||||||
| Estacio Participacoes S.A. | 19,230 | 397,221 | ||||||
| Kroton Educacional S.A. (a) | 13,058 | 294,961 | ||||||
|
| |||||||
| $ | 1,335,388 | |||||||
|
| |||||||
| Electrical Equipment – 0.2% | ||||||||
| Crompton Greaves Ltd. | 88,015 | $ | 187,805 | |||||
|
| |||||||
| Electronics – 10.2% | ||||||||
| Samsung Electronics Co. Ltd. | 2,900 | $ | 4,150,553 | |||||
| Seoul Semiconductor Co. Ltd. (a) | 22,628 | 514,489 | ||||||
| Siliconware Precision Industries Co. Ltd. | 1,232,000 | 1,318,558 | ||||||
| Taiwan Semiconductor Manufacturing Co. Ltd. | 945,258 | 3,163,696 | ||||||
|
| |||||||
| $ | 9,147,296 | |||||||
|
| |||||||
| Energy – Independent – 3.8% | ||||||||
| China Shenhua Energy Co. Ltd. | 172,500 | $ | 769,578 | |||||
| CNOOC Ltd. | 316,000 | 693,859 | ||||||
| INPEX Corp. | 108 | 576,380 | ||||||
| Reliance Industries Ltd. | 85,541 | 1,325,309 | ||||||
|
| |||||||
| $ | 3,365,126 | |||||||
|
| |||||||
| Energy – Integrated – 3.0% | ||||||||
| OAO Gazprom, ADR | 143,684 | $ | 1,377,768 | |||||
| OAO NOVATEK, GDR | 3,900 | 469,814 | ||||||
| Petroleo Brasileiro S.A., ADR | 44,652 | 869,374 | ||||||
|
| |||||||
| $ | 2,716,956 | |||||||
|
| |||||||
| Engineering – Construction – 0.4% | ||||||||
| Promotora y Operadora de Infraestructura S.A.B. de C.V. (a) | 48,600 | $ | 324,093 | |||||
|
| |||||||
7
Table of Contents
MFS Emerging Markets Equity Portfolio
Portfolio of Investments – continued
| Issuer | Shares/Par | Value ($) | ||||||
| COMMON STOCKS – continued | ||||||||
| Food & Beverages – 1.1% | ||||||||
| Arca Continental S.A.B de C.V. | 40,876 | $ | 303,859 | |||||
| M. Dias Branco S.A. Industria e Comercio de Alimentos | 16,500 | 632,933 | ||||||
|
| |||||||
| $ | 936,792 | |||||||
|
| |||||||
| Food & Drug Stores – 4.4% | ||||||||
| Brazil Pharma S.A. | 54,000 | $ | 379,780 | |||||
| CP All PLC | 384,100 | 577,594 | ||||||
| Dairy Farm International Holdings Ltd. | 47,700 | 520,691 | ||||||
| E-Mart Co. Ltd. | 3,904 | 867,900 | ||||||
| O’Key Group S.A., GDR | 84,680 | 996,724 | ||||||
| Raia Drogasil S.A. | 23,700 | 267,901 | ||||||
| Wumart Stores, Inc., “H” | 162,000 | 352,026 | ||||||
|
| |||||||
| $ | 3,962,616 | |||||||
|
| |||||||
| Gaming & Lodging – 1.0% | ||||||||
| Minor International PLC | 642,330 | $ | 411,562 | |||||
| Shangri-La Asia Ltd. | 254,000 | 511,810 | ||||||
|
| |||||||
| $ | 923,372 | |||||||
|
| |||||||
| General Merchandise – 2.7% | ||||||||
| Bim Birlesik Magazalar A.S. | 6,178 | $ | 302,631 | |||||
| Clicks Group Ltd. | 107,210 | 839,667 | ||||||
| Lojas Renner S.A. | 7,300 | 285,622 | ||||||
| Mr. Price Group Ltd. | 47,587 | 794,953 | ||||||
| PT Mitra Adiperkasa Tbk | 328,000 | 229,655 | ||||||
|
| |||||||
| $ | 2,452,528 | |||||||
|
| |||||||
| Health Maintenance Organizations – 0.2% | ||||||||
| OdontoPrev S.A. | 39,600 | $ | 209,223 | |||||
|
| |||||||
| Insurance – 2.0% | ||||||||
| Brasil Insurance Participacoes e Administracao S.A. | 65,400 | $ | 638,828 | |||||
| China Pacific Insurance Co. Ltd. | 298,800 | 1,120,641 | ||||||
|
| |||||||
| $ | 1,759,469 | |||||||
|
| |||||||
| Machinery & Tools – 2.3% | ||||||||
| Glory Ltd. | 25,900 | $ | 599,954 | |||||
| Sinotruk Hong Kong Ltd. | 827,500 | 636,769 | ||||||
| Thermax Ltd. | 30,570 | 346,246 | ||||||
| TK Corp. | 22,944 | 463,530 | ||||||
|
| |||||||
| $ | 2,046,499 | |||||||
|
| |||||||
| Major Banks – 3.1% | ||||||||
| Bank of China Ltd. | 3,042,000 | $ | 1,377,113 | |||||
| Standard Chartered PLC | 54,393 | 1,388,062 | ||||||
|
| |||||||
| $ | 2,765,175 | |||||||
|
| |||||||
| Medical & Health Technology & Services – 0.7% | ||||||||
| Diagnosticos da America S.A. | 32,100 | $ | 208,603 | |||||
| Fleury S.A. | 33,400 | 376,005 | ||||||
|
| |||||||
| $ | 584,608 | |||||||
|
| |||||||
| Metals & Mining – 6.0% | ||||||||
| Gerdau S.A., ADR | 68,530 | $ | 616,085 | |||||
| Grupo Mexico S.A.B. de C.V., “B” | 115,517 | 417,785 | ||||||
| Issuer | Shares/Par | Value ($) | ||||||
| COMMON STOCKS – continued | ||||||||
| Metals & Mining – continued | ||||||||
| Iluka Resources Ltd. | 113,081 | $ | 1,095,840 | |||||
| Mining & Metallurgical Co. Norilsk Nickel, ADR | 18,706 | 349,578 | ||||||
| MOIL Ltd. | 69,136 | 333,729 | ||||||
| Steel Authority of India Ltd. | 429,550 | 714,017 | ||||||
| Ternium S.A., ADR | 13,750 | 323,813 | ||||||
| Vale S.A., ADR | 73,758 | 1,545,968 | ||||||
|
| |||||||
| $ | 5,396,815 | |||||||
|
| |||||||
| Network & Telecom – 0.7% | ||||||||
| VTech Holdings Ltd. | 54,700 | $ | 614,599 | |||||
|
| |||||||
| Oil Services – 1.4% | ||||||||
| Global Ports Investments PLC, GDR | 28,290 | $ | 406,344 | |||||
| Lamprell PLC | 193,930 | 296,128 | ||||||
| Tenaris S.A., ADR | 13,619 | 570,908 | ||||||
|
| |||||||
| $ | 1,273,380 | |||||||
|
| |||||||
| Other Banks & Diversified Financials – 15.5% | ||||||||
| Akbank T.A.S. | 89,170 | $ | 440,909 | |||||
| Banco De Oro Unibank, Inc. (a) | 32,206 | 57,098 | ||||||
| Banco Santander Chile, ADR | 5,941 | 169,259 | ||||||
| Banco Santander S.A., IEU | 64,900 | 473,687 | ||||||
| Bancolombia S.A., ADR | 2,941 | 195,812 | ||||||
| Bangkok Bank Public Co. Ltd. | 167,500 | 1,147,668 | ||||||
| Bank Negara Indonesia PT | 1,811,500 | 698,089 | ||||||
| Bank Polska Kasa Opieki S.A. | 11,170 | 609,385 | ||||||
| China Construction Bank | 1,941,670 | 1,582,469 | ||||||
| Chinatrust Financial Holding Co. Ltd. | 1,038,295 | 615,584 | ||||||
| CIMB Group Holdings Berhad | 149,400 | 373,174 | ||||||
| Credicorp Ltd. | 5,540 | 811,942 | ||||||
| Grupo Financiero Banorte S.A. de C.V. | 36,200 | 233,701 | ||||||
| Grupo Financiero Santander Mexico S.A.B. de C.V., ADR (a) | 25,870 | 418,577 | ||||||
| Hana Financial Group, Inc. | 28,350 | 926,806 | ||||||
| Housing Development Finance Corp. Ltd. | 41,461 | 632,436 | ||||||
| ICICI Bank Ltd. | 62,207 | 1,310,316 | ||||||
| Itau Unibanco Holding S.A., ADR | 31,502 | 518,523 | ||||||
| Komercni Banka A.S. | 4,433 | 935,188 | ||||||
| Sberbank of Russia | 303,330 | 937,098 | ||||||
| Turkiye Garanti Bankasi A.S. | 146,942 | 764,458 | ||||||
|
| |||||||
| $ | 13,852,179 | |||||||
|
| |||||||
| Pharmaceuticals – 0.5% | ||||||||
| Genomma Lab Internacional S.A., “B” (a) | 236,200 | $ | 485,874 | |||||
|
| |||||||
| Precious Metals & Minerals – 0.8% | ||||||||
| Gold Fields Ltd. | 55,031 | $ | 682,994 | |||||
|
| |||||||
| Real Estate – 2.4% | ||||||||
| Asian Property Development PLC | 1,354,900 | $ | 376,484 | |||||
| Brasil Brokers Participacoes | 138,500 | 464,299 | ||||||
| Hang Lung Properties Ltd. | 235,000 | 942,234 | ||||||
| Macquarie Mexico Real Estate S.A. de C.V., REIT (a) | 199,100 | 395,079 | ||||||
|
| |||||||
| $ | 2,178,096 | |||||||
|
| |||||||
8
Table of Contents
MFS Emerging Markets Equity Portfolio
Portfolio of Investments – continued
| Issuer | Shares/Par | Value ($) | ||||||
| COMMON STOCKS – continued | ||||||||
| Restaurants – 0.8% | ||||||||
| Ajisen China Holdings Ltd. | 487,000 | $ | 473,114 | |||||
| Arcos Dorados Holdings, Inc. | 22,180 | 265,273 | ||||||
|
| |||||||
| $ | 738,387 | |||||||
|
| |||||||
| Specialty Chemicals – 1.3% | ||||||||
| Chugoku Marine Paints Ltd. | 76,000 | $ | 453,535 | |||||
| Formosa Plastics Corp. | 131,000 | 355,997 | ||||||
| Mexichem S.A.B de C.V. | 58,100 | 324,114 | ||||||
|
| |||||||
| $ | 1,133,646 | |||||||
|
| |||||||
| Specialty Stores – 0.7% | ||||||||
| M.Video | 74,020 | $ | 582,115 | |||||
|
| |||||||
| Telecommunications – Wireless – 4.9% | ||||||||
| America Movil S.A.B. de C.V., “L”, ADR | 46,574 | $ | 1,077,722 | |||||
| China Mobile Ltd. | 45,000 | 527,123 | ||||||
| Mobile TeleSystems OJSC, ADR | 61,382 | 1,144,774 | ||||||
| MTN Group Ltd. | 30,032 | 631,228 | ||||||
| TIM Participacoes S.A., ADR | 22,137 | 438,755 | ||||||
| Turkcell Iletisim Hizmetleri A.S. (a) | 84,200 | 545,144 | ||||||
|
| |||||||
| $ | 4,364,746 | |||||||
|
| |||||||
| Telephone Services – 2.9% | ||||||||
| China Unicom (Hong Kong) Ltd. | 876,000 | $ | 1,420,446 | |||||
| Empresa Nacional de Telecomunicaciones S.A. | 8,654 | 178,953 | ||||||
| PT XL Axiata Tbk | 1,730,000 | 1,027,278 | ||||||
|
| |||||||
| $ | 2,626,677 | |||||||
|
| |||||||
| Utilities – Electric Power – 0.9% | ||||||||
| Energias do Brasil S.A. | 58,500 | $ | 359,616 | |||||
| Terna Participacoes S.A., IEU | 29,960 | 318,988 | ||||||
| Tractebel Energia S.A. | 10,200 | 166,139 | ||||||
|
| |||||||
| $ | 844,743 | |||||||
|
| |||||||
| Utilities – Water – 0.7% | ||||||||
| Aguas Andinas S.A. | 915,948 | $ | 653,538 | |||||
|
| |||||||
Total Common Stocks (Identified Cost, $69,885,767) |
| $ | 89,533,595 | |||||
|
| |||||||
| Issuer | Shares/Par | Value ($) | ||||||
| MONEY MARKET FUNDS – 0.0% | ||||||||
| MFS Institutional Money Market Portfolio, 0.16%, at Cost and Net Asset Value (v) | 25 | $ | 25 | |||||
|
| |||||||
Total Investments (Identified Cost, $69,885,792) |
| $ | 89,533,620 | |||||
|
| |||||||
| OTHER ASSETS, LESS LIABILITIES – 0.1% | 131,969 | |||||||
|
| |||||||
| Net Assets – 100.0% | $ | 89,665,589 | ||||||
|
| |||||||
| (a) | Non-income producing security. |
| (v) | Underlying affiliated fund that is available only to investment companies managed by MFS. The rate quoted for the MFS Institutional Money Market Portfolio is the annualized seven-day yield of the fund at period end. |
The following abbreviations are used in this report and are defined:
| ADR | American Depositary Receipt |
| GDR | Global Depositary Receipt |
| IEU | International Equity Unit |
| PLC | Public Limited Company |
| REIT | Real Estate Investment Trust |
See Notes to Financial Statements
9
Table of Contents
MFS Emerging Markets Equity Portfolio
FINANCIAL STATEMENTS | STATEMENT OF ASSETS AND LIABILITIES
This statement represents your fund’s balance sheet, which details the assets and liabilities comprising the total value of the fund.
At 12/31/12 | ||||||||
Assets | ||||||||
Investments – | ||||||||
Non-affiliated issuers, at value (identified cost, $69,885,767) | $89,533,595 | |||||||
Underlying affiliated funds, at cost and value | 25 | |||||||
Total investments, at value (identified cost, $69,885,792) | $89,533,620 | |||||||
Foreign currency, at value (identified cost, $1,562) | 1,455 | |||||||
Receivables for | ||||||||
Investments sold | 531,266 | |||||||
Fund shares sold | 292,898 | |||||||
Interest and dividends | 56,422 | |||||||
Other assets | 1,763 | |||||||
Total assets | $90,417,424 | |||||||
Liabilities | ||||||||
Payable to custodian | $176,029 | |||||||
Payable for fund shares reacquired | 140,647 | |||||||
Payable to affiliates | ||||||||
Investment adviser | 10,406 | |||||||
Shareholder servicing costs | 64 | |||||||
Distribution and/or service fees | 1,097 | |||||||
Payable for independent Trustees’ compensation | 23 | |||||||
Deferred country tax expense payable | 335,151 | |||||||
Accrued expenses and other liabilities | 88,418 | |||||||
Total liabilities | $751,835 | |||||||
Net assets | $89,665,589 | |||||||
Net assets consist of | ||||||||
Paid-in capital | $73,629,110 | |||||||
Unrealized appreciation (depreciation) on investments and translation of assets and liabilities in foreign currencies | 19,401,577 | |||||||
Accumulated net realized gain (loss) on investments and foreign currency | (4,698,422 | ) | ||||||
Undistributed net investment income | 1,333,324 | |||||||
Net assets | $89,665,589 | |||||||
Shares of beneficial interest outstanding | 5,803,776 |
| Net assets | Shares outstanding | Net asset value per share | ||||||||||
Initial Class | $48,802,674 | 3,136,337 | $15.56 | |||||||||
Service Class | 40,862,915 | 2,667,439 | 15.32 | |||||||||
See Notes to Financial Statements
10
Table of Contents
MFS Emerging Markets Equity Portfolio
FINANCIAL STATEMENTS | STATEMENT OF OPERATIONS
This statement describes how much your fund earned in investment income and accrued in expenses. It also describes any gains and/or losses generated by fund operations.
Year ended 12/31/12 | ||||||||
Net investment income | ||||||||
Income | ||||||||
Dividends | $3,611,988 | |||||||
Interest | 399 | |||||||
Dividends from underlying affiliated funds | 1,328 | |||||||
Foreign taxes withheld | (327,263 | ) | ||||||
Total investment income | $3,286,452 | |||||||
Expenses | ||||||||
Management fee | $1,352,365 | |||||||
Distribution and/or service fees | 97,768 | |||||||
Shareholder servicing costs | 11,892 | |||||||
Administrative services fee | 28,838 | |||||||
Independent Trustees’ compensation | 5,975 | |||||||
Custodian fee | 225,616 | |||||||
Shareholder communications | 9,496 | |||||||
Audit and tax fees | 72,492 | |||||||
Legal fees | 2,460 | |||||||
Miscellaneous | 26,460 | |||||||
Total expenses | $1,833,362 | |||||||
Fees paid indirectly | (41 | ) | ||||||
Reduction of expenses by investment adviser | (474 | ) | ||||||
Net expenses | $1,832,847 | |||||||
Net investment income | $1,453,605 | |||||||
Realized and unrealized gain (loss) on investments and foreign currency | ||||||||
Realized gain (loss) (identified cost basis) | ||||||||
Investments (net of $185,887 country tax) | $(4,343,463 | ) | ||||||
Foreign currency | (92,848 | ) | ||||||
Net realized gain (loss) on investments and foreign currency | $(4,436,311 | ) | ||||||
Change in unrealized appreciation (depreciation) | ||||||||
Investments (net of $224,447 increase in deferred country tax) | $22,744,425 | |||||||
Translation of assets and liabilities in foreign currencies | 1,837 | |||||||
Net unrealized gain (loss) on investments and foreign currency translation | $22,746,262 | |||||||
Net realized and unrealized gain (loss) on investments and foreign currency | $18,309,951 | |||||||
Change in net assets from operations | $19,763,556 |
See Notes to Financial Statements
11
Table of Contents
MFS Emerging Markets Equity Portfolio
FINANCIAL STATEMENTS | STATEMENTS OF CHANGES IN NET ASSETS
These statements describe the increases and/or decreases in net assets resulting from operations, any distributions, and any shareholder transactions.
For years ended 12/31 | 2012 | 2011 | ||||||
Change in net assets | ||||||||
From operations | ||||||||
Net investment income | $1,453,605 | $1,617,721 | ||||||
Net realized gain (loss) on investments and foreign currency | (4,436,311 | ) | 5,196,364 | |||||
Net unrealized gain (loss) on investments and foreign currency translation | 22,746,262 | (33,420,397 | ) | |||||
Change in net assets from operations | $19,763,556 | $(26,606,312 | ) | |||||
Distributions declared to shareholders | ||||||||
From net investment income | $(1,400,009 | ) | $(662,107 | ) | ||||
From net realized gain on investments | (5,621,397 | ) | (5,626,393 | ) | ||||
Total distributions declared to shareholders | $(7,021,406 | ) | $(6,288,500 | ) | ||||
Change in net assets from fund share transactions | $(48,622,791 | ) | $21,979,094 | |||||
Total change in net assets | $(35,880,641 | ) | $(10,915,718 | ) | ||||
Net assets | ||||||||
At beginning of period | 125,546,230 | 136,461,948 | ||||||
At end of period (including undistributed net investment income of $1,333,324 and | $89,665,589 | $125,546,230 |
See Notes to Financial Statements
12
Table of Contents
MFS Emerging Markets Equity Portfolio
FINANCIAL STATEMENTS | FINANCIAL HIGHLIGHTS
The financial highlights table is intended to help you understand the fund’s financial performance for the past 5 years. Certain information reflects financial results for a single fund share. The total returns in the table represent the rate by which an investor would have earned (or lost) on an investment in the fund share class (assuming reinvestment of all distributions) held for the entire period.
| Initial Class | Years ended 12/31 | |||||||||||||||||||
| 2012 | 2011 | 2010 | 2009 | 2008 | ||||||||||||||||
Net asset value, beginning of period | $13.84 | $17.88 | $14.54 | $8.88 | $26.15 | |||||||||||||||
| Income (loss) from investment operations | ||||||||||||||||||||
Net investment income (d) | $0.18 | $0.21 | $0.13 | $0.14 | $0.33 | |||||||||||||||
Net realized and unrealized gain (loss) on investments | 2.35 | (3.46 | ) | 3.31 | 5.80 | (11.19 | ) | |||||||||||||
Total from investment operations | $2.53 | $(3.25 | ) | $3.44 | $5.94 | $(10.86 | ) | |||||||||||||
| Less distributions declared to shareholders | ||||||||||||||||||||
From net investment income | $(0.17 | ) | $(0.09 | ) | $(0.10 | ) | $(0.28 | ) | $(0.27 | ) | ||||||||||
From net realized gain on investments | (0.64 | ) | (0.70 | ) | — | — | (6.14 | ) | ||||||||||||
Total distributions declared to shareholders | $(0.81 | ) | $(0.79 | ) | $(0.10 | ) | $(0.28 | ) | $(6.41 | ) | ||||||||||
Net asset value, end of period (x) | $15.56 | $13.84 | $17.88 | $14.54 | $8.88 | |||||||||||||||
Total return (%) (k)(r)(s)(x) | 18.76 | (18.58 | ) | 23.82 | 68.58 | (55.11 | ) | |||||||||||||
| Ratios (%) (to average net assets) and Supplemental data: | ||||||||||||||||||||
Expenses before expense reductions (f) | 1.35 | 1.36 | 1.55 | 1.71 | 1.85 | |||||||||||||||
Expenses after expense reductions (f) | 1.35 | 1.36 | 1.40 | 1.40 | 1.61 | |||||||||||||||
Net investment income | 1.23 | 1.28 | 0.86 | 1.24 | 1.94 | |||||||||||||||
Portfolio turnover | 33 | 34 | 39 | 66 | 93 | |||||||||||||||
Net assets at end of period (000 omitted) | $48,803 | $88,928 | $99,316 | $71,026 | $33,411 | |||||||||||||||
See Notes to Financial Statements
13
Table of Contents
MFS Emerging Markets Equity Portfolio
Financial Highlights – continued
| Service Class | Years ended 12/31 | |||||||||||||||||||
| 2012 | 2011 | 2010 | 2009 | 2008 | ||||||||||||||||
Net asset value, beginning of period | $13.64 | $17.64 | $14.36 | $8.76 | $25.88 | |||||||||||||||
| Income (loss) from investment operations | ||||||||||||||||||||
Net investment income (d) | $0.13 | $0.16 | $0.09 | $0.11 | $0.29 | |||||||||||||||
Net realized and unrealized gain (loss) on investments | 2.32 | (3.40 | ) | 3.28 | 5.73 | (11.06 | ) | |||||||||||||
Total from investment operations | $2.45 | $(3.24 | ) | $3.37 | $5.84 | $(10.77 | ) | |||||||||||||
| Less distributions declared to shareholders | ||||||||||||||||||||
From net investment income | $(0.13 | ) | $(0.06 | ) | $(0.09 | ) | $(0.24 | ) | $(0.21 | ) | ||||||||||
From net realized gain on investments | (0.64 | ) | (0.70 | ) | — | — | (6.14 | ) | ||||||||||||
Total distributions declared to shareholders | $(0.77 | ) | $(0.76 | ) | $(0.09 | ) | $(0.24 | ) | $(6.35 | ) | ||||||||||
Net asset value, end of period (x) | $15.32 | $13.64 | $17.64 | $14.36 | $8.76 | |||||||||||||||
Total return (%) (k)(r)(s)(x) | 18.45 | (18.77 | ) | 23.54 | 68.13 | (55.23 | ) | |||||||||||||
| Ratios (%) (to average net assets) and Supplemental data: | ||||||||||||||||||||
Expenses before expense reductions (f) | 1.60 | 1.61 | 1.80 | 1.95 | 2.10 | |||||||||||||||
Expenses after expense reductions (f) | 1.60 | 1.61 | 1.65 | 1.65 | 1.86 | |||||||||||||||
Net investment income | 0.90 | 1.02 | 0.62 | 0.93 | 1.70 | |||||||||||||||
Portfolio turnover | 33 | 34 | 39 | 66 | 93 | |||||||||||||||
Net assets at end of period (000 omitted) | $40,863 | $36,618 | $37,146 | $25,363 | $9,342 | |||||||||||||||
| (d) | Per share data is based on average shares outstanding. |
| (f) | Ratios do not reflect reductions from fees paid indirectly, if applicable. |
| (k) | The total return does not reflect expenses that apply to separate accounts. Inclusion of these charges would reduce the total return figures for all periods shown. |
| (r) | Certain expenses have been reduced without which performance would have been lower. |
| (s) | From time to time the fund may receive proceeds from litigation settlements, without which performance would be lower. |
| (x) | The net asset values per share and total returns have been calculated on net assets which include adjustments made in accordance with U.S. generally accepted accounting principles required at period end for financial reporting purposes. |
See Notes to Financial Statements
14
Table of Contents
MFS Emerging Markets Equity Portfolio
| (1) | Business and Organization |
MFS Emerging Markets Equity Portfolio (the fund) is a series of MFS Variable Insurance Trust II (the trust). The trust is organized as a Massachusetts business trust and is registered under the Investment Company Act of 1940, as amended, as an open-end management investment company. The shareholders of each series of the trust are separate accounts of insurance companies, which offer variable annuity and/or life insurance products, and qualified retirement and pension plans.
| (2) | Significant Accounting Policies |
General – The preparation of financial statements in conformity with U.S. generally accepted accounting principles requires management to make estimates and assumptions that affect the reported amounts of assets and liabilities, and disclosure of contingent assets and liabilities at the date of the financial statements and the reported amounts of revenues and expenses during the reporting period. Actual results could differ from those estimates. In the preparation of these financial statements, management has evaluated subsequent events occurring after the date of the fund’s Statement of Assets and Liabilities through the date that the financial statements were issued. The fund invests in foreign securities, including securities of emerging market issuers. Investments in foreign securities are vulnerable to the effects of changes in the relative values of the local currency and the U.S. dollar and to the effects of changes in each country’s legal, political, and economic environment. The markets of emerging markets countries are generally more volatile than the markets of developed countries with more mature economies. All of the risks of investing in foreign securities previously described are heightened when investing in emerging markets countries.
In this reporting period the fund adopted Financial Accounting Standards Board (FASB) Accounting Standards Update 2011-04, Fair Value Measurement (Topic 820) – Amendments to Achieve Common Fair Value Measurement and Disclosure Requirements in U.S. GAAP and IFRSs (“ASU 2011-04”). ASU 2011-04 seeks to improve the comparability of fair value measurements as presented and disclosed in financial statements prepared in accordance with U.S. GAAP and International Financial Reporting Standards (IFRS) by providing common requirements for fair value measurement and disclosure.
In December 2011, the FASB issued Accounting Standards Update 2011-11, Balance Sheet (Topic 210) – Disclosures about Offsetting Assets and Liabilities (“ASU 2011-11”). Effective for annual reporting periods beginning on or after January 1, 2013 and interim periods within those annual periods, ASU 2011-11 is intended to enhance disclosure requirements on the offsetting of financial assets and liabilities. Although still evaluating the potential impacts of ASU 2011-11 to the fund, management expects that the impact of the fund’s adoption will be limited to additional financial statement disclosures.
Investment Valuations – Equity securities, including restricted equity securities, are generally valued at the last sale or official closing price as provided by a third-party pricing service on the market or exchange on which they are primarily traded. Equity securities, for which there were no sales reported that day, are generally valued at the last quoted daily bid quotation as provided by a third-party pricing service on the market or exchange on which such securities are primarily traded. Short-term instruments with a maturity at issuance of 60 days or less generally are valued at amortized cost, which approximates market value. Open-end investment companies are generally valued at net asset value per share. Securities and other assets generally valued on the basis of information from a third-party pricing service may also be valued at a broker/dealer bid quotation. Values obtained from third-party pricing services can utilize both transaction data and market information such as yield, quality, coupon rate, maturity, type of issue, trading characteristics, and other market data. The values of foreign securities and other assets and liabilities expressed in foreign currencies are converted to U.S. dollars using the mean of bid and asked prices for rates provided by a third-party pricing service.
The Board of Trustees has delegated primary responsibility for determining or causing to be determined the value of the fund’s investments (including any fair valuation) to the adviser pursuant to valuation policies and procedures approved by the Board. If the adviser determines that reliable market quotations are not readily available, investments are valued at fair value as determined in good faith by the adviser in accordance with such procedures under the oversight of the Board of Trustees. Under the fund’s valuation policies and procedures, market quotations are not considered to be readily available for most types of debt instruments and floating rate loans and many types of derivatives. These investments are generally valued at fair value based on information from third-party pricing services. In addition, investments may be valued at fair value if the adviser determines that an investment’s value has been materially affected by events occurring after the close of the exchange or market on which the investment is principally traded (such as foreign exchange or market) and prior to the determination of the fund’s net asset value, or after the halting of trading of a specific security where trading does not resume prior to the close of the exchange or market on which the security is principally traded. Events that occur on a frequent basis after foreign markets close (such as developments in foreign markets and significant movements in the U.S. markets) and prior to the determination of the fund’s net asset value may be deemed to have a material effect on the value of securities traded in foreign markets. Accordingly, the fund’s foreign equity securities may often be valued at fair value. The adviser generally relies on third-party pricing services or other information (such as the correlation with price movements of similar securities in the same or other markets; the type, cost and investment characteristics of the security; the business and financial condition of the issuer; and trading and other market data) to assist in determining whether to fair value and at what value to fair value an investment. The value of an investment for purposes of calculating the fund’s net asset value can differ depending on the source and method used to determine value. When fair valuation is used, the value of an investment used to
15
Table of Contents
MFS Emerging Markets Equity Portfolio
Notes to Financial Statements – continued
determine the fund’s net asset value may differ from quoted or published prices for the same investment. There can be no assurance that the fund could obtain the fair value assigned to an investment if it were to sell the investment at the same time at which the fund determines its net asset value per share.
Various inputs are used in determining the value of the fund’s assets or liabilities. These inputs are categorized into three broad levels. In certain cases, the inputs used to measure fair value may fall into different levels of the fair value hierarchy. In such cases, an investment’s level within the fair value hierarchy is based on the lowest level of input that is significant to the fair value measurement. The fund’s assessment of the significance of a particular input to the fair value measurement in its entirety requires judgment, and considers factors specific to the investment. Level 1 includes unadjusted quoted prices in active markets for identical assets or liabilities. Level 2 includes other significant observable market-based inputs (including quoted prices for similar securities, interest rates, prepayment speed, and credit risk). Level 3 includes unobservable inputs, which may include the adviser’s own assumptions in determining the fair value of investments. The following is a summary of the levels used as of December 31, 2012 in valuing the fund’s assets or liabilities:
| Investments at Value | Level 1 | Level 2 | Level 3 | Total | ||||||||||||
| Equity Securities: | ||||||||||||||||
Brazil | $7,898,465 | $6,181,316 | $— | $14,079,781 | ||||||||||||
China | — | 11,423,496 | — | 11,423,496 | ||||||||||||
South Korea | 867,900 | 7,937,426 | — | 8,805,326 | ||||||||||||
Taiwan | — | 8,091,484 | — | 8,091,484 | ||||||||||||
India | 1,060,285 | 5,977,999 | — | 7,038,284 | ||||||||||||
Russia | 1,144,774 | 5,119,441 | — | 6,264,215 | ||||||||||||
Hong Kong | 1,128,457 | 4,471,476 | — | 5,599,933 | ||||||||||||
Mexico | 5,448,880 | — | — | 5,448,880 | ||||||||||||
South Africa | — | 4,470,093 | — | 4,470,093 | ||||||||||||
Other Countries | 6,531,410 | 11,780,693 | — | 18,312,103 | ||||||||||||
| Mutual Funds | 25 | — | — | 25 | ||||||||||||
| Total Investments | $24,080,196 | $65,453,424 | $— | $89,533,620 | ||||||||||||
For further information regarding security characteristics, see the Portfolio of Investments.
Of the level 2 investments presented above, equity investments amounting to $51,126,012 would have been considered level 1 investments at the beginning of the period. The primary reason for changes in the classifications between levels 1 and 2 occurs when foreign equity securities are fair valued using other observable market-based inputs in place of the closing exchange price due to events occurring after the close of the exchange or market on which the investment is principally traded. The fund’s foreign equity securities may often be valued at fair value. The fund’s policy is to recognize transfers between the levels as of the end of the period.
Foreign Currency Translation – Purchases and sales of foreign investments, income, and expenses are converted into U.S. dollars based upon currency exchange rates prevailing on the respective dates of such transactions or on the reporting date for foreign denominated receivables and payables. Gains and losses attributable to foreign currency exchange rates on sales of securities are recorded for financial statement purposes as net realized gains and losses on investments. Gains and losses attributable to foreign exchange rate movements on receivables, payables, income and expenses are recorded for financial statement purposes as foreign currency transaction gains and losses. That portion of both realized and unrealized gains and losses on investments that results from fluctuations in foreign currency exchange rates is not separately disclosed.
Security Loans – State Street Bank and Trust Company (“State Street”), as lending agent, loans the securities of the fund to certain qualified institutions (the “Borrowers”) approved by the fund. The loans are collateralized by cash and/or U.S. Treasury and federal agency obligations in an amount typically at least equal to the market value of the securities loaned. The market value of the loaned securities is determined at the close of business of the fund and any additional required collateral is delivered to the fund on the next business day. State Street provides the fund with indemnification against Borrower default. The fund bears the risk of loss with respect to the investment of cash collateral. On loans collateralized by cash, the cash collateral is invested in a money market fund or short-term securities. A portion of the income generated upon investment of the collateral is remitted to the Borrowers, and the remainder is allocated between the fund and the lending agent. On loans collateralized by U.S. Treasury and/or federal agency obligations, a fee is received from the Borrower, and is allocated between the fund and the lending agent. Income from securities lending is included in “Interest” income in the Statement of Operations. The dividend and interest income earned on the securities loaned is accounted for in the same manner as other dividend and interest income. At December 31, 2012 there were no securities on loan or collateral outstanding.
Indemnifications – Under the fund’s organizational documents, its officers and Trustees may be indemnified against certain liabilities and expenses arising out of the performance of their duties to the fund. Additionally, in the normal course of business, the
16
Table of Contents
MFS Emerging Markets Equity Portfolio
Notes to Financial Statements – continued
fund enters into agreements with service providers that may contain indemnification clauses. The fund’s maximum exposure under these agreements is unknown as this would involve future claims that may be made against the fund that have not yet occurred.
Investment Transactions and Income – Investment transactions are recorded on the trade date. Interest income is recorded on the accrual basis. Dividends received in cash are recorded on the ex-dividend date. Certain dividends from foreign securities will be recorded when the fund is informed of the dividend if such information is obtained subsequent to the ex-dividend date. Dividend payments received in additional securities are recorded on the ex-dividend date in an amount equal to the value of the security on such date.
The fund may receive proceeds from litigation settlements. Any proceeds received from litigation involving portfolio holdings are reflected in the Statement of Operations in realized gain/loss if the security has been disposed of by the fund or in unrealized gain/loss if the security is still held by the fund. Any other proceeds from litigation not related to portfolio holdings are reflected as other income in the Statement of Operations.
Fees Paid Indirectly – The fund’s custody fee may be reduced according to an arrangement that measures the value of cash deposited with the custodian by the fund. This amount, for the year ended December 31, 2012, is shown as a reduction of total expenses in the Statement of Operations.
Tax Matters and Distributions – The fund intends to qualify as a regulated investment company, as defined under Subchapter M of the Internal Revenue Code, and to distribute all of its taxable income, including realized capital gains. As a result, no provision for federal income tax is required. The fund’s federal tax returns, when filed, will remain subject to examination by the Internal Revenue Service for a three year period. Foreign taxes have been accrued by the fund in the accompanying financial statements.
Distributions to shareholders are recorded on the ex-dividend date. Income and capital gain distributions are determined in accordance with income tax regulations, which may differ from U.S. generally accepted accounting principles. Certain capital accounts in the financial statements are periodically adjusted for permanent differences in order to reflect their tax character. These adjustments have no impact on net assets or net asset value per share. Temporary differences which arise from recognizing certain items of income, expense, gain or loss in different periods for financial statement and tax purposes will reverse at some time in the future. Distributions in excess of net investment income or net realized gains are temporary overdistributions for financial statement purposes resulting from differences in the recognition or classification of income or distributions for financial statement and tax purposes.
Book/tax differences primarily relate to wash sale loss deferrals and passive foreign investment companies.
The tax character of distributions declared to shareholders for the last two fiscal years is as follows:
| 12/31/12 | 12/31/11 | |||||||
| Ordinary income (including any short-term capital gains) | $2,236,279 | $810,319 | ||||||
| Long-term capital gains | 4,785,127 | 5,478,181 | ||||||
| Total distributions | $7,021,406 | $6,288,500 | ||||||
The federal tax cost and the tax basis components of distributable earnings were as follows:
| As of 12/31/12 | ||||
| Cost of investments | $71,291,675 | |||
| Gross appreciation | 20,638,871 | |||
| Gross depreciation | (2,396,926 | ) | ||
| Net unrealized appreciation (depreciation) | $18,241,945 | |||
| Undistributed ordinary income | 1,337,813 | |||
| Capital loss carryforwards | (3,203,727 | ) | ||
| Other temporary differences | (339,552 | ) |
As of December 31, 2012, the fund had capital loss carryforwards available to offset future realized gains. Such losses are characterized as follows:
| Short-term losses | $(419,668 | ) | ||
| Long-term losses | (2,784,059 | ) | ||
| Total | $(3,203,727 | ) |
Under the Regulated Investment Company Modernization Act of 2010 (the “Act”), the above net capital losses may be carried forward indefinitely, and their character is retained as short-term and/or long-term losses. Previously, net capital losses were carried forward for eight years and treated as short-term losses.
Multiple Classes of Shares of Beneficial Interest – The fund offers multiple classes of shares, which differ in their respective distribution and/or service fees. The fund’s income, realized and unrealized gain (loss), and common expenses are allocated to
17
Table of Contents
MFS Emerging Markets Equity Portfolio
Notes to Financial Statements – continued
shareholders based on the daily net assets of each class. Dividends are declared separately for each class. Differences in per share dividend rates are generally due to differences in separate class expenses. The fund’s distributions declared to shareholders as reported in the Statements of Changes in Net Assets are presented by class as follows:
| From net investment income | From net realized gain on investments | |||||||||||||||
| Year ended 12/31/12 | Year ended 12/31/11 | Year ended 12/31/12 | Year ended 12/31/11 | |||||||||||||
| Initial Class | $1,051,896 | $526,690 | $3,957,778 | $4,031,341 | ||||||||||||
| Service Class | 348,113 | 135,417 | 1,663,619 | 1,595,052 | ||||||||||||
| Total | $1,400,009 | $662,107 | $5,621,397 | $5,626,393 | ||||||||||||
| (3) | Transactions with Affiliates |
Investment Adviser – The fund has an investment advisory agreement with MFS to provide overall investment management and related administrative services and facilities to the fund. The management fee is computed daily and paid monthly at the following annual rates:
| First $500 million of average daily net assets | 1.05% | |||
| Average daily net assets in excess of $500 million | 1.00% |
The management fee incurred for the year ended December 31, 2012 was equivalent to an annual effective rate of 1.05% of the fund’s average daily net assets.
The investment adviser has agreed in writing to pay a portion of the fund’s total annual operating expenses, exclusive of interest, taxes, extraordinary expenses, brokerage and transaction costs, and investment-related expenses, such that total annual operating expenses do not exceed 1.40% of average daily net assets for the Initial Class shares and 1.65% of average daily net assets for the Service Class shares. This written agreement will continue until modified by the fund’s Board of Trustees, but such agreement will continue at least until April 30, 2014. For the year ended December 31, 2012, the fund’s actual operating expenses did not exceed the limit and therefore, the investment adviser did not pay any portion of the fund’s expenses related to this agreement.
Distributor – MFS Fund Distributors, Inc. (MFD), a wholly-owned subsidiary of MFS, is the distributor of shares of the fund. The Trustees have adopted a distribution plan for the Service Class shares pursuant to Rule 12b-1 under the Investment Company Act of 1940.
The fund’s distribution plan provides that the fund will pay MFD distribution and/or service fees equal to 0.25% per annum of its average daily net assets attributable to Service Class shares as partial consideration for services performed and expenses incurred by MFD and financial intermediaries (including participating insurance companies that invest in the fund to fund variable annuity and variable life insurance contracts, sponsors of qualified retirement and pension plans that invest in the fund, and affiliates of these participating insurance companies and plan sponsors) in connection with the sale and distribution of the Service Class shares. MFD may subsequently pay all, or a portion, of the distribution and/or service fees to financial intermediaries.
Shareholder Servicing Agent – MFS Service Center, Inc. (MFSC), a wholly-owned subsidiary of MFS, receives a fee from the fund for its services as shareholder servicing agent. For the year ended December 31, 2012, the fee was $11,864, which equated to 0.0092% annually of the fund’s average daily net assets. MFSC also receives payment from the fund for out-of-pocket expenses paid by MFSC on behalf of the fund. For the year ended December 31, 2012, these costs amounted to $28.
Administrator – MFS provides certain financial, legal, shareholder communications, compliance, and other administrative services to the fund. Under an administrative services agreement, the fund partially reimburses MFS the costs incurred to provide these services. The fund is charged an annual fixed amount of $17,500 plus a fee based on average daily net assets. The administrative services fee incurred for the year ended December 31, 2012 was equivalent to an annual effective rate of 0.0224% of the fund’s average daily net assets.
Trustees’ and Officers’ Compensation – The fund pays compensation to independent Trustees in the form of a retainer, attendance fees, and additional compensation to Board and Committee chairpersons. The fund does not pay compensation directly to Trustees or officers of the fund who are also officers of the investment adviser, all of whom receive remuneration for their services to the fund from MFS. Certain officers and Trustees of the fund are officers or directors of MFS, MFD, and MFSC.
Other – This fund and certain other funds managed by MFS (the funds) have entered into services agreements (the Agreements) which provide for payment of fees by the funds to Tarantino LLC and Griffin Compliance LLC in return for the provision of services of an Independent Chief Compliance Officer (ICCO) and Assistant ICCO, respectively, for the funds. The ICCO and Assistant ICCO are officers of the funds and the sole members of Tarantino LLC and Griffin Compliance LLC, respectively. The funds can terminate the Agreements with Tarantino LLC and Griffin Compliance LLC at any time under the terms of the Agreements. For the year ended December 31, 2012, the aggregate fees paid by the fund to Tarantino LLC and Griffin Compliance LLC were $1,076 and are included in “Miscellaneous” expense in the Statement of Operations. MFS has agreed to reimburse the fund for a portion of the
18
Table of Contents
MFS Emerging Markets Equity Portfolio
Notes to Financial Statements – continued
payments made by the fund in the amount of $474, which is shown as a reduction of total expenses in the Statement of Operations. Additionally, MFS has agreed to bear all expenses associated with office space, other administrative support, and supplies provided to the ICCO and Assistant ICCO.
The fund invests in the MFS Institutional Money Market Portfolio which is managed by MFS and seeks current income consistent with preservation of capital and liquidity. Income earned on this investment is included in “Dividends from underlying affiliated funds” in the Statement of Operations. This money market fund does not pay a management fee to MFS.
| (4) | Portfolio Securities |
Purchases and sales of investments, other than short-term obligations, aggregated $41,737,698 and $95,105,912, respectively.
| (5) | Shares of Beneficial Interest |
The fund’s Declaration of Trust permits the Trustees to issue an unlimited number of full and fractional shares of beneficial interest. Transactions in fund shares were as follows:
| Year ended 12/31/12 | Year ended 12/31/11 | |||||||||||||||
| Shares | Amount | Shares | Amount | |||||||||||||
| Shares sold | ||||||||||||||||
Initial Class | 512,045 | $7,556,283 | 1,330,112 | $21,129,082 | ||||||||||||
Service Class | 620,853 | 9,211,261 | 1,005,433 | 15,977,133 | ||||||||||||
| 1,132,898 | $16,767,544 | 2,335,545 | $37,106,215 | |||||||||||||
| Shares issued to shareholders in reinvestment of distributions | ||||||||||||||||
Initial Class | 349,593 | $5,009,674 | 300,463 | $4,558,031 | ||||||||||||
Service Class | 142,474 | 2,011,732 | 115,673 | 1,730,469 | ||||||||||||
| 492,067 | $7,021,406 | 416,136 | $6,288,500 | |||||||||||||
| Shares reacquired | ||||||||||||||||
Initial Class | (4,148,462 | ) | $(60,765,216 | ) | (762,765 | ) | $(12,544,649 | ) | ||||||||
Service Class | (780,281 | ) | (11,646,525 | ) | (542,955 | ) | (8,870,972 | ) | ||||||||
| (4,928,743 | ) | $(72,411,741 | ) | (1,305,720 | ) | $(21,415,621 | ) | |||||||||
| Net change | ||||||||||||||||
Initial Class | (3,286,824 | ) | $(48,199,259 | ) | 867,810 | $13,142,464 | ||||||||||
Service Class | (16,954 | ) | (423,532 | ) | 578,151 | 8,836,630 | ||||||||||
| (3,303,778 | ) | $(48,622,791 | ) | 1,445,961 | $21,979,094 | |||||||||||
The fund is one of several mutual funds in which the MFS funds-of-funds may invest. The MFS funds-of-funds do not invest in the underlying MFS funds for the purpose of exercising management or control. At the end of the period, the MFS Growth Allocation Portfolio was the owner of record of approximately 6% of the value of outstanding voting shares of the fund.
| (6) | Line of Credit |
The fund and certain other funds managed by MFS participate in a $1.1 billion unsecured committed line of credit, subject to a $1 billion sublimit, provided by a syndication of banks under a credit agreement. Borrowings may be made for temporary financing needs. Interest is charged to each fund, based on its borrowings, generally at a rate equal to the higher of the Federal Reserve funds rate or one month LIBOR plus an agreed upon spread. A commitment fee, based on the average daily, unused portion of the committed line of credit, is allocated among the participating funds at the end of each calendar quarter. In addition, the fund and other funds managed by MFS have established unsecured uncommitted borrowing arrangements with certain banks for temporary financing needs. Interest is charged to each fund, based on its borrowings, at a rate equal to the Federal Reserve funds rate plus an agreed upon spread. For the year ended December 31, 2012, the fund’s commitment fee and interest expense were $855 and $0, respectively, and are included in “Miscellaneous” expense in the Statement of Operations.
| (7) | Transactions in Underlying Affiliated Funds – Affiliated Issuers |
An affiliated issuer may be considered one in which the fund owns 5% or more of the outstanding voting securities, or a company which is under common control. For the purposes of this report, the fund assumes the following to be an affiliated issuer:
| Underlying Affiliated Fund | Beginning Shares/Par Amount | Acquisitions Shares/Par Amount | Dispositions Shares/Par Amount | Ending Shares/Par Amount | ||||||||||||
| MFS Institutional Money Market Portfolio | 1,374,005 | 30,523,480 | (31,897,460 | ) | 25 | |||||||||||
| Underlying Affiliated Fund | Realized Gain (Loss) | Capital Gain Distributions | Dividend Income | Ending Value | ||||||||||||
| MFS Institutional Money Market Portfolio | $— | $— | $1,328 | $25 | ||||||||||||
19
Table of Contents
MFS Emerging Markets Equity Portfolio
REPORT OF INDEPENDENT REGISTERED PUBLIC ACCOUNTING FIRM
To the Board of Trustees of MFS Variable Insurance Trust II and the Shareholders of
MFS Emerging Markets Equity Portfolio:
We have audited the accompanying statement of assets and liabilities, including the portfolio of investments, of MFS Emerging Markets Equity Portfolio (the “Fund”) (one of the series comprising MFS Variable Insurance Trust II) as of December 31, 2012, and the related statement of operations for the year then ended, the statements of changes in net assets for each of the two years in the period then ended, and the financial highlights for each of the five years in the period then ended. These financial statements and financial highlights are the responsibility of the Fund’s management. Our responsibility is to express an opinion on these financial statements and financial highlights based on our audits.
We conducted our audits in accordance with the standards of the Public Company Accounting Oversight Board (United States). Those standards require that we plan and perform the audit to obtain reasonable assurance about whether the financial statements and financial highlights are free of material misstatement. The Fund is not required to have, nor were we engaged to perform, an audit of its internal control over financial reporting. Our audits included consideration of internal control over financial reporting as a basis for designing audit procedures that are appropriate in the circumstances, but not for the purpose of expressing an opinion on the effectiveness of the Fund’s internal control over financial reporting. Accordingly, we express no such opinion. An audit also includes examining, on a test basis, evidence supporting the amounts and disclosures in the financial statements, assessing the accounting principles used and significant estimates made by management, as well as evaluating the overall financial statement presentation. Our procedures included confirmation of securities owned as of December 31, 2012, by correspondence with the custodian. We believe that our audits provide a reasonable basis for our opinion.
In our opinion, the financial statements and financial highlights referred to above present fairly, in all material respects, the financial position of MFS Emerging Markets Equity Portfolio as of December 31, 2012, the results of its operations for the year then ended, the changes in its net assets for each of the two years in the period then ended, and the financial highlights for each of the five years in the period then ended, in conformity with accounting principles generally accepted in the United States of America.
DELOITTE & TOUCHE LLP
Boston, Massachusetts
February 15, 2013
20
Table of Contents
MFS Emerging Markets Equity Portfolio
TRUSTEES AND OFFICERS – IDENTIFICATION AND BACKGROUND
The Trustees and officers of the Trust, as of February 1, 2013, are listed below, together with their principal occupations during the past five years. (Their titles may have varied during that period.) The address of each Trustee and officer is 111 Huntington Avenue, Boston, Massachusetts 02199-7618.
Name, Age | Position(s) with Fund | Trustee/Officer Since (h) | Principal Occupations During the Past Five Years | Other Directorships (j) | ||||
| INTERESTED TRUSTEES | ||||||||
Robert J. Manning (k) (age 49) | Trustee | February 2004 | Massachusetts Financial Services Company, Chairman, Chief Executive Officer and Director; President (until December 2009); Chief Investment Officer (until July 2010) | N/A | ||||
| INDEPENDENT TRUSTEES | ||||||||
David H. Gunning (age 70) | Trustee and Chair of Trustees | January 2004 | Private investor | Lincoln Electric Holdings, Inc. (welding equipment manufacturer), Director; Development Alternatives, Inc. (consulting), Director/Non-Executive Chairman; Portman Limited (mining), Director (until 2008) | ||||
Robert E. Butler (age 71) | Trustee | January 2006 | Consultant – investment company industry regulatory and compliance matters | N/A | ||||
Maureen R. Goldfarb (age 57) | Trustee | January 2009 | Private investor | N/A | ||||
William R. Gutow (age 71) | Trustee | December 1993 | Private investor and real estate consultant; Capitol Entertainment Management Company (video franchise), Vice Chairman | Atlantic Coast Tan (tanning salons), Vice Chairman (until 2007); Texas Donuts (donut franchise), Vice Chairman (until 2010) | ||||
Michael Hegarty (age 68) | Trustee | December 2004 | Private investor; Rouse Properties Inc. (real estate), Director | N/A | ||||
John P. Kavanaugh (age 58) | Trustee | January 2009 | Private investor | N/A | ||||
J. Dale Sherratt (age 74) | Trustee | June 1989 | Insight Resources, Inc. (acquisition planning specialists), President; Wellfleet Investments (investor in health care companies), Managing General Partner | N/A | ||||
| Laurie J. Thomsen (age 55) | Trustee | March 2005 | Private investor; New Profit, Inc. (venture philanthropy), Executive Partner (until 2010) | The Travelers Companies (insurance), Director | ||||
Robert W. Uek (age 71) | Trustee | January 2006 | Consultant to investment company industry | N/A | ||||
| OFFICERS | ||||||||
John M. Corcoran (k) (age 47) | President | October 2008 | Massachusetts Financial Services Company, Senior Vice President (since October 2008); State Street Bank and Trust (financial services provider), Senior Vice President, (until September 2008) | N/A | ||||
| Christopher R. Bohane (k) (age 39) | Assistant Secretary and Assistant Clerk | July 2005 | Massachusetts Financial Services Company, Vice President and Senior Counsel | N/A | ||||
Kino Clark (k) (age 44) | Assistant Treasurer | January 2012 | Massachusetts Financial Services Company, Vice President | N/A | ||||
Thomas H. Connors (k) (age 53) | Assistant Secretary and Assistant Clerk | September 2012 | Massachusetts Financial Services Company, Vice President and Senior Counsel; Deutsche Investment Management Americas Inc. (financial service provider), Director and Senior Counsel (until 2012) | N/A | ||||
Ethan D. Corey (k) (age 49) | Assistant Secretary and Assistant Clerk | July 2005 | Massachusetts Financial Services Company, Senior Vice President and Associate General Counsel | N/A | ||||
21
Table of Contents
MFS Emerging Markets Equity Portfolio
Trustees and Officers – continued
Name, Age | Position(s) with Fund | Trustee/Officer Since (h) | Principal Occupations During the Past Five Years | Other Directorships (j) | ||||
David L. DiLorenzo (k) (age 44) | Treasurer | July 2005 | Massachusetts Financial Services Company, Senior Vice President | N/A | ||||
Robyn L. Griffin (age 37) | Assistant Independent Chief Compliance Officer | August 2008 | Griffin Compliance LLC (provider of compliance services), Principal (since August 2008); State Street Corporation (financial services provider), Mutual Fund Administration Assistant Vice President (October 2006 – July 2008) | N/A | ||||
Brian E. Langenfeld (k) (age 39) | Assistant Secretary and Assistant Clerk | June 2006 | Massachusetts Financial Services Company, Vice President and Senior Counsel | N/A | ||||
Susan S. Newton (k) (age 62) | Assistant Secretary and Assistant Clerk | May 2005 | Massachusetts Financial Services Company, Senior Vice President and Associate General Counsel | N/A | ||||
Susan A. Pereira (k) (age 42) | Assistant Secretary and Assistant Clerk | July 2005 | Massachusetts Financial Services Company, Vice President and Senior Counsel | N/A | ||||
Kasey L. Phillips (k) (age 42) | Assistant Treasurer | September 2012 | Massachusetts Financial Services Company, Vice President; Wells Fargo Funds Management, LLC, Senior Vice President, Fund Treasurer (until 2012) | N/A | ||||
Mark N. Polebaum (k) (age 60) | Secretary and Clerk | January 2006 | Massachusetts Financial Services Company, Executive Vice President, General Counsel and Secretary | N/A | ||||
Frank L. Tarantino (age 68) | Independent Chief Compliance Officer | June 2004 | Tarantino LLC (provider of compliance services), Principal | N/A | ||||
Richard S. Weitzel (k) (age 42) | Assistant Secretary and Assistant Clerk | October 2007 | Massachusetts Financial Services Company, Senior Vice President and Associate General Counsel | N/A | ||||
James O. Yost (k) (age 52) | Deputy Treasurer | September 1990 | Massachusetts Financial Services Company, Senior Vice President | N/A | ||||
| (h) | Date first appointed to serve as Trustee/officer of an MFS fund. Each Trustee has served continuously since appointment unless indicated otherwise. For the period from December 15, 2004 until February 22, 2005, Mr. Manning served as Advisory Trustee. For the period October 2008, until January 2012, Mr. Corcoran served as Treasurer of the Funds. Prior to January 2012, Messrs. DiLorenzo and Yost served as Assistant Treasurers of the Funds. |
| (j) | Directorships or trusteeships of companies required to report to the Securities and Exchange Commission (i.e., “public companies”). |
| (k) | “Interested person” of the Trust within the meaning of the Investment Company Act of 1940 (referred to as the 1940 Act), which is the principal federal law governing investment companies like the fund, as a result of position with MFS. The address of MFS is 111 Huntington Avenue, Boston, Massachusetts 02199-7618. |
Each Trustee has been elected by shareholders and each Trustee and officer holds office until his or her successor is chosen and qualified or until his or her earlier death, resignation, retirement or removal. The Trust does not hold annual meetings for the purpose of electing Trustees, and Trustees are not elected for fixed terms. Messrs. Butler, Kavanaugh, Uek and Ms. Thomsen are members of the Trust’s Audit Committee.
Each of the Fund’s Trustees and officers holds comparable positions with certain other funds of which MFS or a subsidiary is the investment adviser or distributor, and, in the case of the officers, with certain affiliates of MFS. As of January 1, 2013, the Trustees served as board members of 143 funds within the MFS Family of Funds.
22
Table of Contents
MFS Emerging Markets Equity Portfolio
Trustees and Officers – continued
The Statement of Additional Information for the Fund includes further information about the Trustees and is available without charge upon request by calling 1-800-225-2606.
Investment Adviser Massachusetts Financial Services Company 111 Huntington Avenue Boston, MA 02199-7618 | Custodian State Street Bank and Trust 1 Lincoln Street Boston, MA 02111-2900 | |
Distributor MFS Fund Distributors, Inc. 111 Huntington Avenue Boston, MA 02199-7618 | Independent Registered Public Accounting Firm Deloitte & Touche LLP 200 Berkeley Street Boston, MA 02116 | |
Portfolio Managers Jose Luis Garcia Robert Lau |
23
Table of Contents
MFS Emerging Markets Equity Portfolio
BOARD REVIEW OF INVESTMENT ADVISORY AGREEMENT
A discussion regarding the Board’s most recent approval of the fund’s Investment Advisory Agreement with MFS is available by clicking on the fund’s name under “Variable Insurance Portfolios – VIT II” in the “Products” section of the MFS Web site (mfs.com).
PROXY VOTING POLICIES AND INFORMATION
A general description of the MFS funds’ proxy voting policies and procedures is available without charge, upon request, by calling 1-800-225-2606, by visiting the Proxy Voting section of mfs.com or by visiting the SEC’s Web site at http://www.sec.gov.
Information regarding how the fund voted proxies relating to portfolio securities during the most recent twelve-month period ended June 30 is available without charge by visiting the Proxy Voting section of mfs.com or by visiting the SEC’s Web site at http://www.sec.gov.
QUARTERLY PORTFOLIO DISCLOSURE
The fund will file a complete schedule of portfolio holdings with the Securities and Exchange Commission (the Commission) for the first and third quarters of each fiscal year on Form N-Q. The fund’s Form N-Q is available on the EDGAR database on the Commission’s Internet Web site at http://www.sec.gov, and may be reviewed and copied at the:
Public Reference Room
Securities and Exchange Commission
100 F Street, NE, Room 1580
Washington, D.C. 20549
Information on the operation of the Public Reference Room may be obtained by calling the Commission at 1-800-SEC-0330. Copies of the fund’s Form N-Q also may be obtained, upon payment of a duplicating fee, by electronic request at the following e-mail address: publicinfo@sec.gov or by writing the Public Reference Section at the above address.
From time to time, MFS may post important information about the fund or the MFS funds on the MFS web site (mfs.com). This information is available by visiting the “News & Commentary” section of mfs.com or by clicking on the fund’s name under “Variable Insurance Portfolios – VIT II” in the “Products” section of mfs.com.
FEDERAL TAX INFORMATION (unaudited)
The following information is provided pursuant to provisions of the Internal Revenue Code.
The fund designates $5,264,000 as capital gain dividends paid during the fiscal year.
Income derived from foreign sources was $3,607,538. The fund intends to pass through foreign tax credits of $430,603 for the fiscal year.
24
Table of Contents
rev. 3/11

| Why? | Financial companies choose how they share your personal information. Federal law gives consumers the right to limit some but not all sharing. Federal law also requires us to tell you how we collect, share, and protect your personal information. Please read this notice carefully to understand what we do. |
| What? | The types of personal information we collect and share depend on the product or service you have with us. This information can include:
• Social Security number and account balances • Account transactions and transaction history • Checking account information and wire transfer instructions
When you are no longer our customer, we continue to share your information as described in this notice. |
| How? | All financial companies need to share customers’ personal information to run their everyday business. In the section below, we list the reasons financial companies can share their customers’ personal information; the reasons MFS chooses to share; and whether you can limit this sharing. |
| Reasons we can share your personal information | Does MFS share? | Can you limit this sharing? | ||
For our everyday business purposes – such as to process your transactions, maintain your account(s), respond to court orders and legal investigations, or report to credit bureaus | Yes | No | ||
For our marketing purposes – to offer our products and services to you | No | We don’t share | ||
| For joint marketing with other financial companies | No | We don’t share | ||
For our affiliates’ everyday business purposes – information about your transactions and experiences | No | We don’t share | ||
For our affiliates’ everyday business purposes – information about your creditworthiness | No | We don’t share | ||
| For nonaffiliates to market to you | No | We don’t share |
| Questions? | Call 800-225-2606 or go to mfs.com. |
25
Table of Contents
| Page 2 |
| Who we are | ||
| Who is providing this notice? | MFS Funds, MFS Investment Management, MFS Institutional Advisors, Inc., MFS Fund Distributors, Inc., MFS Heritage Trust Company, and MFS Service Center, Inc. | |
| What we do | ||
| How does MFS protect my personal information? | To protect your personal information from unauthorized access and use, we use security measures that comply with federal law. These measures include procedural, electronic, and physical safeguards for the protection of the personal information we collect about you. | |
| How does MFS collect my personal information? | We collect your personal information, for example, when you
• open an account or provide account information • direct us to buy securities or direct us to sell your securities • make a wire transfer
We also collect your personal information from others, such as credit bureaus, affiliates and other companies. | |
| Why can’t I limit all sharing? | Federal law gives you the right to limit only
• sharing for affiliates’ everyday business purposes – information about your creditworthiness • affiliates from using your information to market to you • sharing for nonaffiliates to market to you
State laws and individual companies may give you additional rights to limit sharing. | |
| Definitions | ||
| Affiliates | Companies related by common ownership or control. They can be financial and nonfinancial companies.
•MFS does not share personal information with affiliates, except for everyday business purposes as described on page one of this notice. | |
| Nonaffiliates | Companies not related by common ownership or control. They can be financial and nonfinancial companies.
•MFS does not share with nonaffiliates so they can market to you. | |
| Joint Marketing | A formal agreement between nonaffiliated financial companies that together market financial products or services to you.
•MFS doesn’t jointly market. | |
| Other important information | ||
| If you own an MFS product or receive an MFS service in the name of a third party such as a bank or broker-dealer, their privacy policy may apply to you instead of ours. | ||
26
Table of Contents
Table of Contents
ANNUAL REPORT
December 31, 2012

MFS® STRATEGIC INCOME PORTFOLIO
MFS® Variable Insurance Trust II

SIS-ANN
Table of Contents
MFS® STRATEGIC INCOME PORTFOLIO
The report is prepared for the general information of contract owners. It is authorized for distribution to prospective investors only when preceded or accompanied by a current prospectus.
NOT FDIC INSURED Ÿ MAY LOSE VALUE Ÿ NO BANK OR CREDIT UNION GUARANTEE Ÿ NOT A DEPOSIT Ÿ NOT INSURED BY ANY FEDERAL GOVERNMENT AGENCY OR NCUA/NCUSIF
Table of Contents
MFS Strategic Income Portfolio
LETTER FROM THE CHAIRMAN AND CEO

Dear Contract Owners:
The global market outlook for 2013 is one of cautious optimism. While we are seeing some positive economic trends in the United States, Europe and China, the overall environment remains challenging. In the United States, the recent fiscal cliff agreement was received positively by investors, even though it mostly addressed pressing taxation issues and did not resolve additional concerns, including the need for spending cuts and a large-scale reduction of the federal debt. These issues will be front and center again in the spring. Despite the ongoing uncertainty, economic tailwinds are gathering strength as the U.S. housing and job markets are improving and consumer confidence is rising.
Overseas, the debt crisis continues to weigh heavily on eurozone markets, with even Germany — long an economic stalwart — experiencing some contraction. These ongoing challenges could be a drag on global market performance this year. In Asia, manufacturing activity has accelerated in emerging markets such as China and India, and we are seeing signs of stabilized loan growth in China, a leading indicator of that country’s economic health. In contrast, Japan’s economy is contracting sharply under deflationary pressures. Nevertheless, Japanese markets have responded favorably to early actions by the new government, which appears determined to act aggressively, along with the Bank of Japan, to stimulate growth.
As always, managing risk in the face of uncertainty remains a top priority for investors. At MFS®, our uniquely collaborative investment process revolves around global research and our disciplined risk management approach. Our global team of investment professionals shares ideas and evaluates opportunities across continents, investment disciplines and asset classes — all with a goal of building better insights, and ultimately better results, for our clients.
We remain mindful of the many economic challenges investors face today, and believe it is more important than ever to maintain a long-term view, employ time-tested principles, such as asset allocation and diversification, and work closely with investment advisors to identify and pursue the most suitable opportunities.
Respectfully,

Robert J. Manning
Chairman and Chief Executive Officer
MFS Investment Management®
February 15, 2013
The opinions expressed in this letter are subject to change, may not be relied upon for investment advice, and no forecasts can be guaranteed.
1
Table of Contents
MFS Strategic Income Portfolio
Portfolio structure (i)
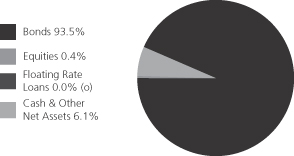
| Fixed income sectors (i) | ||||
| High Grade Corporates | 48.1% | |||
| High Yield Corporates | 29.5% | |||
| Non-U.S. Government Bonds | 11.9% | |||
| Emerging Markets Bonds | 4.4% | |||
| Commercial Mortgage-Backed Securities | 1.2% | |||
| U.S. Government Agencies | 1.1% | |||
| Mortgage-Backed Securities | 0.5% | |||
| Asset-Backed Securities | 0.4% | |||
| Collateralized Debt Obligations | 0.2% | |||
| Floating Rate Loans (o) | 0.0% | |||
| U.S. Treasury Securities | (3.8)% |
| Composition including fixed income credit quality (a)(i) | ||||
| AAA | 4.7% | |||
| AA | 5.0% | |||
| A | 20.3% | |||
| BBB | 33.4% | |||
| BB | 13.3% | |||
| B | 14.1% | |||
| CCC | 4.7% | |||
| CC (o) | 0.0% | |||
| C | 0.2% | |||
| Federal Agencies | 1.6% | |||
| Not Rated | (3.8)% | |||
| Non-Fixed Income | 0.4% | |||
| Cash & Other | 6.1% | |||
| Portfolio facts (i) | ||||
| Average Duration (d) | 4.7 | |||
| Average Effective Maturity (m) | 7.5 yrs. | |||
| Issuer country weightings (i)(x) | ||||
| United States | 67.3% | |||
| United Kingdom | 5.4% | |||
| France | 3.2% | |||
| Netherlands | 2.7% | |||
| Japan | 2.7% | |||
| Canada | 2.3% | |||
| Germany | 2.1% | |||
| Australia | 2.0% | |||
| Sweden | 1.5% | |||
| Other Countries | 10.8% | |||
| (a) | For all securities other than those specifically described below, ratings are assigned to underlying securities utilizing ratings from Moody’s, Fitch, and Standard & Poor’s rating agencies and applying the following hierarchy: If all three agencies provide a rating, the middle rating (after dropping the highest and lowest ratings) is assigned; if two of the three agencies rate a security, the lower of the two is assigned. Ratings are shown in the S&P and Fitch scale (e.g., AAA). Securities rated BBB or higher are considered investment grade. All ratings are subject to change. Federal Agencies includes rated and unrated U.S. Agency fixed-income securities, U.S. Agency mortgage-backed securities, and collateralized mortgage obligations of U.S. Agency mortgage-backed securities. Not Rated includes fixed income securities, including fixed income futures contracts, which have not been rated by any rating agency. Non-Fixed Income includes equity securities (including convertible bonds and equity derivatives) and commodities. Cash & Other includes cash, other assets less liabilities, offsets to derivative positions, and short-term securities. The fund may not hold all of these instruments. The fund is not rated by these agencies. |
| (d) | Duration is a measure of how much a bond’s price is likely to fluctuate with general changes in interest rates, e.g., if rates rise 1.00%, a bond with a 5-year duration is likely to lose about 5.00% of its value due to the interest rate move. |
| (i) | For purposes of this presentation, the components include the market value of securities, and reflect the impact of the equivalent exposure of derivative positions, if any. These amounts may be negative from time to time. The bond component will include any accrued interest amounts. Equivalent exposure is a calculated amount that translates the derivative position into a reasonable approximation of the amount of the underlying asset that the portfolio would have to hold at a given point in time to have the same price sensitivity that results from the portfolio’s ownership of the derivative contract. When dealing with derivatives, equivalent exposure is a more representative measure of the potential impact of a position on portfolio performance than market value. Where the fund holds convertible bonds, these are treated as part of the equity portion of the portfolio. |
| (m) | In determining an instrument’s effective maturity for purposes of calculating the fund’s dollar-weighted average effective maturity, MFS uses the instrument’s stated maturity or, if applicable, an earlier date on which MFS believes it is probable that a maturity-shortening device (such as a put, pre-refunding or prepayment) will cause the instrument to be repaid. Such an earlier date can be substantially shorter than the instrument’s stated maturity. |
| (o) | Less than 0.1%. |
| (x) | Represents the portfolio’s exposure to issuer countries as a percentage of a portfolio’s net assets. |
Percentages are based on net assets as of 12/31/12.
The portfolio is actively managed and current holdings may be different.
2
Table of Contents
MFS Strategic Income Portfolio
Summary of Results
For the twelve months ended December 31, 2012, Initial Class shares of the MFS Strategic Income Portfolio (“fund”) provided a total return of 10.42%, while Service Class shares of the fund provided a total return of 10.29%. These compare with a return of 15.78% over the same period for the fund’s benchmark, the Barclays U.S. High-Yield Corporate Bond 2% Issuer Capped Index. Effective April 29, 2012, the Barclays U.S. High-Yield Corporate Bond 2% Issuer Capped Index replaced the Barclays U.S. High-Yield Corporate Bond Index as the fund’s primary benchmark. The Barclays U.S. High-Yield Corporate Bond Index generated a return of 15.81% over the reporting period. For the same period, the fund’s other benchmark, the MFS Strategic Income Blended Index – Current (“Blended Index”), generated a return of 9.76%. The Blended Index reflects the blended returns of various fixed income market indices, with percentage allocations to each index designed to resemble the fixed income allocations of the fund. The market indices and related percentage allocations used to compile the Blended Index are set forth in the Performance Summary.
Market Environment
The beginning of the period was characterized by a risk-on sentiment as a result of additional liquidity measures by the Federal Reserve Bank (“Fed”) and the European Central Bank (“ECB”) as well as a commensurate improvement in macroeconomic conditions. During this time, global equity valuations rose, credit spreads contracted, and high-quality sovereign yields increased modestly.
During the middle of the period, however, conditions worsened, driven by broadly weaker global macroeconomic indicators, as well as renewed concerns over the eurozone’s capacity and determination to address its ongoing crisis. Despite this deterioration, broad market sentiment remained relatively resilient as equity markets generally maintained gains and credit spreads did not indicate deterioration.
However, this renewed weakness in the fundamentals precipitated a further round of monetary easing by both the Fed (through a third round of quantitative easing) and the ECB (through a new bond purchase facility) in the second half of the period, which soon instilled additional confidence in risk markets. Nonetheless, towards the end of the period, weaker equity earnings reports and declining forward guidance caused market sentiment to soften. In addition, as we moved toward year end, the fiscal cliff negotiations between the Republicans in the U.S. Congress and President Obama were a particular source of market attention, where uncertainty surrounding the fiscal negotiations continued right up to the end-of-year deadline.
Detractors from Performance
Relative to the Blended Index, the fund’s lack of exposure to emerging market debt securities of Turkey, Venezuela, and Russia, hindered relative results. A lesser exposure to Mexican and Indonesian bonds also dampened relative performance.
Contributors to Performance
Credit quality, primarily the fund’s greater exposure to “BBB” (r) and “A” rated securities, was a primary contributor to performance relative to the Blended Index. The portion of the fund’s return derived from yield, which was greater than that of the benchmark, was another positive factor for relative results.
A greater relative exposure to the financial, banking, and industrial sectors also benefited relative results as these market sectors performed well during the reporting period. Yield curve (y) positioning in the U.S., particularly the fund’s greater exposure to shifts in the middle portion of the yield curve (centered around maturities of 7 years), was another positive factor for the fund’s relative results as this portion of the yield curve performed well over the reporting period. Additionally, security selection further supported positive relative returns.
Respectfully,
| William Adams | James Calmas | David Cole | ||
| Portfolio Manager | Portfolio Manager | Portfolio Manager | ||
| Robert Persons | Matthew Ryan | Erik Weisman | ||
| Portfolio Manager | Portfolio Manager | Portfolio Manager | ||
| (r) | Bonds rated “BBB”, “Baa”, or higher are considered investment grade; bonds rated “BB”, “Ba”, or below are considered non-investment grade. The source for bond quality ratings is Moody’s Investors Service, Standard & Poor’s and Fitch, Inc. and are applied using the following hierarchy: If all three agencies provide a rating, the middle rating (after dropping the highest and lowest ratings) is assigned; if two of the three agencies rate a security, the lower of the two is assigned. Ratings are shown in the S&P and Fitch scale (e.g., AAA). For securities which are not rated by any of the three agencies, the security is considered Not Rated. |
| (y) | A yield curve graphically depicts the yields of different maturity bonds of the same credit quality and type; a normal yield curve is upward sloping, with short-term rates lower than long-term rates. |
The views expressed in this report are those of the portfolio managers only through the end of the period of the report as stated on the cover and do not necessarily reflect the views of MFS or any other person in the MFS organization. These views are subject to change at any time based on market or other conditions, and MFS disclaims any responsibility to update such views. These views may not be relied upon as investment advice or an indication of trading intent on behalf of any MFS portfolio. References to specific securities are not recommendations of such securities, and may not be representative of any MFS portfolio’s current or future investments.
3
Table of Contents
MFS Strategic Income Portfolio
PERFORMANCE SUMMARY THROUGH 12/31/12
The following chart illustrates the historical performance of the fund in comparison to its benchmark(s). Benchmarks are unmanaged and may not be invested in directly. Benchmark returns do not reflect any fees or expenses. The performance of other share classes will be greater than or less than that of the class depicted below. (See Notes to Performance Summary.)
Performance data shown represents past performance and is no guarantee of future results. Investment return and principal value fluctuate so your units, when sold, may be worth more or less than the original cost; current performance may be lower or higher than quoted. The performance shown does not reflect the deduction of taxes, if any, that a contract holder would pay on fund distributions or the redemption of contract units. The returns for the fund shown also do not reflect the deduction of expenses associated with variable products, such as mortality and expense risk charges, separate account charges, and sales charges imposed by the insurance company separate accounts. Such expenses would reduce the overall returns shown.
Growth of a Hypothetical $10,000 Investment
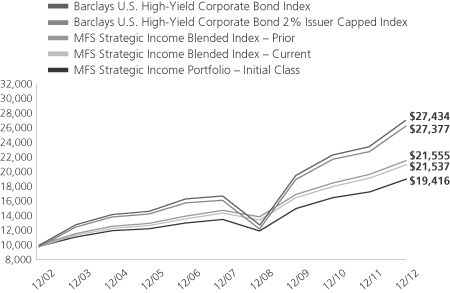
Total Returns through 12/31/12
Average annual total returns
| Share Class | Class inception date | 1-yr | 5-yr | 10-yr | ||||||||
| Initial Class | 5/06/98 | 10.42% | 7.19% | 6.86% | ||||||||
| Service Class | 8/24/01 | 10.29% | 6.93% | 6.59% | ||||||||
| Comparative benchmarks | ||||||||||||
Barclays U.S. High-Yield Corporate Bond 2% Issuer Capped Index (f)(s) | 15.78% | 10.45% | 10.60% | |||||||||
| Barclays U.S. High-Yield Corporate Bond Index (f)(s) | 15.81% | 10.34% | 10.62% | |||||||||
| MFS Strategic Income Blended Index – Current (f)(s)(x) | 9.76% | 8.03% | 7.97% | |||||||||
| MFS Strategic Income Blended Index – Prior (f)(s)(y) | 9.77% | 8.00% | 7.98% | |||||||||
| Barclays U.S. Credit Bond Index (f) | 9.37% | 7.65% | 6.23% | |||||||||
| Barclays U.S. Government/Mortgage Bond Index (f) | 2.27% | 5.46% | 4.87% | |||||||||
| Citigroup World Government Bond Non-Dollar Hedged Index (f) | 5.51% | 4.47% | 4.30% | |||||||||
| Citigroup World Government Bond Non-Dollar Index (f) | 1.51% | 5.24% | 6.38% | |||||||||
| JPMorgan Emerging Markets Bond Index Global (f) | 18.54% | 10.47% | 11.56% | |||||||||
| (f) | Source: FactSet Research Systems Inc. |
| (s) | Effective April 29, 2012, the Barclays U.S. High-Yield Corporate Bond 2% Issuer Capped Index replaced the Barclays U.S. High-Yield Corporate Bond Index as the fund’s primary benchmark and the MFS Strategic Income Portfolio Blended Index – Current replaced the MFS Strategic Income Portfolio |
4
Table of Contents
MFS Strategic Income Portfolio
Performance Summary – continued
| Blended Index – Prior as the fund’s other benchmark as the fund’s investment adviser believes the new benchmarks better reflect the investment policies and strategies of the fund. |
| (x) | MFS Strategic Income Blended Index – Current is at a point in time and allocations during the period can change. As of December 31, 2012 the blended index was comprised of 10% Barclays U.S. Credit Bond Index, 33% Barclays U.S. High-Yield Corporate Bond 2% Issuer Capped Index, 14% JPMorgan Emerging Markets Bond Index Global, 8.5% Citigroup World Government Bond Non-Dollar Hedged Index, 8.5% Citigroup World Government Bond Non-Dollar Index, and 26% Barclays U.S. Government/Mortgage Bond Index. |
| (s) | Effective April 29, 2012, the Barclays U.S. High-Yield Corporate Bond 2% Issuer Capped Index replaced the Barclays U.S. High-Yield Corporate Bond Index as the fund’s primary benchmark and the MFS Strategic Income Portfolio Blended Index – Current replaced the MFS Strategic Income Portfolio Blended Index – Prior as the fund’s other benchmark as the fund’s investment adviser believes the new benchmarks better reflect the investment policies and strategies of the fund. |
| (x) | MFS Strategic Income Blended Index – Current is at a point in time and allocations during the period can change. As of December 31, 2012 the blended index was comprised of 10% Barclays U.S. Credit Bond Index, 33% Barclays U.S. High-Yield Corporate Bond 2% Issuer Capped Index, 14% JPMorgan Emerging Markets Bond Index Global, 8.5% Citigroup World Government Bond Non-Dollar Hedged Index, 8.5% Citigroup World Government Bond Non-Dollar Index, and 26% Barclays U.S. Government/Mortgage Bond Index. |
| (y) | MFS Strategic Income Blended Index – Prior is at a point in time and allocations during the period can change. As of December 31, 2012 the blended index was comprised of 10% Barclays U.S. Credit Bond Index, 33% Barclays U.S. High-Yield Corporate Bond Index, 14% JPMorgan Emerging Markets Bond Index Global, 8.5% Citigroup World Government Bond Non-Dollar Hedged Index, 8.5% Citigroup World Government Bond Non-Dollar Index, and 26% Barclays U.S. Government/Mortgage Bond Index. |
Benchmark Definitions
Barclays U.S. Credit Bond Index – a market capitalization-weighted index that measures the performance of publicly issued, SEC-registered, U.S. corporate and specified foreign debentures and secured notes that meet specified maturity, liquidity, and quality requirements.
Barclays U.S. Government/Mortgage Bond Index – measures debt issued by the U.S. Government, and its agencies, as well as mortgage-backed pass-through securities of Ginnie Mae (GNMA), Fannie Mae (FNMA), and Freddie Mac (FHLMC).
Barclays U.S. High-Yield Corporate Bond 2% Issuer Capped Index – a component of the Barclays U.S. High-Yield Corporate Bond Index, which measures performance of non-investment grade, fixed rate debt. The index limits the maximum exposure to any one issuer to 2%.
Barclays U.S. High-Yield Corporate Bond Index – a market capitalization-weighted index that measures the performance of non-investment grade, fixed rate debt. Eurobonds and debt issues from countries designated as emerging markets (e.g., Argentina, Brazil, Venezuela, etc.) are excluded.
Citigroup World Government Bond Non-Dollar Hedged Index – a market capitalization-weighted index that is designed to represent the currency-hedged performance of the international developed government bond markets, excluding the United States.
Citigroup World Government Bond Non-Dollar Index – a market capitalization-weighted index that is designed to represent the performance of the international developed government bond markets, excluding the United States.
JPMorgan Emerging Markets Bond Index Global – measures the performance of U.S.-dollar-denominated debt instruments issued by emerging market sovereign and quasi-sovereign entities: Brady bonds, loans, Eurobonds.
It is not possible to invest directly in an index.
Notes to Performance Summary
Average annual total return represents the average annual change in value for each share class for the periods presented.
Performance results reflect any applicable expense subsidies and waivers in effect during the periods shown. Without such subsidies and waivers the fund’s performance results would be less favorable. Please see the prospectus and financial statements for complete details. All results are historical and assume the reinvestment of any dividends and capital gains distributions.
Performance results do not include adjustments made for financial reporting purposes in accordance with U.S. generally accepted accounting principles and may differ from amounts reported in the financial highlights.
From time to time the fund may receive proceeds from litigation settlements, without which performance would be lower.
5
Table of Contents
MFS Strategic Income Portfolio
Fund Expenses Borne by the Contract Holders During the Period,
July 1, 2012 through December 31, 2012
As a contract holder of the fund, you incur ongoing costs, including management fees; distribution and/or service (12b-1) fees; and other fund expenses. This example is intended to help you understand your ongoing costs (in dollars) of investing in the fund and to compare these costs with the ongoing costs of investing in other mutual funds.
The example is based on an investment of $1,000 invested at the beginning of the period and held for the entire period July 1, 2012 through December 31, 2012.
Actual Expenses
The first line for each share class in the following table provides information about actual account values and actual expenses. You may use the information in this line, together with the amount you invested, to estimate the expenses that you paid over the period. Simply divide your account value by $1,000 (for example, an $8,600 account value divided by $1,000 = 8.6), then multiply the result by the number in the first line under the heading entitled “Expenses Paid During Period” to estimate the expenses you paid on your account during this period.
Hypothetical Example for Comparison Purposes
The second line for each share class in the following table provides information about hypothetical account values and hypothetical expenses based on the fund’s actual expense ratio and an assumed rate of return of 5% per year before expenses, which is not the fund’s actual return. The hypothetical account values and expenses may not be used to estimate the actual ending account balance or expenses you paid for the period. You may use this information to compare the ongoing costs of investing in the fund and other funds. To do so, compare this 5% hypothetical example with the 5% hypothetical examples that appear in the shareholder reports of the other funds.
Please note that the expenses shown in the table are meant to highlight the fund’s ongoing costs only and do not take into account the fees and expenses imposed under the variable contracts through which your investment in the fund is made. Therefore, the second line for each share class in the table is useful in comparing ongoing costs associated with an investment in vehicles (such as the fund) which fund benefits under variable annuity and variable life insurance contracts and to qualified pension and retirement plans only, and will not help you determine the relative total costs of investing in the fund through variable annuity and variable life insurance contracts. If the fees and expenses imposed under the variable contracts were included, your costs would have been higher.
| Share Class | Annualized Expense Ratio | Beginning Account Value 7/01/12 | Ending Account Value | Expenses Paid During Period (p) 7/01/12-12/31/12 | ||||||||||||||
| Initial Class | Actual | 0.90% | $1,000.00 | $1,053.36 | $4.65 | |||||||||||||
| Hypothetical (h) | 0.90% | $1,000.00 | $1,020.61 | $4.57 | ||||||||||||||
| Service Class | Actual | 1.15% | $1,000.00 | $1,051.80 | $5.93 | |||||||||||||
| Hypothetical (h) | 1.15% | $1,000.00 | $1,019.36 | $5.84 | ||||||||||||||
| (h) | 5% class return per year before expenses. |
| (p) | Expenses paid are equal to each class’s annualized expense ratio, as shown above, multiplied by the average account value over the period, multiplied by the number of days in the period, divided by the number of days in the year. |
6
Table of Contents
MFS Strategic Income Portfolio
PORTFOLIO OF INVESTMENTS – 12/31/12
The Portfolio of Investments is a complete list of all securities owned by your fund. It is categorized by broad-based asset classes.
| Issuer | Shares/Par | Value ($) | ||||||
| BONDS – 96.0% | ||||||||
| Aerospace – 0.7% | ||||||||
| Bombardier, Inc., 7.5%, 2018 (n) | $ | 85,000 | $ | 94,669 | ||||
| Bombardier, Inc., 7.75%, 2020 (n) | 35,000 | 39,725 | ||||||
| CPI International, Inc., 8%, 2018 | 55,000 | 53,651 | ||||||
| Huntington Ingalls Industries, Inc., 7.125%, 2021 | 105,000 | 114,188 | ||||||
| Kratos Defense & Security Solutions, Inc., 10%, 2017 | 70,000 | 76,825 | ||||||
|
| |||||||
| $ | 379,058 | |||||||
|
| |||||||
| Airlines – 0.3% | ||||||||
| Continental Airlines, Inc., FRN, 0.66%, 2013 | $ | 151,785 | $ | 148,750 | ||||
|
| |||||||
| Apparel Manufacturers – 0.4% | ||||||||
| Hanesbrands, Inc., 8%, 2016 | $ | 15,000 | $ | 16,463 | ||||
| Hanesbrands, Inc., 6.375%, 2020 | 30,000 | 33,000 | ||||||
| Jones Group, Inc., 6.875%, 2019 | 45,000 | 46,800 | ||||||
| Levi Strauss & Co., 6.875%, 2022 | 5,000 | 5,363 | ||||||
| PVH Corp., 7.375%, 2020 | 65,000 | 72,881 | ||||||
| PVH Corp., 4.5%, 2022 | 25,000 | 25,250 | ||||||
|
| |||||||
| $ | 199,757 | |||||||
|
| |||||||
| Asset-Backed & Securitized – 1.8% | ||||||||
| Bayview Financial Revolving Mortgage Loan Trust, FRN, 1.809%, 2040 (z) | $ | 163,081 | $ | 103,089 | ||||
| Capital Trust Realty Ltd., CDO, 5.16%, 2035 (n) | 76,277 | 77,009 | ||||||
| Crest Ltd., “A1” CDO, FRN, 0.79%, 2018 (z) | 24,665 | 24,295 | ||||||
| Crest Ltd., CDO, 7%, 2040 (a)(p) | 321,150 | 16,058 | ||||||
| Falcon Franchise Loan LLC, FRN, 6.014%, 2023 (i)(z) | 135,034 | 15,191 | ||||||
| Falcon Franchise Loan LLC, FRN, 6.447%, 2025 (i)(z) | 141,036 | 22,171 | ||||||
| First Union-Lehman Brothers Bank of America, FRN, 0.444%, 2035 (i) | 1,345,785 | 25,739 | ||||||
| GMAC LLC, FRN, 6.02%, 2033 (z) | 125,263 | 127,723 | ||||||
| Hertz Global Holdings, Inc., 4.26%, 2014 (n) | 75,000 | 75,417 | ||||||
| Morgan Stanley Capital I, Inc., FRN, 1.383%, 2039 (i)(z) | 790,620 | 15,417 | ||||||
| Prudential Securities Secured Financing Corp., FRN, 7.167%, 2013 (z) | 411,000 | 410,691 | ||||||
| Salomon Brothers Mortgage Securities, Inc., FRN, 7.155%, 2032 (z) | 27,086 | 27,080 | ||||||
|
| |||||||
| $ | 939,880 | |||||||
|
| |||||||
| Automotive – 1.7% | ||||||||
| Accuride Corp., 9.5%, 2018 | $ | 75,000 | $ | 72,375 | ||||
| Allison Transmission, Inc., 7.125%, 2019 (n) | 90,000 | 96,075 | ||||||
| Ford Motor Co., 7.45%, 2031 | 20,000 | 25,400 | ||||||
| Ford Motor Credit Co. LLC, 12%, 2015 | 130,000 | 159,575 | ||||||
| General Motors Financial Co., Inc., 6.75%, 2018 | 80,000 | 91,775 | ||||||
| Goodyear Tire & Rubber Co., 8.25%, 2020 | 15,000 | 16,463 | ||||||
| Goodyear Tire & Rubber Co., 7%, 2022 | 25,000 | 26,813 | ||||||
| Issuer | Shares/Par | Value ($) | ||||||
| BONDS – continued | ||||||||
| Automotive – continued | ||||||||
| Harley-Davidson Financial Services, 3.875%, 2016 (n) | $ | 190,000 | $ | 203,945 | ||||
| Jaguar Land Rover PLC, 7.75%, 2018 (n) | 150,000 | 163,500 | ||||||
| Lear Corp., 8.125%, 2020 | 32,000 | 36,080 | ||||||
|
| |||||||
| $ | 892,001 | |||||||
|
| |||||||
| Biotechnology – 0.3% | ||||||||
| Life Technologies Corp., 6%, 2020 | $ | 150,000 | $ | 177,779 | ||||
|
| |||||||
| Broadcasting – 3.1% | ||||||||
| Allbritton Communications Co., 8%, 2018 | $ | 30,000 | $ | 32,550 | ||||
| AMC Networks, Inc., 7.75%, 2021 | 49,000 | 56,105 | ||||||
| CBS Corp., 5.75%, 2020 | 40,000 | 47,911 | ||||||
| CBS Corp., 3.375%, 2022 | 148,000 | 153,887 | ||||||
| Clear Channel Communications, Inc., 9%, 2021 | 59,000 | 52,658 | ||||||
| Clear Channel Worldwide Holdings, Inc., 6.5%, 2022 (n) | 15,000 | 15,413 | ||||||
| Clear Channel Worldwide Holdings, Inc., 6.5%, 2022 (n) | 30,000 | 31,125 | ||||||
| Clear Channel Worldwide Holdings, Inc., “A”, 7.625%, 2020 | 5,000 | 4,988 | ||||||
| Clear Channel Worldwide Holdings, Inc., “B”, 7.625%, 2020 | 25,000 | 25,188 | ||||||
| Hughes Network Systems LLC, 7.625%, 2021 | 30,000 | 34,125 | ||||||
| IAC/InterActiveCorp, 4.75%, 2022 (z) | 5,000 | 4,975 | ||||||
| Intelsat Bermuda Ltd., 11.25%, 2017 | 90,000 | 95,175 | ||||||
| Intelsat Bermuda Ltd., 11.5%, 2017 (p) | 90,000 | 95,625 | ||||||
| Intelsat Jackson Holdings Ltd., 6.625%, 2022 (n) | 45,000 | 46,463 | ||||||
| LBI Media, Inc., 13.5% to 2015, 11.5% to 2020 (p)(z) | 35,000 | 14,700 | ||||||
| Liberty Media Corp., 8.5%, 2029 | 55,000 | 59,538 | ||||||
| Liberty Media Corp., 8.25%, 2030 | 15,000 | 16,350 | ||||||
| Local TV Finance LLC, 9.25%, 2015 (p)(z) | 41,186 | 41,649 | ||||||
| NBCUniversal Media LLC, 5.95%, 2041 | 161,000 | 197,391 | ||||||
| News America, Inc., 8.5%, 2025 | 75,000 | 101,834 | ||||||
| Nexstar Broadcasting Group, Inc., 8.875%, 2017 | 20,000 | 21,950 | ||||||
| Nexstar Broadcasting Group, Inc., 6.875%, 2020 (n) | 5,000 | 5,131 | ||||||
| Sinclair Broadcast Group, Inc., 9.25%, 2017 (n) | 25,000 | 27,500 | ||||||
| Sinclair Broadcast Group, Inc., 8.375%, 2018 | 5,000 | 5,588 | ||||||
| SIRIUS XM Radio, Inc., 8.75%, 2015 (n) | 30,000 | 33,975 | ||||||
| SIRIUS XM Radio, Inc., 7.625%, 2018 (n) | 40,000 | 44,600 | ||||||
| SIRIUS XM Radio, Inc., 5.25%, 2022 (n) | 25,000 | 25,250 | ||||||
| Starz LLC/Starz Finance Corp., 5%, 2019 (n) | 15,000 | 15,375 | ||||||
| Townsquare Radio LLC, 9%, 2019 (z) | 20,000 | 21,950 | ||||||
| Univision Communications, Inc., 6.875%, 2019 (n) | 70,000 | 72,800 | ||||||
7
Table of Contents
MFS Strategic Income Portfolio
Portfolio of Investments – continued
| Issuer | Shares/Par | Value ($) | ||||||
| BONDS – continued | ||||||||
| Broadcasting – continued | ||||||||
| Univision Communications, Inc., 7.875%, 2020 (n) | $ | 20,000 | $ | 21,650 | ||||
| Univision Communications, Inc., 8.5%, 2021 (n) | 35,000 | 36,138 | ||||||
| Vivendi S.A., 4.75%, 2022 (n) | 160,000 | 166,229 | ||||||
|
| |||||||
| $ | 1,625,786 | |||||||
|
| |||||||
| Brokerage & Asset Managers – 1.0% | ||||||||
| Blackstone Holdings Finance Co. LLC, 4.75%, 2023 (n) | $ | 153,000 | $ | 162,648 | ||||
| E*TRADE Financial Corp., 6.375%, 2019 | 55,000 | 56,375 | ||||||
| Invesco Finance PLC, 3.125%, 2022 | 108,000 | 109,090 | ||||||
| TD Ameritrade Holding Corp., 5.6%, 2019 | 175,000 | 207,694 | ||||||
|
| |||||||
| $ | 535,807 | |||||||
|
| |||||||
| Building – 1.2% | ||||||||
| Boise Cascade LLC/Finance Corp., 6.375%, 2020 (n) | $ | 20,000 | $ | 20,600 | ||||
| Building Materials Holding Corp., 6.875%, 2018 (n) | 20,000 | 21,600 | ||||||
| Building Materials Holding Corp., 7%, 2020 (n) | 20,000 | 21,800 | ||||||
| Building Materials Holding Corp., 6.75%, 2021 (n) | 20,000 | 22,100 | ||||||
| CRH PLC, 8.125%, 2018 | 120,000 | 144,906 | ||||||
| HD Supply, Inc., 13.5%, 2015 | 35,000 | 35,875 | ||||||
| HD Supply, Inc., 8.125%, 2019 (n) | 20,000 | 22,800 | ||||||
| HD Supply, Inc., 11.5%, 2020 (n) | 15,000 | 16,894 | ||||||
| Masonite International Corp., 8.25%, 2021 (n) | 50,000 | 53,500 | ||||||
| Nortek, Inc., 8.5%, 2021 | 80,000 | 88,800 | ||||||
| Owens Corning, Inc., 4.2%, 2022 | 65,000 | 66,104 | ||||||
| Roofing Supply Group LLC/Roofing Supply Finance, Inc., 10%, 2020 (n) | 15,000 | 16,800 | ||||||
| USG Corp., 6.3%, 2016 | 46,000 | 47,610 | ||||||
| USG Corp., 7.875%, 2020 (n) | 25,000 | 27,813 | ||||||
|
| |||||||
| $ | 607,202 | |||||||
|
| |||||||
| Business Services – 0.6% | ||||||||
| Ceridian Corp., 12.25%, 2015 (p) | $ | 20,000 | $ | 20,050 | ||||
| Ceridian Corp., 8.875%, 2019 (n) | 10,000 | 10,850 | ||||||
| Fidelity National Information Services, Inc., 7.625%, 2017 | 20,000 | 21,750 | ||||||
| Fidelity National Information Services, Inc., 5%, 2022 | 35,000 | 37,538 | ||||||
| iGate Corp., 9%, 2016 | 70,000 | 75,863 | ||||||
| Iron Mountain, Inc., 8.375%, 2021 | 60,000 | 66,600 | ||||||
| Legend Acquisition Sub, Inc., 10.75%, 2020 (n) | 35,000 | 31,675 | ||||||
| Lender Processing Services, Inc., 5.75%, 2023 | 30,000 | 31,125 | ||||||
| SunGard Data Systems, Inc., 7.375%, 2018 | 20,000 | 21,425 | ||||||
|
| |||||||
| $ | 316,876 | |||||||
|
| |||||||
| Issuer | Shares/Par | Value ($) | ||||||
| BONDS – continued | ||||||||
| Cable TV – 2.6% | ||||||||
| Bresnan Broadband Holdings LLC, 8%, 2018 (n) | $ | 10,000 | $ | 10,800 | ||||
| CCO Holdings LLC, 7.875%, 2018 | 85,000 | 91,481 | ||||||
| CCO Holdings LLC, 8.125%, 2020 | 70,000 | 78,400 | ||||||
| CCO Holdings LLC, 7.375%, 2020 | 20,000 | 22,200 | ||||||
| CCO Holdings LLC, 5.125%, 2023 | 15,000 | 14,963 | ||||||
| Cequel Communications Holdings, 6.375%, 2020 (z) | 35,000 | 36,444 | ||||||
| Cox Communications, Inc., 3.25%, 2022 (n) | 193,000 | 199,033 | ||||||
| DIRECTV Holdings LLC, 5.875%, 2019 | 70,000 | 82,736 | ||||||
| DIRECTV Holdings LLC, 3.8%, 2022 | 200,000 | 206,331 | ||||||
| DISH DBS Corp., 6.75%, 2021 | 30,000 | 34,200 | ||||||
| DISH DBS Corp., 5%, 2023 (z) | 35,000 | 35,000 | ||||||
| EchoStar Corp., 7.125%, 2016 | 30,000 | 33,600 | ||||||
| Myriad International Holdings B.V., 6.375%, 2017 (n) | 128,000 | 144,320 | ||||||
| Time Warner Cable, Inc., 8.25%, 2019 | 190,000 | 252,840 | ||||||
| Virgin Media Finance PLC, 8.375%, 2019 | 67,000 | 76,045 | ||||||
| Ziggo Bond Co. B.V., 8%, 2018 (n) | EUR | 50,000 | 72,597 | |||||
|
| |||||||
| $ | 1,390,990 | |||||||
|
| |||||||
| Chemicals – 1.4% | ||||||||
| Celanese U.S. Holdings LLC, 6.625%, 2018 | $ | 85,000 | $ | 93,500 | ||||
| Dow Chemical Co., 8.55%, 2019 | 260,000 | 351,020 | ||||||
| Hexion U.S. Finance Corp./Hexion Nova Scotia Finance, 8.875%, 2018 | 60,000 | 61,650 | ||||||
| Hexion U.S. Finance Corp./Hexion Nova Scotia Finance, 9%, 2020 | 10,000 | 9,125 | ||||||
| Huntsman International LLC, 8.625%, 2021 | 65,000 | 74,263 | ||||||
| Momentive Performance Materials, Inc., 11.5%, 2016 | 18,000 | 10,530 | ||||||
| Polypore International, Inc., 7.5%, 2017 | 30,000 | 32,700 | ||||||
| Sociedad Quimica y Minera de Chile S.A., 5.5%, 2020 (n) | 100,000 | 113,152 | ||||||
|
| |||||||
| $ | 745,940 | |||||||
|
| |||||||
| Computer Software – 0.7% | ||||||||
| Infor U.S., Inc., 11.5%, 2018 | $ | 55,000 | $ | 64,350 | ||||
| Nuance Communications, Inc., 5.375%, 2020 (n) | 35,000 | 36,575 | ||||||
| Oracle Corp., 5.375%, 2040 | 103,000 | 128,423 | ||||||
| Seagate HDD Cayman, 6.875%, 2020 | 30,000 | 31,913 | ||||||
| Syniverse Holdings, Inc., 9.125%, 2019 | 65,000 | 69,388 | ||||||
| TransUnion Holding Co., Inc., 9.625%, 2018 | 15,000 | 15,863 | ||||||
| TransUnion LLC/TransUnion Financing Corp., 11.375%, 2018 | 10,000 | 11,650 | ||||||
|
| |||||||
| $ | 358,162 | |||||||
|
| |||||||
| Computer Software – Systems – 0.3% | ||||||||
| Audatex North America, Inc., 6.75%, 2018 (n) | $ | 15,000 | $ | 16,050 | ||||
8
Table of Contents
MFS Strategic Income Portfolio
Portfolio of Investments – continued
| Issuer | Shares/Par | Value ($) | ||||||
| BONDS – continued | ||||||||
| Computer Software – Systems – continued | ||||||||
| CDW LLC/CDW Finance Corp., 12.535%, 2017 | $ | 34,000 | $ | 36,338 | ||||
| CDW LLC/CDW Finance Corp., 8.5%, 2019 | 55,000 | 59,538 | ||||||
| DuPont Fabros Technology, Inc., REIT, 8.5%, 2017 | 45,000 | 49,163 | ||||||
|
| |||||||
| $ | 161,089 | |||||||
|
| |||||||
| Conglomerates – 0.5% | ||||||||
| Amsted Industries, Inc., 8.125%, 2018 (n) | $ | 85,000 | $ | 90,950 | ||||
| Dynacast International LLC, 9.25%, 2019 | 35,000 | 37,450 | ||||||
| Griffon Corp., 7.125%, 2018 | 70,000 | 74,200 | ||||||
| Ingersoll-Rand Global Holding Co. Ltd., 9.5%, 2014 | 61,000 | 67,509 | ||||||
|
| |||||||
| $ | 270,109 | |||||||
|
| |||||||
| Consumer Products – 0.8% | ||||||||
| Easton-Bell Sports, Inc., 9.75%, 2016 | �� | $ | 45,000 | $ | 48,380 | |||
| Elizabeth Arden, Inc., 7.375%, 2021 | 50,000 | 55,875 | ||||||
| FGI Operating Co./FGI Finance, Inc., 7.875%, 2020 (n) | 5,000 | 5,150 | ||||||
| Libbey Glass, Inc., 6.875%, 2020 | 15,000 | 16,125 | ||||||
| Mattel, Inc., 5.45%, 2041 | 83,000 | 93,760 | ||||||
| Newell Rubbermaid, Inc., 2.05%, 2017 | 74,000 | 74,984 | ||||||
| Newell Rubbermaid, Inc., 4.7%, 2020 | 90,000 | 99,404 | ||||||
| Spectrum Brands Escrow Corp., 6.375%, 2020 (n) | 20,000 | 21,000 | ||||||
| Spectrum Brands Escrow Corp., 6.625%, 2022 (z) | 5,000 | 5,363 | ||||||
|
| |||||||
| $ | 420,041 | |||||||
|
| |||||||
| Consumer Services – 0.7% | ||||||||
| Experian Finance PLC, 2.375%, 2017 (n) | $ | 200,000 | $ | 203,468 | ||||
| QVC, Inc., 7.375%, 2020 (n) | 35,000 | 38,942 | ||||||
| Service Corp. International, 7%, 2017 | 90,000 | 103,500 | ||||||
| Service Corp. International, 7%, 2019 | 10,000 | 10,950 | ||||||
|
| |||||||
| $ | 356,860 | |||||||
|
| |||||||
| Containers – 0.6% | ||||||||
| Ball Corp., 5%, 2022 | $ | 25,000 | $ | 26,750 | ||||
| Berry Plastics Group, Inc., 9.5%, 2018 | 15,000 | 16,500 | ||||||
| Greif, Inc., 6.75%, 2017 | 85,000 | 94,775 | ||||||
| Reynolds Group, 5.75%, 2020 (n) | 25,000 | 25,813 | ||||||
| Reynolds Group, 8.25%, 2021 | 135,000 | 137,025 | ||||||
|
| |||||||
| $ | 300,863 | |||||||
|
| |||||||
| Defense Electronics – 0.8% | ||||||||
| BAE Systems Holdings, Inc., 5.2%, 2015 (n) | $ | 212,000 | $ | 232,159 | ||||
| BAE Systems Holdings, Inc., 6.375%, 2019 (n) | 60,000 | 71,628 | ||||||
| Ducommun, Inc., 9.75%, 2018 | 55,000 | 59,125 | ||||||
| MOOG, Inc., 7.25%, 2018 | 40,000 | 42,050 | ||||||
|
| |||||||
| $ | 404,962 | |||||||
|
| |||||||
| Electrical Equipment – 0.3% | ||||||||
| Avaya, Inc., 9.75%, 2015 | $ | 40,000 | $ | 35,600 | ||||
| Avaya, Inc., 7%, 2019 (n) | 15,000 | 14,025 | ||||||
| Issuer | Shares/Par | Value ($) | ||||||
| BONDS – continued | ||||||||
| Electrical Equipment – continued | ||||||||
| Ericsson, Inc., 4.125%, 2022 | $ | 115,000 | $ | 119,519 | ||||
|
| |||||||
| $ | 169,144 | |||||||
|
| |||||||
| Electronics – 0.4% | ||||||||
| Freescale Semiconductor, Inc., 9.25%, 2018 (n) | $ | 70,000 | $ | 76,475 | ||||
| Nokia Corp., 5.375%, 2019 | 20,000 | 19,050 | ||||||
| Nokia Corp., 6.625%, 2039 | 10,000 | 8,975 | ||||||
| Sensata Technologies B.V., 6.5%, 2019 (n) | 65,000 | 69,225 | ||||||
| Tyco Electronics Group S.A., 3.5%, 2022 | 48,000 | 49,333 | ||||||
|
| |||||||
| $ | 223,058 | |||||||
|
| |||||||
| Emerging Market Quasi-Sovereign – 1.9% | ||||||||
| IIRSA Norte Finance Ltd., 8.75%, 2024 | $ | 117,724 | $ | 144,070 | ||||
| Petrobras International Finance Co., 7.875%, 2019 | 81,000 | 101,175 | ||||||
| Petrobras International Finance Co., 6.75%, 2041 | 73,000 | 92,497 | ||||||
| Petroleos Mexicanos, 5.5%, 2021 | 116,000 | 135,546 | ||||||
| Petroleos Mexicanos, 4.875%, 2022 | 54,000 | 60,939 | ||||||
| Petroleos Mexicanos, 6.5%, 2041 | 49,000 | 61,495 | ||||||
| Ras Laffan Liquefied Natural Gas Co. Ltd., 5.832%, 2016 (n) | 161,600 | 178,002 | ||||||
| Rosneft, 4.199%, 2022 (z) | 200,000 | 203,500 | ||||||
|
| |||||||
| $ | 977,224 | |||||||
|
| |||||||
| Emerging Market Sovereign – 0.3% | ||||||||
| Republic of Philippines, 6.375%, 2034 | $ | 100,000 | $ | 140,500 | ||||
| Republic of Poland, 5%, 2022 | 23,000 | 27,163 | ||||||
| United Mexican States, 5.95%, 2019 | 6,000 | 7,380 | ||||||
|
| |||||||
| $ | 175,043 | |||||||
|
| |||||||
| Energy – Independent – 3.2% | ||||||||
| BreitBurn Energy Partners LP, 8.625%, 2020 | $ | 25,000 | $ | 27,250 | ||||
| BreitBurn Energy Partners LP, 7.875%, 2022 (n) | 50,000 | 51,875 | ||||||
| Carrizo Oil & Gas, Inc., 8.625%, 2018 | 20,000 | 21,600 | ||||||
| Chaparral Energy, Inc., 7.625%, 2022 | 55,000 | 57,750 | ||||||
| Chesapeake Energy Corp., 6.875%, 2020 | 45,000 | 48,769 | ||||||
| Concho Resources, Inc., 8.625%, 2017 | 35,000 | 38,106 | ||||||
| Concho Resources, Inc., 6.5%, 2022 | 60,000 | 66,000 | ||||||
| Continental Resources, Inc., 8.25%, 2019 | 50,000 | 56,000 | ||||||
| Denbury Resources, Inc., 8.25%, 2020 | 80,000 | 90,000 | ||||||
| Energy XXI Gulf Coast, Inc., 9.25%, 2017 | 80,000 | 91,400 | ||||||
| EP Energy LLC, 9.375%, 2020 | 115,000 | 129,663 | ||||||
| EPL Oil & Gas, Inc., 8.25%, 2018 (n) | 30,000 | 30,825 | ||||||
| EQT Corp., 4.875%, 2021 | 74,000 | 79,442 | ||||||
| EXCO Resources, Inc., 7.5%, 2018 | 30,000 | 29,100 | ||||||
| Harvest Operations Corp., 6.875%, 2017 | 80,000 | 88,800 | ||||||
| Hess Corp., 8.125%, 2019 | 60,000 | 78,966 | ||||||
| Hilcorp Energy I/Hilcorp Finance Co., 8%, 2020 (n) | 20,000 | 21,900 | ||||||
| Laredo Petroleum, Inc., 9.5%, 2019 | 30,000 | 33,525 | ||||||
| LINN Energy LLC, 6.5%, 2019 | 15,000 | 15,150 | ||||||
| LINN Energy LLC, 8.625%, 2020 | 40,000 | 43,600 | ||||||
| LINN Energy LLC, 7.75%, 2021 | 37,000 | 39,405 | ||||||
9
Table of Contents
MFS Strategic Income Portfolio
Portfolio of Investments – continued
| Issuer | Shares/Par | Value ($) | ||||||
| BONDS – continued | ||||||||
| Energy – Independent – continued | ||||||||
| MEG Energy Corp., 6.5%, 2021 (n) | $ | 15,000 | $ | 15,788 | ||||
| Newfield Exploration Co., 6.875%, 2020 | 55,000 | 58,850 | ||||||
| Plains Exploration & Production Co., 8.625%, 2019 | 50,000 | 56,875 | ||||||
| Plains Exploration & Production Co., 6.5%, 2020 | 15,000 | 16,613 | ||||||
| Plains Exploration & Production Co., 6.75%, 2022 | 35,000 | 39,288 | ||||||
| QEP Resources, Inc., 6.875%, 2021 | 95,000 | 109,488 | ||||||
| Range Resources Corp., 8%, 2019 | 35,000 | 38,763 | ||||||
| Range Resources Corp., 5%, 2022 | 15,000 | 15,675 | ||||||
| Samson Investment Co., 9.75%, 2020 (n) | 25,000 | 26,438 | ||||||
| SandRidge Energy, Inc., 8%, 2018 (n) | 85,000 | 90,100 | ||||||
| SM Energy Co., 6.5%, 2021 | 45,000 | 48,150 | ||||||
| Whiting Petroleum Corp., 6.5%, 2018 | 30,000 | 32,250 | ||||||
|
| |||||||
| $ | 1,687,404 | |||||||
|
| |||||||
| Energy – Integrated – 1.1% | ||||||||
| BP Capital Markets PLC, 4.5%, 2020 | $ | 46,000 | $ | 53,013 | ||||
| BP Capital Markets PLC, 4.742%, 2021 | �� | 130,000 | 152,234 | |||||
| Cenovus Energy, Inc., 4.5%, 2014 | 60,000 | 63,655 | ||||||
| Pacific Rubiales Energy Corp., 7.25%, 2021 (n) | 115,000 | 132,825 | ||||||
| Petro-Canada Financial Partnership, 5%, 2014 | 170,000 | 182,868 | ||||||
|
| |||||||
| $ | 584,595 | |||||||
|
| |||||||
| Engineering – Construction – 0.1% | ||||||||
| BakerCorp International, Inc., 8.25%, 2019 | $ | 40,000 | $ | 40,000 | ||||
|
| |||||||
| Entertainment – 0.6% | ||||||||
| AMC Entertainment, Inc., 8.75%, 2019 | $ | 80,000 | $ | 88,600 | ||||
| AMC Entertainment, Inc., 9.75%, 2020 | 50,000 | 57,750 | ||||||
| Cedar Fair LP, 9.125%, 2018 | 35,000 | 39,375 | ||||||
| Cinemark USA, Inc., 8.625%, 2019 | 75,000 | 83,063 | ||||||
| Cinemark USA, Inc., 5.125%, 2022 (z) | 5,000 | 5,063 | ||||||
| NAI Entertainment Holdings LLC, 8.25%, 2017 (n) | 20,000 | 22,025 | ||||||
| Six Flags Entertainment Corp., 5.25%, 2021 (z) | 30,000 | 30,000 | ||||||
|
| |||||||
| $ | 325,876 | |||||||
|
| |||||||
| Financial Institutions – 3.1% | ||||||||
| Ally Financial, Inc., 5.5%, 2017 | $ | 115,000 | $ | 123,023 | ||||
| CIT Group, Inc., 5.25%, 2014 (n) | 70,000 | 72,450 | ||||||
| CIT Group, Inc., 5.25%, 2018 | 50,000 | 53,500 | ||||||
| CIT Group, Inc., 6.625%, 2018 (n) | 68,000 | 76,840 | ||||||
| CIT Group, Inc., 5.5%, 2019 (n) | 53,000 | 57,770 | ||||||
| Credit Acceptance Corp., 9.125%, 2017 | 40,000 | 43,700 | ||||||
| General Electric Capital Corp., 6%, 2019 | 50,000 | 60,828 | ||||||
| General Electric Capital Corp., 5.5%, 2020 | 110,000 | 130,208 | ||||||
| General Electric Capital Corp., 3.15%, 2022 | 138,000 | 140,994 | ||||||
| GMAC, Inc., 8%, 2031 | 10,000 | 12,663 | ||||||
| Icahn Enterprises LP, 8%, 2018 | 62,000 | 66,573 | ||||||
| International Lease Finance Corp., 4.875%, 2015 | 20,000 | 20,702 | ||||||
| Issuer | Shares/Par | Value ($) | ||||||
| BONDS – continued | ||||||||
| Financial Institutions – continued | ||||||||
| International Lease Finance Corp., 8.625%, 2015 | $ | 20,000 | $ | 22,475 | ||||
| International Lease Finance Corp., 7.125%, 2018 (n) | 69,000 | 80,040 | ||||||
| LeasePlan Corp. N.V., 3%, 2017 (n) | 200,000 | 201,870 | ||||||
| Nationstar Mortgage LLC/Capital Corp., 10.875%, 2015 | 75,000 | 80,250 | ||||||
| Nationstar Mortgage LLC/Capital Corp., 9.625%, 2019 (n) | 20,000 | 22,500 | ||||||
| Nationstar Mortgage LLC/Capital Corp., 7.875%, 2020 (n) | 10,000 | 10,550 | ||||||
| NYSE Euronext, 2%, 2017 | 86,000 | 87,426 | ||||||
| PHH Corp., 9.25%, 2016 | 50,000 | 58,375 | ||||||
| PHH Corp., 7.375%, 2019 | 30,000 | 33,300 | ||||||
| SLM Corp., 8.45%, 2018 | 40,000 | 46,800 | ||||||
| SLM Corp., 8%, 2020 | 105,000 | 119,963 | ||||||
| SLM Corp., 7.25%, 2022 | 5,000 | 5,513 | ||||||
|
| |||||||
| $ | 1,628,313 | |||||||
|
| |||||||
| Food & Beverages – 2.8% | ||||||||
| Anheuser-Busch InBev S.A., 7.75%, 2019 | $ | 220,000 | $ | 293,835 | ||||
| ARAMARK Corp., 8.5%, 2015 | 50,000 | 50,251 | ||||||
| B&G Foods, Inc., 7.625%, 2018 | 57,000 | 61,275 | ||||||
| Campbell Soup Co., 2.5%, 2022 | 61,000 | 60,454 | ||||||
| JBS USA LLC/JBS USA Finance, 8.25%, 2020 (n) | 15,000 | 15,900 | ||||||
| Kraft Foods Group, Inc., 6.125%, 2018 (n) | 170,000 | 208,271 | ||||||
| Mead Johnson Nutrition Co., “A”, 4.9%, 2019 | 43,000 | 49,074 | ||||||
| Pernod-Ricard S.A., 2.95%, 2017 (n) | 200,000 | 210,345 | ||||||
| Pinnacle Foods Finance LLC, 8.25%, 2017 | 15,000 | 15,975 | ||||||
| SABMiller Holdings, Inc., 3.75%, 2022 (n) | 205,000 | 221,365 | ||||||
| TreeHouse Foods, Inc., 7.75%, 2018 | 45,000 | 48,825 | ||||||
| Tyson Foods, Inc., 6.6%, 2016 | 120,000 | 137,513 | ||||||
| Tyson Foods, Inc., 4.5%, 2022 | 75,000 | 81,189 | ||||||
|
| |||||||
| $ | 1,454,272 | |||||||
|
| |||||||
| Food & Drug Stores – 0.4% | ||||||||
| CVS Caremark Corp., 5.75%, 2041 | $ | 180,000 | $ | 224,111 | ||||
|
| |||||||
| Forest & Paper Products – 0.5% | ||||||||
| Ainsworth Lumber Co. Ltd., 7.5%, 2017 (n) | $ | 5,000 | $ | 5,238 | ||||
| Boise, Inc., 8%, 2020 | 45,000 | 49,725 | ||||||
| Georgia-Pacific Corp., 8%, 2024 | 6,000 | 8,389 | ||||||
| Graphic Packaging Holding Co., 7.875%, 2018 | 30,000 | 33,150 | ||||||
| Tembec Industries, Inc., 11.25%, 2018 | 20,000 | 21,200 | ||||||
| Votorantim Participacoes S.A., 6.75%, 2021 (n) | 100,000 | 117,250 | ||||||
| Xerium Technologies, Inc., 8.875%, 2018 | 18,000 | 16,200 | ||||||
|
| |||||||
| $ | 251,152 | |||||||
|
| |||||||
| Gaming & Lodging – 1.7% | ||||||||
| Boyd Gaming Corp., 9%, 2020 (z) | $ | 20,000 | $ | 19,700 | ||||
| Caesars Entertainment Operating Co., Inc., 8.5%, 2020 | 60,000 | 59,550 | ||||||
10
Table of Contents
MFS Strategic Income Portfolio
Portfolio of Investments – continued
| Issuer | Shares/Par | Value ($) | ||||||
| BONDS – continued | ||||||||
| Gaming & Lodging – continued | ||||||||
| Choice Hotels International, Inc., 5.75%, 2022 | $ | 5,000 | $ | 5,538 | ||||
| CityCenter Holdings LLC, 10.75%, 2017 (p) | 20,000 | 21,700 | ||||||
| FelCor Lodging LP, 5.625%, 2023 (z) | 5,000 | 4,975 | ||||||
| Fontainebleau Las Vegas Holdings LLC, 10.25%, 2015 (a)(d)(n) | 95,000 | 59 | ||||||
| GWR Operating Partnership LLP, 10.875%, 2017 | 25,000 | 28,438 | ||||||
| Host Hotels & Resorts, Inc., REIT, 5.25%, 2022 | 30,000 | 32,850 | ||||||
| Isle of Capri Casinos, Inc., 8.875%, 2020 | 45,000 | 49,050 | ||||||
| Marriott International, Inc., 5.625%, 2013 | 120,000 | 120,645 | ||||||
| MGM Mirage, 6.625%, 2015 | 20,000 | 21,450 | ||||||
| MGM Resorts International, 11.375%, 2018 | 55,000 | 66,550 | ||||||
| MGM Resorts International, 6.625%, 2021 | 15,000 | 15,000 | ||||||
| Penn National Gaming, Inc., 8.75%, 2019 | 75,000 | 85,500 | ||||||
| Pinnacle Entertainment, Inc., 8.75%, 2020 | 25,000 | 27,000 | ||||||
| Rivers Pittsburgh Borrower LP/Rivers Pittsburgh Finance Corp., 9.5%, 2019 (n) | 5,000 | 5,425 | ||||||
| Seven Seas Cruises S. DE R.L., 9.125%, 2019 | 65,000 | 68,738 | ||||||
| Viking Cruises Ltd., 8.5%, 2022 (n) | 25,000 | 27,000 | ||||||
| Wyndham Worldwide Corp., 6%, 2016 | 1,000 | 1,131 | ||||||
| Wyndham Worldwide Corp., 5.75%, 2018 | 140,000 | 156,494 | ||||||
| Wyndham Worldwide Corp., 7.375%, 2020 | 30,000 | 36,112 | ||||||
| Wynn Las Vegas LLC, 7.75%, 2020 | 50,000 | 57,000 | ||||||
|
| |||||||
| $ | 909,905 | |||||||
|
| |||||||
| Industrial – 0.2% | ||||||||
| Dematic S.A., 7.75%, 2020 (z) | $ | 30,000 | $ | 30,000 | ||||
| Mueller Water Products, Inc., 8.75%, 2020 | 38,000 | 43,320 | ||||||
| SPL Logistics Escrow LLC, 8.875%, 2020 (n) | 20,000 | 21,200 | ||||||
|
| |||||||
| $ | 94,520 | |||||||
|
| |||||||
| Insurance – 2.3% | ||||||||
| Allianz AG, 5.5% to 2014, FRN to 2049 | EUR | 248,000 | $ | 335,504 | ||||
| American International Group, Inc., 3%, 2015 | $ | 50,000 | 52,026 | |||||
| American International Group, Inc., 8.175% to 2038, FRN to 2068 | 135,000 | 175,838 | ||||||
| Metlife, Inc., 1.756%, 2017 | 31,000 | 31,488 | ||||||
| Metropolitan Life Global Funding I, 5.125%, 2014 (n) | 80,000 | 85,048 | ||||||
| Principal Financial Group, Inc., 8.875%, 2019 | 130,000 | 174,440 | ||||||
| Prudential Financial, Inc., 6.2%, 2015 | 130,000 | 143,570 | ||||||
| Unum Group, 7.125%, 2016 | 160,000 | 188,488 | ||||||
|
| |||||||
| $ | 1,186,402 | |||||||
|
| |||||||
| Issuer | Shares/Par | Value ($) | ||||||
| BONDS – continued | ||||||||
| Insurance – Health – 0.0% | ||||||||
| AMERIGROUP Corp., 7.5%, 2019 | $ | 19,000 | $ | 22,800 | ||||
|
| |||||||
| Insurance – Property & Casualty – 2.7% | ||||||||
| Aon Corp., 3.5%, 2015 | $ | 140,000 | $ | 147,449 | ||||
| AXIS Capital Holdings Ltd., 5.75%, 2014 | 205,000 | 219,856 | ||||||
| AXIS Capital Holdings Ltd., 5.875%, 2020 | 50,000 | 56,762 | ||||||
| CNA Financial Corp., 5.875%, 2020 | 160,000 | 188,769 | ||||||
| Liberty Mutual Group, Inc., 4.95%, 2022 (n) | 114,000 | 124,247 | ||||||
| Liberty Mutual Group, Inc., 10.75% to 2038, FRN to 2088 (n) | 70,000 | 104,300 | ||||||
| PartnerRe Ltd., 5.5%, 2020 | 107,000 | 119,410 | ||||||
| QBE Capital Funding III Ltd., FRN, 7.25%, 2041 (n) | 200,000 | 207,000 | ||||||
| Travelers Cos., Inc., 3.9%, 2020 | 220,000 | 248,510 | ||||||
|
| |||||||
| $ | 1,416,303 | |||||||
|
| |||||||
| International Market Quasi-Sovereign – 2.1% | ||||||||
| EDF Energies Nouvelles S.A., 6.5%, 2019 (n) | $ | 230,000 | $ | 281,561 | ||||
| ING Bank N.V., 3.9%, 2014 (n) | 190,000 | 197,524 | ||||||
| Irish Life & Permanent PLC, 3.6%, 2013 (e)(n) | 400,000 | 400,003 | ||||||
| Vestjysk Bank A/S, FRN, 0.858%, 2013 (n) | 130,000 | 130,328 | ||||||
| Westpac Banking Corp., 3.45%, 2014 (n) | 100,000 | 104,696 | ||||||
|
| |||||||
| $ | 1,114,112 | |||||||
|
| |||||||
| International Market Sovereign – 9.3% | ||||||||
| Commonwealth of Australia, 5.75%, 2021 | AUD | 38,000 | $ | 47,007 | ||||
| Federal Republic of Germany, 3.75%, 2015 | EUR | 239,000 | 339,223 | |||||
| Federal Republic of Germany, 4.25%, 2018 | EUR | 97,000 | 154,608 | |||||
| Federal Republic of Germany, 6.25%, 2030 | EUR | 81,000 | 172,686 | |||||
| Government of Canada, 4.5%, 2015 | CAD | 86,000 | 93,297 | |||||
| Government of Canada, 4.25%, 2018 | CAD | 45,000 | 51,844 | |||||
| Government of Canada, 5.75%, 2033 | CAD | 17,000 | 26,536 | |||||
| Government of Japan, 1.7%, 2017 | JPY | 33,450,000 | 411,168 | |||||
| Government of Japan, 1.1%, 2020 | JPY | 17,000,000 | 205,125 | |||||
| Government of Japan, 2.1%, 2024 | JPY | 8,000,000 | 103,821 | |||||
| Government of Japan, 2.2%, 2027 | JPY | 19,100,000 | 246,728 | |||||
| Government of Japan, 2.4%, 2037 | JPY | 20,100,000 | 255,756 | |||||
| Kingdom of Belgium, 5.5%, 2017 | EUR | 113,000 | 181,871 | |||||
| Kingdom of Denmark, 3%, 2021 | DKK | 218,000 | 44,865 | |||||
| Kingdom of Spain, 4.6%, 2019 | EUR | 167,000 | 220,187 | |||||
| Kingdom of Sweden, 5%, 2020 | SEK | 155,000 | 30,197 | |||||
| Kingdom of the Netherlands, 3.75%, 2014 | EUR | 187,000 | 260,777 | |||||
| Kingdom of the Netherlands, 5.5%, 2028 | EUR | 22,000 | 42,249 | |||||
| Republic of Austria, 4.65%, 2018 | EUR | 78,000 | 123,043 | |||||
| Republic of Finland, 3.875%, 2017 | EUR | 22,000 | 33,658 | |||||
| Republic of France, 6%, 2025 | EUR | 53,000 | 98,612 | |||||
11
Table of Contents
MFS Strategic Income Portfolio
Portfolio of Investments – continued
| Issuer | Shares/Par | Value ($) | ||||||
| BONDS – continued | ||||||||
| International Market Sovereign – continued | ||||||||
| Republic of France, 4.75%, 2035 | EUR | 113,000 | $ | 195,392 | ||||
| Republic of Ireland, 4.6%, 2016 | EUR | 49,000 | 68,507 | |||||
| Republic of Italy, 4.25%, 2015 | EUR | 89,000 | 122,527 | |||||
| Republic of Italy, 5.25%, 2017 | EUR | 267,000 | 383,243 | |||||
| Republic of Italy, 3.75%, 2021 | EUR | 101,000 | 131,075 | |||||
| State of Israel, 4%, 2022 | $ | 248,000 | 270,010 | |||||
| United Kingdom Treasury, 8%, 2015 | GBP | 107,000 | 212,523 | |||||
| United Kingdom Treasury, 8%, 2021 | GBP | 79,000 | 194,805 | |||||
| United Kingdom Treasury, 4.25%, 2036 | GBP | 73,000 | 145,202 | |||||
|
| |||||||
| $ | 4,866,542 | |||||||
|
| |||||||
| Local Authorities – 0.6% | ||||||||
| Louisiana Gas & Fuels Tax Rev. (Build America Bonds), FRN, 3%, 2043 | $ | 160,000 | $ | 160,325 | ||||
| Province of Ontario, 5.45%, 2016 | 145,000 | 167,388 | ||||||
|
| |||||||
| $ | 327,713 | |||||||
|
| |||||||
| Machinery & Tools – 1.2% | ||||||||
| Atlas Copco AB, 5.6%, 2017 (n) | $ | 214,000 | $ | 249,561 | ||||
| Case New Holland, Inc., 7.875%, 2017 | 130,000 | 153,725 | ||||||
| CNH America LLC, 7.25%, 2016 | 25,000 | 28,125 | ||||||
| CNH Capital LLC, 3.875%, 2015 (n) | 5,000 | 5,156 | ||||||
| CNH Capital LLC, 6.25%, 2016 | 10,000 | 11,025 | ||||||
| H&E Equipment Services LLC, 7%, 2022 (n) | 35,000 | 37,275 | ||||||
| NESCO LLC/NESCO Holdings Corp., 11.75%, 2017 (n) | 55,000 | 59,125 | ||||||
| RSC Equipment Rental, Inc., 8.25%, 2021 | 55,000 | 62,013 | ||||||
| UR Financing Escrow Corp., 5.75%, 2018 (n) | 20,000 | 21,550 | ||||||
| UR Financing Escrow Corp., 7.625%, 2022 (n) | 22,000 | 24,585 | ||||||
|
| |||||||
| $ | 652,140 | |||||||
|
| |||||||
| Major Banks – 7.9% | ||||||||
| ABN AMRO Bank N.V., 4.25%, 2017 (n) | $ | 200,000 | $ | 218,143 | ||||
| Bank of America Corp., 7.375%, 2014 | 65,000 | 70,385 | ||||||
| Bank of America Corp., 6.5%, 2016 | 325,000 | 375,297 | ||||||
| Barclays Bank PLC, 5.125%, 2020 | 130,000 | 148,062 | ||||||
| BNP Paribas, 7.195% to 2037, FRN to 2049 (n) | 100,000 | 102,500 | ||||||
| BNP Paribas, FRN, 3.059%, 2014 | 78,000 | 80,640 | ||||||
| Commonwealth Bank of Australia, 5%, 2019 (n) | 140,000 | 162,694 | ||||||
| Credit Suisse New York, 5.5%, 2014 | 130,000 | 138,319 | ||||||
| DBS Bank Ltd., 2.35%, 2017 (n) | 200,000 | 207,509 | ||||||
| Goldman Sachs Group, Inc., 6%, 2014 | 90,000 | 95,782 | ||||||
| Goldman Sachs Group, Inc., 5.75%, 2022 | 201,000 | 237,625 | ||||||
| HSBC Holdings PLC, 4%, 2022 | 323,000 | 353,642 | ||||||
| Intesa Sanpaolo S.p.A., FRN, 2.711%, 2014 (n) | 100,000 | 99,888 | ||||||
| JPMorgan Chase & Co., 2%, 2017 | 55,000 | 56,182 | ||||||
| JPMorgan Chase & Co., 4.625%, 2021 | 140,000 | 159,624 | ||||||
| Macquarie Bank Ltd., 5%, 2017 (n) | 111,000 | 121,401 | ||||||
| Macquarie Group Ltd., 6%, 2020 (n) | 86,000 | 93,060 | ||||||
| Merrill Lynch & Co., Inc., 6.4%, 2017 | 90,000 | 105,692 | ||||||
| Issuer | Shares/Par | Value ($) | ||||||
| BONDS – continued | ||||||||
| Major Banks – continued | ||||||||
| Morgan Stanley, 6%, 2014 | $ | 100,000 | $ | 105,897 | ||||
| Morgan Stanley, 7.3%, 2019 | 100,000 | 121,522 | ||||||
| Morgan Stanley, 5.625%, 2019 | 100,000 | 113,098 | ||||||
| Royal Bank of Scotland Group PLC, 7.648% to 2031, FRN to 2049 | 110,000 | 111,100 | ||||||
| Royal Bank of Scotland PLC, 2.55%, 2015 | 87,000 | 89,037 | ||||||
| Santander International Debt S.A., 2.991%, 2013 (n) | 100,000 | 100,169 | ||||||
| Standard Chartered PLC, 3.85%, 2015 (n) | 150,000 | 158,192 | ||||||
| UFJ Finance Aruba AEC, 6.75%, 2013 | 159,000 | 164,022 | ||||||
| Wells Fargo & Co., 7.98% to 2018, FRN to 2049 | 78,000 | 89,505 | ||||||
| Westpac Banking Corp., 2%, 2017 | 240,000 | 247,215 | ||||||
|
| |||||||
| $ | 4,126,202 | |||||||
|
| |||||||
| Medical & Health Technology & Services – 3.2% | ||||||||
| AmSurg Corp., 5.625%, 2020 (n) | $ | 10,000 | $ | 10,400 | ||||
| Aristotle Holding, Inc., 3.9%, 2022 (n) | 75,000 | 80,869 | ||||||
| Biomet, Inc., 6.5%, 2020 (n) | 40,000 | 42,500 | ||||||
| Cardinal Health, Inc., 5.8%, 2016 | 201,000 | 232,942 | ||||||
| CDRT Holding Corp., 9.25%, 2017 (p)(z) | 10,000 | 10,200 | ||||||
| Davita, Inc., 6.375%, 2018 | 80,000 | 85,800 | ||||||
| Davita, Inc., 6.625%, 2020 | 60,000 | 65,250 | ||||||
| Fresenius Medical Care AG & Co. KGaA, 9%, 2015 (n) | 35,000 | 40,338 | ||||||
| Fresenius Medical Care Capital Trust III, 5.625%, 2019 (n) | 40,000 | 42,950 | ||||||
| HCA, Inc., 8.5%, 2019 | 140,000 | 156,100 | ||||||
| HCA, Inc., 7.5%, 2022 | 85,000 | 97,325 | ||||||
| HCA, Inc., 5.875%, 2022 | 35,000 | 38,063 | ||||||
| HealthSouth Corp., 8.125%, 2020 | 90,000 | 99,113 | ||||||
| Hologic, Inc., 6.25%, 2020 (n) | 15,000 | 16,163 | ||||||
| IASIS Healthcare LLC/IASIS Capital Corp., 8.375%, 2019 | 70,000 | 66,150 | ||||||
| McKesson Corp., 5.7%, 2017 | 90,000 | 106,325 | ||||||
| Owens & Minor, Inc., 6.35%, 2016 | 170,000 | 186,465 | ||||||
| Physio-Control International, Inc., 9.875%, 2019 (n) | 30,000 | 32,925 | ||||||
| Select Medical Corp., 7.625%, 2015 | 7,000 | 7,009 | ||||||
| Tenet Healthcare Corp., 9.25%, 2015 | 30,000 | 33,675 | ||||||
| Tenet Healthcare Corp., 8%, 2020 | 20,000 | 21,538 | ||||||
| Thermo Fisher Scientific, Inc., 3.15%, 2023 | 128,000 | 130,813 | ||||||
| Universal Health Services, Inc., 7%, 2018 | 35,000 | 38,588 | ||||||
| Universal Hospital Services, Inc., 7.625%, 2020 (n) | 35,000 | 36,881 | ||||||
| Universal Hospital Services, Inc., FRN, 3.902%, 2015 | 20,000 | 19,913 | ||||||
|
| |||||||
| $ | 1,698,295 | |||||||
|
| |||||||
| Metals & Mining – 1.1% | ||||||||
| Arch Coal, Inc., 7.25%, 2020 | $ | 40,000 | $ | 37,100 | ||||
| Cloud Peak Energy, Inc., 8.25%, 2017 | 85,000 | 90,950 | ||||||
| Cloud Peak Energy, Inc., 8.5%, 2019 | 15,000 | 16,463 | ||||||
| Consol Energy, Inc., 8%, 2017 | 35,000 | 37,888 | ||||||
| Consol Energy, Inc., 8.25%, 2020 | 30,000 | 32,475 | ||||||
12
Table of Contents
MFS Strategic Income Portfolio
Portfolio of Investments – continued
| Issuer | Shares/Par | Value ($) | ||||||
| BONDS – continued | ||||||||
| Metals & Mining – continued | ||||||||
| Fortescue Metals Group Ltd., 8.25%, 2019 (n) | $ | 45,000 | $ | 47,925 | ||||
| Peabody Energy Corp., 6%, 2018 | 20,000 | 21,250 | ||||||
| Peabody Energy Corp., 6.25%, 2021 | 20,000 | 21,250 | ||||||
| Southern Copper Corp., 6.75%, 2040 | 156,000 | 187,805 | ||||||
| Vale Overseas Ltd., 4.375%, 2022 | 70,000 | 74,725 | ||||||
|
| |||||||
| $ | 567,831 | |||||||
|
| |||||||
| Mortgage-Backed – 0.5% | ||||||||
| Fannie Mae, 6.5%, 2032 | $ | 75,073 | $ | 85,442 | ||||
| Freddie Mac, 4.224%, 2020 | 146,497 | 170,164 | ||||||
|
| |||||||
| $ | 255,606 | |||||||
|
| |||||||
| Natural Gas – Distribution – 0.5% | ||||||||
| AmeriGas Finance LLC, 6.75%, 2020 | $ | 45,000 | $ | 49,388 | ||||
| Ferrellgas LP/Ferrellgas Finance Corp., 6.5%, 2021 | 30,000 | 29,700 | ||||||
| GDF Suez, 1.625%, 2017 (n) | 190,000 | 189,955 | ||||||
|
| |||||||
| $ | 269,043 | |||||||
|
| |||||||
| Natural Gas – Pipeline – 2.7% | ||||||||
| Access Midstream Partners Co., 4.875%, 2023 | $ | 15,000 | $ | 15,225 | ||||
| Atlas Pipeline Partners LP, 8.75%, 2018 | 80,000 | 85,200 | ||||||
| Crosstex Energy, Inc., 8.875%, 2018 | 75,000 | 81,000 | ||||||
| El Paso Corp., 7%, 2017 | 75,000 | 85,675 | ||||||
| El Paso Corp., 7.75%, 2032 | 80,000 | 93,999 | ||||||
| Energy Transfer Equity LP, 7.5%, 2020 | 65,000 | 75,075 | ||||||
| Energy Transfer Partners LP, 6.5%, 2042 | 135,000 | 165,286 | ||||||
| Enterprise Products Partners LP, 6.3%, 2017 | 140,000 | 169,348 | ||||||
| Enterprise Products Partners LP, 8.375% to 2016, FRN to 2066 | 33,000 | 37,661 | ||||||
| Enterprise Products Partners LP, 7.034% to 2018, FRN to 2068 | 20,000 | 22,900 | ||||||
| Inergy Midstream LP, 6%, 2020 (n) | 25,000 | 25,813 | ||||||
| Kinder Morgan Energy Partners LP, 6.375%, 2041 | 190,000 | 235,115 | ||||||
| MarkWest Energy Partners LP, 5.5%, 2023 | 30,000 | 32,550 | ||||||
| Rockies Express Pipeline LLC, 5.625%, 2020 (n) | 24,000 | 23,580 | ||||||
| Spectra Energy Capital LLC, 8%, 2019 | 164,000 | 216,591 | ||||||
| Williams Cos., Inc., 3.7%, 2023 | 47,000 | 47,407 | ||||||
|
| |||||||
| $ | 1,412,425 | |||||||
|
| |||||||
| Network & Telecom – 2.0% | ||||||||
| AT&T, Inc., 5.5%, 2018 | $ | 150,000 | $ | 178,694 | ||||
| AT&T, Inc., 3.875%, 2021 | 70,000 | 78,016 | ||||||
| Centurylink, Inc., 7.65%, 2042 | 134,000 | 140,045 | ||||||
| Cincinnati Bell, Inc., 8.25%, 2017 | 15,000 | 16,163 | ||||||
| Citizens Communications Co., 9%, 2031 | 30,000 | 33,000 | ||||||
| France Telecom, 4.375%, 2014 | 120,000 | 126,291 | ||||||
| Frontier Communications Corp., 8.125%, 2018 | 45,000 | 51,750 | ||||||
| Qwest Communications International, Inc., 7.125%, 2018 (n) | 50,000 | 52,170 | ||||||
| Qwest Corp., 7.5%, 2014 | 140,000 | 153,229 | ||||||
| Issuer | Shares/Par | Value ($) | ||||||
| BONDS – continued | ||||||||
| Network & Telecom – continued | ||||||||
| TW Telecom Holdings, Inc., 5.375%, 2022 (n) | $ | 20,000 | $ | 20,950 | ||||
| Verizon Communications, Inc., 8.75%, 2018 | 91,000 | 126,351 | ||||||
| Windstream Corp., 8.125%, 2018 | 10,000 | 10,925 | ||||||
| Windstream Corp., 7.75%, 2020 | 50,000 | 54,000 | ||||||
|
| |||||||
| $ | 1,041,584 | |||||||
|
| |||||||
| Oil Services – 0.8% | ||||||||
| Bristow Group, Inc., 6.25%, 2022 | $ | 15,000 | $ | 16,050 | ||||
| Chesapeake Energy Corp., 6.625%, 2019 (n) | 15,000 | 14,138 | ||||||
| Dresser-Rand Group, Inc., 6.5%, 2021 | 20,000 | 21,200 | ||||||
| Edgen Murray Corp., 8.75%, 2020 (n) | 40,000 | 40,400 | ||||||
| Pioneer Energy Services Corp., 9.875%, 2018 | 35,000 | 38,063 | ||||||
| Shale-Inland Holdings LLC/Finance Co., 8.75%, 2019 (n) | 40,000 | 41,900 | ||||||
| Transocean, Inc., 2.5%, 2017 | 53,000 | 53,558 | ||||||
| Transocean, Inc., 6%, 2018 | 110,000 | 127,577 | ||||||
| Unit Corp., 6.625%, 2021 | 25,000 | 25,656 | ||||||
| Unit Corp., 6.625%, 2021 (n) | 25,000 | 25,656 | ||||||
|
| |||||||
| $ | 404,198 | |||||||
|
| |||||||
| Other Banks & Diversified Financials – 3.3% | ||||||||
| Bancolombia S.A., 5.125%, 2022 | $ | 5,000 | $ | 5,200 | ||||
| Citigroup, Inc., 6.375%, 2014 | 120,000 | 129,678 | ||||||
| Citigroup, Inc., 6.01%, 2015 | 100,000 | 109,272 | ||||||
| Citigroup, Inc., 8.5%, 2019 | 75,000 | 100,848 | ||||||
| Groupe BPCE S.A., 12.5% to 2019, FRN to 2049 (n) | 157,000 | 181,952 | ||||||
| Lloyds TSB Bank PLC, 5.8%, 2020 (n) | 100,000 | 117,028 | ||||||
| Rabobank Nederland N.V., 3.375%, 2017 | 92,000 | 98,834 | ||||||
| Rabobank Nederland N.V., 3.95%, 2022 | 250,000 | 256,009 | ||||||
| Santander Holdings USA, Inc., 4.625%, 2016 | 20,000 | 20,910 | ||||||
| Santander UK PLC, 8.963% to 2030, FRN to 2049 | 103,000 | 116,776 | ||||||
| SunTrust Banks, Inc., 3.5%, 2017 | 107,000 | 114,910 | ||||||
| Svenska Handelsbanken AB, 4.875%, 2014 (n) | 180,000 | 190,217 | ||||||
| Swedbank AB, 2.125%, 2017 (n) | 200,000 | 204,348 | ||||||
| U.S. Bancorp, 2.95%, 2022 | 70,000 | 70,716 | ||||||
|
| |||||||
| $ | 1,716,698 | |||||||
|
| |||||||
| Personal Computers & Peripherals – 0.2% | ||||||||
| Equifax, Inc., 3.3%, 2022 | $ | 105,000 | $ | 104,154 | ||||
|
| |||||||
| Pharmaceuticals – 1.3% | ||||||||
| AbbVie, Inc., 2.9%, 2022 (n) | $ | 170,000 | $ | 173,125 | ||||
| Celgene Corp., 3.95%, 2020 | 160,000 | 173,646 | ||||||
| Hospira, Inc., 6.05%, 2017 | 100,000 | 116,096 | ||||||
| Teva Pharmaceutical Finance LLC, 5.55%, 2016 | 87,000 | 98,469 | ||||||
| Teva Pharmaceutical Finance LLC, 2.25%, 2020 | 42,000 | 42,375 | ||||||
| Valeant Pharmaceuticals International, Inc., 7%, 2020 (n) | 50,000 | 54,375 | ||||||
13
Table of Contents
MFS Strategic Income Portfolio
Portfolio of Investments – continued
| Issuer | Shares/Par | Value ($) | ||||||
| BONDS – continued | ||||||||
| Pharmaceuticals – continued | ||||||||
| Valeant Pharmaceuticals International, Inc., 7.25%, 2022 (n) | $ | 30,000 | $ | 32,775 | ||||
|
| |||||||
| $ | 690,861 | |||||||
|
| |||||||
| Pollution Control – 0.4% | ||||||||
| Heckmann Corp., 9.875%, 2018 | $ | 35,000 | $ | 36,138 | ||||
| Heckmann Corp., 9.875%, 2018 | 10,000 | 10,250 | ||||||
| Republic Services, Inc., 5.25%, 2021 | 130,000 | 153,218 | ||||||
|
| |||||||
| $ | 199,606 | |||||||
|
| |||||||
| Precious Metals & Minerals – 0.1% | ||||||||
| Eldorado Gold Corp., 6.125%, 2020 (z) | $ | 25,000 | $ | 25,438 | ||||
| IAMGOLD Corp., 6.75%, 2020 (n) | 33,000 | 32,175 | ||||||
|
| |||||||
| $ | 57,613 | |||||||
|
| |||||||
| Printing & Publishing – 0.2% | ||||||||
| American Media, Inc., 13.5%, 2018 (z) | $ | 6,759 | $ | 5,948 | ||||
| Nielsen Finance LLC, 7.75%, 2018 | 45,000 | 50,288 | ||||||
| Nielsen Finance LLC, 4.5%, 2020 (n) | 25,000 | 24,875 | ||||||
|
| |||||||
| $ | 81,111 | |||||||
|
| |||||||
| Railroad & Shipping – 0.8% | ||||||||
| CSX Corp., 4.1%, 2044 | $ | 304,000 | $ | 300,091 | ||||
| Kansas City Southern de Mexico S.A. de C.V., 6.125%, 2021 | 20,000 | 22,600 | ||||||
| Panama Canal Railway Co., 7%, 2026 (n) | 89,000 | 83,660 | ||||||
|
| |||||||
| $ | 406,351 | |||||||
|
| |||||||
| Real Estate – 2.1% | ||||||||
| Boston Properties LP, REIT, 3.7%, 2018 | $ | 73,000 | $ | 79,299 | ||||
| CNL Lifestyle Properties, Inc., REIT, 7.25%, 2019 | 25,000 | 23,875 | ||||||
| DDR Corp., REIT, 4.625%, 2022 | 148,000 | 161,520 | ||||||
| Entertainment Properties Trust, REIT, 7.75%, 2020 | 45,000 | 52,008 | ||||||
| HCP, Inc., REIT, 5.375%, 2021 | 141,000 | 160,565 | ||||||
| Health Care REIT, Inc., 2.25%, 2018 | 51,000 | 50,957 | ||||||
| Kennedy Wilson, Inc., 8.75%, 2019 | 25,000 | 26,625 | ||||||
| Kimco Realty Corp., REIT, 6.875%, 2019 | 36,000 | 44,468 | ||||||
| MPT Operating Partnership LP, REIT, 6.875%, 2021 | 40,000 | 43,400 | ||||||
| MPT Operating Partnership LP, REIT, 6.375%, 2022 | 40,000 | 42,000 | ||||||
| Simon Property Group, Inc., REIT, 6.1%, 2016 | 230,000 | 265,318 | ||||||
| WEA Finance LLC, REIT, 6.75%, 2019 (n) | 110,000 | 136,272 | ||||||
|
| |||||||
| $ | 1,086,307 | |||||||
|
| |||||||
| Retailers – 3.0% | ||||||||
| Academy Ltd., 9.25%, 2019 (n) | $ | 30,000 | $ | 33,300 | ||||
| AutoZone, Inc., 6.5%, 2014 | 230,000 | 242,829 | ||||||
| Burlington Coat Factory Warehouse Corp., 10%, 2019 | 45,000 | 48,600 | ||||||
| Dollar General Corp., 4.125%, 2017 | 113,000 | 118,650 | ||||||
| Gap, Inc., 5.95%, 2021 | 189,000 | 216,223 | ||||||
| Issuer | Shares/Par | Value ($) | ||||||
| BONDS – continued | ||||||||
| Retailers – continued | ||||||||
| J. Crew Group, Inc., 8.125%, 2019 | $ | 35,000 | $ | 37,013 | ||||
| Kohl’s Corp., 3.25%, 2023 | 162,000 | 157,296 | ||||||
| Limited Brands, Inc., 5.25%, 2014 | 59,000 | 61,950 | ||||||
| Limited Brands, Inc., 6.9%, 2017 | 40,000 | 45,900 | ||||||
| Limited Brands, Inc., 7%, 2020 | 15,000 | 17,250 | ||||||
| Limited Brands, Inc., 6.95%, 2033 | 20,000 | 20,350 | ||||||
| Macy’s, Inc., 7.875%, 2015 | 200,000 | 232,987 | ||||||
| Pantry, Inc., 8.375%, 2020 (n) | 15,000 | 15,675 | ||||||
| Rite Aid Corp., 9.25%, 2020 | 35,000 | 37,275 | ||||||
| Sally Beauty Holdings, Inc., 6.875%, 2019 | 20,000 | 22,100 | ||||||
| Staples, Inc., 9.75%, 2014 | 140,000 | 152,207 | ||||||
| Toys “R” Us Property Co. II LLC, 8.5%, 2017 | 30,000 | 31,800 | ||||||
| Toys “R” Us, Inc., 10.75%, 2017 | 50,000 | 53,875 | ||||||
| YCC Holdings LLC/Yankee Finance, Inc., 10.25%, 2016 (p) | 25,000 | 25,815 | ||||||
|
| |||||||
| $ | 1,571,095 | |||||||
|
| |||||||
| Specialty Chemicals – 0.0% | ||||||||
| Koppers, Inc., 7.875%, 2019 | $ | 20,000 | $ | 22,000 | ||||
|
| |||||||
| Specialty Stores – 0.2% | ||||||||
| Gymboree Corp., 9.125%, 2018 | $ | 25,000 | $ | 22,250 | ||||
| Michaels Stores, Inc., 11.375%, 2016 | 35,000 | 36,575 | ||||||
| Michaels Stores, Inc., 7.75%, 2018 | 25,000 | 27,438 | ||||||
|
| |||||||
| $ | 86,263 | |||||||
|
| |||||||
| Supermarkets – 0.0% | ||||||||
| SUPERVALU, Inc., 7.5%, 2014 | $ | 18,000 | $ | 17,460 | ||||
|
| |||||||
| Supranational – 0.4% | ||||||||
| Corporacion Andina de Fomento, 4.375%, 2022 | $ | 210,000 | $ | 227,380 | ||||
|
| |||||||
| Telecommunications – Wireless – 2.2% | ||||||||
| American Tower Corp., REIT, 4.625%, 2015 | $ | 80,000 | $ | 85,037 | ||||
| American Tower Corp., REIT, 4.7%, 2022 | 126,000 | 139,408 | ||||||
| Clearwire Corp., 12%, 2015 (n) | 50,000 | 53,750 | ||||||
| Cricket Communications, Inc., 7.75%, 2020 | 45,000 | 45,900 | ||||||
| Crown Castle International Corp., 7.125%, 2019 | 130,000 | 143,650 | ||||||
| Crown Castle International Corp., 5.25%, 2023 (n) | 25,000 | 26,750 | ||||||
| Crown Castle Towers LLC, 6.113%, 2020 (n) | 157,000 | 189,104 | ||||||
| MetroPCS Wireless, Inc., 7.875%, 2018 | 40,000 | 43,300 | ||||||
| Rogers Cable, Inc., 5.5%, 2014 | 164,000 | 173,489 | ||||||
| Sprint Capital Corp., 6.875%, 2028 | 50,000 | 52,000 | ||||||
| Sprint Nextel Corp., 6%, 2016 | 75,000 | 81,563 | ||||||
| Sprint Nextel Corp., 8.375%, 2017 | 55,000 | 63,938 | ||||||
| Sprint Nextel Corp., 9%, 2018 (n) | 10,000 | 12,350 | ||||||
| Sprint Nextel Corp., 6%, 2022 | 55,000 | 56,513 | ||||||
|
| |||||||
| $ | 1,166,752 | |||||||
|
| |||||||
| Telephone Services – 0.2% | ||||||||
| Cogent Communications Group, Inc., 8.375%, 2018 (n) | $ | 15,000 | $ | 16,463 | ||||
| Level 3 Financing, Inc., 9.375%, 2019 | 35,000 | 39,113 | ||||||
| Level 3 Financing, Inc., 7%, 2020 (n) | 15,000 | 15,675 | ||||||
14
Table of Contents
MFS Strategic Income Portfolio
Portfolio of Investments – continued
| Issuer | Shares/Par | Value ($) | ||||||
| BONDS – continued | ||||||||
| Telephone Services – continued | ||||||||
| Level 3 Financing, Inc., 8.625%, 2020 | $ | 20,000 | $ | 22,200 | ||||
|
| |||||||
| $ | 93,451 | |||||||
|
| |||||||
| Tobacco – 2.2% | ||||||||
| Altria Group, Inc., 9.25%, 2019 | $ | 71,000 | $ | 98,771 | ||||
| B.A.T. International Finance PLC, 3.25%, 2022 (n) | 306,000 | 318,956 | ||||||
| Lorillard Tobacco Co., 8.125%, 2019 | 112,000 | 142,915 | ||||||
| Lorillard Tobacco Co., 6.875%, 2020 | 70,000 | 85,321 | ||||||
| Reynolds American, Inc., 6.75%, 2017 | 240,000 | 289,828 | ||||||
| Reynolds American, Inc., 4.75%, 2042 | 203,000 | 204,802 | ||||||
|
| |||||||
| $ | 1,140,593 | |||||||
|
| |||||||
| Transportation – 0.1% | ||||||||
| Navios South American Logistics, Inc., 9.25%, 2019 | $ | 40,000 | $ | 39,250 | ||||
|
| |||||||
| Transportation – Services – 1.2% | ||||||||
| ACL I Corp., 10.625%, 2016 (p) | $ | 52,854 | $ | 51,061 | ||||
| Avis Budget Car Rental LLC, 8.25%, 2019 | 25,000 | 27,625 | ||||||
| Avis Budget Car Rental LLC, 9.75%, 2020 | 15,000 | 17,325 | ||||||
| Commercial Barge Line Co., 12.5%, 2017 | 100,000 | 110,250 | ||||||
| ERAC USA Finance Co., 6.375%, 2017 (n) | 180,000 | 217,703 | ||||||
| HDTFS, Inc., 5.875%, 2020 (n) | 5,000 | 5,225 | ||||||
| Navios Maritime Acquisition Corp., 8.625%, 2017 | 60,000 | 56,250 | ||||||
| Navios Maritime Holdings, Inc., 8.875%, 2017 | 50,000 | 49,875 | ||||||
| Swift Services Holdings, Inc., 10%, 2018 | 80,000 | 87,800 | ||||||
|
| |||||||
| $ | 623,114 | |||||||
|
| |||||||
| U.S. Government Agencies and Equivalents – 1.1% | ||||||||
| National Credit Union Administration Guaranteed Note, 2.9%, 2020 | $ | 50,000 | $ | 53,298 | ||||
| Small Business Administration, 4.34%, 2024 | 157,201 | 172,815 | ||||||
| Small Business Administration, 4.77%, 2024 | 117,636 | 131,341 | ||||||
| Small Business Administration, 4.625%, 2025 | 99,743 | 111,519 | ||||||
| Small Business Administration, 5.11%, 2025 | 90,865 | 101,895 | ||||||
|
| |||||||
| $ | 570,868 | |||||||
|
| |||||||
| Utilities – Electric Power – 4.0% | ||||||||
| AES Corp., 8%, 2017 | $ | 85,000 | $ | 98,175 | ||||
| Allegheny Energy, Inc., 5.75%, 2019 (n) | 150,000 | 164,554 | ||||||
| Atlantic Power Corp., 9%, 2018 | 2,000 | 2,090 | ||||||
| Calpine Corp., 8%, 2016 (n) | 55,000 | 58,438 | ||||||
| Calpine Corp., 7.875%, 2020 (n) | 59,000 | 66,228 | ||||||
| CMS Energy Corp., 4.25%, 2015 | 140,000 | 148,548 | ||||||
| CMS Energy Corp., 5.05%, 2022 | 99,000 | 110,332 | ||||||
| Covanta Holding Corp., 7.25%, 2020 | 35,000 | 38,563 | ||||||
| Covanta Holding Corp., 6.375%, 2022 | 10,000 | 10,860 | ||||||
| DPL, Inc., 7.25%, 2021 | 25,000 | 26,750 | ||||||
| Duke Energy Corp., 3.35%, 2015 | 220,000 | 232,447 | ||||||
| Issuer | Shares/Par | Value ($) | ||||||
| BONDS – continued | ||||||||
| Utilities – Electric Power – continued | ||||||||
| Energy Future Holdings Corp., 10%, 2020 | $ | 45,000 | $ | 50,288 | ||||
| Energy Future Holdings Corp., 10%, 2020 | 145,000 | 163,488 | ||||||
| Energy Future Holdings Corp., 11.75%, 2022 (n) | 40,000 | 44,400 | ||||||
| Exelon Generation Co. LLC, 5.2%, 2019 | 70,000 | 79,355 | ||||||
| GenOn Energy, Inc., 9.875%, 2020 | 80,000 | 92,400 | ||||||
| NRG Energy, Inc., 8.25%, 2020 | 85,000 | 95,200 | ||||||
| Oncor Electric Delivery Co., 4.1%, 2022 | 150,000 | 163,490 | ||||||
| PPL WEM Holdings PLC, 3.9%, 2016 (n) | 200,000 | 210,611 | ||||||
| Progress Energy, Inc., 3.15%, 2022 | 196,000 | 198,416 | ||||||
| Texas Competitive Electric Holdings Co. LLC, 11.5%, 2020 (n) | 25,000 | 19,563 | ||||||
|
| |||||||
| $ | 2,074,196 | |||||||
|
| |||||||
| Total Bonds (Identified Cost, $46,819,543) | $ | 50,312,848 | ||||||
|
| |||||||
| PREFERRED STOCKS – 0.1% | ||||||||
| Other Banks & Diversified Financials – 0.1% | ||||||||
| Ally Financial, Inc., 7% (z) | 30 | $ | 29,465 | |||||
| GMAC Capital Trust I, 8.125% | 1,575 | 41,974 | ||||||
|
| |||||||
| Total Preferred Stocks (Identified Cost, $68,159) | $ | 71,439 | ||||||
|
| |||||||
| CONVERTIBLE BONDS – 0.1% | ||||||||
| Network & Telecom – 0.1% | ||||||||
| Nortel Networks Corp., 1.75%, 2014 (Identified Cost, $49,356) (a)(d) | $ | 50,000 | $ | 50,688 | ||||
|
| |||||||
| CONVERTIBLE PREFERRED STOCKS – 0.1% | ||||||||
| Automotive – 0.1% | ||||||||
| General Motors Co., 4.75% (Identified Cost, $45,131) | 920 | $ | 40,600 | |||||
|
| |||||||
| Strike Price | First Exercise | |||||||||||||||
| WARRANTS – 0.1% | ||||||||||||||||
| Broadcasting – 0.1% | ||||||||||||||||
| New Young Broadcasting Holding Co, Inc. (1 share for 1 warrant) (a) (Identified Cost, $13,572) | $ | 0.01 | 7/14/10 | 6 | $ | 22,500 | ||||||||||
|
| |||||||||||||||
| FLOATING RATE LOANS (g)(r) – 0.0% | ||||||||
| Financial Institutions – 0.0% | ||||||||
| Springleaf Financial Funding Co., Term Loan, 5.5%, 2017 (Identified Cost, $22,457) | $ | 22,538 | $ | 22,391 | ||||
|
| |||||||
| COMMON STOCKS – 0.0% | ||||||||
| Automotive – 0.0% | ||||||||
| Accuride Corp. (a) | 1,188 | $ | 3,813 | |||||
|
| |||||||
| Broadcasting – 0.0% | ||||||||
| New Young Broadcasting Holding Co., Inc. (a) | 2 | $ | 7,500 | |||||
|
| |||||||
15
Table of Contents
MFS Strategic Income Portfolio
Portfolio of Investments – continued
| Issuer | Shares/Par | Value ($) | ||||||
| COMMON STOCKS – continued | ||||||||
| Printing & Publishing – 0.0% | ||||||||
| American Media Operations, Inc. (a) | 1,733 | $ | 8,232 | |||||
|
| |||||||
| Total Common Stocks (Identified Cost, $44,982) | $ | 19,545 | ||||||
|
| |||||||
| Issuer | Shares/Par | Value ($) | ||||||
| MONEY MARKET FUNDS – 1.7% | ||||||||
| MFS Institutional Money Market Portfolio, 0.16%, at Cost and Net Asset Value (v) | 897,164 | $ | 897,164 | |||||
|
| |||||||
| Total Investments (Identified Cost, $47,960,364) | $ | 51,437,175 | ||||||
|
| |||||||
| OTHER ASSETS, LESS LIABILITIES – 1.9% | 994,258 | |||||||
|
| |||||||
| Net Assets – 100.0% | $ | 52,431,433 | ||||||
|
| |||||||
| (a) | Non-income producing security. |
| (d) | In default. Interest and/or scheduled principal payment(s) have been missed. |
| (e) | Guaranteed by Minister for Finance of Ireland. |
| (g) | The rate shown represents a weighted average coupon rate on settled positions at period end, unless otherwise indicated. |
| (i) | Interest only security for which the fund receives interest on notional principal (Par amount). Par amount shown is the notional principal and does not reflect the cost of the security. |
| (n) | Securities exempt from registration under Rule 144A of the Securities Act of 1933. These securities may be sold in the ordinary course of business in transactions exempt from registration, normally to qualified institutional buyers. At period end, the aggregate value of these securities was $11,866,857, representing 22.6% of net assets. |
| (p) | Payment-in-kind security. |
| (r) | Remaining maturities of floating rate loans may be less than stated maturities shown as a result of contractual or optional prepayments by the borrower. Such prepayments cannot be predicted with certainty. These loans may be subject to restrictions on resale. Floating rate loans generally have rates of interest which are determined periodically by reference to a base lending rate plus a premium. |
| (v) | Underlying affiliated fund that is available only to investment companies managed by MFS. The rate quoted for the MFS Institutional Money Market Portfolio is the annualized seven-day yield of the fund at period end. |
| (z) | Restricted securities are not registered under the Securities Act of 1933 and are subject to legal restrictions on resale. These securities generally may be resold in transactions exempt from registration or to the public if the securities are subsequently registered. Disposal of these securities may involve time-consuming negotiations and prompt sale at an acceptable price may be difficult. The fund holds the following restricted securities: |
| Restricted Securities | Acquisition Date | Cost | Value | |||||||
| Ally Financial, Inc., 7% (Preferred Stock) | 4/13/11-4/14/11 | $28,125 | $29,465 | |||||||
| American Media, Inc., 13.5%, 2018 | 12/22/10 | 6,848 | 5,948 | |||||||
| Bayview Financial Revolving Mortgage Loan Trust, FRN, 1.809%, 2040 | 3/01/06 | 163,081 | 103,089 | |||||||
| Boyd Gaming Corp., 9%, 2020 | 12/19/12-12/21/12 | 19,988 | 19,700 | |||||||
| CDRT Holding Corp., 9.25%, 2017 | 12/13/12 | 10,298 | 10,200 | |||||||
| Cequel Communications Holdings, 6.375%, 2020 | 12/13/12-12/24/12 | 36,423 | 36,444 | |||||||
| Cinemark USA, Inc., 5.125%, 2022 | 12/04/12 | 5,000 | 5,063 | |||||||
| Crest Ltd., “A1” CDO, FRN, 0.79%, 2018 | 1/21/10 | 19,950 | 24,295 | |||||||
| DISH DBS Corp., 5%, 2023 | 12/19/12 | 35,000 | 35,000 | |||||||
| Dematic S.A., 7.75%, 2020 | 12/13/12 | 30,000 | 30,000 | |||||||
| Eldorado Gold Corp., 6.125%, 2020 | 12/10/12-12/12/12 | 25,330 | 25,438 | |||||||
| Falcon Franchise Loan LLC, FRN, 6.014%, 2023 | 1/18/02 | 4,814 | 15,191 | |||||||
| Falcon Franchise Loan LLC, FRN, 6.447%, 2025 | 1/29/03 | 11,217 | 22,171 | |||||||
| FelCor Lodging LP, 5.625%, 2023 | 12/12/12 | 5,000 | 4,975 | |||||||
| GMAC LLC, FRN, 6.02%, 2033 | 11/17/00 | 125,263 | 127,723 | |||||||
| IAC/InterActiveCorp, 4.75%, 2022 | 12/18/12 | 5,000 | 4,975 | |||||||
| LBI Media, Inc., 13.5% to 2015, 11.5% to 2020 | 7/18/07 | 16,648 | 14,700 | |||||||
| Local TV Finance LLC, 9.25%, 2015 | 12/10/07-11/30/10 | 40,912 | 41,649 | |||||||
| Morgan Stanley Capital I, Inc., FRN, 1.383%, 2039 | 7/20/04 | 21,730 | 15,417 | |||||||
| Prudential Securities Secured Financing Corp., FRN, 7.167%, 2013 | 12/06/04 | 413,304 | 410,691 | |||||||
16
Table of Contents
MFS Strategic Income Portfolio
Portfolio of Investments – continued
| Restricted Securities – continued | Acquisition Date | Cost | Value | |||||||
| Rosneft, 4.199%, 2022 | 11/29/12 | $200,000 | $203,500 | |||||||
| Salomon Brothers Mortgage Securities, Inc., FRN, 7.155%, 2032 | 1/07/05 | 27,086 | 27,080 | |||||||
| Six Flags Entertainment Corp., 5.25%, 2021 | 12/11/12 | 30,000 | 30,000 | |||||||
| Spectrum Brands Escrow Corp., 6.625%, 2022 | 11/01/12 | 5,000 | 5,363 | |||||||
| Townsquare Radio LLC, 9%, 2019 | 3/30/12 | 19,816 | 21,950 | |||||||
| Total Restricted Securities | $1,270,027 | |||||||||
| % of Net assets | 2.4% | |||||||||
The following abbreviations are used in this report and are defined:
| CDO | Collateralized Debt Obligation |
| FRN | Floating Rate Note. Interest rate resets periodically and may not be the rate reported at period end. |
| PLC | Public Limited Company |
| REIT | Real Estate Investment Trust |
Abbreviations indicate amounts shown in currencies other than the U.S. dollar. All amounts are stated in U.S. dollars unless otherwise indicated. A list of abbreviations is shown below:
| AUD | Australian Dollar |
| CAD | Canadian Dollar |
| DKK | Danish Krone |
| EUR | Euro |
| GBP | British Pound |
| JPY | Japanese Yen |
| SEK | Swedish Krona |
Derivative Contracts at 12/31/12
Forward Foreign Currency Exchange Contracts at 12/31/12
| Type | Currency | Counterparty | Contracts to Deliver/Receive | Settlement Date Range | In Exchange For | Contracts at Value | Net Unrealized Appreciation (Depreciation) | |||||||||||||||
| Asset Derivatives | ||||||||||||||||||||||
| SELL | CAD | Merrill Lynch International Bank | 168,695 | 1/11/13 | $ | 171,982 | $ | 169,564 | $ | 2,418 | ||||||||||||
|
| |||||||||||||||||||||
| Liability Derivatives | ||||||||||||||||||||||
| SELL | AUD | Westpac Banking Corp. | 43,432 | 1/11/13 | $ | 44,054 | $ | 45,075 | $ | (1,021 | ) | |||||||||||
| SELL | DKK | Citibank N.A. | 242,054 | 1/11/13 | 42,455 | 42,829 | (374 | ) | ||||||||||||||
| SELL | EUR | Barclays Bank PLC | 53,891 | 1/11/13 | 69,969 | 71,139 | (1,170 | ) | ||||||||||||||
| SELL | EUR | Deutsche Bank AG | 253,723 | 1/11/13 | 326,930 | 334,925 | (7,995 | ) | ||||||||||||||
| SELL | EUR | UBS AG | 222,723 | 1/11/13 | 287,054 | 294,003 | (6,949 | ) | ||||||||||||||
| SELL | GBP | Barclays Bank PLC | 175,962 | 1/11/13 | 281,311 | 285,835 | (4,524 | ) | ||||||||||||||
| SELL | GBP | Deutsche Bank AG | 175,962 | 1/11/13 | 281,259 | 285,835 | (4,576 | ) | ||||||||||||||
| BUY | JPY | Credit Suisse Group | 16,922,260 | 1/11/13 | 216,472 | 195,335 | (21,137 | ) | ||||||||||||||
| BUY | JPY | Merrill Lynch International Bank | 16,922,260 | 1/11/13 | 216,357 | 195,335 | (21,022 | ) | ||||||||||||||
| SELL | SEK | Deutsche Bank AG | 132,906 | 1/11/13 | 19,892 | 20,433 | (541 | ) | ||||||||||||||
|
| |||||||||||||||||||||
| $ | (69,309 | ) | ||||||||||||||||||||
|
| |||||||||||||||||||||
17
Table of Contents
MFS Strategic Income Portfolio
Portfolio of Investments – continued
Futures Contracts Outstanding at 12/31/12
| Description | Currency | Contracts | Value | Expiration Date | Unrealized Appreciation (Depreciation) | |||||||||||||
| Asset Derivatives | ||||||||||||||||||
| Interest Rate Futures | ||||||||||||||||||
| U.S. Treasury Note 10 yr (Short) | USD | 15 | $1,991,719 | March - 2013 | $10,352 | |||||||||||||
|
| |||||||||||||||||
At December 31, 2012, the fund had cash collateral of $16,500 to cover any commitments for certain derivative contracts. Cash collateral includes “Restricted cash” in the Statement of Assets and Liabilities.
See Notes to Financial Statements
18
Table of Contents
MFS Strategic Income Portfolio
FINANCIAL STATEMENT | STATEMENT OF ASSETS AND LIABILITIES
This statement represents your fund’s balance sheet, which details the assets and liabilities comprising the total value of the fund.
At 12/31/12 | ||||||||
Assets | ||||||||
Investments – | ||||||||
Non-affiliated issuers, at value (identified cost, $47,063,200) | $50,540,011 | |||||||
Underlying affiliated funds, at cost and value | 897,164 | |||||||
Total investments, at value (identified cost, $47,960,364) | $51,437,175 | |||||||
Cash | 34,986 | |||||||
Restricted cash | 16,500 | |||||||
Receivables for | ||||||||
Forward foreign currency exchange contracts | 2,418 | |||||||
Daily variation margin on open futures contracts | 2,578 | |||||||
Investments sold | 360,365 | |||||||
Fund shares sold | 157,878 | |||||||
Interest | 714,393 | |||||||
Receivable from investment adviser | 6,760 | |||||||
Other assets | 913 | |||||||
Total assets | $52,733,966 | |||||||
Liabilities | ||||||||
Payables for | ||||||||
Forward foreign currency exchange contracts | $69,309 | |||||||
Investments purchased | 61,300 | |||||||
Fund shares reacquired | 130,737 | |||||||
Payable to affiliates | ||||||||
Distribution and/or service fees | 243 | |||||||
Payable for independent Trustees’ compensation | 67 | |||||||
Accrued expenses and other liabilities | 40,877 | |||||||
Total liabilities | $302,533 | |||||||
Net assets | $52,431,433 | |||||||
Net assets consist of | ||||||||
Paid-in capital | $50,775,598 | |||||||
Unrealized appreciation (depreciation) on investments and translation of assets and liabilities in foreign currencies | 3,421,930 | |||||||
Accumulated net realized gain (loss) on investments and foreign currency | (3,933,559 | ) | ||||||
Undistributed net investment income | 2,167,464 | |||||||
Net assets | $52,431,433 | |||||||
Shares of beneficial interest outstanding | 5,150,810 |
| Net assets | Shares outstanding | Net asset value per share | ||||||||||
Initial Class | $43,564,328 | 4,275,037 | $10.19 | |||||||||
Service Class | 8,867,105 | 875,773 | 10.12 | |||||||||
See Notes to Financial Statements
19
Table of Contents
MFS Strategic Income Portfolio
FINANCIAL STATEMENTS | STATEMENT OF OPERATIONS
This statement describes how much your fund earned in investment income and accrued in expenses. It also describes any gains and/or losses generated by fund operations.
Year ended 12/31/12 | ||||||||
Net investment income | ||||||||
Income | ||||||||
Interest | $2,654,446 | |||||||
Dividends | 11,804 | |||||||
Dividends from underlying affiliated funds | 2,851 | |||||||
Total investment income | $2,669,101 | |||||||
Expenses | ||||||||
Management fee | $355,843 | |||||||
Distribution and/or service fees | 24,137 | |||||||
Administrative services fee | 17,646 | |||||||
Independent Trustees’ compensation | 1,816 | |||||||
Custodian fee | 21,341 | |||||||
Shareholder communications | 6,631 | |||||||
Audit and tax fees | 66,342 | |||||||
Legal fees | 1,146 | |||||||
Miscellaneous | 47,717 | |||||||
Total expenses | $542,619 | |||||||
Fees paid indirectly | (21 | ) | ||||||
Reduction of expenses by investment adviser | (60,930 | ) | ||||||
Net expenses | $481,668 | |||||||
Net investment income | $2,187,433 | |||||||
Realized and unrealized gain (loss) on investments and foreign currency | ||||||||
Realized gain (loss) (identified cost basis) | ||||||||
Investments | $831,485 | |||||||
Futures contracts | (77,781 | ) | ||||||
Swap agreements | 4,290 | |||||||
Foreign currency | 10,324 | |||||||
Net realized gain (loss) on investments and foreign currency | $768,318 | |||||||
Change in unrealized appreciation (depreciation) | ||||||||
Investments | $2,152,123 | |||||||
Futures contracts | 10,352 | |||||||
Swap agreements | (3,538 | ) | ||||||
Translation of assets and liabilities in foreign currencies | (94,401 | ) | ||||||
Net unrealized gain (loss) on investments and foreign currency translation | $2,064,536 | |||||||
Net realized and unrealized gain (loss) on investments and foreign currency | $2,832,854 | |||||||
Change in net assets from operations | $5,020,287 |
See Notes to Financial Statements
20
Table of Contents
MFS Strategic Income Portfolio
FINANCIAL STATEMENTS | STATEMENTS OF CHANGES IN NET ASSETS
These statements describe the increases and/or decreases in net assets resulting from operations, any distributions, and any shareholder transactions.
For years ended 12/31 | 2012 | 2011 | ||||||
Change in net assets | ||||||||
From operations | ||||||||
Net investment income | $2,187,433 | $2,378,437 | ||||||
Net realized gain (loss) on investments and foreign currency | 768,318 | 263,644 | ||||||
Net unrealized gain (loss) on investments and foreign currency translation | 2,064,536 | (378,048 | ) | |||||
Change in net assets from operations | $5,020,287 | $2,264,033 | ||||||
Distributions declared to shareholders | ||||||||
From net investment income | $(2,700,006 | ) | $(2,837,428 | ) | ||||
Change in net assets from fund share transactions | $1,180,839 | $(2,364,894 | ) | |||||
Total change in net assets | $3,501,120 | $(2,938,289 | ) | |||||
Net assets | ||||||||
At beginning of period | 48,930,313 | 51,868,602 | ||||||
At end of period (including undistributed net investment income of $2,167,464 and | $52,431,433 | $48,930,313 |
See Notes to Financial Statements
21
Table of Contents
MFS Strategic Income Portfolio
FINANCIAL STATEMENTS | FINANCIAL HIGHLIGHTS
The financial highlights table is intended to help you understand the fund’s financial performance for the past 5 years. Certain information reflects financial results for a single fund share. The total returns in the table represent the rate by which an investor would have earned (or lost) on an investment in the fund share class (assuming reinvestment of all distributions) held for the entire period.
| Initial Class | Years ended 12/31 | |||||||||||||||||||
| 2012 | 2011 | 2010 | 2009 | 2008 | ||||||||||||||||
Net asset value, beginning of period | $9.74 | $9.87 | $9.46 | $8.36 | $10.40 | |||||||||||||||
| Income (loss) from investment operations | ||||||||||||||||||||
Net investment income (d) | $0.44 | $0.48 | $0.49 | $0.55 | $0.58 | |||||||||||||||
Net realized and unrealized gain (loss) on investments and foreign currency | 0.56 | (0.02 | ) | 0.45 | 1.54 | (1.82 | ) | |||||||||||||
Total from investment operations | $1.00 | $0.46 | $0.94 | $2.09 | $(1.24 | ) | ||||||||||||||
| Less distributions declared to shareholders | ||||||||||||||||||||
From net investment income | $(0.55 | ) | $(0.59 | ) | $(0.53 | ) | $(0.99 | ) | $(0.80 | ) | ||||||||||
Net asset value, end of period (x) | $10.19 | $9.74 | $9.87 | $9.46 | $8.36 | |||||||||||||||
Total return (%) (k)(r)(s)(x) | 10.42 | 4.67 | 10.27 | 27.52 | (12.94 | ) | ||||||||||||||
| Ratios (%) (to average net assets) and Supplemental data: | ||||||||||||||||||||
Expenses before expense reductions (f) | 1.02 | 1.05 | 1.06 | 1.03 | 1.02 | |||||||||||||||
Expenses after expense reductions (f) | 0.90 | 0.90 | 0.90 | 0.90 | 0.90 | |||||||||||||||
Net investment income | 4.35 | 4.79 | 5.11 | 6.23 | 6.07 | |||||||||||||||
Portfolio turnover | 40 | 29 | 48 | 63 | 38 | |||||||||||||||
Net assets at end of period (000 omitted) | $43,564 | $38,563 | $40,927 | $40,221 | $31,159 | |||||||||||||||
| Service Class | Years ended 12/31 | |||||||||||||||||||
| 2012 | 2011 | 2010 | 2009 | 2008 | ||||||||||||||||
Net asset value, beginning of period | $9.67 | $9.81 | $9.40 | $8.30 | $10.33 | |||||||||||||||
| Income (loss) from investment operations | ||||||||||||||||||||
Net investment income (d) | $0.41 | $0.45 | $0.47 | $0.52 | $0.55 | |||||||||||||||
Net realized and unrealized gain (loss) on investments and foreign currency | 0.56 | (0.03 | ) | 0.45 | 1.54 | (1.80 | ) | |||||||||||||
Total from investment operations | $0.97 | $0.42 | $0.92 | $2.06 | $(1.25 | ) | ||||||||||||||
| Less distributions declared to shareholders | ||||||||||||||||||||
From net investment income | $(0.52 | ) | $(0.56 | ) | $(0.51 | ) | $(0.96 | ) | $(0.78 | ) | ||||||||||
Net asset value, end of period (x) | $10.12 | $9.67 | $9.81 | $9.40 | $8.30 | |||||||||||||||
Total return (%) (k)(r)(s)(x) | 10.18 | 4.31 | 10.05 | 27.24 | (13.21 | ) | ||||||||||||||
Ratios (%) (to average net assets) and Supplemental data: | ||||||||||||||||||||
Expenses before expense reductions (f) | 1.27 | 1.30 | 1.31 | 1.28 | 1.26 | |||||||||||||||
Expenses after expense reductions (f) | 1.15 | 1.15 | 1.15 | 1.15 | 1.15 | |||||||||||||||
Net investment income | 4.11 | 4.54 | 4.87 | 6.02 | 5.82 | |||||||||||||||
Portfolio turnover | 40 | 29 | 48 | 63 | 38 | |||||||||||||||
Net assets at end of period (000 omitted) | $8,867 | $10,368 | $10,942 | $11,644 | $11,192 | |||||||||||||||
| (d) | Per share data is based on average shares outstanding. |
| (f) | Ratios do not reflect reductions from fees paid indirectly, if applicable. |
| (k) | The total return does not reflect expenses that apply to separate accounts. Inclusion of these charges would reduce the total return figures for all periods shown. |
| (r) | Certain expenses have been reduced without which performance would have been lower. |
| (s) | From time to time the fund may receive proceeds from litigation settlements, without which performance would be lower. |
| (x) | The net asset values per share and total returns have been calculated on net assets which include adjustments made in accordance with U.S. generally accepted accounting principles required at period end for financial reporting purposes. |
See Notes to Financial Statements
22
Table of Contents
MFS Strategic Income Portfolio
| (1) | Business and Organization |
MFS Strategic Income Portfolio (the fund) is a series of MFS Variable Insurance Trust II (the trust). The trust is organized as a Massachusetts business trust and is registered under the Investment Company Act of 1940, as amended, as an open-end management investment company. The shareholders of each series of the trust are separate accounts of insurance companies, which offer variable annuity and/or life insurance products, and qualified retirement and pension plans.
| (2) | Significant Accounting Policies |
General – The preparation of financial statements in conformity with U.S. generally accepted accounting principles requires management to make estimates and assumptions that affect the reported amounts of assets and liabilities, and disclosure of contingent assets and liabilities at the date of the financial statements and the reported amounts of revenues and expenses during the reporting period. Actual results could differ from those estimates. In the preparation of these financial statements, management has evaluated subsequent events occurring after the date of the fund’s Statement of Assets and Liabilities through the date that the financial statements were issued. The fund invests in high-yield securities rated below investment grade. Investments in high-yield securities involve greater degrees of credit and market risk than investments in higher-rated securities and tend to be more sensitive to economic conditions. The fund invests in foreign securities. Investments in foreign securities are vulnerable to the effects of changes in the relative values of the local currency and the U.S. dollar and to the effects of changes in each country’s legal, political, and economic environment.
In this reporting period the fund adopted Financial Accounting Standards Board (FASB) Accounting Standards Update 2011-04, Fair Value Measurement (Topic 820) – Amendments to Achieve Common Fair Value Measurement and Disclosure Requirements in U.S. GAAP and IFRSs (“ASU 2011-04”). ASU 2011-04 seeks to improve the comparability of fair value measurements as presented and disclosed in financial statements prepared in accordance with U.S. GAAP and International Financial Reporting Standards (IFRS) by providing common requirements for fair value measurement and disclosure.
In December 2011, the FASB issued Accounting Standards Update 2011-11, Balance Sheet (Topic 210) – Disclosures about Offsetting Assets and Liabilities (“ASU 2011-11”). Effective for annual reporting periods beginning on or after January 1, 2013 and interim periods within those annual periods, ASU 2011-11 is intended to enhance disclosure requirements on the offsetting of financial assets and liabilities. Although still evaluating the potential impacts of ASU 2011-11 to the fund, management expects that the impact of the fund’s adoption will be limited to additional financial statement disclosures.
Investment Valuations – Debt instruments and floating rate loans (other than short-term instruments), including restricted debt instruments, are generally valued at an evaluated or composite bid as provided by a third-party pricing service. Equity securities, including restricted equity securities, are generally valued at the last sale or official closing price as provided by a third-party pricing service on the market or exchange on which they are primarily traded. Equity securities, for which there were no sales reported that day, are generally valued at the last quoted daily bid quotation as provided by a third-party pricing service on the market or exchange on which such securities are primarily traded. Short-term instruments with a maturity at issuance of 60 days or less generally are valued at amortized cost, which approximates market value. Futures contracts are generally valued at last posted settlement price as provided by a third-party pricing service on the market on which they are primarily traded. Futures contracts for which there were no trades that day for a particular position are generally valued at the closing bid quotation as provided by a third-party pricing service on the market on which such futures contracts are primarily traded. Forward foreign currency exchange contracts are generally valued at the mean of bid and asked prices for the time period interpolated from rates provided by a third-party pricing service for proximate time periods. Swap agreements are generally valued at valuations provided by a third-party pricing service. Open-end investment companies are generally valued at net asset value per share. Securities and other assets generally valued on the basis of information from a third-party pricing service may also be valued at a broker/dealer bid quotation. Values obtained from third-party pricing services can utilize both transaction data and market information such as yield, quality, coupon rate, maturity, type of issue, trading characteristics, and other market data. The values of foreign securities and other assets and liabilities expressed in foreign currencies are converted to U.S. dollars using the mean of bid and asked prices for rates provided by a third-party pricing service.
The Board of Trustees has delegated primary responsibility for determining or causing to be determined the value of the fund’s investments (including any fair valuation) to the adviser pursuant to valuation policies and procedures approved by the Board. If the adviser determines that reliable market quotations are not readily available, investments are valued at fair value as determined in good faith by the adviser in accordance with such procedures under the oversight of the Board of Trustees. Under the fund’s valuation policies and procedures, market quotations are not considered to be readily available for most types of debt instruments and floating rate loans and many types of derivatives. These investments are generally valued at fair value based on information from third-party pricing services. In addition, investments may be valued at fair value if the adviser determines that an investment’s value has been materially affected by events occurring after the close of the exchange or market on which the investment is principally traded (such as foreign exchange or market) and prior to the determination of the fund’s net asset value, or after the halting of trading of a specific security where trading does not resume prior to the close of the exchange or market on which the security is principally traded. The adviser generally relies on third-party pricing services or other information (such as the correlation with price
23
Table of Contents
MFS Strategic Income Portfolio
Notes to Financial Statements – continued
movements of similar securities in the same or other markets; the type, cost and investment characteristics of the security; the business and financial condition of the issuer; and trading and other market data) to assist in determining whether to fair value and at what value to fair value an investment. The value of an investment for purposes of calculating the fund’s net asset value can differ depending on the source and method used to determine value. When fair valuation is used, the value of an investment used to determine the fund’s net asset value may differ from quoted or published prices for the same investment. There can be no assurance that the fund could obtain the fair value assigned to an investment if it were to sell the investment at the same time at which the fund determines its net asset value per share.
Various inputs are used in determining the value of the fund’s assets or liabilities. These inputs are categorized into three broad levels. In certain cases, the inputs used to measure fair value may fall into different levels of the fair value hierarchy. In such cases, an investment’s level within the fair value hierarchy is based on the lowest level of input that is significant to the fair value measurement. The fund’s assessment of the significance of a particular input to the fair value measurement in its entirety requires judgment, and considers factors specific to the investment. Level 1 includes unadjusted quoted prices in active markets for identical assets or liabilities. Level 2 includes other significant observable market-based inputs (including quoted prices for similar securities, interest rates, prepayment speed, and credit risk). Level 3 includes unobservable inputs, which may include the adviser’s own assumptions in determining the fair value of investments. Other financial instruments are derivative instruments not reflected in total investments, such as futures contracts and forward foreign currency exchange contracts. The following is a summary of the levels used as of December 31, 2012 in valuing the fund’s assets or liabilities:
| Investments at Value | Level 1 | Level 2 | Level 3 | Total | ||||||||||||
| Equity Securities | $86,387 | $59,465 | $8,232 | $154,084 | ||||||||||||
| U.S. Treasury Bonds & U.S. Government Agency & Equivalents | — | 570,868 | — | 570,868 | ||||||||||||
| Non-U.S. Sovereign Debt | — | 7,360,303 | — | 7,360,303 | ||||||||||||
| U.S. Corporate Bonds | — | 31,714,197 | — | 31,714,197 | ||||||||||||
| Residential Mortgage-Backed Securities | — | 255,606 | — | 255,606 | ||||||||||||
| Commercial Mortgage-Backed Securities | — | 644,012 | — | 644,012 | ||||||||||||
| Asset-Backed Securities (including CDOs) | — | 295,868 | — | 295,868 | ||||||||||||
| Foreign Bonds | — | 9,522,682 | — | 9,522,682 | ||||||||||||
| Floating Rate Loans | — | 22,391 | — | 22,391 | ||||||||||||
| Mutual Funds | 897,164 | — | — | 897,164 | ||||||||||||
| Total Investments | $983,551 | $50,445,392 | $8,232 | $51,437,175 | ||||||||||||
| Other Financial Instruments | ||||||||||||||||
| Futures Contracts | $10,352 | $— | $— | $10,352 | ||||||||||||
| Forward Foreign Currency Exchange Contracts | — | (66,891 | ) | — | (66,891 | ) | ||||||||||
For further information regarding security characteristics, see the Portfolio of Investments.
The following is a reconciliation of level 3 assets for which significant unobservable inputs were used to determine fair value. The fund’s policy is to recognize transfers between the levels as of the end of the period. The table presents the activity of level 3 securities held at the beginning and the end of the period.
| Equity Securities | ||||
| Balance as of 12/31/11 | $20,605 | |||
Change in unrealized appreciation (depreciation) | (12,373 | ) | ||
| Balance as of 12/31/12 | $8,232 | |||
The net change in unrealized appreciation (depreciation) from investments still held as level 3 at December 31, 2012 is $(12,373).
Foreign Currency Translation – Purchases and sales of foreign investments, income, and expenses are converted into U.S. dollars based upon currency exchange rates prevailing on the respective dates of such transactions or on the reporting date for foreign denominated receivables and payables. Gains and losses attributable to foreign currency exchange rates on sales of securities are recorded for financial statement purposes as net realized gains and losses on investments. Gains and losses attributable to foreign exchange rate movements on receivables, payables, income and expenses are recorded for financial statement purposes as foreign currency transaction gains and losses. That portion of both realized and unrealized gains and losses on investments that results from fluctuations in foreign currency exchange rates is not separately disclosed.
Derivatives – The fund uses derivatives for different purposes, primarily to increase or decrease exposure to a particular market or segment of the market, or security, to increase or decrease interest rate or currency exposure, or as alternatives to direct investments. Derivatives are used for hedging or non-hedging purposes. While hedging can reduce or eliminate losses, it can also reduce or eliminate gains. When the fund uses derivatives as an investment to increase market exposure, or for hedging purposes, gains and losses from derivative instruments may be substantially greater than the derivative’s original cost.
24
Table of Contents
MFS Strategic Income Portfolio
Notes to Financial Statements – continued
The derivative instruments used by the fund were futures contracts, forward foreign currency exchange contracts, and swap agreements. The fund’s period end derivatives, as presented in the Portfolio of Investments and the associated Derivative Contract tables, generally are indicative of the volume of its derivative activity during the period.
The following table presents, by major type of derivative contract, the fair value, on a gross basis, of the asset and liability components of derivatives held by the fund at December 31, 2012 as reported in the Statement of Assets and Liabilities:
| Fair Value (a) | ||||||||||
| Risk | Derivative Contracts | Asset Derivatives | Liability Derivatives | |||||||
| Interest Rate | Interest Rate Futures | $10,352 | $— | |||||||
| Foreign Exchange | Forward Foreign Currency Exchange | 2,418 | (69,309 | ) | ||||||
| Total | $12,770 | $(69,309 | ) | |||||||
| (a) | The value of futures contracts outstanding includes cumulative appreciation (depreciation) as reported in the fund’s Portfolio of Investments. Only the current day variation margin for futures contracts is separately reported within the fund’s Statement of Assets and Liabilities. |
The following table presents, by major type of derivative contract, the realized gain (loss) on derivatives held by the fund for the year ended December 31, 2012 as reported in the Statement of Operations:
| Risk | Futures Contracts | Swap Agreements | Foreign Currency | |||||||||
| Interest Rate | $(77,781 | ) | $— | $— | ||||||||
| Foreign Exchange | — | — | 19,067 | |||||||||
| Credit | — | 4,290 | — | |||||||||
| Total | $(77,781 | ) | $4,290 | $19,067 | ||||||||
The following table presents, by major type of derivative contract, the change in unrealized appreciation (depreciation) on derivatives held by the fund for the year ended December 31, 2012 as reported in the Statement of Operations:
| Risk | Futures Contracts | Swap Agreements | Translation of Assets and Liabilities in Foreign Currencies | |||||||||
| Interest Rate | $10,352 | $— | $— | |||||||||
| Foreign Exchange | — | — | (102,507 | ) | ||||||||
| Credit | — | (3,538 | ) | — | ||||||||
| Total | $10,352 | $(3,538 | ) | $(102,507 | ) | |||||||
Derivative counterparty credit risk is managed through formal evaluation of the creditworthiness of all potential counterparties. On certain over-the-counter derivatives, the fund attempts to reduce its exposure to counterparty credit risk whenever possible by entering into an International Swaps and Derivatives Association (ISDA) Master Agreement on a bilateral basis with each of the counterparties with whom it undertakes a significant volume of transactions. The ISDA Master Agreement gives each party to the agreement the right to terminate all transactions traded under such agreement if there is a certain deterioration in the credit quality of the other party. The ISDA Master Agreement gives the fund the right, upon an event of default by the applicable counterparty or a termination of the agreement, to close out all transactions traded under such agreement and to net amounts owed under each transaction to one net amount payable by one party to the other. This right to close out and net payments across all transactions traded under the ISDA Master Agreement could result in a reduction of the fund’s credit risk to such counterparty equal to any amounts payable by the fund under the applicable transactions, if any. However, absent an event of default by the counterparty or a termination of the agreement, the ISDA Master Agreement does not result in an offset of reported amounts of assets and liabilities in the Statement of Assets and Liabilities across transactions between the fund and the applicable counterparty.
Collateral requirements differ by type of derivative. Collateral or margin requirements are set by the broker or exchange clearing house for exchange traded derivatives (i.e., futures contracts and exchange-traded options) while collateral terms are contract specific for over-the-counter traded derivatives (i.e., forward foreign currency exchange contracts, swap agreements and over-the-counter options). For derivatives traded under an ISDA Master Agreement, the collateral requirements are netted across all transactions traded under such agreement and one amount is posted from one party to the other to collateralize such obligations. Cash collateral that has been pledged to cover obligations of the fund under derivative contracts, if any, will be reported separately in the Statement of Assets and Liabilities as “Restricted cash”. Securities collateral pledged for the same purpose, if any, is noted in the Portfolio of Investments.
Futures Contracts – The fund entered into futures contracts which may be used to hedge against or obtain broad market exposure, interest rate exposure, currency exposure, or to manage duration. A futures contract represents a commitment for the future purchase or sale of an asset at a specified price on a specified date.
25
Table of Contents
MFS Strategic Income Portfolio
Notes to Financial Statements – continued
Upon entering into a futures contract, the fund is required to deposit with the broker, either in cash or securities, an initial margin in an amount equal to a certain percentage of the notional amount of the contract. Subsequent payments (variation margin) are made or received by the fund each day, depending on the daily fluctuations in the value of the contract, and are recorded for financial statement purposes as unrealized gain or loss by the fund until the contract is closed or expires at which point the gain or loss on futures contracts is realized.
The fund bears the risk of interest rates, exchange rates or securities prices moving unexpectedly, in which case, the fund may not achieve the anticipated benefits of the futures contracts and may realize a loss. While futures contracts may present less counterparty risk to the fund since the contracts are exchange traded and the exchange’s clearinghouse guarantees payments to the broker, there is still counterparty credit risk due to the insolvency of the broker. The fund’s maximum risk of loss due to counterparty credit risk is equal to the margin posted by the fund to the broker plus any gains or minus any losses on the outstanding futures contracts.
Forward Foreign Currency Exchange Contracts – The fund entered into forward foreign currency exchange contracts for the purchase or sale of a specific foreign currency at a fixed price on a future date. These contracts may be used to hedge the fund’s currency risk or for non-hedging purposes. For hedging purposes, the fund may enter into contracts to deliver or receive foreign currency that the fund will receive from or use in its normal investment activities. The fund may also use contracts to hedge against declines in the value of foreign currency denominated securities due to unfavorable exchange rate movements. For non-hedging purposes, the fund may enter into contracts with the intent of changing the relative exposure of the fund’s portfolio of securities to different currencies to take advantage of anticipated exchange rate changes.
Forward foreign currency exchange contracts are adjusted by the daily exchange rate of the underlying currency and any unrealized gains or losses are recorded as a receivable or payable for forward foreign currency exchange contracts until the contract settlement date. On contract settlement date, any gain or loss on the contract is recorded as realized gains or losses on foreign currency.
Risks may arise upon entering into these contracts from unanticipated movements in the value of the contract and from the potential inability of counterparties to meet the terms of their contracts. Generally, the fund’s maximum risk due to counterparty credit risk is the unrealized gain on the contract due to the use of Continuous Linked Settlement, an industry accepted settlement system. This risk is mitigated in cases where there is an ISDA Master Agreement between the fund and the counterparty providing for netting as described above and for posting of collateral by the counterparty to the fund to cover the fund’s exposure to the counterparty under such ISDA Master Agreement.
Swap Agreements – The fund entered into swap agreements. A swap agreement is generally an exchange of cash payments, at specified intervals or upon the occurrence of specified events, between the fund and a counterparty. The net cash payments exchanged are recorded as a realized gain or loss on swap agreements in the Statement of Operations. The value of the swap agreement, which is adjusted daily and includes any related interest accruals to be paid or received by the fund, is recorded in the Statement of Assets and Liabilities. The daily change in value, including any related interest accruals to be paid or received, is recorded as unrealized appreciation or depreciation on swap agreements in the Statement of Operations. Amounts paid or received at the inception of the swap agreement are reflected as premiums paid or received in the Statement of Assets and Liabilities and are amortized using the effective interest method over the term of the agreement. A liquidation payment received or made upon early termination is recorded as a realized gain or loss on swap agreements in the Statement of Operations.
Risks related to swap agreements include the possible lack of a liquid market, unfavorable market and interest rate movements of the underlying instrument and the failure of the counterparty to perform under the terms of the agreements. To address counterparty risk, swap agreements are limited to only highly-rated counterparties. The risk is further mitigated by having an ISDA Master Agreement between the fund and the counterparty providing for netting as described above and by the posting of collateral by the counterparty to the fund to cover the fund’s exposure to the counterparty under such ISDA Master Agreement.
The fund entered into credit default swap agreements in order to manage its exposure to the market or certain sectors of the market, to reduce its credit risk exposure to defaults of corporate and sovereign issuers or to create exposure to corporate or sovereign issuers to which it is not otherwise exposed. In a credit default swap agreement, the protection buyer can make an upfront payment and will make a stream of payments based on a fixed percentage applied to the agreement notional amount to the protection seller in exchange for the right to receive a specified return upon the occurrence of a defined credit event on the reference obligation (which may be either a single security or a basket of securities issued by corporate or sovereign issuers) and, with respect to the rare cases where physical settlement applies, the delivery by the buyer to the seller of a defined deliverable obligation. Although agreement-specific, credit events generally consist of a combination of the following: bankruptcy, failure to pay, restructuring, obligation acceleration, obligation default, or repudiation/moratorium, each as defined in the 2003 ISDA Credit Derivatives Definitions as amended by the relevant agreement. Restructuring is generally not applicable when the reference obligation is issued by a North American corporation and obligation acceleration, obligation default, or repudiation/moratorium are generally only applicable when the reference obligation is issued by a sovereign entity or an entity in an emerging country. Upon
26
Table of Contents
MFS Strategic Income Portfolio
Notes to Financial Statements – continued
determination of the final price for the deliverable obligation (or upon delivery of the deliverable obligation in the case of physical settlement), the difference between the value of the deliverable obligation and the swap agreement’s notional amount is recorded as realized gain or loss on swap agreements in the Statement of Operations.
The fund’s maximum risk of loss from counterparty risk, either as the protection seller or as the protection buyer, is the fair value of the agreement. This risk is mitigated by having an ISDA Master Agreement between the fund and the counterparty providing for netting as described above and by the posting of collateral by the counterparty to the fund to cover the fund’s exposure to the counterparty under such ISDA Master Agreement.
Loans and Other Direct Debt Instruments – The fund invests in loans and loan participations or other receivables. These investments may include standby financing commitments, including revolving credit facilities, which obligate the fund to supply additional cash to the borrower on demand. Loan participations involve a risk of insolvency of the lending bank or other financial intermediary.
Indemnifications – Under the fund’s organizational documents, its officers and Trustees may be indemnified against certain liabilities and expenses arising out of the performance of their duties to the fund. Additionally, in the normal course of business, the fund enters into agreements with service providers that may contain indemnification clauses. The fund’s maximum exposure under these agreements is unknown as this would involve future claims that may be made against the fund that have not yet occurred.
Investment Transactions and Income – Investment transactions are recorded on the trade date. Interest income is recorded on the accrual basis. All premium and discount is amortized or accreted for financial statement purposes in accordance with U.S. generally accepted accounting principles. The fund earns certain fees in connection with its floating rate loan purchasing activities. These fees are in addition to interest payments earned and may include amendment fees, commitment fees, facility fees, consent fees, and prepayment fees. Commitment fees are recorded on an accrual basis as income in the accompanying financial statements. Dividends received in cash are recorded on the ex-dividend date. Certain dividends from foreign securities will be recorded when the fund is informed of the dividend if such information is obtained subsequent to the ex-dividend date. Dividend and interest payments received in additional securities are recorded on the ex-dividend or ex-interest date in an amount equal to the value of the security on such date. Debt obligations may be placed on non-accrual status or set to accrue at a rate of interest less than the contractual coupon when the collection of all or a portion of interest has become doubtful. Interest income for those debt obligations may be further reduced by the write-off of the related interest receivables when deemed uncollectible.
The fund may receive proceeds from litigation settlements. Any proceeds received from litigation involving portfolio holdings are reflected in the Statement of Operations in realized gain/loss if the security has been disposed of by the fund or in unrealized gain/loss if the security is still held by the fund. Any other proceeds from litigation not related to portfolio holdings are reflected as other income in the Statement of Operations.
Fees Paid Indirectly – The fund’s custody fee may be reduced according to an arrangement that measures the value of cash deposited with the custodian by the fund. This amount, for the year ended December 31, 2012, is shown as a reduction of total expenses in the Statement of Operations.
Tax Matters and Distributions – The fund intends to qualify as a regulated investment company, as defined under Subchapter M of the Internal Revenue Code, and to distribute all of its taxable income, including realized capital gains. As a result, no provision for federal income tax is required. The fund’s federal tax returns, when filed, will remain subject to examination by the Internal Revenue Service for a three year period.
Distributions to shareholders are recorded on the ex-dividend date. Income and capital gain distributions are determined in accordance with income tax regulations, which may differ from U.S. generally accepted accounting principles. Certain capital accounts in the financial statements are periodically adjusted for permanent differences in order to reflect their tax character. These adjustments have no impact on net assets or net asset value per share. Temporary differences which arise from recognizing certain items of income, expense, gain or loss in different periods for financial statement and tax purposes will reverse at some time in the future. Distributions in excess of net investment income or net realized gains are temporary overdistributions for financial statement purposes resulting from differences in the recognition or classification of income or distributions for financial statement and tax purposes.
Book/tax differences primarily relate to amortization and accretion of debt securities, straddle loss deferrals, and derivative transactions.
The tax character of distributions declared to shareholders for the last two fiscal years is as follows:
| 12/31/12 | 12/31/11 | |||||||
| Ordinary income (including any short-term capital gains) | $2,700,006 | $2,837,428 | ||||||
27
Table of Contents
MFS Strategic Income Portfolio
Notes to Financial Statements – continued
The federal tax cost and the tax basis components of distributable earnings were as follows:
| As of 12/31/12 | ||||
| Cost of investments | $48,323,079 | |||
| Gross appreciation | 3,937,021 | |||
| Gross depreciation | (822,925 | ) | ||
| Net unrealized appreciation (depreciation) | $3,114,096 | |||
| Undistributed ordinary income | 2,369,780 | |||
| Capital loss carryforwards | (3,537,974 | ) | ||
| Other temporary differences | (290,067 | ) |
Under the Regulated Investment Company Modernization Act of 2010 (the “Act”), net capital losses recognized after December 31, 2010 may be carried forward indefinitely, and their character is retained as short-term and/or long-term losses. Previously, net capital losses were carried forward for eight years and treated as short-term losses. As a transition rule, the Act requires that post-enactment net capital losses be used before pre-enactment net capital losses.
As of December 31, 2012, the fund had capital loss carryforwards available to offset future realized gains. Such losses expire as follows:
| Pre-enactment losses: | ||||
| 12/31/16 | $(1,895,956 | ) | ||
| 12/31/17 | (1,642,018 | ) | ||
| Total | $(3,537,974 | ) | ||
Multiple Classes of Shares of Beneficial Interest – The fund offers multiple classes of shares, which differ in their respective distribution and/or service fees. The fund’s income, realized and unrealized gain (loss), and common expenses are allocated to shareholders based on the daily net assets of each class. Dividends are declared separately for each class. Differences in per share dividend rates are generally due to differences in separate class expenses. The fund’s distributions declared to shareholders as reported in the Statements of Changes in Net Assets are presented by class as follows:
| From net investment income | ||||||||
| Year ended 12/31/12 | Year ended 12/31/11 | |||||||
| Initial Class | $2,206,430 | $2,246,632 | ||||||
| Service Class | 493,576 | 590,796 | ||||||
| Total | $2,700,006 | $2,837,428 | ||||||
| (3) | Transactions with Affiliates |
Investment Adviser – The fund has an investment advisory agreement with MFS to provide overall investment management and related administrative services and facilities to the fund. The management fee is computed daily and paid monthly at the following annual rates:
| First $1 billion of average daily net assets | 0.70% | |||
| Average daily net assets in excess of $1 billion | 0.65% |
The management fee incurred for the year ended December 31, 2012 was equivalent to an annual effective rate of 0.70% of the fund’s average daily net assets.
The investment adviser has agreed in writing to pay a portion of the fund’s total annual operating expenses, exclusive of interest, taxes, extraordinary expenses, brokerage and transaction costs, and investment-related expenses, such that total annual operating expenses do not exceed 0.90% of average daily net assets for the Initial Class shares and 1.15% of average daily net assets for the Service Class shares. This written agreement will continue until modified by the fund’s Board of Trustees, but such agreement will continue at least until April 30, 2014. For the year ended December 31, 2012, this reduction amounted to $60,752 and is reflected as a reduction of total expenses in the Statement of Operations.
Distributor – MFS Fund Distributors, Inc. (MFD), a wholly-owned subsidiary of MFS, is the distributor of shares of the fund. The Trustees have adopted a distribution plan for the Service Class shares pursuant to Rule 12b-1 under the Investment Company Act of 1940.
The fund’s distribution plan provides that the fund will pay MFD distribution and/or service fees equal to 0.25% per annum of its average daily net assets attributable to Service Class shares as partial consideration for services performed and expenses incurred by MFD and financial intermediaries (including participating insurance companies that invest in the fund to fund variable annuity and
28
Table of Contents
MFS Strategic Income Portfolio
Notes to Financial Statements – continued
variable life insurance contracts, sponsors of qualified retirement and pension plans that invest in the fund, and affiliates of these participating insurance companies and plan sponsors) in connection with the sale and distribution of the Service Class shares. MFD may subsequently pay all, or a portion, of the distribution and/or service fees to financial intermediaries.
Shareholder Servicing Agent – MFS Service Center, Inc. (MFSC), a wholly-owned subsidiary of MFS, has contracted to provide transfer agent and recordkeeping functions in connection with the issuance, transfer, and redemption of each class of shares of the fund under a Shareholder Servicing Agent Agreement. During the year ended December 31, 2012, the fund did not pay MFSC a fee for this service. Effective April 1, 2013, the fund will be charged a shareholder servicing fee by MFSC.
Administrator – MFS provides certain financial, legal, shareholder communications, compliance, and other administrative services to the fund. Under an administrative services agreement, the fund partially reimburses MFS the costs incurred to provide these services. The fund is charged an annual fixed amount of $17,500 plus a fee based on average daily net assets. The administrative services fee incurred for the year ended December 31, 2012 was equivalent to an annual effective rate of 0.0347% of the fund’s average daily net assets.
Trustees’ and Officers’ Compensation – The fund pays compensation to independent Trustees in the form of a retainer, attendance fees, and additional compensation to Board and Committee chairpersons. The fund does not pay compensation directly to Trustees or officers of the fund who are also officers of the investment adviser, all of whom receive remuneration for their services to the fund from MFS. Certain officers and Trustees of the fund are officers or directors of MFS, MFD, and MFSC.
Other – This fund and certain other funds managed by MFS (the funds) have entered into services agreements (the Agreements) which provide for payment of fees by the funds to Tarantino LLC and Griffin Compliance LLC in return for the provision of services of an Independent Chief Compliance Officer (ICCO) and Assistant ICCO, respectively, for the funds. The ICCO and Assistant ICCO are officers of the funds and the sole members of Tarantino LLC and Griffin Compliance LLC, respectively. The funds can terminate the Agreements with Tarantino LLC and Griffin Compliance LLC at any time under the terms of the Agreements. For the year ended December 31, 2012, the aggregate fees paid by the fund to Tarantino LLC and Griffin Compliance LLC were $413 and are included in “Miscellaneous” expense in the Statement of Operations. MFS has agreed to reimburse the fund for a portion of the payments made by the fund in the amount of $178, which is shown as a reduction of total expenses in the Statement of Operations. Additionally, MFS has agreed to bear all expenses associated with office space, other administrative support, and supplies provided to the ICCO and Assistant ICCO.
The fund invests in the MFS Institutional Money Market Portfolio which is managed by MFS and seeks current income consistent with preservation of capital and liquidity. Income earned on this investment is included in “Dividends from underlying affiliated funds” in the Statement of Operations. This money market fund does not pay a management fee to MFS.
| (4) | Portfolio Securities |
Purchases and sales of investments, other than short-term obligations, were as follows:
| Purchases | Sales | |||||||
| U.S. Government securities | $— | $25,403 | ||||||
| Investments (non-U.S. Government securities) | $21,213,396 | $19,148,405 | ||||||
| (5) | Shares of Beneficial Interest |
The fund’s Declaration of Trust permits the Trustees to issue an unlimited number of full and fractional shares of beneficial interest. Transactions in fund shares were as follows:
| Year ended 12/31/12 | Year ended 12/31/11 | |||||||||||||||
| Shares | Amount | Shares | Amount | |||||||||||||
| Shares sold | ||||||||||||||||
Initial Class | 526,863 | $5,329,625 | 372,136 | $3,704,937 | ||||||||||||
Service Class | 92,471 | 932,095 | 167,680 | 1,662,734 | ||||||||||||
| 619,334 | $6,261,720 | 539,816 | $5,367,671 | |||||||||||||
| Shares issued to shareholders in reinvestment of distributions | ||||||||||||||||
Initial Class | 223,776 | $2,206,430 | 232,812 | $2,246,632 | ||||||||||||
Service Class | 50,314 | 493,576 | 61,541 | 590,796 | ||||||||||||
| 274,090 | $2,700,006 | 294,353 | $2,837,428 | |||||||||||||
29
Table of Contents
MFS Strategic Income Portfolio
Notes to Financial Statements – continued
| Year ended 12/31/12 | Year ended 12/31/11 | |||||||||||||||
| Shares | Amount | Shares | Amount | |||||||||||||
| Shares reacquired | ||||||||||||||||
Initial Class | (436,307 | ) | $(4,403,488 | ) | (790,674 | ) | $(7,873,245 | ) | ||||||||
Service Class | (338,688 | ) | (3,377,399 | ) | (273,071 | ) | (2,696,748 | ) | ||||||||
| (774,995 | ) | $(7,780,887 | ) | (1,063,745 | ) | $(10,569,993 | ) | |||||||||
| Net change | ||||||||||||||||
Initial Class | 314,332 | $3,132,567 | (185,726 | ) | $(1,921,676 | ) | ||||||||||
Service Class | (195,903 | ) | (1,951,728 | ) | (43,850 | ) | (443,218 | ) | ||||||||
| 118,429 | $1,180,839 | (229,576 | ) | $(2,364,894 | ) | |||||||||||
| (6) | Line of Credit |
The fund and certain other funds managed by MFS participate in a $1.1 billion unsecured committed line of credit, subject to a $1 billion sublimit, provided by a syndication of banks under a credit agreement. Borrowings may be made for temporary financing needs. Interest is charged to each fund, based on its borrowings, generally at a rate equal to the higher of the Federal Reserve funds rate or one month LIBOR plus an agreed upon spread. A commitment fee, based on the average daily, unused portion of the committed line of credit, is allocated among the participating funds at the end of each calendar quarter. In addition, the fund and other funds managed by MFS have established unsecured uncommitted borrowing arrangements with certain banks for temporary financing needs. Interest is charged to each fund, based on its borrowings, at a rate equal to the Federal Reserve funds rate plus an agreed upon spread. For the year ended December 31, 2012, the fund’s commitment fee and interest expense were $319 and $0, respectively, and are included in “Miscellaneous” expense in the Statement of Operations.
| (7) | Transactions in Underlying Affiliated Funds – Affiliated Issuers |
An affiliated issuer may be considered one in which the fund owns 5% or more of the outstanding voting securities, or a company which is under common control. For the purposes of this report, the fund assumes the following to be an affiliated issuer:
| Underlying Affiliated Fund | Beginning Shares/Par Amount | Acquisitions Shares/Par Amount | Dispositions Shares/Par Amount | Ending Shares/Par Amount | ||||||||||||
| MFS Institutional Money Market Portfolio | 2,545,148 | 14,696,449 | (16,344,433 | ) | 897,164 | |||||||||||
| Underlying Affiliated Fund | Realized Gain (Loss) | Capital Gain Distributions | Dividend Income | Ending Value | ||||||||||||
| MFS Institutional Money Market Portfolio | $— | $— | $2,851 | $897,164 | ||||||||||||
30
Table of Contents
MFS Strategic Income Portfolio
REPORT OF INDEPENDENT REGISTERED PUBLIC ACCOUNTING FIRM
To the Board of Trustees of MFS Variable Insurance Trust II and the Shareholders of
MFS Strategic Income Portfolio:
We have audited the accompanying statement of assets and liabilities, including the portfolio of investments, of MFS Strategic Income Portfolio (the “Fund”) (one of the series comprising MFS Variable Insurance Trust II) as of December 31, 2012, and the related statement of operations for the year then ended, the statements of changes in net assets for each of the two years in the period then ended, and the financial highlights for each of the five years in the period then ended. These financial statements and financial highlights are the responsibility of the Fund’s management. Our responsibility is to express an opinion on these financial statements and financial highlights based on our audits.
We conducted our audits in accordance with the standards of the Public Company Accounting Oversight Board (United States). Those standards require that we plan and perform the audit to obtain reasonable assurance about whether the financial statements and financial highlights are free of material misstatement. The Fund is not required to have, nor were we engaged to perform, an audit of its internal control over financial reporting. Our audits included consideration of internal control over financial reporting as a basis for designing audit procedures that are appropriate in the circumstances, but not for the purpose of expressing an opinion on the effectiveness of the Fund’s internal control over financial reporting. Accordingly, we express no such opinion. An audit also includes examining, on a test basis, evidence supporting the amounts and disclosures in the financial statements, assessing the accounting principles used and significant estimates made by management, as well as evaluating the overall financial statement presentation. Our procedures included confirmation of securities owned as of December 31, 2012, by correspondence with the custodian and brokers; where replies were not received from brokers, we performed other auditing procedures. We believe that our audits provide a reasonable basis for our opinion.
In our opinion, the financial statements and financial highlights referred to above present fairly, in all material respects, the financial position of MFS Strategic Income Portfolio as of December 31, 2012, the results of its operations for the year then ended, the changes in its net assets for each of the two years in the period then ended, and the financial highlights for each of the five years in the period then ended, in conformity with accounting principles generally accepted in the United States of America.
DELOITTE & TOUCHE LLP
Boston, Massachusetts
February 15, 2013
31
Table of Contents
MFS Strategic Income Portfolio
TRUSTEES AND OFFICERS – IDENTIFICATION AND BACKGROUND
The Trustees and officers of the Trust, as of February 1, 2013, are listed below, together with their principal occupations during the past five years. (Their titles may have varied during that period.) The address of each Trustee and officer is 111 Huntington Avenue, Boston, Massachusetts 02199-7618.
Name, Age | Position(s) with Fund | Trustee/Officer Since (h) | Principal Occupations During the Past Five Years | Other Directorships (j) | ||||
| INTERESTED TRUSTEES | ||||||||
Robert J. Manning (k) (age 49) | Trustee | February 2004 | Massachusetts Financial Services Company, Chairman, Chief Executive Officer and Director; President (until December 2009); Chief Investment Officer (until July 2010) | N/A | ||||
| INDEPENDENT TRUSTEES | ||||||||
David H. Gunning (age 70) | Trustee and Chair of Trustees | January 2004 | Private investor | Lincoln Electric Holdings, Inc. (welding equipment manufacturer), Director; Development Alternatives, Inc. (consulting), Director/Non-Executive Chairman; Portman Limited (mining), Director (until 2008) | ||||
Robert E. Butler (age 71) | Trustee | January 2006 | Consultant – investment company industry regulatory and compliance matters | N/A | ||||
Maureen R. Goldfarb (age 57) | Trustee | January 2009 | Private investor | N/A | ||||
William R. Gutow (age 71) | Trustee | December 1993 | Private investor and real estate consultant; Capitol Entertainment Management Company (video franchise), Vice Chairman | Atlantic Coast Tan (tanning salons), Vice Chairman (until 2007); Texas Donuts (donut franchise), Vice Chairman (until 2010) | ||||
Michael Hegarty (age 68) | Trustee | December 2004 | Private investor; Rouse Properties Inc. (real estate), Director | N/A | ||||
John P. Kavanaugh (age 58) | Trustee | January 2009 | Private investor | N/A | ||||
J. Dale Sherratt (age 74) | Trustee | June 1989 | Insight Resources, Inc. (acquisition planning specialists), President; Wellfleet Investments (investor in health care companies), Managing General Partner | N/A | ||||
| Laurie J. Thomsen (age 55) | Trustee | March 2005 | Private investor; New Profit, Inc. (venture philanthropy), Executive Partner (until 2010) | The Travelers Companies (insurance), Director | ||||
Robert W. Uek (age 71) | Trustee | January 2006 | Consultant to investment company industry | N/A | ||||
| OFFICERS | ||||||||
John M. Corcoran (k) (age 47) | President | October 2008 | Massachusetts Financial Services Company, Senior Vice President (since October 2008); State Street Bank and Trust (financial services provider), Senior Vice President, (until September 2008) | N/A | ||||
| Christopher R. Bohane (k) (age 39) | Assistant Secretary and Assistant Clerk | July 2005 | Massachusetts Financial Services Company, Vice President and Senior Counsel | N/A | ||||
Kino Clark (k) (age 44) | Assistant Treasurer | January 2012 | Massachusetts Financial Services Company, Vice President | N/A | ||||
Thomas H. Connors (k) (age 53) | Assistant Secretary and Assistant Clerk | September 2012 | Massachusetts Financial Services Company, Vice President and Senior Counsel; Deutsche Investment Management Americas Inc. (financial service provider), Director and Senior Counsel (until 2012) | N/A | ||||
Ethan D. Corey (k) (age 49) | Assistant Secretary and Assistant Clerk | July 2005 | Massachusetts Financial Services Company, Senior Vice President and Associate General Counsel | N/A | ||||
32
Table of Contents
MFS Strategic Income Portfolio
Trustees and Officers – continued
Name, Age | Position(s) with Fund | Trustee/Officer Since (h) | Principal Occupations During the Past Five Years | Other Directorships (j) | ||||
David L. DiLorenzo (k) (age 44) | Treasurer | July 2005 | Massachusetts Financial Services Company, Senior Vice President | N/A | ||||
Robyn L. Griffin (age 37) | Assistant Independent Chief Compliance Officer | August 2008 | Griffin Compliance LLC (provider of compliance services), Principal (since August 2008); State Street Corporation (financial services provider), Mutual Fund Administration Assistant Vice President (October 2006 – July 2008) | N/A | ||||
Brian E. Langenfeld (k) (age 39) | Assistant Secretary and Assistant Clerk | June 2006 | Massachusetts Financial Services Company, Vice President and Senior Counsel | N/A | ||||
Susan S. Newton (k) (age 62) | Assistant Secretary and Assistant Clerk | May 2005 | Massachusetts Financial Services Company, Senior Vice President and Associate General Counsel | N/A | ||||
Susan A. Pereira (k) (age 42) | Assistant Secretary and Assistant Clerk | July 2005 | Massachusetts Financial Services Company, Vice President and Senior Counsel | N/A | ||||
Kasey L. Phillips (k) (age 42) | Assistant Treasurer | September 2012 | Massachusetts Financial Services Company, Vice President; Wells Fargo Funds Management, LLC, Senior Vice President, Fund Treasurer (until 2012) | N/A | ||||
Mark N. Polebaum (k) (age 60) | Secretary and Clerk | January 2006 | Massachusetts Financial Services Company, Executive Vice President, General Counsel and Secretary | N/A | ||||
Frank L. Tarantino (age 68) | Independent Chief Compliance Officer | June 2004 | Tarantino LLC (provider of compliance services), Principal | N/A | ||||
Richard S. Weitzel (k) (age 42) | Assistant Secretary and Assistant Clerk | October 2007 | Massachusetts Financial Services Company, Senior Vice President and Associate General Counsel | N/A | ||||
James O. Yost (k) (age 52) | Deputy Treasurer | September 1990 | Massachusetts Financial Services Company, Senior Vice President | N/A | ||||
| (h) | Date first appointed to serve as Trustee/officer of an MFS fund. Each Trustee has served continuously since appointment unless indicated otherwise. For the period from December 15, 2004 until February 22, 2005, Mr. Manning served as Advisory Trustee. For the period October 2008, until January 2012, Mr. Corcoran served as Treasurer of the Funds. Prior to January 2012, Messrs. DiLorenzo and Yost served as Assistant Treasurers of the Funds. |
| (j) | Directorships or trusteeships of companies required to report to the Securities and Exchange Commission (i.e., “public companies”). |
| (k) | “Interested person” of the Trust within the meaning of the Investment Company Act of 1940 (referred to as the 1940 Act), which is the principal federal law governing investment companies like the fund, as a result of position with MFS. The address of MFS is 111 Huntington Avenue, Boston, Massachusetts 02199-7618. |
Each Trustee has been elected by shareholders and each Trustee and officer holds office until his or her successor is chosen and qualified or until his or her earlier death, resignation, retirement or removal. The Trust does not hold annual meetings for the purpose of electing Trustees, and Trustees are not elected for fixed terms. Messrs. Butler, Kavanaugh, Uek and Ms. Thomsen are members of the Trust’s Audit Committee.
Each of the Fund’s Trustees and officers holds comparable positions with certain other funds of which MFS or a subsidiary is the investment adviser or distributor, and, in the case of the officers, with certain affiliates of MFS. As of January 1, 2013, the Trustees served as board members of 143 funds within the MFS Family of Funds.
33
Table of Contents
MFS Strategic Income Portfolio
Trustees and Officers – continued
The Statement of Additional Information for the Fund includes further information about the Trustees and is available without charge upon request by calling 1-800-225-2606.
Investment Adviser Massachusetts Financial Services Company 111 Huntington Avenue Boston, MA 02199-7618 | Custodian State Street Bank and Trust 1 Lincoln Street Boston, MA 02111-2900 | |
Distributor MFS Fund Distributors, Inc. 111 Huntington Avenue Boston, MA 02199-7618 | Independent Registered Public Accounting Firm Deloitte & Touche LLP 200 Berkeley Street Boston, MA 02116 | |
Portfolio Managers William Adams James Calmas David Cole Robert Persons Matthew Ryan Erik Weisman |
34
Table of Contents
MFS Strategic Income Portfolio
BOARD REVIEW OF INVESTMENT ADVISORY AGREEMENT
A discussion regarding the Board’s most recent approval of the fund’s Investment Advisory Agreement with MFS is available by clicking on the fund’s name under “Variable Insurance Portfolios – VIT II” in the “Products” section of the MFS Web site (mfs.com).
PROXY VOTING POLICIES AND INFORMATION
A general description of the MFS funds’ proxy voting policies and procedures is available without charge, upon request, by calling 1-800-225-2606, by visiting the Proxy Voting section of mfs.com or by visiting the SEC’s Web site at http://www.sec.gov.
Information regarding how the fund voted proxies relating to portfolio securities during the most recent twelve-month period ended June 30 is available without charge by visiting the Proxy Voting section of mfs.com or by visiting the SEC’s Web site at http://www.sec.gov.
QUARTERLY PORTFOLIO DISCLOSURE
The fund will file a complete schedule of portfolio holdings with the Securities and Exchange Commission (the Commission) for the first and third quarters of each fiscal year on Form N-Q. The fund’s Form N-Q is available on the EDGAR database on the Commission’s Internet Web site at http://www.sec.gov, and may be reviewed and copied at the:
Public Reference Room
Securities and Exchange Commission
100 F Street, NE, Room 1580
Washington, D.C. 20549
Information on the operation of the Public Reference Room may be obtained by calling the Commission at 1-800-SEC-0330. Copies of the fund’s Form N-Q also may be obtained, upon payment of a duplicating fee, by electronic request at the following e-mail address: publicinfo@sec.gov or by writing the Public Reference Section at the above address.
From time to time, MFS may post important information about the fund or the MFS funds on the MFS web site (mfs.com). This information is available by visiting the “News & Commentary” section of mfs.com or by clicking on the fund’s name under “Variable Insurance Portfolios – VIT II” in the “Products” section of mfs.com.
35
Table of Contents
rev. 3/11

| Why? | Financial companies choose how they share your personal information. Federal law gives consumers the right to limit some but not all sharing. Federal law also requires us to tell you how we collect, share, and protect your personal information. Please read this notice carefully to understand what we do. |
| What? | The types of personal information we collect and share depend on the product or service you have with us. This information can include:
• Social Security number and account balances • Account transactions and transaction history • Checking account information and wire transfer instructions
When you are no longer our customer, we continue to share your information as described in this notice. |
| How? | All financial companies need to share customers’ personal information to run their everyday business. In the section below, we list the reasons financial companies can share their customers’ personal information; the reasons MFS chooses to share; and whether you can limit this sharing. |
| Reasons we can share your personal information | Does MFS share? | Can you limit this sharing? | ||
For our everyday business purposes – such as to process your transactions, maintain your account(s), respond to court orders and legal investigations, or report to credit bureaus | Yes | No | ||
For our marketing purposes – to offer our products and services to you | No | We don’t share | ||
| For joint marketing with other financial companies | No | We don’t share | ||
For our affiliates’ everyday business purposes – information about your transactions and experiences | No | We don’t share | ||
For our affiliates’ everyday business purposes – information about your creditworthiness | No | We don’t share | ||
| For nonaffiliates to market to you | No | We don’t share |
| Questions? | Call 800-225-2606 or go to mfs.com. |
36
Table of Contents
| Page 2 |
| Who we are | ||
| Who is providing this notice? | MFS Funds, MFS Investment Management, MFS Institutional Advisors, Inc., MFS Fund Distributors, Inc., MFS Heritage Trust Company, and MFS Service Center, Inc. | |
| What we do | ||
| How does MFS protect my personal information? | To protect your personal information from unauthorized access and use, we use security measures that comply with federal law. These measures include procedural, electronic, and physical safeguards for the protection of the personal information we collect about you. | |
| How does MFS collect my personal information? | We collect your personal information, for example, when you
• open an account or provide account information • direct us to buy securities or direct us to sell your securities • make a wire transfer
We also collect your personal information from others, such as credit bureaus, affiliates and other companies. | |
| Why can’t I limit all sharing? | Federal law gives you the right to limit only
• sharing for affiliates’ everyday business purposes – information about your creditworthiness • affiliates from using your information to market to you • sharing for nonaffiliates to market to you
State laws and individual companies may give you additional rights to limit sharing. | |
| Definitions | ||
| Affiliates | Companies related by common ownership or control. They can be financial and nonfinancial companies.
•MFS does not share personal information with affiliates, except for everyday business purposes as described on page one of this notice. | |
| Nonaffiliates | Companies not related by common ownership or control. They can be financial and nonfinancial companies.
•MFS does not share with nonaffiliates so they can market to you. | |
| Joint Marketing | A formal agreement between nonaffiliated financial companies that together market financial products or services to you.
•MFS doesn’t jointly market. | |
| Other important information | ||
| If you own an MFS product or receive an MFS service in the name of a third party such as a bank or broker-dealer, their privacy policy may apply to you instead of ours. | ||
37
Table of Contents
Table of Contents
| ITEM 2. | CODE OF ETHICS. |
The Registrant has adopted a Code of Ethics pursuant to Section 406 of the Sarbanes-Oxley Act and as defined in Form N-CSR that applies to the Registrant’s principal executive officer and principal financial and accounting officer. During the period covered by this report, the Registrant has not amended any provision in its Code of Ethics (the “Code”) that relates to an element of the Code’s definitions enumerated in paragraph (b) of Item 2 of this Form N-CSR. During the period covered by this report, the Registrant did not grant a waiver, including an implicit waiver, from any provision of the Code.
A copy of the Code of Ethics is filed as an exhibit to this Form N-CSR.
| ITEM 3. | AUDIT COMMITTEE FINANCIAL EXPERT. |
For the reporting period ended December 31, 2012, Messrs. J. Kermit Birchfield, Robert C. Bishop, and Haviland Wright, members of the Audit Committee, have been determined by the Board of Trustees in their reasonable business judgment to meet the definition of “audit committee financial expert” as such term is defined in Form N-CSR. In addition, Messrs. J. Kermit Birchfield, Robert C. Bishop, and Haviland Wright are “independent” members of the Audit Committee as defined in Form N-CSR.
Effective January 1, 2012, Messrs. Robert E. Butler, John P. Kavanaugh and Robert W. Uek and Ms. Laurie J. Thomsen, members of the Audit Committee, have been determined by the Board of Trustees in their reasonable business judgment to meet the definition of “audit committee financial expert” as such term is defined in Form N-CSR. In addition, Messrs. Butler, Kavanaugh and Uek and Ms. Thomsen are “independent” members of the Audit Committee (as such term has been defined by the Securities and Exchange Commission in regulations implementing Section 407 of the Sarbanes-Oxley Act of 2002). The Securities and Exchange Commission has stated that the designation of a person as an audit committee financial expert pursuant to this Item 3 on the Form N-CSR does not impose on such a person any duties, obligations or liability that are greater than the duties, obligations or liability imposed on such person as a member of the Audit Committee and the Board of Trustees in the absence of such designation or identification.
Table of Contents
| ITEM 4. | PRINCIPAL ACCOUNTANT FEES AND SERVICES. |
Items 4(a) through 4(d) and 4(g):
The Board of Trustees has appointed Deloitte & Touche LLP (“Deloitte”) to serve as independent accountants to each series of the Registrant (collectively, the “Funds”). The tables below set forth the audit fees billed to the Funds as well as fees for non-audit services provided to the Funds and/or to the Funds’ investment adviser, Massachusetts Financial Services Company (“MFS”) and to various entities either controlling, controlled by, or under common control with MFS that provide ongoing services to the Funds (“MFS Related Entities”).
For the fiscal years ended December 31, 2012 and 2011, audit fees billed to the Funds by Deloitte were as follows:
| Audit Fees | ||||||||
| 2012 | 2011 | |||||||
Fees billed by Deloitte: | ||||||||
MFS Blended Research Core Equity Portfolio | 40,688 | 39,101 | ||||||
MFS Blended Research Growth Portfolio+ | 0 | 37,176 | ||||||
MFS Blended Research Value Portfolio+ | 0 | 37,176 | ||||||
MFS Bond Portfolio | 56,660 | 54,563 | ||||||
MFS Core Equity Portfolio | 42,569 | 41,001 | ||||||
MFS Growth Portfolio++ | 0 | 39,732 | ||||||
MFS Emerging Markets Equity Portfolio | 42,887 | 41,217 | ||||||
MFS Global Governments Portfolio | 54,443 | 52,429 | ||||||
MFS Global Growth Portfolio | 52,417 | 50,389 | ||||||
MFS Global Tactical Allocation Portfolio | 52,417 | 50,389 | ||||||
MFS Government Securities Portfolio | 46,381 | 44,670 | ||||||
MFS High Yield Portfolio | 59,931 | 57,711 | ||||||
MFS International Growth Portfolio | 42,887 | 41,217 | ||||||
MFS International Value Portfolio | 43,620 | 41,923 | ||||||
MFS Massachusetts Investors Growth Stock Portfolio | 42,569 | 41,001 | ||||||
MFS Mid Cap Growth Portfolio++ | 0 | 39,026 | ||||||
MFS Money Market Portfolio | 25,125 | 24,212 | ||||||
MFS New Discovery Portfolio | 40,517 | 39,026 | ||||||
MFS Research International Portfolio | 40,688 | 39,101 | ||||||
MFS Global Research Portfolio | 41,422 | 39,807 | ||||||
MFS Strategic Income Portfolio | 59,681 | 57,471 | ||||||
MFS Technology Portfolio | 40,688 | 39,101 | ||||||
MFS Total Return Portfolio | 54,443 | 52,429 | ||||||
MFS Utilities Portfolio | 40,517 | 39,026 | ||||||
MFS Value Portfolio | 40,517 | 39,026 | ||||||
Total | 961,067 | 1,077,920 | ||||||
Table of Contents
For the fiscal years ended December 31, 2012 and 2011, fees billed by Deloitte for audit-related, tax and other services provided to the Funds and for audit-related, tax and other services provided to MFS and MFS Related Entities were as follows:
| Audit-Related Fees1 | Tax Fees2 | All Other Fees3 | ||||||||||||||||||||||
| 2012 | 2011 | 2012 | 2011 | 2012 | 2011 | |||||||||||||||||||
Fees billed by Deloitte: | ||||||||||||||||||||||||
To MFS Blended Research Core Equity Portfolio | 2,400 | 2,400 | 4,582 | 4,410 | 845 | 1,331 | ||||||||||||||||||
To MFS Blended Research Growth Portfolio+ | 600 | 2,400 | 2,390 | 5,107 | 845 | 1,331 | ||||||||||||||||||
To MFS Blended Research Value Portfolio+ | 600 | 2,400 | 2,390 | 5,107 | 845 | 1,331 | ||||||||||||||||||
To MFS Bond Portfolio | 0 | 0 | 4,582 | 4,410 | 845 | 1,331 | ||||||||||||||||||
To MFS Core Equity Portfolio | 0 | 0 | 4,582 | 4,410 | 845 | 1,331 | ||||||||||||||||||
To MFS Growth Portfolio++ | 2,500 | 0 | 2,390 | 4,410 | 845 | 1,331 | ||||||||||||||||||
To MFS Emerging Markets Equity Portfolio | 2,400 | 2,400 | 4,582 | 4,410 | 845 | 1,331 | ||||||||||||||||||
To MFS Global Governments Portfolio | 0 | 0 | 4,582 | 4,410 | 845 | 1,331 | ||||||||||||||||||
To MFS Global Growth Portfolio | 2,400 | 2,400 | 4,582 | 4,410 | 845 | 1,331 | ||||||||||||||||||
To MFS Global Tactical Allocation Portfolio | 2,400 | 2,400 | 4,582 | 4,410 | 845 | 1,331 | ||||||||||||||||||
To MFS Government Securities Portfolio | 0 | 0 | 4,582 | 4,410 | 845 | 1,331 | ||||||||||||||||||
To MFS High Yield Portfolio | 2,050 | 0 | 4,582 | 4,410 | 845 | 1,331 | ||||||||||||||||||
To MFS International Growth Portfolio | 2,400 | 2,400 | 4,582 | 4,410 | 845 | 1,331 | ||||||||||||||||||
To MFS International Value Portfolio | 2,400 | 2,400 | 4,582 | 4,410 | 845 | 1,331 | ||||||||||||||||||
To MFS Massachusetts Investors Growth Stock Portfolio | 0 | 0 | 4,582 | 4,410 | 845 | 1,331 | ||||||||||||||||||
To MFS Mid Cap Growth Portfolio++ | 2,500 | 0 | 2,390 | 4,410 | 845 | 1,331 | ||||||||||||||||||
To MFS Money Market Portfolio | 0 | 0 | 4,582 | 4,410 | 845 | 1,331 | ||||||||||||||||||
To MFS New Discovery Portfolio | 0 | 0 | 4,582 | 4,410 | 845 | 1,331 | ||||||||||||||||||
To MFS Research International Portfolio | 2,400 | 2,400 | 4,582 | 4,410 | 845 | 1,331 | ||||||||||||||||||
To MFS Global Research Portfolio | 2,400 | 2,400 | 4,582 | 4,410 | 845 | 1,331 | ||||||||||||||||||
Table of Contents
To MFS Strategic Income Portfolio | 0 | 0 | 4,582 | 4,410 | 845 | 1,331 | ||||||||||||||||||
To MFS Technology Portfolio | 2,400 | 2,400 | 4,582 | 4,410 | 845 | 1,331 | ||||||||||||||||||
To MFS Total Return Portfolio | 0 | 0 | 4,581 | 4,409 | 845 | 1,331 | ||||||||||||||||||
To MFS Utilities Portfolio | 0 | 0 | 4,581 | 4,409 | 845 | 1,331 | ||||||||||||||||||
To MFS Value Portfolio | 0 | 0 | 4,581 | 4,409 | 845 | 1,331 | ||||||||||||||||||
Total fees billed by Deloitte To above Funds: | 29,850 | 26,400 | 105,779 | 111,641 | 21,125 | 33,325 |
| Audit-Related Fees1 | Tax Fees2 | All Other Fees3 | ||||||||||||||||||||||
| 2012 | 2011 | 2012 | 2011 | 2012 | 2011 | |||||||||||||||||||
Fees billed by Deloitte: | ||||||||||||||||||||||||
To MFS and MFS Related Entities of MFS Blended Research Core Equity Portfolio* | 1,135,274 | 1,265,664 | 0 | 0 | 0 | 53,100 | ||||||||||||||||||
To MFS and MFS Related Entities of MFS Blended Research Growth Portfolio*+ | 1,135,274 | 1,265,664 | 0 | 0 | 0 | 53,100 | ||||||||||||||||||
To MFS and MFS Related Entities of MFS Blended Research Value Portfolio*+ | 1,135,274 | 1,265,664 | 0 | 0 | 0 | 53,100 | ||||||||||||||||||
To MFS and MFS Related Entities of MFS Bond Portfolio* | 1,135,274 | 1,265,664 | 0 | 0 | 0 | 53,100 | ||||||||||||||||||
To MFS and MFS Related Entities of MFS Core Equity Portfolio* | 1,135,274 | 1,265,664 | 0 | 0 | 0 | 53,100 | ||||||||||||||||||
To MFS and MFS Related Entities of MFS Growth Portfolio*++ | 1,135,274 | 1,265,664 | 0 | 0 | 0 | 53,100 | ||||||||||||||||||
To MFS and MFS Related Entities of MFS Emerging Markets Equity Portfolio* | 1,135,274 | 1,265,664 | 0 | 0 | 0 | 53,100 | ||||||||||||||||||
To MFS and MFS Related Entities of MFS Global Governments Portfolio* | 1,135,274 | 1,265,664 | 0 | 0 | 0 | 53,100 | ||||||||||||||||||
To MFS and MFS Related Entities of MFS Global Growth Portfolio* | 1,135,274 | 1,265,664 | 0 | 0 | 0 | 53,100 | ||||||||||||||||||
To MFS Global Tactical Allocation, MFS and MFS Related Entities* | 1,135,274 | 1,265,664 | 0 | 0 | 0 | 53,100 | ||||||||||||||||||
To MFS and MFS Related Entities of MFS Government Securities Portfolio* | 1,135,274 | 1,265,664 | 0 | 0 | 0 | 53,100 | ||||||||||||||||||
Table of Contents
To MFS and MFS Related Entities of MFS High Yield Portfolio* | 1,135,274 | 1,265,664 | 0 | 0 | 0 | 53,100 | ||||||||||||||||||
To MFS and MFS Related Entities of MFS International Growth Portfolio* | 1,135,274 | 1,265,664 | 0 | 0 | 0 | 53,100 | ||||||||||||||||||
To MFS and MFS Related Entities of MFS International Value Portfolio* | 1,135,274 | 1,265,664 | 0 | 0 | 0 | 53,100 | ||||||||||||||||||
To MFS and MFS Related Entities of MFS Massachusetts Investors Growth Stock Portfolio* | 1,135,274 | 1,265,664 | 0 | 0 | 0 | 53,100 | ||||||||||||||||||
To MFS and MFS Related Entities of MFS Mid Cap Growth Portfolio*++ | 1,135,274 | 1,265,664 | 0 | 0 | 0 | 53,100 | ||||||||||||||||||
To MFS and MFS Related Entities of MFS Money Market Portfolio* | 1,135,274 | 1,265,664 | 0 | 0 | 0 | 53,100 | ||||||||||||||||||
To MFS and MFS Related Entities of MFS New Discovery Portfolio* | 1,135,274 | 1,265,664 | 0 | 0 | 0 | 53,100 | ||||||||||||||||||
To MFS and MFS Related Entities of MFS Research International Portfolio* | 1,135,274 | 1,265,664 | 0 | 0 | 0 | 53,100 | ||||||||||||||||||
To MFS and MFS Related Entities of MFS Global Research Portfolio* | 1,135,274 | 1,265,664 | 0 | 0 | 0 | 53,100 | ||||||||||||||||||
To MFS and MFS Related Entities of MFS Strategic Income Portfolio* | 1,135,274 | 1,265,664 | 0 | 0 | 0 | 53,100 | ||||||||||||||||||
To MFS and MFS Related Entities of MFS Technology Portfolio* | 1,135,274 | 1,265,664 | 0 | 0 | 0 | 53,100 | ||||||||||||||||||
To MFS and MFS Related Entities of MFS Total Return Portfolio* | 1,135,274 | 1,265,664 | 0 | 0 | 0 | 53,100 | ||||||||||||||||||
To MFS and MFS Related Entities of MFS Utilities Portfolio* | 1,135,274 | 1,265,664 | 0 | 0 | 0 | 53,100 | ||||||||||||||||||
To MFS and MFS Related Entities of MFS Value Portfolio* | 1,135,274 | 1,265,664 | 0 | 0 | 0 | 53,100 |
Table of Contents
| 2012 | 20114 | |||||||
Aggregate fees for non-audit services: | ||||||||
To MFS Blended Research Core Equity Portfolio, MFS and MFS Related Entities# | 1,366,171 | 1,646,120 | ||||||
To MFS Blended Research Growth Portfolio, MFS and MFS Related Entities#+ | 1,362,179 | 1,646,817 | ||||||
To MFS Blended Research Value Portfolio, MFS and MFS Related Entities#+ | 1,362,179 | 1,646,817 | ||||||
To MFS Bond Portfolio, MFS and MFS Related Entities# | 1,363,771 | 1,643,720 | ||||||
To MFS Core Equity Portfolio, MFS and MFS Related Entities# | 1,363,771 | 1,643,720 | ||||||
To MFS Growth Portfolio, MFS and MFS Related Entities#++ | 1,364,079 | 1,643,720 | ||||||
To MFS Emerging Markets Equity Portfolio, MFS and MFS Related Entities# | 1,366,171 | 1,646,120 | ||||||
To MFS Global Governments Portfolio, MFS and MFS Related Entities# | 1,363,771 | 1,643,720 | ||||||
To MFS Global Growth Portfolio MFS and MFS Related Entities# | 1,366,171 | 1,646,120 | ||||||
To MFS Global Tactical Allocation Portfolio, MFS and MFS Related Entities# | 1,366,171 | 1,646,120 | ||||||
To MFS Government Securities Portfolio, MFS and MFS Related Entities# | 1,363,771 | 1,643,720 | ||||||
To MFS High Yield Portfolio, MFS and MFS Related Entities# | 1,365,821 | 1,643,720 | ||||||
To MFS International Growth Portfolio, MFS and MFS Related Entities# | 1,366,171 | 1,646,120 | ||||||
To MFS International Value Portfolio, MFS and MFS Related Entities# | 1,366,171 | 1,646,120 | ||||||
To MFS Massachusetts Investors Growth Stock Portfolio, MFS and MFS Related Entities# | 1,363,771 | 1,643,720 | ||||||
Table of Contents
To MFS Mid Cap Growth Portfolio, MFS and MFS Related Entities#++ | 1,364,079 | 1,643,720 | ||||||
To MFS Money Market Portfolio, MFS and MFS Related Entities# | 1,363,771 | 1,643,720 | ||||||
To MFS New Discovery Portfolio, MFS and MFS Related Entities# | 1,363,771 | 1,643,720 | ||||||
To MFS Research International Portfolio, MFS and MFS Related Entities# | 1,366,171 | 1,646,120 | ||||||
To MFS Global Research Portfolio, MFS and MFS Related Entities# | 1,366,171 | 1,646,120 | ||||||
To MFS Strategic Income Portfolio, MFS and MFS Related Entities# | 1,363,771 | 1,643,720 | ||||||
To MFS Technology Portfolio, MFS and MFS Related Entities# | 1,366,171 | 1,646,120 | ||||||
To MFS Total Return Portfolio, MFS and MFS Related Entities# | 1,363,770 | 1,643,719 | ||||||
To MFS Utilities Portfolio, MFS and MFS Related Entities# | 1,363,770 | 1,643,719 | ||||||
To MFS Value Portfolio, MFS and MFS Related Entities# | 1,363,770 | 1,643,719 |
| + | MFS Blended Research Growth Portfolio and the MFS Blended Research Value Portfolio were terminated as series of the Registrant as of July 3, 2012. |
| ++ | MFS Growth Portfolio and the MFS Mid Cap Growth Portfolio were reorganized into the MFS Growth Series and MFS Mid Cap Growth Series, respectively, as of August 17, 2012, and were terminated as series of the Registrant effective August 22, 2012. |
| * | This amount reflects the fees billed to MFS and MFS Related Entities for non-audit services relating directly to the operations and financial reporting of the Funds (portions of which services also related to the operations and financial reporting of other funds within the MFS Funds complex). |
| # | This amount reflects the aggregate fees billed by Deloitte for non-audit services rendered to the Funds and for non-audit services rendered to MFS and the MFS Related Entities. |
| 1 | The fees included under “Audit-Related Fees” are fees related to assurance and related services that are reasonably related to the performance of the audit or review of financial statements, but not reported under ‘‘Audit Fees,’’ including accounting consultations, agreed-upon procedure reports, attestation reports, comfort letters and internal control reviews. |
| 2 | The fees included under “Tax Fees” are fees associated with tax compliance, tax advice and tax planning, including services relating to the filing or amendment of federal, state or local income tax returns, regulated investment company qualification reviews and tax distribution and analysis. |
Table of Contents
| 3 | The fees included under “All Other Fees” are fees for products and services provided by Deloitte other than those reported under “Audit Fees,” “Audit-Related Fees” and “Tax Fees,” including fees for services related to review of internal controls and review of Rule 38a-1 compliance program. |
| 4 | Deloitte fees reported in 2011 have been restated in this filing from those reported in the Registrant’s filing for the reporting period ended December 31, 2011. |
Item 4(e)(1):
Set forth below are the policies and procedures established by the Audit Committee of the Board of Trustees relating to the pre-approval of audit and non-audit related services:
To the extent required by applicable law, pre-approval by the Audit Committee of the Board is needed for all audit and permissible non-audit services rendered to the Funds and all permissible non-audit services rendered to MFS or MFS Related Entities if the services relate directly to the operations and financial reporting of the Registrant. Pre-approval is currently on an engagement-by-engagement basis. In the event pre-approval of such services is necessary between regular meetings of the Audit Committee and it is not practical to wait to seek pre-approval at the next regular meeting of the Audit Committee, pre-approval of such services may be referred to the Chair of the Audit Committee for approval; provided that the Chair may not pre-approve any individual engagement for such services exceeding $50,000 or multiple engagements for such services in the aggregate exceeding $100,000 in each period between regular meetings of the Audit Committee. Any engagement pre-approved by the Chair between regular meetings of the Audit Committee shall be presented for ratification by the entire Audit Committee at its next regularly scheduled meeting.
Item 4(e)(2):
None, or 0%, of the services relating to the Audit-Related Fees, Tax Fees and All Other Fees paid by the Fund and MFS and MFS Related Entities relating directly to the operations and financial reporting of the Registrant disclosed above were approved by the audit committee pursuant to paragraphs (c)(7)(i)(C) of Rule 2-01 of Regulation S-X (which permits audit committee approval after the start of the engagement with respect to services other than audit, review or attest services, if certain conditions are satisfied).
Item 4(f): Not applicable.
Item 4(h): The Registrant’s Audit Committee has considered whether the provision by a Registrant’s independent registered public accounting firm of non-audit services to MFS and MFS Related Entities that were not pre-approved by the Committee (because such services did not relate directly to the operations and financial reporting of the Registrant) was compatible with maintaining the independence of the independent registered public accounting firm as the Registrant’s principal auditors.
Table of Contents
| ITEM 5. | AUDIT COMMITTEE OF LISTED REGISTRANTS. |
Not applicable to the Registrant.
| ITEM 6. | SCHEDULE OF INVESTMENTS |
A schedule of investments of the Registrant is included as part of the report to shareholders of such series under Item 1 of this Form N-CSR.
| ITEM 7. | DISCLOSURE OF PROXY VOTING POLICIES AND PROCEDURES FOR CLOSED-END MANAGEMENT INVESTMENT COMPANIES. |
Not applicable to the Registrant.
| ITEM 8. | PORTFOLIO MANAGERS OF CLOSED-END MANAGEMENT INVESTMENT COMPANIES. |
Not applicable to the Registrant.
| ITEM 9. | PURCHASES OF EQUITY SECURITIES BY CLOSED-END MANAGEMENT INVESTMENT COMPANY AND AFFILIATED PURCHASERS. |
Not applicable to the Registrant.
| ITEM 10. | SUBMISSION OF MATTERS TO A VOTE OF SECURITY HOLDERS. |
There were no material changes to the procedures by which shareholders may send recommendations to the Board for nominees to the Registrant’s Board since the Registrant last provided disclosure as to such procedures in response to the requirements of Item 407 (c)(2)(iv) of Regulation S-K or this Item.
| ITEM 11. | CONTROLS AND PROCEDURES. |
| (a) | Based upon their evaluation of the effectiveness of the registrant’s disclosure controls and procedures (as defined in Rule 30a-3(c) under the Investment Company Act of 1940 (the “Act”)) as conducted within 90 days of the filing date of this report on Form N-CSR, the registrant’s principal financial officer and principal executive officer have concluded that those disclosure controls and procedures provide reasonable assurance that the material information required to be disclosed by the registrant on this report is recorded, processed, summarized and reported within the time periods specified in the Securities and Exchange Commission’s rules and forms. |
| (b) | There were no changes in the registrant’s internal controls over financial reporting (as defined in Rule 30a-3(d) under the Act) that occurred during the second fiscal quarter of the period covered by the report that have materially affected, or are reasonably likely to materially affect, the registrant’s internal control over financial reporting. |
Table of Contents
| ITEM 12. | EXHIBITS. |
| (a) | File the exhibits listed below as part of this form. Letter or number the exhibits in the sequence indicated. |
| (1) | Any code of ethics, or amendment thereto, that is the subject of the disclosure required by Item 2, to the extent that the registrant intends to satisfy the Item 2 requirements through filing of an exhibit: Code of Ethics attached hereto. |
| (2) | A separate certification for each principal executive officer and principal financial officer of the registrant as required by Rule 30a-2(a) under the Act (17 CFR 270.30a-2): Attached hereto. |
| (b) | If the report is filed under Section 13(a) or 15(d) of the Exchange Act, provide the certifications required by Rule 30a-2(b) under the Act (17 CFR 270.30a-2(b)), Rule 13a-14(b) or Rule 15d-14(b) under the Exchange Act (17 CFR 240.13a-14(b) or 240.15d-14(b)) and Section 1350 of Chapter 63 of Title 18 of the United States Code (18 U.S.C. 1350) as an exhibit. A certification furnished pursuant to this paragraph will not be deemed “filed” for the purposes of Section 18 of the Exchange Act (15 U.S.C. 78r), or otherwise subject to the liability of that section. Such certification will not be deemed to be incorporated by reference into any filing under the Securities Act of 1933 or the Exchange Act, except to the extent that the registrant specifically incorporates it by reference: Attached hereto. |
Table of Contents
Notice
A copy of the Amended and Restated Declaration of Trust, as amended, of the Registrant is on file with the Secretary of State of The Commonwealth of Massachusetts and notice is hereby given that this instrument is executed on behalf of the Registrant by an officer of the Registrant as an officer and not individually and the obligations of or arising out of this instrument are not binding upon any of the Trustees or shareholders individually, but are binding only upon the assets and property of the respective constituent series of the Registrant.
Table of Contents
SIGNATURES
Pursuant to the requirements of the Securities Exchange Act of 1934 and the Investment Company Act of 1940, the registrant has duly caused this report to be signed on its behalf by the undersigned, thereunto duly authorized.
(Registrant) MFS VARIABLE INSURANCE TRUST II
| By (Signature and Title)* | JOHN M. CORCORAN | |
| John M. Corcoran, President |
Date: February 15, 2013
Pursuant to the requirements of the Securities Exchange Act of 1934 and the Investment Company Act of 1940, this report has been signed below by the following persons on behalf of the registrant and in the capacities and on the dates indicated.
| By (Signature and Title)* | JOHN M. CORCORAN | |
| John M. Corcoran, President (Principal Executive Officer) |
Date: February 15, 2013
| By (Signature and Title)* | DAVID L. DILORENZO | |
| David L. DiLorenzo, Treasurer (Principal Financial Officer and Accounting Officer) |
Date: February 15, 2013
| * | Print name and title of each signing officer under his or her signature. |