UNITED STATES
SECURITIES AND EXCHANGE COMMISSION
Washington, D.C. 20549
FORM N-CSR
CERTIFIED SHAREHOLDER REPORT OF
REGISTERED MANAGEMENT INVESTMENT COMPANIES
Investment Company Act file number 811-03732
MFS VARIABLE INSURANCE TRUST II
(Exact name of registrant as specified in charter)
500 Boylston Street, Boston, Massachusetts 02116
(Address of principal executive offices) (Zip code)
Susan S. Newton
Massachusetts Financial Services Company
500 Boylston Street
Boston, Massachusetts 02116
(Name and address of agents for service)
Registrant’s telephone number, including area code: (617) 954-5000
Date of fiscal year end: December 31
Date of reporting period: December 31, 2010
| ITEM 1. | REPORTS TO STOCKHOLDERS. |

MFS® INTERNATIONAL GROWTH PORTFOLIO
The report is prepared for the general information of contract owners. It is authorized for distribution to prospective investors only when preceded or accompanied by a current prospectus.
NOT FDIC INSURED Ÿ MAY LOSE VALUE Ÿ NO BANK GUARANTEE Ÿ NOT A DEPOSIT Ÿ NOT INSURED BY ANY FEDERAL GOVERNMENT AGENCY OR NCUA/NCUSIF
MFS International Growth Portfolio
LETTER FROM THE CEO

Dear Contract Owners:
After an extended rebound in the financial markets, uncertainty returned in 2010 as investors began to question the durability of the recovery for global economies and markets. That uncertainty led to increased risk aversion, especially as investors saw the eurozone struggle with the debt woes of many of its members. In September, the U.S. Federal Reserve Board’s promises to further loosen monetary policy helped assuage market fears and drive asset prices off their recent lows. A combination of solid earnings and improving economic data gave an additional boost to investor sentiment. As we enter 2011, we are cautiously optimistic that economic growth will continue to improve and that the global economies will recover from the shocks of the past few years. We expect the pace of recovery worldwide will be uneven and volatile.
As always, we continue to be mindful of the many economic challenges faced at the local, national, and international levels. It is in times such as these that we want to remind investors of the merits of maintaining a long-term view, adhering to basic investing principles such as asset allocation and diversification, and working closely with their advisors to research and identify appropriate investment opportunities.
Respectfully,

Robert J. Manning
Chairman and Chief Executive Officer
MFS Investment Management®
February 14, 2011
The opinions expressed in this letter are subject to change, may not be relied upon for investment advice, and no forecasts can be guaranteed.
1
MFS International Growth Portfolio
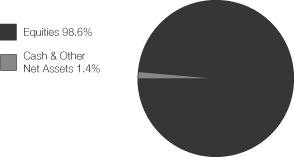
PORTFOLIO COMPOSITION
Portfolio structure
| | | | |
| Top ten holdings | | | | |
| BHP Billiton Ltd. | | | 3.8% | |
| LVMH Moet Hennessy Louis Vuitton S.A. | | | 2.8% | |
| Teck Resources Ltd., “B” | | | 2.3% | |
| Taiwan Semiconductor Manufacturing Co. Ltd., ADR | | | 2.1% | |
| Schneider Electric S.A. | | | 2.1% | |
| Groupe Danone | | | 1.9% | |
| Nestle S.A. | | | 1.8% | |
| Accenture Ltd., “A” | | | 1.7% | |
| Saipem S.p.A. | | | 1.6% | |
| Linde AG | | | 1.6% | |
| | | | |
| Equity sectors | | | | |
| Financial Services | | | 15.4% | |
| Basic Materials | | | 14.3% | |
| Consumer Staples | | | 12.9% | |
| Technology | | | 10.9% | |
| Health Care | | | 10.5% | |
| Retailing | | | 10.3% | |
| Special Products & Services | | | 6.8% | |
| Industrial Goods & Services | | | 5.4% | |
| Energy | | | 5.2% | |
| Utilities & Communications | | | 3.6% | |
| Leisure | | | 2.4% | |
| Transportation | | | 0.9% | |
| | | | |
| Issuer country weightings | | | | |
| United Kingdom | | | 11.7% | |
| France | | | 11.2% | |
| Japan | | | 10.4% | |
| Switzerland | | | 10.1% | |
| Germany | | | 9.6% | |
| Australia | | | 5.7% | |
| Brazil | | | 5.6% | |
| Taiwan | | | 3.7% | |
| Canada | | | 3.4% | |
| Other Countries | | | 28.6% | |
Percentages are based on net assets as of 12/31/10.
The portfolio is actively managed and current holdings may be different.
2
MFS International Growth Portfolio
MANAGEMENT REVIEW
Summary of Results
For the twelve months ended December 31, 2010, Initial Class shares of the MFS International Growth Portfolio (the “fund”) provided a total return of 15.16%, while Service Class shares of the fund provided a total return of 14.86%. These compare with a return of 14.79% for the fund’s benchmark, the Morgan Stanley Capital International (MSCI) All Country World (ex-US) Growth Index.
Market Environment
The first quarter of the reporting period witnessed a continuation of the financial market and macroeconomic rebounds that had begun in early 2009. These recoveries in global activity and asset valuations were generally synchronized around the world, led importantly by emerging Asian economies, but broadening to include most of the global economy to varying degrees. Primary drivers of the recoveries included an unwinding of the inventory destocking that took place earlier, the production of manufacturing and capital goods, as well as massive fiscal and monetary stimulus.
During most of the remainder of the period, heightened risk surrounding the public-debt profiles of several of the peripheral European countries impaired market sentiment. At the same time, the improving trend in global macroeconomic data began to weaken somewhat. These two dynamics caused many asset prices to retrench significantly, as many questioned the durability of the global recovery.
Towards the end of the period, the U.S. Federal Reserve led markets to believe that further monetary loosening would be forthcoming if macroeconomic activity did not show signs of improvement. The prospects for more easing by the Fed improved market sentiment and drove risk-asset prices markedly higher. However, in a text-book case of “buy the rumor, sell the fact,” the weeks following the early November announcement of further quantitative easing saw a sell-off in U.S. Treasury bonds. This rise in Treasury yields occurred despite risk-off behavior in equities and credit markets (which would normally result in Treasury yield compression), and appears to have been the result of a few factors: signs of improved U.S. and global economic activity; opposition to quantitative easing from some quarters; and crowded long positions in U.S. Treasuries. The December agreement on an expansionary U.S. fiscal package also boosted sentiment, leading markets to reach near-term highs in risky asset valuations toward year end.
Contributors to Performance
Stock selection in the retailing sector was a primary factor driving relative performance. The fund’s overweight positions in luxury goods maker LVMH Moët Hennessy Louis Vuitton (France), watch maker Swatch Group (Switzerland), and export trading company Li & Fung (Hong Kong) were among the fund’s top relative contributors. Shares of LVMH rose during the reporting period as the company reported better-than-expected sales and earnings results. Strength was evident across all of LVMH’s business segments, as the company benefited from robust demand for luxury goods, as well as the replenishing of inventories at U.S. and European retailers following the recession.
Stock selection in the financial services and special products & services sectors also positively contributed to relative performance. In the financial services sector, holdings of commercial banking firm Credicorp (b) (Peru) was among the fund’s top contributors. In the special products & services sector, product safety testing company Intertek Group (United Kingdom) was another positive factor.
Stocks in other sectors that contributed to relative results included zircon producer Iluka Resources (b) (Australia), brewery company Companhia de Bebidas das Americas (Brazil), and oil and gas turnkey contractor Saipem S.p.A. (Italy). Shares of Iluka Resources soared as the company’s management announced significantly higher-than-expected earnings in the second half of 2010, following a partial recovery in global demand earlier in the year. The fund’s timing of ownership in shares of diversified mining company Teck Resources (Canada) and digital products manufacturer ARM Holdings (h) (United Kingdom) also helped.
Detractors from Performance
Stock selection in the energy sector held back relative performance. The fund’s investment in shares of oil and gas explorer INPEX (Japan), and timing of ownership in shares of integrated oil and gas company TOTAL (b)(h) (France), negatively impacted relative results. The share price of INPEX fell as the company announced plans to raise capital via a stock issue to finance the development of the Ichthys natural gas project in Australia.
Elsewhere, holdings of securities broker Nomura Holdings (b) (Japan), apparel retailer Esprit Holdings (Hong Kong), stock exchange Deutsche Boerse (Germany), copy machine maker Konica Minolta Holdings (Japan), skin and beauty care products company Beiersdorf (Germany), paint and specialty chemical maker Akzo Nobel (b) (Netherlands), specialty chemical manufacturer Shin-Etsu Chemical (Japan), and oil and gas exploration and production company Petroleo Brasileiro (Brazil) detracted from relative performance.
3
MFS International Growth Portfolio
Management Review – continued
During the reporting period, the fund’s currency exposure was also a detractor from relative performance. All of MFS’ investment decisions are driven by the fundamentals of each individual opportunity and as such, it is common for our portfolios to have different currency exposure than the benchmark.
Respectfully,
David Antonelli
Portfolio Manager
| (b) | Security is not a benchmark constituent. |
| (h) | Security was not held in the portfolio at period end. |
The views expressed in this report are those of the portfolio manager only through the end of the period of the report as stated on the cover and do not necessarily reflect the views of MFS or any other person in the MFS organization. These views are subject to change at any time based on market or other conditions, and MFS disclaims any responsibility to update such views. These views may not be relied upon as investment advice or an indication of trading intent on behalf of any MFS portfolio. References to specific securities are not recommendations of such securities, and may not be representative of any MFS portfolio’s current or future investments.
4
MFS International Growth Portfolio
PERFORMANCE SUMMARY THROUGH 12/31/10
The following chart illustrates the historical performance of the fund in comparison to its benchmark(s). Benchmarks are unmanaged and may not be invested in directly. Benchmark returns do not reflect any fees or expenses. The performance of other share classes will be greater than or less than that of the class depicted below. (See Notes to Performance Summary.)
Performance data shown represents past performance and is no guarantee of future results. Investment return and principal value fluctuate so your units, when sold, may be worth more or less than the original cost; current performance may be lower or higher than quoted. The performance shown does not reflect the deduction of taxes, if any, that a contract holder would pay on fund distributions or the redemption of contract units. The returns for the fund shown also do not reflect the deduction of expenses associated with variable products, such as mortality and expense risk charges, separate account charges, and sales charges imposed by the insurance company separate accounts. Such expenses would reduce the overall returns shown.
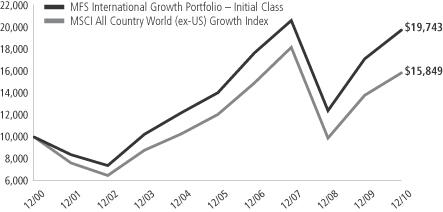
Growth of a Hypothetical $10,000 Investment
Total Returns through 12/31/10
Average annual total returns
| | | | | | | | | | | | | | |
| | | Share class | | Class inception date | | 1-yr | | 5-yr | | 10-yr | | Life (t) | | |
| | | Initial Class | | 6/03/96 | | 15.16% | | 7.05% | | 7.04% | | N/A | | |
| | | Service Class | | 8/24/01 | | 14.86% | | 6.78% | | N/A | | 8.84% | | |
| | | | | |
| Comparative benchmark | | | | | | | | | | |
| | | MSCI All Country World (ex-US) Growth Index (f) | | 14.79% | | 5.59% | | 4.71% | | N/A | | |
| (f) | Source: FactSet Research Systems Inc. |
| (t) | For the period from the class inception date through the stated period (for those share classes with less than 10 years of performance history). No comparative benchmark performance information is provided for “life” periods. (See Notes to Performance Summary). |
Benchmark Definition
MSCI All Country World (ex-US) Growth Index – a market capitalization-weighted index that is designed to measure equity market performance for growth securities in the global developed and emerging markets, excluding the U.S.
It is not possible to invest directly in an index.
Notes to Performance Summary
Average annual total return represents the average annual change in value for each share class for the periods presented. Life returns are presented where the share class has less than 10 years of performance history and represent the average annual total return from the class inception date to the stated period end date. As the fund’s share classes may have different inception dates, the life returns may represent different time periods and may not be comparable. As a result, no comparative benchmark performance information is provided for life periods.
Performance results reflect any applicable expense subsidies and waivers in effect during the periods shown. Without such subsidies and waivers the fund’s performance results would be less favorable. Please see the prospectus and financial statements for complete details. All results are historical and assume the reinvestment of any dividends and capital gains distributions.
From time to time the fund may receive proceeds from litigation settlements, without which performance would be lower.
5
MFS International Growth Portfolio
EXPENSE TABLE
Fund Expenses Borne by the Contract Holders During the Period,
July 1, 2010 through December 31, 2010
As a contract holder of the fund, you incur ongoing costs, including management fees; distribution and/or service (12b-1) fees; and other fund expenses. This example is intended to help you understand your ongoing costs (in dollars) of investing in the fund and to compare these costs with the ongoing costs of investing in other mutual funds.
The example is based on an investment of $1,000 invested at the beginning of the period and held for the entire period July 1, 2010 through December 31, 2010.
Actual Expenses
The first line for each share class in the following table provides information about actual account values and actual expenses. You may use the information in this line, together with the amount you invested, to estimate the expenses that you paid over the period. Simply divide your account value by $1,000 (for example, an $8,600 account value divided by $1,000 = 8.6), then multiply the result by the number in the first line under the heading entitled “Expenses Paid During Period” to estimate the expenses you paid on your account during this period.
Hypothetical Example for Comparison Purposes
The second line for each share class in the following table provides information about hypothetical account values and hypothetical expenses based on the fund’s actual expense ratio and an assumed rate of return of 5% per year before expenses, which is not the fund’s actual return. The hypothetical account values and expenses may not be used to estimate the actual ending account balance or expenses you paid for the period. You may use this information to compare the ongoing costs of investing in the fund and other funds. To do so, compare this 5% hypothetical example with the 5% hypothetical examples that appear in the shareholder reports of the other funds.
Please note that the expenses shown in the table are meant to highlight the fund’s ongoing costs only and do not take into account the fees and expenses imposed under the variable contracts through which your investment in the fund is made. Therefore, the second line for each share class in the table is useful in comparing ongoing costs associated with an investment in vehicles (such as the fund) which fund benefits under variable annuity and variable life insurance contracts and to qualified pension and retirement plans only, and will not help you determine the relative total costs of investing in the fund through variable annuity and variable life insurance contracts. If the fees and expenses imposed under the variable contracts were included, your costs would have been higher.
| | | | | | | | | | | | | | | | | | |
| Share Class | | | | Annualized Expense Ratio | | | Beginning Account Value 7/01/10 | | | Ending Account Value 12/31/10 | | | Expenses Paid During Period (p) 7/01/10-12/31/10 | |
| Initial Class | | Actual | | | 1.07% | | | | $1,000.00 | | | | $1,264.84 | | | | $6.11 | |
| | Hypothetical (h) | | | 1.07% | | | | $1,000.00 | | | | $1,019.81 | | | | $5.45 | |
| Service Class | | Actual | | | 1.32% | | | | $1,000.00 | | | | $1,263.55 | | | | $7.53 | |
| | Hypothetical (h) | | | 1.32% | | | | $1,000.00 | | | | $1,018.55 | | | | $6.72 | |
| (h) | 5% class return per year before expenses. |
| (p) | Expenses paid is equal to each class’ annualized expense ratio, as shown above, multiplied by the average account value over the period, multiplied by the number of days in the period, divided by the number of days in the year. |
6
MFS International Growth Portfolio
PORTFOLIO OF INVESTMENTS – 12/31/10
The Portfolio of Investments is a complete list of all securities owned by your fund. It is categorized by broad-based asset classes.
| | | | | | | | |
| Issuer | | Shares/Par | | | Value ($) | |
| | | | | | | |
| COMMON STOCKS – 98.6% | | | | | | | | |
| Airlines – 0.9% | | | | | | | | |
| Copa Holdings S.A., “A” | | | 36,320 | | | $ | 2,137,069 | |
| | | | | | | | |
| Alcoholic Beverages – 4.2% | | | | | | | | |
| Companhia de Bebidas das Americas, ADR | | | 109,790 | | | $ | 3,406,784 | |
| Diageo PLC | | | 171,422 | | | | 3,167,077 | |
| Heineken N.V. | | | 28,163 | | | | 1,380,799 | |
| Pernod Ricard S.A. | | | 27,898 | | | | 2,623,027 | |
| | | | | | | | |
| | | | | | $ | 10,577,687 | |
| | | | | | | | |
| Apparel Manufacturers – 6.3% | | | | | | | | |
| Compagnie Financiere Richemont S.A. | | | 46,276 | | | $ | 2,722,118 | |
| Li & Fung Ltd. | | | 566,600 | | | | 3,287,575 | |
| LVMH Moet Hennessy Louis Vuitton S.A. | | | 42,882 | | | | 7,054,026 | |
| Swatch Group Ltd. | | | 6,443 | | | | 2,872,131 | |
| | | | | | | | |
| | | | | | $ | 15,935,850 | |
| | | | | | | | |
| Broadcasting – 1.5% | | | | | | | | |
| Grupo Televisa S.A., ADR (a) | | | 57,100 | | | $ | 1,480,603 | |
| Publicis Groupe S.A. | | | 46,500 | | | | 2,423,380 | |
| | | | | | | | |
| | | | | | $ | 3,903,983 | |
| | | | | | | | |
| Brokerage & Asset Managers – 4.4% | | | | | | | | |
| Aberdeen Asset Management PLC | | | 744,394 | | | $ | 2,354,825 | |
| BM&F Bovespa S.A. | | | 380,000 | | | | 3,005,663 | |
| Deutsche Boerse AG | | | 36,501 | | | | 2,526,611 | |
| ICAP PLC | | | 163,496 | | | | 1,363,750 | |
| Nomura Holdings, Inc. | �� | | 273,600 | | | | 1,735,485 | |
| | | | | | | | |
| | | | | | $ | 10,986,334 | |
| | | | | | | | |
| Business Services – 6.8% | | | | | | | | |
| Accenture Ltd., “A” (s) | | | 86,090 | | | $ | 4,174,504 | |
| Amadeus IT Holding S.A. (a) | | | 93,523 | | | | 1,959,604 | |
| Capita Group PLC | | | 193,116 | | | | 2,097,071 | |
| Hays PLC | | | 1,111,086 | | | | 2,232,926 | |
| Infosys Technologies Ltd., ADR | | | 24,780 | | | | 1,885,262 | |
| Intertek Group PLC | | | 79,670 | | | | 2,204,788 | |
| Michael Page International | | | 317,870 | | | | 2,750,529 | |
| | | | | | | | |
| | | | | | $ | 17,304,684 | |
| | | | | | | | |
| Computer Software – 1.4% | | | | | | | | |
| Dassault Systems S.A. | | | 21,802 | | | $ | 1,643,741 | |
| SAP AG | | | 39,392 | | | | 2,005,566 | |
| | | | | | | | |
| | | | | | $ | 3,649,307 | |
| | | | | | | | |
| Computer Software – Systems – 3.4% | | | | | | | | |
| Acer, Inc. | | | 1,239,750 | | | $ | 3,831,100 | |
| Konica Minolta Holdings, Inc. | | | 256,000 | | | | 2,661,214 | |
| NICE Systems Ltd., ADR (a) | | | 56,960 | | | | 1,987,904 | |
| | | | | | | | |
| | | | | | $ | 8,480,218 | |
| | | | | | | | |
| Consumer Products – 4.6% | | | | | | | | |
| AmorePacific Corp. (a) | | | 1,665 | | | $ | 1,671,015 | |
| Beiersdorf AG | | | 40,376 | | | | 2,240,458 | |
| Henkel KGaA, IPS | | | 32,310 | | | | 2,009,188 | |
| | | | | | | | |
| Issuer | | Shares/Par | | | Value ($) | |
| | | | | | | | |
| COMMON STOCKS – continued | | | | | |
| Consumer Products – continued | | | | | | | | |
| Reckitt Benckiser Group PLC | | | 59,082 | | | $ | 3,247,043 | |
| Uni-Charm Corp. | | | 59,700 | | | | 2,371,479 | |
| | | | | | | | |
| | | | | | $ | 11,539,183 | |
| | | | | | | | |
| Electrical Equipment – 2.6% | | | | | | | | |
| Keyence Corp. | | | 4,300 | | | $ | 1,243,163 | |
| Schneider Electric S.A. | | | 36,008 | | | | 5,389,159 | |
| | | | | | | | |
| | | | | | $ | 6,632,322 | |
| | | | | | | | |
| Electronics – 5.5% | | | | | | | | |
| Hoya Corp. | | | 77,700 | | | $ | 1,887,232 | |
| Infineon Technologies AG (a) | | | 202,496 | | | | 1,884,156 | |
| Samsung Electronics Co. Ltd. | | | 3,353 | | | | 2,803,769 | |
| Taiwan Semiconductor Manufacturing Co. Ltd., ADR | | | 431,040 | | | | 5,405,242 | |
| Tokyo Electron Ltd. | | | 32,100 | | | | 2,032,196 | |
| | | | | | | | |
| | | | | | $ | 14,012,595 | |
| | | | | | | | |
| Energy – Independent – 0.7% | | | | | | | | |
| INPEX Corp. | | | 319 | | | $ | 1,868,266 | |
| | | | | | | | |
| Energy – Integrated – 2.9% | | | | | | | | |
| OAO Gazprom, ADR | | | 106,260 | | | $ | 2,683,065 | |
| Petroleo Brasileiro S.A., ADR | | | 48,060 | | | | 1,818,590 | |
| Suncor Energy, Inc. | | | 74,722 | | | | 2,876,756 | |
| | | | | | | | |
| | | | | | $ | 7,378,411 | |
| | | | | | | | |
| Engineering – Construction – 0.8% | | | | | | | | |
| JGC Corp. | | | 90,000 | | | $ | 1,954,038 | |
| | | | | | | | |
| Food & Beverages – 4.1% | | | | | | | | |
| Coca-Cola Hellenic Bottling Co. S.A. | | | 44,654 | | | $ | 1,155,233 | |
| Groupe Danone | | | 75,158 | | | | 4,722,389 | |
| Nestle S.A. | | | 75,873 | | | | 4,442,831 | |
| | | | | | | | |
| | | | | | $ | 10,320,453 | |
| | | | | | | | |
| Food & Drug Stores – 2.4% | | | | | | | | |
| Dairy Farm International Holdings Ltd. | | | 214,200 | | | $ | 1,989,918 | |
| Lawson, Inc. | | | 27,500 | | | | 1,359,927 | |
| Tesco PLC | | | 420,151 | | | | 2,783,993 | |
| | | | | | | | |
| | | | | | $ | 6,133,838 | |
| | | | | | | | |
| Internet – 0.6% | | | | | | | | |
| Yahoo Japan Corp. | | | 4,113 | | | $ | 1,595,757 | |
| | | | | | | | |
| Leisure & Toys – 0.9% | | | | | | | | |
| Shimano, Inc. | | | 44,000 | | | $ | 2,238,207 | |
| | | | | | | | |
| Machinery & Tools – 2.0% | | | | | | | | |
| KONE Oyj “B” | | | 44,737 | | | $ | 2,486,933 | |
| Schindler Holding AG | | | 20,608 | | | | 2,437,695 | |
| | | | | | | | |
| | | | | | $ | 4,924,628 | |
| | | | | | | | |
| Major Banks – 6.1% | | | | | | | | |
| Credit Suisse Group AG | | | 68,357 | | | $ | 2,754,019 | |
| Erste Group Bank AG | | | 56,679 | | | | 2,661,509 | |
7
MFS International Growth Portfolio
Portfolio of Investments – continued
| | | | | | | | |
| Issuer | | Shares/Par | | | Value ($) | |
| | | | | | | | |
| COMMON STOCKS – continued | |
| Major Banks – continued | | | | | | | | |
| HSBC Holdings PLC | | | 347,524 | | | $ | 3,527,819 | |
| Julius Baer Group Ltd. | | | 55,670 | | | | 2,607,857 | |
| Standard Chartered PLC | | | 140,550 | | | | 3,781,112 | |
| | | | | | | | |
| | | | | | $ | 15,332,316 | |
| | | | | | | | |
| Medical & Health Technology & Services – 1.9% | |
| Diagnosticos da America S.A. | | | 90,400 | | | $ | 1,225,301 | |
| Fleury S.A. | | | 63,600 | | | | 1,021,048 | |
| Fresenius Medical Care AG & Co. KGaA | | | 41,957 | | | | 2,423,782 | |
| | | | | | | | |
| | | | | | $ | 4,670,131 | |
| | | | | | | | |
| Medical Equipment – 3.1% | | | | | | | | |
| Essilor International S.A. | | | 31,511 | | | $ | 2,028,560 | |
| Sonova Holding AG | | | 25,726 | | | | 3,320,993 | |
| Synthes, Inc. | | | 19,130 | | | | 2,584,084 | |
| | | | | | | | |
| | | | | | $ | 7,933,637 | |
| | | | | | | | |
| Metals & Mining – 7.5% | | | | | | | | |
| BHP Billiton Ltd. | | | 208,972 | | | $ | 9,671,582 | |
| Iluka Resources Ltd. (a) | | | 381,247 | | | | 3,564,047 | |
| Teck Resources Ltd., “B” | | | 93,395 | | | | 5,803,960 | |
| | | | | | | | |
| | | | | | $ | 19,039,589 | |
| | | | | | | | |
| Oil Services – 1.6% | | | | | | | | |
| Saipem S.p.A. | | | 81,532 | | | $ | 4,013,762 | |
| | | | | | | | |
| Other Banks & Diversified Financials – 4.9% | |
| Akbank T.A.S. | | | 453,200 | | | $ | 2,518,430 | |
| Banco Santander Brasil S.A., ADR | | | 279,220 | | | | 3,797,392 | |
| Bank Rakyat Indonesia | | | 1,436,500 | | | | 1,674,057 | |
| China Construction Bank (a) | | | 1,421,410 | | | | 1,274,602 | |
| Credicorp Ltd. | | | 8,320 | | | | 989,331 | |
| HDFC Bank Ltd. | | | 38,773 | | | | 2,034,553 | |
| | | | | | | | |
| | | | | | $ | 12,288,365 | |
| | | | | | | | |
| Pharmaceuticals – 5.5% | | | | | | | | |
| Bayer AG | | | 44,085 | | | $ | 3,257,766 | |
| Merck KGaA | | | 17,104 | | | | 1,367,936 | |
| Novo Nordisk A/S, “B” | | | 22,471 | | | | 2,533,907 | |
| Roche Holding AG | | | 13,145 | | | | 1,926,059 | |
| Santen, Inc. | | | 53,800 | | | | 1,868,654 | |
| Teva Pharmaceutical Industries Ltd., ADR | | | 57,200 | | | | 2,981,836 | |
| | | | | | | | |
| | | | | | $ | 13,936,158 | |
| | | | | | | | |
| Precious Metals & Minerals – 0.5% | | | | | | | | |
| Newcrest Mining Ltd. | | | 30,150 | | | $ | 1,247,066 | |
| | | | | | | | |
| Specialty Chemicals – 6.3% | | | | | | | | |
| Akzo Nobel N.V. | | | 55,731 | | | $ | 3,461,893 | |
| L’Air Liquide S.A. | | | 19,431 | | | | 2,457,388 | |
| Linde AG | | | 26,316 | | | | 3,993,107 | |
| Shin-Etsu Chemical Co. Ltd. | | | 64,900 | | | | 3,517,182 | |
| Symrise AG | | | 90,647 | | | | 2,486,226 | |
| | | | | | | | |
| | | | | | $ | 15,915,796 | |
| | | | | | | | |
| | | | | | | | |
| Issuer | | Shares/Par | | | Value ($) | |
| | | | | | | | |
| COMMON STOCKS – continued | |
| Specialty Stores – 1.6% | | | | | | | | |
| Esprit Holdings Ltd. | | | 414,169 | | | $ | 1,971,523 | |
| Industria de Diseno Textil S.A. | | | 28,741 | | | | 2,151,922 | |
| | | | | | | | |
| | | | | | $ | 4,123,445 | |
| | | | | | | | |
| Telecommunications – Wireless – 1.9% | |
| MTN Group Ltd. | | | 120,819 | | | $ | 2,465,350 | |
| Philippine Long Distance Telephone Co. | | | 39,970 | | | | 2,330,139 | |
| | | | | | | | |
| | | | | | $ | 4,795,489 | |
| | | | | | | | |
| Telephone Services – 1.7% | | | | | | | | |
| China Unicom Ltd. | | | 2,148,000 | | | $ | 3,072,993 | |
| Telefonica S.A. | | | 55,739 | | | | 1,263,621 | |
| | | | | | | | |
| | | | | | $ | 4,336,614 | |
| | | | | | | | |
Total Common Stocks
(Identified Cost, $216,172,332) | | | | | | $ | 249,205,198 | |
| | | | | | | | |
|
| MONEY MARKET FUNDS (v) – 0.8% | |
| MFS Institutional Money Market Portfolio, 0.18%, at Cost and Net Asset Value | | | 2,123,761 | | | $ | 2,123,761 | |
| | | | | | | | |
Total Investments
(Identified Cost, $218,296,093) | | | $ | 251,328,959 | |
OTHER ASSETS, LESS
LIABILITIES – 0.6% | | | | 1,475,234 | |
| | | | | | | | |
| Net Assets – 100.0% | | | $ | 252,804,193 | |
| | | | | | | | |
| (a) | Non-income producing security. |
| (s) | Security or a portion of the security was pledged to cover collateral requirements for securities sold short and written options. At December 31, 2010, the value of securities pledged amounted to $166,321. At December 31, 2010, the fund had no short sales outstanding. |
| (v) | Underlying fund that is available only to investment companies managed by MFS. The rate quoted is the annualized seven-day yield of the fund at period end. |
The following abbreviations are used in this report and are defined:
| ADR | | American Depository Receipt |
| IPS | | International Preference Stock |
| PLC | | Public Limited Company |
See Notes to Financial Statements
8
MFS International Growth Portfolio
FINANCIAL STATEMENTS | STATEMENT OF ASSETS AND LIABILITIES
This statement represents your fund’s balance sheet, which details the assets and liabilities comprising the total value of the fund.
| | | | | | | | |
At 12/31/10 | | | | | | | | |
Assets | | | | | | | | |
Investments – | | | | | | | | |
Non-affiliated issuers, at value (identified cost, $216,172,332) | | | $249,205,198 | | | | | |
Underlying funds, at cost and value | | | 2,123,761 | | | | | |
Total investments, at value (identified cost, $218,296,093) | | | $251,328,959 | | | | | |
Foreign currency, at value (identified cost, $48,565) | | | 48,613 | | | | | |
Receivables for | | | | | | | | |
Investments sold | | | 1,429,793 | | | | | |
Fund shares sold | | | 109,722 | | | | | |
Interest and dividends | | | 427,032 | | | | | |
Other assets | | | 8,567 | | | | | |
Total assets | | | | | | | $253,352,686 | |
Liabilities | | | | | | | | |
Payables for | | | | | | | | |
Investments purchased | | | $299,726 | | | | | |
Fund shares reacquired | | | 86,655 | | | | | |
Payable to affiliates | | | | | | | | |
Investment adviser | | | 12,459 | | | | | |
Shareholder servicing costs | | | 132 | �� | | | | |
Distribution and/or service fees | | | 428 | | | | | |
Administrative services fee | | | 495 | | | | | |
Payable for Trustees’ compensation | | | 78 | | | | | |
Deferred country tax expense payable | | | 43,806 | | | | | |
Accrued expenses and other liabilities | | | 104,714 | | | | | |
Total liabilities | | | | | | | $548,493 | |
Net assets | | | | | | | $252,804,193 | |
Net assets consist of | | | | | | | | |
Paid-in capital | | | $197,544,320 | | | | | |
Unrealized appreciation (depreciation) on investments and translation of assets and liabilities in foreign currencies
(net of $43,806 deferred country tax) | | | 33,007,396 | | | | | |
Accumulated net realized gain (loss) on investments and foreign currency transactions | | | 19,674,240 | | | | | |
Undistributed net investment income | | | 2,578,237 | | | | | |
Net assets | | | | | | | $252,804,193 | |
Shares of beneficial interest outstanding | | | | | | | 18,270,880 | |
| | | | | | | | | | | | |
| | | Net assets | | | Shares
outstanding | | | Net asset value
per share | |
Initial Class | | | $221,456,475 | | | | 15,992,589 | | | | $13.85 | |
Service Class | | | 31,347,718 | | | | 2,278,291 | | | | 13.76 | |
See Notes to Financial Statements
9
MFS International Growth Portfolio
FINANCIAL STATEMENTS | STATEMENT OF OPERATIONS
This statement describes how much your fund earned in investment income and accrued in expenses. It also describes any gains and/or losses generated by fund operations.
| | | | | | | | |
| Year ended 12/31/10 | | | | | | | | |
| Net investment income | | | | | | | | |
Income | | | | | | | | |
Dividends | | | $5,950,128 | | | | | |
Interest | | | 80,737 | | | | | |
Dividends from underlying funds | | | 8,172 | | | | | |
Foreign taxes withheld | | | (581,755 | ) | | | | |
Total investment income | | | | | | | $5,457,282 | |
Expenses | | | | | | | | |
Management fee | | | $2,131,103 | | | | | |
Distribution and/or service fees | | | 68,993 | | | | | |
Shareholder servicing costs | | | 27,351 | | | | | |
Administrative services fee | | | 84,613 | | | | | |
Trustees’ compensation | | | 27,727 | | | | | |
Custodian fee | | | 209,211 | | | | | |
Shareholder communications | | | 18,417 | | | | | |
Auditing fees | | | 55,958 | | | | | |
Legal fees | | | 7,157 | | | | | |
Miscellaneous | | | 29,313 | | | | | |
Total expenses | | | | | | | $2,659,843 | |
Fees paid indirectly | | | (10 | ) | | | | |
Net expenses | | | | | | | $2,659,833 | |
Net investment income | | | | | | | $2,797,449 | |
Realized and unrealized gain (loss) on investments and foreign currency transactions | | | | | | | | |
Realized gain (loss) (identified cost basis) | | | | | | | | |
Investment transactions (net of $7,813 country tax) | | | $28,087,937 | | | | | |
Foreign currency transactions | | | (206,902 | ) | | | | |
Net realized gain (loss) on investments and foreign currency transactions | | | | | | | $27,881,035 | |
Change in unrealized appreciation (depreciation) | | | | | | | | |
Investments (net of $2,032 increase in deferred country tax) | | | $7,195,481 | | | | | |
Translation of assets and liabilities in foreign currencies | | | 10,342 | | | | | |
Net unrealized gain (loss) on investments and foreign currency translation | | | | | | | $7,205,823 | |
Net realized and unrealized gain (loss) on investments and foreign currency | | | | | | | $35,086,858 | |
Change in net assets from operations | | | | | | | $37,884,307 | |
See Notes to Financial Statements
10
MFS International Growth Portfolio
FINANCIAL STATEMENTS | STATEMENTS OF CHANGES IN NET ASSETS
These statements describe the increases and/or decreases in net assets resulting from operations, any distributions, and any shareholder transactions.
| | | | | | | | |
For years ended 12/31 | | | 2010 | | | | 2009 | |
Change in net assets | | | | | | | | |
From operations | | | | | | | | |
Net investment income | | | $2,797,449 | | | | $1,964,427 | |
Net realized gain (loss) on investments and foreign currency transactions | | | 27,881,035 | | | | 4,026,805 | |
Net unrealized gain (loss) on investments and foreign currency translation | | | 7,205,823 | | | | 44,703,242 | |
Change in net assets from operations | | | $37,884,307 | | | | $50,694,474 | |
Distributions declared to shareholders | | | | | | | | |
From net investment income | | | $(1,936,143 | ) | | | $(1,417,238 | ) |
Change in net assets from fund share transactions | | | $9,593,366 | | | | $52,895,067 | |
Total change in net assets | | | $45,541,530 | | | | $102,172,303 | |
Net assets | | | | | | | | |
At beginning of period | | | 207,262,663 | | | | 105,090,360 | |
At end of period (including undistributed net investment income of $2,578,237 and
$1,931,646, respectively) | | | $252,804,193 | | | | $207,262,663 | |
See Notes to Financial Statements
11
MFS International Growth Portfolio
FINANCIAL STATEMENTS | FINANCIAL HIGHLIGHTS
The financial highlights table is intended to help you understand the fund’s financial performance for the past 5 years. Certain information reflects financial results for a single fund share. The total returns in the table represent the rate by which an investor would have earned (or lost) on an investment in the fund share class (assuming reinvestment of all distributions) held for the entire period.
| | | | | | | | | | | | | | | | | | | | |
| Initial Class | | Years ended 12/31 | |
| | | 2010 | | | 2009 | | | 2008 | | | 2007 | | | 2006 | |
Net asset value, beginning of period | | | $12.13 | | | | $8.90 | | | | $17.63 | | | | $17.93 | | | | $15.42 | |
| Income (loss) from investment operations | | | | | | | | | | | | | | | | | | | | |
Net investment income (d) | | | $0.15 | | | | $0.14 | | | | $0.16 | | | | $0.21 | | | | $0.23 | |
Net realized and unrealized gain (loss) on investments and foreign currency | | | 1.68 | | | | 3.20 | | | | (6.04 | ) | | | 2.57 | | | | 3.70 | |
Total from investment operations | | | $1.83 | | | | $3.34 | | | | $(5.88 | ) | | | $2.78 | | | | $3.93 | |
| Less distributions declared to shareholders | | | | | | | | | | | | | | | | | | | | |
From net investment income | | | $(0.11 | ) | | | $(0.11 | ) | | | $(0.19 | ) | | | $(0.27 | ) | | | $(0.11 | ) |
From net realized gain on investments | | | — | | | | — | | | | (2.66 | ) | | | (2.81 | ) | | | (1.31 | ) |
Total distributions declared to shareholders | | | $(0.11 | ) | | | $(0.11 | ) | | | $(2.85 | ) | | | $(3.08 | ) | | | $(1.42 | ) |
Net asset value, end of period | | | $13.85 | | | | $12.13 | | | | $8.90 | | | | $17.63 | | | | $17.93 | |
Total return (%) (k)(s) | | | 15.16 | | | | 38.06 | | | | (39.82 | ) | | | 16.58 | | | | 26.04 | |
Ratios (%) (to average net assets)
and Supplemental data: | | | | | | | | | | | | | | | | | | | | |
Expenses (f) | | | 1.09 | | | | 1.25 | | | | 1.22 | | | | 1.11 | | | | 1.12 | |
Net investment income | | | 1.21 | | | | 1.39 | | | | 1.25 | | | | 1.16 | | | | 1.40 | |
Portfolio turnover | | | 66 | | | | 56 | | | | 73 | | | | 56 | | | | 86 | |
Net assets at end of period (000 omitted) | | | $221,456 | | | | $179,925 | | | | $87,034 | | | | $139,633 | | | | $140,242 | |
| |
| Service Class | | Years ended 12/31 | |
| | | 2010 | | | 2009 | | | 2008 | | | 2007 | | | 2006 | |
Net asset value, beginning of period | | | $12.06 | | | | $8.84 | | | | $17.53 | | | | $17.85 | | | | $15.36 | |
| Income (loss) from investment operations | | | | | | | | | | | | | | | | | | | | |
Net investment income (d) | | | $0.11 | | | | $0.12 | | | | $0.13 | | | | $0.15 | | | | $0.19 | |
Net realized and unrealized gain (loss) on investments and foreign currency | | | 1.67 | | | | 3.18 | | | | (6.00 | ) | | | 2.56 | | | | 3.69 | |
Total from investment operations | | | $1.78 | | | | $3.30 | | | | $(5.87 | ) | | | $2.71 | | | | $3.88 | |
| Less distributions declared to shareholders | | | | | | | | | | | | | | | | | | | | |
From net investment income | | | $(0.08 | ) | | | $(0.08 | ) | | | $(0.16 | ) | | | $(0.22 | ) | | | $(0.08 | ) |
From net realized gain on investments | | | — | | | | — | | | | (2.66 | ) | | | (2.81 | ) | | | (1.31 | ) |
Total distributions declared to shareholders | | | $(0.08 | ) | | | $(0.08 | ) | | | $(2.82 | ) | | | $(3.03 | ) | | | $(1.39 | ) |
Net asset value, end of period | | | $13.76 | | | | $12.06 | | | | $8.84 | | | | $17.53 | | | | $17.85 | |
Total return (%) (k)(s) | | | 14.86 | | | | 37.69 | | | | (39.96 | ) | | | 16.26 | | | | 25.75 | |
Ratios (%) (to average net assets)
and Supplemental data: | | | | | | | | | | | | | | | | | | | | |
Expenses (f) | | | 1.34 | | | | 1.50 | | | | 1.46 | | | | 1.37 | | | | 1.37 | |
Net investment income | | | 0.94 | | | | 1.17 | | | | 1.04 | | | | 0.85 | | | | 1.15 | |
Portfolio turnover | | | 66 | | | | 56 | | | | 73 | | | | 56 | | | | 86 | |
Net assets at end of period (000 omitted) | | | $31,348 | | | | $27,338 | | | | $18,056 | | | | $28,689 | | | | $22,979 | |
| (d) | Per share data is based on average shares outstanding. |
| (f) | Ratios do not reflect reductions from fees paid indirectly, if applicable. |
| (k) | The total return does not reflect expenses that apply to separate accounts. Inclusion of these charges would reduce the total return figures for all periods shown. |
| (s) | From time to time the fund may receive proceeds from litigation settlements, without which performance would be lower. |
See Notes to Financial Statements
12
MFS International Growth Portfolio
NOTES TO FINANCIAL STATEMENTS
| (1) | | Business and Organization |
MFS International Growth Portfolio (the fund) is a series of MFS Variable Insurance Trust II (the trust). The trust is organized as a Massachusetts business trust and is registered under the Investment Company Act of 1940, as amended, as an open-end management investment company. The shareholders of each series of the trust are separate accounts of insurance companies, which offer variable annuity and/or life insurance products, and qualified retirement and pension plans.
| (2) | | Significant Accounting Policies |
General – The preparation of financial statements in conformity with U.S. generally accepted accounting principles requires management to make estimates and assumptions that affect the reported amounts of assets and liabilities, and disclosure of contingent assets and liabilities at the date of the financial statements and the reported amounts of revenues and expenses during the reporting period. Actual results could differ from those estimates. In the preparation of these financial statements, management has evaluated subsequent events occurring after the date of the fund’s Statement of Assets and Liabilities through the date that the financial statements were issued. The fund invests in foreign securities, including securities of emerging market issuers. Investments in foreign securities are vulnerable to the effects of changes in the relative values of the local currency and the U.S. dollar and to the effects of changes in each country’s legal, political, and economic environment. The markets of emerging markets countries are generally more volatile than the markets of developed countries with more mature economies. All of the risks of investing in foreign securities previously described are heightened when investing in emerging markets countries.
Investment Valuations – Equity securities, including restricted equity securities, are generally valued at the last sale or official closing price as provided by a third-party pricing service on the market or exchange on which they are primarily traded. Equity securities, for which there were no sales reported that day, are generally valued at the last quoted daily bid quotation as provided by a third-party pricing service on the market or exchange on which such securities are primarily traded. Equity securities held short, for which there were no sales reported for that day, are generally valued at the last quoted daily ask quotation as provided by a third-party pricing service on the market or exchange on which such securities are primarily traded. Short-term instruments with a maturity at issuance of 60 days or less generally are valued at amortized cost, which approximates market value. Open-end investment companies are generally valued at net asset value per share. Securities and other assets generally valued on the basis of information from a third-party pricing service may also be valued at a broker/dealer bid quotation. Values obtained from third-party pricing services can utilize both transaction data and market information such as yield, quality, coupon rate, maturity, type of issue, trading characteristics, and other market data. The values of foreign securities and other assets and liabilities expressed in foreign currencies are converted to U.S. dollars using the mean of bid and asked prices for rates provided by a third-party pricing service.
The Board of Trustees has delegated primary responsibility for determining or causing to be determined the value of the fund’s investments (including any fair valuation) to the adviser pursuant to valuation policies and procedures approved by the Board. If the adviser determines that reliable market quotations are not readily available, investments are valued at fair value as determined in good faith by the adviser in accordance with such procedures under the oversight of the Board of Trustees. Under the fund’s valuation policies and procedures, market quotations are not considered to be readily available for most types of debt instruments and floating rate loans and many types of derivatives. These investments are generally valued at fair value based on information from third-party pricing services. In addition, investments may be valued at fair value if the adviser determines that an investment’s value has been materially effected by events occurring after the close of the exchange or market on which the investment is principally traded (such as foreign exchange or market) and prior to the determination of the fund’s net asset value, or after the halting of trading of a specific security where trading does not resume prior to the close of the exchange or market on which the security is principally traded. Events that occur on a frequent basis after foreign markets close (such as developments in foreign markets and significant movements in the U.S. markets) and prior to the determination of the fund’s net asset value may be deemed to have a material effect on the value of securities traded in foreign markets. Accordingly, the fund’s foreign equity securities may often be valued at fair value. The adviser generally relies on third-party pricing services or other information (such as the correlation with price movements of similar securities in the same or other markets; the type, cost and investment characteristics of the security; the business and financial condition of the issuer; and trading and other market data) to assist in determining whether to fair value and at what value to fair value an investment. The value of an investment for purposes of calculating the fund’s net asset value can differ depending on the source and method used to determine value. When fair valuation is used, the value of an investment used to determine the fund’s net asset value may differ from quoted or published prices for the same investment. There can be no assurance that the fund could obtain the fair value assigned to an investment if it were to sell the investment at the same time at which the fund determines its net asset value per share.
13
MFS International Growth Portfolio
Notes to Financial Statements – continued
Various inputs are used in determining the value of the fund’s assets or liabilities. These inputs are categorized into three broad levels. In certain cases, the inputs used to measure fair value may fall into different levels of the fair value hierarchy. In such cases, an investment’s level within the fair value hierarchy is based on the lowest level of input that is significant to the fair value measurement. The fund’s assessment of the significance of a particular input to the fair value measurement in its entirety requires judgment, and considers factors specific to the investment. Level 1 includes unadjusted quoted prices in active markets for identical assets or liabilities. Level 2 includes other significant observable market-based inputs (including quoted prices for similar securities, interest rates, prepayment speed, and credit risk). Level 3 includes unobservable inputs, which may include the adviser’s own assumptions in determining the fair value of investments. The following is a summary of the levels used as of December 31, 2010 in valuing the fund’s assets or liabilities:
| | | | | | | | | | | | | | | | |
| Investments at Value | | Level 1 | | | Level 2 | | | Level 3 | | | Total | |
| Equity Securities: | | | | | | | | | | | | | | | | |
United Kingdom | | | $29,510,934 | | | | $— | | | | $— | | | | $29,510,934 | |
France | | | 28,341,670 | | | | — | | | | — | | | | 28,341,670 | |
Japan | | | 20,764,120 | | | | 5,568,680 | | | | — | | | | 26,332,800 | |
Switzerland | | | 25,667,786 | | | | — | | | | — | | | | 25,667,786 | |
Germany | | | 24,194,797 | | | | — | | | | — | | | | 24,194,797 | |
Australia | | | 14,482,695 | | | | — | | | | — | | | | 14,482,695 | |
Brazil | | | 14,274,778 | | | | — | | | | — | | | | 14,274,778 | |
Taiwan | | | 9,236,342 | | | | — | | | | — | | | | 9,236,342 | |
Canada | | | 8,680,715 | | | | — | | | | — | | | | 8,680,715 | |
Other Countries | | | 68,482,681 | | | | — | | | | — | | | | 68,482,681 | |
| Mutual Funds | | | 2,123,761 | | | | — | | | | — | | | | 2,123,761 | |
| Total Investments | | | $245,760,279 | | | | $5,568,680 | | | | $— | | | | $251,328,959 | |
For further information regarding security characteristics, see the Portfolio of Investments.
Of the level 2 investments presented above, equity investments amounting to $1,243,163 were considered level 1 investments at the beginning of the period. Of the level 1 investments presented above, equity investments amounting to $116,545,699 were considered level 2 investments at the beginning of the period. The primary reason for changes in the classifications between levels 1 and 2 occurs when foreign equity securities are fair valued using other observable market-based inputs in place of the closing exchange price due to events occurring after the close of the exchange or market on which the investment is principally traded. The fund’s foreign equity securities may often be valued at fair value.
Foreign Currency Translation – Purchases and sales of foreign investments, income, and expenses are converted into U.S. dollars based upon currency exchange rates prevailing on the respective dates of such transactions or on the reporting date for foreign denominated receivables and payables. Gains and losses attributable to foreign currency exchange rates on sales of securities are recorded for financial statement purposes as net realized gains and losses on investments. Gains and losses attributable to foreign exchange rate movements on receivables, payables, income and expenses are recorded for financial statement purposes as foreign currency transaction gains and losses. That portion of both realized and unrealized gains and losses on investments that results from fluctuations in foreign currency exchange rates is not separately disclosed.
Short Sales – The fund may enter into short sales whereby it sells a security it does not own in anticipation of a decline in the value of that security. The fund will realize a gain if the security price decreases and a loss if the security price increases between the date of the short sale and the date on which the fund replaces the borrowed security. Losses from short sales can exceed the proceeds of the security sold; and they can also exceed the potential loss from an ordinary buy and sell transaction. The amount of any premium, dividends, or interest the fund may be required to pay in connection with a short sale will be recognized as a fund expense. The fund segregates cash or marketable securities in an amount that, when combined with the amount of proceeds from the short sale deposited with the broker, at least equals the current market value of the security sold short. At December 31, 2010, the fund has yet to enter into such transactions.
Security Loans – State Street Bank and Trust Company (“State Street”), as lending agent, loans the securities of the fund to certain qualified institutions (the “Borrowers”) approved by the fund. The loans are collateralized by cash and/or U.S. Treasury and federal agency obligations in an amount typically at least equal to the market value of the securities loaned. The market value of the loaned securities is determined at the close of business of the fund and any additional required collateral is delivered to the fund on the next business day. State Street provides the fund with indemnification against Borrower default. The fund bears the risk of loss with respect to the investment of cash collateral. On loans collateralized by cash, the cash collateral is invested in a money market fund or short-term securities. A portion of the income generated upon investment of the collateral is remitted to the Borrowers, and the remainder is allocated between the fund and the lending agent. On loans
14
MFS International Growth Portfolio
Notes to Financial Statements – continued
collateralized by U.S. Treasury and/or federal agency obligations, a fee is received from the Borrower, and is allocated between the fund and the lending agent. Income from securities lending is included in interest income on the Statement of Operations. The dividend and interest income earned on the securities loaned is accounted for in the same manner as other dividend and interest income.
Indemnifications – Under the fund’s organizational documents, its officers and Trustees may be indemnified against certain liabilities and expenses arising out of the performance of their duties to the fund. Additionally, in the normal course of business, the fund enters into agreements with service providers that may contain indemnification clauses. The fund’s maximum exposure under these agreements is unknown as this would involve future claims that may be made against the fund that have not yet occurred.
Investment Transactions and Income – Investment transactions are recorded on the trade date. Interest income is recorded on the accrual basis. Dividends received in cash are recorded on the ex-dividend date. Certain dividends from foreign securities will be recorded when the fund is informed of the dividend if such information is obtained subsequent to the ex-dividend date. Dividend and interest payments received in additional securities are recorded on the ex-dividend or ex-interest date in an amount equal to the value of the security on such date.
The fund may receive proceeds from litigation settlements. Any proceeds received from litigation involving portfolio holdings are reflected in the Statement of Operations in realized gain/loss if the security has been disposed of by the fund or in unrealized gain/loss if the security is still held by the fund. Any other proceeds from litigation not related to portfolio holdings are reflected as other income in the Statement of Operations.
Fees Paid Indirectly – The fund’s custody fee may be reduced according to an arrangement that measures the value of cash deposited with the custodian by the fund. This amount, for the year ended December 31, 2010, is shown as a reduction of total expenses on the Statement of Operations.
Tax Matters and Distributions – The fund intends to qualify as a regulated investment company, as defined under Subchapter M of the Internal Revenue Code, and to distribute all of its taxable income, including realized capital gains. As a result, no provision for federal income tax is required. The fund’s federal tax returns for the prior three fiscal years remain subject to examination by the Internal Revenue Service. Foreign taxes, if any, have been accrued by the fund in the accompanying financial statements.
Distributions to shareholders are recorded on the ex-dividend date. Income and capital gain distributions are determined in accordance with income tax regulations, which may differ from U.S. generally accepted accounting principles. Certain capital accounts in the financial statements are periodically adjusted for permanent differences in order to reflect their tax character. These adjustments have no impact on net assets or net asset value per share. Temporary differences which arise from recognizing certain items of income, expense, gain or loss in different periods for financial statement and tax purposes will reverse at some time in the future. Distributions in excess of net investment income or net realized gains are temporary overdistributions for financial statement purposes resulting from differences in the recognition or classification of income or distributions for financial statement and tax purposes.
Book/tax differences primarily relate to wash sale loss deferrals.
The tax character of distributions declared to shareholders for the last two fiscal years is as follows:
| | | | | | | | |
| | | 12/31/10 | | | 12/31/09 | |
| Ordinary income (including any short-term capital gains) | | | $1,936,143 | | | | $1,417,238 | |
The federal tax cost and the tax basis components of distributable earnings were as follows:
| | | | |
| As of 12/31/10 | | | | |
| Cost of investments | | | $218,951,945 | |
| Gross appreciation | | | 39,401,120 | |
| Gross depreciation | | | (7,024,106 | ) |
| Net unrealized appreciation (depreciation) | | | $32,377,014 | |
| Undistributed ordinary income | | | 4,590,472 | |
| Undistributed long-term capital gain | | | 18,333,928 | |
| Other temporary differences | | | (41,541 | ) |
Multiple Classes of Shares of Beneficial Interest – The fund offers multiple classes of shares, which differ in their respective distribution and/or service fees. The fund’s income, realized and unrealized gain (loss), and common expenses are allocated to shareholders based on the daily net assets of each class. Dividends are declared separately for each class. Differences in per
15
MFS International Growth Portfolio
Notes to Financial Statements – continued
share dividend rates are generally due to differences in separate class expenses. The fund’s distributions declared to shareholders as reported on the Statements of Changes in Net Assets are presented by class as follows:
| | | | | | | | |
| | | From net investment
income | |
| | | Year ended
12/31/10 | | | Year ended
12/31/09 | |
| Initial Class | | | $1,752,956 | | | | $1,263,603 | |
| Service Class | | | 183,187 | | | | 153,635 | |
| Total | | | $1,936,143 | | | | $1,417,238 | |
| (3) | | Transactions with Affiliates |
Investment Adviser – The fund has an investment advisory agreement with MFS to provide overall investment management and related administrative services and facilities to the fund. The management fee is computed daily and paid monthly at the following annual rates:
| | | | |
| First $1 billion of average daily net assets | | | 0.90% | |
| Next $1 billion of average daily net assets | | | 0.80% | |
| Average daily net assets in excess of $2 billion | | | 0.70% | |
The management fee incurred for the year ended December 31, 2010 was equivalent to an annual effective rate of 0.90% of the fund’s average daily net assets.
The investment adviser has agreed to pay a portion of the fund’s total annual operating expenses, exclusive of interest, taxes, extraordinary expenses, brokerage and transaction costs and investment-related expenses, such that total annual operating expenses do not exceed 1.35% of average daily net assets for the Initial Class shares and 1.60% of average daily net assets for the Service Class shares. This written agreement will continue until April 30, 2012. For the year ended December 31, 2010, the fund’s actual operating expenses did not exceed the limit and therefore, the investment adviser did not pay any portion of the fund’s expenses related to this agreement.
Distributor – MFS Fund Distributors, Inc. (MFD), a wholly-owned subsidiary of MFS, is the distributor of shares of the fund. The Trustees have adopted a distribution plan for the Service Class shares pursuant to Rule 12b-1 under the Investment Company Act of 1940.
The fund’s distribution plan provides that the fund will pay MFD distribution and/or service fees equal to 0.25% per annum of its average daily net assets attributable to Service Class shares as partial consideration for services performed and expenses incurred by MFD and financial intermediaries (including participating insurance companies that invest in the fund to fund variable annuity and variable life insurance contracts, sponsors of qualified retirement and pension plans that invest in the fund, and affiliates of these participating insurance companies and plan sponsors) in connection with the sale and distribution of the Service Class shares. MFD may subsequently pay all, or a portion, of the distribution and/or service fees to financial intermediaries.
Shareholder Servicing Agent – MFS Service Center, Inc. (MFSC), a wholly-owned subsidiary of MFS, receives a fee from the fund for its services as shareholder servicing agent. For the year ended December 31, 2010, the fee was $27,323, which equated to 0.0115% annually of the fund’s average daily net assets. MFSC also receives payment from the fund for out-of-pocket expenses paid by MFSC on behalf of the fund. For the year ended December 31, 2010, these costs amounted to $28.
Administrator – MFS provides certain financial, legal, shareholder communications, compliance, and other administrative services to the fund. Under an administrative services agreement, the fund partially reimburses MFS the costs incurred to provide these services. The fund is charged an annual fixed amount of $10,000 plus a fee based on average daily net assets. The administrative services fee incurred for the year ended December 31, 2010 was equivalent to an annual effective rate of 0.0357% of the fund’s average daily net assets.
Trustees’ and Officers’ Compensation – The fund pays compensation to Trustees in the form of a retainer, attendance fees, and additional compensation to the Board chairperson. The fund does not pay compensation directly to officers of the fund who are also officers of the investment adviser, all of whom receive remuneration for their services to the fund from MFS. Certain officers of the fund are officers or directors of MFS, MFD, and MFSC.
Other – This fund and certain other funds managed by MFS (the funds) have entered into services agreements (the Agreements) which provide for payment of fees by the funds to Tarantino LLC and Griffin Compliance LLC in return for the provision of services of an Independent Chief Compliance Officer (ICCO) and Assistant ICCO, respectively, for the funds. The ICCO and Assistant ICCO are officers of the funds and the sole members of Tarantino LLC and Griffin Compliance LLC, respectively. The funds can terminate the Agreements with Tarantino LLC and Griffin Compliance LLC at any time under the
16
MFS International Growth Portfolio
Notes to Financial Statements – continued
terms of the Agreements. MFS has agreed to bear all expenses associated with office space, other administrative support, and supplies provided to the ICCO and Assistant ICCO. For the year ended December 31, 2010, the aggregate fees paid by the fund to Tarantino LLC and Griffin Compliance LLC were $4,065 and are included in miscellaneous expense on the Statement of Operations.
The fund invests in the MFS Institutional Money Market Portfolio which is managed by MFS and seeks a high level of current income consistent with preservation of capital and liquidity. Income earned on this investment is included in dividends from underlying funds on the Statement of Operations. This money market fund does not pay a management fee to MFS.
Purchases and sales of investments, other than U.S. Government securities, purchased option transactions, and short-term obligations, aggregated $163,081,395 and $151,266,931, respectively.
| (5) | | Shares of Beneficial Interest |
The fund’s Declaration of Trust permits the Trustees to issue an unlimited number of full and fractional shares of beneficial interest. Transactions in fund shares were as follows:
| | | | | | | | | | | | | | | | |
| | | Year ended 12/31/10 | | | Year ended 12/31/09 | |
| | | Shares | | | Amount | | | Shares | | | Amount | |
| Shares sold | | | | | | | | | | | | | | | | |
Initial Class | | | 5,318,787 | | | | $62,995,452 | | | | 6,779,227 | | | | $67,075,450 | |
Service Class | | | 529,150 | | | | 6,406,687 | | | | 615,094 | | | | 6,459,951 | |
| | | 5,847,937 | | | | $69,402,139 | | | | 7,394,321 | | | | $73,535,401 | |
| Shares issued to shareholders in reinvestment of distributions | | | | | | | | | | | | | | | | |
Initial Class | | | 142,981 | | | | $1,752,956 | | | | 148,834 | | | | $1,263,603 | |
Service Class | | | 15,004 | | | | 183,187 | | | | 18,182 | | | | 153,635 | |
| | | 157,985 | | | | $1,936,143 | | | | 167,016 | | | | $1,417,238 | |
| Shares reacquired | | | | | | | | | | | | | | | | |
Initial Class | | | (4,301,835 | ) | | | $(55,307,266 | ) | | | (1,869,251 | ) | | | $(18,228,127 | ) |
Service Class | | | (532,563 | ) | | | (6,437,650 | ) | | | (408,327 | ) | | | (3,829,445 | ) |
| | | (4,834,398 | ) | | | $(61,744,916 | ) | | | (2,277,578 | ) | | | $(22,057,572 | ) |
| Net change | | | | | | | | | | | | | | | | |
Initial Class | | | 1,159,933 | | | | $9,441,142 | | | | 5,058,810 | | | | $50,110,926 | |
Service Class | | | 11,591 | | | | 152,224 | | | | 224,949 | | | | 2,784,141 | |
| | | 1,171,524 | | | | $9,593,366 | | | | 5,283,759 | | | | $52,895,067 | |
The fund and certain other funds managed by MFS participate in a $1.1 billion unsecured committed line of credit, subject to a $1 billion sublimit, provided by a syndication of banks under a credit agreement. Borrowings may be made for temporary financing needs. Interest is charged to each fund, based on its borrowings, generally at a rate equal to the higher of the Federal Reserve funds rate or one month LIBOR plus an agreed upon spread. A commitment fee, based on the average daily, unused portion of the committed line of credit, is allocated among the participating funds at the end of each calendar quarter. In addition, the fund and other funds managed by MFS have established unsecured uncommitted borrowing arrangements with certain banks for temporary financing needs. Interest is charged to each fund, based on its borrowings, at a rate equal to the Federal Reserve funds rate plus an agreed upon spread. For the year ended December 31, 2010, the fund’s commitment fee and interest expense were $2,642 and $1,959, respectively, and are included in miscellaneous expense on the Statement of Operations.
17
MFS International Growth Portfolio
Notes to Financial Statements – continued
| (7) | | Transactions in Underlying Funds – Affiliated Issuers |
An affiliated issuer may be considered one in which the fund owns 5% or more of the outstanding voting securities, or a company which is under common control. For the purposes of this report, the fund assumes the following to be affiliated issuers:
| | | | | | | | | | | | | | |
| Underlying Funds | | Beginning
Shares/Par
Amount | | Acquisitions
Shares/Par
Amount | | | Dispositions
Shares/Par
Amount | | | Ending
Shares/Par
Amount | |
| MFS Institutional Money Market Portfolio | | 4,001,551 | | | 67,229,368 | | | | (69,107,158 | ) | | | 2,123,761 | |
| | | | |
| Underlying Funds | | Realized
Gain (Loss) | | Capital Gain
Distributions | | | Dividend
Income | | | Ending
Value | |
| MFS Institutional Money Market Portfolio | | $— | | | $— | | | | $8,172 | | | | $2,123,761 | |
18
MFS International Growth Portfolio
REPORT OF INDEPENDENT REGISTERED PUBLIC ACCOUNTING FIRM
To the Board of Trustees of MFS Variable Insurance Trust II and the Shareholders of
MFS International Growth Portfolio:
We have audited the accompanying statement of assets and liabilities, including the portfolio of investments, of MFS International Growth Portfolio (the “Fund”) (one of the portfolios comprising MFS Variable Insurance Trust II) as of December 31, 2010, and the related statement of operations for the year then ended, the statements of changes in net assets for each of the two years in the period then ended, and the financial highlights for each of the five years in the period then ended. These financial statements and financial highlights are the responsibility of the Fund’s management. Our responsibility is to express an opinion on these financial statements and financial highlights based on our audits.
We conducted our audits in accordance with the standards of the Public Company Accounting Oversight Board (United States). Those standards require that we plan and perform the audit to obtain reasonable assurance about whether the financial statements and financial highlights are free of material misstatement. The Fund is not required to have, nor were we engaged to perform, an audit of its internal control over financial reporting. Our audits included consideration of internal control over financial reporting as a basis for designing audit procedures that are appropriate in the circumstances, but not for the purpose of expressing an opinion on the effectiveness of the Fund’s internal control over financial reporting. Accordingly, we express no such opinion. An audit also includes examining, on a test basis, evidence supporting the amounts and disclosures in the financial statements, assessing the accounting principles used and significant estimates made by management, as well as evaluating the overall financial statement presentation. Our procedures included confirmation of securities owned as of December 31, 2010, by correspondence with the custodian and brokers; where replies were not received from brokers, we performed other auditing procedures. We believe that our audits provide a reasonable basis for our opinion.
In our opinion, the financial statements and financial highlights referred to above present fairly, in all material respects, the financial position of MFS International Growth Portfolio as of December 31, 2010, the results of its operations for the year then ended, the changes in its net assets for each of the two years in the period then ended, and the financial highlights for each of the five years in the period then ended, in conformity with accounting principles generally accepted in the United States of America.
DELOITTE & TOUCHE LLP
Boston, Massachusetts
February 14, 2011
19
MFS International Growth Portfolio
TRUSTEES AND OFFICERS – IDENTIFICATION AND BACKGROUND
The Trustees and officers of the Trust, as of February 1, 2011, are listed below, together with their principal occupations during the past five years. (Their titles may have varied during that period.) The address of each Trustee and officer is 500 Boylston Street, Boston, Massachusetts 02116.
| | | | | | |
Name, Date of Birth | | Position(s) Held
with Fund | | Trustee/Officer
Since (1) | | Principal Occupations During the Past Five Years and
Other Directorships (2) |
| INTERESTED TRUSTEE | | | | |
David D. Horn (3) (born 6/07/41) | | Trustee | | April 1986 | | Private investor; Sun Life Assurance Company of Canada, Senior Vice President and General Manager for the United States (until 1997); Director (until March 2004) |
| | |
| INDEPENDENT TRUSTEES | | | | |
J. Kermit Birchfield (born 1/08/40) | | Chairman | | May 1997 | | Consultant; Century Partners, Inc. (investments), Director; Displaytech, Inc. (technology), Chairman; Dessin Fournir LLC (furniture manufacturer), Director; Site Watch LLC (software to monitor oil tanks), Managing Director (2006 to present); Juridica Investments (fund investing in judicial matters), Director (2007 to present), Immuno Science, Inc. (medical research), Independent Director (2009 to present), Intermountain Industries, Inc. (oil & gas exploration and production), Director (until February 2009) |
| | | |
Robert C. Bishop (born 1/13/43) | | Trustee | | May 2001 | | AutoImmune, Inc. (pharmaceutical product development), Chairman, President and Chief Executive Officer; Caliper Life Sciences Corp. (laboratory analytical instruments), Chairman; Optobionics Corporation (ophthalmic devices), Director (until 2007); Millipore Corporation (purification/filtration products), Director (until July 2010); Waterstreet Capital (leverage buyouts), Advisory Board (until August 2010) |
| | | |
Frederick H. Dulles (born 3/12/42) | | Trustee | | May 2001 | | Dulles International Law LLC (law firm), Senior Lawyer (since 2009); Juridica Capital Management (US) Inc. (litigation financing), Vice President and General Counsel (since 2009); Dulles Properties LLC (real estate), Broker (since 2008); The Citadel School of Business Administration (education), Adjunct Professor (since 2003); Disher, Hamrick & Myers Residential, Inc. (real estate), Broker (until 2006); Frederick H. Dulles Law Practice (law firm), (until 2006); Charlestown School of Law (education), Adjunct Professor (until 2007); Prudential Carolina Real Estate, (real estate), Broker (until 2008); Free Enterprise Foundation Inc. (research institute), Director & Secretary (until 2008); Ten State International Law PLLP (law firm), Of Counsel (until 2009) |
| | | |
Marcia A. Kean (born 6/30/48) | | Trustee | | April 2005 | | Feinstein Kean Healthcare (consulting), Chief Executive Officer |
| | | |
Ronald G. Steinhart (born 6/15/40) | | Trustee | | May 2001 | | Private investor; Penske Automotive Group (automotive retailer), Director; Animal Health International, Inc. (animal health products), Director (since 2007); Texas Industries (concrete/aggregates/cement), Director (since 2007); Susser Holdings Corporation (retail convenience stores and distributor of wholesale motor fuel), Director (since 2009); Prentiss Properties Trust (real estate investment trust), Director (until 2006); Penson Worldwide, Inc. (securities clearance), Director (until 2008) |
| | | |
Haviland Wright (born 7/21/48) | | Trustee | | May 2001 | | X-Change Corp. (multi-media web services), Director (since 2010); Nano Loa Inc. (liquid crystal displays), Director (until 2009); Profitability of Hawaii (software), Chief Development Officer (until 2010); Elixir Technologies Corporation (software), Director (until 2010) |
| | | |
| OFFICERS | | | | | | |
Maria F. DiOrioDwyer (4)
(born 12/01/58) | | President | | November 2005 | | Massachusetts Financial Services Company, Executive Vice President and Chief Regulatory Officer; Chief Compliance Officer (since December 2006) |
| | | |
| Christopher R. Bohane (4) (born 1/18/74) | | Assistant Secretary and Assistant Clerk | | July 2005 | | Massachusetts Financial Services Company, Vice President and Senior Counsel |
| | | |
John M. Corcoran (4) (born 4/13/65) | | Treasurer | | October 2008 | | Massachusetts Financial Services Company, Senior Vice President (since October 2008); State Street Bank and Trust (financial services provider), Senior Vice President, (until September 2008) |
| | | |
Ethan D. Corey (4) (born 11/21/63) | | Assistant Secretary and Assistant Clerk | | July 2005 | | Massachusetts Financial Services Company, Senior Vice President and Associate General Counsel |
| | | |
David L. DiLorenzo (4) (born 8/10/68) | | Assistant Treasurer | | July 2005 | | Massachusetts Financial Services Company, Vice President |
| | | |
Timothy M. Fagan (4) (born 7/10/68) | | Assistant Secretary and Assistant Clerk | | September 2005 | | Massachusetts Financial Services Company, Vice President and Senior Counsel |
| | | |
Mark D. Fischer (4) (born 10/27/70) | | Assistant Treasurer | | July 2005 | | Massachusetts Financial Services Company, Vice President |
20
MFS International Growth Portfolio
Trustees and Officers – continued
| | | | | | |
Name, Date of Birth | | Position(s) Held
with Fund | | Trustee/Officer
Since (1) | | Principal Occupations During the Past Five Years and
Other Directorships (2) |
Robyn L. Griffin (born 7/04/75) | | Assistant Independent Chief Compliance Officer | | August 2008 | | Griffin Compliance LLC (provider of compliance services), Principal (since August 2008); State Street Corporation (financial services provider), Mutual Fund Administration Assistant Vice President (October 2006 – July 2008); Liberty Mutual Group (insurance), Personal Market Assistant Controller (April 2006 – October 2006); Deloitte & Touche LLP (professional services firm), Senior Manager (prior to April 2006) |
| | | |
Brian E. Langenfeld (4) (born 3/07/73) | | Assistant Secretary and Assistant Clerk | | May 2006 | | Massachusetts Financial Services Company, Vice President and Senior Counsel (since May 2006); John Hancock Advisers, LLC, Assistant Vice President and Counsel (until April 2006) |
| | | |
Ellen Moynihan (4) (born 11/13/57) | | Assistant Treasurer | | May 1997 | | Massachusetts Financial Services Company, Senior Vice President |
| | | |
Susan S. Newton (4) (born 3/07/50) | | Assistant Secretary and Assistant Clerk | | May 2005 | | Massachusetts Financial Services Company, Senior Vice President and Associate General Counsel |
| | | |
Susan A. Pereira (4)
(born 11/05/70) | | Assistant Secretary and Assistant Clerk | | July 2005 | | Massachusetts Financial Services Company, Vice President and Senior Counsel |
| | | |
Mark N. Polebaum (4) (born 5/01/52) | | Secretary and Clerk | | February 2006 | | Massachusetts Financial Services Company, Executive Vice President, General Counsel and Secretary (since January 2006); Wilmer Cutler Pickering Hale and Dorr LLP (law firm), Partner (until January 2006) |
| | | |
Frank L. Tarantino (born 3/07/44) | | Independent Chief Compliance Officer | | September 2004 | | Tarantino LLC (provider of compliance services), Principal |
| | | |
Richard S. Weitzel (4) (born 7/16/70) | | Assistant Secretary and Assistant Clerk | | October 2007 | | Massachusetts Financial Services Company, Vice President and Assistant General Counsel |
| | | |
James O. Yost (4) (born 6/12/60) | | Assistant Treasurer | | April 1992 | | Massachusetts Financial Services Company, Senior Vice President |
| (1) | Date first appointed to serve as Trustee/Officer of an MFS fund or a Compass variable account. Each Trustee has served continuously since appointment. For the period March 2008 until October 2008, Ms. DiOrioDwyer served as Treasurer of the Funds. |
| (2) | Directorships or trusteeships of companies required to report to the Securities and Exchange Commission (i.e., “public companies”). |
| (3) | “Interested person” of the Trust, within the meaning of the Investment Company Act of 1940 (referred to as the 1940 Act), which is the principal federal law governing investment companies like the Trust, as a result of position with Sun Life of Canada (U.S.). The address of Sun Life of Canada (U.S.) is One Sun Life Executive Park, Wellesley Hills, Massachusetts 02481. |
| (4) | “Interested person” of MFS within the meaning of the 1940 Act. The address of MFS is 500 Boylston Street, Boston, Massachusetts 02116. |
The Trust does not hold annual meetings for the purpose of electing Trustees, and Trustees are not elected for fixed terms. Each Trustee and officer holds office until his or her successor is chosen and qualified, or until his or her earlier death, resignation, retirement or removal.
All Trustees currently serve as Trustees of the Trust and have served in that capacity since originally elected or appointed. All of the Trustees are also Managers of the Compass Variable Accounts. The executive officers of the Trust hold similar offices for the Compass Variable Accounts and other funds in the MFS fund complex. As of January 1, 2011, each Trustee serves as a Trustee or Manager of 31 Accounts/Portfolios.
21
MFS International Growth Portfolio
Trustees and Officers – continued
The Statement of Additional Information contains further information about the Trustees and is available without charge upon request by calling 1-800-752-7215.
| | |
Investment Adviser
Massachusetts Financial Services Company 500 Boylston Street, Boston, MA 02116-3741 | | Custodian State Street Bank and Trust 1 Lincoln Street, Boston, MA 02111-2900 |
Distributor
MFS Fund Distributors, Inc. 500 Boylston Street, Boston, MA 02116-3741 | | Independent Registered Public Accounting Firm Deloitte & Touche LLP 200 Berkeley Street, Boston, MA 02116 |
Portfolio Manager David Antonelli | | |
22
MFS International Growth Portfolio
BOARD REVIEW OF INVESTMENT ADVISORY AGREEMENT
The Investment Company Act of 1940 requires that both the full Board of Trustees and a majority of the non-interested (“independent”) Trustees, voting separately, annually approve the continuation of the investment advisory agreement between MFS Variable Insurance Trust II (the “Trust”) and Massachusetts Financial Services Company (“MFS”) on behalf of the Fund. The Trustees consider matters bearing on the Fund and the advisory arrangement at their meetings throughout the year, including a review of performance data at each regular meeting. In addition, the independent Trustees met in person in May and again in July 2010 (“contract review meetings”) for the specific purpose of considering whether to approve the continuation of the investment advisory agreement for the Fund. The independent Trustees were assisted in their evaluation of the investment advisory agreement by independent legal counsel, from whom they received separate legal advice and with whom they met separately from MFS management during various contract review meetings. The independent Trustees were also assisted in this process by the Fund’s Independent Chief Compliance Officer, a full-time senior officer appointed by and reporting to the independent Trustees.
In connection with their deliberations, the Trustees, including the independent Trustees, considered such information and factors as they believed, in light of the legal advice furnished to them and their own business judgment, to be relevant. The investment advisory agreement was considered separately for the Fund, although the Trustees also took into account the common interests of all Funds in the Trust in their review. As described below, the Trustees considered the nature, quality, and extent of the various investment advisory, administrative, and shareholder services performed by MFS under the existing investment advisory agreement and other arrangements with the Trust.
In connection with their contract review meetings, the Trustees received and relied upon materials which included, among other items: (i) information provided by Lipper Inc. on the investment performance of the Fund for various time periods ended December 31, 2009, compared to the investment performance of a group of funds with substantially similar investment classifications/objectives (the “Lipper performance universe”), (ii) information provided by Lipper Inc. on the Fund’s advisory fees and other expenses compared to the advisory fees and other expenses of comparable funds identified by Lipper (the “Lipper expense group”), (iii) information provided by MFS on the advisory fees of comparable portfolios of its other clients, including institutional separate account and other clients, (iv) information as to whether, and to what extent applicable, expense waivers, reimbursements or fee “breakpoints” are observed for the Fund, (v) information regarding MFS’ financial results and financial condition, including MFS’ and certain of its affiliates’ estimated profitability from services performed for the Fund, (vi) MFS’ views regarding the outlook for the mutual fund industry and its strategic business plans, (vii) descriptions of various functions performed by MFS for the Trust, such as compliance monitoring and portfolio trading practices, and (viii) information regarding the overall organization of MFS, including information about MFS’ senior management and other personnel providing investment advisory, administrative and other services to the Fund. The comparative performance, fee and expense information prepared and provided by Lipper Inc. was not independently verified, and the independent Trustees did not independently verify any information provided to them by MFS.
The Trustees’ conclusion as to the continuation of the investment advisory agreement was based on comprehensive consideration of all information provided to the Trustees and not the result of any single factor. Some of the factors that figured particularly in the Trustees’ deliberations are described below for the Fund, while individual Trustees may have given different weight to various factors and evaluated the information presented as a whole differently than another individual Trustee. The Trustees recognized that the fee arrangements for the Fund reflect years of review and discussion between the independent Trustees and MFS, that certain aspects of such arrangements may receive greater scrutiny in some years than others, and that the Trustees’ conclusions may be based, in part, on their consideration of these same arrangements during the course of the year and in prior years.
Based on information provided by Lipper Inc., the Trustees compared the Fund’s total return investment performance to the performance of the Lipper performance universe over various time periods. The Trustees placed particular emphasis on the total return performance of the Fund’s Initial Class shares in comparison to the performance of funds in its Lipper performance universe over the one-, three- and five-year periods ended December 31, 2009. The Trustees did not rely on performance results for more recent periods, including those shown elsewhere in this report.
The Trustees noted the performance of the Fund’s Initial Class shares was in the 2nd quintile relative to the other funds in the Lipper performance universe for the one-year period (the 1st quintile being the best performers and the 5th quintile being the worst performers). The total return performance of the Fund was in the 1st quintile for the three-year period and the five-year period ended December 31, 2009, relative to the Lipper performance universe. Based on the nature and quality of services provided by MFS, the Board of Trustees concluded that the Fund’s performance was satisfactory.
23
MFS International Growth Portfolio
Board Review of Investment Advisory Agreement – continued
In the course of their deliberations, the Trustees took into account information provided by MFS during contract review meetings, as well as during investment review meetings conducted with portfolio management personnel during the course of the year.
In assessing the reasonableness of the Fund’s advisory fee, the Trustees considered, among other information, the Fund’s advisory fee and the total expense ratio of the Fund’s Initial Class shares as a percentage of average daily net assets, compared to the advisory fee and total expense ratios of its peer group of funds based on information provided by Lipper Inc. The Trustees also considered the advisory fees charged by MFS to institutional accounts. In comparing these fees, the Trustees considered the generally broader scope of services provided by MFS to the Trust than those provided to institutional accounts. The Trustees also considered the higher demands placed on MFS’ investment personnel and trading infrastructure as a result of the daily cash in-flows and out-flows of the Fund, and the impact on MFS and related expenses due to the more extensive regulatory regime to which the Fund is subject, compared to institutional accounts.
In considering the fees, the Trustees noted from the Lipper data that the Fund’s effective advisory fee rate was approximately at the median and total expense ratio was above the median of such fees and expenses of funds in the Lipper expense group. In addition, the Trustees accepted MFS’ offer to continue the expense limitation for the Fund, and concluded that the existing breakpoints were sufficient to allow the Fund to benefit from economies of scale as its assets grow. The Trustees concluded that the fees were reasonable in light of the nature and quality of services provided.
The Trustees also considered information prepared by MFS relating to its costs and profits with respect to the Fund and other investment companies and accounts advised by MFS, as well as MFS’ methodologies used to determine and allocate its costs to the Fund and other accounts and products for purposes of estimating profitability.
After reviewing these and other factors described below, the Trustees concluded that the advisory fees charged to the Fund represent reasonable compensation in light of the nature and quality of the services being provided by MFS.
In addition, the Trustees considered MFS’ resources and related efforts to continue to retain, attract and motivate capable personnel to serve the Fund. The Trustees also considered the financial resources of MFS and its parent, Sun Life Financial Inc. The Trustees further considered any advantages and possible disadvantages of having an adviser which also serves other investment companies as well as institutional accounts.
The Trustees also considered the nature, quality, cost, and extent of administrative, transfer agency, and distribution services provided to the Fund by MFS and its affiliates under agreements and plans other than the investment advisory agreement, including the 12b-1 fees the Fund pays to MFS Fund Distributors, Inc., an affiliate of MFS. The Trustees also considered the nature, extent and quality of certain other services MFS performs or arranges on the Fund’s behalf, which may include securities lending programs, directed expense payment programs, class action recovery programs, and MFS’ interaction with third-party service providers, principally custodians and sub-custodians. The Trustees concluded that the various non-advisory services provided by MFS and its affiliates on behalf of the Fund were satisfactory. The Trustees also considered the benefits to MFS from the use of the Fund’s portfolio brokerage commissions to pay for investment research and various other factors. Additionally, the Trustees considered so-called “fall-out benefits” to MFS such as reputational value derived from serving as investment manager to the Trust, and determined that any such benefits derived by MFS were reasonable and fair.
Based on their evaluation of factors that they deemed to be material, including those factors described above, the Board of Trustees, including a majority of the independent Trustees, concluded that the investment advisory agreement should be continued for an additional one-year period, commencing September 1, 2010.
A discussion regarding the Board’s most recent review and renewal of the fund’s Investment Advisory Agreement with MFS is available by clicking on the fund’s name under “Variable Insurance Portfolios — VIT II” in the “Products and Performance” section of the MFS Web site (mfs.com).
24
MFS International Growth Portfolio
PROXY VOTING POLICIES AND INFORMATION
A general description of the MFS funds’ proxy voting policies and procedures is available without charge, upon request, by calling
1-800-225-2606, by visiting the Proxy Voting section of mfs.com or by visiting the SEC’s Web site at http://www.sec.gov.
Information regarding how the fund voted proxies relating to portfolio securities during the most recent twelve-month period ended June 30 is available without charge by visiting the Proxy Voting section of mfs.com or by visiting the SEC’s Web site at http://www.sec.gov.
QUARTERLY PORTFOLIO DISCLOSURE
The fund will file a complete schedule of portfolio holdings with the Securities and Exchange Commission (the Commission) for the first and third quarters of each fiscal year on Form N-Q. The fund’s Form N-Q may be reviewed and copied at the:
Public Reference Room
Securities and Exchange Commission
100 F Street, NE, Room 1580
Washington, D.C. 20549
Information on the operation of the Public Reference Room may be obtained by calling the Commission at 1-800-SEC-0330. The fund’s Form N-Q is available on the EDGAR database on the Commission’s Internet Web site at http://www.sec.gov, and copies of this information may be obtained, upon payment of a duplicating fee, by electronic request at the following e-mail address: publicinfo@sec.gov or by writing the Public Reference Section at the above address.
FURTHER INFORMATION
From time to time, MFS may post important information about the fund or the MFS funds on the MFS web site (mfs.com). This information is available by visiting the “News & Commentary” section of mfs.com or by clicking on the fund’s name under “Variable Insurance Portfolios — VIT II” in the “Products and Performance” section of mfs.com.
FEDERAL TAX INFORMATION (unaudited)
The following information is provided pursuant to provisions of the Internal Revenue Code.
Income derived from foreign sources was $5,137,916. The fund intends to pass through foreign tax credits of $459,820 for the fiscal year.
25
MFS International Growth Portfolio
MFS® PRIVACY NOTICE
Privacy is a concern for every investor today. At MFS Investment Management® and the MFS funds, we take this concern very seriously. We want you to understand our policies about the investment products and services that we offer, and how we protect the nonpublic personal information of investors who have a direct relationship with us and our wholly owned subsidiaries.
Throughout our business relationship, you provide us with personal information. We maintain information and records about you, your investments, and the services you use. Examples of the nonpublic personal information we maintain include
| | Ÿ | | data from investment applications and other forms |
| | Ÿ | | share balances and transactional history with us, our affiliates, or others |
| | Ÿ | | facts from a consumer reporting agency |
We do not disclose any nonpublic personal information about our customers or former customers to anyone, except as permitted by law. We may share nonpublic personal information with third parties or certain of our affiliates in connection with servicing your account or processing your transactions. We may share information with companies or financial institutions that perform marketing services on our behalf or with other financial institutions with which we have joint marketing arrangements, subject to any legal requirements.
Authorization to access your nonpublic personal information is limited to appropriate personnel who provide products, services, or information to you. We maintain physical, electronic, and procedural safeguards to help protect the personal information we collect about you.
If you have any questions about the MFS privacy policy, please call 1-800-225-2606 any business day.
Note: If you own MFS products or receive MFS services in the name of a third party such as a bank or broker-dealer, their privacy policy may apply to you instead of ours.
26


MFS® BLENDED RESEARCH® CORE EQUITY PORTFOLIO
The report is prepared for the general information of contract owners. It is authorized for distribution to prospective investors only when preceded or accompanied by a current prospectus.
NOT FDIC INSURED Ÿ MAY LOSE VALUE Ÿ NO BANK GUARANTEE Ÿ NOT A DEPOSIT Ÿ NOT INSURED BY ANY FEDERAL GOVERNMENT AGENCY OR NCUA/NCUSIF
MFS Blended Research Core Equity Portfolio
LETTER FROM THE CEO

Dear Contract Owners:
After an extended rebound in the financial markets, uncertainty returned in 2010 as investors began to question the durability of the recovery for global economies and markets. That uncertainty led to increased risk aversion, especially as investors saw the eurozone struggle with the debt woes of many of its members. In September, the U.S. Federal Reserve Board’s promises to further loosen monetary policy helped assuage market fears and drive asset prices off their recent lows. A combination of solid earnings and improving economic data gave an additional boost to investor sentiment. As we enter 2011, we are cautiously optimistic that economic growth will continue to improve and that the global economies will recover from the shocks of the past few years. We expect the pace of recovery worldwide will be uneven and volatile.
As always, we continue to be mindful of the many economic challenges faced at the local, national, and international levels. It is in times such as these that we want to remind investors of the merits of maintaining a long-term view, adhering to basic investing principles such as asset allocation and diversification, and working closely with their advisors to research and identify appropriate investment opportunities.
Respectfully,

Robert J. Manning
Chairman and Chief Executive Officer
MFS Investment Management®
February 14, 2011
The opinions expressed in this letter are subject to change, may not be relied upon for investment advice, and no forecasts can be guaranteed.
1
MFS Blended Research Core Equity Portfolio
PORTFOLIO COMPOSITION
Portfolio structure

| | | | |
| Top ten holdings | | | | |
| Exxon Mobil Corp. | | | 4.3% | |
| Apple, Inc. | | | 3.6% | |
| Chevron Corp. | | | 2.7% | |
| Bank of America Corp. | | | 2.3% | |
| Google, Inc., “A” | | | 2.2% | |
| Oracle Corp. | | | 2.1% | |
| Intel Corp. | | | 1.9% | |
| Procter & Gamble Co. | | | 1.9% | |
| JPMorgan Chase & Co. | | | 1.7% | |
| Abbott Laboratories | | | 1.6% | |
| | | | |
| Equity sectors | | | | |
| Technology | | | 16.8% | |
| Financial Services | | | 16.7% | |
| Energy | | | 11.5% | |
| Health Care | | | 11.2% | |
| Consumer Staples | | | 9.6% | |
| Industrial Goods & Services | | | 6.4% | |
| Utilities & Communications | | | 5.9% | |
| Retailing | | | 5.7% | |
| Leisure | | | 5.6% | |
| Basic Materials | | | 4.3% | |
| Autos & Housing | | | 3.0% | |
| Transportation | | | 2.3% | |
| Special Products & Services | | | 0.6% | |
Percentages are based on net assets as of 12/31/10.
The portfolio is actively managed and current holdings may be different.
2
MFS Blended Research Core Equity Portfolio
MANAGEMENT REVIEW
Summary of Results
For the twelve months ended December 31, 2010, Initial Class shares of the MFS Blended Research Core Equity Portfolio (the “fund”) provided a total return of 16.46%, while Service Class shares provided a total return of 16.12%. These compare with a return of 15.06% for the fund’s benchmark, the Standard & Poor’s 500 Stock Index (“S&P 500 Index”).
Market Environment
The first quarter of the reporting period witnessed a continuation of the financial market and macroeconomic rebounds that had begun in early 2009. These recoveries in global activity and asset valuations were generally synchronized around the world, led importantly by emerging Asian economies, but broadening to include most of the global economy to varying degrees. Primary drivers of the recoveries included an unwinding of the inventory destocking that took place earlier, the production of manufacturing and capital goods, as well as massive fiscal and monetary stimulus.
During most of the remainder of the period, heightened risk surrounding the public-debt profiles of several of the peripheral European countries impaired market sentiment. At the same time, the improving trend in global macroeconomic data began to weaken somewhat. These two dynamics caused many asset prices to retrench significantly, as many questioned the durability of the global recovery.
Towards the end of the period, the U.S. Federal Reserve led markets to believe that further monetary loosening would be forthcoming if macroeconomic activity did not show signs of improvement. The prospects for more easing by the Fed improved market sentiment and drove risk-asset prices markedly higher. However, in a text-book case of “buy the rumor, sell the fact,” the weeks following the early November announcement of further quantitative easing saw a sell-off in U.S. Treasury bonds. This rise in Treasury yields occurred despite risk-off behavior in equities and credit markets (which would normally result in Treasury yield compression), and appears to have been the result of a few factors: signs of improved U.S. and global economic activity; opposition to quantitative easing from some quarters; and crowded long positions in U.S. Treasuries. The December agreement on an expansionary U.S. fiscal package also boosted sentiment, leading markets to reach near-term highs in risky asset valuations toward year end.
Contributors to Performance
Strong stock selection in the leisure sector contributed to the fund’s performance relative to the S&P 500 Index. Casino resorts operator Las Vegas Sands (b) and cruise line operator Royal Caribbean Cruises (b), both impressive performers, boosted relative returns. Shares of Las Vegas Sands outpaced industry peers during the latter part of the reporting period after announcing strong earnings that exceeded expectations. A new casino in Singapore, combined with strong growth throughout its casinos in Macau, contributed to the company’s strong results and investor optimism. In addition, the timing of our ownership in shares of media firm Time Warner Cable (h) aided relative results.
Favorable security selection in the retailing sector also bolstered relative performance. The fund’s ownership in shares of specialty retailer Limited Brands and an overweight position in strong-performing department store operator Macy’s supported returns. Shares of Limited Brands appreciated as the company experienced a rise in same store sales that beat expectations. In addition, the company announced a special dividend along with a new share repurchase program.
Stock selection in the technology & energy sectors was another positive factor for relative results. Within the technology sector, internet software service provider Akamai Technologies (h) was among the fund’s top relative contributors. Within the energy sector, oil and gas drilling equipment manufacturers National Oilwell Varco and Smith International (h) benefited relative performance. During the latter part of the reporting period, the stock price of National Oilwell Varco appreciated after the company posted better-than-expected quarterly earnings stemming from high oil and gas activity across North America. In addition, the company boosted its quarterly dividend during the quarter.
Elsewhere, the fund’s holdings of iron ore miner Cliffs Natural Resources and diversified technology and industrial company Johnson Controls aided relative returns.
Detractors from Performance
Stock selection in the health care sector detracted from relative performance. Holdings of medical device maker Medtronic, pharmaceutical and medical products maker Abbott Laboratories, respiratory therapy services provider Lincare Holdings (b)(h), and biotechnology firm Amgen were among the fund’s top relative detractors. Shares of Medtronic came under pressure due to weaker-than-expected sales, lower margins in its Cardiac Rhythm Management (CRM) business, and a reduction in management’s revenue guidance.
3
MFS Blended Research Core Equity Portfolio
Management Review – continued
Individual securities in other sectors that held back relative performance included publishing software company Adobe Systems (h), soft drink maker Dr Pepper Snapple Group, specialty consumer electronics retailer Best Buy, defense contractor Lockheed Martin, power generation company NRG Energy (h), and hard drives and storage solutions manufacturer Seagate Technology (b)(h).
Respectfully,
Matthew Krummell
Portfolio Manager
| (b) | Security is not a benchmark constituent. |
| (h) | Security was not held in the portfolio at period end. |
The views expressed in this report are those of the portfolio manager only through the end of the period of the report as stated on the cover and do not necessarily reflect the views of MFS or any other person in the MFS organization. These views are subject to change at any time based on market or other conditions, and MFS disclaims any responsibility to update such views. These views may not be relied upon as investment advice or an indication of trading intent on behalf of any MFS portfolio. References to specific securities are not recommendations of such securities, and may not be representative of any MFS portfolio’s current or future investments.
4
MFS Blended Research Core Equity Portfolio
PERFORMANCE SUMMARY THROUGH 12/31/10
The following chart illustrates the historical performance of the fund in comparison to its benchmark(s). Benchmarks are unmanaged and may not be invested in directly. Benchmark returns do not reflect any fees or expenses. The performance of other share classes will be greater than or less than that of the class depicted below. (See Notes to Performance Summary.)
Performance data shown represents past performance and is no guarantee of future results. Investment return and principal value fluctuate so your units, when sold, may be worth more or less than the original cost; current performance may be lower or higher than quoted. The performance shown does not reflect the deduction of taxes, if any, that a contract holder would pay on fund distributions or the redemption of contract units. The returns for the fund shown also do not reflect the deduction of expenses associated with variable products, such as mortality and expense risk charges, separate account charges, and sales charges imposed by the insurance company separate accounts. Such expenses would reduce the overall returns shown.
Growth of a Hypothetical $10,000 Investment
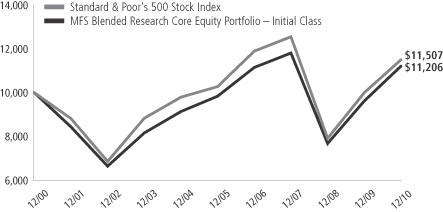
Total Returns through 12/31/10
Average annual total returns
| | | | | | | | | | | | | | |
| | | Share class | | Class inception date | | 1-yr | | 5-yr | | 10-yr | | Life (t) | | |
| | | Initial Class | | 11/14/86 | | 16.46% | | 2.64% | | 1.15% | | N/A | | |
| | | Service Class | | 8/24/01 | | 16.12% | | 2.38% | | N/A | | 2.63% | | |
| | | | | |
| Comparative benchmark | | | | | | | | | | |
| | | Standard & Poor’s 500 Stock Index (f) | | 15.06% | | 2.29% | | 1.41% | | N/A | | |
| (f) | Source: FactSet Research Systems Inc. |
| (t) | For the period from the class inception date through the stated period end (for those share classes with less than 10 years of performance history). No comparative benchmark performance information is provided for “life” periods. (See Notes to Performance Summary.) |
Benchmark Definition
Standard & Poor’s 500 Stock Index – a market capitalization-weighted index of 500 widely held equity securities, designed to measure broad U.S. equity performance.
It is not possible to invest directly in an index.
Notes to Performance Summary
Average annual total return represents the average annual change in value for each share class for the periods presented. Life returns are presented where the share class has less than 10 years of performance history and represent the average annual total return from the class inception date to the stated period end date. As the fund’s share classes may have different inception dates, the life returns may represent different time periods and may not be comparable. As a result, no comparative benchmark performance information is provided for life periods.
Performance results reflect any applicable expense subsidies and waivers in effect during the periods shown. Without such subsidies and waivers the fund’s performance results would be less favorable. Please see the prospectus and financial statements for complete details. All results are historical and assume the reinvestment of any dividends and capital gains distributions.
5
MFS Blended Research Core Equity Portfolio
Performance Summary – continued
Prior to June 22, 2007, the fund’s investments were primarily selected based on fundamental analysis. Beginning June 22, 2007, the fund’s investments are selected based on fundamental and quantitative analysis.
From time to time the fund may receive proceeds from litigation settlements, without which performance would be lower.
6
MFS Blended Research Core Equity Portfolio
EXPENSE TABLE
Fund Expenses Borne by the Contract Holders During the Period,
July 1, 2010 through December 31, 2010
As a contract holder of the fund, you incur ongoing costs, including management fees; distribution and/or service (12b-1) fees; and other fund expenses. This example is intended to help you understand your ongoing costs (in dollars) of investing in the fund and to compare these costs with the ongoing costs of investing in other mutual funds.
The example is based on an investment of $1,000 invested at the beginning of the period and held for the entire period July 1, 2010 through December 31, 2010.
Actual Expenses
The first line for each share class in the following table provides information about actual account values and actual expenses. You may use the information in this line, together with the amount you invested, to estimate the expenses that you paid over the period. Simply divide your account value by $1,000 (for example, an $8,600 account value divided by $1,000 = 8.6), then multiply the result by the number in the first line under the heading entitled “Expenses Paid During Period” to estimate the expenses you paid on your account during this period.
Hypothetical Example for Comparison Purposes
The second line for each share class in the following table provides information about hypothetical account values and hypothetical expenses based on the fund’s actual expense ratio and an assumed rate of return of 5% per year before expenses, which is not the fund’s actual return. The hypothetical account values and expenses may not be used to estimate the actual ending account balance or expenses you paid for the period. You may use this information to compare the ongoing costs of investing in the fund and other funds. To do so, compare this 5% hypothetical example with the 5% hypothetical examples that appear in the shareholder reports of the other funds.
Please note that the expenses shown in the table are meant to highlight the fund’s ongoing costs only and do not take into account the fees and expenses imposed under the variable contracts through which your investment in the fund is made. Therefore, the second line for each share class in the table is useful in comparing ongoing costs associated with an investment in vehicles (such as the fund) which fund benefits under variable annuity and variable life insurance contracts and to qualified pension and retirement plans only, and will not help you determine the relative total costs of investing in the fund through variable annuity and variable life insurance contracts. If the fees and expenses imposed under the variable contracts were included, your costs would have been higher.
| | | | | | | | | | | | | | | | | | |
| Share Class | | | | Annualized
Expense Ratio | | | Beginning
Account Value
7/01/10 | | | Ending
Account Value
12/31/10 | | | Expenses Paid
During Period (p)
7/01/10-12/31/10 | |
| Initial Class | | Actual | | | 0.60% | | | | $1,000.00 | | | | $1,227.66 | | | | $3.37 | |
| | Hypothetical (h) | | | 0.60% | | | | $1,000.00 | | | | $1,022.18 | | | | $3.06 | |
| Service Class | | Actual | | | 0.85% | | | | $1,000.00 | | | | $1,225.88 | | | | $4.77 | |
| | Hypothetical (h) | | | 0.85% | | | | $1,000.00 | | | | $1,020.92 | | | | $4.33 | |
| (h) | 5% class return per year before expenses. |
| (p) | Expenses paid is equal to each class’ annualized expense ratio, as shown above, multiplied by the average account value over the period, multiplied by the number of days in the period, divided by the number of days in the year. |
7
MFS Blended Research Core Equity Portfolio
PORTFOLIO OF INVESTMENTS – 12/31/10
The Portfolio of Investments is a complete list of all securities owned by your fund. It is categorized by broad-based asset classes.
| | | | | | | | |
| Issuer | | Shares/Par | | | Value ($) | |
| | | | | | | | |
| COMMON STOCKS – 99.6% | | | | | | | | |
| Aerospace – 3.5% | | | | | | | | |
| Lockheed Martin Corp. | | | 76,920 | | | $ | 5,377,474 | |
| Northrop Grumman Corp. | | | 108,200 | | | | 7,009,196 | |
| United Technologies Corp. | | | 85,030 | | | | 6,693,562 | |
| | | | | | | | |
| | | | | | $ | 19,080,232 | |
| | | | | | | | |
| Airlines – 0.2% | | | | | | | | |
| United Continental Holdings, Inc. (a) | | | 56,530 | | | $ | 1,346,545 | |
| | | | | | | | |
| Automotive – 2.3% | | | | | | | | |
| Ford Motor Co. (a) | | | 270,210 | | | $ | 4,536,826 | |
| Johnson Controls, Inc. | | | 215,560 | | | | 8,234,392 | |
| | | | | | | | |
| | | | | | $ | 12,771,218 | |
| | | | | | | | |
| Biotechnology – 1.4% | | | | | | | | |
| Amgen, Inc. (a) | | | 134,890 | | | $ | 7,405,461 | |
| | | | | | | | |
| Broadcasting – 1.3% | | | | | | | | |
| CBS Corp., “B” | | | 361,250 | | | $ | 6,881,813 | |
| | | | | | | | |
| Brokerage & Asset Managers – 0.9% | | | | | | | | |
| NASDAQ OMX Group, Inc. (a) | | | 201,747 | | | $ | 4,783,421 | |
| | | | | | | | |
| Business Services – 0.6% | | | | | | | | |
| Dun & Bradstreet Corp. | | | 39,960 | | | $ | 3,280,316 | |
| | | | | | | | |
| Cable TV – 1.3% | | | | | | | | |
| DIRECTV, “A” (a) | | | 173,560 | | | $ | 6,930,251 | |
| | | | | | | | |
| Chemicals – 3.6% | | | | | | | | |
| 3M Co. | | | 61,720 | | | $ | 5,326,436 | |
| Celanese Corp. | | | 114,790 | | | | 4,725,904 | |
| E.I. du Pont de Nemours & Co. | | | 155,080 | | | | 7,735,390 | |
| PPG Industries, Inc. | | | 20,730 | | | | 1,742,771 | |
| | | | | | | | |
| | | | | | $ | 19,530,501 | |
| | | | | | | | |
| Computer Software – 5.2% | | | | | | | | |
| Intuit, Inc. (a) | | | 122,170 | | | $ | 6,022,981 | |
| Microsoft Corp. | | | 198,940 | | | | 5,554,405 | |
| Oracle Corp. | | | 361,600 | | | | 11,318,080 | |
| VeriSign, Inc. | | | 166,590 | | | | 5,442,495 | |
| | | | | | | | |
| | | | | | $ | 28,337,961 | |
| | | | | | | | |
| Computer Software – Systems – 5.3% | |
| Apple, Inc. (a) | | | 60,940 | | | $ | 19,656,806 | |
| Hewlett-Packard Co. | | | 42,850 | | | | 1,803,985 | |
| International Business Machines Corp. | | | 29,760 | | | | 4,367,578 | |
| Lexmark International, Inc., “A” (a) | | | 84,270 | | | | 2,934,281 | |
| | | | | | | | |
| | | | | | $ | 28,762,650 | |
| | | | | | | | |
| Construction – 0.7% | | | | | | | | |
| Owens Corning (a) | | | 126,860 | | | $ | 3,951,689 | |
| | | | | | | | |
| Consumer Products – 2.7% | | | | | | | | |
| Energizer Holdings, Inc. (a) | | | 60,630 | | | $ | 4,419,927 | |
| Procter & Gamble Co. | | | 163,240 | | | | 10,501,229 | |
| | | | | | | | |
| | | | | | $ | 14,921,156 | |
| | | | | | | | |
| | | | | | | | |
| Issuer | | Shares/Par | | | Value ($) | |
| | | | | | | | |
| COMMON STOCKS – continued | |
| Electrical Equipment – 1.0% | | | | | | | | |
| General Electric Co. | | | 307,010 | | | $ | 5,615,213 | |
| | | | | | | | |
| Electronics – 1.9% | | | | | | | | |
| Intel Corp. | | | 504,700 | | | $ | 10,613,841 | |
| | | | | | | | |
| Energy – Integrated – 9.8% | | | | | | | | |
| Chevron Corp. | | | 159,490 | | | $ | 14,553,463 | |
| ConocoPhillips | | | 65,590 | | | | 4,466,679 | |
| Exxon Mobil Corp. | | | 320,290 | | | | 23,419,605 | |
| Hess Corp. | | | 97,710 | | | | 7,478,723 | |
| Marathon Oil Corp. | | | 97,220 | | | | 3,600,057 | |
| | | | | | | | |
| | | | | | $ | 53,518,527 | |
| | | | | | | | |
| Food & Beverages – 4.7% | | | | | | | | |
| Bunge Ltd. | | | 70,680 | | | $ | 4,630,954 | |
| Coca-Cola Co. | | | 20,030 | | | | 1,317,373 | |
| Dr Pepper Snapple Group, Inc. | | | 154,110 | | | | 5,418,508 | |
| General Mills, Inc. | | | 181,860 | | | | 6,472,397 | |
| PepsiCo, Inc. | | | 100,680 | | | | 6,577,424 | |
| Tyson Foods, Inc., “A” | | | 79,170 | | | | 1,363,307 | |
| | | | | | | | |
| | | | | | $ | 25,779,963 | |
| | | | | | | | |
| Food & Drug Stores – 2.4% | | | | | | | | |
| Kroger Co. | | | 262,420 | | | $ | 5,867,711 | |
| Walgreen Co. | | | 180,110 | | | | 7,017,086 | |
| | | | | | | | |
| | | | | | $ | 12,884,797 | |
| | | | | | | | |
| Gaming & Lodging – 1.6% | | | | | | | | |
| Las Vegas Sands Corp. (a) | | | 96,120 | | | $ | 4,416,714 | |
| Royal Caribbean Cruises Ltd. (a) | | | 89,300 | | | | 4,197,100 | |
| | | | | | | | |
| | | | | | $ | 8,613,814 | |
| | | | | | | | |
| General Merchandise – 1.2% | | | | | | | | |
| Macy’s, Inc. | | | 256,520 | | | $ | 6,489,956 | |
| | | | | | | | |
| Health Maintenance Organizations – 2.0% | |
| Aetna, Inc. | | | 157,850 | | | $ | 4,816,004 | |
| WellPoint, Inc. (a) | | | 103,200 | | | | 5,867,952 | |
| | | | | | | | |
| | | | | | $ | 10,683,956 | |
| | | | | | | | |
| Insurance – 5.0% | | | | | | | | |
| Aflac, Inc. | | | 121,820 | | | $ | 6,874,303 | |
| Allied World Assurance Co. | | | 53,470 | | | | 3,178,257 | |
| Berkshire Hathaway, Inc., “B” (a) | | | 18,230 | | | | 1,460,405 | |
| Chubb Corp. | | | 29,890 | | | | 1,782,640 | |
| Prudential Financial, Inc. | | | 124,180 | | | | 7,290,608 | |
| Travelers Cos., Inc. | | | 122,380 | | | | 6,817,790 | |
| | | | | | | | |
| | | | | | $ | 27,404,003 | |
| | | | | | | | |
| Internet – 2.2% | | | | | | | | |
| Google, Inc., “A” (a) | | | 20,540 | | | $ | 12,200,144 | |
| | | | | | | | |
| Machinery & Tools – 1.1% | | | | | | | | |
| Cummins, Inc. | | | 54,010 | | | $ | 5,941,640 | |
| | | | | | | | |
8
MFS Blended Research Core Equity Portfolio
Portfolio of Investments – continued
| | | | | | | | |
| Issuer | | Shares/Par | | | Value ($) | |
| | | | | | | | |
| | | | | | | | |
| COMMON STOCKS – continued | |
| Major Banks – 6.1% | | | | | | | | |
| Bank of America Corp. | | | 946,170 | | | $ | 12,621,908 | |
| Bank of New York Mellon Corp. | | | 132,818 | | | | 4,011,104 | |
| Goldman Sachs Group, Inc. | | | 31,410 | | | | 5,281,906 | |
| JPMorgan Chase & Co. | | | 217,250 | | | | 9,215,745 | |
| Wells Fargo & Co. | | | 60,910 | | | | 1,887,601 | |
| | | | | | | | |
| | | | | | $ | 33,018,264 | |
| | | | | | | | |
| Medical & Health Technology & Services – 1.2% | |
| McKesson Corp. | | | 95,950 | | | $ | 6,752,961 | |
| | | | | | | | |
| Medical Equipment – 1.9% | | | | | | | | |
| Medtronic, Inc. | | | 195,500 | | | $ | 7,251,095 | |
| Thermo Fisher Scientific, Inc. (a) | | | 60,200 | | | | 3,332,672 | |
| | | | | | | | |
| | | | | | $ | 10,583,767 | |
| | | | | | | | |
| Metals & Mining – 0.7% | | | | | | | | |
| Cliffs Natural Resources, Inc. | | | 51,260 | | | $ | 3,998,793 | |
| | | | | | | | |
| Natural Gas – Distribution – 0.6% | | | | | | | | |
| NiSource, Inc. | | | 191,370 | | | $ | 3,371,939 | |
| | | | | | | | |
| Network & Telecom – 2.2% | | | | | | | | |
| Cisco Systems, Inc. (a) | | | 133,880 | | | $ | 2,708,392 | |
| F5 Networks, Inc. (a) | | | 35,510 | | | | 4,621,982 | |
| Polycom, Inc. (a) | | | 120,810 | | | | 4,709,174 | |
| | | | | | | | |
| | | | | | $ | 12,039,548 | |
| | | | | | | | |
| Oil Services – 1.7% | | | | | | | | |
| Halliburton Co. | | | 111,360 | | | $ | 4,546,829 | |
| National Oilwell Varco, Inc. | | | 66,890 | | | | 4,498,353 | |
| | | | | | | | |
| | | | | | $ | 9,045,182 | |
| | | | | | | | |
| Other Banks & Diversified Financials – 3.9% | |
| American Express Co. | | | 178,200 | | | $ | 7,648,344 | |
| Citigroup, Inc. (a) | | | 1,594,060 | | | | 7,539,904 | |
| MasterCard, Inc., “A” | | | 26,590 | | | | 5,959,085 | |
| | | | | | | | |
| | | | | | $ | 21,147,333 | |
| | | | | | | | |
| Pharmaceuticals – 4.7% | | | | | | | | |
| Abbott Laboratories | | | 186,830 | | | $ | 8,951,025 | |
| Johnson & Johnson | | | 128,820 | | | | 7,967,517 | |
| Pfizer, Inc. | | | 510,580 | | | | 8,940,256 | |
| | | | | | | | |
| | | | | | $ | 25,858,798 | |
| | | | | | | | |
| Pollution Control – 0.8% | | | | | | | | |
| Republic Services, Inc. | | | 152,770 | | | $ | 4,561,712 | |
| | | | | | | | |
| Railroad & Shipping – 0.7% | | | | | | | | |
| Union Pacific Corp. | | | 41,360 | | | $ | 3,832,418 | |
| | | | | | | | |
| Real Estate – 0.8% | | | | | | | | |
| Annaly Mortgage Management, Inc., REIT | | | 235,560 | | | $ | 4,221,235 | |
| | | | | | | | |
| Restaurants – 1.4% | | | | | | | | |
| Darden Restaurants, Inc. | | | 115,460 | | | $ | 5,361,962 | |
| McDonald’s Corp. | | | 29,100 | | | | 2,233,716 | |
| | | | | | | | |
| | | | | | $ | 7,595,678 | |
| | | | | | | | |
| | | | | | | | |
| Issuer | | Shares/Par | | | Value ($) | |
| | | | | | | | |
| | | | | | | | |
| COMMON STOCKS – continued | |
| Specialty Stores – 2.1% | | | | | | | | |
| Best Buy Co., Inc. | | | 117,920 | | | $ | 4,043,477 | |
| Limited Brands, Inc. | | | 235,410 | | | | 7,234,149 | |
| | | | | | | | |
| | | | | | $ | 11,277,626 | |
| | | | | | | | |
| Telephone Services – 3.0% | | | | | | | | |
| AT&T, Inc. | | | 298,320 | | | $ | 8,764,642 | |
| Qwest Communications International, Inc. | | | 963,760 | | | | 7,334,214 | |
| | | | | | | | |
| | | | | | $ | 16,098,856 | |
| | | | | | | | |
| Tobacco – 2.2% | | | | | | | | |
| Altria Group, Inc. | | | 277,420 | | | $ | 6,830,080 | |
| Philip Morris International, Inc. | | | 91,500 | | | | 5,355,495 | |
| | | | | | | | |
| | | | | | $ | 12,185,575 | |
| | | | | | | | |
| Trucking – 1.4% | | | | | | | | |
| United Parcel Service, Inc., “B” | | | 101,940 | | | $ | 7,398,805 | |
| | | | | | | | |
| Utilities – Electric Power – 2.3% | | | | | | | | |
| Entergy Corp. | | | 51,640 | | | $ | 3,657,661 | |
| PG&E Corp. | | | 120,700 | | | | 5,774,288 | |
| Public Service Enterprise Group, Inc. | | | 102,220 | | | | 3,251,618 | |
| | | | | | | | |
| | | | | | $ | 12,683,567 | |
| | | | | | | | |
Total Common Stocks
(Identified Cost, $500,403,606) | | | | | | $ | 543,401,125 | |
| | | | | | | | |
| MONEY MARKET FUNDS (v) – 0.4% | |
| MFS Institutional Money Market Portfolio, 0.18%, at Cost and Net Asset Value | | | 1,951,910 | | | $ | 1,951,910 | |
| | | | | | | | |
Total Investments
(Identified Cost, $502,355,516) | | | | | | $ | 545,353,035 | |
| | | | | | | | |
OTHER ASSETS, LESS
LIABILITIES – 0.0% | | | | | | | 112,937 | |
| | | | | | | | |
| Net Assets – 100.0% | | | | | | $ | 545,465,972 | |
| | | | | | | | |
| (a) | Non-income producing security. |
| (v) | Underlying fund that is available only to investment companies managed by MFS. The rate quoted is the annualized seven-day yield of the fund at period end. |
The following abbreviations are used in this report and are defined:
| REIT | | Real Estate Investment Trust |
See Notes to Financial Statements
9
MFS Blended Research Core Equity Portfolio
FINANCIAL STATEMENTS | STATEMENT OF ASSETS AND LIABILITIES
This statement represents your fund’s balance sheet, which details the assets and liabilities comprising the total value of the fund.
| | | | | | | | |
At 12/31/10 | | | | | | | | |
Assets | | | | | | | | |
Investments – | | | | | | | | |
Non-affiliated issuers, at value (identified cost, $500,403,606) | | | $543,401,125 | | | | | |
Underlying funds, at cost and value | | | 1,951,910 | | | | | |
Total investments, at value (identified cost, $502,355,516) | | | $545,353,035 | | | | | |
Receivables for | | | | | | | | |
Fund shares sold | | | 87,955 | | | | | |
Dividends | | | 670,712 | | | | | |
Receivable from investment adviser | | | 15,803 | | | | | |
Other assets | | | 15,958 | | | | | |
Total assets | | | | | | | $546,143,463 | |
Liabilities | | | | | | | | |
Payable for | | | | | | | | |
Fund shares reacquired | | | $514,169 | | | | | |
Payable to affiliates | | | | | | | | |
Investment adviser | | | 16,463 | | | | | |
Shareholder servicing costs | | | 284 | | | | | |
Distribution and/or service fees | | | 2,535 | | | | | |
Administrative services fee | | | 1,050 | | | | | |
Payable for Trustees’ compensation | | | 618 | | | | | |
Accrued expenses and other liabilities | | | 142,372 | | | | | |
Total liabilities | | | | | | | $677,491 | |
Net assets | | | | | | | $545,465,972 | |
Net assets consist of | | | | | | | | |
Paid-in capital | | | $641,735,879 | | | | | |
Unrealized appreciation (depreciation) on investments | | | 42,997,519 | | | | | |
Accumulated net realized gain (loss) on investments and foreign currency transactions | | | (148,323,502 | ) | | | | |
Undistributed net investment income | | | 9,056,076 | | | | | |
Net assets | | | | | | | $545,465,972 | |
Shares of beneficial interest outstanding | | | | | | | 17,147,621 | |
| | | | | | | | | | | | |
| | | Net assets | | | Shares
outstanding | | | Net asset value
per share | |
Initial Class | | | $360,667,372 | | | | 11,311,194 | | | | $31.89 | |
Service Class | | | 184,798,600 | | | | 5,836,427 | | | | 31.66 | |
See Notes to Financial Statements
10
MFS Blended Research Core Equity Portfolio
FINANCIAL STATEMENTS | STATEMENT OF OPERATIONS
This statement describes how much your fund earned in investment income and accrued in expenses. It also describes any gains and/or losses generated by fund operations.
| | | | | | | | |
Year ended 12/31/10 | | | | | | | | |
| Net investment income | | | | | | | | |
Income | | | | | | | | |
Dividends | | | $12,748,848 | | | | | |
Dividends from underlying funds | | | 5,694 | | | | | |
Total investment income | | | | | | | $12,754,542 | |
Expenses | | | | | | | | |
Management fee | | | $2,955,292 | | | | | |
Distribution and/or service fees | | | 467,119 | | | | | |
Shareholder servicing costs | | | 62,178 | | | | | |
Administrative services fee | | | 188,257 | | | | | |
Trustees’ compensation | | | 74,201 | | | | | |
Custodian fee | | | 82,067 | | | | | |
Shareholder communications | | | 29,290 | | | | | |
Auditing fees | | | 50,205 | | | | | |
Legal fees | | | 7,406 | | | | | |
Miscellaneous | | | 46,467 | | | | | |
Total expenses | | | | | | | $3,962,482 | |
Fees paid indirectly | | | (29 | ) | | | | |
Reduction of expenses by investment adviser | | | (266,193 | ) | | | | |
Net expenses | | | | | | | $3,696,260 | |
Net investment income | | | | | | | $9,058,282 | |
Realized and unrealized gain (loss) on investments | | | | | | | | |
Realized gain (loss) on investment transactions (identified cost basis) | | | | | | | $30,651,867 | |
Change in unrealized appreciation (depreciation) on investments | | | | | | | $41,875,927 | |
Net realized and unrealized gain (loss) on investments | | | | | | | $72,527,794 | |
Change in net assets from operations | | | | | | | $81,586,076 | |
See Notes to Financial Statements
11
MFS Blended Research Core Equity Portfolio
FINANCIAL STATEMENTS | STATEMENTS OF CHANGES IN NET ASSETS
These statements describe the increases and/or decreases in net assets resulting from operations, any distributions, and any shareholder transactions.
| | | | | | | | |
For years ended 12/31 | | | 2010 | | | | 2009 | |
Change in net assets | | | | | | | | |
From operations | | | | | | | | |
Net investment income | | | $9,058,282 | | | | $8,939,467 | |
Net realized gain (loss) on investments | | | 30,651,867 | | | | (67,667,592 | ) |
Net unrealized gain (loss) on investments | | | 41,875,927 | | | | 179,009,138 | |
Change in net assets from operations | | | $81,586,076 | | | | $120,281,013 | |
Distributions declared to shareholders | | | | | | | | |
From net investment income | | | $(9,141,057 | ) | | | $(11,711,698 | ) |
Change in net assets from fund share transactions | | | $(87,431,906 | ) | | | $(84,015,359 | ) |
Total change in net assets | | | $(14,986,887 | ) | | | $24,553,956 | |
Net assets | | | | | | | | |
At beginning of period | | | 560,452,859 | | | | 535,898,903 | |
At end of period (including undistributed net investment income of $9,056,076 and
$8,476,101, respectively) | | | $545,465,972 | | | | $560,452,859 | |
See Notes to Financial Statements
12
MFS Blended Research Core Equity Portfolio
FINANCIAL STATEMENTS | FINANCIAL HIGHLIGHTS
The financial highlights table is intended to help you understand the fund’s financial performance for the past 5 years. Certain information reflects financial results for a single fund share. The total returns in the table represent the rate by which an investor would have earned (or lost) on an investment in the fund share class (assuming reinvestment of all distributions) held for the entire period.
| | | | | | | | | | | | | | | | | | | | |
| Initial Class | | Years ended 12/31 | |
| | | 2010 | | | 2009 | | | 2008 | | | 2007 | | | 2006 | |
Net asset value, beginning of period | | | $27.84 | | | | $22.80 | | | | $35.51 | | | | $33.89 | | | | $30.15 | |
| Income (loss) from investment operations | | | | | | | | | | | | | | | | | | | | |
Net investment income (d) | | | $0.51 | | | | $0.43 | | | | $0.48 | | | | $0.38 | | | | $0.37 | |
Net realized and unrealized gain (loss) on investments
and foreign currency | | | 4.05 | | | | 5.16 | | | | (12.74 | ) | | | 1.64 | | | | 3.62 | |
Total from investment operations | | | $4.56 | | | | $5.59 | | | | $(12.26 | ) | | | $2.02 | | | | $3.99 | |
| Less distributions declared to shareholders | | | | | | | | | | | | | | | | | | | | |
From net investment income | | | $(0.51 | ) | | | $(0.55 | ) | �� | | $(0.45 | ) | | | $(0.40 | ) | | | $(0.25 | ) |
Net asset value, end of period | | | $31.89 | | | | $27.84 | | | | $22.80 | | | | $35.51 | | | | $33.89 | |
Total return (%) (k)(r)(s) | | | 16.46 | | | | 25.26 | | | | (34.95 | ) | | | 5.95 | | | | 13.30 | |
Ratios (%) (to average net assets)
and Supplemental data: | | | | | | | | | | | | | | | | | | | | |
Expenses before expense reductions (f) | | | 0.65 | | | | 0.66 | | | | 0.64 | | | | 0.62 | | | | 0.61 | |
Expenses after expense reductions (f) | | | 0.60 | | | | 0.60 | | | | 0.60 | | | | 0.61 | | | | N/A | |
Net investment income | | | 1.77 | | | | 1.81 | | | | 1.60 | | | | 1.07 | | | | 1.18 | |
Portfolio turnover | | | 68 | | | | 74 | | | | 76 | | | | 102 | | | | 35 | |
Net assets at end of period (000 omitted) | | | $360,667 | | | | $361,105 | | | | $342,241 | | | | $673,008 | | | | $826,937 | |
| |
| Service Class | | Years ended 12/31 | |
| | | 2010 | | | 2009 | | | 2008 | | | 2007 | | | 2006 | |
Net asset value, beginning of period | | | $27.66 | | | | $22.62 | | | | $35.23 | | | | $33.65 | | | | $29.96 | |
| Income (loss) from investment operations | | | | | | | | | | | | | | | | | | | | |
Net investment income (d) | | | $0.44 | | | | $0.37 | | | | $0.41 | | | | $0.29 | | | | $0.28 | |
Net realized and unrealized gain (loss) on investments
and foreign currency | | | 4.00 | | | | 5.14 | | | | (12.66 | ) | | | 1.63 | | | | 3.61 | |
Total from investment operations | | | $4.44 | | | | $5.51 | | | | $(12.25 | ) | | | $1.92 | | | | $3.89 | |
| Less distributions declared to shareholders | | | | | | | | | | | | | | | | | | | | |
From net investment income | | | $(0.44 | ) | | | $(0.47 | ) | | | $(0.36 | ) | | | $(0.34 | ) | | | $(0.20 | ) |
Net asset value, end of period | | | $31.66 | | | | $27.66 | | | | $22.62 | | | | $35.23 | | | | $33.65 | |
Total return (%) (k)(r)(s) | | | 16.12 | | | | 25.00 | | | | (35.12 | ) | | | 5.69 | | | | 13.04 | |
Ratios (%) (to average net assets)
and Supplemental data: | | | | | | | | | | | | | | | | | | | | |
Expenses before expense reductions (f) | | | 0.90 | | | | 0.91 | | | | 0.90 | | | | 0.87 | | | | 0.86 | |
Expenses after expense reductions (f) | | | 0.85 | | | | 0.85 | | | | 0.85 | | | | 0.86 | | | | N/A | |
Net investment income | | | 1.52 | | | | 1.57 | | | | 1.35 | | | | 0.84 | | | | 0.88 | |
Portfolio turnover | | | 68 | | | | 74 | | | | 76 | | | | 102 | | | | 35 | |
Net assets at end of period (000 omitted) | | | $184,799 | | | | $199,348 | | | | $193,658 | | | | $338,647 | | | | $319,869 | |
| (d) | Per share data is based on average shares outstanding. |
| (f) | Ratios do not reflect reductions from fees paid indirectly, if applicable. |
| (k) | The total return does not reflect expenses that apply to separate accounts. Inclusion of these charges would reduce the total return figures for all periods shown. |
| (r) | Certain expenses have been reduced without which performance would have been lower. |
| (s) | From time to time the fund may receive proceeds from litigation settlements, without which performance would be lower. |
See Notes to Financial Statements
13
MFS Blended Research Core Equity Portfolio
NOTES TO FINANCIAL STATEMENTS
| (1) | | Business and Organization |
MFS Blended Research Core Equity Portfolio (the fund) is a series of MFS Variable Insurance Trust II (the trust). The trust is organized as a Massachusetts business trust and is registered under the Investment Company Act of 1940, as amended, as an open-end management investment company. The shareholders of each series of the trust are separate accounts of insurance companies, which offer variable annuity and/or life insurance products, and qualified retirement and pension plans.
| (2) | | Significant Accounting Policies |
General – The preparation of financial statements in conformity with U.S. generally accepted accounting principles requires management to make estimates and assumptions that affect the reported amounts of assets and liabilities, and disclosure of contingent assets and liabilities at the date of the financial statements and the reported amounts of revenues and expenses during the reporting period. Actual results could differ from those estimates. In the preparation of these financial statements, management has evaluated subsequent events occurring after the date of the fund’s Statement of Assets and Liabilities through the date that the financial statements were issued.
Investment Valuations – Equity securities, including restricted equity securities, are generally valued at the last sale or official closing price as provided by a third-party pricing service on the market or exchange on which they are primarily traded. Equity securities, for which there were no sales reported that day, are generally valued at the last quoted daily bid quotation as provided by a third-party pricing service on the market or exchange on which such securities are primarily traded. Equity securities held short, for which there were no sales reported for that day, are generally valued at the last quoted daily ask quotation as provided by a third-party pricing service on the market or exchange on which such securities are primarily traded. Short-term instruments with a maturity at issuance of 60 days or less generally are valued at amortized cost, which approximates market value. Open-end investment companies are generally valued at net asset value per share. Securities and other assets generally valued on the basis of information from a third-party pricing service may also be valued at a broker/dealer bid quotation. Values obtained from third-party pricing services can utilize both transaction data and market information such as yield, quality, coupon rate, maturity, type of issue, trading characteristics, and other market data.
The Board of Trustees has delegated primary responsibility for determining or causing to be determined the value of the fund’s investments (including any fair valuation) to the adviser pursuant to valuation policies and procedures approved by the Board. If the adviser determines that reliable market quotations are not readily available, investments are valued at fair value as determined in good faith by the adviser in accordance with such procedures under the oversight of the Board of Trustees. Under the fund’s valuation policies and procedures, market quotations are not considered to be readily available for most types of debt instruments and floating rate loans and many types of derivatives. These investments are generally valued at fair value based on information from third-party pricing services. In addition, investments may be valued at fair value if the adviser determines that an investment’s value has been materially effected by events occurring after the close of the exchange or market on which the investment is principally traded (such as foreign exchange or market) and prior to the determination of the fund’s net asset value, or after the halting of trading of a specific security where trading does not resume prior to the close of the exchange or market on which the security is principally traded. Events that occur on a frequent basis after foreign markets close (such as developments in foreign markets and significant movements in the U.S. markets) and prior to the determination of the fund’s net asset value may be deemed to have a material effect on the value of securities traded in foreign markets. Accordingly, the fund’s foreign equity securities may often be valued at fair value. The adviser generally relies on third-party pricing services or other information (such as the correlation with price movements of similar securities in the same or other markets; the type, cost and investment characteristics of the security; the business and financial condition of the issuer; and trading and other market data) to assist in determining whether to fair value and at what value to fair value an investment. The value of an investment for purposes of calculating the fund’s net asset value can differ depending on the source and method used to determine value. When fair valuation is used, the value of an investment used to determine the fund’s net asset value may differ from quoted or published prices for the same investment. There can be no assurance that the fund could obtain the fair value assigned to an investment if it were to sell the investment at the same time at which the fund determines its net asset value per share.
Various inputs are used in determining the value of the fund’s assets or liabilities. These inputs are categorized into three broad levels. In certain cases, the inputs used to measure fair value may fall into different levels of the fair value hierarchy. In such cases, an investment’s level within the fair value hierarchy is based on the lowest level of input that is significant to the fair value measurement. The fund’s assessment of the significance of a particular input to the fair value measurement in its entirety requires judgment, and considers factors specific to the investment. Level 1 includes unadjusted quoted prices in active markets for identical assets or liabilities. Level 2 includes other significant observable market-based inputs (including quoted prices for similar securities, interest rates, prepayment speed, and credit risk). Level 3 includes unobservable inputs, which may
14
MFS Blended Research Core Equity Portfolio
Notes to Financial Statements – continued
include the adviser’s own assumptions in determining the fair value of investments. The following is a summary of the levels used as of December 31, 2010 in valuing the fund’s assets or liabilities:
| | | | | | | | | | | | | | | | |
| Investments at Value | | Level 1 | | | Level 2 | | | Level 3 | | | Total | |
| Equity Securities | | | $543,401,125 | | | | $— | | | | $— | | | | $543,401,125 | |
| Mutual Funds | | | 1,951,910 | | | | — | | | | — | | | | 1,951,910 | |
| Total Investments | | | $545,353,035 | | | | $— | | | | $— | | | | $545,353,035 | |
For further information regarding security characteristics, see the Portfolio of Investments.
Indemnifications – Under the fund’s organizational documents, its officers and Trustees may be indemnified against certain liabilities and expenses arising out of the performance of their duties to the fund. Additionally, in the normal course of business, the fund enters into agreements with service providers that may contain indemnification clauses. The fund’s maximum exposure under these agreements is unknown as this would involve future claims that may be made against the fund that have not yet occurred.
Investment Transactions and Income – Investment transactions are recorded on the trade date. Dividends received in cash are recorded on the ex-dividend date. Certain dividends from foreign securities will be recorded when the fund is informed of the dividend if such information is obtained subsequent to the ex-dividend date. Dividend and interest payments received in additional securities are recorded on the ex-dividend or ex-interest date in an amount equal to the value of the security on such date.
The fund may receive proceeds from litigation settlements. Any proceeds received from litigation involving portfolio holdings are reflected in the Statement of Operations in realized gain/loss if the security has been disposed of by the fund or in unrealized gain/loss if the security is still held by the fund. Any other proceeds from litigation not related to portfolio holdings are reflected as other income in the Statement of Operations.
Fees Paid Indirectly – The fund’s custody fee may be reduced according to an arrangement that measures the value of cash deposited with the custodian by the fund. This amount, for the year ended December 31, 2010, is shown as a reduction of total expenses on the Statement of Operations.
Tax Matters and Distributions – The fund intends to qualify as a regulated investment company, as defined under Subchapter M of the Internal Revenue Code, and to distribute all of its taxable income, including realized capital gains. As a result, no provision for federal income tax is required. The fund’s federal tax returns for the prior three fiscal years remain subject to examination by the Internal Revenue Service. Foreign taxes, if any, have been accrued by the fund in the accompanying financial statements.
Distributions to shareholders are recorded on the ex-dividend date. Income and capital gain distributions are determined in accordance with income tax regulations, which may differ from U.S. generally accepted accounting principles. Certain capital accounts in the financial statements are periodically adjusted for permanent differences in order to reflect their tax character. These adjustments have no impact on net assets or net asset value per share. Temporary differences which arise from recognizing certain items of income, expense, gain or loss in different periods for financial statement and tax purposes will reverse at some time in the future. Distributions in excess of net investment income or net realized gains are temporary overdistributions for financial statement purposes resulting from differences in the recognition or classification of income or distributions for financial statement and tax purposes.
Book/tax differences primarily relate to wash sale loss deferrals.
The tax character of distributions declared to shareholders for the last two fiscal years is as follows:
| | | | | | | | |
| | | 12/31/10 | | | 12/31/09 | |
| Ordinary income (including any short-term capital gains) | | | $9,141,057 | | | | $11,711,698 | |
The federal tax cost and the tax basis components of distributable earnings were as follows:
| | | | |
| As of 12/31/10 | | | | |
| Cost of investments | | | $505,061,740 | |
| Gross appreciation | | | 68,892,283 | |
| Gross depreciation | | | (28,600,988 | ) |
| Net unrealized appreciation (depreciation) | | | $40,291,295 | |
| Undistributed ordinary income | | | 9,056,076 | |
| Capital loss carryforwards | | | (145,617,278 | ) |
15
MFS Blended Research Core Equity Portfolio
Notes to Financial Statements – continued
As of December 31, 2010, the fund had capital loss carryforwards available to offset future realized gains. Such losses expire as follows:
| | | | |
| 12/31/16 | | | $(73,792,613 | ) |
| 12/31/17 | | | (71,824,665 | ) |
| Total | | | $(145,617,278 | ) |
Multiple Classes of Shares of Beneficial Interest – The fund offers multiple classes of shares, which differ in their respective distribution and/or service fees. The fund’s income, realized and unrealized gain (loss), and common expenses are allocated to shareholders based on the daily net assets of each class. Dividends are declared separately for each class. Differences in per share dividend rates are generally due to differences in separate class expenses. The fund’s distributions declared to shareholders as reported on the Statements of Changes in Net Assets are presented by class as follows:
| | | | | | | | |
| | | From net investment
income | |
| | | Year ended
12/31/10 | | | Year ended
12/31/09 | |
| Initial Class | | | $6,266,489 | | | | $7,740,496 | |
| Service Class | | | 2,874,568 | | | | 3,971,202 | |
| Total | | | $9,141,057 | | | | $11,711,698 | |
| (3) | | Transactions with Affiliates |
Investment Adviser – The fund has an investment advisory agreement with MFS to provide overall investment management and related administrative services and facilities to the fund. The management fee is computed daily and paid monthly at an annual rate of 0.55% of the fund’s average daily net assets.
The investment adviser has agreed in writing to pay a portion of the fund’s total annual operating expenses, exclusive of interest, taxes, extraordinary expenses, and brokerage commissions, such that the total annual operating expenses of the fund do not exceed 1.25% of the fund’s average daily net assets. MFS’ agreement to limit the fund’s operating expenses is contained in the investment advisory agreement between MFS and the fund and may not be rescinded without shareholder approval. In addition, the investment adviser has agreed in writing to pay a portion of the fund’s total annual operating expenses, exclusive of interest, taxes, extraordinary expenses, brokerage and transaction costs and investment-related expenses, such that the total annual operating expenses of the fund do not exceed 0.60% of average daily net assets for the Initial Class shares and 0.85% of average daily net assets for the Service Class shares. This written agreement will continue until April 30, 2012. For the year ended December 31, 2010, this reduction amounted to $266,193 and is reflected as a reduction of total expenses in the Statement of Operations.
Distributor – MFS Fund Distributors, Inc. (MFD), a wholly-owned subsidiary of MFS, is the distributor of shares of the fund. The Trustees have adopted a distribution plan for the Service Class shares pursuant to Rule 12b-1 under the Investment Company Act of 1940.
The fund’s distribution plan provides that the fund will pay MFD distribution and/or service fees equal to 0.25% per annum of its average daily net assets attributable to Service Class shares as partial consideration for services performed and expenses incurred by MFD and financial intermediaries (including participating insurance companies that invest in the fund to fund variable annuity and variable life insurance contracts, sponsors of qualified retirement and pension plans that invest in the fund, and affiliates of these participating insurance companies and plan sponsors) in connection with the sale and distribution of the Service Class shares. MFD may subsequently pay all, or a portion, of the distribution and/or service fees to financial intermediaries.
Shareholder Servicing Agent – MFS Service Center, Inc. (MFSC), a wholly-owned subsidiary of MFS, receives a fee from the fund for its services as shareholder servicing agent. For the year ended December 31, 2010, the fee was $62,104, which equated to 0.0116% annually of the fund’s average daily net assets. MFSC also receives payment from the fund for out-of-pocket expenses paid by MFSC on behalf of the fund. For the year ended December 31, 2010, these costs amounted to $74.
Administrator – MFS provides certain financial, legal, shareholder communications, compliance, and other administrative services to the fund. Under an administrative services agreement, the fund partially reimburses MFS the costs incurred to provide these services. The fund is charged an annual fixed amount of $10,000 plus a fee based on average daily net assets. The administrative services fee incurred for the year ended December 31, 2010 was equivalent to an annual effective rate of 0.0350% of the fund’s average daily net assets.
Trustees’ and Officers’ Compensation – The fund pays compensation to Trustees in the form of a retainer, attendance fees, and additional compensation to the Board chairperson. The fund does not pay compensation directly to officers of the fund
16
MFS Blended Research Core Equity Portfolio
Notes to Financial Statements – continued
who are also officers of the investment adviser, all of whom receive remuneration for their services to the fund from MFS. Certain officers of the fund are officers or directors of MFS, MFD, and MFSC.
Other – This fund and certain other funds managed by MFS (the funds) have entered into services agreements (the Agreements) which provide for payment of fees by the funds to Tarantino LLC and Griffin Compliance LLC in return for the provision of services of an Independent Chief Compliance Officer (ICCO) and Assistant ICCO, respectively, for the funds. The ICCO and Assistant ICCO are officers of the funds and the sole members of Tarantino LLC and Griffin Compliance LLC, respectively. The funds can terminate the Agreements with Tarantino LLC and Griffin Compliance LLC at any time under the terms of the Agreements. MFS has agreed to bear all expenses associated with office space, other administrative support, and supplies provided to the ICCO and Assistant ICCO. For the year ended December 31, 2010, the aggregate fees paid by the fund to Tarantino LLC and Griffin Compliance LLC were $9,105 and are included in miscellaneous expense on the Statement of Operations.
The fund invests in the MFS Institutional Money Market Portfolio which is managed by MFS and seeks a high level of current income consistent with preservation of capital and liquidity. Income earned on this investment is included in dividends from underlying funds on the Statement of Operations. This money market fund does not pay a management fee to MFS.
Purchases and sales of investments, other than U.S. Government securities, purchased option transactions, and short-term obligations, aggregated $361,156,192 and $444,385,510, respectively.
| (5) | | Shares of Beneficial Interest |
The fund’s Declaration of Trust permits the Trustees to issue an unlimited number of full and fractional shares of beneficial interest. Transactions in fund shares were as follows:
| | | | | | | | | | | | | | | | |
| | | Year ended 12/31/10 | | | Year ended 12/31/09 | |
| | | Shares | | | Amount | | | Shares | | | Amount | |
| Shares sold | | | | | | | | | | | | | | | | |
Initial Class | | | 51,684 | | | | $1,484,658 | | | | 181,724 | | | | $3,472,695 | |
Service Class | | | 146,260 | | | | 4,101,313 | | | | 521,406 | | | | 9,059,324 | |
| | | 197,944 | | | | $5,585,971 | | | | 703,130 | | | | $12,532,019 | |
| Shares issued to shareholders in reinvestment of distributions | | | | | | | | | | | | | | | | |
Initial Class | | | 206,526 | | | | $6,266,489 | | | | 365,118 | | | | $7,740,496 | |
Service Class | | | 95,345 | | | | 2,874,568 | | | | 188,298 | | | | 3,971,202 | |
| | | 301,871 | | | | $9,141,057 | | | | 553,416 | | | | $11,711,698 | |
| Shares reacquired | | | | | | | | | | | | | | | | |
Initial Class | | | (1,916,648 | ) | | | $(55,333,836 | ) | | | (2,589,673 | ) | | | $(59,635,833 | ) |
Service Class | | | (1,613,548 | ) | | | (46,825,098 | ) | | | (2,062,531 | ) | | | (48,623,243 | ) |
| | | (3,530,196 | ) | | | $(102,158,934 | ) | | | (4,652,204 | ) | | | $(108,259,076 | ) |
| Net change | | | | | | | | | | | | | | | | |
Initial Class | | | (1,658,438 | ) | | | $(47,582,689 | ) | | | (2,042,831 | ) | | | $(48,422,642 | ) |
Service Class | | | (1,371,943 | ) | | | (39,849,217 | ) | | | (1,352,827 | ) | | | (35,592,717 | ) |
| | | (3,030,381 | ) | | | $(87,431,906 | ) | | | (3,395,658 | ) | | | $(84,015,359 | ) |
The fund and certain other funds managed by MFS participate in a $1.1 billion unsecured committed line of credit, subject to a $1 billion sublimit, provided by a syndication of banks under a credit agreement. Borrowings may be made for temporary financing needs. Interest is charged to each fund, based on its borrowings, generally at a rate equal to the higher of the Federal Reserve funds rate or one month LIBOR plus an agreed upon spread. A commitment fee, based on the average daily, unused portion of the committed line of credit, is allocated among the participating funds at the end of each calendar quarter. In addition, the fund and other funds managed by MFS have established unsecured uncommitted borrowing arrangements with certain banks for temporary financing needs. Interest is charged to each fund, based on its borrowings, at a rate equal to the Federal Reserve funds rate plus an agreed upon spread. For the year ended December 31, 2010, the fund’s commitment fee and interest expense were $6,022 and $0, respectively, and are included in miscellaneous expense on the Statement of Operations.
17
MFS Blended Research Core Equity Portfolio
Notes to Financial Statements – continued
| (7) | | Transactions in Underlying Funds – Affiliated Issuers |
An affiliated issuer may be considered one in which the fund owns 5% or more of the outstanding voting securities, or a company which is under common control. For the purposes of this report, the fund assumes the following to be affiliated issuers:
| | | | | | | | | | | | | | | | |
| Underlying Funds | | Beginning
Shares/Par
Amount | | | Acquisitions
Shares/Par
Amount | | | Dispositions
Shares/Par
Amount | | | Ending
Shares/Par
Amount | |
| MFS Institutional Money Market Portfolio | | | 1,252,331 | | | | 85,683,022 | | | | (84,983,443 | ) | | | 1,951,910 | |
| | | | |
| Underlying Funds | | Realized
Gain (Loss) | | | Capital Gain
Distributions | | | Dividend
Income | | | Ending
Value | |
| MFS Institutional Money Market Portfolio | | | $— | | | | $— | | | | $5,694 | | | | $1,951,910 | |
18
MFS Blended Research Core Equity Portfolio
REPORT OF INDEPENDENT REGISTERED PUBLIC ACCOUNTING FIRM
To the Board of Trustees of MFS Variable Insurance Trust II and the Shareholders of
MFS Blended Research Core Equity Portfolio:
We have audited the accompanying statement of assets and liabilities, including the portfolio of investments, of MFS Blended Research Core Equity Portfolio (the “Fund”) (one of the portfolios comprising MFS Variable Insurance Trust II) as of December 31, 2010, and the related statement of operations for the year then ended, the statements of changes in net assets for each of the two years in the period then ended, and the financial highlights for each of the five years in the period then ended. These financial statements and financial highlights are the responsibility of the Fund’s management. Our responsibility is to express an opinion on these financial statements and financial highlights based on our audits.
We conducted our audits in accordance with the standards of the Public Company Accounting Oversight Board (United States). Those standards require that we plan and perform the audit to obtain reasonable assurance about whether the financial statements and financial highlights are free of material misstatement. The Fund is not required to have, nor were we engaged to perform, an audit of its internal control over financial reporting. Our audits included consideration of internal control over financial reporting as a basis for designing audit procedures that are appropriate in the circumstances, but not for the purpose of expressing an opinion on the effectiveness of the Fund’s internal control over financial reporting. Accordingly, we express no such opinion. An audit also includes examining, on a test basis, evidence supporting the amounts and disclosures in the financial statements, assessing the accounting principles used and significant estimates made by management, as well as evaluating the overall financial statement presentation. Our procedures included confirmation of securities owned as of December 31, 2010, by correspondence with the custodian. We believe that our audits provide a reasonable basis for our opinion.
In our opinion, the financial statements and financial highlights referred to above present fairly, in all material respects, the financial position of MFS Blended Research Core Equity Portfolio as of December 31, 2010, the results of its operations for the year then ended, the changes in its net assets for each of the two years in the period then ended, and the financial highlights for each of the five years in the period then ended, in conformity with accounting principles generally accepted in the United States of America.
DELOITTE & TOUCHE LLP
Boston, Massachusetts
February 14, 2011
19
MFS Blended Research Core Equity Portfolio
TRUSTEES AND OFFICERS – IDENTIFICATION AND BACKGROUND
The Trustees and officers of the Trust, as of February 1, 2011, are listed below, together with their principal occupations during the past five years. (Their titles may have varied during that period.) The address of each Trustee and officer is 500 Boylston Street, Boston, Massachusetts 02116.
| | | | | | |
Name, Date of Birth | | Position(s) Held
with Fund | | Trustee/Officer
Since (1) | | Principal Occupations During the Past Five Years and
Other Directorships (2) |
| INTERESTED TRUSTEE | | | | |
David D. Horn (3) (born 6/07/41) | | Trustee | | April 1986 | | Private investor; Sun Life Assurance Company of Canada, Senior Vice President and General Manager for the United States (until 1997); Director (until March 2004) |
| | |
| INDEPENDENT TRUSTEES | | | | |
J. Kermit Birchfield (born 1/08/40) | | Chairman | | May 1997 | | Consultant; Century Partners, Inc. (investments), Director; Displaytech, Inc. (technology), Chairman; Dessin Fournir LLC (furniture manufacturer), Director; Site Watch LLC (software to monitor oil tanks), Managing Director (2006 to present); Juridica Investments (fund investing in judicial matters), Director (2007 to present), Immuno Science, Inc. (medical research), Independent Director (2009 to present), Intermountain Industries, Inc. (oil & gas exploration and production), Director (until February 2009) |
| | | |
Robert C. Bishop (born 1/13/43) | | Trustee | | May 2001 | | AutoImmune, Inc. (pharmaceutical product development), Chairman, President and Chief Executive Officer; Caliper Life Sciences Corp. (laboratory analytical instruments), Chairman; Optobionics Corporation (ophthalmic devices), Director (until 2007); Millipore Corporation (purification/filtration products), Director (until July 2010); Waterstreet Capital (leverage buyouts), Advisory Board (until August 2010) |
| | | |
Frederick H. Dulles (born 3/12/42) | | Trustee | | May 2001 | | Dulles International Law LLC (law firm), Senior Lawyer (since 2009); Juridica Capital Management (US) Inc. (litigation financing), Vice President and General Counsel (since 2009); Dulles Properties LLC (real estate), Broker (since 2008); The Citadel School of Business Administration (education), Adjunct Professor (since 2003); Disher, Hamrick & Myers Residential, Inc. (real estate), Broker (until 2006); Frederick H. Dulles Law Practice (law firm), (until 2006); Charlestown School of Law (education), Adjunct Professor (until 2007); Prudential Carolina Real Estate, (real estate), Broker (until 2008); Free Enterprise Foundation Inc. (research institute), Director & Secretary (until 2008); Ten State International Law PLLP (law firm), Of Counsel (until 2009) |
| | | |
Marcia A. Kean (born 6/30/48) | | Trustee | | April 2005 | | Feinstein Kean Healthcare (consulting), Chief Executive Officer |
| | | |
Ronald G. Steinhart (born 6/15/40) | | Trustee | | May 2001 | | Private investor; Penske Automotive Group (automotive retailer), Director; Animal Health International, Inc. (animal health products), Director (since 2007); Texas Industries (concrete/aggregates/cement), Director (since 2007); Susser Holdings Corporation (retail convenience stores and distributor of wholesale motor fuel), Director (since 2009); Prentiss Properties Trust (real estate investment trust), Director (until 2006); Penson Worldwide, Inc. (securities clearance), Director (until 2008) |
| | | |
Haviland Wright (born 7/21/48) | | Trustee | | May 2001 | | X-Change Corp. (multi-media web services), Director (since 2010); Nano Loa Inc. (liquid crystal displays), Director (until 2009); Profitability of Hawaii (software), Chief Development Officer (until 2010); Elixir Technologies Corporation (software), Director (until 2010) |
| | | |
| OFFICERS | | | | | | |
Maria F. DiOrioDwyer (4)
(born 12/01/58) | | President | | November 2005 | | Massachusetts Financial Services Company, Executive Vice President and Chief Regulatory Officer; Chief Compliance Officer (since December 2006) |
| | | |
| Christopher R. Bohane (4) (born 1/18/74) | | Assistant Secretary and Assistant Clerk | | July 2005 | | Massachusetts Financial Services Company, Vice President and Senior Counsel |
| | | |
John M. Corcoran (4) (born 4/13/65) | | Treasurer | | October 2008 | | Massachusetts Financial Services Company, Senior Vice President (since October 2008); State Street Bank and Trust (financial services provider), Senior Vice President, (until September 2008) |
| | | |
Ethan D. Corey (4) (born 11/21/63) | | Assistant Secretary and Assistant Clerk | | July 2005 | | Massachusetts Financial Services Company, Senior Vice President and Associate General Counsel |
| | | |
David L. DiLorenzo (4) (born 8/10/68) | | Assistant Treasurer | | July 2005 | | Massachusetts Financial Services Company, Vice President |
| | | |
Timothy M. Fagan (4) (born 7/10/68) | | Assistant Secretary and Assistant Clerk | | September 2005 | | Massachusetts Financial Services Company, Vice President and Senior Counsel |
| | | |
Mark D. Fischer (4) (born 10/27/70) | | Assistant Treasurer | | July 2005 | | Massachusetts Financial Services Company, Vice President |
20
MFS Blended Research Core Equity Portfolio
Trustees and Officers – continued
| | | | | | |
Name, Date of Birth | | Position(s) Held
with Fund | | Trustee/Officer
Since (1) | | Principal Occupations During the Past Five Years and
Other Directorships (2) |
Robyn L. Griffin (born 7/04/75) | | Assistant Independent Chief Compliance Officer | | August 2008 | | Griffin Compliance LLC (provider of compliance services), Principal (since August 2008); State Street Corporation (financial services provider), Mutual Fund Administration Assistant Vice President (October 2006 – July 2008); Liberty Mutual Group (insurance), Personal Market Assistant Controller (April 2006 – October 2006); Deloitte & Touche LLP (professional services firm), Senior Manager (prior to April 2006) |
| | | |
Brian E. Langenfeld (4) (born 3/07/73) | | Assistant Secretary and Assistant Clerk | | May 2006 | | Massachusetts Financial Services Company, Vice President and Senior Counsel (since May 2006); John Hancock Advisers, LLC, Assistant Vice President and Counsel (until April 2006) |
| | | |
Ellen Moynihan (4) (born 11/13/57) | | Assistant Treasurer | | May 1997 | | Massachusetts Financial Services Company, Senior Vice President |
| | | |
Susan S. Newton (4) (born 3/07/50) | | Assistant Secretary and Assistant Clerk | | May 2005 | | Massachusetts Financial Services Company, Senior Vice President and Associate General Counsel |
| | | |
Susan A. Pereira (4)
(born 11/05/70) | | Assistant Secretary and Assistant Clerk | | July 2005 | | Massachusetts Financial Services Company, Vice President and Senior Counsel |
| | | |
Mark N. Polebaum (4) (born 5/01/52) | | Secretary and Clerk | | February 2006 | | Massachusetts Financial Services Company, Executive Vice President, General Counsel and Secretary (since January 2006); Wilmer Cutler Pickering Hale and Dorr LLP (law firm), Partner (until January 2006) |
| | | |
Frank L. Tarantino (born 3/07/44) | | Independent Chief Compliance Officer | | September 2004 | | Tarantino LLC (provider of compliance services), Principal |
| | | |
Richard S. Weitzel (4) (born 7/16/70) | | Assistant Secretary and Assistant Clerk | | October 2007 | | Massachusetts Financial Services Company, Vice President and Assistant General Counsel |
| | | |
James O. Yost (4) (born 6/12/60) | | Assistant Treasurer | | April 1992 | | Massachusetts Financial Services Company, Senior Vice President |
| (1) | Date first appointed to serve as Trustee/Officer of an MFS fund or a Compass variable account. Each Trustee has served continuously since appointment. For the period March 2008 until October 2008, Ms. DiOrioDwyer served as Treasurer of the Funds. |
| (2) | Directorships or trusteeships of companies required to report to the Securities and Exchange Commission (i.e., “public companies”). |
| (3) | “Interested person” of the Trust, within the meaning of the Investment Company Act of 1940 (referred to as the 1940 Act), which is the principal federal law governing investment companies like the Trust, as a result of position with Sun Life of Canada (U.S.). The address of Sun Life of Canada (U.S.) is One Sun Life Executive Park, Wellesley Hills, Massachusetts 02481. |
| (4) | “Interested person” of MFS within the meaning of the 1940 Act. The address of MFS is 500 Boylston Street, Boston, Massachusetts 02116. |
The Trust does not hold annual meetings for the purpose of electing Trustees, and Trustees are not elected for fixed terms. Each Trustee and officer holds office until his or her successor is chosen and qualified, or until his or her earlier death, resignation, retirement or removal.
All Trustees currently serve as Trustees of the Trust and have served in that capacity since originally elected or appointed. All of the Trustees are also Managers of the Compass Variable Accounts. The executive officers of the Trust hold similar offices for the Compass Variable Accounts and other funds in the MFS fund complex. As of January 1, 2011, each Trustee serves as a Trustee or Manager of 31 Accounts/Portfolios.
21
MFS Blended Research Core Equity Portfolio
Trustees and Officers – continued
The Statement of Additional Information contains further information about the Trustees and is available without charge upon request by calling 1-800-752-7215.
| | |
Investment Adviser
Massachusetts Financial Services Company 500 Boylston Street, Boston, MA 02116-3741 | | Custodian State Street Bank and Trust 1 Lincoln Street, Boston, MA 02111-2900 |
Distributor
MFS Fund Distributors, Inc. 500 Boylston Street, Boston, MA 02116-3741 | | Independent Registered Public Accounting Firm Deloitte & Touche LLP 200 Berkeley Street, Boston, MA 02116 |
Portfolio Manager Matthew Krummell | | |
22
MFS Blended Research Core Equity Portfolio
BOARD REVIEW OF INVESTMENT ADVISORY AGREEMENT
The Investment Company Act of 1940 requires that both the full Board of Trustees and a majority of the non-interested (“independent”) Trustees, voting separately, annually approve the continuation of the investment advisory agreement between MFS Variable Insurance Trust II (the “Trust”) and Massachusetts Financial Services Company (“MFS”) on behalf of the Fund. The Trustees consider matters bearing on the Fund and the advisory arrangement at their meetings throughout the year, including a review of performance data at each regular meeting. In addition, the independent Trustees met in person in May and again in July 2010 (“contract review meetings”) for the specific purpose of considering whether to approve the continuation of the investment advisory agreement for the Fund. The independent Trustees were assisted in their evaluation of the investment advisory agreement by independent legal counsel, from whom they received separate legal advice and with whom they met separately from MFS management during various contract review meetings. The independent Trustees were also assisted in this process by the Fund’s Independent Chief Compliance Officer, a full-time senior officer appointed by and reporting to the independent Trustees.
In connection with their deliberations, the Trustees, including the independent Trustees, considered such information and factors as they believed, in light of the legal advice furnished to them and their own business judgment, to be relevant. The investment advisory agreement was considered separately for the Fund, although the Trustees also took into account the common interests of all Funds in the Trust in their review. As described below, the Trustees considered the nature, quality, and extent of the various investment advisory, administrative, and shareholder services performed by MFS under the existing investment advisory agreement and other arrangements with the Trust.
In connection with their contract review meetings, the Trustees received and relied upon materials which included, among other items: (i) information provided by Lipper Inc. (“Lipper”) on the investment performance of the Fund for various time periods ended December 31, 2009, compared to the investment performance of a group of funds with substantially similar investment classifications/objectives (the “Lipper performance universe”), (ii) information provided by Lipper on the Fund’s advisory fees and other expenses compared to the advisory fees and other expenses of comparable funds identified by Lipper (the “Lipper expense group”), (iii) information provided by MFS on the advisory fees of comparable portfolios of its other clients, including institutional separate account and other clients, (iv) information as to whether, and to what extent applicable, expense waivers, reimbursements or fee “breakpoints” are observed for the Fund, (v) information regarding MFS’ financial results and financial condition, including MFS’ and certain of its affiliates’ estimated profitability from services performed for the Fund, (vi) MFS’ views regarding the outlook for the mutual fund industry and its strategic business plans, (vii) descriptions of various functions performed by MFS for the Trust, such as compliance monitoring and portfolio trading practices, and (viii) information regarding the overall organization of MFS, including information about MFS’ senior management and other personnel providing investment advisory, administrative and other services to the Fund. The comparative performance, fee and expense information prepared and provided by Lipper was not independently verified, and the independent Trustees did not independently verify any information provided to them by MFS.
The Trustees’ conclusion as to the continuation of the investment advisory agreement was based on comprehensive consideration of all information provided to the Trustees and was not the result of any single factor. Some of the factors that figured particularly in the Trustees’ deliberations are described below for the Fund, while individual Trustees may have given different weight to various factors and evaluated the information presented as a whole differently than another individual Trustee. The Trustees recognized that the fee arrangements for the Fund reflect years of review and discussion between the independent Trustees and MFS, that certain aspects of such arrangements may receive greater scrutiny in some years than others, and that the Trustees’ conclusions may be based, in part, on their consideration of these same arrangements during the course of the year and in prior years.
Based on information provided by Lipper, the Trustees compared the Fund’s total return investment performance to the performance of the Lipper performance universe over various time periods. The Trustees placed particular emphasis on the total return performance of the Fund’s Initial Class shares in comparison to the performance of funds in its Lipper performance universe over the one-, three- and five-year periods ended December 31, 2009. The Trustees did not rely on performance results for more recent periods, including those shown elsewhere in this report.
The Trustees noted the performance of the Fund’s Initial Class shares was in the 4th quintile relative to the other funds in the Lipper performance universe for the one-year period (the 1st quintile being the best performers and the 5th quintile being the worst performers). The total return performance of the Fund was in the 2nd quintile for the three-year and the five-year periods ended December 31, 2009, relative to the Lipper performance universe. Based on the nature and quality of services provided by MFS, the Board of Trustees concluded that the Fund’s performance was satisfactory.
In the course of their deliberations, the Trustees took into account information provided by MFS during contract review meetings, as well as during investment review meetings conducted with portfolio management personnel during the course of the year.
23
MFS Blended Research Core Equity Portfolio
Board Review of Investment Advisory Agreement – continued
In assessing the reasonableness of the Fund’s advisory fee, the Trustees considered, among other information, the Fund’s advisory fee and the total expense ratio of the Fund’s Initial Class shares as a percentage of average daily net assets, compared to the advisory fee and total expense ratios of its peer group of funds based on information provided by Lipper. The Trustees also considered the advisory fees charged by MFS to institutional accounts. In comparing these fees, the Trustees considered the generally broader scope of services provided by MFS to the Trust than those provided to institutional accounts. The Trustees also considered the higher demands placed on MFS’ investment personnel and trading infrastructure as a result of the daily cash in-flows and out-flows of the Fund, and the impact on MFS and related expenses due to the more extensive regulatory regime to which the Fund is subject, compared to institutional accounts.
In considering the fees, the Trustees noted from the Lipper data that the Fund’s effective advisory fee rate and total expense ratio were each below the median of such fees and expenses of funds in the Lipper expense group. In addition, the Trustees accepted MFS’ offer to continue the expense limitation for the Fund. They noted that the Fund’s advisory fee rate schedule is not currently subject to any breakpoints. However, the Trustees concluded that the fees were reasonable in light of the nature and quality of services provided by MFS, and determined not to recommend any advisory fee breakpoints for the Fund at this time.
The Trustees also considered information prepared by MFS relating to its costs and profits with respect to the Fund and other investment companies and accounts advised by MFS, as well as MFS’ methodologies used to determine and allocate its costs to the Fund and other accounts and products for purposes of estimating profitability.
After reviewing these and other factors described below, the Trustees concluded that the advisory fees charged to the Fund represent reasonable compensation in light of the nature and quality of the services being provided by MFS.
In addition, the Trustees considered MFS’ resources and related efforts to continue to retain, attract and motivate capable personnel to serve the Fund. The Trustees also considered the financial resources of MFS and its parent, Sun Life Financial Inc. The Trustees further considered any advantages and possible disadvantages of having an adviser which also serves other investment companies as well as institutional accounts.
The Trustees also considered the nature, quality, cost, and extent of administrative, transfer agency, and distribution services provided to the Fund by MFS and its affiliates under agreements and plans other than the investment advisory agreement, including the 12b-1 fees the Fund pays to MFS Fund Distributors, Inc., an affiliate of MFS. The Trustees also considered the nature, extent and quality of certain other services MFS performs or arranges on the Fund’s behalf, which may include securities lending programs, directed expense payment programs, class action recovery programs, and MFS’ interaction with third-party service providers, principally custodians and sub-custodians. The Trustees concluded that the various non-advisory services provided by MFS and its affiliates on behalf of the Fund were satisfactory. The Trustees also considered the benefits to MFS from the use of the Fund’s portfolio brokerage commissions to pay for investment research and various other factors. Additionally, the Trustees considered so-called “fall-out benefits” to MFS such as reputational value derived from serving as investment manager to the Trust, and determined that any such benefits derived by MFS were reasonable and fair.
Based on their evaluation of factors that they deemed to be material, including those factors described above, the Board of Trustees, including a majority of the independent Trustees, concluded that the investment advisory agreement should be continued for an additional one-year period, commencing September 1, 2010.
A discussion regarding the Board’s most recent review and renewal of the fund’s Investment Advisory Agreement with MFS is available by clicking on the fund’s name under “Variable Insurance Portfolios — VIT II” in the “Products and Performance” section of the MFS Web site (mfs.com).
24
MFS Blended Research Core Equity Portfolio
PROXY VOTING POLICIES AND INFORMATION
A general description of the MFS funds’ proxy voting policies and procedures is available without charge, upon request, by calling 1-800-225-2606, by visiting the Proxy Voting section of mfs.com or by visiting the SEC’s Web site at http://www.sec.gov.
Information regarding how the fund voted proxies relating to portfolio securities during the most recent twelve-month period ended June 30 is available without charge by visiting the Proxy Voting section of mfs.com or by visiting the SEC’s Web site at http://www.sec.gov.
QUARTERLY PORTFOLIO DISCLOSURE
The fund will file a complete schedule of portfolio holdings with the Securities and Exchange Commission (the Commission) for the first and third quarters of each fiscal year on Form N-Q. The fund’s Form N-Q may be reviewed and copied at the:
Public Reference Room
Securities and Exchange Commission
100 F Street, NE, Room 1580
Washington, D.C. 20549
Information on the operation of the Public Reference Room may be obtained by calling the Commission at 1-800-SEC-0330. The fund’s Form N-Q is available on the EDGAR database on the Commission’s Internet Web site at http://www.sec.gov, and copies of this information may be obtained, upon payment of a duplicating fee, by electronic request at the following e-mail address: publicinfo@sec.gov or by writing the Public Reference Section at the above address.
FURTHER INFORMATION
From time to time, MFS may post important information about the fund or the MFS funds on the MFS web site (mfs.com). This information is available by visiting the “News & Commentary” section of mfs.com or by clicking on the fund’s name under “Variable Insurance Portfolios — VIT II” in the “Products and Performance” section of mfs.com.
FEDERAL TAX INFORMATION (unaudited)
The following information is provided pursuant to provisions of the Internal Revenue Code.
For corporate shareholders, 100% of the ordinary income dividends paid during the fiscal year qualify for the corporate dividends received deduction.
25
MFS Blended Research Core Equity Portfolio
MFS® PRIVACY NOTICE
Privacy is a concern for every investor today. At MFS Investment Management® and the MFS funds, we take this concern very seriously. We want you to understand our policies about the investment products and services that we offer, and how we protect the nonpublic personal information of investors who have a direct relationship with us and our wholly owned subsidiaries.
Throughout our business relationship, you provide us with personal information. We maintain information and records about you, your investments, and the services you use. Examples of the nonpublic personal information we maintain include
| | Ÿ | | data from investment applications and other forms |
| | Ÿ | | share balances and transactional history with us, our affiliates, or others |
| | Ÿ | | facts from a consumer reporting agency |
We do not disclose any nonpublic personal information about our customers or former customers to anyone, except as permitted by law. We may share nonpublic personal information with third parties or certain of our affiliates in connection with servicing your account or processing your transactions. We may share information with companies or financial institutions that perform marketing services on our behalf or with other financial institutions with which we have joint marketing arrangements, subject to any legal requirements.
Authorization to access your nonpublic personal information is limited to appropriate personnel who provide products, services, or information to you. We maintain physical, electronic, and procedural safeguards to help protect the personal information we collect about you.
If you have any questions about the MFS privacy policy, please call 1-800-225-2606 any business day.
Note: If you own MFS products or receive MFS services in the name of a third party such as a bank or broker-dealer, their privacy policy may apply to you instead of ours.
26


MFS® GLOBAL RESEARCH PORTFOLIO
The report is prepared for the general information of contract owners. It is authorized for distribution to prospective investors only when preceded or accompanied by a current prospectus.
NOT FDIC INSURED Ÿ MAY LOSE VALUE Ÿ NO BANK GUARANTEE Ÿ NOT A DEPOSIT Ÿ NOT INSURED BY ANY FEDERAL GOVERNMENT AGENCY OR NCUA/NCUSIF
MFS Global Research Portfolio
LETTER FROM THE CEO

Dear Contract Owners:
After an extended rebound in the financial markets, uncertainty returned in 2010 as investors began to question the durability of the recovery for global economies and markets. That uncertainty led to increased risk aversion, especially as investors saw the eurozone struggle with the debt woes of many of its members. In September, the U.S. Federal Reserve Board’s promises to further loosen monetary policy helped assuage market fears and drive asset prices off their recent lows. A combination of solid earnings and improving economic data gave an additional boost to investor sentiment. As we enter 2011, we are cautiously optimistic that economic growth will continue to improve and that the global economies will recover from the shocks of the past few years. We expect the pace of recovery worldwide will be uneven and volatile.
As always, we continue to be mindful of the many economic challenges faced at the local, national, and international levels. It is in times such as these that we want to remind investors of the merits of maintaining a long-term view, adhering to basic investing principles such as asset allocation and diversification, and working closely with their advisors to research and identify appropriate investment opportunities.
Respectfully,

Robert J. Manning
Chairman and Chief Executive Officer
MFS Investment Management®
February 14, 2011
The opinions expressed in this letter are subject to change, may not be relied upon for investment advice, and no forecasts can be guaranteed.
1
MFS Global Research Portfolio
PORTFOLIO COMPOSITION
Portfolio structure
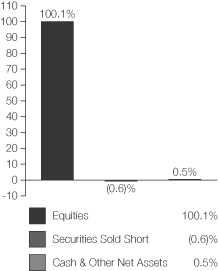
| | | | |
| Top ten holdings | | | | |
| Apple, Inc. | | | 2.7% | |
| Teck Resources Ltd., “B” | | | 2.0% | |
| Exxon Mobil Corp. | | | 1.7% | |
| BP PLC | | | 1.7% | |
| Target Corp. | | | 1.6% | |
| Royal Dutch Shell PLC, “A” | | | 1.6% | |
| PepsiCo, Inc. | | | 1.6% | |
| Oracle Corp. | | | 1.5% | |
| Procter & Gamble Co. | | | 1.5% | |
| Danaher Corp. | | | 1.4% | |
| | | | |
| Global equity sectors | | | | |
| Capital Goods (s) | | | 22.0% | |
| Financial Services | | | 20.7% | |
| Energy | | | 15.1% | |
| Technology | | | 12.8% | |
| Consumer Cyclicals | | | 8.6% | |
| Health Care | | | 7.9% | |
| Consumer Staples | | | 7.1% | |
| Telecommunications/Cable Television | | | 5.3% | |
| |
| Issuer country weightings | | | | |
| United States | | | 49.8% | |
| United Kingdom | | | 9.9% | |
| Japan | | | 5.6% | |
| Germany | | | 4.1% | |
| Switzerland | | | 3.7% | |
| France | | | 3.4% | |
| Canada | | | 3.1% | |
| Netherlands | | | 3.0% | |
| China | | | 2.8% | |
| Other Countries | | | 14.6% | |
| (s) | Global equity sector includes equities and securities sold short. |
Percentages are based on net assets as of 12/31/10.
The portfolio is actively managed and current holdings may be different.
2
MFS Global Research Portfolio
MANAGEMENT REVIEW
Summary of Results
For the twelve months ended December 31, 2010, Initial Class shares of the MFS Global Research Portfolio (the “fund”) provided a total return of 12.66%, while Service Class shares of the fund provided a total return of 12.42%. These compare with a return of 13.21% for the fund’s benchmark, the Morgan Stanley Capital International (MSCI) All Country World Index.
Market Environment
The first quarter of the reporting period witnessed a continuation of the financial market and macroeconomic rebounds that had begun in early 2009. These recoveries in global activity and asset valuations were generally synchronized around the world, led importantly by emerging Asian economies, but broadening to include most of the global economy to varying degrees. Primary drivers of the recoveries included an unwinding of the inventory destocking that took place earlier, the production of manufacturing and capital goods, as well as massive fiscal and monetary stimulus.
During most of the remainder of the period, heightened risk surrounding the public-debt profiles of several of the peripheral European countries impaired market sentiment. At the same time, the improving trend in global macroeconomic data began to weaken somewhat. These two dynamics caused many asset prices to retrench significantly, as many questioned the durability of the global recovery.
Towards the end of the period, the U.S. Federal Reserve led markets to believe that further monetary loosening would be forthcoming if macroeconomic activity did not show signs of improvement. The prospects for more easing by the Fed improved market sentiment and drove risk-asset prices markedly higher. However, in a text-book case of “buy the rumor, sell the fact,” the weeks following the early November announcement of further quantitative easing saw a sell-off in U.S. Treasury bonds. This rise in Treasury yields occurred despite risk-off behavior in equities and credit markets (which would normally result in Treasury yield compression), and appears to have been the result of a few factors: signs of improved U.S. and global economic activity; opposition to quantitative easing from some quarters; and crowded long positions in U.S. Treasuries. The December agreement on an expansionary U.S. fiscal package also boosted sentiment, leading markets to reach near-term highs in risky asset valuations toward year end.
Detractors from Performance
Security selection in the financial services sector detracted from the fund’s performance relative to the MSCI All Country World Index. The fund’s holdings of global banking firm BNP Paribas (France) and diversified financial services firm Bank of America were among the top detractors. Shares of Bank of America fell during the period as the company reported weaker-than-expected capital markets revenues and net interest income. We believe concerns about potential losses tied to loan repurchases also weighed on the company’s stock price.
Stock selection in the health care sector also held back relative returns. Pharmaceutical companies, Sanofi-Aventis (France) and Roche Holding (Switzerland), and medical device maker Medtronic hurt relative results. Shares of Medtronic came under pressure due to weaker-than-expected sales and lower margins in its Cardiac Rhythm Management (CRM) business, and a reduction in management’s revenue guidance.
Stock selection in the consumer staples sector was another negative factor for relative performance. However, no individual stocks within this sector were among the fund’s top detractors.
Stocks in other sectors that detracted from relative performance included network equipment company Cisco, agrichemical products company Monsanto, apparel retailer Esprit Holdings (Hong Kong), internet search engine Google, and telecommunications services provider Royal KPN (Netherlands).
During the reporting period, the fund’s currency exposure detracted from relative performance. All of our investment decisions are driven by the fundamentals of each individual opportunity and as such, it is common for our funds to have different currency exposures than the benchmark.
Contributors to Performance
Stock selection in the capital goods sector was the primary contributor to relative performance. Holdings of mining companies, Teck Resources (Canada) and Iluka Resources (b) (Australia), project management provider Fluor, automotive and industrial products manufacturer Tomkins (h) (United Kingdom), and shipbuilder Keppel (Singapore) were among the fund’s top contributors. Shares of Teck appreciated due to increased demand from developing economies and weaker-than-expected supply from competitors. The company also benefited from an increase in commodities prices during the reporting period.
3
MFS Global Research Portfolio
Management Review – continued
Elsewhere, personal electronics maker Apple, specialty retailer Limited Brands, apparel retailer Abercrombie & Fitch, and entertainment and communications services provider Virgin Media (United Kingdom) bolstered relative returns. Shares of Abercrombie & Fitch climbed as the company reported better-than-expected earnings results. The company also cut its capital expenditure forecast and benefited from improving U.S. sales and increasing international penetration. The timing of our ownership in shares of integrated oil and gas company BP (United Kingdom) also positively impacted relative results.
The total return of the fund includes proceeds from a non-recurring litigation settlement received during the reporting period, which if excluded would have resulted in a lower total return.
Respectfully,
Michael Cantara
Portfolio Manager
Note to Contract Owners: Effective October 2010, Jose Luis Garcia is no longer a co-manager of the fund.
| (b) | Security is not a benchmark constituent. |
| (h) | Security was not held in the portfolio at period end. |
The views expressed in this report are those of the portfolio manager only through the end of the period of the report as stated on the cover and do not necessarily reflect the views of MFS or any other person in the MFS organization. These views are subject to change at any time based on market or other conditions, and MFS disclaims any responsibility to update such views. These views may not be relied upon as investment advice or an indication of trading intent on behalf of any MFS portfolio. References to specific securities are not recommendations of such securities, and may not be representative of any MFS portfolio’s current or future investments.
4
MFS Global Research Portfolio
PERFORMANCE SUMMARY THROUGH 12/31/10
The following chart illustrates the historical performance of the fund in comparison to its benchmark(s). Benchmarks are unmanaged and may not be invested in directly. Benchmark returns do not reflect any fees or expenses. The performance of other share classes will be greater than or less than that of the class depicted below. (See Notes to Performance Summary.)
Performance data shown represents past performance and is no guarantee of future results. Investment return and principal value fluctuate so your units, when sold, may be worth more or less than the original cost; current performance may be lower or higher than quoted. The performance shown does not reflect the deduction of taxes, if any, that a contract holder would pay on fund distributions or the redemption of contract units. The returns for the fund shown also do not reflect the deduction of expenses associated with variable products, such as mortality and expense risk charges, separate account charges, and sales charges imposed by the insurance company separate accounts. Such expenses would reduce the overall returns shown.
Growth of a Hypothetical $10,000 Investment
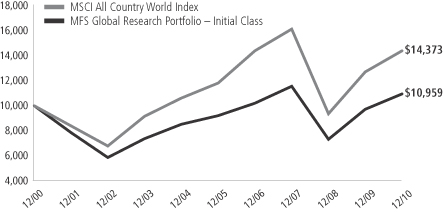
Total Returns through 12/31/10
Average annual total returns
| | | | | | | | | | | | | | |
| | | Share class | | Class inception date | | 1-yr | | 5-yr | | 10-yr | | Life (t) | | |
| | | Initial Class | | 11/07/94 | | 12.66% | | 3.51% | | 0.92% | | N/A | | |
| | | Service Class | | 8/24/01 | | 12.42% | | 3.25% | | N/A | | 3.22% | | |
| | | | | |
| Comparative benchmark | | | | | | | | | | |
| | | MSCI All Country World Index (f) | | 13.21% | | 3.98% | | 3.69% | | N/A | | |
| (f) | Source: FactSet Research Systems Inc. |
| (t) | For the period from the class inception date through the stated period end (for those share classes with less than 10 years of performance history). No comparative benchmark performance information is provided for “life” periods. (See Notes to Performance Summary.) |
Includedin the Initial Class and Service Class total returns for the year ended December 31, 2010 are proceeds received from a non-recurring litigation settlement against Tyco International Ltd. Had these proceeds not been included, the 1-year total returns would have been lower by approximately 0.71% and 0.70%, respectively.
Benchmark Definition
MSCI All Country World Index – a market capitalization-weighted index that is designed to measure equity market performance in the global developed and emerging markets.
It is not possible to invest directly in an index.
Notes to Performance Summary
Average annual total return represents the average annual change in value for each share class for the periods presented. Life returns are presented where the share class has less than 10 years of performance history and represent the average annual total return from the class inception date to the stated period end date. As the fund’s share classes may have different inception dates, the life returns may represent different time periods and may not be comparable. As a result, no comparative benchmark performance information is provided for life periods.
Performance results reflect any applicable expense subsidies and waivers in effect during the periods shown. Without such subsidies and waivers the fund’s performance results would be less favorable. Please see the prospectus and financial statements for complete details. All results are historical and assume the reinvestment of any dividends and capital gains distributions.
5
MFS Global Research Portfolio
Performance Summary – continued
Prior to October 6, 2008, MFS primarily invested the fund’s assets in U.S. equity securities. Effective October 6, 2008, MFS primarily invests the fund’s assets in U.S. and foreign equity securities, including emerging market equity securities.
From time to time the fund may receive proceeds from litigation settlements, without which performance would be lower.
6
MFS Global Research Portfolio
EXPENSE TABLE
Fund Expenses Borne by the Contract Holders During the Period, July��1, 2010 through December 31, 2010
As a contract holder of the fund, you incur ongoing costs, including management fees; distribution and/or service (12b-1) fees; and other fund expenses. This example is intended to help you understand your ongoing costs (in dollars) of investing in the fund and to compare these costs with the ongoing costs of investing in other mutual funds.
The example is based on an investment of $1,000 invested at the beginning of the period and held for the entire period July 1, 2010 through December 31, 2010.
Actual Expenses
The first line for each share class in the following table provides information about actual account values and actual expenses. You may use the information in this line, together with the amount you invested, to estimate the expenses that you paid over the period. Simply divide your account value by $1,000 (for example, an $8,600 account value divided by $1,000 = 8.6), then multiply the result by the number in the first line under the heading entitled “Expenses Paid During Period” to estimate the expenses you paid on your account during this period.
Hypothetical Example for Comparison Purposes
The second line for each share class in the following table provides information about hypothetical account values and hypothetical expenses based on the fund’s actual expense ratio and an assumed rate of return of 5% per year before expenses, which is not the fund’s actual return. The hypothetical account values and expenses may not be used to estimate the actual ending account balance or expenses you paid for the period. You may use this information to compare the ongoing costs of investing in the fund and other funds. To do so, compare this 5% hypothetical example with the 5% hypothetical examples that appear in the shareholder reports of the other funds.
Please note that the expenses shown in the table are meant to highlight the fund’s ongoing costs only and do not take into account the fees and expenses imposed under the variable contracts through which your investment in the fund is made. Therefore, the second line for each share class in the table is useful in comparing ongoing costs associated with an investment in vehicles (such as the fund) which fund benefits under variable annuity and variable life insurance contracts and to qualified pension and retirement plans only, and will not help you determine the relative total costs of investing in the fund through variable annuity and variable life insurance contracts. If the fees and expenses imposed under the variable contracts were included, your costs would have been higher.
| | | | | | | | | | | | | | | | | | |
| Share Class | | | | Annualized
Expense Ratio | | | Beginning
Account Value
7/01/10 | | | Ending
Account Value
12/31/10 | | | Expenses Paid
During Period (p)
7/01/10-12/31/10 | |
| Initial Class | | Actual | | | 0.98% | | | | $1,000.00 | | | | $1,261.81 | | | | $5.59 | |
| | Hypothetical (h) | | | 0.98% | | | | $1,000.00 | | | | $1,020.27 | | | | $4.99 | |
| Service Class | | Actual | | | 1.23% | | | | $1,000.00 | | | | $1,260.55 | | | | $7.01 | |
| | Hypothetical (h) | | | 1.23% | | | | $1,000.00 | | | | $1,019.00 | | | | $6.26 | |
| (h) | 5% class return per year before expenses. |
| (p) | Expenses paid is equal to each class’ annualized expense ratio, as shown above, multiplied by the average account value over the period, multiplied by the number of days in the period, divided by the number of days in the year. |
7
MFS Global Research Portfolio
PORTFOLIO OF INVESTMENTS – 12/31/10
The Portfolio of Investments is a complete list of all securities owned by your fund. It is categorized by broad-based asset classes.
| | | | | | | | |
| Issuer | | Shares/Par | | | Value ($) | |
| | | | | | | | |
| COMMON STOCKS – 99.7% | | | | | | | | |
| Aerospace – 1.2% | | | | | | | | |
| Honeywell International, Inc. | | | 14,920 | | | $ | 793,147 | |
| Precision Castparts Corp. | | | 8,440 | | | | 1,174,932 | |
| | | | | | | | |
| | | | | | $ | 1,968,079 | |
| | | | | | | | |
| Alcoholic Beverages – 0.6% | | | | | | | | |
| Heineken N.V. | | | 19,683 | | | $ | 965,035 | |
| | | | | | | | |
| Apparel Manufacturers – 1.3% | | | | | | | | |
| Li & Fung Ltd. | | | 80,000 | | | $ | 464,183 | |
| LVMH Moet Hennessy Louis Vuitton S.A. | | | 4,687 | | | | 771,005 | |
| NIKE, Inc., “B” | | | 10,770 | | | | 919,973 | |
| | | | | | | | |
| | | | | | $ | 2,155,161 | |
| | | | | | | | |
| Automotive – 1.7% | | | | | | | | |
| Bayerische Motoren Werke AG | | | 17,500 | | | $ | 1,376,222 | |
| DENSO Corp. | | | 17,500 | | | | 603,954 | |
| General Motors Co. (a) | | | 10,940 | | | | 403,248 | |
| Mando Corp. (a) | | | 2,840 | | | | 326,288 | |
| | | | | | | | |
| | | | | | $ | 2,709,712 | |
| | | | | | | | |
| Biotechnology – 0.5% | | | | | | | | |
| Gilead Sciences, Inc. (a) | | | 21,200 | | | $ | 768,288 | |
| | | | | | | | |
| Broadcasting – 0.4% | | | | | | | | |
| Publicis Groupe S.A. | | | 12,616 | | | $ | 657,492 | |
| | | | | | | | |
| Brokerage & Asset Managers – 2.7% | | | | | | | | |
| Aberdeen Asset Management PLC | | | 229,651 | | | $ | 726,481 | |
| Affiliated Managers Group, Inc. (a) | | | 5,190 | | | | 514,952 | |
| Blackrock, Inc. | | | 3,327 | | | | 634,060 | |
| BM&F Bovespa S.A. | | | 97,600 | | | | 771,981 | |
| Deutsche Boerse AG | | | 13,461 | | | | 931,775 | |
| Franklin Resources, Inc. | | | 7,100 | | | | 789,591 | |
| | | | | | | | |
| | | | | | $ | 4,368,840 | |
| | | | | | | | |
| Business Services – 1.9% | | | | | | | | |
| Accenture Ltd., “A” | | | 26,530 | | | $ | 1,286,440 | |
| Cielo S.A. | | | 43,100 | | | | 349,214 | |
| Cognizant Technology Solutions Corp., “A” (a) | | | 12,540 | | | | 919,057 | |
| Mitsubishi Corp. | | | 18,500 | | | | 500,838 | |
| | | | | | | | |
| | | | | | $ | 3,055,549 | |
| | | | | | | | |
| Cable TV – 0.8% | | | | | | | | |
| Comcast Corp., “Special A” | | | 34,470 | | | $ | 717,321 | |
| Virgin Media, Inc. | | | 18,570 | | | | 505,847 | |
| | | | | | | | |
| | | | | | $ | 1,223,168 | |
| | | | | | | | |
| Chemicals – 2.3% | | | | | | | | |
| Celanese Corp. | | | 27,630 | | | $ | 1,137,527 | |
| Ecolab, Inc. | | | 12,760 | | | | 643,359 | |
| Monsanto Co. | | | 20,690 | | | | 1,440,852 | |
| Nufarm Ltd. (a) | | | 100,559 | | | | 528,658 | |
| | | | | | | | |
| | | | | | $ | 3,750,396 | |
| | | | | | | | |
| | | | | | | | |
| Issuer | | Shares/Par | | | Value ($) | |
| | | | | | | | |
| COMMON STOCKS – continued | |
| Computer Software – 1.8% | | | | | | | | |
| Autodesk, Inc. (a) | | | 13,730 | | | $ | 524,486 | |
| Oracle Corp. | | | 78,520 | | | | 2,457,676 | |
| | | | | | | | |
| | | | | | $ | 2,982,162 | |
| | | | | | | | |
| Computer Software – Systems – 5.6% | |
| Acer, Inc. | | | 410,679 | | | $ | 1,269,088 | |
| Apple, Inc. (a)(s) | | | 13,360 | | | | 4,309,402 | |
| EMC Corp. (a) | | | 80,030 | | | | 1,832,687 | |
| Hewlett-Packard Co. | | | 31,990 | | | | 1,346,779 | |
| Konica Minolta Holdings, Inc. | | | 31,000 | | | | 322,256 | |
| | | | | | | | |
| | | | | | $ | 9,080,212 | |
| | | | | | | | |
| Conglomerates – 0.7% | | | | | | | | |
| Hutchison Whampoa Ltd. | | | 110,000 | | | $ | 1,132,153 | |
| | | | | | | | |
| Construction – 1.0% | | | | | | | | |
| Anhui Conch Cement Co. Ltd. | | | 94,000 | | | $ | 440,806 | |
| Corporacion GEO S.A.B. de C.V., “B” (a) | | | 29,750 | | | | 109,075 | |
| Duratex S.A. | | | 7,800 | | | | 83,873 | |
| Owens Corning (a) | | | 16,850 | | | | 524,878 | |
| Urbi Desarrollos Urbanos S.A. de C.V. (a) | | | 162,150 | | | | 380,626 | |
| | | | | | | | |
| | | | | | $ | 1,539,258 | |
| | | | | | | | |
| Consumer Products – 2.4% | | | | | | | | |
| Procter & Gamble Co. | | | 37,490 | | | $ | 2,411,732 | |
| Reckitt Benckiser Group PLC | | | 26,032 | | | | 1,430,673 | |
| | | | | | | | |
| | | | | | $ | 3,842,405 | |
| | | | | | | | |
| Electrical Equipment – 2.9% | | | | | | | | |
| Danaher Corp. (s) | | | 49,520 | | | $ | 2,335,858 | |
| Schneider Electric S.A. | | | 6,931 | | | | 1,037,332 | |
| Siemens AG | | | 10,518 | | | | 1,302,917 | |
| | | | | | | | |
| | | | | | $ | 4,676,107 | |
| | | | | | | | |
| Electronics – 1.4% | | | | | | | | |
| Advanced Micro Devices, Inc. (a) | | | 72,940 | | | $ | 596,649 | |
| First Solar, Inc. (a)(l) | | | 4,840 | | | | 629,878 | |
| Samsung Electronics Co. Ltd. | | | 616 | | | | 515,097 | |
| Samsung Electronics Co. Ltd., GDR | | | 1,063 | | | | 448,480 | |
| | | | | | | | |
| | | | | | $ | 2,190,104 | |
| | | | | | | | |
| Energy – Independent – 3.0% | | | | | | | | |
| Apache Corp. | | | 8,310 | | | $ | 990,801 | |
| Bankers Petroleum Ltd. (a) | | | 75,582 | | | | 577,716 | |
| CONSOL Energy, Inc. | | | 7,250 | | | | 353,365 | |
| INPEX Corp. | | | 157 | | | | 919,491 | |
| Occidental Petroleum Corp. | | | 16,770 | | | | 1,645,137 | |
| Southwestern Energy Co. (a) | | | 8,950 | | | | 334,999 | |
| | | | | | | | |
| | | | | | $ | 4,821,509 | |
| | | | | | | | |
| Energy – Integrated – 6.3% | | | | | | | | |
| BP PLC | | | 371,804 | | | $ | 2,698,697 | |
| Chevron Corp. (s) | | | 17,600 | | | | 1,606,000 | |
| China Petroleum & Chemical Corp. | | | 628,000 | | | | 601,112 | |
8
MFS Global Research Portfolio
Portfolio of Investments – continued
| | | | | | | | |
| Issuer | | Shares/Par | | | Value ($) | |
| | | | | | | | |
| COMMON STOCKS – continued | |
| Energy – Integrated – continued | |
| Exxon Mobil Corp. | | | 37,430 | | | $ | 2,736,882 | |
| Royal Dutch Shell PLC, “A” | | | 75,859 | | | | 2,529,240 | |
| | | | | | | | |
| | | | | | $ | 10,171,931 | |
| | | | | | | | |
| Engineering – Construction – 2.3% | | | | | | | | |
| Fluor Corp. | | | 33,390 | | | $ | 2,212,421 | |
| JGC Corp. | | | 33,000 | | | | 716,481 | |
| Keppel Corp. Ltd. | | | 82,000 | | | | 723,295 | |
| | | | | | | | |
| | | | | | $ | 3,652,197 | |
| | | | | | | | |
| Food & Beverages – 3.6% | | | | | | | | |
| General Mills, Inc. | | | 30,730 | | | $ | 1,093,681 | |
| Nestle S.A. | | | 38,311 | | | | 2,243,345 | |
| PepsiCo, Inc. | | | 38,610 | | | | 2,522,391 | |
| | | | | | | | |
| | | | | | $ | 5,859,417 | |
| | | | | | | | |
| Food & Drug Stores – 1.5% | | | | | | | | |
| Lawson, Inc. | | | 11,200 | | | $ | 553,861 | |
| Tesco PLC | | | 186,358 | | | | 1,234,840 | |
| Walgreen Co. | | | 16,570 | | | | 645,567 | |
| | | | | | | | |
| | | | | | $ | 2,434,268 | |
| | | | | | | | |
| Gaming & Lodging – 0.5% | | | | | | | | |
| Sands China Ltd. (a) | | | 349,200 | | | $ | 767,334 | |
| | | | | | | | |
| General Merchandise – 2.5% | | | | | | | | |
| Kohl’s Corp. (a) | | | 24,570 | | | $ | 1,335,134 | |
| Target Corp. | | | 43,680 | | | | 2,626,478 | |
| | | | | | | | |
| | | | | | $ | 3,961,612 | |
| | | | | | | | |
| Insurance – 3.9% | | | | | | | | |
| ACE Ltd. | | | 8,620 | | | $ | 536,595 | |
| Aflac, Inc. | | | 14,430 | | | | 814,285 | |
| Aon Corp. | | | 15,220 | | | | 700,272 | |
| China Pacific Insurance Co. Ltd. | | | 112,400 | | | | 467,080 | |
| Hiscox Ltd. | | | 164,358 | | | | 977,339 | |
| ING Groep N.V. (a) | | | 114,855 | | | | 1,117,340 | |
| Prudential Financial, Inc. | | | 13,020 | | | | 764,404 | |
| Swiss Reinsurance Co. | | | 15,944 | | | | 857,736 | |
| | | | | | | | |
| | | | | | $ | 6,235,051 | |
| | | | | | | | |
| Internet – 0.8% | | | | | | | | |
| Google, Inc., “A” (a) | | | 2,060 | | | $ | 1,223,578 | |
| | | | | | | | |
| Machinery & Tools – 1.7% | | | | | | | | |
| Beml Ltd. | | | 16,460 | | | $ | 379,981 | |
| Glory Ltd. | | | 19,100 | | | | 470,501 | |
| MAN SE | | | 10,884 | | | | 1,294,296 | |
| Sinotruk Hong Kong Ltd. | | | 556,500 | | | | 573,483 | |
| | | | | | | | |
| | | | | | $ | 2,718,261 | |
| | | | | | | | |
| Major Banks – 9.1% | | | | | | | | |
| Bank of America Corp. | | | 145,430 | | | $ | 1,940,036 | |
| Bank of New York Mellon Corp. | | | 22,156 | | | | 669,111 | |
| Barclays PLC | | | 160,847 | | | | 656,157 | |
| BNP Paribas | | | 25,936 | | | | 1,650,080 | |
| Credit Suisse Group AG | | | 31,650 | | | | 1,275,140 | |
| Erste Group Bank AG | | | 21,502 | | | | 1,009,682 | |
| Goldman Sachs Group, Inc. | | | 5,390 | | | | 906,382 | |
| | | | | | | | |
| Issuer | | Shares/Par | | | Value ($) | |
| | | | | | | | |
| COMMON STOCKS – continued | |
| Major Banks – continued | | | | | | | | |
| HSBC Holdings PLC | | | 196,930 | | | $ | 1,999,095 | |
| JPMorgan Chase & Co. | | | 47,070 | | | | 1,996,709 | |
| KBC Group N.V. (a) | | | 15,311 | | | | 521,732 | |
| Sumitomo Mitsui Financial Group, Inc. | | | 26,900 | | | | 958,182 | |
| SunTrust Banks, Inc. | | | 23,250 | | | | 686,108 | |
| The Toronto-Dominion Bank | | | 5,488 | | | | 409,820 | |
| | | | | | | | |
| | | | | | $ | 14,678,234 | |
| | | | | | | | |
| Medical & Health Technology & Services – 0.8% | | | | | |
| Miraca Holdings, Inc. | | | 17,200 | | | $ | 692,745 | |
| Rhoen-Klinikum AG | | | 29,250 | | | | 643,759 | |
| | | | | | | | |
| | | | | | $ | 1,336,504 | |
| | | | | | | | |
| | | | | | | | |
| Medical Equipment – 2.5% | | | | | | | | |
| Becton, Dickinson & Co. | | | 10,190 | | | $ | 861,259 | |
| Medtronic, Inc. | | | 34,340 | | | | 1,273,671 | |
| St. Jude Medical, Inc. (a) | | | 23,380 | | | | 999,495 | |
| Thermo Fisher Scientific, Inc. (a) | | | 14,850 | | | | 822,096 | |
| | | | | | | | |
| | | | | | $ | 3,956,521 | |
| | | | | | | | |
| Metals & Mining – 4.4% | | | | | | | | |
| BHP Billiton PLC | | | 48,674 | | | $ | 1,935,893 | |
| Iluka Resources Ltd. (a) | | | 135,503 | | | | 1,266,735 | |
| Steel Authority of India Ltd. | | | 98,217 | | | | 400,863 | |
| Teck Resources Ltd., “B” | | | 52,267 | | | | 3,248,092 | |
| Usinas Siderurgicas de Minas Gerais S.A., IPS | | | 26,400 | | | | 304,713 | |
| | | | | | | | |
| | | | | | $ | 7,156,296 | |
| | | | | | | | |
| Natural Gas – Distribution – 0.4% | | | | | | | | |
| Tokyo Gas Co. Ltd. | | | 129,000 | | | $ | 571,992 | |
| | | | | | | | |
| Network & Telecom – 1.3% | | | | | | | | |
| Cisco Systems, Inc. (a) | | | 107,390 | | | $ | 2,172,500 | |
| Nortel Networks Corp. (a) | | | 11,112 | | | | 153 | |
| | | | | | | | |
| | | | | | $ | 2,172,653 | |
| | | | | | | | |
| Oil Services – 2.0% | | | | | | | | |
| Halliburton Co. | | | 46,290 | | | $ | 1,890,021 | |
| Schlumberger Ltd. | | | 15,470 | | | | 1,291,745 | |
| | | | | | | | |
| | | | | | $ | 3,181,766 | |
| | | | | | | | |
| Other Banks & Diversified Financials – 4.6% | | | | | |
| Aeon Credit Service Co. Ltd. | | | 37,800 | | | $ | 534,480 | |
| Banco Santander S.A., IEU | | | 85,800 | | | | 1,165,536 | |
| Bank Rakyat Indonesia | | | 877,500 | | | | 1,022,614 | |
| China Construction Bank (a) | | | 2,092,860 | | | | 1,876,703 | |
| Citigroup, Inc. (a) | | | 114,050 | | | | 539,457 | |
| ICICI Bank Ltd. | | | 37,201 | | | | 952,675 | |
| MasterCard, Inc., “A” | | | 3,540 | | | | 793,349 | |
| Zions Bancorporation | | | 20,390 | | | | 494,050 | |
| | | | | | | | |
| | | | | | $ | 7,378,864 | |
| | | | | | | | |
| Pharmaceuticals – 4.1% | | | | | | | | |
| Abbott Laboratories | | | 26,830 | | | $ | 1,285,425 | |
| Pfizer, Inc. | | | 97,990 | | | | 1,715,805 | |
| Roche Holding AG | | | 10,378 | | | | 1,520,627 | |
| Sanofi-Aventis | | | 20,605 | | | | 1,317,524 | |
| Teva Pharmaceutical Industries Ltd., ADR | | | 15,300 | | | | 797,589 | |
| | | | | | | | |
| | | | | | $ | 6,636,970 | |
| | | | | | | | |
9
MFS Global Research Portfolio
Portfolio of Investments – continued
| | | | | | | | |
| Issuer | | Shares/Par | | | Value ($) | |
| | | | | | | | |
| COMMON STOCKS – continued | |
| Precious Metals & Minerals – 0.6% | | | | | | | | |
| Anglo American Platinum Corp. Ltd. (a) | | | 2,589 | | | $ | 272,805 | |
| Newcrest Mining Ltd. | | | 17,594 | | | | 727,724 | |
| | | | | | | | |
| | | | | | $ | 1,000,529 | |
| | | | | | | | |
| Railroad & Shipping – 0.8% | | | | | | | | |
| Canadian National Railway Co. | | | 11,510 | | | $ | 765,070 | |
| East Japan Railway Co. | | | 9,300 | | | | 604,804 | |
| | | | | | | | |
| | | | | | $ | 1,369,874 | |
| | | | | | | | |
| Restaurants – 0.9% | | | | | | | | |
| McDonald’s Corp. | | | 19,890 | | | $ | 1,526,756 | |
| | | | | | | | |
| Specialty Chemicals – 2.0% | | | | | | | | |
| Airgas, Inc. | | | 10,010 | | | $ | 625,225 | |
| Akzo Nobel N.V. | | | 18,906 | | | | 1,174,401 | |
| Formosa Plastics Corp. | | | 96,000 | | | | 321,026 | |
| Linde AG | | | 7,207 | | | | 1,093,568 | |
| | | | | | | | |
| | | | | | $ | 3,214,220 | |
| | | | | | | | |
| Specialty Stores – 1.5% | | | | | | | | |
| Abercrombie & Fitch Co., “A” | | | 9,300 | | | $ | 535,959 | |
| Best Buy Co., Inc. | | | 14,460 | | | | 495,833 | |
| Esprit Holdings Ltd. | | | 149,322 | | | | 710,801 | |
| Limited Brands, Inc. | | | 10,830 | | | | 332,806 | |
| Staples, Inc. | | | 15,990 | | | | 364,092 | |
| | | | | | | | |
| | | | | | $ | 2,439,491 | |
| | | | | | | | |
| Telecommunications – Wireless – 1.7% | | | | | | | | |
| Cellcom Israel Ltd. | | | 13,440 | | | $ | 439,354 | |
| Vivo Participacoes S.A., ADR | | | 19,210 | | | | 626,054 | |
| Vodafone Group PLC | | | 679,989 | | | | 1,757,762 | |
| | | | | | | | |
| | | | | | $ | 2,823,170 | |
| | | | | | | | |
| Telephone Services – 2.8% | | | | | | | | |
| American Tower Corp., “A” (a) | | | 10,070 | | | $ | 520,015 | |
| AT&T, Inc. | | | 35,930 | | | | 1,055,623 | |
| China Unicom Ltd. | | | 422,000 | | | | 603,726 | |
| Royal KPN N.V. | | | 105,889 | | | | 1,545,174 | |
| Telecom Italia S.p.A. | | | 357,967 | | | | 462,566 | |
| Telecom Italia S.p.A. | | | 357,053 | | | | 387,429 | |
| | | | | | | | |
| | | | | | $ | 4,574,533 | |
| | | | | | | | |
| Tobacco – 0.5% | | | | | | | | |
| Japan Tobacco, Inc. | | | 215 | | | $ | 795,757 | |
| | | | | | | | |
| Trucking – 1.0% | | | | | | | | |
| Expeditors International of Washington, Inc. | | | 15,500 | | | $ | 846,300 | |
| Yamato Holdings Co. Ltd. | | | 49,800 | | | | 709,063 | |
| | | | | | | | |
| | | | | | $ | 1,555,363 | |
| | | | | | | | |
| Utilities – Electric Power – 3.4% | | | | | | | | |
| American Electric Power Co., Inc. | | | 19,440 | | | $ | 699,451 | |
| CEZ AS | | | 17,692 | | | | 739,131 | |
| Energias de Portugal S.A. | | | 281,102 | | | | 935,711 | |
| | | | | | | | |
| Issuer | | Shares/Par | | | Value ($) | |
| COMMON STOCKS – continued | |
| Utilities – Electric Power – continued | | | | | | | | |
| Fortum Corp. | | | 30,884 | | | $ | 929,816 | |
| PG&E Corp. | | | 32,970 | | | | 1,577,285 | |
| Tractebel Energia S.A. | | | 35,170 | | | | 581,576 | |
| | | | | | | | |
| | | | | | $ | 5,462,970 | |
| | | | | | | | |
| | | | | | | | |
Total Common Stocks
(Identified Cost, $139,901,855) | | | | | | $ | 160,741,742 | |
| | | | | | | | |
|
| CONVERTIBLE PREFERRED STOCKS – 0.4% | |
| Other Banks & Diversified Financials – 0.4% | | | | | |
Citigroup, Inc., 7.5%
(Identified Cost, $507,179) | | | 4,000 | | | $ | 546,760 | |
| | | | | | | | |
| | | | | | | | |
|
| MONEY MARKET FUNDS (v) – 0.0% | |
| MFS Institutional Money Market Portfolio, 0.18%, at Cost and Net Asset Value | | | 20 | | | $ | 20 | |
| | | | | | | | |
| |
| COLLATERAL FOR SECURITIES LOANED – 0.3% | | | | | |
| Navigator Securities Lending Prime Portfolio, at Cost and Net Asset Value | | | 485,512 | | | $ | 485,512 | |
| | | | | | | | |
Total Investments (Identified Cost, $140,894,566) | | | | | | $ | 161,774,034 | |
| | | | | | | | |
|
| SECURITIES SOLD SHORT – (0.6)% | |
| Electrical Equipment – (0.3)% | | | | | | | | |
| Emerson Electric Co. | | | (7,500 | ) | | $ | (428,775 | ) |
| | | | | | | | |
| Machinery & Tools – (0.3)% | | | | | | | | |
| Caterpillar, Inc. | | | (5,300 | ) | | $ | (496,398 | ) |
| | | | | | | | |
Total Securities Sold Short (Proceeds Received, $725,318) | | | | | | $ | (925,173 | ) |
| | | | | | | | |
OTHER ASSETS, LESS
LIABILITIES – 0.2% | | | | | | | 343,224 | |
| | | | | | | | |
| Net Assets – 100.0% | | | | | | $ | 161,192,085 | |
| | | | | | | | |
| (a) | Non-income producing security. |
| (l) | All or a portion of this security is on loan. |
| (s) | Security or a portion of the security was pledged to cover collateral requirements for securities sold short. At December 31, 2010, the value of securities pledged amounted to $757,729. |
| (v) | Underlying fund that is available only to investment companies managed by MFS. The rate quoted is the annualized seven-day yield of the fund at period end. |
The following abbreviations are used in this report and are defined:
| ADR | | American Depository Receipt |
| GDR | | Global Depository Receipt |
| IEU | | International Equity Unit |
| IPS | | International Preference Stock |
| PLC | | Public Limited Company |
See Notes to Financial Statements
10
MFS Global Research Portfolio
FINANCIAL STATEMENTS | STATEMENT OF ASSETS AND LIABILITIES
This statement represents your fund’s balance sheet, which details the assets and liabilities comprising the total value of the fund.
| | | | | | | | |
At 12/31/10 | | | | | | | | |
Assets | | | | | | | | |
Investments – | | | | | | | | |
Non-affiliated issuers, at value (identified cost, $140,894,546) | | | $161,774,014 | | | | | |
Underlying funds, at cost and value | | | 20 | | | | | |
Total investments, at value, including $472,408 of securities on loan (identified cost, $140,894,566) | | | $161,774,034 | | | | | |
Foreign currency, at value (identified cost, $97,677) | | | 107,164 | | | | | |
Deposits with brokers for securities sold short | | | 704,041 | | | | | |
Receivables for | | | | | | | | |
Investments sold | | | 814,322 | | | | | |
Fund shares sold | | | 98,268 | | | | | |
Interest and dividends | | | 252,269 | | | | | |
Other assets | | | 5,152 | | | | | |
Total assets | | | | | | | $163,755,250 | |
Liabilities | | | | | | | | |
Payable to custodian | | | $788,179 | | | | | |
Payables for | | | | | | | | |
Securities sold short, at value (proceeds received, $725,318) | | | 925,173 | | | | | |
Fund shares reacquired | | | 248,712 | | | | | |
Collateral for securities loaned, at value | | | 485,512 | | | | | |
Payable to affiliates | | | | | | | | |
Investment adviser | | | 6,624 | | | | | |
Shareholder servicing costs | | | 84 | | | | | |
Distribution and/or service fees | | | 233 | | | | | |
Administrative services fee | | | 322 | | | | | |
Payable for Trustees’ compensation | | | 194 | | | | | |
Accrued expenses and other liabilities | | | 108,132 | | | | | |
Total liabilities | | | | | | | $2,563,165 | |
Net assets | | | | | | | $161,192,085 | |
Net assets consist of | | | | | | | | |
Paid-in capital | | | $192,111,783 | | | | | |
Unrealized appreciation (depreciation) on investments and translation of assets and liabilities
in foreign currencies (net of $19,068 deferred country tax) | | | 20,678,982 | | | | | |
Accumulated net realized gain (loss) on investments and foreign currency transactions | | | (53,331,933 | ) | | | | |
Undistributed net investment income | | | 1,733,253 | | | | | |
Net assets | | | | | | | $161,192,085 | |
Shares of beneficial interest outstanding | | | | | | | 8,386,054 | |
| | | | | | | | | | | | |
| | | Net assets | | | Shares
outstanding | | | Net asset value
per share | |
Initial Class | | | $144,156,139 | | | | 7,494,712 | | | | $19.23 | |
Service Class | | | 17,035,946 | | | | 891,342 | | | | 19.11 | |
See Notes to Financial Statements
11
MFS Global Research Portfolio
FINANCIAL STATEMENTS | STATEMENT OF OPERATIONS
This statement describes how much your fund earned in investment income and accrued in expenses. It also describes any gains and/or losses generated by fund operations.
| | | | | | | | |
| Year ended 12/31/10 | | | | | | | | |
| Net investment income | | | | | | | | |
Income | | | | | | | | |
Dividends | | | $3,563,055 | | | | | |
Interest | | | 25,457 | | | | | |
Dividends from underlying funds | | | 780 | | | | | |
Foreign taxes withheld | | | (223,222 | ) | | | | |
Total investment income | | | | | | | $3,366,070 | |
Expenses | | | | | | | | |
Management fee | | | $1,172,517 | | | | | |
Distribution and/or service fees | | | 42,303 | | | | | |
Shareholder servicing costs | | | 18,074 | | | | | |
Administrative services fee | | | 56,999 | | | | | |
Trustees’ compensation | | | 22,143 | | | | | |
Custodian fee | | | 134,113 | | | | | |
Shareholder communications | | | 16,950 | | | | | |
Auditing fees | | | 55,697 | | | | | |
Legal fees | | | 7,193 | | | | | |
Dividend and interest expense on securities sold short | | | 15,360 | | | | | |
Miscellaneous | | | 24,364 | | | | | |
Total expenses | | | | | | | $1,565,713 | |
Fees paid indirectly | | | (9 | ) | | | | |
Net expenses | | | | | | | $1,565,704 | |
Net investment income | | | | | | | $1,800,366 | |
Realized and unrealized gain (loss) on investments and foreign currency transactions | | | | | | | | |
Realized gain (loss) (identified cost basis) | | | | | | | | |
Investment transactions (net of $15,659 country tax) (s) | | | $11,022,023 | | | | | |
Securities sold short | | | (8,939 | ) | | | | |
Foreign currency transactions | | | (49,911 | ) | | | | |
Net realized gain (loss) on investments and foreign currency transactions | | | | | | | $10,963,173 | |
Change in unrealized appreciation (depreciation) | | | | | | | | |
Investments (net of $10,888 increase in deferred country tax) | | | $5,768,021 | | | | | |
Securities sold short | | | (199,855 | ) | | | | |
Translation of assets and liabilities in foreign currencies | | | 15,021 | | | | | |
Net unrealized gain (loss) on investments and foreign currency translation | | | | | | | $5,583,187 | |
Net realized and unrealized gain (loss) on investments and foreign currency | | | | | | | $16,546,360 | |
Change in net assets from operations | | | | | | | $18,346,726 | |
| (s) | Realized gain (loss) on investment transactions includes proceeds received from a non-recurring cash settlement in the amount of $917,197 from a litigation settlement against Tyco International Ltd. |
See Notes to Financial Statements
12
MFS Global Research Portfolio
FINANCIAL STATEMENTS | STATEMENTS OF CHANGES IN NET ASSETS
These statements describe the increases and/or decreases in net assets resulting from operations, any distributions, and any shareholder transactions.
| | | | | | | | |
For years ended 12/31 | | | 2010 | | | | 2009 | |
Change in net assets | | | | | | | | |
From operations | | | | | | | | |
Net investment income | | | $1,800,366 | | | | $2,104,817 | |
Net realized gain (loss) on investments and foreign currency transactions | | | 10,963,173 | | | | (17,948,787 | ) |
Net unrealized gain (loss) on investments and foreign currency translation | | | 5,583,187 | | | | 58,678,719 | |
Change in net assets from operations | | | $18,346,726 | | | | $42,834,749 | |
Distributions declared to shareholders | | | | | | | | |
From net investment income | | | $(2,115,081 | ) | | | $(2,477,434 | ) |
Change in net assets from fund share transactions | | | $(22,699,043 | ) | | | $(25,568,497 | ) |
Total change in net assets | | | $(6,467,398 | ) | | | $14,788,818 | |
Net assets | | | | | | | | |
At beginning of period | | | 167,659,483 | | | | 152,870,665 | |
At end of period (including undistributed net investment income of $1,733,253
and $2,113,538, respectively) | | | $161,192,085 | | | | $167,659,483 | |
See Notes to Financial Statements
13
MFS Global Research Portfolio
FINANCIAL STATEMENTS | FINANCIAL HIGHLIGHTS
The financial highlights table is intended to help you understand the fund’s financial performance for the past 5 years. Certain information reflects financial results for a single fund share. The total returns in the table represent the rate by which an investor would have earned (or lost) on an investment in the fund share class (assuming reinvestment of all distributions) held for the entire period.
| | | | | | | | | | | | | | | | | | | | |
| Initial Class | | Years ended 12/31 | |
| | | 2010 | | | 2009 | | | 2008 | | | 2007 | | | 2006 | |
Net asset value, beginning of period | | | $17.29 | | | | $13.30 | | | | $21.04 | | | | $18.73 | | | | $17.04 | |
| Income (loss) from investment operations | | | | | | | | | | | | | | | | | | | | |
Net investment income (d) | | | $0.20 | | | | $0.20 | | | | $0.19 | | | | $0.10 | | | | $0.13 | |
Net realized and unrealized gain (loss) on investments
and foreign currency | | | 1.97 | | | | 4.03 | | | | (7.81 | ) | | | 2.37 | | | | 1.67 | |
Total from investment operations | | | $2.17 | | | | $4.23 | | | | $(7.62 | ) | | | $2.47 | | | | $1.80 | |
| Less distributions declared to shareholders | | | | | | | | | | | | | | | | | | | | |
From net investment income | | | $(0.23 | ) | | | $(0.24 | ) | | | $(0.12 | ) | | | $(0.16 | ) | | | $(0.11 | ) |
Net asset value, end of period | | | $19.23 | | | | $17.29 | | | | $13.30 | | | | $21.04 | | | | $18.73 | |
Total return (%) (k)(s) | | | 12.66 | | | | 32.44 | | | | (36.43 | ) | | | 13.24 | | | | 10.62 | |
Ratios (%) (to average net assets)
and Supplemental data: | | | | | | | | | | | | | | | | | | | | |
Expenses (f) | | | 0.97 | | | | 0.98 | | | | 0.87 | | | | 0.83 | | | | 0.82 | |
Net investment income | | | 1.18 | | | | 1.42 | | | | 1.06 | | | | 0.48 | | | | 0.76 | |
Portfolio turnover | | | 59 | | | | 63 | | | | 144 | | | | 84 | | | | 87 | |
Net assets at end of period (000 omitted) | | | $144,156 | | | | $149,758 | | | | $134,672 | | | | $268,217 | | | | $309,757 | |
| Supplemental Ratios (%): | | | | | | | | | | | | | | | | | | | | |
Ratio of expenses to average net assets excluding
short sale dividend and interest expense (f) | | | 0.96 | | | | 0.98 | | | | N/A | | | | N/A | | | | N/A | |
See Notes to Financial Statements
14
MFS Global Research Portfolio
Financial Highlights – continued
| | | | | | | | | | | | | | | | | | | | |
| Service Class | | Years ended 12/31 | |
| | | 2010 | | | 2009 | | | 2008 | | | 2007 | | | 2006 | |
Net asset value, beginning of period | | | $17.18 | | | | $13.21 | | | | $20.89 | | | | $18.60 | | | | $16.93 | |
| Income (loss) from investment operations | | | | | | | | | | | | | | | | | | | | |
Net investment income (d) | | | $0.16 | | | | $0.17 | | | | $0.14 | | | | $0.05 | | | | $0.09 | |
Net realized and unrealized gain (loss) on investments
and foreign currency | | | 1.96 | | | | 3.99 | | | | (7.76 | ) | | | 2.36 | | | | 1.65 | |
Total from investment operations | | | $2.12 | | | | $4.16 | | | | $(7.62 | ) | | | $2.41 | | | | $1.74 | |
| Less distributions declared to shareholders | | | | | | | | | | | | | | | | | | | | |
From net investment income | | | $(0.19 | ) | | | $(0.19 | ) | | | $(0.06 | ) | | | $(0.12 | ) | | | $(0.07 | ) |
Net asset value, end of period | | | $19.11 | | | | $17.18 | | | | $13.21 | | | | $20.89 | | | | $18.60 | |
Total return (%) (k)(s) | | | 12.42 | | | | 32.03 | | | | (36.57 | ) | | | 12.97 | | | | 10.32 | |
Ratios (%) (to average net assets)
and Supplemental data: | | | | | | | | | | | | | | | | | | | | |
Expenses (f) | | | 1.22 | | | | 1.23 | | | | 1.12 | | | | 1.08 | | | | 1.07 | |
Net investment income | | | 0.93 | | | | 1.21 | | | | 0.81 | | | | 0.23 | | | | 0.54 | |
Portfolio turnover | | | 59 | | | | 63 | | | | 144 | | | | 84 | | | | 87 | |
Net assets at end of period (000 omitted) | | | $17,036 | | | | $17,901 | | | | $18,199 | | | | $28,832 | | | | $29,316 | |
| Supplemental Ratios (%): | | | | | | | | | | | | | | | | | | | | |
Ratio of expenses to average net assets excluding
short sale dividend and interest expense (f) | | | 1.21 | | | | 1.23 | | | | N/A | | | | N/A | | | | N/A | |
| (d) | Per share data is based on average shares outstanding. |
| (f) | Ratios do not reflect reductions from fees paid indirectly, if applicable. |
| (k) | The total return does not reflect expenses that apply to separate accounts. Inclusion of these charges would reduce the total return figures for all periods shown. |
| (s) | From time to time the fund may receive proceeds from litigation settlements, without which performance would be lower. Excluding the effect of the proceeds received from a non-recurring litigation settlement against Enron Corp., the Initial Class and Service Class total returns for the year ended December 31, 2008 would have each been lower by approximately 0.86%. Excluding the effect of the proceeds received from a non-recurring litigation settlement against Tyco International Ltd., the Initial Class and Service Class total returns for the year ended December 31, 2010 would have been lower by approximately 0.71% and 0.70%, respectively. |
See Notes to Financial Statements
15
MFS Global Research Portfolio
NOTES TO FINANCIAL STATEMENTS
| (1) | | Business and Organization |
MFS Global Research Portfolio (the fund) is a series of MFS Variable Insurance Trust II (the trust). The trust is organized as a Massachusetts business trust and is registered under the Investment Company Act of 1940, as amended, as an open-end management investment company. The shareholders of each series of the trust are separate accounts of insurance companies, which offer variable annuity and/or life insurance products, and qualified retirement and pension plans.
| (2) | | Significant Accounting Policies |
General – The preparation of financial statements in conformity with U.S. generally accepted accounting principles requires management to make estimates and assumptions that affect the reported amounts of assets and liabilities, and disclosure of contingent assets and liabilities at the date of the financial statements and the reported amounts of revenues and expenses during the reporting period. Actual results could differ from those estimates. In the preparation of these financial statements, management has evaluated subsequent events occurring after the date of the fund’s Statement of Assets and Liabilities through the date that the financial statements were issued. The fund invests in foreign securities, including securities of emerging market issuers. Investments in foreign securities are vulnerable to the effects of changes in the relative values of the local currency and the U.S. dollar and to the effects of changes in each country’s legal, political, and economic environment. The markets of emerging markets countries are generally more volatile than the markets of developed countries with more mature economies. All of the risks of investing in foreign securities previously described are heightened when investing in emerging markets countries.
Investment Valuations – Equity securities, including restricted equity securities, are generally valued at the last sale or official closing price as provided by a third-party pricing service on the market or exchange on which they are primarily traded. Equity securities, for which there were no sales reported that day, are generally valued at the last quoted daily bid quotation as provided by a third-party pricing service on the market or exchange on which such securities are primarily traded. Equity securities held short, for which there were no sales reported for that day, are generally valued at the last quoted daily ask quotation as provided by a third-party pricing service on the market or exchange on which such securities are primarily traded. Short-term instruments with a maturity at issuance of 60 days or less generally are valued at amortized cost, which approximates market value. Exchange-traded options are generally valued at the last sale or official closing price as provided by a third-party pricing service on the exchange on which such options are primarily traded. Exchange-traded options for which there were no sales reported that day are generally valued at the last daily bid quotation as provided by a third-party pricing service on the exchange on which such options are primarily traded. Options not traded on an exchange are generally valued at a broker/dealer bid quotation. Foreign currency options are generally valued at valuations provided by a third-party pricing service. Open-end investment companies are generally valued at net asset value per share. Securities and other assets generally valued on the basis of information from a third-party pricing service may also be valued at a broker/dealer bid quotation. Values obtained from third-party pricing services can utilize both transaction data and market information such as yield, quality, coupon rate, maturity, type of issue, trading characteristics, and other market data. The values of foreign securities and other assets and liabilities expressed in foreign currencies are converted to U.S. dollars using the mean of bid and asked prices for rates provided by a third-party pricing service.
The Board of Trustees has delegated primary responsibility for determining or causing to be determined the value of the fund’s investments (including any fair valuation) to the adviser pursuant to valuation policies and procedures approved by the Board. If the adviser determines that reliable market quotations are not readily available, investments are valued at fair value as determined in good faith by the adviser in accordance with such procedures under the oversight of the Board of Trustees. Under the fund’s valuation policies and procedures, market quotations are not considered to be readily available for most types of debt instruments and floating rate loans and many types of derivatives. These investments are generally valued at fair value based on information from third-party pricing services. In addition, investments may be valued at fair value if the adviser determines that an investment’s value has been materially effected by events occurring after the close of the exchange or market on which the investment is principally traded (such as foreign exchange or market) and prior to the determination of the fund’s net asset value, or after the halting of trading of a specific security where trading does not resume prior to the close of the exchange or market on which the security is principally traded. Events that occur on a frequent basis after foreign markets close (such as developments in foreign markets and significant movements in the U.S. markets) and prior to the determination of the fund’s net asset value may be deemed to have a material effect on the value of securities traded in foreign markets. Accordingly, the fund’s foreign equity securities may often be valued at fair value. The adviser generally relies on third-party pricing services or other information (such as the correlation with price movements of similar securities in the same or other markets; the type, cost and investment characteristics of the security; the business and financial condition of the issuer; and trading and other market data) to assist in determining whether to fair value and at what value to fair value an investment. The value of an investment for purposes of calculating the fund’s net asset value can differ depending on the
16
MFS Global Research Portfolio
Notes to Financial Statements – continued
source and method used to determine value. When fair valuation is used, the value of an investment used to determine the fund’s net asset value may differ from quoted or published prices for the same investment. There can be no assurance that the fund could obtain the fair value assigned to an investment if it were to sell the investment at the same time at which the fund determines its net asset value per share.
Various inputs are used in determining the value of the fund’s assets or liabilities. These inputs are categorized into three broad levels. In certain cases, the inputs used to measure fair value may fall into different levels of the fair value hierarchy. In such cases, an investment’s level within the fair value hierarchy is based on the lowest level of input that is significant to the fair value measurement. The fund’s assessment of the significance of a particular input to the fair value measurement in its entirety requires judgment, and considers factors specific to the investment. Level 1 includes unadjusted quoted prices in active markets for identical assets or liabilities. Level 2 includes other significant observable market-based inputs (including quoted prices for similar securities, interest rates, prepayment speed, and credit risk). Level 3 includes unobservable inputs, which may include the adviser’s own assumptions in determining the fair value of investments. The following is a summary of the levels used as of December 31, 2010 in valuing the fund’s assets or liabilities:
| | | | | | | | | | | | | | | | |
| Investments at Value | | Level 1 | | | Level 2 | | | Level 3 | | | Total | |
| Equity Securities: | | | | | | | | | | | | | | | | |
United States | | | $81,223,932 | | | | $— | | | | $— | | | | $81,223,932 | |
United Kingdom | | | 15,946,177 | | | | — | | | | — | | | | 15,946,177 | |
Japan | | | 8,237,922 | | | | 716,481 | | | | — | | | | 8,954,403 | |
Germany | | | 6,642,537 | | | | — | | | | — | | | | 6,642,537 | |
Switzerland | | | 5,896,847 | | | | — | | | | — | | | | 5,896,847 | |
France | | | 5,433,433 | | | | — | | | | — | | | | 5,433,433 | |
Canada | | | 5,000,851 | | | | — | | | | — | | | | 5,000,851 | |
Netherlands | | | 4,801,950 | | | | — | | | | — | | | | 4,801,950 | |
China | | | 4,562,909 | | | | — | | | | — | | | | 4,562,909 | |
Other Countries | | | 22,499,175 | | | | 326,288 | | | | — | | | | 22,825,463 | |
| Mutual Funds | | | 485,532 | | | | — | | | | — | | | | 485,532 | |
| Total Investments | | | $160,731,265 | | | | $1,042,769 | | | | $— | | | | $161,774,034 | |
| | | | |
| Short Sales | | | $(925,173 | ) | | | $— | | | | $— | | | | $(925,173 | ) |
For further information regarding security characteristics, see the Portfolio of Investments.
Of the level 1 investments presented above, equity investments amounting to $33,383,334 were considered level 2 investments at the beginning of the period. The primary reason for changes in the classifications between levels 1 and 2 occurs when foreign equity securities are fair valued using other observable market-based inputs in place of the closing exchange price due to events occurring after the close of the exchange or market on which the investment is principally traded. The fund’s foreign equity securities may often be valued at fair value.
Foreign Currency Translation – Purchases and sales of foreign investments, income, and expenses are converted into U.S. dollars based upon currency exchange rates prevailing on the respective dates of such transactions or on the reporting date for foreign denominated receivables and payables. Gains and losses attributable to foreign currency exchange rates on sales of securities are recorded for financial statement purposes as net realized gains and losses on investments. Gains and losses attributable to foreign exchange rate movements on receivables, payables, income and expenses are recorded for financial statement purposes as foreign currency transaction gains and losses. That portion of both realized and unrealized gains and losses on investments that results from fluctuations in foreign currency exchange rates is not separately disclosed.
Derivatives – The fund uses derivatives for different purposes, including to earn income and enhance returns, to increase or decrease exposure to a particular market, to manage or adjust the risk profile of the fund, or as alternatives to direct investments. Derivatives are used for hedging or non-hedging purposes. While hedging can reduce or eliminate losses, it can also reduce or eliminate gains. When the fund uses derivatives as an investment to increase market exposure, or for hedging purposes, gains and losses from derivative instruments may be substantially greater than the derivative’s original cost.
Derivative instruments used by the fund during the period include purchased options. At December 31, 2010, the fund did not have any outstanding derivative instruments.
17
MFS Global Research Portfolio
Notes to Financial Statements – continued
The following table presents, by major type of derivative contract, the realized gain (loss) on derivatives held by the fund for the year ended December 31, 2010 as reported in the Statement of Operations:
| | | | |
| Risk | | Investment
Transactions
(Purchased Options) | |
| Equity Contracts | | | $(251,005 | ) |
There is no unrealized gain (loss) from derivative transactions at period end.
Derivative counterparty credit risk is managed through formal evaluation of the creditworthiness of all potential counterparties. On certain over-the-counter derivatives, the fund attempts to reduce its exposure to counterparty credit risk whenever possible by entering into an International Swaps and Derivatives Association (ISDA) Master Agreement on a bilateral basis with each of the counterparties with whom it undertakes a significant volume of transactions. The ISDA Master Agreement gives each party to the agreement the right to terminate all transactions traded under such agreement if there is a certain deterioration in the credit quality of the other party. The ISDA Master Agreement gives the fund the right, upon an event of default by the applicable counterparty or a termination of the agreement, to close out all transactions traded under such agreement and to net amounts owed under each transaction to one net amount payable by one party to the other. This right to close out and net payments across all transactions traded under the ISDA Master Agreement could result in a reduction of the fund’s credit risk to such counterparty equal to any amounts payable by the fund under the applicable transactions, if any. However, absent an event of default by the counterparty or a termination of the agreement, the ISDA Master Agreement does not result in an offset of reported amounts of assets and liabilities in the Statement of Assets and Liabilities across transactions between the fund and the applicable counterparty.
Collateral requirements differ by type of derivative. Collateral or margin requirements are set by the broker or exchange clearing house for exchange traded derivatives (i.e., futures and exchange-traded options) while collateral terms are contract specific for over-the-counter traded derivatives (i.e., forwards, swaps and over-the-counter options). For derivatives traded under an ISDA Master Agreement, the collateral requirements are netted across all transactions traded under such agreement and one amount is posted from one party to the other to collateralize such obligations. Cash collateral that has been pledged to cover obligations of the fund under derivative contracts, if any, will be reported separately on the Statement of Assets and Liabilities as restricted cash. Securities collateral pledged for the same purpose, if any, is noted in the Portfolio of Investments.
Purchased Options – The fund purchased call options for a premium. Purchased call options entitle the holder to buy a specified number of shares or units of a particular security, currency or index at a specified price at a specified date or within a specified period of time. Purchasing call options may be used to hedge against an anticipated increase in the dollar cost of securities or currency to be acquired or to increase the fund’s exposure to an underlying instrument.
The premium paid is initially recorded as an investment in the Statement of Assets and Liabilities. That investment is subsequently marked-to-market daily with the difference between the premium paid and the market value of the purchased option being recorded as unrealized appreciation or depreciation. Premiums paid for purchased call options which have expired are treated as realized losses on investments in the Statement of Operations. Upon the exercise or closing of a purchased call option, the premium paid is added to the cost of the security or financial instrument.
The risk in purchasing an option is that the fund pays a premium whether or not the option is exercised. The fund’s maximum risk of loss due to counterparty credit risk is limited to the market value of the option. For over-the-counter options, this risk is mitigated in cases where there is an ISDA Master Agreement between the fund and the counterparty providing for netting as described above and for posting of collateral by the counterparty to the fund to cover the fund’s exposure to the counterparty under such ISDA Master Agreement.
Short Sales – The fund entered into short sales whereby it sells a security it does not own in anticipation of a decline in the value of that security. The fund will realize a gain if the security price decreases and a loss if the security price increases between the date of the short sale and the date on which the fund replaces the borrowed security. Losses from short sales can exceed the proceeds of the security sold; and they can also exceed the potential loss from an ordinary buy and sell transaction. The amount of any premium, dividends, or interest the fund may be required to pay in connection with a short sale will be recognized as a fund expense. During the year ended December 31, 2010, this expense amounted to $15,360. The fund segregates cash or marketable securities in an amount that, when combined with the amount of proceeds from the short sale deposited with the broker, at least equals the current market value of the security sold short.
Security Loans – State Street Bank and Trust Company (“State Street”), as lending agent, loans the securities of the fund to certain qualified institutions (the “Borrowers”) approved by the fund. The loans are collateralized by cash and/or U.S. Treasury and federal agency obligations in an amount typically at least equal to the market value of the securities loaned. The market
18
MFS Global Research Portfolio
Notes to Financial Statements – continued
value of the loaned securities is determined at the close of business of the fund and any additional required collateral is delivered to the fund on the next business day. State Street provides the fund with indemnification against Borrower default. The fund bears the risk of loss with respect to the investment of cash collateral. On loans collateralized by cash, the cash collateral is invested in a money market fund or short-term securities. A portion of the income generated upon investment of the collateral is remitted to the Borrowers, and the remainder is allocated between the fund and the lending agent. On loans collateralized by U.S. Treasury and/or federal agency obligations, a fee is received from the Borrower, and is allocated between the fund and the lending agent. Income from securities lending is included in interest income on the Statement of Operations. The dividend and interest income earned on the securities loaned is accounted for in the same manner as other dividend and interest income.
Indemnifications – Under the fund’s organizational documents, its officers and Trustees may be indemnified against certain liabilities and expenses arising out of the performance of their duties to the fund. Additionally, in the normal course of business, the fund enters into agreements with service providers that may contain indemnification clauses. The fund’s maximum exposure under these agreements is unknown as this would involve future claims that may be made against the fund that have not yet occurred.
Investment Transactions and Income – Investment transactions are recorded on the trade date. Interest income is recorded on the accrual basis. Dividends received in cash are recorded on the ex-dividend date. Certain dividends from foreign securities will be recorded when the fund is informed of the dividend if such information is obtained subsequent to the ex-dividend date. Dividend and interest payments received in additional securities are recorded on the ex-dividend or ex-interest date in an amount equal to the value of the security on such date.
The fund may receive proceeds from litigation settlements. Any proceeds received from litigation involving portfolio holdings are reflected in the Statement of Operations in realized gain/loss if the security has been disposed of by the fund or in unrealized gain/loss if the security is still held by the fund. Any other proceeds from litigation not related to portfolio holdings are reflected as other income in the Statement of Operations. On September 6, 2010, the fund received $917,197 from a non-recurring litigation settlement against Tyco International Ltd.
Fees Paid Indirectly – The fund’s custody fee may be reduced according to an arrangement that measures the value of cash deposited with the custodian by the fund. This amount, for the year ended December 31, 2010, is shown as a reduction of total expenses on the Statement of Operations.
Tax Matters and Distributions – The fund intends to qualify as a regulated investment company, as defined under Subchapter M of the Internal Revenue Code, and to distribute all of its taxable income, including realized capital gains. As a result, no provision for federal income tax is required. The fund’s federal tax returns for the prior three fiscal years remain subject to examination by the Internal Revenue Service. Foreign taxes, if any, have been accrued by the fund in the accompanying financial statements.
Distributions to shareholders are recorded on the ex-dividend date. Income and capital gain distributions are determined in accordance with income tax regulations, which may differ from U.S. generally accepted accounting principles. Certain capital accounts in the financial statements are periodically adjusted for permanent differences in order to reflect their tax character. These adjustments have no impact on net assets or net asset value per share. Temporary differences which arise from recognizing certain items of income, expense, gain or loss in different periods for financial statement and tax purposes will reverse at some time in the future. Distributions in excess of net investment income or net realized gains are temporary overdistributions for financial statement purposes resulting from differences in the recognition or classification of income or distributions for financial statement and tax purposes.
Book/tax differences primarily relate to the expiration of capital loss carryforwards and wash sale loss deferrals.
The tax character of distributions declared to shareholders for the last two fiscal years is as follows:
| | | | | | | | |
| | | 12/31/10 | | | 12/31/09 | |
| Ordinary income (including any short-term capital gains) | | | $2,115,081 | | | | $2,477,434 | |
19
MFS Global Research Portfolio
Notes to Financial Statements – continued
The federal tax cost and the tax basis components of distributable earnings were as follows:
| | | | |
| As of 12/31/10 | | | | |
| Cost of investments | | | $141,239,018 | |
| Gross appreciation | | | 25,851,805 | |
| Gross depreciation | | | (5,316,789 | ) |
| Net unrealized appreciation (depreciation) | | | $20,535,016 | |
| Undistributed ordinary income | | | 1,733,253 | |
| Capital loss carryforwards | | | (52,987,481 | ) |
| Other temporary differences | | | (200,486 | ) |
As of December 31, 2010, the fund had capital loss carryforwards available to offset future realized gains. Such losses expire as follows:
| | | | |
| 12/31/16 | | | $(34,265,726 | ) |
| 12/31/17 | | | (18,721,755 | ) |
| Total | | | $(52,987,481 | ) |
Multiple Classes of Shares of Beneficial Interest – The fund offers multiple classes of shares, which differ in their respective distribution and/or service fees. The fund’s income, realized and unrealized gain (loss), and common expenses are allocated to shareholders based on the daily net assets of each class. Dividends are declared separately for each class. Differences in per share dividend rates are generally due to differences in separate class expenses. The fund’s distributions declared to shareholders as reported on the Statements of Changes in Net Assets are presented by class as follows:
| | | | | | | | |
| | | From net investment
income | |
| | | Year ended
12/31/10 | | | Year ended
12/31/09 | |
| Initial Class | | | $1,921,573 | | | | $2,227,418 | |
| Service Class | | | 193,508 | | | | 250,016 | |
| Total | | | $2,115,081 | | | | $2,477,434 | |
| (3) | | Transactions with Affiliates |
Investment Adviser – The fund has an investment advisory agreement with MFS to provide overall investment management and related administrative services and facilities to the fund. The management fee is computed daily and paid monthly at the following annual rates:
| | | | |
| First $300 million of average daily net assets | | | 0.75% | |
| Average daily net assets in excess of $300 million | | | 0.675% | |
The management fee incurred for the year ended December 31, 2010 was equivalent to an annual effective rate of 0.75% of the fund’s average daily net assets.
Distributor – MFS Fund Distributors, Inc. (MFD), a wholly-owned subsidiary of MFS, is the distributor of shares of the fund. The Trustees have adopted a distribution plan for the Service Class shares pursuant to Rule 12b-1 under the Investment Company Act of 1940.
The fund’s distribution plan provides that the fund will pay MFD distribution and/or service fees equal to 0.25% per annum of its average daily net assets attributable to Service Class shares as partial consideration for services performed and expenses incurred by MFD and financial intermediaries (including participating insurance companies that invest in the fund to fund variable annuity and variable life insurance contracts, sponsors of qualified retirement and pension plans that invest in the fund, and affiliates of these participating insurance companies and plan sponsors) in connection with the sale and distribution of the Service Class shares. MFD may subsequently pay all, or a portion, of the distribution and/or service fees to financial intermediaries.
Shareholder Servicing Agent – MFS Service Center, Inc. (MFSC), a wholly-owned subsidiary of MFS, receives a fee from the fund for its services as shareholder servicing agent. For the year ended December 31, 2010, the fee was $18,061, which equated to 0.0116% annually of the fund’s average daily net assets. MFSC also receives payment from the fund for out-of-pocket expenses paid by MFSC on behalf of the fund. For the year ended December 31, 2010, these costs amounted to $13.
Administrator – MFS provides certain financial, legal, shareholder communications, compliance, and other administrative services to the fund. Under an administrative services agreement, the fund partially reimburses MFS the costs incurred to provide these services. The fund is charged an annual fixed amount of $10,000 plus a fee based on average daily net assets. The administrative services fee incurred for the year ended December 31, 2010 was equivalent to an annual effective rate of 0.0365% of the fund’s average daily net assets.
20
MFS Global Research Portfolio
Notes to Financial Statements – continued
Trustees’ and Officers’ Compensation – The fund pays compensation to Trustees in the form of a retainer, attendance fees, and additional compensation to the Board chairperson. The fund does not pay compensation directly to officers of the fund who are also officers of the investment adviser, all of whom receive remuneration for their services to the fund from MFS. Certain officers of the fund are officers or directors of MFS, MFD, and MFSC.
Other – This fund and certain other funds managed by MFS (the funds) have entered into services agreements (the Agreements) which provide for payment of fees by the funds to Tarantino LLC and Griffin Compliance LLC in return for the provision of services of an Independent Chief Compliance Officer (ICCO) and Assistant ICCO, respectively, for the funds. The ICCO and Assistant ICCO are officers of the funds and the sole members of Tarantino LLC and Griffin Compliance LLC, respectively. The funds can terminate the Agreements with Tarantino LLC and Griffin Compliance LLC at any time under the terms of the Agreements. MFS has agreed to bear all expenses associated with office space, other administrative support, and supplies provided to the ICCO and Assistant ICCO. For the year ended December 31, 2010, the aggregate fees paid by the fund to Tarantino LLC and Griffin Compliance LLC were $2,655 and are included in miscellaneous expense on the Statement of Operations.
The fund invests in the MFS Institutional Money Market Portfolio which is managed by MFS and seeks a high level of current income consistent with preservation of capital and liquidity. Income earned on this investment is included in dividends from underlying funds on the Statement of Operations. This money market fund does not pay a management fee to MFS.
Purchases and sales of investments, other than U.S. Government securities, purchased option transactions, short sales, and short-term obligations, aggregated $91,250,538 and $112,201,550, respectively.
| (5) | | Shares of Beneficial Interest |
The fund’s Declaration of Trust permits the Trustees to issue an unlimited number of full and fractional shares of beneficial interest. Transactions in fund shares were as follows:
| | | | | | | | | | | | | | | | |
| | | Year ended 12/31/10 | | | Year ended 12/31/09 | |
| | | Shares | | | Amount | | | Shares | | | Amount | |
| Shares sold | | | | | | | | | | | | | | | | |
Initial Class | | | 17,219 | | | | $315,125 | | | | 18,709 | | | | $238,415 | |
Service Class | | | 76,615 | | | | 1,283,428 | | | | 150,965 | | | | 1,652,653 | |
| | | 93,834 | | | | $1,598,553 | | | | 169,674 | | | | $1,891,068 | |
| Shares issued to shareholders in reinvestment of distributions | | | | | | | | | | | | | | | | |
Initial Class | | | 107,231 | | | | $1,921,573 | | | | 177,767 | | | | $2,227,418 | |
Service Class | | | 10,847 | | | | 193,508 | | | | 20,049 | | | | 250,016 | |
| | | 118,078 | | | | $2,115,081 | | | | 197,816 | | | | $2,477,434 | |
| Shares reacquired | | | | | | | | | | | | | | | | |
Initial Class | | | (1,293,440 | ) | | | $(22,290,770 | ) | | | (1,657,341 | ) | | | $(22,985,827 | ) |
Service Class | | | (238,078 | ) | | | (4,121,907 | ) | | | (507,104 | ) | | | (6,951,172 | ) |
| | | (1,531,518 | ) | | | $(26,412,677 | ) | | | (2,164,445 | ) | | | $(29,936,999 | ) |
| Net change | | | | | | | | | | | | | | | | |
Initial Class | | | (1,168,990 | ) | | | $(20,054,072 | ) | | | (1,460,865 | ) | | | $(20,519,994 | ) |
Service Class | | | (150,616 | ) | | | (2,644,971 | ) | | | (336,090 | ) | | | (5,048,503 | ) |
| | | (1,319,606 | ) | | | $(22,699,043 | ) | | | (1,796,955 | ) | | | $(25,568,497 | ) |
The fund and certain other funds managed by MFS participate in a $1.1 billion unsecured committed line of credit, subject to a $1 billion sublimit, provided by a syndication of banks under a credit agreement. Borrowings may be made for temporary financing needs. Interest is charged to each fund, based on its borrowings, generally at a rate equal to the higher of the Federal Reserve funds rate or one month LIBOR plus an agreed upon spread. A commitment fee, based on the average daily, unused portion of the committed line of credit, is allocated among the participating funds at the end of each calendar quarter. In addition, the fund and other funds managed by MFS have established unsecured uncommitted borrowing arrangements with certain banks for temporary financing needs. Interest is charged to each fund, based on its borrowings, at a rate equal to the Federal Reserve funds rate plus an agreed upon spread. For the year ended December 31, 2010, the fund’s commitment fee and interest expense were $1,755 and $0, respectively, and are included in miscellaneous expense on the Statement of Operations.
21
MFS Global Research Portfolio
Notes to Financial Statements – continued
| (7) | | Transactions in Underlying Funds – Affiliated Issuers |
An affiliated issuer may be considered one in which the fund owns 5% or more of the outstanding voting securities, or a company which is under common control. For the purposes of this report, the fund assumes the following to be affiliated issuers:
| | | | | | | | | | | | | | | | |
| Underlying Funds | | Beginning
Shares/Par
Amount | | | Acquisitions
Shares/Par
Amount | | | Dispositions
Shares/Par
Amount | | | Ending
Shares/Par
Amount | |
| MFS Institutional Money Market Portfolio | | | 100 | | | | 22,080,192 | | | | (22,080,272 | ) | | | 20 | |
| | | | |
| Underlying Funds | | Realized
Gain (Loss) | | | Capital Gain
Distributions | | | Dividend
Income | | | Ending
Value | |
| MFS Institutional Money Market Portfolio | | | $— | | | | $— | | | | $780 | | | | $20 | |
22
MFS Global Research Portfolio
REPORT OF INDEPENDENT REGISTERED PUBLIC ACCOUNTING FIRM
To the Board of Trustees of MFS Variable Insurance Trust II and the Shareholders of
MFS Global Research Portfolio:
We have audited the accompanying statement of assets and liabilities, including the portfolio of investments, of MFS Global Research Portfolio (the “Fund”) (one of the portfolios comprising MFS Variable Insurance Trust II) as of December 31, 2010, and the related statement of operations for the year then ended, the statements of changes in net assets for each of the two years in the period then ended, and the financial highlights for each of the five years in the period then ended. These financial statements and financial highlights are the responsibility of the Fund’s management. Our responsibility is to express an opinion on these financial statements and financial highlights based on our audits.
We conducted our audits in accordance with the standards of the Public Company Accounting Oversight Board (United States). Those standards require that we plan and perform the audit to obtain reasonable assurance about whether the financial statements and financial highlights are free of material misstatement. The Fund is not required to have, nor were we engaged to perform, an audit of its internal control over financial reporting. Our audits included consideration of internal control over financial reporting as a basis for designing audit procedures that are appropriate in the circumstances, but not for the purpose of expressing an opinion on the effectiveness of the Fund’s internal control over financial reporting. Accordingly, we express no such opinion. An audit also includes examining, on a test basis, evidence supporting the amounts and disclosures in the financial statements, assessing the accounting principles used and significant estimates made by management, as well as evaluating the overall financial statement presentation. Our procedures included confirmation of securities owned as of December 31, 2010, by correspondence with the custodian and brokers; where replies were not received from brokers, we performed other auditing procedures. We believe that our audits provide a reasonable basis for our opinion.
In our opinion, the financial statements and financial highlights referred to above present fairly, in all material respects, the financial position of MFS Global Research Portfolio as of December 31, 2010, the results of its operations for the year then ended, the changes in its net assets for each of the two years in the period then ended, and the financial highlights for each of the five years in the period then ended, in conformity with accounting principles generally accepted in the United States of America.
DELOITTE & TOUCHE LLP
Boston, Massachusetts
February 14, 2011
23
MFS Global Research Portfolio
TRUSTEES AND OFFICERS – IDENTIFICATION AND BACKGROUND
The Trustees and officers of the Trust, as of February 1, 2011, are listed below, together with their principal occupations during the past five years. (Their titles may have varied during that period.) The address of each Trustee and officer is 500 Boylston Street, Boston, Massachusetts 02116.
| | | | | | |
Name, Date of Birth | | Position(s) Held
with Fund | | Trustee/Officer
Since (1) | | Principal Occupations During the Past Five Years and
Other Directorships (2) |
| INTERESTED TRUSTEE | | | | |
David D. Horn (3) (born 6/07/41) | | Trustee | | April 1986 | | Private investor; Sun Life Assurance Company of Canada, Senior Vice President and General Manager for the United States (until 1997); Director (until March 2004) |
| | |
| INDEPENDENT TRUSTEES | | | | |
J. Kermit Birchfield (born 1/08/40) | | Chairman | | May 1997 | | Consultant; Century Partners, Inc. (investments), Director; Displaytech, Inc. (technology), Chairman; Dessin Fournir LLC (furniture manufacturer), Director; Site Watch LLC (software to monitor oil tanks), Managing Director (2006 to present); Juridica Investments (fund investing in judicial matters), Director (2007 to present), Immuno Science, Inc. (medical research), Independent Director (2009 to present), Intermountain Industries, Inc. (oil & gas exploration and production), Director (until February 2009) |
| | | |
Robert C. Bishop (born 1/13/43) | | Trustee | | May 2001 | | AutoImmune, Inc. (pharmaceutical product development), Chairman, President and Chief Executive Officer; Caliper Life Sciences Corp. (laboratory analytical instruments), Chairman; Optobionics Corporation (ophthalmic devices), Director (until 2007); Millipore Corporation (purification/filtration products), Director (until July 2010); Waterstreet Capital (leverage buyouts), Advisory Board (until August 2010) |
| | | |
Frederick H. Dulles (born 3/12/42) | | Trustee | | May 2001 | | Dulles International Law LLC (law firm), Senior Lawyer (since 2009); Juridica Capital Management (US) Inc. (litigation financing), Vice President and General Counsel (since 2009); Dulles Properties LLC (real estate), Broker (since 2008); The Citadel School of Business Administration (education), Adjunct Professor (since 2003); Disher, Hamrick & Myers Residential, Inc. (real estate), Broker (until 2006); Frederick H. Dulles Law Practice (law firm), (until 2006); Charlestown School of Law (education), Adjunct Professor (until 2007); Prudential Carolina Real Estate, (real estate), Broker (until 2008); Free Enterprise Foundation Inc. (research institute), Director & Secretary (until 2008); Ten State International Law PLLP (law firm), Of Counsel (until 2009) |
| | | |
Marcia A. Kean (born 6/30/48) | | Trustee | | April 2005 | | Feinstein Kean Healthcare (consulting), Chief Executive Officer |
| | | |
Ronald G. Steinhart (born 6/15/40) | | Trustee | | May 2001 | | Private investor; Penske Automotive Group (automotive retailer), Director; Animal Health International, Inc. (animal health products), Director (since 2007); Texas Industries (concrete/aggregates/cement), Director (since 2007); Susser Holdings Corporation (retail convenience stores and distributor of wholesale motor fuel), Director (since 2009); Prentiss Properties Trust (real estate investment trust), Director (until 2006); Penson Worldwide, Inc. (securities clearance), Director (until 2008) |
| | | |
Haviland Wright (born 7/21/48) | | Trustee | | May 2001 | | X-Change Corp. (multi-media web services), Director (since 2010); Nano Loa Inc. (liquid crystal displays), Director (until 2009); Profitability of Hawaii (software), Chief Development Officer (until 2010); Elixir Technologies Corporation (software), Director (until 2010) |
| | | |
| OFFICERS | | | | | | |
Maria F. DiOrioDwyer (4)
(born 12/01/58) | | President | | November 2005 | | Massachusetts Financial Services Company, Executive Vice President and Chief Regulatory Officer; Chief Compliance Officer (since December 2006) |
| | | |
| Christopher R. Bohane (4) (born 1/18/74) | | Assistant Secretary and Assistant Clerk | | July 2005 | | Massachusetts Financial Services Company, Vice President and Senior Counsel |
| | | |
John M. Corcoran (4) (born 4/13/65) | | Treasurer | | October 2008 | | Massachusetts Financial Services Company, Senior Vice President (since October 2008); State Street Bank and Trust (financial services provider), Senior Vice President, (until September 2008) |
| | | |
Ethan D. Corey (4) (born 11/21/63) | | Assistant Secretary and Assistant Clerk | | July 2005 | | Massachusetts Financial Services Company, Senior Vice President and Associate General Counsel |
| | | |
David L. DiLorenzo (4) (born 8/10/68) | | Assistant Treasurer | | July 2005 | | Massachusetts Financial Services Company, Vice President |
| | | |
Timothy M. Fagan (4) (born 7/10/68) | | Assistant Secretary and Assistant Clerk | | September 2005 | | Massachusetts Financial Services Company, Vice President and Senior Counsel |
| | | |
Mark D. Fischer (4) (born 10/27/70) | | Assistant Treasurer | | July 2005 | | Massachusetts Financial Services Company, Vice President |
24
MFS Global Research Portfolio
Trustees and Officers – continued
| | | | | | |
Name, Date of Birth | | Position(s) Held
with Fund | | Trustee/Officer
Since (1) | | Principal Occupations During the Past Five Years and
Other Directorships (2) |
Robyn L. Griffin (born 7/04/75) | | Assistant Independent Chief Compliance Officer | | August 2008 | | Griffin Compliance LLC (provider of compliance services), Principal (since August 2008); State Street Corporation (financial services provider), Mutual Fund Administration Assistant Vice President (October 2006 – July 2008); Liberty Mutual Group (insurance), Personal Market Assistant Controller (April 2006 – October 2006); Deloitte & Touche LLP (professional services firm), Senior Manager (prior to April 2006) |
| | | |
Brian E. Langenfeld (4) (born 3/07/73) | | Assistant Secretary and Assistant Clerk | | May 2006 | | Massachusetts Financial Services Company, Vice President and Senior Counsel (since May 2006); John Hancock Advisers, LLC, Assistant Vice President and Counsel (until April 2006) |
| | | |
Ellen Moynihan (4) (born 11/13/57) | | Assistant Treasurer | | May 1997 | | Massachusetts Financial Services Company, Senior Vice President |
| | | |
Susan S. Newton (4) (born 3/07/50) | | Assistant Secretary and Assistant Clerk | | May 2005 | | Massachusetts Financial Services Company, Senior Vice President and Associate General Counsel |
| | | |
Susan A. Pereira (4)
(born 11/05/70) | | Assistant Secretary and Assistant Clerk | | July 2005 | | Massachusetts Financial Services Company, Vice President and Senior Counsel |
| | | |
Mark N. Polebaum (4) (born 5/01/52) | | Secretary and Clerk | | February 2006 | | Massachusetts Financial Services Company, Executive Vice President, General Counsel and Secretary (since January 2006); Wilmer Cutler Pickering Hale and Dorr LLP (law firm), Partner (until January 2006) |
| | | |
Frank L. Tarantino (born 3/07/44) | | Independent Chief Compliance Officer | | September 2004 | | Tarantino LLC (provider of compliance services), Principal |
| | | |
Richard S. Weitzel (4) (born 7/16/70) | | Assistant Secretary and Assistant Clerk | | October 2007 | | Massachusetts Financial Services Company, Vice President and Assistant General Counsel |
| | | |
James O. Yost (4) (born 6/12/60) | | Assistant Treasurer | | April 1992 | | Massachusetts Financial Services Company, Senior Vice President |
| (1) | Date first appointed to serve as Trustee/Officer of an MFS fund or a Compass variable account. Each Trustee has served continuously since appointment. For the period March 2008 until October 2008, Ms. DiOrioDwyer served as Treasurer of the Funds. |
| (2) | Directorships or trusteeships of companies required to report to the Securities and Exchange Commission (i.e., “public companies”). |
| (3) | “Interested person” of the Trust, within the meaning of the Investment Company Act of 1940 (referred to as the 1940 Act), which is the principal federal law governing investment companies like the Trust, as a result of position with Sun Life of Canada (U.S.). The address of Sun Life of Canada (U.S.) is One Sun Life Executive Park, Wellesley Hills, Massachusetts 02481. |
| (4) | “Interested person” of MFS within the meaning of the 1940 Act. The address of MFS is 500 Boylston Street, Boston, Massachusetts 02116. |
The Trust does not hold annual meetings for the purpose of electing Trustees, and Trustees are not elected for fixed terms. Each Trustee and officer holds office until his or her successor is chosen and qualified, or until his or her earlier death, resignation, retirement or removal.
All Trustees currently serve as Trustees of the Trust and have served in that capacity since originally elected or appointed. All of the Trustees are also Managers of the Compass Variable Accounts. The executive officers of the Trust hold similar offices for the Compass Variable Accounts and other funds in the MFS fund complex. As of January 1, 2011, each Trustee serves as a Trustee or Manager of 31 Accounts/Portfolios.
25
MFS Global Research Portfolio
Trustees and Officers – continued
The Statement of Additional Information contains further information about the Trustees and is available without charge upon request by calling 1-800-752-7215.
| | |
Investment Adviser
Massachusetts Financial Services Company 500 Boylston Street, Boston, MA 02116-3741 | | Custodian State Street Bank and Trust 1 Lincoln Street, Boston, MA 02111-2900 |
Distributor
MFS Fund Distributors, Inc. 500 Boylston Street, Boston, MA 02116-3741 | | Independent Registered Public Accounting Firm Deloitte & Touche LLP 200 Berkeley Street, Boston, MA 02116 |
Portfolio Manager Michael Cantara | | |
26
MFS Global Research Portfolio
BOARD REVIEW OF INVESTMENT ADVISORY AGREEMENT
The Investment Company Act of 1940 requires that both the full Board of Trustees and a majority of the non-interested (“independent”) Trustees, voting separately, annually approve the continuation of the investment advisory agreement between MFS Variable Insurance Trust II (the “Trust”) and Massachusetts Financial Services Company (“MFS”) on behalf of the Fund. The Trustees consider matters bearing on the Fund and the advisory arrangement at their meetings throughout the year, including a review of performance data at each regular meeting. In addition, the independent Trustees met in person in May and again in July 2010 (“contract review meetings”) for the specific purpose of considering whether to approve the continuation of the investment advisory agreement for the Fund. The independent Trustees were assisted in their evaluation of the investment advisory agreement by independent legal counsel, from whom they received separate legal advice and with whom they met separately from MFS management during various contract review meetings. The independent Trustees were also assisted in this process by the Fund’s Independent Chief Compliance Officer, a full-time senior officer appointed by and reporting to the independent Trustees.
In connection with their deliberations, the Trustees, including the independent Trustees, considered such information and factors as they believed, in light of the legal advice furnished to them and their own business judgment, to be relevant. The investment advisory agreement was considered separately for the Fund, although the Trustees also took into account the common interests of all Funds in the Trust in their review. As described below, the Trustees considered the nature, quality, and extent of the various investment advisory, administrative, and shareholder services performed by MFS under the existing investment advisory agreement and other arrangements with the Trust.
In connection with their contract review meetings, the Trustees received and relied upon materials which included, among other items: (i) information provided by Lipper Inc. (“Lipper”) on the investment performance of the Fund for various time periods ended December 31, 2009, compared to the investment performance of a group of funds with substantially similar investment classifications/objectives (the “Lipper performance universe”), (ii) information provided by Lipper on the Fund’s advisory fees and other expenses compared to the advisory fees and other expenses of comparable funds identified by Lipper (the “Lipper expense group”), (iii) information provided by MFS on the advisory fees of comparable portfolios of its other clients, including institutional separate account and other clients, (iv) information as to whether, and to what extent applicable, expense waivers, reimbursements or fee “breakpoints” are observed for the Fund, (v) information regarding MFS’ financial results and financial condition, including MFS’ and certain of its affiliates’ estimated profitability from services performed for the Fund, (vi) MFS’ views regarding the outlook for the mutual fund industry and its strategic business plans, (vii) descriptions of various functions performed by MFS for the Trust, such as compliance monitoring and portfolio trading practices, and (viii) information regarding the overall organization of MFS, including information about MFS’ senior management and other personnel providing investment advisory, administrative and other services to the Fund. The comparative performance, fee and expense information prepared and provided by Lipper was not independently verified, and the independent Trustees did not independently verify any information provided to them by MFS.
The Trustees’ conclusion as to the continuation of the investment advisory agreement was based on comprehensive consideration of all information provided to the Trustees and was not the result of any single factor. Some of the factors that figured particularly in the Trustees’ deliberations are described below for the Fund, while individual Trustees may have given different weight to various factors and evaluated the information presented as a whole differently than another individual Trustee. The Trustees recognized that the fee arrangements for the Fund reflect years of review and discussion between the independent Trustees and MFS, that certain aspects of such arrangements may receive greater scrutiny in some years than others, and that the Trustees’ conclusions may be based, in part, on their consideration of these same arrangements during the course of the year and in prior years.
Based on information provided by Lipper, the Trustees compared the Fund’s total return investment performance to the performance of the Lipper performance universe over various time periods. The Trustees placed particular emphasis on the total return performance of the Fund’s Initial Class shares in comparison to the performance of funds in its Lipper performance universe over the one-, three- and five-year periods ended December 31, 2009. The Trustees did not rely on performance results for more recent periods, including those shown elsewhere in this report.
The Trustees noted the performance of the Fund’s Initial Class shares was in the 2nd quintile relative to the other funds in the Lipper performance universe for the one-year period (the 1st quintile being the best performers and the 5th quintile being the worst performers). The total return performance of the Fund was in the 1st quintile for the three-year period and the 4th quintile for the five-year period ended December 31, 2009, relative to the Lipper performance universe. Based on the nature and quality of services provided by MFS, the Board of Trustees concluded that the Fund’s performance was satisfactory.
27
MFS Global Research Portfolio
Board Review of Investment Advisory Agreement – continued
In the course of their deliberations, the Trustees took into account information provided by MFS during contract review meetings, as well as during investment review meetings conducted with portfolio management personnel during the course of the year.
In assessing the reasonableness of the Fund’s advisory fee, the Trustees considered, among other information, the Fund’s advisory fee and the total expense ratio of the Fund’s Initial Class shares as a percentage of average daily net assets, compared to the advisory fee and total expense ratios of its peer group of funds based on information provided by Lipper. The Trustees also considered the advisory fees charged by MFS to institutional accounts. In comparing these fees, the Trustees considered the generally broader scope of services provided by MFS to the Trust than those provided to institutional accounts. The Trustees also considered the higher demands placed on MFS’ investment personnel and trading infrastructure as a result of the daily cash in-flows and out-flows of the Fund, and the impact on MFS and related expenses due to the more extensive regulatory regime to which the Fund is subject, compared to institutional accounts.
In considering the fees, the Trustees noted from the Lipper data that the Fund’s effective advisory fee rate and total expense ratio were each approximately at the median of such fees and expenses of funds in the Lipper expense group. The Trustees further concluded that the existing breakpoint was sufficient to allow the Fund to benefit from economies of scale as its assets grow. The Trustees concluded that the fees were reasonable in light of the nature and quality of services provided.
The Trustees also considered information prepared by MFS relating to its costs and profits with respect to the Fund and other investment companies and accounts advised by MFS, as well as MFS’ methodologies used to determine and allocate its costs to the Fund and other accounts and products for purposes of estimating profitability.
After reviewing these and other factors described below, the Trustees concluded that the advisory fees charged to the Fund represent reasonable compensation in light of the nature and quality of the services being provided by MFS.
In addition, the Trustees considered MFS’ resources and related efforts to continue to retain, attract and motivate capable personnel to serve the Fund. The Trustees also considered the financial resources of MFS and its parent, Sun Life Financial Inc. The Trustees further considered any advantages and possible disadvantages of having an adviser which also serves other investment companies as well as institutional accounts.
The Trustees also considered the nature, quality, cost, and extent of administrative, transfer agency, and distribution services provided to the Fund by MFS and its affiliates under agreements and plans other than the investment advisory agreement, including the 12b-1 fees the Fund pays to MFS Fund Distributors, Inc., an affiliate of MFS. The Trustees also considered the nature, extent and quality of certain other services MFS performs or arranges on the Fund’s behalf, which may include securities lending programs, directed expense payment programs, class action recovery programs, and MFS’ interaction with third-party service providers, principally custodians and sub-custodians. The Trustees concluded that the various non-advisory services provided by MFS and its affiliates on behalf of the Fund were satisfactory. The Trustees also considered the benefits to MFS from the use of the Fund’s portfolio brokerage commissions to pay for investment research and various other factors. Additionally, the Trustees considered so-called “fall-out benefits” to MFS such as reputational value derived from serving as investment manager to the Trust, and determined that any such benefits derived by MFS were reasonable and fair.
Based on their evaluation of factors that they deemed to be material, including those factors described above, the Board of Trustees, including a majority of the independent Trustees, concluded that the investment advisory agreement should be continued for an additional one-year period, commencing September 1, 2010.
A discussion regarding the Board’s most recent review and renewal of the fund’s Investment Advisory Agreement with MFS is available by clicking on the fund’s name under “Variable Insurance Portfolios — VIT II” in the “Products and Performance” section of the MFS Web site (mfs.com).
28
MFS Global Research Portfolio
PROXY VOTING POLICIES AND INFORMATION
A general description of the MFS funds’ proxy voting policies and procedures is available without charge, upon request, by calling
1-800-225-2606, by visiting the Proxy Voting section of mfs.com or by visiting the SEC’s Web site at http://www.sec.gov.
Information regarding how the fund voted proxies relating to portfolio securities during the most recent twelve-month period ended June 30 is available without charge by visiting the Proxy Voting section of mfs.com or by visiting the SEC’s Web site at http://www.sec.gov.
QUARTERLY PORTFOLIO DISCLOSURE
The fund will file a complete schedule of portfolio holdings with the Securities and Exchange Commission (the Commission) for the first and third quarters of each fiscal year on Form N-Q. The fund’s Form N-Q may be reviewed and copied at the:
Public Reference Room
Securities and Exchange Commission
100 F Street, NE, Room 1580
Washington, D.C. 20549
Information on the operation of the Public Reference Room may be obtained by calling the Commission at 1-800-SEC-0330. The fund’s Form N-Q is available on the EDGAR database on the Commission’s Internet Web site at http://www.sec.gov, and copies of this information may be obtained, upon payment of a duplicating fee, by electronic request at the following e-mail address: publicinfo@sec.gov or by writing the Public Reference Section at the above address.
FURTHER INFORMATION
From time to time, MFS may post important information about the fund or the MFS funds on the MFS web site (mfs.com). This information is available by visiting the “News & Commentary” section of mfs.com or by clicking on the fund’s name under “Variable Insurance Portfolios — VIT II” in the “Products and Performance” section of mfs.com.
FEDERAL TAX INFORMATION (unaudited)
The following information is provided pursuant to provisions of the Internal Revenue Code.
For corporate shareholders, 60.09% of the ordinary income dividends paid during the fiscal year qualify for the corporate dividends received deduction.
29
MFS Global Research Portfolio
MFS® PRIVACY NOTICE
Privacy is a concern for every investor today. At MFS Investment Management® and the MFS funds, we take this concern very seriously. We want you to understand our policies about the investment products and services that we offer, and how we protect the nonpublic personal information of investors who have a direct relationship with us and our wholly owned subsidiaries.
Throughout our business relationship, you provide us with personal information. We maintain information and records about you, your investments, and the services you use. Examples of the nonpublic personal information we maintain include
| | Ÿ | | data from investment applications and other forms |
| | Ÿ | | share balances and transactional history with us, our affiliates, or others |
| | Ÿ | | facts from a consumer reporting agency |
We do not disclose any nonpublic personal information about our customers or former customers to anyone, except as permitted by law. We may share nonpublic personal information with third parties or certain of our affiliates in connection with servicing your account or processing your transactions. We may share information with companies or financial institutions that perform marketing services on our behalf or with other financial institutions with which we have joint marketing arrangements, subject to any legal requirements.
Authorization to access your nonpublic personal information is limited to appropriate personnel who provide products, services, or information to you. We maintain physical, electronic, and procedural safeguards to help protect the personal information we collect about you.
If you have any questions about the MFS privacy policy, please call 1-800-225-2606 any business day.
Note: If you own MFS products or receive MFS services in the name of a third party such as a bank or broker-dealer, their privacy policy may apply to you instead of ours.
30

MFS® INTERNATIONAL VALUE PORTFOLIO
The report is prepared for the general information of contract owners. It is authorized for distribution to prospective investors only when preceded or accompanied by a current prospectus.
NOT FDIC INSURED Ÿ MAY LOSE VALUE Ÿ NO BANK GUARANTEE Ÿ NOT A DEPOSIT Ÿ NOT INSURED BY ANY FEDERAL GOVERNMENT AGENCY OR NCUA/NCUSIF
MFS International Value Portfolio
LETTER FROM THE CEO

Dear Contract Owners:
After an extended rebound in the financial markets, uncertainty returned in 2010 as investors began to question the durability of the recovery for global economies and markets. That uncertainty led to increased risk aversion, especially as investors saw the eurozone struggle with the debt woes of many of its members. In September, the U.S. Federal Reserve Board’s promises to further loosen monetary policy helped assuage market fears and drive asset prices off their recent lows. A combination of solid earnings and improving economic data gave an additional boost to investor sentiment. As we enter 2011, we are cautiously optimistic that economic growth will continue to improve and that the global economies will recover from the shocks of the past few years. We expect the pace of recovery worldwide will be uneven and volatile.
As always, we continue to be mindful of the many economic challenges faced at the local, national, and international levels. It is in times such as these that we want to remind investors of the merits of maintaining a long-term view, adhering to basic investing principles such as asset allocation and diversification, and working closely with their advisors to research and identify appropriate investment opportunities.
Respectfully,

Robert J. Manning
Chairman and Chief Executive Officer
MFS Investment Management®
February 14, 2011
The opinions expressed in this letter are subject to change, may not be relied upon for investment advice, and no forecasts can be guaranteed.
1
MFS International Value Portfolio
PORTFOLIO COMPOSITION
Portfolio structure
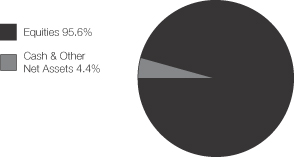
| | | | |
| Top ten holdings | | | | |
| Royal Dutch Shell PLC, “A” | | | 3.3% | |
| Nestle S.A. | | | 2.9% | |
| Vodafone Group PLC | | | 2.7% | |
| Roche Holding AG | | | 2.7% | |
| GlaxoSmithKline PLC | | | 2.7% | |
| Sanofi-Aventis | | | 2.6% | |
| BP PLC | | | 2.6% | |
| KDDI Corp. | | | 2.6% | |
| Heineken N.V. | | | 2.6% | |
| Kao Corp. | | | 2.5% | |
| | | | |
| Equity sectors | | | | |
| Consumer Staples | | | 17.3% | |
| Financial Services | | | 16.8% | |
| Health Care | | | 15.0% | |
| Utilities & Communications | | | 8.6% | |
| Technology | | | 8.1% | |
| Energy | | | 7.0% | |
| Industrial Goods & Services | | | 6.3% | |
| Basic Materials | | | 3.9% | |
| Leisure | | | 3.3% | |
| Special Products & Services | | | 3.1% | |
| Transportation | | | 2.3% | |
| Autos & Housing | | | 2.0% | |
| Retailing | | | 1.9% | |
| |
| Issuer country weightings | | | | |
| United Kingdom | | | 24.5% | |
| Japan | | | 24.1% | |
| Switzerland | | | 12.7% | |
| France | | | 7.9% | |
| Germany | | | 7.2% | |
| Netherlands | | | 6.5% | |
| Taiwan | | | 2.8% | |
| Sweden | | | 2.4% | |
| South Korea | | | 1.2% | |
| Other Countries | | | 10.7% | |
| Percentages | are based on net assets as of 12/31/10. |
The portfolio is actively managed and current holdings may be different.
2
MFS International Value Portfolio
MANAGEMENT REVIEW
Summary of Results
For the twelve months ended December 31, 2010, Initial Class shares of the MFS International Value Portfolio (the “fund”) provided a total return of 9.11%, while Service Class shares of the fund provided a total return of 8.78%. These compare with a return of 3.81% for the fund’s benchmark, the Morgan Stanley Capital International (MSCI) EAFE (Europe, Australasia, Far East) Value Index.
Market Environment
The first quarter of the reporting period witnessed a continuation of the financial market and macroeconomic rebounds that had begun in early 2009. These recoveries in global activity and asset valuations were generally synchronized around the world, led importantly by emerging Asian economies, but broadening to include most of the global economy to varying degrees. Primary drivers of the recoveries included an unwinding of the inventory destocking that took place earlier, the production of manufacturing and capital goods, as well as massive fiscal and monetary stimulus.
During most of the remainder of the period, heightened risk surrounding the public-debt profiles of several of the peripheral European countries impaired market sentiment. At the same time, the improving trend in global macroeconomic data began to weaken somewhat. These two dynamics caused many asset prices to retrench significantly, as many questioned the durability of the global recovery.
Towards the end of the period, the U.S. Federal Reserve led markets to believe that further monetary loosening would be forthcoming if macroeconomic activity did not show signs of improvement. The prospects for more easing by the Fed improved market sentiment and drove risk-asset prices markedly higher. However, in a text-book case of “buy the rumor, sell the fact,” the weeks following the early November announcement of further quantitative easing saw a sell-off in U.S. Treasury bonds. This rise in Treasury yields occurred despite risk-off behavior in equities and credit markets (which would normally result in Treasury yield compression), and appears to have been the result of a few factors: signs of improved U.S. and global economic activity; opposition to quantitative easing from some quarters; and crowded long positions in U.S. Treasuries. The December agreement on an expansionary U.S. fiscal package also boosted sentiment, leading markets to reach near-term highs in risky asset valuations toward year end.
Contributors to Performance
Stock selection and an underweight position in the financial services sector contributed to performance relative to the MSCI EAFE Value Index. Not holding poor-performing financial services firms Banco Santander S.A. (Spain) and Banco Bilbao Vizcaya (Spain) aided results as both stocks underperformed the benchmark over the reporting period.
An overweight position and stock selection in the consumer staples sector were other positive factors for relative returns. Holdings of global food company Nestle S.A. (b) (Switzerland) and tobacco distributor British American Tobacco (b) (United Kingdom) bolstered performance as both stocks turned in strong performance relative to the benchmark. Shares of British American Tobacco rose as the company reported strong price gains and higher profit margins for its cigarette sales.
Stock selection in the autos & housing sector benefited relative results. Holdings of automotive and industrial products manufacturer Tomkins (h) (United Kingdom) and used vehicle auction sites operator USS Co. (Japan) helped performance. Shares of Tomkins benefited from Canadian private equity firm, Onex, and the Canadian Pension Plan Investment Board completing the acquisition of Tomkins.
Elsewhere, the timing of our ownership in integrated oil company BP PLC (United Kingdom) aided performance. The fund’s holdings of precision instrumentation and controls supplier Spectris PLC (b) (United Kingdom), flavors and fragrances company Givaudan (b) (Switzerland), and locks manufacturer Assa Abloy were also among the fund’s top contributors. Shares of Spectris rose as the company announced better-than-expected earnings due to an increase in demand from industrial customers.
During the reporting period, the fund’s currency exposure was another contributor to relative performance. All of MFS’ investment decisions are driven by the fundamentals of each individual opportunity and as such, it is common for our portfolios to have different currency exposures than the benchmark.
Detractors from Performance
Stock selection in the health care sector held back relative performance. Holdings of pharmaceutical and diagnostic company Roche Holding (b) (Switzerland) and pharmaceutical company Sanofi-Aventis (France) were among the fund’s top detractors. Shares of Sanofi-Aventis came under pressure due, in part, to no movement in the drug maker’s hostile bid for biotech company Genzyme.
3
MFS International Value Portfolio
Management Review – continued
Other individual stocks that hindered relative results included oil and gas exploration company INPEX (Japan), aerospace and defense technology firm Cobham (United Kingdom), and telecommunications services provider Koninklijike KPN (Netherlands). Shares of INPEX were negatively affected by the company’s announcement that it was raising capital via a stock issue to finance the development of its Ichthys natural gas project in Australia. Not holding electronics and electrical engineering company Siemens, chemical company BASF (Germany), carmaker Volkswagen (Germany), and financial services firm Australia and New Zealand Banking Group dampened performance as all four stocks outperformed the benchmark over the reporting period.
The fund’s cash position was also a detractor from relative performance. The fund holds cash to buy new holdings and to provide liquidity. In a period when equity markets rose, as measured by the fund’s benchmark, holding cash hurt performance versus the benchmark, which has no cash position.
Respectfully,
| | |
| Benjamin Stone | | Barnaby Wiener |
| Portfolio Manager | | Portfolio Manager |
| (b) | Security is not a benchmark constituent. |
| (h) | Security was not held in the portfolio at period end. |
The views expressed in this report are those of the portfolio managers only through the end of the period of the report as stated on the cover and do not necessarily reflect the views of MFS or any other person in the MFS organization. These views are subject to change at any time based on market or other conditions, and MFS disclaims any responsibility to update such views. These views may not be relied upon as investment advice or an indication of trading intent on behalf of any MFS portfolio. References to specific securities are not recommendations of such securities, and may not be representative of any MFS portfolio’s current or future investments.
4
MFS International Value Portfolio
PERFORMANCE SUMMARY THROUGH 12/31/10
The following chart illustrates the historical performance of the fund in comparison to its benchmark(s). Benchmarks are unmanaged and may not be invested in directly. Benchmark returns do not reflect any fees or expenses. The performance of other share classes will be greater than or less than that of the class depicted below. (See Notes to Performance Summary.)
Performance data shown represents past performance and is no guarantee of future results. Investment return and principal value fluctuate so your units, when sold, may be worth more or less than the original cost; current performance may be lower or higher than quoted. The performance shown does not reflect the deduction of taxes, if any, that a contract holder would pay on fund distributions or the redemption of contract units. The returns for the fund shown also do not reflect the deduction of expenses associated with variable products, such as mortality and expense risk charges, separate account charges, and sales charges imposed by the insurance company separate accounts. Such expenses would reduce the overall returns shown.
Growth of a Hypothetical $10,000 Investment
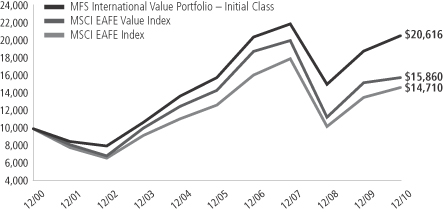
Total Returns through 12/31/10
Average annual total returns
| | | | | | | | | | | | | | |
| | | Share class | | Class inception date | | 1-yr | | 5-yr | | 10-yr | | Life (t) | | |
| | | Initial Class | | 10/02/95 | | 9.11% | | 5.41% | | 7.50% | | N/A | | |
| | | Service Class | | 8/24/01 | | 8.78% | | 5.15% | | N/A | | 8.97 | | |
| | | | | |
| Comparative benchmarks | | | | | | | | | | |
| | | MSCI EAFE Value Index (f) | | 3.81% | | 1.96% | | 4.72% | | N/A | | |
| | | MSCI EAFE Index (f) | | 8.21% | | 2.94% | | 3.94% | | N/A | | |
| (f) | Source: FactSet Research Systems Inc. |
| (t) | For the period from the class inception date through the stated period end (for those share classes with less than 10 years of performance history). No comparative benchmark performance information is provided for “life” periods. (See Notes to Performance Summary.) |
Benchmark Definitions
MSCI EAFE (Europe, Australasia, Far East) Index – a market capitalization-weighted index that is designed to measure equity market performance in the developed markets, excluding the U.S. and Canada.
MSCI EAFE (Europe, Australasia, Far East) Value Index – a market capitalization-weighted index that is designed to measure equity market performance for value securities in the developed markets, excluding the U.S. and Canada.
It is not possible to invest directly in an index.
Notes to Performance Summary
Average annual total return represents the average annual change in value for each share class for the periods presented. Life returns are presented where the share class has less than 10 years of performance history and represent the average annual total return from the class inception date to the stated period end date. As the fund’s share classes may have different inception dates, the life returns may represent different time periods and may not be comparable. As a result, no comparative benchmark performance information is provided for life periods.
5
MFS International Value Portfolio
Performance Summary – continued
Performance results reflect any applicable expense subsidies and waivers in effect during the periods shown. Without such subsidies and waivers the fund’s performance results would be less favorable. Please see the prospectus and financial statements for complete details. All results are historical and assume the reinvestment of any dividends and capital gains distributions.
From time to time the fund may receive proceeds from litigation settlements, without which performance would be lower.
6
MFS International Value Portfolio
EXPENSE TABLE
Fund Expenses Borne by the Contract Holders During the Period,
July 1, 2010 through December 31, 2010
As a contract holder of the fund, you incur ongoing costs, including management fees; distribution and/or service (12b-1) fees; and other fund expenses. This example is intended to help you understand your ongoing costs (in dollars) of investing in the fund and to compare these costs with the ongoing costs of investing in other mutual funds.
The example is based on an investment of $1,000 invested at the beginning of the period and held for the entire period July 1, 2010 through December 31, 2010.
Actual Expenses
The first line for each share class in the following table provides information about actual account values and actual expenses. You may use the information in this line, together with the amount you invested, to estimate the expenses that you paid over the period. Simply divide your account value by $1,000 (for example, an $8,600 account value divided by $1,000 = 8.6), then multiply the result by the number in the first line under the heading entitled “Expenses Paid During Period” to estimate the expenses you paid on your account during this period.
Hypothetical Example for Comparison Purposes
The second line for each share class in the following table provides information about hypothetical account values and hypothetical expenses based on the fund’s actual expense ratio and an assumed rate of return of 5% per year before expenses, which is not the fund’s actual return. The hypothetical account values and expenses may not be used to estimate the actual ending account balance or expenses you paid for the period. You may use this information to compare the ongoing costs of investing in the fund and other funds. To do so, compare this 5% hypothetical example with the 5% hypothetical examples that appear in the shareholder reports of the other funds.
Please note that the expenses shown in the table are meant to highlight the fund’s ongoing costs only and do not take into account the fees and expenses imposed under the variable contracts through which your investment in the fund is made. Therefore, the second line for each share class in the table is useful in comparing ongoing costs associated with an investment in vehicles (such as the fund) which fund benefits under variable annuity and variable life insurance contracts and to qualified pension and retirement plans only, and will not help you determine the relative total costs of investing in the fund through variable annuity and variable life insurance contracts. If the fees and expenses imposed under the variable contracts were included, your costs would have been higher.
| | | | | | | | | | | | | | | | | | |
| Share Class | | | | Annualized
Expense Ratio | | | Beginning
Account Value
7/01/10 | | | Ending
Account Value
12/31/10 | | | Expenses Paid
During Period (p)
7/01/10-12/31/10 | |
| Initial Class | | Actual | | | 1.05% | | | | $1,000.00 | | | | $1,197.39 | | | | $5.82 | |
| | Hypothetical (h) | | | 1.05% | | | | $1,000.00 | | | | $1,019.91 | | | | $5.35 | |
| Service Class | | Actual | | | 1.30% | | | | $1,000.00 | | | | $1,196.12 | | | | $7.20 | |
| | Hypothetical (h) | | | 1.30% | | | | $1,000.00 | | | | $1,018.65 | | | | $6.61 | |
| (h) | 5% class return per year before expenses. |
| (p) | Expenses paid is equal to each class’ annualized expense ratio, as shown above, multiplied by the average account value over the period, multiplied by the number of days in the period, divided by the number of days in the year. |
7
MFS International Value Portfolio
PORTFOLIO OF INVESTMENTS – 12/31/10
The Portfolio of Investments is a complete list of all securities owned by your fund. It is categorized by broad-based asset classes.
| | | | | | | | |
| Issuer | | Shares/Par | | | Value ($) | |
| | | | | | | | |
| COMMON STOCKS – 95.6% | | | | | | | | |
| Aerospace – 1.1% | | | | | | | | |
| Cobham PLC | | | 1,333,777 | | | $ | 4,231,769 | |
| | | | | | | | |
| Alcoholic Beverages – 2.6% | | | | | | | | |
| Heineken N.V. | | | 204,898 | | | $ | 10,045,912 | |
| | | | | | | | |
| Automotive – 0.7% | | | | | | | | |
| USS Co. Ltd. | | | 34,530 | | | $ | 2,823,983 | |
| | | | | | | | |
| Broadcasting – 2.4% | | | | | | | | |
| Fuji Television Network, Inc. | | | 1,741 | | | $ | 2,753,349 | |
| Nippon Television Network Corp. | | | 18,650 | | | | 2,933,372 | |
| Vivendi S.A. | | | 139,848 | | | | 3,774,953 | |
| | | | | | | | |
| | | | | | $ | 9,461,674 | |
| | | | | | | | |
| Brokerage & Asset Managers – 1.3% | | | | | | | | |
| Daiwa Securities Group, Inc. | | | 963,000 | | | $ | 4,957,926 | |
| Van Lanschot N.V. (a) | | | 7,361 | | | | 295,587 | |
| | | | | | | | |
| | | | | | $ | 5,253,513 | |
| | | | | | | | |
| Business Services – 3.1% | | | | | | | | |
| Amadeus IT Holding S.A. (a) | | | 121,941 | | | $ | 2,555,052 | |
| Bunzl PLC | | | 250,240 | | | | 2,805,171 | |
| Compass Group PLC | | | 295,750 | | | | 2,679,012 | |
| Nomura Research, Inc. | | | 184,100 | | | | 4,087,009 | |
| | | | | | | | |
| | | | | | $ | 12,126,244 | |
| | | | | | | | |
| Chemicals – 1.1% | | | | | | | | |
| Givaudan S.A. | | | 4,145 | | | $ | 4,473,053 | |
| | | | | | | | |
| Computer Software – 0.2% | | | | | | | | |
| OBIC Co. Ltd. | | | 4,830 | | | $ | 994,674 | |
| | | | | | | | |
| Computer Software – Systems – 3.1% | | | | | | | | |
| Acer, Inc. | | | 1,527,636 | | | $ | 4,720,731 | |
| Asustek Computer, Inc. | | | 142,000 | | | | 1,349,065 | |
| Konica Minolta Holdings, Inc. | | | 365,000 | | | | 3,794,310 | |
| Venture Corp. Ltd. | | | 309,000 | | | | 2,229,587 | |
| | | | | | | | |
| | | | | | $ | 12,093,693 | |
| | | | | | | | |
| Construction – 1.3% | | | | | | | | |
| Geberit AG | | | 22,472 | | | $ | 5,196,199 | |
| | | | | | | | |
| Consumer Products – 5.8% | | | | | | | | |
| Henkel KGaA, IPS | | | 94,528 | | | $ | 5,878,197 | |
| Kao Corp. | | | 357,900 | | | | 9,645,094 | |
| KOSE Corp. | | | 86,300 | | | | 2,232,171 | |
| Reckitt Benckiser Group PLC | | | 93,245 | | | | 5,124,582 | |
| | | | | | | | |
| | | | | | $ | 22,880,044 | |
| | | | | | | | |
| Containers – 1.1% | | | | | | | | |
| Brambles Ltd. | | | 426,264 | | | $ | 3,104,198 | |
| Smurfit Kappa Group PLC (a) | | | 108,522 | | | | 1,058,631 | |
| | | | | | | | |
| | | | | | $ | 4,162,829 | |
| | | | | | | | |
| Electrical Equipment – 1.8% | | | | | | | | |
| Legrand S.A. | | | 101,354 | | | $ | 4,127,514 | |
| Spectris PLC | | | 152,099 | | | | 3,108,872 | |
| | | | | | | | |
| | | | | | $ | 7,236,386 | |
| | | | | | | | |
| | | | | | | | |
| Issuer | | Shares/Par | | | Value ($) | |
| | | | | | | | |
| COMMON STOCKS – continued | |
| Electronics – 3.1% | | | | | | | | |
| Halma PLC | | | 442,235 | | | $ | 2,475,263 | |
| Samsung Electronics Co. Ltd. | | | 5,752 | | | | 4,809,805 | |
| Taiwan Semiconductor Manufacturing Co. Ltd., ADR | | | 397,348 | | | | 4,982,744 | |
| | | | | | | | |
| | | | | | $ | 12,267,812 | |
| | | | | | | | |
| Energy – Independent – 1.1% | | | | | | | | |
| INPEX Corp. | | | 725 | | | $ | 4,246,059 | |
| | | | | | | | |
| Energy – Integrated – 5.9% | | | | | | | | |
| BP PLC | | | 1,419,383 | | | $ | 10,302,430 | |
| Royal Dutch Shell PLC, “A” | | | 392,937 | | | | 13,101,045 | |
| | | | | | | | |
| | | | | | $ | 23,403,475 | |
| | | | | | | | |
| Food & Beverages – 4.8% | | | | | | | | |
| Barry Callebaut AG | | | 1,400 | | | $ | 1,159,679 | |
| Groupe Danone | | | 104,676 | | | | 6,577,089 | |
| Nestle S.A. | | | 193,096 | | | | 11,306,958 | |
| | | | | | | | |
| | | | | | $ | 19,043,726 | |
| | | | | | | | |
| Food & Drug Stores – 1.1% | | | | | | | | |
| Lawson, Inc. | | | 86,600 | | | $ | 4,282,535 | |
| | | | | | | | |
| General Merchandise – 0.2% | | | | | | | | |
| Daiei, Inc. (a) | | | 201,150 | | | $ | 795,285 | |
| | | | | | | | |
| Insurance – 7.4% | | | | | | | | |
| Amlin PLC | | | 224,614 | | | $ | 1,431,949 | |
| Catlin Group Ltd. | | | 300,757 | | | | 1,734,967 | |
| Euler Hermes (a) | | | 16,517 | | | | 1,574,813 | |
| Hiscox Ltd. | | | 460,477 | | | | 2,738,182 | |
| ING Groep N.V. (a) | | | 465,089 | | | | 4,524,508 | |
| Jardine Lloyd Thompson Group PLC | | | 266,915 | | | | 2,617,564 | |
| Muenchener Ruckvers AG | | | 29,086 | | | | 4,409,531 | |
| SNS REAAL Groep N.V. (a) | | | 181,230 | | | | 772,547 | |
| Swiss Reinsurance Co. | | | 85,162 | | | | 4,581,442 | |
| Zurich Financial Services Ltd. | | | 18,145 | | | | 4,700,234 | |
| | | | | | | | |
| | | | | | $ | 29,085,737 | |
| | | | | | | | |
| Leisure & Toys – 0.5% | | | | | | | | |
| Sankyo Co. Ltd. | | | 33,800 | | | $ | 1,908,770 | |
| | | | | | | | |
| Machinery & Tools – 3.4% | | | | | | | | |
| ASSA ABLOY AB, “B” | | | 136,238 | | | $ | 3,838,603 | |
| Glory Ltd. | | | 91,600 | | | | 2,256,436 | |
| Neopost S.A. (l) | | | 55,159 | | | | 4,805,825 | |
| Schindler Holding AG | | | 20,815 | | | | 2,462,181 | |
| | | | | | | | |
| | | | | | $ | 13,363,045 | |
| | | | | | | | |
| Major Banks – 4.2% | | | | | | | | |
| HSBC Holdings PLC | | | 825,480 | | | $ | 8,379,691 | |
| Julius Baer Group Ltd. | | | 45,761 | | | | 2,143,670 | |
| Sumitomo Mitsui Financial Group, Inc. | | | 126,100 | | | | 4,491,701 | |
| UniCredito Italiano S.p.A. | | | 672,262 | | | | 1,390,636 | |
| | | | | | | | |
| | | | | | $ | 16,405,698 | |
| | | | | | | | |
8
MFS International Value Portfolio
Portfolio of Investments – continued
| | | | | | | | |
| Issuer | | Shares/Par | | | Value ($) | |
| | | | | | | | |
| COMMON STOCKS – continued | |
| Medical & Health Technology & Services – 2.3% | | | | | |
| Kobayashi Pharmaceutical Co. Ltd. | | | 65,700 | | | $ | 3,047,514 | |
| Miraca Holdings, Inc. | | | 106,200 | | | | 4,277,300 | |
| Rhoen-Klinikum AG | | | 73,344 | | | | 1,614,218 | |
| | | | | | | | |
| | | | | | $ | 8,939,032 | |
| | | | | | | | |
| Medical Equipment – 1.8% | | | | | | | | |
| Smith & Nephew PLC | | | 379,158 | | | $ | 3,999,096 | |
| Synthes, Inc. | | | 23,629 | | | | 3,191,810 | |
| | | | | | | | |
| | | | | | $ | 7,190,906 | |
| | | | | | | | |
| Network & Telecom – 1.7% | | | | | | | | |
| Ericsson, Inc., “B” | | | 356,539 | | | $ | 4,142,874 | |
| Nokia Oyj | | | 237,395 | | | | 2,455,367 | |
| | | | | | | | |
| | | | | | $ | 6,598,241 | |
| | | | | | | | |
| Other Banks & Diversified Financials – 3.0% | | | | | |
| Anglo Irish Bank Corp. PLC (a) | | | 249,800 | | | $ | 0 | |
| Chiba Bank Ltd. | | | 224,000 | | | | 1,456,731 | |
| DnB NOR A.S.A. | | | 251,274 | | | | 3,526,849 | |
| Hachijuni Bank Ltd. | | | 226,000 | | | | 1,263,752 | |
| Joyo Bank Ltd. | | | 306,000 | | | | 1,345,511 | |
| Jyske Bank A.S. (a) | | | 16,783 | | | | 779,268 | |
| Sapporo Hokuyo Holdings, Inc. | | | 251,100 | | | | 1,175,243 | |
| Sydbank A.S. (a) | | | 30,501 | | | | 827,314 | |
| Unione di Banche Italiane ScpA | | | 143,859 | | | | 1,259,164 | |
| | | | | | | | |
| | | | | | $ | 11,633,832 | |
| | | | | | | | |
| Pharmaceuticals – 10.9% | | | | | | | | |
| Bayer AG | | | 89,214 | | | $ | 6,592,681 | |
| GlaxoSmithKline PLC | | | 539,763 | | | | 10,435,146 | |
| Hisamitsu Pharmaceutical Co., Inc. | | | 51,200 | | | | 2,156,719 | |
| Roche Holding AG | | | 71,969 | | | | 10,545,190 | |
| Sanofi-Aventis | | | 162,634 | | | | 10,399,135 | |
| Santen, Inc. | | | 82,900 | | | | 2,879,394 | |
| | | | | | | | |
| | | | | | $ | 43,008,265 | |
| | | | | | | | |
| Printing & Publishing – 0.4% | | | | | | | | |
| United Business Media Ltd. | | | 137,438 | | | $ | 1,478,528 | |
| | | | | | | | |
| Real Estate – 0.9% | | | | | | | | |
| Deutsche Wohnen AG (a) | | | 252,437 | | | $ | 3,541,981 | |
| | | | | | | | |
| Specialty Chemicals – 1.7% | | | | | | | | |
| Shin-Etsu Chemical Co. Ltd. | | | 73,300 | | | $ | 3,972,410 | |
| Symrise AG | | | 92,898 | | | | 2,547,965 | |
| | | | | | | | |
| | | | | | $ | 6,520,375 | |
| | | | | | | | |
| Specialty Stores – 0.6% | | | | | | | | |
| Esprit Holdings Ltd. | | | 490,372 | | | $ | 2,334,264 | |
| | | | | | | | |
| Telecommunications – Wireless – 5.3% | | | | | |
| KDDI Corp. | | | 1,780 | | | $ | 10,282,301 | |
| Vodafone Group PLC | | | 4,171,244 | | | | 10,782,609 | |
| | | | | | | | |
| | | | | | $ | 21,064,910 | |
| | | | | | | | |
| | | | | | | | |
| Issuer | | Shares/Par | | | Value ($) | |
| | | | | | | | |
| COMMON STOCKS – continued | |
| Telephone Services – 2.4% | |
| China Unicom Ltd. | | | 1,044,000 | | | $ | 1,493,578 | |
| Royal KPN N.V. | | | 440,783 | | | | 6,432,080 | |
| Telecom Italia S.p.A. | | | 1,554,309 | | | | 1,686,543 | |
| | | | | | | | |
| | | | | | $ | 9,612,201 | |
| | | | | | | | |
| Tobacco – 4.1% | | | | | | | | |
| British American Tobacco PLC | | | 230,556 | | | $ | 8,855,289 | |
| Japan Tobacco, Inc. | | | 1,525 | | | | 5,644,322 | |
| Swedish Match AB | | | 53,821 | | | | 1,558,057 | |
| | | | | | | | |
| | | | | | $ | 16,057,668 | |
| | | | | | | | |
| Trucking – 2.3% | | | | | | | | |
| TNT N.V. | | | 136,639 | | | $ | 3,606,166 | |
| Yamato Holdings Co. Ltd. | | | 370,000 | | | | 5,268,136 | |
| | | | | | | | |
| | | | | | $ | 8,874,302 | |
| | | | | | | | |
| Utilities – Electric Power – 0.9% | |
| E.ON AG | | | 122,488 | | | $ | 3,754,017 | |
| | | | | | | | |
Total Common Stocks
(Identified Cost, $369,994,825) | | | | | | $ | 376,390,637 | |
| | | | | | | | |
| Issuer/Expiration Date/Strike Price | | Par Amount of
Contracts | | | | |
| |
| CALL OPTIONS PURCHASED – 0.1% | | | | | |
| EUR Currency – August 2011 @ JPY 120 (Premiums Paid, $398,060) | | EUR | 11,438,785 | | | $ | 186,292 | |
| | | | | | | | |
| |
| PUT OPTIONS PURCHASED – 0.0% | | | | | |
| JPY Currency – August 2011 @ $0.0108 (Premiums Paid, $244,716) | | JPY | 1,372,654,146 | | | $ | 78,241 | |
| | | | | | | | |
| Issuer | | Shares/Par | | | | |
| |
| MONEY MARKET FUNDS (v) – 4.8% | | | | | |
| MFS Institutional Money Market Portfolio, 0.18%, at Cost and Net Asset Value | | | 18,785,164 | | | $ | 18,785,164 | |
| | | | | | | | |
| |
| COLLATERAL FOR SECURITIES LOANED – 0.9% | | | | | |
| Navigator Securities Lending Prime Portfolio, at Cost and Net Asset Value | | | 3,710,187 | | | $ | 3,710,187 | |
| | | | | | | | |
Total Investments
(Identified Cost, $393,132,952) | | | | | | $ | 399,150,521 | |
| | | | | | | | |
OTHER ASSETS, LESS
LIABILITIES – (1.4)% | | | | | | | (5,592,530 | ) |
| | | | | | | | |
| Net Assets – 100.0% | | | | | | $ | 393,557,991 | |
| | | | | | | | |
9
MFS International Value Portfolio
Portfolio of Investments – continued
| (a) | | Non-income producing security. |
| (l) | | All or a portion of this security is on loan. |
| (v) | | Underlying fund that is available only to investment companies managed by MFS. The rate quoted is the annualized seven-day yield of the fund at period end. |
The following abbreviations are used in this report and are defined:
| ADR | | American Depository Receipt |
| IPS | | International Preference Stock |
| PLC | | Public Limited Company |
Abbreviations indicate amounts shown in currencies other than the U.S. dollar. All amounts are stated in U.S. dollars unless otherwise indicated. A list of abbreviations is shown below:
See Notes to Financial Statements
10
MFS International Value Portfolio
FINANCIAL STATEMENTS | STATEMENT OF ASSETS AND LIABILITIES
This statement represents your fund’s balance sheet, which details the assets and liabilities comprising the total value of the fund.
| | | | | | | | |
At 12/31/10 | | | | | | | | |
Assets | | | | | | | | |
Investments – | | | | | | | | |
Non-affiliated issuers, at value (identified cost, $374,347,788) | | | $380,365,357 | | | | | |
Underlying funds, at cost and value | | | 18,785,164 | | | | | |
Total investments, at value, including $3,517,482 of securities on loan (identified cost, $393,132,952) | | | $399,150,521 | | | | | |
Foreign currency, at value (identified cost, $86,940) | | | 86,992 | | | | | |
Receivables for | | | | | | | | |
Fund shares sold | | | 776,809 | | | | | |
Interest and dividends | | | 734,341 | | | | | |
Other assets | | | 10,896 | | | | | |
Total assets | | | | | | | $400,759,559 | |
Liabilities | | | | | | | | |
Payables for | | | | | | | | |
Investments purchased | | | $3,198,951 | | | | | |
Fund shares reacquired | | | 150,187 | | | | | |
Collateral for securities loaned, at value | | | 3,710,187 | | | | | |
Payable to affiliates | | | | | | | | |
Investment adviser | | | 19,374 | | | | | |
Shareholder servicing costs | | | 205 | | | | | |
Distribution and/or service fees | | | 4,445 | | | | | |
Administrative services fee | | | 760 | | | | | |
Payable for Trustees’ compensation | | | 64 | | | | | |
Accrued expenses and other liabilities | | | 117,395 | | | | | |
Total liabilities | | | | | | | $7,201,568 | |
Net assets | | | | | | | $393,557,991 | |
Net assets consist of | | | | | | | | |
Paid-in capital | | | $410,338,263 | | | | | |
Unrealized appreciation (depreciation) on investments and translation of assets and liabilities in foreign currencies | | | 6,038,767 | | | | | |
Accumulated net realized gain (loss) on investments and foreign currency transactions | | | (27,542,085 | ) | | | | |
Undistributed net investment income | | | 4,723,046 | | | | | |
Net assets | | | | | | | $393,557,991 | |
Shares of beneficial interest outstanding | | | | | | | 25,455,335 | |
| | | | | | | | | | | | |
| | | Net assets | | | Shares
outstanding | | | Net asset value
per share | |
Initial Class | | | $68,356,398 | | | | 4,384,674 | | | | $15.59 | |
Service Class | | | 325,201,593 | | | | 21,070,661 | | | | 15.43 | |
See Notes to Financial Statements
11
MFS International Value Portfolio
FINANCIAL STATEMENTS | STATEMENT OF OPERATIONS
This statement describes how much your fund earned in investment income and accrued in expenses. It also describes any gains and/or losses generated by fund operations.
| | | | | | | | |
| Year ended 12/31/10 | | | | | | | | |
| Net investment income | | | | | | | | |
Income | | | | | | | | |
Dividends | | | $9,506,849 | | | | | |
Interest | | | 194,562 | | | | | |
Dividends from underlying funds | | | 27,797 | | | | | |
Foreign taxes withheld | | | (867,287 | ) | | | | |
Total investment income | | | | | | | $8,861,921 | |
Expenses | | | | | | | | |
Management fee | | | $2,887,553 | | | | | |
Distribution and/or service fees | | | 641,013 | | | | | |
Shareholder servicing costs | | | 36,950 | | | | | |
Administrative services fee | | | 113,542 | | | | | |
Trustees’ compensation | | | 36,178 | | | | | |
Custodian fee | | | 195,702 | | | | | |
Shareholder communications | | | 22,396 | | | | | |
Auditing fees | | | 59,822 | | | | | |
Legal fees | | | 7,233 | | | | | |
Miscellaneous | | | 32,558 | | | | | |
Total expenses | | | | | | | $4,032,947 | |
Fees paid indirectly | | | (13 | ) | | | | |
Net expenses | | | | | | | $4,032,934 | |
Net investment income | | | | | | | $4,828,987 | |
Realized and unrealized gain (loss) on investments and foreign currency transactions | | | | | | | | |
Realized gain (loss) (identified cost basis) | | | | | | | | |
Investment transactions (net of $105,811 country tax) | | | $(801,875 | ) | | | | |
Foreign currency transactions | | | 19,635 | | | | | |
Net realized gain (loss) on investments and foreign currency transactions | | | | | | | $(782,240 | ) |
Change in unrealized appreciation (depreciation) | | | | | | | | |
Investments (net of $73,910 decrease in deferred country tax) | | | $28,225,867 | | | | | |
Translation of assets and liabilities in foreign currencies | | | 14,022 | | | | | |
Net unrealized gain (loss) on investments and foreign currency translation | | | | | | | $28,239,889 | |
Net realized and unrealized gain (loss) on investments and foreign currency | | | | | | | $27,457,649 | |
Change in net assets from operations | | | | | | | $32,286,636 | |
See Notes to Financial Statements
12
MFS International Value Portfolio
FINANCIAL STATEMENTS | STATEMENTS OF CHANGES IN NET ASSETS
These statements describe the increases and/or decreases in net assets resulting from operations, any distributions, and any shareholder transactions.
| | | | | | | | |
For years ended 12/31 | | | 2010 | | | | 2009 | |
Change in net assets | | | | | | | | |
From operations | | | | | | | | |
Net investment income | | | $4,828,987 | | | | $4,427,279 | |
Net realized gain (loss) on investments and foreign currency transactions | | | (782,240 | ) | | | (16,898,012 | ) |
Net unrealized gain (loss) on investments and foreign currency translation | | | 28,239,889 | | | | 69,725,072 | |
Change in net assets from operations | | | $32,286,636 | | | | $57,254,339 | |
Distributions declared to shareholders | | | | | | | | |
From net investment income | | | $(4,425,164 | ) | | | $(7,654,372 | ) |
Change in net assets from fund share transactions | | | $95,712,274 | | | | $(16,651,005 | ) |
Total change in net assets | | | $123,573,746 | | | | $32,948,962 | |
| Net assets | | | | | | | | |
At beginning of period | | | 269,984,245 | | | | 237,035,283 | |
At end of period (including undistributed net investment income of $4,723,046 and
$4,405,399, respectively) | | | $393,557,991 | | | | $269,984,245 | |
See Notes to Financial Statements
13
MFS International Value Portfolio
FINANCIAL STATEMENTS | FINANCIAL HIGHLIGHTS
The financial highlights table is intended to help you understand the fund’s financial performance for the past 5 years. Certain information reflects financial results for a single fund share. The total returns in the table represent the rate by which an investor would have earned (or lost) on an investment in the fund share class (assuming reinvestment of all distributions) held for the entire period.
| | | | | | | | | | | | | | | | | | | | |
| Initial Class | | Years ended 12/31 | |
| | | 2010 | | | 2009 | | | 2008 | | | 2007 | | | 2006 | |
Net asset value, beginning of period | | | $14.51 | | | | $12.03 | | | | $18.68 | | | | $20.02 | | | | $17.39 | |
| Income (loss) from investment operations | | | | | | | | | | | | | | | | | | | | |
Net investment income (d) | | | $0.26 | | | | $0.25 | | | | $0.44 | | | | $0.33 | | | | $0.39 | |
Net realized and unrealized gain (loss) on investments
and foreign currency | | | 1.05 | | | | 2.64 | | | | (5.94 | ) | | | 1.13 | | | | 4.54 | |
Total from investment operations | | | $1.31 | | | | $2.89 | | | | $(5.50 | ) | | | $1.46 | | | | $4.93 | |
| Less distributions declared to shareholders | | | | | | | | | | | | | | | | | | | | |
From net investment income | | | $(0.23 | ) | | | $(0.41 | ) | | | $(0.16 | ) | | | $(0.33 | ) | | | $(0.24 | ) |
From net realized gain on investments | | | — | | | | — | | | | (0.99 | ) | | | (2.47 | ) | | | (2.06 | ) |
Total distributions declared to shareholders | | | $(0.23 | ) | | | $(0.41 | ) | | | $(1.15 | ) | | | $(2.80 | ) | | | $(2.30 | ) |
Net asset value, end of period | | | $15.59 | | | | $14.51 | | | | $12.03 | | | | $18.68 | | | | $20.02 | |
Total return (%) (k)(s) | | | 9.11 | | | | 25.37 | | | | (31.41 | ) | | | 7.35 | | | | 29.23 | |
Ratios (%) (to average net assets)
and Supplemental data: | | | | | | | | | | | | | | | | | | | | |
Expenses (f) | | | 1.06 | | | | 1.09 | | | | 1.05 | | | | 1.05 | | | | 1.11 | |
Net investment income | | | 1.79 | | | | 2.00 | | | | 2.82 | | | | 1.67 | | | | 2.09 | |
Portfolio turnover | | | 28 | | | | 49 | | | | 44 | | | | 44 | | | | 55 | |
Net assets at end of period (000 omitted) | | | $68,356 | | | | $63,978 | | | | $57,968 | | | | $117,100 | | | | $134,008 | |
| |
| Service Class | | Years ended 12/31 | |
| | | 2010 | | | 2009 | | | 2008 | | | 2007 | | | 2006 | |
Net asset value, beginning of period | | | $14.38 | | | | $11.91 | | | | $18.53 | | | | $19.92 | | | | $17.32 | |
| Income (loss) from investment operations | | | | | | | | | | | | | | | | | | | | |
Net investment income (d) | | | $0.20 | | | | $0.23 | | | | $0.39 | | | | $0.16 | | | | $0.34 | |
Net realized and unrealized gain (loss) on investments
and foreign currency | | | 1.05 | | | | 2.62 | | | | (5.87 | ) | | | 1.24 | | | | 4.53 | |
Total from investment operations | | | $1.25 | | | | $2.85 | | | | $(5.48 | ) | | | $1.40 | | | | $4.87 | |
| Less distributions declared to shareholders | | | | | | | | | | | | | | | | | | | | |
From net investment income | | | $(0.20 | ) | | | $(0.38 | ) | | | $(0.15 | ) | | | $(0.32 | ) | | | $(0.21 | ) |
From net realized gain on investments | | | — | | | | — | | | | (0.99 | ) | | | (2.47 | ) | | | (2.06 | ) |
Total distributions declared to shareholders | | | $(0.20 | ) | | | $(0.38 | ) | | | $(1.14 | ) | | | $(2.79 | ) | | | $(2.27 | ) |
Net asset value, end of period | | | $15.43 | | | | $14.38 | | | | $11.91 | | | | $18.53 | | | | $19.92 | |
Total return (%) (k)(s) | | | 8.78 | | | | 25.11 | | | | (31.58 | ) | | | 7.04 | | | | 28.95 | |
Ratios (%) (to average net assets)
and Supplemental data: | | | | | | | | | | | | | | | | | | | | |
Expenses (f) | | | 1.31 | | | | 1.34 | | | | 1.30 | | | | 1.30 | | | | 1.36 | |
Net investment income | | | 1.43 | | | | 1.83 | | | | 2.52 | | | | 0.87 | | | | 1.84 | |
Portfolio turnover | | | 28 | | | | 49 | | | | 44 | | | | 44 | | | | 55 | |
Net assets at end of period (000 omitted) | | | $325,202 | | | | $206,006 | | | | $179,067 | | | | $224,339 | | | | $14,973 | |
| (d) | Per share data is based on average shares outstanding. |
| (f) | Ratios do not reflect reductions from fees paid indirectly, if applicable. |
| (k) | The total return does not reflect expenses that apply to separate accounts. Inclusion of these charges would reduce the total return figures for all periods shown. |
| (s) | From time to time the fund may receive proceeds from litigation settlements, without which performance would be lower. |
See Notes to Financial Statements
14
MFS International Value Portfolio
NOTES TO FINANCIAL STATEMENTS
| (1) | | Business and Organization |
MFS International Value Portfolio (the fund) is a series of MFS Variable Insurance Trust II (the trust). The trust is organized as a Massachusetts business trust and is registered under the Investment Company Act of 1940, as amended, as an open-end management investment company. The shareholders of each series of the trust are separate accounts of insurance companies, which offer variable annuity and/or life insurance products, and qualified retirement and pension plans.
| (2) | | Significant Accounting Policies |
General – The preparation of financial statements in conformity with U.S. generally accepted accounting principles requires management to make estimates and assumptions that affect the reported amounts of assets and liabilities, and disclosure of contingent assets and liabilities at the date of the financial statements and the reported amounts of revenues and expenses during the reporting period. Actual results could differ from those estimates. In the preparation of these financial statements, management has evaluated subsequent events occurring after the date of the fund’s Statement of Assets and Liabilities through the date that the financial statements were issued. The fund invests in foreign securities, including securities of emerging market issuers. Investments in foreign securities are vulnerable to the effects of changes in the relative values of the local currency and the U.S. dollar and to the effects of changes in each country’s legal, political, and economic environment. The markets of emerging markets countries are generally more volatile than the markets of developed countries with more mature economies. All of the risks of investing in foreign securities previously described are heightened when investing in emerging markets countries.
Investment Valuations – Equity securities, including restricted equity securities, are generally valued at the last sale or official closing price as provided by a third-party pricing service on the market or exchange on which they are primarily traded. Equity securities, for which there were no sales reported that day, are generally valued at the last quoted daily bid quotation as provided by a third-party pricing service on the market or exchange on which such securities are primarily traded. Equity securities held short, for which there were no sales reported for that day, are generally valued at the last quoted daily ask quotation as provided by a third-party pricing service on the market or exchange on which such securities are primarily traded. Short-term instruments with a maturity at issuance of 60 days or less generally are valued at amortized cost, which approximates market value. Exchange-traded options are generally valued at the last sale or official closing price as provided by a third-party pricing service on the exchange on which such options are primarily traded. Exchange-traded options for which there were no sales reported that day are generally valued at the last daily bid quotation as provided by a third-party pricing service on the exchange on which such options are primarily traded. Options not traded on an exchange are generally valued at a broker/dealer bid quotation. Foreign currency options are generally valued at valuations provided by a third-party pricing service. Open-end investment companies are generally valued at net asset value per share. Securities and other assets generally valued on the basis of information from a third-party pricing service may also be valued at a broker/dealer bid quotation. Values obtained from third-party pricing services can utilize both transaction data and market information such as yield, quality, coupon rate, maturity, type of issue, trading characteristics, and other market data. The values of foreign securities and other assets and liabilities expressed in foreign currencies are converted to U.S. dollars using the mean of bid and asked prices for rates provided by a third-party pricing service.
The Board of Trustees has delegated primary responsibility for determining or causing to be determined the value of the fund’s investments (including any fair valuation) to the adviser pursuant to valuation policies and procedures approved by the Board. If the adviser determines that reliable market quotations are not readily available, investments are valued at fair value as determined in good faith by the adviser in accordance with such procedures under the oversight of the Board of Trustees. Under the fund’s valuation policies and procedures, market quotations are not considered to be readily available for most types of debt instruments and floating rate loans and many types of derivatives. These investments are generally valued at fair value based on information from third-party pricing services. In addition, investments may be valued at fair value if the adviser determines that an investment’s value has been materially effected by events occurring after the close of the exchange or market on which the investment is principally traded (such as foreign exchange or market) and prior to the determination of the fund’s net asset value, or after the halting of trading of a specific security where trading does not resume prior to the close of the exchange or market on which the security is principally traded. Events that occur on a frequent basis after foreign markets close (such as developments in foreign markets and significant movements in the U.S. markets) and prior to the determination of the fund’s net asset value may be deemed to have a material effect on the value of securities traded in foreign markets. Accordingly, the fund’s foreign equity securities may often be valued at fair value. The adviser generally relies on third-party pricing services or other information (such as the correlation with price movements of similar securities in the same or other markets; the type, cost and investment characteristics of the security; the business and financial condition of the issuer; and trading and other market data) to assist in determining whether to fair value and at what value to fair value an investment. The value of an investment for purposes of calculating the fund’s net asset value can differ depending on the
15
MFS International Value Portfolio
Notes to Financial Statements – continued
source and method used to determine value. When fair valuation is used, the value of an investment used to determine the fund’s net asset value may differ from quoted or published prices for the same investment. There can be no assurance that the fund could obtain the fair value assigned to an investment if it were to sell the investment at the same time at which the fund determines its net asset value per share.
Various inputs are used in determining the value of the fund’s assets or liabilities. These inputs are categorized into three broad levels. In certain cases, the inputs used to measure fair value may fall into different levels of the fair value hierarchy. In such cases, an investment’s level within the fair value hierarchy is based on the lowest level of input that is significant to the fair value measurement. The fund’s assessment of the significance of a particular input to the fair value measurement in its entirety requires judgment, and considers factors specific to the investment. Level 1 includes unadjusted quoted prices in active markets for identical assets or liabilities. Level 2 includes other significant observable market-based inputs (including quoted prices for similar securities, interest rates, prepayment speed, and credit risk). Level 3 includes unobservable inputs, which may include the adviser’s own assumptions in determining the fair value of investments. The following is a summary of the levels used as of December 31, 2010 in valuing the fund’s assets or liabilities:
| | | | | | | | | | | | | | | | |
| Investments at Value | | Level 1 | | | Level 2 | | | Level 3 | | | Total | |
| Equity Securities: | | | | | | | | | | | | | | | | |
United Kingdom | | | $96,281,160 | | | | $— | | | | $— | | | | $96,281,160 | |
Japan | | | 87,837,483 | | | | 7,134,524 | | | | — | | | | 94,972,007 | |
Switzerland | | | 49,760,419 | | | | — | | | | — | | | | 49,760,419 | |
France | | | 31,259,329 | | | | — | | | | — | | | | 31,259,329 | |
Germany | | | 28,338,591 | | | | — | | | | — | | | | 28,338,591 | |
Netherlands | | | 25,676,800 | | | | — | | | | — | | | | 25,676,800 | |
Taiwan | | | 11,052,540 | | | | — | | | | — | | | | 11,052,540 | |
Sweden | | | 9,539,535 | | | | — | | | | — | | | | 9,539,535 | |
South Korea | | | 4,809,805 | | | | — | | | | — | | | | 4,809,805 | |
Other Countries | | | 24,700,451 | | | | — | | | | 0 | | | | 24,700,451 | |
| Purchased Currency Options | | | — | | | | 264,533 | | | | — | | | | 264,533 | |
| Mutual Funds | | | 22,495,351 | | | | — | | | | — | | | | 22,495,351 | |
| Total Investments | | | $391,751,464 | | | | $7,399,057 | | | | $0 | | | | $399,150,521 | |
For further information regarding security characteristics, see the Portfolio of Investments. At December 31, 2010, the fund held one level 3 security valued at $0, which was also held and valued at $0 at December 31, 2009.
Of the level 1 investments presented above, equity investments amounting to $224,672,967 were considered level 2 investments at the beginning of the period. The primary reason for changes in the classifications between levels 1 and 2 occurs when foreign equity securities are fair valued using other observable market-based inputs in place of the closing exchange price due to events occurring after the close of the exchange or market on which the investment is principally traded. The fund’s foreign equity securities may often be valued at fair value.
Foreign Currency Translation – Purchases and sales of foreign investments, income, and expenses are converted into U.S. dollars based upon currency exchange rates prevailing on the respective dates of such transactions or on the reporting date for foreign denominated receivables and payables. Gains and losses attributable to foreign currency exchange rates on sales of securities are recorded for financial statement purposes as net realized gains and losses on investments. Gains and losses attributable to foreign exchange rate movements on receivables, payables, income and expenses are recorded for financial statement purposes as foreign currency transaction gains and losses. That portion of both realized and unrealized gains and losses on investments that results from fluctuations in foreign currency exchange rates is not separately disclosed.
Derivatives – The fund uses derivatives for different purposes, including to earn income and enhance returns, to increase or decrease exposure to a particular market, to manage or adjust the risk profile of the fund, or as alternatives to direct investments. Derivatives are used for hedging or non-hedging purposes. While hedging can reduce or eliminate losses, it can also reduce or eliminate gains. When the fund uses derivatives as an investment to increase market exposure, or for hedging purposes, gains and losses from derivative instruments may be substantially greater than the derivative’s original cost.
Derivative instruments used by the fund during the period include purchased options. The fund’s period end derivatives, as presented in the Portfolio of Investments and the associated Derivative Contract Tables, generally are indicative of the volume of its derivative activity during the period.
16
MFS International Value Portfolio
Notes to Financial Statements – continued
The following table presents, by major type of derivative contract, the fair value, on a gross basis, of the asset and liability components of derivatives held by the fund at December 31, 2010 as reported in the Statement of Assets and Liabilities:
| | | | | | |
| | | | | Fair Value (a) | |
| Risk | | Derivative | | Asset Derivatives | |
| Foreign Exchange Contracts | | Purchased Currency Options | | | $264,533 | |
| (a) | The value of purchased options outstanding is included in total investments, at value, within the fund’s Statement of Assets and Liabilities. |
The following table presents, by major type of derivative contract, the realized gain (loss) on derivatives held by the fund for the year ended December 31, 2010 as reported in the Statement of Operations:
| | | | |
| Risk | | Investment Transactions (Purchased Options) | |
| Foreign Exchange Contracts | | | $(525,344 | ) |
The following table presents, by major type of derivative contract, the change in unrealized appreciation (depreciation) on derivatives held by the fund for the year ended December 31, 2010 as reported in the Statement of Operations:
| | | | |
| Risk | | Investments (Purchased Options) | |
| Foreign Exchange Contracts | | | $(505,478 | ) |
Derivative counterparty credit risk is managed through formal evaluation of the creditworthiness of all potential counterparties. On certain over-the-counter derivatives, the fund attempts to reduce its exposure to counterparty credit risk whenever possible by entering into an International Swaps and Derivatives Association (ISDA) Master Agreement on a bilateral basis with each of the counterparties with whom it undertakes a significant volume of transactions. The ISDA Master Agreement gives each party to the agreement the right to terminate all transactions traded under such agreement if there is a certain deterioration in the credit quality of the other party. The ISDA Master Agreement gives the fund the right, upon an event of default by the applicable counterparty or a termination of the agreement, to close out all transactions traded under such agreement and to net amounts owed under each transaction to one net amount payable by one party to the other. This right to close out and net payments across all transactions traded under the ISDA Master Agreement could result in a reduction of the fund’s credit risk to such counterparty equal to any amounts payable by the fund under the applicable transactions, if any. However, absent an event of default by the counterparty or a termination of the agreement, the ISDA Master Agreement does not result in an offset of reported amounts of assets and liabilities in the Statement of Assets and Liabilities across transactions between the fund and the applicable counterparty.
Collateral requirements differ by type of derivative. Collateral or margin requirements are set by the broker or exchange clearing house for exchange traded derivatives (i.e., futures and exchange-traded options) while collateral terms are contract specific for over-the-counter traded derivatives (i.e., forwards, swaps and over-the-counter options). For derivatives traded under an ISDA Master Agreement, the collateral requirements are netted across all transactions traded under such agreement and one amount is posted from one party to the other to collateralize such obligations. Cash collateral that has been pledged to cover obligations of the fund under derivative contracts, if any, will be reported separately on the Statement of Assets and Liabilities as restricted cash. Securities collateral pledged for the same purpose, if any, is noted in the Portfolio of Investments.
Purchased Options – The fund purchased call and put options for a premium. Purchased call and put options entitle the holder to buy and sell a specified number of shares or units of a particular security, currency or index at a specified price at a specified date or within a specified period of time. Purchasing call options may be used to hedge against an anticipated increase in the dollar cost of securities or currency to be acquired or to increase the fund’s exposure to an underlying instrument. Purchasing put options may hedge against a decline in the value of portfolio securities or currency.
The premium paid is initially recorded as an investment in the Statement of Assets and Liabilities. That investment is subsequently marked-to-market daily with the difference between the premium paid and the market value of the purchased option being recorded as unrealized appreciation or depreciation. Premiums paid for purchased call and put options which have expired are treated as realized losses on investments in the Statement of Operations. Upon the exercise or closing of a purchased call option, the premium paid is added to the cost of the security or financial instrument. Upon the exercise or closing of a purchased put option, the premium paid is offset against the proceeds on the sale of the underlying security or financial instrument in order to determine the realized gain or loss on investments.
17
MFS International Value Portfolio
Notes to Financial Statements – continued
The risk in purchasing an option is that the fund pays a premium whether or not the option is exercised. The fund’s maximum risk of loss due to counterparty credit risk is limited to the market value of the option. For over-the-counter options, this risk is mitigated in cases where there is an ISDA Master Agreement between the fund and the counterparty providing for netting as described above and for posting of collateral by the counterparty to the fund to cover the fund’s exposure to the counterparty under such ISDA Master Agreement.
Security Loans – State Street Bank and Trust Company (“State Street”), as lending agent, loans the securities of the fund to certain qualified institutions (the “Borrowers”) approved by the fund. The loans are collateralized by cash and/or U.S. Treasury and federal agency obligations in an amount typically at least equal to the market value of the securities loaned. The market value of the loaned securities is determined at the close of business of the fund and any additional required collateral is delivered to the fund on the next business day. State Street provides the fund with indemnification against Borrower default. The fund bears the risk of loss with respect to the investment of cash collateral. On loans collateralized by cash, the cash collateral is invested in a money market fund or short-term securities. A portion of the income generated upon investment of the collateral is remitted to the Borrowers, and the remainder is allocated between the fund and the lending agent. On loans collateralized by U.S. Treasury and/or federal agency obligations, a fee is received from the Borrower, and is allocated between the fund and the lending agent. Income from securities lending is included in interest income on the Statement of Operations. The dividend and interest income earned on the securities loaned is accounted for in the same manner as other dividend and interest income.
Indemnifications – Under the fund’s organizational documents, its officers and Trustees may be indemnified against certain liabilities and expenses arising out of the performance of their duties to the fund. Additionally, in the normal course of business, the fund enters into agreements with service providers that may contain indemnification clauses. The fund’s maximum exposure under these agreements is unknown as this would involve future claims that may be made against the fund that have not yet occurred.
Investment Transactions and Income – Investment transactions are recorded on the trade date. Interest income is recorded on the accrual basis. Dividends received in cash are recorded on the ex-dividend date. Certain dividends from foreign securities will be recorded when the fund is informed of the dividend if such information is obtained subsequent to the ex-dividend date. Dividend and interest payments received in additional securities are recorded on the ex-dividend or ex-interest date in an amount equal to the value of the security on such date.
The fund may receive proceeds from litigation settlements. Any proceeds received from litigation involving portfolio holdings are reflected in the Statement of Operations in realized gain/loss if the security has been disposed of by the fund or in unrealized gain/loss if the security is still held by the fund. Any other proceeds from litigation not related to portfolio holdings are reflected as other income in the Statement of Operations.
Fees Paid Indirectly – The fund’s custody fee may be reduced according to an arrangement that measures the value of cash deposited with the custodian by the fund. This amount, for the year ended December 31, 2010, is shown as a reduction of total expenses on the Statement of Operations.
Tax Matters and Distributions – The fund intends to qualify as a regulated investment company, as defined under Subchapter M of the Internal Revenue Code, and to distribute all of its taxable income, including realized capital gains. As a result, no provision for federal income tax is required. The fund’s federal tax returns for the prior three fiscal years remain subject to examination by the Internal Revenue Service. Foreign taxes, if any, have been accrued by the fund in the accompanying financial statements.
Distributions to shareholders are recorded on the ex-dividend date. Income and capital gain distributions are determined in accordance with income tax regulations, which may differ from U.S. generally accepted accounting principles. Certain capital accounts in the financial statements are periodically adjusted for permanent differences in order to reflect their tax character. These adjustments have no impact on net assets or net asset value per share. Temporary differences which arise from recognizing certain items of income, expense, gain or loss in different periods for financial statement and tax purposes will reverse at some time in the future. Distributions in excess of net investment income or net realized gains are temporary overdistributions for financial statement purposes resulting from differences in the recognition or classification of income or distributions for financial statement and tax purposes.
Book/tax differences primarily relate to wash sale loss deferrals.
The tax character of distributions declared to shareholders for the last two fiscal years is as follows:
| | | | | | | | |
| | | 12/31/10 | | | 12/31/09 | |
| Ordinary income (including any short-term capital gains) | | | $4,425,164 | | | | $7,654,372 | |
18
MFS International Value Portfolio
Notes to Financial Statements – continued
The federal tax cost and the tax basis components of distributable earnings were as follows:
| | | | |
| As of 12/31/10 | | | | |
| Cost of investments | | | $393,915,999 | |
| Gross appreciation | | | 35,597,092 | |
| Gross depreciation | | | (30,362,570 | ) |
| Net unrealized appreciation (depreciation) | | | $5,234,522 | |
| Undistributed ordinary income | | | 4,741,489 | |
| Capital loss carryforwards | | | (26,759,038 | ) |
| Other temporary differences | | | 2,755 | |
As of December 31, 2010, the fund had capital loss carryforwards available to offset future realized gains. Such losses expire as follows:
| | | | |
| 12/31/16 | | $ | (7,444,841 | ) |
| 12/31/17 | | | (18,221,256 | ) |
| 12/31/18 | | | (1,092,941 | ) |
| Total | | $ | (26,759,038 | ) |
Multiple Classes of Shares of Beneficial Interest – The fund offers multiple classes of shares, which differ in their respective distribution and/or service fees. The fund’s income, realized and unrealized gain (loss), and common expenses are allocated to shareholders based on the daily net assets of each class. Dividends are declared separately for each class. Differences in per share dividend rates are generally due to differences in separate class expenses. The fund’s distributions declared to shareholders as reported on the Statements of Changes in Net Assets are presented by class as follows:
| | | | | | | | |
| | | From net investment
income | |
| | | Year ended
12/31/10 | | | Year ended
12/31/09 | |
| Initial Class | | | $1,040,282 | | | | $1,823,810 | |
| Service Class | | | 3,384,882 | | | | 5,830,562 | |
| Total | | | $4,425,164 | | | | $7,654,372 | |
| (3) | | Transactions with Affiliates |
Investment Adviser – The fund has an investment advisory agreement with MFS to provide overall investment management and related administrative services and facilities to the fund.
The management fee is computed daily and paid monthly at the following annual rates:
| | | | |
| First $1 billion of average daily net assets | | | 0.90% | |
| Next $1 billion of average daily net assets | | | 0.80% | |
| Average daily net assets in excess of $2 billion | | | 0.70% | |
The management fee incurred for the year ended December 31, 2010 was equivalent to an annual effective rate of 0.90% of the fund’s average daily net assets.
Distributor – MFS Fund Distributors, Inc. (MFD), a wholly-owned subsidiary of MFS, is the distributor of shares of the fund. The Trustees have adopted a distribution plan for the Service Class shares pursuant to Rule 12b-1 under the Investment Company Act of 1940.
The fund’s distribution plan provides that the fund will pay MFD distribution and/or service fees equal to 0.25% per annum of its average daily net assets attributable to Service Class shares as partial consideration for services performed and expenses incurred by MFD and financial intermediaries (including participating insurance companies that invest in the fund to fund variable annuity and variable life insurance contracts, sponsors of qualified retirement and pension plans that invest in the fund, and affiliates of these participating insurance companies and plan sponsors) in connection with the sale and distribution of the Service Class shares. MFD may subsequently pay all, or a portion, of the distribution and/or service fees to financial intermediaries.
Shareholder Servicing Agent – MFS Service Center, Inc. (MFSC), a wholly-owned subsidiary of MFS, receives a fee from the fund for its services as shareholder servicing agent. For the year ended December 31, 2010, the fee was $36,917, which equated to 0.0115% annually of the fund’s average daily net assets. MFSC also receives payment from the fund for out-of-pocket expenses paid by MFSC on behalf of the fund. For the year ended December 31, 2010, these costs amounted to $33.
19
MFS International Value Portfolio
Notes to Financial Statements – continued
Administrator – MFS provides certain financial, legal, shareholder communications, compliance, and other administrative services to the fund. Under an administrative services agreement, the fund partially reimburses MFS the costs incurred to provide these services. The fund is charged an annual fixed amount of $10,000 plus a fee based on average daily net assets. The administrative services fee incurred for the year ended December 31, 2010 was equivalent to an annual effective rate of 0.0354% of the fund’s average daily net assets.
Trustees’ and Officers’ Compensation – The fund pays compensation to Trustees in the form of a retainer, attendance fees, and additional compensation to the Board chairperson. The fund does not pay compensation directly to officers of the fund who are also officers of the investment adviser, all of whom receive remuneration for their services to the fund from MFS. Certain officers of the fund are officers or directors of MFS, MFD, and MFSC.
Other – This fund and certain other funds managed by MFS (the funds) have entered into services agreements (the Agreements) which provide for payment of fees by the funds to Tarantino LLC and Griffin Compliance LLC in return for the provision of services of an Independent Chief Compliance Officer (ICCO) and Assistant ICCO, respectively, for the funds. The ICCO and Assistant ICCO are officers of the funds and the sole members of Tarantino LLC and Griffin Compliance LLC, respectively. The funds can terminate the Agreements with Tarantino LLC and Griffin Compliance LLC at any time under the terms of the Agreements. MFS has agreed to bear all expenses associated with office space, other administrative support, and supplies provided to the ICCO and Assistant ICCO. For the year ended December 31, 2010, the aggregate fees paid by the fund to Tarantino LLC and Griffin Compliance LLC were $5,404 and are included in miscellaneous expense on the Statement of Operations.
The fund invests in the MFS Institutional Money Market Portfolio which is managed by MFS and seeks a high level of current income consistent with preservation of capital and liquidity. Income earned on this investment is included in dividends from underlying funds on the Statement of Operations. This money market fund does not pay a management fee to MFS.
Purchases and sales of investments, other than U.S. Government securities, purchased option transactions, and short-term obligations, aggregated $174,312,477 and $84,293,286, respectively.
| (5) | | Shares of Beneficial Interest |
The fund’s Declaration of Trust permits the Trustees to issue an unlimited number of full and fractional shares of beneficial interest. Transactions in fund shares were as follows:
| | | | | | | | | | | | | | | | |
| | | Year ended 12/31/10 | | | Year ended 12/31/09 | |
| | | Shares | | | Amount | | | Shares | | | Amount | |
| Shares sold | | | | | | | | | | | | | | | | |
Initial Class | | | 818,696 | | | | $11,858,777 | | | | 290,600 | | | | $4,072,824 | |
Service Class | | | 9,375,648 | | | | 133,038,501 | | | | 2,568,502 | | | | 29,145,117 | |
| | | 10,194,344 | | | | $144,897,278 | | | | 2,859,102 | | | | $33,217,941 | |
| Shares issued to shareholders in reinvestment of distributions | | | | | | | | | | | | | | | | |
Initial Class | | | 71,448 | | | | $1,040,282 | | | | 173,366 | | | | $1,823,810 | |
Service Class | | | 234,410 | | | | 3,384,882 | | | | 557,948 | | | | 5,830,562 | |
| | | 305,858 | | | | $4,425,164 | | | | 731,314 | | | | $7,654,372 | |
| Shares reacquired | | | | | | | | | | | | | | | | |
Initial Class | | | (914,793 | ) | | | $(13,007,882 | ) | | | (874,433 | ) | | | $(10,178,448 | ) |
Service Class | | | (2,868,953 | ) | | | (40,602,286 | ) | | | (3,832,506 | ) | | | (47,344,870 | ) |
| | | (3,783,746 | ) | | | $(53,610,168 | ) | | | (4,706,939 | ) | | | $(57,523,318 | ) |
| Net change | | | | | | | | | | | | | | | | |
Initial Class | | | (24,649 | ) | | | $(108,823 | ) | | | (410,467 | ) | | | $(4,281,814 | ) |
Service Class | | | 6,741,105 | | | | 95,821,097 | | | | (706,056 | ) | | | (12,369,191 | ) |
| | | 6,716,456 | | | | $95,712,274 | | | | (1,116,523 | ) | | | $(16,651,005 | ) |
The fund and certain other funds managed by MFS participate in a $1.1 billion unsecured committed line of credit, subject to a $1 billion sublimit, provided by a syndication of banks under a credit agreement. Borrowings may be made for temporary financing needs. Interest is charged to each fund, based on its borrowings, generally at a rate equal to the higher of the Federal Reserve funds rate or one month LIBOR plus an agreed upon spread. A commitment fee, based on the average daily, unused portion of the committed line of credit, is allocated among the participating funds at the end of each calendar quarter. In addition, the fund and other funds managed by MFS have established unsecured uncommitted borrowing arrangements with
20
MFS International Value Portfolio
Notes to Financial Statements – continued
certain banks for temporary financing needs. Interest is charged to each fund, based on its borrowings, at a rate equal to the Federal Reserve funds rate plus an agreed upon spread. For the year ended December 31, 2010, the fund’s commitment fee and interest expense were $3,532 and $0, respectively, and are included in miscellaneous expense on the Statement of Operations.
| (7) | | Transactions in Underlying Funds – Affiliated Issuers |
An affiliated issuer may be considered one in which the fund owns 5% or more of the outstanding voting securities, or a company which is under common control. For the purposes of this report, the fund assumes the following to be affiliated issuers:
| | | | | | | | | | | | | | |
| Underlying Funds | | Beginning
Shares/Par
Amount | | Acquisitions
Shares/Par
Amount | | | Dispositions
Shares/Par
Amount | | | Ending
Shares/Par
Amount | |
| MFS Institutional Money Market Portfolio | | 9,462,583 | | | 138,979,883 | | | | (129,657,302 | ) | | | 18,785,164 | |
| | | | |
| Underlying Funds | | Realized
Gain (Loss) | | Capital Gain
Distributions | | | Dividend
Income | | | Ending
Value | |
| MFS Institutional Money Market Portfolio | | $— | | | $— | | | | $27,797 | | | | $18,785,164 | |
21
MFS International Value Portfolio
REPORT OF INDEPENDENT REGISTERED PUBLIC ACCOUNTING FIRM
To the Board of Trustees of MFS Variable Insurance Trust II and the Shareholders of
MFS International Value Portfolio:
We have audited the accompanying statement of assets and liabilities, including the portfolio of investments, of MFS International Value Portfolio (the “Fund”) (one of the portfolios comprising MFS Variable Insurance Trust II) as of December 31, 2010, and the related statement of operations for the year then ended, the statements of changes in net assets for each of the two years in the period then ended, and the financial highlights for each of the five years in the period then ended. These financial statements and financial highlights are the responsibility of the Fund’s management. Our responsibility is to express an opinion on these financial statements and financial highlights based on our audits.
We conducted our audits in accordance with the standards of the Public Company Accounting Oversight Board (United States). Those standards require that we plan and perform the audit to obtain reasonable assurance about whether the financial statements and financial highlights are free of material misstatement. The Fund is not required to have, nor were we engaged to perform, an audit of its internal control over financial reporting. Our audits included consideration of internal control over financial reporting as a basis for designing audit procedures that are appropriate in the circumstances, but not for the purpose of expressing an opinion on the effectiveness of the Fund’s internal control over financial reporting. Accordingly, we express no such opinion. An audit also includes examining, on a test basis, evidence supporting the amounts and disclosures in the financial statements, assessing the accounting principles used and significant estimates made by management, as well as evaluating the overall financial statement presentation. Our procedures included confirmation of securities owned as of December 31, 2010, by correspondence with the custodian and brokers; where replies were not received from brokers, we performed other auditing procedures. We believe that our audits provide a reasonable basis for our opinion.
In our opinion, the financial statements and financial highlights referred to above present fairly, in all material respects, the financial position of MFS International Value Portfolio as of December 31, 2010, the results of its operations for the year then ended, the changes in its net assets for each of the two years in the period then ended, and the financial highlights for each of the five years in the period then ended, in conformity with accounting principles generally accepted in the United States of America.
DELOITTE & TOUCHE LLP
Boston, Massachusetts
February 14, 2011
22
MFS International Value Portfolio
TRUSTEES AND OFFICERS – IDENTIFICATION AND BACKGROUND
The Trustees and officers of the Trust, as of February 1, 2011, are listed below, together with their principal occupations during the past five years. (Their titles may have varied during that period.) The address of each Trustee and officer is 500 Boylston Street, Boston, Massachusetts 02116.
| | | | | | |
Name, Date of Birth | | Position(s) Held
with Fund | | Trustee/Officer
Since (1) | | Principal Occupations During the Past Five Years and
Other Directorships (2) |
| INTERESTED TRUSTEE | | | | |
David D. Horn (3) (born 6/07/41) | | Trustee | | April 1986 | | Private investor; Sun Life Assurance Company of Canada, Senior Vice President and General Manager for the United States (until 1997); Director (until March 2004) |
| | |
| INDEPENDENT TRUSTEES | | | | |
J. Kermit Birchfield (born 1/08/40) | | Chairman | | May 1997 | | Consultant; Century Partners, Inc. (investments), Director; Displaytech, Inc. (technology), Chairman; Dessin Fournir LLC (furniture manufacturer), Director; Site Watch LLC (software to monitor oil tanks), Managing Director (2006 to present); Juridica Investments (fund investing in judicial matters), Director (2007 to present), Immuno Science, Inc. (medical research), Independent Director (2009 to present), Intermountain Industries, Inc. (oil & gas exploration and production), Director (until February 2009) |
| | | |
Robert C. Bishop (born 1/13/43) | | Trustee | | May 2001 | | AutoImmune, Inc. (pharmaceutical product development), Chairman, President and Chief Executive Officer; Caliper Life Sciences Corp. (laboratory analytical instruments), Chairman; Optobionics Corporation (ophthalmic devices), Director (until 2007); Millipore Corporation (purification/filtration products), Director (until July 2010); Waterstreet Capital (leverage buyouts), Advisory Board (until August 2010) |
| | | |
Frederick H. Dulles (born 3/12/42) | | Trustee | | May 2001 | | Dulles International Law LLC (law firm), Senior Lawyer (since 2009); Juridica Capital Management (US) Inc. (litigation financing), Vice President and General Counsel (since 2009); Dulles Properties LLC (real estate), Broker (since 2008); The Citadel School of Business Administration (education), Adjunct Professor (since 2003); Disher, Hamrick & Myers Residential, Inc. (real estate), Broker (until 2006); Frederick H. Dulles Law Practice (law firm), (until 2006); Charlestown School of Law (education), Adjunct Professor (until 2007); Prudential Carolina Real Estate, (real estate), Broker (until 2008); Free Enterprise Foundation Inc. (research institute), Director & Secretary (until 2008); Ten State International Law PLLP (law firm), Of Counsel (until 2009) |
| | | |
Marcia A. Kean (born 6/30/48) | | Trustee | | April 2005 | | Feinstein Kean Healthcare (consulting), Chief Executive Officer |
| | | |
Ronald G. Steinhart (born 6/15/40) | | Trustee | | May 2001 | | Private investor; Penske Automotive Group (automotive retailer), Director; Animal Health International, Inc. (animal health products), Director (since 2007); Texas Industries (concrete/aggregates/cement), Director (since 2007); Susser Holdings Corporation (retail convenience stores and distributor of wholesale motor fuel), Director (since 2009); Prentiss Properties Trust (real estate investment trust), Director (until 2006); Penson Worldwide, Inc. (securities clearance), Director (until 2008) |
| | | |
Haviland Wright (born 7/21/48) | | Trustee | | May 2001 | | X-Change Corp. (multi-media web services), Director (since 2010); Nano Loa Inc. (liquid crystal displays), Director (until 2009); Profitability of Hawaii (software), Chief Development Officer (until 2010); Elixir Technologies Corporation (software), Director (until 2010) |
| | | |
| OFFICERS | | | | | | |
Maria F. DiOrioDwyer (4)
(born 12/01/58) | | President | | November 2005 | | Massachusetts Financial Services Company, Executive Vice President and Chief Regulatory Officer; Chief Compliance Officer (since December 2006) |
| | | |
| Christopher R. Bohane (4) (born 1/18/74) | | Assistant Secretary and Assistant Clerk | | July 2005 | | Massachusetts Financial Services Company, Vice President and Senior Counsel |
| | | |
John M. Corcoran (4) (born 4/13/65) | | Treasurer | | October 2008 | | Massachusetts Financial Services Company, Senior Vice President (since October 2008); State Street Bank and Trust (financial services provider), Senior Vice President, (until September 2008) |
| | | |
Ethan D. Corey (4) (born 11/21/63) | | Assistant Secretary and Assistant Clerk | | July 2005 | | Massachusetts Financial Services Company, Senior Vice President and Associate General Counsel |
| | | |
David L. DiLorenzo (4) (born 8/10/68) | | Assistant Treasurer | | July 2005 | | Massachusetts Financial Services Company, Vice President |
| | | |
Timothy M. Fagan (4) (born 7/10/68) | | Assistant Secretary and Assistant Clerk | | September 2005 | | Massachusetts Financial Services Company, Vice President and Senior Counsel |
| | | |
Mark D. Fischer (4) (born 10/27/70) | | Assistant Treasurer | | July 2005 | | Massachusetts Financial Services Company, Vice President |
23
MFS International Value Portfolio
Trustees and Officers – continued
| | | | | | |
Name, Date of Birth | | Position(s) Held
with Fund | | Trustee/Officer
Since (1) | | Principal Occupations During the Past Five Years and
Other Directorships (2) |
Robyn L. Griffin (born 7/04/75) | | Assistant Independent Chief Compliance Officer | | August 2008 | | Griffin Compliance LLC (provider of compliance services), Principal (since August 2008); State Street Corporation (financial services provider), Mutual Fund Administration Assistant Vice President (October 2006 – July 2008); Liberty Mutual Group (insurance), Personal Market Assistant Controller (April 2006 – October 2006); Deloitte & Touche LLP (professional services firm), Senior Manager (prior to April 2006) |
| | | |
Brian E. Langenfeld (4) (born 3/07/73) | | Assistant Secretary and Assistant Clerk | | May 2006 | | Massachusetts Financial Services Company, Vice President and Senior Counsel (since May 2006); John Hancock Advisers, LLC, Assistant Vice President and Counsel (until April 2006) |
| | | |
Ellen Moynihan (4) (born 11/13/57) | | Assistant Treasurer | | May 1997 | | Massachusetts Financial Services Company, Senior Vice President |
| | | |
Susan S. Newton (4) (born 3/07/50) | | Assistant Secretary and Assistant Clerk | | May 2005 | | Massachusetts Financial Services Company, Senior Vice President and Associate General Counsel |
| | | |
Susan A. Pereira (4)
(born 11/05/70) | | Assistant Secretary and Assistant Clerk | | July 2005 | | Massachusetts Financial Services Company, Vice President and Senior Counsel |
| | | |
Mark N. Polebaum (4) (born 5/01/52) | | Secretary and Clerk | | February 2006 | | Massachusetts Financial Services Company, Executive Vice President, General Counsel and Secretary (since January 2006); Wilmer Cutler Pickering Hale and Dorr LLP (law firm), Partner (until January 2006) |
| | | |
Frank L. Tarantino (born 3/07/44) | | Independent Chief Compliance Officer | | September 2004 | | Tarantino LLC (provider of compliance services), Principal |
| | | |
Richard S. Weitzel (4) (born 7/16/70) | | Assistant Secretary and Assistant Clerk | | October 2007 | | Massachusetts Financial Services Company, Vice President and Assistant General Counsel |
| | | |
James O. Yost (4) (born 6/12/60) | | Assistant Treasurer | | April 1992 | | Massachusetts Financial Services Company, Senior Vice President |
| (1) | Date first appointed to serve as Trustee/Officer of an MFS fund or a Compass variable account. Each Trustee has served continuously since appointment. For the period March 2008 until October 2008, Ms. DiOrioDwyer served as Treasurer of the Funds. |
| (2) | Directorships or trusteeships of companies required to report to the Securities and Exchange Commission (i.e., “public companies”). |
| (3) | “Interested person” of the Trust, within the meaning of the Investment Company Act of 1940 (referred to as the 1940 Act), which is the principal federal law governing investment companies like the Trust, as a result of position with Sun Life of Canada (U.S.). The address of Sun Life of Canada (U.S.) is One Sun Life Executive Park, Wellesley Hills, Massachusetts 02481. |
| (4) | “Interested person” of MFS within the meaning of the 1940 Act. The address of MFS is 500 Boylston Street, Boston, Massachusetts 02116. |
The Trust does not hold annual meetings for the purpose of electing Trustees, and Trustees are not elected for fixed terms. Each Trustee and officer holds office until his or her successor is chosen and qualified, or until his or her earlier death, resignation, retirement or removal.
All Trustees currently serve as Trustees of the Trust and have served in that capacity since originally elected or appointed. All of the Trustees are also Managers of the Compass Variable Accounts. The executive officers of the Trust hold similar offices for the Compass Variable Accounts and other funds in the MFS fund complex. As of January 1, 2011, each Trustee serves as a Trustee or Manager of 31 Accounts/Portfolios.
24
MFS International Value Portfolio
Trustees and Officers – continued
The Statement of Additional Information contains further information about the Trustees and is available without charge upon request by calling 1-800-752-7215.
| | |
Investment Adviser
Massachusetts Financial Services Company 500 Boylston Street, Boston, MA 02116-3741 | | Custodian State Street Bank and Trust 1 Lincoln Street, Boston, MA 02111-2900 |
Distributor
MFS Fund Distributors, Inc. 500 Boylston Street, Boston, MA 02116-3741 | | Independent Registered Public Accounting Firm Deloitte & Touche LLP 200 Berkeley Street, Boston, MA 02116 |
Portfolio Managers Benjamin Stone Barnaby Wiener | | |
25
MFS International Value Portfolio
BOARD REVIEW OF INVESTMENT ADVISORY AGREEMENT
The Investment Company Act of 1940 requires that both the full Board of Trustees and a majority of the non-interested (“independent”) Trustees, voting separately, annually approve the continuation of the investment advisory agreement between MFS Variable Insurance Trust II (the “Trust”) and Massachusetts Financial Services Company (“MFS”) on behalf of the Fund. The Trustees consider matters bearing on the Fund and the advisory arrangement at their meetings throughout the year, including a review of performance data at each regular meeting. In addition, the independent Trustees met in person in May and again in July 2010 (“contract review meetings”) for the specific purpose of considering whether to approve the continuation of the investment advisory agreement for the Fund. The independent Trustees were assisted in their evaluation of the investment advisory agreement by independent legal counsel, from whom they received separate legal advice and with whom they met separately from MFS management during various contract review meetings. The independent Trustees were also assisted in this process by the Fund’s Independent Chief Compliance Officer, a full-time senior officer appointed by and reporting to the independent Trustees.
In connection with their deliberations, the Trustees, including the independent Trustees, considered such information and factors as they believed, in light of the legal advice furnished to them and their own business judgment, to be relevant. The investment advisory agreement was considered separately for the Fund, although the Trustees also took into account the common interests of all Funds in the Trust in their review. As described below, the Trustees considered the nature, quality, and extent of the various investment advisory, administrative, and shareholder services performed by MFS under the existing investment advisory agreement and other arrangements with the Trust.
In connection with their contract review meetings, the Trustees received and relied upon materials which included, among other items: (i) information provided by Lipper Inc. (“Lipper”) on the investment performance of the Fund for various time periods ended December 31, 2009, compared to the investment performance of a group of funds with substantially similar investment classifications/objectives (the “Lipper performance universe”), (ii) information provided by Lipper on the Fund’s advisory fees and other expenses compared to the advisory fees and other expenses of comparable funds identified by Lipper (the “Lipper expense group”), (iii) information provided by MFS on the advisory fees of comparable portfolios of its other clients, including institutional separate account and other clients, (iv) information as to whether, and to what extent applicable, expense waivers, reimbursements or fee “breakpoints” are observed for the Fund, (v) information regarding MFS’ financial results and financial condition, including MFS’ and certain of its affiliates’ estimated profitability from services performed for the Fund, (vi) MFS’ views regarding the outlook for the mutual fund industry and its strategic business plans, (vii) descriptions of various functions performed by MFS for the Trust, such as compliance monitoring and portfolio trading practices, and (viii) information regarding the overall organization of MFS, including information about MFS’ senior management and other personnel providing investment advisory, administrative and other services to the Fund. The comparative performance, fee and expense information prepared and provided by Lipper was not independently verified, and the independent Trustees did not independently verify any information provided to them by MFS.
The Trustees’ conclusion as to the continuation of the investment advisory agreement was based on comprehensive consideration of all information provided to the Trustees and was not the result of any single factor. Some of the factors that figured particularly in the Trustees’ deliberations are described below for the Fund, while individual Trustees may have given different weight to various factors and evaluated the information presented as a whole differently than another individual Trustee. The Trustees recognized that the fee arrangements for the Fund reflect years of review and discussion between the independent Trustees and MFS, that certain aspects of such arrangements may receive greater scrutiny in some years than others, and that the Trustees’ conclusions may be based, in part, on their consideration of these same arrangements during the course of the year and in prior years.
Based on information provided by Lipper, the Trustees compared the Fund’s total return investment performance to the performance of the Lipper performance universe over various time periods. The Trustees placed particular emphasis on the total return performance of the Fund’s Initial Class shares in comparison to the performance of funds in its Lipper performance universe over the one-, three- and five-year periods ended December 31, 2009. The Trustees did not rely on performance results for more recent periods, including those shown elsewhere in this report.
The Trustees noted the performance of the Fund’s Initial Class shares was in the 5th quintile relative to the other funds in the Lipper performance universe for the one-year period (the 1st quintile being the best performers and the 5th quintile being the worst performers). The total return performance of the Fund was in the 1st quintile for the three-year and five-year periods ended December 31, 2009, relative to the Lipper performance universe. Based on the nature and quality of services historically provided by MFS, the Board of Trustees concluded that the Fund’s performance was satisfactory.
26
MFS International Value Portfolio
Board Review of Investment Advisory Agreement – continued
In the course of their deliberations, the Trustees took into account information provided by MFS during contract review meetings, as well as during investment review meetings conducted with portfolio management personnel during the course of the year.
In assessing the reasonableness of the Fund’s advisory fee, the Trustees considered, among other information, the Fund’s advisory fee and the total expense ratio of the Fund’s Initial Class shares as a percentage of average daily net assets, compared to the advisory fee and total expense ratios of its peer group of funds based on information provided by Lipper. The Trustees also considered the advisory fees charged by MFS to institutional accounts. In comparing these fees, the Trustees considered the generally broader scope of services provided by MFS to the Trust than those provided to institutional accounts. The Trustees also considered the higher demands placed on MFS’ investment personnel and trading infrastructure as a result of the daily cash in-flows and out-flows of the Fund, and the impact on MFS and related expenses due to the more extensive regulatory regime to which the Fund is subject, compared to institutional accounts.
In considering the fees, the Trustees noted from the Lipper data that the Fund’s effective advisory fee rate and total expense ratio were each above the median of such fees and expenses of funds in the Lipper expense group. The Trustees further concluded that the existing breakpoints were sufficient to allow the Fund to benefit from economies of scale as its assets grow. The Trustees concluded that the fees were reasonable in light of the nature and quality of services provided.
The Trustees also considered information prepared by MFS relating to its costs and profits with respect to the Fund and other investment companies and accounts advised by MFS, as well as MFS’ methodologies used to determine and allocate its costs to the Fund and other accounts and products for purposes of estimating profitability.
After reviewing these and other factors described below, the Trustees concluded that the advisory fees charged to the Fund represent reasonable compensation in light of the nature and quality of the services being provided by MFS.
In addition, the Trustees considered MFS’ resources and related efforts to continue to retain, attract and motivate capable personnel to serve the Fund. The Trustees also considered the financial resources of MFS and its parent, Sun Life Financial Inc. The Trustees further considered any advantages and possible disadvantages of having an adviser which also serves other investment companies as well as institutional accounts.
The Trustees also considered the nature, quality, cost, and extent of administrative, transfer agency, and distribution services provided to the Fund by MFS and its affiliates under agreements and plans other than the investment advisory agreement, including the 12b-1 fees the Fund pays to MFS Fund Distributors, Inc., an affiliate of MFS. The Trustees also considered the nature, extent and quality of certain other services MFS performs or arranges on the Fund’s behalf, which may include securities lending programs, directed expense payment programs, class action recovery programs, and MFS’ interaction with third-party service providers, principally custodians and sub-custodians. The Trustees concluded that the various non-advisory services provided by MFS and its affiliates on behalf of the Fund were satisfactory. The Trustees also considered the benefits to MFS from the use of the Fund’s portfolio brokerage commissions to pay for investment research and various other factors. Additionally, the Trustees considered so-called “fall-out benefits” to MFS such as reputational value derived from serving as investment manager to the Trust, and determined that any such benefits derived by MFS were reasonable and fair.
Based on their evaluation of factors that they deemed to be material, including those factors described above, the Board of Trustees, including a majority of the independent Trustees, concluded that the investment advisory agreement should be continued for an additional one-year period, commencing September 1, 2010.
A discussion regarding the Board’s most recent review and renewal of the fund’s Investment Advisory Agreement with MFS is available by clicking on the fund’s name under “Variable Insurance Portfolios — VIT II” in the “Products and Performance” section of the MFS Web site (mfs.com).
27
MFS International Value Portfolio
PROXY VOTING POLICIES AND INFORMATION
A general description of the MFS funds’ proxy voting policies and procedures is available without charge, upon request, by calling
1-800-225-2606, by visiting the Proxy Voting section of mfs.com or by visiting the SEC’s Web site at http://www.sec.gov.
Information regarding how the fund voted proxies relating to portfolio securities during the most recent twelve-month period ended June 30 is available without charge by visiting the Proxy Voting section of mfs.com or by visiting the SEC’s Web site at http://www.sec.gov.
QUARTERLY PORTFOLIO DISCLOSURE
The fund will file a complete schedule of portfolio holdings with the Securities and Exchange Commission (the Commission) for the first and third quarters of each fiscal year on Form N-Q. The fund’s Form N-Q may be reviewed and copied at the:
Public Reference Room
Securities and Exchange Commission
100 F Street, NE, Room 1580
Washington, D.C. 20549
Information on the operation of the Public Reference Room may be obtained by calling the Commission at 1-800-SEC-0330. The fund’s Form N-Q is available on the EDGAR database on the Commission’s Internet Web site at http://www.sec.gov, and copies of this information may be obtained, upon payment of a duplicating fee, by electronic request at the following e-mail address: publicinfo@sec.gov or by writing the Public Reference Section at the above address.
FURTHER INFORMATION
From time to time, MFS may post important information about the fund or the MFS funds on the MFS web site (mfs.com). This information is available by visiting the “News & Commentary” section of mfs.com or by clicking on the fund’s name under “Variable Insurance Portfolios — VIT II” in the “Products and Performance” section of mfs.com.
FEDERAL TAX INFORMATION (unaudited)
The following information is provided pursuant to provisions of the Internal Revenue Code.
Income derived from foreign sources was $7,573,152. The fund intends to pass through foreign tax credits of $683,712 for the fiscal year.
28
MFS International Value Portfolio
MFS® PRIVACY NOTICE
Privacy is a concern for every investor today. At MFS Investment Management® and the MFS funds, we take this concern very seriously. We want you to understand our policies about the investment products and services that we offer, and how we protect the nonpublic personal information of investors who have a direct relationship with us and our wholly owned subsidiaries.
Throughout our business relationship, you provide us with personal information. We maintain information and records about you, your investments, and the services you use. Examples of the nonpublic personal information we maintain include
| | Ÿ | | data from investment applications and other forms |
| | Ÿ | | share balances and transactional history with us, our affiliates, or others |
| | Ÿ | | facts from a consumer reporting agency |
We do not disclose any nonpublic personal information about our customers or former customers to anyone, except as permitted by law. We may share nonpublic personal information with third parties or certain of our affiliates in connection with servicing your account or processing your transactions. We may share information with companies or financial institutions that perform marketing services on our behalf or with other financial institutions with which we have joint marketing arrangements, subject to any legal requirements.
Authorization to access your nonpublic personal information is limited to appropriate personnel who provide products, services, or information to you. We maintain physical, electronic, and procedural safeguards to help protect the personal information we collect about you.
If you have any questions about the MFS privacy policy, please call 1-800-225-2606 any business day.
Note: If you own MFS products or receive MFS services in the name of a third party such as a bank or broker-dealer, their privacy policy may apply to you instead of ours.
29


MFS® BLENDED RESEARCH® GROWTH PORTFOLIO
The report is prepared for the general information of contract owners. It is authorized for distribution to prospective investors only when preceded or accompanied by a current prospectus.
NOT FDIC INSURED Ÿ MAY LOSE VALUE Ÿ NO BANK GUARANTEE Ÿ NOT A DEPOSIT Ÿ NOT INSURED BY ANY FEDERAL GOVERNMENT AGENCY OR NCUA/NCUSIF
MFS Blended Research Growth Portfolio
LETTER FROM THE CEO

Dear Contract Owners:
After an extended rebound in the financial markets, uncertainty returned in 2010 as investors began to question the durability of the recovery for global economies and markets. That uncertainty led to increased risk aversion, especially as investors saw the eurozone struggle with the debt woes of many of its members. In September, the U.S. Federal Reserve Board’s promises to further loosen monetary policy helped assuage market fears and drive asset prices off their recent lows. A combination of solid earnings and improving economic data gave an additional boost to investor sentiment. As we enter 2011, we are cautiously optimistic that economic growth will continue to improve and that the global economies will recover from the shocks of the past few years. We expect the pace of recovery worldwide will be uneven and volatile.
As always, we continue to be mindful of the many economic challenges faced at the local, national, and international levels. It is in times such as these that we want to remind investors of the merits of maintaining a long-term view, adhering to basic investing principles such as asset allocation and diversification, and working closely with their advisors to research and identify appropriate investment opportunities.
Respectfully,

Robert J. Manning
Chairman and Chief Executive Officer
MFS Investment Management®
February 14, 2011
The opinions expressed in this letter are subject to change, may not be relied upon for investment advice, and no forecasts can be guaranteed.
1
MFS Blended Research Growth Portfolio
PORTFOLIO COMPOSITION
Portfolio structure
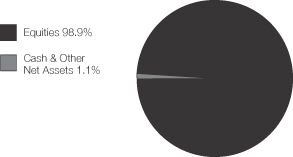
| | | | |
| Top ten holdings | | | | |
| Exxon Mobil Corp. | | | 6.2% | |
| Apple, Inc. | | | 4.3% | |
| Google, Inc., “A” | | | 3.2% | |
| Oracle Corp. | | | 2.5% | |
| International Business Machines Corp. | | | 2.2% | |
| Philip Morris International, Inc. | | | 2.2% | |
| Abbott Laboratories | | | 2.0% | |
| Intel Corp. | | | 1.9% | |
| United Parcel Service, Inc., “B” | | | 1.8% | |
| McDonald’s Corp. | | | 1.6% | |
| | | | |
| Equity sectors | | | | |
| Technology | | | 27.3% | |
| Energy | | | 10.2% | |
| Health Care | | | 9.5% | |
| Retailing | | | 8.6% | |
| Industrial Goods & Services | | | 7.9% | |
| Leisure | | | 7.3% | |
| Consumer Staples | | | 7.0% | |
| Basic Materials | | | 6.6% | |
| Financial Services | | | 6.3% | |
| Autos & Housing | | | 3.0% | |
| Special Products & Services | | | 2.6% | |
| Transportation | | | 2.1% | |
| Utilities & Communications | | | 0.5% | |
Percentages are based on net assets as of 12/31/10.
The portfolio is actively managed and current holdings may be different.
2
MFS Blended Research Growth Portfolio
MANAGEMENT REVIEW
Summary of Results
For the twelve months ended December 31, 2010, Initial Class shares of the MFS Blended Research Growth Portfolio (the “fund”) provided a total return of 18.35%, while Service Class shares of the fund provided a total return of 17.94%. These compare with a return of 16.71% for the fund’s benchmark, the Russell 1000 Growth Index.
Market Environment
The first quarter of the reporting period witnessed a continuation of the financial market and macroeconomic rebounds that had begun in early 2009. These recoveries in global activity and asset valuations were generally synchronized around the world, led importantly by emerging Asian economies, but broadening to include most of the global economy to varying degrees. Primary drivers of the recoveries included an unwinding of the inventory destocking that took place earlier, the production of manufacturing and capital goods, as well as massive fiscal and monetary stimulus.
During most of the remainder of the period, heightened risk surrounding the public-debt profiles of several of the peripheral European countries impaired market sentiment. At the same time, the improving trend in global macroeconomic data began to weaken somewhat. These two dynamics caused many asset prices to retrench significantly, as many questioned the durability of the global recovery.
Towards the end of the period, the U.S. Federal Reserve led markets to believe that further monetary loosening would be forthcoming if macroeconomic activity did not show signs of improvement. The prospects for more easing by the Fed improved market sentiment and drove risk-asset prices markedly higher. However, in a text-book case of “buy the rumor, sell the fact,” the weeks following the early November announcement of further quantitative easing saw a sell-off in U.S. Treasury bonds. This rise in Treasury yields occurred despite risk-off behavior in equities and credit markets (which would normally result in Treasury yield compression), and appears to have been the result of a few factors: signs of improved U.S. and global economic activity; opposition to quantitative easing from some quarters; and crowded long positions in U.S. Treasuries. The December agreement on an expansionary U.S. fiscal package also boosted sentiment, leading markets to reach near-term highs in risky asset valuations toward year end.
Contributors to Performance
Favorable stock selection in the technology sector contributed to the fund’s performance relative to the Russell 1000 Growth Index. The fund’s ownership in shares of network storage products company F5 Networks and technology systems developer Riverbed Technology (b) contributed to relative returns. Shares of F5 Networks climbed higher as the company released strong quarterly earnings and impressive earnings guidance for the fourth quarter of 2010. Our underweight position in software giant Microsoft also contributed to relative results.
Security selection in the retailing sector boosted relative returns during the reporting period. The fund’s ownership in shares of specialty retailer Limited Brands, outdoor accessory retailer Deckers Outdoor (b), and department store operator Macy’s contributed to strong returns. The share price of Deckers rose due to stronger-than-expected earnings results. Increased demand for their Teva brand and growth in the United Kingdom and China further supported the stock price.
Elsewhere, the fund’s holdings of iron ore miner Cliffs Natural Resources, technology services provider Cognizant Technology, biotech firm Gilead Sciences, and cruise line operator Royal Caribbean Cruises aided relative returns.
Detractors from Performance
A combination of stock selection and an overweight position in the health care sector detracted from the fund’s relative results. Top detractors within the sector included products manufacturer and supplier Alere (h), medical device maker Medtronic, and biotechnology firm Amgen. Shares of Medtronic came under pressure due to weaker-than-expected sales, lower margins in its Cardiac Rhythm Management (CRM) business, and a reduction in management’s revenue guidance.
Stock selection in the consumer staples sector was another negative area of relative performance. Holdings of weak-performing oilseeds, corn, and wheat processor Archer-Daniel Midland (h) weighed on relative returns.
Security selection in the industrial goods & services sector also dampened relative returns. Not owning industrial manufacturer Caterpillar (h) held back relative performance as the stock outperformed the benchmark over the reporting period.
3
MFS Blended Research Growth Portfolio
Management Review – continued
Individual securities in other sectors that hindered relative results included higher education provider Devry (h), solar electric power modules manufacturer First Solar, and publishing software company Adobe Systems (h). The fund’s underweight position in oil field services company Schlumberger also detracted from relative returns. The timing of our transactions in online travel company Priceline.com (h) hindered relative performance as the fund missed some of the stock’s positive price gains during the reporting period.
Respectfully,
Matthew Krummell
Portfolio Manager
| (b) | Security is not a benchmark constituent. |
| (h) | Security was not held in the portfolio at period end. |
The views expressed in this report are those of the portfolio manager only through the end of the period of the report as stated on the cover and do not necessarily reflect the views of MFS or any other person in the MFS organization. These views are subject to change at any time based on market or other conditions, and MFS disclaims any responsibility to update such views. These views may not be relied upon as investment advice or an indication of trading intent on behalf of any MFS portfolio. References to specific securities are not recommendations of such securities, and may not be representative of any MFS portfolio’s current or future investments.
4
MFS Blended Research Growth Portfolio
PERFORMANCE SUMMARY THROUGH 12/31/10
The following chart illustrates the historical performance of the fund in comparison to its benchmark(s). Benchmarks are unmanaged and may not be invested in directly. Benchmark returns do not reflect any fees or expenses. The performance of other share classes will be greater than or less than that of the class depicted below. (See Notes to Performance Summary.)
Performance data shown represents past performance and is no guarantee of future results. Investment return and principal value fluctuate so your units, when sold, may be worth more or less than the original cost; current performance may be lower or higher than quoted. The performance shown does not reflect the deduction of taxes, if any, that a contract holder would pay on fund distributions or the redemption of contract units. The returns for the fund shown also do not reflect the deduction of expenses associated with variable products, such as mortality and expense risk charges, separate account charges, and sales charges imposed by the insurance company separate accounts. Such expenses would reduce the overall returns shown.
Growth of a Hypothetical $10,000 Investment (t)
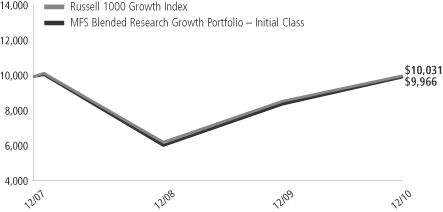
Total Returns through 12/31/10
Average annual total returns
| | | | | | | | | | |
| | | Share class | | Class inception date | | 1-yr | | Life (t) | | |
| | | Initial Class | | 12/18/07 | | 18.35% | | (0.11)% | | |
| | | Service Class | | 12/18/07 | | 17.94% | | (0.37)% | | |
| | | |
| Comparative benchmark | | | | | | |
| | | Russell 1000 Growth Index (f) | | 16.71% | | 0.10% | | |
| (f) | Source: FactSet Research Systems Inc. |
| (t) | For the period from the class inception date through the stated period end. (See Notes to Performance Summary.) |
Benchmark Definition
Russell 1000 Growth Index – constructed to provide a comprehensive barometer for growth securities in the large-cap segment of the U.S. equity universe. Companies in this index generally have higher price-to-book ratios and higher forecasted growth values.
It is not possible to invest directly in an index.
Notes to Performance Summary
Average annual total return represents the average annual change in value for each share class for the periods presented. Life returns are presented where the share class has less than 10 years of performance history and represent the average annual total return from the class inception date to the stated period end date.
Performance results reflect any applicable expense subsidies and waivers in effect during the periods shown. Without such subsidies and waivers the fund’s performance results would be less favorable. Please see the prospectus and financial statements for complete details. All results are historical and assume the reinvestment of any dividends and capital gains distributions.
From time to time the fund may receive proceeds from litigation settlements, without which performance would be lower.
5
MFS Blended Research Growth Portfolio
EXPENSE TABLE
Fund Expenses Borne by the Contract Holders During the Period,
July 1, 2010 through December 31, 2010
As a contract holder of the fund, you incur ongoing costs, including management fees; distribution and/or service (12b-1) fees; and other fund expenses. This example is intended to help you understand your ongoing costs (in dollars) of investing in the fund and to compare these costs with the ongoing costs of investing in other mutual funds.
The example is based on an investment of $1,000 invested at the beginning of the period and held for the entire period July 1, 2010 through December 31, 2010.
Actual Expenses
The first line for each share class in the following table provides information about actual account values and actual expenses. You may use the information in this line, together with the amount you invested, to estimate the expenses that you paid over the period. Simply divide your account value by $1,000 (for example, an $8,600 account value divided by $1,000 = 8.6), then multiply the result by the number in the first line under the heading entitled “Expenses Paid During Period” to estimate the expenses you paid on your account during this period.
Hypothetical Example for Comparison Purposes
The second line for each share class in the following table provides information about hypothetical account values and hypothetical expenses based on the fund’s actual expense ratio and an assumed rate of return of 5% per year before expenses, which is not the fund’s actual return. The hypothetical account values and expenses may not be used to estimate the actual ending account balance or expenses you paid for the period. You may use this information to compare the ongoing costs of investing in the fund and other funds. To do so, compare this 5% hypothetical example with the 5% hypothetical examples that appear in the shareholder reports of the other funds.
Please note that the expenses shown in the table are meant to highlight the fund’s ongoing costs only and do not take into account the fees and expenses imposed under the variable contracts through which your investment in the fund is made. Therefore, the second line for each share class in the table is useful in comparing ongoing costs associated with an investment in vehicles (such as the fund) which fund benefits under variable annuity and variable life insurance contracts and to qualified pension and retirement plans only, and will not help you determine the relative total costs of investing in the fund through variable annuity and variable life insurance contracts. If the fees and expenses imposed under the variable contracts were included, your costs would have been higher.
| | | | | | | | | | | | | | | | | | |
| Share Class | | | | Annualized Expense Ratio | | | Beginning Account Value 7/01/10 | | | Ending Account Value 12/31/10 | | | Expenses Paid During Period (p)
7/01/10-12/31/10 | |
| Initial Class | | Actual | | | 0.60% | | | | $1,000.00 | | | | $1,253.52 | | | | $3.41 | |
| | Hypothetical (h) | | | 0.60% | | | | $1,000.00 | | | | $1,022.18 | | | | $3.06 | |
| Service Class | | Actual | | | 0.85% | | | | $1,000.00 | | | | $1,252.36 | | | | $4.83 | |
| | Hypothetical (h) | | | 0.85% | | | | $1,000.00 | | | | $1,020.92 | | | | $4.33 | |
| (h) | 5% class return per year before expenses. |
| (p) | Expenses paid is equal to each class’ annualized expense ratio, as shown above, multiplied by the average account value over the period, multiplied by the number of days in the period, divided by the number of days in the year. |
6
MFS Blended Research Growth Portfolio
PORTFOLIO OF INVESTMENTS – 12/31/10
The Portfolio of Investments is a complete list of all securities owned by your fund. It is categorized by broad-based asset classes.
| | | | | | | | |
| Issuer | | Shares/Par | | | Value ($) | |
| | | | | | | | |
| COMMON STOCKS – 98.9% | | | | | | | | |
| Aerospace – 3.5% | | | | | | | | |
| Honeywell International, Inc. | | | 449 | | | $ | 23,869 | |
| Lockheed Martin Corp. | | | 455 | | | | 31,809 | |
| Northrop Grumman Corp. | | | 787 | | | | 50,982 | |
| Textron, Inc. | | | 2,201 | | | | 52,032 | |
| United Technologies Corp. | | | 204 | | | | 16,059 | |
| | | | | | | | |
| | | | | | $ | 174,751 | |
| | | | | | | | |
| Airlines – 0.3% | | | | | | | | |
| United Continental Holdings, Inc. (a) | | | 595 | | | $ | 14,173 | |
| | | | | | | | |
| Apparel Manufacturers – 1.0% | | | | | | | | |
| Deckers Outdoor Corp. (a) | | | 231 | | | $ | 18,420 | |
| Phillips-Van Heusen Corp. | | | 500 | | | | 31,505 | |
| | | | | | | | |
| | | | | | $ | 49,925 | |
| | | | | | | | |
| Automotive – 3.0% | | | | | | | | |
| Ford Motor Co. (a) | | | 3,077 | | | $ | 51,663 | |
| Johnson Controls, Inc. | | | 1,842 | | | | 70,364 | |
| TRW Automotive Holdings Corp. (a) | | | 475 | | | | 25,033 | |
| | | | | | | | |
| | | | | | $ | 147,060 | |
| | | | | | | | |
| Biotechnology – 1.8% | | | | | | | | |
| Amgen, Inc. (a) | | | 931 | | | $ | 51,112 | |
| Genzyme Corp. (a) | | | 172 | | | | 12,246 | |
| Gilead Sciences, Inc. (a) | | | 723 | | | | 26,202 | |
| | | | | | | | |
| | | | | | $ | 89,560 | |
| | | | | | | | |
| Broadcasting – 1.1% | | | | | | | | |
| CBS Corp., “B” | | | 2,827 | | | $ | 53,854 | |
| | | | | | | | |
| Brokerage & Asset Managers – 0.9% | | | | | | | | |
| NASDAQ OMX Group, Inc. (a) | | | 1,877 | | | $ | 44,504 | |
| | | | | | | | |
| Business Services – 2.6% | | | | | | | | |
| Accenture Ltd., “A” | | | 600 | | | $ | 29,094 | |
| Cognizant Technology Solutions Corp., “A” (a) | | | 620 | | | | 45,440 | |
| MSCI, Inc., “A” (a) | | | 1,404 | | | | 54,700 | |
| | | | | | | | |
| | | | | | $ | 129,234 | |
| | | | | | | | |
| Cable TV – 0.5% | | | | | | | | |
| DIRECTV, “A” (a) | | | 656 | | | $ | 26,194 | |
| | | | | | | | |
| Chemicals – 3.4% | | | | | | | | |
| 3M Co. | | | 486 | | | $ | 41,942 | |
| E.I. du Pont de Nemours & Co. | | | 1,087 | | | | 54,220 | |
| Ecolab, Inc. | | | 369 | | | | 18,605 | |
| PPG Industries, Inc. | | | 625 | | | | 52,544 | |
| | | | | | | | |
| | | | | | $ | 167,311 | |
| | | | | | | | |
| Computer Software – 7.4% | | | | | | | | |
| Autodesk, Inc. (a) | | | 664 | | | $ | 25,365 | |
| Intuit, Inc. (a) | | | 1,187 | | | | 58,519 | |
| Microsoft Corp. | | | 2,070 | | | | 57,794 | |
| Oracle Corp. | | | 3,999 | | | | 125,169 | |
| Rovi Corp. (a) | | | 662 | | | | 41,051 | |
| | | | | | | | |
| Issuer | | Shares/Par | | | Value ($) | |
| | | | | | | | |
| COMMON STOCKS – continued | | | | | |
| Computer Software – continued | | | | | | | | |
| VeriSign, Inc. | | | 1,775 | | | $ | 57,989 | |
| | | | | | | | |
| | | | | | $ | 365,887 | |
| | | | | | | | |
| Computer Software – Systems – 7.2% | | | | | | | | |
| Apple, Inc. (a) | | | 662 | | | $ | 213,535 | |
| Hewlett-Packard Co. | | | 846 | | | | 35,617 | |
| International Business Machines Corp. | | | 745 | | | | 109,336 | |
| | | | | | | | |
| | | | | | $ | 358,488 | |
| | | | | | | | |
| Consumer Products – 1.0% | | | | | | | | |
| Energizer Holdings, Inc. (a) | | | 672 | | | $ | 48,989 | |
| | | | | | | | |
| Electrical Equipment – 0.5% | | | | | | | | |
| Danaher Corp. | | | 578 | | | $ | 27,264 | |
| | | | | | | | |
| Electronics – 4.3% | | | | | | | | |
| First Solar, Inc. (a) | | | 349 | | | $ | 45,419 | |
| Intel Corp. | | | 4,554 | | | | 95,771 | |
| Linear Technology Corp. | | | 1,143 | | | | 39,536 | |
| Microchip Technology, Inc. | | | 945 | | | | 32,328 | |
| | | | | | | | |
| | | | | | $ | 213,054 | |
| | | | | | | | |
| Energy – Independent – 0.3% | | | | | | | | |
| QEP Resources, Inc. | | | 433 | | | $ | 15,722 | |
| | | | | | | | |
| Energy – Integrated – 7.3% | | | | | | | | |
| Chevron Corp. | | | 632 | | | $ | 57,670 | |
| Exxon Mobil Corp. | | | 4,186 | | | | 306,080 | |
| | | | | | | | |
| | | | | | $ | 363,750 | |
| | | | | | | | |
| Food & Beverages – 3.6% | | | | | | | | |
| Coca-Cola Co. | | | 399 | | | $ | 26,242 | |
| Dr Pepper Snapple Group, Inc. | | | 1,376 | | | | 48,380 | |
| General Mills, Inc. | | | 1,680 | | | | 59,791 | |
| PepsiCo, Inc. | | | 670 | | | | 43,771 | |
| | | | | | | | |
| | | | | | $ | 178,184 | |
| | | | | | | | |
| Food & Drug Stores – 1.2% | | | | | | | | |
| Walgreen Co. | | | 472 | | | $ | 18,389 | |
| Whole Foods Market, Inc. | | | 833 | | | | 42,141 | |
| | | | | | | | |
| | | | | | $ | 60,530 | |
| | | | | | | | |
| Forest & Paper Products – 0.5% | | | | | | | | |
| International Paper Co. | | | 868 | | | $ | 23,644 | |
| | | | | | | | |
| Gaming & Lodging – 1.3% | | | | | | | | |
| Las Vegas Sands Corp. (a) | | | 997 | | | $ | 45,812 | |
| Royal Caribbean Cruises Ltd. (a) | | | 418 | | | | 19,646 | |
| | | | | | | | |
| | | | | | $ | 65,458 | |
| | | | | | | | |
| General Merchandise – 3.2% | | | | | | | | |
| Dollar Tree, Inc. (a) | | | 866 | | | $ | 48,565 | |
| Macy’s, Inc. | | | 2,348 | | | | 59,404 | |
| Target Corp. | | | 444 | | | | 26,698 | |
| Wal-Mart Stores, Inc. | | | 429 | | | | 23,136 | |
| | | | | | | | |
| | | | | | $ | 157,803 | |
| | | | | | | | |
7
MFS Blended Research Growth Portfolio
Portfolio of Investments – continued
| | | | | | | | |
| Issuer | | Shares/Par | | | Value ($) | |
| | | | | | | | |
| COMMON STOCKS – continued | |
| Health Maintenance Organizations – 0.9% | |
| UnitedHealth Group, Inc. | | | 1,296 | | | $ | 46,799 | |
| | | | | | | | |
| Insurance – 2.3% | | | | | | | | |
| ACE Ltd. | | | 200 | | | $ | 12,450 | |
| Aflac, Inc. | | | 484 | | | | 27,312 | |
| Allied World Assurance Co. | | | 467 | | | | 27,758 | |
| Prudential Financial, Inc. | | | 814 | | | | 47,790 | |
| | | | | | | | |
| | | | | | $ | 115,310 | |
| | | | | | | | |
| Internet – 3.2% | | | | | | | | |
| Google, Inc., “A” (a) | | | 268 | | | $ | 159,184 | |
| | | | | | | | |
| Leisure & Toys – 0.8% | | | | | | | | |
| Activision Blizzard, Inc. | | | 3,392 | | | $ | 42,196 | |
| | | | | | | | |
| Machinery & Tools – 3.1% | | | | | | | | |
| Cummins, Inc. | | | 552 | | | $ | 60,726 | |
| Pitney Bowes, Inc. | | | 1,719 | | | | 41,565 | |
| Timken Co. | | | 1,100 | | | | 52,503 | |
| | | | | | | | |
| | | | | | $ | 154,794 | |
| | | | | | | | |
| Major Banks – 0.6% | | | | | | | | |
| Goldman Sachs Group, Inc. | | | 174 | | | $ | 29,260 | |
| | | | | | | | |
| Medical & Health Technology & Services – 0.3% | |
| McKesson Corp. | | | 193 | | | $ | 13,583 | |
| | | | | | | | |
| Medical Equipment – 3.5% | | | | | | | | |
| Medtronic, Inc. | | | 1,844 | | | $ | 68,394 | |
| Thermo Fisher Scientific, Inc. (a) | | | 842 | | | | 46,613 | |
| Waters Corp. (a) | | | 754 | | | | 58,593 | |
| | | | | | | | |
| | | | | | $ | 173,600 | |
| | | | | | | | |
| Metals & Mining – 1.7% | | | | | | | | |
| Cliffs Natural Resources, Inc. | | | 670 | | | $ | 52,267 | |
| Freeport-McMoRan Copper & Gold, Inc. | | | 266 | | | | 31,944 | |
| | | | | | | | |
| | | | | | $ | 84,211 | |
| | | | | | | | |
| Network & Telecom – 5.2% | | | | | | | | |
| Cisco Systems, Inc. (a) | | | 2,399 | | | $ | 48,532 | |
| F5 Networks, Inc. (a) | | | 560 | | | | 72,890 | |
| Juniper Networks, Inc. (a) | | | 1,226 | | | | 45,264 | |
| Polycom, Inc. (a) | | | 936 | | | | 36,485 | |
| QUALCOMM, Inc. | | | 141 | | | | 6,978 | |
| Riverbed Technology, Inc. (a) | | | 1,338 | | | | 47,058 | |
| | | | | | | | |
| | | | | | $ | 257,207 | |
| | | | | | | | |
| Oil Services – 2.6% | | | | | | | | |
| Halliburton Co. | | | 843 | | | $ | 34,420 | |
| Noble Corp. | | | 555 | | | | 19,852 | |
| Schlumberger Ltd. | | | 308 | | | | 25,718 | |
| Transocean, Inc. (a) | | | 686 | | | | 47,684 | |
| | | | | | | | |
| | | | | | $ | 127,674 | |
| | | | | | | | |
| Other Banks & Diversified Financials – 2.2% | |
| American Express Co. | | | 1,466 | | | $ | 62,921 | |
| Visa, Inc., “A” | | | 647 | | | | 45,536 | |
| | | | | | | | |
| | | | | | $ | 108,457 | |
| | | | | | | | |
| | | | | | | | |
| Issuer | | Shares/Par | | | Value ($) | |
| | | | | | | | |
| COMMON STOCKS – continued | |
| Pharmaceuticals – 3.0% | | | | | | | | |
| Abbott Laboratories | | | 2,093 | | | $ | 100,276 | |
| Johnson & Johnson | | | 818 | | | | 50,593 | |
| | | | | | | | |
| | | | | | $ | 150,869 | |
| | | | | | | | |
| Pollution Control – 0.8% | | | | | | | | |
| Republic Services, Inc. | | | 1,331 | | | $ | 39,744 | |
| | | | | | | | |
| Printing & Publishing – 0.9% | | | | | | | | |
| Moody’s Corp. | | | 1,639 | | | $ | 43,499 | |
| | | | | | | | |
| Real Estate – 0.3% | | | | | | | | |
| Public Storage, Inc., REIT | | | 134 | | | $ | 13,590 | |
| | | | | | | | |
| Restaurants – 2.7% | | | | | | | | |
| Darden Restaurants, Inc. | | | 1,245 | | | $ | 57,818 | |
| McDonald’s Corp. | | | 1,029 | | | | 78,986 | |
| | | | | | | | |
| | | | | | $ | 136,804 | |
| | | | | | | | |
| Specialty Chemicals – 1.0% | | | | | | | | |
| Air Products & Chemicals, Inc. | | | 303 | | | $ | 27,558 | |
| Praxair, Inc. | | | 248 | | | | 23,677 | |
| | | | | | | | |
| | | | | | $ | 51,235 | |
| | | | | | | | |
| Specialty Stores – 3.2% | | | | | | | | |
| Advance Auto Parts, Inc. | | | 736 | | | $ | 48,686 | |
| Best Buy Co., Inc. | | | 1,180 | | | | 40,462 | |
| Limited Brands, Inc. | | | 2,203 | | | | 67,698 | |
| | | | | | | | |
| | | | | | $ | 156,846 | |
| | | | | | | | |
| Telephone Services – 0.5% | | | | | | | | |
| American Tower Corp., “A” (a) | | | 472 | | | $ | 24,374 | |
| | | | | | | | |
| Tobacco – 2.4% | | | | | | | | |
| Lorillard, Inc. | | | 134 | | | $ | 10,996 | |
| Philip Morris International, Inc. | | | 1,825 | | | | 106,817 | |
| | | | | | | | |
| | | | | | $ | 117,813 | |
| | | | | | | | |
| Trucking – 1.8% | | | | | | | | |
| United Parcel Service, Inc., “B” | | | 1,202 | | | $ | 87,241 | |
| | | | | | | | |
Total Common Stocks
(Identified Cost, $4,207,916) | | | | | | $ | 4,909,629 | |
| | | | | | | | |
|
| MONEY MARKET FUNDS (v) – 1.5% | |
| MFS Institutional Money Market Portfolio, 0.18%, at Cost and Net Asset Value | | | 73,664 | | | $ | 73,664 | |
| | | | | | | | |
Total Investments
(Identified Cost, $4,281,580) | | | | | | $ | 4,983,293 | |
| | | | | | | | |
OTHER ASSETS, LESS
LIABILITIES – (0.4)% | | | | (19,995 | ) |
| | | | | | | | |
| Net Assets – 100.0% | | | $ | 4,963,298 | |
| | | | | | | | |
| (a) | | Non-income producing security. |
| (v) | | Underlying fund that is available only to investment companies managed by MFS. The rate quoted is the annualized seven-day yield of the fund at period end. |
The following abbreviations are used in this report and are defined:
| REIT | | Real Estate Investment Trust |
See Notes to Financial Statements
8
MFS Blended Research Growth Portfolio
FINANCIAL STATEMENTS | STATEMENT OF ASSETS AND LIABILITIES
This statement represents your fund’s balance sheet, which details the assets and liabilities comprising the total value of the fund.
| | | | | | | | |
At 12/31/10 | | | | | | | | |
Assets | | | | | | | | |
Investments – | | | | | | | | |
Non-affiliated issuers, at value (identified cost, $4,207,916) | | | $4,909,629 | | | | | |
Underlying funds, at cost and value | | | 73,664 | | | | | |
Total investments, at value (identified cost, $4,281,580) | | | $4,983,293 | | | | | |
Receivable for dividends | | | 3,374 | | | | | |
Receivable from investment adviser | | | 11,801 | | | | | |
Other assets | | | 302 | | | | | |
Total assets | | | | | | | $4,998,770 | |
Liabilities | | | | | | | | |
Payable to affiliates | | | | | | | | |
Investment adviser | | | $164 | | | | | |
Shareholder servicing costs | | | 3 | | | | | |
Distribution and/or service fees | | | 34 | | | | | |
Administrative services fee | | | 55 | | | | | |
Payable for Trustees’ compensation | | | 3 | | | | | |
Accrued expenses and other liabilities | | | 35,213 | | | | | |
Total liabilities | | | | | | | $35,472 | |
Net assets | | | | | | | $4,963,298 | |
Net assets consist of | | | | | | | | |
Paid-in capital | | | $5,122,397 | | | | | |
Unrealized appreciation (depreciation) on investments | | | 701,713 | | | | | |
| Accumulated net realized gain (loss) on investments | | | (860,899 | ) | | | | |
Undistributed net investment income | | | 87 | | | | | |
Net assets | | | | | | | $4,963,298 | |
Shares of beneficial interest outstanding | | | | | | | 515,423 | |
| | | | | | | | | | | | |
| | | Net assets | | | Shares
outstanding | | | Net asset value
per share | |
Initial Class | | | $2,491,059 | | | | 258,734 | | | | $9.63 | |
Service Class | | | 2,472,239 | | | | 256,689 | | | | 9.63 | |
See Notes to Financial Statements
9
MFS Blended Research Growth Portfolio
FINANCIAL STATEMENTS | STATEMENT OF OPERATIONS
This statement describes how much your fund earned in investment income and accrued in expenses. It also describes any gains and/or losses generated by fund operations.
| | | | | | | | |
| Year ended 12/31/10 | | | | | | | | |
| Net investment income | | | | | | | | |
Income | | | | | | | | |
Dividends | | | $82,510 | | | | | |
Dividends from underlying funds | | | 92 | | | | | |
Total investment income | | | | | | | $82,602 | |
Expenses | | | | | | | | |
Management fee | | | $26,383 | | | | | |
Distribution and/or service fees | | | 5,481 | | | | | |
Shareholder servicing costs | | | 510 | | | | | |
Administrative services fee | | | 10,000 | | | | | |
Trustees’ compensation | | | 559 | | | | | |
Custodian fee | | | 5,376 | | | | | |
Shareholder communications | | | 3,934 | | | | | |
Auditing fees | | | 48,572 | | | | | |
Legal fees | | | 7,100 | | | | | |
Miscellaneous | | | 8,475 | | | | | |
Total expenses | | | | | | | $116,390 | |
Fees paid indirectly | | | (2 | ) | | | | |
Reduction of expenses by investment adviser | | | (84,475 | ) | | | | |
Net expenses | | | | | | | $31,913 | |
Net investment income | | | | | | | $50,689 | |
Realized and unrealized gain (loss) on investments | | | | | | | | |
Realized gain (loss) on investment transactions (identified cost basis) | | | | | | | $259,981 | |
Change in unrealized appreciation (depreciation) on investments | | | | | | | $452,163 | |
Net realized and unrealized gain (loss) on investments | | | | | | | $712,144 | |
Change in net assets from operations | | | | | | | $762,833 | |
See Notes to Financial Statements
10
MFS Blended Research Growth Portfolio
FINANCIAL STATEMENTS | STATEMENTS OF CHANGES IN NET ASSETS
These statements describe the increases and/or decreases in net assets resulting from operations, any distributions, and any shareholder transactions.
| | | | | | | | |
For years ended 12/31 | | | 2010 | | | | 2009 | |
Change in net assets | | | | | | | | |
From operations | | | | | | | | |
Net investment income | | | $50,689 | | | | $41,102 | |
Net realized gain (loss) on investments | | | 259,981 | | | | (541,369 | ) |
Net unrealized gain (loss) on investments | | | 452,163 | | | | 1,662,199 | |
Change in net assets from operations | | | $762,833 | | | | $1,161,932 | |
Distributions declared to shareholders | | | | | | | | |
From net investment income | | | $(50,602 | ) | | | $(41,102 | ) |
From tax return of capital | | | — | | | | (102 | ) |
Total distributions declared to shareholders | | | $(50,602 | ) | | | $(41,204 | ) |
Change in net assets from fund share transactions | | | $50,602 | | | | $41,204 | |
Total change in net assets | | | $762,833 | | | | $1,161,932 | |
Net assets | | | | | | | | |
At beginning of period | | | 4,200,465 | | | | 3,038,533 | |
At end of period (including undistributed net investment income of $87 and
$0, respectively) | | | $4,963,298 | | | | $4,200,465 | |
See Notes to Financial Statements
11
MFS Blended Research Growth Portfolio
FINANCIAL STATEMENTS | FINANCIAL HIGHLIGHTS
The financial highlights table is intended to help you understand the fund’s financial performance for the past 5 years (or life of a particular share class, if shorter). Certain information reflects financial results for a single fund share. The total returns in the table represent the rate by which an investor would have earned (or lost) on an investment in the fund share class (assuming reinvestment of all distributions) held for the entire period.
| | | | | | | | | | | | | | | | |
| Initial Class | | Years ended 12/31 | |
| | | 2010 | | | 2009 | | | 2008 | | | 2007 (c) | |
Net asset value, beginning of period | | | $8.23 | | | | $6.01 | | | | $10.11 | | | | $10.00 | |
| Income (loss) from investment operations | | | | | | | | | | | | | | | | |
Net investment income (d) | | | $0.11 | | | | $0.09 | | | | $0.07 | | | | $0.00 | (w) |
Net realized and unrealized gain (loss) on investments | | | 1.40 | | | | 2.22 | | | | (4.10 | ) | | | 0.11 | |
Total from investment operations | | | $1.51 | | | | $2.31 | | | | $(4.03 | ) | | | $0.11 | |
| Less distributions declared to shareholders | | | | | | | | | | | | | | | | |
| From net investment income | | | $(0.11 | ) | | | $(0.09 | ) | | | $(0.07 | ) | | | $(0.00 | )(w) |
From tax return of capital | | | — | | | | (0.00 | )(w) | | | (0.00 | )(w) | | | (0.00 | )(w) |
Total distributions declared to shareholders | | | $(0.11 | ) | | | $(0.09 | ) | | | $(0.07 | ) | | | $(0.00 | )(w) |
Net asset value, end of period | | | $9.63 | | | | $8.23 | | | | $6.01 | | | | $10.11 | |
Total return (%) (k)(r)(s) | | | 18.35 | | | | 38.42 | | | | (39.84 | ) | | | 1.13 | (n) |
Ratios (%) (to average net assets)
and Supplemental data: | | | | | | | | | | | | | | | | |
Expenses before expense reductions (f) | | | 2.52 | | | | 2.85 | | | | 2.87 | | | | 10.74 | (a) |
Expenses after expense reductions (f) | | | 0.60 | | | | 0.60 | | | | 0.60 | | | | 0.60 | (a) |
Net investment income | | | 1.28 | | | | 1.30 | | | | 0.83 | | | | 0.81 | (a) |
Portfolio turnover | | | 83 | | | | 74 | | | | 50 | | | | 0 | |
Net assets at end of period (000 omitted) | | | $2,491 | | | | $2,106 | | | | $1,521 | | | | $2,528 | |
See Notes to Financial Statements
12
MFS Blended Research Growth Portfolio
Financial Highlights – continued
| | | | | | | | | | | | | | | | |
| Service Class | | Years ended 12/31 | |
| | | 2010 | | | 2009 | | | 2008 | | | 2007 (c) | |
Net asset value, beginning of period | | | $8.24 | | | | $6.02 | | | | $10.11 | | | | $10.00 | |
| Income (loss) from investment operations | | | | | | | | | | | | | | | | |
Net investment income (d) | | | $0.09 | | | | $0.07 | | | | $0.05 | | | | $0.00 | (w) |
Net realized and unrealized gain (loss) on investments | | | 1.39 | | | | 2.22 | | | | (4.09 | ) | | | 0.11 | |
Total from investment operations | | | $1.48 | | | | $2.29 | | | | $(4.04 | ) | | | $0.11 | |
| Less distributions declared to shareholders | | | | | | | | | | | | | | | | |
From net investment income | | | $(0.09 | ) | | | $(0.07 | ) | | | $(0.05 | ) | | | $(0.00) | (w) |
From tax return of capital | | | — | | | | (0.00 | )(w) | | | (0.00 | )(w) | | | (0.00) | (w) |
Total distributions declared to shareholders | | | $(0.09 | ) | | | $(0.07 | ) | | | $(0.05 | ) | | | $(0.00) | (w) |
Net asset value, end of period | | | $9.63 | | | | $8.24 | | | | $6.02 | | | | $10.11 | |
Total return (%) (k)(r)(s) | | | 17.94 | | | | 38.07 | | | | (39.96 | ) | | | 1.13 | (n) |
Ratios (%) (to average net assets)
and Supplemental data: | | | | | | | | | | | | | | | | |
Expenses before expense reductions (f) | | | 2.77 | | | | 3.10 | | | | 3.12 | | | | 10.99 | (a) |
Expenses after expense reductions (f) | | | 0.85 | | | | 0.85 | | | | 0.85 | | | | 0.85 | (a) |
Net investment income | | | 1.03 | | | | 1.05 | | | | 0.58 | | | | 0.56 | (a) |
Portfolio turnover | | | 83 | | | | 74 | | | | 50 | | | | 0 | |
Net assets at end of period (000 omitted) | | | $2,472 | | | | $2,095 | | | | $1,517 | | | | $2,528 | |
| (c) | For the period from the commencement of the fund’s investment operations, December 18, 2007, through the stated period end. |
| (d) | Per share data is based on average shares outstanding. |
| (f) | Ratios do not reflect reductions from fees paid indirectly, if applicable. |
| (k) | The total return does not reflect expenses that apply to separate accounts. Inclusion of these charges would reduce the total return figures for all periods shown. |
| (r) | Certain expenses have been reduced without which performance would have been lower. |
| (s) | From time to time the fund may receive proceeds from litigation settlements, without which performance would be lower. |
| (w) | Per share amount was less than $0.01. |
See Notes to Financial Statements
13
MFS Blended Research Growth Portfolio
NOTES TO FINANCIAL STATEMENTS
| (1) | | Business and Organization |
MFS Blended Research Growth Portfolio (the fund) is a series of MFS Variable Insurance Trust II (the trust). The trust is organized as a Massachusetts business trust and is registered under the Investment Company Act of 1940, as amended, as an open-end management investment company. Except as otherwise described in Note 3, the shareholders of each series of the trust are separate accounts of insurance companies, which offer variable annuity and/or life insurance products, and qualified retirement and pension plans.
| (2) | | Significant Accounting Policies |
General – The preparation of financial statements in conformity with U.S. generally accepted accounting principles requires management to make estimates and assumptions that affect the reported amounts of assets and liabilities, and disclosure of contingent assets and liabilities at the date of the financial statements and the reported amounts of revenues and expenses during the reporting period. Actual results could differ from those estimates. In the preparation of these financial statements, management has evaluated subsequent events occurring after the date of the fund’s Statement of Assets and Liabilities through the date that the financial statements were issued.
Investment Valuations – Equity securities, including restricted equity securities, are generally valued at the last sale or official closing price as provided by a third-party pricing service on the market or exchange on which they are primarily traded. Equity securities, for which there were no sales reported that day, are generally valued at the last quoted daily bid quotation as provided by a third-party pricing service on the market or exchange on which such securities are primarily traded. Equity securities held short, for which there were no sales reported for that day, are generally valued at the last quoted daily ask quotation as provided by a third-party pricing service on the market or exchange on which such securities are primarily traded. Short-term instruments with a maturity at issuance of 60 days or less generally are valued at amortized cost, which approximates market value. Open-end investment companies are generally valued at net asset value per share. Securities and other assets generally valued on the basis of information from a third-party pricing service may also be valued at a broker/dealer bid quotation. Values obtained from third-party pricing services can utilize both transaction data and market information such as yield, quality, coupon rate, maturity, type of issue, trading characteristics, and other market data.
The Board of Trustees has delegated primary responsibility for determining or causing to be determined the value of the fund’s investments (including any fair valuation) to the adviser pursuant to valuation policies and procedures approved by the Board. If the adviser determines that reliable market quotations are not readily available, investments are valued at fair value as determined in good faith by the adviser in accordance with such procedures under the oversight of the Board of Trustees. Under the fund’s valuation policies and procedures, market quotations are not considered to be readily available for most types of debt instruments and floating rate loans and many types of derivatives. These investments are generally valued at fair value based on information from third-party pricing services. In addition, investments may be valued at fair value if the adviser determines that an investment’s value has been materially effected by events occurring after the close of the exchange or market on which the investment is principally traded (such as foreign exchange or market) and prior to the determination of the fund’s net asset value, or after the halting of trading of a specific security where trading does not resume prior to the close of the exchange or market on which the security is principally traded. Events that occur on a frequent basis after foreign markets close (such as developments in foreign markets and significant movements in the U.S. markets) and prior to the determination of the fund’s net asset value may be deemed to have a material effect on the value of securities traded in foreign markets. Accordingly, the fund’s foreign equity securities may often be valued at fair value. The adviser generally relies on third-party pricing services or other information (such as the correlation with price movements of similar securities in the same or other markets; the type, cost and investment characteristics of the security; the business and financial condition of the issuer; and trading and other market data) to assist in determining whether to fair value and at what value to fair value an investment. The value of an investment for purposes of calculating the fund’s net asset value can differ depending on the source and method used to determine value. When fair valuation is used, the value of an investment used to determine the fund’s net asset value may differ from quoted or published prices for the same investment. There can be no assurance that the fund could obtain the fair value assigned to an investment if it were to sell the investment at the same time at which the fund determines its net asset value per share.
Various inputs are used in determining the value of the fund’s assets or liabilities. These inputs are categorized into three broad levels. In certain cases, the inputs used to measure fair value may fall into different levels of the fair value hierarchy. In such cases, an investment’s level within the fair value hierarchy is based on the lowest level of input that is significant to the fair value measurement. The fund’s assessment of the significance of a particular input to the fair value measurement in its entirety requires judgment, and considers factors specific to the investment. Level 1 includes unadjusted quoted prices in active markets for identical assets or liabilities. Level 2 includes other significant observable market-based inputs (including quoted
14
MFS Blended Research Growth Portfolio
Notes to Financial Statements – continued
prices for similar securities, interest rates, prepayment speed, and credit risk). Level 3 includes unobservable inputs, which may include the adviser’s own assumptions in determining the fair value of investments. The following is a summary of the levels used as of December 31, 2010 in valuing the fund’s assets or liabilities:
| | | | | | | | | | | | | | | | |
| Investments at Value | | Level 1 | | | Level 2 | | | Level 3 | | | Total | |
| Equity Securities | | | $4,909,629 | | | | $— | | | | $— | | | | $4,909,629 | |
| Mutual Funds | | | 73,664 | | | | — | | | | — | | | | 73,664 | |
| Total Investments | | | $4,983,293 | | | | $— | | | | $— | | | | $4,983,293 | |
For further information regarding security characteristics, see the Portfolio of Investments.
Indemnifications – Under the fund’s organizational documents, its officers and Trustees may be indemnified against certain liabilities and expenses arising out of the performance of their duties to the fund. Additionally, in the normal course of business, the fund enters into agreements with service providers that may contain indemnification clauses. The fund’s maximum exposure under these agreements is unknown as this would involve future claims that may be made against the fund that have not yet occurred.
Investment Transactions and Income – Investment transactions are recorded on the trade date. Dividends received in cash are recorded on the ex-dividend date. Certain dividends from foreign securities will be recorded when the fund is informed of the dividend if such information is obtained subsequent to the ex-dividend date. Dividend and interest payments received in additional securities are recorded on the ex-dividend or ex-interest date in an amount equal to the value of the security on such date.
The fund may receive proceeds from litigation settlements. Any proceeds received from litigation involving portfolio holdings are reflected in the Statement of Operations in realized gain/loss if the security has been disposed of by the fund or in unrealized gain/loss if the security is still held by the fund. Any other proceeds from litigation not related to portfolio holdings are reflected as other income in the Statement of Operations.
Fees Paid Indirectly – The fund’s custody fee may be reduced according to an arrangement that measures the value of cash deposited with the custodian by the fund. This amount, for the year ended December 31, 2010, is shown as a reduction of total expenses on the Statement of Operations.
Tax Matters and Distributions – The fund intends to qualify as a regulated investment company, as defined under Subchapter M of the Internal Revenue Code, and to distribute all of its taxable income, including realized capital gains. As a result, no provision for federal income tax is required. The fund’s federal tax returns for the prior three fiscal years remain subject to examination by the Internal Revenue Service. Foreign taxes, if any, have been accrued by the fund in the accompanying financial statements.
Distributions to shareholders are recorded on the ex-dividend date. Income and capital gain distributions are determined in accordance with income tax regulations, which may differ from U.S. generally accepted accounting principles. Certain capital accounts in the financial statements are periodically adjusted for permanent differences in order to reflect their tax character. These adjustments have no impact on net assets or net asset value per share. Temporary differences which arise from recognizing certain items of income, expense, gain or loss in different periods for financial statement and tax purposes will reverse at some time in the future. Distributions in excess of net investment income or net realized gains are temporary overdistributions for financial statement purposes resulting from differences in the recognition or classification of income or distributions for financial statement and tax purposes.
During the year ended December 31, 2010, there were no significant adjustments due to differences between book and tax accounting.
The tax character of distributions declared to shareholders for the last two fiscal years is as follows:
| | | | | | | | |
| | | 12/31/10 | | | 12/31/09 | |
| Ordinary income (including any short-term capital gains) | | | $50,602 | | | | $41,102 | |
| Tax return of capital (b) | | | — | | | | 102 | |
| Total distributions | | | $50,602 | | | | $41,204 | |
| | (b) | Distributions in excess of tax basis earnings and profits are reported in the financial statements as a tax return of capital. | |
15
MFS Blended Research Growth Portfolio
Notes to Financial Statements – continued
The federal tax cost and the tax basis components of distributable earnings were as follows:
| | | | |
| As of 12/31/10 | | | | |
| Cost of investments | | | $4,281,580 | �� |
| Gross appreciation | | | 838,209 | |
| Gross depreciation | | | (136,496 | ) |
| Net unrealized appreciation (depreciation) | | | $701,713 | |
| Undistributed ordinary income | | | 87 | |
| Capital loss carryforwards | | | (860,899 | ) |
As of December 31, 2010, the fund had capital loss carryforwards available to offset future realized gains. Such losses expire as follows:
| | | | |
| 12/31/16 | | | $(17,746 | ) |
| 12/31/17 | | | (843,153 | ) |
| Total | | | $(860,899 | ) |
Multiple Classes of Shares of Beneficial Interest – The fund offers multiple classes of shares, which differ in their respective distribution and/or service fees. The fund’s income, realized and unrealized gain (loss), and common expenses are allocated to shareholders based on the daily net assets of each class. Dividends are declared separately for each class. Differences in per share dividend rates are generally due to differences in separate class expenses. The fund’s distributions declared to shareholders as reported on the Statements of Changes in Net Assets are presented by class as follows:
| | | | | | | | | | | | | | | | |
| | | From net investment
income | | | From tax return of
capital | |
| | | Year ended
12/31/10 | | | Year ended
12/31/09 | | | Year ended
12/31/10 | | | Year ended
12/31/09 | |
| Initial Class | | | $28,122 | | | | $22,774 | | | | $— | | | | $51 | |
| Service Class | | | 22,480 | | | | 18,328 | | | | — | | | | 51 | |
| Total | | | $50,602 | | | | $41,102 | | | | $— | | | | $102 | |
| (3) | | Transactions with Affiliates |
Investment Adviser – The fund has an investment advisory agreement with MFS to provide overall investment management and related administrative services and facilities to the fund. The management fee is computed daily and paid monthly at an annual rate of 0.60% of the fund’s average daily net assets.
The investment adviser has agreed in writing to pay a portion of the fund’s total annual operating expenses, exclusive of interest, taxes, extraordinary expenses, brokerage and transaction costs and investment-related expenses, such that total annual operating expenses do not exceed 0.60% of average daily net assets for the Initial Class shares and 0.85% of average daily net assets for the Service Class shares. This written agreement will continue until April 30, 2012. For the year ended December 31, 2010, this reduction amounted to $84,475 and is reflected as a reduction of total expenses in the Statements of Operations.
Distributor – MFS Fund Distributors, Inc. (MFD), a wholly-owned subsidiary of MFS, is the distributor of shares of the fund. The Trustees have adopted a distribution plan for the Service Class shares pursuant to Rule 12b-1 under the Investment Company Act of 1940.
The fund’s distribution plan provides that the fund will pay MFD distribution and/or service fees equal to 0.25% per annum of its average daily net assets attributable to Service Class shares as partial consideration for services performed and expenses incurred by MFD and financial intermediaries (including participating insurance companies that invest in the fund to fund variable annuity and variable life insurance contracts, sponsors of qualified retirement and pension plans that invest in the fund, and affiliates of these participating insurance companies and plan sponsors) in connection with the sale and distribution of the Service Class shares. MFD may subsequently pay all, or a portion, of the distribution and/or service fees to financial intermediaries.
Shareholder Servicing Agent – MFS Service Center, Inc. (MFSC), a wholly-owned subsidiary of MFS, receives a fee from the fund for its services as shareholder servicing agent. For the year ended December 31, 2010, the fee was $507, which equated to 0.0115% annually of the fund’s average daily net assets. MFSC also receives payment from the fund for out-of-pocket expenses paid by MFSC on behalf of the fund. For the year ended December 31, 2010, these costs amounted to $3.
16
MFS Blended Research Growth Portfolio
Notes to Financial Statements – continued
Administrator – MFS provides certain financial, legal, shareholder communications, compliance, and other administrative services to the fund. Under an administrative services agreement, the fund partially reimburses MFS the costs incurred to provide these services. The fund is charged an annual fixed amount of $10,000 plus a fee based on average daily net assets. The administrative services fee incurred for the year ended December 31, 2010 was equivalent to an annual effective rate of 0.2273% of the fund’s average daily net assets.
Trustees’ and Officers’ Compensation – The fund pays compensation to Trustees in the form of a retainer, attendance fees, and additional compensation to the Board chairperson. The fund does not pay compensation directly to officers of the fund who are also officers of the investment adviser, all of whom receive remuneration for their services to the fund from MFS. Certain officers of the fund are officers or directors of MFS, MFD, and MFSC.
Other – This fund and certain other funds managed by MFS (the funds) have entered into services agreements (the Agreements) which provide for payment of fees by the funds to Tarantino LLC and Griffin Compliance LLC in return for the provision of services of an Independent Chief Compliance Officer (ICCO) and Assistant ICCO, respectively, for the funds. The ICCO and Assistant ICCO are officers of the funds and the sole members of Tarantino LLC and Griffin Compliance LLC, respectively. The funds can terminate the Agreements with Tarantino LLC and Griffin Compliance LLC at any time under the terms of the Agreements. MFS has agreed to bear all expenses associated with office space, other administrative support, and supplies provided to the ICCO and Assistant ICCO. For the year ended December 31, 2010, the aggregate fees paid by the fund to Tarantino LLC and Griffin Compliance LLC were $69 and are included in miscellaneous expense on the Statement of Operations.
The fund invests in the MFS Institutional Money Market Portfolio which is managed by MFS and seeks a high level of current income consistent with preservation of capital and liquidity. Income earned on this investment is included in dividends from underlying funds on the Statement of Operations. This money market fund does not pay a management fee to MFS.
On December 18, 2007, MFS purchased 250,000 shares of both the Initial Class and Service Class for an aggregate amount of $5,000,000. At December 31, 2010, MFS was the sole shareholder of both classes.
Purchases and sales of investments, other than U.S. Government securities, purchased option transactions, and short-term obligations, aggregated $3,648,114 and $3,610,587, respectively.
| (5) | | Shares of Beneficial Interest |
The fund’s Declaration of Trust permits the Trustees to issue an unlimited number of full and fractional shares of beneficial interest. Transactions in fund shares were as follows:
| | | | | | | | | | | | | | | | |
| | | Year ended 12/31/10 | | | Year ended 12/31/09 | |
| | | Shares | | | Amount | | | Shares | | | Amount | |
| Shares issued to shareholders in reinvestment of distributions | | | | | | | | | | | | | | | | |
Initial Class | | | 2,917 | | | | $28,122 | | | | 2,743 | | | | $22,825 | |
Service Class | | | 2,332 | | | | 22,480 | | | | 2,207 | | | | 18,379 | |
| | | 5,249 | | | | $50,602 | | | | 4,950 | | | | $41,204 | |
The fund and certain other funds managed by MFS participate in a $1.1 billion unsecured committed line of credit, subject to a $1 billion sublimit, provided by a syndication of banks under a credit agreement. Borrowings may be made for temporary financing needs. Interest is charged to each fund, based on its borrowings, generally at a rate equal to the higher of the Federal Reserve funds rate or one month LIBOR plus an agreed upon spread. A commitment fee, based on the average daily, unused portion of the committed line of credit, is allocated among the participating funds at the end of each calendar quarter. In addition, the fund and other funds managed by MFS have established unsecured uncommitted borrowing arrangements with certain banks for temporary financing needs. Interest is charged to each fund, based on its borrowings, at a rate equal to the Federal Reserve funds rate plus an agreed upon spread. For the year ended December 31, 2010, the fund’s commitment fee and interest expense were $47 and $0, respectively, and are included in miscellaneous expense on the Statement of Operations.
17
MFS Blended Research Growth Portfolio
Notes to Financial Statements – continued
| (7) | | Transactions in Underlying Funds – Affiliated Issuers |
An affiliated issuer may be considered one in which the fund owns 5% or more of the outstanding voting securities, or a company which is under common control. For the purposes of this report, the fund assumes the following to be affiliated issuers:
| | | | | | | | | | | | | | |
| Underlying Funds | | Beginning
Shares/Par
Amount | | Acquisitions
Shares/Par
Amount | | | Dispositions
Shares/Par
Amount | | | Ending
Shares/Par
Amount | |
| MFS Institutional Money Market Portfolio | | 64,225 | | | 156,582 | | | | (147,143 | ) | | | 73,664 | |
| | | | |
| Underlying Funds | | Realized
Gain (Loss) | | Capital Gain
Distributions | | | Dividend
Income | | | Ending
Value | |
| MFS Institutional Money Market Portfolio | | $— | | | $— | | | | $92 | | | | $73,664 | |
18
MFS Blended Research Growth Portfolio
REPORT OF INDEPENDENT REGISTERED PUBLIC ACCOUNTING FIRM
To the Board of Trustees of MFS Variable Insurance Trust II and the Shareholder of
MFS Blended Research Growth Portfolio:
We have audited the accompanying statement of assets and liabilities, including the portfolio of investments, of MFS Blended Research Growth Portfolio (the “Fund”) (one of the portfolios comprising MFS Variable Insurance Trust II) as of December 31, 2010, and the related statement of operations for the year then ended, the statements of changes in net assets for each of the two years in the period then ended, and the financial highlights for each of the periods presented. These financial statements and financial highlights are the responsibility of the Fund’s management. Our responsibility is to express an opinion on these financial statements and financial highlights based on our audits.
We conducted our audits in accordance with the standards of the Public Company Accounting Oversight Board (United States). Those standards require that we plan and perform the audit to obtain reasonable assurance about whether the financial statements and financial highlights are free of material misstatement. The Fund is not required to have, nor were we engaged to perform, an audit of its internal control over financial reporting. Our audits included consideration of internal control over financial reporting as a basis for designing audit procedures that are appropriate in the circumstances, but not for the purpose of expressing an opinion on the effectiveness of the Fund’s internal control over financial reporting. Accordingly, we express no such opinion. An audit also includes examining, on a test basis, evidence supporting the amounts and disclosures in the financial statements, assessing the accounting principles used and significant estimates made by management, as well as evaluating the overall financial statement presentation. Our procedures included confirmation of securities owned as of December 31, 2010, by correspondence with the custodian. We believe that our audits provide a reasonable basis for our opinion.
In our opinion, the financial statements and financial highlights referred to above present fairly, in all material respects, the financial position of MFS Blended Research Growth Portfolio as of December 31, 2010, the results of its operations for the year then ended, the changes in its net assets for each of the two years in the period then ended, and the financial highlights for each of the periods presented, in conformity with accounting principles generally accepted in the United States of America.
DELOITTE & TOUCHE LLP
Boston, Massachusetts
February 14, 2011
19
MFS Blended Research Growth Portfolio
TRUSTEES AND OFFICERS – IDENTIFICATION AND BACKGROUND
The Trustees and officers of the Trust, as of February 1, 2011, are listed below, together with their principal occupations during the past five years. (Their titles may have varied during that period.) The address of each Trustee and officer is 500 Boylston Street, Boston, Massachusetts 02116.
| | | | | | |
Name, Date of Birth | | Position(s) Held
with Fund | | Trustee/Officer
Since (1) | | Principal Occupations During the Past Five Years and
Other Directorships (2) |
| INTERESTED TRUSTEE | | | | |
David D. Horn (3) (born 6/07/41) | | Trustee | | April 1986 | | Private investor; Sun Life Assurance Company of Canada, Senior Vice President and General Manager for the United States (until 1997); Director (until March 2004) |
| | |
| INDEPENDENT TRUSTEES | | | | |
J. Kermit Birchfield (born 1/08/40) | | Chairman | | May 1997 | | Consultant; Century Partners, Inc. (investments), Director; Displaytech, Inc. (technology), Chairman; Dessin Fournir LLC (furniture manufacturer), Director; Site Watch LLC (software to monitor oil tanks), Managing Director (2006 to present); Juridica Investments (fund investing in judicial matters), Director (2007 to present), Immuno Science, Inc. (medical research), Independent Director (2009 to present), Intermountain Industries, Inc. (oil & gas exploration and production), Director (until February 2009) |
| | | |
Robert C. Bishop (born 1/13/43) | | Trustee | | May 2001 | | AutoImmune, Inc. (pharmaceutical product development), Chairman, President and Chief Executive Officer; Caliper Life Sciences Corp. (laboratory analytical instruments), Chairman; Optobionics Corporation (ophthalmic devices), Director (until 2007); Millipore Corporation (purification/filtration products), Director (until July 2010); Waterstreet Capital (leverage buyouts), Advisory Board (until August 2010) |
| | | |
Frederick H. Dulles (born 3/12/42) | | Trustee | | May 2001 | | Dulles International Law LLC (law firm), Senior Lawyer (since 2009); Juridica Capital Management (US) Inc. (litigation financing), Vice President and General Counsel (since 2009); Dulles Properties LLC (real estate), Broker (since 2008); The Citadel School of Business Administration (education), Adjunct Professor (since 2003); Disher, Hamrick & Myers Residential, Inc. (real estate), Broker (until 2006); Frederick H. Dulles Law Practice (law firm), (until 2006); Charlestown School of Law (education), Adjunct Professor (until 2007); Prudential Carolina Real Estate, (real estate), Broker (until 2008); Free Enterprise Foundation Inc. (research institute), Director & Secretary (until 2008); Ten State International Law PLLP (law firm), Of Counsel (until 2009) |
| | | |
Marcia A. Kean (born 6/30/48) | | Trustee | | April 2005 | | Feinstein Kean Healthcare (consulting), Chief Executive Officer |
| | | |
Ronald G. Steinhart (born 6/15/40) | | Trustee | | May 2001 | | Private investor; Penske Automotive Group (automotive retailer), Director; Animal Health International, Inc. (animal health products), Director (since 2007); Texas Industries (concrete/aggregates/cement), Director (since 2007); Susser Holdings Corporation (retail convenience stores and distributor of wholesale motor fuel), Director (since 2009); Prentiss Properties Trust (real estate investment trust), Director (until 2006); Penson Worldwide, Inc. (securities clearance), Director (until 2008) |
| | | |
Haviland Wright (born 7/21/48) | | Trustee | | May 2001 | | X-Change Corp. (multi-media web services), Director (since 2010); Nano Loa Inc. (liquid crystal displays), Director (until 2009); Profitability of Hawaii (software), Chief Development Officer (until 2010); Elixir Technologies Corporation (software), Director (until 2010) |
| | | |
| OFFICERS | | | | | | |
Maria F. DiOrioDwyer (4)
(born 12/01/58) | | President | | November 2005 | | Massachusetts Financial Services Company, Executive Vice President and Chief Regulatory Officer; Chief Compliance Officer (since December 2006) |
| | | |
| Christopher R. Bohane (4) (born 1/18/74) | | Assistant Secretary and Assistant Clerk | | July 2005 | | Massachusetts Financial Services Company, Vice President and Senior Counsel |
| | | |
John M. Corcoran (4) (born 4/13/65) | | Treasurer | | October 2008 | | Massachusetts Financial Services Company, Senior Vice President (since October 2008); State Street Bank and Trust (financial services provider), Senior Vice President, (until September 2008) |
| | | |
Ethan D. Corey (4) (born 11/21/63) | | Assistant Secretary and Assistant Clerk | | July 2005 | | Massachusetts Financial Services Company, Senior Vice President and Associate General Counsel |
| | | |
David L. DiLorenzo (4) (born 8/10/68) | | Assistant Treasurer | | July 2005 | | Massachusetts Financial Services Company, Vice President |
| | | |
Timothy M. Fagan (4) (born 7/10/68) | | Assistant Secretary and Assistant Clerk | | September 2005 | | Massachusetts Financial Services Company, Vice President and Senior Counsel |
| | | |
Mark D. Fischer (4) (born 10/27/70) | | Assistant Treasurer | | July 2005 | | Massachusetts Financial Services Company, Vice President |
20
MFS Blended Research Growth Portfolio
Trustees and Officers – continued
| | | | | | |
Name, Date of Birth | | Position(s) Held
with Fund | | Trustee/Officer
Since (1) | | Principal Occupations During the Past Five Years and
Other Directorships (2) |
Robyn L. Griffin (born 7/04/75) | | Assistant Independent Chief Compliance Officer | | August 2008 | | Griffin Compliance LLC (provider of compliance services), Principal (since August 2008); State Street Corporation (financial services provider), Mutual Fund Administration Assistant Vice President (October 2006 – July 2008); Liberty Mutual Group (insurance), Personal Market Assistant Controller (April 2006 – October 2006); Deloitte & Touche LLP (professional services firm), Senior Manager (prior to April 2006) |
| | | |
Brian E. Langenfeld (4) (born 3/07/73) | | Assistant Secretary and Assistant Clerk | | May 2006 | | Massachusetts Financial Services Company, Vice President and Senior Counsel (since May 2006); John Hancock Advisers, LLC, Assistant Vice President and Counsel (until April 2006) |
| | | |
Ellen Moynihan (4) (born 11/13/57) | | Assistant Treasurer | | May 1997 | | Massachusetts Financial Services Company, Senior Vice President |
| | | |
Susan S. Newton (4) (born 3/07/50) | | Assistant Secretary and Assistant Clerk | | May 2005 | | Massachusetts Financial Services Company, Senior Vice President and Associate General Counsel |
| | | |
Susan A. Pereira (4)
(born 11/05/70) | | Assistant Secretary and Assistant Clerk | | July 2005 | | Massachusetts Financial Services Company, Vice President and Senior Counsel |
| | | |
Mark N. Polebaum (4) (born 5/01/52) | | Secretary and Clerk | | February 2006 | | Massachusetts Financial Services Company, Executive Vice President, General Counsel and Secretary (since January 2006); Wilmer Cutler Pickering Hale and Dorr LLP (law firm), Partner (until January 2006) |
| | | |
Frank L. Tarantino (born 3/07/44) | | Independent Chief Compliance Officer | | September 2004 | | Tarantino LLC (provider of compliance services), Principal |
| | | |
Richard S. Weitzel (4) (born 7/16/70) | | Assistant Secretary and Assistant Clerk | | October 2007 | | Massachusetts Financial Services Company, Vice President and Assistant General Counsel |
| | | |
James O. Yost (4) (born 6/12/60) | | Assistant Treasurer | | April 1992 | | Massachusetts Financial Services Company, Senior Vice President |
| (1) | Date first appointed to serve as Trustee/Officer of an MFS fund or a Compass variable account. Each Trustee has served continuously since appointment. For the period March 2008 until October 2008, Ms. DiOrioDwyer served as Treasurer of the Funds. |
| (2) | Directorships or trusteeships of companies required to report to the Securities and Exchange Commission (i.e., “public companies”). |
| (3) | “Interested person” of the Trust, within the meaning of the Investment Company Act of 1940 (referred to as the 1940 Act), which is the principal federal law governing investment companies like the Trust, as a result of position with Sun Life of Canada (U.S.). The address of Sun Life of Canada (U.S.) is One Sun Life Executive Park, Wellesley Hills, Massachusetts 02481. |
| (4) | “Interested person” of MFS within the meaning of the 1940 Act. The address of MFS is 500 Boylston Street, Boston, Massachusetts 02116. |
The Trust does not hold annual meetings for the purpose of electing Trustees, and Trustees are not elected for fixed terms. Each Trustee and officer holds office until his or her successor is chosen and qualified, or until his or her earlier death, resignation, retirement or removal.
All Trustees currently serve as Trustees of the Trust and have served in that capacity since originally elected or appointed. All of the Trustees are also Managers of the Compass Variable Accounts. The executive officers of the Trust hold similar offices for the Compass Variable Accounts and other funds in the MFS fund complex. As of January 1, 2011, each Trustee serves as a Trustee or Manager of 31 Accounts/Portfolios.
21
MFS Blended Research Growth Portfolio
Trustees and Officers – continued
The Statement of Additional Information contains further information about the Trustees and is available without charge upon request by calling 1-800-752-7215.
| | |
Investment Adviser
Massachusetts Financial Services Company 500 Boylston Street, Boston, MA 02116-3741 | | Custodian State Street Bank and Trust 1 Lincoln Street, Boston, MA 02111-2900 |
Distributor
MFS Fund Distributors, Inc. 500 Boylston Street, Boston, MA 02116-3741 | | Independent Registered Public Accounting Firm Deloitte & Touche LLP 200 Berkeley Street, Boston, MA 02116 |
Portfolio Manager Matthew Krummell | | |
22
MFS Blended Research Growth Portfolio
BOARD REVIEW OF INVESTMENT ADVISORY AGREEMENT
The Investment Company Act of 1940 requires that both the full Board of Trustees and a majority of the non-interested (“independent”) Trustees, voting separately, annually approve the continuation of the investment advisory agreement between MFS Variable Insurance Trust II (the “Trust”) and Massachusetts Financial Services Company (“MFS”) on behalf of the Fund. The Trustees consider matters bearing on the Fund and the advisory arrangement at their meetings throughout the year, including a review of performance data at each regular meeting. In addition, the independent Trustees met in person in May and again in July 2010 (“contract review meetings”) for the specific purpose of considering whether to approve the continuation of the investment advisory agreement for the Fund. The independent Trustees were assisted in their evaluation of the investment advisory agreement by independent legal counsel, from whom they received separate legal advice and with whom they met separately from MFS management during various contract review meetings. The independent Trustees were also assisted in this process by the Fund’s Independent Chief Compliance Officer, a full-time senior officer appointed by and reporting to the independent Trustees.
In connection with their deliberations, the Trustees, including the independent Trustees, considered such information and factors as they believed, in light of the legal advice furnished to them and their own business judgment, to be relevant. The investment advisory agreement was considered separately for the Fund, although the Trustees also took into account the common interests of all Funds in the Trust in their review. As described below, the Trustees considered the nature, quality, and extent of the various investment advisory, administrative, and shareholder services performed by MFS under the existing investment advisory agreement and other arrangements with the Trust.
In connection with their contract review meetings, the Trustees received and relied upon materials which included, among other items: (i) information provided by Lipper Inc. (“Lipper”) on the investment performance of the Fund for the one-year period ended December 31, 2009, compared to the investment performance of a group of funds with substantially similar investment classifications/objectives (the “Lipper performance universe”), (ii) information provided by Lipper on the Fund’s advisory fees and other expenses compared to the advisory fees and other expenses of comparable funds identified by Lipper (the “Lipper expense group”), (iii) information provided by MFS on the advisory fees of comparable portfolios of its other clients, including institutional separate account and other clients, (iv) information as to whether, and to what extent applicable, expense waivers, reimbursements or fee “breakpoints” are observed for the Fund, (v) information regarding MFS’ financial results and financial condition, including MFS’ and certain of its affiliates’ estimated profitability from services performed for the Fund, (vi) MFS’ views regarding the outlook for the mutual fund industry and its strategic business plans, (vii) descriptions of various functions performed by MFS for the Trust, such as compliance monitoring and portfolio trading practices, and (viii) information regarding the overall organization of MFS, including information about MFS’ senior management and other personnel providing investment advisory, administrative and other services to the Fund. The comparative performance, fee and expense information prepared and provided by Lipper was not independently verified, and the independent Trustees did not independently verify any information provided to them by MFS.
The Trustees’ conclusion as to the continuation of the investment advisory agreement was based on comprehensive consideration of all information provided to the Trustees and was not the result of any single factor. Some of the factors that figured particularly in the Trustees’ deliberations are described below for the Fund, while individual Trustees may have given different weight to various factors and evaluated the information presented as a whole differently than another individual Trustee. The Trustees recognized that the fee arrangements for the Fund reflect years of review and discussion between the independent Trustees and MFS, that certain aspects of such arrangements may receive greater scrutiny in some years than others, and that the Trustees’ conclusions may be based, in part, on their consideration of these same arrangements during the course of the year and in prior years.
Based on information provided by Lipper, the Trustees compared the Fund’s total return investment performance to the performance of the Lipper performance universe over the one year period ended December 31, 2009. (The Fund commenced operations in December 2007.) The Trustees placed particular emphasis on the total return performance of the Fund’s Initial Class shares in comparison to the performance of funds in its Lipper performance universe over the one-year period. The Trustees did not rely on performance results for more recent periods, including those shown elsewhere in this report.
The Trustees noted the performance of the Fund’s Initial Class shares was in the 3rd quintile relative to the other funds in the Lipper performance universe for the one-year period (the 1st quintile being the best performers and the 5th quintile being the worst performers). Based on the nature and quality of services provided by MFS, the Board of Trustees concluded that the Fund’s performance was satisfactory.
In the course of their deliberations, the Trustees took into account information provided by MFS during contract review meetings, as well as during investment review meetings conducted with portfolio management personnel during the course of the year.
23
MFS Blended Research Growth Portfolio
Board Review of Investment Advisory Agreement – continued
In assessing the reasonableness of the Fund’s advisory fee, the Trustees considered, among other information, the Fund’s advisory fee and the total expense ratio of the Fund’s Initial Class shares as a percentage of average daily net assets, compared to the advisory fee and total expense ratios of its peer group of funds based on information provided by Lipper. The Trustees also considered the advisory fees charged by MFS to institutional accounts. In comparing these fees, the Trustees considered the generally broader scope of services provided by MFS to the Trust than those provided to institutional accounts. The Trustees also considered the higher demands placed on MFS’ investment personnel and trading infrastructure as a result of the daily cash in-flows and out-flows of the Fund, and the impact on MFS and related expenses due to the more extensive regulatory regime to which the Fund is subject, compared to institutional accounts.
In considering the fees, the Trustees noted from the Lipper data that the Fund’s effective advisory fee rate and total expense ratio were each below the median of such fees and expenses of funds in the Lipper expense group. In addition, the Trustees accepted MFS’ offer to continue the expense limitation for the Fund. They noted that the Fund’s advisory fee rate schedule is not currently subject to any breakpoints. However, the Trustees concluded that the Fund was still too small to achieve economies of scale and that the fees were reasonable in light of the nature and quality of services provided by MFS.
The Trustees also considered information prepared by MFS relating to its costs and profits with respect to the Fund and other investment companies and accounts advised by MFS, as well as MFS’ methodologies used to determine and allocate its costs to the Fund and other accounts and products for purposes of estimating profitability.
After reviewing these and other factors described below, the Trustees concluded that the advisory fees charged to the Fund represent reasonable compensation in light of the nature and quality of the services being provided by MFS.
In addition, the Trustees considered MFS’ resources and related efforts to continue to retain, attract and motivate capable personnel to serve the Fund. The Trustees also considered the financial resources of MFS and its parent, Sun Life Financial Inc. The Trustees further considered any advantages and possible disadvantages of having an adviser which also serves other investment companies as well as institutional accounts.
The Trustees also considered the nature, quality, cost, and extent of administrative, transfer agency, and distribution services provided to the Fund by MFS and its affiliates under agreements and plans other than the investment advisory agreement, including the 12b-1 fees the Fund pays to MFS Fund Distributors, Inc., an affiliate of MFS. The Trustees also considered the nature, extent and quality of certain other services MFS performs or arranges on the Fund’s behalf, which may include securities lending programs, directed expense payment programs, class action recovery programs, and MFS’ interaction with third-party service providers, principally custodians and sub-custodians. The Trustees concluded that the various non-advisory services provided by MFS and its affiliates on behalf of the Fund were satisfactory. The Trustees also considered the benefits to MFS from the use of the Fund’s portfolio brokerage commissions to pay for investment research and various other factors. Additionally, the Trustees considered so-called “fall-out benefits” to MFS such as reputational value derived from serving as investment manager to the Trust, and determined that any such benefits derived by MFS were reasonable and fair.
Based on their evaluation of factors that they deemed to be material, including those factors described above, the Board of Trustees, including a majority of the independent Trustees, concluded that the investment advisory agreement should be continued for an additional one-year period, commencing September 1, 2010.
A discussion regarding the Board’s most recent review and renewal of the fund’s Investment Advisory Agreement with MFS is available by clicking on the fund’s name under “Variable Insurance Portfolios — VIT II” in the “Products and Performance” section of the MFS Web site (mfs.com).
24
MFS Blended Research Growth Portfolio
PROXY VOTING POLICIES AND INFORMATION
A general description of the MFS funds’ proxy voting policies and procedures is available without charge, upon request, by calling
1-800-225-2606, by visiting the Proxy Voting section of mfs.com or by visiting the SEC’s Web site at http://www.sec.gov.
Information regarding how the fund voted proxies relating to portfolio securities during the most recent twelve-month period ended June 30 is available without charge by visiting the Proxy Voting section of mfs.com or by visiting the SEC’s Web site at http://www.sec.gov.
QUARTERLY PORTFOLIO DISCLOSURE
The fund will file a complete schedule of portfolio holdings with the Securities and Exchange Commission (the Commission) for the first and third quarters of each fiscal year on Form N-Q. The fund’s Form N-Q may be reviewed and copied at the:
Public Reference Room
Securities and Exchange Commission
100 F Street, NE, Room 1580
Washington, D.C. 20549
Information on the operation of the Public Reference Room may be obtained by calling the Commission at 1-800-SEC-0330. The fund’s Form N-Q is available on the EDGAR database on the Commission’s Internet Web site at http://www.sec.gov, and copies of this information may be obtained, upon payment of a duplicating fee, by electronic request at the following e-mail address: publicinfo@sec.gov or by writing the Public Reference Section at the above address.
FURTHER INFORMATION
From time to time, MFS may post important information about the fund or the MFS funds on the MFS web site (mfs.com). This information is available by visiting the “News & Commentary” section of mfs.com or by clicking on the fund’s name under “Variable Insurance Portfolios — VIT II” in the “Products and Performance” section of mfs.com.
FEDERAL TAX INFORMATION (unaudited)
The following information is provided pursuant to provisions of the Internal Revenue Code.
For corporate shareholders 100% of the ordinary income dividends paid during the fiscal year qualify for the corporate dividends received deduction.
25
MFS Blended Research Growth Portfolio
MFS® PRIVACY NOTICE
Privacy is a concern for every investor today. At MFS Investment Management® and the MFS funds, we take this concern very seriously. We want you to understand our policies about the investment products and services that we offer, and how we protect the nonpublic personal information of investors who have a direct relationship with us and our wholly owned subsidiaries.
Throughout our business relationship, you provide us with personal information. We maintain information and records about you, your investments, and the services you use. Examples of the nonpublic personal information we maintain include
| | Ÿ | | data from investment applications and other forms |
| | Ÿ | | share balances and transactional history with us, our affiliates, or others |
| | Ÿ | | facts from a consumer reporting agency |
We do not disclose any nonpublic personal information about our customers or former customers to anyone, except as permitted by law. We may share nonpublic personal information with third parties or certain of our affiliates in connection with servicing your account or processing your transactions. We may share information with companies or financial institutions that perform marketing services on our behalf or with other financial institutions with which we have joint marketing arrangements, subject to any legal requirements.
Authorization to access your nonpublic personal information is limited to appropriate personnel who provide products, services, or information to you. We maintain physical, electronic, and procedural safeguards to help protect the personal information we collect about you.
If you have any questions about the MFS privacy policy, please call 1-800-225-2606 any business day.
Note: If you own MFS products or receive MFS services in the name of a third party such as a bank or broker-dealer, their privacy policy may apply to you instead of ours.
26


MFS® BLENDED RESEARCH® VALUE PORTFOLIO
The report is prepared for the general information of contract owners. It is authorized for distribution to prospective investors only when preceded or accompanied by a current prospectus.
NOT FDIC INSURED Ÿ MAY LOSE VALUE Ÿ NO BANK GUARANTEE Ÿ NOT A DEPOSIT Ÿ NOT INSURED BY ANY FEDERAL GOVERNMENT AGENCY OR NCUA/NCUSIF
MFS Blended Research Value Portfolio
LETTER FROM THE CEO

Dear Contract Owners:
After an extended rebound in the financial markets, uncertainty returned in 2010 as investors began to question the durability of the recovery for global economies and markets. That uncertainty led to increased risk aversion, especially as investors saw the eurozone struggle with the debt woes of many of its members. In September, the U.S. Federal Reserve Board’s promises to further loosen monetary policy helped assuage market fears and drive asset prices off their recent lows. A combination of solid earnings and improving economic data gave an additional boost to investor sentiment. As we enter 2011, we are cautiously optimistic that economic growth will continue to improve and that the global economies will recover from the shocks of the past few years. We expect the pace of recovery worldwide will be uneven and volatile.
As always, we continue to be mindful of the many economic challenges faced at the local, national, and international levels. It is in times such as these that we want to remind investors of the merits of maintaining a long-term view, adhering to basic investing principles such as asset allocation and diversification, and working closely with their advisors to research and identify appropriate investment opportunities.
Respectfully,

Robert J. Manning
Chairman and Chief Executive Officer
MFS Investment Management®
February 14, 2011
The opinions expressed in this letter are subject to change, may not be relied upon for investment advice, and no forecasts can be guaranteed.
1
MFS Blended Research Value Portfolio
PORTFOLIO COMPOSITION
Portfolio structure

| | | | |
| Top ten holdings | | | | |
| Chevron Corp. | | | 3.9% | |
| AT&T, Inc. | | | 3.4% | |
| Wells Fargo & Co. | | | 3.1% | |
| JPMorgan Chase & Co. | | | 3.1% | |
| Bank of America Corp. | | | 3.0% | |
| Pfizer, Inc. | | | 2.2% | |
| General Electric Co. | | | 1.9% | |
| Johnson & Johnson | | | 1.8% | |
| Procter & Gamble Co. | | | 1.7% | |
| Prudential Financial, Inc. | | | 1.7% | |
| | | | |
| Equity sectors | | | | |
| Financial Services | | | 27.3% | |
| Health Care | | | 12.7% | |
| Utilities & Communications | | | 11.9% | |
| Energy | | | 10.7% | |
| Consumer Staples | | | 9.9% | |
| Leisure | | | 6.8% | |
| Industrial Goods & Services | | | 6.4% | |
| Basic Materials | | | 3.4% | |
| Technology | | | 3.3% | |
| Retailing | | | 3.2% | |
| Autos & Housing | | | 1.8% | |
| Transportation | | | 1.5% | |
| Special Products & Services | | | 0.3% | |
Percentages are based on net assets as of 12/31/10.
The portfolio is actively managed and current holdings may be different.
2
MFS Blended Research Value Portfolio
MANAGEMENT REVIEW
Summary of Results
For the twelve months ended December 31, 2010, Initial Class shares of the MFS Blended Research Value Portfolio (the “fund”) provided a total return of 15.77%, while Service Class shares of the fund provided a total return of 15.51%. These compare with a return of 15.51% for the fund’s benchmark, the Russell 1000 Value Index.
Market Environment
The first quarter of the reporting period witnessed a continuation of the financial market and macroeconomic rebounds that had begun in early 2009. These recoveries in global activity and asset valuations were generally synchronized around the world, led importantly by emerging Asian economies, but broadening to include most of the global economy to varying degrees. Primary drivers of the recoveries included an unwinding of the inventory destocking that took place earlier, the production of manufacturing and capital goods, as well as massive fiscal and monetary stimulus.
During most of the remainder of the period, heightened risk surrounding the public-debt profiles of several of the peripheral European countries impaired market sentiment. At the same time, the improving trend in global macroeconomic data began to weaken somewhat. These two dynamics caused many asset prices to retrench significantly, as many questioned the durability of the global recovery.
Towards the end of the period, the U.S. Federal Reserve led markets to believe that further monetary loosening would be forthcoming if macroeconomic activity did not show signs of improvement. The prospects for more easing by the Fed improved market sentiment and drove risk-asset prices markedly higher. However, in a text-book case of “buy the rumor, sell the fact,” the weeks following the early November announcement of further quantitative easing saw a sell-off in U.S. Treasury bonds. This rise in Treasury yields occurred despite risk-off behavior in equities and credit markets (which would normally result in Treasury yield compression), and appears to have been the result of a few factors: signs of improved U.S. and global economic activity; opposition to quantitative easing from some quarters; and crowded long positions in U.S. Treasuries. The December agreement on an expansionary U.S. fiscal package also boosted sentiment, leading markets to reach near-term highs in risky asset valuations toward year end.
Contributors to Performance
Stock selection in the leisure sector boosted performance relative to the Russell 1000 Value Index. Holdings of casino resorts operator Las Vegas Sands, cruise line operator Royal Caribbean Cruises, entertainment and communications services company Virgin Media (United Kingdom), and media firm Time Warner Cable (h) were among the fund’s top relative contributors. Shares of Royal Caribbean rose as the company reported strong revenues driven by beneficial foreign exchange rates, cost controls throughout the company, and no disturbances from the traditional hurricane season.
Stock selection in the industrial goods & services sector was another positive. The fund’s overweight positions in bearings and assemblies manufacturer Timken and electrical products manufacturer Wesco International benefited performance as both stocks outperformed the benchmark over the reporting period. Shares of Timken appreciated due to better-than-expected earnings results. The company attributed the positive results to strong demand in their mobile and steel businesses and increased sales in Asia.
Stock selection in the retailing sector also contributed to relative performance. The fund’s holdings of specialty retailer Limited Brands (h) and department stores operator Macy’s aided results. Shares of Limited Brands appreciated as the company experienced a rise in same store sales that beat expectations. In addition, the company announced a special dividend along with a new share repurchase program.
Elsewhere, the fund’s holdings of iron ore miner Cliffs Natural Resources and oil and gas drilling equipment manufacturer National Oilwell Varco benefited performance. Shares of National Oilwell Varco rose as the company posted better-than-expected earnings stemming from high oil and gas activity across North America.
Detractors from Performance
Stock selection in the consumer staples sector detracted from relative performance. The timing of our ownership in beverage manufacturer and distributor Dr Pepper Snapple Group and holdings of weak-performing oilseeds, corn, and wheat processor Archer Daniels Midland (h) hindered results.
Stocks in other sectors that held back relative returns included financial services firm Bank of America, power generation company NRG Energy, consumer electronics retailer Best Buy (b), computer hard drive maker Western Digital (h), global power company AES Corp. (h), and electric company PPL Corp. Shares of Western Digital declined as the company’s management
3
MFS Blended Research Value Portfolio
Management Review – continued
announced earnings that fell short of expectations. The company experienced weakness in European and consumer demand, increased pricing pressure within the industry, and shifts in market share among competitors. The timing of our ownership in financial services firm Citigroup, and not holding strong-performing aerospace company Boeing, also detracted from performance.
Respectfully,
Jonathan Sage
Portfolio Manager
| (b) | Security is not a benchmark constituent. |
| (h) | Security was not held in the portfolio at period end. |
The views expressed in this report are those of the portfolio manager only through the end of the period of the report as stated on the cover and do not necessarily reflect the views of MFS or any other person in the MFS organization. These views are subject to change at any time based on market or other conditions, and MFS disclaims any responsibility to update such views. These views may not be relied upon as investment advice or an indication of trading intent on behalf of any MFS portfolio. References to specific securities are not recommendations of such securities, and may not be representative of any MFS portfolio’s current or future investments.
4
MFS Blended Research Value Portfolio
PERFORMANCE SUMMARY THROUGH 12/31/10
The following chart illustrates the historical performance of the fund in comparison to its benchmark(s). Benchmarks are unmanaged and may not be invested in directly. Benchmark returns do not reflect any fees or expenses. The performance of other share classes will be greater than or less than that of the class depicted below. (See Notes to Performance Summary.)
Performance data shown represents past performance and is no guarantee of future results. Investment return and principal value fluctuate so your units, when sold, may be worth more or less than the original cost; current performance may be lower or higher than quoted. The performance shown does not reflect the deduction of taxes, if any, that a contract holder would pay on fund distributions or the redemption of contract units. The returns for the fund shown also do not reflect the deduction of expenses associated with variable products, such as mortality and expense risk charges, separate account charges, and sales charges imposed by the insurance company separate accounts. Such expenses would reduce the overall returns shown.
Growth of a Hypothetical $10,000 Investment (t)
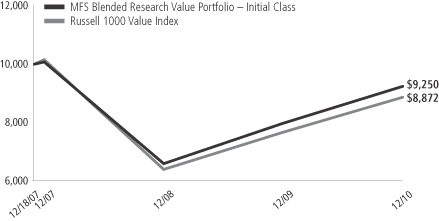
Total Returns through 12/31/10
Average annual total returns
| | | | | | | | | | |
| | | Share class | | Class inception date | | 1-yr | | Life (t) | | |
| | | Initial Class | | 12/18/07 | | 15.77% | | (2.53)% | | |
| | | Service Class | | 12/18/07 | | 15.51% | | (2.79)% | | |
| | | |
| Comparative benchmark | | | | | | |
| | | Russell 1000 Value Index (f) | | 15.51% | | (3.84)% | | |
| (f) | Source: FactSet Research Systems Inc. |
| (t) | For the period from the class inception date through the stated period end. (See Notes to Performance Summary.) |
Benchmark Definition
Russell 1000 Value Index – constructed to provide a comprehensive barometer for the value securities in the large-cap segment of the U.S. equity universe. Companies in this index generally have lower price-to-book ratios and lower forecasted growth values.
It is not possible to invest directly in an index.
Notes to Performance Summary
Average annual total return represents the average annual change in value for each share class for the periods presented. Life returns are presented where the share class has less than 10 years of performance history and represent the average annual total return from the class inception date to the stated period end date.
Performance results reflect any applicable expense subsidies and waivers in effect during the periods shown. Without such subsidies and waivers the fund’s performance results would be less favorable. Please see the prospectus and financial statements for complete details. All results are historical and assume the reinvestment of any dividends and capital gains distributions.
From time to time the fund may receive proceeds from litigation settlements, without which performance would be lower.
5
MFS Blended Research Value Portfolio
EXPENSE TABLE
Fund Expenses Borne by the Contract Holders During the Period,
July 1, 2010 through December 31, 2010
As a contract holder of the fund, you incur ongoing costs, including management fees; distribution and/or service (12b-1) fees; and other fund expenses. This example is intended to help you understand your ongoing costs (in dollars) of investing in the fund and to compare these costs with the ongoing costs of investing in other mutual funds.
The example is based on an investment of $1,000 invested at the beginning of the period and held for the entire period July 1, 2010 through December 31, 2010.
Actual Expenses
The first line for each share class in the following table provides information about actual account values and actual expenses. You may use the information in this line, together with the amount you invested, to estimate the expenses that you paid over the period. Simply divide your account value by $1,000 (for example, an $8,600 account value divided by $1,000 = 8.6), then multiply the result by the number in the first line under the heading entitled “Expenses Paid During Period” to estimate the expenses you paid on your account during this period.
Hypothetical Example for Comparison Purposes
The second line for each share class in the following table provides information about hypothetical account values and hypothetical expenses based on the fund’s actual expense ratio and an assumed rate of return of 5% per year before expenses, which is not the fund’s actual return. The hypothetical account values and expenses may not be used to estimate the actual ending account balance or expenses you paid for the period. You may use this information to compare the ongoing costs of investing in the fund and other funds. To do so, compare this 5% hypothetical example with the 5% hypothetical examples that appear in the shareholder reports of the other funds.
Please note that the expenses shown in the table are meant to highlight the fund’s ongoing costs only and do not take into account the fees and expenses imposed under the variable contracts through which your investment in the fund is made. Therefore, the second line for each share class in the table is useful in comparing ongoing costs associated with an investment in vehicles (such as the fund) which fund benefits under variable annuity and variable life insurance contracts and to qualified pension and retirement plans only, and will not help you determine the relative total costs of investing in the fund through variable annuity and variable life insurance contracts. If the fees and expenses imposed under the variable contracts were included, your costs would have been higher.
| | | | | | | | | | | | | | | | | | |
| Share Class | | | | Annualized
Expense Ratio | | | Beginning
Account Value
7/01/10 | | | Ending
Account Value
12/31/10 | | | Expenses Paid
During Period (p)
7/01/10-12/31/10 | |
| Initial Class | | Actual | | | 0.60% | | | | $1,000.00 | | | | $1,220.42 | | | | $3.36 | |
| | Hypothetical (h) | | | 0.60% | | | | $1,000.00 | | | | $1,022.18 | | | | $3.06 | |
| Service Class | | Actual | | | 0.85% | | | | $1,000.00 | | | | $1,217.68 | | | | $4.75 | |
| | Hypothetical (h) | | | 0.85% | | | | $1,000.00 | | | | $1,020.92 | | | | $4.33 | |
| (h) | 5% class return per year before expenses. |
| (p) | Expenses paid is equal to each class’ annualized expense ratio, as shown above, multiplied by the average account value over the period, multiplied by the number of days in the period, divided by the number of days in the year. |
6
MFS Blended Research Value Portfolio
PORTFOLIO OF INVESTMENTS – 12/31/10
The Portfolio of Investments is a complete list of all securities owned by your fund. It is categorized by broad-based asset classes.
| | | | | | | | |
| Issuer | | Shares/Par | | | Value ($) | |
| | | | | | | | |
| COMMON STOCKS – 99.2% | | | | | | | | |
| Aerospace – 2.1% | | | | | | | | |
| Lockheed Martin Corp. | | | 390 | | | $ | 27,260 | |
| Northrop Grumman Corp. | | | 1,090 | | | | 70,610 | |
| | | | | | | | |
| | | | | | $ | 97,870 | |
| | | | | | | | |
| Airlines – 0.4% | | | | | | | | |
| Copa Holdings S.A., “A” | | | 320 | | | $ | 18,829 | |
| | | | | | | | |
| Automotive – 1.0% | | | | | | | | |
| Johnson Controls, Inc. | | | 1,160 | | | $ | 44,312 | |
| | | | | | | | |
| Biotechnology – 1.4% | | | | | | | | |
| Amgen, Inc. (a) | | | 1,180 | | | $ | 64,782 | |
| | | | | | | | |
| Broadcasting – 1.5% | | | | | | | | |
| CBS Corp., “B” | | | 3,270 | | | $ | 62,294 | |
| Walt Disney Co. | | | 180 | | | | 6,752 | |
| | | | | | | | |
| | | | | | $ | 69,046 | |
| | | | | | | | |
| Brokerage & Asset Managers – 1.1% | | | | | | | | |
| NASDAQ OMX Group, Inc. (a) | | | 2,050 | | | $ | 48,606 | |
| | | | | | | | |
| Business Services – 0.3% | | | | | | | | |
| Accenture Ltd., “A” | | | 290 | | | $ | 14,062 | |
| | | | | | | | |
| Cable TV – 2.2% | | | | | | | | |
| Comcast Corp., “A” | | | 1,110 | | | $ | 24,387 | |
| DIRECTV, “A” (a) | | | 570 | | | | 22,760 | |
| Virgin Media, Inc. | | | 2,050 | | | | 55,842 | |
| | | | | | | | |
| | | | | | $ | 102,989 | |
| | | | | | | | |
| Chemicals – 2.3% | | | | | | | | |
| Celanese Corp. | | | 640 | | | $ | 26,349 | |
| E.I. du Pont de Nemours & Co. | | | 1,570 | | | | 78,312 | |
| | | | | | | | |
| | | | | | $ | 104,661 | |
| | | | | | | | |
| Computer Software – 1.3% | | | | | | | | |
| Microsoft Corp. | | | 2,210 | | | $ | 61,703 | |
| | | | | | | | |
| Construction – 0.8% | | | | | | | | |
| Owens Corning (a) | | | 1,160 | | | $ | 36,134 | |
| | | | | | | | |
| Consumer Products – 3.6% | | | | | | | | |
| Energizer Holdings, Inc. (a) | | | 840 | | | $ | 61,236 | |
| Newell Rubbermaid, Inc. | | | 1,280 | | | | 23,270 | |
| Procter & Gamble Co. | | | 1,240 | | | | 79,769 | |
| | | | | | | | |
| | | | | | $ | 164,275 | |
| | | | | | | | |
| Electrical Equipment – 2.4% | | | | | | | | |
| General Electric Co. | | | 4,850 | | | $ | 88,707 | |
| WESCO International, Inc. (a) | | | 400 | | | | 21,120 | |
| | | | | | | | |
| | | | | | $ | 109,827 | |
| | | | | | | | |
| Electronics – 1.6% | | | | | | | | |
| Linear Technology Corp. | | | 800 | | | $ | 27,672 | |
| Microchip Technology, Inc. | | | 1,310 | | | | 44,815 | |
| | | | | | | | |
| | | | | | $ | 72,487 | |
| | | | | | | | |
| | | | | | | | |
| Issuer | | Shares/Par | | | Value ($) | |
| | | | | | | | |
| COMMON STOCKS – continued | |
| Energy – Independent – 1.1% | | | | | | | | |
| Apache Corp. | | | 420 | | | $ | 50,077 | |
| | | | | | | | |
| Energy – Integrated – 8.3% | | | | | | | | |
| Chevron Corp. | | | 1,960 | | | $ | 178,850 | |
| ConocoPhillips | | | 650 | | | | 44,265 | |
| Exxon Mobil Corp. | | | 930 | | | | 68,002 | |
| Hess Corp. | | | 710 | | | | 54,343 | |
| Marathon Oil Corp. | | | 1,010 | | | | 37,400 | |
| | | | | | | | |
| | | | | | $ | 382,860 | |
| | | | | | | | |
| Engineering – Construction – 0.3% | | | | | | | | |
| KBR, Inc. | | | 430 | | | $ | 13,102 | |
| | | | | | | | |
| Food & Beverages – 4.9% | | | | | | | | |
| Bunge Ltd. | | | 990 | | | $ | 64,865 | |
| Coca-Cola Co. | | | 360 | | | | 23,677 | |
| Dr Pepper Snapple Group, Inc. | | | 1,580 | | | | 55,553 | |
| General Mills, Inc. | | | 1,140 | | | | 40,573 | |
| Smithfield Foods, Inc. (a) | | | 2,050 | | | | 42,292 | |
| | | | | | | | |
| | | | | | $ | 226,960 | |
| | | | | | | | |
| Gaming & Lodging – 1.7% | | | | | | | | |
| Las Vegas Sands Corp. (a) | | | 370 | | | $ | 17,002 | |
| Royal Caribbean Cruises Ltd. (a) | | | 1,320 | | | | 62,040 | |
| | | | | | | | |
| | | | | | $ | 79,042 | |
| | | | | | | | |
| General Merchandise – 1.3% | | | | | | | | |
| Macy’s, Inc. | | | 2,350 | | | $ | 59,455 | |
| | | | | | | | |
| Health Maintenance Organizations – 1.8% | | | | | |
| Aetna, Inc. | | | 1,350 | | | $ | 41,189 | |
| Humana, Inc. (a) | | | 750 | | | | 41,055 | |
| | | | | | | | |
| | | | | | $ | 82,244 | |
| | | | | | | | |
| Insurance – 8.5% | | | | | | | | |
| ACE Ltd. | | | 390 | | | $ | 24,278 | |
| Aflac, Inc. | | | 1,020 | | | | 57,559 | |
| Allied World Assurance Co. | | | 960 | | | | 57,062 | |
| Aon Corp. | | | 540 | | | | 24,845 | |
| Berkshire Hathaway, Inc., “B” (a) | | | 610 | | | | 48,867 | |
| Chubb Corp. | | | 450 | | | | 26,838 | |
| Prudential Financial, Inc. | | | 1,340 | | | | 78,671 | |
| Travelers Cos., Inc. | | | 1,300 | | | | 72,423 | |
| | | | | | | | |
| | | | | | $ | 390,543 | |
| | | | | | | | |
| Leisure & Toys – 0.8% | | | | | | | | |
| Activision Blizzard, Inc. | | | 3,150 | | | $ | 39,186 | |
| | | | | | | | |
| Machinery & Tools – 1.2% | | | | | | | | |
| Timken Co. | | | 1,180 | | | $ | 56,321 | |
| | | | | | | | |
| Major Banks – 12.0% | | | | | | | | |
| Bank of America Corp. | | | 10,342 | | | $ | 137,962 | |
| Bank of New York Mellon Corp. | | | 1,100 | | | | 33,220 | |
| Goldman Sachs Group, Inc. | | | 390 | | | | 65,582 | |
| JPMorgan Chase & Co. | | | 3,330 | | | | 141,259 | |
7
MFS Blended Research Value Portfolio
Portfolio of Investments – continued
| | | | | | | | |
| Issuer | | Shares/Par | | | Value ($) | |
| | | | | | | | |
| COMMON STOCKS – continued | | | | | |
| Major Banks – continued | | | | | | | | |
| PNC Financial Services Group, Inc. | | | 510 | | | $ | 30,967 | |
| Wells Fargo & Co. | | | 4,610 | | | | 142,864 | |
| | | | | | | | |
| | | | | | $ | 551,854 | |
| | | | | | | | |
| Medical & Health Technology & Services – 2.3% | | | | | |
| Cardinal Health, Inc. | | | 1,070 | | | $ | 40,992 | |
| Lincare Holdings, Inc. | | | 1,005 | | | | 26,964 | |
| McKesson Corp. | | | 560 | | | | 39,413 | |
| | | | | | | | |
| | | | | | $ | 107,369 | |
| | | | | | | | |
| Medical Equipment – 1.0% | | | | | | | | |
| St. Jude Medical, Inc. (a) | | | 540 | | | $ | 23,085 | |
| Thermo Fisher Scientific, Inc. (a) | | | 400 | | | | 22,144 | |
| | | | | | | | |
| | | | | | $ | 45,229 | |
| | | | | | | | |
| Metals & Mining – 1.1% | | | | | | | | |
| Cliffs Natural Resources, Inc. | | | 660 | | | $ | 51,487 | |
| | | | | | | | |
| Natural Gas – Pipeline – 1.0% | | | | | | | | |
| El Paso Corp. | | | 3,360 | | | $ | 46,234 | |
| | | | | | | | |
| Network & Telecom – 0.4% | | | | | | | | |
| Tellabs, Inc. | | | 2,770 | | | $ | 18,781 | |
| | | | | | | | |
| Oil Services – 1.3% | | | | | | | | |
| National Oilwell Varco, Inc. | | | 920 | | | $ | 61,870 | |
| | | | | | | | |
| Other Banks & Diversified Financials – 3.0% | |
| American Express Co. | | | 960 | | | $ | 41,203 | |
| Capital One Financial Corp. | | | 1,150 | | | | 48,944 | |
| Citigroup, Inc. (a) | | | 9,880 | | | | 46,732 | |
| | | | | | | | |
| | | | | | $ | 136,879 | |
| | | | | | | | |
| Pharmaceuticals – 6.2% | | | | | | | | |
| Abbott Laboratories | | | 910 | | | $ | 43,598 | |
| Endo Pharmaceuticals Holdings, Inc. (a) | | | 870 | | | | 31,068 | |
| Johnson & Johnson | | | 1,320 | | | | 81,642 | |
| Merck & Co., Inc. | | | 840 | | | | 30,274 | |
| Pfizer, Inc. | | | 5,700 | | | | 99,807 | |
| | | | | | | | |
| | | | | | $ | 286,389 | |
| | | | | | | | |
| Pollution Control – 0.4% | | | | | | | | |
| Republic Services, Inc. | | | 562 | | | $ | 16,781 | |
| | | | | | | | |
| Railroad & Shipping – 1.1% | | | | | | | | |
| CSX Corp. | | | 800 | | | $ | 51,688 | |
| | | | | | | | |
| Real Estate – 2.7% | | | | | | | | |
| Annaly Mortgage Management, Inc., REIT | | | 2,890 | | | $ | 51,789 | |
| Equity Residential, REIT | | | 630 | | | | 32,729 | |
| Mack-Cali Realty Corp., REIT | | | 1,240 | | | | 40,994 | |
| | | | | | | | |
| | | | | | $ | 125,512 | |
| | | | | | | | |
| Restaurants – 0.6% | | | | | | | | |
| Darden Restaurants, Inc. | | | 600 | | | $ | 27,864 | |
| | | | | | | | |
| | | | | | | | |
| Issuer | | Shares/Par | | | Value ($) | |
| | | | | | | | |
| COMMON STOCKS – continued | |
| Specialty Stores – 1.9% | | | | | | | | |
| Best Buy Co., Inc. | | | 990 | | | $ | 33,947 | |
| IAC/InterActiveCorp (a) | | | 430 | | | | 12,341 | |
| Limited Brands, Inc. | | | 1,350 | | | | 41,486 | |
| | | | | | | | |
| | | | | | $ | 87,774 | |
| | | | | | | | |
| Telecommunications – Wireless – 0.4% | |
| Sprint Nextel Corp. (a) | | | 4,530 | | | $ | 19,162 | |
| | | | | | | | |
| Telephone Services – 4.2% | | | | | | | | |
| AT&T, Inc. | | | 5,360 | | | $ | 157,477 | |
| CenturyLink, Inc. | | | 387 | | | | 17,868 | |
| Verizon Communications, Inc. | | | 570 | | | | 20,395 | |
| | | | | | | | |
| | | | | | $ | 195,740 | |
| | | | | | | | |
| Tobacco – 1.4% | | | | | | | | |
| Reynolds American, Inc. | | | 1,940 | | | $ | 63,283 | |
| | | | | | | | |
| Utilities – Electric Power – 6.3% | | | | | | | | |
| Dominion Resources, Inc. | | | 350 | | | $ | 14,952 | |
| Edison International | | | 520 | | | | 20,072 | |
| Integrys Energy Group, Inc. | | | 940 | | | | 45,599 | |
| NRG Energy, Inc. (a) | | | 2,670 | | | | 52,172 | |
| PG&E Corp. | | | 1,210 | | | | 57,886 | |
| PPL Corp. | | | 930 | | | | 24,478 | |
| Public Service Enterprise Group, Inc. | | | 860 | | | | 27,357 | |
| Wisconsin Energy Corp. | | | 790 | | | | 46,499 | |
| | | | | | | | |
| | | | | | $ | 289,015 | |
| | | | | | | | |
Total Common Stocks
(Identified Cost, $4,453,760) | | | | | | $ | 4,572,284 | |
| | | | | | | | |
| MONEY MARKET FUNDS (v) – 1.1% | |
| MFS Institutional Money Market Portfolio, 0.18%, at Cost and Net Asset Value | | | 51,719 | | | $ | 51,719 | |
| | | | | | | | |
Total Investments
(Identified Cost, $4,505,479) | | | | | | $ | 4,624,003 | |
| | | | | | | | |
OTHER ASSETS, LESS
LIABILITIES – (0.3)% | | | | | | | (16,063 | ) |
| | | | | | | | |
| Net Assets – 100.0% | | | | | | $ | 4,607,940 | |
| | | | | | | | |
| (a) | | Non-income producing security. |
| (v) | | Underlying fund that is available only to investment companies managed by MFS. The rate quoted is the annualized seven-day yield of the fund at period end. |
The following abbreviations are used in this report and are defined:
| REIT | | Real Estate Investment Trust |
See Notes to Financial Statements
8
MFS Blended Research Value Portfolio
FINANCIAL STATEMENTS | STATEMENT OF ASSETS AND LIABILITIES
This statement represents your fund’s balance sheet, which details the assets and liabilities comprising the total value of the fund.
| | | | | | | | |
At 12/31/10 | | | | | | | | |
Assets | | | | | | | | |
Investments – | | | | | | | | |
Non-affiliated issuers, at value (identified cost, $4,453,760) | | | $4,572,284 | | | | | |
Underlying funds, at cost and value | | | 51,719 | | | | | |
Total investments, at value (identified cost, $4,505,479) | | | $4,624,003 | | | | | |
Receivables for dividends | | | 7,161 | | | | | |
Receivable from investment adviser | | | 12,380 | | | | | |
Other assets | | | 290 | | | | | |
Total assets | | | | | | | $4,643,834 | |
Liabilities | | | | | | | | |
Payable to affiliates | | | | | | | | |
Investment adviser | | | $152 | | | | | |
Shareholder servicing costs | | | 2 | | | | | |
Distribution and/or service fees | | | 31 | | | | | |
Administrative services fee | | | 55 | | | | | |
Payable for Trustees’ compensation | | | 3 | | | | | |
Accrued expenses and other liabilities | | | 35,651 | | | | | |
Total liabilities | | | | | | | $35,894 | |
Net assets | | | | | | | $4,607,940 | |
Net assets consist of | | | | | | | | |
Paid-in capital | | | $5,228,305 | | | | | |
Unrealized appreciation (depreciation) on investments | | | 118,524 | | | | | |
Accumulated net realized gain (loss) on investments | | | (738,889 | ) | | | | |
Net assets | | | | | | | $4,607,940 | |
Shares of beneficial interest outstanding | | | | | | | 533,201 | |
| | | | | | | | | | | | |
| | | Net assets | | | Shares
outstanding | | | Net asset value
per share | |
Initial Class | | | $2,312,710 | | | | 267,648 | | | | $8.64 | |
Service Class | | | 2,295,230 | | | | 265,553 | | | | 8.64 | |
See Notes to Financial Statements
9
MFS Blended Research Value Portfolio
FINANCIAL STATEMENTS | STATEMENT OF OPERATIONS
This statement describes how much your fund earned in investment income and accrued in expenses. It also describes any gains and/or losses generated by fund operations.
| | | | | | | | |
Year ended 12/31/10 | | | | | | | | |
Net investment income | | | | | | | | |
Income | | | | | | | | |
Dividend income | | | $100,683 | | | | | |
Dividends from underlying funds | | | 109 | | | | | |
Total investment income | | | | | | | $100,792 | |
Expenses | | | | | | | | |
Management fee | | | $24,929 | | | | | |
Distribution and/or service fees | | | 5,178 | | | | | |
Shareholder servicing costs | | | 483 | | | | | |
Administrative services fee | | | 10,000 | | | | | |
Trustees’ compensation | | | 530 | | | | | |
Custodian fee | | | 5,406 | | | | | |
Shareholder communications | | | 4,800 | | | | | |
Auditing fees | | | 48,572 | | | | | |
Legal fees | | | 7,088 | | | | | |
Miscellaneous | | | 9,293 | | | | | |
Total expenses | | | | | | | $116,279 | |
Reduction of expenses by investment adviser | | | (86,124 | ) | | | | |
Net expenses | | | | | | | $30,155 | |
Net investment income | | | | | | | $70,637 | |
Realized and unrealized gain (loss) on investments | | | | | | | | |
Realized gain (loss) on investment transactions (identified cost basis) | | | | | | | $214,305 | |
Change in unrealized appreciation (depreciation) on investments | | | | | | | $339,872 | |
Net realized and unrealized gain (loss) on investments | | | | | | | $554,177 | |
Change in net assets from operations | | | | | | | $624,814 | |
See Notes to Financial Statements
10
MFS Blended Research Value Portfolio
FINANCIAL STATEMENTS | STATEMENTS OF CHANGES IN NET ASSETS
These statements describe the increases and/or decreases in net assets resulting from operations, any distributions, and any shareholder transactions.
| | | | | | | | |
For years ended 12/31 | | | 2010 | | | | 2009 | |
Change in net assets | | | | | | | | |
From operations | | | | | | | | |
Net investment income | | | $70,637 | | | | $69,546 | |
Net realized gain (loss) on investments | | | 214,305 | | | | (400,738 | ) |
Net unrealized gain (loss) on investments | | | 339,872 | | | | 1,015,945 | |
Change in net assets from operations | | | $624,814 | | | | $684,753 | |
Distributions declared to shareholders | | | | | | | | |
From net investment income | | | $(72,000 | ) | | | $(69,546 | ) |
From tax return of capital | | | — | | | | (2,958 | ) |
Total distributions declared to shareholders | | | $(72,000 | ) | | | $(72,504 | ) |
Change in net assets from fund share transactions | | | $72,000 | | | | $72,504 | |
Total change in net assets | | | $624,814 | | | | $684,753 | |
Net assets | | | | | | | | |
At beginning of period | | | 3,983,126 | | | | 3,298,373 | |
At end of period | | | $4,607,940 | | | | $3,983,126 | |
See Notes to Financial Statements
11
MFS Blended Research Value Portfolio
FINANCIAL STATEMENTS | FINANCIAL HIGHLIGHTS
The financial highlights table is intended to help you understand the fund’s financial performance for the past 5 years (or life of a particular share class, if shorter). Certain information reflects financial results for a single fund share. The total returns in the table represent the rate by which an investor would have earned (or lost) on an investment in the fund share class (assuming reinvestment of all distributions) held for the entire period.
| | | | | | | | | | | | | | | | |
| Initial Class | | Years ended 12/31 | |
| | | 2010 | | | 2009 | | | 2008 | | | 2007 (c) | |
Net asset value, beginning of period | | | $7.59 | | | | $6.40 | | | | $10.07 | | | | $10.00 | |
| Income (loss) from investment operations | | | | | | | | | | | | | | | | |
Net investment income (d) | | | $0.14 | | | | $0.14 | | | | $0.18 | | | | $0.01 | |
Net realized and unrealized gain (loss) on investments | | | 1.06 | | | | 1.20 | | | | (3.66 | ) | | | 0.07 | |
Total from investment operations | | | $1.20 | | | | $1.34 | | | | $(3.48 | ) | | | $0.08 | |
| Less distributions declared to shareholders | | | | | | | | | | | | | | | | |
From net investment income | | | $(0.15 | ) | | | $(0.14 | ) | | | $(0.17 | ) | | | $(0.01 | ) |
From net realized gain on investments | | | — | | | | — | | | | — | | | | (0.00 | )(w) |
From tax return of capital | | | — | | | | (0.01 | ) | | | (0.02 | ) | | | (0.00 | )(w) |
Total distributions declared to shareholders | | | $(0.15 | ) | | | $(0.15 | ) | | | $(0.19 | ) | | | $(0.01 | ) |
Net asset value, end of period | | | $8.64 | | | | $7.59 | | | | $6.40 | | | | $10.07 | |
Total return (%) (k)(r)(s) | | | 15.77 | | | | 20.90 | | | | (34.44 | ) | | | 0.80 | (n) |
Ratios (%) (to average net assets) and Supplemental data: | | | | | | | | | | | | | | | | |
Expenses before expense reductions (f) | | | 2.67 | | | | 2.96 | | | | 2.79 | | | | 10.80 | (a) |
Expenses after expense reductions (f) | | | 0.60 | | | | 0.60 | | | | 0.60 | | | | 0.60 | (a) |
Net investment income | | | 1.82 | | | | 2.17 | | | | 2.10 | | | | 2.22 | (a) |
Portfolio turnover | | | 65 | | | | 50 | | | | 49 | | | | 0 | |
Net assets at end of period (000 omitted) | | | $2,313 | | | | $1,997 | | | | $1,651 | | | | $2,519 | |
See Notes to Financial Statements
12
MFS Blended Research Value Portfolio
Financial Highlights – continued
| | | | | | | | | | | | | | | | |
| Service Class | | Years ended 12/31 | |
| | | 2010 | | | 2009 | | | 2008 | | | 2007 (c) | |
Net asset value, beginning of period | | | $7.59 | | | | $6.40 | | | | $10.07 | | | | $10.00 | |
| Income (loss) from investment operations | | | | | | | | | | | | | | | | |
Net investment income (d) | | | $0.12 | | | | $0.13 | | | | $0.16 | | | | $0.01 | |
Net realized and unrealized gain (loss) on investments | | | 1.06 | | | | 1.19 | | | | (3.66 | ) | | | 0.07 | |
Total from investment operations | | | $1.18 | | | | $1.32 | | | | $(3.50 | ) | | | $0.08 | |
| Less distributions declared to shareholders | | | | | | | | | | | | | | | | |
From net investment income | | | $(0.13 | ) | | | $(0.13 | ) | | | $(0.16 | ) | | | $(0.01 | ) |
From net realized gain on investments | | | — | | | | — | | | | — | | | | (0.00 | )(w) |
From tax return of capital | | | — | | | | (0.00 | )(w) | | | (0.01 | ) | | | (0.00 | )(w) |
Total distributions declared to shareholders | | | $(0.13 | ) | | | $(0.13 | ) | | | $(0.17 | ) | | | $(0.01 | ) |
Net asset value, end of period | | | $8.64 | | | | $7.59 | | | | $6.40 | | | | $10.07 | |
Total return (%) (k)(r)(s) | | | 15.51 | | | | 20.64 | | | | (34.66 | ) | | | 0.80 | (n) |
Ratios (%) (to average net assets) and Supplemental data: | | | | | | | | | | | | | | | | |
Expenses before expense reductions (f) | | | 2.92 | | | | 3.21 | | | | 3.04 | | | | 11.05 | (a) |
Expenses after expense reductions (f) | | | 0.85 | | | | 0.85 | | | | 0.85 | | | | 0.85 | (a) |
Net investment income | | | 1.57 | | | | 1.95 | | | | 1.85 | | | | 1.97 | (a) |
Portfolio turnover | | | 65 | | | | 50 | | | | 49 | | | | 0 | |
Net assets at end of period (000 omitted) | | | $2,295 | | | | $1,986 | | | | $1,647 | | | | $2,519 | |
| (c) | For the period from the commencement of the fund’s investment operations, December 18, 2007, through the stated period end. |
| (d) | Per share data is based on average shares outstanding. |
| (f) | Ratios do not reflect reductions from fees paid indirectly, if applicable. |
| (k) | The total return does not reflect expenses that apply to separate accounts. Inclusion of these charges would reduce the total return figures for all periods shown. |
| (r) | Certain expenses have been reduced without which performance would have been lower. |
| (s) | From time to time the fund may receive proceeds from litigation settlements, without which performance would be lower. |
| (w) | Per share amount was less than $0.01. |
See Notes to Financial Statements
13
MFS Blended Research Value Portfolio
NOTES TO FINANCIAL STATEMENTS
| (1) | | Business and Organization |
MFS Blended Research Value Portfolio (the fund) is a series of MFS Variable Insurance Trust II (the trust). The trust is organized as a Massachusetts business trust and is registered under the Investment Company Act of 1940, as amended, as an open-end management investment company. Except as otherwise described in Note 3, the shareholders of each series of the trust are separate accounts of insurance companies, which offer variable annuity and/or life insurance products, and qualified retirement and pension plans.
| (2) | | Significant Accounting Policies |
General – The preparation of financial statements in conformity with U.S. generally accepted accounting principles requires management to make estimates and assumptions that affect the reported amounts of assets and liabilities, and disclosure of contingent assets and liabilities at the date of the financial statements and the reported amounts of revenues and expenses during the reporting period. Actual results could differ from those estimates. In the preparation of these financial statements, management has evaluated subsequent events occurring after the date of the fund’s Statement of Assets and Liabilities through the date that the financial statements were issued. The fund invests in foreign securities, including securities of emerging market issuers. Investments in foreign securities are vulnerable to the effects of changes in the relative values of the local currency and the U.S. dollar and to the effects of changes in each country’s legal, political, and economic environment. The markets of emerging markets countries are generally more volatile than the markets of developed countries with more mature economies. All of the risks of investing in foreign securities previously described are heightened when investing in emerging markets countries.
Investment Valuations – Equity securities, including restricted equity securities, are generally valued at the last sale or official closing price as provided by a third-party pricing service on the market or exchange on which they are primarily traded. Equity securities, for which there were no sales reported that day, are generally valued at the last quoted daily bid quotation as provided by a third-party pricing service on the market or exchange on which such securities are primarily traded. Equity securities held short, for which there were no sales reported for that day, are generally valued at the last quoted daily ask quotation as provided by a third-party pricing service on the market or exchange on which such securities are primarily traded. Short-term instruments with a maturity at issuance of 60 days or less generally are valued at amortized cost, which approximates market value. Open-end investment companies are generally valued at net asset value per share. Securities and other assets generally valued on the basis of information from a third-party pricing service may also be valued at a broker/dealer bid quotation. Values obtained from third-party pricing services can utilize both transaction data and market information such as yield, quality, coupon rate, maturity, type of issue, trading characteristics, and other market data. The values of foreign securities and other assets and liabilities expressed in foreign currencies are converted to U.S. dollars using the mean of bid and asked prices for rates provided by a third-party pricing service.
The Board of Trustees has delegated primary responsibility for determining or causing to be determined the value of the fund’s investments (including any fair valuation) to the adviser pursuant to valuation policies and procedures approved by the Board. If the adviser determines that reliable market quotations are not readily available, investments are valued at fair value as determined in good faith by the adviser in accordance with such procedures under the oversight of the Board of Trustees. Under the fund’s valuation policies and procedures, market quotations are not considered to be readily available for most types of debt instruments and floating rate loans and many types of derivatives. These investments are generally valued at fair value based on information from third-party pricing services. In addition, investments may be valued at fair value if the adviser determines that an investment’s value has been materially effected by events occurring after the close of the exchange or market on which the investment is principally traded (such as foreign exchange or market) and prior to the determination of the fund’s net asset value, or after the halting of trading of a specific security where trading does not resume prior to the close of the exchange or market on which the security is principally traded. Events that occur on a frequent basis after foreign markets close (such as developments in foreign markets and significant movements in the U.S. markets) and prior to the determination of the fund’s net asset value may be deemed to have a material effect on the value of securities traded in foreign markets. Accordingly, the fund’s foreign equity securities may often be valued at fair value. The adviser generally relies on third-party pricing services or other information (such as the correlation with price movements of similar securities in the same or other markets; the type, cost and investment characteristics of the security; the business and financial condition of the issuer; and trading and other market data) to assist in determining whether to fair value and at what value to fair value an investment. The value of an investment for purposes of calculating the fund’s net asset value can differ depending on the source and method used to determine value. When fair valuation is used, the value of an investment used to determine the fund’s net asset value may differ from quoted or published prices for the same investment. There can be no assurance that the fund could obtain the fair value assigned to an investment if it were to sell the investment at the same time at which the fund determines its net asset value per share.
14
MFS Blended Research Value Portfolio
Notes to Financial Statements – continued
Various inputs are used in determining the value of the fund’s assets or liabilities. These inputs are categorized into three broad levels. In certain cases, the inputs used to measure fair value may fall into different levels of the fair value hierarchy. In such cases, an investment’s level within the fair value hierarchy is based on the lowest level of input that is significant to the fair value measurement. The fund’s assessment of the significance of a particular input to the fair value measurement in its entirety requires judgment, and considers factors specific to the investment. Level 1 includes unadjusted quoted prices in active markets for identical assets or liabilities. Level 2 includes other significant observable market-based inputs (including quoted prices for similar securities, interest rates, prepayment speed, and credit risk). Level 3 includes unobservable inputs, which may include the adviser’s own assumptions in determining the fair value of investments. The following is a summary of the levels used as of December 31, 2010 in valuing the fund’s assets or liabilities:
| | | | | | | | | | | | | | | | |
| Investments at Value | | Level 1 | | | Level 2 | | | Level 3 | | | Total | |
| Equity Securities | | | $4,572,284 | | | | $— | | | | $— | | | | $4,572,284 | |
| Mutual Funds | | | 51,719 | | | | — | | | | — | | | | 51,719 | |
| Total Investments | | | $4,624,003 | | | | $— | | | | $— | | | | $4,624,003 | |
For further information regarding security characteristics, see the Portfolio of Investments.
Indemnifications – Under the fund’s organizational documents, its officers and Trustees may be indemnified against certain liabilities and expenses arising out of the performance of their duties to the fund. Additionally, in the normal course of business, the fund enters into agreements with service providers that may contain indemnification clauses. The fund’s maximum exposure under these agreements is unknown as this would involve future claims that may be made against the fund that have not yet occurred.
Investment Transactions and Income – Investment transactions are recorded on the trade date. Dividends received in cash are recorded on the ex-dividend date. Certain dividends from foreign securities will be recorded when the fund is informed of the dividend if such information is obtained subsequent to the ex-dividend date. Dividend and interest payments received in additional securities are recorded on the ex-dividend or ex-interest date in an amount equal to the value of the security on such date.
The fund may receive proceeds from litigation settlements. Any proceeds received from litigation involving portfolio holdings are reflected in the Statement of Operations in realized gain/loss if the security has been disposed of by the fund or in unrealized gain/loss if the security is still held by the fund. Any other proceeds from litigation not related to portfolio holdings are reflected as other income in the Statement of Operations.
Fees Paid Indirectly – The fund’s custody fee may be reduced according to an arrangement that measures the value of cash deposited with the custodian by the fund. For the year ended December 31, 2010, custody fees were not reduced.
Tax Matters and Distributions – The fund intends to qualify as a regulated investment company, as defined under Subchapter M of the Internal Revenue Code, and to distribute all of its taxable income, including realized capital gains. As a result, no provision for federal income tax is required. The fund’s federal tax returns for the prior three fiscal years remain subject to examination by the Internal Revenue Service. Foreign taxes, if any, have been accrued by the fund in the accompanying financial statements.
Distributions to shareholders are recorded on the ex-dividend date. Income and capital gain distributions are determined in accordance with income tax regulations, which may differ from U.S. generally accepted accounting principles. Certain capital accounts in the financial statements are periodically adjusted for permanent differences in order to reflect their tax character. These adjustments have no impact on net assets or net asset value per share. Temporary differences which arise from recognizing certain items of income, expense, gain or loss in different periods for financial statement and tax purposes will reverse at some time in the future. Distributions in excess of net investment income or net realized gains are temporary overdistributions for financial statement purposes resulting from differences in the recognition or classification of income or distributions for financial statement and tax purposes.
During the year ended December 31, 2010, there were no significant adjustments due to differences between book and tax accounting.
The tax character of distributions declared to shareholders for the last two fiscal years is as follows:
| | | | | | | | |
| | | 12/31/10 | | | 12/31/09 | |
| Ordinary income (including any short-term capital gains) (a) | | | $72,000 | | | | $69,546 | |
| Tax return of capital (b) | | | — | | | | 2,958 | |
| Total distributions | | | $72,000 | | | | $72,504 | |
| | (a) | Included in the fund’s 2010 distributions from ordinary income is $1,363 in excess of investment company taxable income, which in accordance with applicable U.S. tax law, is taxable to shareholders as ordinary income distributions. | |
| | (b) | Distributions in excess of tax basis earnings and profits are reported in the financial statements as a tax return of capital. | |
15
MFS Blended Research Value Portfolio
Notes to Financial Statements – continued
The federal tax cost and the tax basis components of distributable earnings were as follows:
| | | | |
| As of 12/31/10 | | | | |
| Cost of investments | | | $4,507,788 | |
| Gross appreciation | | | 451,772 | |
| Gross depreciation | | | (335,557 | ) |
| Net unrealized appreciation (depreciation) | | | $116,215 | |
| Capital loss carryforwards | | | (736,580 | ) |
As of December 31, 2010, the fund had capital loss carryforwards available to offset future realized gains. Such losses expire as follows:
| | | | |
| 12/31/16 | | | $(177,391 | ) |
| 12/31/17 | | | (559,189 | ) |
| Total | | | $(736,580 | ) |
Multiple Classes of Shares of Beneficial Interest – The fund offers multiple classes of shares, which differ in their respective distribution and/or service fees. The fund’s income, realized and unrealized gain (loss), and common expenses are allocated to shareholders based on the daily net assets of each class. Dividends are declared separately for each class. Differences in per share dividend rates are generally due to differences in separate class expenses. The fund’s distributions declared to shareholders as reported on the Statements of Changes in Net Assets are presented by class as follows:
| | | | | | | | | | | | | | | | |
| | | From net investment
income | | | From tax return of
capital | |
| | | Year ended
12/31/10 | | | Year ended
12/31/09 | | | Year ended
12/31/10 | | | Year ended
12/31/09 | |
| Initial Class | | | $38,696 | | | | $36,943 | | | | $— | | | | $1,482 | |
| Service Class | | | 33,304 | | | | 32,603 | | | | — | | | | 1,476 | |
| Total | | | $72,000 | | | | $69,546 | | | | $— | | | | $2,958 | |
| (3) | | Transactions with Affiliates |
Investment Adviser – The fund has an investment advisory agreement with MFS to provide overall investment management and related administrative services and facilities to the fund. The management fee is computed daily and paid monthly at an annual rate of 0.60% of the fund’s average daily net assets.
The investment adviser has agreed in writing to pay a portion of the fund’s operating expenses, exclusive of interest, taxes, extraordinary expenses, brokerage and transaction costs and investment-related expenses, such that the operating expenses of the fund do not exceed 0.60% of average daily net assets for the Initial Class shares and 0.85% of average daily net assets for the Service Class shares. This written agreement will continue until April 30, 2012. For the year ended December 31, 2010, this reduction amounted to $86,124 and is reflected as a reduction of total expenses in the Statement of Operations.
Distributor – MFS Fund Distributors, Inc. (MFD), a wholly-owned subsidiary of MFS, is the distributor of shares of the fund. The Trustees have adopted a distribution plan for the Service Class shares pursuant to Rule 12b-1 under the Investment Company Act of 1940.
The fund’s distribution plan provides that the fund will pay MFD distribution and/or service fees equal to 0.25% per annum of its average daily net assets attributable to Service Class shares as partial consideration for services performed and expenses incurred by MFD and financial intermediaries (including participating insurance companies that invest in the fund to fund variable annuity and variable life insurance contracts, sponsors of qualified retirement and pension plans that invest in the fund, and affiliates of these participating insurance companies and plan sponsors) in connection with the sale and distribution of the Service Class shares. MFD may subsequently pay all, or a portion, of the distribution and/or service fees to financial intermediaries.
Shareholder Servicing Agent – MFS Service Center, Inc. (MFSC), a wholly-owned subsidiary of MFS, receives a fee from the fund for its services as shareholder servicing agent. For the year ended December 31, 2010, the fee was $480, which equated to 0.0115% annually of the fund’s average daily net assets. MFSC also receives payment from the fund for out-of-pocket expenses paid by MFSC on behalf of the fund. For the year ended December 31, 2010, these costs amounted to $3.
Administrator – MFS provides certain financial, legal, shareholder communications, compliance, and other administrative services to the fund. Under an administrative services agreement, the fund partially reimburses MFS the costs incurred to
16
MFS Blended Research Value Portfolio
Notes to Financial Statements – continued
provide these services. The fund is charged an annual fixed amount of $10,000 plus a fee based on average daily net assets. The administrative services fee incurred for the year ended December 31, 2010 was equivalent to an annual effective rate of 0.2406% of the fund’s average daily net assets.
Trustees’ and Officers’ Compensation – The fund pays compensation to Trustees in the form of a retainer, attendance fees, and additional compensation to the Board chairperson. The fund does not pay compensation directly to officers of the fund who are also officers of the investment adviser, all of whom receive remuneration for their services to the fund from MFS. Certain officers of the fund are officers or directors of MFS, MFD, and MFSC.
Other – This fund and certain other funds managed by MFS (the funds) have entered into services agreements (the Agreements) which provide for payment of fees by the funds to Tarantino LLC and Griffin Compliance LLC in return for the provision of services of an Independent Chief Compliance Officer (ICCO) and Assistant ICCO, respectively, for the funds. The ICCO and Assistant ICCO are officers of the funds and the sole members of Tarantino LLC and Griffin Compliance LLC, respectively. The funds can terminate the Agreements with Tarantino LLC and Griffin Compliance LLC at any time under the terms of the Agreements. MFS has agreed to bear all expenses associated with office space, other administrative support, and supplies provided to the ICCO and Assistant ICCO. For the year ended December 31, 2010, the aggregate fees paid by the fund to Tarantino LLC and Griffin Compliance LLC were $65 and are included in miscellaneous expense on the Statement of Operations.
The fund invests in the MFS Institutional Money Market Portfolio which is managed by MFS and seeks a high level of current income consistent with preservation of capital and liquidity. Income earned on this investment is included in dividends from underlying funds on the Statement of Operations. This money market fund does not pay a management fee to MFS.
On December 18, 2007, MFS purchased 250,000 shares of both the Initial Class and Service Class for an aggregate amount of $5,000,000. At December 31, 2010, MFS was the sole shareholder of both classes.
Purchases and sales of investments, other than U.S. Government securities, purchased option transactions, and short-term obligations, aggregated $2,722,338 and $2,651,040, respectively.
| (5) | | Shares of Beneficial Interest |
The fund’s Declaration of Trust permits the Trustees to issue an unlimited number of full and fractional shares of beneficial interest. Transactions in fund shares were as follows:
| | | | | | | | | | | | | | | | |
| | | Year ended 12/31/10 | | | Year ended 12/31/09 | |
| | | Shares | | | Amount | | | Shares | | | Amount | |
| Shares issued to shareholders in reinvestment of distributions | | | | | | | | | | | | | | | | |
Initial Class | | | 4,479 | | | | $38,696 | | | | 5,009 | | | | $38,425 | |
Service Class | | | 3,855 | | | | 33,304 | | | | 4,438 | | | | 34,079 | |
| | | 8,334 | | | | $72,000 | | | | 9,447 | | | | $72,504 | |
The fund and certain other funds managed by MFS participate in a $1.1 billion unsecured committed line of credit, subject to a $1 billion sublimit, provided by a syndication of banks under a credit agreement. Borrowings may be made for temporary financing needs. Interest is charged to each fund, based on its borrowings, generally at a rate equal to the higher of the Federal Reserve funds rate or one month LIBOR plus an agreed upon spread. A commitment fee, based on the average daily, unused portion of the committed line of credit, is allocated among the participating funds at the end of each calendar quarter. In addition, the fund and other funds managed by MFS have established unsecured uncommitted borrowing arrangements with certain banks for temporary financing needs. Interest is charged to each fund, based on its borrowings, at a rate equal to the Federal Reserve funds rate plus an agreed upon spread. For the year ended December 31, 2010, the fund’s commitment fee and interest expense were $46 and $0, respectively, and are included in miscellaneous expense on the Statement of Operations.
17
MFS Blended Research Value Portfolio
Notes to Financial Statements – continued
| (7) | | Transactions in Underlying Funds – Affiliated Issuers |
An affiliated issuer may be considered one in which the fund owns 5% or more of the outstanding voting securities, or a company which is under common control. For the purposes of this report, the fund assumes the following to be affiliated issuers:
| | | | | | | | | | | | | | | | |
| Underlying Funds | | Beginning
Shares/Par
Amount | | | Acquisitions
Shares/Par
Amount | | | Dispositions
Shares/Par
Amount | | | Ending
Shares/Par
Amount | |
| MFS Institutional Money Market Portfolio | | | 57,659 | | | | 152,722 | | | | (158,662 | ) | | | 51,719 | |
| | | | |
| Underlying Funds | | Realized
Gain (Loss) | | | Capital Gain
Distributions | | | Dividend
Income | | | Ending
Value | |
| MFS Institutional Money Market Portfolio | | | $— | | | | $— | | | | $109 | | | | $51,719 | |
18
MFS Blended Research Value Portfolio
REPORT OF INDEPENDENT REGISTERED PUBLIC ACCOUNTING FIRM
To the Board of Trustees of MFS Variable Insurance Trust II and the Shareholder of
MFS Blended Research Value Portfolio:
We have audited the accompanying statement of assets and liabilities, including the portfolio of investments, of MFS Blended Research Value Portfolio (the “Fund”) (one of the portfolios comprising MFS Variable Insurance Trust II) as of December 31, 2010, and the related statement of operations for the year then ended, the statements of changes in net assets for each of the two years in the period then ended, and the financial highlights for each of the periods presented. These financial statements and financial highlights are the responsibility of the Fund’s management. Our responsibility is to express an opinion on these financial statements and financial highlights based on our audits.
We conducted our audits in accordance with the standards of the Public Company Accounting Oversight Board (United States). Those standards require that we plan and perform the audit to obtain reasonable assurance about whether the financial statements and financial highlights are free of material misstatement. The Fund is not required to have, nor were we engaged to perform, an audit of its internal control over financial reporting. Our audits included consideration of internal control over financial reporting as a basis for designing audit procedures that are appropriate in the circumstances, but not for the purpose of expressing an opinion on the effectiveness of the Fund’s internal control over financial reporting. Accordingly, we express no such opinion. An audit also includes examining, on a test basis, evidence supporting the amounts and disclosures in the financial statements, assessing the accounting principles used and significant estimates made by management, as well as evaluating the overall financial statement presentation. Our procedures included confirmation of securities owned as of December 31, 2010, by correspondence with the custodian. We believe that our audits provide a reasonable basis for our opinion.
In our opinion, the financial statements and financial highlights referred to above present fairly, in all material respects, the financial position of MFS Blended Research Value Portfolio as of December 31, 2010, the results of its operations for the year then ended, the changes in its net assets for each of the two years in the period then ended, and the financial highlights for each of the periods presented, in conformity with accounting principles generally accepted in the United States of America.
DELOITTE & TOUCHE LLP
Boston, Massachusetts
February 14, 2011
19
MFS Blended Research Value Portfolio
TRUSTEES AND OFFICERS – IDENTIFICATION AND BACKGROUND
The Trustees and officers of the Trust, as of February 1, 2011, are listed below, together with their principal occupations during the past five years. (Their titles may have varied during that period.) The address of each Trustee and officer is 500 Boylston Street, Boston, Massachusetts 02116.
| | | | | | |
Name, Date of Birth | | Position(s) Held
with Fund | | Trustee/Officer
Since (1) | | Principal Occupations During the Past Five Years and
Other Directorships (2) |
| INTERESTED TRUSTEE | | | | |
David D. Horn (3) (born 6/07/41) | | Trustee | | April 1986 | | Private investor; Sun Life Assurance Company of Canada, Senior Vice President and General Manager for the United States (until 1997); Director (until March 2004) |
| | |
| INDEPENDENT TRUSTEES | | | | |
J. Kermit Birchfield (born 1/08/40) | | Chairman | | May 1997 | | Consultant; Century Partners, Inc. (investments), Director; Displaytech, Inc. (technology), Chairman; Dessin Fournir LLC (furniture manufacturer), Director; Site Watch LLC (software to monitor oil tanks), Managing Director (2006 to present); Juridica Investments (fund investing in judicial matters), Director (2007 to present), Immuno Science, Inc. (medical research), Independent Director (2009 to present), Intermountain Industries, Inc. (oil & gas exploration and production), Director (until February 2009) |
| | | |
Robert C. Bishop (born 1/13/43) | | Trustee | | May 2001 | | AutoImmune, Inc. (pharmaceutical product development), Chairman, President and Chief Executive Officer; Caliper Life Sciences Corp. (laboratory analytical instruments), Chairman; Optobionics Corporation (ophthalmic devices), Director (until 2007); Millipore Corporation (purification/filtration products), Director (until July 2010); Waterstreet Capital (leverage buyouts), Advisory Board (until August 2010) |
| | | |
Frederick H. Dulles (born 3/12/42) | | Trustee | | May 2001 | | Dulles International Law LLC (law firm), Senior Lawyer (since 2009); Juridica Capital Management (US) Inc. (litigation financing), Vice President and General Counsel (since 2009); Dulles Properties LLC (real estate), Broker (since 2008); The Citadel School of Business Administration (education), Adjunct Professor (since 2003); Disher, Hamrick & Myers Residential, Inc. (real estate), Broker (until 2006); Frederick H. Dulles Law Practice (law firm), (until 2006); Charlestown School of Law (education), Adjunct Professor (until 2007); Prudential Carolina Real Estate, (real estate), Broker (until 2008); Free Enterprise Foundation Inc. (research institute), Director & Secretary (until 2008); Ten State International Law PLLP (law firm), Of Counsel (until 2009) |
| | | |
Marcia A. Kean (born 6/30/48) | | Trustee | | April 2005 | | Feinstein Kean Healthcare (consulting), Chief Executive Officer |
| | | |
Ronald G. Steinhart (born 6/15/40) | | Trustee | | May 2001 | | Private investor; Penske Automotive Group (automotive retailer), Director; Animal Health International, Inc. (animal health products), Director (since 2007); Texas Industries (concrete/aggregates/cement), Director (since 2007); Susser Holdings Corporation (retail convenience stores and distributor of wholesale motor fuel), Director (since 2009); Prentiss Properties Trust (real estate investment trust), Director (until 2006); Penson Worldwide, Inc. (securities clearance), Director (until 2008) |
| | | |
Haviland Wright (born 7/21/48) | | Trustee | | May 2001 | | X-Change Corp. (multi-media web services), Director (since 2010); Nano Loa Inc. (liquid crystal displays), Director (until 2009); Profitability of Hawaii (software), Chief Development Officer (until 2010); Elixir Technologies Corporation (software), Director (until 2010) |
| | | |
| OFFICERS | | | | | | |
Maria F. DiOrioDwyer (4)
(born 12/01/58) | | President | | November 2005 | | Massachusetts Financial Services Company, Executive Vice President and Chief Regulatory Officer; Chief Compliance Officer (since December 2006) |
| | | |
| Christopher R. Bohane (4) (born 1/18/74) | | Assistant Secretary and Assistant Clerk | | July 2005 | | Massachusetts Financial Services Company, Vice President and Senior Counsel |
| | | |
John M. Corcoran (4) (born 4/13/65) | | Treasurer | | October 2008 | | Massachusetts Financial Services Company, Senior Vice President (since October 2008); State Street Bank and Trust (financial services provider), Senior Vice President, (until September 2008) |
| | | |
Ethan D. Corey (4) (born 11/21/63) | | Assistant Secretary and Assistant Clerk | | July 2005 | | Massachusetts Financial Services Company, Senior Vice President and Associate General Counsel |
| | | |
David L. DiLorenzo (4) (born 8/10/68) | | Assistant Treasurer | | July 2005 | | Massachusetts Financial Services Company, Vice President |
| | | |
Timothy M. Fagan (4) (born 7/10/68) | | Assistant Secretary and Assistant Clerk | | September 2005 | | Massachusetts Financial Services Company, Vice President and Senior Counsel |
| | | |
Mark D. Fischer (4) (born 10/27/70) | | Assistant Treasurer | | July 2005 | | Massachusetts Financial Services Company, Vice President |
20
MFS Blended Research Value Portfolio
Trustees and Officers – continued
| | | | | | |
Name, Date of Birth | | Position(s) Held
with Fund | | Trustee/Officer
Since (1) | | Principal Occupations During the Past Five Years and
Other Directorships (2) |
Robyn L. Griffin (born 7/04/75) | | Assistant Independent Chief Compliance Officer | | August 2008 | | Griffin Compliance LLC (provider of compliance services), Principal (since August 2008); State Street Corporation (financial services provider), Mutual Fund Administration Assistant Vice President (October 2006 – July 2008); Liberty Mutual Group (insurance), Personal Market Assistant Controller (April 2006 – October 2006); Deloitte & Touche LLP (professional services firm), Senior Manager (prior to April 2006) |
| | | |
Brian E. Langenfeld (4) (born 3/07/73) | | Assistant Secretary and Assistant Clerk | | May 2006 | | Massachusetts Financial Services Company, Vice President and Senior Counsel (since May 2006); John Hancock Advisers, LLC, Assistant Vice President and Counsel (until April 2006) |
| | | |
Ellen Moynihan (4) (born 11/13/57) | | Assistant Treasurer | | May 1997 | | Massachusetts Financial Services Company, Senior Vice President |
| | | |
Susan S. Newton (4) (born 3/07/50) | | Assistant Secretary and Assistant Clerk | | May 2005 | | Massachusetts Financial Services Company, Senior Vice President and Associate General Counsel |
| | | |
Susan A. Pereira (4)
(born 11/05/70) | | Assistant Secretary and Assistant Clerk | | July 2005 | | Massachusetts Financial Services Company, Vice President and Senior Counsel |
| | | |
Mark N. Polebaum (4) (born 5/01/52) | | Secretary and Clerk | | February 2006 | | Massachusetts Financial Services Company, Executive Vice President, General Counsel and Secretary (since January 2006); Wilmer Cutler Pickering Hale and Dorr LLP (law firm), Partner (until January 2006) |
| | | |
Frank L. Tarantino (born 3/07/44) | | Independent Chief Compliance Officer | | September 2004 | | Tarantino LLC (provider of compliance services), Principal |
| | | |
Richard S. Weitzel (4) (born 7/16/70) | | Assistant Secretary and Assistant Clerk | | October 2007 | | Massachusetts Financial Services Company, Vice President and Assistant General Counsel |
| | | |
James O. Yost (4) (born 6/12/60) | | Assistant Treasurer | | April 1992 | | Massachusetts Financial Services Company, Senior Vice President |
| (1) | Date first appointed to serve as Trustee/Officer of an MFS fund or a Compass variable account. Each Trustee has served continuously since appointment. For the period March 2008 until October 2008, Ms. DiOrioDwyer served as Treasurer of the Funds. |
| (2) | Directorships or trusteeships of companies required to report to the Securities and Exchange Commission (i.e., “public companies”). |
| (3) | “Interested person” of the Trust, within the meaning of the Investment Company Act of 1940 (referred to as the 1940 Act), which is the principal federal law governing investment companies like the Trust, as a result of position with Sun Life of Canada (U.S.). The address of Sun Life of Canada (U.S.) is One Sun Life Executive Park, Wellesley Hills, Massachusetts 02481. |
| (4) | “Interested person” of MFS within the meaning of the 1940 Act. The address of MFS is 500 Boylston Street, Boston, Massachusetts 02116. |
The Trust does not hold annual meetings for the purpose of electing Trustees, and Trustees are not elected for fixed terms. Each Trustee and officer holds office until his or her successor is chosen and qualified, or until his or her earlier death, resignation, retirement or removal.
All Trustees currently serve as Trustees of the Trust and have served in that capacity since originally elected or appointed. All of the Trustees are also Managers of the Compass Variable Accounts. The executive officers of the Trust hold similar offices for the Compass Variable Accounts and other funds in the MFS fund complex. As of January 1, 2011, each Trustee serves as a Trustee or Manager of 31 Accounts/Portfolios.
21
MFS Blended Research Value Portfolio
Trustees and Officers – continued
The Statement of Additional Information contains further information about the Trustees and is available without charge upon request by calling 1-800-752-7215.
| | |
Investment Adviser
Massachusetts Financial Services Company 500 Boylston Street, Boston, MA 02116-3741 | | Custodian State Street Bank and Trust 1 Lincoln Street, Boston, MA 02111-2900 |
Distributor
MFS Fund Distributors, Inc. 500 Boylston Street, Boston, MA 02116-3741 | | Independent Registered Public Accounting Firm Deloitte & Touche LLP 200 Berkeley Street, Boston, MA 02116 |
Portfolio Manager Jonathan Sage | | |
22
MFS Blended Research Value Portfolio
BOARD REVIEW OF INVESTMENT ADVISORY AGREEMENT
The Investment Company Act of 1940 requires that both the full Board of Trustees and a majority of the non-interested (“independent”) Trustees, voting separately, annually approve the continuation of the investment advisory agreement between MFS Variable Insurance Trust II (the “Trust”) and Massachusetts Financial Services Company (“MFS”) on behalf of the Fund. The Trustees consider matters bearing on the Fund and the advisory arrangement at their meetings throughout the year, including a review of performance data at each regular meeting. In addition, the independent Trustees met in person in May and again in July 2010 (“contract review meetings”) for the specific purpose of considering whether to approve the continuation of the investment advisory agreement for the Fund. The independent Trustees were assisted in their evaluation of the investment advisory agreement by independent legal counsel, from whom they received separate legal advice and with whom they met separately from MFS management during various contract review meetings. The independent Trustees were also assisted in this process by the Fund’s Independent Chief Compliance Officer, a full-time senior officer appointed by and reporting to the independent Trustees.
In connection with their deliberations, the Trustees, including the independent Trustees, considered such information and factors as they believed, in light of the legal advice furnished to them and their own business judgment, to be relevant. The investment advisory agreement was considered separately for the Fund, although the Trustees also took into account the common interests of all Funds in the Trust in their review. As described below, the Trustees considered the nature, quality, and extent of the various investment advisory, administrative, and shareholder services performed by MFS under the existing investment advisory agreement and other arrangements with the Trust.
In connection with their contract review meetings, the Trustees received and relied upon materials which included, among other items: (i) information provided by Lipper Inc. (“Lipper”) on the investment performance of the Fund for the one-year period ended December 31, 2009, compared to the investment performance of a group of funds with substantially similar investment classifications/objectives (the “Lipper performance universe”), (ii) information provided by Lipper on the Fund’s advisory fees and other expenses compared to the advisory fees and other expenses of comparable funds identified by Lipper (the “Lipper expense group”), (iii) information provided by MFS on the advisory fees of comparable portfolios of its other clients, including institutional separate account and other clients, (iv) information as to whether, and to what extent applicable, expense waivers, reimbursements or fee “breakpoints” are observed for the Fund, (v) information regarding MFS’ financial results and financial condition, including MFS’ and certain of its affiliates’ estimated profitability from services performed for the Fund, (vi) MFS’ views regarding the outlook for the mutual fund industry and its strategic business plans, (vii) descriptions of various functions performed by MFS for the Trust, such as compliance monitoring and portfolio trading practices, and (viii) information regarding the overall organization of MFS, including information about MFS’ senior management and other personnel providing investment advisory, administrative and other services to the Fund. The comparative performance, fee and expense information prepared and provided by Lipper was not independently verified, and the independent Trustees did not independently verify any information provided to them by MFS.
The Trustees’ conclusion as to the continuation of the investment advisory agreement was based on comprehensive consideration of all information provided to the Trustees and was not the result of any single factor. Some of the factors that figured particularly in the Trustees’ deliberations are described below for the Fund, while individual Trustees may have given different weight to various factors and evaluated the information presented as a whole differently than another individual Trustee. The Trustees recognized that the fee arrangements for the Fund reflect years of review and discussion between the independent Trustees and MFS, that certain aspects of such arrangements may receive greater scrutiny in some years than others, and that the Trustees’ conclusions may be based, in part, on their consideration of these same arrangements during the course of the year and in prior years.
Based on information provided by Lipper, the Trustees compared the Fund’s total return investment performance to the performance of the Lipper performance universe over the one year period ended December 31, 2009. (The Fund commenced operations in December 2007.) The Trustees placed particular emphasis on the total return performance of the Fund’s Initial Class shares in comparison to the performance of funds in its Lipper performance universe over the one-year period. The Trustees did not rely on performance results for more recent periods, including those shown elsewhere in this report.
The Trustees noted the performance of the Fund’s Initial Class shares was in the 4th quintile relative to the other funds in the Lipper performance universe for the one-year period (the 1st quintile being the best performers and the 5th quintile being the worst performers). Based on the nature and quality of services provided by MFS, the Board of Trustees concluded that the Fund’s performance was satisfactory.
In the course of their deliberations, the Trustees took into account information provided by MFS during contract review meetings, as well as during investment review meetings conducted with portfolio management personnel during the course of the year.
23
MFS Blended Research Value Portfolio
Board Review of Investment Advisory Agreement – continued
In assessing the reasonableness of the Fund’s advisory fee, the Trustees considered, among other information, the Fund’s advisory fee and the total expense ratio of the Fund’s Initial Class shares as a percentage of average daily net assets, compared to the advisory fee and total expense ratios of its peer group of funds based on information provided by Lipper. The Trustees also considered the advisory fees charged by MFS to institutional accounts. In comparing these fees, the Trustees considered the generally broader scope of services provided by MFS to the Trust than those provided to institutional accounts. The Trustees also considered the higher demands placed on MFS’ investment personnel and trading infrastructure as a result of the daily cash in-flows and out-flows of the Fund, and the impact on MFS and related expenses due to the more extensive regulatory regime to which the Fund is subject, compared to institutional accounts.
In considering the fees, the Trustees noted from the Lipper data that the Fund’s effective advisory fee rate and total expense ratio were each below the median of such fees and expenses of funds in the Lipper expense group. In addition, the Trustees accepted MFS’ offer to continue the expense limitation for the Fund. They noted that the Fund’s advisory fee rate schedule is not currently subject to any breakpoints. However, the Trustees concluded that the Fund was still too small to achieve economies of scale and that the fees were reasonable in light of the nature and quality of services provided by MFS.
The Trustees also considered information prepared by MFS relating to its costs and profits with respect to the Fund and other investment companies and accounts advised by MFS, as well as MFS’ methodologies used to determine and allocate its costs to the Fund and other accounts and products for purposes of estimating profitability.
After reviewing these and other factors described below, the Trustees concluded that the advisory fees charged to the Fund represent reasonable compensation in light of the nature and quality of the services being provided by MFS.
In addition, the Trustees considered MFS’ resources and related efforts to continue to retain, attract and motivate capable personnel to serve the Fund. The Trustees also considered the financial resources of MFS and its parent, Sun Life Financial Inc. The Trustees further considered any advantages and possible disadvantages of having an adviser which also serves other investment companies as well as institutional accounts.
The Trustees also considered the nature, quality, cost, and extent of administrative, transfer agency, and distribution services provided to the Fund by MFS and its affiliates under agreements and plans other than the investment advisory agreement, including the 12b-1 fees the Fund pays to MFS Fund Distributors, Inc., an affiliate of MFS. The Trustees also considered the nature, extent and quality of certain other services MFS performs or arranges on the Fund’s behalf, which may include securities lending programs, directed expense payment programs, class action recovery programs, and MFS’ interaction with third-party service providers, principally custodians and sub-custodians. The Trustees concluded that the various non-advisory services provided by MFS and its affiliates on behalf of the Fund were satisfactory. The Trustees also considered the benefits to MFS from the use of the Fund’s portfolio brokerage commissions to pay for investment research and various other factors. Additionally, the Trustees considered so-called “fall-out benefits” to MFS such as reputational value derived from serving as investment manager to the Trust, and determined that any such benefits derived by MFS were reasonable and fair.
Based on their evaluation of factors that they deemed to be material, including those factors described above, the Board of Trustees, including a majority of the independent Trustees, concluded that the investment advisory agreement should be continued for an additional one-year period, commencing September 1, 2010.
A discussion regarding the Board’s most recent review and renewal of the fund’s Investment Advisory Agreement with MFS is available by clicking on the fund’s name under “Variable Insurance Portfolios — VIT II” in the “Products and Performance” section of the MFS Web site (mfs.com).
24
MFS Blended Research Value Portfolio
PROXY VOTING POLICIES AND INFORMATION
A general description of the MFS funds’ proxy voting policies and procedures is available without charge, upon request, by calling 1-800-225-2606, by visiting the Proxy Voting section of mfs.com or by visiting the SEC’s Web site at http://www.sec.gov.
Information regarding how the fund voted proxies relating to portfolio securities during the most recent twelve-month period ended June 30 is available without charge by visiting the Proxy Voting section of mfs.com or by visiting the SEC’s Web site at http://www.sec.gov.
QUARTERLY PORTFOLIO DISCLOSURE
The fund will file a complete schedule of portfolio holdings with the Securities and Exchange Commission (the Commission) for the first and third quarters of each fiscal year on Form N-Q. The fund’s Form N-Q may be reviewed and copied at the:
Public Reference Room
Securities and Exchange Commission
100 F Street, NE, Room 1580
Washington, D.C. 20549
Information on the operation of the Public Reference Room may be obtained by calling the Commission at 1-800-SEC-0330. The fund’s Form N-Q is available on the EDGAR database on the Commission’s Internet Web site at http://www.sec.gov, and copies of this information may be obtained, upon payment of a duplicating fee, by electronic request at the following e-mail address: publicinfo@sec.gov or by writing the Public Reference Section at the above address.
FURTHER INFORMATION
From time to time, MFS may post important information about the fund or the MFS funds on the MFS web site (mfs.com). This information is available by visiting the “News & Commentary” section of mfs.com or by clicking on the fund’s name under “Variable Insurance Portfolios — VIT II” in the “Products and Performance” section of mfs.com.
FEDERAL TAX INFORMATION (unaudited)
The following information is provided pursuant to provisions of the Internal Revenue Code.
For corporate shareholders, 100% of the ordinary income dividends paid during the fiscal year qualify for the corporate dividends received deduction.
25
MFS Blended Research Value Portfolio
MFS® PRIVACY NOTICE
Privacy is a concern for every investor today. At MFS Investment Management® and the MFS funds, we take this concern very seriously. We want you to understand our policies about the investment products and services that we offer, and how we protect the nonpublic personal information of investors who have a direct relationship with us and our wholly owned subsidiaries.
Throughout our business relationship, you provide us with personal information. We maintain information and records about you, your investments, and the services you use. Examples of the nonpublic personal information we maintain include
| | Ÿ | | data from investment applications and other forms |
| | Ÿ | | share balances and transactional history with us, our affiliates, or others |
| | Ÿ | | facts from a consumer reporting agency |
We do not disclose any nonpublic personal information about our customers or former customers to anyone, except as permitted by law. We may share nonpublic personal information with third parties or certain of our affiliates in connection with servicing your account or processing your transactions. We may share information with companies or financial institutions that perform marketing services on our behalf or with other financial institutions with which we have joint marketing arrangements, subject to any legal requirements.
Authorization to access your nonpublic personal information is limited to appropriate personnel who provide products, services, or information to you. We maintain physical, electronic, and procedural safeguards to help protect the personal information we collect about you.
If you have any questions about the MFS privacy policy, please call 1-800-225-2606 any business day.
Note: If you own MFS products or receive MFS services in the name of a third party such as a bank or broker-dealer, their privacy policy may apply to you instead of ours.
26

MFS® GLOBAL GROWTH PORTFOLIO
The report is prepared for the general information of contract owners. It is authorized for distribution to prospective investors only when preceded or accompanied by a current prospectus.
NOT FDIC INSURED Ÿ MAY LOSE VALUE Ÿ NO BANK GUARANTEE Ÿ NOT A DEPOSIT Ÿ NOT INSURED BY ANY FEDERAL GOVERNMENT AGENCY OR NCUA/NCUSIF
MFS Global Growth Portfolio
LETTER FROM THE CEO

Dear Contract Owners:
After an extended rebound in the financial markets, uncertainty returned in 2010 as investors began to question the durability of the recovery for global economies and markets. That uncertainty led to increased risk aversion, especially as investors saw the eurozone struggle with the debt woes of many of its members. In September, the U.S. Federal Reserve Board’s promises to further loosen monetary policy helped assuage market fears and drive asset prices off their recent lows. A combination of solid earnings and improving economic data gave an additional boost to investor sentiment. As we enter 2011, we are cautiously optimistic that economic growth will continue to improve and that the global economies will recover from the shocks of the past few years. We expect the pace of recovery worldwide will be uneven and volatile.
As always, we continue to be mindful of the many economic challenges faced at the local, national, and international levels. It is in times such as these that we want to remind investors of the merits of maintaining a long-term view, adhering to basic investing principles such as asset allocation and diversification, and working closely with their advisors to research and identify appropriate investment opportunities.
Respectfully,

Robert J. Manning
Chairman and Chief Executive Officer
MFS Investment Management®
February 14, 2011
The opinions expressed in this letter are subject to change, may not be relied upon for investment advice, and no forecasts can be guaranteed.
1
MFS Global Growth Portfolio
PORTFOLIO COMPOSITION
Portfolio structure
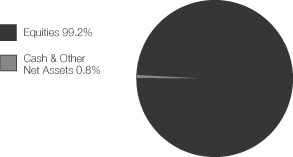
| | | | |
| Top ten holdings | | | | |
| BHP Billiton PLC | | | 2.5% | |
| Danaher Corp. | | | 2.3% | |
| Cisco Systems, Inc. | | | 2.3% | |
| Taiwan Semiconductor Manufacturing Co. Ltd., ADR | | | 2.2% | |
| Oracle Corp. | | | 2.1% | |
| Schneider Electric S.A. | | | 1.8% | |
| Groupe Danone | | | 1.8% | |
| Accenture Ltd., “A” | | | 1.7% | |
| Schlumberger Ltd. | | | 1.7% | |
| Pernod Ricard S.A. | | | 1.7% | |
| | | | |
| Equity sectors | | | | |
| Technology | | | 17.9% | |
| Financial Services | | | 16.1% | |
| Consumer Staples | | | 13.7% | |
| Health Care | | | 13.5% | |
| Basic Materials | | | 9.1% | |
| Retailing | | | 7.9% | |
| Special Products & Services | | | 6.6% | |
| Industrial Goods & Services | | | 6.3% | |
| Energy | | | 6.2% | |
| Leisure | | | 1.1% | |
| Utilities & Communications | | | 0.8% | |
| |
| Issuer country weightings | | | | |
| United States | | | 47.5% | |
| United Kingdom | | | 10.4% | |
| France | | | 8.9% | |
| Switzerland | | | 8.0% | |
| Japan | | | 4.8% | |
| Germany | | | 4.7% | |
| Brazil | | | 3.8% | |
| Taiwan | | | 3.3% | |
| Netherlands | | | 1.9% | |
| Other Countries | | | 6.7% | |
Percentages are based on net assets as of 12/31/10.
The portfolio is actively managed and current holdings may be different.
2
MFS Global Growth Portfolio
MANAGEMENT REVIEW
Summary of Results
For the twelve months ended December 31, 2010, Initial Class shares of the MFS Global Growth Portfolio (the “fund”) provided a total return of 11.80%, while Service Class shares of the fund provided a total return of 11.53%. These returns compare with a return of 15.49% for the fund’s benchmark, the Morgan Stanley Capital International (MSCI) All Country World Growth Index.
Market Environment
The first quarter of the reporting period witnessed a continuation of the financial market and macroeconomic rebounds that had begun in early 2009. These recoveries in global activity and asset valuations were generally synchronized around the world, led importantly by emerging Asian economies, but broadening to include most of the global economy to varying degrees. Primary drivers of the recoveries included an unwinding of the inventory destocking that took place earlier, the production of manufacturing and capital goods, as well as massive fiscal and monetary stimulus.
During most of the remainder of the period, heightened risk surrounding the public-debt profiles of several of the peripheral European countries impaired market sentiment. At the same time, the improving trend in global macroeconomic data began to weaken somewhat. These two dynamics caused many asset prices to retrench significantly, as many questioned the durability of the global recovery.
Towards the end of the period, the U.S. Federal Reserve led markets to believe that further monetary loosening would be forthcoming if macroeconomic activity did not show signs of improvement. The prospects for more easing by the Fed improved market sentiment and drove risk-asset prices markedly higher. However, in a text-book case of “buy the rumor, sell the fact,” the weeks following the early November announcement of further quantitative easing saw a sell-off in U.S. Treasury bonds. This rise in Treasury yields occurred despite risk-off behavior in equities and credit markets (which would normally result in Treasury yield compression), and appears to have been the result of a few factors: signs of improved U.S. and global economic activity; opposition to quantitative easing from some quarters; and crowded long positions in U.S. Treasuries. The December agreement on an expansionary U.S. fiscal package also boosted sentiment, leading markets to reach near-term highs in risky asset valuations toward year end.
Detractors from Performance
Stock selection and an overweight position in the financial services sector were among the key detractors from performance relative to the MSCI All Country World Growth Index. Holdings of credit card company Mastercard, investment bank and brokerage house Nomura Holdings (b) (Japan), stock exchange Deutsche Boerse (Germany), brokerage and banking company Charles Schwab, and financial services firm Credit Suisse (Switzerland) were among the fund’s top detractors. Shares of Credit Suisse declined after management reported that lower client activity resulted in a decline in trading revenues, falling short of analyst expectations. Shares of Mastercard declined sharply after the Federal Reserve released a debit interchange proposal that would substantially reduce debit card transaction fees. The Fed’s proposals on debit network exclusivity also created uncertainty surrounding Mastercard’s future market share and revenues.
Stock selection in the basic materials sector also negatively impacted relative performance. However, no individual securities within this sector were among the fund’s top detractors.
Stocks in other sectors that held back results included oil and gas exploration company INPEX (Japan), apparel retailer Esprit Holdings (Hong Kong), network equipment company Cisco Systems, and integrated oil company Total S.A. (b)(h) (France). Shares of Esprit fell as the company announced weaker-than-expected sales results due, in part, to the difficulties faced by European wholesalers in financing expansion, resulting in limited floor space and cautious ordering.
During the reporting period, the fund’s currency exposure was also a detractor from relative performance. All of MFS’ investment decisions are driven by the fundamentals of each individual opportunity and as such, it is common for our portfolios to have different currency exposure than the benchmark.
The fund’s cash position was another detractor from relative performance. The fund holds cash to buy new holdings and to provide liquidity. In a period when equity markets rose, as measured by the fund’s benchmark, holding cash hurt performance versus the benchmark, which has no cash position.
Contributors to Performance
Stock selection in the technology sector aided relative performance. Not holding either software giant Microsoft or computer products and services provider Hewlett-Packard bolstered results as both stocks declined during the reporting period.
Top relative contributors in other sectors included oil and gas drilling equipment manufacturer National Oilwell Varco, brewer Companhia de Bebidas das Americas, product safety testing company Intertek Group (United Kingdom), mining company BHP
3
MFS Global Growth Portfolio
Management Review – continued
Billiton (United Kingdom), infant formula manufacturer Mead Johnson Nutrition, and financial services company Credicorp (b)(h) (Peru). Shares of National Oilwell Varco rose as the company posted better-than-expected earnings stemming from high oil and gas activity across North America. The fund’s overweight positions in strong-performing luxury goods company Compagnie Financiere Richemont S.A. (Switzerland) and luxury goods manufacturer LVMH Moët Hennessy Louis Vuitton (France) also boosted results. Shares of LVMH rose during the reporting period as the company reported better-than-expected sales and earnings results. Strength was evident across all of LVMH’s business segments, as the company benefited from robust demand for luxury goods, as well as the replenishing of inventories at U.S. and European retailers following the recession.
Respectfully,
| | |
| David Antonelli | | Jeffrey Constantino |
| Portfolio Manager | | Portfolio Manager |
| (b) | Security is not a benchmark constituent. |
| (h) | Security was not held in the fund at period end. |
The views expressed in this report are those of the portfolio managers only through the end of the period of the report as stated on the cover and do not necessarily reflect the views of MFS or any other person in the MFS organization. These views are subject to change at any time based on market or other conditions, and MFS disclaims any responsibility to update such views. These views may not be relied upon as investment advice or an indication of trading intent on behalf of any MFS portfolio. References to specific securities are not recommendations of such securities, and may not be representative of any MFS portfolio’s current or future investments.
4
MFS Global Growth Portfolio
PERFORMANCE SUMMARY THROUGH 12/31/10
The following chart illustrates the historical performance of the fund in comparison to its benchmark(s). Benchmarks are unmanaged and may not be invested in directly. Benchmark returns do not reflect any fees or expenses. The performance of other share classes will be greater than or less than that of the class depicted below. (See Notes to Performance Summary.)
Performance data shown represents past performance and is no guarantee of future results. Investment return and principal value fluctuate so your units, when sold, may be worth more or less than the original cost; current performance may be lower or higher than quoted. The performance shown does not reflect the deduction of taxes, if any, that a contract holder would pay on fund distributions or the redemption of contract units. The returns for the fund shown also do not reflect the deduction of expenses associated with variable products, such as mortality and expense risk charges, separate account charges, and sales charges imposed by the insurance company separate accounts. Such expenses would reduce the overall returns shown.
Growth of a Hypothetical $10,000 Investment
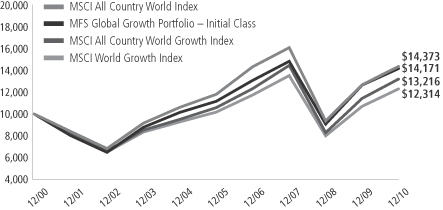
Total Returns through 12/31/10
Average annual total returns
| | | | | | | | | | | | | | |
| | | Share class | | Class inception date | | 1-yr | | 5-yr | | 10-yr | | Life (t) | | |
| | | Initial Class | | 11/16/93 | | 11.80% | | 4.88% | | 3.55% | | N/A | | |
| | | Service Class | | 8/24/01 | | 11.53% | | 4.63% | | N/A | | 5.83% | | |
| | | | | |
| Comparative benchmarks | | | | | | | | | | |
| | | MSCI All Country World Growth Index (f) | | 15.49% | | 4.54% | | 2.83% | | N/A | | |
| | | MSCI All Country World Index (f) | | 13.21% | | 3.98% | | 3.69% | | N/A | | |
| | | MSCI World Growth Index (f) | | 14.89% | | 3.85% | | 2.10% | | N/A | | |
| (f) | Source: FactSet Research Systems Inc. |
| (t) | For the period from the class inception date through the stated period end (for those share classes with less than 10 years of performance history). No comparative benchmark performance information is provided for “life” periods. (See Notes to Performance Summary.) |
Benchmark Definitions
MSCI All Country World Growth Index – a market capitalization-weighted index that is designed to measure equity market performance for growth securities in the global developed and emerging markets.
MSCI All Country World Index – a market capitalization-weighted index that is designed to measure equity market performance in the global developed and emerging markets.
MSCI World Growth Index – a market capitalization-weighted index that is designed to measure equity market performance for growth securities in the global developed markets.
It is not possible to invest directly in an index.
Note to Contract Holders: Effective September 30, 2010, the MSCI All Country World Index became the fund’s other benchmark, replacing the MSCI World Growth Index, because MFS believes that the MSCI All Country World Index more closely represents the fund’s investment policies and strategies.
5
MFS Global Growth Portfolio
Performance Summary – continued
Notes to Performance Summary
Average annual total return represents the average annual change in value for each share class for the periods presented. Life returns are presented where the share class has less than 10 years of performance history and represent the average annual total return from the class inception date to the stated period end date. As the fund’s share classes may have different inception dates, the life returns may represent different time periods and may not be comparable. As a result, no comparative benchmark performance information is provided for life periods.
Performance results reflect any applicable expense subsidies and waivers in effect during the periods shown. Without such subsidies and waivers the fund’s performance results would be less favorable. Please see the prospectus and financial statements for complete details. All results are historical and assume the reinvestment of any dividends and capital gains distributions.
From time to time the fund may receive proceeds from litigation settlements, without which performance would be lower.
6
MFS Global Growth Portfolio
EXPENSE TABLE
Fund Expenses Borne by the Contract Holders During the Period,
July 1, 2010 through December 31, 2010
As a contract holder of the fund, you incur ongoing costs, including management fees; distribution and/or service (12b-1) fees; and other fund expenses. This example is intended to help you understand your ongoing costs (in dollars) of investing in the fund and to compare these costs with the ongoing costs of investing in other mutual funds.
The example is based on an investment of $1,000 invested at the beginning of the period and held for the entire period July 1, 2010 through December 31, 2010.
Actual Expenses
The first line for each share class in the following table provides information about actual account values and actual expenses. You may use the information in this line, together with the amount you invested, to estimate the expenses that you paid over the period. Simply divide your account value by $1,000 (for example, an $8,600 account value divided by $1,000 = 8.6), then multiply the result by the number in the first line under the heading entitled “Expenses Paid During Period” to estimate the expenses you paid on your account during this period.
Hypothetical Example for Comparison Purposes
The second line for each share class in the following table provides information about hypothetical account values and hypothetical expenses based on the fund’s actual expense ratio and an assumed rate of return of 5% per year before expenses, which is not the fund’s actual return. The hypothetical account values and expenses may not be used to estimate the actual ending account balance or expenses you paid for the period. You may use this information to compare the ongoing costs of investing in the fund and other funds. To do so, compare this 5% hypothetical example with the 5% hypothetical examples that appear in the shareholder reports of the other funds.
Please note that the expenses shown in the table are meant to highlight the fund’s ongoing costs only and do not take into account the fees and expenses imposed under the variable contracts through which your investment in the fund is made. Therefore, the second line for each share class in the table is useful in comparing ongoing costs associated with an investment in vehicles (such as the fund) which fund benefits under variable annuity and variable life insurance contracts and to qualified pension and retirement plans only, and will not help you determine the relative total costs of investing in the fund through variable annuity and variable life insurance contracts. If the fees and expenses imposed under the variable contracts were included, your costs would have been higher.
| | | | | | | | | | | | | | | | | | |
| Share Class | | | | Annualized
Expense Ratio | | | Beginning
Account Value
7/01/10 | | | Ending
Account Value
12/31/10 | | | Expenses Paid
During Period (p)
7/01/10-12/31/10 | |
| Initial Class | | Actual | | | 1.17% | | | | $1,000.00 | | | | $1,252.70 | | | | $6.64 | |
| | Hypothetical (h) | | | 1.17% | | | | $1,000.00 | | | | $1,019.31 | | | | $5.96 | |
| Service Class | | Actual | | | 1.42% | | | | $1,000.00 | | | | $1,250.39 | | | | $8.05 | |
| | Hypothetical (h) | | | 1.42% | | | | $1,000.00 | | | | $1,018.05 | | | | $7.22 | |
| (h) | 5% class return per year before expenses. |
| (p) | Expenses paid is equal to each class’ annualized expense ratio, as shown above, multiplied by the average account value over the period, multiplied by the number of days in the period, divided by the number of days in the year. |
7
MFS Global Growth Portfolio
PORTFOLIO OF INVESTMENTS – 12/31/10
The Portfolio of Investments is a complete list of all securities owned by your fund. It is categorized by broad-based asset classes.
| | | | | | | | |
| Issuer | | Shares/Par | | | Value ($) | |
| | | | | | | | |
| COMMON STOCKS – 99.2% | | | | | | | | |
| Aerospace – 1.3% | | | | | |
| United Technologies Corp. | | | 12,120 | | | $ | 954,085 | |
| | | | | | | | |
| Alcoholic Beverages – 4.8% | | | | | |
| Companhia de Bebidas das Americas, ADR | | | 26,000 | | | $ | 806,780 | |
| Diageo PLC | | | 55,598 | | | | 1,027,191 | |
| Heineken N.V. | | | 9,716 | | | | 476,364 | |
| Pernod Ricard S.A. | | | 13,837 | | | | 1,300,983 | |
| | | | | | | | |
| | | | | | $ | 3,611,318 | |
| | | | | | | | |
| Apparel Manufacturers – 4.1% | | | | | |
| Compagnie Financiere Richemont S.A. | | | 11,952 | | | $ | 703,059 | |
| Li & Fung Ltd. | | | 101,800 | | | | 590,673 | |
| LVMH Moet Hennessy Louis Vuitton S.A. | | | 7,053 | | | | 1,160,208 | |
| NIKE, Inc., “B” | | | 7,290 | | | | 622,712 | |
| | | | | | | | |
| | | | | | $ | 3,076,652 | |
| | | | | | | | |
| Broadcasting – 1.1% | | | | | |
| Publicis Groupe S.A. | | | 15,453 | | | $ | 805,344 | |
| | | | | | | | |
| Brokerage & Asset Managers – 6.3% | | | | | |
| BM&F Bovespa S.A. | | | 87,800 | | | $ | 694,466 | |
| Charles Schwab Corp. | | | 33,940 | | | | 580,713 | |
| CME Group, Inc. | | | 2,640 | | | | 849,420 | |
| Deutsche Boerse AG | | | 10,225 | | | | 707,778 | |
| Franklin Resources, Inc. | | | 7,280 | | | | 809,609 | |
| ICAP PLC | | | 64,227 | | | | 535,729 | |
| Nomura Holdings, Inc. | | | 90,300 | | | | 572,786 | |
| | | | | | | | |
| | | | | | $ | 4,750,501 | |
| | | | | | | | |
| Business Services – 6.6% | | | | | |
| Accenture Ltd., “A” | | | 27,260 | | | $ | 1,321,837 | |
| Cognizant Technology Solutions Corp., “A” (a) | | | 7,370 | | | | 540,147 | |
| Dun & Bradstreet Corp. | | | 13,290 | | | | 1,090,976 | |
| Hays PLC | | | 206,494 | | | | 414,987 | |
| Intertek Group PLC | | | 15,505 | | | | 429,086 | |
| MSCI, Inc., “A” (a) | | | 19,050 | | | | 742,188 | |
| Verisk Analytics, Inc., “A” (a) | | | 13,020 | | | | 443,722 | |
| | | | | | | | |
| | | | | | $ | 4,982,943 | |
| | | | | | | | |
| Chemicals – 1.2% | | | | | |
| Monsanto Co. | | | 12,950 | | | $ | 901,838 | |
| | | | | | | | |
| Computer Software – 3.2% | | | | | |
| Autodesk, Inc. (a) | | | 22,260 | | | $ | 850,332 | |
| Oracle Corp. | | | 50,140 | | | | 1,569,382 | |
| | | | | | | | |
| | | | | | $ | 2,419,714 | |
| | | | | | | | |
| Computer Software – Systems – 5.8% | | | | | |
| Acer, Inc. | | | 275,250 | | | $ | 850,583 | |
| Apple, Inc. (a) | | | 3,670 | | | | 1,183,795 | |
| EMC Corp. (a) | | | 23,530 | | | | 538,837 | |
| International Business Machines Corp. | | | 8,380 | | | | 1,229,849 | |
| Konica Minolta Holdings, Inc. | | | 53,500 | | | | 556,152 | |
| | | | | | | | |
| | | | | | $ | 4,359,216 | |
| | | | | | | | |
| | | | | | | | |
| Issuer | | Shares/Par | | | Value ($) | |
| | | | | | | | |
| COMMON STOCKS – continued | | | | | | | | |
| Consumer Products – 4.5% | | | | | |
| Beiersdorf AG | | | 5,471 | | | $ | 303,585 | |
| Church & Dwight Co., Inc. | | | 6,800 | | | | 469,336 | |
| Colgate-Palmolive Co. | | | 11,830 | | | | 950,777 | |
| Procter & Gamble Co. | | | 13,920 | | | | 895,474 | |
| Reckitt Benckiser Group PLC | | | 14,549 | | | | 799,588 | |
| | | | | | | | |
| | | | | | $ | 3,418,760 | |
| | | | | | | | |
| Electrical Equipment – 4.1% | | | | | |
| Danaher Corp. | | | 36,740 | | | $ | 1,733,026 | |
| Schneider Electric S.A. | | | 9,336 | | | | 1,397,278 | |
| | | | | | | | |
| | | | | | $ | 3,130,304 | |
| | | | | | | | |
| Electronics – 5.9% | | | | | |
| Hoya Corp. | | | 26,400 | | | $ | 641,222 | |
| Microchip Technology, Inc. | | | 22,140 | | | | 757,409 | |
| Samsung Electronics Co. Ltd. | | | 964 | | | | 806,094 | |
| Taiwan Semiconductor Manufacturing Co. Ltd., ADR | | | 132,628 | | | | 1,663,155 | |
| Tokyo Electron Ltd. | | | 10,000 | | | | 633,083 | |
| | | | | | | | |
| | | | | | $ | 4,500,963 | |
| | | | | | | | |
| Energy – Independent – 0.7% | | | | | |
| INPEX Corp. | | | 87 | | | $ | 509,527 | |
| | | | | | | | |
| Energy – Integrated – 2.1% | | | | | |
| Chevron Corp. | | | 6,170 | | | $ | 563,013 | |
| Hess Corp. | | | 7,820 | | | | 598,543 | |
| Suncor Energy, Inc. | | | 12,263 | | | | 472,119 | |
| | | | | | | | |
| | | | | | $ | 1,633,675 | |
| | | | | | | | |
| Food & Beverages – 4.4% | | | | | |
| Groupe Danone | | | 21,139 | | | $ | 1,328,223 | |
| Mead Johnson Nutrition Co., “A” | | | 6,080 | | | | 378,480 | |
| Nestle S.A. | | | 12,754 | | | | 746,825 | |
| PepsiCo, Inc. | | | 12,980 | | | | 847,983 | |
| | | | | | | | |
| | | | | | $ | 3,301,511 | |
| | | | | | | | |
| Food & Drug Stores – 1.4% | | | | | |
| Tesco PLC | | | 162,582 | | | $ | 1,077,296 | |
| | | | | | | | |
| General Merchandise – 1.2% | | | | | |
| Kohl’s Corp. (a) | | | 9,340 | | | $ | 507,536 | |
| Target Corp. | | | 6,520 | | | | 392,048 | |
| | | | | | | | |
| | | | | | $ | 899,584 | |
| | | | | | | | |
| Internet – 0.8% | | | | | |
| Google, Inc., “A” (a) | | | 990 | | | $ | 588,030 | |
| | | | | | | | |
| Machinery & Tools – 0.9% | | | | | |
| Schindler Holding AG | | | 5,919 | | | $ | 700,151 | |
| | | | | | | | |
| Major Banks – 5.7% | | | | | |
| Bank of New York Mellon Corp. | | | 14,380 | | | $ | 434,276 | |
| Credit Suisse Group AG | | | 18,601 | | | | 749,411 | |
| HSBC Holdings PLC | | | 78,101 | | | | 792,826 | |
| Julius Baer Group Ltd. | | | 18,969 | | | | 888,601 | |
8
MFS Global Growth Portfolio
Portfolio of Investments – continued
| | | | | | | | |
| Issuer | | Shares/Par | | | Value ($) | |
| | | | | | | | |
| COMMON STOCKS – continued | | | | | | | | |
| Major Banks – continued | | | | | |
| Standard Chartered PLC | | | 32,641 | | | $ | 878,117 | |
| State Street Corp. | | | 11,790 | | | | 546,349 | |
| | | | | | | | |
| | | | | | $ | 4,289,580 | |
| | | | | | | | |
| Medical & Health Technology & Services – 1.8% | | | | | |
| Diagnosticos da America S.A. | | | 27,800 | | | $ | 376,807 | |
| Fresenius Medical Care AG & Co. KGaA | | | 6,276 | | | | 362,554 | |
| Patterson Cos., Inc. | | | 20,760 | | | | 635,879 | |
| | | | | | | | |
| | | | | | $ | 1,375,240 | |
| | | | | | | | |
| Medical Equipment – 7.1% | | | | | |
| Becton, Dickinson & Co. | | | 4,460 | | | $ | 376,959 | |
| DENTSPLY International, Inc. | | | 20,480 | | | | 699,802 | |
| Essilor International S.A. | | | 5,673 | | | | 365,206 | |
| Medtronic, Inc. | | | 14,630 | | | | 542,627 | |
| Sonova Holding AG | | | 6,032 | | | | 778,676 | |
| St. Jude Medical, Inc. (a) | | | 8,530 | | | | 364,658 | |
| Synthes, Inc. | | | 6,811 | | | | 920,031 | |
| Thermo Fisher Scientific, Inc. (a) | | | 14,760 | | | | 817,114 | |
| Waters Corp. (a) | | | 6,130 | | | | 476,362 | |
| | | | | | | | |
| | | | | | $ | 5,341,435 | |
| | | | | | | | |
| Metals & Mining – 2.5% | | | | | |
| BHP Billiton PLC | | | 47,277 | | | $ | 1,880,330 | |
| | | | | | | | |
| Network & Telecom – 2.2% | | | | | |
| Cisco Systems, Inc. (a) | | | 84,280 | | | $ | 1,704,984 | |
| | | | | | | | |
| Oil Services – 3.4% | | | | | |
| National Oilwell Varco, Inc. | | | 18,820 | | | $ | 1,265,645 | |
| Schlumberger Ltd. | | | 15,720 | | | | 1,312,620 | |
| | | | | | | | |
| | | | | | $ | 2,578,265 | |
| | | | | | | | |
| Other Banks & Diversified Financials – 4.1% | | | | | |
| Akbank T.A.S. | | | 74,180 | | | $ | 412,218 | |
| Banco Santander Brasil S.A., ADR | | | 73,050 | | | | 993,480 | |
| HDFC Bank Ltd. | | | 5,407 | | | | 283,724 | |
| MasterCard, Inc., “A” | | | 2,710 | | | | 607,338 | |
| Visa, Inc., “A” | | | 11,620 | | | | 817,816 | |
| | | | | | | | |
| | | | | | $ | 3,114,576 | |
| | | | | | | | |
| Pharmaceuticals – 4.6% | | | | | |
| Allergan, Inc. | | | 5,870 | | | $ | 403,093 | |
| Bayer AG | | | 11,887 | | | | 878,418 | |
| Johnson & Johnson | | | 10,650 | | | | 658,703 | |
| Roche Holding AG | | | 3,645 | | | | 534,080 | |
| Teva Pharmaceutical Industries Ltd., ADR | | | 19,390 | | | | 1,010,801 | |
| | | | | | | | |
| | | | | | $ | 3,485,095 | |
| | | | | | | | |
| | | | | | | | |
| Issuer | | Shares/Par | | | Value ($) | |
| | | | | | | | |
| COMMON STOCKS – continued | | | | | | | | |
| Specialty Chemicals – 5.4% | | | | | |
| Akzo Nobel N.V. | | | 15,924 | | | $ | 989,165 | |
| L’Air Liquide S.A. | | | 2,934 | | | | 371,055 | |
| Linde AG | | | 6,416 | | | | 973,544 | |
| Praxair, Inc. | | | 7,090 | | | | 676,882 | |
| Shin-Etsu Chemical Co. Ltd. | | | 13,700 | | | | 742,456 | |
| Symrise AG | | | 12,477 | | | | 342,214 | |
| | | | | | | | |
| | | | | | $ | 4,095,316 | |
| | | | | | | | |
| Specialty Stores – 1.2% | | | | | |
| Esprit Holdings Ltd. | | | 94,369 | | | $ | 449,214 | |
| Industria de Diseno Textil S.A. | | | 6,467 | | | | 484,203 | |
| | | | | | | | |
| | | | | | $ | 933,417 | |
| | | | | | | | |
| Telecommunications – Wireless – 0.8% | | | | | |
| MTN Group Ltd. | | | 28,862 | | | $ | 588,938 | |
| | | | | | | | |
Total Common Stocks
(Identified Cost, $67,707,756) | | | | | | $ | 75,008,588 | |
| | | | | | | | |
| |
| MONEY MARKET FUNDS (v) – 0.9% | | | | | |
| MFS Institutional Money Market Portfolio, 0.18%, at Cost and Net Asset Value | | | 683,229 | | | $ | 683,229 | |
| | | | | | | | |
Total Investments
(Identified Cost, $68,390,985) | | | | | | $ | 75,691,817 | |
| | | | | | | | |
OTHER ASSETS, LESS
LIABILITIES – (0.1)% | | | | | | | (48,468 | ) |
| | | | | | | | |
| Net Assets – 100.0% | | | | | | $ | 75,643,349 | |
| | | | | | | | |
| (a) | Non-income producing security. |
| (v) | Underlying fund that is available only to investment companies managed by MFS. The rate quoted is the annualized seven-day yield of the fund at period end. |
The following abbreviations are used in this report and are defined:
| ADR | | American Depository Receipt |
| PLC | | Public Limited Company |
See Notes to Financial Statements
9
MFS Global Growth Portfolio
FINANCIAL STATEMENTS | STATEMENT OF ASSETS AND LIABILITIES
This statement represents your fund’s balance sheet, which details the assets and liabilities comprising the total value of the fund.
| | | | | | | | |
At 12/31/10 | | | | | | | | |
Assets | | | | | |
Investments – | | | | | | | | |
Non-affiliated issuers, at value (identified cost, $67,707,756) | | | $75,008,588 | | | | | |
Underlying funds, at cost and value | | | 683,229 | | | | | |
Total investments, at value (identified cost, $68,390,985) | | | $75,691,817 | | | | | |
Foreign currency, at value (identified cost, $8,072) | | | 8,082 | | | | | |
Receivables for | | | | | | | | |
Fund shares sold | | | 11,377 | | | | | |
Interest and dividends | | | 85,942 | | | | | |
Other assets | | | 2,584 | | | | | |
Total assets | | | | | | | $75,799,802 | |
Liabilities | | | | | | | | |
Payables for | | | | | | | | |
Investments purchased | | | $23,979 | | | | | |
Fund shares reacquired | | | 60,695 | | | | | |
Payable to affiliates | | | | | | | | |
Investment adviser | | | 3,738 | | | | | |
Shareholder servicing costs | | | 39 | | | | | |
Distribution and/or service fees | | | 57 | | | | | |
Administrative services fee | | | 160 | | | | | |
Payable for Trustees’ compensation | | | 96 | | | | | |
Accrued expenses and other liabilities | | | 67,689 | | | | | |
Total liabilities | | | | | | | $156,453 | |
Net assets | | | | | | | $75,643,349 | |
Net assets consist of | | | | | | | | |
Paid-in capital | | | $80,534,443 | | | | | |
Unrealized appreciation (depreciation) on investments and translation of assets and liabilities in foreign currencies | | | 7,304,555 | | | | | |
Accumulated net realized gain (loss) on investments and foreign currency transactions | | | (12,647,780 | ) | | | | |
Undistributed net investment income | | | 452,131 | | | | | |
Net assets | | | | | | | $75,643,349 | |
Shares of beneficial interest outstanding | | | | | | | 4,653,317 | |
| | | | | | | | | | | | |
| | | Net assets | | | Shares
outstanding | | | Net asset value
per share | |
Initial Class | | | $71,545,507 | | | | 4,400,038 | | | | $16.26 | |
Service Class | | | 4,097,842 | | | | 253,279 | | | | 16.18 | |
See Notes to Financial Statements
10
MFS Global Growth Portfolio
FINANCIAL STATEMENTS | STATEMENT OF OPERATIONS
This statement describes how much your fund earned in investment income and accrued in expenses. It also describes any gains and/or losses generated by fund operations.
| | | | | | | | |
| Year ended 12/31/10 | | | | | | | | |
| Net investment income | | | | | | | | |
Income | | | | | | | | |
Dividends | | | $1,439,058 | | | | | |
Interest | | | 10,939 | | | | | |
Dividends from underlying funds | | | 1,839 | | | | | |
Foreign taxes withheld | | | (94,235 | ) | | | | |
Total investment income | | | | | | | $1,357,601 | |
Expenses | | | | | | | | |
Management fee | | | $660,402 | | | | | |
Distribution and/or service fees | | | 10,957 | | | | | |
Shareholder servicing costs | | | 8,495 | | | | | |
Administrative services fee | | | 28,408 | | | | | |
Trustees’ compensation | | | 10,573 | | | | | |
Custodian fee | | | 71,914 | | | | | |
Shareholder communications | | | 9,163 | | | | | |
Auditing fees | | | 60,154 | | | | | |
Legal fees | | | 7,141 | | | | | |
Miscellaneous | | | 15,899 | | | | | |
Total expenses | | | | | | | $883,106 | |
Fees paid indirectly | | | (2 | ) | | | | |
Net expenses | | | | | | | $883,104 | |
Net investment income | | | | | | | $474,497 | |
Realized and unrealized gain (loss) on investments and foreign currency transactions | | | | | | | | |
Realized gain (loss) (identified cost basis) | | | | | | | | |
Investment transactions | | | $2,832,065 | | | | | |
Foreign currency transactions | | | (20,533 | ) | | | | |
Net realized gain (loss) on investments and foreign currency transactions | | | | | | | $2,811,532 | |
Change in unrealized appreciation (depreciation) | | | | | | | | |
Investments | | | $4,578,958 | | | | | |
Translation of assets and liabilities in foreign currencies | | | 765 | | | | | |
Net unrealized gain (loss) on investments and foreign currency translation | | | | | | | $4,579,723 | |
Net realized and unrealized gain (loss) on investments and foreign currency | | | | | | | $7,391,255 | |
Change in net assets from operations | | | | | | | $7,865,752 | |
See Notes to Financial Statements
11
MFS Global Growth Portfolio
FINANCIAL STATEMENTS | STATEMENTS OF CHANGES IN NET ASSETS
These statements describe the increases and/or decreases in net assets resulting from operations, any distributions, and any shareholder transactions.
| | | | | | | | |
For years ended 12/31 | | | 2010 | | | | 2009 | |
Change in net assets | | | | | | | | |
From operations | | | | | | | | |
Net investment income | | | $474,497 | | | | $573,401 | |
Net realized gain (loss) on investments and foreign currency transactions | | | 2,811,532 | | | | (4,835,091 | ) |
Net unrealized gain (loss) on investments and foreign currency translation | | | 4,579,723 | | | | 27,741,899 | |
Change in net assets from operations | | | $7,865,752 | | | | $23,480,209 | |
Distributions declared to shareholders | | | | | | | | |
From net investment income | | | $(565,546 | ) | | | $(797,216 | ) |
Change in net assets from fund share transactions | | | $(11,830,037 | ) | | | $(9,468,184 | ) |
Total change in net assets | | | $(4,529,831 | ) | | | $13,214,809 | |
Net assets | | | | | | | | |
At beginning of period | | | 80,173,180 | | | | 66,958,371 | |
At end of period (including undistributed net investment income of $452,131 and
$563,713, respectively) | | | $75,643,349 | | | | $80,173,180 | |
See Notes to Financial Statements
12
MFS Global Growth Portfolio
FINANCIAL STATEMENTS | FINANCIAL HIGHLIGHTS
The financial highlights table is intended to help you understand the fund’s financial performance for the past 5 years. Certain information reflects financial results for a single fund share. The total returns in the table represent the rate by which an investor would have earned (or lost) on an investment in the fund share class (assuming reinvestment of all distributions) held for the entire period.
| | | | | | | | | | | | | | | | | | | | |
| Initial Class | | Years ended 12/31 | |
| | | 2010 | | | 2009 | | | 2008 | | | 2007 | | | 2006 | |
Net asset value, beginning of period | | | $14.65 | | | | $10.62 | | | | $17.54 | | | | $15.74 | | | | $13.48 | |
| Income (loss) from investment operations | | | | | | | | | | | | | | | | | | | | |
Net investment income (d) | | | $0.10 | | | | $0.10 | | | | $0.13 | | | | $0.14 | | | | $0.20 | |
Net realized and unrealized gain (loss) on investments
and foreign currency | | | 1.62 | | | | 4.07 | | | | (6.90 | ) | | | 1.94 | | | | 2.14 | |
Total from investment operations | | | $1.72 | | | | $4.17 | | | | $(6.77 | ) | | | $2.08 | | | | $2.34 | |
| Less distributions declared to shareholders | | | | | | | | | | | | | | | | | | | | |
From net investment income | | | $(0.11 | ) | | | $(0.14 | ) | | | $(0.15 | ) | | | $(0.28 | ) | | | $(0.08 | ) |
Net asset value, end of period | | | $16.26 | | | | $14.65 | | | | $10.62 | | | | $17.54 | | | | $15.74 | |
Total return (%) (k)(s) | | | 11.80 | | | | 39.81 | | | | (38.93 | ) | | | 13.27 | | | | 17.37 | |
Ratios (%) (to average net assets) and Supplemental data: | | | | | | | | | | | | | | | | | | | | |
Expenses (f) | | | 1.19 | | | | 1.34 | | | | 1.25 | | | | 1.10 | | | | 1.14 | |
Net investment income | | | 0.66 | | | | 0.85 | | | | 0.90 | | | | 0.83 | | | | 1.39 | |
Portfolio turnover | | | 61 | | | | 76 | | | | 81 | | | | 76 | | | | 92 | |
Net assets at end of period (000 omitted) | | | $71,546 | | | | $75,171 | | | | $62,289 | | | | $131,870 | | | | $148,793 | |
| |
| Service Class | | Years ended 12/31 | |
| | | 2010 | | | 2009 | | | 2008 | | | 2007 | | | 2006 | |
Net asset value, beginning of period | | | $14.58 | | | | $10.55 | | | | $17.42 | | | | $15.63 | | | | $13.39 | |
| Income (loss) from investment operations | | | | | | | | | | | | | | | | | | | | |
Net investment income (d) | | | $0.06 | | | | $0.07 | | | | $0.10 | | | | $0.09 | | | | $0.17 | |
Net realized and unrealized gain (loss) on investments
and foreign currency | | | 1.62 | | | | 4.05 | | | | (6.86 | ) | | | 1.94 | | | | 2.12 | |
Total from investment operations | | | $1.68 | | | | $4.12 | | | | $(6.76 | ) | | | $2.03 | | | | $2.29 | |
| Less distributions declared to shareholders | | | | | | | | | | | | | | | | | | | | |
From net investment income | | | $(0.08 | ) | | | $(0.09 | ) | | | $(0.11 | ) | | | $(0.24 | ) | | | $(0.05 | ) |
Net asset value, end of period | | | $16.18 | | | | $14.58 | | | | $10.55 | | | | $17.42 | | | | $15.63 | |
Total return (%) (k)(s) | | | 11.53 | | | | 39.43 | | | | (39.07 | ) | | | 13.04 | | | | 17.09 | |
Ratios (%) (to average net assets) and Supplemental data: | | | | | | | | | | | | | | | | | | | | |
Expenses (f) | | | 1.44 | | | | 1.59 | | | | 1.49 | | | | 1.35 | | | | 1.39 | |
Net investment income | | | 0.42 | | | | 0.58 | | | | 0.67 | | | | 0.56 | | | | 1.16 | |
Portfolio turnover | | | 61 | | | | 76 | | | | 81 | | | | 76 | | | | 92 | |
Net assets at end of period (000 omitted) | | | $4,098 | | | | $5,002 | | | | $4,670 | | | | $8,716 | | | | $8,723 | |
| (d) | Per share data is based on average shares outstanding. |
| (f) | Ratios do not reflect reductions from fees paid indirectly, if applicable. |
| (k) | The total return does not reflect expenses that apply to separate accounts. Inclusion of these charges would reduce the total return figures for all periods shown. |
| (s) | From time to time the fund may receive proceeds from litigation settlements, without which performance would be lower. |
See Notes to Financial Statements
13
MFS Global Growth Portfolio
NOTES TO FINANCIAL STATEMENTS
| (1) | | Business and Organization |
MFS Global Growth Portfolio (the fund) is a series of MFS Variable Insurance Trust II (the trust). The trust is organized as a Massachusetts business trust and is registered under the Investment Company Act of 1940, as amended, as an open-end management investment company. The shareholders of each series of the trust are separate accounts of insurance companies, which offer variable annuity and/or life insurance products, and qualified retirement and pension plans.
| (2) | | Significant Accounting Policies |
General – The preparation of financial statements in conformity with U.S. generally accepted accounting principles requires management to make estimates and assumptions that affect the reported amounts of assets and liabilities, and disclosure of contingent assets and liabilities at the date of the financial statements and the reported amounts of revenues and expenses during the reporting period. Actual results could differ from those estimates. In the preparation of these financial statements, management has evaluated subsequent events occurring after the date of the fund’s Statement of Assets and Liabilities through the date that the financial statements were issued. The fund invests in foreign securities, including securities of emerging market issuers. Investments in foreign securities are vulnerable to the effects of changes in the relative values of the local currency and the U.S. dollar and to the effects of changes in each country’s legal, political, and economic environment. The markets of emerging markets countries are generally more volatile than the markets of developed countries with more mature economies. All of the risks of investing in foreign securities previously described are heightened when investing in emerging markets countries.
Investment Valuations – Equity securities, including restricted equity securities, are generally valued at the last sale or official closing price as provided by a third-party pricing service on the market or exchange on which they are primarily traded. Equity securities, for which there were no sales reported that day, are generally valued at the last quoted daily bid quotation as provided by a third-party pricing service on the market or exchange on which such securities are primarily traded. Equity securities held short, for which there were no sales reported for that day, are generally valued at the last quoted daily ask quotation as provided by a third-party pricing service on the market or exchange on which such securities are primarily traded. Short-term instruments with a maturity at issuance of 60 days or less generally are valued at amortized cost, which approximates market value. Open-end investment companies are generally valued at net asset value per share. Securities and other assets generally valued on the basis of information from a third-party pricing service may also be valued at a broker/dealer bid quotation. Values obtained from third-party pricing services can utilize both transaction data and market information such as yield, quality, coupon rate, maturity, type of issue, trading characteristics, and other market data. The values of foreign securities and other assets and liabilities expressed in foreign currencies are converted to U.S. dollars using the mean of bid and asked prices for rates provided by a third-party pricing service.
The Board of Trustees has delegated primary responsibility for determining or causing to be determined the value of the fund’s investments (including any fair valuation) to the adviser pursuant to valuation policies and procedures approved by the Board. If the adviser determines that reliable market quotations are not readily available, investments are valued at fair value as determined in good faith by the adviser in accordance with such procedures under the oversight of the Board of Trustees. Under the fund’s valuation policies and procedures, market quotations are not considered to be readily available for most types of debt instruments and floating rate loans and many types of derivatives. These investments are generally valued at fair value based on information from third-party pricing services. In addition, investments may be valued at fair value if the adviser determines that an investment’s value has been materially effected by events occurring after the close of the exchange or market on which the investment is principally traded (such as foreign exchange or market) and prior to the determination of the fund’s net asset value, or after the halting of trading of a specific security where trading does not resume prior to the close of the exchange or market on which the security is principally traded. Events that occur on a frequent basis after foreign markets close (such as developments in foreign markets and significant movements in the U.S. markets) and prior to the determination of the fund’s net asset value may be deemed to have a material effect on the value of securities traded in foreign markets. Accordingly, the fund’s foreign equity securities may often be valued at fair value. The adviser generally relies on third-party pricing services or other information (such as the correlation with price movements of similar securities in the same or other markets; the type, cost and investment characteristics of the security; the business and financial condition of the issuer; and trading and other market data) to assist in determining whether to fair value and at what value to fair value an investment. The value of an investment for purposes of calculating the fund’s net asset value can differ depending on the source and method used to determine value. When fair valuation is used, the value of an investment used to determine the fund’s net asset value may differ from quoted or published prices for the same investment. There can be no assurance that the fund could obtain the fair value assigned to an investment if it were to sell the investment at the same time at which the fund determines its net asset value per share.
14
MFS Global Growth Portfolio
Notes to Financial Statements – continued
Various inputs are used in determining the value of the fund’s assets or liabilities. These inputs are categorized into three broad levels. In certain cases, the inputs used to measure fair value may fall into different levels of the fair value hierarchy. In such cases, an investment’s level within the fair value hierarchy is based on the lowest level of input that is significant to the fair value measurement. The fund’s assessment of the significance of a particular input to the fair value measurement in its entirety requires judgment, and considers factors specific to the investment. Level 1 includes unadjusted quoted prices in active markets for identical assets or liabilities. Level 2 includes other significant observable market-based inputs (including quoted prices for similar securities, interest rates, prepayment speed, and credit risk). Level 3 includes unobservable inputs, which may include the adviser’s own assumptions in determining the fair value of investments. The following is a summary of the levels used as of December 31, 2010 in valuing the fund’s assets or liabilities:
| | | | | | | | | | | | | | | | |
| Investments at Value | | Level 1 | | | Level 2 | | | Level 3 | | | Total | |
| Equity Securities | | | $75,008,588 | | | | $— | | | | $— | | | | $75,008,588 | |
| Mutual Funds | | | 683,229 | | | | — | | | | — | | | | 683,229 | |
| Total Investments | | | $75,691,817 | | | | $— | | | | $— | | | | $75,691,817 | |
For further information regarding security characteristics, see the Portfolio of Investments.
Of the level 1 investments presented above, equity investments amounting to $23,067,125 were considered level 2 investments at the beginning of the period. The primary reason for changes in the classifications between levels 1 and 2 occurs when foreign equity securities are fair valued using other observable market-based inputs in place of the closing exchange price due to events occurring after the close of the exchange or market on which the investment is principally traded. The fund’s foreign equity securities may often be valued at fair value.
Foreign Currency Translation – Purchases and sales of foreign investments, income, and expenses are converted into U.S. dollars based upon currency exchange rates prevailing on the respective dates of such transactions or on the reporting date for foreign denominated receivables and payables. Gains and losses attributable to foreign currency exchange rates on sales of securities are recorded for financial statement purposes as net realized gains and losses on investments. Gains and losses attributable to foreign exchange rate movements on receivables, payables, income and expenses are recorded for financial statement purposes as foreign currency transaction gains and losses. That portion of both realized and unrealized gains and losses on investments that results from fluctuations in foreign currency exchange rates is not separately disclosed.
Security Loans – State Street Bank and Trust Company (“State Street”), as lending agent, loans the securities of the fund to certain qualified institutions (the “Borrowers”) approved by the fund. The loans are collateralized by cash and/or U.S. Treasury and federal agency obligations in an amount typically at least equal to the market value of the securities loaned. The market value of the loaned securities is determined at the close of business of the fund and any additional required collateral is delivered to the fund on the next business day. State Street provides the fund with indemnification against Borrower default. The fund bears the risk of loss with respect to the investment of cash collateral. On loans collateralized by cash, the cash collateral is invested in a money market fund or short-term securities. A portion of the income generated upon investment of the collateral is remitted to the Borrowers, and the remainder is allocated between the fund and the lending agent. On loans collateralized by U.S. Treasury and/or federal agency obligations, a fee is received from the Borrower, and is allocated between the fund and the lending agent. Income from securities lending is included in interest income on the Statement of Operations. The dividend and interest income earned on the securities loaned is accounted for in the same manner as other dividend and interest income.
Indemnifications – Under the fund’s organizational documents, its officers and Trustees may be indemnified against certain liabilities and expenses arising out of the performance of their duties to the fund. Additionally, in the normal course of business, the fund enters into agreements with service providers that may contain indemnification clauses. The fund’s maximum exposure under these agreements is unknown as this would involve future claims that may be made against the fund that have not yet occurred.
Investment Transactions and Income – Investment transactions are recorded on the trade date. Interest income is recorded on the accrual basis. Dividends received in cash are recorded on the ex-dividend date. Certain dividends from foreign securities will be recorded when the fund is informed of the dividend if such information is obtained subsequent to the ex-dividend date. Dividend and interest payments received in additional securities are recorded on the ex-dividend or ex-interest date in an amount equal to the value of the security on such date.
The fund may receive proceeds from litigation settlements. Any proceeds received from litigation involving portfolio holdings are reflected in the Statement of Operations in realized gain/loss if the security has been disposed of by the fund or in unrealized gain/loss if the security is still held by the fund. Any other proceeds from litigation not related to portfolio holdings are reflected as other income in the Statement of Operations.
15
MFS Global Growth Portfolio
Notes to Financial Statements – continued
Fees Paid Indirectly – The fund’s custody fee may be reduced according to an arrangement that measures the value of cash deposited with the custodian by the fund. This amount, for the year ended December 31, 2010, is shown as a reduction of total expenses on the Statement of Operations.
Tax Matters and Distributions – The fund intends to qualify as a regulated investment company, as defined under Subchapter M of the Internal Revenue Code, and to distribute all of its taxable income, including realized capital gains. As a result, no provision for federal income tax is required. The fund’s federal tax returns for the prior three fiscal years remain subject to examination by the Internal Revenue Service. Foreign taxes, if any, have been accrued by the fund in the accompanying financial statements.
Distributions to shareholders are recorded on the ex-dividend date. Income and capital gain distributions are determined in accordance with income tax regulations, which may differ from U.S. generally accepted accounting principles. Certain capital accounts in the financial statements are periodically adjusted for permanent differences in order to reflect their tax character. These adjustments have no impact on net assets or net asset value per share. Temporary differences which arise from recognizing certain items of income, expense, gain or loss in different periods for financial statement and tax purposes will reverse at some time in the future. Distributions in excess of net investment income or net realized gains are temporary overdistributions for financial statement purposes resulting from differences in the recognition or classification of income or distributions for financial statement and tax purposes.
Book/tax differences primarily relate to expiration of capital loss carryforwards and wash sale loss deferrals.
The tax character of distributions declared to shareholders for the last two fiscal years is as follows:
| | | | | | | | |
| | | 12/31/10 | | | 12/31/09 | |
| Ordinary income (including any short-term capital gains) | | | $565,546 | | | | $797,216 | |
The federal tax cost and the tax basis components of distributable earnings were as follows:
| | | | |
| As of 12/31/10 | | | | |
| Cost of investments | | | $68,446,627 | |
| Gross appreciation | | | 10,584,907 | |
| Gross depreciation | | | (3,339,717 | ) |
| Net unrealized appreciation (depreciation) | | | $7,245,190 | |
| Undistributed ordinary income | | | 452,567 | |
| Capital loss carryforwards | | | (12,592,138 | ) |
| Other temporary differences | | | 3,287 | |
As of December 31, 2010, the fund had capital loss carryforwards available to offset future realized gains. Such losses expire as follows:
| | | | |
| 12/31/16 | | | $(7,268,811 | ) |
| 12/31/17 | | | (5,323,327 | ) |
| Total | | | $(12,592,138 | ) |
Multiple Classes of Shares of Beneficial Interest – The fund offers multiple classes of shares, which differ in their respective distribution and/or service fees. The fund’s income, realized and unrealized gain (loss), and common expenses are allocated to shareholders based on the daily net assets of each class. Dividends are declared separately for each class. Differences in per share dividend rates are generally due to differences in separate class expenses. The fund’s distributions declared to shareholders as reported on the Statements of Changes in Net Assets are presented by class as follows:
| | | | | | | | |
| | | From net investment
income | |
| | | Year ended
12/31/10 | | | Year ended
12/31/09 | |
| Initial Class | | | $541,002 | | | | $763,972 | |
| Service Class | | | 24,544 | | | | 33,244 | |
| Total | | | $565,546 | | | | $797,216 | |
| (3) | | Transactions with Affiliates |
Investment Adviser – The fund has an investment advisory agreement with MFS to provide overall investment management and related administrative services and facilities to the fund.
16
MFS Global Growth Portfolio
Notes to Financial Statements – continued
The management fee is computed daily and paid monthly at the following annual rates:
| | | | |
| First $1 billion of average daily net assets | | | 0.90% | |
| Next $1 billion of average daily net assets | | | 0.75% | |
| Average daily net assets in excess of $2 billion | | | 0.65% | |
The management fee incurred for the year ended December 31, 2010 was equivalent to an annual effective rate of 0.90% of the fund’s average daily net assets.
The investment adviser has agreed in writing to pay a portion of the fund’s total annual operating expenses, exclusive of interest, taxes, extraordinary expenses, brokerage and transaction costs and investment-related expenses, such that total annual operating expenses do not exceed 1.40% of average daily net assets for the Initial Class shares and 1.65% of average daily net assets for the Service Class shares. This written agreement will continue until April 30, 2012. For the year ended December 31, 2010, the fund’s actual operating expenses did not exceed the limit and therefore, the investment adviser did not pay any portion of the fund’s expenses.
Distributor – MFS Fund Distributors, Inc. (MFD), a wholly-owned subsidiary of MFS, is the distributor of shares of the fund. The Trustees have adopted a distribution plan for the Service Class shares pursuant to Rule 12b-1 under the Investment Company Act of 1940.
The fund’s distribution plan provides that the fund will pay MFD distribution and/or service fees equal to 0.25% per annum of its average daily net assets attributable to Service Class shares as partial consideration for services performed and expenses incurred by MFD and financial intermediaries (including participating insurance companies that invest in the fund to fund variable annuity and variable life insurance contracts, sponsors of qualified retirement and pension plans that invest in the fund, and affiliates of these participating insurance companies and plan sponsors) in connection with the sale and distribution of the Service Class shares. MFD may subsequently pay all, or a portion, of the distribution and/or service fees to financial intermediaries.
Shareholder Servicing Agent – MFS Service Center, Inc. (MFSC), a wholly-owned subsidiary of MFS, receives a fee from the fund for its services as shareholder servicing agent. For the year ended December 31, 2010, the fee was $8,477, which equated to 0.0116% annually of the fund’s average daily net assets. MFSC also receives payment from the fund for out-of-pocket expenses paid by MFSC on behalf of the fund. For the year ended December 31, 2010, these costs amounted to $18.
Administrator – MFS provides certain financial, legal, shareholder communications, compliance, and other administrative services to the fund. Under an administrative services agreement, the fund partially reimburses MFS the costs incurred to provide these services. The fund is charged an annual fixed amount of $10,000 plus a fee based on average daily net assets. The administrative services fee incurred for the year ended December 31, 2010 was equivalent to an annual effective rate of 0.0387% of the fund’s average daily net assets.
Trustees’ and Officers’ Compensation – The fund pays compensation to Trustees in the form of a retainer, attendance fees, and additional compensation to the Board chairperson. The fund does not pay compensation directly to officers of the fund who are also officers of the investment adviser, all of whom receive remuneration for their services to the fund from MFS. Certain officers of the fund are officers or directors of MFS, MFD, and MFSC.
Other – This fund and certain other funds managed by MFS (the funds) have entered into services agreements (the Agreements) which provide for payment of fees by the funds to Tarantino LLC and Griffin Compliance LLC in return for the provision of services of an Independent Chief Compliance Officer (ICCO) and Assistant ICCO, respectively, for the funds. The ICCO and Assistant ICCO are officers of the funds and the sole members of Tarantino LLC and Griffin Compliance LLC, respectively. The funds can terminate the Agreements with Tarantino LLC and Griffin Compliance LLC at any time under the terms of the Agreements. MFS has agreed to bear all expenses associated with office space, other administrative support, and supplies provided to the ICCO and Assistant ICCO. For the year ended December 31, 2010, the aggregate fees paid by the fund to Tarantino LLC and Griffin Compliance LLC were $1,249 and are included in miscellaneous expense on the Statement of Operations.
The fund invests in the MFS Institutional Money Market Portfolio which is managed by MFS and seeks a high level of current income consistent with preservation of capital and liquidity. Income earned on this investment is included in dividends from underlying funds on the Statement of Operations. This money market fund does not pay a management fee to MFS.
Purchases and sales of investments, other than U.S. Government securities, purchased option transactions, and short-term obligations, aggregated $43,935,236 and $55,251,529, respectively.
17
MFS Global Growth Portfolio
Notes to Financial Statements – continued
| (5) | | Shares of Beneficial Interest |
The fund’s Declaration of Trust permits the Trustees to issue an unlimited number of full and fractional shares of beneficial interest. Transactions in fund shares were as follows:
| | | | | | | | | | | | | | | | |
| | | Year ended 12/31/10 | | | Year ended 12/31/09 | |
| | | Shares | | | Amount | | | Shares | | | Amount | |
| Shares sold | | | | | | | | | | | | | | | | |
Initial Class | | | 47,368 | | | | $708,923 | | | | 89,730 | | | | $1,097,090 | |
Service Class | | | 16,148 | | | | 235,445 | | | | 47,525 | | | | 530,482 | |
| | | 63,516 | | | | $944,368 | | | | 137,255 | | | | $1,627,572 | |
| Shares issued to shareholders in reinvestment of distributions | | | | | | | | | | | | | | | | |
Initial Class | | | 35,899 | | | | $541,002 | | | | 73,885 | | | | $763,972 | |
Service Class | | | 1,634 | | | | 24,544 | | | | 3,224 | | | | 33,244 | |
| | | 37,533 | | | | $565,546 | | | | 77,109 | | | | $797,216 | |
| Shares reacquired | | | | | | | | | | | | | | | | |
Initial Class | | | (813,422 | ) | | | $(11,782,957 | ) | | | (899,889 | ) | | | $(10,282,882 | ) |
Service Class | | | (107,508 | ) | | | (1,556,994 | ) | | | (150,575 | ) | | | (1,610,090 | ) |
| | | (920,930 | ) | | | $(13,339,951 | ) | | | (1,050,464 | ) | | | $(11,892,972 | ) |
| Net change | | | | | | | | | | | | | | | | |
Initial Class | | | (730,155 | ) | | | $(10,533,032 | ) | | | (736,274 | ) | | | $(8,421,820 | ) |
Service Class | | | (89,726 | ) | | | (1,297,005 | ) | | | (99,826 | ) | | | (1,046,364 | ) |
| | | (819,881 | ) | | | $(11,830,037 | ) | | | (836,100 | ) | | | $(9,468,184 | ) |
The fund and certain other funds managed by MFS participate in a $1.1 billion unsecured committed line of credit, subject to a $1 billion sublimit, provided by a syndication of banks under a credit agreement. Borrowings may be made for temporary financing needs. Interest is charged to each fund, based on its borrowings, generally at a rate equal to the higher of the Federal Reserve funds rate or one month LIBOR plus an agreed upon spread. A commitment fee, based on the average daily, unused portion of the committed line of credit, is allocated among the participating funds at the end of each calendar quarter. In addition, the fund and other funds managed by MFS have established unsecured uncommitted borrowing arrangements with certain banks for temporary financing needs. Interest is charged to each fund, based on its borrowings, at a rate equal to the Federal Reserve funds rate plus an agreed upon spread. For the year ended December 31, 2010, the fund’s commitment fee and interest expense were $823 and $0, respectively, and are included in miscellaneous expense on the Statement of Operations.
| (7) | | Transactions in Underlying Funds – Affiliated Issuers |
An affiliated issuer may be considered one in which the fund owns 5% or more of the outstanding voting securities, or a company which is under common control. For the purposes of this report, the fund assumes the following to be affiliated issuers:
| | | | | | | | | | | | | | |
| Underlying Funds | | Beginning
Shares/Par
Amount | | Acquisitions
Shares/Par
Amount | | | Dispositions
Shares/Par
Amount | | | Ending
Shares/Par
Amount | |
| MFS Institutional Money Market Portfolio | | 945,330 | | | 17,864,693 | | | | (18,126,794 | ) | | | 683,229 | |
| | | | |
| Underlying Funds | | Realized
Gain (Loss) | | Capital Gain
Distributions | | | Dividend
Income | | | Ending
Value | |
| MFS Institutional Money Market Portfolio | | $— | | | $— | | | | $1,839 | | | | $683,229 | |
18
MFS Global Growth Portfolio
REPORT OF INDEPENDENT REGISTERED PUBLIC ACCOUNTING FIRM
To the Board of Trustees of MFS Variable Insurance Trust II and the Shareholders of
MFS Global Growth Portfolio:
We have audited the accompanying statement of assets and liabilities, including the portfolio of investments, of MFS Global Growth Portfolio (the “Fund”) (one of the portfolios comprising MFS Variable Insurance Trust II) as of December 31, 2010, and the related statement of operations for the year then ended, the statements of changes in net assets for each of the two years in the period then ended, and the financial highlights for each of the five years in the period then ended. These financial statements and financial highlights are the responsibility of the Fund’s management. Our responsibility is to express an opinion on these financial statements and financial highlights based on our audits.
We conducted our audits in accordance with the standards of the Public Company Accounting Oversight Board (United States). Those standards require that we plan and perform the audit to obtain reasonable assurance about whether the financial statements and financial highlights are free of material misstatement. The Fund is not required to have, nor were we engaged to perform, an audit of its internal control over financial reporting. Our audits included consideration of internal control over financial reporting as a basis for designing audit procedures that are appropriate in the circumstances, but not for the purpose of expressing an opinion on the effectiveness of the Fund’s internal control over financial reporting. Accordingly, we express no such opinion. An audit also includes examining, on a test basis, evidence supporting the amounts and disclosures in the financial statements, assessing the accounting principles used and significant estimates made by management, as well as evaluating the overall financial statement presentation. Our procedures included confirmation of securities owned as of December 31, 2010, by correspondence with the custodian and brokers; where replies were not received from brokers, we performed other auditing procedures. We believe that our audits provide a reasonable basis for our opinion.
In our opinion, the financial statements and financial highlights referred to above present fairly, in all material respects, the financial position of MFS Global Growth Portfolio as of December 31, 2010, the results of its operations for the year then ended, the changes in its net assets for each of the two years in the period then ended, and the financial highlights for each of the five years in the period then ended, in conformity with accounting principles generally accepted in the United States of America.
DELOITTE & TOUCHE LLP
Boston, Massachusetts
February 14, 2011
19
MFS Global Growth Portfolio
TRUSTEES AND OFFICERS – IDENTIFICATION AND BACKGROUND
The Trustees and officers of the Trust, as of February 1, 2011, are listed below, together with their principal occupations during the past five years. (Their titles may have varied during that period.) The address of each Trustee and officer is 500 Boylston Street, Boston, Massachusetts 02116.
| | | | | | |
Name, Date of Birth | | Position(s) Held
with Fund | | Trustee/Officer
Since (1) | | Principal Occupations During the Past Five Years and
Other Directorships (2) |
| INTERESTED TRUSTEE | | | | |
David D. Horn (3) (born 6/07/41) | | Trustee | | April 1986 | | Private investor; Sun Life Assurance Company of Canada, Senior Vice President and General Manager for the United States (until 1997); Director (until March 2004) |
| | |
| INDEPENDENT TRUSTEES | | | | |
J. Kermit Birchfield (born 1/08/40) | | Chairman | | May 1997 | | Consultant; Century Partners, Inc. (investments), Director; Displaytech, Inc. (technology), Chairman; Dessin Fournir LLC (furniture manufacturer), Director; Site Watch LLC (software to monitor oil tanks), Managing Director (2006 to present); Juridica Investments (fund investing in judicial matters), Director (2007 to present), Immuno Science, Inc. (medical research), Independent Director (2009 to present), Intermountain Industries, Inc. (oil & gas exploration and production), Director (until February 2009) |
| | | |
Robert C. Bishop (born 1/13/43) | | Trustee | | May 2001 | | AutoImmune, Inc. (pharmaceutical product development), Chairman, President and Chief Executive Officer; Caliper Life Sciences Corp. (laboratory analytical instruments), Chairman; Optobionics Corporation (ophthalmic devices), Director (until 2007); Millipore Corporation (purification/filtration products), Director (until July 2010); Waterstreet Capital (leverage buyouts), Advisory Board (until August 2010) |
| | | |
Frederick H. Dulles (born 3/12/42) | | Trustee | | May 2001 | | Dulles International Law LLC (law firm), Senior Lawyer (since 2009); Juridica Capital Management (US) Inc. (litigation financing), Vice President and General Counsel (since 2009); Dulles Properties LLC (real estate), Broker (since 2008); The Citadel School of Business Administration (education), Adjunct Professor (since 2003); Disher, Hamrick & Myers Residential, Inc. (real estate), Broker (until 2006); Frederick H. Dulles Law Practice (law firm), (until 2006); Charlestown School of Law (education), Adjunct Professor (until 2007); Prudential Carolina Real Estate, (real estate), Broker (until 2008); Free Enterprise Foundation Inc. (research institute), Director & Secretary (until 2008); Ten State International Law PLLP (law firm), Of Counsel (until 2009) |
| | | |
Marcia A. Kean (born 6/30/48) | | Trustee | | April 2005 | | Feinstein Kean Healthcare (consulting), Chief Executive Officer |
| | | |
Ronald G. Steinhart (born 6/15/40) | | Trustee | | May 2001 | | Private investor; Penske Automotive Group (automotive retailer), Director; Animal Health International, Inc. (animal health products), Director (since 2007); Texas Industries (concrete/aggregates/cement), Director (since 2007); Susser Holdings Corporation (retail convenience stores and distributor of wholesale motor fuel), Director (since 2009); Prentiss Properties Trust (real estate investment trust), Director (until 2006); Penson Worldwide, Inc. (securities clearance), Director (until 2008) |
| | | |
Haviland Wright (born 7/21/48) | | Trustee | | May 2001 | | X-Change Corp. (multi-media web services), Director (since 2010); Nano Loa Inc. (liquid crystal displays), Director (until 2009); Profitability of Hawaii (software), Chief Development Officer (until 2010); Elixir Technologies Corporation (software), Director (until 2010) |
| | | |
| OFFICERS | | | | | | |
Maria F. DiOrioDwyer (4)
(born 12/01/58) | | President | | November 2005 | | Massachusetts Financial Services Company, Executive Vice President and Chief Regulatory Officer; Chief Compliance Officer (since December 2006) |
| | | |
| Christopher R. Bohane (4) (born 1/18/74) | | Assistant Secretary and Assistant Clerk | | July 2005 | | Massachusetts Financial Services Company, Vice President and Senior Counsel |
| | | |
John M. Corcoran (4) (born 4/13/65) | | Treasurer | | October 2008 | | Massachusetts Financial Services Company, Senior Vice President (since October 2008); State Street Bank and Trust (financial services provider), Senior Vice President, (until September 2008) |
| | | |
Ethan D. Corey (4) (born 11/21/63) | | Assistant Secretary and Assistant Clerk | | July 2005 | | Massachusetts Financial Services Company, Senior Vice President and Associate General Counsel |
| | | |
David L. DiLorenzo (4) (born 8/10/68) | | Assistant Treasurer | | July 2005 | | Massachusetts Financial Services Company, Vice President |
| | | |
Timothy M. Fagan (4) (born 7/10/68) | | Assistant Secretary and Assistant Clerk | | September 2005 | | Massachusetts Financial Services Company, Vice President and Senior Counsel |
| | | |
Mark D. Fischer (4) (born 10/27/70) | | Assistant Treasurer | | July 2005 | | Massachusetts Financial Services Company, Vice President |
20
MFS Global Growth Portfolio
Trustees and Officers – continued
| | | | | | |
Name, Date of Birth | | Position(s) Held
with Fund | | Trustee/Officer
Since (1) | | Principal Occupations During the Past Five Years and
Other Directorships (2) |
Robyn L. Griffin (born 7/04/75) | | Assistant Independent Chief Compliance Officer | | August 2008 | | Griffin Compliance LLC (provider of compliance services), Principal (since August 2008); State Street Corporation (financial services provider), Mutual Fund Administration Assistant Vice President (October 2006 – July 2008); Liberty Mutual Group (insurance), Personal Market Assistant Controller (April 2006 – October 2006); Deloitte & Touche LLP (professional services firm), Senior Manager (prior to April 2006) |
| | | |
Brian E. Langenfeld (4) (born 3/07/73) | | Assistant Secretary and Assistant Clerk | | May 2006 | | Massachusetts Financial Services Company, Vice President and Senior Counsel (since May 2006); John Hancock Advisers, LLC, Assistant Vice President and Counsel (until April 2006) |
| | | |
Ellen Moynihan (4) (born 11/13/57) | | Assistant Treasurer | | May 1997 | | Massachusetts Financial Services Company, Senior Vice President |
| | | |
Susan S. Newton (4) (born 3/07/50) | | Assistant Secretary and Assistant Clerk | | May 2005 | | Massachusetts Financial Services Company, Senior Vice President and Associate General Counsel |
| | | |
Susan A. Pereira (4)
(born 11/05/70) | | Assistant Secretary and Assistant Clerk | | July 2005 | | Massachusetts Financial Services Company, Vice President and Senior Counsel |
| | | |
Mark N. Polebaum (4) (born 5/01/52) | | Secretary and Clerk | | February 2006 | | Massachusetts Financial Services Company, Executive Vice President, General Counsel and Secretary (since January 2006); Wilmer Cutler Pickering Hale and Dorr LLP (law firm), Partner (until January 2006) |
| | | |
Frank L. Tarantino (born 3/07/44) | | Independent Chief Compliance Officer | | September 2004 | | Tarantino LLC (provider of compliance services), Principal |
| | | |
Richard S. Weitzel (4) (born 7/16/70) | | Assistant Secretary and Assistant Clerk | | October 2007 | | Massachusetts Financial Services Company, Vice President and Assistant General Counsel |
| | | |
James O. Yost (4) (born 6/12/60) | | Assistant Treasurer | | April 1992 | | Massachusetts Financial Services Company, Senior Vice President |
| (1) | Date first appointed to serve as Trustee/Officer of an MFS fund or a Compass variable account. Each Trustee has served continuously since appointment. For the period March 2008 until October 2008, Ms. DiOrioDwyer served as Treasurer of the Funds. |
| (2) | Directorships or trusteeships of companies required to report to the Securities and Exchange Commission (i.e., “public companies”). |
| (3) | “Interested person” of the Trust, within the meaning of the Investment Company Act of 1940 (referred to as the 1940 Act), which is the principal federal law governing investment companies like the Trust, as a result of position with Sun Life of Canada (U.S.). The address of Sun Life of Canada (U.S.) is One Sun Life Executive Park, Wellesley Hills, Massachusetts 02481. |
| (4) | “Interested person” of MFS within the meaning of the 1940 Act. The address of MFS is 500 Boylston Street, Boston, Massachusetts 02116. |
The Trust does not hold annual meetings for the purpose of electing Trustees, and Trustees are not elected for fixed terms. Each Trustee and officer holds office until his or her successor is chosen and qualified, or until his or her earlier death, resignation, retirement or removal.
All Trustees currently serve as Trustees of the Trust and have served in that capacity since originally elected or appointed. All of the Trustees are also Managers of the Compass Variable Accounts. The executive officers of the Trust hold similar offices for the Compass Variable Accounts and other funds in the MFS fund complex. As of January 1, 2011, each Trustee serves as a Trustee or Manager of 31 Accounts/Portfolios.
21
MFS Global Growth Portfolio
Trustees and Officers – continued
The Statement of Additional Information for the Fund and further information about the Trustees are available without charge upon request by calling 1-800-752-7215.
| | |
Investment Adviser
Massachusetts Financial Services Company 500 Boylston Street, Boston, MA 02116-3741 | | Custodian State Street Bank and Trust 1 Lincoln Street, Boston, MA 02111-2900 |
Distributor
MFS Fund Distributors, Inc. 500 Boylston Street, Boston, MA 02116-3741 | | Independent Registered Public Accounting Firm Deloitte & Touche LLP 200 Berkeley Street, Boston, MA 02116 |
Portfolio Managers David Antonelli Jeffrey Constantino | | |
22
MFS Global Growth Portfolio
BOARD REVIEW OF INVESTMENT ADVISORY AGREEMENT
The Investment Company Act of 1940 requires that both the full Board of Trustees and a majority of the non-interested (“independent”) Trustees, voting separately, annually approve the continuation of the investment advisory agreement between MFS Variable Insurance Trust II (the “Trust”) and Massachusetts Financial Services Company (“MFS”) on behalf of the Fund. The Trustees consider matters bearing on the Fund and the advisory arrangement at their meetings throughout the year, including a review of performance data at each regular meeting. In addition, the independent Trustees met in person in May and again in July 2010 (“contract review meetings”) for the specific purpose of considering whether to approve the continuation of the investment advisory agreement for the Fund. The independent Trustees were assisted in their evaluation of the investment advisory agreement by independent legal counsel, from whom they received separate legal advice and with whom they met separately from MFS management during various contract review meetings. The independent Trustees were also assisted in this process by the Fund’s Independent Chief Compliance Officer, a full-time senior officer appointed by and reporting to the independent Trustees.
In connection with their deliberations, the Trustees, including the independent Trustees, considered such information and factors as they believed, in light of the legal advice furnished to them and their own business judgment, to be relevant. The investment advisory agreement was considered separately for the Fund, although the Trustees also took into account the common interests of all Funds in the Trust in their review. As described below, the Trustees considered the nature, quality, and extent of the various investment advisory, administrative, and shareholder services performed by MFS under the existing investment advisory agreement and other arrangements with the Trust.
In connection with their contract review meetings, the Trustees received and relied upon materials which included, among other items: (i) information provided by Lipper Inc. (“Lipper”) on the investment performance of the Fund for various time periods ended December 31, 2009, compared to the investment performance of a group of funds with substantially similar investment classifications/objectives (the “Lipper performance universe”), (ii) information provided by Lipper on the Fund’s advisory fees and other expenses compared to the advisory fees and other expenses of comparable funds identified by Lipper (the “Lipper expense group”), (iii) information provided by MFS on the advisory fees of comparable portfolios of its other clients, including institutional separate account and other clients, (iv) information as to whether, and to what extent applicable, expense waivers, reimbursements or fee “breakpoints” are observed for the Fund, (v) information regarding MFS’ financial results and financial condition, including MFS’ and certain of its affiliates’ estimated profitability from services performed for the Fund, (vi) MFS’ views regarding the outlook for the mutual fund industry and its strategic business plans, (vii) descriptions of various functions performed by MFS for the Trust, such as compliance monitoring and portfolio trading practices, and (viii) information regarding the overall organization of MFS, including information about MFS’ senior management and other personnel providing investment advisory, administrative and other services to the Fund. The comparative performance, fee and expense information prepared and provided by Lipper was not independently verified, and the independent Trustees did not independently verify any information provided to them by MFS.
The Trustees’ conclusion as to the continuation of the investment advisory agreement was based on comprehensive consideration of all information provided to the Trustees and was not the result of any single factor. Some of the factors that figured particularly in the Trustees’ deliberations are described below for the Fund, while individual Trustees may have given different weight to various factors and evaluated the information presented as a whole differently than another Trustee. The Trustees recognized that the fee arrangements for the Fund reflect years of review and discussion between the independent Trustees and MFS, that certain aspects of such arrangements may receive greater scrutiny in some years than others, and that the Trustees’ conclusions may be based, in part, on their consideration of these same arrangements during the course of the year and in prior years.
Based on information provided by Lipper, the Trustees compared the Fund’s total return investment performance to the performance of the Lipper performance universe over various time periods. The Trustees placed particular emphasis on the total return performance of the Fund’s Initial Class shares in comparison to the performance of funds in its Lipper performance universe over the one-, three- and five-year periods ended December 31, 2009. The Trustees did not rely on performance results for more recent periods, including those shown elsewhere in this report.
The Trustees noted the performance of the Fund’s Initial Class shares was in the 2nd quintile relative to the other funds in the Lipper performance universe for the one-year period (the 1st quintile being the best performers and the 5th quintile being the worst performers). The total return performance of the Fund was in the 3rd quintile for the three-year and the five-year periods ended December 31, 2009, relative to the Lipper performance universe. Based on the nature and quality of services provided by MFS, the Board of Trustees concluded that the Fund’s performance was satisfactory.
23
MFS Global Growth Portfolio
Board Review of Investment Advisory Agreement – continued
In the course of their deliberations, the Trustees took into account information provided by MFS during contract review meetings, as well as during investment review meetings conducted with portfolio management personnel during the course of the year.
In assessing the reasonableness of the Fund’s advisory fee, the Trustees considered, among other information, the Fund’s advisory fee and the total expense ratio of the Fund’s Initial Class shares as a percentage of average daily net assets, compared to the advisory fee and total expense ratios of its peer group of funds based on information provided by Lipper. The Trustees also considered the advisory fees charged by MFS to institutional accounts. In comparing these fees, the Trustees considered the generally broader scope of services provided by MFS to the Trust than those provided to institutional accounts. The Trustees also considered the higher demands placed on MFS’ investment personnel and trading infrastructure as a result of the daily cash in-flows and out-flows of the Fund, and the impact on MFS and related expenses due to the more extensive regulatory regime to which the Fund is subject, compared to institutional accounts.
In considering the fees, the Trustees noted from the Lipper data that the Fund’s effective advisory fee rate and total expense ratio were each above the median of such fees and expenses of funds in the Lipper expense group. In addition, the Trustees accepted MFS’ offer to continue the expense limitation for the Fund. The Trustees further concluded that the existing breakpoints were sufficient to allow the Fund to benefit from economies of scale as its assets grow. The Trustees concluded that the fees were reasonable in light of the nature and quality of services provided.
The Trustees also considered information prepared by MFS relating to its costs and profits with respect to the Fund and other investment companies and accounts advised by MFS, as well as MFS’ methodologies used to determine and allocate its costs to the Fund and other accounts and products for purposes of estimating profitability.
After reviewing these and other factors described below, the Trustees concluded that the advisory fees charged to the Fund represent reasonable compensation in light of the nature and quality of the services being provided by MFS.
In addition, the Trustees considered MFS’ resources and related efforts to continue to retain, attract and motivate capable personnel to serve the Fund. The Trustees also considered the financial resources of MFS and its parent, Sun Life Financial Inc. The Trustees further considered any advantages and possible disadvantages of having an adviser which also serves other investment companies as well as institutional accounts.
The Trustees also considered the nature, quality, cost, and extent of administrative, transfer agency, and distribution services provided to the Fund by MFS and its affiliates under agreements and plans other than the investment advisory agreement, including the 12b-1 fees the Fund pays to MFS Fund Distributors, Inc., an affiliate of MFS. The Trustees also considered the nature, extent and quality of certain other services MFS performs or arranges on the Fund’s behalf, which may include securities lending programs, directed expense payment programs, class action recovery programs, and MFS’ interaction with third-party service providers, principally custodians and sub-custodians. The Trustees concluded that the various non-advisory services provided by MFS and its affiliates on behalf of the Fund were satisfactory. The Trustees also considered the benefits to MFS from the use of the Fund’s portfolio brokerage commissions to pay for investment research and various other factors. Additionally, the Trustees considered so-called “fall-out benefits” to MFS such as reputational value derived from serving as investment manager to the Trust, and determined that any such benefits derived by MFS were reasonable and fair.
Based on their evaluation of factors that they deemed to be material, including those factors described above, the Board of Trustees, including a majority of the independent Trustees, concluded that the investment advisory agreement should be continued for an additional one-year period, commencing September 1, 2010.
A discussion regarding the Board’s most recent review and renewal of the fund’s Investment Advisory Agreement with MFS is available by clicking on the fund’s name under “Variable Insurance Portfolios — VIT II” in the “Products and Performance” section of the MFS Web site (mfs.com).
24
MFS Global Growth Portfolio
PROXY VOTING POLICIES AND INFORMATION
A general description of the MFS funds’ proxy voting policies and procedures is available without charge, upon request, by calling 1-800-225-2606, by visiting the Proxy Voting section of mfs.com or by visiting the SEC’s Web site at http://www.sec.gov.
Information regarding how the fund voted proxies relating to portfolio securities during the most recent twelve-month period ended June 30 is available without charge by visiting the Proxy Voting section of mfs.com or by visiting the SEC’s Web site at http://www.sec.gov.
QUARTERLY PORTFOLIO DISCLOSURE
The fund will file a complete schedule of portfolio holdings with the Securities and Exchange Commission (the Commission) for the first and third quarters of each fiscal year on Form N-Q. The fund’s Form N-Q may be reviewed and copied at the:
Public Reference Room
Securities and Exchange Commission
100 F Street, NE, Room 1580
Washington, D.C. 20549
Information on the operation of the Public Reference Room may be obtained by calling the Commission at 1-800-SEC-0330. The fund’s Form N-Q is available on the EDGAR database on the Commission’s Internet Web site at http://www.sec.gov, and copies of this information may be obtained, upon payment of a duplicating fee, by electronic request at the following e-mail address: publicinfo@sec.gov or by writing the Public Reference Section at the above address.
FURTHER INFORMATION
From time to time, MFS may post important information about the fund or the MFS funds on the MFS web site (mfs.com). This information is available by visiting the “News & Commentary” section of mfs.com or by clicking on the fund’s name under “Variable Insurance Portfolios — VIT II” in the “Products and Performance” section of mfs.com.
FEDERAL TAX INFORMATION (unaudited)
The following information is provided pursuant to provisions of the Internal Revenue Code.
For corporate shareholders, 49.71% of the ordinary income dividends paid during the fiscal year qualify for the corporate dividends received deduction.
Income derived from foreign sources was $934,574. The fund intends to pass through foreign tax credits of $78,192 for the fiscal year.
25
MFS Global Growth Portfolio
MFS® PRIVACY NOTICE
Privacy is a concern for every investor today. At MFS Investment Management® and the MFS funds, we take this concern very seriously. We want you to understand our policies about the investment products and services that we offer, and how we protect the nonpublic personal information of investors who have a direct relationship with us and our wholly owned subsidiaries.
Throughout our business relationship, you provide us with personal information. We maintain information and records about you, your investments, and the services you use. Examples of the nonpublic personal information we maintain include
| | Ÿ | | data from investment applications and other forms |
| | Ÿ | | share balances and transactional history with us, our affiliates, or others |
| | Ÿ | | facts from a consumer reporting agency |
We do not disclose any nonpublic personal information about our customers or former customers to anyone, except as permitted by law. We may share nonpublic personal information with third parties or certain of our affiliates in connection with servicing your account or processing your transactions. We may share information with companies or financial institutions that perform marketing services on our behalf or with other financial institutions with which we have joint marketing arrangements, subject to any legal requirements.
Authorization to access your nonpublic personal information is limited to appropriate personnel who provide products, services, or information to you. We maintain physical, electronic, and procedural safeguards to help protect the personal information we collect about you.
If you have any questions about the MFS privacy policy, please call 1-800-225-2606 any business day.
Note: If you own MFS products or receive MFS services in the name of a third party such as a bank or broker-dealer, their privacy policy may apply to you instead of ours.
26


MFS® RESEARCH INTERNATIONAL PORTFOLIO
This report is prepared for the general information of contract owners. It is authorized for distribution to prospective investors only when preceded or accompanied by a current prospectus.
NOT FDIC INSURED Ÿ MAY LOSE VALUE Ÿ NO BANK OR CREDIT UNION GUARANTEE Ÿ NOT A DEPOSIT Ÿ NOT INSURED BY ANY FEDERAL GOVERNMENT AGENCY OR NCUA/NCUSIF
MFS Research International Portfolio
LETTER FROM THE CEO

Dear Contract Owners:
After an extended rebound in the financial markets, uncertainty returned in 2010 as investors began to question the durability of the recovery for global economies and markets. That uncertainty led to increased risk aversion, especially as investors saw the eurozone struggle with the debt woes of many of its members. In September, the U.S. Federal Reserve Board’s promises to further loosen monetary policy helped assuage market fears and drive asset prices off their recent lows. A combination of solid earnings and improving economic data gave an additional boost to investor sentiment. As we enter 2011, we are cautiously optimistic that economic growth will continue to improve and that the global economies will recover from the shocks of the past few years. We expect the pace of recovery worldwide will be uneven and volatile.
As always, we continue to be mindful of the many economic challenges faced at the local, national, and international levels. It is in times such as these that we want to remind investors of the merits of maintaining a long-term view, adhering to basic investing principles such as asset allocation and diversification, and working closely with their advisors to research and identify appropriate investment opportunities.
Respectfully,

Robert J. Manning
Chairman and Chief Executive Officer
MFS Investment Management®
February 14, 2011
The opinions expressed in this letter are subject to change, may not be relied upon for investment advice, and no forecasts can be guaranteed.
1
MFS Research International Portfolio
PORTFOLIO COMPOSITION
Portfolio structure

| | | | |
| Top ten holdings | | | | |
| Nestle S.A. | | | 3.1% | |
| Royal Dutch Shell PLC, “A” | | | 2.7% | |
| HSBC Holdings PLC | | | 2.7% | |
| BHP Billiton PLC | | | 2.3% | |
| Siemens AG | | | 2.1% | |
| Roche Holding AG | | | 2.0% | |
| LVMH Moet Hennessy Louis Vuitton S.A. | | | 1.9% | |
| BNP Paribas | | | 1.9% | |
| Vodafone Group PLC | | | 1.9% | |
| BP PLC | | | 1.7% | |
| | | | |
| Global equity sectors | | | | |
| Capital Goods | | | 25.9% | |
| Financial Services | | | 23.4% | |
| Energy | | | 12.8% | |
| Health Care | | | 8.4% | |
| Technology | | | 8.3% | |
| Consumer Staples | | | 7.8% | |
| Consumer Cyclicals | | | 7.6% | |
| Telecommunications/Cable Television | | | 5.5% | |
| |
Issuer country weightings | | | | |
| Japan | | | 17.6% | |
| United Kingdom | | | 17.3% | |
| Switzerland | | | 9.7% | |
| France | | | 9.7% | |
| Germany | | | 9.4% | |
| Netherlands | | | 5.4% | |
| Hong Kong | | | 4.1% | |
| Australia | | | 3.4% | |
| China | | | 3.1% | |
| Other Countries | | | 20.3% | |
Percentages are based on net assets as of 12/31/10.
The portfolio is actively managed and current holdings may be different.
2
MFS Research International Portfolio
MANAGEMENT REVIEW
Summary of Results
For the twelve months ended December 31, 2010, Initial Class shares of the MFS Research International Portfolio (the “fund”) provided a total return of 10.63%, while Service Class shares of the fund provided a total return of 10.34%. These compare with a return of 8.21% for the fund’s benchmark, the Morgan Stanley Capital International (MSCI) EAFE (Europe, Australasia, Far East) Index.
Market Environment
The first quarter of the reporting period witnessed a continuation of the financial market and macroeconomic rebounds that had begun in early 2009. These recoveries in global activity and asset valuations were generally synchronized around the world, led importantly by emerging Asian economies, but broadening to include most of the global economy to varying degrees. Primary drivers of the recoveries included an unwinding of the inventory destocking that took place earlier, the production of manufacturing and capital goods, as well as massive fiscal and monetary stimulus.
During most of the remainder of the period, heightened risk surrounding the public-debt profiles of several of the peripheral European countries impaired market sentiment. At the same time, the improving trend in global macroeconomic data began to weaken somewhat. These two dynamics caused many asset prices to retrench significantly, as many questioned the durability of the global recovery.
Towards the end of the period, the U.S. Federal Reserve led markets to believe that further monetary loosening would be forthcoming if macroeconomic activity did not show signs of improvement. The prospects for more easing by the Fed improved market sentiment and drove risk-asset prices markedly higher. However, in a text-book case of “buy the rumor, sell the fact,” the weeks following the early November announcement of further quantitative easing saw a sell-off in U.S. Treasury bonds. This rise in Treasury yields occurred despite risk-off behavior in equities and credit markets (which would normally result in Treasury yield compression), and appears to have been the result of a few factors: signs of improved U.S. and global economic activity; opposition to quantitative easing from some quarters; and crowded long positions in U.S. Treasuries. The December agreement on an expansionary U.S. fiscal package also boosted sentiment, leading markets to reach near-term highs in risky asset valuations toward year end.
Contributors to Performance
Stock selection in the capital goods sector contributed to the fund’s performance relative to the MSCI EAFE Index. Holdings of automotive and industrial products manufacturer Tomkins (h) (United Kingdom), Australian mining company Iluka Resources (b) Ltd., and diversified mining company Teck Resources (b) (Canada) were among the fund’s top contributors. Shares of Teck appreciated due to increased demand from developing economies and weaker-than-expected supply from competitors. The company also benefited from an increase in commodities prices during the reporting period. The fund’s overweight position in shares of shipbuilder and shipyard operator Keppel (Singapore) and industrial conglomerate Hutchison Whampoa (Hong Kong) also aided relative returns. The fund’s ownership in shares of industrial transport and engineering firm MAN SE (Germany) was another contributor.
Favorable stock selection in the financial services sector also had a positive impact on relative returns. The fund’s ownership in shares of banking and treasury management firm ICICI Bank (b) (India) and our avoidance of weak-performing financial services firm Banco Santander (Spain) contributed to relative returns.
Securities in other sectors that bolstered relative results included integrated oil company BP (United Kingdom) and luxury goods company LVMH Moët Hennessy Louis Vuitton (France). Shares of LVMH rose during the reporting period as the company reported sales that exceeded expectations, led by Louis Vuitton, Wines & Spirits, and cosmetics retailer Sephora. The company’s profitability reflects ongoing robust demand for luxury goods, which has been increasing in emerging markets. Price increases in Europe and the replenishing of inventories at U.S. and European retailers following the recession has also been positive for the stock.
Detractors from Performance
Stock selection in the health care sector detracted from relative performance during the reporting period. Holdings of Swiss pharmaceutical and diagnostic company Roche Holding and drug maker Sanofi-Aventis (France) detracted from relative returns. Shares of Sanofi-Aventis came under pressure due, in part, to a stalled bid by the drug maker to acquire biotech company Genzyme.
Elsewhere, the fund’s ownership in shares of weak-performing global banking group BNP Paribas (France), power and gas company E.ON (h) (Germany), and Hong Kong-based retailer Esprit Holdings weighed on relative returns. Holdings of banking services provider Unione Di Banche (h) (Italy), oil and gas exploration company INPEX (Japan), financial services firm SNS
3
MFS Research International Portfolio
Management Review – continued
REAAL Groep (b) (Netherlands), and French energy and environmental services provider GDF SUEZ (h) also detracted from relative returns. Not owning shares of Australian mining operator Rio Tinto (h), a standout performer, was an additional negative factor.
During the reporting period, the fund’s currency exposure detracted from relative performance. All of MFS’ investment decisions are driven by the fundamentals of each individual opportunity and as such, it is common for our portfolios to have different currency exposure than the benchmark.
Respectfully,
| | |
| Jose Luis Garcia | | Thomas Melendez |
| Portfolio Manager | | Portfolio Manager |
| (b) | Security is not a benchmark constituent. |
| (h) | Security was not held in the portfolio at period end. |
The views expressed in this report are those of the portfolio managers only through the end of the period of the report as stated on the cover and do not necessarily reflect the views of MFS or any other person in the MFS organization. These views are subject to change at any time based on market or other conditions, and MFS disclaims any responsibility to update such views. These views may not be relied upon as investment advice or an indication of trading intent on behalf of any MFS portfolio. References to specific securities are not recommendations of such securities, and may not be representative of any MFS portfolio’s current or future investments.
4
MFS Research International Portfolio
PERFORMANCE SUMMARY THROUGH 12/31/10
The following chart illustrates the historical performance of the fund in comparison to its benchmark(s). Benchmarks are unmanaged and may not be invested in directly. Benchmark returns do not reflect any fees or expenses. The performance of other share classes will be greater than or less than that of the class depicted below. (See Notes to Performance Summary.)
Performance data shown represents past performance and is no guarantee of future results. Investment return and principal value fluctuate so your units, when sold, may be worth more or less than the original cost; current performance may be lower or higher than quoted. The performance shown does not reflect the deduction of taxes, if any, that a contract holder would pay on fund distributions or the redemption of contract units. The returns for the fund shown also do not reflect the deduction of expenses associated with variable products, such as mortality and expense risk charges, separate account charges, and sales charges imposed by the insurance company separate accounts. Such expenses would reduce the overall returns shown.
Growth of a Hypothetical $10,000 Investment
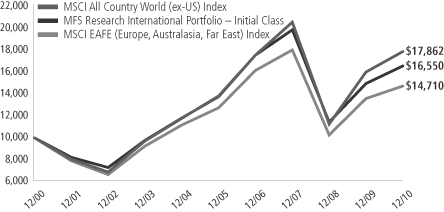
Total Returns through 12/31/10
Average annual total returns
| | | | | | | | | | | | | | |
| | | Share class | | Class inception date | | 1-yr | | 5-yr | | 10-yr | | Life (t) | | |
| | | Initial Class | | 5/06/98 | | 10.63% | | 3.74% | | 5.17% | | N/A | | |
| | | Service Class | | 8/24/01 | | 10.34% | | 3.48% | | N/A | | 6.89% | | |
| | | | | |
| Comparative benchmarks | | | | | | | | | | |
| | | MSCI EAFE (Europe, Australasia, Far East) Index (f) | | 8.21% | | 2.94% | | 3.94% | | N/A | | |
| | | MSCI All Country World (ex-US) Index (f) | | 11.60% | | 5.29% | | 5.97% | | N/A | | |
| (f) | Source: FactSet Research Systems Inc. |
| (t) | For the period from the class inception date through the stated period end (for those share classes with less than 10 years of performance history). No comparative benchmark performance information is provided for “life” periods. (See Notes to Performance Summary.) |
Benchmark Definitions
MSCI All Country World (ex-US) Index – a market capitalization-weighted index that is designed to measure equity market performance in the developed and emerging markets, excluding the U.S.
MSCI EAFE (Europe, Australasia, Far East) Index – a market capitalization-weighted index that is designed to measure equity market performance in the developed markets, excluding the U.S. and Canada.
It is not possible to invest directly in an index.
Notes to Performance Summary
Average annual total return represents the average annual change in value for each share class for the periods presented. Life returns are presented where the share class has less than 10 years of performance history and represent the average annual total return from the class inception date to the stated period end date. As the fund’s share classes may have different inception dates, the life returns may represent different time periods and may not be comparable. As a result, no comparative benchmark performance information is provided for life periods.
5
MFS Research International Portfolio
Performance Summary – continued
Performance results reflect any applicable expense subsidies and waivers in effect during the periods shown. Without such subsidies and waivers the fund’s performance results would be less favorable. Please see the prospectus and financial statements for complete details. All results are historical and assume the reinvestment of any dividends and capital gains distributions.
From time to time the fund may receive proceeds from litigation settlements, without which performance would be lower.
6
MFS Research International Portfolio
EXPENSE TABLE
Fund Expenses Borne by the Contract Holders During the Period,
July 1, 2010 through December 31, 2010
As a contract holder of the fund, you incur ongoing costs, including management fees; distribution and/or service (12b-1) fees; and other fund expenses. This example is intended to help you understand your ongoing costs (in dollars) of investing in the fund and to compare these costs with the ongoing costs of investing in other mutual funds.
The example is based on an investment of $1,000 invested at the beginning of the period and held for the entire period July 1, 2010 through December 31, 2010.
Actual Expenses
The first line for each share class in the following table provides information about actual account values and actual expenses. You may use the information in this line, together with the amount you invested, to estimate the expenses that you paid over the period. Simply divide your account value by $1,000 (for example, an $8,600 account value divided by $1,000 = 8.6), then multiply the result by the number in the first line under the heading entitled “Expenses Paid During Period” to estimate the expenses you paid on your account during this period.
Hypothetical Example for Comparison Purposes
The second line for each share class in the following table provides information about hypothetical account values and hypothetical expenses based on the fund’s actual expense ratio and an assumed rate of return of 5% per year before expenses, which is not the fund’s actual return. The hypothetical account values and expenses may not be used to estimate the actual ending account balance or expenses you paid for the period. You may use this information to compare the ongoing costs of investing in the fund and other funds. To do so, compare this 5% hypothetical example with the 5% hypothetical examples that appear in the shareholder reports of the other funds.
Please note that the expenses shown in the table are meant to highlight the fund’s ongoing costs only and do not take into account the fees and expenses imposed under the variable contracts through which your investment in the fund is made. Therefore, the second line for each share class in the table is useful in comparing ongoing costs associated with an investment in vehicles (such as the fund) which fund benefits under variable annuity and variable life insurance contracts and to qualified pension and retirement plans only, and will not help you determine the relative total costs of investing in the fund through variable annuity and variable life insurance contracts. If the fees and expenses imposed under the variable contracts were included, your costs would have been higher.
| | | | | | | | | | | | | | | | | | |
| Share Class | | | | Annualized
Expense Ratio | | | Beginning
Account Value
7/01/10 | | | Ending
Account Value
12/31/10 | | | Expenses Paid
During Period (p)
7/01/10-12/31/10 | |
| Initial Class | | Actual | | | 1.11% | | | | $1,000.00 | | | | $1,265.25 | | | | $6.34 | |
| | Hypothetical (h) | | | 1.11% | | | | $1,000.00 | | | | $1,019.61 | | | | $5.65 | |
| Service Class | | Actual | | | 1.36% | | | | $1,000.00 | | | | $1,263.55 | | | | $7.76 | |
| | Hypothetical (h) | | | 1.36% | | | | $1,000.00 | | | | $1,018.35 | | | | $6.92 | |
| (h) | 5% class return per year before expenses. |
| (p) | Expenses paid is equal to each class’ annualized expense ratio, as shown above, multiplied by the average account value over the period, multiplied by the number of days in the period, divided by the number of days in the year. |
7
MFS Research International Portfolio
PORTFOLIO OF INVESTMENTS – 12/31/10
The Portfolio of Investments is a complete list of all securities owned by your fund. It is categorized by broad-based asset classes.
| | | | | | | | |
| Issuer | | Shares/Par | | | Value ($) | |
| | | | | | | | |
| COMMON STOCKS – 99.7% | | | | | | | | |
| Alcoholic Beverages – 1.1% | |
| Heineken N.V. | | | 39,563 | | | $ | 1,939,728 | |
| | | | | | | | |
| Apparel Manufacturers – 2.4% | | | | | | | | |
| Li & Fung Ltd. | | | 142,000 | | | $ | 823,924 | |
| LVMH Moet Hennessy Louis Vuitton S.A. | | | 20,519 | | | | 3,375,345 | |
| | | | | | | | |
| | | | | | $ | 4,199,269 | |
| | | | | | | | |
| Automotive – 2.2% | |
| Bayerische Motoren Werke AG | | | 28,725 | | | $ | 2,258,970 | |
| DENSO Corp. | | | 47,500 | | | | 1,639,303 | |
| | | | | | | | |
| | | | | | $ | 3,898,273 | |
| | | | | | | | |
| Broadcasting – 1.3% | |
| Publicis Groupe S.A. | | | 33,982 | | | $ | 1,770,996 | |
| WPP Group PLC | | | 43,944 | | | | 540,911 | |
| | | | | | | | |
| | | | | | $ | 2,311,907 | |
| | | | | | | | |
| Brokerage & Asset Managers – 2.6% | |
| Aberdeen Asset Management PLC | | | 307,137 | | | $ | 971,601 | |
| BM&F Bovespa S.A. | | | 114,000 | | | | 901,699 | |
| Deutsche Boerse AG | | | 18,625 | | | | 1,289,229 | |
| Hong Kong Exchanges & Clearing Ltd. | | | 14,100 | | | | 319,811 | |
| Nomura Holdings, Inc. | | | 152,900 | | | | 969,867 | |
| | | | | | | | |
| | | | | | $ | 4,452,207 | |
| | | | | | | | |
| Business Services – 2.1% | |
| Cognizant Technology Solutions Corp., “A” (a) | | | 13,650 | | | $ | 1,000,407 | |
| Mitsubishi Corp. | | | 65,100 | | | | 1,762,407 | |
| Nomura Research, Inc. | | | 40,100 | | | | 890,218 | |
| | | | | | | | |
| | | | | | $ | 3,653,032 | |
| | | | | | | | |
| Chemicals – 0.8% | |
| Monsanto Co. | | | 8,500 | | | $ | 591,940 | |
| Nufarm Ltd. (a) | | | 151,786 | | | | 797,968 | |
| | | | | | | | |
| | | | | | $ | 1,389,908 | |
| | | | | | | | |
| Computer Software – 0.5% | |
| Dassault Systems S.A. | | | 10,904 | | | $ | 822,097 | |
| | | | | | | | |
| Computer Software – Systems – 3.4% | |
| Acer, Inc. | | | 795,935 | | | $ | 2,459,614 | |
| Konica Minolta Holdings, Inc. | | | 236,000 | | | | 2,453,307 | |
| Ricoh Co. Ltd. | | | 73,000 | | | | 1,069,959 | |
| | | | | | | | |
| | | | | | $ | 5,982,880 | |
| | | | | | | | |
| Conglomerates – 1.6% | |
| Hutchison Whampoa Ltd. | | | 271,000 | | | $ | 2,789,214 | |
| | | | | | | | |
| Construction – 0.7% | |
| Geberit AG | | | 4,043 | | | $ | 934,863 | |
| Urbi Desarrollos Urbanos S.A. de C.V. (a) | | | 150,250 | | | | 352,692 | |
| | | | | | | | |
| | | | | | $ | 1,287,555 | |
| | | | | | | | |
| | | | | | | | |
| Issuer | | Shares/Par | | | Value ($) | |
| | | | | | | | |
| COMMON STOCKS - continued | |
| Consumer Products – 1.4% | |
| Kimberly-Clark de Mexico S.A. de C.V., “A” | | | 81,660 | | | $ | 500,738 | |
| Reckitt Benckiser Group PLC | | | 35,529 | | | | 1,952,612 | |
| | | | | | | | |
| | | | | | $ | 2,453,350 | |
| | | | | | | | |
| Electrical Equipment – 3.7% | |
| Legrand S.A. | | | 10,929 | | | $ | 445,071 | |
| Schneider Electric S.A. | | | 16,025 | | | | 2,398,391 | |
| Siemens AG | | | 28,886 | | | | 3,578,253 | |
| | | | | | | | |
| | | | | | $ | 6,421,715 | |
| | | | | | | | |
| Electronics – 1.5% | |
| Samsung Electronics Co. Ltd. | | | 2,234 | | | $ | 1,868,064 | |
| Taiwan Semiconductor Manufacturing Co. Ltd. | | | 277,804 | | | | 676,490 | |
| | | | | | | | |
| | | | | | $ | 2,544,554 | |
| | | | | | | | |
| Energy – Independent – 1.2% | |
| Bankers Petroleum Ltd. (a) | | | 82,298 | | | $ | 629,050 | |
| INPEX Corp. | | | 255 | | | | 1,493,441 | |
| | | | | | | | |
| | | | | | $ | 2,122,491 | |
| | | | | | | | |
| Energy – Integrated – 6.2% | |
| BG Group PLC | | | 101,133 | | | $ | 2,043,486 | |
| BP PLC | | | 395,894 | | | | 2,873,552 | |
| China Petroleum & Chemical Corp. | | | 1,242,000 | | | | 1,188,823 | |
| Royal Dutch Shell PLC, “A” | | | 139,346 | | | | 4,645,982 | |
| | | | | | | | |
| | | | | | $ | 10,751,843 | |
| | | | | | | | |
| Engineering – Construction – 2.3% | |
| JGC Corp. | | | 75,000 | | | $ | 1,628,365 | |
| Keppel Corp. Ltd. | | | 202,000 | | | | 1,781,774 | |
| Outotec Oyj | | | 10,434 | | | | 644,722 | |
| | | | | | | | |
| | | | | | $ | 4,054,861 | |
| | | | | | | | |
| Food & Beverages – 4.6% | |
| Groupe Danone | | | 41,362 | | | $ | 2,598,891 | |
| Nestle S.A. | | | 92,336 | | | | 5,406,841 | |
| | | | | | | | |
| | | | | | $ | 8,005,732 | |
| | | | | | | | |
| Food & Drug Stores – 2.0% | |
| Lawson, Inc. | | | 39,900 | | | $ | 1,973,131 | |
| Tesco PLC | | | 236,341 | | | | 1,566,036 | |
| | | | | | | | |
| | | | | | $ | 3,539,167 | |
| | | | | | | | |
| Insurance – 4.0% | |
| Amlin PLC | | | 49,831 | | �� | $ | 317,680 | |
| China Pacific Insurance Co. Ltd. | | | 256,600 | | | | 1,066,306 | |
| Hiscox Ltd. | | | 115,431 | | | | 686,399 | |
| ING Groep N.V. (a) | | | 240,098 | | | | 2,335,737 | |
| SNS REAAL Groep N.V. (a) | | | 139,877 | | | | 596,267 | |
| Swiss Reinsurance Co. | | | 36,703 | | | | 1,974,504 | |
| | | | | | | | |
| | | | | | $ | 6,976,893 | |
| | | | | | | | |
8
MFS Research International Portfolio
Portfolio of Investments – continued
| | | | | | | | |
| Issuer | | Shares/Par | | | Value ($) | |
| | | | | | | | |
| COMMON STOCKS – continued | |
| Machinery & Tools – 3.1% | |
| Beml Ltd. | | | 19,074 | | | $ | 440,325 | |
| Glory Ltd. | | | 53,400 | | | | 1,315,433 | |
| KONE Oyj “B” | | | 4,624 | | | | 257,049 | |
| MAN SE | | | 22,539 | | | | 2,680,278 | |
| Schindler Holding AG | | | 2,204 | | | | 260,708 | |
| Sinotruk Hong Kong Ltd. | | | 366,500 | | | | 377,684 | |
| | | | | | | | |
| | | | | | $ | 5,331,477 | |
| | | | | | | | |
| Major Banks – 12.1% | |
| Bank of China Ltd. | | | 1,608,000 | | | $ | 848,189 | |
| Barclays PLC | | | 407,543 | | | | 1,662,524 | |
| BNP Paribas | | | 51,529 | | | | 3,278,339 | |
| BOC Hong Kong Holdings Ltd. | | | 243,000 | | | | 826,903 | |
| Credit Suisse Group AG | | | 48,814 | | | | 1,966,656 | |
| Erste Group Bank AG | | | 22,839 | | | | 1,072,464 | |
| HSBC Holdings PLC | | | 457,669 | | | | 4,645,933 | |
| Julius Baer Group Ltd. | | | 18,693 | | | | 875,672 | |
| KBC Group N.V. (a) | | | 19,151 | | | | 652,583 | |
| Mitsubishi UFJ Financial Group, Inc. | | | 177,900 | | | | 961,918 | |
| Sumitomo Mitsui Financial Group, Inc. | | | 61,800 | | | | 2,201,325 | |
| Westpac Banking Corp. | | | 91,760 | | | | 2,084,456 | |
| | | | | | | | |
| | | | | | $ | 21,076,962 | |
| | | | | | | | |
| Medical & Health Technology & Services – 2.2% | |
| Diagnosticos da America S.A. | | | 62,300 | | | $ | 844,428 | |
| Miraca Holdings, Inc. | | | 36,800 | | | | 1,482,153 | |
| Rhoen-Klinikum AG | | | 64,096 | | | | 1,410,680 | |
| | | | | | | | |
| | | | | | $ | 3,737,261 | |
| | | | | | | | |
| Medical Equipment – 1.2% | |
| Sonova Holding AG | | | 6,399 | | | $ | 826,053 | |
| Synthes, Inc. | | | 9,126 | | | | 1,232,742 | |
| | | | | | | | |
| | | | | | $ | 2,058,795 | |
| | | | | | | | |
| Metals & Mining – 4.9% | |
| BHP Billiton PLC | | | 98,923 | | | $ | 3,934,427 | |
| Iluka Resources Ltd. (a) | | | 183,318 | | | | 1,713,729 | |
| Teck Resources Ltd., “B” | | | 46,085 | | | | 2,863,916 | |
| | | | | | | | |
| | | | | | $ | 8,512,072 | |
| | | | | | | | |
| Natural Gas – Distribution – 1.2% | |
| Tokyo Gas Co. Ltd. | | | 454,000 | | | $ | 2,013,056 | |
| | | | | | | | |
| Network & Telecom – 0.8% | |
| Ericsson, Inc., “B” | | | 112,790 | | | $ | 1,310,585 | |
| | | | | | | | |
| Oil Services – 0.9% | |
| Schlumberger Ltd. | | | 18,690 | | | $ | 1,560,615 | |
| | | | | | | | |
| Other Banks & Diversified Financials – 4.3% | |
| Aeon Credit Service Co. Ltd. | | | 83,200 | | | $ | 1,176,421 | |
| Banco Santander Brasil S.A., ADR | | | 116,460 | | | | 1,583,856 | |
| China Construction Bank (a) | | | 1,229,880 | | | | 1,102,854 | |
| HDFC Bank Ltd., ADR | | | 6,720 | | | | 1,122,979 | |
| ICICI Bank Ltd. | | | 41,744 | | | | 1,069,016 | |
| Komercni Banka A.S. | | | 3,364 | | | | 796,036 | |
| United Overseas Bank Ltd. | | | 48,000 | | | | 680,718 | |
| | | | | | | | |
| | | | | | $ | 7,531,880 | |
| | | | | | | | |
| | | | | | | | |
| Issuer | | Shares/Par | | | Value ($) | |
| | | | | | | | |
| COMMON STOCKS – continued | |
| Pharmaceuticals – 5.0% | |
| Bayer AG | | | 23,276 | | | $ | 1,720,036 | |
| Roche Holding AG | | | 23,571 | | | | 3,453,719 | |
| Sanofi-Aventis | | | 33,756 | | | | 2,158,423 | |
| Santen, Inc. | | | 36,600 | | | | 1,271,240 | |
| | | | | | | | |
| | | | | | $ | 8,603,418 | |
| | | | | | | | |
| Precious Metals & Minerals – 0.8% | |
| Newcrest Mining Ltd. | | | 32,043 | | | $ | 1,325,364 | |
| | | | | | | | |
| Railroad & Shipping – 1.0% | |
| East Japan Railway Co. | | | 25,500 | | | $ | 1,658,332 | |
| | | | | | | | |
| Real Estate – 0.4% | |
| Sun Hung Kai Properties Ltd. | | | 39,000 | | | $ | 647,759 | |
| | | | | | | | |
| Specialty Chemicals – 3.7% | |
| Akzo Nobel N.V. | | | 43,586 | | | $ | 2,707,471 | |
| Chugoku Marine Paints Ltd. | | | 23,000 | | | | 195,184 | |
| Linde AG | | | 18,471 | | | | 2,802,731 | |
| Nippon Paint Co. Ltd. | | | 23,000 | | | | 176,204 | |
| Symrise AG | | | 22,607 | | | | 620,055 | |
| | | | | | | | |
| | | $ | 6,501,645 | |
| | | | | | | | |
| Specialty Stores – 1.9% | |
| Esprit Holdings Ltd. | | | 254,813 | | | $ | 1,212,958 | |
| Industria de Diseno Textil S.A. | | | 12,243 | | | | 916,669 | |
| Kingfisher PLC | | | 262,660 | | | | 1,078,657 | |
| | | | | | | | |
| | | | | | $ | 3,208,284 | |
| | | | | | | | |
| Telecommunications – Wireless – 3.2% | |
| Cellcom Israel Ltd. | | | 14,710 | | | $ | 480,870 | |
| KDDI Corp. | | | 198 | | | | 1,143,762 | |
| Vivo Participacoes S.A., ADR | | | 20,700 | | | | 674,613 | |
| Vodafone Group PLC | | | 1,248,133 | | | | 3,226,407 | |
| | | | | | | | |
| | | | | | $ | 5,525,652 | |
| | | | | | | | |
| Telephone Services – 2.3% | |
| China Unicom Ltd. | | | 616,000 | | | $ | 881,268 | |
| PT XL Axiata Tbk (a) | | | 557,500 | | | | 327,941 | |
| Royal KPN N.V. | | | 128,146 | | | | 1,869,957 | |
| Telecom Italia S.p.A. | | | 388,109 | | | | 501,515 | |
| Telecom Italia S.p.A. | | | 387,863 | | | | 420,861 | |
| | | | | | | | |
| | | | | | $ | 4,001,542 | |
| | | | | | | | |
| Tobacco – 0.7% | |
| Japan Tobacco, Inc. | | | 339 | | | $ | 1,254,705 | |
| | | | | | | | |
| Trucking – 1.1% | |
| Yamato Holdings Co. Ltd. | | | 134,300 | | | $ | 1,912,191 | |
| | | | | | | | |
| Utilities – Electric Power – 3.3% | |
| CEZ AS | | | 23,845 | | | $ | 996,190 | |
| Cheung Kong Infrastructure Holdings Ltd. | | | 101,000 | | | | 462,587 | |
| Energias de Portugal S.A. | | | 585,304 | | | | 1,948,315 | |
| Fortum Corp. | | | 31,943 | | | | 961,703 | |
| Red Electrica de Espana | | | 16,824 | | | | 791,363 | |
| Tractebel Energia S.A. | | | 37,840 | | | | 625,728 | |
| | | | | | | | |
| | | | | | $ | 5,785,886 | |
| | | | | | | | |
Total Common Stocks
(Identified Cost, $163,058,859) | | | | | | $ | 173,154,157 | |
| | | | | | | | |
9
MFS Research International Portfolio
Portfolio of Investments – continued
| | | | | | | | |
| Issuer | | Shares/Par | | | Value ($) | |
| | | | | | | | |
| MONEY MARKET FUNDS (v) – 0.0% | |
| MFS Institutional Money Market Portfolio, 0.18%, at Cost and Net Asset Value | | | 101 | | | $ | 101 | |
| | | | | | | | |
Total Investments
(Identified Cost, $163,058,960) | | | | | | $ | 173,154,258 | |
| | | | | | | | |
OTHER ASSETS, LESS
LIABILITIES – 0.3% | | | | | | | 563,615 | |
| | | | | | | | |
| Net Assets – 100.0% | | | | | | $ | 173,717,873 | |
| | | | | | | | |
| (a) | Non-income producing security. |
| (v) | Underlying fund that is available only to investment companies managed by MFS. The rate quoted is the annualized seven-day yield of the fund at period end. |
The following abbreviations are used in this report and are defined:
| ADR | | American Depository Receipt |
| PLC | | Public Limited Company |
See Notes to Financial Statements
10
MFS Research International Portfolio
FINANCIAL STATEMENTS | STATEMENT OF ASSETS AND LIABILITIES
This statement represents your fund’s balance sheet, which details the assets and liabilities comprising the total value of the fund.
| | | | | | | | |
At 12/31/10 | | | | | | | | |
Assets | | | | | | | | |
Investments – | | | | | | | | |
Non-affiliated issuers, at value (identified cost, $163,058,859) | | | $173,154,157 | | | | | |
Underlying funds, at cost and value | | | 101 | | | | | |
Total investments, at value (identified cost, $163,058,960) | | | $173,154,258 | | | | | |
Foreign currency, at value (identified cost, $165,084) | | | 172,727 | | | | | |
Receivables for | | | | | | | | |
Investments sold | | | 953,665 | | | | | |
Fund shares sold | | | 69 | | | | | |
Interest and dividends | | | 359,030 | | | | | |
Other assets | | | 7,682 | | | | | |
Total assets | | | | | | | $174,647,431 | |
Liabilities | | | | | | | | |
Payable to custodian | | | $86,103 | | | | | |
Payables for | | | | | | | | |
Investments purchased | | | 329,282 | | | | | |
Fund shares reacquired | | | 339,979 | | | | | |
Payable to affiliates | | | | | | | | |
Investment adviser | | | 58,465 | | | | | |
Shareholder servicing costs | | | 91 | | | | | |
Distribution and/or service fees | | | 1,665 | | | | | |
Administrative services fee | | | 346 | | | | | |
Payable for Trustees’ compensation | | | 215 | | | | | |
Accrued expenses and other liabilities | | | 113,412 | | | | | |
Total liabilities | | | | | | | $929,558 | |
Net assets | | | | | | | $173,717,873 | |
Net assets consist of | | | | | | | | |
Paid-in capital | | | $189,912,334 | | | | | |
Unrealized appreciation (depreciation) on investments and translation of assets and liabilities in foreign currencies | | | 10,121,882 | | | | | |
Accumulated net realized gain (loss) on investments and foreign currency transactions | | | (29,189,758 | ) | | | | |
Undistributed net investment income | | | 2,873,415 | | | | | |
Net assets | | | | | | | $173,717,873 | |
Shares of beneficial interest outstanding | | | | | | | 12,799,950 | |
| | | | | | | | | | | | |
| | | Net assets | | | Shares
outstanding | | | Net asset value
per share | |
Initial Class | | | $52,239,132 | | | | 3,816,948 | | | | $13.69 | |
Service Class | | | 121,478,741 | | | | 8,983,002 | | | | 13.52 | |
See Notes to Financial Statements
11
MFS Research International Portfolio
FINANCIAL STATEMENTS | STATEMENT OF OPERATIONS
This statement describes how much your fund earned in investment income and accrued in expenses. It also describes any gains and/or losses generated by fund operations.
| | | | | | | | |
Year ended 12/31/10 | | | | | | | | |
Net investment income | | | | | | | | |
Income | | | | | | | | |
Dividends | | | $6,478,165 | | | | | |
Interest | | | 109,436 | | | | | |
Dividends from underlying funds | | | 3,285 | | | | | |
Foreign taxes withheld | | | (612,280 | ) | | | | |
Total investment income | | | | | | | $5,978,606 | |
Expenses | | | | | | | | |
Management fee | | | $1,984,507 | | | | | |
Distribution and/or service fees | | | 299,035 | | | | | |
Shareholder servicing costs | | | 25,601 | | | | | |
Administrative services fee | | | 79,051 | | | | | |
Trustees’ compensation | | | 29,216 | | | | | |
Custodian fee | | | 234,201 | | | | | |
Shareholder communications | | | 27,970 | | | | | |
Auditing fees | | | 50,721 | | | | | |
Legal fees | | | 7,195 | | | | | |
Miscellaneous | | | 35,333 | | | | | |
Total expenses | | | | | | | $2,772,830 | |
Fees paid indirectly | | | (9 | ) | | | | |
Reduction of expenses by investment adviser | | | (38,608 | ) | | | | |
Net expenses | | | | | | | $2,734,213 | |
Net investment income | | | | | | | $3,244,393 | |
Realized and unrealized gain (loss) on investments and foreign currency transactions | | | | | | | | |
Realized gain (loss) (identified cost basis) | | | | | | | | |
Investment transactions | | | $19,232,077 | | | | | |
Foreign currency transactions | | | (366,054 | ) | | | | |
Net realized gain (loss) on investments and foreign currency transactions | | | | | | | $18,866,023 | |
Change in unrealized appreciation (depreciation) | | | | | | | | |
Investments (net of $25,034 decrease in deferred country tax) | | | $2,208,691 | | | | | |
Translation of assets and liabilities in foreign currencies | | | 25,260 | | | | | |
Net unrealized gain (loss) on investments and foreign currency translation | | | | | | | $2,233,951 | |
Net realized and unrealized gain (loss) on investments and foreign currency | | | | | | | $21,099,974 | |
Change in net assets from operations | | | | | | | $24,344,367 | |
See Notes to Financial Statements
12
MFS Research International Portfolio
FINANCIAL STATEMENTS | STATEMENTS OF CHANGES IN NET ASSETS
These statements describe the increases and/or decreases in net assets resulting from operations, any distributions, and any shareholder transactions.
| | | | | | | | |
For years ended 12/31 | | | 2010 | | | | 2009 | |
Change in net assets | | | | | | | | |
From operations | | | | | | | | |
Net investment income | | | $3,244,393 | | | | $2,761,938 | |
Net realized gain (loss) on investments and foreign currency transactions | | | 18,866,023 | | | | (6,609,521 | ) |
Net unrealized gain (loss) on investments and foreign currency translation | | | 2,233,951 | | | | 49,816,690 | |
Change in net assets from operations | | | $24,344,367 | | | | $45,969,107 | |
Distributions declared to shareholders | | | | | | | | |
From net investment income | | | $(2,780,628 | ) | | | $(4,916,469 | ) |
Change in net assets from fund share transactions | | | $(67,615,217 | ) | | | $18,915,236 | |
Total change in net assets | | | $(46,051,478 | ) | | | $59,967,874 | |
Net assets | | | | | | | | |
At beginning of period | | | 219,769,351 | | | | 159,801,477 | |
At end of period (including undistributed net investment income of $2,873,415 and
$2,775,704, respectively) | | | $173,717,873 | | | | $219,769,351 | |
See Notes to Financial Statements
13
MFS Research International Portfolio
FINANCIAL STATEMENTS | FINANCIAL HIGHLIGHTS
The financial highlights table is intended to help you understand the fund’s financial performance for the past 5 years. Certain information reflects financial results for a single fund share. The total returns in the table represent the rate by which an investor would have earned (or lost) on an investment in the fund share class (assuming reinvestment of all distributions) held for the entire period.
| | | | | | | | | | | | | | | | | | | | |
| Initial Class | | Years ended 12/31 | |
| | | 2010 | | | 2009 | | | 2008 | | | 2007 | | | 2006 | |
Net asset value, beginning of period | | | $12.54 | | | | $9.94 | | | | $19.92 | | | | $19.94 | | | | $16.74 | |
| Income (loss) from investment operations | | | | | | | | | | | | | | | | | | | | |
Net investment income (d) | | | $0.20 | | | | $0.17 | | | | $0.37 | | | | $0.30 | | | | $0.22 | |
Net realized and unrealized gain (loss) on investments
and foreign currency | | | 1.12 | | | | 2.77 | | | | (7.71 | ) | | | 2.21 | | | | 4.30 | |
Total from investment operations | | | $1.32 | | | | $2.94 | | | | $(7.34 | ) | | | $2.51 | | | | $4.52 | |
| Less distributions declared to shareholders | | | | | | | | | | | | | | | | | | | | |
From net investment income | | | $(0.17 | ) | | | $(0.34 | ) | | | $(0.29 | ) | | | $(0.23 | ) | | | $(0.21 | ) |
From net realized gain on investments | | | — | | | | — | | | | (2.35 | ) | | | (2.30 | ) | | | (1.11 | ) |
Total distributions declared to shareholders | | | $(0.17 | ) | | | $(0.34 | ) | | | $(2.64 | ) | | | $(2.53 | ) | | | $(1.32 | ) |
Net asset value, end of period | | | $13.69 | | | | $12.54 | | | | $9.94 | | | | $19.92 | | | | $19.94 | |
Total return (%) (k)(r)(s) | | | 10.63 | | | | 30.94 | | | | (42.49 | ) | | | 13.15 | | | | 27.47 | |
Ratios (%) (to average net assets) and Supplemental data: | | | | | | | | | | | | | | | | | | | | |
Expenses before expense reductions (f) | | | 1.12 | | | | 1.18 | | | | 1.17 | | | | 1.06 | | | | 1.13 | |
Expenses after expense reductions (f) | | | 1.10 | | | | 1.10 | | | | 1.11 | | | | 1.06 | | | | 1.13 | |
Net investment income | | | 1.66 | | | | 1.62 | | | | 2.43 | | | | 1.51 | | | | 1.23 | |
Portfolio turnover | | | 60 | | | | 75 | | | | 82 | | | | 68 | | | | 80 | |
Net assets at end of period (000 omitted) | | | $52,239 | | | | $93,714 | | | | $45,835 | | | | $108,167 | | | | $119,534 | |
See Notes to Financial Statements
14
MFS Research International Portfolio
Financial Highlights – continued
| | | | | | | | | | | | | | | | | | | | |
| Service Class | | Years ended 12/31 | |
| | | 2010 | | | 2009 | | | 2008 | | | 2007 | | | 2006 | |
Net asset value, beginning of period | | | $12.39 | | | | $9.82 | | | | $19.70 | | | | $19.77 | | | | $16.61 | |
| Income (loss) from investment operations | | | | | | | | | | | | | | | | | | | | |
Net investment income (d) | | | $0.16 | | | | $0.17 | | | | $0.32 | | | | $0.23 | | | | $0.16 | |
Net realized and unrealized gain (loss) on investments
and foreign currency | | | 1.11 | | | | 2.70 | | | | (7.61 | ) | | | 2.20 | | | | 4.29 | |
Total from investment operations | | | $1.27 | | | | $2.87 | | | | $(7.29 | ) | | | $2.43 | | | | $4.45 | |
| Less distributions declared to shareholders | | | | | | | | | | | | | | | | | | | | |
From net investment income | | | $(0.14 | ) | | | $(0.30 | ) | | | $(0.24 | ) | | | $(0.20 | ) | | | $(0.18 | ) |
From net realized gain on investments | | | — | | | | — | | | | (2.35 | ) | | | (2.30 | ) | | | (1.11 | ) |
Total distributions declared to shareholders | | | $(0.14 | ) | | | $(0.30 | ) | | | $(2.59 | ) | | | $(2.50 | ) | | | $(1.29 | ) |
Net asset value, end of period | | | $13.52 | | | | $12.39 | | | | $9.82 | | | | $19.70 | | | | $19.77 | |
Total return (%) (k)(r)(s) | | | 10.34 | | | | 30.50 | | | | (42.60 | ) | | | 12.81 | | | | 27.25 | |
Ratios (%) (to average net assets) and Supplemental data: | | | | | | | | | | | | | | | | | | | | |
Expenses before expense reductions (f) | | | 1.37 | | | | 1.43 | | | | 1.42 | | | | 1.31 | | | | 1.38 | |
Expenses after expense reductions (f) | | | 1.35 | | | | 1.35 | | | | 1.36 | | | | 1.31 | | | | 1.38 | |
Net investment income | | | 1.31 | | | | 1.64 | | | | 2.17 | | | | 1.19 | | | | 0.89 | |
Portfolio turnover | | | 60 | | | | 75 | | | | 82 | | | | 68 | | | | 80 | |
Net assets at end of period (000 omitted) | | | $121,479 | | | | $126,055 | | | | $113,966 | | | | $202,567 | | | | $155,969 | |
| (d) | Per share data is based on average shares outstanding. |
| (f) | Ratios do not reflect reductions from fees paid indirectly, if applicable. |
| (k) | The total return does not reflect expenses that apply to separate accounts. Inclusion of these charges would reduce the total return figures for all periods shown. |
| (r) | Certain expenses have been reduced without which performance would have been lower. |
| (s) | From time to time the fund may receive proceeds from litigation settlements, without which performance would be lower. |
See Notes to Financial Statements
15
MFS Research International Portfolio
NOTES TO FINANCIAL STATEMENTS
| (1) | | Business and Organization |
MFS Research International Portfolio (the fund) is a series of MFS Variable Insurance Trust II (the trust). The trust is organized as a Massachusetts business trust and is registered under the Investment Company Act of 1940, as amended, as an open-end management investment company. The shareholders of each series of the trust are separate accounts of insurance companies, which offer variable annuity and/or life insurance products, and qualified retirement and pension plans.
| (2) | | Significant Accounting Policies |
General – The preparation of financial statements in conformity with U.S. generally accepted accounting principles requires management to make estimates and assumptions that affect the reported amounts of assets and liabilities, and disclosure of contingent assets and liabilities at the date of the financial statements and the reported amounts of revenues and expenses during the reporting period. Actual results could differ from those estimates. In the preparation of these financial statements, management has evaluated subsequent events occurring after the date of the fund’s Statement of Assets and Liabilities through the date that the financial statements were issued. The fund invests in foreign securities, including securities of emerging market issuers. Investments in foreign securities are vulnerable to the effects of changes in the relative values of the local currency and the U.S. dollar and to the effects of changes in each country’s legal, political, and economic environment. The markets of emerging markets countries are generally more volatile than the markets of developed countries with more mature economies. All of the risks of investing in foreign securities previously described are heightened when investing in emerging markets countries.
Investment Valuations – Equity securities, including restricted equity securities, are generally valued at the last sale or official closing price as provided by a third-party pricing service on the market or exchange on which they are primarily traded. Equity securities, for which there were no sales reported that day, are generally valued at the last quoted daily bid quotation as provided by a third-party pricing service on the market or exchange on which such securities are primarily traded. Equity securities held short, for which there were no sales reported for that day, are generally valued at the last quoted daily ask quotation as provided by a third-party pricing service on the market or exchange on which such securities are primarily traded. Short-term instruments with a maturity at issuance of 60 days or less generally are valued at amortized cost, which approximates market value. Open-end investment companies are generally valued at net asset value per share. Securities and other assets generally valued on the basis of information from a third-party pricing service may also be valued at a broker/dealer bid quotation. Values obtained from third-party pricing services can utilize both transaction data and market information such as yield, quality, coupon rate, maturity, type of issue, trading characteristics, and other market data. The values of foreign securities and other assets and liabilities expressed in foreign currencies are converted to U.S. dollars using the mean of bid and asked prices for rates provided by a third-party pricing service.
The Board of Trustees has delegated primary responsibility for determining or causing to be determined the value of the fund’s investments (including any fair valuation) to the adviser pursuant to valuation policies and procedures approved by the Board. If the adviser determines that reliable market quotations are not readily available, investments are valued at fair value as determined in good faith by the adviser in accordance with such procedures under the oversight of the Board of Trustees. Under the fund’s valuation policies and procedures, market quotations are not considered to be readily available for most types of debt instruments and floating rate loans and many types of derivatives. These investments are generally valued at fair value based on information from third-party pricing services. In addition, investments may be valued at fair value if the adviser determines that an investment’s value has been materially effected by events occurring after the close of the exchange or market on which the investment is principally traded (such as foreign exchange or market) and prior to the determination of the fund’s net asset value, or after the halting of trading of a specific security where trading does not resume prior to the close of the exchange or market on which the security is principally traded. Events that occur on a frequent basis after foreign markets close (such as developments in foreign markets and significant movements in the U.S. markets) and prior to the determination of the fund’s net asset value may be deemed to have a material effect on the value of securities traded in foreign markets. Accordingly, the fund’s foreign equity securities may often be valued at fair value. The adviser generally relies on third-party pricing services or other information (such as the correlation with price movements of similar securities in the same or other markets; the type, cost and investment characteristics of the security; the business and financial condition of the issuer; and trading and other market data) to assist in determining whether to fair value and at what value to fair value an investment. The value of an investment for purposes of calculating the fund’s net asset value can differ depending on the source and method used to determine value. When fair valuation is used, the value of an investment used to determine the fund’s net asset value may differ from quoted or published prices for the same investment. There can be no assurance that the fund could obtain the fair value assigned to an investment if it were to sell the investment at the same time at which the fund determines its net asset value per share.
16
MFS Research International Portfolio
Notes to Financial Statements – continued
Various inputs are used in determining the value of the fund’s assets or liabilities. These inputs are categorized into three broad levels. In certain cases, the inputs used to measure fair value may fall into different levels of the fair value hierarchy. In such cases, an investment’s level within the fair value hierarchy is based on the lowest level of input that is significant to the fair value measurement. The fund’s assessment of the significance of a particular input to the fair value measurement in its entirety requires judgment, and considers factors specific to the investment. Level 1 includes unadjusted quoted prices in active markets for identical assets or liabilities. Level 2 includes other significant observable market-based inputs (including quoted prices for similar securities, interest rates, prepayment speed, and credit risk). Level 3 includes unobservable inputs, which may include the adviser’s own assumptions in determining the fair value of investments. The following is a summary of the levels used as of December 31, 2010 in valuing the fund’s assets or liabilities:
| | | | | | | | | | | | | | | | |
| Investments at Value | | Level 1 | | | Level 2 | | | Level 3 | | | Total | |
| Equity Securities: | | | | | | | | | | | | | | | | |
Japan | | | $28,123,339 | | | | $2,518,582 | | | | $— | | | | $30,641,921 | |
United Kingdom | | | 30,146,207 | | | | — | | | | — | | | | 30,146,207 | |
Switzerland | | | 16,931,757 | | | | — | | | | — | | | | 16,931,757 | |
France | | | 16,847,553 | | | | — | | | | — | | | | 16,847,553 | |
Germany | | | 16,360,231 | | | | — | | | | — | | | | 16,360,231 | |
Netherlands | | | 9,449,160 | | | | — | | | | — | | | | 9,449,160 | |
Hong Kong | | | 7,083,157 | | | | — | | | | — | | | | 7,083,157 | |
Australia | | | 5,921,518 | | | | — | | | | — | | | | 5,921,518 | |
China | | | 5,465,123 | | | | — | | | | — | | | | 5,465,123 | |
Other Countries | | | 34,307,530 | | | | — | | | | — | | | | 34,307,530 | |
| Mutual Funds | | | 101 | | | | — | | | | — | | | | 101 | |
| Total Investments | | | $170,635,676 | | | | $2,518,582 | | | | $— | | | | $173,154,258 | |
For further information regarding security characteristics, see the Portfolio of Investments.
Of the level 1 investments presented above, equity investments amounting to $88,649,295 were considered level 2 investments at the beginning of the period. The primary reason for changes in the classifications between levels 1 and 2 occurs when foreign equity securities are fair valued using other observable market-based inputs in place of the closing exchange price due to events occurring after the close of the exchange or market on which the investment is principally traded. The fund’s foreign equity securities may often be valued at fair value.
Foreign Currency Translation – Purchases and sales of foreign investments, income, and expenses are converted into U.S. dollars based upon currency exchange rates prevailing on the respective dates of such transactions or on the reporting date for foreign denominated receivables and payables. Gains and losses attributable to foreign currency exchange rates on sales of securities are recorded for financial statement purposes as net realized gains and losses on investments. Gains and losses attributable to foreign exchange rate movements on receivables, payables, income and expenses are recorded for financial statement purposes as foreign currency transaction gains and losses. That portion of both realized and unrealized gains and losses on investments that results from fluctuations in foreign currency exchange rates is not separately disclosed.
Security Loans – State Street Bank and Trust Company (“State Street”), as lending agent, loans the securities of the fund to certain qualified institutions (the “Borrowers”) approved by the fund. The loans are collateralized by cash and/or U.S. Treasury and federal agency obligations in an amount typically at least equal to the market value of the securities loaned. The market value of the loaned securities is determined at the close of business of the fund and any additional required collateral is delivered to the fund on the next business day. State Street provides the fund with indemnification against Borrower default. The fund bears the risk of loss with respect to the investment of cash collateral. On loans collateralized by cash, the cash collateral is invested in a money market fund or short-term securities. A portion of the income generated upon investment of the collateral is remitted to the Borrowers, and the remainder is allocated between the fund and the lending agent. On loans collateralized by U.S. Treasury and/or federal agency obligations, a fee is received from the Borrower, and is allocated between the fund and the lending agent. Income from securities lending is included in interest income, on the Statement of Operations. The dividend and interest income earned on the securities loaned is accounted for in the same manner as other dividend and interest income.
17
MFS Research International Portfolio
Notes to Financial Statements – continued
Indemnifications – Under the fund’s organizational documents, its officers and Trustees may be indemnified against certain liabilities and expenses arising out of the performance of their duties to the fund. Additionally, in the normal course of business, the fund enters into agreements with service providers that may contain indemnification clauses. The fund’s maximum exposure under these agreements is unknown as this would involve future claims that may be made against the fund that have not yet occurred.
Investment Transactions and Income – Investment transactions are recorded on the trade date. Interest income is recorded on the accrual basis. Dividends received in cash are recorded on the ex-dividend date. Certain dividends from foreign securities will be recorded when the fund is informed of the dividend if such information is obtained subsequent to the ex-dividend date. Dividend and interest payments received in additional securities are recorded on the ex-dividend or ex-interest date in an amount equal to the value of the security on such date.
The fund may receive proceeds from litigation settlements. Any proceeds received from litigation involving portfolio holdings are reflected in the Statement of Operations in realized gain/loss if the security has been disposed of by the fund or in unrealized gain/loss if the security is still held by the fund. Any other proceeds from litigation not related to portfolio holdings are reflected as other income in the Statement of Operations.
Fees Paid Indirectly – The fund’s custody fee may be reduced according to an arrangement that measures the value of cash deposited with the custodian by the fund. This amount, for the year ended December 31, 2010, is shown as a reduction of total expenses on the Statement of Operations.
Tax Matters and Distributions – The fund intends to qualify as a regulated investment company, as defined under Subchapter M of the Internal Revenue Code, and to distribute all of its taxable income, including realized capital gains. As a result, no provision for federal income tax is required. The fund’s federal tax returns for the prior three fiscal years remain subject to examination by the Internal Revenue Service. Foreign taxes, if any, have been accrued by the fund in the accompanying financial statements.
Distributions to shareholders are recorded on the ex-dividend date. Income and capital gain distributions are determined in accordance with income tax regulations, which may differ from U.S. generally accepted accounting principles. Certain capital accounts in the financial statements are periodically adjusted for permanent differences in order to reflect their tax character. These adjustments have no impact on net assets or net asset value per share. Temporary differences which arise from recognizing certain items of income, expense, gain or loss in different periods for financial statement and tax purposes will reverse at some time in the future. Distributions in excess of net investment income or net realized gains are temporary overdistributions for financial statement purposes resulting from differences in the recognition or classification of income or distributions for financial statement and tax purposes.
Book/tax differences primarily relate to wash sale loss deferrals.
The tax character of distributions declared to shareholders for the last two fiscal years is as follows:
| | | | | | | | |
| | | 12/31/10 | | | 12/31/09 | |
| Ordinary income (including any short-term capital gains) | | | $2,780,628 | | | | $4,916,469 | |
The federal tax cost and the tax basis components of distributable earnings were as follows:
| | | | |
| As of 12/31/10 | | | | |
| Cost of investments | | | $164,203,921 | |
| Gross appreciation | | | 19,944,630 | |
| Gross depreciation | | | (10,994,293 | ) |
| Net unrealized appreciation (depreciation) | | | $8,950,337 | |
| Undistributed ordinary income | | | 2,877,865 | |
| Capital loss carryforwards | | | (28,044,797 | ) |
| Other temporary differences | | | 22,134 | |
As of December 31, 2010, the fund had capital loss carryforwards available to offset future realized gains. Such losses expire as follows:
| | | | |
| 12/31/16 | | | $(16,000,345 | ) |
| 12/31/17 | | | (12,044,452 | ) |
| Total | | | $(28,044,797 | ) |
Multiple Classes of Shares of Beneficial Interest – The fund offers multiple classes of shares, which differ in their respective distribution and/or service fees. The fund’s income, realized and unrealized gain (loss), and common expenses are allocated to shareholders based on the daily net assets of each class. Dividends are declared separately for each class. Differences in per
18
MFS Research International Portfolio
Notes to Financial Statements – continued
share dividend rates are generally due to differences in separate class expenses. The fund’s distributions declared to shareholders as reported on the Statements of Changes in Net Assets are presented by class as follows:
| | | | | | | | |
| | | From net investment
income | |
| | | Year ended
12/31/10 | | | Year ended
12/31/09 | |
| Initial Class | | | $1,407,840 | | | | $1,443,330 | |
| Service Class | | | 1,372,788 | | | | 3,473,139 | |
| Total | | | $2,780,628 | | | | $4,916,469 | |
| (3) | | Transactions with Affiliates |
Investment Adviser – The fund has an investment advisory agreement with MFS to provide overall investment management and related administrative services and facilities to the fund. The management fee is computed daily and paid monthly at the following annual rates:
| | | | |
| First $1 billion of average daily net assets | | | 0.90% | |
| Next $1 billion of average daily net assets | | | 0.80% | |
| Average daily net assets in excess of $2 billion | | | 0.70% | |
The management fee incurred for the year ended December 31, 2010 was equivalent to an annual effective rate of 0.90% of the fund’s average daily net assets.
The investment adviser has agreed in writing to pay a portion of the fund’s total annual operating expenses, exclusive of interest, taxes, extraordinary expenses, brokerage and transaction costs and investment-related expenses, such that total annual operating expenses do not exceed 1.10% of average daily net assets for the Initial Class shares and 1.35% of average daily net assets for the Service Class shares. This written agreement will continue until April 30, 2012. For the year ended December 31, 2010, this reduction amounted to $38,608 and is reflected as a reduction of total expenses in the Statement of Operations.
Distributor – MFS Fund Distributors, Inc. (MFD), a wholly-owned subsidiary of MFS, is the distributor of shares of the fund. The Trustees have adopted a distribution plan for the Service Class shares pursuant to Rule 12b-1 under the Investment Company Act of 1940.
The fund’s distribution plan provides that the fund will pay MFD distribution and/or service fees equal to 0.25% per annum of its average daily net assets attributable to Service Class shares as partial consideration for services performed and expenses incurred by MFD and financial intermediaries (including participating insurance companies that invest in the fund to fund variable annuity and variable life insurance contracts, sponsors of qualified retirement and pension plans that invest in the fund, and affiliates of these participating insurance companies and plan sponsors) in connection with the sale and distribution of the Service Class shares. MFD may subsequently pay all, or a portion, of the distribution and/or service fees to financial intermediaries.
Shareholder Servicing Agent – MFS Service Center, Inc. (MFSC), a wholly-owned subsidiary of MFS, receives a fee from the fund for its services as shareholder servicing agent. For the year ended December 31, 2010, the fee was $25,577, which equated to 0.0116% annually of the fund’s average daily net assets. MFSC also receives payment from the fund for out-of-pocket expenses paid by MFSC on behalf of the fund. For the year ended December 31, 2010, these costs amounted to $24.
Administrator – MFS provides certain financial, legal, shareholder communications, compliance, and other administrative services to the fund. Under an administrative services agreement, the fund partially reimburses MFS the costs incurred to provide these services. The fund is charged an annual fixed amount of $10,000 plus a fee based on average daily net assets. The administrative services fee incurred for the year ended December 31, 2010 was equivalent to an annual effective rate of 0.0358% of the fund’s average daily net assets.
Trustees’ and Officers’ Compensation – The fund pays compensation to Trustees in the form of a retainer, attendance fees, and additional compensation to the Board chairperson. The fund does not pay compensation directly to officers of the fund who are also officers of the investment adviser, all of whom receive remuneration for their services to the fund from MFS. Certain officers of the fund are officers or directors of MFS, MFD, and MFSC.
Other – This fund and certain other funds managed by MFS (the funds) have entered into services agreements (the Agreements) which provide for payment of fees by the funds to Tarantino LLC and Griffin Compliance LLC in return for the provision of services of an Independent Chief Compliance Officer (ICCO) and Assistant ICCO, respectively, for the funds. The ICCO and Assistant ICCO are officers of the funds and the sole members of Tarantino LLC and Griffin Compliance LLC, respectively. The funds can terminate the Agreements with Tarantino LLC and Griffin Compliance LLC at any time under the
19
MFS Research International Portfolio
Notes to Financial Statements – continued
terms of the Agreements. MFS has agreed to bear all expenses associated with office space, other administrative support, and supplies provided to the ICCO and Assistant ICCO. For the year ended December 31, 2010, the aggregate fees paid by the fund to Tarantino LLC and Griffin Compliance LLC were $3,865 and are included in miscellaneous expense on the Statement of Operations.
The fund invests in the MFS Institutional Money Market Portfolio which is managed by MFS and seeks a high level of current income consistent with preservation of capital and liquidity. Income earned on this investment is included in dividends from underlying funds on the Statement of Operations. This money market fund does not pay a management fee to MFS.
Purchases and sales of investments, other than U.S. Government securities, purchased option transactions, and short-term obligations, aggregated $129,436,708 and $195,645,380, respectively.
| (5) | | Shares of Beneficial Interest |
The fund’s Declaration of Trust permits the Trustees to issue an unlimited number of full and fractional shares of beneficial interest. Transactions in fund shares were as follows:
| | | | | | | | | | | | | | | | |
| | | Year ended 12/31/10 | | | Year ended 12/31/09 | |
| | | Shares | | | Amount | | | Shares | | | Amount | |
| Shares sold | | | | | | | | | | | | | | | | |
Initial Class | | | 2,749,140 | | | | $32,862,902 | | | | 3,780,901 | | | | $45,788,727 | |
Service Class | | | 941,744 | | | | 10,940,634 | | | | 920,047 | | | | 7,839,938 | |
| | | 3,690,884 | | | | $43,803,536 | | | | 4,700,948 | | | | $53,628,665 | |
| Shares issued to shareholders in reinvestment of distributions | | | | | | | | | | | | | | | | |
Initial Class | | | 113,261 | | | | $1,407,840 | | | | 162,904 | | | | $1,443,330 | |
Service Class | | | 111,518 | | | | 1,372,788 | | | | 396,025 | | | | 3,473,139 | |
| | | 224,779 | | | | $2,780,628 | | | | 558,929 | | | | $4,916,469 | |
| Shares reacquired | | | | | | | | | | | | | | | | |
Initial Class | | | (6,520,132 | ) | | | $(86,865,256 | ) | | | (1,079,610 | ) | | | $(11,330,133 | ) |
Service Class | | | (2,242,265 | ) | | | (27,334,125 | ) | | | (2,751,913 | ) | | | (28,299,765 | ) |
| | | (8,762,397 | ) | | | $(114,199,381 | ) | | | (3,831,523 | ) | | | $(39,629,898 | ) |
| Net change | | | | | | | | | | | | | | | | |
Initial Class | | | (3,657,731 | ) | | | $(52,594,514 | ) | | | 2,864,195 | | | | $35,901,924 | |
Service Class | | | (1,189,003 | ) | | | (15,020,703 | ) | | | (1,435,841 | ) | | | (16,986,688 | ) |
| | | (4,846,734 | ) | | | $(67,615,217 | ) | | | 1,428,354 | | | | $18,915,236 | |
The fund and certain other funds managed by MFS participate in a $1.1 billion unsecured committed line of credit, subject to a $1 billion sublimit, provided by a syndication of banks under a credit agreement. Borrowings may be made for temporary financing needs. Interest is charged to each fund, based on its borrowings, generally at a rate equal to the higher of the Federal Reserve funds rate or one month LIBOR plus an agreed upon spread. A commitment fee, based on the average daily, unused portion of the committed line of credit, is allocated among the participating funds at the end of each calendar quarter. In addition, the fund and other funds managed by MFS have established unsecured uncommitted borrowing arrangements with certain banks for temporary financing needs. Interest is charged to each fund, based on its borrowings, at a rate equal to the Federal Reserve funds rate plus an agreed upon spread. For the year ended December 31, 2010, the fund’s commitment fee and interest expense were $2,540 and $6,504, respectively, and are included in miscellaneous expense on the Statement of Operations.
| (7) | | Transactions in Underlying Funds – Affiliated Issuers |
An affiliated issuer may be considered one in which the fund owns 5% or more of the outstanding voting securities, or a company which is under common control. For the purposes of this report, the fund assumes the following to be affiliated issuers:
| | | | | | | | | | | | | | |
| Underlying Funds | | Beginning
Shares/Par
Amount | | Acquisitions
Shares/Par
Amount | | | Dispositions
Shares/Par
Amount | | | Ending
Shares/Par
Amount | |
| MFS Institutional Money Market Portfolio | | 3,132,603 | | | 52,878,697 | | | | (56,011,199 | ) | | | 101 | |
| | | | |
| Underlying Funds | | Realized
Gain (Loss) | | Capital Gain
Distributions | | | Dividend
Income | | | Ending
Value | |
| MFS Institutional Money Market Portfolio | | $— | | | $— | | | | $3,285 | | | | $101 | |
20
MFS Research International Portfolio
REPORT OF INDEPENDENT REGISTERED PUBLIC ACCOUNTING FIRM
To the Board of Trustees of MFS Variable Insurance Trust II and the Shareholders of
MFS Research International Portfolio:
We have audited the accompanying statement of assets and liabilities, including the portfolio of investments, of MFS Research International Portfolio (the “Fund”) (one of the portfolios comprising MFS Variable Insurance Trust II) as of December 31, 2010, and the related statement of operations for the year then ended, the statements of changes in net assets for each of the two years in the period then ended, and the financial highlights for each of the five years in the period then ended. These financial statements and financial highlights are the responsibility of the Fund’s management. Our responsibility is to express an opinion on these financial statements and financial highlights based on our audits.
We conducted our audits in accordance with the standards of the Public Company Accounting Oversight Board (United States). Those standards require that we plan and perform the audit to obtain reasonable assurance about whether the financial statements and financial highlights are free of material misstatement. The Fund is not required to have, nor were we engaged to perform, an audit of its internal control over financial reporting. Our audits included consideration of internal control over financial reporting as a basis for designing audit procedures that are appropriate in the circumstances, but not for the purpose of expressing an opinion on the effectiveness of the Fund’s internal control over financial reporting. Accordingly, we express no such opinion. An audit also includes examining, on a test basis, evidence supporting the amounts and disclosures in the financial statements, assessing the accounting principles used and significant estimates made by management, as well as evaluating the overall financial statement presentation. Our procedures included confirmation of securities owned as of December 31, 2010, by correspondence with the custodian and brokers; where replies were not received from brokers, we performed other auditing procedures. We believe that our audits provide a reasonable basis for our opinion.
In our opinion, the financial statements and financial highlights referred to above present fairly, in all material respects, the financial position of MFS Research International Portfolio as of December 31, 2010, the results of its operations for the year then ended, the changes in its net assets for each of the two years in the period then ended, and the financial highlights for each of the five years in the period then ended, in conformity with accounting principles generally accepted in the United States of America.
DELOITTE & TOUCHE LLP
Boston, Massachusetts
February 14, 2011
21
MFS Research International Portfolio
TRUSTEES AND OFFICERS – IDENTIFICATION AND BACKGROUND
The Trustees and officers of the Trust, as of February 1, 2011, are listed below, together with their principal occupations during the past five years. (Their titles may have varied during that period.) The address of each Trustee and officer is 500 Boylston Street, Boston, Massachusetts 02116.
| | | | | | |
Name, Date of Birth | | Position(s) Held
with Fund | | Trustee/Officer
Since (1) | | Principal Occupations During the Past Five Years and
Other Directorships (2) |
| INTERESTED TRUSTEE | | | | |
David D. Horn (3) (born 6/07/41) | | Trustee | | April 1986 | | Private investor; Sun Life Assurance Company of Canada, Senior Vice President and General Manager for the United States (until 1997); Director (until March 2004) |
| | |
| INDEPENDENT TRUSTEES | | | | |
J. Kermit Birchfield (born 1/08/40) | | Chairman | | May 1997 | | Consultant; Century Partners, Inc. (investments), Director; Displaytech, Inc. (technology), Chairman; Dessin Fournir LLC (furniture manufacturer), Director; Site Watch LLC (software to monitor oil tanks), Managing Director (2006 to present); Juridica Investments (fund investing in judicial matters), Director (2007 to present), Immuno Science, Inc. (medical research), Independent Director (2009 to present), Intermountain Industries, Inc. (oil & gas exploration and production), Director (until February 2009) |
| | | |
Robert C. Bishop (born 1/13/43) | | Trustee | | May 2001 | | AutoImmune, Inc. (pharmaceutical product development), Chairman, President and Chief Executive Officer; Caliper Life Sciences Corp. (laboratory analytical instruments), Chairman; Optobionics Corporation (ophthalmic devices), Director (until 2007); Millipore Corporation (purification/filtration products), Director (until July 2010); Waterstreet Capital (leverage buyouts), Advisory Board (until August 2010) |
| | | |
Frederick H. Dulles (born 3/12/42) | | Trustee | | May 2001 | | Dulles International Law LLC (law firm), Senior Lawyer (since 2009); Juridica Capital Management (US) Inc. (litigation financing), Vice President and General Counsel (since 2009); Dulles Properties LLC (real estate), Broker (since 2008); The Citadel School of Business Administration (education), Adjunct Professor (since 2003); Disher, Hamrick & Myers Residential, Inc. (real estate), Broker (until 2006); Frederick H. Dulles Law Practice (law firm), (until 2006); Charlestown School of Law (education), Adjunct Professor (until 2007); Prudential Carolina Real Estate, (real estate), Broker (until 2008); Free Enterprise Foundation Inc. (research institute), Director & Secretary (until 2008); Ten State International Law PLLP (law firm), Of Counsel (until 2009) |
| | | |
Marcia A. Kean (born 6/30/48) | | Trustee | | April 2005 | | Feinstein Kean Healthcare (consulting), Chief Executive Officer |
| | | |
Ronald G. Steinhart (born 6/15/40) | | Trustee | | May 2001 | | Private investor; Penske Automotive Group (automotive retailer), Director; Animal Health International, Inc. (animal health products), Director (since 2007); Texas Industries (concrete/aggregates/cement), Director (since 2007); Susser Holdings Corporation (retail convenience stores and distributor of wholesale motor fuel), Director (since 2009); Prentiss Properties Trust (real estate investment trust), Director (until 2006); Penson Worldwide, Inc. (securities clearance), Director (until 2008) |
| | | |
Haviland Wright (born 7/21/48) | | Trustee | | May 2001 | | X-Change Corp. (multi-media web services), Director (since 2010); Nano Loa Inc. (liquid crystal displays), Director (until 2009); Profitability of Hawaii (software), Chief Development Officer (until 2010); Elixir Technologies Corporation (software), Director (until 2010) |
| | | |
| OFFICERS | | | | | | |
Maria F. DiOrioDwyer (4)
(born 12/01/58) | | President | | November 2005 | | Massachusetts Financial Services Company, Executive Vice President and Chief Regulatory Officer; Chief Compliance Officer (since December 2006) |
| | | |
| Christopher R. Bohane (4) (born 1/18/74) | | Assistant Secretary and Assistant Clerk | | July 2005 | | Massachusetts Financial Services Company, Vice President and Senior Counsel |
| | | |
John M. Corcoran (4) (born 4/13/65) | | Treasurer | | October 2008 | | Massachusetts Financial Services Company, Senior Vice President (since October 2008); State Street Bank and Trust (financial services provider), Senior Vice President, (until September 2008) |
| | | |
Ethan D. Corey (4) (born 11/21/63) | | Assistant Secretary and Assistant Clerk | | July 2005 | | Massachusetts Financial Services Company, Senior Vice President and Associate General Counsel |
| | | |
David L. DiLorenzo (4) (born 8/10/68) | | Assistant Treasurer | | July 2005 | | Massachusetts Financial Services Company, Vice President |
| | | |
Timothy M. Fagan (4) (born 7/10/68) | | Assistant Secretary and Assistant Clerk | | September 2005 | | Massachusetts Financial Services Company, Vice President and Senior Counsel |
| | | |
Mark D. Fischer (4) (born 10/27/70) | | Assistant Treasurer | | July 2005 | | Massachusetts Financial Services Company, Vice President |
22
MFS Research International Portfolio
Trustees and Officers – continued
| | | | | | |
Name, Date of Birth | | Position(s) Held
with Fund | | Trustee/Officer
Since (1) | | Principal Occupations During the Past Five Years and
Other Directorships (2) |
Robyn L. Griffin (born 7/04/75) | | Assistant Independent Chief Compliance Officer | | August 2008 | | Griffin Compliance LLC (provider of compliance services), Principal (since August 2008); State Street Corporation (financial services provider), Mutual Fund Administration Assistant Vice President (October 2006 – July 2008); Liberty Mutual Group (insurance), Personal Market Assistant Controller (April 2006 – October 2006); Deloitte & Touche LLP (professional services firm), Senior Manager (prior to April 2006) |
| | | |
Brian E. Langenfeld (4) (born 3/07/73) | | Assistant Secretary and Assistant Clerk | | May 2006 | | Massachusetts Financial Services Company, Vice President and Senior Counsel (since May 2006); John Hancock Advisers, LLC, Assistant Vice President and Counsel (until April 2006) |
| | | |
Ellen Moynihan (4) (born 11/13/57) | | Assistant Treasurer | | May 1997 | | Massachusetts Financial Services Company, Senior Vice President |
| | | |
Susan S. Newton (4) (born 3/07/50) | | Assistant Secretary and Assistant Clerk | | May 2005 | | Massachusetts Financial Services Company, Senior Vice President and Associate General Counsel |
| | | |
Susan A. Pereira (4)
(born 11/05/70) | | Assistant Secretary and Assistant Clerk | | July 2005 | | Massachusetts Financial Services Company, Vice President and Senior Counsel |
| | | |
Mark N. Polebaum (4) (born 5/01/52) | | Secretary and Clerk | | February 2006 | | Massachusetts Financial Services Company, Executive Vice President, General Counsel and Secretary (since January 2006); Wilmer Cutler Pickering Hale and Dorr LLP (law firm), Partner (until January 2006) |
| | | |
Frank L. Tarantino (born 3/07/44) | | Independent Chief Compliance Officer | | September 2004 | | Tarantino LLC (provider of compliance services), Principal |
| | | |
Richard S. Weitzel (4) (born 7/16/70) | | Assistant Secretary and Assistant Clerk | | October 2007 | | Massachusetts Financial Services Company, Vice President and Assistant General Counsel |
| | | |
James O. Yost (4) (born 6/12/60) | | Assistant Treasurer | | April 1992 | | Massachusetts Financial Services Company, Senior Vice President |
| (1) | Date first appointed to serve as Trustee/Officer of an MFS fund or a Compass variable account. Each Trustee has served continuously since appointment. For the period March 2008 until October 2008, Ms. DiOrioDwyer served as Treasurer of the Funds. |
| (2) | Directorships or trusteeships of companies required to report to the Securities and Exchange Commission (i.e., “public companies”). |
| (3) | “Interested person” of the Trust, within the meaning of the Investment Company Act of 1940 (referred to as the 1940 Act), which is the principal federal law governing investment companies like the Trust, as a result of position with Sun Life of Canada (U.S.). The address of Sun Life of Canada (U.S.) is One Sun Life Executive Park, Wellesley Hills, Massachusetts 02481. |
| (4) | “Interested person” of MFS within the meaning of the 1940 Act. The address of MFS is 500 Boylston Street, Boston, Massachusetts 02116. |
The Trust does not hold annual meetings for the purpose of electing Trustees, and Trustees are not elected for fixed terms. Each Trustee and officer holds office until his or her successor is chosen and qualified, or until his or her earlier death, resignation, retirement or removal.
All Trustees currently serve as Trustees of the Trust and have served in that capacity since originally elected or appointed. All of the Trustees are also Managers of the Compass Variable Accounts. The executive officers of the Trust hold similar offices for the Compass Variable Accounts and other funds in the MFS fund complex. As of January 1, 2011, each Trustee serves as a Trustee or Manager of 31 Accounts/Portfolios.
23
MFS Research International Portfolio
Trustees and Officers – continued
The Statement of Additional Information contains further information about the Trustees and is available without charge upon request by calling 1-800-752-7215.
| | |
Investment Adviser
Massachusetts Financial Services Company 500 Boylston Street, Boston, MA 02116-3741 | | Custodian State Street Bank and Trust 1 Lincoln Street, Boston, MA 02111-2900 |
Distributor
MFS Fund Distributors, Inc. 500 Boylston Street, Boston, MA 02116-3741 | | Independent Registered Public Accounting Firm Deloitte & Touche LLP 200 Berkeley Street, Boston, MA 02116 |
Portfolio Managers Jose Luis Garcia Thomas Melendez | | |
24
MFS Research International Portfolio
BOARD REVIEW OF INVESTMENT ADVISORY AGREEMENT
The Investment Company Act of 1940 requires that both the full Board of Trustees and a majority of the non-interested (“independent”) Trustees, voting separately, annually approve the continuation of the investment advisory agreement between MFS Variable Insurance Trust II (the “Trust”) and Massachusetts Financial Services Company (“MFS”) on behalf of the Fund. The Trustees consider matters bearing on the Fund and the advisory arrangement at their meetings throughout the year, including a review of performance data at each regular meeting. In addition, the independent Trustees met in person in May and again in July 2010 (“contract review meetings”) for the specific purpose of considering whether to approve the continuation of the investment advisory agreement for the Fund. The independent Trustees were assisted in their evaluation of the investment advisory agreement by independent legal counsel, from whom they received separate legal advice and with whom they met separately from MFS management during various contract review meetings. The independent Trustees were also assisted in this process by the Fund’s Independent Chief Compliance Officer, a full-time senior officer appointed by and reporting to the independent Trustees.
In connection with their deliberations, the Trustees, including the independent Trustees, considered such information and factors as they believed, in light of the legal advice furnished to them and their own business judgment, to be relevant. The investment advisory agreement was considered separately for the Fund, although the Trustees also took into account the common interests of all Funds in the Trust in their review. As described below, the Trustees considered the nature, quality, and extent of the various investment advisory, administrative, and shareholder services performed by MFS under the existing investment advisory agreement and other arrangements with the Trust.
In connection with their contract review meetings, the Trustees received and relied upon materials which included, among other items: (i) information provided by Lipper Inc. (“Lipper”) on the investment performance of the Fund for various time periods ended December 31, 2009, compared to the investment performance of a group of funds with substantially similar investment classifications/objectives (the “Lipper performance universe”), (ii) information provided by Lipper on the Fund’s advisory fees and other expenses compared to the advisory fees and other expenses of comparable funds identified by Lipper (the “Lipper expense group”), (iii) information provided by MFS on the advisory fees of comparable portfolios of its other clients, including institutional separate account and other clients, (iv) information as to whether, and to what extent applicable, expense waivers, reimbursements or fee “breakpoints” are observed for the Fund, (v) information regarding MFS’ financial results and financial condition, including MFS’ and certain of its affiliates’ estimated profitability from services performed for the Fund, (vi) MFS’ views regarding the outlook for the mutual fund industry and its strategic business plans, (vii) descriptions of various functions performed by MFS for the Trust, such as compliance monitoring and portfolio trading practices, and (viii) information regarding the overall organization of MFS, including information about MFS’ senior management and other personnel providing investment advisory, administrative and other services to the Fund. The comparative performance, fee and expense information prepared and provided by Lipper was not independently verified, and the independent Trustees did not independently verify any information provided to them by MFS.
The Trustees’ conclusion as to the continuation of the investment advisory agreement was based on comprehensive consideration of all information provided to the Trustees and was not the result of any single factor. Some of the factors that figured particularly in the Trustees’ deliberations are described below for the Fund, while individual Trustees may have given different weight to various factors and evaluated the information presented as a whole differently than another individual Trustee. The Trustees recognized that the fee arrangements for the Fund reflect years of review and discussion between the independent Trustees and MFS, that certain aspects of such arrangements may receive greater scrutiny in some years than others, and that the Trustees’ conclusions may be based, in part, on their consideration of these same arrangements during the course of the year and in prior years.
Based on information provided by Lipper, the Trustees compared the Fund’s total return investment performance to the performance of the Lipper performance universe over various time periods. The Trustees placed particular emphasis on the total return performance of the Fund’s Initial Class shares in comparison to the performance of funds in its Lipper performance universe over the one-, three- and five-year periods ended December 31, 2009. The Trustees did not rely on performance results for more recent periods, including those shown elsewhere in this report.
The Trustees noted the performance of the Fund’s Initial Class shares was in the 2nd quintile relative to the other funds in the Lipper performance universe for the one-year period (the 1st quintile being the best performers and the 5th quintile being the worst performers). The total return performance of the Fund was also in the 2nd quintile for the three-year and the five-year periods ended December 31, 2009, relative to the Lipper performance universe. Based on the nature and quality of services provided by MFS, the Board of Trustees concluded that the Fund’s performance was satisfactory.
In the course of their deliberations, the Trustees took into account information provided by MFS during contract review meetings, as well as during investment review meetings conducted with portfolio management personnel during the course of the year.
25
MFS Research International Portfolio
Board Review of Investment Advisory Agreement – continued
In assessing the reasonableness of the Fund’s advisory fee, the Trustees considered, among other information, the Fund’s advisory fee and the total expense ratio of the Fund’s Initial Class shares as a percentage of average daily net assets, compared to the advisory fee and total expense ratios of its peer group of funds based on information provided by Lipper. The Trustees also considered the advisory fees charged by MFS to institutional accounts. In comparing these fees, the Trustees considered the generally broader scope of services provided by MFS to the Trust than those provided to institutional accounts. The Trustees also considered the higher demands placed on MFS’ investment personnel and trading infrastructure as a result of the daily cash in-flows and out-flows of the Fund, and the impact on MFS and related expenses due to the more extensive regulatory regime to which the Fund is subject, compared to institutional accounts.
In considering the fees, the Trustees noted from the Lipper data that the Fund’s effective advisory fee rate and total expense ratio were each approximately at the median of such fees and expenses of funds in the Lipper expense group. In addition, the Trustees accepted MFS’ offer to continue the expense limitation for the Fund. The Trustees further concluded that the existing breakpoints were sufficient to allow the Fund to benefit from economies of scale as its assets grow. The Trustees concluded that the fees were reasonable in light of the nature and quality of services provided.
The Trustees also considered information prepared by MFS relating to its costs and profits with respect to the Fund and other investment companies and accounts advised by MFS, as well as MFS’ methodologies used to determine and allocate its costs to the Fund and other accounts and products for purposes of estimating profitability.
After reviewing these and other factors described below, the Trustees concluded that the advisory fees charged to the Fund represent reasonable compensation in light of the nature and quality of the services being provided by MFS.
In addition, the Trustees considered MFS’ resources and related efforts to continue to retain, attract and motivate capable personnel to serve the Fund. The Trustees also considered the financial resources of MFS and its parent, Sun Life Financial Inc. The Trustees further considered any advantages and possible disadvantages of having an adviser which also serves other investment companies as well as institutional accounts.
The Trustees also considered the nature, quality, cost, and extent of administrative, transfer agency, and distribution services provided to the Fund by MFS and its affiliates under agreements and plans other than the investment advisory agreement, including the 12b-1 fees the Fund pays to MFS Fund Distributors, Inc., an affiliate of MFS. The Trustees also considered the nature, extent and quality of certain other services MFS performs or arranges on the Fund’s behalf, which may include securities lending programs, directed expense payment programs, class action recovery programs, and MFS’ interaction with third-party service providers, principally custodians and sub-custodians. The Trustees concluded that the various non-advisory services provided by MFS and its affiliates on behalf of the Fund were satisfactory. The Trustees also considered the benefits to MFS from the use of the Fund’s portfolio brokerage commissions to pay for investment research and various other factors. Additionally, the Trustees considered so-called “fall-out benefits” to MFS such as reputational value derived from serving as investment manager to the Trust, and determined that any such benefits derived by MFS were reasonable and fair.
Based on their evaluation of factors that they deemed to be material, including those factors described above, the Board of Trustees, including a majority of the independent Trustees, concluded that the investment advisory agreement should be continued for an additional one-year period, commencing September 1, 2010.
A discussion regarding the Board’s most recent review and renewal of the fund’s Investment Advisory Agreement with MFS is available by clicking on the fund’s name under “Variable Insurance Portfolios — VIT II” in the “Products and Performance” section of the MFS Web site (mfs.com).
26
MFS Research International Portfolio
PROXY VOTING POLICIES AND INFORMATION
A general description of the MFS funds’ proxy voting policies and procedures is available without charge, upon request, by calling
1-800-225-2606, by visiting the Proxy Voting section of mfs.com or by visiting the SEC’s Web site at http://www.sec.gov.
Information regarding how the fund voted proxies relating to portfolio securities during the most recent twelve-month period ended June 30 is available without charge by visiting the Proxy Voting section of mfs.com or by visiting the SEC’s Web site at http://www.sec.gov.
QUARTERLY PORTFOLIO DISCLOSURE
The fund will file a complete schedule of portfolio holdings with the Securities and Exchange Commission (the Commission) for the first and third quarters of each fiscal year on Form N-Q. The fund’s Form N-Q may be reviewed and copied at the:
Public Reference Room
Securities and Exchange Commission
100 F Street, NE, Room 1580
Washington, D.C. 20549
Information on the operation of the Public Reference Room may be obtained by calling the Commission at 1-800-SEC-0330. The fund’s Form N-Q is available on the EDGAR database on the Commission’s Internet Web site at http://www.sec.gov, and copies of this information may be obtained, upon payment of a duplicating fee, by electronic request at the following e-mail address: publicinfo@sec.gov or by writing the Public Reference Section at the above address.
FURTHER INFORMATION
From time to time, MFS may post important information about the fund or the MFS funds on the MFS web site (mfs.com). This information is available by visiting the “News & Commentary” section of mfs.com or by clicking on the fund’s name under “Variable Insurance Portfolios — VIT II” in the “Products and Performance” section of mfs.com.
FEDERAL TAX INFORMATION (unaudited)
The following information is provided pursuant to provisions of the Internal Revenue Code.
Income derived from foreign sources was $5,292,808. The fund intends to pass through foreign tax credits of $443,427 for the fiscal year.
27
MFS Research International Portfolio
MFS® PRIVACY NOTICE
Privacy is a concern for every investor today. At MFS Investment Management® and the MFS funds, we take this concern very seriously. We want you to understand our policies about the investment products and services that we offer, and how we protect the nonpublic personal information of investors who have a direct relationship with us and our wholly owned subsidiaries.
Throughout our business relationship, you provide us with personal information. We maintain information and records about you, your investments, and the services you use. Examples of the nonpublic personal information we maintain include
| | Ÿ | | data from investment applications and other forms |
| | Ÿ | | share balances and transactional history with us, our affiliates, or others |
| | Ÿ | | facts from a consumer reporting agency |
We do not disclose any nonpublic personal information about our customers or former customers to anyone, except as permitted by law. We may share nonpublic personal information with third parties or certain of our affiliates in connection with servicing your account or processing your transactions. We may share information with companies or financial institutions that perform marketing services on our behalf or with other financial institutions with which we have joint marketing arrangements, subject to any legal requirements.
Authorization to access your nonpublic personal information is limited to appropriate personnel who provide products, services, or information to you. We maintain physical, electronic, and procedural safeguards to help protect the personal information we collect about you.
If you have any questions about the MFS privacy policy, please call 1-800-225-2606 any business day.
Note: If you own MFS products or receive MFS services in the name of a third party such as a bank or broker-dealer, their privacy policy may apply to you instead of ours.
28


MFS® TECHNOLOGY PORTFOLIO
The report is prepared for the general information of contract owners. It is authorized for distribution to prospective investors only when preceded or accompanied by a current prospectus.
NOT FDIC INSURED Ÿ MAY LOSE VALUE Ÿ NO BANK GUARANTEE Ÿ NOT A DEPOSIT Ÿ NOT INSURED BY ANY FEDERAL GOVERNMENT AGENCY OR NCUA/NCUSIF
MFS Technology Portfolio
LETTER FROM THE CEO

Dear Contract Owners:
After an extended rebound in the financial markets, uncertainty returned in 2010 as investors began to question the durability of the recovery for global economies and markets. That uncertainty led to increased risk aversion, especially as investors saw the eurozone struggle with the debt woes of many of its members. In September, the U.S. Federal Reserve Board’s promises to further loosen monetary policy helped assuage market fears and drive asset prices off their recent lows. A combination of solid earnings and improving economic data gave an additional boost to investor sentiment. As we enter 2011, we are cautiously optimistic that economic growth will continue to improve and that the global economies will recover from the shocks of the past few years. We expect the pace of recovery worldwide will be uneven and volatile.
As always, we continue to be mindful of the many economic challenges faced at the local, national, and international levels. It is in times such as these that we want to remind investors of the merits of maintaining a long-term view, adhering to basic investing principles such as asset allocation and diversification, and working closely with their advisors to research and identify appropriate investment opportunities.
Respectfully,

Robert J. Manning
Chairman and Chief Executive Officer
MFS Investment Management®
February 14, 2011
The opinions expressed in this letter are subject to change, may not be relied upon for investment advice, and no forecasts can be guaranteed.
1
MFS Technology Portfolio
PORTFOLIO COMPOSITION
Portfolio structure (i)
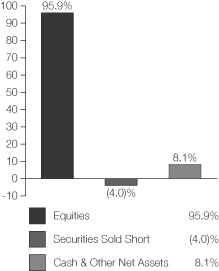
| | | | |
| Top ten holdings (i) | | | | |
| Apple, Inc. | | | 11.5% | |
| Oracle Corp. | | | 7.5% | |
| Google, Inc., “A” | | | 6.7% | |
| International Business Machines Corp. | | | 5.5% | |
| Cisco Systems, Inc. | | | 4.8% | |
| EMC Corp. | | | 4.7% | |
| Hewlett-Packard Co. | | | 3.1% | |
| Accenture Ltd., “A” | | | 3.0% | |
| Amazon.com, Inc. | | | 2.9% | |
| Microchip Technology, Inc. | | | 2.7% | |
| | | | |
| Top five industries (i) | | | | |
| Computer Software-Systems | | | 30.7% | |
| Computer Software | | | 19.5% | |
| Network & Telecom (s) | | | 10.3% | |
| Internet | | | 7.0% | |
| Business Services | | | 6.7% | |
| (i) | For purposes of this presentation, the components include the market value of securities, less any securities sold short, and reflect the impact of the equivalent exposure of derivative positions, if applicable. These amounts may be negative from time to time. Equivalent exposure is a calculated amount that translates the derivative position into a reasonable approximation of the amount of the underlying asset that the portfolio would have to hold at a given point in time to have the same price sensitivity that results from the portfolio’s ownership of the derivative contract. When dealing with derivatives, equivalent exposure is a more representative measure of the potential impact of a position on portfolio performance than market value. |
| (s) | Top five industry includes equities and securities sold short. |
Percentages are based on net assets as of 12/31/10.
The portfolio is actively managed and current holdings may be different.
2
MFS Technology Portfolio
MANAGEMENT REVIEW
Summary of Results
For the twelve months ended December 31, 2010, Initial Class shares of the MFS Technology Portfolio (the “fund”) provided a total return of 20.63%, while Service Class shares provided a total return of 20.22%. These compare with a return of 15.06% for the fund’s benchmark, the Standard & Poor’s 500 Stock Index, and a return of 12.65% for the fund’s other benchmark, the Standard & Poor’s North American Technology Sector Index.
Market Environment
The first quarter of the reporting period witnessed a continuation of the financial market and macroeconomic rebounds that had begun in early 2009. These recoveries in global activity and asset valuations were generally synchronized around the world, led importantly by emerging Asian economies, but broadening to include most of the global economy to varying degrees. Primary drivers of the recoveries included an unwinding of the inventory destocking that took place earlier, the production of manufacturing and capital goods, as well as massive fiscal and monetary stimulus.
During most of the remainder of the period, heightened risk surrounding the public-debt profiles of several of the peripheral European countries impaired market sentiment. At the same time, the improving trend in global macroeconomic data began to weaken somewhat. These two dynamics caused many asset prices to retrench significantly, as many questioned the durability of the global recovery.
Towards the end of the period, the U.S. Federal Reserve led markets to believe that further monetary loosening would be forthcoming if macroeconomic activity did not show signs of improvement. The prospects for more easing by the Fed improved market sentiment and drove risk-asset prices markedly higher. However, in a text-book case of “buy the rumor, sell the fact,” the weeks following the early November announcement of further quantitative easing saw a sell-off in U.S. Treasury bonds. This rise in Treasury yields occurred despite risk-off behavior in equities and credit markets (which would normally result in Treasury yield compression), and appears to have been the result of a few factors: signs of improved U.S. and global economic activity; opposition to quantitative easing from some quarters; and crowded long positions in U.S. Treasuries. The December agreement on an expansionary U.S. fiscal package also boosted sentiment, leading markets to reach near-term highs in risky asset valuations toward year end.
Contributors to Performance
Stock selection in the computer software industry was a key driver for positive performance relative to the Standard & Poor’s North American Technology Sector Index. Holdings of customer information software manager Salesforce.com (h), internet infrastructure services provider Verisign, enterprise software products maker Oracle, and internet software service provider Akamai Technologies were among the fund’s top contributors. Shares of Oracle rose as the company announced earnings that exceeded expectations, driven by strong demand for software licenses, as well as its expansion into the hardware business through the acquisition of Sun Microsystems. Not holding poor-performing software giant Microsoft aided relative results.
Stock selection in the network & telecom industry also boosted relative performance. The fund’s holdings of WAN optimization products designer and distributor Riverbed Technology and telecommunications networking products company Tellabs (h) aided returns. The fund’s short position in wireless solutions provider Research In Motion (Canada) also helped as this stock underperformed the benchmark over the reporting period.
Stock selection in the internet and computer systems industries also bolstered returns. Within the internet industry, our holdings of online restaurant reservation company OpenTable benefited returns as this stock significantly outperformed the benchmark over the reporting period. Shares of OpenTable moved higher after the company announced success in seating diners through its online applications. Within the computer systems industry, it was holdings of systems and software data storage manufacturer 3Par (b)(h) that helped relative performance.
Stock selection in the business services industry also boosted results. No individual stocks within this industry were among the fund’s top relative contributors.
Detractors from Performance
Stock selection in the electronics industry detracted from relative returns. The fund’s short position in semiconductor and passive electronic components producer Vishay Intertechnology and holdings of semiconductor and computer technology developer Texas Instruments hurt relative results. Exposure to Texas Instruments was achieved through both a short position and via put options on the stock.
An underweight position in the specialty stores industry was another negative. No individual stocks within this industry were among the fund’s top relative detractors.
3
MFS Technology Portfolio
Management Review – continued
Securities in other industries that held back relative performance included smartphone manufacturer Palm Inc. (h), network equipment company Cisco Systems, and IT company Telvent Git (b)(h) (Spain). Cisco Systems shares declined after the company forecasted lower-than-expected revenue and earnings. Management attributed the shortfall to lower government spending and weaker sales in Europe. The timing of our ownership in network storage company Compellent Technologies (b) and our underweight position in strong-performing computer and personal electronics maker Apple also hindered returns. The fund’s exposure to diversified technology products and services company IBM, through a combination of common stock and call options, dampened performance. A short hedge to our exposure to technology via a put option in Technology Select Sector SPDR (b)(h) was also among our top detractors for the reporting period.
The fund’s cash position was also a detractor from relative results. The fund holds cash to buy new holdings and to provide liquidity. In a period when equity markets rose, as measured by the fund’s benchmark, holding cash hurt performance versus the benchmark, which has no cash position.
Respectfully,
Joseph MacDougall
Portfolio Manager
Note to Contract Owners: Effective May 5, 2010, Joseph MacDougall became the manager of the fund. Previously, the fund was managed by Telis Bertsekas.
| (b) | Security is not a benchmark constituent. |
| (h) | Security was not held in the portfolio at period end. |
The views expressed in this report are those of the portfolio manager only through the end of the period of the report as stated on the cover and do not necessarily reflect the views of MFS or any other person in the MFS organization. These views are subject to change at any time based on market or other conditions, and MFS disclaims any responsibility to update such views. These views may not be relied upon as investment advice or an indication of trading intent on behalf of any MFS portfolio. References to specific securities are not recommendations of such securities, and may not be representative of any MFS portfolio’s current or future investments.
4
MFS Technology Portfolio
PERFORMANCE SUMMARY THROUGH 12/31/10
The following chart illustrates the historical performance of the fund in comparison to its benchmark(s). Benchmarks are unmanaged and may not be invested in directly. Benchmark returns do not reflect any fees or expenses. The performance of other share classes will be greater than or less than that of the class depicted below. (See Notes to Performance Summary.)
Performance data shown represents past performance and is no guarantee of future results. Investment return and principal value fluctuate so your units, when sold, may be worth more or less than the original cost; current performance may be lower or higher than quoted. The performance shown does not reflect the deduction of taxes, if any, that a contract holder would pay on fund distributions or the redemption of contract units. The returns for the fund shown also do not reflect the deduction of expenses associated with variable products, such as mortality and expense risk charges, separate account charges, and sales charges imposed by the insurance company separate accounts. Such expenses would reduce the overall returns shown.
Growth of a Hypothetical $10,000 Investment
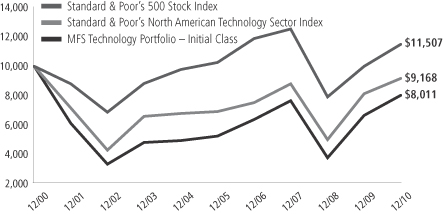
Total Returns through 12/31/10
Average annual total returns
| | | | | | | | | | | | | | |
| | | Share class | | Class inception date | | 1-yr | | 5-yr | | 10-yr | | Life (t) | | |
| | | Initial Class | | 6/16/00 | | 20.63% | | 8.93% | | (2.19)% | | N/A | | |
| | | Service Class | | 8/24/01 | | 20.22% | | 8.64% | | N/A | | 3.11% | | |
| | | | | |
| Comparative benchmarks | | | | | | | | | | |
| | | Standard & Poor’s 500 Stock Index (f) | | 15.06% | | 2.29% | | 1.41% | | N/A | | |
| | | Standard & Poor’s North American Technology Sector Index (f) | | 12.65% | | 5.83% | | (0.86)% | | N/A | | |
| (f) | Source: FactSet Research Systems Inc. |
| (t) | For the period from the class inception date through the stated period end (for those share classes with less than 10 years of performance history). No comparative benchmark performance information is provided for “life” periods. (See Notes to Performance Summary.) |
Benchmark Definitions
Standard & Poor’s 500 Stock Index – a market capitalization-weighted index of 500 widely held equity securities, designed to measure broad U.S. equity performance.
Standard & Poor’s North American Technology Sector Index – a modified market capitalization-weighted index that measures the performance of selected technology stocks.
It is not possible to invest directly in an index.
Notes to Performance Summary
Average annual total return represents the average annual change in value for each share class for the periods presented. Life returns are presented where the share class has less than 10 years of performance history and represent the average annual total return from the class inception date to the stated period end date. As the fund’s share classes may have different inception dates, the life returns may represent different time periods and may not be comparable. As a result, no comparative benchmark performance information is provided for life periods.
5
MFS Technology Portfolio
Performance Summary – continued
Performance results reflect any applicable expense subsidies and waivers in effect during the periods shown. Without such subsidies and waivers the fund’s performance results would be less favorable. Please see the prospectus and financial statements for complete details. All results are historical and assume the reinvestment of any dividends and capital gains distributions.
From time to time the fund may receive proceeds from litigation settlements, without which performance would be lower.
6
MFS Technology Portfolio
EXPENSE TABLE
Fund Expenses Borne by the Contract Holders During the Period,
July 1, 2010 through December 31, 2010
As a contract holder of the fund, you incur ongoing costs, including management fees; distribution and/or service (12b-1) fees; and other fund expenses. This example is intended to help you understand your ongoing costs (in dollars) of investing in the fund and to compare these costs with the ongoing costs of investing in other mutual funds.
The example is based on an investment of $1,000 invested at the beginning of the period and held for the entire period July 1, 2010 through December 31, 2010.
Actual Expenses
The first line for each share class in the following table provides information about actual account values and actual expenses. You may use the information in this line, together with the amount you invested, to estimate the expenses that you paid over the period. Simply divide your account value by $1,000 (for example, an $8,600 account value divided by $1,000 = 8.6), then multiply the result by the number in the first line under the heading entitled “Expenses Paid During Period” to estimate the expenses you paid on your account during this period.
Hypothetical Example for Comparison Purposes
The second line for each share class in the following table provides information about hypothetical account values and hypothetical expenses based on the fund’s actual expense ratio and an assumed rate of return of 5% per year before expenses, which is not the fund’s actual return. The hypothetical account values and expenses may not be used to estimate the actual ending account balance or expenses you paid for the period. You may use this information to compare the ongoing costs of investing in the fund and other funds. To do so, compare this 5% hypothetical example with the 5% hypothetical examples that appear in the shareholder reports of the other funds.
Please note that the expenses shown in the table are meant to highlight the fund’s ongoing costs only and do not take into account the fees and expenses imposed under the variable contracts through which your investment in the fund is made. Therefore, the second line for each share class in the table is useful in comparing ongoing costs associated with an investment in vehicles (such as the fund) which fund benefits under variable annuity and variable life insurance contracts and to qualified pension and retirement plans only, and will not help you determine the relative total costs of investing in the fund through variable annuity and variable life insurance contracts. If the fees and expenses imposed under the variable contracts were included, your costs would have been higher.
| | | | | | | | | | | | | | | | | | |
| Share Class | | | | Annualized
Expense Ratio | | | Beginning
Account Value
7/01/10 | | | Ending
Account Value
12/31/10 | | | Expenses Paid
During Period (p)
7/01/10-12/31/10 | |
| Initial Class | | Actual | | | 1.09% | | | | $1,000.00 | | | | $1,310.35 | | | | $6.35 | |
| | Hypothetical (h) | | | 1.09% | | | | $1,000.00 | | | | $1,019.71 | | | | $5.55 | |
| Service Class | | Actual | | | 1.34% | | | | $1,000.00 | | | | $1,308.45 | | | | $7.80 | |
| | Hypothetical (h) | | | 1.34% | | | | $1,000.00 | | | | $1,018.45 | | | | $6.82 | |
| (h) | 5% class return per year before expenses. |
| (p) | Expenses paid is equal to each class’ annualized expense ratio, as shown above, multiplied by the average account value over the period, multiplied by the number of days in the period, divided by the number of days in the year. |
7
MFS Technology Portfolio
PORTFOLIO OF INVESTMENTS – 12/31/10
The Portfolio of Investments is a complete list of all securities owned by your fund. It is categorized by broad-based asset classes.
| | | | | | | | |
| Issuer | | Shares/Par | | | Value ($) | |
| | | | | | | | |
| COMMON STOCKS – 97.6% | |
| Business Services – 8.2% | | | | | | | | |
| Accenture Ltd., “A” | | | 13,480 | | | $ | 653,645 | |
| Cognizant Technology Solutions Corp., “A” (a) | | | 7,210 | | | | 528,421 | |
| Concur Technologies, Inc. (a) | | | 1,200 | | | | 62,316 | |
| Constant Contact, Inc. (a) | | | 2,970 | | | | 92,040 | |
| FleetCor Technologies, Inc. (a) | | | 6,080 | | | | 187,994 | |
| Genpact Ltd. (a) | | | 9,500 | | | | 144,400 | |
| MSCI, Inc., “A” (a) | | | 2,410 | | | | 93,894 | |
| | | | | | | | |
| | | | | | $ | 1,762,710 | |
| | | | | | | | |
| Cable TV – 0.5% | | | | | | | | |
| Virgin Media, Inc. | | | 3,730 | | | $ | 101,605 | |
| | | | | | | | |
| Computer Software – 18.0% | | | | | | | | |
| Akamai Technologies, Inc. (a) | | | 2,310 | | | $ | 108,686 | |
| Autodesk, Inc. (a) | | | 13,420 | | | | 512,644 | |
| Autonomy Corp. PLC (a) | | | 5,722 | | | | 134,264 | |
| BMC Software, Inc. (a) | | | 3,500 | | | | 164,990 | |
| Cadence Design Systems, Inc. (a) | | | 11,280 | | | | 93,173 | |
| CommVault Systems, Inc. (a) | | | 2,420 | | | | 69,260 | |
| Intuit, Inc. (a) | | | 3,430 | | | | 169,099 | |
| Oracle Corp. (s) | | | 51,360 | | | | 1,607,568 | |
| Parametric Technology Corp. (a) | | | 10,820 | | | | 243,775 | |
| Red Hat, Inc. (a) | | | 2,880 | | | | 131,472 | |
| Rovi Corp. (a) | | | 1,800 | | | | 111,618 | |
| SolarWinds, Inc. (a) | | | 6,080 | | | | 117,040 | |
| Symantec Corp. (a) | | | 10,790 | | | | 180,625 | |
| VeriSign, Inc. | | | 6,770 | | | | 221,176 | |
| | | | | | | | |
| | | | | | $ | 3,865,390 | |
| | | | | | | | |
| Computer Software – Systems – 28.8% | | | | | | | | |
| Acer, Inc. | | | 18,000 | | | $ | 55,624 | |
| Apple, Inc. (a)(s) | | | 7,660 | | | | 2,470,805 | |
| Compellent Technologies, Inc. (a) | | | 6,140 | | | | 169,403 | |
| EMC Corp. (a) | | | 44,300 | | | | 1,014,470 | |
| Hewlett-Packard Co. (s) | | | 15,730 | | | | 662,233 | |
| International Business Machines Corp. | | | 8,070 | | | | 1,184,353 | |
| IntraLinks Holdings, Inc. (a) | | | 8,690 | | | | 162,590 | |
| NetApp, Inc. (a) | | | 2,680 | | | | 147,293 | |
| Pegatron Corp. (a) | | | 35,000 | | | | 50,418 | |
| Verifone Systems, Inc. (a) | | | 4,310 | | | | 166,194 | |
| VMware, Inc. (a) | | | 1,200 | | | | 106,692 | |
| | | | | | | | |
| | | | | | $ | 6,190,075 | |
| | | | | | | | |
| Consumer Services – 1.4% | | | | | | | | |
| Ctrip.com International Ltd., ADR (a) | | | 7,160 | | | $ | 289,622 | |
| | | | | | | | |
| Electronics – 12.8% | | | | | | | | |
| Advanced Micro Devices, Inc. (a) | | | 46,400 | | | $ | 379,552 | |
| Aeroflex Holding Corp. (a) | | | 3,420 | | | | 56,259 | |
| ARM Holdings PLC, ADR | | | 6,200 | | | | 128,650 | |
| Broadcom Corp., “A” | | | 6,060 | | | | 263,913 | |
| CEVA, Inc. (a) | | | 2,500 | | | | 51,250 | |
| Cirrus Logic, Inc. (a) | | | 3,100 | | | | 49,538 | |
| First Solar, Inc. (a) | | | 3,290 | | | | 428,161 | |
| | | | | | | | |
| Issuer | | Shares/Par | | | Value ($) | |
| | | | | | | | |
| COMMON STOCKS – continued | |
| Electronics – continued | | | | | | | | |
| Intel Corp. | | | 11,640 | | | $ | 244,789 | |
| Jabil Circuit, Inc. | | | 6,200 | | | | 124,558 | |
| Microchip Technology, Inc. | | | 16,770 | | | | 573,702 | |
| NVIDIA Corp. (a) | | | 6,500 | | | | 100,100 | |
| OmniVision Technologies, Inc. (a) | | | 2,830 | | | | 83,796 | |
| Stratasys, Inc. (a) | | | 5,220 | | | | 170,381 | |
| Teradyne, Inc. (a) | | | 6,600 | | | | 92,664 | |
| | | | | | | | |
| | | | | | $ | 2,747,313 | |
| | | | | | | | |
| Internet – 8.6% | | | | | | | | |
| Bitauto Holdings Ltd., ADR (a) | | | 8,180 | | | $ | 72,311 | |
| Google, Inc., “A” (a)(s) | | | 2,420 | | | | 1,437,407 | |
| Mail.ru Group Ltd., GDR (a)(z) | | | 2,992 | | | | 107,712 | |
| OpenTable, Inc. (a) | | | 850 | | | | 59,908 | |
| Yahoo!, Inc. (a) | | | 10,840 | | | | 180,269 | |
| | | | | | | | |
| | | | | | $ | 1,857,607 | |
| | | | | | | | |
| Leisure & Toys – 1.5% | | | | | | | | |
| THQ, Inc. (a) | | | 53,550 | | | $ | 324,513 | |
| | | | | | | | |
| Network & Telecom – 9.3% | | | | | | | | |
| Acme Packet, Inc. (a) | | | 920 | | | $ | 48,907 | |
| Ciena Corp. (a) | | | 4,500 | | | | 94,725 | |
| Cisco Systems, Inc. (a) | | | 51,330 | | | | 1,038,406 | |
| Fortinet, Inc. (a) | | | 5,050 | | | | 163,368 | |
| Juniper Networks, Inc. (a) | | | 5,930 | | | | 218,936 | |
| Radware Ltd. (a) | | | 5,900 | | | | 221,309 | |
| Riverbed Technology, Inc. (a) | | | 3,920 | | | | 137,866 | |
| Sycamore Networks, Inc. | | | 3,900 | | | | 80,301 | |
| | | | | | | | |
| | | | | | $ | 2,003,818 | |
| | | | | | | | |
| Other Banks & Diversified Financials – 4.0% | | | | | |
| MasterCard, Inc., “A” | | | 1,860 | | | $ | 416,845 | |
| Visa, Inc., “A” | | | 6,350 | | | | 446,913 | |
| | | | | | | | |
| | | | | | $ | 863,758 | |
| | | | | | | | |
| Specialty Stores – 3.3% | | | | | | | | |
| Amazon.com, Inc. (a) | | | 3,450 | | | $ | 621,000 | |
| The Carphone Warehouse Group PLC (a) | | | 13,307 | | | | 82,002 | |
| | | | | | | | |
| | | | | | $ | 703,002 | |
| | | | | | | | |
| Telephone Services – 1.2% | | | | | | | | |
| Cogent Communications Group, Inc. (a) | | | 18,550 | | | $ | 262,297 | |
| | | | | | | | |
Total Common Stocks
(Identified Cost, $19,057,860) | | | | | | $ | 20,971,710 | |
| | | | | | | | |
| CONVERTIBLE BONDS – 1.9% | |
| Computer Software – 1.1% | | | | | | | | |
| Verisign, Inc., 3.25%, 2037 | | $ | 210,000 | | | $ | 235,463 | |
| | | | | | | | |
| Leisure & Toys – 0.8% | | | | | | | | |
| THQ, Inc., 5%, 2014 | | $ | 174,000 | | | $ | 181,178 | |
| | | | | | | | |
Total Convertible Bonds
(Identified Cost, $317,866) | | | | | | $ | 416,641 | |
| | | | | | | | |
8
MFS Technology Portfolio
Portfolio of Investments – continued
| | | | | | | | |
| Issuer/Expiration Date/Strike Price | | Number of
Contracts | | | Value ($) | |
| | | | | | | | |
| CALL OPTIONS PURCHASED – 0.0% | |
| Google Inc. A – January 2011 @ $620 | | | 2 | | | $ | 1,700 | |
| Symantec Corp. – February 2011 @ $18 | | | 62 | | | | 2,356 | |
| Symantec Corp. – January 2011 @ $19 | | | 74 | | | | 370 | |
| Yahoo!, Inc. – January 2011 @ $21 | | | 199 | | | | 796 | |
| | | | | | | | |
Total Call Options Purchased
(Premium Paid, $16,125) | | | | | | $ | 5,222 | |
| | | | | | | | |
| PUT OPTIONS PURCHASED – 0.2% | |
| Altera Corp. – January 2011 @ $29 | | | 118 | | | $ | 354 | |
| Altera Corp. – March 2011 @ $37 | | | 57 | | | | 17,271 | |
| Atmel Corp. – February 2011 @ $6 | | | 208 | | | | 832 | |
| Mcafee Inc. – June 2011 @ $46 | | | 34 | | | | 4,250 | |
| Texas Instruments, Inc. – January 2011 @ $26 | | | 210 | | | | 420 | |
| Texas Instruments, Inc. – January 2011 @ $29 | | | 95 | | | | 475 | |
| Vishay Intertechnology Inc. – April 2011 @ $15 | | | 56 | | | | 8,120 | |
| Vishay Intertechnology, Inc. – April 2011 @ $12.50 | | | 237 | | | | 13,035 | |
| | | | | | | | |
Total Put Options Purchased
(Premium Paid, $156,270) | | | | | | $ | 44,757 | |
| | | | | | | | |
| | |
| Issuer | | Shares/Par | | | | |
| MONEY MARKET FUNDS (v) – 0.8% | |
| MFS Institutional Money Market Portfolio, 0.18%, at Cost and Net Asset Value | | | 166,838 | | | $ | 166,838 | |
| | | | | | | | |
Total Investments
(Identified Cost, $19,714,959) | | | | | | $ | 21,605,168 | |
| | | | | | | | |
| | |
| Issuer/Expiration Date/Strike Price | | Number of
Contracts | | | | |
| CALL OPTIONS WRITTEN – (0.2)% | |
| Advanced Micro Devices – January 2011 @ $9 | | | (94 | ) | | $ | (752 | ) |
| Ciena Corp. – January 2011 @ $20 | | | (45 | ) | | | (6,705 | ) |
| Cisco Systems Inc. – January 2011 @ $20 | | | (199 | ) | | | (10,945 | ) |
| Cisco Systems Inc. – January 2011 @ $21 | | | (96 | ) | | | (1,536 | ) |
| Google Inc. A – January 2011 @ $640 | | | (4 | ) | | | (1,720 | ) |
| Jabil Circuit Inc. – January 2011 @ $17.50 | | | (12 | ) | | | (3,300 | ) |
| Jabil Circuit Inc. – January 2011 @ $19 | | | (50 | ) | | | (7,250 | ) |
| | | | | | | | |
| Issuer/Expiration Date/Strike Price | | Number of
Contracts | | | Value ($) | |
| CALL OPTIONS WRITTEN – continued | | | | | | | | |
| | | | | | | | |
| Radware Ltd. – January 2011 @ $40 | | | (33 | ) | | $ | (3,300 | ) |
| Red Hat Inc. – January 2011 @ $49 | | | (28 | ) | | | (980 | ) |
| Visa Inc. A – January 2011 @ $72.50 | | | (63 | ) | | | (5,103 | ) |
| | | | | | | | |
Total Call Options Written
(Premium Received, $33,978) | | | | | | $ | (41,591 | ) |
| | | | | | | | |
| PUT OPTIONS WRITTEN – (0.1)% | |
| Best Buy Co. Inc. - January 2011 @ $34 | | | (36 | ) | | $ | (2,808 | ) |
| Citrix Systems Inc. - January 2011 @ $62.50 | | | (19 | ) | | | (1,273 | ) |
| Compellent Technologies Inc. - January 2011 @ $25 | | | (9 | ) | | | (36 | ) |
| FormFactor, Inc. - January 2011 @ $7.50 | | | (60 | ) | | | (240 | ) |
| Red Hat Inc. - January 2011 @ $43 | | | (38 | ) | | | (2,090 | ) |
| Sourcefire Inc. - January 2011 @ $22.50 | | | (50 | ) | | | (500 | ) |
| Sourcefire Inc. - January 2011 @ $25 | | | (12 | ) | | | (780 | ) |
| Symantec Corp. - January 2011 @ $15 | | | (115 | ) | | | (920 | ) |
| Symantec Corp. - February 2011 @ $15 | | | (106 | ) | | | (2,650 | ) |
| Yahoo!, Inc. - January 2011 @ $12.50 | | | (283 | ) | | | (849 | ) |
| | | | | | | | |
Total Put Options Written
(Premium Received, $25,784) | | | | | | $ | (12,146 | ) |
| | | | | | | | |
| | |
| Issuer | | Shares/Par | | | | |
| SECURITIES SOLD SHORT – (4.0)% | |
| Electronics – (3.4)% | | | | | | | | |
| Marvell Technology Group Ltd. (a) | | | (7,700 | ) | | $ | (142,835 | ) |
| Texas Instruments, Inc. | | | (5,200 | ) | | | (169,000 | ) |
| Vishay Intertechnology, Inc. (a) | | | (29,000 | ) | | | (425,720 | ) |
| | | | | | | | |
| | | | | | $ | (737,555 | ) |
| | | | | | | | |
| Network & Telecom – (0.6)% | | | | | | | | |
| Research In Motion Ltd. (a) | | | (2,200 | ) | | $ | (127,886 | ) |
| | | | | | | | |
Total Securities Sold Short
(Proceeds Received, $652,565) | | | | | | $ | (865,441 | ) |
| | | | | | | | |
OTHER ASSETS, LESS
LIABILITIES – 3.8% | | | | | | | 809,982 | |
| | | | | | | | |
| Net Assets – 100.0% | | | | | | $ | 21,495,972 | |
| | | | | | | | |
| (a) | Non-income producing security. |
| (s) | Security or a portion of the security was pledged to cover collateral requirements for securities sold short and written options. At December 31, 2010, the value of securities pledged amounted to $1,089,981. |
| (v) | Underlying fund that is available only to investment companies managed by MFS. The rate quoted is the annualized seven-day yield of the fund at period end. |
| (z) | Restricted securities are not registered under the Securities Act of 1933 and are subject to legal restrictions on resale. These securities generally may be resold in transactions exempt from registration or to the public if the securities are subsequently registered. Disposal of these securities may involve time-consuming negotiations and prompt sale at an acceptable price may be difficult. The fund holds the following restricted security: |
| | | | | | | | | | |
| Restricted Security | | Acquisition
Date | | Cost | | | Value | |
| Mail.ru Group Ltd., GDR | | 11/05/10-12/21/10 | | | $103,761 | | | | $107,712 | |
| % of Net Assets | | | | | | | | | 0.5% | |
The following abbreviations are used in this report and are defined:
| ADR | | American Depository Receipt |
| GDR | | Global Depository Receipt |
| PLC | | Public Limited Company |
See Notes to Financial Statements
9
MFS Technology Portfolio
FINANCIAL STATEMENTS | STATEMENT OF ASSETS AND LIABILITIES
This statement represents your fund’s balance sheet, which details the assets and liabilities comprising the total value of the fund.
| | | | | | | | |
At 12/31/10 | | | | | | | | |
| Assets | | | | | | | | |
Investments – | | | | | | | | |
Non-affiliated issuers, at value (identified cost, $19,548,121) | | | $21,438,330 | | | | | |
Underlying funds, at cost and value | | | 166,838 | | | | | |
Total investments, at value (identified cost, $19,714,959) | | | $21,605,168 | | | | | |
Deposits with brokers for securities sold short | | | 663,123 | | | | | |
Receivables for | | | | | | | | |
Fund shares sold | | | 192,293 | | | | | |
Interest | | | 5,865 | | | | | |
Receivable from investment adviser | | | 811 | | | | | |
Other assets | | | 832 | | | | | |
Total assets | | | | | | | $22,468,092 | |
| Liabilities | | | | | | | | |
Payables for | | | | | | | | |
Securities sold short, at value (proceeds received, $652,565) | | | $865,441 | | | | | |
Investments purchased | | | 512 | | | | | |
Fund shares reacquired | | | 12,708 | | | | | |
Written options outstanding, at value (premiums received, $59,762) | | | 53,737 | | | | | |
Payable to affiliates | | | | | | | | |
Investment adviser | | | 880 | | | | | |
Shareholder servicing costs | | | 11 | | | | | |
Distribution and/or service fees | | | 75 | | | | | |
Administrative services fee | | | 35 | | | | | |
Payable for Trustees’ compensation | | | 10 | | | | | |
Accrued expenses and other liabilities | | | 38,711 | | | | | |
Total liabilities | | | | | | | $972,120 | |
Net assets | | | | | | | $21,495,972 | |
| Net assets consist of | | | | | | | | |
Paid-in capital | | | $23,859,541 | | | | | |
Unrealized appreciation (depreciation) on investments | | | 1,683,358 | | | | | |
Accumulated net realized gain (loss) on investments and foreign currency transactions | | | (4,046,927 | ) | | | | |
Net assets | | | | | | | $21,495,972 | |
Shares of beneficial interest outstanding | | | | | | | 3,165,103 | |
| | | | | | | | | | | | |
| | | Net assets | | | Shares
outstanding | | | Net asset value
per share | |
Initial Class | | | $15,844,077 | | | | 2,316,998 | | | | $6.84 | |
Service Class | | | 5,651,895 | | | | 848,105 | | | | 6.66 | |
See Notes to Financial Statements
10
MFS Technology Portfolio
FINANCIAL STATEMENTS | STATEMENT OF OPERATIONS
This statement describes how much your fund earned in investment income and accrued in expenses. It also describes any gains and/or losses generated by fund operations.
| | | | | | | | |
Year ended 12/31/10 | | | | | | | | |
Net investment loss | | | | | | | | |
Income | | | | | | | | |
Dividends | | | $142,151 | | | | | |
Interest | | | 37,868 | | | | | |
Dividends from underlying funds | | | 356 | | | | | |
Foreign taxes withheld | | | (2,090 | ) | | | | |
Total investment income | | | | | | | $178,285 | |
Expenses | | | | | | | | |
Management fee | | | $128,211 | | | | | |
Distribution and/or service fees | | | 6,457 | | | | | |
Shareholder servicing costs | | | 1,973 | | | | | |
Administrative services fee | | | 10,000 | | | | | |
Trustees’ compensation | | | 2,171 | | | | | |
Custodian fee | | | 12,370 | | | | | |
Shareholder communications | | | 5,275 | | | | | |
Auditing fees | | | 46,281 | | | | | |
Legal fees | | | 7,105 | | | | | |
Dividend and interest expense on securities sold short | | | 11,334 | | | | | |
Miscellaneous | | | 11,785 | | | | | |
Total expenses | | | | | | | $242,962 | |
Fees paid indirectly | | | (6 | ) | | | | |
Reduction of expenses by investment adviser | | | (53,890 | ) | | | | |
Net expenses | | | | | | | $189,066 | |
Net investment loss | | | | | | | $(10,781 | ) |
Realized and unrealized gain (loss) on investments and foreign currency transactions | | | | | | | | |
Realized gain (loss) (identified cost basis) | | | | | | | | |
Investment transactions | | | $1,791,871 | | | | | |
Written option transactions | | | 193,420 | | | | | |
Securities sold short | | | (64,141 | ) | | | | |
Foreign currency transactions | | | (1,400 | ) | | | | |
Net realized gain (loss) on investments and foreign currency transactions | | | | | | | $1,919,750 | |
Change in unrealized appreciation (depreciation) | | | | | | | | |
Investments | | | $1,588,146 | | | | | |
Written options | | | 6,025 | | | | | |
Securities sold short | | | (216,462 | ) | | | | |
Net unrealized gain (loss) on investments | | | | | | | $1,377,709 | |
Net realized and unrealized gain (loss) on investments | | | | | | | $3,297,459 | |
Change in net assets from operations | | | | | | | $3,286,678 | |
See Notes to Financial Statements
11
MFS Technology Portfolio
FINANCIAL STATEMENTS | STATEMENTS OF CHANGES IN NET ASSETS
These statements describe the increases and/or decreases in net assets resulting from operations, any distributions, and any shareholder transactions.
| | | | | | | | |
For years ended 12/31 | | | 2010 | | | | 2009 | |
Change in net assets | | | | | | | | |
From operations | | | | | | | | |
Net investment loss | | | $(10,781 | ) | | | $(10,845 | ) |
Net realized gain (loss) on investments and foreign currency transactions | | | 1,919,750 | | | | (911,418 | ) |
Net unrealized gain (loss) on investments and foreign currency translation | | | 1,377,709 | | | | 7,916,652 | |
Change in net assets from operations | | | $3,286,678 | | | | $6,994,389 | |
Change in net assets from fund share transactions | | | $1,890,876 | | | | $283,359 | |
Total change in net assets | | | $5,177,554 | | | | $7,277,748 | |
Net assets | | | | | | | | |
At beginning of period | | | 16,318,418 | | | | 9,040,670 | |
At end of period | | | $21,495,972 | | | | $16,318,418 | |
See Notes to Financial Statements
12
MFS Technology Portfolio
FINANCIAL STATEMENTS | FINANCIAL HIGHLIGHTS
The financial highlights table is intended to help you understand the fund’s financial performance for the past 5 years. Certain information reflects financial results for a single fund share. The total returns in the table represent the rate by which an investor would have earned (or lost) on an investment in the fund share class (assuming reinvestment of all distributions) held for the entire period.
| | | | | | | | | | | | | | | | | | | | |
| Initial Class | | Years ended 12/31 | |
| | | 2010 | | | 2009 | | | 2008 | | | 2007 | | | 2006 | |
Net asset value, beginning of period | | | $5.67 | | | | $3.21 | | | | $6.54 | | | | $5.44 | | | | $4.46 | |
| Income (loss) from investment operations | | | | | | | | | | | | | | | | | | | | |
Net investment income (loss) (d) | | | $(0.00 | )(w) | | | $(0.00 | )(w) | | | $(0.00 | )(w) | | | $(0.02 | ) | | | $(0.03 | ) |
Net realized and unrealized gain (loss) on investments and
foreign currency | | | 1.17 | | | | 2.46 | | | | (3.33 | ) | | | 1.12 | | | | 1.01 | |
Total from investment operations | | | $1.17 | | | | $2.46 | | | | $(3.33 | ) | | | $1.10 | | | | $0.98 | |
Net asset value, end of period | | | $6.84 | | | | $5.67 | | | | $3.21 | | | | $6.54 | | | | $5.44 | |
Total return (%) (k)(r)(s) | | | 20.63 | | | | 76.64 | | | | (50.92 | ) | | | 20.22 | | | | 21.97 | |
Ratios (%) (to average net assets)
and Supplemental data: | | | | | | | | | | | | | | | | | | | | |
Expenses before expense reductions (f) | | | 1.38 | | | | 1.60 | | | | 1.39 | | | | 1.21 | | | | 1.34 | |
Expenses after expense reductions (f) | | | 1.07 | | | | 1.04 | | | | 1.02 | | | | 1.00 | | | | 1.00 | |
Net investment loss | | | (0.07 | ) | | | (0.05 | ) | | | (0.00 | )(w) | | | (0.31 | ) | | | (0.55 | ) |
Portfolio turnover | | | 140 | | | | 227 | | | | 244 | | | | 249 | | | | 234 | |
Net assets at end of period (000 omitted) | | | $15,844 | | | | $14,542 | | | | $8,051 | | | | $21,184 | | | | $18,813 | |
| Supplemental ratios (%): | | | | | | | | | | | | | | | | | | | | |
Expenses after expense reductions excluding short sale dividend and
interest expense (f) | | | 1.00 | | | | 1.00 | | | | 1.00 | | | | N/A | | | | N/A | |
See Notes to Financial Statements
13
MFS Technology Portfolio
Financial Highlights – continued
| | | | | | | | | | | | | | | | | | | | |
| Service Class | | Years ended 12/31 | |
| | | 2010 | | | 2009 | | | 2008 | | | 2007 | | | 2006 | |
Net asset value, beginning of period | | | $5.54 | | | | $3.14 | | | | $6.42 | | | | $5.35 | | | | $4.40 | |
| Income (loss) from investment operations | | | | | | | | | | | | | | | | | | | | |
Net investment income (loss) (d) | | | $(0.00 | )(w) | | | $(0.01 | ) | | | $(0.02 | ) | | | $(0.03 | ) | | | $(0.04 | ) |
Net realized and unrealized gain (loss) on investments and
foreign currency | | | 1.12 | | | | 2.41 | | | | (3.26 | ) | | | 1.10 | | | | 0.99 | |
Total from investment operations | | | $1.12 | | | | $2.40 | | | | $(3.28 | ) | | | $1.07 | | | | $0.95 | |
Net asset value, end of period | | | $6.66 | | | | $5.54 | | | | $3.14 | | | | $6.42 | | | | $5.35 | |
Total return (%) (k)(r)(s) | | | 20.22 | | | | 76.43 | | | | (51.09 | ) | | | 20.00 | | | | 21.59 | |
Ratios (%) (to average net assets)
and Supplemental data: | | | | | | | | | | | | | | | | | | | | |
Expenses before expense reductions (f) | | | 1.63 | | | | 1.85 | | | | 1.62 | | | | 1.46 | | | | 1.59 | |
Expenses after expense reductions (f) | | | 1.32 | | | | 1.29 | | | | 1.27 | | | | 1.25 | | | | 1.25 | |
Net investment loss | | | (0.04 | ) | | | (0.32 | ) | | | (0.29 | ) | | | (0.56 | ) | | | (0.80 | ) |
Portfolio turnover | | | 140 | | | | 227 | | | | 244 | | | | 249 | | | | 234 | |
Net assets at end of period (000 omitted) | | | $5,652 | | | | $1,776 | | | | $990 | | | | $3,555 | | | | $3,148 | |
| Supplemental ratios (%): | | | | | | | | | | | | | | | | | | | | |
Expenses after expense reductions excluding short sale dividend and
interest expense (f) | | | 1.25 | | | | 1.25 | | | | 1.25 | | | | N/A | | | | N/A | |
| (d) | Per share data is based on average shares outstanding. |
| (f) | Ratios do not reflect reductions from fees paid indirectly, if applicable. |
| (k) | The total return does not reflect expenses that apply to separate accounts. Inclusion of these charges would reduce the total return figures for all periods shown. |
| (r) | Certain expenses have been reduced without which performance would have been lower |
| (s) | From time to time the fund may receive proceeds from litigation settlements, without which performance would be lower. Excluding the effect of the proceeds received from a non-recurring litigation settlement against Nortel Networks Corp., the total returns for the year ended December 31, 2008 would have been lower by approximately 0.58%. |
| (w) | Per share amount was less than $0.01. |
See Notes to Financial Statements
14
MFS Technology Portfolio
NOTES TO FINANCIAL STATEMENTS
| (1) | | Business and Organization |
MFS Technology Portfolio (the fund) is a series of MFS Variable Insurance Trust II (the trust). The trust is organized as a Massachusetts business trust and is registered under the Investment Company Act of 1940, as amended, as an open-end management investment company. The shareholders of each series of the trust are separate accounts of insurance companies, which offer variable annuity and/or life insurance products, and qualified retirement and pension plans.
| (2) | | Significant Accounting Policies |
General – The preparation of financial statements in conformity with U.S. generally accepted accounting principles requires management to make estimates and assumptions that affect the reported amounts of assets and liabilities, and disclosure of contingent assets and liabilities at the date of the financial statements and the reported amounts of revenues and expenses during the reporting period. Actual results could differ from those estimates. In the preparation of these financial statements, management has evaluated subsequent events occurring after the date of the fund’s Statement of Assets and Liabilities through the date that the financial statements were issued. The fund invests primarily in securities of issuers in the technology industry. Issuers in a single industry can react similarly to market, economic, political and regulatory conditions and developments. The fund invests in foreign securities, including securities of emerging market issuers. Investments in foreign securities are vulnerable to the effects of changes in the relative values of the local currency and the U.S. dollar and to the effects of changes in each country’s legal, political, and economic environment. The markets of emerging markets countries are generally more volatile than the markets of developed countries with more mature economies. All of the risks of investing in foreign securities previously described are heightened when investing in emerging markets countries.
Investment Valuations – Equity securities, including restricted equity securities, are generally valued at the last sale or official closing price as provided by a third-party pricing service on the market or exchange on which they are primarily traded. Equity securities, for which there were no sales reported that day, are generally valued at the last quoted daily bid quotation as provided by a third-party pricing service on the market or exchange on which such securities are primarily traded. Equity securities held short, for which there were no sales reported for that day, are generally valued at the last quoted daily ask quotation as provided by a third-party pricing service on the market or exchange on which such securities are primarily traded. Debt instruments and floating rate loans (other than short-term instruments), including restricted debt instruments, are generally valued at an evaluated or composite bid as provided by a third-party pricing service. Short-term instruments with a maturity at issuance of 60 days or less generally are valued at amortized cost, which approximates market value. Exchange-traded options are generally valued at the last sale or official closing price as provided by a third-party pricing service on the exchange on which such options are primarily traded. Exchange-traded options for which there were no sales reported that day are generally valued at the last daily bid quotation as provided by a third-party pricing service on the exchange on which such options are primarily traded. Options not traded on an exchange are generally valued at a broker/dealer bid quotation. Foreign currency options are generally valued at valuations provided by a third-party pricing service. Open-end investment companies are generally valued at net asset value per share. Securities and other assets generally valued on the basis of information from a third-party pricing service may also be valued at a broker/dealer bid quotation. Values obtained from third-party pricing services can utilize both transaction data and market information such as yield, quality, coupon rate, maturity, type of issue, trading characteristics, and other market data. The values of foreign securities and other assets and liabilities expressed in foreign currencies are converted to U.S. dollars using the mean of bid and asked prices for rates provided by a third-party pricing service.
The Board of Trustees has delegated primary responsibility for determining or causing to be determined the value of the fund’s investments (including any fair valuation) to the adviser pursuant to valuation policies and procedures approved by the Board. If the adviser determines that reliable market quotations are not readily available, investments are valued at fair value as determined in good faith by the adviser in accordance with such procedures under the oversight of the Board of Trustees. Under the fund’s valuation policies and procedures, market quotations are not considered to be readily available for most types of debt instruments and floating rate loans and many types of derivatives. These investments are generally valued at fair value based on information from third-party pricing services. In addition, investments may be valued at fair value if the adviser determines that an investment’s value has been materially affected by events occurring after the close of the exchange or market on which the investment is principally traded (such as foreign exchange or market) and prior to the determination of the fund’s net asset value, or after the halting of trading of a specific security where trading does not resume prior to the close of the exchange or market on which the security is principally traded. Events that occur on a frequent basis after foreign markets close (such as developments in foreign markets and significant movements in the U.S. markets) and prior to the determination of the fund’s net asset value may be deemed to have a material effect on the value of securities traded in foreign markets. Accordingly, the fund’s foreign equity securities may often be valued at fair value. The adviser generally relies on
15
MFS Technology Portfolio
Notes to Financial Statements – continued
third-party pricing services or other information (such as the correlation with price movements of similar securities in the same or other markets; the type, cost and investment characteristics of the security; the business and financial condition of the issuer; and trading and other market data) to assist in determining whether to fair value and at what value to fair value an investment. The value of an investment for purposes of calculating the fund’s net asset value can differ depending on the source and method used to determine value. When fair valuation is used, the value of an investment used to determine the fund’s net asset value may differ from quoted or published prices for the same investment. There can be no assurance that the fund could obtain the fair value assigned to an investment if it were to sell the investment at the same time at which the fund determines its net asset value per share.
Various inputs are used in determining the value of the fund’s assets or liabilities. These inputs are categorized into three broad levels. In certain cases, the inputs used to measure fair value may fall into different levels of the fair value hierarchy. In such cases, an investment’s level within the fair value hierarchy is based on the lowest level of input that is significant to the fair value measurement. The fund’s assessment of the significance of a particular input to the fair value measurement in its entirety requires judgment, and considers factors specific to the investment. Level 1 includes unadjusted quoted prices in active markets for identical assets or liabilities. Level 2 includes other significant observable market-based inputs (including quoted prices for similar securities, interest rates, prepayment speed, and credit risk). Level 3 includes unobservable inputs, which may include the adviser’s own assumptions in determining the fair value of investments. Other financial instruments are derivative instruments not reflected in total investments, such as written options. The following is a summary of the levels used as of December 31, 2010 in valuing the fund’s assets or liabilities:
| | | | | | | | | | | | | | | | |
| Investments at Value | | Level 1 | | | Level 2 | | | Level 3 | | | Total | |
| Equity Securities: | | | | | | | | | | | | | | | | |
United States | | | $19,878,592 | | | | $1,186 | | | | $— | | | | $19,879,778 | |
China | | | 361,933 | | | | — | | | | — | | | | 361,933 | |
United Kingdom | | | 344,916 | | | | — | | | | — | | | | 344,916 | |
Israel | | | 221,309 | | | | — | | | | — | | | | 221,309 | |
Russia | | | — | | | | 107,712 | | | | — | | | | 107,712 | |
Taiwan | | | 106,041 | | | | — | | | | — | | | | 106,041 | |
| Corporate Bonds | | | — | | | | 416,641 | | | | — | | | | 416,641 | |
| Mutual Funds | | | 166,838 | | | | — | | | | — | | | | 166,838 | |
| Total Investments | | | $21,079,629 | | | | $525,539 | | | | $— | | | | $21,605,168 | |
| | | | |
| Short Sales | | | $(865,441 | ) | | | $— | | | | $— | | | | $(865,441 | ) |
| | | | |
| Other Financial Instruments | | | | | | | | | | | | |
| Written Options | | | $(53,461 | ) | | | $(276 | ) | | | $— | | | | $(53,737 | ) |
For further information regarding security characteristics, see the Portfolio of Investments.
Foreign Currency Translation – Purchases and sales of foreign investments, income, and expenses are converted into U.S. dollars based upon currency exchange rates prevailing on the respective dates of such transactions or on the reporting date for foreign denominated receivables and payables. Gains and losses attributable to foreign currency exchange rates on sales of securities are recorded for financial statement purposes as net realized gains and losses on investments. Gains and losses attributable to foreign exchange rate movements on receivables, payables, income and expenses are recorded for financial statement purposes as foreign currency transaction gains and losses. That portion of both realized and unrealized gains and losses on investments that results from fluctuations in foreign currency exchange rates is not separately disclosed.
Derivatives – The fund uses derivatives for different purposes, including to earn income and enhance returns, to increase or decrease exposure to a particular market, to manage or adjust the risk profile of the fund, or as alternatives to direct investments. Derivatives are used for hedging or non-hedging purposes. While hedging can reduce or eliminate losses, it can also reduce or eliminate gains. When the fund uses derivatives as an investment to increase market exposure, or for hedging purposes, gains and losses from derivative instruments may be substantially greater than the derivative’s original cost.
Derivative instruments used by the fund during the period include written options and purchased options. The fund’s period end derivatives, as presented in the Portfolio of Investments and the associated Derivative Contract Tables, generally are indicative of the volume of its derivative activity during the period.
16
MFS Technology Portfolio
Notes to Financial Statements – continued
The following table presents, by major type of derivative contract, the fair value, on a gross basis, of the asset and liability components of derivatives held by the fund at December 31, 2010 as reported in the Statement of Assets and Liabilities:
| | | | | | | | | | |
| | | | | Fair Value (a) | |
| Risk | | Derivative | | Asset Derivatives | | | Liability Derivatives | |
| Equity Contracts | | Purchased Equity Options | | | $49,979 | | | | $— | |
| Equity Contracts | | Written Equity Options | | | — | | | | (53,737 | ) |
| Total | | | | | $49,979 | | | | $(53,737 | ) |
| (a) | The value of purchased options outstanding is included in total investments, at value, within the fund’s Statement of Assets and Liabilities. |
The following table presents, by major type of derivative contract, the realized gain (loss) on derivatives held by the fund for the year ended December 31, 2010 as reported in the Statement of Operations:
| | | | | | | | |
| Risk | | Investment
Transactions
(Purchased
Options) | | | Written
Options | |
| Equity Contracts | | | $(140,032 | ) | | | $193,420 | |
The following table presents, by major type of derivative contract, the change in unrealized appreciation (depreciation) on derivatives held by the fund for the year ended December 31, 2010 as reported in the Statement of Operations:
| | | | | | | | |
| Risk | | Investment
Transactions
(Purchased
Options) | | | Written
Options | |
| Equity Contracts | | | $(10,354 | ) | | | $6,025 | |
Derivative counterparty credit risk is managed through formal evaluation of the creditworthiness of all potential counterparties. On certain over-the-counter derivatives, the fund attempts to reduce its exposure to counterparty credit risk whenever possible by entering into an International Swaps and Derivatives Association (ISDA) Master Agreement on a bilateral basis with each of the counterparties with whom it undertakes a significant volume of transactions. The ISDA Master Agreement gives each party to the agreement the right to terminate all transactions traded under such agreement if there is a certain deterioration in the credit quality of the other party. The ISDA Master Agreement gives the fund the right, upon an event of default by the applicable counterparty or a termination of the agreement, to close out all transactions traded under such agreement and to net amounts owed under each transaction to one net amount payable by one party to the other. This right to close out and net payments across all transactions traded under the ISDA Master Agreement could result in a reduction of the fund’s credit risk to such counterparty equal to any amounts payable by the fund under the applicable transactions, if any. However, absent an event of default by the counterparty or a termination of the agreement, the ISDA Master Agreement does not result in an offset of reported amounts of assets and liabilities in the Statement of Assets and Liabilities across transactions between the fund and the applicable counterparty.
Collateral requirements differ by type of derivative. Collateral or margin requirements are set by the broker or exchange clearing house for exchange traded derivatives (i.e., futures and exchange-traded options) while collateral terms are contract specific for over-the-counter traded derivatives (i.e., forwards, swaps and over-the-counter options). For derivatives traded under an ISDA Master Agreement, the collateral requirements are netted across all transactions traded under such agreement and one amount is posted from one party to the other to collateralize such obligations. Cash collateral that has been pledged to cover obligations of the fund under derivative contracts, if any, will be reported separately on the Statement of Assets and Liabilities as restricted cash. Securities collateral pledged for the same purpose, if any, is noted in the Portfolio of Investments.
Written Options – In exchange for a premium, the fund wrote call options on securities that it anticipated the price would decline and also wrote put options on securities that it anticipated the price would increase. At the time the option was written, the fund believed the premium received exceeded the potential loss that could result from adverse price changes in the options’ underlying securities. In a written option, the fund as the option writer grants the buyer the right to purchase from, or sell to, the fund a specified number of shares or units of a particular security, currency or index at a specified price within a specified period of time.
The premium received is initially recorded as a liability on the Statement of Assets and Liabilities. The option is subsequently marked-to-market daily with the difference between the premium received and the market value of the written option being recorded as unrealized appreciation or depreciation. When a written option expires, the fund realizes a gain equal to the amount of the premium received. The difference between the premium received and the amount paid on effecting a closing
17
MFS Technology Portfolio
Notes to Financial Statements – continued
transaction is considered a realized gain or loss. When a written call option is exercised, the premium received is offset against the proceeds to determine the realized gain or loss. When a written put option is exercised, the premium reduces the cost basis of the security purchased by the fund.
At the initiation of the written option contract, for exchange traded options, the fund is required to deposit securities or cash as collateral with the custodian for the benefit of the broker. For over-the-counter options, the fund may post collateral subject to the terms of an ISDA Master Agreement as generally described above if the market value of the options contract moves against it. The fund, as writer of an option, may have no control over whether the underlying securities may be sold (call) or purchased (put) and, as a result, bears the market risk of an unfavorable change in the price of the securities underlying the written option. Losses from writing options can exceed the premium received and can exceed the potential loss from an ordinary buy and sell transaction. Although the fund’s market risk may be significant, the maximum counterparty credit risk to the fund is equal to the market value of any collateral posted to the broker. For over-the-counter options, this risk is mitigated in cases where there is an ISDA Master Agreement between the fund and the counterparty providing for netting as described above.
Written Option Transactions
| | | | | | | | |
| | | Number of
contracts | | | Premiums
received | |
| Outstanding, beginning of period | | | — | | | | $— | |
| Options written | | | 7,350 | | | | 466,596 | |
| Options closed | | | (2,784 | ) | | | (251,845 | ) |
| Options expired | | | (3,214 | ) | | | (154,989 | ) |
| Outstanding, end of period | | | 1,352 | | | | $59,762 | |
Purchased Options – The fund purchased call and put options for a premium. Purchased call and put options entitle the holder to buy and sell a specified number of shares or units of a particular security, currency or index at a specified price at a specified date or within a specified period of time. Purchasing call options may be used to hedge against an anticipated increase in the dollar cost of securities or currency to be acquired or to increase the fund’s exposure to an underlying instrument. Purchasing put options may hedge against a decline in the value of portfolio securities or currency.
The premium paid is initially recorded as an investment in the Statement of Assets and Liabilities. That investment is subsequently marked-to-market daily with the difference between the premium paid and the market value of the purchased option being recorded as unrealized appreciation or depreciation. Premiums paid for purchased call and put options which have expired are treated as realized losses on investments in the Statement of Operations. Upon the exercise or closing of a purchased call option, the premium paid is added to the cost of the security or financial instrument. Upon the exercise or closing of a purchased put option, the premium paid is offset against the proceeds on the sale of the underlying security or financial instrument in order to determine the realized gain or loss on investments.
The risk in purchasing an option is that the fund pays a premium whether or not the option is exercised. The fund’s maximum risk of loss due to counterparty credit risk is limited to the market value of the option. For over-the-counter options, this risk is mitigated in cases where there is an ISDA Master Agreement between the fund and the counterparty providing for netting as described above and for posting of collateral by the counterparty to the fund to cover the fund’s exposure to the counterparty under such ISDA Master Agreement.
Short Sales – The fund entered into short sales whereby it sells a security it does not own in anticipation of a decline in the value of that security. The fund will realize a gain if the security price decreases and a loss if the security price increases between the date of the short sale and the date on which the fund replaces the borrowed security. Losses from short sales can exceed the proceeds of the security sold; and they can also exceed the potential loss from an ordinary buy and sell transaction. The amount of any premium, dividends, or interest the fund may be required to pay in connection with a short sale will be recognized as a fund expense. During the year ended December 31, 2010, this expense amounted to $11,334. The fund segregates cash or marketable securities in an amount that, when combined with the amount of proceeds from the short sale deposited with the broker, at least equals the current market value of the security sold short.
Indemnifications – Under the fund’s organizational documents, its officers and Trustees may be indemnified against certain liabilities and expenses arising out of the performance of their duties to the fund. Additionally, in the normal course of business, the fund enters into agreements with service providers that may contain indemnification clauses. The fund’s maximum exposure under these agreements is unknown as this would involve future claims that may be made against the fund that have not yet occurred.
Investment Transactions and Income – Investment transactions are recorded on the trade date. Interest income is recorded on the accrual basis. All premium and discount is amortized or accreted for financial statement purposes in accordance with U.S.
18
MFS Technology Portfolio
Notes to Financial Statements – continued
generally accepted accounting principles. Dividends received in cash are recorded on the ex-dividend date. Certain dividends from foreign securities will be recorded when the fund is informed of the dividend if such information is obtained subsequent to the ex-dividend date. Dividend and interest payments received in additional securities are recorded on the ex-dividend or ex-interest date in an amount equal to the value of the security on such date.
The fund may receive proceeds from litigation settlements. Any proceeds received from litigation involving portfolio holdings are reflected in the Statement of Operations in realized gain/loss if the security has been disposed of by the fund or in unrealized gain/loss if the security is still held by the fund. Any other proceeds from litigation not related to portfolio holdings are reflected as other income in the Statement of Operations.
Fees Paid Indirectly – The fund’s custody fee may be reduced according to an arrangement that measures the value of cash deposited with the custodian by the fund. This amount, for the year ended December 31, 2010, is shown as a reduction of total expenses on the Statement of Operations.
Tax Matters and Distributions – The fund intends to qualify as a regulated investment company, as defined under Subchapter M of the Internal Revenue Code, and to distribute all of its taxable income, including realized capital gains. As a result, no provision for federal income tax is required. The fund’s federal tax returns for the prior three fiscal years remain subject to examination by the Internal Revenue Service. Foreign taxes, if any, have been accrued by the fund in the accompanying financial statements.
Distributions to shareholders are recorded on the ex-dividend date. Income and capital gain distributions are determined in accordance with income tax regulations, which may differ from U.S. generally accepted accounting principles. Certain capital accounts in the financial statements are periodically adjusted for permanent differences in order to reflect their tax character. These adjustments have no impact on net assets or net asset value per share. Temporary differences which arise from recognizing certain items of income, expense, gain or loss in different periods for financial statement and tax purposes will reverse at some time in the future. Distributions in excess of net investment income or net realized gains are temporary overdistributions for financial statement purposes resulting from differences in the recognition or classification of income or distributions for financial statement and tax purposes.
Book/tax differences primarily relate to expiration of capital loss carryforwards, wash sale loss deferrals, and straddle loss deferrals.
The fund declared no distributions for the years ended December 31, 2010 and December 31, 2009.
The federal tax cost and the tax basis components of distributable earnings were as follows:
| | | | |
| As of 12/31/10 | | | | |
| Cost of investments | | | $19,735,499 | |
| Gross appreciation | | | 2,698,008 | |
| Gross depreciation | | | (828,339 | ) |
| Net unrealized appreciation (depreciation) | | | $1,869,669 | |
| Capital loss carryforwards | | | (3,997,652 | ) |
| Other temporary differences | | | (235,586 | ) |
As of December 31, 2010, the fund had capital loss carryforwards available to offset future realized gains. Such losses expire as follows:
| | | | |
| 12/31/16 | | | $(2,853,626 | ) |
| 12/31/17 | | | (1,144,026 | ) |
| | | $(3,997,652 | ) |
Multiple Classes of Shares of Beneficial Interest – The fund offers multiple classes of shares, which differ in their respective distribution and/or service fees. The fund’s income, realized and unrealized gain (loss), and common expenses are allocated to shareholders based on the daily net assets of each class. Dividends are declared separately for each class. Differences in per share dividend rates are generally due to differences in separate class expenses.
19
MFS Technology Portfolio
Notes to Financial Statements – continued
| (3) | | Transactions with Affiliates |
Investment Adviser – The fund has an investment advisory agreement with MFS to provide overall investment management and related administrative services and facilities to the fund. The management fee is computed daily and paid monthly at the following annual rates:
| | | | |
| First $1 billion of average daily net assets | | | 0.75% | |
| Average daily net assets in excess of $1 billion | | | 0.70% | |
The management fee incurred for the year ended December 31, 2010 was equivalent to an annual effective rate of 0.75% of the fund’s average daily net assets.
The investment adviser has agreed in writing to pay a portion of the fund’s total annual operating expenses, exclusive of interest, taxes, extraordinary expenses, brokerage and transaction costs and investment-related expenses, such that total annual operating expenses do not exceed 1.00% of average daily net assets for the Initial Class shares and 1.25% of average daily net assets for the Service Class shares. This written agreement will continue until April 30, 2012. For the year ended December 31, 2010, this reduction amounted to $53,890 and is reflected as a reduction of total expenses in the Statements of Operations.
Distributor – MFS Fund Distributors, Inc. (MFD), a wholly-owned subsidiary of MFS, is the distributor of shares of the fund. The Trustees have adopted a distribution plan for the Service Class shares pursuant to Rule 12b-1 under the Investment Company Act of 1940.
The fund’s distribution plan provides that the fund will pay MFD distribution and/or service fees equal to 0.25% per annum of its average daily net assets attributable to Service Class shares as partial consideration for services performed and expenses incurred by MFD and financial intermediaries (including participating insurance companies that invest in the fund to fund variable annuity and variable life insurance contracts, sponsors of qualified retirement and pension plans that invest in the fund, and affiliates of these participating insurance companies and plan sponsors) in connection with the sale and distribution of the Service Class shares. MFD may subsequently pay all, or a portion, of the distribution and/or service fees to financial intermediaries.
Shareholder Servicing Agent – MFS Service Center, Inc. (MFSC), a wholly-owned subsidiary of MFS, receives a fee from the fund for its services as shareholder servicing agent. For the year ended December 31, 2010, the fee was $1,967, which equated to 0.0115% annually of the fund’s average daily net assets. MFSC also receives payment from the fund for out-of-pocket expenses paid by MFSC on behalf of the fund. For the year ended December 31, 2010, these costs amounted to $6.
Administrator – MFS provides certain financial, legal, shareholder communications, compliance, and other administrative services to the fund. Under an administrative services agreement, the fund partially reimburses MFS the costs incurred to provide these services. The fund is charged an annual fixed amount of $10,000 plus a fee based on average daily net assets. The administrative services fee incurred for the year ended December 31, 2010 was equivalent to an annual effective rate of 0.0585% of the fund’s average daily net assets.
Trustees’ and Officers’ Compensation – The fund pays compensation to Trustees in the form of a retainer, attendance fees, and additional compensation to the Board chairperson. The fund does not pay compensation directly to officers of the fund who are also officers of the investment adviser, all of whom receive remuneration for their services to the fund from MFS. Certain officers of the fund are officers or directors of MFS, MFD, and MFSC.
Other – This fund and certain other funds managed by MFS (the funds) have entered into services agreements (the Agreements) which provide for payment of fees by the funds to Tarantino LLC and Griffin Compliance LLC in return for the provision of services of an Independent Chief Compliance Officer (ICCO) and Assistant ICCO, respectively, for the funds. The ICCO and Assistant ICCO are officers of the funds and the sole members of Tarantino LLC and Griffin Compliance LLC, respectively. The funds can terminate the Agreements with Tarantino LLC and Griffin Compliance LLC at any time under the terms of the Agreements. MFS has agreed to bear all expenses associated with office space, other administrative support, and supplies provided to the ICCO and Assistant ICCO. For the year ended December 31, 2010, the aggregate fees paid by the fund to Tarantino LLC and Griffin Compliance LLC were $290 and are included in miscellaneous expense on the Statement of Operations.
The fund invests in the MFS Institutional Money Market Portfolio which is managed by MFS and seeks a high level of current income consistent with preservation of capital and liquidity. Income earned on this investment is included in dividends from underlying funds on the Statement of Operations. This money market fund does not pay a management fee to MFS.
Purchases and sales of investments, other than U.S. Government securities, purchased option transactions, short sales, and short-term obligations, aggregated $25,328,782 and $23,823,275, respectively.
20
MFS Technology Portfolio
Notes to Financial Statements – continued
| (5) | | Shares of Beneficial Interest |
The fund’s Declaration of Trust permits the Trustees to issue an unlimited number of full and fractional shares of beneficial interest. Transactions in fund shares were as follows:
| | | | | | | | | | | | | | | | |
| | | Year ended 12/31/10 | | | Year ended 12/31/09 | |
| | | Shares | | | Amount | | | Shares | | | Amount | |
| Shares sold | | | | | | | | | | | | | | | | |
Initial Class | | | 264,700 | | | | $1,607,870 | | | | 645,666 | | | | $3,025,207 | |
Service Class | | | 719,608 | | | | 4,429,714 | | | | 96,890 | | | | 427,795 | |
| | | 984,308 | | | | $6,037,584 | | | | 742,556 | | | | $3,453,002 | |
| Shares reacquired | | | | | | | | | | | | | | | | |
Initial Class | | | (511,495 | ) | | | $(3,035,186 | ) | | | (592,122 | ) | | | $(2,766,428 | ) |
Service Class | | | (192,036 | ) | | | (1,111,522 | ) | | | (91,390 | ) | | | (403,215 | ) |
| | | (703,531 | ) | | | $(4,146,708 | ) | | | (683,512 | ) | | | $(3,169,643 | ) |
| Net change | | | | | | | | | | | | | | | | |
Initial Class | | | (246,795 | ) | | | $(1,427,316 | ) | | | 53,544 | | | | $258,779 | |
Service Class | | | 527,572 | | | | 3,318,192 | | | | 5,500 | | | | 24,580 | |
| | | 280,777 | | | | $1,890,876 | | | | 59,044 | | | | $283,359 | |
The fund and certain other funds managed by MFS participate in a $1.1 billion unsecured committed line of credit, subject to a $1 billion sublimit, provided by a syndication of banks under a credit agreement. Borrowings may be made for temporary financing needs. Interest is charged to each fund, based on its borrowings, generally at a rate equal to the higher of the Federal Reserve funds rate or one month LIBOR plus an agreed upon spread. A commitment fee, based on the average daily, unused portion of the committed line of credit, is allocated among the participating funds at the end of each calendar quarter. In addition, the fund and other funds managed by MFS have established unsecured uncommitted borrowing arrangements with certain banks for temporary financing needs. Interest is charged to each fund, based on its borrowings, at a rate equal to the Federal Reserve funds rate plus an agreed upon spread. For the year ended December 31, 2010, the fund’s commitment fee and interest expense were $186 and $0, respectively, and are included in miscellaneous expense on the Statement of Operations.
| (7) | | Transactions in Underlying Funds – Affiliated Issuers |
An affiliated issuer may be considered one in which the fund owns 5% or more of the outstanding voting securities, or a company which is under common control. For the purposes of this report, the fund assumes the following to be affiliated issuers:
| | | | | | | | | | | | | | | | |
| Underlying Funds | | Beginning Share/Par Amount | | | Acquisitions
Shares/Par
Amount | | | Dispositions
Shares/Par
Amount | | | Ending
Share/Par
Amount | |
| MFS Institutional Money Market Portfolio | | | 150,561 | | | | 8,759,783 | | | | (8,743,506 | ) | | | 166,838 | |
| | | | |
| Underlying Funds | | Realized Gain (Loss) | | | Capital Gain
Distributions | | | Dividend
Income | | | Ending
Value | |
| MFS Institutional Money Market Portfolio | | | $— | | | | $— | | | | $356 | | | | $166,838 | |
21
MFS Technology Portfolio
REPORT OF INDEPENDENT REGISTERED PUBLIC ACCOUNTING FIRM
To the Board of Trustees of MFS Variable Insurance Trust II and the Shareholders of
MFS Technology Portfolio:
We have audited the accompanying statement of assets and liabilities, including the portfolio of investments, of MFS Technology Portfolio (the “Fund”) (one of the portfolios comprising MFS Variable Insurance Trust II) as of December 31, 2010, and the related statement of operations for the year then ended, the statements of changes in net assets for each of the two years in the period then ended, and the financial highlights for each of the five years in the period then ended. These financial statements and financial highlights are the responsibility of the Fund’s management. Our responsibility is to express an opinion on these financial statements and financial highlights based on our audits.
We conducted our audits in accordance with the standards of the Public Company Accounting Oversight Board (United States). Those standards require that we plan and perform the audit to obtain reasonable assurance about whether the financial statements and financial highlights are free of material misstatement. The Fund is not required to have, nor were we engaged to perform, an audit of its internal control over financial reporting. Our audits included consideration of internal control over financial reporting as a basis for designing audit procedures that are appropriate in the circumstances, but not for the purpose of expressing an opinion on the effectiveness of the Fund’s internal control over financial reporting. Accordingly, we express no such opinion. An audit also includes examining, on a test basis, evidence supporting the amounts and disclosures in the financial statements, assessing the accounting principles used and significant estimates made by management, as well as evaluating the overall financial statement presentation. Our procedures included confirmation of securities owned as of December 31, 2010, by correspondence with the custodian and brokers; where replies were not received from brokers, we performed other auditing procedures. We believe that our audits provide a reasonable basis for our opinion.
In our opinion, the financial statements and financial highlights referred to above present fairly, in all material respects, the financial position of MFS Technology Portfolio as of December 31, 2010, the results of its operations for the year then ended, the changes in its net assets for each of the two years in the period then ended, and the financial highlights for each of the five years in the period then ended, in conformity with accounting principles generally accepted in the United States of America.
DELOITTE & TOUCHE LLP
Boston, Massachusetts
February 14, 2011
22
MFS Technology Portfolio
TRUSTEES AND OFFICERS – IDENTIFICATION AND BACKGROUND
The Trustees and officers of the Trust, as of February 1, 2011, are listed below, together with their principal occupations during the past five years. (Their titles may have varied during that period.) The address of each Trustee and officer is 500 Boylston Street, Boston, Massachusetts 02116.
| | | | | | |
Name, Date of Birth | | Position(s) Held
with Fund | | Trustee/Officer
Since (1) | | Principal Occupations During the Past Five Years and
Other Directorships (2) |
| INTERESTED TRUSTEE | | | | |
David D. Horn (3) (born 6/07/41) | | Trustee | | April 1986 | | Private investor; Sun Life Assurance Company of Canada, Senior Vice President and General Manager for the United States (until 1997); Director (until March 2004) |
| | |
| INDEPENDENT TRUSTEES | | | | |
J. Kermit Birchfield (born 1/08/40) | | Chairman | | May 1997 | | Consultant; Century Partners, Inc. (investments), Director; Displaytech, Inc. (technology), Chairman; Dessin Fournir LLC (furniture manufacturer), Director; Site Watch LLC (software to monitor oil tanks), Managing Director (2006 to present); Juridica Investments (fund investing in judicial matters), Director (2007 to present), Immuno Science, Inc. (medical research), Independent Director (2009 to present), Intermountain Industries, Inc. (oil & gas exploration and production), Director (until February 2009) |
| | | |
Robert C. Bishop (born 1/13/43) | | Trustee | | May 2001 | | AutoImmune, Inc. (pharmaceutical product development), Chairman, President and Chief Executive Officer; Caliper Life Sciences Corp. (laboratory analytical instruments), Chairman; Optobionics Corporation (ophthalmic devices), Director (until 2007); Millipore Corporation (purification/filtration products), Director (until July 2010); Waterstreet Capital (leverage buyouts), Advisory Board (until August 2010) |
| | | |
Frederick H. Dulles (born 3/12/42) | | Trustee | | May 2001 | | Dulles International Law LLC (law firm), Senior Lawyer (since 2009); Juridica Capital Management (US) Inc. (litigation financing), Vice President and General Counsel (since 2009); Dulles Properties LLC (real estate), Broker (since 2008); The Citadel School of Business Administration (education), Adjunct Professor (since 2003); Disher, Hamrick & Myers Residential, Inc. (real estate), Broker (until 2006); Frederick H. Dulles Law Practice (law firm), (until 2006); Charlestown School of Law (education), Adjunct Professor (until 2007); Prudential Carolina Real Estate, (real estate), Broker (until 2008); Free Enterprise Foundation Inc. (research institute), Director & Secretary (until 2008); Ten State International Law PLLP (law firm), Of Counsel (until 2009) |
| | | |
Marcia A. Kean (born 6/30/48) | | Trustee | | April 2005 | | Feinstein Kean Healthcare (consulting), Chief Executive Officer |
| | | |
Ronald G. Steinhart (born 6/15/40) | | Trustee | | May 2001 | | Private investor; Penske Automotive Group (automotive retailer), Director; Animal Health International, Inc. (animal health products), Director (since 2007); Texas Industries (concrete/aggregates/cement), Director (since 2007); Susser Holdings Corporation (retail convenience stores and distributor of wholesale motor fuel), Director (since 2009); Prentiss Properties Trust (real estate investment trust), Director (until 2006); Penson Worldwide, Inc. (securities clearance), Director (until 2008) |
| | | |
Haviland Wright (born 7/21/48) | | Trustee | | May 2001 | | X-Change Corp. (multi-media web services), Director (since 2010); Nano Loa Inc. (liquid crystal displays), Director (until 2009); Profitability of Hawaii (software), Chief Development Officer (until 2010); Elixir Technologies Corporation (software), Director (until 2010) |
| | | |
| OFFICERS | | | | | | |
Maria F. DiOrioDwyer (4)
(born 12/01/58) | | President | | November 2005 | | Massachusetts Financial Services Company, Executive Vice President and Chief Regulatory Officer; Chief Compliance Officer (since December 2006) |
| | | |
| Christopher R. Bohane (4) (born 1/18/74) | | Assistant Secretary and Assistant Clerk | | July 2005 | | Massachusetts Financial Services Company, Vice President and Senior Counsel |
| | | |
John M. Corcoran (4) (born 4/13/65) | | Treasurer | | October 2008 | | Massachusetts Financial Services Company, Senior Vice President (since October 2008); State Street Bank and Trust (financial services provider), Senior Vice President, (until September 2008) |
| | | |
Ethan D. Corey (4) (born 11/21/63) | | Assistant Secretary and Assistant Clerk | | July 2005 | | Massachusetts Financial Services Company, Senior Vice President and Associate General Counsel |
| | | |
David L. DiLorenzo (4) (born 8/10/68) | | Assistant Treasurer | | July 2005 | | Massachusetts Financial Services Company, Vice President |
| | | |
Timothy M. Fagan (4) (born 7/10/68) | | Assistant Secretary and Assistant Clerk | | September 2005 | | Massachusetts Financial Services Company, Vice President and Senior Counsel |
| | | |
Mark D. Fischer (4) (born 10/27/70) | | Assistant Treasurer | | July 2005 | | Massachusetts Financial Services Company, Vice President |
23
MFS Technology Portfolio
Trustees and Officers – continued
| | | | | | |
Name, Date of Birth | | Position(s) Held
with Fund | | Trustee/Officer
Since (1) | | Principal Occupations During the Past Five Years and
Other Directorships (2) |
Robyn L. Griffin (born 7/04/75) | | Assistant Independent Chief Compliance Officer | | August 2008 | | Griffin Compliance LLC (provider of compliance services), Principal (since August 2008); State Street Corporation (financial services provider), Mutual Fund Administration Assistant Vice President (October 2006 – July 2008); Liberty Mutual Group (insurance), Personal Market Assistant Controller (April 2006 – October 2006); Deloitte & Touche LLP (professional services firm), Senior Manager (prior to April 2006) |
| | | |
Brian E. Langenfeld (4) (born 3/07/73) | | Assistant Secretary and Assistant Clerk | | May 2006 | | Massachusetts Financial Services Company, Vice President and Senior Counsel (since May 2006); John Hancock Advisers, LLC, Assistant Vice President and Counsel (until April 2006) |
| | | |
Ellen Moynihan (4) (born 11/13/57) | | Assistant Treasurer | | May 1997 | | Massachusetts Financial Services Company, Senior Vice President |
| | | |
Susan S. Newton (4) (born 3/07/50) | | Assistant Secretary and Assistant Clerk | | May 2005 | | Massachusetts Financial Services Company, Senior Vice President and Associate General Counsel |
| | | |
Susan A. Pereira (4)
(born 11/05/70) | | Assistant Secretary and Assistant Clerk | | July 2005 | | Massachusetts Financial Services Company, Vice President and Senior Counsel |
| | | |
Mark N. Polebaum (4) (born 5/01/52) | | Secretary and Clerk | | February 2006 | | Massachusetts Financial Services Company, Executive Vice President, General Counsel and Secretary (since January 2006); Wilmer Cutler Pickering Hale and Dorr LLP (law firm), Partner (until January 2006) |
| | | |
Frank L. Tarantino (born 3/07/44) | | Independent Chief Compliance Officer | | September 2004 | | Tarantino LLC (provider of compliance services), Principal |
| | | |
Richard S. Weitzel (4) (born 7/16/70) | | Assistant Secretary and Assistant Clerk | | October 2007 | | Massachusetts Financial Services Company, Vice President and Assistant General Counsel |
| | | |
James O. Yost (4) (born 6/12/60) | | Assistant Treasurer | | April 1992 | | Massachusetts Financial Services Company, Senior Vice President |
| (1) | Date first appointed to serve as Trustee/Officer of an MFS fund or a Compass variable account. Each Trustee has served continuously since appointment. For the period March 2008 until October 2008, Ms. DiOrioDwyer served as Treasurer of the Funds. |
| (2) | Directorships or trusteeships of companies required to report to the Securities and Exchange Commission (i.e., “public companies”). |
| (3) | “Interested person” of the Trust, within the meaning of the Investment Company Act of 1940 (referred to as the 1940 Act), which is the principal federal law governing investment companies like the Trust, as a result of position with Sun Life of Canada (U.S.). The address of Sun Life of Canada (U.S.) is One Sun Life Executive Park, Wellesley Hills, Massachusetts 02481. |
| (4) | “Interested person” of MFS within the meaning of the 1940 Act. The address of MFS is 500 Boylston Street, Boston, Massachusetts 02116. |
The Trust does not hold annual meetings for the purpose of electing Trustees, and Trustees are not elected for fixed terms. Each Trustee and officer holds office until his or her successor is chosen and qualified, or until his or her earlier death, resignation, retirement or removal.
All Trustees currently serve as Trustees of the Trust and have served in that capacity since originally elected or appointed. All of the Trustees are also Managers of the Compass Variable Accounts. The executive officers of the Trust hold similar offices for the Compass Variable Accounts and other funds in the MFS fund complex. As of January 1, 2011, each Trustee serves as a Trustee or Manager of 31 Accounts/Portfolios.
24
MFS Technology Portfolio
Trustees and Officers – continued
The Statement of Additional Information contains further information about the Trustees and is available without charge upon request by calling 1-800-752-7215.
| | |
Investment Adviser
Massachusetts Financial Services Company 500 Boylston Street, Boston, MA 02116-3741 | | Custodian State Street Bank and Trust 1 Lincoln Street, Boston, MA 02111-2900 |
Distributor
MFS Fund Distributors, Inc. 500 Boylston Street, Boston, MA 02116-3741 | | Independent Registered Public Accounting Firm Deloitte & Touche LLP 200 Berkeley Street, Boston, MA 02116 |
Portfolio Manager Joseph MacDougall | | |
25
MFS Technology Portfolio
BOARD REVIEW OF INVESTMENT ADVISORY AGREEMENT
The Investment Company Act of 1940 requires that both the full Board of Trustees and a majority of the non-interested (“independent”) Trustees, voting separately, annually approve the continuation of the investment advisory agreement between MFS Variable Insurance Trust II (the “Trust”) and Massachusetts Financial Services Company (“MFS”) on behalf of the Fund. The Trustees consider matters bearing on the Fund and the advisory arrangement at their meetings throughout the year, including a review of performance data at each regular meeting. In addition, the independent Trustees met in person in May and again in July 2010 (“contract review meetings”) for the specific purpose of considering whether to approve the continuation of the investment advisory agreement for the Fund. The independent Trustees were assisted in their evaluation of the investment advisory agreement by independent legal counsel, from whom they received separate legal advice and with whom they met separately from MFS management during various contract review meetings. The independent Trustees were also assisted in this process by the Fund’s Independent Chief Compliance Officer, a full-time senior officer appointed by and reporting to the independent Trustees.
In connection with their deliberations, the Trustees, including the independent Trustees, considered such information and factors as they believed, in light of the legal advice furnished to them and their own business judgment, to be relevant. The investment advisory agreement was considered separately for the Fund, although the Trustees also took into account the common interests of all Funds in the Trust in their review. As described below, the Trustees considered the nature, quality, and extent of the various investment advisory, administrative, and shareholder services performed by MFS under the existing investment advisory agreement and other arrangements with the Trust.
In connection with their contract review meetings, the Trustees received and relied upon materials which included, among other items: (i) information provided by Lipper Inc. (“Lipper”) on the investment performance of the Fund for various time periods ended December 31, 2009, compared to the investment performance of a group of funds with substantially similar investment classifications/objectives (the “Lipper performance universe”), (ii) information provided by Lipper on the Fund’s advisory fees and other expenses compared to the advisory fees and other expenses of comparable funds identified by Lipper (the “Lipper expense group”), (iii) information provided by MFS on the advisory fees of comparable portfolios of its other clients, including institutional separate account and other clients, (iv) information as to whether, and to what extent applicable, expense waivers, reimbursements or fee “breakpoints” are observed for the Fund, (v) information regarding MFS’ financial results and financial condition, including MFS’ and certain of its affiliates’ estimated profitability from services performed for the Fund, (vi) MFS’ views regarding the outlook for the mutual fund industry and its strategic business plans, (vii) descriptions of various functions performed by MFS for the Trust, such as compliance monitoring and portfolio trading practices, and (viii) information regarding the overall organization of MFS, including information about MFS’ senior management and other personnel providing investment advisory, administrative and other services to the Fund. The comparative performance, fee and expense information prepared and provided by Lipper was not independently verified, and the independent Trustees did not independently verify any information provided to them by MFS.
The Trustees’ conclusion as to the continuation of the investment advisory agreement was based on comprehensive consideration of all information provided to the Trustees and was not the result of any single factor. Some of the factors that figured particularly in the Trustees’ deliberations are described below for the Fund, while individual Trustees may have given different weight to various factors and evaluated the information presented as a whole differently than another individual Trustee. The Trustees recognized that the fee arrangements for the Fund reflect years of review and discussion between the independent Trustees and MFS, that certain aspects of such arrangements may receive greater scrutiny in some years than others, and that the Trustees’ conclusions may be based, in part, on their consideration of these same arrangements during the course of the year and in prior years.
Based on information provided by Lipper, the Trustees compared the Fund’s total return investment performance to the performance of the Lipper performance universe over various time periods. The Trustees placed particular emphasis on the total return performance of the Fund’s Initial Class shares in comparison to the performance of funds in its Lipper performance universe over the one-, three- and five-year periods ended December 31, 2009. The Trustees did not rely on performance results for more recent periods, including those shown elsewhere in this report.
The Trustees noted the performance of the Fund’s Initial Class shares was in the 1st quintile relative to the other funds in the Lipper performance universe for the one-year period (the 1st quintile being the best performers and the 5th quintile being the worst performers). The total return performance of the Fund was in the 3rd quintile for the three-year period and in the 1st quintile for the five-year period ended December 31, 2009, relative to the Lipper performance universe. Based on the nature and quality of services provided by MFS, the Board of Trustees concluded that the Fund’s performance was satisfactory.
26
MFS Technology Portfolio
Board Review of Investment Advisory Agreement – continued
In the course of their deliberations, the Trustees took into account information provided by MFS during contract review meetings, as well as during investment review meetings conducted with portfolio management personnel during the course of the year.
In assessing the reasonableness of the Fund’s advisory fee, the Trustees considered, among other information, the Fund’s advisory fee and the total expense ratio of the Fund’s Initial Class shares as a percentage of average daily net assets, compared to the advisory fee and total expense ratios of its peer group of funds based on information provided by Lipper. The Trustees also considered the advisory fees charged by MFS to institutional accounts. In comparing these fees, the Trustees considered the generally broader scope of services provided by MFS to the Trust than those provided to institutional accounts. The Trustees also considered the higher demands placed on MFS’ investment personnel and trading infrastructure as a result of the daily cash in-flows and out-flows of the Fund, and the impact on MFS and related expenses due to the more extensive regulatory regime to which the Fund is subject, compared to institutional accounts.
In considering the fees, the Trustees noted from the Lipper data that the Fund’s effective advisory fee rate was below the median and total expense ratio was above the median of such fees and expenses of funds in the Lipper expense group. In addition, the Trustees accepted MFS’ offer to continue the expense limitation for the Fund. The Trustees further concluded that the existing breakpoint was sufficient to allow the Fund to benefit from economies of scale as its assets grow. The Trustees concluded that the fees were reasonable in light of the nature and quality of services provided.
The Trustees also considered information prepared by MFS relating to its costs and profits with respect to the Fund and other investment companies and accounts advised by MFS, as well as MFS’ methodologies used to determine and allocate its costs to the Fund and other accounts and products for purposes of estimating profitability.
After reviewing these and other factors described below, the Trustees concluded that the advisory fees charged to the Fund represent reasonable compensation in light of the nature and quality of the services being provided by MFS.
In addition, the Trustees considered MFS’ resources and related efforts to continue to retain, attract and motivate capable personnel to serve the Fund. The Trustees also considered the financial resources of MFS and its parent, Sun Life Financial Inc. The Trustees further considered any advantages and possible disadvantages of having an adviser which also serves other investment companies as well as institutional accounts.
The Trustees also considered the nature, quality, cost, and extent of administrative, transfer agency, and distribution services provided to the Fund by MFS and its affiliates under agreements and plans other than the investment advisory agreement, including the 12b-1 fees the Fund pays to MFS Fund Distributors, Inc., an affiliate of MFS. The Trustees also considered the nature, extent and quality of certain other services MFS performs or arranges on the Fund’s behalf, which may include securities lending programs, directed expense payment programs, class action recovery programs, and MFS’ interaction with third-party service providers, principally custodians and sub-custodians. The Trustees concluded that the various non-advisory services provided by MFS and its affiliates on behalf of the Fund were satisfactory. The Trustees also considered the benefits to MFS from the use of the Fund’s portfolio brokerage commissions to pay for investment research and various other factors. Additionally, the Trustees considered so-called “fall-out benefits” to MFS such as reputational value derived from serving as investment manager to the Trust, and determined that any such benefits derived by MFS were reasonable and fair.
Based on their evaluation of factors that they deemed to be material, including those factors described above, the Board of Trustees, including a majority of the independent Trustees, concluded that the investment advisory agreement should be continued for an additional one-year period, commencing September 1, 2010.
A discussion regarding the Board’s most recent review and renewal of the fund’s Investment Advisory Agreement with MFS is available by clicking on the fund’s name under “Variable Insurance Portfolios — VIT II” in the “Products and Performance” section of the MFS Web site (mfs.com).
27
28
MFS Technology Portfolio
PROXY VOTING POLICIES AND INFORMATION
A general description of the MFS funds’ proxy voting policies and procedures is available without charge, upon request, by calling 1-800-225-2606, by visiting the Proxy Voting section of mfs.com or by visiting the SEC’s Web site at http://www.sec.gov.
Information regarding how the fund voted proxies relating to portfolio securities during the most recent twelve-month period ended June 30 is available without charge by visiting the Proxy Voting section of mfs.com or by visiting the SEC’s Web site at http://www.sec.gov.
QUARTERLY PORTFOLIO DISCLOSURE
The fund will file a complete schedule of portfolio holdings with the Securities and Exchange Commission (the Commission) for the first and third quarters of each fiscal year on Form N-Q. The fund’s Form N-Q may be reviewed and copied at the:
Public Reference Room
Securities and Exchange Commission
100 F Street, NE, Room 1580
Washington, D.C. 20549
Information on the operation of the Public Reference Room may be obtained by calling the Commission at 1-800-SEC-0330. The fund’s Form N-Q is available on the EDGAR database on the Commission’s Internet Web site at http://www.sec.gov, and copies of this information may be obtained, upon payment of a duplicating fee, by electronic request at the following e-mail address: publicinfo@sec.gov or by writing the Public Reference Section at the above address.
FURTHER INFORMATION
From time to time, MFS may post important information about the fund or the MFS funds on the MFS web site (mfs.com). This information is available by visiting the “News & Commentary” section of mfs.com or by clicking on the fund’s name under “Variable Insurance Portfolios — VIT II” in the “Products and Performance” section of mfs.com.
MFS Technology Portfolio
MFS® PRIVACY NOTICE
Privacy is a concern for every investor today. At MFS Investment Management® and the MFS funds, we take this concern very seriously. We want you to understand our policies about the investment products and services that we offer, and how we protect the nonpublic personal information of investors who have a direct relationship with us and our wholly owned subsidiaries.
Throughout our business relationship, you provide us with personal information. We maintain information and records about you, your investments, and the services you use. Examples of the nonpublic personal information we maintain include
| | Ÿ | | data from investment applications and other forms |
| | Ÿ | | share balances and transactional history with us, our affiliates, or others |
| | Ÿ | | facts from a consumer reporting agency |
We do not disclose any nonpublic personal information about our customers or former customers to anyone, except as permitted by law. We may share nonpublic personal information with third parties or certain of our affiliates in connection with servicing your account or processing your transactions. We may share information with companies or financial institutions that perform marketing services on our behalf or with other financial institutions with which we have joint marketing arrangements, subject to any legal requirements.
Authorization to access your nonpublic personal information is limited to appropriate personnel who provide products, services, or information to you. We maintain physical, electronic, and procedural safeguards to help protect the personal information we collect about you.
If you have any questions about the MFS privacy policy, please call 1-800-225-2606 any business day.
Note: If you own MFS products or receive MFS services in the name of a third party such as a bank or broker-dealer, their privacy policy may apply to you instead of ours.
29


MFS® EMERGING MARKETS EQUITY PORTFOLIO
The report is prepared for the general information of contract owners. It is authorized for distribution to prospective investors only when preceded or accompanied by a current prospectus.
NOT FDIC INSURED Ÿ MAY LOSE VALUE Ÿ NO BANK GUARANTEE Ÿ NOT A DEPOSIT Ÿ NOT INSURED BY ANY FEDERAL GOVERNMENT AGENCY OR NCUA/NCUSIF
MFS Emerging Markets Equity Portfolio
LETTER FROM THE CEO

Dear Contract Owners:
After an extended rebound in the financial markets, uncertainty returned in 2010 as investors began to question the durability of the recovery for global economies and markets. That uncertainty led to increased risk aversion, especially as investors saw the eurozone struggle with the debt woes of many of its members. In September, the U.S. Federal Reserve Board’s promises to further loosen monetary policy helped assuage market fears and drive asset prices off their recent lows. A combination of solid earnings and improving economic data gave an additional boost to investor sentiment. As we enter 2011, we are cautiously optimistic that economic growth will continue to improve and that the global economies will recover from the shocks of the past few years. We expect the pace of recovery worldwide will be uneven and volatile.
As always, we continue to be mindful of the many economic challenges faced at the local, national, and international levels. It is in times such as these that we want to remind investors of the merits of maintaining a long-term view, adhering to basic investing principles such as asset allocation and diversification, and working closely with their advisors to research and identify appropriate investment opportunities.
Respectfully,

Robert J. Manning
Chairman and Chief Executive Officer
MFS Investment Management®
February 14, 2011
The opinions expressed in this letter are subject to change, may not be relied upon for investment advice, and no forecasts can be guaranteed.
1
MFS Emerging Markets Equity Portfolio
PORTFOLIO COMPOSITION
Portfolio structure

| | | | |
| Top ten holdings | | | | |
| Samsung Electronics Co. Ltd. | | | 4.2% | |
| Infosys Technologies Ltd., ADR | | | 2.5% | |
| Vale S.A., ADR | | | 2.4% | |
| Taiwan Semiconductor Manufacturing Co. Ltd. | | | 2.2% | |
| Petroleo Brasileiro S.A., ADR | | | 2.0% | |
| China Construction Bank | | | 1.9% | |
| MTN Group Ltd. | | | 1.8% | |
| HTC Corp. | | | 1.7% | |
| OAO Gazprom, ADR | | | 1.7% | |
| Turkiye Garanti Bankasi A.S. | | | 1.6% | |
| | | | |
| Equity sectors | | | | |
| Financial Services | | | 23.3% | |
| Technology | | | 13.4% | |
| Energy | | | 10.6% | |
| Basic Materials | | | 10.4% | |
| Utilities & Communications | | | 9.0% | |
| Retailing | | | 8.4% | |
| Special Products & Services | | | 6.8% | |
| Consumer Staples | | | 4.3% | |
| Autos & Housing | | | 3.8% | |
| Leisure | | | 3.7% | |
| Health Care | | | 3.5% | |
| Industrial Goods & Services | | | 1.7% | |
| Transportation | | | 0.8% | |
| | | | |
| Issuer country weightings | | | | |
| Brazil | | | 16.4% | |
| China | | | 11.5% | |
| South Korea | | | 11.3% | |
| Taiwan | | | 8.8% | |
| India | | | 8.5% | |
| South Africa | | | 8.2% | |
| Mexico | | | 6.4% | |
| Hong Kong | | | 6.3% | |
| Russia | | | 5.4% | |
| Other Countries | | | 17.2% | |
Percentages are based on net assets as of 12/31/10.
The portfolio is actively managed and current holdings may be different.
2
MFS Emerging Markets Equity Portfolio
MANAGEMENT REVIEW
Summary of Results
For the twelve months ended December 31, 2010, Initial Class shares of the MFS Emerging Markets Equity Portfolio (the “fund”) provided a total return of 23.82%, while Service Class shares of the fund provided a total return of 23.54%. These compare with a return of 19.20% for the fund’s benchmark, the Morgan Stanley Capital International (MSCI) Emerging Markets Index.
Market Environment
The first quarter of the reporting period witnessed a continuation of the financial market and macroeconomic rebounds that had begun in early 2009. These recoveries in global activity and asset valuations were generally synchronized around the world, led importantly by emerging Asian economies, but broadening to include most of the global economy to varying degrees. Primary drivers of the recoveries included an unwinding of the inventory destocking that took place earlier, the production of manufacturing and capital goods, as well as massive fiscal and monetary stimulus.
During most of the remainder of the period, heightened risk surrounding the public-debt profiles of several of the peripheral European countries impaired market sentiment. At the same time, the improving trend in global macroeconomic data began to weaken somewhat. These two dynamics caused many asset prices to retrench significantly, as many questioned the durability of the global recovery.
Towards the end of the period, the U.S. Federal Reserve led markets to believe that further monetary loosening would be forthcoming if macroeconomic activity did not show signs of improvement. The prospects for more easing by the Fed improved market sentiment and drove risk-asset prices markedly higher. However, in a text-book case of “buy the rumor, sell the fact,” the weeks following the early November announcement of further quantitative easing saw a sell-off in U.S. Treasury bonds. This rise in Treasury yields occurred despite risk-off behavior in equities and credit markets (which would normally result in Treasury yield compression), and appears to have been the result of a few factors: signs of improved U.S. and global economic activity; opposition to quantitative easing from some quarters; and crowded long positions in U.S. Treasuries. The December agreement on an expansionary U.S. fiscal package also boosted sentiment, leading markets to reach near-term highs in risky asset valuations toward year end.
Contributors to Performance
Stock selection in the technology sector boosted performance relative to the MSCI Emerging Markets Index. The fund’s overweight position in electronics maker HTC Corp. (Taiwan) aided results as this stock significantly outperformed the benchmark over the reporting period. Shares of HTC were propelled by the company’s success in the smartphone market, particularly as the largest vendor of smartphones based on Google’s Android operating system.
A combination of stock selection and an overweight position in the retailing sector was another positive. Holdings of strong-performing department stores operator Lewis Group (b) (South Africa) and export trading company Li & Fung (b) (Hong Kong) benefited relative returns.
Stock selection in the utilities & communications and financial services sectors also bolstered results. Within the utilities & communications sector, holdings of telecommunications company XL Axiata (b) (Indonesia) were among the fund’s top contributors. Within the financial services sector, it was the timing of our ownership in insurance company China Life Insurance (h), and not holding poor-performing financial services firm Industrial and Commercial Bank of China, that helped relative results.
Securities in other sectors that aided relative returns included over-the-counter pharmaceutical and personal care products manufacturer Genomma Lab Internacional (b) (Mexico), investment management company First Pacific (b) (Hong Kong), oil and gas exploration and production company PTT PLC (b) (Thailand), and technology consulting firm Infosys (India). Shares of First Pacific rose on the announcement that Indonesia’s biggest instant noodle maker, PT Indofood CBP Sukses Makmur, submitted an application for separate listing from its parent company on the Indonesia Stock Exchange. First Pacific owns a 50.1% stake in the parent company. Additionally, First Pacific launched a share buy-back program, which was also positive for the stock.
Detractors from Performance
Stock selection and an underweight position in the basic materials sector detracted from relative performance. An overweight position in steel manufacturer Steel Authority of India held back results. Shares of the company were negatively impacted by the Indian government’s approval of selling its stake in the company.
3
MFS Emerging Markets Equity Portfolio
Management Review – continued
Top relative detractors in other sectors included generic drug manufacturer Teva Pharmaceuticals (Israel), insurance company China Pacific Insurance Group, brake, steering, and suspension systems developer Mando (South Korea), natural gas producer Gazprom (Russia), coal producer China Shenhua Energy, and semiconductor assembly and testing company Siliconware Precision Industries (Taiwan). Shares of Gazprom fell as investors responded negatively to a report speculating that Gazprom’s dominant market share in the European natural gas market might narrow in the long term, based upon competitive pressures. Not holding strong-performing shipbuilder Hyundai Heavy Industries (South Korea), and the timing of our ownership in semiconductor manufacturer Taiwan Semiconductor, also held back relative results.
The fund’s cash position was another detractor from relative performance. The fund holds cash to buy new holdings and to provide liquidity. In a period when equity markets rose, as measured by the fund’s benchmark, holding cash hurt performance versus the benchmark, which has no cash position.
Respectfully,
| | |
| Jose Luis Garcia | | Robert Lau |
| Portfolio Manager | | Portfolio Manager |
Note to Contract Owners: Effective April 7, 2010, Nicholas Smithie is no longer a co-manager of the fund.
| (b) | Security is not a benchmark constituent. |
| (h) | Security was not held in the portfolio at period end. |
The views expressed in this report are those of the portfolio managers only through the end of the period of the report as stated on the cover and do not necessarily reflect the views of MFS or any other person in the MFS organization. These views are subject to change at any time based on market or other conditions, and MFS disclaims any responsibility to update such views. These views may not be relied upon as investment advice or an indication of trading intent on behalf of any MFS portfolio. References to specific securities are not recommendations of such securities, and may not be representative of any MFS portfolio’s current or future investments.
4
MFS Emerging Markets Equity Portfolio
PERFORMANCE SUMMARY THROUGH 12/31/10
The following chart illustrates the historical performance of the fund in comparison to its benchmark(s). Benchmarks are unmanaged and may not be invested in directly. Benchmark returns do not reflect any fees or expenses. The performance of other share classes will be greater than or less than that of the class depicted below. (See Notes to Performance Summary.)
Performance data shown represents past performance and is no guarantee of future results. Investment return and principal value fluctuate so your units, when sold, may be worth more or less than the original cost; current performance may be lower or higher than quoted. The performance shown does not reflect the deduction of taxes, if any, that a contract holder would pay on fund distributions or the redemption of contract units. The returns for the fund shown also do not reflect the deduction of expenses associated with variable products, such as mortality and expense risk charges, separate account charges, and sales charges imposed by the insurance company separate accounts. Such expenses would reduce the overall returns shown.
Growth of a Hypothetical $10,000 Investment
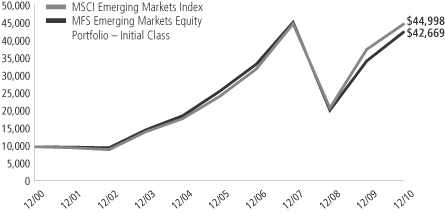
Total Returns through 12/31/10
Average annual total returns
| | | | | | | | | | | | | | |
| | | Share class | | Class inception date | | 1-yr | | 5-yr | | 10-yr | | Life (t) | | |
| | | Initial Class | | 6/05/96 | | 23.82% | | 10.60% | | 15.61% | | N/A | | |
| | | Service Class | | 8/24/01 | | 23.54% | | 10.34% | | N/A | | 17.26% | | |
| | | | | |
| Comparative benchmark | | | | | | | | | | |
| | | MSCI Emerging Markets Index (f) | | 19.20% | | 13.11% | | 16.23% | | N/A | | |
| (f) | Source: FactSet Research Systems Inc. |
| (t) | For the period from the class inception date through the stated period end (for those share classes with less than 10 years of performance history). No comparative benchmark performance information is provided for “life” periods. (See Notes to Performance Summary.) |
Benchmark Definition
MSCI Emerging Markets Index – a market capitalization-weighted index that is designed to measure equity market performance in the global emerging markets.
It is not possible to invest directly in an index.
Notes to Performance Summary
Average annual total return represents the average annual change in value for each share class for the periods presented. Life returns are presented where the share class has less than 10 years of performance history and represent the average annual total return from the class inception date to the stated period end date. As the fund’s share classes may have different inception dates, the life returns may represent different time periods and may not be comparable. As a result, no comparative benchmark performance information is provided for life periods.
Performance results reflect any applicable expense subsidies and waivers in effect during the periods shown. Without such subsidies and waivers the fund’s performance results would be less favorable. Please see the prospectus and financial statements for complete details. All results are historical and assume the reinvestment of any dividends and capital gains distributions.
From time to time the fund may receive proceeds from litigation settlements, without which performance would be lower.
5
MFS Emerging Markets Equity Portfolio
EXPENSE TABLE
Fund Expenses Borne by the Contract Holders During the Period, July 1, 2010 through December 31, 2010
As a contract holder of the fund, you incur ongoing costs, including management fees; distribution and/or service (12b-1) fees; and other fund expenses. This example is intended to help you understand your ongoing costs (in dollars) of investing in the fund and to compare these costs with the ongoing costs of investing in other mutual funds.
The example is based on an investment of $1,000 invested at the beginning of the period and held for the entire period July 1, 2010 through December 31, 2010.
Actual Expenses
The first line for each share class in the following table provides information about actual account values and actual expenses. You may use the information in this line, together with the amount you invested, to estimate the expenses that you paid over the period. Simply divide your account value by $1,000 (for example, an $8,600 account value divided by $1,000 = 8.6), then multiply the result by the number in the first line under the heading entitled “Expenses Paid During Period” to estimate the expenses you paid on your account during this period.
Hypothetical Example for Comparison Purposes
The second line for each share class in the following table provides information about hypothetical account values and hypothetical expenses based on the fund’s actual expense ratio and an assumed rate of return of 5% per year before expenses, which is not the fund’s actual return. The hypothetical account values and expenses may not be used to estimate the actual ending account balance or expenses you paid for the period. You may use this information to compare the ongoing costs of investing in the fund and other funds. To do so, compare this 5% hypothetical example with the 5% hypothetical examples that appear in the shareholder reports of the other funds.
Please note that the expenses shown in the table are meant to highlight the fund’s ongoing costs only and do not take into account the fees and expenses imposed under the variable contracts through which your investment in the fund is made. Therefore, the second line for each share class in the table is useful in comparing ongoing costs associated with an investment in vehicles (such as the fund) which fund benefits under variable annuity and variable life insurance contracts and to qualified pension and retirement plans only, and will not help you determine the relative total costs of investing in the fund through variable annuity and variable life insurance contracts. If the fees and expenses imposed under the variable contracts were included, your costs would have been higher.
| | | | | | | | | | | | | | | | | | |
| Share Class | | | | Annualized Expense Ratio | | | Beginning Account Value 7/01/10 | | | Ending Account Value
12/31/10 | | | Expenses Paid During Period (p) 7/01/10-12/31/10 | |
| Initial Class | | Actual | | | 1.40% | | | | $1,000.00 | | | | $1,289.11 | | | | $8.08 | |
| | Hypothetical (h) | | | 1.40% | | | | $1,000.00 | | | | $1,018.15 | | | | $7.12 | |
| Service Class | | Actual | | | 1.65% | | | | $1,000.00 | | | | $1,287.59 | | | | $9.51 | |
| | Hypothetical (h) | | | 1.65% | | | | $1,000.00 | | | | $1,016.89 | | | | $8.39 | |
| (h) | 5% class return per year before expenses. |
| (p) | Expenses paid is equal to each class’ annualized expense ratio, as shown above, multiplied by the average account value over the period, multiplied by the number of days in the period, divided by the number of days in the year. |
6
MFS Emerging Markets Equity Portfolio
PORTFOLIO OF INVESTMENTS – 12/31/10
The Portfolio of Investments is a complete list of all securities owned by your fund. It is categorized by broad-based asset classes.
| | | | | | | | |
| Issuer | | Shares/Par | | | Value ($) | |
| | | | | | | | |
| COMMON STOCKS – 99.7% | | | | | | | | |
| Airlines – 0.8% | | | | | |
| Copa Holdings S.A., “A” | | | 6,717 | | | $ | 395,228 | |
Grupo Aeroportuario del Sureste S.A.
de C.V., ADR | | | 12,960 | | | | 731,592 | |
| | | | | | | | |
| | | | | | $ | 1,126,820 | |
| | | | | | | | |
| Alcoholic Beverages – 0.7% | | | | | |
| Companhia de Bebidas das Americas, ADR | | | 31,165 | | | $ | 967,050 | |
| | | | | | | | |
| Apparel Manufacturers – 2.6% | | | | | |
| Cia.Hering S.A. | | | 42,100 | | | $ | 684,759 | |
| Li & Fung Ltd. | | | 292,000 | | | | 1,694,267 | |
| Stella International Holdings | | | 601,500 | | | | 1,199,471 | |
| | | | | | | | |
| | | | | | $ | 3,578,497 | |
| | | | | | | | |
| Automotive – 1.2% | | | | | |
| Mando Corp. (a) | | | 14,030 | | | $ | 1,611,907 | |
| | | | | | | | |
| Broadcasting – 0.5% | | | | | |
| Grupo Televisa S.A., ADR (a) | | | 25,606 | | | $ | 663,964 | |
| | | | | | | | |
| Brokerage & Asset Managers – 1.7% | | | | | | | | |
| BM&F Bovespa S.A. | | | 90,500 | | | $ | 715,822 | |
| Bolsa Mexicana de Valores S.A. de C.V. | | | 173,800 | | | | 365,332 | |
CETIP S.A. – Balcao Organizado de
Ativos e Derivativos | | | 40,000 | | | | 568,675 | |
| Hong Kong Exchanges & Clearing Ltd. | | | 30,200 | | | | 684,986 | |
| | | | | | | | |
| | | | | | $ | 2,334,815 | |
| | | | | | | | |
| Business Services – 4.2% | | | | | |
| Cielo S.A. | | | 70,490 | | | $ | 571,139 | |
| Infosys Technologies Ltd., ADR | | | 44,609 | | | | 3,393,853 | |
| Kroton Educacional S.A., IEU (a) | | | 59,496 | | | | 783,125 | |
| LPS Brasil – Consultoria de Imoveis S.A. | | | 25,800 | | | | 606,145 | |
| Redecard S.A. | | | 32,900 | | | | 417,196 | |
| | | | | | | | |
| | | | | | $ | 5,771,458 | |
| | | | | | | | |
| Cable TV – 1.5% | | | | | |
| Naspers Ltd. | | | 34,222 | | | $ | 2,015,397 | |
| | | | | | | | |
| Computer Software – 0.3% | | | | | |
| Totvs S.A. | | | 4,100 | | | $ | 417,410 | |
| | | | | | | | |
| Computer Software – Systems – 2.7% | | | | | |
| Acer, Inc. | | | 492,947 | | | $ | 1,523,315 | |
| Hon Hai Precision Industry Co. Ltd. | | | 391,960 | | | | 1,579,589 | |
| NICE Systems Ltd., ADR (a) | | | 18,260 | | | | 637,274 | |
| | | | | | | | |
| | | | | | $ | 3,740,178 | |
| | | | | | | | |
| Conglomerates – 1.9% | | | | | |
| Alfa S.A de C.V., “A” | | | 69,890 | | | $ | 703,993 | |
| First Pacific Co. Ltd. | | | 2,118,800 | | | | 1,908,141 | |
| | | | | | | | |
| | | | | | $ | 2,612,134 | |
| | | | | | | | |
| Construction – 2.6% | | | | | |
| Anhui Conch Cement Co. Ltd. | | | 374,000 | | | $ | 1,753,847 | |
| Corporacion GEO S.A.B. de C.V., “B” (a) | | | 115,970 | | | | 425,192 | |
| Corporacion Moctezuma S.A. de C.V. | | | 189,200 | | | | 471,085 | |
| | | | | | | | |
| Issuer | | Shares/Par | | | Value ($) | |
| | | | | | | | |
| COMMON STOCKS – continued | |
| Construction – continued | | | | | |
| Duratex S.A. | | | 32,689 | | | $ | 351,505 | |
| Urbi Desarrollos Urbanos S.A. de C.V. (a) | | | 225,979 | | | | 530,456 | |
| | | | | | | | |
| | | | | | $ | 3,532,085 | |
| | | | | | | | |
| Consumer Products – 1.9% | | | | | |
| Dabur India Ltd. | | | 651,758 | | | $ | 1,461,226 | |
| Hengan International Group Co. Ltd. | | | 105,000 | | | | 905,755 | |
| Kimberly-Clark de Mexico S.A. de C.V., “A” | | | 39,470 | | | | 242,029 | |
| | | | | | | | |
| | | | | | $ | 2,609,010 | |
| | | | | | | | |
| Consumer Services – 0.7% | | | | | |
| Anhanguera Educacional Participacoes S.A. | | | 37,100 | | | $ | 893,976 | |
| | | | | | | | |
| Electronics – 8.5% | | | | | |
| Samsung Electronics Co. Ltd. | | | 6,820 | | | $ | 5,702,864 | |
| Seoul Semiconductor Co. Ltd. (a) | | | 16,492 | | | | 588,177 | |
| Siliconware Precision Industries Co. Ltd. | | | 1,597,000 | | | | 1,917,068 | |
| Taiwan Semiconductor Manufacturing Co. Ltd. | | | 1,220,258 | | | | 2,971,492 | |
| Taiwan Semiconductor Manufacturing Co. Ltd., ADR | | | 28,271 | | | | 354,518 | |
| | | | | | | | |
| | | | | | $ | 11,534,119 | |
| | | | | | | | |
| Energy – Independent – 5.5% | | | | | |
| Bankers Petroleum Ltd. (a) | | | 97,965 | | | $ | 748,802 | |
| China Shenhua Energy Co. Ltd. | | | 249,500 | | | | 1,046,431 | |
| CNOOC Ltd. | | | 671,000 | | | | 1,591,864 | |
| INPEX Corp. | | | 157 | | | | 919,491 | |
| PTT Exploration & Production Ltd. | | | 127,400 | | | | 710,008 | |
| Reliance Industries Ltd. | | | 68,235 | | | | 1,615,574 | |
| Turkiye Petrol Rafinerileri AS | | | 32,682 | | | | 817,050 | |
| | | | | | | | |
| | | | | | $ | 7,449,220 | |
| | | | | | | | |
| Energy – Integrated – 4.8% | | | | | |
| LUKOIL, ADR | | | 27,123 | | | $ | 1,551,978 | |
| OAO Gazprom, ADR | | | 91,622 | | | | 2,313,456 | |
| Petroleo Brasileiro S.A., ADR | | | 71,982 | | | | 2,723,799 | |
| | | | | | | | |
| | | | | | $ | 6,589,233 | |
| | | | | | | | |
| Food & Beverages – 1.0% | | | | | |
| Grupo Continental S.A. | | | 201,905 | | | $ | 575,470 | |
| Tiger Brands Ltd. | | | 26,213 | | | | 770,493 | |
| | | | | | | | |
| | | | | | $ | 1,345,963 | |
| | | | | | | | |
| Food & Drug Stores – 1.1% | | | | | |
| Dairy Farm International Holdings Ltd. | | | 69,300 | | | $ | 643,797 | |
| Shoprite Group PLC | | | 58,611 | | | | 886,616 | |
| | | | | | | | |
| | | | | | $ | 1,530,413 | |
| | | | | | | | |
| Forest & Paper Products – 0.2% | | | | | |
| Suzano Papel E Celulose S.A., IPS | | | 27,275 | | | $ | 242,846 | |
| | | | | | | | |
7
MFS Emerging Markets Equity Portfolio
Portfolio of Investments – continued
| | | | | | | | |
| Issuer | | Shares/Par | | | Value ($) | |
| | | | | | | | |
| COMMON STOCKS – continued | |
| Gaming & Lodging – 1.7% | | | | | |
| Genting Berhad | | | 131,300 | | | $ | 476,061 | |
| Sands China Ltd. (a) | | | 863,600 | | | | 1,897,680 | |
| | | | | | | | |
| | | | | | $ | 2,373,741 | |
| | | | | | | | |
| General Merchandise – 2.4% | | | | | |
| Bim Birlesik Magazalar A.S. | | | 33,080 | | | $ | 1,124,806 | |
| Shinsegae Co. Ltd. (a) | | | 3,846 | | | | 2,080,751 | |
| | | | | | | | |
| | | | | | $ | 3,205,557 | |
| | | | | | | | |
| Insurance – 3.1% | | | | | |
| Brazil Insurance Participacoes e Administracao S.A. (a) | | | 1,000 | | | $ | 1,192,771 | |
| China Pacific Insurance Co. Ltd. | | | 432,800 | | | | 1,798,508 | |
| Samsung Fire & Marine Insurance Co. Ltd. | | | 6,082 | | | | 1,205,789 | |
| | | | | | | | |
| | | | | | $ | 4,197,068 | |
| | | | | | | | |
| Internet – 0.2% | | | | | |
| Universo Online S.A., IPS | | | 37,700 | | | $ | 301,373 | |
| | | | | | | | |
| Machinery & Tools – 1.7% | | | | | |
| Beml Ltd. | | | 17,361 | | | $ | 400,780 | |
| Sinotruk Hong Kong Ltd. | | | 895,000 | | | | 922,312 | |
| TK Corp. (a) | | | 42,267 | | | | 992,524 | |
| | | | | | | | |
| | | | | | $ | 2,315,616 | |
| | | | | | | | |
| Major Banks – 3.5% | | | | | |
| Bank of China Ltd. | | | 2,913,000 | | | $ | 1,536,551 | |
| Erste Group Bank AG | | | 19,973 | | | | 937,884 | |
| Standard Chartered PLC | | | 61,543 | | | | 1,676,977 | |
| Standard Chartered PLC | | | 25,300 | | | | 680,627 | |
| | | | | | | | |
| | | | | | $ | 4,832,039 | |
| | | | | | | | |
| Medical & Health Technology & Services – 1.7% | | | | | |
| Diagnosticos da America S.A. | | | 84,200 | | | $ | 1,141,265 | |
| Fleury S.A. | | | 73,700 | | | | 1,183,196 | |
| | | | | | | | |
| | | | | | $ | 2,324,461 | |
| | | | | | | | |
| Metals & Mining – 7.4% | | | | | |
| Grupo Mexico S.A.B. de C.V., “B” | | | 166,542 | | | $ | 682,215 | |
| Maanshan Iron & Steel Co. Ltd. | | | 844,000 | | | | 449,537 | |
| Magnitogorsk Iron & Steel Works, GDR | | | 53,650 | | | | 780,608 | |
| Mining & Metallurgical Co. Norilsk Nickel, ADR | | | 47,250 | | | | 1,118,408 | |
| MOIL Ltd. (a) | | | 1,608 | | | | 16,172 | |
| Novolipetsk Steel, GDR | | | 19,050 | | | | 908,685 | |
| POSCO | | | 1,570 | | | | 672,384 | |
| Steel Authority of India Ltd. | | | 371,237 | | | | 1,515,168 | |
| Ternium S.A., ADR | | | 10,780 | | | | 457,180 | |
| Usinas Siderurgicas de Minas Gerais S.A., IPS | | | 27,350 | | | | 315,678 | |
| Vale S.A., ADR | | | 93,558 | | | | 3,234,300 | |
| | | | | | | | |
| | | | | | $ | 10,150,335 | |
| | | | | | | | |
| Network & Telecom – 1.7% | | | | | |
| HTC Corp. | | | 75,813 | | | $ | 2,340,188 | |
| | | | | | | | |
| Oil Services – 0.3% | | | | | |
| Tenaris S.A., ADR | | | 9,359 | | | $ | 458,404 | |
| | | | | | | | |
| | | | | | | | |
| Issuer | | Shares/Par | | | Value ($) | |
| | | | | | | | |
| COMMON STOCKS – continued | |
| Other Banks & Diversified Financials – 13.3% | | | | | |
| Banco Santander Chile, ADR | | | 3,280 | | | $ | 306,582 | |
| Banco Santander S.A., IEU | | | 60,700 | | | | 824,569 | |
| Bancolombia S.A., ADR | | | 5,081 | | | | 314,565 | |
| Bank Negara Indonesia PT | | | 211,000 | | | | 90,746 | |
| China Construction Bank (a) | | | 2,827,670 | | | | 2,535,619 | |
| China Merchants Bank Co. Ltd. | | | 72,031 | | | | 181,820 | |
| Commercial International Bank, GDR | | | 143,800 | | | | 1,200,730 | |
| Compartamos S.A.B. de C.V. (a) | | | 158,800 | | | | 345,245 | |
| Credicorp Ltd. | | | 4,240 | | | | 504,178 | |
| CSU Cardsystem S.A. | | | 166,905 | | | | 679,685 | |
| Hana Financial Group, Inc. | | | 40,970 | | | | 1,563,134 | |
| Housing Development Finance Corp. Ltd. | | | 129,472 | | | | 2,108,933 | |
| ICICI Bank Ltd. | | | 44,682 | | | | 1,144,255 | |
| Itau Unibanco Multiplo S.A., ADR | | | 26,362 | | | | 632,952 | |
| Komercni Banka A.S. | | | 5,013 | | | | 1,186,245 | |
| Public Bank Berhad | | | 9,842 | | | | 41,558 | |
| Public Bank Berhad | | | 524,000 | | | | 2,209,178 | |
| Turkiye Garanti Bankasi A.S. | | | 438,932 | | | | 2,223,088 | |
| | | | | | | | |
| | | | | | $ | 18,093,082 | |
| | | | | | | | |
| Pharmaceuticals – 1.8% | | | | | |
| Genomma Lab Internacional S.A., “B” (a) | | | 294,700 | | | $ | 705,371 | |
| Teva Pharmaceutical Industries Ltd., ADR | | | 33,710 | | | | 1,757,302 | |
| | | | | | | | |
| | | | | | $ | 2,462,673 | |
| | | | | | | | |
| Precious Metals & Minerals – 1.5% | | | | | |
| Anglo American Platinum Corp. Ltd. (a) | | | 10,246 | | | $ | 1,079,629 | |
| Gold Fields Ltd. | | | 49,118 | | | | 899,223 | |
| | | | | | | | |
| | | | | | $ | 1,978,852 | |
| | | | | | | | |
| Real Estate – 1.7% | | | | | |
| Brasil Brokers Participacoes | | | 159,900 | | | $ | 919,907 | |
| China Overseas Land & Investment Ltd. | | | 424,000 | | | | 784,417 | |
| Hang Lung Properties Ltd. | | | 135,000 | | | | 631,336 | |
| | | | | | | | |
| | | | | | $ | 2,335,660 | |
| | | | | | | | |
| Specialty Chemicals – 1.3% | | | | | |
| Formosa Plastics Corp. | | | 390,000 | | | $ | 1,304,169 | |
| Mexichem S.A.B de C.V. | | | 116,800 | | | | 418,116 | |
| | | | | | | | |
| | | | | | $ | 1,722,285 | |
| | | | | | | | |
| Specialty Stores – 2.3% | | | | | |
| Lewis Group Ltd. | | | 94,660 | | | $ | 1,168,108 | |
| Truworths International Ltd. | | | 179,083 | | | | 1,947,825 | |
| | | | | | | | |
| | | | | | $ | 3,115,933 | |
| | | | | | | | |
| Telecommunications – Wireless – 4.8% | | | | | |
| America Movil S.A.B. de C.V., “L”, ADR | | | 33,677 | | | $ | 1,931,038 | |
| China Mobile Ltd. | | | 97,000 | | | | 963,411 | |
| Mobile TeleSystems OJSC, ADR | | | 34,412 | | | | 718,178 | |
| MTN Group Ltd. | | | 117,560 | | | | 2,398,849 | |
| Vivo Participacoes S.A., ADR | | | 15,216 | | | | 495,889 | |
| | | | | | | | |
| | | | | | $ | 6,507,365 | |
| | | | | | | | |
8
MFS Emerging Markets Equity Portfolio
Portfolio of Investments – continued
| | | | | | | | |
| Issuer | | Shares/Par | | | Value ($) | |
| | | | | | | | |
| COMMON STOCKS – continued | |
| Telephone Services – 2.4% | | | | | |
| China Unicom Ltd., ADR | | | 84,610 | | | $ | 1,205,693 | |
Empresa Nacional de
Telecomunicaciones S.A. | | | 18,125 | | | | 316,839 | |
| PT XL Axiata Tbk (a) | | | 3,016,500 | | | | 1,774,412 | |
| | | | | | | | |
| | | | | | $ | 3,296,944 | |
| | | | | | | | |
| Tobacco – 0.7% | | | | | | | | |
| KT&G Corp. (a) | | | 16,733 | | | $ | 964,458 | |
| | | | | | | | |
| Utilities – Electric Power – 1.8% | | | | | | | | |
| CPFL Energia S.A. | | | 11,700 | | | $ | 290,386 | |
| Eletropaulo Metropolitana S.A.,IPS | | | 27,120 | | | | 524,592 | |
| Enersis S.A., ADR | | | 14,262 | | | | 331,164 | |
| Equatorial Energia S.A. | | | 24,800 | | | | 170,313 | |
| Manila Water Co., Inc. | | | 1,384,000 | | | | 605,915 | |
| Tractebel Energia S.A. | | | 30,880 | | | | 510,636 | |
| | | | | | | | |
| | | | | | $ | 2,433,006 | |
| | | | | | | | |
Total Common Stocks
(Identified Cost, $105,759,208) | | | | | | $ | 135,975,535 | |
| | | | | | | | |
| | | | | | | | |
| Issuer | | Shares/Par | | | Value ($) | |
| | | | | | | | |
|
| MONEY MARKET FUNDS (v) – 0.5% | |
| MFS Institutional Money Market Portfolio, 0.18%, at Cost and Net Asset Value | | | 717,813 | | | $ | 717,813 | |
| | | | | | | | |
Total Investments
(Identified Cost, $106,477,021) | | | | | | $ | 136,693,348 | |
| | | | | | | | |
OTHER ASSETS, LESS
LIABILITIES – (0.2)% | | | | | | | (231,400 | ) |
| | | | | | | | |
| Net Assets – 100.0% | | | | | | $ | 136,461,948 | |
| | | | | | | | |
| (a) | | Non-income producing security. |
| (v) | | Underlying fund that is available only to investment companies managed by MFS. The rate quoted is the annualized seven-day yield of the fund at period end. |
The following abbreviations are used in this report and are defined:
| ADR | | American Depository Receipt |
| GDR | | Global Depository Receipt |
| IEU | | International Equity Unit |
| IPS | | International Preference Stock |
| PLC | | Public Limited Company |
See Notes to Financial Statements
9
MFS Emerging Markets Equity Portfolio
FINANCIAL STATEMENTS | STATEMENT OF ASSETS AND LIABILITIES
This statement represents your fund’s balance sheet, which details the assets and liabilities comprising the total value of the fund.
| | | | | | | | |
At 12/31/10 | | | | | | | | |
Assets | | | | | | | | |
Investments – | | | | | | | | |
Non-affiliated issuers, at value (identified cost, $105,759,208) | | | $135,975,535 | | | | | |
Underlying funds, at cost and value | | | 717,813 | | | | | |
Total investments, at value (identified cost, $106,477,021) | | | $136,693,348 | | | | | |
Cash | | | 38,690 | | | | | |
Foreign currency, at value (identified cost, $18) | | | 19 | | | | | |
Receivables for | | | | | | | | |
Fund shares sold | | | 228,764 | | | | | |
Interest and dividends | | | 120,264 | | | | | |
Other assets | | | 4,155 | | | | | |
Total assets | | | | | | | $137,085,240 | |
Liabilities | | | | | | | | |
Payable for fund shares reacquired | | | $279,911 | | | | | |
Payable to affiliates | | | | | | | | |
Investment adviser | | | 47,172 | | | | | |
Shareholder servicing costs | | | 70 | | | | | |
Distribution and/or service fees | | | 503 | | | | | |
Administrative services fee | | | 273 | | | | | |
Payable for Trustees’ compensation | | | 30 | | | | | |
Deferred country tax expense payable | | | 141,432 | | | | | |
Accrued expenses and other liabilities | | | 153,901 | | | | | |
Total liabilities | | | | | | | $623,292 | |
Net assets | | | | | | | $136,461,948 | |
Net assets consist of | | | | | | | | |
Paid-in capital | | | $100,272,807 | | | | | |
Unrealized appreciation (depreciation) on investments and translation of assets and liabilities in foreign currencies
(net of $141,432 deferred country tax) | | | 30,075,712 | | | | | |
Accumulated net realized gain (loss) on investments and foreign currency transactions | | | 5,469,629 | | | | | |
Undistributed net investment income | | | 643,800 | | | | | |
Net assets | | | | | | | $136,461,948 | |
Shares of beneficial interest outstanding | | | | | | | 7,661,593 | |
| | | | | | | | | | | | |
| | | Net assets | | | Shares
outstanding | | | Net asset value
per share | |
Initial Class | | | $99,315,985 | | | | 5,555,351 | | | | $17.88 | |
Service Class | | | 37,145,963 | | | | 2,106,242 | | | | 17.64 | |
See Notes to Financial Statements
10
MFS Emerging Markets Equity Portfolio
FINANCIAL STATEMENTS | STATEMENT OF OPERATIONS
This statement describes how much your fund earned in investment income and accrued in expenses. It also describes any gains and/or losses generated by fund operations.
| | | | | | | | |
Year ended 12/31/10 | | | | | | | | |
Net investment income | | | | | | | | |
Income | | | | | | | | |
Dividends | | | $2,739,335 | | | | | |
Dividends from underlying funds | | | 2,965 | | | | | |
Interest | | | 98 | | | | | |
Foreign taxes withheld | | | (250,619 | ) | | | | |
Total investment income | | | | | | | $2,491,779 | |
Expenses | | | | | | | | |
Management fee | | | $1,154,947 | | | | | |
Distribution and/or service fees | | | 72,962 | | | | | |
Shareholder servicing costs | | | 12,675 | | | | | |
Administrative services fee | | | 40,980 | | | | | |
Trustees’ compensation | | | 12,899 | | | | | |
Custodian fee | | | 369,038 | | | | | |
Shareholder communications | | | 17,188 | | | | | |
Auditing fees | | | 64,119 | | | | | |
Legal fees | | | 7,129 | | | | | |
Miscellaneous | | | 22,126 | | | | | |
Total expenses | | | | | | | $1,774,063 | |
Fees paid indirectly | | | (12 | ) | | | | |
Reduction of expenses by investment adviser | | | (159,367 | ) | | | | |
Net expenses | | | | | | | $1,614,684 | |
Net investment income | | | | | | | $877,095 | |
Realized and unrealized gain (loss) on investments and foreign currency transactions | | | | | | | | |
Realized gain (loss) (identified cost basis) | | | | | | | | |
Investment transactions (net of $80,835 country tax) | | | $11,291,961 | | | | | |
Foreign currency transactions | | | (143,810 | ) | | | | |
Net realized gain (loss) on investments and foreign currency transactions | | | | | | | $11,148,151 | |
Change in unrealized appreciation (depreciation) | | | | | | | | |
Investments (net of $95,376 decrease in deferred country tax) | | | $13,171,484 | | | | | |
Translation of assets and liabilities in foreign currencies | | | 1,194 | | | | | |
Net unrealized gain (loss) on investments and foreign currency translation | | | | | | | $13,172,678 | |
Net realized and unrealized gain (loss) on investments and foreign currency | | | | | | | $24,320,829 | |
Change in net assets from operations | | | | | | | $25,197,924 | |
See Notes to Financial Statements
11
MFS Emerging Markets Equity Portfolio
FINANCIAL STATEMENTS | STATEMENTS OF CHANGES IN NET ASSETS
These statements describe the increases and/or decreases in net assets resulting from operations, any distributions, and any shareholder transactions.
| | | | | | | | |
For years ended 12/31 | | | 2010 | | | | 2009 | |
Change in net assets | | | | | | | | |
From operations | | | | | | | | |
Net investment income | | | $877,095 | | | | $762,267 | |
Net realized gain (loss) on investments and foreign currency transactions | | | 11,148,151 | | | | 148,329 | |
Net unrealized gain (loss) on investments and foreign currency translation | | | 13,172,678 | | | | 32,679,399 | |
Change in net assets from operations | | | $25,197,924 | | | | $33,589,995 | |
Distributions declared to shareholders | | | | | | | | |
From net investment income | | | $(710,049 | ) | | | $(1,343,322 | ) |
Change in net assets from fund share transactions | | | $15,585,410 | | | | $21,389,378 | |
Total change in net assets | | | $40,073,285 | | | | $53,636,051 | |
Net assets | | | | | | | | |
At beginning of period | | | 96,388,663 | | | | 42,752,612 | |
At end of period (including undistributed net investment income of $643,800 and
$701,399, respectively) | | | $136,461,948 | | | | $96,388,663 | |
See Notes to Financial Statements
12
MFS Emerging Markets Equity Portfolio
FINANCIAL STATEMENTS | FINANCIAL HIGHLIGHTS
The financial highlights table is intended to help you understand the fund’s financial performance for the past 5 years. Certain information reflects financial results for a single fund share. The total returns in the table represent the rate by which an investor would have earned (or lost) on an investment in the fund share class (assuming reinvestment of all distributions) held for the entire period.
| | | | | | | | | | | | | | | | | | | | |
| Initial Class | | Years ended 12/31 | |
| | | 2010 | | | 2009 | | | 2008 | | | 2007 | | | 2006 | |
Net asset value, beginning of period | | | $14.54 | | | | $8.88 | | | | $26.15 | | | | $24.52 | | | | $21.84 | |
| Income (loss) from investment operations | | | | | | | | | | | | | | | | | | | | |
Net investment income (d) | | | $0.13 | | | | $0.14 | | | | $0.33 | | | | $0.30 | | | | $0.47 | |
Net realized and unrealized gain (loss) on investments and foreign currency | | | 3.31 | | | | 5.80 | | | | (11.19 | ) | | | 7.13 | | | | 5.92 | |
Total from investment operations | | | $3.44 | | | | $5.94 | | | | $(10.86 | ) | | | $7.43 | | | | $6.39 | |
| Less distributions declared to shareholders | | | | | | | | | | | | | | | | | | | | |
From net investment income | | | $(0.10 | ) | | | $(0.28 | ) | | | $(0.27 | ) | | | $(0.55 | ) | | | $(0.25 | ) |
From net realized gain on investments | | | — | | | | — | | | | (6.14 | ) | | | (5.25 | ) | | | (3.46 | ) |
Total distributions declared to shareholders | | | $(0.10 | ) | | | $(0.28 | ) | | | $(6.41 | ) | | | $(5.80 | ) | | | $(3.71 | ) |
Net asset value, end of period | | | $17.88 | | | | $14.54 | | | | $8.88 | | | | $26.15 | | | | $24.52 | |
Total return (%) (k)(r)(s) | | | 23.82 | | | | 68.58 | | | | (55.11 | ) | | | 35.71 | | | | 30.16 | |
Ratios (%) (to average net assets)
and Supplemental data: | | | | | | | | | | | | | | | | | | | | |
Expenses before expense reductions (f) | | | 1.55 | | | | 1.71 | | | | 1.85 | | | | 1.55 | | | | 1.53 | |
Expenses after expense reductions (f) | | | 1.40 | | | | 1.40 | | | | 1.61 | | | | N/A | | | | N/A | |
Net investment income | | | 0.86 | | | | 1.24 | | | | 1.94 | | | | 1.22 | | | | 2.08 | |
Portfolio turnover | | | 39 | | | | 66 | | | | 93 | | | | 96 | | | | 110 | |
Net assets at end of period (000 omitted) | | | $99,316 | | | | $71,026 | | | | $33,411 | | | | $94,193 | | | | $89,419 | |
| |
| Service Class | | Years ended 12/31 | |
| | | 2010 | | | 2009 | | | 2008 | | | 2007 | | | 2006 | |
Net asset value, beginning of period | | | $14.36 | | | | $8.76 | | | | $25.88 | | | | $24.33 | | | | $21.71 | |
| Income (loss) from investment operations | | | | | | | | | | | | | | | | | | | | |
Net investment income (d) | | | $0.09 | | | | $0.11 | | | | $0.29 | | | | $0.23 | | | | $0.41 | |
Net realized and unrealized gain (loss) on investments and foreign currency | | | 3.28 | | | | 5.73 | | | | (11.06 | ) | | | 7.07 | | | | 5.89 | |
Total from investment operations | | | $3.37 | | | | $5.84 | | | | $(10.77 | ) | | | $7.30 | | | | $6.30 | |
| Less distributions declared to shareholders | | | | | | | | | | | | | | | | | | | | |
From net investment income | | | $(0.09 | ) | | | $(0.24 | ) | | | $(0.21 | ) | | | $(0.50 | ) | | | $(0.22 | ) |
From net realized gain on investments | | | — | | | | — | | | | (6.14 | ) | | | (5.25 | ) | | | (3.46 | ) |
Total distributions declared to shareholders | | | $(0.09 | ) | | | $(0.24 | ) | | | $(6.35 | ) | | | $(5.75 | ) | | | $(3.68 | ) |
Net asset value, end of period | | | $17.64 | | | | $14.36 | | | | $8.76 | | | | $25.88 | | | | $24.33 | |
Total return (%) (k)(r)(s) | | | 23.54 | | | | 68.13 | | | | (55.23 | ) | | | 35.38 | | | | 29.90 | |
Ratios (%) (to average net assets)
and Supplemental data: | | | | | | | | | | | | | | | | | | | | |
Expenses before expense reductions (f) | | | 1.80 | | | | 1.95 | | | | 2.10 | | | | 1.81 | | | | 1.78 | |
Expenses after expense reductions (f) | | | 1.65 | | | | 1.65 | | | | 1.86 | | | | N/A | | | | N/A | |
Net investment income | | | 0.62 | | | | 0.93 | | | | 1.70 | | | | 0.96 | | | | 1.84 | |
Portfolio turnover | | | 39 | | | | 66 | | | | 93 | | | | 96 | | | | 110 | |
Net assets at end of period (000 omitted) | | | $37,146 | | | | $25,363 | | | | $9,342 | | | | $23,614 | | | | $19,176 | |
| (d) | Per share data is based on average shares outstanding. |
| (f) | Ratios do not reflect reductions from fees paid indirectly, if applicable. |
| (k) | The total return does not reflect expenses that apply to separate accounts. Inclusion of these charges would reduce the total return figures for all periods shown. |
| (r) | Certain expenses have been reduced without which performance would have been lower. |
| (s) | From time to time the fund may receive proceeds from litigation settlements, without which performance would be lower. |
See Notes to Financial Statements
13
MFS Emerging Markets Equity Portfolio
NOTES TO FINANCIAL STATEMENTS
| (1) | | Business and Organization |
MFS Emerging Markets Equity Portfolio (the fund) is a series of MFS Variable Insurance Trust II (the trust). The trust is organized as a Massachusetts business trust and is registered under the Investment Company Act of 1940, as amended, as an open-end management investment company. The shareholders of each series of the trust are separate accounts of insurance companies, which offer variable annuity and/or life insurance products, and qualified retirement and pension plans.
| (2) | | Significant Accounting Policies |
General – The preparation of financial statements in conformity with U.S. generally accepted accounting principles requires management to make estimates and assumptions that affect the reported amounts of assets and liabilities, and disclosure of contingent assets and liabilities at the date of the financial statements and the reported amounts of revenues and expenses during the reporting period. Actual results could differ from those estimates. In the preparation of these financial statements, management has evaluated subsequent events occurring after the date of the fund’s Statement of Assets and Liabilities through the date that the financial statements were issued. The fund invests in foreign securities, including securities of emerging market issuers. Investments in foreign securities are vulnerable to the effects of changes in the relative values of the local currency and the U.S. dollar and to the effects of changes in each country’s legal, political, and economic environment. The markets of emerging markets countries are generally more volatile than the markets of developed countries with more mature economies. All of the risks of investing in foreign securities previously described are heightened when investing in emerging markets countries.
Investment Valuations – Equity securities, including restricted equity securities, are generally valued at the last sale or official closing price as provided by a third-party pricing service on the market or exchange on which they are primarily traded. Equity securities, for which there were no sales reported that day, are generally valued at the last quoted daily bid quotation as provided by a third-party pricing service on the market or exchange on which such securities are primarily traded. Equity securities held short, for which there were no sales reported for that day, are generally valued at the last quoted daily ask quotation as provided by a third-party pricing service on the market or exchange on which such securities are primarily traded. Short-term instruments with a maturity at issuance of 60 days or less generally are valued at amortized cost, which approximates market value. Open-end investment companies are generally valued at net asset value per share. Securities and other assets generally valued on the basis of information from a third-party pricing service may also be valued at a broker/dealer bid quotation. Values obtained from third-party pricing services can utilize both transaction data and market information such as yield, quality, coupon rate, maturity, type of issue, trading characteristics, and other market data. The values of foreign securities and other assets and liabilities expressed in foreign currencies are converted to U.S. dollars using the mean of bid and asked prices for rates provided by a third-party pricing service.
The Board of Trustees has delegated primary responsibility for determining or causing to be determined the value of the fund’s investments (including any fair valuation) to the adviser pursuant to valuation policies and procedures approved by the Board. If the adviser determines that reliable market quotations are not readily available, investments are valued at fair value as determined in good faith by the adviser in accordance with such procedures under the oversight of the Board of Trustees. Under the fund’s valuation policies and procedures, market quotations are not considered to be readily available for most types of debt instruments and floating rate loans and many types of derivatives. These investments are generally valued at fair value based on information from third-party pricing services. In addition, investments may be valued at fair value if the adviser determines that an investment’s value has been materially effected by events occurring after the close of the exchange or market on which the investment is principally traded (such as foreign exchange or market) and prior to the determination of the fund’s net asset value, or after the halting of trading of a specific security where trading does not resume prior to the close of the exchange or market on which the security is principally traded. Events that occur on a frequent basis after foreign markets close (such as developments in foreign markets and significant movements in the U.S. markets) and prior to the determination of the fund’s net asset value may be deemed to have a material effect on the value of securities traded in foreign markets. Accordingly, the fund’s foreign equity securities may often be valued at fair value. The adviser generally relies on third-party pricing services or other information (such as the correlation with price movements of similar securities in the same or other markets; the type, cost and investment characteristics of the security; the business and financial condition of the issuer; and trading and other market data) to assist in determining whether to fair value and at what value to fair value an investment. The value of an investment for purposes of calculating the fund’s net asset value can differ depending on the source and method used to determine value. When fair valuation is used, the value of an investment used to determine the fund’s net asset value may differ from quoted or published prices for the same investment. There can be no assurance that the fund could obtain the fair value assigned to an investment if it were to sell the investment at the same time at which the fund determines its net asset value per share.
14
MFS Emerging Markets Equity Portfolio
Notes to Financial Statements – continued
Various inputs are used in determining the value of the fund’s assets or liabilities. These inputs are categorized into three broad levels. In certain cases, the inputs used to measure fair value may fall into different levels of the fair value hierarchy. In such cases, an investment’s level within the fair value hierarchy is based on the lowest level of input that is significant to the fair value measurement. The fund’s assessment of the significance of a particular input to the fair value measurement in its entirety requires judgment, and considers factors specific to the investment. Level 1 includes unadjusted quoted prices in active markets for identical assets or liabilities. Level 2 includes other significant observable market-based inputs (including quoted prices for similar securities, interest rates, prepayment speed, and credit risk). Level 3 includes unobservable inputs, which may include the adviser’s own assumptions in determining the fair value of investments. The following is a summary of the levels used as of December 31, 2010 in valuing the fund’s assets or liabilities:
| | | | | | | | | | | | | | | | |
| Investments at Value | | Level 1 | | | Level 2 | | | Level 3 | | | Total | |
| Equity Securities: | | | | | | | | | | | | | | | | |
Brazil | | | $22,360,959 | | | | $— | | | | $— | | | | $22,360,959 | |
China | | | 15,675,764 | | | | — | | | | — | | | | 15,675,764 | |
South Korea | | | 11,545,062 | | | | 3,836,926 | | | | — | | | | 15,381,988 | |
Taiwan | | | 11,990,340 | | | | — | | | | — | | | | 11,990,340 | |
India | | | 11,655,960 | | | | — | | | | — | | | | 11,655,960 | |
South Africa | | | 11,166,140 | | | | — | | | | — | | | | 11,166,140 | |
Mexico | | | 8,791,100 | | | | — | | | | — | | | | 8,791,100 | |
Hong Kong | | | 8,659,679 | | | | — | | | | — | | | | 8,659,679 | |
Russia | | | 7,391,312 | | | | — | | | | — | | | | 7,391,312 | |
Other Countries | | | 22,192,285 | | | | 710,008 | | | | — | | | | 22,902,293 | |
| Mutual Funds | | | 717,813 | | | | — | | | | — | | | | 717,813 | |
| Total Investments | | | $132,146,414 | | | | $4,546,934 | | | | $— | | | | $136,693,348 | |
For further information regarding security characteristics, see the Portfolio of Investments.
Of the level 1 investments presented above, equity investments amounting to $62,928,430 were considered level 2 investments at the beginning of the period. The primary reason for changes in the classifications between levels 1 and 2 occurs when foreign equity securities are fair valued using other observable market-based inputs in place of the closing exchange price due to events occurring after the close of the exchange or market on which the investment is principally traded. The fund’s foreign equity securities may often be valued at fair value.
Foreign Currency Translation – Purchases and sales of foreign investments, income, and expenses are converted into U.S. dollars based upon currency exchange rates prevailing on the respective dates of such transactions or on the reporting date for foreign denominated receivables and payables. Gains and losses attributable to foreign currency exchange rates on sales of securities are recorded for financial statement purposes as net realized gains and losses on investments. Gains and losses attributable to foreign exchange rate movements on receivables, payables, income and expenses are recorded for financial statement purposes as foreign currency transaction gains and losses. That portion of both realized and unrealized gains and losses on investments that results from fluctuations in foreign currency exchange rates is not separately disclosed.
Indemnifications – Under the fund’s organizational documents, its officers and Trustees may be indemnified against certain liabilities and expenses arising out of the performance of their duties to the fund. Additionally, in the normal course of business, the fund enters into agreements with service providers that may contain indemnification clauses. The fund’s maximum exposure under these agreements is unknown as this would involve future claims that may be made against the fund that have not yet occurred.
Investment Transactions and Income – Investment transactions are recorded on the trade date. Interest income is recorded on the accrual basis. Dividends received in cash are recorded on the ex-dividend date. Certain dividends from foreign securities will be recorded when the fund is informed of the dividend if such information is obtained subsequent to the ex-dividend date. Dividend and interest payments received in additional securities are recorded on the ex-dividend or ex-interest date in an amount equal to the value of the security on such date.
The fund may receive proceeds from litigation settlements. Any proceeds received from litigation involving portfolio holdings are reflected in the Statement of Operations in realized gain/loss if the security has been disposed of by the fund or in unrealized gain/loss if the security is still held by the fund. Any other proceeds from litigation not related to portfolio holdings are reflected as other income in the Statement of Operations.
Fees Paid Indirectly – The fund’s custody fee may be reduced according to an arrangement that measures the value of cash deposited with the custodian by the fund. This amount, for the year ended December 31, 2010, is shown as a reduction of total expenses on the Statement of Operations.
15
MFS Emerging Markets Equity Portfolio
Notes to Financial Statements – continued
Tax Matters and Distributions – The fund intends to qualify as a regulated investment company, as defined under Subchapter M of the Internal Revenue Code, and to distribute all of its taxable income, including realized capital gains. As a result, no provision for federal income tax is required. The fund’s federal tax returns for the prior three fiscal years remain subject to examination by the Internal Revenue Service. Foreign taxes, if any, have been accrued by the fund in the accompanying financial statements.
Distributions to shareholders are recorded on the ex-dividend date. Income and capital gain distributions are determined in accordance with income tax regulations, which may differ from U.S. generally accepted accounting principles. Certain capital accounts in the financial statements are periodically adjusted for permanent differences in order to reflect their tax character. These adjustments have no impact on net assets or net asset value per share. Temporary differences which arise from recognizing certain items of income, expense, gain or loss in different periods for financial statement and tax purposes will reverse at some time in the future. Distributions in excess of net investment income or net realized gains are temporary overdistributions for financial statement purposes resulting from differences in the recognition or classification of income or distributions for financial statement and tax purposes.
Book/tax differences primarily relate to wash sale loss deferrals.
The tax character of distributions declared to shareholders for the last two fiscal years is as follows:
| | | | | | | | |
| | | 12/31/10 | | | 12/31/09 | |
| Ordinary income (including any short-term capital gains) | | | $710,049 | | | | $1,343,322 | |
The federal tax cost and the tax basis components of distributable earnings were as follows:
| | | | |
| As of 12/31/10 | | | | |
| Cost of investments | | | $106,633,721 | |
| Gross appreciation | | | 33,121,553 | |
| Gross depreciation | | | (3,061,926 | ) |
| Net unrealized appreciation (depreciation) | | | $30,059,627 | |
| Undistributed ordinary income | | | 809,278 | |
| Undistributed long-term capital gain | | | 5,478,139 | |
| Other temporary differences | | | (157,903 | ) |
Multiple Classes of Shares of Beneficial Interest – The fund offers multiple classes of shares, which differ in their respective distribution and/or service fees. The fund’s income, realized and unrealized gain (loss), and common expenses are allocated to shareholders based on the daily net assets of each class. Dividends are declared separately for each class. Differences in per share dividend rates are generally due to differences in separate class expenses. The fund’s distributions declared to shareholders as reported on the Statements of Changes in Net Assets are presented by class as follows:
| | | | | | | | |
| | | From net investment
income | |
| | | Year ended
12/31/10 | | | Year ended
12/31/09 | |
| Initial Class | | | $542,071 | | | | $1,089,057 | |
| Service Class | | | 167,978 | | | | 254,265 | |
| Total | | | $710,049 | | | | $1,343,322 | |
| (3) | | Transactions with Affiliates |
Investment Adviser – The fund has an investment advisory agreement with MFS to provide overall investment management and related administrative services and facilities to the fund.
The management fee is computed daily and paid monthly at the following annual rates:
| | | | |
| First $500 million of average daily net assets | | | 1.05% | |
| Average daily net assets in excess of $500 million | | | 1.00% | |
The management fee incurred for the year ended December 31, 2010 was equivalent to an annual effective rate of 1.05% of the fund’s average daily net assets.
The investment adviser has agreed in writing to pay a portion of the fund’s total annual operating expenses, exclusive of interest, taxes, extraordinary expenses, brokerage and transaction costs, and investment-related expenses, such that total annual operating expenses do not exceed 1.40% of average daily net assets for the Initial Class shares and 1.65% of average daily net assets for the Service Class shares. This written agreement will continue until April 30, 2012. For the year ended December 31, 2010, this reduction amounted to $159,367 and is reflected as a reduction of total expenses in the Statement of Operations.
16
MFS Emerging Markets Equity Portfolio
Notes to Financial Statements – continued
Distributor – MFS Fund Distributors, Inc. (MFD), a wholly-owned subsidiary of MFS, is the distributor of shares of the fund. The Trustees have adopted a distribution plan for the Service Class shares pursuant to Rule 12b-1 under the Investment Company Act of 1940.
The fund’s distribution plan provides that the fund will pay MFD distribution and/or service fees equal to 0.25% per annum of its average daily net assets attributable to Service Class shares as partial consideration for services performed and expenses incurred by MFD and financial intermediaries (including participating insurance companies that invest in the fund to fund variable annuity and variable life insurance contracts, sponsors of qualified retirement and pension plans that invest in the fund, and affiliates of these participating insurance companies and plan sponsors) in connection with the sale and distribution of the Service Class shares. MFD may subsequently pay all, or a portion, of the distribution and/or service fees to financial intermediaries.
Shareholder Servicing Agent – MFS Service Center, Inc. (MFSC), a wholly-owned subsidiary of MFS, receives a fee from the fund for its services as shareholder servicing agent. For the year ended December 31, 2010, the fee was $12,651, which equated to 0.0115% annually of the fund’s average daily net assets. MFSC also receives payment from the fund for out-of-pocket expenses paid by MFSC on behalf of the fund. For the year ended December 31, 2010, these costs amounted to $24.
Administrator – MFS provides certain financial, legal, shareholder communications, compliance, and other administrative services to the fund. Under an administrative services agreement, the fund partially reimburses MFS the costs incurred to provide these services. The fund is charged an annual fixed amount of $10,000 plus a fee based on average daily net assets. The administrative services fee incurred for the year ended December 31, 2010 was equivalent to an annual effective rate of 0.0372% of the fund’s average daily net assets.
Trustees’ and Officers’ Compensation – The fund pays compensation to Trustees in the form of a retainer, attendance fees, and additional compensation to the Board chairperson. The fund does not pay compensation directly to officers of the fund who are also officers of the investment adviser, all of whom receive remuneration for their services to the fund from MFS. Certain officers of the fund are officers or directors of MFS, MFD, and MFSC.
Other – This fund and certain other funds managed by MFS (the funds) have entered into services agreements (the Agreements) which provide for payment of fees by the funds to Tarantino LLC and Griffin Compliance LLC in return for the provision of services of an Independent Chief Compliance Officer (ICCO) and Assistant ICCO, respectively, for the funds. The ICCO and Assistant ICCO are officers of the funds and the sole members of Tarantino LLC and Griffin Compliance LLC, respectively. The funds can terminate the Agreements with Tarantino LLC and Griffin Compliance LLC at any time under the terms of the Agreements. MFS has agreed to bear all expenses associated with office space, other administrative support, and supplies provided to the ICCO and Assistant ICCO. For the year ended December 31, 2010, the aggregate fees paid by the fund to Tarantino LLC and Griffin Compliance LLC were $1,866 and are included in miscellaneous expense on the Statement of Operations.
The fund invests in the MFS Institutional Money Market Portfolio which is managed by MFS and seeks a high level of current income consistent with preservation of capital and liquidity. Income earned on this investment is included in dividends from underlying funds on the Statement of Operations. This money market fund does not pay a management fee to MFS.
Purchases and sales of investments, other than U.S. Government securities, purchased option transactions, and short-term obligations, aggregated $58,299,698 and $42,676,993, respectively.
17
MFS Emerging Markets Equity Portfolio
Notes to Financial Statements – continued
| (5) | Shares of Beneficial Interest |
The fund’s Declaration of Trust permits the Trustees to issue an unlimited number of full and fractional shares of beneficial interest. Transactions in fund shares were as follows:
| | | | | | | | | | | | | | | | |
| | | Year ended 12/31/10 | | | Year ended 12/31/09 | |
| | | Shares | | | Amount | | | Shares | | | Amount | |
| Shares sold | | | | | | | | | | | | | | | | |
Initial Class | | | 1,292,090 | | | | $19,587,990 | | | | 1,866,216 | | | | $21,305,823 | |
Service Class | | | 1,105,275 | | | | 16,898,112 | | | | 1,017,919 | | | | 12,438,640 | |
| | | 2,397,365 | | | | $36,486,102 | | | | 2,884,135 | | | | $33,744,463 | |
| Shares issued to shareholders in reinvestment of distributions | | | | | | | | | | | | | | | | |
Initial Class | | | 35,546 | | | | $542,071 | | | | 115,122 | | | | $1,089,057 | |
Service Class | | | 11,147 | | | | 167,978 | | | | 27,165 | | | | 254,265 | |
| | | 46,693 | | | | $710,049 | | | | 142,287 | | | | $1,343,322 | |
| Shares reacquired | | | | | | | | | | | | | | | | |
Initial Class | | | (657,613 | ) | | | $(9,982,626 | ) | | | (857,701 | ) | | | $(9,580,199 | ) |
Service Class | | | (776,271 | ) | | | (11,628,115 | ) | | | (345,148 | ) | | | (4,118,208 | ) |
| | | (1,433,884 | ) | | | $(21,610,741 | ) | | | (1,202,849 | ) | | | $(13,698,407 | ) |
| Net change | | | | | | | | | | | | | | | | |
Initial Class | | | 670,023 | | | | $10,147,435 | | | | 1,123,637 | | | | $12,814,681 | |
Service Class | | | 340,151 | | | | 5,437,975 | | | | 699,936 | | | | 8,574,697 | |
| | | 1,010,174 | | | | $15,585,410 | | | | 1,823,573 | | | | $21,389,378 | |
The fund and certain other funds managed by MFS participate in a $1.1 billion unsecured committed line of credit, subject to a $1 billion sublimit, provided by a syndication of banks under a credit agreement. Borrowings may be made for temporary financing needs. Interest is charged to each fund, based on its borrowings, generally at a rate equal to the higher of the Federal Reserve funds rate or one month LIBOR plus an agreed upon spread. A commitment fee, based on the average daily, unused portion of the committed line of credit, is allocated among the participating funds at the end of each calendar quarter. In addition, the fund and other funds managed by MFS have established unsecured uncommitted borrowing arrangements with certain banks for temporary financing needs. Interest is charged to each fund, based on its borrowings, at a rate equal to the Federal Reserve funds rate plus an agreed upon spread. For the year ended December 31, 2010, the fund’s commitment fee and interest expense were $1,209 and $0, respectively, and are included in miscellaneous expense on the Statement of Operations.
| (7) | Transactions in Underlying Funds – Affiliated Issuers |
An affiliated issuer may be considered one in which the fund owns 5% or more of the outstanding voting securities, or a company which is under common control. For the purposes of this report, the fund assumes the following to be affiliated issuers:
| | | | | | | | | | | | | | |
| Underlying Funds | | Beginning
Shares/Par
Amount | | Acquisitions
Shares/Par
Amount | | | Dispositions
Shares/Par
Amount | | | Ending
Shares/Par
Amount | |
| MFS Institutional Money Market Portfolio | | 1,151,778 | | | 37,085,973 | | | | (37,519,938 | ) | | | 717,813 | |
| | | | |
| Underlying Funds | | Realized
Gain (Loss) | | Capital Gain
Distributions | | | Dividend
Income | | | Ending
Value | |
| MFS Institutional Money Market Portfolio | | $— | | | $— | | | | $2,965 | | | | $717,813 | |
18
MFS Emerging Markets Equity Portfolio
REPORT OF INDEPENDENT REGISTERED PUBLIC ACCOUNTING FIRM
To the Board of Trustees of MFS Variable Insurance Trust II and the Shareholders of
MFS Emerging Markets Equity Portfolio:
We have audited the accompanying statement of assets and liabilities, including the portfolio of investments, of MFS Emerging Markets Equity Portfolio (the “Fund”) (one of the portfolios comprising MFS Variable Insurance Trust II) as of December 31, 2010, and the related statement of operations for the year then ended, the statements of changes in net assets for each of the two years in the period then ended, and the financial highlights for each of the five years in the period then ended. These financial statements and financial highlights are the responsibility of the Fund’s management. Our responsibility is to express an opinion on these financial statements and financial highlights based on our audits.
We conducted our audits in accordance with the standards of the Public Company Accounting Oversight Board (United States). Those standards require that we plan and perform the audit to obtain reasonable assurance about whether the financial statements and financial highlights are free of material misstatement. The Fund is not required to have, nor were we engaged to perform, an audit of its internal control over financial reporting. Our audits included consideration of internal control over financial reporting as a basis for designing audit procedures that are appropriate in the circumstances, but not for the purpose of expressing an opinion on the effectiveness of the Fund’s internal control over financial reporting. Accordingly, we express no such opinion. An audit also includes examining, on a test basis, evidence supporting the amounts and disclosures in the financial statements, assessing the accounting principles used and significant estimates made by management, as well as evaluating the overall financial statement presentation. Our procedures included confirmation of securities owned as of December 31, 2010, by correspondence with the custodian and brokers; where replies were not received from brokers, we performed other auditing procedures. We believe that our audits provide a reasonable basis for our opinion.
In our opinion, the financial statements and financial highlights referred to above present fairly, in all material respects, the financial position of MFS Emerging Markets Equity Portfolio as of December 31, 2010, the results of its operations for the year then ended, the changes in its net assets for each of the two years in the period then ended, and the financial highlights for each of the five years in the period then ended, in conformity with accounting principles generally accepted in the United States of America.
DELOITTE & TOUCHE LLP
Boston, Massachusetts
February 14, 2011
19
MFS Emerging Markets Equity Portfolio
TRUSTEES AND OFFICERS – IDENTIFICATION AND BACKGROUND
The Trustees and officers of the Trust, as of February 1, 2011, are listed below, together with their principal occupations during the past five years. (Their titles may have varied during that period.) The address of each Trustee and officer is 500 Boylston Street, Boston, Massachusetts 02116.
| | | | | | |
Name, Date of Birth | | Position(s) Held
with Fund | | Trustee/Officer
Since (1) | | Principal Occupations During the Past Five Years and
Other Directorships (2) |
| INTERESTED TRUSTEE | | | | |
David D. Horn (3) (born 6/07/41) | | Trustee | | April 1986 | | Private investor; Sun Life Assurance Company of Canada, Senior Vice President and General Manager for the United States (until 1997); Director (until March 2004) |
| | |
| INDEPENDENT TRUSTEES | | | | |
J. Kermit Birchfield (born 1/08/40) | | Chairman | | May 1997 | | Consultant; Century Partners, Inc. (investments), Director; Displaytech, Inc. (technology), Chairman; Dessin Fournir LLC (furniture manufacturer), Director; Site Watch LLC (software to monitor oil tanks), Managing Director (2006 to present); Juridica Investments (fund investing in judicial matters), Director (2007 to present), Immuno Science, Inc. (medical research), Independent Director (2009 to present), Intermountain Industries, Inc. (oil & gas exploration and production), Director (until February 2009) |
| | | |
Robert C. Bishop (born 1/13/43) | | Trustee | | May 2001 | | AutoImmune, Inc. (pharmaceutical product development), Chairman, President and Chief Executive Officer; Caliper Life Sciences Corp. (laboratory analytical instruments), Chairman; Optobionics Corporation (ophthalmic devices), Director (until 2007); Millipore Corporation (purification/filtration products), Director (until July 2010); Waterstreet Capital (leverage buyouts), Advisory Board (until August 2010) |
| | | |
Frederick H. Dulles (born 3/12/42) | | Trustee | | May 2001 | | Dulles International Law LLC (law firm), Senior Lawyer (since 2009); Juridica Capital Management (US) Inc. (litigation financing), Vice President and General Counsel (since 2009); Dulles Properties LLC (real estate), Broker (since 2008); The Citadel School of Business Administration (education), Adjunct Professor (since 2003); Disher, Hamrick & Myers Residential, Inc. (real estate), Broker (until 2006); Frederick H. Dulles Law Practice (law firm), (until 2006); Charlestown School of Law (education), Adjunct Professor (until 2007); Prudential Carolina Real Estate, (real estate), Broker (until 2008); Free Enterprise Foundation Inc. (research institute), Director & Secretary (until 2008); Ten State International Law PLLP (law firm), Of Counsel (until 2009) |
| | | |
Marcia A. Kean (born 6/30/48) | | Trustee | | April 2005 | | Feinstein Kean Healthcare (consulting), Chief Executive Officer |
| | | |
Ronald G. Steinhart (born 6/15/40) | | Trustee | | May 2001 | | Private investor; Penske Automotive Group (automotive retailer), Director; Animal Health International, Inc. (animal health products), Director (since 2007); Texas Industries (concrete/aggregates/cement), Director (since 2007); Susser Holdings Corporation (retail convenience stores and distributor of wholesale motor fuel), Director (since 2009); Prentiss Properties Trust (real estate investment trust), Director (until 2006); Penson Worldwide, Inc. (securities clearance), Director (until 2008) |
| | | |
Haviland Wright (born 7/21/48) | | Trustee | | May 2001 | | X-Change Corp. (multi-media web services), Director (since 2010); Nano Loa Inc. (liquid crystal displays), Director (until 2009); Profitability of Hawaii (software), Chief Development Officer (until 2010); Elixir Technologies Corporation (software), Director (until 2010) |
| | | |
| OFFICERS | | | | | | |
Maria F. DiOrioDwyer (4)
(born 12/01/58) | | President | | November 2005 | | Massachusetts Financial Services Company, Executive Vice President and Chief Regulatory Officer; Chief Compliance Officer (since December 2006) |
| | | |
| Christopher R. Bohane (4) (born 1/18/74) | | Assistant Secretary and Assistant Clerk | | July 2005 | | Massachusetts Financial Services Company, Vice President and Senior Counsel |
| | | |
John M. Corcoran (4) (born 4/13/65) | | Treasurer | | October 2008 | | Massachusetts Financial Services Company, Senior Vice President (since October 2008); State Street Bank and Trust (financial services provider), Senior Vice President, (until September 2008) |
| | | |
Ethan D. Corey (4) (born 11/21/63) | | Assistant Secretary and Assistant Clerk | | July 2005 | | Massachusetts Financial Services Company, Senior Vice President and Associate General Counsel |
| | | |
David L. DiLorenzo (4) (born 8/10/68) | | Assistant Treasurer | | July 2005 | | Massachusetts Financial Services Company, Vice President |
| | | |
Timothy M. Fagan (4) (born 7/10/68) | | Assistant Secretary and Assistant Clerk | | September 2005 | | Massachusetts Financial Services Company, Vice President and Senior Counsel |
| | | |
Mark D. Fischer (4) (born 10/27/70) | | Assistant Treasurer | | July 2005 | | Massachusetts Financial Services Company, Vice President |
20
MFS Emerging Markets Equity Portfolio
Trustees and Officers – continued
| | | | | | |
Name, Date of Birth | | Position(s) Held
with Fund | | Trustee/Officer
Since (1) | | Principal Occupations During the Past Five Years and
Other Directorships (2) |
Robyn L. Griffin (born 7/04/75) | | Assistant Independent Chief Compliance Officer | | August 2008 | | Griffin Compliance LLC (provider of compliance services), Principal (since August 2008); State Street Corporation (financial services provider), Mutual Fund Administration Assistant Vice President (October 2006 – July 2008); Liberty Mutual Group (insurance), Personal Market Assistant Controller (April 2006 – October 2006); Deloitte & Touche LLP (professional services firm), Senior Manager (prior to April 2006) |
| | | |
Brian E. Langenfeld (4) (born 3/07/73) | | Assistant Secretary and Assistant Clerk | | May 2006 | | Massachusetts Financial Services Company, Vice President and Senior Counsel (since May 2006); John Hancock Advisers, LLC, Assistant Vice President and Counsel (until April 2006) |
| | | |
Ellen Moynihan (4) (born 11/13/57) | | Assistant Treasurer | | May 1997 | | Massachusetts Financial Services Company, Senior Vice President |
| | | |
Susan S. Newton (4) (born 3/07/50) | | Assistant Secretary and Assistant Clerk | | May 2005 | | Massachusetts Financial Services Company, Senior Vice President and Associate General Counsel |
| | | |
Susan A. Pereira (4)
(born 11/05/70) | | Assistant Secretary and Assistant Clerk | | July 2005 | | Massachusetts Financial Services Company, Vice President and Senior Counsel |
| | | |
Mark N. Polebaum (4) (born 5/01/52) | | Secretary and Clerk | | February 2006 | | Massachusetts Financial Services Company, Executive Vice President, General Counsel and Secretary (since January 2006); Wilmer Cutler Pickering Hale and Dorr LLP (law firm), Partner (until January 2006) |
| | | |
Frank L. Tarantino (born 3/07/44) | | Independent Chief Compliance Officer | | September 2004 | | Tarantino LLC (provider of compliance services), Principal |
| | | |
Richard S. Weitzel (4) (born 7/16/70) | | Assistant Secretary and Assistant Clerk | | October 2007 | | Massachusetts Financial Services Company, Vice President and Assistant General Counsel |
| | | |
James O. Yost (4) (born 6/12/60) | | Assistant Treasurer | | April 1992 | | Massachusetts Financial Services Company, Senior Vice President |
| (1) | Date first appointed to serve as Trustee/Officer of an MFS fund or a Compass variable account. Each Trustee has served continuously since appointment. For the period March 2008 until October 2008, Ms. DiOrioDwyer served as Treasurer of the Funds. |
| (2) | Directorships or trusteeships of companies required to report to the Securities and Exchange Commission (i.e., “public companies”). |
| (3) | “Interested person” of the Trust, within the meaning of the Investment Company Act of 1940 (referred to as the 1940 Act), which is the principal federal law governing investment companies like the Trust, as a result of position with Sun Life of Canada (U.S.). The address of Sun Life of Canada (U.S.) is One Sun Life Executive Park, Wellesley Hills, Massachusetts 02481. |
| (4) | “Interested person” of MFS within the meaning of the 1940 Act. The address of MFS is 500 Boylston Street, Boston, Massachusetts 02116. |
The Trust does not hold annual meetings for the purpose of electing Trustees, and Trustees are not elected for fixed terms. Each Trustee and officer holds office until his or her successor is chosen and qualified, or until his or her earlier death, resignation, retirement or removal.
All Trustees currently serve as Trustees of the Trust and have served in that capacity since originally elected or appointed. All of the Trustees are also Managers of the Compass Variable Accounts. The executive officers of the Trust hold similar offices for the Compass Variable Accounts and other funds in the MFS fund complex. As of January 1, 2011, each Trustee serves as a Trustee or Manager of 31 Accounts/Portfolios.
21
MFS Emerging Markets Equity Portfolio
Trustees and Officers – continued
The Statement of Additional Information contains further information about the Trustees and is available without charge upon request by calling 1-800-752-7215.
| | |
Investment Adviser
Massachusetts Financial Services Company 500 Boylston Street, Boston, MA 02116-3741 | | Custodian State Street Bank and Trust 1 Lincoln Street, Boston, MA 02111-2900 |
Distributor
MFS Fund Distributors, Inc. 500 Boylston Street, Boston, MA 02116-3741 | | Independent Registered Public Accounting Firm Deloitte & Touche LLP 200 Berkeley Street, Boston, MA 02116 |
Portfolio Managers Jose Luis Garcia Robert Lau | | |
22
MFS Emerging Markets Equity Portfolio
BOARD REVIEW OF INVESTMENT ADVISORY AGREEMENT
The Investment Company Act of 1940 requires that both the full Board of Trustees and a majority of the non-interested (“independent”) Trustees, voting separately, annually approve the continuation of the investment advisory agreement between MFS Variable Insurance Trust II (the “Trust”) and Massachusetts Financial Services Company (“MFS”) on behalf of the Fund. The Trustees consider matters bearing on the Fund and the advisory arrangement at their meetings throughout the year, including a review of performance data at each regular meeting. In addition, the independent Trustees met in person in May and again in July 2010 (“contract review meetings”) for the specific purpose of considering whether to approve the continuation of the investment advisory agreement for the Fund. The independent Trustees were assisted in their evaluation of the investment advisory agreement by independent legal counsel, from whom they received separate legal advice and with whom they met separately from MFS management during various contract review meetings. The independent Trustees were also assisted in this process by the Fund’s Independent Chief Compliance Officer, a full-time senior officer appointed by and reporting to the independent Trustees.
In connection with their deliberations, the Trustees, including the independent Trustees, considered such information and factors as they believed, in light of the legal advice furnished to them and their own business judgment, to be relevant. The investment advisory agreement was considered separately for the Fund, although the Trustees also took into account the common interests of all Funds in the Trust in their review. As described below, the Trustees considered the nature, quality, and extent of the various investment advisory, administrative, and shareholder services performed by MFS under the existing investment advisory agreement and other arrangements with the Trust.
In connection with their contract review meetings, the Trustees received and relied upon materials which included, among other items: (i) information provided by Lipper Inc. (“Lipper”) on the investment performance of the Fund for various time periods ended December 31, 2009, compared to the investment performance of a group of funds with substantially similar investment classifications/objectives (the “Lipper performance universe”), (ii) information provided by Lipper on the Fund’s advisory fees and other expenses compared to the advisory fees and other expenses of comparable funds identified by Lipper (the “Lipper expense group”), (iii) information provided by MFS on the advisory fees of comparable portfolios of its other clients, including institutional separate account and other clients, (iv) information as to whether, and to what extent applicable, expense waivers, reimbursements or fee “breakpoints” are observed for the Fund, (v) information regarding MFS’ financial results and financial condition, including MFS’ and certain of its affiliates’ estimated profitability from services performed for the Fund, (vi) MFS’ views regarding the outlook for the mutual fund industry and its strategic business plans, (vii) descriptions of various functions performed by MFS for the Trust, such as compliance monitoring and portfolio trading practices, and (viii) information regarding the overall organization of MFS, including information about MFS’ senior management and other personnel providing investment advisory, administrative and other services to the Fund. The comparative performance, fee and expense information prepared and provided by Lipper was not independently verified, and the independent Trustees did not independently verify any information provided to them by MFS.
The Trustees’ conclusion as to the continuation of the investment advisory agreement was based on comprehensive consideration of all information provided to the Trustees and was not the result of any single factor. Some of the factors that figured particularly in the Trustees’ deliberations are described below for the Fund, while individual Trustees may have given different weight to various factors and evaluated the information presented as a whole differently than another individual Trustee. The Trustees recognized that the fee arrangements for the Fund reflect years of review and discussion between the independent Trustees and MFS, that certain aspects of such arrangements may receive greater scrutiny in some years than others, and that the Trustees’ conclusions may be based, in part, on their consideration of these same arrangements during the course of the year and in prior years.
Based on information provided by Lipper, the Trustees compared the Fund’s total return investment performance to the performance of the Lipper performance universe over various time periods. The Trustees placed particular emphasis on the total return performance of the Fund’s Initial Class shares in comparison to the performance of funds in its Lipper performance universe over the one-, three- and five-year periods ended December 31, 2009. The Trustees did not rely on performance results for more recent periods, including those shown elsewhere in this report.
The Trustees noted the performance of the Fund’s Initial Class shares was in the 4th quintile relative to the other funds in the Lipper performance universe for the one-year period (the 1st quintile being the best performers and the 5th quintile being the worst performers). The total return performance of the Fund was in the 5th quintile for the three-year period and in the 4th quintile for the five-year period ended December 31, 2009, relative to the Lipper performance universe. Based on the nature and quality of services provided by MFS and MFS’ explanation of steps taken to improve performance, the Board of Trustees concluded that the Fund’s performance was adequate.
23
MFS Emerging Markets Equity Portfolio
Board Review of Investment Advisory Agreement – continued
In the course of their deliberations, the Trustees took into account information provided by MFS during contract review meetings, as well as during investment review meetings conducted with portfolio management personnel during the course of the year.
In assessing the reasonableness of the Fund’s advisory fee, the Trustees considered, among other information, the Fund’s advisory fee and the total expense ratio of the Fund’s Initial Class shares as a percentage of average daily net assets, compared to the advisory fee and total expense ratios of its peer group of funds based on information provided by Lipper. The Trustees also considered the advisory fees charged by MFS to institutional accounts. In comparing these fees, the Trustees considered the generally broader scope of services provided by MFS to the Trust than those provided to institutional accounts. The Trustees also considered the higher demands placed on MFS’ investment personnel and trading infrastructure as a result of the daily cash in-flows and out-flows of the Fund, and the impact on MFS and related expenses due to the more extensive regulatory regime to which the Fund is subject, compared to institutional accounts.
In considering the fees, the Trustees noted from the Lipper data that the Fund’s effective advisory fee rate was below the median and total expense ratio was above the median of such fees and expenses of funds in the Lipper expense group. In addition, the Trustees accepted MFS’ offer to continue the expense limitation for the Fund. The Trustees further concluded that the existing breakpoint was sufficient to allow the Fund to benefit from economies of scale as its assets grow. The Trustees concluded that the fees were reasonable in light of the nature and quality of services provided.
The Trustees also considered information prepared by MFS relating to its costs and profits with respect to the Fund and other investment companies and accounts advised by MFS, as well as MFS’ methodologies used to determine and allocate its costs to the Fund and other accounts and products for purposes of estimating profitability.
After reviewing these and other factors described below, the Trustees concluded that the advisory fees charged to the Fund represent reasonable compensation in light of the nature and quality of the services being provided by MFS.
In addition, the Trustees considered MFS’ resources and related efforts to continue to retain, attract and motivate capable personnel to serve the Fund. The Trustees also considered the financial resources of MFS and its parent, Sun Life Financial Inc. The Trustees further considered any advantages and possible disadvantages of having an adviser which also serves other investment companies as well as institutional accounts.
The Trustees also considered the nature, quality, cost, and extent of administrative, transfer agency, and distribution services provided to the Fund by MFS and its affiliates under agreements and plans other than the investment advisory agreement, including the 12b-1 fees the Fund pays to MFS Fund Distributors, Inc., an affiliate of MFS. The Trustees also considered the nature, extent and quality of certain other services MFS performs or arranges on the Fund’s behalf, which may include securities lending programs, directed expense payment programs, class action recovery programs, and MFS’ interaction with third-party service providers, principally custodians and sub-custodians. The Trustees concluded that the various non-advisory services provided by MFS and its affiliates on behalf of the Fund were satisfactory. The Trustees also considered the benefits to MFS from the use of the Fund’s portfolio brokerage commissions to pay for investment research and various other factors. Additionally, the Trustees considered so-called “fall-out benefits” to MFS such as reputational value derived from serving as investment manager to the Trust, and determined that any such benefits derived by MFS were reasonable and fair.
Based on their evaluation of factors that they deemed to be material, including those factors described above, the Board of Trustees, including a majority of the independent Trustees, concluded that the investment advisory agreement should be continued for an additional one-year period, commencing September 1, 2010.
A discussion regarding the Board’s most recent review and renewal of the fund’s Investment Advisory Agreement with MFS is available by clicking on the fund’s name under “Variable Insurance Portfolios — VIT II” in the “Products and Performance” section of the MFS Web site (mfs.com).
24
MFS Emerging Markets Equity Portfolio
PROXY VOTING POLICIES AND INFORMATION
A general description of the MFS funds’ proxy voting policies and procedures is available without charge, upon request, by calling 1-800-225-2606, by visiting the Proxy Voting section of mfs.com or by visiting the SEC’s Web site at http://www.sec.gov.
Information regarding how the fund voted proxies relating to portfolio securities during the most recent twelve-month period ended June 30 is available without charge by visiting the Proxy Voting section of mfs.com or by visiting the SEC’s Web site at http://www.sec.gov.
QUARTERLY PORTFOLIO DISCLOSURE
The fund will file a complete schedule of portfolio holdings with the Securities and Exchange Commission (the Commission) for the first and third quarters of each fiscal year on Form N-Q. The fund’s Form N-Q may be reviewed and copied at the:
Public Reference Room
Securities and Exchange Commission
100 F Street, NE, Room 1580
Washington, D.C. 20549
Information on the operation of the Public Reference Room may be obtained by calling the Commission at 1-800-SEC-0330. The fund’s Form N-Q is available on the EDGAR database on the Commission’s Internet Web site at http://www.sec.gov, and copies of this information may be obtained, upon payment of a duplicating fee, by electronic request at the following e-mail address: publicinfo@sec.gov or by writing the Public Reference Section at the above address.
FURTHER INFORMATION
From time to time, MFS may post important information about the fund or the MFS funds on the MFS web site (mfs.com). This information is available by visiting the “News & Commentary” section of mfs.com or by clicking on the fund’s name under “Variable Insurance Portfolios — VIT II” in the “Products and Performance” section of mfs.com.
FEDERAL TAX INFORMATION (unaudited)
The following information is provided pursuant to provisions of the Internal Revenue Code.
Income derived from foreign sources was $2,739,335. The fund intends to pass through foreign tax credits of $321,184 for the fiscal year.
25
MFS Emerging Markets Equity Portfolio
MFS® PRIVACY NOTICE
Privacy is a concern for every investor today. At MFS Investment Management® and the MFS funds, we take this concern very seriously. We want you to understand our policies about the investment products and services that we offer, and how we protect the nonpublic personal information of investors who have a direct relationship with us and our wholly owned subsidiaries.
Throughout our business relationship, you provide us with personal information. We maintain information and records about you, your investments, and the services you use. Examples of the nonpublic personal information we maintain include
| | Ÿ | | data from investment applications and other forms |
| | Ÿ | | share balances and transactional history with us, our affiliates, or others |
| | Ÿ | | facts from a consumer reporting agency |
We do not disclose any nonpublic personal information about our customers or former customers to anyone, except as permitted by law. We may share nonpublic personal information with third parties or certain of our affiliates in connection with servicing your account or processing your transactions. We may share information with companies or financial institutions that perform marketing services on our behalf or with other financial institutions with which we have joint marketing arrangements, subject to any legal requirements.
Authorization to access your nonpublic personal information is limited to appropriate personnel who provide products, services, or information to you. We maintain physical, electronic, and procedural safeguards to help protect the personal information we collect about you.
If you have any questions about the MFS privacy policy, please call 1-800-225-2606 any business day.
Note: If you own MFS products or receive MFS services in the name of a third party such as a bank or broker-dealer, their privacy policy may apply to you instead of ours.
26


MFS® GLOBAL TACTICAL ALLOCATION PORTFOLIO
The report is prepared for the general information of contract owners. It is authorized for distribution to prospective investors only when preceded or accompanied by a current prospectus.
NOT FDIC INSURED Ÿ MAY LOSE VALUE Ÿ NO BANK GUARANTEE Ÿ NOT A DEPOSIT Ÿ NOT INSURED BY ANY FEDERAL GOVERNMENT AGENCY OR NCUA/NCUSIF
MFS Global Tactical Allocation Portfolio
LETTER FROM THE CEO

Dear Contract Owners:
After an extended rebound in the financial markets, uncertainty returned in 2010 as investors began to question the durability of the recovery for global economies and markets. That uncertainty led to increased risk aversion, especially as investors saw the eurozone struggle with the debt woes of many of its members. In September, the U.S. Federal Reserve Board’s promises to further loosen monetary policy helped assuage market fears and drive asset prices off their recent lows. A combination of solid earnings and improving economic data gave an additional boost to investor sentiment. As we enter 2011, we are cautiously optimistic that economic growth will continue to improve and that the global economies will recover from the shocks of the past few years. We expect the pace of recovery worldwide will be uneven and volatile.
As always, we continue to be mindful of the many economic challenges faced at the local, national, and international levels. It is in times such as these that we want to remind investors of the merits of maintaining a long-term view, adhering to basic investing principles such as asset allocation and diversification, and working closely with their advisors to research and identify appropriate investment opportunities.
Respectfully,

Robert J. Manning
Chairman and Chief Executive Officer
MFS Investment Management®
February 14, 2011
The opinions expressed in this letter are subject to change, may not be relied upon for investment advice, and no forecasts can be guaranteed.
1
MFS Global Tactical Allocation Portfolio
PORTFOLIO COMPOSITION
Portfolio structure based on market value (a)
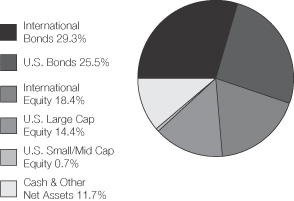
| | | | |
| Top ten holdings (b) | | | | |
| U.S. Treasury Note 10 yr future – MAR 22 11 | | | 6.3% | |
| U.S. Treasury Notes, 3.5%, 2020 | | | 3.9% | |
| Government of Japan, 1.7%, 2017 | | | 3.1% | |
| DAX Index Future – MAR 18 11 | | | 2.9% | |
| S&P 500 E-Mini Future – MAR 18 11 | | | 2.8% | |
| U.S. Treasury Note, 4.75%, 2017 | | | 2.6% | |
| Nikkei 225 Index Future | | | (2.8)% | |
| S&P/TSX 60 Index Future | | | (3.2)% | |
| Japan Government Bond 10yr Future – MAR 10 11 | | | (3.9)% | |
| Canadian Government Bond 10yr Future – MAR 01 11 | | | (7.3)% | |
Portfolio structure reflecting equivalent exposure of derivative positions (b)
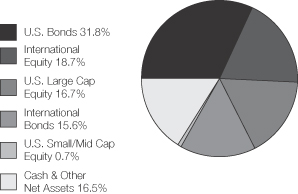
| (a) | For purposes of this presentation, components include the market value of securities, less any securities sold short, and the market value of derivative contracts and may, from time to time, be negative. The bond component will include any accrued interest amounts. Where the fund holds convertible bonds, these are treated as part of the equity portion of the portfolio. |
| (b) | For purposes of this presentation, the components include the market value of securities, less any securities sold short, and reflect the impact of the equivalent exposure of derivative positions, if applicable. These amounts may be negative from time to time. The bond component will include any accrued interest amounts. Equivalent exposure is a calculated amount that translates the derivative position into a reasonable approximation of the amount of the underlying asset that the portfolio would have to hold at a given point in time to have the same price sensitivity that results from the portfolio’s ownership of the derivative contract. When dealing with derivatives, equivalent exposure is a more representative measure of the potential impact of a position on portfolio performance than market value. The market value of derivatives may be different. Where the fund holds convertible bonds, these are treated as part of the equity portion of the portfolio. |
Percentages are based on net assets as of 12/31/10, unless otherwise noted.
The portfolio is actively managed and current holdings may be different.
2
MFS Global Tactical Allocation Portfolio
MANAGEMENT REVIEW
Summary of Results
For the twelve months ended December 31, 2010, Initial Class shares of the MFS Global Tactical Allocation Portfolio (the “fund”) provided a total return of 5.53%, while Service Class shares of the fund provided a total return of 5.31%. These compare with returns of 12.34% and 5.54% for the fund’s benchmarks, the Morgan Stanley Capital International (MSCI) World Index and the Barclays Capital Global Aggregate Index, respectively. The fund’s other benchmark, the Global Tactical Allocation Blended Index (the “Blended Index”), generated a total return of 7.87%. The market indices and related percentage allocations used to compile the Blended Index are set forth in the Performance Summary.
Prior to February 8, 2010, the fund invested in a combination of stocks and bonds, which historically had been allocated at approximately 60% stocks and 40% bonds. Effective February 8, 2010, the fund’s adviser attempts to achieve the fund’s objective by generating returns from individual security selection of a combination of debt instruments and equity securities, and a tactical asset allocation overlay primarily using derivative instruments to manage the fund’s exposure to asset classes (e.g. equity and fixed income), markets (e.g. U.S. and foreign countries), and currencies (e.g. U.S. dollar and Japanese yen). MFS may also use derivatives, such as futures, forward contracts, and options, to seek to limit the fund’s exposure to certain extreme market events.
Effective February 8, 2010, the Barclays Capital Global Aggregate Index replaced the JPMorgan Global Government Bond Index Unhedged as a benchmark of the fund and the Global Tactical Allocation Blended Index replaced the Global Total Return Blended Index as a benchmark of the fund because the fund’s adviser believes that these indices better reflect the current investment policies and strategies of the fund. For the twelve months ended December 31, 2010, the JPMorgan Global Government Bond Index Unhedged and the Global Total Return Blended Index generated returns of 6.42% and 10.39%, respectively. The return of a combination of the Global Total Return Blended Index for the period of January 1, 2010 through February 7, 2010 and the Global Tactical Allocation Blended Index for the period of February 8, 2010 through December 31, 2010, which reflects the change in the fund’s investment policies that occurred during the reporting period as discussed above, was 5.68%.
Market Environment
The first quarter of the reporting period witnessed a continuation of the financial market and macroeconomic rebounds that had begun in early 2009. These recoveries in global activity and asset valuations were generally synchronized around the world, led importantly by emerging Asian economies, but broadening to include most of the global economy to varying degrees. Primary drivers of the recoveries included an unwinding of the inventory destocking that took place earlier, the production of manufacturing and capital goods, as well as massive fiscal and monetary stimulus.
During most of the remainder of the period, heightened risk surrounding the public-debt profiles of several of the peripheral European countries impaired market sentiment. At the same time, the improving trend in global macroeconomic data began to weaken somewhat. These two dynamics caused many asset prices to retrench significantly, as many questioned the durability of the global recovery.
Towards the end of the period, the U.S. Federal Reserve led markets to believe that further monetary loosening would be forthcoming if macroeconomic activity did not show signs of improvement. The prospects for more easing by the Fed improved market sentiment and drove risk-asset prices markedly higher. However, in a text-book case of “buy the rumor, sell the fact,” the weeks following the early November announcement of further quantitative easing saw a sell-off in U.S. Treasury bonds. This rise in Treasury yields occurred despite risk-off behavior in equities and credit markets (which would normally result in Treasury yield compression), and appears to have been the result of a few factors: signs of improved U.S. and global economic activity; opposition to quantitative easing from some quarters; and crowded long positions in U.S. Treasuries. The December agreement on an expansionary U.S. fiscal package also boosted sentiment, leading markets to reach near-term highs in risky asset valuations toward year end.
Detractors from Performance
Within the equity portion of the fund, stock selection and an overweight position in the health care sector detracted from performance relative to the MSCI World Index. Holdings of pharmaceutical companies, Sanofi-Aventis (France), Roche Holding (Switzerland), and Abbott Laboratories, were among the fund’s top detractors over the reporting period. Shares of Roche Holding struggled on the news that an advisory panel recommended that the U.S. FDA withdraw its provisional approval of Roche’s top-selling drug, Avastin, as a first line treatment for breast cancer.
Security selection in the transportation sector also held back relative returns. Our overweight position in postal operator TNT (Netherlands) detracted from relative performance as the company reported weak financial results and declined volume in the company’s mail division amid intensifying competition and the substitution of email for traditional letter mail.
3
MFS Global Tactical Allocation Portfolio
Management Review – continued
Elsewhere, not owning strong-performing computer maker Apple dampened relative results. The fund’s holdings of defense contractor Lockheed Martin, oil and gas exploration company INPEX (Japan), telecommunications services provider Royal KPN N.V. (Netherlands), defense and commercial aerospace equipment maker Cobham, and power and gas company E.ON (Germany) also hurt relative performance. Shares of INPEX declined after the company announced plans to raise equity to cover higher-than-expected development costs for Ichthys, a liquefied natural gas project in Australia.
Within the fixed income portion of the fund, individual sovereign bond holdings of Italy and Ireland held back results relative to the Barclays Capital Global Aggregate Index. The fund’s yield curve (y) positioning in the U.S. and Japan was another negative factor for relative performance.
As a part of the fund’s tactical overlay, an underweight to Swiss Franc via the use of currency forward contracts dampened performance as the currency appreciated during the year.
Contributors to Performance
During the period February 8, 2010 to December 31, 2010, the tactical overlay contributed positively to performance with positive contributions coming from the top level stock and bond positioning, allocation within stock and bond markets, and currency allocation. An underweight to equity during the downturn in the second quarter and an overweight to equity from September through year end during the rally, both achieved primarily through the use of stock index futures such as the S&P 500 Index Futures, contributed positively to performance. Within the equity allocation, an underweight to Australia and an overweight to Sweden via holdings of the Australian SPI 200 Index Futures and the OMXS 30 Index Futures, helped relative performance as the Australian equity market substantially underperformed, and Swedish equity market considerably outperformed, the global equity markets.
The fund’s tactical allocation to fixed income was achieved primarily through the use of interest rate futures such as the US Treasury Bond 10-year Futures. A tactical overweight to fixed income in May through July during a bond market rally and an underweight to fixed income during the fourth quarter sell-off contributed positively to performance. Within the bond allocation, an underweight to Australia and an overweight to the U.K., via the use of Australian and U.K government bond futures, also helped performance as the Australian bond market underperformed and the U.K. bond market outperformed the global bond markets. Currency allocation via holdings of currency forward contracts was another positive factor for performance with a significant contribution coming from an overweight to the New Zealand dollar which appreciated during the year.
Within the equity portion of the fund, stock selection in the financial services sector had a positive impact on relative performance. Not holding financial services and banking firm Banco Santander (Spain) contributed to relative returns as shares of the company underperformed the benchmark.
Stock selection in the autos & housing sector also helped relative performance. The fund’s holdings of automotive and industrial products manufacturer Tomkins (h) (United Kingdom) had a positive effect on relative results. Shares of Tomkins surged in response to a takeover bid from a private-equity consortium.
Elsewhere, the timing of our ownership in shares of integrated oil company BP PLC (United Kingdom), which underperformed the benchmark over the reporting period, benefited relative performance. Other positive contributors included locks manufacturer Assa Abloy (Sweden), control products manufacturer Spectris (b) (United Kingdom), wiring devices and cable systems manufacturer Legrand S.A., chemical company PPG Industries, voice and data communications services company Vodafone Group (United Kingdom), and global food company Nestle (Switzerland). Not holding poor-performing software giant Microsoft also bolstered relative returns.
Within the fixed income portion of the fund, the return from yield, which was greater than that of the Barclays Capital Global Aggregate Index, was a key contributor to relative performance. The fund’s greater exposure to “BBB” and “BB” rated (r) U.S. corporate bonds also had a positive impact on relative results as these securities outperformed the benchmark over the reporting period. A lesser exposure to peripheral European nations’ debt securities, particularly an underweight position in Greece and Spain, also benefited relative performance. The fund’s greater exposure to Euroland versus U.S. bonds, particularly the fund’s long position in German government bonds (“Bunds”) versus U.S. Treasuries, was another positive factor. Elsewhere, our holdings of emerging market debt securities also contributed to relative results.
Respectfully,
| | | | | | | | |
| Nevin Chitkara | | Steven Gorham | | Richard Hawkins | | Benjamin Nastou | | Natalie Shapiro |
| Portfolio Manager | | Portfolio Manager | | Portfolio Manager | | Portfolio Manager | | Portfolio Manager |
| | | | |
| Benjamin Stone | | Erik Weisman | | Barnaby Wiener | | | | |
| Portfolio Manager | | Portfolio Manager | | Portfolio Manager | | | | |
Notes to Contract Owners: Effective February 8, 2010, Richard Hawkins, Benjamin Nastou and Natalie Shapiro became co-managers of the fund, and Matthew Ryan is no longer a co-manager of the fund.
4
MFS Global Tactical Allocation Portfolio
Management Review – continued
Prior to February 8, 2010, the fund normally invested between 40% and 75% of its assets in equity securities and at least 25% of its assets in fixed-income senior securities. Effective February 8, 2010, MFS attempts to achieve the fund’s objective by generating returns from a combination of (i) individual security selection of a combination of debt instruments and equity securities and (ii) a tactical asset allocation overlay primarily using derivative instruments.
| (b) | Security is not a benchmark constituent. |
| (h) | Security was not held in the portfolio at period end. |
| (r) | Bonds rated “BBB”, “Baa”, or higher are considered investment grade; bonds rated “BB”, “Ba”, or below are considered non-investment grade. The primary source for bond quality ratings is Moody’s Investors Service. If not available, ratings by Standard & Poor’s are used, else ratings by Fitch, Inc. For securities which are not rated by any of the three agencies, the security is considered Not Rated. |
| (y) | A yield curve graphically depicts the yields of different maturity bonds of the same credit quality and type; a normal yield curve is upward sloping, with short-term rates lower than long-term rates. |
The views expressed in this report are those of the portfolio managers only through the end of the period of the report as stated on the cover and do not necessarily reflect the views of MFS or any other person in the MFS organization. These views are subject to change at any time based on market or other conditions, and MFS disclaims any responsibility to update such views. These views may not be relied upon as investment advice or an indication of trading intent on behalf of any MFS portfolio. References to specific securities are not recommendations of such securities, and may not be representative of any MFS portfolio’s current or future investments.
5
MFS Global Tactical Allocation Portfolio
PERFORMANCE SUMMARY THROUGH 12/31/10
The following chart illustrates the historical performance of the fund in comparison to its benchmark(s). Benchmarks are unmanaged and may not be invested in directly. Benchmark returns do not reflect any fees or expenses. The performance of other share classes will be greater than or less than that of the class depicted below. (See Notes to Performance Summary.)
Performance data shown represents past performance and is no guarantee of future results. Investment return and principal value fluctuate so your units, when sold, may be worth more or less than the original cost; current performance may be lower or higher than quoted. The performance shown does not reflect the deduction of taxes, if any, that a contract holder would pay on fund distributions or the redemption of contract units. The returns for the fund shown also do not reflect the deduction of expenses associated with variable products, such as mortality and expense risk charges, separate account charges, and sales charges imposed by the insurance company separate accounts. Such expenses would reduce the overall returns shown.
Growth of a Hypothetical $10,000 Investment
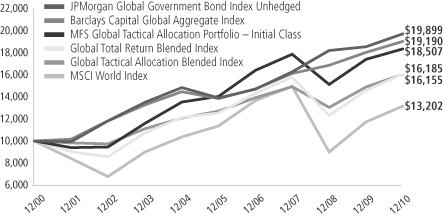
Total Returns through 12/31/10
Average annual total returns
| | | | | | | | | | | | | | |
| | | Share class | | Class inception date | | 1-yr | | 5-yr | | 10-yr | | Life (t) | | |
| | | Initial Class | | 11/07/94 | | 5.53% | | 5.57% | | 6.35% | | N/A | | |
| | | Service Class | | 8/24/01 | | 5.31% | | 5.32% | | N/A | | 7.05% | | |
| | | | | |
| Comparative benchmarks | | | | | | | | | | |
| | | Barclays Capital Global Aggregate Index (f)(z) | | 5.54% | | 6.66% | | 6.74% | | N/A | | |
| | | MSCI World Index (f) | | 12.34% | | 2.99% | | 2.82% | | N/A | | |
| | | Global Tactical Allocation Blended Index (f)(y)(z) | | 7.87% | | 4.85% | | 4.91% | | N/A | | |
| | | Barclays Capital Global Aggregate Index Hedged (f) | | 4.61% | | 4.85% | | 5.21% | | N/A | | |
| | | JPMorgan Global Government Bond Index Unhedged (f)(z) | | 6.42% | | 7.35% | | 7.12% | | N/A | | |
| | | Global Total Return Blended Index (f)(z) | | 10.39% | | 5.20% | | 4.93% | | N/A | | |
| (f) | Source: FactSet Research Systems Inc. |
| (t) | For the period from the class inception date through the stated period end (for those share classes with less than 10 years of performance history). No comparable benchmark performance information is provided for “life” periods. (See Notes to Performance Summary.) |
| (y) | The Global Tactical Allocation Blended Index is at a point in time and allocations during the period can change. As of December 31, 2010, the blended index was comprised of 35% MSCI World Index, 54% Barclays Capital Global Aggregate Index Hedged, and 11% Barclays Capital Global Aggregate Index. |
| (z) | Effective February 8, 2010, the Barclays Capital Global Aggregate Index replaced the JPMorgan Global Government Bond Index Unhedged as a benchmark of the fund. In addition, the Global Tactical Allocation Blended Index (the “Blended Index”) replaced the Global Total Return Blended Index (the “Blended Index”) as the fund’s other benchmark as of that date. The fund’s investment adviser believes that the Barclays Capital Global Aggregate Index and the Global Tactical Allocation Blended Index better reflect the investment policies and strategies of the fund. |
Benchmark Definitions
Barclays Capital Global Aggregate Index – provides a broad-based measure of the global investment-grade fixed income markets. The three major components of this index are the U.S. Aggregate, the Pan-European Aggregate, and the Asian-Pacific Aggregate Indices. The index also includes Eurodollar and Euro-Yen corporate bonds, Canadian government, agency and corporate securities, and USD investment grade 144A securities.
6
MFS Global Tactical Allocation Portfolio
Performance Summary – continued
Barclays Capital Global Aggregate Index Hedged – provides a broad-based measure of the currency-hedged performance of global investment-grade fixed income markets. The three major components of this index are the U.S. Aggregate, the Pan-European Aggregate, and the Asian-Pacific Aggregate Indices. The index also includes Eurodollar and Euro-Yen corporate bonds, Canadian government, agency and corporate securities, and USD investment grade 144A securities.
JPMorgan Global Government Bond Index Unhedged – measures developed government bond markets around the world.
MSCI World Index – a market capitalization-weighted index that is designed to measure equity market performance in the global developed markets.
It is not possible to invest directly in an index.
Notes to Performance Summary
Average annual total return represents the average annual change in value for each share class for the periods presented. Life returns are presented where the share class has less than 10 years of performance history and represent the average annual total return from the class inception date to the stated period end date. As the fund’s share classes may have different inception dates, the life returns may represent different time periods and may not be comparable. As a result, no comparative benchmark performance information is provided for life periods.
Performance results reflect any applicable expense subsidies and waivers in effect during the periods shown. Without such subsidies and waivers the fund’s performance results would be less favorable. Please see the prospectus and financial statements for complete details. All results are historical and assume the reinvestment of any dividends and capital gains distributions.
From time to time the fund may receive proceeds from litigation settlements, without which performance would be lower.
7
MFS Global Tactical Allocation Portfolio
EXPENSE TABLE
Fund Expenses Borne by the Contract Holders During the Period,
July 1, 2010 through December 31, 2010
As a contract holder of the fund, you incur ongoing costs, including management fees; distribution and/or service (12b-1) fees; and other fund expenses. This example is intended to help you understand your ongoing costs (in dollars) of investing in the fund and to compare these costs with the ongoing costs of investing in other mutual funds.
The example is based on an investment of $1,000 invested at the beginning of the period and held for the entire period July 1, 2010 through December 31, 2010.
Actual Expenses
The first line for each share class in the following table provides information about actual account values and actual expenses. You may use the information in this line, together with the amount you invested, to estimate the expenses that you paid over the period. Simply divide your account value by $1,000 (for example, an $8,600 account value divided by $1,000 = 8.6), then multiply the result by the number in the first line under the heading entitled “Expenses Paid During Period” to estimate the expenses you paid on your account during this period.
Hypothetical Example for Comparison Purposes
The second line for each share class in the following table provides information about hypothetical account values and hypothetical expenses based on the fund’s actual expense ratio and an assumed rate of return of 5% per year before expenses, which is not the fund’s actual return. The hypothetical account values and expenses may not be used to estimate the actual ending account balance or expenses you paid for the period. You may use this information to compare the ongoing costs of investing in the fund and other funds. To do so, compare this 5% hypothetical example with the 5% hypothetical examples that appear in the shareholder reports of the other funds.
Please note that the expenses shown in the table are meant to highlight the fund’s ongoing costs only and do not take into account the fees and expenses imposed under the variable contracts through which your investment in the fund is made. Therefore, the second line for each share class in the table is useful in comparing ongoing costs associated with an investment in vehicles (such as the fund) which fund benefits under variable annuity and variable life insurance contracts and to qualified pension and retirement plans only, and will not help you determine the relative total costs of investing in the fund through variable annuity and variable life insurance contracts. If the fees and expenses imposed under the variable contracts were included, your costs would have been higher.
| | | | | | | | | | | | | | | | | | |
| Share Class | | | | Annualized
Expense Ratio | | | Beginning
Account Value
7/01/10 | | | Ending
Account Value
12/31/10 | | | Expenses Paid
During Period (p)
7/01/10-12/31/10 | |
| Initial Class | | Actual | | | 0.90% | | | | $1,000.00 | | | | $1,080.67 | | | | $4.72 | |
| | Hypothetical (h) | | | 0.90% | | | | $1,000.00 | | | | $1,020.67 | | | | $4.58 | |
| Service Class | | Actual | | | 1.15% | | | | $1,000.00 | | | | $1,078.99 | | | | $6.03 | |
| | Hypothetical (h) | | | 1.15% | | | | $1,000.00 | | | | $1,019.41 | | | | $5.85 | |
| (h) | 5% class return per year before expenses. |
| (p) | Expenses paid is equal to each class’ annualized expense ratio, as shown above, multiplied by the average account value over the period, multiplied by the number of days in the period, divided by the number of days in the year. |
8
MFS Global Tactical Allocation Portfolio
PORTFOLIO OF INVESTMENTS – 12/31/10
The Portfolio of Investments is a complete list of all securities owned by your fund. It is categorized by broad-based asset classes.
| | | | | | | | |
| Issuer | | Shares/Par | | | Value ($) | |
| | | | | | | | |
| COMMON STOCKS – 33.5% | | | | | | | | |
| Aerospace – 1.7% | | | | | | | | |
| Cobham PLC | | | 291,861 | | | $ | 926,007 | |
| Honeywell International, Inc. | | | 26,030 | | | | 1,383,755 | |
| Lockheed Martin Corp. (s) | | | 40,330 | | | | 2,819,470 | |
| Northrop Grumman Corp. | | | 21,110 | | | | 1,367,506 | |
| United Technologies Corp. | | | 25,660 | | | | 2,019,955 | |
| | | | | | | | |
| | | | | | $ | 8,516,693 | |
| | | | | | | | |
| Alcoholic Beverages – 0.6% | | | | | | | | |
| Heineken N.V. | | | 59,761 | | | $ | 2,930,013 | |
| | | | | | | | |
| Automotive – 0.1% | | | | | | | | |
| USS Co. Ltd. | | | 7,830 | | | $ | 640,365 | |
| | | | | | | | |
| Broadcasting – 1.1% | | | | | | | | |
| Fuji Television Network, Inc. | | | 459 | | | $ | 725,897 | |
| Nippon Television Network Corp. | | | 5,060 | | | | 795,864 | |
| Omnicom Group, Inc. | | | 18,220 | | | | 834,476 | |
| Vivendi S.A. | | | 61,952 | | | | 1,672,286 | |
| Walt Disney Co. | | | 34,330 | | | | 1,287,709 | |
| | | | | | | | |
| | | | | | $ | 5,316,232 | |
| | | | | | | | |
| Brokerage & Asset Managers – 0.2% | | | | | | | | |
| Daiwa Securities Group, Inc. | | | 226,000 | | | $ | 1,163,542 | |
| | | | | | | | |
| Business Services – 1.1% | | | | | | | | |
| Accenture Ltd., “A” | | | 41,250 | | | $ | 2,000,213 | |
| Bunzl PLC | | | 72,468 | | | | 812,361 | |
| Compass Group PLC | | | 71,680 | | | | 649,304 | |
| Dun & Bradstreet Corp. | | | 10,540 | | | | 865,229 | |
| Nomura Research, Inc. | | | 35,500 | | | | 788,098 | |
| | | | | | | | |
| | | | | | $ | 5,115,205 | |
| | | | | | | | |
| Chemicals – 0.7% | | | | | | | | |
| 3M Co. | | | 13,250 | | | $ | 1,143,475 | |
| Givaudan S.A. | | | 1,161 | | | | 1,252,887 | |
| PPG Industries, Inc. | | | 13,620 | | | | 1,145,033 | |
| | | | | | | | |
| | | | | | $ | 3,541,395 | |
| | | | | | | | |
| Computer Software – 0.4% | | | | | | | | |
| Oracle Corp. | | | 62,800 | | | $ | 1,965,640 | |
| | | | | | | | |
| Computer Software – Systems – 0.8% | | | | | | | | |
| Acer, Inc. | | | 357,089 | | | $ | 1,103,484 | |
| International Business Machines Corp. | | | 11,380 | | | | 1,670,129 | |
| Konica Minolta Holdings, Inc. | | | 116,000 | | | | 1,205,863 | |
| | | | | | | | |
| | | | | | $ | 3,979,476 | |
| | | | | | | | |
| Construction – 0.7% | | | | | | | | |
| Geberit AG | | | 5,861 | | | $ | 1,355,239 | |
| Sherwin-Williams Co. | | | 13,280 | | | | 1,112,200 | |
| Stanley Black & Decker, Inc. | | | 10,960 | | | | 732,895 | |
| | | | | | | | |
| | | | | | $ | 3,200,334 | |
| | | | | | | | |
| Consumer Products – 1.2% | | | | | | | | |
| Henkel KGaA, IPS | | | 24,255 | | | $ | 1,508,290 | |
| Kao Corp. | | | 73,900 | | | | 1,991,541 | |
| | | | | | | | |
| Issuer | | Shares/Par | | | Value ($) | |
| | | | | | | | |
| COMMON STOCKS – continued | | | | | |
| Consumer Products – continued | | | | | | | | |
| KOSE Corp. | | | 19,000 | | | $ | 491,440 | |
| Procter & Gamble Co. | | | 13,714 | | | | 882,222 | |
| Reckitt Benckiser Group PLC | | | 20,063 | | | | 1,102,627 | |
| | | | | | | | |
| | | | | | $ | 5,976,120 | |
| | | | | | | | |
| Containers – 0.1% | | | | | | | | |
| Brambles Ltd. | | | 78,358 | | | $ | 570,629 | |
| | | | | | | | |
| Electrical Equipment – 0.4% | | | | | | | | |
| Legrand S.A. | | | 33,768 | | | $ | 1,375,159 | |
| Spectris PLC | | | 35,955 | | | | 734,913 | |
| | | | | | | | |
| | | | | | $ | 2,110,072 | |
| | | | | | | | |
| Electronics – 1.0% | | | | | | | | |
| Halma PLC | | | 104,249 | | | $ | 583,499 | |
| Intel Corp. | | | 58,890 | | | | 1,238,457 | |
| Samsung Electronics Co. Ltd. | | | 1,961 | | | | 1,639,782 | |
| Taiwan Semiconductor Manufacturing Co. Ltd., ADR | | | 131,448 | | | | 1,648,358 | |
| | | | | | | | |
| | | | | | $ | 5,110,096 | |
| | | | | | | | |
| Energy – Independent – 0.6% | | | | | | | | |
| Apache Corp. | | | 11,890 | | | $ | 1,417,645 | |
| EOG Resources, Inc. | | | 7,190 | | | | 657,238 | |
| INPEX Corp. | | | 158 | | | | 925,348 | |
| | | | | | | | |
| | | | | | $ | 3,000,231 | |
| | | | | | | | |
| Energy – Integrated – 2.2% | | | | | | | | |
| BP PLC | | | 363,233 | | | $ | 2,636,485 | |
| Chevron Corp. | | | 26,940 | | | | 2,458,275 | |
| Exxon Mobil Corp. | | | 26,570 | | | | 1,942,798 | |
| Hess Corp. | | | 10,590 | | | | 810,559 | |
| Royal Dutch Shell PLC, “A” | | | 83,662 | | | | 2,789,403 | |
| | | | | | | | |
| | | | | | $ | 10,637,520 | |
| | | | | | | | |
| Food & Beverages – 1.7% | | | | | | | | |
| General Mills, Inc. | | | 35,010 | | | $ | 1,246,006 | |
| Groupe Danone | | | 26,069 | | | | 1,637,989 | |
| J.M. Smucker Co. | | | 10,298 | | | | 676,064 | |
| Kellogg Co. | | | 11,130 | | | | 568,520 | |
| Nestle S.A. | | | 54,659 | | | | 3,200,621 | |
| PepsiCo, Inc. | | | 17,030 | | | | 1,112,570 | |
| | | | | | | | |
| | | | | | $ | 8,441,770 | |
| | | | | | | | |
| Food & Drug Stores – 0.3% | | | | | | | | |
| CVS Caremark Corp. | | | 16,540 | | | $ | 575,096 | |
| Lawson, Inc. | | | 20,000 | | | | 989,038 | |
| | | | | | | | |
| | | | | | $ | 1,564,134 | |
| | | | | | | | |
| Insurance – 2.4% | | | | | | | | |
| Allstate Corp. | | | 15,050 | | | $ | 479,794 | |
| Aon Corp. | | | 21,840 | | | | 1,004,858 | |
| Hiscox Ltd. | | | 108,821 | | | | 647,094 | |
| ING Groep N.V. (a) | | | 126,400 | | | | 1,229,653 | |
| Jardine Lloyd Thompson Group PLC | | | 76,102 | | | | 746,312 | |
9
MFS Global Tactical Allocation Portfolio
Portfolio of Investments – continued
| | | | | | | | |
| Issuer | | Shares/Par | | | Value ($) | |
| | | | | | | | |
| COMMON STOCKS – continued | | | | | |
| Insurance – continued | | | | | | | | |
| MetLife, Inc. | | | 55,340 | | | $ | 2,459,310 | |
| Muenchener Ruckvers AG | | | 6,061 | | | | 918,867 | |
| Prudential Financial, Inc. | | | 19,680 | | | | 1,155,413 | |
| Swiss Reinsurance Co. | | | 23,937 | | | | 1,287,734 | |
| Travelers Cos., Inc. | | | 12,820 | | | | 714,202 | |
| Zurich Financial Services Ltd. | | | 4,695 | | | | 1,216,181 | |
| | | | | | | | |
| | | | | | $ | 11,859,418 | |
| | | | | | | | |
| Leisure & Toys – 0.1% | | | | | | | | |
| Hasbro, Inc. | | | 10,450 | | | $ | 493,031 | |
| | | | | | | | |
| Machinery & Tools – 0.7% | | | | | | | | |
| ASSA ABLOY AB, “B” | | | 45,891 | | | $ | 1,293,012 | |
| Glory Ltd. | | | 19,500 | | | | 480,355 | |
| Neopost S.A. | | | 10,606 | | | | 924,066 | |
| Schindler Holding AG | | | 5,142 | | | | 608,241 | |
| | | | | | | | |
| | | | | | $ | 3,305,674 | |
| | | | | | | | |
| Major Banks – 3.0% | | | | | | | | |
| Bank of America Corp. | | | 102,480 | | | $ | 1,367,083 | |
| Bank of New York Mellon Corp. | | | 79,731 | | | | 2,407,876 | |
| Goldman Sachs Group, Inc. | | | 11,850 | | | | 1,992,696 | |
| HSBC Holdings PLC | | | 205,009 | | | | 2,081,107 | |
| JPMorgan Chase & Co. | | | 46,200 | | | | 1,959,804 | |
| PNC Financial Services Group, Inc. | | | 13,440 | | | | 816,077 | |
| State Street Corp. | | | 27,790 | | | | 1,287,789 | |
| Sumitomo Mitsui Financial Group, Inc. | | | 18,000 | | | | 641,163 | |
| The Toronto-Dominion Bank | | | 7,984 | | | | 596,210 | |
| Wells Fargo & Co. | | | 49,910 | | | | 1,546,711 | |
| | | | | | | | |
| | | | | | $ | 14,696,516 | |
| | | | | | | | |
| Medical & Health Technology & Services – 0.5% | | | | | |
| Kobayashi Pharmaceutical Co. Ltd. | | | 15,800 | | | $ | 732,888 | |
| Miraca Holdings, Inc. | | | 26,100 | | | | 1,051,201 | |
| Quest Diagnostics, Inc. | | | 12,630 | | | | 681,641 | |
| | | | | | | | |
| | | | | | $ | 2,465,730 | |
| | | | | | | | |
| Medical Equipment – 1.0% | | | | | | | | |
| Becton, Dickinson & Co. | | | 8,590 | | | $ | 726,027 | |
| Medtronic, Inc. | | | 38,370 | | | | 1,423,143 | |
| Smith & Nephew PLC | | | 74,214 | | | | 782,758 | |
| St. Jude Medical, Inc. (a) | | | 24,100 | | | | 1,030,275 | |
| Synthes, Inc. | | | 5,899 | | | | 796,838 | |
| | | | | | | | |
| | | | | | $ | 4,759,041 | |
| | | | | | | | |
| Network & Telecom – 0.6% | | | | | | | | |
| Cisco Systems, Inc. (a) | | | 33,700 | | | $ | 681,751 | |
| Ericsson, Inc., “B” | | | 108,168 | | | | 1,256,879 | |
| Nokia Oyj | | | 103,865 | | | | 1,074,272 | |
| | | | | | | | |
| | | | | | $ | 3,012,902 | |
| | | | | | | | |
| Oil Services – 0.3% | | | | | | | | |
| Noble Corp. | | | 13,430 | | | $ | 480,391 | |
| Transocean, Inc. (a) | | | 12,230 | | | | 850,107 | |
| | | | | | | | |
| | | | | | $ | 1,330,498 | |
| | | | | | | | |
| Other Banks & Diversified Financials – 0.6% | | | | | |
| DnB NOR A.S.A. | | | 94,891 | | | $ | 1,331,878 | |
| | | | | | | | |
| Issuer | | Shares/Par | | | Value ($) | |
| | | | | | | | |
| COMMON STOCKS – continued | |
| Other Banks & Diversified Financials – continued | | | | | |
| Hachijuni Bank Ltd. | | | 65,000 | | | $ | 363,468 | |
| MasterCard, Inc., “A” | | | 3,440 | | | | 770,938 | |
| Sapporo Hokuyo Holdings, Inc. | | | 80,300 | | | | 375,834 | |
| | | | | | | | |
| | | | | | $ | 2,842,118 | |
| | | | | | | | |
| Pharmaceuticals – 3.6% | | | | | | | | |
| Abbott Laboratories | | | 44,440 | | | $ | 2,129,120 | |
| Bayer AG | | | 17,088 | | | | 1,262,759 | |
| GlaxoSmithKline PLC | | | 104,285 | | | | 2,016,124 | |
| Johnson & Johnson (s) | | | 53,370 | | | | 3,300,935 | |
| Pfizer, Inc. | | | 116,910 | | | | 2,047,094 | |
| Roche Holding AG | | | 19,671 | | | | 2,882,275 | |
| Sanofi-Aventis | | | 48,013 | | | | 3,070,045 | |
| Santen, Inc. | | | 18,800 | | | | 652,987 | |
| | | | | | | | |
| | | | | | $ | 17,361,339 | |
| | | | | | | | |
| Railroad & Shipping – 0.2% | | | | | | | | |
| Canadian National Railway Co. | | | 12,390 | | | $ | 823,563 | |
| | | | | | | | |
| Real Estate – 0.2% | | | | | | | | |
| Deutsche Wohnen AG (a) | | | 54,868 | | | $ | 769,861 | |
| | | | | | | | |
| Specialty Chemicals – 0.2% | | | | | | | | |
| Shin-Etsu Chemical Co. Ltd. | | | 19,200 | | | $ | 1,040,522 | |
| | | | | | | | |
| Specialty Stores – 0.1% | | | | | | | | |
| Esprit Holdings Ltd. | | | 114,300 | | | $ | 544,090 | |
| | | | | | | | |
| Telecommunications – Wireless – 1.4% | | | | | |
| KDDI Corp. | | | 491 | | | $ | 2,836,298 | |
| Vodafone Group PLC | | | 1,453,279 | | | | 3,756,707 | |
| | | | | | | | |
| | | | | | $ | 6,593,005 | |
| | | | | | | | |
| Telephone Services – 1.2% | | | | | | | | |
| AT&T, Inc. | | | 88,760 | | | $ | 2,607,769 | |
| China Unicom Ltd. | | | 370,000 | | | | 529,333 | |
| Royal KPN N.V. | | | 140,795 | | | | 2,054,536 | |
| Telecom Italia S.p.A. | | | 391,841 | | | | 425,177 | |
| | | | | | | | |
| | | | | | $ | 5,616,815 | |
| | | | | | | | |
| Tobacco – 1.4% | | | | | | | | |
| British American Tobacco PLC | | | 45,710 | | | $ | 1,755,648 | |
| Japan Tobacco, Inc. | | | 385 | | | | 1,424,960 | |
| Philip Morris International, Inc. (s) | | | 50,566 | | | | 2,959,628 | |
| Reynolds American, Inc. | | | 15,420 | | | | 503,000 | |
| | | | | | | | |
| | | | | | $ | 6,643,236 | |
| | | | | | | | |
| Trucking – 0.6% | | | | | | | | |
| TNT N.V. | | | 37,320 | | | $ | 984,947 | |
| Yamato Holdings Co. Ltd. | | | 127,300 | | | | 1,812,524 | |
| | | | | | | | |
| | | | | | $ | 2,797,471 | |
| | | | | | | | |
| Utilities – Electric Power – 0.5% | | | | | | | | |
| E.ON AG | | | 34,229 | | | $ | 1,049,052 | |
| PG&E Corp. | | | 33,760 | | | | 1,615,078 | |
| | | | | | | | |
| | | | | | $ | 2,664,130 | |
| | | | | | | | |
Total Common Stocks
(Identified Cost, $155,753,914) | | | | | | $ | 163,398,427 | |
| | | | | | | | |
10
MFS Global Tactical Allocation Portfolio
Portfolio of Investments – continued
| | | | | | | | |
| Issuer | | Shares/Par | | | Value ($) | |
| | | | | | | | |
| BONDS – 54.3% | | | | | | | | |
| Aerospace – 0.1% | | | | | | | | |
| Bombardier, Inc., 7.75%, 2020 (n) | | $ | 670,000 | | | $ | 721,925 | |
| | | | | | | | |
| Asset-Backed & Securitized – 1.9% | | | | | |
| Bayview Commercial Asset Trust, FRN, 1.687%, 2023 (z) | | CAD | 170,000 | | | $ | 139,904 | |
| Citigroup/Deutsche Bank Commercial Mortgage Trust, 5.322%, 2049 | | $ | 1,479,018 | | | | 1,533,032 | |
| Commercial Mortgage Asset Trust, FRN, 0.84%, 2032 (i)(z) | | | 2,400,135 | | | | 46,300 | |
| Commercial Mortgage Pass-Through Certificates, “A3”, 5.293%, 2049 | | | 532,759 | | | | 548,967 | |
| Commercial Mortgage Pass-Through Certificates, “A4”, 5.306%, 2046 | | | 532,759 | | | | 555,660 | |
| Commercial Mortgage Pass-Through Certificates, FRN, 0.45%, 2017 (n) | | | 360,000 | | | | 345,134 | |
| First Union National Bank Commercial Mortgage Trust, FRN, 0.738%, 2043 (i)(n) | | | 2,852,983 | | | | 11,347 | |
| JPMorgan Chase Commercial Mortgage Securities Corp., FRN, 5.817%, 2049 | | | 1,032,759 | | | | 1,086,096 | |
| JPMorgan Chase Commercial Mortgage Securities Corp., FRN, 5.988%, 2051 | | | 1,808,573 | | | | 1,894,278 | |
| Merrill Lynch Mortgage Trust, FRN, 5.825%, 2050 | | | 310,000 | | | | 330,143 | |
| Merrill Lynch Mortgage Trust, FRN, “A3”, 5.825%, 2050 | | | 2,000,000 | | | | 2,105,693 | |
| Wachovia Bank Commercial Mortgage Trust, “A3”, FRN, 5.902%, 2051 | | | 620,000 | | | | 657,198 | |
| | | | | | | | |
| | | | | | $ | 9,253,752 | |
| | | | | | | | |
| Automotive – 0.2% | | | | | | | | |
| Ford Motor Credit Co. LLC, 7.8%, 2012 | | $ | 800,000 | | | $ | 850,502 | |
| | | | | | | | |
| Building – 0.1% | | | | | | | | |
| Mohawk Industries, Inc., 6.875%, 2016 | | $ | 645,000 | | | $ | 691,763 | |
| | | | | | | | |
| Cable TV – 0.5% | | | | | | | | |
| Comcast Corp., 5.15%, 2020 | | $ | 570,000 | | | $ | 598,696 | |
Cox Communications, Inc.,
9.375%, 2019 (n) | | | 460,000 | | | | 601,661 | |
| DIRECTV Holdings LLC, 5.2%, 2020 | | | 520,000 | | | | 539,075 | |
| Time Warner Cable, Inc., 5%, 2020 | | | 520,000 | | | | 535,152 | |
| | | | | | | | |
| | | | | | $ | 2,274,584 | |
| | | | | | | | |
| Chemicals – 0.4% | | | | | | | | |
| Ashland, Inc., 9.125%, 2017 | | $ | 560,000 | | | $ | 645,400 | |
| Dow Chemical Co., 9.4%, 2039 | | | 339,000 | | | | 492,035 | |
| Nalco Co., 8.25%, 2017 | | | 620,000 | | | | 671,925 | |
| | | | | | | | |
| | | | | | $ | 1,809,360 | |
| | | | | | | | |
| Consumer Products – 0.1% | | | | | | | | |
| Whirlpool Corp., 8%, 2012 | | $ | 520,000 | | | $ | 560,361 | |
| | | | | | | | |
| Emerging Market Quasi-Sovereign – 1.2% | | | | | |
| Banco do Nordeste do Brasil (BNB), 3.625%, 2015 (n) | | $ | 269,000 | | | $ | 262,722 | |
| BNDES Participacoes S.A., 6.5%, 2019 (n) | | | 200,000 | | | | 219,500 | |
| Corporacion Nacional del Cobre de Chile, 3.75%, 2020 (n) | | | 324,000 | | | | 307,001 | |
| | | | | | | | |
| Issuer | | Shares/Par | | | Value ($) | |
| | | | | | | | |
| BONDS – continued | | | | | | | | |
| Emerging Market Quasi-Sovereign – continued | | | | | |
Empresa Nacional del Petroleo,
6.25%, 2019 | | $ | 169,000 | | | $ | 182,364 | |
| Pemex Project Funding Master Trust, 5.75%, 2018 | | | 503,000 | | | | 537,801 | |
| Petrobras International Finance Co., 7.875%, 2019 | | | 758,000 | | | | 896,085 | |
| Petroleos Mexicanos, 6%, 2020 | | | 300,000 | | | | 318,000 | |
| Petroleos Mexicanos, 5.5%, 2021 | | | 100,000 | | | | 101,250 | |
| Qatari Diar Finance Q.S.C., 5%, 2020 (n) | | | 618,000 | | | | 615,066 | |
| Qtel International Finance Ltd., 7.875%, 2019 (n) | | | 150,000 | | | | 179,215 | |
| Ras Laffan Liquefied Natural Gas Co. Ltd., 6.75%, 2019 (n) | | | 800,000 | | | | 927,953 | |
| SCF Capital Ltd., 5.375%, 2017 (n) | | | 458,000 | | | | 448,290 | |
| Sinochem Overseas Capital Co. Ltd., 4.5%, 2020 (n) | | | 100,000 | | | | 98,563 | |
| VTB Capital S.A., 6.465%, 2015 (n) | | | 334,000 | | | | 347,761 | |
| VTB Capital S.A., 6.551%, 2020 (n) | | | 392,000 | | | | 385,140 | |
| | | | | | | | |
| | | | | | $ | 5,826,711 | |
| | | | | | | | |
| Emerging Market Sovereign – 0.8% | | | | | | | | |
Federative Republic of Brazil,
5.625%, 2041 | | $ | 605,000 | | | $ | 600,463 | |
| Republic of Peru, 7.35%, 2025 | | | 600,000 | | | | 729,900 | |
| Republic of South Africa, 8%, 2018 | | ZAR | 14,720,000 | | | | 2,224,726 | |
| Republic of South Africa, 5.5%, 2020 | | $ | 400,000 | | | | 425,500 | |
| | | | | | | | |
| | | | | | $ | 3,980,589 | |
| | | | | | | | |
| Energy – Independent – 0.4% | | | | | | | | |
| Anadarko Petroleum Corp., 6.2%, 2040 | | $ | 435,000 | | | $ | 424,639 | |
Newfield Exploration Co.,
6.625%, 2016 | | | 1,490,000 | | | | 1,530,975 | |
| | | | | | | | |
| | | | | | $ | 1,955,614 | |
| | | | | | | | |
| Energy – Integrated – 0.1% | | | | | | | | |
| Hess Corp., 8.125%, 2019 | | $ | 480,000 | | | $ | 606,418 | |
| | | | | | | | |
| Food & Beverages – 0.7% | | | | | | | | |
Anheuser-Busch InBev S.A.,
5.375%, 2020 | | $ | 810,000 | | | $ | 877,706 | |
| Kraft Foods, Inc., 6.125%, 2018 | | | 470,000 | | | | 536,879 | |
| Kraft Foods, Inc., 6.5%, 2040 | | | 578,000 | | | | 647,724 | |
| Miller Brewing Co., 5.5%, 2013 (n) | | | 600,000 | | | | 651,238 | |
| Tyson Foods, Inc., 6.6%, 2016 | | | 713,000 | | | | 782,072 | |
| | | | | | | | |
| | | | | | $ | 3,495,619 | |
| | | | | | | | |
| Food & Drug Stores – 0.1% | | | | | | | | |
| CVS Caremark Corp., 5.75%, 2017 | | $ | 610,000 | | | $ | 678,717 | |
| | | | | | | | |
| Forest & Paper Products – 0.1% | | | | | |
| Georgia-Pacific Corp., 5.4%, 2020 (n) | | $ | 46,000 | | | $ | 45,479 | |
Votorantim Participacoes S.A.,
6.75%, 2021 (n) | | | 300,000 | | | | 313,500 | |
| | | | | | | | |
| | | | | | $ | 358,979 | |
| | | | | | | | |
11
MFS Global Tactical Allocation Portfolio
Portfolio of Investments – continued
| | | | | | | | |
| Issuer | | Shares/Par | | | Value ($) | |
| | | | | | | | |
| BONDS – continued | | | | | | | | |
| Gaming & Lodging – 0.2% | | | | | | | | |
Host Hotels & Resorts, Inc.,
6.75%, 2016 | | $ | 1,080,000 | | | $ | 1,102,950 | |
| | | | | | | | |
| Insurance – 0.6% | | | | | | | | |
| ING Groep N.V., 5.775% to 2015, FRN to 2049 | | $ | 810,000 | | | $ | 696,600 | |
Prudential Financial, Inc.,
5.375%, 2020 | | | 660,000 | | | | 689,669 | |
| Unum Group, 7.125%, 2016 | | | 800,000 | | | | 898,568 | |
UnumProvident Corp.,
6.85%, 2015 (n) | | | 696,000 | | | | 772,064 | |
| | | | | | | | |
| | | | | | $ | 3,056,901 | |
| | | | | | | | |
| Insurance – Property & Casualty – 0.8% | | | | | |
AXIS Capital Holdings Ltd.,
5.75%, 2014 | | $ | 320,000 | | | $ | 340,276 | |
| Chubb Corp., 6.375% to 2017, FRN to 2067 | | | 1,210,000 | | | | 1,261,425 | |
| CNA Financial Corp., 5.875%, 2020 | | | 1,000,000 | | | | 995,673 | |
| ZFS Finance USA Trust II, 6.45% to 2016, FRN to 2065 (n) | | | 1,500,000 | | | | 1,475,625 | |
| | | | | | | | |
| | | | | | $ | 4,072,999 | |
| | | | | | | | |
| International Market Quasi-Sovereign – 0.7% | | | | | |
Canada Housing Trust,
4.6%, 2011 (n) | | CAD | 803,000 | | | $ | 825,589 | |
| Eksportfinans A.S.A., 1.875%, 2013 | | $ | 1,795,000 | | | | 1,815,924 | |
Irish Life & Permanent PLC,
3.6%, 2013 (e)(n) | | | 700,000 | | | | 627,913 | |
| | | | | | | | |
| | | | | | $ | 3,269,426 | |
| | | | | | | | |
| International Market Sovereign - 23.4% | | | | | |
| Federal Republic of Germany, 3.75%, 2013 | | EUR | 1,903,000 | | | $ | 2,714,020 | |
| Federal Republic of Germany, 3.75%, 2015 | | EUR | 492,000 | | | | 711,332 | |
| Federal Republic of Germany, 4.25%, 2018 | | EUR | 4,959,000 | | | | 7,332,390 | |
| Federal Republic of Germany, 6.25%, 2030 | | EUR | 1,303,000 | | | | 2,398,240 | |
| Government of Canada, 4.5%, 2015 | | CAD | 798,000 | | | | 876,572 | |
Government of Canada,
4.25%, 2018 | | CAD | 7,309,000 | | | | 8,035,048 | |
| Government of Japan, 1.3%, 2014 | | JPY | 934,000,000 | | | | 11,934,044 | |
| Government of Japan, 1.7%, 2017 | | JPY | 1,148,000,000 | | | | 15,103,220 | |
| Government of Japan, 1.1%, 2020 | | JPY | 359,000,000 | | | | 4,436,142 | |
| Government of Japan, 2.1%, 2024 | | JPY | 603,000,000 | | | | 7,989,843 | |
| Government of Japan, 2.2%, 2027 | | JPY | 146,950,000 | | | | 1,936,826 | |
| Government of Japan, 2.4%, 2037 | | JPY | 129,000,000 | | | | 1,727,535 | |
| Kingdom of Spain, 4.6%, 2019 | | EUR | 1,773,000 | | | | 2,251,522 | |
Kingdom of the Netherlands,
3.75%, 2014 | | EUR | 5,129,000 | | | | 7,385,332 | |
Kingdom of the Netherlands,
5.5%, 2028 | | EUR | 690,000 | | | | 1,150,936 | |
| Republic of Austria, 4.65%, 2018 | | EUR | 1,775,000 | | | | 2,619,064 | |
| Republic of Finland, 3.875%, 2017 | | EUR | 2,473,000 | | | | 3,562,963 | |
| | | | | | | | |
| Issuer | | Shares/Par | | | Value ($) | |
| | | | | | | | |
| BONDS – continued | | | | | | | | |
| International Market Sovereign – continued | | | | | |
| Republic of France, 6%, 2025 | | EUR | 1,213,000 | | | $ | 2,050,381 | |
| Republic of France, 4.75%, 2035 | | EUR | 1,697,000 | | | | 2,569,532 | |
| Republic of Italy, 4.75%, 2013 | | EUR | 4,016,000 | | | | 5,561,709 | |
| Republic of Italy, 5.25%, 2017 | | EUR | 3,996,000 | | | | 5,653,304 | |
| United Kingdom Treasury, 8%, 2015 | | GBP | 3,259,000 | | | | 6,450,055 | |
| United Kingdom Treasury, 8%, 2021 | | GBP | 2,548,000 | | | | 5,533,572 | |
| United Kingdom Treasury, 4.25%, 2027 | | GBP | 1,424,000 | | | | 2,277,659 | |
| United Kingdom Treasury, 4.25%, 2036 | | GBP | 1,056,000 | | | | 1,657,934 | |
| | | | | | | | |
| | | | | | $ | 113,919,175 | |
| | | | | | | | |
| Local Authorities – 0.1% | | | | | | | | |
Utah Transit Authority Sales Tax Rev. (Build America Bonds), “B”,
5.937%, 2039 | | $ | 230,000 | | | $ | 241,790 | |
| | | | | | | | |
| Machinery & Tools – 0.2% | | | | | | | | |
Case New Holland, Inc.,
7.875%, 2017 (n) | | $ | 740,000 | | | $ | 808,450 | |
| | | | | | | | |
| Major Banks – 1.9% | | | | | | | | |
| Bank of America Corp., 7.625%, 2019 | | $ | 1,225,000 | | | $ | 1,410,508 | |
| BB&T Corp., 3.95%, 2016 | | | 820,000 | | | | 846,356 | |
| BNP Paribas, 7.195% to 2037, FRN to 2049 (n) | | | 1,000,000 | | | | 955,000 | |
| Credit Suisse (USA), Inc., 6%, 2018 | | | 985,000 | | | | 1,056,210 | |
| HSBC USA, Inc., 4.875%, 2020 | | | 870,000 | | | | 864,839 | |
| Merrill Lynch & Co., Inc., 6.15%, 2013 | | | 859,000 | | | | 921,713 | |
| Morgan Stanley, 7.3%, 2019 | | | 772,000 | | | | 868,993 | |
| PNC Financial Services Group, Inc., 5.125%, 2020 | | | 1,170,000 | | | | 1,219,482 | |
| UniCredito Luxembourg Finance S.A., 6%, 2017 (n) | | | 1,020,000 | | | | 997,460 | |
| | | | | | | | |
| | | | | | $ | 9,140,561 | |
| | | | | | | | |
| Metals & Mining – 1.1% | | | | | | | | |
| ArcelorMittal, 6.125%, 2018 | | $ | 270,000 | | | $ | 287,681 | |
| ArcelorMittal, 5.25%, 2020 | | | 640,000 | | | | 632,719 | |
| Freeport-McMoRan Copper & Gold, Inc., 8.25%, 2015 | | | 177,000 | | | | 186,514 | |
| Freeport-McMoRan Copper & Gold, Inc., 8.375%, 2017 | | | 378,000 | | | | 418,163 | |
| Gold Fields Orogen Holdings Ltd., 4.875%, 2020 (n) | | | 947,000 | | | | 905,932 | |
| Peabody Energy Corp., 7.375%, 2016 | | | 620,000 | | | | 688,200 | |
| Southern Copper Corp., 5.375%, 2020 | | | 150,000 | | | | 151,647 | |
| Southern Copper Corp., 6.75%, 2040 | | | 107,000 | | | | 110,798 | |
| Teck Resources Ltd., 10.25%, 2016 | | | 184,000 | | | | 227,700 | |
| Teck Resources Ltd., 10.75%, 2019 | | | 527,000 | | | | 685,100 | |
| Vale Overseas Ltd., 4.625%, 2020 | | | 210,000 | | | | 207,918 | |
| Vale Overseas Ltd., 6.875%, 2039 | | | 585,000 | | | | 646,384 | |
| | | | | | | | |
| | | | | | $ | 5,148,756 | |
| | | | | | | | |
| Mortgage-Backed – 6.7% | | | | | | | | |
| Fannie Mae, 4.771%, 2012 | | $ | 181,686 | | | $ | 189,427 | |
| Fannie Mae, 5.37%, 2013 | | | 140,278 | | | | 147,381 | |
| Fannie Mae, 4.78%, 2015 | | | 93,544 | | | | 100,886 | |
| Fannie Mae, 4.856%, 2015 | | | 74,404 | | | | 80,009 | |
12
MFS Global Tactical Allocation Portfolio
Portfolio of Investments – continued
| | | | | | | | |
| Issuer | | Shares/Par | | | Value ($) | |
| | | | | | | | |
| BONDS – continued | | | | | | | | |
| Mortgage-Backed – continued | | | | | | | | |
| Fannie Mae, 4.997%, 2015 | | $ | 293,986 | | | $ | 320,124 | |
| Fannie Mae, 5.5%, 2015 - 2037 | | | 687,519 | | | | 737,304 | |
| Fannie Mae, 5.09%, 2016 | | | 99,000 | | | | 107,469 | |
| Fannie Mae, 5.424%, 2016 | | | 99,291 | | | | 108,677 | |
| Fannie Mae, 4.99%, 2017 | | | 39,987 | | | | 43,680 | |
| Fannie Mae, 5.05%, 2017 | | | 88,936 | | | | 96,529 | |
| Fannie Mae, 5.298%, 2018 | | | 717,907 | | | | 776,305 | |
| Fannie Mae, 4.57%, 2019 | | | 244,937 | | | | 256,356 | |
| Fannie Mae, 6.16%, 2019 | | | 46,055 | | | | 51,588 | |
| Fannie Mae, 4%, 2025 - 2040 | | | 5,678,462 | | | | 5,676,116 | |
| Fannie Mae, 4.5%, 2025 - 2040 | | | 852,348 | | | | 883,221 | |
| Fannie Mae, 6%, 2037 | | | 479,944 | | | | 522,258 | |
| Fannie Mae, 5%, 2040 | | | 2,863,299 | | | | 3,012,265 | |
| Freddie Mac, 4.186%, 2019 | | | 650,000 | | | | 659,064 | |
| Freddie Mac, 5.085%, 2019 | | | 30,000 | | | | 31,719 | |
| Freddie Mac, 2.757%, 2020 | | | 341,994 | | | | 338,383 | |
| Freddie Mac, 5%, 2022 - 2040 | | | 5,459,280 | | | | 5,752,384 | |
| Freddie Mac, 4%, 2025 | | | 1,283,953 | | | | 1,322,672 | |
| Freddie Mac, 5.5%, 2037 | | | 423,778 | | | | 454,917 | |
| Freddie Mac, 4.5%, 2040 | | | 9,935,324 | | | | 10,190,517 | |
| Ginnie Mae, 5%, 2040 | | | 727,621 | | | | 774,080 | |
| | | | | | | | |
| | | | | | $ | 32,633,331 | |
| | | | | | | | |
| Natural Gas – Pipeline – 0.2% | | | | | | | | |
| Williams Partners LP, 5.25%, 2020 | | $ | 761,000 | | | $ | 788,853 | |
| | | | | | | | |
| Network & Telecom – 0.3% | | | | | | | | |
| CenturyLink, Inc., 7.6%, 2039 | | $ | 570,000 | | | $ | 574,501 | |
| Telecom Italia Capital, 7.175%, 2019 | | | 860,000 | | | | 920,142 | |
| | | | | | | | |
| | | | | | $ | 1,494,643 | |
| | | | | | | | |
| Oils – 0.2% | | | | | | | | |
LUKOIL International Finance B.V.,
6.125%, 2020 (n) | | $ | 1,067,000 | | | $ | 1,068,280 | |
| | | | | | | | |
| Other Banks & Diversified Financials – 0.4% | | | | | |
Banco Santander U.S. Debt S.A.U.,
3.781%, 2015 (n) | | $ | 800,000 | | | $ | 751,666 | |
| Citigroup, Inc., 6.125%, 2018 | | | 1,275,000 | | | | 1,396,797 | |
| | | | | | | | |
| | | | | | $ | 2,148,463 | |
| | | | | | | | |
| Real Estate – 0.2% | | | | | | | | |
Simon Property Group, Inc., REIT,
5.65%, 2020 | | $ | 830,000 | | | $ | 897,839 | |
| | | | | | | | |
| Retailers – 0.1% | | | | | | | | |
| Limited Brands, Inc., 7%, 2020 | | $ | 620,000 | | | $ | 654,100 | |
| | | | | | | | |
| Specialty Stores – 0.1% | | | | | | | | |
| Best Buy Co., Inc., 6.75%, 2013 | | $ | 490,000 | | | $ | 542,027 | |
| | | | | | | | |
| Tobacco – 0.4% | | | | | | | | |
| Altria Group, Inc., 9.7%, 2018 | | $ | 1,055,000 | | | $ | 1,391,783 | |
| Lorillard Tobacco Co., 6.875%, 2020 | | | 440,000 | | | | 454,447 | |
| | | | | | | | |
| | | | | | $ | 1,846,230 | |
| | | | | | | | |
| | | | | | | | |
| Issuer | | Shares/Par | | | Value ($) | |
| | | | | | | | |
| BONDS – continued | | | | | | | | |
| U.S. Government Agencies and Equivalents – 0.6% | | | | | |
Aid-Egypt,
4.45%, 2015 | | $ | 649,000 | | | $ | 711,343 | |
FDIC Structured Sale Guarantee Note,
0%, 2012 (n) | | | 131,000 | | | | 127,513 | |
Small Business Administration,
5.09%, 2025 | | | 45,287 | | | | 48,504 | |
Small Business Administration,
5.21%, 2026 | | | 1,516,590 | | | | 1,627,981 | |
Small Business Administration,
5.31%, 2027 | | | 343,745 | | | | 368,644 | |
| | | | | | | | |
| | | | | | $ | 2,883,985 | |
| | | | | | | | |
| U.S. Treasury Obligations – 8.8% | | | | | | | | |
| U.S. Treasury Bonds, 6.875%, 2025 | | $ | 1,472,000 | | | $ | 1,967,650 | |
| U.S. Treasury Bonds, 4.5%, 2039 | | | 507,000 | | | | 520,626 | |
| U.S. Treasury Notes, 4.75%, 2012 (f) | | | 2,277,000 | | | | 2,384,090 | |
| U.S. Treasury Notes, 4.125%, 2015 (f) | | | 641,000 | | | | 705,851 | |
| U.S. Treasury Notes, 4.75%, 2017 (f) | | | 11,064,000 | | | | 12,546,399 | |
| U.S. Treasury Notes, 3.5%, 2020 | | | 18,266,000 | | | | 18,711,325 | |
| U.S. Treasury Notes, TIPS, 1.25%, 2020 | | | 5,780,543 | | | | 5,918,732 | |
| | | | | | | | |
| | | | | | $ | 42,754,673 | |
| | | | | | | | |
| Utilities – Electric Power – 0.6% | | | | | | | | |
Enel Finance International S.A.,
6%, 2039 (n) | | $ | 894,000 | | | $ | 801,922 | |
| Progress Energy, Inc., 7.05%, 2019 | | | 1,350,000 | | | | 1,601,648 | |
| TECO Energy, Inc., 6.572%, 2017 | | | 461,000 | | | | 522,238 | |
| | | | | | | | |
| | | | | | $ | 2,925,808 | |
| | | | | | | | |
Total Bonds
(Identified Cost, $263,326,575) | | | | | | $ | 264,464,134 | |
| | | | | | | | |
| Issuer/Expiration Date/ Strike Price | | Number of
Contracts | | | | |
| | |
| PUT OPTIONS PURCHASED – 0.0% | | | | | | | | |
| AEX Index - January 2011 @ $280 | | | 83 | | | $ | 555 | |
| S&P 500 Index - June 2011 @ $1,125 | | | 75 | | | | 230,250 | |
| | | | | | | | |
Total Put Options Purchased
(Identified Cost, $243,450) | | | | | | $ | 230,805 | |
| | | | | | | | |
| Issuer | | Shares/Par | | | | |
| | |
| MONEY MARKET FUNDS (v) – 10.6% | | | | | | | | |
| MFS Institutional Money Market Portfolio, 0.18%, at Cost and Net Asset Value | | | 51,691,815 | | | $ | 51,691,815 | |
| | | | | | | | |
Total Investments
(Identified Cost, $471,015,754) | | | | | | $ | 479,785,181 | |
| | | | | | | | |
OTHER ASSETS, LESS
LIABILITIES – 1.6% | | | | | | | 7,669,246 | |
| | | | | | | | |
| Net Assets – 100.0% | | | | | | $ | 487,454,427 | |
| | | | | | | | |
13
MFS Global Tactical Allocation Portfolio
Portfolio of Investment – continued
| (a) | | Non-income producing security. |
| (e) | | Guaranteed by Minister for Finance of Ireland. |
| (f) | | All or a portion of the security has been segregated as collateral for open futures contracts. |
| (i) | | Interest only security for which the fund receives interest on notional principal (Par amount). Par amount shown is the notional principal and does not reflect the cost of the security. |
| (n) | | Securities exempt from registration under Rule 144A of the Securities Act of 1933. These securities may be sold in the ordinary course of business in transactions exempt from registration, normally to qualified institutional buyers. At period end, the aggregate value of these securities was $16,598,909, representing 3.4% of net assets. |
| (s) | | Security or a portion of the security was pledged to cover collateral requirements for securities sold short. At December 31, 2010, the value of securities pledged amounted to $322,210. At December 31, 2010, the fund had no short sales outstanding. |
| (v) | | Underlying fund that is available only to investment companies managed by MFS. The rate quoted is the annualized seven-day yield of the fund at period end. |
| (z) | | Restricted securities are not registered under the Securities Act of 1933 and are subject to legal restrictions on resale. These securities generally may be resold in transactions exempt from registration or to the public if the securities are subsequently registered. Disposal of these securities may involve time-consuming negotiations and prompt sale at an acceptable price may be difficult. The fund holds the following restricted securities: |
| | | | | | | | | | |
| Restricted Securities | | Acquisition
Date | | Cost | | | Value | |
| Bayview Commercial Asset Trust, FRN, 1.687%, 2023 | | 5/25/06 | | | $153,707 | | | | $139,904 | |
| Commercial Mortgage Asset Trust, FRN, 0.84%, 2032 | | 8/25/03 | | | 45,256 | | | | 46,300 | |
| Total Restricted Securities | | | | | | | | | $186,204 | |
| % of Net Assets | | | | | | | | | 0.0% | |
The following abbreviations are used in this report and are defined:
| ADR | | American Depository Receipt |
| FRN | | Floating Rate Note. Interest rate resets periodically and may not be the rate reported at period end. |
| IPS | | International Preference Stock |
| PLC | | Public Limited Company |
| REIT | | Real Estate Investment Trust |
| TIPS | | Treasury Inflation Protected Security |
Abbreviations indicate amounts shown in currencies other than the U.S. dollar. All amounts are stated in U.S. dollars unless otherwise indicated. A list of abbreviations is shown below:
| CNY | | Chinese Yuan Renminbi |
14
MFS Global Tactical Allocation Portfolio
Portfolio of Investments – continued
Derivative Contracts at 12/31/10
Forward Foreign Currency Exchange Contracts at 12/31/10
| | | | | | | | | | | | | | | | | | | | | | | | |
| Type | | Currency | | | Counterparty | | Contracts to
Deliver/Receive | | Settlement Date
Range | | In Exchange For | | | Contracts
at Value | | | Net Unrealized
Appreciation
(Depreciation) | |
| Asset Derivatives | | | | | | | | | | | | | | | | | | | | | | |
| BUY | | | AUD | | | Barclays Bank PLC | | 191,000 | | 1/12/11 | | $ | 190,393 | | | $ | 195,185 | | | $ | 4,792 | |
| BUY | | | AUD | | | Citibank N.A. | | 403,000 | | 1/12/11 | | | 394,192 | | | | 411,831 | | | | 17,639 | |
| BUY | | | AUD | | | Credit Suisse Group | | 247,000 | | 1/12/11 | | | 242,393 | | | | 252,412 | | | | 10,019 | |
| BUY | | | AUD | | | Deutsche Bank AG | | 1,565,804 | | 1/12/11-2/09/11 | | | 1,547,081 | | | | 1,595,342 | | | | 48,261 | |
| BUY | | | AUD | | | Goldman Sachs International | | 1,763,836 | | 1/12/11-2/09/11 | | | 1,735,460 | | | | 1,796,768 | | | | 61,308 | |
| BUY | | | AUD | | | Royal Bank of Scotland Group PLC | | 167,000 | | 1/12/11 | | | 164,727 | | | | 170,659 | | | | 5,932 | |
| BUY | | | AUD | | | UBS AG | | 126,000 | | 1/12/11 | | | 124,060 | | | | 128,761 | | | | 4,701 | |
| BUY | | | AUD | | | Westpac Banking Corp | | 2,341,345 | | 1/12/11 | | | 2,275,717 | | | | 2,392,650 | | | | 116,933 | |
| BUY | | | CAD | | | Barclays Bank PLC | | 583,133 | | 1/12/11 | | | 580,372 | | | | 586,388 | | | | 6,016 | |
| BUY | | | CAD | | | Citibank N.A. | | 12,821,282 | | 1/12/11-2/09/11 | | | 12,659,825 | | | | 12,886,027 | | | | 226,202 | |
| BUY | | | CAD | | | Deutsche Bank AG | | 402,000 | | 1/12/11 | | | 396,807 | | | | 404,244 | | | | 7,437 | |
| BUY | | | CAD | | | Goldman Sachs International | | 4,835,160 | | 1/12/11 | | | 4,730,435 | | | | 4,862,146 | | | | 131,711 | |
| BUY | | | CAD | | | UBS AG | | 1,042,000 | | 1/12/11 | | | 1,030,732 | | | | 1,047,816 | | | | 17,084 | |
| BUY | | | CHF | | | Barclays Bank PLC | | 256,000 | | 1/12/11 | | | 267,473 | | | | 273,824 | | | | 6,351 | |
| BUY | | | CHF | | | Citibank N.A. | | 78,000 | | 1/12/11 | | | 78,561 | | | | 83,431 | | | | 4,870 | |
| BUY | | | CHF | | | Credit Suisse Group | | 309,000 | | 1/12/11 | | | 320,432 | | | | 330,514 | | | | 10,082 | |
| BUY | | | CHF | | | Deutsche Bank AG | | 1,388,000 | | 1/10/11-1/12/11 | | | 1,445,378 | | | | 1,484,606 | | | | 39,228 | |
| BUY | | | CHF | | | JPMorgan Chase Bank N.A. | | 1,712,000 | | 2/09/11 | | | 1,752,000 | | | | 1,831,829 | | | | 79,829 | |
| BUY | | | CHF | | | UBS AG | | 1,551,000 | | 1/12/11 | | | 1,605,191 | | | | 1,658,988 | | | | 53,797 | |
| BUY | | | CLP | | | Barclays Bank PLC | | 385,437,000 | | 1/10/11 | | | 809,902 | | | | 823,192 | | | | 13,290 | |
| BUY | | | CLP | | | JPMorgan Chase Bank N.A. | | 344,009,000 | | 1/10/11-1/20/11 | | | 729,705 | | | | 734,277 | | | | 4,572 | |
| BUY | | | CNY | | | JPMorgan Chase Bank N.A. | | 8,166,000 | | 1/06/11-4/18/11 | | | 1,229,218 | | | | 1,239,061 | | | | 9,843 | |
| BUY | | | DKK | | | Barclays Bank PLC | | 495,000 | | 1/12/11 | | | 87,256 | | | | 88,739 | | | | 1,483 | |
| BUY | | | DKK | | | Deutsche Bank AG | | 489,000 | | 2/09/11 | | | 87,159 | | | | 87,657 | | | | 498 | |
| SELL | | | DKK | | | Goldman Sachs International | | 5,599,259 | | 2/09/11 | | | 1,049,130 | | | | 1,003,712 | | | | 45,418 | |
| SELL | | | DKK | | | JPMorgan Chase Bank N.A. | | 249,000 | | 1/12/11 | | | 47,012 | | | | 44,638 | | | | 2,374 | |
| SELL | | | DKK | | | UBS AG | | 244,860 | | 2/09/11 | | | 46,000 | | | | 43,893 | | | | 2,107 | |
| BUY | | | EUR | | | Barclays Bank PLC | | 1,962,000 | | 1/12/11-3/15/11 | | | 2,594,884 | | | | 2,621,432 | | | | 26,548 | |
| BUY | | | EUR | | | Citibank N.A. | | 1,042,000 | | 1/12/11 | | | 1,379,423 | | | | 1,392,406 | | | | 12,983 | |
| BUY | | | EUR | | | Credit Suisse Group | | 314,000 | | 1/12/11 | | | 410,869 | | | | 419,593 | | | | 8,724 | |
| BUY | | | EUR | | | Deutsche Bank AG | | 2,909,000 | | 1/12/11-3/15/11 | | | 3,824,825 | | | | 3,887,177 | | | | 62,352 | |
| BUY | | | EUR | | | Goldman Sachs International | | 954,000 | | 1/12/11 | | | 1,263,856 | | | | 1,274,813 | | | | 10,957 | |
| BUY | | | EUR | | | HSBC Bank | | 278,000 | | 1/12/11 | | | 366,645 | | | | 371,486 | | | | 4,841 | |
| BUY | | | EUR | | | JPMorgan Chase Bank N.A. | | 1,607,475 | | 1/12/11 | | | 2,095,545 | | | | 2,148,040 | | | | 52,495 | |
| BUY | | | EUR | | | Royal Bank of Scotland Group PLC | | 510,000 | | 1/12/11 | | | 679,475 | | | | 681,504 | | | | 2,029 | |
| BUY | | | EUR | | | UBS AG | | 4,559,557 | | 1/12/11-3/15/11 | | | 6,031,900 | | | | 6,092,149 | | | | 60,249 | |
| SELL | | | EUR | | | Citibank N.A. | | 4,391,882 | | 2/09/11 | | | 6,149,000 | | | | 5,868,424 | | | | 280,576 | |
| SELL | | | EUR | | | Deutsche Bank AG | | 3,220,923 | | 1/10/11-1/12/11 | | | 4,454,573 | | | | 4,304,066 | | | | 150,507 | |
| SELL | | | EUR | | | Goldman Sachs International | | 42,453,485 | | 1/12/11-2/09/11 | | | 59,528,855 | | | | 56,726,258 | | | | 2,802,597 | |
| SELL | | | EUR | | | HSBC Bank | | 1,326,000 | | 1/12/11 | | | 1,819,308 | | | | 1,771,910 | | | | 47,398 | |
| SELL | | | EUR | | | JPMorgan Chase Bank N.A. | | 1,861,000 | | 1/12/11 | | | 2,615,636 | | | | 2,486,821 | | | | 128,815 | |
| SELL | | | EUR | | | UBS AG | | 3,628,720 | | 1/12/11-3/15/11 | | | 4,867,228 | | | | 4,847,994 | | | | 19,234 | |
| BUY | | | GBP | | | Barclays Bank PLC | | 516,000 | | 1/12/11 | | | 799,721 | | | | 804,454 | | | | 4,733 | |
| BUY | | | GBP | | | Goldman Sachs International | | 323,000 | | 1/12/11 | | | 497,824 | | | | 503,563 | | | | 5,739 | |
| SELL | | | GBP | | | Barclays Bank PLC | | 1,642,604 | | 1/12/11 | | | 2,605,689 | | | | 2,560,850 | | | | 44,839 | |
| SELL | | | GBP | | | Deutsche Bank AG | | 6,572,667 | | 2/09/11 | | | 10,521,000 | | | | 10,244,778 | | | | 276,222 | |
| SELL | | | GBP | | | Goldman Sachs International | | 258,000 | | 1/12/11 | | | 404,850 | | | | 402,227 | | | | 2,623 | |
| SELL | | | GBP | | | JPMorgan Chase Bank N.A. | | 1,438,499 | | 1/12/11 | | | 2,297,902 | | | | 2,242,647 | | | | 55,255 | |
| SELL | | | GBP | | | UBS AG | | 15,000 | | 1/12/11 | | | 24,062 | | | | 23,385 | | | | 677 | |
| BUY | | | ILS | | | HSBC Bank | | 2,511,000 | | 1/07/11 | | | 694,490 | | | | 707,590 | | | | 13,100 | |
| BUY | | | JPY | | | Barclays Bank PLC | | 197,029,000 | | 1/12/11 | | | 2,372,071 | | | | 2,426,947 | | | | 54,876 | |
15
MFS Global Tactical Allocation Portfolio
Portfolio of Investments – continued
Forward Foreign Currency Exchange Contracts at 12/31/10 – continued
| | | | | | | | | | | | | | | | | | | | | | | | |
| Type | | Currency | | | Counterparty | | Contracts to
Deliver/Receive | | Settlement Date
Range | | In Exchange For | | | Contracts
at Value | | | Net Unrealized
Appreciation
(Depreciation) | |
| Asset Derivatives – continued | | | | | | | | | | | | | | | | |
| BUY | | | JPY | | | Citibank N.A. | | 280,015,000 | | 1/12/11 | | $ | 3,384,197 | | | $ | 3,449,144 | | | $ | 64,947 | |
| BUY | | | JPY | | | Credit Suisse Group | | 155,966,000 | | 1/12/11 | | | 1,896,518 | | | | 1,921,144 | | | | 24,626 | |
| BUY | | | JPY | | | Deutsche Bank AG | | 120,123,000 | | 1/12/11 | | | 1,446,741 | | | | 1,479,641 | | | | 32,900 | |
| BUY | | | JPY | | | Goldman Sachs International | | 19,565,000 | | 1/12/11 | | | 233,729 | | | | 240,996 | | | | 7,267 | |
| BUY | | | JPY | | | HSBC Bank | | 53,520,000 | | 1/12/11 | | | 638,424 | | | | 659,244 | | | | 20,820 | |
| BUY | | | JPY | | | JPMorgan Chase Bank N.A. | | 1,176,670,517 | | 1/12/11 | | | 14,387,716 | | | | 14,493,890 | | | | 106,174 | |
| BUY | | | JPY | | | Royal Bank of Scotland Group PLC | | 88,336,000 | | 1/12/11 | | | 1,059,227 | | | | 1,088,097 | | | | 28,870 | |
| BUY | | | JPY | | | UBS AG | | 214,465,000 | | 1/12/11 | | | 2,568,437 | | | | 2,641,718 | | | | 73,281 | |
| SELL | | | JPY | | | JPMorgan Chase Bank N.A. | | 3,192,001,319 | | 1/12/11-2/09/11 | | | 39,588,209 | | | | 39,329,458 | | | | 258,751 | |
| SELL | | | JPY | | | Royal Bank of Scotland Group PLC | | 485,807,386 | | 2/09/11 | | | 6,022,000 | | | | 5,985,823 | | | | 36,177 | |
| BUY | | | KRW | | | HSBC Bank | | 135,660,000 | | 1/18/11 | | | 117,781 | | | | 119,446 | | | | 1,665 | |
| BUY | | | KRW | | | JPMorgan Chase Bank N.A. | | 1,038,575,000 | | 1/05/11 | | | 891,419 | | | | 915,076 | | | | 23,657 | |
| SELL | | | KRW | | | JPMorgan Chase Bank N.A. | | 4,701,486,500 | | 1/05/11-1/27/11 | | | 4,157,467 | | | | 4,139,778 | | | | 17,689 | |
| BUY | | | MXN | | | Citibank N.A. | | 3,228,000 | | 1/12/11 | | | 260,121 | | | | 261,239 | | | | 1,118 | |
| BUY | | | MXN | | | HSBC Bank | | 8,541,000 | | 1/12/11 | | | 687,349 | | | | 691,214 | | | | 3,865 | |
| BUY | | | MXN | | | JPMorgan Chase Bank N.A. | | 8,664,000 | | 1/12/11 | | | 698,626 | | | | 701,169 | | | | 2,543 | |
| BUY | | | MYR | | | JPMorgan Chase Bank N.A. | | 1,864,000 | | 1/21/11 | | | 590,790 | | | | 603,767 | | | | 12,977 | |
| BUY | | | NOK | | | Citibank N.A. | | 61,633,479 | | 2/09/11 | | | 10,482,000 | | | | 10,543,950 | | | | 61,950 | |
| BUY | | | NOK | | | Credit Suisse Group | | 1,564,000 | | 1/12/11 | | | 266,881 | | | | 267,931 | | | | 1,050 | |
| BUY | | | NZD | | | Barclays Bank PLC | | 612,000 | | 1/12/11-4/15/11 | | | 461,098 | | | | 474,956 | | | | 13,858 | |
| BUY | | | NZD | | | Deutsche Bank AG | | 86,000 | | 4/15/11 | | | 63,391 | | | | 66,479 | | | | 3,088 | |
| BUY | | | NZD | | | Goldman Sachs International | | 16,448,917 | | 2/09/11 | | | 12,600,363 | | | | 12,782,221 | | | | 181,858 | |
| BUY | | | NZD | | | JPMorgan Chase Bank N.A. | | 11,366,357 | | 2/09/11 | | | 8,639,000 | | | | 8,832,636 | | | | 193,636 | |
| BUY | | | PHP | | | Deutsche Bank AG | | 5,773,000 | | 1/18/11 | | | 130,937 | | | | 131,794 | | | | 857 | |
| BUY | | | PHP | | | JPMorgan Chase Bank N.A. | | 63,420,000 | | 1/28/11 | | | 1,436,467 | | | | 1,447,999 | | | | 11,532 | |
| BUY | | | PLN | | | Barclays Bank PLC | | 355,000 | | 1/27/11 | | | 116,555 | | | | 119,742 | | | | 3,187 | |
| BUY | | | SEK | | | Barclays Bank PLC | | 547,000 | | 1/12/11 | | | 78,699 | | | | 81,309 | | | | 2,610 | |
| BUY | | | SEK | | | Citibank N.A. | | 1,069,000 | | 1/12/11 | | | 157,204 | | | | 158,902 | | | | 1,698 | |
| BUY | | | SEK | | | Credit Suisse Group | | 983,000 | | 1/12/11 | | | 143,409 | | | | 146,118 | | | | 2,709 | |
| BUY | | | SEK | | | Deutsche Bank AG | | 13,299,113 | | 1/12/11-2/09/11 | | | 1,942,097 | | | | 1,975,063 | | | | 32,966 | |
| BUY | | | SEK | | | Goldman Sachs International | | 1,014,000 | | 2/09/11 | | | 148,158 | | | | 150,584 | | | | 2,426 | |
| BUY | | | SEK | | | UBS AG | | 523,000 | | 2/09/11 | | | 76,007 | | | | 77,668 | | | | 1,661 | |
| SELL | | | SEK | | | Credit Suisse Group | | 1,060,000 | | 1/12/11 | | | 157,939 | | | | 157,564 | | | | 375 | |
| SELL | | | SEK | | | JPMorgan Chase Bank N.A. | | 41,825,025 | | 2/09/11 | | | 6,290,424 | | | | 6,211,221 | | | | 79,203 | |
| BUY | | | SGD | | | Deutsche Bank AG | | 398,000 | | 1/12/11-2/07/11 | | | 306,671 | | | | 310,134 | | | | 3,463 | |
| BUY | | | SGD | | | Goldman Sachs International | | 859,000 | | 1/12/11-2/07/11 | | | 657,765 | | | | 669,354 | | | | 11,589 | |
| BUY | | | SGD | | | HSBC Bank | | 793,000 | | 1/12/11 | | | 612,781 | | | | 617,921 | | | | 5,140 | |
| BUY | | | SGD | | | JPMorgan Chase Bank N.A. | | 1,677,000 | | 1/12/11-2/07/11 | | | 1,287,040 | | | | 1,306,775 | | | | 19,735 | |
| BUY | | | THB | | | JPMorgan Chase Bank N.A. | | 19,071,000 | | 2/28/11 | | | 631,909 | | | | 632,046 | | | | 137 | |
| SELL | | | THB | | | HSBC Bank | | 2,714,000 | | 2/14/11 | | | 90,166 | | | | 89,978 | | | | 188 | |
| SELL | | | TRY | | | Citibank N.A. | | 1,138,000 | | 2/22/11 | | | 749,892 | | | | 732,603 | | | | 17,289 | |
| SELL | | | TRY | | | HSBC Bank | | 1,004,000 | | 2/22/11 | | | 658,361 | | | | 646,339 | | | | 12,022 | |
| BUY | | | TWD | | | Barclays Bank PLC | | 5,478,000 | | 1/27/11 | | | 180,405 | | | | 188,000 | | | | 7,595 | |
| BUY | | | TWD | | | Credit Suisse Group | | 4,995,000 | | 1/27/11 | | | 166,361 | | | | 171,424 | | | | 5,063 | |
| BUY | | | TWD | | | JPMorgan Chase Bank N.A. | | 69,500,000 | | 1/27/11 | | | 2,286,936 | | | | 2,385,182 | | | | 98,246 | |
| BUY | | | ZAR | | | Goldman Sachs International | | 1,691,000 | | 1/18/11 | | | 246,903 | | | | 256,164 | | | | 9,261 | |
| | | | | | | | | | | | | | | | | | | | | | | | |
| | | | | | | | | | | | | | | | | | | | | | $ | 6,561,865 | |
| | | | | | | | | | | | | | | | | | | | | | | | |
| Liability Derivatives | | | | | | | | | | | | | | | | | | | |
| SELL | | | AUD | | | Goldman Sachs International | | 3,695,927 | | 2/09/11 | | $ | 3,647,658 | | | $ | 3,763,835 | | | $ | (116,177 | ) |
| SELL | | | AUD | | | Royal Bank of Scotland Group PLC | | 442,000 | | 1/12/11 | | | 432,848 | | | | 451,686 | | | | (18,838 | ) |
| SELL | | | CAD | | | Barclays Bank PLC | | 148,000 | | 1/12/11 | | | 146,471 | | | | 148,826 | | | | (2,355 | ) |
16
MFS Global Tactical Allocation Portfolio
Portfolio of Investments – continued
Forward Foreign Currency Exchange Contracts at 12/31/10 – continued
| | | | | | | | | | | | | | | | | | | | | | | | |
| Type | | Currency | | | Counterparty | | Contracts to
Deliver/Receive | | Settlement Date
Range | | In Exchange For | | | Contracts
at Value | | | Net Unrealized
Appreciation
(Depreciation) | |
| Liability Derivatives – continued | | | | | | | | | | | | | | |
| SELL | | | CAD | | | Citibank N.A. | | 5,883,626 | | 2/09/11 | | $ | 5,847,000 | | | $ | 5,913,215 | | | $ | (66,215 | ) |
| SELL | | | CAD | | | Credit Suisse Group | | 6,921,175 | | 1/12/11 | | | 6,881,469 | | | | 6,959,804 | | | | (78,335 | ) |
| SELL | | | CAD | | | Goldman Sachs International | | 19,091,057 | | 1/12/11-2/09/11 | | | 18,863,307 | | | | 19,187,646 | | | | (324,339 | ) |
| SELL | | | CAD | | | UBS AG | | 865,490 | | 1/12/11 | | | 861,974 | | | | 870,321 | | | | (8,347 | ) |
| SELL | | | CHF | | | Credit Suisse Group | | 5,473,285 | | 2/09/11 | | | 5,576,000 | | | | 5,856,382 | | | | (280,382 | ) |
| SELL | | | CHF | | | JPMorgan Chase Bank N.A. | | 10,704,611 | | 2/09/11 | | | 10,940,153 | | | | 11,453,871 | | | | (513,718 | ) |
| SELL | | | CHF | | | UBS AG | | 1,263,000 | | 1/12/11 | | | 1,309,598 | | | | 1,350,936 | | | | (41,338 | ) |
| BUY | | | CZK | | | Deutsche Bank AG | | 902,000 | | 1/12/11 | | | 50,960 | | | | 48,127 | | | | (2,833 | ) |
| BUY | | | CZK | | | UBS AG | | 4,982,000 | | 1/12/11 | | | 283,242 | | | | 265,819 | | | | (17,423 | ) |
| BUY | | | DKK | | | Credit Suisse Group | | 5,880,922 | | 1/12/11 | | | 1,097,412 | | | | 1,054,277 | | | | (43,135 | ) |
| BUY | | | DKK | | | JPMorgan Chase Bank N.A. | | 174,000 | | 1/12/11 | | | 33,171 | | | | 31,193 | | | | (1,978 | ) |
| BUY | | | DKK | | | UBS AG | | 571,000 | | 1/12/11 | | | 107,873 | | | | 102,363 | | | | (5,510 | ) |
| BUY | | | EUR | | | Barclays Bank PLC | | 549,000 | | 1/12/11 | | | 755,222 | | | | 733,619 | | | | (21,603 | ) |
| BUY | | | EUR | | | Citibank N.A. | | 1,857,015 | | 1/12/11-2/09/11 | | | 2,491,874 | | | | 2,481,368 | | | | (10,506 | ) |
| BUY | | | EUR | | | Credit Suisse Group | | 2,068,000 | | 1/12/11 | | | 2,838,826 | | | | 2,763,431 | | | | (75,395 | ) |
| BUY | | | EUR | | | Deutsche Bank AG | | 1,914,000 | | 1/12/11 | | | 2,620,554 | | | | 2,557,644 | | | | (62,910 | ) |
| BUY | | | EUR | | | Goldman Sachs International | | 582,000 | | 1/12/11 | | | 806,107 | | | | 777,716 | | | | (28,391 | ) |
| BUY | | | EUR | | | JPMorgan Chase Bank N.A. | | 13,731,576 | | 1/12/11 | | | 19,129,716 | | | | 18,349,255 | | | | (780,461 | ) |
| BUY | | | EUR | | | Royal Bank of Scotland Group PLC | | 882,000 | | 1/12/11 | | | 1,231,146 | | | | 1,178,600 | | | | (52,546 | ) |
| BUY | | | EUR | | | UBS AG | | 1,260,007 | | 1/12/11 | | | 1,777,609 | | | | 1,683,725 | | | | (93,884 | ) |
| SELL | | | EUR | | | Barclays Bank PLC | | 1,319,000 | | 1/12/11 | | | 1,731,467 | | | | 1,762,556 | | | | (31,089 | ) |
| SELL | | | EUR | | | Citibank N.A. | | 236,000 | | 1/12/11 | | | 311,208 | | | | 315,362 | | | | (4,154 | ) |
| SELL | | | EUR | | | Goldman Sachs International | | 2,191,050 | | 1/12/11 | | | 2,870,286 | | | | 2,927,860 | | | | (57,574 | ) |
| BUY | | | GBP | | | Barclays Bank PLC | | 1,074,443 | | 1/12/11 | | | 1,708,925 | | | | 1,675,077 | | | | (33,848 | ) |
| BUY | | | GBP | | | Citibank N.A. | | 86,000 | | 1/12/11 | | | 138,232 | | | | 134,076 | | | | (4,156 | ) |
| BUY | | | GBP | | | Credit Suisse Group | | 213,000 | | 1/12/11 | | | 339,516 | | | | 332,071 | | | | (7,445 | ) |
| BUY | | | GBP | | | Deutsche Bank AG | | 2,726,676 | | 1/12/11-2/09/11 | | | 4,311,958 | | | | 4,250,554 | | | | (61,404 | ) |
| BUY | | | GBP | | | Goldman Sachs International | | 466,000 | | 1/12/11 | | | 740,460 | | | | 726,503 | | | | (13,957 | ) |
| BUY | | | GBP | | | JPMorgan Chase Bank N.A. | | 4,436,325 | | 2/09/11 | | | 7,104,108 | | | | 6,914,873 | | | | (189,235 | ) |
| BUY | | | GBP | | | Royal Bank of Scotland Group PLC | | 237,000 | | 1/12/11 | | | 374,633 | | | | 369,488 | | | | (5,145 | ) |
| BUY | | | GBP | | | UBS AG | | 530,000 | | 1/12/11 | | | 836,187 | | | | 826,280 | | | | (9,907 | ) |
| SELL | | | GBP | | | Goldman Sachs International | | 929,475 | | 1/12/11 | | | 1,437,963 | | | | 1,449,069 | | | | (11,106 | ) |
| SELL | | | GBP | | | HSBC Bank | | 842,160 | | 1/12/11 | | | 1,310,907 | | | | 1,312,944 | | | | (2,037 | ) |
| BUY | | | IDR | | | JPMorgan Chase Bank N.A. | | 4,720,390,000 | | 1/14/11 | | | 524,896 | | | | 523,100 | | | | (1,796 | ) |
| SELL | | | IDR | | | JPMorgan Chase Bank N.A. | | 4,722,584,000 | | 1/14/11 | | | 522,063 | | | | 523,343 | | | | (1,280 | ) |
| BUY | | | ILS | | | Credit Suisse Group | | 304,000 | | 1/07/11 | | | 85,844 | | | | 85,666 | | | | (178 | ) |
| BUY | | | JPY | | | Barclays Bank PLC | | 74,018,000 | | 1/12/11 | | | 915,479 | | | | 911,732 | | | | (3,747 | ) |
| BUY | | | JPY | | | Citibank N.A. | | 41,340,000 | | 1/12/11 | | | 514,033 | | | | 509,214 | | | | (4,819 | ) |
| BUY | | | JPY | | | Credit Suisse Group | | 85,976,000 | | 1/12/11 | | | 1,059,856 | | | | 1,059,028 | | | | (828 | ) |
| BUY | | | JPY | | | Deutsche Bank AG | | 31,270,000 | | 1/12/11 | | | 387,773 | | | | 385,175 | | | | (2,598 | ) |
| BUY | | | JPY | | | JPMorgan Chase Bank N.A. | | 22,645,000 | | 1/12/11 | | | 280,771 | | | | 278,935 | | | | (1,836 | ) |
| BUY | | | JPY | | | UBS AG | | 18,413,000 | | 1/12/11 | | | 228,775 | | | | 226,806 | | | | (1,969 | ) |
| SELL | | | JPY | | | Barclays Bank PLC | | 153,605,204 | | 1/12/11 | | | 1,834,651 | | | | 1,892,065 | | | | (57,414 | ) |
| SELL | | | JPY | | | Citibank N.A. | | 25,022,720 | | 1/12/11 | | | 303,791 | | | | 308,223 | | | | (4,432 | ) |
| SELL | | | JPY | | | Credit Suisse Group | | 158,415,540 | | 1/12/11 | | | 1,897,510 | | | �� | 1,951,317 | | | | (53,807 | ) |
| SELL | | | JPY | | | Goldman Sachs International | | 2,581,000 | | 1/12/11 | | | 31,591 | | | | 31,792 | | | | (201 | ) |
| SELL | | | JPY | | | HSBC Bank | | 584,326,262 | | 1/12/11 | | | 7,077,090 | | | | 7,197,563 | | | | (120,473 | ) |
| SELL | | | JPY | | | JPMorgan Chase Bank N.A. | | 479,302,597 | | 1/12/11-2/09/11 | | | 5,801,253 | | | | 5,905,329 | | | | (104,076 | ) |
| SELL | | | JPY | | | Royal Bank of Scotland Group PLC | | 10,000,000 | | 1/12/11 | | | 122,474 | | | | 123,177 | | | | (703 | ) |
| SELL | | | JPY | | | UBS AG | | 90,176,708 | | 1/12/11 | | | 1,075,348 | | | | 1,110,771 | | | | (35,423 | ) |
| BUY | | | KRW | | | Barclays Bank PLC | | 2,520,311,000 | | 1/05/11-1/18/11 | | | 2,243,033 | | | | 2,219,526 | | | | (23,507 | ) |
| BUY | | | KRW | | | HSBC Bank | | 351,018,000 | | 1/18/11 | | | 313,392 | | | | 309,064 | | | | (4,328 | ) |
17
MFS Global Tactical Allocation Portfolio
Portfolio of Investments – continued
Forward Foreign Currency Exchange Contracts at 12/31/10 – continued
| | | | | | | | | | | | | | | | | | | | | | | | |
| Type | | Currency | | | Counterparty | | Contracts to
Deliver/Receive | | Settlement Date
Range | | In Exchange For | | | Contracts
at Value | | | Net Unrealized
Appreciation
(Depreciation) | |
| Liability Derivatives – continued | | | | | | | | | | | | | | |
| BUY | | | KRW | | | JPMorgan Chase Bank N.A. | | 4,569,147,500 | | 1/05/11-1/27/11 | | $ | 4,041,768 | | | $ | 4,023,886 | | | $ | (17,882 | ) |
| SELL | | | KRW | | | HSBC Bank | | 899,553,000 | | 1/18/11 | | | 769,836 | | | | 792,039 | | | | (22,203 | ) |
| SELL | | | KRW | | | JPMorgan Chase Bank N.A. | | 2,325,658,500 | | 1/05/11 | | | 1,989,953 | | | | 2,049,110 | | | | (59,157 | ) |
| BUY | | | NOK | | | UBS AG | | 788,000 | | 1/12/11 | | | 136,667 | | | | 134,993 | | | | (1,674 | ) |
| SELL | | | NOK | | | Citibank N.A. | | 10,673,440 | | 2/09/11 | | | 1,777,000 | | | | 1,825,959 | | | | (48,959 | ) |
| SELL | | | NOK | | | Deutsche Bank AG | | 389,000 | | 1/12/11 | | | 62,714 | | | | 66,640 | | | | (3,926 | ) |
| SELL | | | NOK | | | JPMorgan Chase Bank N.A. | | 32,500,852 | | 2/09/11 | | | 5,543,383 | | | | 5,560,085 | | | | (16,702 | ) |
| SELL | | | NZD | | | Barclays Bank PLC | | 392,000 | | 1/12/11 | | | 302,269 | | | | 305,299 | | | | (3,030 | ) |
| SELL | | | NZD | | | Deutsche Bank AG | | 635,239 | | 2/09/11 | | | 487,000 | | | | 493,636 | | | | (6,636 | ) |
| BUY | | | PHP | | | Barclays Bank PLC | | 8,284,000 | | 1/10/11-2/03/11 | | | 190,359 | | | | 189,130 | | | | (1,229 | ) |
| BUY | | | PHP | | | JPMorgan Chase Bank N.A. | | 36,265,000 | | 1/26/11 | | | 833,708 | | | | 827,980 | | | | (5,728 | ) |
| SELL | | | PHP | | | Barclays Bank PLC | | 2,687,000 | | 1/18/11 | | | 60,971 | | | | 61,342 | | | | (371 | ) |
| SELL | | | PHP | | | JPMorgan Chase Bank N.A. | | 41,859,000 | | 1/26/11 | | | 941,075 | | | | 955,699 | | | | (14,624 | ) |
| BUY | | | PLN | | | Deutsche Bank AG | | 2,612,000 | | 1/27/11 | | | 910,636 | | | | 881,031 | | | | (29,605 | ) |
| BUY | | | SEK | | | Credit Suisse Group | | 18,698,863 | | 1/12/11 | | | 2,788,337 | | | | 2,779,500 | | | | (8,837 | ) |
| BUY | | | SEK | | | Deutsche Bank AG | | 43,501,409 | | 1/12/11-2/09/11 | | | 6,521,210 | | | | 6,460,294 | | | | (60,916 | ) |
| BUY | | | SEK | | | HSBC Bank | | 1,141,000 | | 1/12/11 | | | 173,753 | | | | 169,605 | | | | (4,148 | ) |
| BUY | | | THB | | | HSBC Bank | | 1,537,000 | | 2/14/11 | | | 51,199 | | | | 50,957 | | | | (242 | ) |
| BUY | | | TRY | | | Barclays Bank PLC | | 76,000 | | 1/10/11 | | | 52,169 | | | | 49,183 | | | | (2,986 | ) |
| BUY | | | TRY | | | Deutsche Bank AG | | 201,000 | | 1/10/11 | | | 134,583 | | | | 130,076 | | | | (4,507 | ) |
| BUY | | | TRY | | | HSBC Bank | | 933,500 | | 2/22/11 | | | 636,832 | | | | 600,954 | | | | (35,878 | ) |
| BUY | | | TRY | | | JPMorgan Chase Bank N.A. | | 933,500 | | 2/22/11 | | | 636,550 | | | | 600,954 | | | | (35,596 | ) |
| SELL | | | TWD | | | Credit Suisse Group | | 40,992,350 | | 1/27/11 | | | 1,354,000 | | | | 1,406,823 | | | | (52,823 | ) |
| SELL | | | ZAR | | | Deutsche Bank AG | | 11,592,299 | | 1/18/11 | | | 1,630,353 | | | | 1,756,076 | | | | (125,723 | ) |
| | | | | | | | | | | | | | | | | | | | | | | | |
| | | | | | | | | | | | | | | | | | | | | | $ | (4,064,473 | ) |
| | | | | | | | | | | | | | | | | | | | | | | | |
Futures Contracts Outstanding at 12/31/10
| | | | | | | | | | | | | | | | | | | | |
| Description | | Currency | | | Contracts | | | Value | | | Expiration
Date | | | Unrealized
Appreciation
(Depreciation) | |
| Asset Derivatives | | | | | | | | | | | | | | | | | | | | |
| Equity Futures | | | | | | | | | | | | | | | | | | | | |
| AEX Index (Long) | | | EUR | | | | 50 | | | $ | 4,741,192 | | | | January -2011 | | | $ | 37,877 | |
| ASX SPI 200 Index (Short) | | | AUD | | | | 57 | | | | 6,893,928 | | | | March - 2011 | | | | 77,012 | |
| FTSE 100 Index (Long) | | | GBP | | | | 66 | | | | 6,063,932 | | | | March - 2011 | | | | 48,724 | |
| S+P 500 E-Mini Index (Long) | | | USD | | | | 214 | | | | 13,407,100 | | | | March - 2011 | | | | 178,583 | |
| | | | | | | | | | | | | | | | | | | | |
| | | | | | | | | | | | | | | | | | $ | 342,196 | |
| | | | | | | | | | | | | | | | | | | | |
| Interest Rate Futures | | | | | | | | | | | | | | | | | | | | |
| German Bund (Short) | | | EUR | | | | 58 | | | $ | 9,712,202 | | | | March - 2011 | | | $ | 61,502 | |
| Japan Govt Bond 10 yr (Short) | | | JPY | | | | 11 | | | | 19,050,499 | | | | March - 2011 | | | | 2,506 | |
| | | | | | | | | | | | | | | | | | | | |
| | | | | | | | | | | | | | | | | | $ | 64,008 | |
| | | | | | | | | | | | | | | | | | | | |
| Liability Derivatives | | | | | | | | | | | | | | | | | | | | |
| Equity Futures | | | | | | | | | | | | | | | | | | | | |
| CAC 40 Index (Long) | | | EUR | | | | 101 | | | $ | 5,141,541 | | | | January - 2011 | | | $ | (124,466 | ) |
| DAX Index (Long) | | | EUR | | | | 60 | | | | 13,884,824 | | | | March - 2011 | | | | (230,704 | ) |
| FTSE MIB Index (Long) | | | EUR | | | | 53 | | | | 7,154,984 | | | | March - 2011 | | | | (194,996 | ) |
| IBEX 35 Index (Long) | | | EUR | | | | 21 | | | | 2,747,580 | | | | January - 2011 | | | | (76,174 | ) |
18
MFS Global Tactical Allocation Portfolio
Portfolio of Investments – continued
Futures Contracts Outstanding at 12/31/10 – continued
| | | | | | | | | | | | | | | | | | | | |
| Description | | Currency | | | Contracts | | | Value | | | Expiration
Date | | | Unrealized
Appreciation
(Depreciation) | |
| Liability Derivatives – continued | | | | | | | | | | | | | | | | | | | | |
| Nikkei 225 Index (Short) | | | JPY | | | | 108 | | | $ | 13,578,841 | | | | March - 2011 | | | $ | (5,479 | ) |
| OMX 30 Index (Short) | | | SEK | | | | 138 | | | | 2,373,986 | | | | January - 2011 | | | | (7,284 | ) |
| S+P TSE Index (Short) | | | CAD | | | | 101 | | | | 15,584,250 | | | | March - 2011 | | | | (186,494 | ) |
| | | | | | | | | | | | | | | | | | | | |
| | | | | | | | | | | | | | | | | | $ | (825,597 | ) |
| | | | | | | | | | | | | | | | | | | | |
| Interest Rate Futures | | | | | | | | | | | | | | | | | | | | |
| Australian Treasury Bond 10 yr (Short) | | | AUD | | | | 75 | | | $ | 7,924,288 | | | | March - 2011 | | | $ | (88,803 | ) |
| Govt Of Canada Bond 10 yr (Short) | | | CAD | | | | 287 | | | | 35,376,362 | | | | March - 2011 | | | | (110,840 | ) |
| U.S. Treasury Note 10 yr (Long) | | | USD | | | | 255 | | | | 30,711,562 | | | | March - 2011 | | | | (868,096 | ) |
| UK Long Gilt Bond (Long) | | | GBP | | | | 27 | | | | 5,030,015 | | | | March - 2011 | | | | (12,734 | ) |
| | | | | | | | | | | | | | | | | | | | |
| | | | | | | | | | | | | | | | | | $ | (1,080,473 | ) |
| | | | | | | | | | | | | | | | | | | | |
At December 31, 2010, the fund had sufficient cash and/or other liquid securities to cover any commitments under these derivative contracts.
See Notes to Financial Statements
19
MFS Global Tactical Allocation Portfolio
FINANCIAL STATEMENTS | STATEMENT OF ASSETS AND LIABILITIES
This statement represents your fund’s balance sheet, which details the assets and liabilities comprising the total value of the fund.
| | | | | | | | |
At 12/31/10 | | | | | | | | |
Assets | | | | | | | | |
Investments – | | | | | | | | |
Non-affiliated issuers, at value (identified cost, $419,323,939) | | | $428,093,366 | | | | | |
Underlying funds, at cost and value | | | 51,691,815 | | | | | |
Total investments, at value (identified cost, $471,015,754) | | | $479,785,181 | | | | | |
Restricted cash | | | 472,087 | | | | | |
Foreign currency, at value (identified cost, $74,370) | | | 76,760 | | | | | |
Receivables for | | | | | | | | |
Forward foreign currency exchange contracts | | | 6,561,865 | | | | | |
Fund shares sold | | | 4,409,762 | | | | | |
Interest and dividends | | | 2,917,712 | | | | | |
Other assets | | | 12,005 | | | | | |
Total assets | | | | | | | $494,235,372 | |
Liabilities | | | | | | | | |
Payables for | | | | | | | | |
Forward foreign currency exchange contracts | | | $4,064,473 | | | | | |
Daily variation margin on open futures contracts | | | 93,958 | | | | | |
Investments purchased | | | 2,442,839 | | | | | |
Fund shares reacquired | | | 24,724 | | | | | |
Payable to affiliates | | | | | | | | |
Investment adviser | | | 28,000 | | | | | |
Shareholder servicing costs | | | 251 | | | | | |
Distribution and/or service fees | | | 5,426 | | | | | |
Administrative services fee | | | 930 | | | | | |
Payable for Trustees’ compensation | | | 411 | | | | | |
Accrued expenses and other liabilities | | | 119,933 | | | | | |
Total liabilities | | | | | | | $6,780,945 | |
Net assets | | | | | | | $487,454,427 | |
Net assets consist of | | | | | | | | |
Paid-in capital | | | $474,859,800 | | | | | |
Unrealized appreciation (depreciation) on investments and translation of assets and liabilities in foreign currencies | | | 9,785,190 | | | | | |
Accumulated net realized gain (loss) on investments and foreign currency transactions | | | 2,384,315 | | | | | |
Undistributed net investment income | | | 425,122 | | | | | |
Net assets | | | | | | | $487,454,427 | |
Shares of beneficial interest outstanding | | | | | | | 34,580,687 | |
| | | | | | | | | | | | |
| | | Net assets | | | Shares
outstanding | | | Net asset value
per share | |
Initial Class | | | $87,136,548 | | | | 6,134,832 | | | | $14.20 | |
Service Class | | | 400,317,879 | | | | 28,445,855 | | | | 14.07 | |
See Notes to Financial Statements
20
MFS Global Tactical Allocation Portfolio
FINANCIAL STATEMENTS | STATEMENT OF OPERATIONS
This statement describes how much your fund earned in investment income and accrued in expenses. It also describes any gains and/or losses generated by fund operations.
| | | | | | | | |
| Year ended 12/31/10 | | | | | | | | |
| Net investment income | | | | | | | | |
Income | | | | | | | | |
Interest | | | $4,536,766 | | | | | |
Dividends | | | 2,301,262 | | | | | |
Dividends from underlying funds | | | 65,116 | | | | | |
Foreign taxes withheld | | | (125,034 | ) | | | | |
Total investment income | | | | | | | $6,778,110 | |
Expenses | | | | | | | | |
Management fee | | | $1,923,504 | | | | | |
Distribution and/or service fees | | | 419,613 | | | | | |
Shareholder servicing costs | | | 29,014 | | | | | |
Administrative services fee | | | 90,814 | | | | | |
Trustees’ compensation | | | 14,915 | | | | | |
Custodian fee | | | 219,711 | | | | | |
Shareholder communications | | | 10,298 | | | | | |
Auditing fees | | | 63,397 | | | | | |
Legal fees | | | 7,157 | | | | | |
Miscellaneous | | | 31,035 | | | | | |
Total expenses | | | | | | | $2,809,458 | |
Fees paid indirectly | | | (377 | ) | | | | |
Reduction of expenses by investment adviser | | | (77,514 | ) | | | | |
Net expenses | | | | | | | $2,731,567 | |
Net investment income | | | | | | | $4,046,543 | |
Realized and unrealized gain (loss) on investments and foreign currency transactions | | | | | | | | |
Realized gain (loss) (identified cost basis) | | | | | | | | |
Investment transactions (net of $6,442 country tax) | | | $2,869,462 | | | | | |
Futures contracts | | | 3,648,876 | | | | | |
Foreign currency transactions | | | (5,092,092 | ) | | | | |
Net realized gain (loss) on investments and foreign currency transactions | | | | | | | $1,426,246 | |
Change in unrealized appreciation (depreciation) | | | | | | | | |
Investments (net of $4,144 decrease in deferred country tax) | | | $12,125,660 | | | | | |
Futures contracts | | | (1,499,866 | ) | | | | |
Translation of assets and liabilities in foreign currencies | | | 2,643,850 | | | | | |
Net unrealized gain (loss) on investments and foreign currency translation | | | | | | | $13,269,644 | |
Net realized and unrealized gain (loss) on investments and foreign currency | | | | | | | $14,695,890 | |
Change in net assets from operations | | | | | | | $18,742,433 | |
See Notes to Financial Statements
21
MFS Global Tactical Allocation Portfolio
FINANCIAL STATEMENTS | STATEMENTS OF CHANGES IN NET ASSETS
These statements describe the increases and/or decreases in net assets resulting from operations, any distributions, and any shareholder transactions.
| | | | | | | | |
For years ended 12/31 | | | 2010 | | | | 2009 | |
Change in net assets | | | | | | | | |
From operations | | | | | | | | |
Net investment income | | | $4,046,543 | | | | $2,107,621 | |
Net realized gain (loss) on investments and foreign currency transactions | | | 1,426,246 | | | | (2,304,500 | ) |
Net unrealized gain (loss) on investments and foreign currency translation | | | 13,269,644 | | | | 13,325,296 | |
Change in net assets from operations | | | $18,742,433 | | | | $13,128,417 | |
Distributions declared to shareholders | | | | | | | | |
From net investment income | | | $(1,262,023 | ) | | | $(7,793,150 | ) |
Change in net assets from fund share transactions | | | $365,866,407 | | | | $(6,933,296 | ) |
Total change in net assets | | | $383,346,817 | | | | $(1,598,029 | ) |
Net assets | | | | | | | | |
At beginning of period | | | 104,107,610 | | | | 105,705,639 | |
At end of period (including undistributed net investment income of $425,122 and
$817,169, respectively) | | | $487,454,427 | | | | $104,107,610 | |
See Notes to Financial Statements
22
MFS Global Tactical Allocation Portfolio
FINANCIAL STATEMENTS | FINANCIAL HIGHLIGHTS
The financial highlights table is intended to help you understand the fund’s financial performance for the past 5 years. Certain information reflects financial results for a single fund share. The total returns in the table represent the rate by which an investor would have earned (or lost) on an investment in the fund share class (assuming reinvestment of all distributions) held for the entire period.
| | | | | | | | | | | | | | | | | | | | |
| Initial Class | | Years ended 12/31 | |
| | | 2010 | | | 2009 | | | 2008 | | | 2007 | | | 2006 | |
Net asset value, beginning of period | | | $13.56 | | | | $12.89 | | | | $17.59 | | | | $18.11 | | | | $16.66 | |
| Income (loss) from investment operations | | | | | | | | | | | | | | | | | | | | |
Net investment income (d) | | | $0.24 | | | | $0.27 | | | | $0.37 | | | | $0.40 | | | | $0.41 | |
Net realized and unrealized gain (loss) on investments
and foreign currency | | | 0.51 | | | | 1.44 | | | | (2.68 | ) | | | 1.13 | | | | 2.38 | |
Total from investment operations | | | $0.75 | | | | $1.71 | | | | $(2.31 | ) | | | $1.53 | | | | $2.79 | |
| Less distributions declared to shareholders | | | | | | | | | | | | | | | | | | | | |
From net investment income | | | $(0.11 | ) | | | $(1.04 | ) | | | $(0.86 | ) | | | $(0.40 | ) | | | $(0.16 | ) |
From net realized gain on investments | | | — | | | | — | | | | (1.53 | ) | | | (1.65 | ) | | | (1.18 | ) |
Total distributions declared to shareholders | | | $(0.11 | ) | | | $(1.04 | ) | | | $(2.39 | ) | | | $(2.05 | ) | | | $(1.34 | ) |
Net asset value, end of period | | | $14.20 | | | | $13.56 | | | | $12.89 | | | | $17.59 | | | | $18.11 | |
Total return (%) (k)(r)(s) | | | 5.53 | | | | 15.16 | | | | (15.42 | ) | | | 8.87 | | | | 17.20 | |
Ratios (%) (to average net assets)
and Supplemental data: | | | | | | | | | | | | | | | | | | | | |
Expenses before expense reductions (f) | | | 0.93 | | | | 1.06 | | | | 0.98 | | | | 0.95 | | | | 0.93 | |
Expenses after expense reductions (f) | | | 0.90 | | | | 0.90 | | | | 0.90 | | | | 0.93 | | | | N/A | |
Net investment income | | | 1.76 | | | | 2.17 | | | | 2.48 | | | | 2.24 | | | | 2.41 | |
Portfolio turnover | | | 73 | | | | 66 | | | | 75 | | | | 78 | | | | 76 | |
Net assets at end of period (000 omitted) | | | $87,137 | | | | $92,880 | | | | $93,254 | | | | $145,113 | | | | $161,209 | |
See Notes to Financial Statements
23
MFS Global Tactical Allocation Portfolio
Financial Highlights – continued
| | | | | | | | | | | | | | | | | | | | |
| Service Class | | Years ended 12/31 | |
| | | 2010 | | | 2009 | | | 2008 | | | 2007 | | | 2006 | |
Net asset value, beginning of period | | | $13.46 | | | | $12.79 | | | | $17.46 | | | | $17.99 | | | | $16.56 | |
| Income (loss) from investment operations | | | | | | | | | | | | | | | | | | | | |
Net investment income (d) | | | $0.20 | | | | $0.24 | | | | $0.34 | | | | $0.35 | | | | $0.37 | |
Net realized and unrealized gain (loss) on investments
and foreign currency | | | 0.51 | | | | 1.42 | | | | (2.66 | ) | | | 1.13 | | | | 2.36 | |
Total from investment operations | | | $0.71 | | | | $1.66 | | | | $(2.32 | ) | | | $1.48 | | | | $2.73 | |
| Less distributions declared to shareholders | | | | | | | | | | | | | | | | | | | | |
From net investment income | | | $(0.10 | ) | | | $(0.99 | ) | | | $(0.82 | ) | | | $(0.36 | ) | | | $(0.12 | ) |
From net realized gain on investments | | | — | | | | — | | | | (1.53 | ) | | | (1.65 | ) | | | (1.18 | ) |
Total distributions declared to shareholders | | | $(0.10 | ) | | | $(0.99 | ) | | | $(2.35 | ) | | | $(2.01 | ) | | | $(1.30 | ) |
Net asset value, end of period | | | $14.07 | | | | $13.46 | | | | $12.79 | | | | $17.46 | | | | $17.99 | |
Total return (%) (k)(r)(s) | | | 5.31 | | | | 14.78 | | | | (15.59 | ) | | | 8.62 | | | | 16.91 | |
Ratios (%) (to average net assets)
and Supplemental data: | | | | | | | | | | | | | | | | | | | | |
Expenses before expense reductions (f) | | | 1.18 | | | | 1.31 | | | | 1.23 | | | | 1.20 | | | | 1.18 | |
Expenses after expense reductions (f) | | | 1.15 | | | | 1.15 | | | | 1.15 | | | | 1.18 | | | | N/A | |
Net investment income | | | 1.48 | | | | 1.92 | | | | 2.25 | | | | 1.99 | | | | 2.15 | |
Portfolio turnover | | | 73 | | | | 66 | | | | 75 | | | | 78 | | | | 76 | |
Net assets at end of period (000 omitted) | | | $400,318 | | | | $11,228 | | | | $12,451 | | | | $20,109 | | | | $18,637 | |
| (d) | Per share data is based on average shares outstanding. |
| (f) | Ratios do not reflect reductions from fees paid indirectly, if applicable. |
| (k) | The total return does not reflect expenses that apply to separate accounts. Inclusion of these charges would reduce the total return figures for all periods shown. |
| (r) | Certain expenses have been reduced without which performance would have been lower. |
| (s) | From time to time the fund may receive proceeds from litigation settlements, without which performance would be lower. |
See Notes to Financial Statements
24
MFS Global Tactical Allocation Portfolio
NOTES TO FINANCIAL STATEMENTS
| (1) | | Business and Organization |
MFS Global Tactical Allocation Portfolio (the fund) is a series of MFS Variable Insurance Trust II (the trust). The trust is organized as a Massachusetts business trust and is registered under the Investment Company Act of 1940, as amended, as an open-end management investment company. The shareholders of each series of the trust are separate accounts of insurance companies, which offer variable annuity and/or life insurance products, and qualified retirement and pension plans.
| (2) | | Significant Accounting Policies |
General – The preparation of financial statements in conformity with U.S. generally accepted accounting principles requires management to make estimates and assumptions that affect the reported amounts of assets and liabilities, and disclosure of contingent assets and liabilities at the date of the financial statements and the reported amounts of revenues and expenses during the reporting period. Actual results could differ from those estimates. In the preparation of these financial statements, management has evaluated subsequent events occurring after the date of the fund’s Statement of Assets and Liabilities through the date that the financial statements were issued. The fund invests in foreign securities, including securities of emerging market issuers. Investments in foreign securities are vulnerable to the effects of changes in the relative values of the local currency and the U.S. dollar and to the effects of changes in each country’s legal, political, and economic environment. The markets of emerging markets countries are generally more volatile than the markets of developed countries with more mature economies. All of the risks of investing in foreign securities previously described are heightened when investing in emerging markets countries.
Investment Valuations – Equity securities, including restricted equity securities, are generally valued at the last sale or official closing price as provided by a third-party pricing service on the market or exchange on which they are primarily traded. Equity securities, for which there were no sales reported that day, are generally valued at the last quoted daily bid quotation as provided by a third-party pricing service on the market or exchange on which such securities are primarily traded. Equity securities held short, for which there were no sales reported for that day, are generally valued at the last quoted daily ask quotation as provided by a third-party pricing service on the market or exchange on which such securities are primarily traded. Debt instruments and floating rate loans (other than short-term instruments), including restricted debt instruments, are generally valued at an evaluated or composite bid as provided by a third-party pricing service. Short-term instruments with a maturity at issuance of 60 days or less generally are valued at amortized cost, which approximates market value. Exchange-traded options are generally valued at the last sale or official closing price as provided by a third-party pricing service on the exchange on which such options are primarily traded. Exchange-traded options for which there were no sales reported that day are generally valued at the last daily bid quotation as provided by a third-party pricing service on the exchange on which such options are primarily traded. Options not traded on an exchange are generally valued at a broker/dealer bid quotation. Foreign currency options are generally valued at valuations provided by a third-party pricing service. Futures contracts are generally valued at last posted settlement price as provided by a third-party pricing service on the market on which they are primarily traded. Futures contracts for which there were no trades that day for a particular position are generally valued at the closing bid quotation as provided by a third-party pricing service on the market on which such futures contracts are primarily traded. Forward foreign currency contracts are generally valued at the mean of bid and asked prices for the time period interpolated from rates provided by a third-party pricing service for proximate time periods. Open-end investment companies are generally valued at net asset value per share. Securities and other assets generally valued on the basis of information from a third-party pricing service may also be valued at a broker/dealer bid quotation. Values obtained from third-party pricing services can utilize both transaction data and market information such as yield, quality, coupon rate, maturity, type of issue, trading characteristics, and other market data. The values of foreign securities and other assets and liabilities expressed in foreign currencies are converted to U.S. dollars using the mean of bid and asked prices for rates provided by a third-party pricing service.
The Board of Trustees has delegated primary responsibility for determining or causing to be determined the value of the fund’s investments (including any fair valuation) to the adviser pursuant to valuation policies and procedures approved by the Board. If the adviser determines that reliable market quotations are not readily available, investments are valued at fair value as determined in good faith by the adviser in accordance with such procedures under the oversight of the Board of Trustees. Under the fund’s valuation policies and procedures, market quotations are not considered to be readily available for most types of debt instruments and floating rate loans and many types of derivatives. These investments are generally valued at fair value based on information from third-party pricing services. In addition, investments may be valued at fair value if the adviser determines that an investment’s value has been materially effected by events occurring after the close of the exchange or market on which the investment is principally traded (such as foreign exchange or market) and prior to the determination of the fund’s net asset value, or after the halting of trading of a specific security where trading does not resume prior to the close of the exchange or market on which the security is principally traded. Events that occur on a frequent basis after foreign
25
MFS Global Tactical Allocation Portfolio
Notes to Financial Statements – continued
markets close (such as developments in foreign markets and significant movements in the U.S. markets) and prior to the determination of the fund’s net asset value may be deemed to have a material effect on the value of securities traded in foreign markets. Accordingly, the fund’s foreign equity securities may often be valued at fair value. The adviser generally relies on third-party pricing services or other information (such as the correlation with price movements of similar securities in the same or other markets; the type, cost and investment characteristics of the security; the business and financial condition of the issuer; and trading and other market data) to assist in determining whether to fair value and at what value to fair value an investment. The value of an investment for purposes of calculating the fund’s net asset value can differ depending on the source and method used to determine value. When fair valuation is used, the value of an investment used to determine the fund’s net asset value may differ from quoted or published prices for the same investment. There can be no assurance that the fund could obtain the fair value assigned to an investment if it were to sell the investment at the same time at which the fund determines its net asset value per share.
Various inputs are used in determining the value of the fund’s assets or liabilities. These inputs are categorized into three broad levels. In certain cases, the inputs used to measure fair value may fall into different levels of the fair value hierarchy. In such cases, an investment’s level within the fair value hierarchy is based on the lowest level of input that is significant to the fair value measurement. The fund’s assessment of the significance of a particular input to the fair value measurement in its entirety requires judgment, and considers factors specific to the investment. Level 1 includes unadjusted quoted prices in active markets for identical assets or liabilities. Level 2 includes other significant observable market-based inputs (including quoted prices for similar securities, interest rates, prepayment speed, and credit risk). Level 3 includes unobservable inputs, which may include the adviser’s own assumptions in determining the fair value of investments. Other financial instruments are derivative instruments not reflected in total investments, such as futures and forwards. The following is a summary of the levels used as of December 31, 2010 in valuing the fund’s assets or liabilities:
| | | | | | | | | | | | | | | | |
| Investments at Value | | Level 1 | | | Level 2 | | | Level 3 | | | Total | |
| Equity Securities: | | | | | | | | | | | | | | | | |
United States | | | $73,654,935 | | | | $— | | | | $— | | | | $73,654,935 | |
United Kingdom | | | 22,020,348 | | | | — | | | | — | | | | 22,020,348 | |
Japan | | | 19,608,209 | | | | 1,520,986 | | | | — | | | | 21,129,195 | |
Switzerland | | | 12,600,014 | | | | — | | | | — | | | | 12,600,014 | |
France | | | 8,679,545 | | | | — | | | | — | | | | 8,679,545 | |
Netherlands | | | 7,199,148 | | | | 554 | | | | — | | | | 7,199,702 | |
Germany | | | 5,508,829 | | | | — | | | | — | | | | 5,508,829 | |
Taiwan | | | 2,751,842 | | | | — | | | | — | | | | 2,751,842 | |
Sweden | | | 2,549,891 | | | | — | | | | — | | | | 2,549,891 | |
Other Countries | | | 7,534,935 | | | | — | | | | — | | | | 7,534,935 | |
| U.S. Treasury Bonds & U.S. Government Agency & Equivalents | | | — | | | | 45,638,658 | | | | — | | | | 45,638,658 | |
| Non-U.S. Sovereign Debt | | | — | | | | 126,995,901 | | | | — | | | | 126,995,901 | |
| Corporate Bonds | | | — | | | | 35,677,040 | | | | — | | | | 35,677,040 | |
| Residential Mortgage-Backed Securities | | | — | | | | 32,633,331 | | | | — | | | | 32,633,331 | |
| Commercial Mortgage-Backed Securities | | | — | | | | 9,253,752 | | | | — | | | | 9,253,752 | |
| Foreign Bonds | | | — | | | | 14,265,448 | | | | — | | | | 14,265,448 | |
| Mutual Funds | | | 51,691,815 | | | | — | | | | — | | | | 51,691,815 | |
| Total Investments | | | $213,799,511 | | | | $265,985,670 | | | | $— | | | | $479,785,181 | |
| | | | |
| Other Financial Instruments | | | | | | | | | | | | |
| Futures | | | $(1,499,866 | ) | | | $— | | | | $— | | | | $(1,499,866 | ) |
| Forward Currency Contracts | | | — | | | | 2,497,392 | | | | — | | | | 2,497,392 | |
For further information regarding security characteristics, see the Portfolio of Investments.
Of the Level 1 investments presented above, equity investments amounting to $54,031,215 were considered level 2 investments at the beginning of the period. The primary reason for changes in the classifications between levels 1 and 2 occurs when foreign equity securities are fair valued using other observable market-based inputs in place of the closing exchange price due to events occurring after the close of the exchange or market on which the investment is principally traded. The fund’s foreign equity securities may often be valued at fair value.
Inflation-Adjusted Debt Securities – The fund invests in inflation-adjusted debt securities issued by the U.S. Treasury. The fund may also invest in inflation-adjusted debt securities issued by U.S. Government agencies and instrumentalities other than the U.S. Treasury and by other entities such as U.S. and foreign corporations and foreign governments. The principal value of
26
MFS Global Tactical Allocation Portfolio
Notes to Financial Statements – continued
these debt securities is adjusted through income according to changes in the Consumer Price Index or another general price or wage index. These debt securities typically pay a fixed rate of interest, but this fixed rate is applied to the inflation-adjusted principal amount. The principal paid at maturity of the debt security is typically equal to the inflation-adjusted principal amount, or the security’s original par value, whichever is greater. Other types of inflation-adjusted securities may use other methods to adjust for other measures of inflation.
Foreign Currency Translation – Purchases and sales of foreign investments, income, and expenses are converted into U.S. dollars based upon currency exchange rates prevailing on the respective dates of such transactions or on the reporting date for foreign denominated receivables and payables. Gains and losses attributable to foreign currency exchange rates on sales of securities are recorded for financial statement purposes as net realized gains and losses on investments. Gains and losses attributable to foreign exchange rate movements on receivables, payables, income and expenses are recorded for financial statement purposes as foreign currency transaction gains and losses. That portion of both realized and unrealized gains and losses on investments that results from fluctuations in foreign currency exchange rates is not separately disclosed.
Derivatives – The fund uses derivatives for different purposes, including to earn income and enhance returns, to increase or decrease exposure to a particular market, to manage or adjust the risk profile of the fund, or as alternatives to direct investments. Derivatives are used for hedging or non-hedging purposes. While hedging can reduce or eliminate losses, it can also reduce or eliminate gains. When the fund uses derivatives as an investment to increase market exposure, or for hedging purposes, gains and losses from derivative instruments may be substantially greater than the derivative’s original cost.
Derivative instruments used by the fund during the period include purchased options, futures contracts, and forward foreign currency exchange contracts. The fund’s period end derivatives, as presented in the Portfolio of Investments and the associated Derivative Contract Tables, generally are indicative of the volume of its derivative activity during the period.
The following table presents, by major type of derivative contract, the fair value, on a gross basis, of the asset and liability components of derivatives held by the fund at December 31, 2010 as reported in the Statement of Assets and Liabilities:
| | | | | | | | | | |
| | | | | Fair Value (a) | |
| Risk | | Derivative | | Asset Derivatives | | | Liability Derivatives | |
| Interest Rate Contracts | | Interest Rate Futures | | | $64,008 | | | | $(1,080,473 | ) |
| Foreign Exchange Contracts | | Forward Foreign Currency Exchange Contracts | | | 6,561,865 | | | | (4,064,473 | ) |
| Equity Contracts | | Equity Futures | | | 342,196 | | | | (825,597 | ) |
| Equity Contracts | | Purchased Options | | | 230,805 | | | | — | |
| Total | | | | | $7,198,874 | | | | $(5,970,543 | ) |
| (a) | All derivative valuations are specifically referenced within the fund’s Statement of Assets and Liabilities except for purchased options and futures contracts. The value of purchased options outstanding is included in total investments, at value, within the fund’s Statement of Assets and Liabilities. The value of futures contracts outstanding includes cumulative appreciation (depreciation) as reported in the fund’s Portfolio of Investments. Only the current day variation margin for futures contracts is separately reported within the fund’s Statement of Assets and Liabilities. |
The following table presents, by major type of derivative contract, the realized gain (loss) on derivatives held by the fund for the year ended December 31, 2010 as reported in the Statement of Operations:
| | | | | | | | | | | | | | | | |
| Risk | | Futures Contracts | | | Foreign Currency
Transactions | | | Investment
Transactions
(Purchased
Options) | | | Total | |
| Interest Rate Contracts | | | $1,856,652 | | | | $— | | | | $(19,875 | ) | | | $1,836,777 | |
| Foreign Exchange Contracts | | | — | | | | (4,880,278 | ) | | | (22,610 | ) | | | (4,902,888 | ) |
| Equity Contracts | | | 1,792,224 | | | | — | | | | (51,718 | ) | | | 1,740,506 | |
| Total | | | $3,648,876 | | | | $(4,880,278 | ) | | | $(94,203 | ) | | | $(1,325,605 | ) |
27
MFS Global Tactical Allocation Portfolio
Notes to Financial Statements – continued
The following table presents, by major type of derivative contract, the change in unrealized appreciation (depreciation) on derivatives held by the fund for the year ended December 31, 2010 as reported in the Statement of Operations:
| | | | | | | | | | | | | | | | |
| Risk | | Futures Contracts | | | Translation of
Assets and
Liabilities in
Foreign Currencies | | | Investments
(Purchased
Options) | | | Total | |
| Interest Rate Contracts | | | $(1,016,464 | ) | | | $— | | | | $— | | | | $(1,016,464 | ) |
| Foreign Exchange Contracts | | | — | | | | 2,621,736 | | | | — | | | | 2,621,736 | |
| Equity Contracts | | | (483,402 | ) | | | — | | | | (12,645 | ) | | | (496,047 | ) |
| Total | | | $(1,499,866 | ) | | | $2,621,736 | | | | $(12,645 | ) | | | $1,109,225 | |
Derivative counterparty credit risk is managed through formal evaluation of the creditworthiness of all potential counterparties. On certain over-the-counter derivatives, the fund attempts to reduce its exposure to counterparty credit risk whenever possible by entering into an International Swaps and Derivatives Association (ISDA) Master Agreement on a bilateral basis with each of the counterparties with whom it undertakes a significant volume of transactions. The ISDA Master Agreement gives each party to the agreement the right to terminate all transactions traded under such agreement if there is a certain deterioration in the credit quality of the other party. The ISDA Master Agreement gives the fund the right, upon an event of default by the applicable counterparty or a termination of the agreement, to close out all transactions traded under such agreement and to net amounts owed under each transaction to one net amount payable by one party to the other. This right to close out and net payments across all transactions traded under the ISDA Master Agreement could result in a reduction of the fund’s credit risk to such counterparty equal to any amounts payable by the fund under the applicable transactions, if any. However, absent an event of default by the counterparty or a termination of the agreement, the ISDA Master Agreement does not result in an offset of reported amounts of assets and liabilities in the Statement of Assets and Liabilities across transactions between the fund and the applicable counterparty.
Collateral requirements differ by type of derivative. Collateral or margin requirements are set by the broker or exchange clearing house for exchange traded derivatives (i.e., futures and exchange-traded options) while collateral terms are contract specific for over-the-counter traded derivatives (i.e., forwards, swaps and over-the-counter options). For derivatives traded under an ISDA Master Agreement, the collateral requirements are netted across all transactions traded under such agreement and one amount is posted from one party to the other to collateralize such obligations. Cash collateral that has been pledged to cover obligations of the fund under derivative contracts, if any, will be reported separately on the Statement of Assets and Liabilities as restricted cash. Securities collateral pledged for the same purpose, if any, is noted in the Portfolio of Investments.
Purchased Options – The fund purchased put options for a premium. Purchased put options entitle the holder to sell a specified number of shares or units of a particular security, currency or index at a specified price at a specified date or within a specified period of time. Purchasing put options may hedge against a decline in the value of portfolio securities or currency.
The premium paid is initially recorded as an investment in the Statement of Assets and Liabilities. That investment is subsequently marked-to-market daily with the difference between the premium paid and the market value of the purchased option being recorded as unrealized appreciation or depreciation. Premiums paid for purchased put options which have expired are treated as realized losses on investments in the Statement of Operations. Upon the exercise or closing of a purchased put option, the premium paid is offset against the proceeds on the sale of the underlying security or financial instrument in order to determine the realized gain or loss on investments.
The risk in purchasing an option is that the fund pays a premium whether or not the option is exercised. The fund’s maximum risk of loss due to counterparty credit risk is limited to the market value of the option. For over-the-counter options, this risk is mitigated in cases where there is an ISDA Master Agreement between the fund and the counterparty providing for netting as described above and for posting of collateral by the counterparty to the fund to cover the fund’s exposure to the counterparty under such ISDA Master Agreement.
Futures Contracts – The fund entered into futures contracts which may be used to gain or to hedge against broad market, interest rate or currency exposure. A futures contract represents a commitment for the future purchase or sale of an asset at a specified price on a specified date.
Upon entering into a futures contract, the fund is required to deposit with the broker, either in cash or securities, an initial margin in an amount equal to a certain percentage of the notional amount of the contract. Subsequent payments (variation margin) are made or received by the fund each day, depending on the daily fluctuations in the value of the contract, and are
28
MFS Global Tactical Allocation Portfolio
Notes to Financial Statements – continued
recorded for financial statement purposes as unrealized gain or loss by the fund until the contract is closed or expires at which point the gain or loss on futures is realized.
The fund bears the risk of interest rates, exchange rates or securities prices moving unexpectedly, in which case, the fund may not achieve the anticipated benefits of the futures contracts and may realize a loss. While futures may present less counterparty risk to the fund since the contracts are exchange traded and the exchange’s clearinghouse guarantees payments to the broker, there is still counterparty credit risk due to the insolvency of the broker. The fund’s maximum risk of loss due to counterparty credit risk is equal to the margin posted by the fund to the broker plus any gains or minus any losses on the outstanding futures contracts.
Forward Foreign Currency Exchange Contracts – The fund entered into forward foreign currency exchange contracts for the purchase or sale of a specific foreign currency at a fixed price on a future date. These contracts may be used to hedge the fund’s currency risk or for non-hedging purposes. For hedging purposes, the fund may enter into contracts to deliver or receive foreign currency that the fund will receive from or use in its normal investment activities. The fund may also use contracts to hedge against declines in the value of foreign currency denominated securities due to unfavorable exchange rate movements. For non-hedging purposes, the fund may enter into contracts with the intent of changing the relative exposure of the fund’s portfolio of securities to different currencies to take advantage of anticipated exchange rate changes.
Forward foreign currency exchange contracts are adjusted by the daily exchange rate of the underlying currency and any unrealized gains or losses are recorded as a receivable or payable for forward foreign currency exchange contracts until the contract settlement date. On contract settlement date, any gain or loss on the contract is recorded as realized gains or losses on foreign currency transactions.
Risks may arise upon entering into these contracts from unanticipated movements in the value of the contract and from the potential inability of counterparties to meet the terms of their contracts. Generally, the fund’s maximum risk due to counterparty credit risk is the unrealized gain on the contract due to our use of continuous linked settlement, an industry accepted settlement system. This risk is mitigated in cases where there is an ISDA Master Agreement between the fund and the counterparty providing for netting as described above and for posting of collateral by the counterparty to the fund to cover the fund’s exposure to the counterparty under such ISDA Master Agreement.
Short Sales – The fund may enter into short sales whereby it sells a security it does not own in anticipation of a decline in the value of that security. The fund will realize a gain if the security price decreases and a loss if the security price increases between the date of the short sale and the date on which the fund replaces the borrowed security. Losses from short sales can exceed the proceeds of the security sold; and they can also exceed the potential loss from an ordinary buy and sell transaction. The amount of any premium, dividends, or interest the fund may be required to pay in connection with a short sale will be recognized as a fund expense. The fund segregates cash or marketable securities in an amount that, when combined with the amount of proceeds from the short sale deposited with the broker, at least equals the current market value of the security sold short. At December 31, 2010, the fund has yet to enter into such transactions.
Security Loans – State Street Bank and Trust Company (“State Street”), as lending agent, loans the securities of the fund to certain qualified institutions (the “Borrowers”) approved by the fund. The loans are collateralized by cash and/or U.S. Treasury and federal agency obligations in an amount typically at least equal to the market value of the securities loaned. The market value of the loaned securities is determined at the close of business of the fund and any additional required collateral is delivered to the fund on the next business day. State Street provides the fund with indemnification against Borrower default. The fund bears the risk of loss with respect to the investment of cash collateral. On loans collateralized by cash, the cash collateral is invested in a money market fund or short-term securities. A portion of the income generated upon investment of the collateral is remitted to the Borrowers, and the remainder is allocated between the fund and the lending agent. On loans collateralized by U.S. Treasury and/or federal agency obligations, a fee is received from the Borrower, and is allocated between the fund and the lending agent. Income from securities lending is included in interest income on the Statement of Operations. The dividend and interest income earned on the securities loaned is accounted for in the same manner as other dividend and interest income.
Indemnifications – Under the fund’s organizational documents, its officers and Trustees may be indemnified against certain liabilities and expenses arising out of the performance of their duties to the fund. Additionally, in the normal course of business, the fund enters into agreements with service providers that may contain indemnification clauses. The fund’s maximum exposure under these agreements is unknown as this would involve future claims that may be made against the fund that have not yet occurred.
Investment Transactions and Income – Investment transactions are recorded on the trade date. Interest income is recorded on the accrual basis. All premium and discount is amortized or accreted for financial statement purposes in accordance with U.S.
29
MFS Global Tactical Allocation Portfolio
Notes to Financial Statements – continued
generally accepted accounting principles. Inflation-indexed bonds are fixed-income securities whose principal value is periodically adjusted upward or downward to the rate of inflation. Interest is accrued based on the principal value, which is adjusted for inflation. Any increase or decrease in the principal amount of an inflation-indexed bond is generally recorded as an increase or decrease in interest income, respectively, even though the adjusted principal is not received until maturity. Dividends received in cash are recorded on the ex-dividend date. Certain dividends from foreign securities will be recorded when the fund is informed of the dividend if such information is obtained subsequent to the ex-dividend date. Dividend and interest payments received in additional securities are recorded on the ex-dividend or ex-interest date in an amount equal to the value of the security on such date.
The fund may receive proceeds from litigation settlements. Any proceeds received from litigation involving portfolio holdings are reflected in the Statement of Operations in realized gain/loss if the security has been disposed of by the fund or in unrealized gain/loss if the security is still held by the fund. Any other proceeds from litigation not related to portfolio holdings are reflected as other income in the Statement of Operations.
The fund entered into “TBA” (to be announced) purchase commitments to purchase securities for a fixed unit price at a future date. Although the unit price has been established, the principal value has not been finalized. However, the principal amount of the commitments will not fluctuate more than 0.01%. The fund holds, and maintains until settlement date, cash or high-grade debt obligations in an amount sufficient to meet the purchase price, or the fund may enter into offsetting contracts for the forward sale of other securities it owns. Income on the securities will not be earned until settlement date. TBA purchase commitments may be considered securities in themselves, and involve a risk of loss if the value of the security to be purchased declines prior to settlement date, which is in addition to the risk of decline in the value of the fund’s other assets. Unsettled TBA purchase commitments are valued at the current market value of the underlying securities.
Fees Paid Indirectly – The fund’s custody fee may be reduced according to an arrangement that measures the value of cash deposited with the custodian by the fund. This amount, for the year ended December 31, 2010, is shown as a reduction of total expenses on the Statement of Operations.
Tax Matters and Distributions – The fund intends to qualify as a regulated investment company, as defined under Subchapter M of the Internal Revenue Code, and to distribute all of its taxable income, including realized capital gains. As a result, no provision for federal income tax is required. The fund’s federal tax returns for the prior three fiscal years remain subject to examination by the Internal Revenue Service. Foreign taxes, if any, have been accrued by the fund in the accompanying financial statements.
Distributions to shareholders are recorded on the ex-dividend date. Income and capital gain distributions are determined in accordance with income tax regulations, which may differ from U.S. generally accepted accounting principles. Certain capital accounts in the financial statements are periodically adjusted for permanent differences in order to reflect their tax character. These adjustments have no impact on net assets or net asset value per share. Temporary differences which arise from recognizing certain items of income, expense, gain or loss in different periods for financial statement and tax purposes will reverse at some time in the future. Distributions in excess of net investment income or net realized gains are temporary overdistributions for financial statement purposes resulting from differences in the recognition or classification of income or distributions for financial statement and tax purposes.
Book/tax differences primarily relate to amortization and accretion of debt securities, wash sale loss deferrals, straddle loss deferrals, and derivative transactions.
The tax character of distributions declared to shareholders for the last two fiscal years is as follows:
| | | | | | | | |
| | | 12/31/10 | | | 12/31/09 | |
| Ordinary income (including any short-term capital gains) | | | $1,262,023 | | | | $7,793,150 | |
The federal tax cost and the tax basis components of distributable earnings were as follows:
| | | | |
| As of 12/31/10 | | | | |
| Cost of investments | | | $472,737,574 | |
| Gross appreciation | | | 14,982,519 | |
| Gross depreciation | | | (7,934,912 | ) |
| Net unrealized appreciation (depreciation) | | | $7,047,607 | |
| Undistributed ordinary income | | | 10,915,280 | |
| Undistributed long-term captial gain | | | 165,604 | |
| Other temporary differences | | | (5,533,864 | ) |
30
MFS Global Tactical Allocation Portfolio
Notes to Financial Statements – continued
Multiple Classes of Shares of Beneficial Interest – The fund offers multiple classes of shares, which differ in their respective distribution and/or service fees. The fund’s income, realized and unrealized gain (loss), and common expenses are allocated to shareholders based on the daily net assets of each class. Dividends are declared separately for each class. Differences in per share dividend rates are generally due to differences in separate class expenses. The fund’s distributions declared to shareholders as reported on the Statements of Changes in Net Assets are presented by class as follows:
| | | | | | | | |
| | | From net investment
income | |
| | | Year ended
12/31/10 | | | Year ended
12/31/09 | |
| Initial Class | | | $701,290 | | | | $6,938,032 | |
| Service Class | | | 560,733 | | | | 855,118 | |
| Total | | | $1,262,023 | | | | $7,793,150 | |
| (3) | | Transactions with Affiliates |
Investment Adviser – The fund has an investment advisory agreement with MFS to provide overall investment management and related administrative services and facilities to the fund.
The management fee is computed daily and paid monthly at the following annual rates:
| | | | |
| First $300 million of average daily net assets | | | 0.75% | |
| Average daily net assets in excess of $300 million | | | 0.675% | |
The management fee incurred for the year ended December 31, 2010 was equivalent to an annual effective rate of 0.75% of the fund’s average daily net assets.
The investment adviser has agreed in writing to pay a portion of the fund’s total annual operating expenses, exclusive of interest, taxes, extraordinary expenses, brokerage and transaction costs and investment-related expenses, such that total annual operating expenses do not exceed 0.90% of average daily net assets for the Initial Class shares and 1.15% of average daily net assets for the Service Class shares. This written agreement will continue until April 30, 2012. For the year ended December 31, 2010, this reduction amounted to $77,514 and is reflected as a reduction of total expenses in the Statements of Operations.
Distributor – MFS Fund Distributors, Inc. (MFD), a wholly-owned subsidiary of MFS, is the distributor of shares of the fund. The Trustees have adopted a distribution plan for the Service Class shares pursuant to Rule 12b-1 under the Investment Company Act of 1940.
The fund’s distribution plan provides that the fund will pay MFD distribution and/or service fees equal to 0.25% per annum of its average daily net assets attributable to Service Class shares as partial consideration for services performed and expenses incurred by MFD and financial intermediaries (including participating insurance companies that invest in the fund to fund variable annuity and variable life insurance contracts, sponsors of qualified retirement and pension plans that invest in the fund, and affiliates of these participating insurance companies and plan sponsors) in connection with the sale and distribution of the Service Class shares. MFD may subsequently pay all, or a portion, of the distribution and/or service fees to financial intermediaries.
Shareholder Servicing Agent – MFS Service Center, Inc. (MFSC), a wholly-owned subsidiary of MFS, receives a fee from the fund for its services as shareholder servicing agent. For the year ended December 31, 2010, the fee was $29,006, which equated to 0.0113% annually of the fund’s average daily net assets. MFSC also receives payment from the fund for out-of-pocket expenses paid by MFSC on behalf of the fund. For the year ended December 31, 2010, these costs amounted to $8.
Administrator – MFS provides certain financial, legal, shareholder communications, compliance, and other administrative services to the fund. Under an administrative services agreement, the fund partially reimburses MFS the costs incurred to provide these services. The fund is charged an annual fixed amount of $10,000 plus a fee based on average daily net assets. The administrative services fee incurred for the year ended December 31, 2010 was equivalent to an annual effective rate of 0.0354% of the fund’s average daily net assets.
Trustees’ and Officers’ Compensation – The fund pays compensation to Trustees in the form of a retainer, attendance fees, and additional compensation to the Board chairperson. The fund does not pay compensation directly to officers of the fund who are also officers of the investment adviser, all of whom receive remuneration for their services to the fund from MFS. Certain officers of the fund are officers or directors of MFS, MFD, and MFSC.
Other – This fund and certain other funds managed by MFS (the funds) have entered into services agreements (the Agreements) which provide for payment of fees by the funds to Tarantino LLC and Griffin Compliance LLC in return for the provision of services of an Independent Chief Compliance Officer (ICCO) and Assistant ICCO, respectively, for the funds. The ICCO and Assistant ICCO are officers of the funds and the sole members of Tarantino LLC and Griffin Compliance LLC,
31
MFS Global Tactical Allocation Portfolio
Notes to Financial Statements – continued
respectively. The funds can terminate the Agreements with Tarantino LLC and Griffin Compliance LLC at any time under the terms of the Agreements. MFS has agreed to bear all expenses associated with office space, other administrative support, and supplies provided to the ICCO and Assistant ICCO. For the year ended December 31, 2010, the aggregate fees paid by the fund to Tarantino LLC and Griffin Compliance LLC were $4,328 and are included in miscellaneous expense on the Statement of Operations.
The fund invests in the MFS Institutional Money Market Portfolio which is managed by MFS and seeks a high level of current income consistent with preservation of capital and liquidity. Income earned on this investment is included in dividends from underlying funds on the Statement of Operations. This money market fund does not pay a management fee to MFS.
Purchases and sales of investments, other than purchased option transactions, and short-term obligations, were as follows:
| | | | | | | | |
| | | Purchases | | | Sales | |
| U.S. Government securities | | | $122,813,604 | | | | $40,292,352 | |
| Investments (non-U.S. Government securities) | | | $359,501,093 | | | | $127,804,636 | |
| (5) | | Shares of Beneficial Interest |
The fund’s Declaration of Trust permits the Trustees to issue an unlimited number of full and fractional shares of beneficial interest. Transactions in fund shares were as follows:
| | | | | | | | | | | | | | | | |
| | | Year ended 12/31/10 | | | Year ended 12/31/09 | |
| | | Shares | | | Amount | | | Shares | | | Amount | |
| Shares sold | | | | | | | | | | | | | | | | |
Initial Class | | | 160,971 | | | | $2,205,593 | | | | 175,991 | | | | $2,245,712 | |
Service Class | | | 27,670,459 | | | | 376,359,508 | | | | 52,217 | | | | 665,945 | |
| | | 27,831,430 | | | | $378,565,101 | | | | 228,208 | | | | $2,911,657 | |
| Shares issued to shareholders in reinvestment of distributions | | | | | | | | | | | | | | | | |
Initial Class | | | 51,377 | | | | $701,290 | | | | 632,455 | | | | $6,938,032 | |
Service Class | | | 41,383 | | | | 560,733 | | | | 78,379 | | | | 855,118 | |
| | | 92,760 | | | | $1,262,023 | | | | 710,834 | | | | $7,793,150 | |
| Shares reacquired | | | | | | | | | | | | | | | | |
Initial Class | | | (927,827 | ) | | | $(12,618,417 | ) | | | (1,190,033 | ) | | | $(14,350,447 | ) |
Service Class | | | (99,957 | ) | | | (1,342,300 | ) | | | (270,275 | ) | | | (3,287,656 | ) |
| | | (1,027,784 | ) | | | $(13,960,717 | ) | | | (1,460,308 | ) | | | $(17,638,103 | ) |
| Net change | | | | | | | | | | | | | | | | |
Initial Class | | | (715,479 | ) | | | $(9,711,534 | ) | | | (381,587 | ) | | | $(5,166,703 | ) |
Service Class | | | 27,611,885 | | | | 375,577,941 | | | | (139,679 | ) | | | (1,766,593 | ) |
| | | 26,896,406 | | | | $365,866,407 | | | | (521,266 | ) | | | $(6,933,296 | ) |
The fund and certain other funds managed by MFS participate in a $1.1 billion unsecured committed line of credit, subject to a $1 billion sublimit, provided by a syndication of banks under a credit agreement. Borrowings may be made for temporary financing needs. Interest is charged to each fund, based on its borrowings, generally at a rate equal to the higher of the Federal Reserve funds rate or one month LIBOR plus an agreed upon spread. A commitment fee, based on the average daily, unused portion of the committed line of credit, is allocated among the participating funds at the end of each calendar quarter. In addition, the fund and other funds managed by MFS have established unsecured uncommitted borrowing arrangements with certain banks for temporary financing needs. Interest is charged to each fund, based on its borrowings, at a rate equal to the Federal Reserve funds rate plus an agreed upon spread. For the year ended December 31, 2010, the fund’s commitment fee and interest expense were $2,584 and $0, respectively, and are included in miscellaneous expense on the Statement of Operations.
32
MFS Global Tactical Allocation Portfolio
Notes to Financial Statements – continued
| (7) | | Transactions in Underlying Funds – Affiliated Issuers |
An affiliated issuer may be considered one in which the fund owns 5% or more of the outstanding voting securities, or a company which is under common control. For the purposes of this report, the fund assumes the following to be affiliated issuers:
| | | | | | | | | | | | | | | | |
| Underlying Funds | | Beginning Share/Par Amount | | | Acquisitions Shares/Par Amount | | | Dispositions Shares/Par Amount | | | Ending Share/Par Amount | |
| MFS Institutional Money Market Portfolio | | | 4,181,282 | | | | 239,978,121 | | | | (192,467,588 | ) | | | 51,691,815 | |
| | | | |
| Underlying Funds | | Realized Gain (Loss) | | | Capital Gain Distributions | | | Dividend Income | | | Ending Value | |
| MFS Institutional Money Market Portfolio | | | $— | | | | $— | | | | $65,116 | | | | $51,691,815 | |
33
MFS Global Tactical Allocation Portfolio
REPORT OF INDEPENDENT REGISTERED PUBLIC ACCOUNTING FIRM
To the Board of Trustees of MFS Variable Insurance Trust II and the Shareholders of MFS Global Tactical Allocation Portfolio:
We have audited the accompanying statement of assets and liabilities, including the portfolio of investments, of MFS Global Tactical Allocation Portfolio (the “Fund”) (one of the portfolios comprising MFS Variable Insurance Trust II) as of December 31, 2010, and the related statement of operations for the year then ended, the statements of changes in net assets for each of the two years in the period then ended, and the financial highlights for each of the five years in the period then ended. These financial statements and financial highlights are the responsibility of the Fund’s management. Our responsibility is to express an opinion on these financial statements and financial highlights based on our audits.
We conducted our audits in accordance with the standards of the Public Company Accounting Oversight Board (United States). Those standards require that we plan and perform the audit to obtain reasonable assurance about whether the financial statements and financial highlights are free of material misstatement. The Fund is not required to have, nor were we engaged to perform, an audit of its internal control over financial reporting. Our audits included consideration of internal control over financial reporting as a basis for designing audit procedures that are appropriate in the circumstances, but not for the purpose of expressing an opinion on the effectiveness of the Fund’s internal control over financial reporting. Accordingly, we express no such opinion. An audit also includes examining, on a test basis, evidence supporting the amounts and disclosures in the financial statements, assessing the accounting principles used and significant estimates made by management, as well as evaluating the overall financial statement presentation. Our procedures included confirmation of securities owned as of December 31, 2010, by correspondence with the custodian and brokers; where replies were not received from brokers, we performed other auditing procedures. We believe that our audits provide a reasonable basis for our opinion.
In our opinion, the financial statements and financial highlights referred to above present fairly, in all material respects, the financial position of MFS Global Tactical Allocation Portfolio as of December 31, 2010, the results of its operations for the year then ended, the changes in its net assets for each of the two years in the period then ended, and the financial highlights for each of the five years in the period then ended, in conformity with accounting principles generally accepted in the United States of America.
DELOITTE & TOUCHE LLP
Boston, Massachusetts
February 14, 2011
34
MFS Global Tactical Allocation Portfolio
TRUSTEES AND OFFICERS – IDENTIFICATION AND BACKGROUND
The Trustees and officers of the Trust, as of February 1, 2011, are listed below, together with their principal occupations during the past five years. (Their titles may have varied during that period.) The address of each Trustee and officer is 500 Boylston Street, Boston, Massachusetts 02116.
| | | | | | |
Name, Date of Birth | | Position(s) Held
with Fund | | Trustee/Officer
Since (1) | | Principal Occupations During the Past Five Years and
Other Directorships (2) |
| INTERESTED TRUSTEE | | | | |
David D. Horn (3) (born 6/07/41) | | Trustee | | April 1986 | | Private investor; Sun Life Assurance Company of Canada, Senior Vice President and General Manager for the United States (until 1997); Director (until March 2004) |
| | |
| INDEPENDENT TRUSTEES | | | | |
J. Kermit Birchfield (born 1/08/40) | | Chairman | | May 1997 | | Consultant; Century Partners, Inc. (investments), Director; Displaytech, Inc. (technology), Chairman; Dessin Fournir LLC (furniture manufacturer), Director; Site Watch LLC (software to monitor oil tanks), Managing Director (2006 to present); Juridica Investments (fund investing in judicial matters), Director (2007 to present), Immuno Science, Inc. (medical research), Independent Director (2009 to present), Intermountain Industries, Inc. (oil & gas exploration and production), Director (until February 2009) |
| | | |
Robert C. Bishop (born 1/13/43) | | Trustee | | May 2001 | | AutoImmune, Inc. (pharmaceutical product development), Chairman, President and Chief Executive Officer; Caliper Life Sciences Corp. (laboratory analytical instruments), Chairman; Optobionics Corporation (ophthalmic devices), Director (until 2007); Millipore Corporation (purification/filtration products), Director (until July 2010); Waterstreet Capital (leverage buyouts), Advisory Board (until August 2010) |
| | | |
Frederick H. Dulles (born 3/12/42) | | Trustee | | May 2001 | | Dulles International Law LLC (law firm), Senior Lawyer (since 2009); Juridica Capital Management (US) Inc. (litigation financing), Vice President and General Counsel (since 2009); Dulles Properties LLC (real estate), Broker (since 2008); The Citadel School of Business Administration (education), Adjunct Professor (since 2003); Disher, Hamrick & Myers Residential, Inc. (real estate), Broker (until 2006); Frederick H. Dulles Law Practice (law firm), (until 2006); Charlestown School of Law (education), Adjunct Professor (until 2007); Prudential Carolina Real Estate, (real estate), Broker (until 2008); Free Enterprise Foundation Inc. (research institute), Director & Secretary (until 2008); Ten State International Law PLLP (law firm), Of Counsel (until 2009) |
| | | |
Marcia A. Kean (born 6/30/48) | | Trustee | | April 2005 | | Feinstein Kean Healthcare (consulting), Chief Executive Officer |
| | | |
Ronald G. Steinhart (born 6/15/40) | | Trustee | | May 2001 | | Private investor; Penske Automotive Group (automotive retailer), Director; Animal Health International, Inc. (animal health products), Director (since 2007); Texas Industries (concrete/aggregates/cement), Director (since 2007); Susser Holdings Corporation (retail convenience stores and distributor of wholesale motor fuel), Director (since 2009); Prentiss Properties Trust (real estate investment trust), Director (until 2006); Penson Worldwide, Inc. (securities clearance), Director (until 2008) |
| | | |
Haviland Wright (born 7/21/48) | | Trustee | | May 2001 | | X-Change Corp. (multi-media web services), Director (since 2010); Nano Loa Inc. (liquid crystal displays), Director (until 2009); Profitability of Hawaii (software), Chief Development Officer (until 2010); Elixir Technologies Corporation (software), Director (until 2010) |
| | | |
| OFFICERS | | | | | | |
Maria F. DiOrioDwyer (4)
(born 12/01/58) | | President | | November 2005 | | Massachusetts Financial Services Company, Executive Vice President and Chief Regulatory Officer; Chief Compliance Officer (since December 2006) |
| | | |
| Christopher R. Bohane (4) (born 1/18/74) | | Assistant Secretary and Assistant Clerk | | July 2005 | | Massachusetts Financial Services Company, Vice President and Senior Counsel |
| | | |
John M. Corcoran (4) (born 4/13/65) | | Treasurer | | October 2008 | | Massachusetts Financial Services Company, Senior Vice President (since October 2008); State Street Bank and Trust (financial services provider), Senior Vice President, (until September 2008) |
| | | |
Ethan D. Corey (4) (born 11/21/63) | | Assistant Secretary and Assistant Clerk | | July 2005 | | Massachusetts Financial Services Company, Senior Vice President and Associate General Counsel |
| | | |
David L. DiLorenzo (4) (born 8/10/68) | | Assistant Treasurer | | July 2005 | | Massachusetts Financial Services Company, Vice President |
| | | |
Timothy M. Fagan (4) (born 7/10/68) | | Assistant Secretary and Assistant Clerk | | September 2005 | | Massachusetts Financial Services Company, Vice President and Senior Counsel |
| | | |
Mark D. Fischer (4) (born 10/27/70) | | Assistant Treasurer | | July 2005 | | Massachusetts Financial Services Company, Vice President |
35
MFS Global Tactical Allocation Portfolio
Trustees and Officers – continued
| | | | | | |
Name, Date of Birth | | Position(s) Held
with Fund | | Trustee/Officer
Since (1) | | Principal Occupations During the Past Five Years and
Other Directorships (2) |
Robyn L. Griffin (born 7/04/75) | | Assistant Independent Chief Compliance Officer | | August 2008 | | Griffin Compliance LLC (provider of compliance services), Principal (since August 2008); State Street Corporation (financial services provider), Mutual Fund Administration Assistant Vice President (October 2006 – July 2008); Liberty Mutual Group (insurance), Personal Market Assistant Controller (April 2006 – October 2006); Deloitte & Touche LLP (professional services firm), Senior Manager (prior to April 2006) |
| | | |
Brian E. Langenfeld (4) (born 3/07/73) | | Assistant Secretary and Assistant Clerk | | May 2006 | | Massachusetts Financial Services Company, Vice President and Senior Counsel (since May 2006); John Hancock Advisers, LLC, Assistant Vice President and Counsel (until April 2006) |
| | | |
Ellen Moynihan (4) (born 11/13/57) | | Assistant Treasurer | | May 1997 | | Massachusetts Financial Services Company, Senior Vice President |
| | | |
Susan S. Newton (4) (born 3/07/50) | | Assistant Secretary and Assistant Clerk | | May 2005 | | Massachusetts Financial Services Company, Senior Vice President and Associate General Counsel |
| | | |
Susan A. Pereira (4)
(born 11/05/70) | | Assistant Secretary and Assistant Clerk | | July 2005 | | Massachusetts Financial Services Company, Vice President and Senior Counsel |
| | | |
Mark N. Polebaum (4) (born 5/01/52) | | Secretary and Clerk | | February 2006 | | Massachusetts Financial Services Company, Executive Vice President, General Counsel and Secretary (since January 2006); Wilmer Cutler Pickering Hale and Dorr LLP (law firm), Partner (until January 2006) |
| | | |
Frank L. Tarantino (born 3/07/44) | | Independent Chief Compliance Officer | | September 2004 | | Tarantino LLC (provider of compliance services), Principal |
| | | |
Richard S. Weitzel (4) (born 7/16/70) | | Assistant Secretary and Assistant Clerk | | October 2007 | | Massachusetts Financial Services Company, Vice President and Assistant General Counsel |
| | | |
James O. Yost (4) (born 6/12/60) | | Assistant Treasurer | | April 1992 | | Massachusetts Financial Services Company, Senior Vice President |
| (1) | Date first appointed to serve as Trustee/Officer of an MFS fund or a Compass variable account. Each Trustee has served continuously since appointment. For the period March 2008 until October 2008, Ms. DiOrioDwyer served as Treasurer of the Funds. |
| (2) | Directorships or trusteeships of companies required to report to the Securities and Exchange Commission (i.e., “public companies”). |
| (3) | “Interested person” of the Trust, within the meaning of the Investment Company Act of 1940 (referred to as the 1940 Act), which is the principal federal law governing investment companies like the Trust, as a result of position with Sun Life of Canada (U.S.). The address of Sun Life of Canada (U.S.) is One Sun Life Executive Park, Wellesley Hills, Massachusetts 02481. |
| (4) | “Interested person” of MFS within the meaning of the 1940 Act. The address of MFS is 500 Boylston Street, Boston, Massachusetts 02116. |
The Trust does not hold annual meetings for the purpose of electing Trustees, and Trustees are not elected for fixed terms. Each Trustee and officer holds office until his or her successor is chosen and qualified, or until his or her earlier death, resignation, retirement or removal.
All Trustees currently serve as Trustees of the Trust and have served in that capacity since originally elected or appointed. All of the Trustees are also Managers of the Compass Variable Accounts. The executive officers of the Trust hold similar offices for the Compass Variable Accounts and other funds in the MFS fund complex. As of January 1, 2011, each Trustee serves as a Trustee or Manager of 31 Accounts/Portfolios.
36
MFS Global Tactical Allocation Portfolio
Trustees and Officers – continued
The Statement of Additional Information contains further information about the Trustees and is available without charge upon request by calling 1-800-752-7215.
| | |
Investment Adviser
Massachusetts Financial Services Company 500 Boylston Street, Boston, MA 02116-3741 | | Custodian State Street Bank and Trust 1 Lincoln Street, Boston, MA 02111-2900 |
Distributor
MFS Fund Distributors, Inc. 500 Boylston Street, Boston, MA 02116-3741 | | Independent Registered Public Accounting Firm Deloitte & Touche LLP 200 Berkeley Street, Boston, MA 02116 |
Portfolio Managers Nevin Chitkara Steven Gorham Richard Hawkins Benjamin Nastou Natalie Shapiro Benjamin Stone Erik Weisman Barnaby Wiener | | |
37
MFS Global Tactical Allocation Portfolio
BOARD REVIEW OF INVESTMENT ADVISORY AGREEMENT
The Investment Company Act of 1940 requires that both the full Board of Trustees and a majority of the non-interested (“independent”) Trustees, voting separately, annually approve the continuation of the investment advisory agreement between MFS Variable Insurance Trust II (the “Trust”) and Massachusetts Financial Services Company (“MFS”) on behalf of the Fund. The Trustees consider matters bearing on the Fund and the advisory arrangement at their meetings throughout the year, including a review of performance data at each regular meeting. In addition, the independent Trustees met in person in May and again in July 2010 (“contract review meetings”) for the specific purpose of considering whether to approve the continuation of the investment advisory agreement for the Fund. The independent Trustees were assisted in their evaluation of the investment advisory agreement by independent legal counsel, from whom they received separate legal advice and with whom they met separately from MFS management during various contract review meetings. The independent Trustees were also assisted in this process by the Fund’s Independent Chief Compliance Officer, a full-time senior officer appointed by and reporting to the independent Trustees.
In connection with their deliberations, the Trustees, including the independent Trustees, considered such information and factors as they believed, in light of the legal advice furnished to them and their own business judgment, to be relevant. The investment advisory agreement was considered separately for the Fund, although the Trustees also took into account the common interests of all Funds in the Trust in their review. As described below, the Trustees considered the nature, quality, and extent of the various investment advisory, administrative, and shareholder services performed by MFS under the existing investment advisory agreement and other arrangements with the Trust.
In connection with their contract review meetings, the Trustees received and relied upon materials which included, among other items: (i) information provided by Lipper Inc. (“Lipper”) on the investment performance of the Fund for various time periods ended December 31, 2009, compared to the investment performance of a group of funds with substantially similar investment classifications/objectives (the “Lipper performance universe”), (ii) information provided by Lipper on the Fund’s advisory fees and other expenses compared to the advisory fees and other expenses of comparable funds identified by Lipper (the “Lipper expense group”), (iii) information provided by MFS on the advisory fees of comparable portfolios of its other clients, including institutional separate account and other clients, (iv) information as to whether, and to what extent applicable, expense waivers, reimbursements or fee “breakpoints” are observed for the Fund, (v) information regarding MFS’ financial results and financial condition, including MFS’ and certain of its affiliates’ estimated profitability from services performed for the Fund, (vi) MFS’ views regarding the outlook for the mutual fund industry and its strategic business plans, (vii) descriptions of various functions performed by MFS for the Trust, such as compliance monitoring and portfolio trading practices, and (viii) information regarding the overall organization of MFS, including information about MFS’ senior management and other personnel providing investment advisory, administrative and other services to the Fund. The comparative performance, fee and expense information prepared and provided by Lipper was not independently verified, and the independent Trustees did not independently verify any information provided to them by MFS.
The Trustees’ conclusion as to the continuation of the investment advisory agreement was based on comprehensive consideration of all information provided to the Trustees and was not the result of any single factor. Some of the factors that figured particularly in the Trustees’ deliberations are described below for the Fund, while individual Trustees may have given different weight to various factors and evaluated the information presented as a whole differently than another Trustee. The Trustees recognized that the fee arrangements for the Fund reflect years of review and discussion between the independent Trustees and MFS, that certain aspects of such arrangements may receive greater scrutiny in some years than others, and that the Trustees’ conclusions may be based, in part, on their consideration of these same arrangements during the course of the year and in prior years.
Based on information provided by Lipper, the Trustees compared the Fund’s total return investment performance to the performance of the Lipper performance universe over various time periods. The Trustees placed particular emphasis on the total return performance of the Fund’s Initial Class shares in comparison to the performance of funds in its Lipper performance universe over the one-, three- and five-year periods ended December 31, 2009. The Trustees did not rely on performance results for more recent periods, including those shown elsewhere in this report.
The Trustees noted the performance of the Fund’s Initial Class shares was in the 5th quintile relative to the other funds in the Lipper performance universe for the one-year period (the 1st quintile being the best performers and the 5th quintile being the worst performers). The total return performance of the Fund was in the 3rd quintile for the three-year period and in the 2nd quintile for the five-year period ended December 31, 2009, relative to the Lipper performance universe. Based on the nature and quality of services historically provided by MFS, the Board of Trustees concluded that the Fund’s performance was satisfactory.
38
MFS Global Tactical Allocation Portfolio
Board Review of Investment Advisory Agreement – continued
In the course of their deliberations, the Trustees took into account information provided by MFS during contract review meetings, as well as during investment review meetings conducted with portfolio management personnel during the course of the year.
In assessing the reasonableness of the Fund’s advisory fee, the Trustees considered, among other information, the Fund’s advisory fee and the total expense ratio of the Fund’s Initial Class shares as a percentage of average daily net assets, compared to the advisory fee and total expense ratios of its peer group of funds based on information provided by Lipper. The Trustees also considered the advisory fees charged by MFS to institutional accounts. In comparing these fees, the Trustees considered the generally broader scope of services provided by MFS to the Trust than those provided to institutional accounts. The Trustees also considered the higher demands placed on MFS’ investment personnel and trading infrastructure as a result of the daily cash in-flows and out-flows of the Fund, and the impact on MFS and related expenses due to the more extensive regulatory regime to which the Fund is subject, compared to institutional accounts.
In considering the fees, the Trustees noted from the Lipper data that the Fund’s effective advisory fee rate was approximately at the median and total expense ratio was above the median of such fees and expenses of funds in the Lipper expense group. In addition, the Trustees accepted MFS’ offer to continue the expense limitation for the Fund. The Trustees further concluded that the existing breakpoint was sufficient to allow the Fund to benefit from economies of scale as its assets grow. The Trustees concluded that the fees were reasonable in light of the nature and quality of services provided.
The Trustees also considered information prepared by MFS relating to its costs and profits with respect to the Fund and other investment companies and accounts advised by MFS, as well as MFS’ methodologies used to determine and allocate its costs to the Fund and other accounts and products for purposes of estimating profitability.
After reviewing these and other factors described below, the Trustees concluded that the advisory fees charged to the Fund represent reasonable compensation in light of the nature and quality of the services being provided by MFS.
In addition, the Trustees considered MFS’ resources and related efforts to continue to retain, attract and motivate capable personnel to serve the Fund. The Trustees also considered the financial resources of MFS and its parent, Sun Life Financial Inc. The Trustees further considered any advantages and possible disadvantages of having an adviser which also serves other investment companies as well as institutional accounts.
The Trustees also considered the nature, quality, cost, and extent of administrative, transfer agency, and distribution services provided to the Fund by MFS and its affiliates under agreements and plans other than the investment advisory agreement, including the 12b-1 fees the Fund pays to MFS Fund Distributors, Inc., an affiliate of MFS. The Trustees also considered the nature, extent and quality of certain other services MFS performs or arranges on the Fund’s behalf, which may include securities lending programs, directed expense payment programs, class action recovery programs, and MFS’ interaction with third-party service providers, principally custodians and sub-custodians. The Trustees concluded that the various non-advisory services provided by MFS and its affiliates on behalf of the Fund were satisfactory. The Trustees also considered the benefits to MFS from the use of the Fund’s portfolio brokerage commissions to pay for investment research and various other factors. Additionally, the Trustees considered so-called “fall-out benefits” to MFS such as reputational value derived from serving as investment manager to the Trust, and determined that any such benefits derived by MFS were reasonable and fair.
Based on their evaluation of factors that they deemed to be material, including those factors described above, the Board of Trustees, including a majority of the independent Trustees, concluded that the investment advisory agreement should be continued for an additional one-year period, commencing September 1, 2010.
A discussion regarding the Board’s most recent review and renewal of the fund’s Investment Advisory Agreement with MFS is available by clicking on the fund’s name under “Variable Insurance Portfolios — VIT II” in the “Products and Performance” section of the MFS Web site (mfs.com).
39
MFS Global Tactical Allocation Portfolio
PROXY VOTING POLICIES AND INFORMATION
A general description of the MFS funds’ proxy voting policies and procedures is available without charge, upon request, by calling 1-800-225-2606, by visiting the Proxy Voting section of mfs.com or by visiting the SEC’s Web site at http://www.sec.gov.
Information regarding how the fund voted proxies relating to portfolio securities during the most recent twelve-month period ended June 30 is available without charge by visiting the Proxy Voting section of mfs.com or by visiting the SEC’s Web site at http://www.sec.gov.
QUARTERLY PORTFOLIO DISCLOSURE
The fund will file a complete schedule of portfolio holdings with the Securities and Exchange Commission (the Commission) for the first and third quarters of each fiscal year on Form N-Q. The fund’s Form N-Q may be reviewed and copied at the:
Public Reference Room
Securities and Exchange Commission
100 F Street, NE, Room 1580
Washington, D.C. 20549
Information on the operation of the Public Reference Room may be obtained by calling the Commission at 1-800-SEC-0330. The fund’s Form N-Q is available on the EDGAR database on the Commission’s Internet Web site at http://www.sec.gov, and copies of this information may be obtained, upon payment of a duplicating fee, by electronic request at the following e-mail address: publicinfo@sec.gov or by writing the Public Reference Section at the above address.
FURTHER INFORMATION
From time to time, MFS may post important information about the fund or the MFS funds on the MFS web site (mfs.com). This information is available by visiting the “News & Commentary” section of mfs.com or by clicking on the fund’s name under “Variable Insurance Portfolios — VIT II” in the “Products and Performance” section of mfs.com.
FEDERAL TAX INFORMATION (unaudited)
The following information is provided pursuant to provisions of the Internal Revenue Code.
For corporate shareholders, 54.04% of the ordinary income dividends paid during the fiscal year qualify for the corporate dividends received deduction.
40
MFS Global Tactical Allocation Portfolio
MFS® PRIVACY NOTICE
Privacy is a concern for every investor today. At MFS Investment Management® and the MFS funds, we take this concern very seriously. We want you to understand our policies about the investment products and services that we offer, and how we protect the nonpublic personal information of investors who have a direct relationship with us and our wholly owned subsidiaries.
Throughout our business relationship, you provide us with personal information. We maintain information and records about you, your investments, and the services you use. Examples of the nonpublic personal information we maintain include
| | Ÿ | | data from investment applications and other forms |
| | Ÿ | | share balances and transactional history with us, our affiliates, or others |
| | Ÿ | | facts from a consumer reporting agency |
We do not disclose any nonpublic personal information about our customers or former customers to anyone, except as permitted by law. We may share nonpublic personal information with third parties or certain of our affiliates in connection with servicing your account or processing your transactions. We may share information with companies or financial institutions that perform marketing services on our behalf or with other financial institutions with which we have joint marketing arrangements, subject to any legal requirements.
Authorization to access your nonpublic personal information is limited to appropriate personnel who provide products, services, or information to you. We maintain physical, electronic, and procedural safeguards to help protect the personal information we collect about you.
If you have any questions about the MFS privacy policy, please call 1-800-225-2606 any business day.
Note: If you own MFS products or receive MFS services in the name of a third party such as a bank or broker-dealer, their privacy policy may apply to you instead of ours.
41


MFS® MONEY MARKET PORTFOLIO
The report is prepared for the general information of contract owners. It is authorized for distribution to prospective investors only when preceded or accompanied by a current prospectus.
NOT FDIC INSURED Ÿ MAY LOSE VALUE Ÿ NO BANK GUARANTEE Ÿ NOT A DEPOSIT Ÿ NOT INSURED BY ANY FEDERAL GOVERNMENT AGENCY OR NCUA/NCUSIF
MFS Money Market Portfolio
LETTER FROM THE CEO

Dear Contract Owners:
After an extended rebound in the financial markets, uncertainty returned in 2010 as investors began to question the durability of the recovery for global economies and markets. That uncertainty led to increased risk aversion, especially as investors saw the eurozone struggle with the debt woes of many of its members. In September, the U.S. Federal Reserve Board’s promises to further loosen monetary policy helped assuage market fears and drive asset prices off their recent lows. A combination of solid earnings and improving economic data gave an additional boost to investor sentiment. As we enter 2011, we are cautiously optimistic that economic growth will continue to improve and that the global economies will recover from the shocks of the past few years. We expect the pace of recovery worldwide will be uneven and volatile.
As always, we continue to be mindful of the many economic challenges faced at the local, national, and international levels. It is in times such as these that we want to remind investors of the merits of maintaining a long-term view, adhering to basic investing principles such as asset allocation and diversification, and working closely with their advisors to research and identify appropriate investment opportunities.
Respectfully,

Robert J. Manning
Chairman and Chief Executive Officer
MFS Investment Management®
February 14, 2011
The opinions expressed in this letter are subject to change, may not be relied upon for investment advice, and no forecasts can be guaranteed.
1
MFS Money Market Portfolio
PORTFOLIO COMPOSITION
Portfolio structure (u)
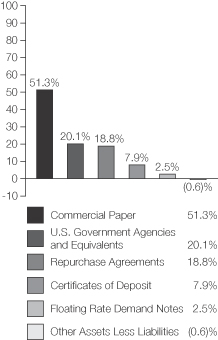
| | | | |
| Composition including fixed income credit quality (a)(u) | |
| A-1+ | | | 3.0% | |
| A-1 | | | 97.6% | |
| Not Rated | | | 0.0% | |
| Cash & Other | | | (0.6)% | |
| | | | |
| Maturity breakdown (u) | | | | |
| 0 - 7 days | | | 24.4% | |
| 8 - 29 days | | | 28.8% | |
| 30 - 59 days | | | 16.4% | |
| 60 - 89 days | | | 16.3% | |
| 90 - 366 days | | | 14.7% | |
| Other Assets Less Liabilities | | | (0.6)% | |
| (a) | The composition table shows the percentage of portfolio assets falling within each rating category. Included in each rating category are short-term debt securities, the ratings of which are based on the short-term credit quality ratings of the securities’ issuers. For repurchase agreements, the credit quality is based on the short-term rating of the counterparty with which MFS trades the repurchase agreement. Each short-term debt security is assigned a rating in accordance with the following ratings hierarchy: If the issuer is rated by Moody’s, then that rating is used; if not rated by Moody’s, then a Standard & Poor’s rating is used; if not rated by S&P, then a Fitch rating is used. Cash and other portfolio assets that are not securities are not included in the categories mentioned above. Ratings are converted to the S&P scale and are subject to change. |
| (u) | For purposes of this presentation, accrued interest, where applicable, is included. |
From time to time, “Other Assets Less Liabilities”, may be negative due to timing of cash receipts.
Percentages are based on net assets as of 12/31/10.
The portfolio is actively managed and current holdings may be different.
2
MFS Money Market Portfolio
PERFORMANCE SUMMARY THROUGH 12/31/10
Total returns as well as the current 7-day yield have been provided for the applicable time periods. Performance results reflect the percentage change in net asset value, including the reinvestment of any dividends and capital gains distributions. (See Notes to Performance Summary.) An investment in the portfolio is not insured or guaranteed by the Federal Deposit Insurance Corporation or any other government agency. Although the fund seeks to preserve the value of your investment at $1.00 per unit, it is possible to lose money by investing in the fund.
Performance data shown represents past performance and is no guarantee of future results. Investment return and principal value fluctuate so your units, when sold, may be worth more or less than the original cost; current performance may be lower or higher than quoted. The performance shown does not reflect the deduction of taxes, if any, that a contract holder would pay on fund distributions or the redemption of contract units. The returns for the fund shown also do not reflect the deduction of expenses associated with variable products, such as mortality and expense risk charges, separate account charges, and sales charges imposed by the insurance company separate accounts. Such expenses would reduce the overall returns shown.
| | | | | | | | | | | | |
| | | Class | | Inception | | 1-year total return | | Current 7-day yield | | Current 7-day yield
without waiver | | |
| | | Initial Class | | 7/19/85 | | 0.00% | | 0.00% | | (0.35)% | | |
| | | Service Class | | 8/24/01 | | 0.00% | | 0.00% | | (0.60)% | | |
Notes to Performance Summary
Yields quoted are based on the latest seven days ended as of December 31, 2010, with dividends annualized. The yield quotations more closely reflect the current earnings of the fund than the total return quotations.
Performance results reflect any applicable expense subsidies, waivers and adjustments in effect during the periods shown. Subsidies and fee waivers may be imposed to enhance a fund’s yield or to avoid a negative yield during periods when the fund’s operating expenses have a significant impact on the fund’s yield due to lower interest rates. Without such subsidies and waivers the fund’s performance results would be less favorable. Please see the prospectus and financial statements for complete details. All results are historical and assume the reinvestment of any dividends and capital gains distributions.
3
MFS Money Market Portfolio
EXPENSE TABLE
Fund Expenses Borne by the Contract Holders During the Period,
July 1, 2010 through December 31, 2010
As a contract holder of the fund, you incur ongoing costs, including management fees; distribution and/or service (12b-1) fees; and other fund expenses. This example is intended to help you understand your ongoing costs (in dollars) of investing in the fund and to compare these costs with the ongoing costs of investing in other mutual funds.
The example is based on an investment of $1,000 invested at the beginning of the period and held for the entire period July 1, 2010 through December 31, 2010.
Actual Expenses
The first line for each share class in the following table provides information about actual account values and actual expenses. You may use the information in this line, together with the amount you invested, to estimate the expenses that you paid over the period. Simply divide your account value by $1,000 (for example, an $8,600 account value divided by $1,000 = 8.6), then multiply the result by the number in the first line under the heading entitled “Expenses Paid During Period” to estimate the expenses you paid on your account during this period.
Hypothetical Example for Comparison Purposes
The second line for each share class in the following table provides information about hypothetical account values and hypothetical expenses based on the fund’s actual expense ratio and an assumed rate of return of 5% per year before expenses, which is not the fund’s actual return. The hypothetical account values and expenses may not be used to estimate the actual ending account balance or expenses you paid for the period. You may use this information to compare the ongoing costs of investing in the fund and other funds. To do so, compare this 5% hypothetical example with the 5% hypothetical examples that appear in the shareholder reports of the other funds.
Please note that the expenses shown in the table are meant to highlight the fund’s ongoing costs only and do not take into account the fees and expenses imposed under the variable contracts through which your investment in the fund is made. Therefore, the second line for each share class in the table is useful in comparing ongoing costs associated with an investment in vehicles (such as the fund) which fund benefits under variable annuity and variable life insurance contracts and to qualified pension and retirement plans only, and will not help you determine the relative total costs of investing in the fund through variable annuity and variable life insurance contracts. If the fees and expenses imposed under the variable contracts were included, your costs would have been higher.
| | | | | | | | | | | | | | | | | | |
| Share Class | | | | Annualized
Expense Ratio | | | Beginning
Account Value
7/01/10 | | | Ending Account Value
12/31/10 | | | Expenses Paid
During Period (p)
7/01/10-12/31/10 | |
| Initial Class | | Actual | | | 0.26% | | | | $1,000.00 | | | | $1,000.00 | | | | $1.31 | |
| | Hypothetical (h) | | | 0.26% | | | | $1,000.00 | | | | $1,023.89 | | | | $1.33 | |
| Service Class | | Actual | | | 0.26% | | | | $1,000.00 | | | | $1,000.00 | | | | $1.31 | |
| | Hypothetical (h) | | | 0.26% | | | | $1,000.00 | | | | $1,023.89 | | | | $1.33 | |
| (h) | 5% class return per year before expenses. |
| (p) | Expenses paid is equal to each class’ annualized expense ratio, as shown above, multiplied by the average account value over the period, multiplied by the number of days in the period, divided by the number of days in the year. |
Expense Changes Impacting Table
As more fully disclosed in footnote 3 to the financial statements, the expense ratios reported above include additional expense reductions to avoid a negative yield.
4
MFS Money Market Portfolio
PORTFOLIO OF INVESTMENTS – 12/31/10
The Portfolio of Investments is a complete list of all securities owned by your fund. It is categorized by broad-based asset classes.
| | | | | | | | |
| Issuer | | Shares/Par | | | Value ($) | |
| | | | | | | | |
| COMMERCIAL PAPER (y) – 51.3% | |
| Automotive – 3.0% | | | | | | | | |
Toyota Motor Credit Corp.,
0.22%, due 1/13/11 | | $ | 10,370,000 | | | $ | 10,369,240 | |
| | | | | | | | |
| Food & Beverages – 8.4% | | | | | | | | |
| Coca-Cola Co., 0.23%, due 3/16/11 (t) | | $ | 10,228,000 | | | $ | 10,223,164 | |
| Nestle Capital Corp., 0.2%, due 3/16/11 (t) | | | 10,117,000 | | | | 10,112,841 | |
| Pepsico, Inc., 0.17%, due 2/11/11 (t) | | | 8,252,000 | | | | 8,250,402 | |
| | | | | | | | |
| | | | | | $ | 28,586,407 | |
| | | | | | | | |
| Machinery & Tools – 2.7% | | | | | | | | |
| Deere and Co., 0.2%, due 1/27/11 (t) | | $ | 9,047,000 | | | $ | 9,045,693 | |
| | | | | | | | |
| Major Banks – 14.8% | | | | | | | | |
ANZ National (International) Ltd.,
0.28%, due 1/24/11 (t) | | $ | 2,000,000 | | | $ | 1,999,642 | |
| Bank of America Corp., 0.28%, due 1/10/11 | | | 10,577,000 | | | | 10,576,260 | |
Barclays U.S. Funding Corp.,
0.18%, due 1/03/11 | | | 6,892,000 | | | | 6,891,930 | |
| HSBC USA, Inc., 0.24%, due 2/14/11 | | | 4,480,000 | | | | 4,478,686 | |
| HSBC USA, Inc., 0.22%, due 1/26/11 | | | 5,804,000 | | | | 5,803,113 | |
JPMorgan Chase & Co.,
0.23%, due 4/25/11 | | | 10,384,000 | | | | 10,376,437 | |
Toronto Dominion HDG (USA), Inc.,
0.26%, due 3/22/11 (t) | | | 5,310,000 | | | | 5,306,932 | |
Toronto Dominion HDG (USA), Inc.,
0.21%, due 1/18/11 (t) | | | 4,973,000 | | | | 4,972,507 | |
| | | | | | | | |
| | | | | | $ | 50,405,507 | |
| | | | | | | | |
| Network & Telecom – 3.0% | | | | | | | | |
| AT&T, Inc., 0.21%, due 1/12/11 (t) | | $ | 10,343,000 | | | $ | 10,342,336 | |
| | | | | | | | |
| Other Banks & Diversified Financials – 14.2% | | | | | |
| Bank of Montreal, 0.24%, due 3/01/11 | | $ | 6,854,000 | | | $ | 6,851,304 | |
| Bank of Nova Scotia, 0.235%, due 2/04/11 | | | 6,648,000 | | | | 6,646,525 | |
| Bank of Nova Scotia, 0.235%, due 2/15/11 | | | 502,000 | | | | 501,853 | |
| Bank of Nova Scotia, 0.275%, due 3/21/11 | | | 3,185,000 | | | | 3,183,078 | |
Citigroup Funding, Inc.,
0.29%, due 1/19/11 | | | 10,545,000 | | | | 10,543,471 | |
Rabobank USA Financial Corp.,
0.3%, due 5/10/11 | | | 10,382,000 | | | | 10,370,839 | |
UBS Finance (Delaware) LLC,
0.22%, due 1/18/11 | | | 9,449,000 | | | | 9,448,018 | |
UBS Finance (Delaware) LLC,
0.285%, due 3/14/11 | | | 895,000 | | | | 894,490 | |
| | | | | | | | |
| | | | | | $ | 48,439,578 | |
| | | | | | | | |
| Pharmaceuticals – 3.2% | | | | | | | | |
| Abbott Laboratories, 0.2%, due 3/08/11 (t) | | $ | 6,379,000 | | | $ | 6,376,661 | |
| Johnson & Johnson, 0.2%, due 3/09/11 (t) | | | 4,471,000 | | | | 4,469,336 | |
| | | | | | | | |
| | | | | | $ | 10,845,997 | |
| | | | | | | | |
| Tobacco – 2.0% | | | | | | | | |
Philip Morris International, Inc.,
0.21%, due 1/18/11 (t) | | $ | 6,893,000 | | | $ | 6,892,316 | |
| | | | | | | | |
Total Commercial Paper, at
Amortized Cost and Value | | | | | | $ | 174,927,074 | |
| | | | | | | | |
| | | | | | | | |
| Issuer | | Shares/Par | | | Value ($) | |
| | | | | | | | |
| U.S. GOVERNMENT AGENCIES AND EQUIVALENTS (y) – 20.1% | |
| Fannie Mae, 0.21%, due 2/09/11 | | $ | 10,620,000 | | | $ | 10,617,584 | |
| Fannie Mae, 0.2%, due 2/22/11 | | | 10,710,000 | | | | 10,706,906 | |
| Fannie Mae, 0.22%, due 3/01/11 | | | 5,000,000 | | | | 4,998,197 | |
Federal Home Loan Bank,
0.155%, due 1/05/11 | | | 3,802,000 | | | | 3,801,935 | |
Federal Home Loan Bank,
0.16%, due 3/11/11 | | | 7,285,000 | | | | 7,282,766 | |
Federal Home Loan Bank,
0.23%, due 6/01/11 | | | 13,600,000 | | | | 13,586,880 | |
Federal Home Loan Bank,
0.2%, due 6/03/11 | | | 3,700,000 | | | | 3,696,855 | |
| Freddie Mac, 0.2%, due 2/07/11 | | | 333,000 | | | | 332,932 | |
| Freddie Mac, 0.165%, due 3/14/11 | | | 4,095,000 | | | | 4,093,649 | |
| Freddie Mac, 0.17%, due 3/14/11 | | | 2,812,000 | | | | 2,811,044 | |
| Freddie Mac, 0.18%, due 3/30/11 | | | 745,000 | | | | 744,672 | |
| Freddie Mac, 0.3%, due 4/26/11 | | | 6,000,000 | | | | 5,994,250 | |
| | | | | | | | |
Total U.S. Government Agencies and Equivalents,
at Amortized Cost and Value | | | $ | 68,667,670 | |
| | | | | | | | |
|
| CERTIFICATES OF DEPOSIT – 7.9% | |
| Major Banks – 7.9% | | | | | | | | |
| Abbey National Treasury Services PLC/US Branch, 0.28%, due 1/14/11 | | $ | 4,630,000 | | | $ | 4,630,000 | |
| Abbey National Treasury Services PLC/US Branch, 0.3%, due 1/21/11 | | | 5,744,000 | | | | 5,744,000 | |
BNP Paribas/New York Branch,
0.69%, due 1/14/11 | | | 7,830,000 | | | | 7,830,000 | |
BNP Paribas/New York Branch,
0.29%, due 2/22/11 | | | 2,530,000 | | | | 2,530,000 | |
| Royal Bank of Canada/Chicago Branch, 0.33%, due 6/07/11 | | | 6,130,000 | | | | 6,130,000 | |
| | | | | | | | |
| Total Certificates of Deposit, at Amortized Cost and Value | | | | | | $ | 26,864,000 | |
| | | | | | | | |
|
| FLOATING RATE DEMAND NOTES – 2.5% | |
East Baton Rouge, LA, Pollution Control Rev. (Exxon Mobil Corp.),
0.22%, due 1/03/11 | | $ | 2,800,000 | | | $ | 2,800,000 | |
Lincoln County, WY, Pollution Control Rev. (Exxon Mobil Corp.), “C”,
0.24%, due 1/03/11 | | | 3,200,000 | | | | 3,200,000 | |
Lincoln County, WY, Pollution Control Rev. (Exxon Mobil Corp.),
0.22%, due 1/03/11 | | | 2,600,000 | | | | 2,600,000 | |
| | | | | | | | |
Total Floating Rate Demand Notes
(Identified Cost, $8,600,000) | | | $ | 8,600,000 | |
| | | | | | | | |
5
MFS Money Market Portfolio
Portfolio of Investments – continued
| | | | | | | | |
| Issuer | | Shares/Par | | | Value ($) | |
| | | | | | | | |
| REPURCHASE AGREEMENTS – 18.8% | |
| Bank of America Corp., 0.15%, dated 12/31/10, due 1/03/11, total to be received $29,656,371 (secured by U.S. Treasury and Federal Agency obligations valued at $30,249,126 in a jointly traded account) | | $ | 29,656,000 | | | $ | 29,656,000 | |
| Goldman Sachs, 0.15%, dated 12/31/10, due 1/03/11, total to be received $34,307,429 (secured by U.S. Treasury and Federal Agency obligations valued at $34,993,272 in a jointly traded account) | | | 34,307,000 | | | | 34,307,000 | |
| | | | | | | | |
| Total Repurchase Agreements, at Cost | | | $ | 63,963,000 | |
| | | | | | | | |
Total Investments, at
Amortized Cost and Value | | | $ | 343,021,744 | |
| | | | | | | | |
OTHER ASSETS, LESS
LIABILITIES – (0.6)% | | | | (2,197,941 | ) |
| | | | | | | | |
| Net Assets – 100.0% | | | $ | 340,823,803 | |
| | | | | | | | |
| (t) | Security exempt from registration with the U.S. Securities and Exchange Commission under Section 4(2) of the Securities Act of 1933. |
| (y) | The rate shown represents an annualized yield at time of purchase. |
The following abbreviations are used in this report and are defined:
| PLC | | Public Limited Company |
See Notes to Financial Statements
6
MFS Money Market Portfolio
FINANCIAL STATEMENTS | STATEMENT OF ASSETS AND LIABILITIES
This statement represents your fund’s balance sheet, which details the assets and liabilities comprising the total value of the fund.
| | | | | | | | |
At 12/31/10 | | | | | | | | |
Assets | | | | | | | | |
Investments, at amortized cost and value | | | $279,058,744 | | | | | |
Repurchase agreements, at cost and value | | | 63,963,000 | | | | | |
Total investments, at amortized cost and value | | | $343,021,744 | | | | | |
Cash | | | 119 | | | | | |
| Receivables for | | | | | | | | |
Fund shares sold | | | 654,893 | | | | | |
Interest | | | 33,030 | | | | | |
| Receivable from investment adviser | | | 2,521 | | | | | |
Other assets | | | 10,581 | | | | | |
Total assets | | | | | | | $343,722,888 | |
Liabilities | | | | | | | | |
Payable for fund shares reacquired | | | $2,843,251 | | | | | |
Payable to affiliates | | | | | | | | |
Investment adviser | | | 2,931 | | | | | |
Distribution and/or service fees | | | 63 | | | | | |
Administrative services fee | | | 664 | | | | | |
Payable for Trustees’ compensation | | | 513 | | | | | |
Accrued expenses and other liabilities | | | 51,663 | | | | | |
Total liabilities | | | | | | | $2,899,085 | |
Net assets | | | | | | | $340,823,803 | |
Net assets consist of | | | | | | | | |
Paid-in capital | | | $341,047,614 | | | | | |
Accumulated net realized gain (loss) on investments | | | (223,811 | ) | | | | |
Net assets | | | | | | | $340,823,803 | |
Shares of beneficial interest outstanding | | | | | | | 341,048,708 | |
| | | | | | | | | | | | |
| | | Net assets | | | Shares
outstanding | | | Net asset value
per share | |
Initial Class | | | $172,365,158 | | | | 172,490,976 | | | | $1.00 | |
Service Class | | | 168,458,645 | | | | 168,557,732 | | | | 1.00 | |
See Notes to Financial Statements
7
MFS Money Market Portfolio
FINANCIAL STATEMENTS | STATEMENT OF OPERATIONS
This statement describes how much your fund earned in investment income and accrued in expenses. It also describes any gains and/or losses generated by fund operations.
| | | | | | | | |
| Year ended 12/31/10 | | | | | | | | |
| Net investment income | | | | | | | | |
Interest income | | | | | | | $990,019 | |
Expenses | | | | | | | | |
Management fee | | | $1,836,936 | | | | | |
Distribution and/or service fees | | | 444,222 | | | | | |
Administrative services fee | | | 129,611 | | | | | |
Trustees’ compensation | | | 52,545 | | | | | |
Custodian fee | | | 38,070 | | | | | |
Shareholder communications | | | 21,086 | | | | | |
Auditing fees | | | 29,408 | | | | | |
Legal fees | | | 7,378 | | | | | |
Miscellaneous | | | 35,728 | | | | | |
Total expenses | | | | | | | $2,594,984 | |
Fees paid indirectly | | | (176 | ) | | | | |
Reduction of expenses by investment adviser and distributor | | | (1,604,789 | ) | | | | |
Net expenses | | | | | | | $990,019 | |
Net investment income | | | | | | | $0 | |
Net realized gain (loss) on investment transactions | | | | | | | $732 | |
Change in net assets from operations | | | | | | | $732 | |
See Notes to Financial Statements
8
MFS Money Market Portfolio
FINANCIAL STATEMENTS | STATEMENTS OF CHANGES IN NET ASSETS
These statements describe the increases and/or decreases in net assets resulting from operations, any distributions, and any shareholder transactions.
| | | | | | | | |
For years ended 12/31 | | | 2010 | | | | 2009 | |
Change in net assets | | | | | | | | |
From operations | | | | | | | | |
Net investment income | | | $0 | | | | $90 | |
Net realized gain (loss) on investments | | | 732 | | | | — | |
Change in net assets from operations | | | $732 | | | | $90 | |
Distributions declared to shareholders | | | | | | | | |
From net investment income | | | $— | | | | $(1,328 | ) |
Change in net assets from fund share transactions | | | $(57,798,897 | ) | | | $(165,760,538 | ) |
Total change in net assets | | | $(57,798,165 | ) | | | $(165,761,776 | ) |
Net assets | | | | | | | | |
At beginning of period | | | 398,621,968 | | | | 564,383,744 | |
At end of period | | | $340,823,803 | | | | $398,621,968 | |
See Notes to Financial Statements
9
MFS Money Market Portfolio
FINANCIAL STATEMENTS | FINANCIAL HIGHLIGHTS
The financial highlights table is intended to help you understand the fund’s financial performance for the past 5 years. Certain information reflects financial results for a single fund share. The total returns in the table represent the rate by which an investor would have earned (or lost) on an investment in the fund share class (assuming reinvestment of all distributions) held for the entire period.
| | | | | | | | | | | | | | | | | | | | |
| Initial Class | | Years ended 12/31 | |
| | | 2010 | | | 2009 | | | 2008 | | | 2007 | | | 2006 | |
Net asset value, beginning of period | | | $1.00 | | | | $1.00 | | | | $1.00 | | | | $1.00 | | | | $1.00 | |
| Income (loss) from investment operations | | | | | | | | | | | | | | | | | | | | |
Net investment income (d) | | | $0.00 | | | | $0.00 | (w) | | | $0.02 | | | | $0.05 | | | | $0.04 | |
Net realized and unrealized gain (loss) on investments | | | 0.00 | (w) | | | 0.00 | | | | (0.00 | )(w) | | | (0.00 | )(w) | | | (0.00 | )(w) |
Total from investment operations | | | $0.00 | (w) | | | $0.00 | (w) | | | $0.02 | | | | $0.05 | | | | $0.04 | |
| Less distributions declared to shareholders | | | | | | | | | | | | | | | | | | | | |
From net investment income | | | $— | | | | $(0.00 | )(w) | | | $(0.02 | ) | | | $(0.05 | ) | | | $(0.04 | ) |
Net asset value, end of period | | | $1.00 | | | | $1.00 | | | | $1.00 | | | | $1.00 | | | | $1.00 | |
Total return (%) (k)(r)(s) | | | 0.00 | | | | 0.00 | (x) | | | 2.03 | | | | 4.84 | | | | 4.59 | |
Ratios (%) (to average net assets)
and Supplemental data: | | | | | | | | | | | | | | | | �� | | | | |
Expenses before expense reductions (f) | | | 0.59 | | | | 0.60 | | | | 0.59 | | | | 0.55 | | | | 0.59 | |
Expenses after expense reductions (f) | | | 0.27 | | | | 0.33 | | | | 0.57 | | | | N/A | | | | N/A | |
Net investment income | | | 0.00 | | | | 0.00 | | | | 2.02 | | | | 4.73 | | | | 4.52 | |
Net assets at end of period (000 omitted) | | | $172,365 | | | | $206,513 | | | | $322,980 | | | | $320,807 | | | | $283,055 | |
| | | | | | | | | | | | | | | | | | | | |
| Service Class | | Years ended 12/31 | |
| | | 2010 | | | 2009 | | | 2008 | | | 2007 | | | 2006 | |
Net asset value, beginning of period | | | $1.00 | | | | $1.00 | | | | $1.00 | | | | $1.00 | | | | $1.00 | |
| Income (loss) from investment operations | | | | | | | | | | | | | | | | | | | | |
Net investment income (d) | | | $0.00 | | | | $0.00 | | | | $0.02 | | | | $0.04 | | | | $0.04 | |
Net realized and unrealized gain (loss) on investments | | | 0.00 | (w) | | | 0.00 | | | | (0.00 | )(w) | | | (0.00 | )(w) | | | (0.00 | )(w) |
Total from investment operations | | | $0.00 | (w) | | | $0.00 | | | | $0.02 | | | | $0.04 | | | | $0.04 | |
| Less distributions declared to shareholders | | | | | | | | | | | | | | | | | | | | |
From net investment income | | | $— | | | | $(0.00 | )(w) | | | $(0.02 | ) | | | $(0.04 | ) | | | $(0.04 | ) |
Net asset value, end of period | | | $1.00 | | | | $1.00 | | | | $1.00 | | | | $1.00 | | | | $1.00 | |
Total return (%) (k)(r)(s) | | | 0.00 | | | | 0.00 | (x) | | | 1.80 | | | | 4.58 | | | | 4.33 | |
Ratios (%) (to average net assets)
and Supplemental data: | | | | | | | | | | | | | | | | | | | | |
Expenses before expense reductions (f) | | | 0.84 | | | | 0.85 | | | | 0.84 | | | | 0.80 | | | | 0.84 | |
Expenses after expense reductions (f) | | | 0.27 | | | | 0.33 | | | | 0.80 | | | | N/A | | | | N/A | |
Net investment income | | | 0.00 | | | | 0.00 | | | | 1.76 | | | | 4.48 | | | | 4.28 | |
Net assets at end of period (000 omitted) | | | $168,459 | | | | $192,109 | | | | $241,404 | | | | $233,523 | | | | $163,515 | |
| (d) | Per share data is based on average shares outstanding. |
| (f) | Ratios do not reflect reductions from fees paid indirectly, if applicable. |
| (k) | The total return does not reflect expenses that apply to separate accounts. Inclusion of these charges would reduce the total return figures for all periods shown. |
| (r) | Certain expenses have been reduced without which performance would have been lower. |
| (s) | From time to time the fund may receive proceeds from litigation settlements, without which performance would be lower. |
| (w) | Per share amount was less than $0.01. |
| (x) | Total return was less than 0.01%. |
See Notes to Financial Statements
10
MFS Money Market Portfolio
NOTES TO FINANCIAL STATEMENTS
| (1) | | Business and Organization |
MFS Money Market Portfolio (the fund) is a series of MFS Variable Insurance Trust II (the trust). The trust is organized as a Massachusetts business trust and is registered under the Investment Company Act of 1940, as amended, as an open-end management investment company. The shareholders of each series of the trust are separate accounts of insurance companies, which offer variable annuity and/or life insurance products, and qualified retirement and pension plans.
| (2) | | Significant Accounting Policies |
General – The preparation of financial statements in conformity with U.S. generally accepted accounting principles requires management to make estimates and assumptions that affect the reported amounts of assets and liabilities, and disclosure of contingent assets and liabilities at the date of the financial statements and the reported amounts of revenues and expenses during the reporting period. Actual results could differ from those estimates. In the preparation of these financial statements, management has evaluated subsequent events occurring after the date of the fund’s Statement of Assets and Liabilities through the date that the financial statements were issued.
Investment Valuations – Pursuant to procedures approved by the Board of Trustees, investments held by the fund are generally valued at amortized cost, which approximates market value. Amortized cost involves valuing an instrument at its cost as adjusted for amortization of premium or accretion of discount rather than its current market value. The amortized cost value of an instrument can be different from the market value of an instrument.
Various inputs are used in determining the value of the fund’s assets or liabilities. These inputs are categorized into three broad levels. In certain cases, the inputs used to measure fair value may fall into different levels of the fair value hierarchy. In such cases, an investment’s level within the fair value hierarchy is based on the lowest level of input that is significant to the fair value measurement. The fund’s assessment of the significance of a particular input to the fair value measurement in its entirety requires judgment, and considers factors specific to the investment. Level 1 includes unadjusted quoted prices in active markets for identical assets or liabilities. Level 2 includes other significant observable market-based inputs (including quoted prices for similar securities, interest rates, prepayment speed, and credit risk). Level 3 includes unobservable inputs, which may include the adviser’s own assumptions in determining the fair value of investments. The following is a summary of the levels used as of December 31, 2010 in valuing the fund’s assets or liabilities:
| | | | | | | | | | | | | | | | |
| Investments at Value | | Level 1 | | | Level 2 | | | Level 3 | | | Total | |
| Short term securities | | | $— | | | | $343,021,744 | | | | $— | | | | $343,021,744 | |
For further information regarding security characteristics, see the Portfolio of Investments.
Repurchase Agreements – The fund entered into repurchase agreements with approved counterparties. Each repurchase agreement is recorded at cost. The fund requires that the securities collateral in a repurchase transaction be transferred to a custodian. The fund monitors, on a daily basis, the value of the collateral to ensure that its value, including accrued interest, is greater than amounts owed to the fund under each such repurchase agreement. The fund and other funds managed by MFS may utilize a joint trading account for the purpose of entering into one or more repurchase agreements.
Indemnifications – Under the fund’s organizational documents, its officers and Trustees may be indemnified against certain liabilities and expenses arising out of the performance of their duties to the fund. Additionally, in the normal course of business, the fund enters into agreements with service providers that may contain indemnification clauses. The fund’s maximum exposure under these agreements is unknown as this would involve future claims that may be made against the fund that have not yet occurred.
Investment Transactions and Income – Investment transactions are recorded on the trade date. Interest income is recorded on the accrual basis. All premium and discount is amortized or accreted for financial statement purposes in accordance with U.S. generally accepted accounting principles.
The fund may receive proceeds from litigation settlements. Any proceeds received from litigation involving portfolio holdings are reflected in the Statement of Operations in realized gain/loss if the security has been disposed of by the fund or in unrealized gain/loss if the security is still held by the fund. Any other proceeds from litigation not related to portfolio holdings are reflected as other income in the Statement of Operations.
Fees Paid Indirectly – The fund’s custody fee may be reduced according to an arrangement that measures the value of cash deposited with the custodian by the fund. This amount, for the year ended December 31, 2010, is shown as a reduction of total expenses on the Statement of Operations.
Tax Matters and Distributions – The fund intends to qualify as a regulated investment company, as defined under Subchapter M of the Internal Revenue Code, and to distribute all of its taxable income, including realized capital gains. As a result, no
11
MFS Money Market Portfolio
Notes to Financial Statements – continued
provision for federal income tax is required. The fund’s federal tax returns for the prior three fiscal years remain subject to examination by the Internal Revenue Service. Foreign taxes, if any, have been accrued by the fund in the accompanying financial statements.
Distributions to shareholders are recorded on the ex-dividend date. Income and capital gain distributions are determined in accordance with income tax regulations, which may differ from U.S. generally accepted accounting principles. Certain capital accounts in the financial statements are periodically adjusted for permanent differences in order to reflect their tax character. These adjustments have no impact on net assets or net asset value per share. Temporary differences which arise from recognizing certain items of income, expense, gain or loss in different periods for financial statement and tax purposes will reverse at some time in the future. Distributions in excess of net investment income or net realized gains are temporary overdistributions for financial statement purposes resulting from differences in the recognition or classification of income or distributions for financial statement and tax purposes.
During the year ended December 31, 2010, there were no significant adjustments due to differences between book and tax accounting.
The tax character of distributions declared to shareholders for the last two fiscal years is as follows:
| | | | | | | | |
| | | 12/31/10 | | | 12/31/09 | |
| Ordinary income (including any short-term capital gains) | | | $— | | | | $1,328 | |
The federal tax cost and the tax basis components of distributable earnings were as follows:
| | | | |
| As of 12/31/10 | | | | |
| Cost of investments | | | $343,021,744 | |
| Capital loss carryforwards | | | (223,811 | ) |
As of December 31, 2010, the fund had capital loss carryforwards available to offset future realized gains. Such losses expire as follows:
| | | | |
| 12/31/15 | | | $(30,886 | ) |
| 12/31/16 | | | (192,925 | ) |
| Total | | | $(223,811 | ) |
Multiple Classes of Shares of Beneficial Interest – The fund offers multiple classes of shares, which differ in their respective distribution and/or service fees. The fund’s income and common expenses are allocated to shareholders based on the value of settled shares outstanding of each class. The fund’s realized and unrealized gain (loss) are allocated to shareholders based on the daily net assets of each class. Dividends are declared separately for each class. Differences in per share dividend rates are generally due to differences in separate class expenses. The fund’s distributions declared to shareholders as reported on the Statements of Changes in Net Assets are presented by class as follows:
| | | | | | | | |
| | | From net investment
income | |
| | | Year ended
12/31/10 | | | Year ended
12/31/09 | |
| Initial Class | | | $— | | | | $1,030 | |
| Service Class | | | — | | | | 298 | |
| Total | | | $— | | | | $1,328 | |
| (3) | | Transactions with Affiliates |
Investment Adviser – The fund has an investment advisory agreement with MFS to provide overall investment management and related administrative services and facilities to the fund. The management fee is computed daily and paid monthly at an annual rate of 0.50% of the fund’s average daily net assets. The investment adviser has agreed in writing to reduce its management fee to 0.45% of average daily net assets in excess of $500 million. This written agreement will continue until modified or rescinded by the fund’s shareholders. For the year ended December 31, 2010, the fund’s average daily net assets did not exceed $500 million and therefore, the management fee was not reduced. During the year ended December 31, 2010, MFS voluntarily waived receipt of $1,108,139 of the fund’s management fee in order to avoid a negative yield. For the year ended December 31, 2010, this voluntary waiver had the effect of reducing the management fee by 0.30% of average daily net assets on an annualized basis. The management fee incurred for the year ended December 31, 2010 was equivalent to an annual effective rate of 0.20% of the fund’s average daily net assets.
The investment adviser has agreed in writing to pay a portion of the fund’s total annual operating expenses, exclusive of interest, taxes, extraordinary expenses, and brokerage commissions, such that total annual fund operating expenses do not exceed 1.25% of the fund’s average daily net assets. MFS’ agreement to limit the fund’s total annual operating expenses is contained in the investment advisory agreement between MFS and the fund and may not be rescinded without shareholder approval.
12
MFS Money Market Portfolio
Notes to Financial Statements – continued
The investment adviser has also agreed in writing to pay a portion of the fund’s total annual operating expenses, exclusive of interest, taxes, extraordinary expenses, brokerage and transaction costs and investment-related expenses, such that total annual operating expenses do not exceed 0.57% of average daily net assets for the Initial Class shares and 0.82% of average daily net assets for the Service Class shares. This written agreement will continue until April 30, 2012. For the year ended December 31, 2010, this reduction amounted to $52,430 and is reflected as a reduction of total expenses in the Statement of Operations.
Distributor – MFS Fund Distributors, Inc. (MFD), a wholly-owned subsidiary of MFS, is the distributor of shares of the fund. The Trustees have adopted a distribution plan for the Service Class shares pursuant to Rule 12b-1 under the Investment Company Act of 1940.
The fund’s distribution plan provides that the fund will pay MFD distribution and/or service fees equal to 0.25% per annum of its average daily net assets attributable to Service Class shares as partial consideration for services performed and expenses incurred by MFD and financial intermediaries (including participating insurance companies that invest in the fund to fund variable annuity and variable life insurance contracts, sponsors of qualified retirement and pension plans that invest in the fund, and affiliates of these participating insurance companies and plan sponsors) in connection with the sale and distribution of the Service Class shares. MFD may subsequently pay all, or a portion, of the distribution and/or service fees to financial intermediaries. During the year ended December 31, 2010, MFD voluntarily waived receipt of $444,222 of the fund’s distribution and/or service fees in order to avoid a negative yield. For the year ended December 31, 2010, this voluntary waiver had the effect of reducing the distribution and/or service fees by 0.25% of average daily net assets attributable to Service Class shares on an annualized basis. The distribution and/or service fees incurred for the year ended December 31, 2010 were equivalent to an annual effective rate of 0.00% of the average daily net assets attributable to Service Class shares.
Shareholder Servicing Agent – MFS Service Center, Inc. (MFSC), a wholly-owned subsidiary of MFS, has contracted to provide transfer agent and recordkeeping functions in connection with the issuance, transfer, and redemption of each class of shares of the fund under a Shareholder Servicing Agent Agreement. During the year ended December 31, 2010, the fund did not pay MFSC a fee for this service.
Administrator – MFS provides certain financial, legal, shareholder communications, compliance, and other administrative services to the fund. Under an administrative services agreement, the fund partially reimburses MFS the costs incurred to provide these services. The fund is charged an annual fixed amount of $10,000 plus a fee based on average daily net assets. The administrative services fee incurred for the year ended December 31, 2010 was equivalent to an annual effective rate of 0.0353% of the fund’s average daily net assets.
Trustees’ and Officers’ Compensation – The fund pays compensation to Trustees in the form of a retainer, attendance fees, and additional compensation to the Board chairperson. The fund does not pay compensation directly to officers of the fund who are also officers of the investment adviser, all of whom receive remuneration for their services to the fund from MFS. Certain officers of the fund are officers or directors of MFS, MFD, and MFSC.
Other – This fund and certain other funds managed by MFS (the funds) have entered into services agreements (the Agreements) which provide for payment of fees by the funds to Tarantino LLC and Griffin Compliance LLC in return for the provision of services of an Independent Chief Compliance Officer (ICCO) and Assistant ICCO, respectively, for the funds. The ICCO and Assistant ICCO are officers of the funds and the sole members of Tarantino LLC and Griffin Compliance LLC, respectively. The funds can terminate the Agreements with Tarantino LLC and Griffin Compliance LLC at any time under the terms of the Agreements. MFS has agreed to bear all expenses associated with office space, other administrative support, and supplies provided to the ICCO and Assistant ICCO. For the year ended December 31, 2010, the aggregate fees paid by the fund to Tarantino LLC and Griffin Compliance LLC were $6,265 and are included in miscellaneous expense on the Statement of Operations.
Purchases and sales of money market securities, exclusive of securities subject to repurchase agreements, aggregated $4,094,870,100 and $4,102,835,656, respectively.
13
MFS Money Market Portfolio
Notes to Financial Statements – continued
| (5) | | Shares of Beneficial Interest |
The fund’s Declaration of Trust permits the Trustees to issue an unlimited number of full and fractional shares of beneficial interest. Transactions in fund shares were as follows:
| | | | | | | | | | | | | | | | |
| | | Year ended 12/31/10 | | | Year ended 12/31/09 | |
| | | Shares | | | Amount | | | Shares | | | Amount | |
| Shares sold | | | | | | | | | | | | | | | | |
Initial Class | | | 38,129,471 | | | | $38,129,471 | | | | 43,373,549 | | | | $43,373,550 | |
Service Class | | | 52,206,382 | | | | 52,206,383 | | | | 66,446,136 | | | | 66,446,135 | |
| | | 90,335,853 | | | | $90,335,854 | | | | 109,819,685 | | | | $109,819,685 | |
| Shares issued to shareholders in reinvestment of distributions | | | | | | | | | | | | | | | | |
Initial Class | | | — | | | | $— | | | | 1,028 | | | | $1,028 | |
Service Class | | | — | | | | — | | | | 298 | | | | 298 | |
| | | — | | | | $— | | | | 1,326 | | | | $1,326 | |
| Shares reacquired | | | | | | | | | | | | | | | | |
Initial Class | | | (72,278,062 | ) | | | $(72,278,062 | ) | | | (159,840,114 | ) | | | $(159,840,114 | ) |
Service Class | | | (75,856,689 | ) | | | (75,856,689 | ) | | | (115,741,435 | ) | | | (115,741,435 | ) |
| | | (148,134,751 | ) | | | $(148,134,751 | ) | | | (275,581,549 | ) | | | $(275,581,549 | ) |
| Net change | | | | | | | | | | | | | | | | |
Initial Class | | | (34,148,591 | ) | | | $(34,148,591 | ) | | | (116,465,537 | ) | | | $(116,465,536 | ) |
Service Class | | | (23,650,307 | ) | | | (23,650,306 | ) | | | (49,295,001 | ) | | | (49,295,002 | ) |
| | | (57,798,898 | ) | | | $(57,798,897 | ) | | | (165,760,538 | ) | | | $(165,760,538 | ) |
The fund and certain other funds managed by MFS participate in a $1.1 billion unsecured committed line of credit, subject to a $1 billion sublimit, provided by a syndication of banks under a credit agreement. Borrowings may be made for temporary financing needs. Interest is charged to each fund, based on its borrowings, generally at a rate equal to the higher of the Federal Reserve funds rate or one month LIBOR plus an agreed upon spread. A commitment fee, based on the average daily, unused portion of the committed line of credit, is allocated among the participating funds at the end of each calendar quarter. In addition, the fund and other funds managed by MFS have established unsecured uncommitted borrowing arrangements with certain banks for temporary financing needs. Interest is charged to each fund, based on its borrowings, at a rate equal to the Federal Reserve funds rate plus an agreed upon spread. For the year ended December 31, 2010, the fund’s commitment fee and interest expense were $4,117 and $0, respectively, and are included in miscellaneous expense on the Statement of Operations.
14
MFS Money Market Portfolio
REPORT OF INDEPENDENT REGISTERED PUBLIC ACCOUNTING FIRM
To the Board of Trustees of MFS Variable Insurance Trust II and the Shareholders of
MFS Money Market Portfolio:
We have audited the accompanying statement of assets and liabilities, including the portfolio of investments, of MFS Money Market Portfolio (the “Fund”) (one of the portfolios comprising MFS Variable Insurance Trust II) as of December 31, 2010, and the related statement of operations for the year then ended, the statements of changes in net assets for each of the two years in the period then ended, and the financial highlights for each of the five years in the period then ended. These financial statements and financial highlights are the responsibility of the Fund’s management. Our responsibility is to express an opinion on these financial statements and financial highlights based on our audits.
We conducted our audits in accordance with the standards of the Public Company Accounting Oversight Board (United States). Those standards require that we plan and perform the audit to obtain reasonable assurance about whether the financial statements and financial highlights are free of material misstatement. The Fund is not required to have, nor were we engaged to perform, an audit of its internal control over financial reporting. Our audits included consideration of internal control over financial reporting as a basis for designing audit procedures that are appropriate in the circumstances, but not for the purpose of expressing an opinion on the effectiveness of the Fund’s internal control over financial reporting. Accordingly, we express no such opinion. An audit also includes examining, on a test basis, evidence supporting the amounts and disclosures in the financial statements, assessing the accounting principles used and significant estimates made by management, as well as evaluating the overall financial statement presentation. Our procedures included confirmation of securities owned as of December 31, 2010, by correspondence with the custodian and brokers; where replies were not received from brokers, we performed other auditing procedures. We believe that our audits provide a reasonable basis for our opinion.
In our opinion, the financial statements and financial highlights referred to above present fairly, in all material respects, the financial position of MFS Money Market Portfolio as of December 31, 2010, the results of its operations for the year then ended, the changes in its net assets for each of the two years in the period then ended, and the financial highlights for each of the five years in the period then ended, in conformity with accounting principles generally accepted in the United States of America.
DELOITTE & TOUCHE LLP
Boston, Massachusetts
February 14, 2011
15
MFS Money Market Portfolio
TRUSTEES AND OFFICERS – IDENTIFICATION AND BACKGROUND
The Trustees and officers of the Trust, as of February 1, 2011, are listed below, together with their principal occupations during the past five years. (Their titles may have varied during that period.) The address of each Trustee and officer is 500 Boylston Street, Boston, Massachusetts 02116.
| | | | | | |
Name, Date of Birth | | Position(s) Held
with Fund | | Trustee/Officer
Since (1) | | Principal Occupations During the Past Five Years and
Other Directorships (2) |
| INTERESTED TRUSTEE | | | | |
David D. Horn (3) (born 6/07/41) | | Trustee | | April 1986 | | Private investor; Sun Life Assurance Company of Canada, Senior Vice President and General Manager for the United States (until 1997); Director (until March 2004) |
| | |
| INDEPENDENT TRUSTEES | | | | |
J. Kermit Birchfield (born 1/08/40) | | Chairman | | May 1997 | | Consultant; Century Partners, Inc. (investments), Director; Displaytech, Inc. (technology), Chairman; Dessin Fournir LLC (furniture manufacturer), Director; Site Watch LLC (software to monitor oil tanks), Managing Director (2006 to present); Juridica Investments (fund investing in judicial matters), Director (2007 to present), Immuno Science, Inc. (medical research), Independent Director (2009 to present), Intermountain Industries, Inc. (oil & gas exploration and production), Director (until February 2009) |
| | | |
Robert C. Bishop (born 1/13/43) | | Trustee | | May 2001 | | AutoImmune, Inc. (pharmaceutical product development), Chairman, President and Chief Executive Officer; Caliper Life Sciences Corp. (laboratory analytical instruments), Chairman; Optobionics Corporation (ophthalmic devices), Director (until 2007); Millipore Corporation (purification/filtration products), Director (until July 2010); Waterstreet Capital (leverage buyouts), Advisory Board (until August 2010) |
| | | |
Frederick H. Dulles (born 3/12/42) | | Trustee | | May 2001 | | Dulles International Law LLC (law firm), Senior Lawyer (since 2009); Juridica Capital Management (US) Inc. (litigation financing), Vice President and General Counsel (since 2009); Dulles Properties LLC (real estate), Broker (since 2008); The Citadel School of Business Administration (education), Adjunct Professor (since 2003); Disher, Hamrick & Myers Residential, Inc. (real estate), Broker (until 2006); Frederick H. Dulles Law Practice (law firm), (until 2006); Charlestown School of Law (education), Adjunct Professor (until 2007); Prudential Carolina Real Estate, (real estate), Broker (until 2008); Free Enterprise Foundation Inc. (research institute), Director & Secretary (until 2008); Ten State International Law PLLP (law firm), Of Counsel (until 2009) |
| | | |
Marcia A. Kean (born 6/30/48) | | Trustee | | April 2005 | | Feinstein Kean Healthcare (consulting), Chief Executive Officer |
| | | |
Ronald G. Steinhart (born 6/15/40) | | Trustee | | May 2001 | | Private investor; Penske Automotive Group (automotive retailer), Director; Animal Health International, Inc. (animal health products), Director (since 2007); Texas Industries (concrete/aggregates/cement), Director (since 2007); Susser Holdings Corporation (retail convenience stores and distributor of wholesale motor fuel), Director (since 2009); Prentiss Properties Trust (real estate investment trust), Director (until 2006); Penson Worldwide, Inc. (securities clearance), Director (until 2008) |
| | | |
Haviland Wright (born 7/21/48) | | Trustee | | May 2001 | | X-Change Corp. (multi-media web services), Director (since 2010); Nano Loa Inc. (liquid crystal displays), Director (until 2009); Profitability of Hawaii (software), Chief Development Officer (until 2010); Elixir Technologies Corporation (software), Director (until 2010) |
| | | |
| OFFICERS | | | | | | |
Maria F. DiOrioDwyer (4)
(born 12/01/58) | | President | | November 2005 | | Massachusetts Financial Services Company, Executive Vice President and Chief Regulatory Officer; Chief Compliance Officer (since December 2006) |
| | | |
| Christopher R. Bohane (4) (born 1/18/74) | | Assistant Secretary and Assistant Clerk | | July 2005 | | Massachusetts Financial Services Company, Vice President and Senior Counsel |
| | | |
John M. Corcoran (4) (born 4/13/65) | | Treasurer | | October 2008 | | Massachusetts Financial Services Company, Senior Vice President (since October 2008); State Street Bank and Trust (financial services provider), Senior Vice President, (until September 2008) |
| | | |
Ethan D. Corey (4) (born 11/21/63) | | Assistant Secretary and Assistant Clerk | | July 2005 | | Massachusetts Financial Services Company, Senior Vice President and Associate General Counsel |
| | | |
David L. DiLorenzo (4) (born 8/10/68) | | Assistant Treasurer | | July 2005 | | Massachusetts Financial Services Company, Vice President |
| | | |
Timothy M. Fagan (4) (born 7/10/68) | | Assistant Secretary and Assistant Clerk | | September 2005 | | Massachusetts Financial Services Company, Vice President and Senior Counsel |
| | | |
Mark D. Fischer (4) (born 10/27/70) | | Assistant Treasurer | | July 2005 | | Massachusetts Financial Services Company, Vice President |
16
MFS Money Market Portfolio
Trustees and Officers – continued
| | | | | | |
Name, Date of Birth | | Position(s) Held
with Fund | | Trustee/Officer
Since (1) | | Principal Occupations During the Past Five Years and
Other Directorships (2) |
Robyn L. Griffin (born 7/04/75) | | Assistant Independent Chief Compliance Officer | | August 2008 | | Griffin Compliance LLC (provider of compliance services), Principal (since August 2008); State Street Corporation (financial services provider), Mutual Fund Administration Assistant Vice President (October 2006 – July 2008); Liberty Mutual Group (insurance), Personal Market Assistant Controller (April 2006 – October 2006); Deloitte & Touche LLP (professional services firm), Senior Manager (prior to April 2006) |
| | | |
Brian E. Langenfeld (4) (born 3/07/73) | | Assistant Secretary and Assistant Clerk | | May 2006 | | Massachusetts Financial Services Company, Vice President and Senior Counsel (since May 2006); John Hancock Advisers, LLC, Assistant Vice President and Counsel (until April 2006) |
| | | |
Ellen Moynihan (4) (born 11/13/57) | | Assistant Treasurer | | May 1997 | | Massachusetts Financial Services Company, Senior Vice President |
| | | |
Susan S. Newton (4) (born 3/07/50) | | Assistant Secretary and Assistant Clerk | | May 2005 | | Massachusetts Financial Services Company, Senior Vice President and Associate General Counsel |
| | | |
Susan A. Pereira (4)
(born 11/05/70) | | Assistant Secretary and Assistant Clerk | | July 2005 | | Massachusetts Financial Services Company, Vice President and Senior Counsel |
| | | |
Mark N. Polebaum (4) (born 5/01/52) | | Secretary and Clerk | | February 2006 | | Massachusetts Financial Services Company, Executive Vice President, General Counsel and Secretary (since January 2006); Wilmer Cutler Pickering Hale and Dorr LLP (law firm), Partner (until January 2006) |
| | | |
Frank L. Tarantino (born 3/07/44) | | Independent Chief Compliance Officer | | September 2004 | | Tarantino LLC (provider of compliance services), Principal |
| | | |
Richard S. Weitzel (4) (born 7/16/70) | | Assistant Secretary and Assistant Clerk | | October 2007 | | Massachusetts Financial Services Company, Vice President and Assistant General Counsel |
| | | |
James O. Yost (4) (born 6/12/60) | | Assistant Treasurer | | April 1992 | | Massachusetts Financial Services Company, Senior Vice President |
| (1) | Date first appointed to serve as Trustee/Officer of an MFS fund or a Compass variable account. Each Trustee has served continuously since appointment. For the period March 2008 until October 2008, Ms. DiOrioDwyer served as Treasurer of the Funds. |
| (2) | Directorships or trusteeships of companies required to report to the Securities and Exchange Commission (i.e., “public companies”). |
| (3) | “Interested person” of the Trust, within the meaning of the Investment Company Act of 1940 (referred to as the 1940 Act), which is the principal federal law governing investment companies like the Trust, as a result of position with Sun Life of Canada (U.S.). The address of Sun Life of Canada (U.S.) is One Sun Life Executive Park, Wellesley Hills, Massachusetts 02481. |
| (4) | “Interested person” of MFS within the meaning of the 1940 Act. The address of MFS is 500 Boylston Street, Boston, Massachusetts 02116. |
The Trust does not hold annual meetings for the purpose of electing Trustees, and Trustees are not elected for fixed terms. Each Trustee and officer holds office until his or her successor is chosen and qualified, or until his or her earlier death, resignation, retirement or removal.
All Trustees currently serve as Trustees of the Trust and have served in that capacity since originally elected or appointed. All of the Trustees are also Managers of the Compass Variable Accounts. The executive officers of the Trust hold similar offices for the Compass Variable Accounts and other funds in the MFS fund complex. As of January 1, 2011, each Trustee serves as a Trustee or Manager of 31 Accounts/Portfolios.
17
MFS Money Market Portfolio
Trustees and Officers – continued
The Statement of Additional Information contains further information about the Trustees and is available without charge upon request by calling 1-800-752-7215.
| | |
Investment Adviser
Massachusetts Financial Services Company 500 Boylston Street, Boston, MA 02116-3741 | | Custodian State Street Bank and Trust 1 Lincoln Street, Boston, MA 02111-2900 |
Distributor
MFS Fund Distributors, Inc. 500 Boylston Street, Boston, MA 02116-3741 | | Independent Registered Public Accounting Firm Deloitte & Touche LLP 200 Berkeley Street, Boston, MA 02116 |
Portfolio Manager Edward O’Dette | | |
18
MFS Money Market Portfolio
BOARD REVIEW OF INVESTMENT ADVISORY AGREEMENT
The Investment Company Act of 1940 requires that both the full Board of Trustees and a majority of the non-interested (“independent”) Trustees, voting separately, annually approve the continuation of the investment advisory agreement between MFS Variable Insurance Trust II (the “Trust”) and Massachusetts Financial Services Company (“MFS”) on behalf of the Fund. The Trustees consider matters bearing on the Fund and the advisory arrangement at their meetings throughout the year, including a review of performance data at each regular meeting. In addition, the independent Trustees met in person in May and again in July 2010 (“contract review meetings”) for the specific purpose of considering whether to approve the continuation of the investment advisory agreement for the Fund. The independent Trustees were assisted in their evaluation of the investment advisory agreement by independent legal counsel, from whom they received separate legal advice and with whom they met separately from MFS management during various contract review meetings. The independent Trustees were also assisted in this process by the Fund’s Independent Chief Compliance Officer, a full-time senior officer appointed by and reporting to the independent Trustees.
In connection with their deliberations, the Trustees, including the independent Trustees, considered such information and factors as they believed, in light of the legal advice furnished to them and their own business judgment, to be relevant. The investment advisory agreement was considered separately for the Fund, although the Trustees also took into account the common interests of all Funds in the Trust in their review. As described below, the Trustees considered the nature, quality, and extent of the various investment advisory, administrative, and shareholder services performed by MFS under the existing investment advisory agreement and other arrangements with the Trust.
In connection with their contract review meetings, the Trustees received and relied upon materials which included, among other items: (i) information provided by Lipper Inc. (“Lipper”) on the investment performance of the Fund for various time periods ended December 31, 2009, compared to the investment performance of a group of funds with substantially similar investment classifications/objectives (the “Lipper performance universe”), (ii) information provided by Lipper on the Fund’s advisory fees and other expenses compared to the advisory fees and other expenses of comparable funds identified by Lipper (the “Lipper expense group”), (iii) information provided by MFS on the advisory fees of comparable portfolios of its other clients, including institutional separate account and other clients, (iv) information as to whether, and to what extent applicable, expense waivers, reimbursements or fee “breakpoints” are observed for the Fund, (v) information regarding MFS’ financial results and financial condition, including MFS’ and certain of its affiliates’ estimated profitability from services performed for the Fund, (vi) MFS’ views regarding the outlook for the mutual fund industry and its strategic business plans, (vii) descriptions of various functions performed by MFS for the Trust, such as compliance monitoring and portfolio trading practices, and (viii) information regarding the overall organization of MFS, including information about MFS’ senior management and other personnel providing investment advisory, administrative and other services to the Fund. The comparative performance, fee and expense information prepared and provided by Lipper was not independently verified, and the independent Trustees did not independently verify any information provided to them by MFS.
The Trustees’ conclusion as to the continuation of the investment advisory agreement was based on comprehensive consideration of all information provided to the Trustees and was not the result of any single factor. Some of the factors that figured particularly in the Trustees’ deliberations are described below for the Fund, while individual Trustees may have given different weight to various factors and evaluated the information presented as a whole differently than another individual Trustee. The Trustees recognized that the fee arrangements for the Fund reflect years of review and discussion between the independent Trustees and MFS, that certain aspects of such arrangements may receive greater scrutiny in some years than others, and that the Trustees’ conclusions may be based, in part, on their consideration of these same arrangements during the course of the year and in prior years.
Based on information provided by Lipper, the Trustees compared the Fund’s total return investment performance to the performance of the Lipper performance universe over various time periods. The Trustees placed particular emphasis on the total return performance of the Fund’s Initial Class shares in comparison to the performance of funds in its Lipper performance universe over the one-, three- and five-year periods ended December 31, 2009. The Trustees did not rely on performance results for more recent periods, including those shown elsewhere in this report.
The Trustees noted the performance of the Fund’s Initial Class shares was in the 5th quintile relative to the other funds in the Lipper performance universe for the one-year period (the 1st quintile being the best performers and the 5th quintile being the worst performers). The total return performance of the Fund was in the 4th quintile for the three-year and the five-year periods ended December 31, 2009, relative to the Lipper performance universe. Based on the nature and quality of services provided by MFS, the Board of Trustees concluded that the Fund’s performance was adequate.
19
MFS Money Market Portfolio
Board Review of Investment Advisory Agreement – continued
In the course of their deliberations, the Trustees took into account information provided by MFS during contract review meetings, as well as during investment review meetings conducted with portfolio management personnel during the course of the year.
In assessing the reasonableness of the Fund’s advisory fee, the Trustees considered, among other information, the Fund’s advisory fee and the total expense ratio of the Fund’s Initial Class shares as a percentage of average daily net assets, compared to the advisory fee and total expense ratios of its peer group of funds based on information provided by Lipper. The Trustees also considered the advisory fees charged by MFS to institutional accounts. In comparing these fees, the Trustees considered the generally broader scope of services provided by MFS to the Trust than those provided to institutional accounts. The Trustees also considered the higher demands placed on MFS’ investment personnel and trading infrastructure as a result of the daily cash in-flows and out-flows of the Fund, and the impact on MFS and related expenses due to the more extensive regulatory regime to which the Fund is subject, compared to institutional accounts.
In considering the fees, the Trustees noted from the Lipper data that the Fund’s effective advisory fee rate and total expense ratio were each below the median of such fees and expenses of funds in the Lipper expense group. The Trustees further noted that MFS agreed to reduce its advisory fee on average daily net assets over $500 million on a permanent basis, requiring shareholder approval for any modification or termination, and they accepted MFS’ offer to continue the expense limitation for the Fund. The Trustees further concluded that the existing breakpoint was sufficient to allow the Fund to benefit from economies of scale as its assets grow. The Trustees concluded that the fees were reasonable in light of the nature and quality of services provided.
The Trustees also considered information prepared by MFS relating to its costs and profits with respect to the Fund and other investment companies and accounts advised by MFS, as well as MFS’ methodologies used to determine and allocate its costs to the Fund and other accounts and products for purposes of estimating profitability.
After reviewing these and other factors described below, the Trustees concluded that the advisory fees charged to the Fund represent reasonable compensation in light of the nature and quality of the services being provided by MFS.
In addition, the Trustees considered MFS’ resources and related efforts to continue to retain, attract and motivate capable personnel to serve the Fund. The Trustees also considered the financial resources of MFS and its parent, Sun Life Financial Inc. The Trustees further considered any advantages and possible disadvantages of having an adviser which also serves other investment companies as well as institutional accounts.
The Trustees also considered the nature, quality, cost, and extent of administrative, transfer agency, and distribution services provided to the Fund by MFS and its affiliates under agreements and plans other than the investment advisory agreement, including the 12b-1 fees the Fund pays to MFS Fund Distributors, Inc., an affiliate of MFS. The Trustees also considered the nature, extent and quality of certain other services MFS performs or arranges on the Fund’s behalf, which may include securities lending programs, directed expense payment programs, class action recovery programs, and MFS’ interaction with third-party service providers, principally custodians and sub-custodians. The Trustees concluded that the various non-advisory services provided by MFS and its affiliates on behalf of the Fund were satisfactory. The Trustees also considered the benefits to MFS from the use of the Fund’s portfolio brokerage commissions to pay for investment research and various other factors. Additionally, the Trustees considered so-called “fall-out benefits” to MFS such as reputational value derived from serving as investment manager to the Trust, and determined that any such benefits derived by MFS were reasonable and fair.
Based on their evaluation of factors that they deemed to be material, including those factors described above, the Board of Trustees, including a majority of the independent Trustees, concluded that the investment advisory agreement should be continued for an additional one-year period, commencing September 1, 2010.
A discussion regarding the Board’s most recent review and renewal of the fund’s Investment Advisory Agreement with MFS is available by clicking on the fund’s name under “Variable Insurance Portfolios — VIT II” in the “Products and Performance” section of the MFS Web site (mfs.com).
20
MFS Money Market Portfolio
PROXY VOTING POLICIES AND INFORMATION
A general description of the MFS funds’ proxy voting policies and procedures is available without charge, upon request, by calling
1-800-225-2606, by visiting the Proxy Voting section of mfs.com or by visiting the SEC’s Web site at http://www.sec.gov.
Information regarding how the fund voted proxies relating to portfolio securities during the most recent twelve-month period ended June 30 is available without charge by visiting the Proxy Voting section of mfs.com or by visiting the SEC’s Web site at http://www.sec.gov.
QUARTERLY PORTFOLIO DISCLOSURE
The fund will file a complete schedule of portfolio holdings with the Securities and Exchange Commission (the Commission) for the first and third quarters of each fiscal year on Form N-Q. The fund’s Form N-Q may be reviewed and copied at the:
Public Reference Room
Securities and Exchange Commission
100 F Street, NE, Room 1580
Washington, D.C. 20549
Information on the operation of the Public Reference Room may be obtained by calling the Commission at 1-800-SEC-0330. The fund’s Form N-Q is available on the EDGAR database on the Commission’s Internet Web site at http://www.sec.gov, and copies of this information may be obtained, upon payment of a duplicating fee, by electronic request at the following e-mail address: publicinfo@sec.gov or by writing the Public Reference Section at the above address.
FURTHER INFORMATION
From time to time, MFS may post important information about the fund or the MFS funds on the MFS web site (mfs.com). This information is available by visiting the “News & Commentary” section of mfs.com or by clicking on the fund’s name under “Variable Insurance Portfolios — VIT II” in the “Products and Performance” section of mfs.com.
21
MFS Money Market Portfolio
MFS® PRIVACY NOTICE
Privacy is a concern for every investor today. At MFS Investment Management® and the MFS funds, we take this concern very seriously. We want you to understand our policies about the investment products and services that we offer, and how we protect the nonpublic personal information of investors who have a direct relationship with us and our wholly owned subsidiaries.
Throughout our business relationship, you provide us with personal information. We maintain information and records about you, your investments, and the services you use. Examples of the nonpublic personal information we maintain include
| | Ÿ | | data from investment applications and other forms |
| | Ÿ | | share balances and transactional history with us, our affiliates, or others |
| | Ÿ | | facts from a consumer reporting agency |
We do not disclose any nonpublic personal information about our customers or former customers to anyone, except as permitted by law. We may share nonpublic personal information with third parties or certain of our affiliates in connection with servicing your account or processing your transactions. We may share information with companies or financial institutions that perform marketing services on our behalf or with other financial institutions with which we have joint marketing arrangements, subject to any legal requirements.
Authorization to access your nonpublic personal information is limited to appropriate personnel who provide products, services, or information to you. We maintain physical, electronic, and procedural safeguards to help protect the personal information we collect about you.
If you have any questions about the MFS privacy policy, please call 1-800-225-2606 any business day.
Note: If you own MFS products or receive MFS services in the name of a third party such as a bank or broker-dealer, their privacy policy may apply to you instead of ours.
22


MFS® MASSACHUSETTS INVESTORS GROWTH STOCK PORTFOLIO
The report is prepared for the general information of contract owners. It is authorized for distribution to prospective investors only when preceded or accompanied by a current prospectus.
NOT FDIC INSURED Ÿ MAY LOSE VALUE Ÿ NO BANK GUARANTEE Ÿ NOT A DEPOSIT Ÿ NOT INSURED BY ANY FEDERAL GOVERNMENT AGENCY OR NCUA/NCUSIF
MFS Massachusetts Investors Growth Stock Portfolio
LETTER FROM THE CEO

Dear Contract Owners:
After an extended rebound in the financial markets, uncertainty returned in 2010 as investors began to question the durability of the recovery for global economies and markets. That uncertainty led to increased risk aversion, especially as investors saw the eurozone struggle with the debt woes of many of its members. In September, the U.S. Federal Reserve Board’s promises to further loosen monetary policy helped assuage market fears and drive asset prices off their recent lows. A combination of solid earnings and improving economic data gave an additional boost to investor sentiment. As we enter 2011, we are cautiously optimistic that economic growth will continue to improve and that the global economies will recover from the shocks of the past few years. We expect the pace of recovery worldwide will be uneven and volatile.
As always, we continue to be mindful of the many economic challenges faced at the local, national, and international levels. It is in times such as these that we want to remind investors of the merits of maintaining a long-term view, adhering to basic investing principles such as asset allocation and diversification, and working closely with their advisors to research and identify appropriate investment opportunities.
Respectfully,

Robert J. Manning
Chairman and Chief Executive Officer
MFS Investment Management®
February 14, 2011
The opinions expressed in this letter are subject to change, may not be relied upon for investment advice, and no forecasts can be guaranteed.
1
MFS Massachusetts Investors Growth Stock Portfolio
PORTFOLIO COMPOSITION
Portfolio structure
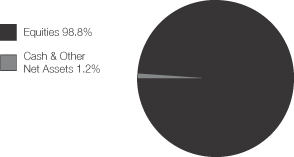
| | | | |
| Top ten holdings | | | | |
| Oracle Corp. | | | 4.3% | |
| Danaher Corp. | | | 4.1% | |
| Cisco Systems, Inc. | | | 3.7% | |
| Accenture Ltd., “A” | | | 3.4% | |
| Apple, Inc. | | | 3.3% | |
| International Business Machines Corp. | | | 3.1% | |
| Schlumberger Ltd. | | | 2.8% | |
| United Technologies Corp. | | | 2.7% | |
| Colgate-Palmolive Co. | | | 2.6% | |
| Visa, Inc., “A” | | | 2.6% | |
| | | | |
| Equity sectors | | | | |
| Technology | | | 25.5% | |
| Health Care | | | 13.9% | |
| Consumer Staples | | | 12.0% | |
| Financial Services | | | 10.3% | |
| Special Products & Services | | | 10.0% | |
| Industrial Goods & Services | | | 7.6% | |
| Energy | | | 7.4% | |
| Retailing | | | 7.1% | |
| Basic Materials | | | 3.3% | |
| Leisure | | | 1.7% | |
Percentages are based on net assets as of 12/31/10.
The portfolio is actively managed and current holdings may be different.
2
MFS Massachusetts Investors Growth Stock Portfolio
MANAGEMENT REVIEW
Summary of Results
For the twelve months ended December 31, 2010, Initial Class shares of the MFS Massachusetts Investors Growth Stock Portfolio (the “fund”) provided a total return of 13.15%, while Service Class shares of the fund provided a total return of 12.83%. These compare with a return of 16.71% for the fund’s benchmark, the Russell 1000 Growth Index.
Market Environment
The first quarter of the reporting period witnessed a continuation of the financial market and macroeconomic rebounds that had begun in early 2009. These recoveries in global activity and asset valuations were generally synchronized around the world, led importantly by emerging Asian economies, but broadening to include most of the global economy to varying degrees. Primary drivers of the recoveries included an unwinding of the inventory destocking that took place earlier, the production of manufacturing and capital goods, as well as massive fiscal and monetary stimulus.
During most of the remainder of the period, heightened risk surrounding the public-debt profiles of several of the peripheral European countries impaired market sentiment. At the same time, the improving trend in global macroeconomic data began to weaken somewhat. These two dynamics caused many asset prices to retrench significantly, as many questioned the durability of the global recovery.
Towards the end of the period, the U.S. Federal Reserve led markets to believe that further monetary loosening would be forthcoming if macroeconomic activity did not show signs of improvement. The prospects for more easing by the Fed improved market sentiment and drove risk-asset prices markedly higher. However, in a text-book case of “buy the rumor, sell the fact,” the weeks following the early November announcement of further quantitative easing saw a sell-off in U.S. Treasury bonds. This rise in Treasury yields occurred despite risk-off behavior in equities and credit markets (which would normally result in Treasury yield compression), and appears to have been the result of a few factors: signs of improved U.S. and global economic activity; opposition to quantitative easing from some quarters; and crowded long positions in U.S. Treasuries. The December agreement on an expansionary U.S. fiscal package also boosted sentiment, leading markets to reach near-term highs in risky asset valuations toward year end.
Detractors from Performance
A combination of security selection and an overweight position in the financial services sector detracted from the fund’s performance relative to the Russell 1000 Growth Index. Credit card companies, Visa and Mastercard, were among the fund’s top detractors over the reporting period. Shares of both declined sharply after the Federal Reserve released a debit interchange proposal that would substantially reduce debit card transaction fees. The Fed’s proposals on debit network exclusivity also created uncertainty surrounding the companies’ future market share and revenues. The fund’s ownership in shares of brokerage firm Charles Schwab and diversified financial services firm Bank of New York Mellon also weighed on relative returns.
Individual securities in other sectors that detracted from relative results included network equipment company Cisco Systems and business information provider Dun & Bradstreet. Elsewhere, our ownership in shares of medical equipment company DENTSPLY International, Inc., household products maker Colgate-Palmolive, and medical device maker Medtronic weighed on relative returns. Shares of Medtronic came under pressure due to weaker-than-expected sales, lower margins in its Cardiac Rhythm Management (CRM) business, and a reduction in management’s revenue guidance. Additionally, our underweight position in computer and personal electronics maker Apple hurt relative performance as this benchmark holding performed well in 2010.
Contributors to Performance
Security selection in the energy sector contributed to relative returns during the reporting period. The fund’s ownership in shares of oil and gas drilling equipment manufacturer National-Oilwell Varco (b) and oil field services company Schlumberger supported relative returns. Shares of Schlumberger appreciated after the company reported better-than-expected earnings results. Increased international demand and continued strength in crude oil prices contributed to the stock’s price increase.
Individual securities in other sectors that aided relative results included enterprise software products maker Oracle, athletic shoes and apparel manufacturer NIKE, and luxury goods company LVMH Moët Hennessy Louis Vuitton (b) (France). Not owning shares of poor-performing software giant Microsoft also contributed to relative returns.
Elsewhere, holdings of food company Mead Johnson Nutrition, brewer Companhia de Bebidas da Americas (b)(h) (Brazil), and agrichemical products company Monsanto were top relative contributors. Our ownership in shares of industrial manufacturer Danaher also aided relative results.
3
MFS Massachusetts Investors Growth Stock Portfolio
Management Review – continued
During the reporting period, the fund’s currency exposure was a contributor to relative performance. All of MFS’ investment decisions are driven by the fundamentals of each individual opportunity and as such, it is common for our portfolios to have different currency exposure than the benchmark.
The total return of the fund includes proceeds from a non-recurring litigation settlement received during the reporting period, which if excluded would have resulted in a lower total return.
Respectfully,
Jeffrey Constantino
Portfolio Manager
| (b) | Security is not a benchmark constituent. |
| (h) | Security was not held in the portfolio at period end. |
The views expressed in this report are those of the portfolio manager only through the end of the period of the report as stated on the cover and do not necessarily reflect the views of MFS or any other person in the MFS organization. These views are subject to change at any time based on market or other conditions, and MFS disclaims any responsibility to update such views. These views may not be relied upon as investment advice or an indication of trading intent on behalf of any MFS portfolio. References to specific securities are not recommendations of such securities, and may not be representative of any MFS portfolio’s current or future investments.
4
MFS Massachusetts Investors Growth Stock Portfolio
PERFORMANCE SUMMARY THROUGH 12/31/10
The following chart illustrates the historical performance of the fund in comparison to its benchmark(s). Benchmarks are unmanaged and may not be invested in directly. Benchmark returns do not reflect any fees or expenses. The performance of other share classes will be greater than or less than that of the class depicted below. (See Notes to Performance Summary.)
Performance data shown represents past performance and is no guarantee of future results. Investment return and principal value fluctuate so your units, when sold, may be worth more or less than the original cost; current performance may be lower or higher than quoted. The performance shown does not reflect the deduction of taxes, if any, that a contract holder would pay on fund distributions or the redemption of contract units. The returns for the fund shown also do not reflect the deduction of expenses associated with variable products, such as mortality and expense risk charges, separate account charges, and sales charges imposed by the insurance company separate accounts. Such expenses would reduce the overall returns shown.
Growth of a Hypothetical $10,000 Investment
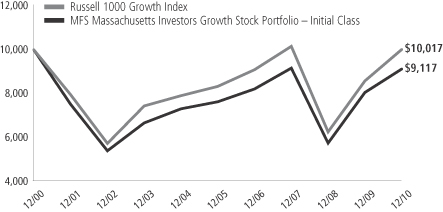
Total Returns through 12/31/10
Average annual total returns
| | | | | | | | | | | | | | |
| | | Share class | | Class inception date | | 1-yr | | 5-yr | | 10-yr | | Life (t) | | |
| | | Initial Class | | 5/06/98 | | 13.15% | | 3.64% | | (0.92)% | | N/A | | |
| | | Service Class | | 8/24/01 | | 12.83% | | 3.38% | | N/A | | 1.90% | | |
| | | | | |
| Comparative benchmark | | | | | | | | | | |
| | | Russell 1000 Growth Index (f) | | 16.71% | | 3.75% | | 0.02% | | N/A | | |
| (f) | Source: FactSet Research Systems Inc. |
| (t) | For the period from the class inception date through the stated period end (for those share classes with less than 10 years of performance history). No comparative benchmark performance information is provided for “life” periods. (See Notes to Performance Summary.) |
Included in the Initial Class and Service Class total returns for the year ended December 31, 2010 are proceeds received from a non-recurring litigation settlement against Tyco International Ltd. Had these proceeds not been included, the 1-year total returns would have each been lower by approximately 0.63%.
Benchmark Definition
Russell 1000 Growth Index – constructed to provide a comprehensive barometer for growth securities in the large-cap segment of the U.S. equity universe. Companies in this index generally have higher price-to-book ratios and higher forecasted growth values.
It is not possible to invest directly in an index.
Notes to Performance Summary
Average annual total return represents the average annual change in value for each share class for the periods presented. Life returns are presented where the share class has less than 10 years of performance history and represent the average annual total return from the class inception date to the stated period end date. As the fund’s share classes may have different inception dates, the life returns may represent different time periods and may not be comparable. As a result, no comparative benchmark performance information is provided for life periods.
5
MFS Massachusetts Investors Growth Stock Portfolio
Performance Summary – continued
Performance results reflect any applicable expense subsidies and waivers in effect during the periods shown. Without such subsidies and waivers the fund’s performance results would be less favorable. Please see the prospectus and financial statements for complete details. All results are historical and assume the reinvestment of any dividends and capital gains distributions.
From time to time the fund may receive proceeds from litigation settlements, without which performance would be lower.
6
MFS Massachusetts Investors Growth Stock Portfolio
EXPENSE TABLE
Fund Expenses Borne by the Contract Holders During the Period,
July 1, 2010 through December 31, 2010
As a contract holder of the fund, you incur ongoing costs, including management fees; distribution and/or service (12b-1) fees; and other fund expenses. This example is intended to help you understand your ongoing costs (in dollars) of investing in the fund and to compare these costs with the ongoing costs of investing in other mutual funds.
The example is based on an investment of $1,000 invested at the beginning of the period and held for the entire period July 1, 2010 through December 31, 2010.
Actual Expenses
The first line for each share class in the following table provides information about actual account values and actual expenses. You may use the information in this line, together with the amount you invested, to estimate the expenses that you paid over the period. Simply divide your account value by $1,000 (for example, an $8,600 account value divided by $1,000 = 8.6), then multiply the result by the number in the first line under the heading entitled “Expenses Paid During Period” to estimate the expenses you paid on your account during this period.
Hypothetical Example for Comparison Purposes
The second line for each share class in the following table provides information about hypothetical account values and hypothetical expenses based on the fund’s actual expense ratio and an assumed rate of return of 5% per year before expenses, which is not the fund’s actual return. The hypothetical account values and expenses may not be used to estimate the actual ending account balance or expenses you paid for the period. You may use this information to compare the ongoing costs of investing in the fund and other funds. To do so, compare this 5% hypothetical example with the 5% hypothetical examples that appear in the shareholder reports of the other funds.
Please note that the expenses shown in the table are meant to highlight the fund’s ongoing costs only and do not take into account the fees and expenses imposed under the variable contracts through which your investment in the fund is made. Therefore, the second line for each share class in the table is useful in comparing ongoing costs associated with an investment in vehicles (such as the fund) which fund benefits under variable annuity and variable life insurance contracts and to qualified pension and retirement plans only, and will not help you determine the relative total costs of investing in the fund through variable annuity and variable life insurance contracts. If the fees and expenses imposed under the variable contracts were included, your costs would have been higher.
| | | | | | | | | | | | | | | | | | |
| Share Class | | | | Annualized Expense Ratio | | | Beginning Account Value 7/01/10 | | | Ending Account Value 12/31/10 | | | Expenses Paid During Period (p) 7/01/10-12/31/10 | |
| Initial Class | | Actual | | | 0.82% | | | | $1,000.00 | | | | $1,238.35 | | | | $4.63 | |
| | Hypothetical (h) | | | 0.82% | | | | $1,000.00 | | | | $1,021.07 | | | | $4.18 | |
| Service Class | | Actual | | | 1.07% | | | | $1,000.00 | | | | $1,236.64 | | | | $6.03 | |
| | Hypothetical (h) | | | 1.07% | | | | $1,000.00 | | | | $1,019.81 | | | | $5.45 | |
| (h) | 5% class return per year before expenses. |
| (p) | Expenses paid is equal to each class’ annualized expense ratio, as shown above, multiplied by the average account value over the period, multiplied by the number of days in the period, divided by the number of days in the year. |
7
MFS Massachusetts Investors Growth Stock Portfolio
PORTFOLIO OF INVESTMENTS – 12/31/10
The Portfolio of Investments is a complete list of all securities owned by your fund. It is categorized by broad-based asset classes.
| | | | | | | | |
| Issuer | | Shares/Par | | | Value ($) | |
| | | | | | | | |
| COMMON STOCKS – 98.8% | | | | | | | | |
| Aerospace – 3.1% | | | | | | | | |
| Precision Castparts Corp. | | | 14,390 | | | $ | 2,003,230 | |
| United Technologies Corp. | | | 169,530 | | | | 13,345,402 | |
| | | | | | | | |
| | | | | | $ | 15,348,632 | |
| | | | | | | | |
| Alcoholic Beverages – 2.0% | | | | | | | | |
| Companhia de Bebidas das Americas, ADR | | | 119,100 | | | $ | 3,695,673 | |
| Diageo PLC | | | 344,202 | | | | 6,359,244 | |
| | | | | | | | |
| | | | | | $ | 10,054,917 | |
| | | | | | | | |
| Apparel Manufacturers – 2.6% | | | | | | | | |
| LVMH Moet Hennessy Louis Vuitton S.A. | | | 34,114 | | | $ | 5,611,703 | |
| NIKE, Inc., “B” | | | 86,170 | | | | 7,360,641 | |
| | | | | | | | |
| | | | | | $ | 12,972,344 | |
| | | | | | | | |
| Broadcasting – 0.4% | | | | | | | | |
| Omnicom Group, Inc. | | | 39,930 | | | $ | 1,828,794 | |
| | | | | | | | |
| Brokerage & Asset Managers – 4.5% | | | | | |
| Charles Schwab Corp. | | | 473,710 | | | $ | 8,105,178 | |
| CME Group, Inc. | | | 26,490 | | | | 8,523,158 | |
| Franklin Resources, Inc. | | | 52,510 | | | | 5,839,637 | |
| | | | | | | | |
| | | | | | $ | 22,467,973 | |
| | | | | | | | |
| Business Services – 10.0% | | | | | | | | |
| Accenture Ltd., “A” | | | 349,110 | | | $ | 16,928,344 | |
| Automatic Data Processing, Inc. | | | 30,600 | | | | 1,416,168 | |
| Dun & Bradstreet Corp. | | | 137,440 | | | | 11,282,450 | |
| MSCI, Inc., “A” (a) | | | 224,340 | | | | 8,740,286 | |
| Verisk Analytics, Inc., “A” (a) | | | 278,730 | | | | 9,499,118 | |
| Western Union Co. | | | 115,510 | | | | 2,145,021 | |
| | | | | | | | |
| | | | | | $ | 50,011,387 | |
| | | | | | | | |
| Cable TV – 1.3% | | | | | | | | |
| DIRECTV, “A” (a) | | | 159,300 | | | $ | 6,360,849 | |
| | | | | | | | |
| Chemicals – 1.2% | | | | | | | | |
| Monsanto Co. | | | 83,170 | | | $ | 5,791,959 | |
| | | | | | | | |
| Computer Software – 5.6% | | | | | | | | |
| Autodesk, Inc. (a) | | | 167,440 | | | $ | 6,396,208 | |
| Oracle Corp. (s) | | | 691,380 | | | | 21,640,194 | |
| | | | | | | | |
| | | | | | $ | 28,036,402 | |
| | | | | | | | |
| Computer Software – Systems – 9.1% | | | | | |
| Apple, Inc. (a) | | | 51,140 | | | $ | 16,495,718 | |
| EMC Corp. (a) | | | 243,730 | | | | 5,581,417 | |
| Hewlett-Packard Co. | | | 189,750 | | | | 7,988,475 | |
| International Business Machines Corp. | | | 105,840 | | | | 15,533,078 | |
| | | | | | | | |
| | | | | | $ | 45,598,688 | |
| | | | | | | | |
| Consumer Products – 5.8% | | | | | | | | |
| Church & Dwight Co., Inc. | | | 82,060 | | | $ | 5,663,781 | |
| Colgate-Palmolive Co. | | | 164,230 | | | | 13,199,165 | |
| Procter & Gamble Co. | | | 153,461 | | | | 9,872,146 | |
| | | | | | | | |
| | | | | | $ | 28,735,092 | |
| | | | | | | | |
| | | | | | | | |
| Issuer | | Shares/Par | | | Value ($) | |
| | | | | | | | |
| COMMON STOCKS – continued | | | | | | | | |
| Electrical Equipment – 4.5% | | | | | | | | |
| Danaher Corp. (s) | | | 431,940 | | | $ | 20,374,610 | |
| W.W. Grainger, Inc. | | | 16,990 | | | | 2,346,489 | |
| | | | | | | | |
| | | | | | $ | 22,721,099 | |
| | | | | | | | |
| Electronics – 4.7% | | | | | | | | |
| Microchip Technology, Inc. | | | 280,120 | | | $ | 9,582,905 | |
| Samsung Electronics Co. Ltd., GDR | | | 6,502 | | | | 2,743,194 | |
Taiwan Semiconductor Manufacturing
Co. Ltd., ADR | | | 904,443 | | | | 11,341,715 | |
| | | | | | | | |
| | | | | | $ | 23,667,814 | |
| | | | | | | | |
| Energy – Integrated – 2.5% | | | | | | | | |
| Chevron Corp. | | | 46,000 | | | $ | 4,197,500 | |
| Exxon Mobil Corp. | | | 71,610 | | | | 5,236,123 | |
| Hess Corp. | | | 38,560 | | | | 2,951,382 | |
| | | | | | | | |
| | | | | | $ | 12,385,005 | |
| | | | | | | | |
| Food & Beverages – 4.2% | | | | | | | | |
| Groupe Danone | | | 114,872 | | | $ | 7,217,732 | |
| Mead Johnson Nutrition Co., “A” | | | 42,230 | | | | 2,628,818 | |
| PepsiCo, Inc. | | | 167,890 | | | | 10,968,254 | |
| | | | | | | | |
| | | | | | $ | 20,814,804 | |
| | | | | | | | |
| Food & Drug Stores – 0.9% | | | | | | | | |
| CVS Caremark Corp. | | | 132,007 | | | $ | 4,589,883 | |
| | | | | | | | |
| General Merchandise – 2.8% | | | | | | | | |
| Kohl’s Corp. (a) | | | 133,130 | | | $ | 7,234,284 | |
| Target Corp. | | | 113,450 | | | | 6,821,749 | |
| | | | | | | | |
| | | | | | $ | 14,056,033 | |
| | | | | | | | |
| Internet – 2.4% | | | | | | | | |
| eBay, Inc. (a) | | | 99,760 | | | $ | 2,776,321 | |
| Google, Inc., “A” (a) | | | 15,920 | | | | 9,456,002 | |
| | | | | | | | |
| | | | | | $ | 12,232,323 | |
| | | | | | | | |
| Major Banks – 2.2% | | | | | | | | |
| Bank of New York Mellon Corp. | | | 80,155 | | | $ | 2,420,681 | |
| State Street Corp. | | | 185,710 | | | | 8,605,801 | |
| | | | | | | | |
| | | | | | $ | 11,026,482 | |
| | | | | | | | |
| Medical & Health Technology & Services – 1.4% | |
| Medco Health Solutions, Inc. (a) | | | 31,880 | | | $ | 1,953,288 | |
| Patterson Cos., Inc. | | | 120,850 | | | | 3,701,636 | |
| VCA Antech, Inc. (a) | | | 62,300 | | | | 1,450,967 | |
| | | | | | | | |
| | | | | | $ | 7,105,891 | |
| | | | | | | | |
| Medical Equipment – 9.4% | | | | | | | | |
| Becton, Dickinson & Co. | | | 76,550 | | | $ | 6,470,006 | |
| DENTSPLY International, Inc. | | | 300,410 | | | | 10,265,010 | |
| Medtronic, Inc. | | | 180,820 | | | | 6,706,614 | |
| St. Jude Medical, Inc. (a) | | | 59,000 | | | | 2,522,250 | |
| Synthes, Inc. | | | 34,378 | | | | 4,643,788 | |
| Thermo Fisher Scientific, Inc. (a) | | | 233,500 | | | | 12,926,560 | |
8
MFS Massachusetts Investors Growth Stock Portfolio
Portfolio of Investments – continued
| | | | | | | | |
| Issuer | | Shares/Par | | | Value ($) | |
| | | | | | | | |
| COMMON STOCKS – continued | | | | | |
| Medical Equipment – continued | | | | | | | | |
| Waters Corp. (a) | | | 46,870 | | | $ | 3,642,268 | |
| | | | | | | | |
| | | | | | $ | 47,176,496 | |
| | | | | | | | |
| Metals & Mining – 0.9% | | | | | | | | |
| BHP Billiton Ltd., ADR | | | 47,190 | | | $ | 4,384,895 | |
| | | | | | | | |
| Network & Telecom – 3.7% | | | | | | | | |
| Cisco Systems, Inc. (a)(s) | | | 908,287 | | | $ | 18,374,646 | |
| | | | | | | | |
| Oil Services – 4.9% | | | | | | | | |
| National Oilwell Varco, Inc. | | | 154,070 | | | $ | 10,361,208 | |
| Schlumberger Ltd. | | | 167,530 | | | | 13,988,755 | |
| | | | | | | | |
| | | | | | $ | 24,349,963 | |
| | | | | | | | |
| Other Banks & Diversified Financials – 3.6% | |
| MasterCard, Inc., “A” | | | 22,340 | | | $ | 5,006,617 | |
| Visa, Inc., “A” | | | 184,990 | | | | 13,019,596 | |
| | | | | | | | |
| | | | | | $ | 18,026,213 | |
| | | | | | | | |
| Pharmaceuticals – 3.1% | | | | | | | | |
| Abbott Laboratories | | | 86,380 | | | $ | 4,138,466 | |
| Allergan, Inc. | | | 43,420 | | | | 2,981,651 | |
| Johnson & Johnson | | | 137,630 | | | | 8,512,416 | |
| | | | | | | | |
| | | | | | $ | 15,632,533 | |
| | | | | | | | |
| Specialty Chemicals – 1.2% | | | | | | | | |
| Praxair, Inc. | | | 64,840 | | | $ | 6,190,275 | |
| | | | | | | | |
| Specialty Stores – 0.8% | | | | | | | | |
| Staples, Inc. | | | 172,900 | | | $ | 3,936,933 | |
| | | | | | | | |
Total Common Stocks
(Identified Cost, $435,370,463) | | | | | | $ | 493,878,325 | |
| | | | | | | | |
| | | | | | | | |
| Issuer | | Shares/Par | | | Value ($) | |
| | | | | | | | |
| MONEY MARKET FUNDS (v) – 1.2% | | | | | |
| MFS Institutional Money Market Portfolio, 0.18%, at Cost and Net Asset Value | | | 5,979,449 | | | $ | 5,979,449 | |
| | | | | | | | |
Total Investments
(Identified Cost, $441,349,912) | | | | | | $ | 499,857,774 | |
| | | | | | | | |
OTHER ASSETS, LESS
LIABILITIES – (0.0)% | | | | | | | (218,124 | ) |
| | | | | | | | |
| Net Assets – 100.0% | | | | | | $ | 499,639,650 | |
| | | | | | | | |
| (a) | Non-income producing security. |
| (s) | Security or a portion of the security was pledged to cover collateral requirements for securities sold short. At December 31, 2010, the value of securities pledged amounted to $171,421. At December 31, 2010, the fund had no short sales outstanding. |
| (v) | Underlying fund that is available only to investment companies managed by MFS. The rate quoted is the annualized seven-day yield of the fund at period end. |
The following abbreviations are used in this report and are defined:
| ADR | | American Depository Receipt |
| GDR | | Global Depository Receipt |
| PLC | | Public Limited Company |
See Notes to Financial Statements
9
MFS Massachusetts Investors Growth Stock Portfolio
FINANCIAL STATEMENTS | STATEMENT OF ASSETS AND LIABILITIES
This statement represents your fund’s balance sheet, which details the assets and liabilities comprising the total value of the fund.
| | | | | | | | |
| At 12/31/10 | | | | | | | | |
Assets | | | | | | | | |
Investments – | | | | | | | | |
Non-affiliated issuers, at value (identified cost, $435,370,463) | | | $493,878,325 | | | | | |
Underlying funds, at cost and value | | | 5,979,449 | | | | | |
Total investments, at value (identified cost, $441,349,912) | | | $499,857,774 | | | | | |
Receivables for | | | | | | | | |
Fund shares sold | | | 188,905 | | | | | |
Interest and dividends | | | 277,067 | | | | | |
Receivable from investment adviser | | | 42,577 | | | | | |
Other assets | | | 14,514 | | | | | |
Total assets | | | | | | | $500,380,837 | |
Liabilities | | | | | | | | |
Payable for fund shares reacquired | | | $629,404 | | | | | |
Payable to affiliates | | | | | | | | |
Investment adviser | | | 20,594 | | | | | |
Distribution and/or service fees | | | 957 | | | | | |
Administrative services fee | | | 964 | | | | | |
Payable for Trustees’ compensation | | | 623 | | | | | |
Accrued expenses and other liabilities | | | 88,645 | | | | | |
Total liabilities | | | | | | | $741,187 | |
Net assets | | | | | | | $499,639,650 | |
Net assets consist of | | | | | | | | |
Paid-in capital | | | $552,254,523 | | | | | |
Unrealized appreciation (depreciation) on investments and translation of assets and liabilities in foreign currencies | | | 58,518,470 | | | | | |
Accumulated net realized gain (loss) on investments and foreign currency transactions | | | (113,635,453 | ) | | | | |
Undistributed net investment income | | | 2,502,110 | | | | | |
Net assets | | | | | | | $499,639,650 | |
Shares of beneficial interest outstanding | | | | | | | 43,760,715 | |
| | | | | | | | | | | | |
| | | Net assets | | | Shares
outstanding | | | Net asset value
per share | |
Initial Class | | | $429,925,381 | | | | 37,613,815 | | | | $11.43 | |
Service Class | | | 69,714,269 | | | | 6,146,900 | | | | 11.34 | |
See Notes to Financial Statements
10
MFS Massachusetts Investors Growth Stock Portfolio
FINANCIAL STATEMENTS | STATEMENT OF OPERATIONS
This statement describes how much your fund earned in investment income and accrued in expenses. It also describes any gains and/or losses generated by fund operations.
| | | | | | | | |
| Year ended 12/31/10 | | | | | | | | |
| Net investment income | | | | | | | | |
Income | | | | | | | | |
Dividends | | | $6,819,810 | | | | | |
Interest | | | 18,347 | | | | | |
Dividends from underlying funds | | | 10,404 | | | | | |
Foreign taxes withheld | | | (146,723 | ) | | | | |
Total investment income | | | | | | | $6,701,838 | |
Expenses | | | | | | | | |
Management fee | | | $3,675,503 | | | | | |
Distribution and/or service fees | | | 181,148 | | | | | |
Administrative services fee | | | 171,973 | | | | | |
Trustees’ compensation | | | 69,813 | | | | | |
Custodian fee | | | 91,608 | | | | | |
Shareholder communications | | | 97,602 | | | | | |
Auditing fees | | | 44,217 | | | | | |
Legal fees | | | 7,502 | | | | | |
Miscellaneous | | | 43,326 | | | | | |
Total expenses | | | | | | | $4,382,692 | |
Fees paid indirectly | | | (31 | ) | | | | |
Reduction of expenses by investment adviser | | | (176,815 | ) | | | | |
Net expenses | | | | | | | $4,205,846 | |
Net investment income | | | | | | | $2,495,992 | |
Realized and unrealized gain (loss) on investments and foreign currency transactions | | | | | | | | |
Realized gain (loss) (identified cost basis) | | | | | | | | |
Investment transactions (s) | | | $43,641,163 | | | | | |
Foreign currency transactions | | | 7,779 | | | | | |
Net realized gain (loss) on investments and foreign currency transactions | | | | | | | $43,648,942 | |
Change in unrealized appreciation (depreciation) | | | | | | | | |
Investments | | | $12,940,699 | | | | | |
Translation of assets and liabilities in foreign currencies | | | 3,932 | | | | | |
Net unrealized gain (loss) on investments and foreign currency translation | | | | | | | $12,944,631 | |
Net realized and unrealized gain (loss) on investments and foreign currency | | | | | | | $56,593,573 | |
Change in net assets from operations | | | | | | | $59,089,565 | |
| (s) | Realized gain (loss) on investment transactions includes proceeds received from a non-recurring cash settlement in the amount of $2,471,274 from a litigation settlement against Tyco International Ltd. |
See Notes to Financial Statements
11
MFS Massachusetts Investors Growth Stock Portfolio
FINANCIAL STATEMENTS | STATEMENTS OF CHANGES IN NET ASSETS
These statements describe the increases and/or decreases in net assets resulting from operations, any distributions, and any shareholder transactions.
| | | | | | | | |
For years ended 12/31 | | | 2010 | | | | 2009 | |
Change in net assets | | | | | | | | |
From operations | | | | | | | | |
Net investment income | | | $2,495,992 | | | | $1,345,349 | |
Net realized gain (loss) on investments and foreign currency transactions | | | 43,648,942 | | | | (9,155,747 | ) |
Net unrealized gain (loss) on investments and foreign currency translation | | | 12,944,631 | | | | 86,000,243 | |
Change in net assets from operations | | | $59,089,565 | | | | $78,189,845 | |
Distributions declared to shareholders | | | | | | | | |
From net investment income | | | $(1,353,058 | ) | | | $(1,718,063 | ) |
Change in net assets from fund share transactions | | | $(86,698,840 | ) | | | $246,693,529 | |
Total change in net assets | | | $(28,962,333 | ) | | | $323,165,311 | |
Net assets | | | | | | | | |
At beginning of period | | | 528,601,983 | | | | 205,436,672 | |
At end of period (including undistributed net investment income of $2,502,110 and
$1,351,397, respectively) | | | $499,639,650 | | | | $528,601,983 | |
See Notes to Financial Statements
12
MFS Massachusetts Investors Growth Stock Portfolio
FINANCIAL STATEMENTS | FINANCIAL HIGHLIGHTS
The financial highlights table is intended to help you understand the fund’s financial performance for the past 5 years. Certain information reflects financial results for a single fund share. The total returns in the table represent the rate by which an investor would have earned (or lost) on an investment in the fund share class (assuming reinvestment of all distributions) held for the entire period.
| | | | | | | | | | | | | | | | | | | | |
| Initial Class | | Years ended 12/31 | |
| | | 2010 | | | 2009 | | | 2008 | | | 2007 | | | 2006 | |
Net asset value, beginning of period | | | $10.13 | | | | $7.30 | | | | $11.69 | | | | $10.52 | | | | $9.78 | |
| Income (loss) from investment operations | | | | | | | | | | | | | | | | | | | | |
Net investment income (d) | | | $0.06 | | | | $0.05 | | | | $0.06 | | | | $0.05 | | | | $0.03 | |
Net realized and unrealized gain (loss) on investments
and foreign currency | | | 1.27 | | | | 2.85 | | | | (4.39 | ) | | | 1.16 | | | | 0.72 | |
Total from investment operations | | | $1.33 | | | | $2.90 | | | | $(4.33 | ) | | | $1.21 | | | | $0.75 | |
| Less distributions declared to shareholders | | | | | | | | | | | | | | | | | | | | |
From net investment income | | | $(0.03 | ) | | | $(0.07 | ) | | | $(0.06 | ) | | | $(0.04 | ) | | | $(0.01 | ) |
Net asset value, end of period | | | $11.43 | | | | $10.13 | | | | $7.30 | | | | $11.69 | | | | $10.52 | |
Total return (%) (k)(r)(s) | | | 13.15 | | | | 40.14 | | | | (37.22 | ) | | | 11.53 | | | | 7.67 | |
Ratios (%) (to average net assets)
and Supplemental data: | | | | | | | | | | | | | | | | | | | | |
Expenses before expense reductions (f) | | | 0.86 | | | | 0.87 | | | | 0.86 | | | | 0.84 | | | | 0.82 | |
Expenses after expense reductions (f) | | | 0.82 | | | | 0.82 | | | | 0.83 | | | | 0.83 | | | | N/A | |
Net investment income | | | 0.55 | | | | 0.62 | | | | 0.62 | | | | 0.48 | | | | 0.34 | |
Portfolio turnover | | | 45 | | | | 53 | | | | 42 | | | | 62 | | | | 72 | |
Net assets at end of period (000 omitted) | | | $429,925 | | | | $448,333 | | | | $145,858 | | | | $309,208 | | | | $336,383 | |
| |
| Service Class | | Years ended 12/31 | |
| | | 2010 | | | 2009 | | | 2008 | | | 2007 | | | 2006 | |
Net asset value, beginning of period | | | $10.06 | | | | $7.24 | | | | $11.59 | | | | $10.43 | | | | $9.71 | |
| Income (loss) from investment operations | | | | | | | | | | | | | | | | | | | | |
Net investment income (d) | | | $0.03 | | | | $0.04 | | | | $0.04 | | | | $0.02 | | | | $0.01 | |
Net realized and unrealized gain (loss) on investments
and foreign currency | | | 1.26 | | | | 2.82 | | | | (4.36 | ) | | | 1.15 | | | | 0.71 | |
Total from investment operations | | | $1.29 | | | | $2.86 | | | | $(4.32 | ) | | | $1.17 | | | | $0.72 | |
| Less distributions declared to shareholders | | | | | | | | | | | | | | | | | | | | |
From net investment income | | | $(0.01 | ) | | | $(0.04 | ) | | | $(0.03 | ) | | | $(0.01 | ) | | | $— | |
Net asset value, end of period | | | $11.34 | | | | $10.06 | | | | $7.24 | | | | $11.59 | | | | $10.43 | |
Total return (%) (k)(r)(s) | | | 12.83 | | | | 39.78 | | | | (37.35 | ) | | | 11.26 | | | | 7.42 | |
Ratios (%) (to average net assets)
and Supplemental data: | | | | | | | | | | | | | | | | | | | | |
Expenses before expense reductions (f) | | | 1.11 | | | | 1.12 | | | | 1.11 | | | | 1.09 | | | | 1.07 | |
Expenses after expense reductions (f) | | | 1.07 | | | | 1.07 | | | | 1.08 | | | | 1.08 | | | | N/A | |
Net investment income | | | 0.30 | | | | 0.43 | | | | 0.37 | | | | 0.19 | | | | 0.09 | |
Portfolio turnover | | | 45 | | | | 53 | | | | 42 | | | | 62 | | | | 72 | |
Net assets at end of period (000 omitted) | | | $69,714 | | | | $80,269 | | | | $59,579 | | | | $119,324 | | | | $88,696 | |
| (d) | Per share data is based on average shares outstanding. |
| (f) | Ratios do not reflect reductions from fees paid indirectly, if applicable. |
| (k) | The total return does not reflect expenses that apply to separate accounts. Inclusion of these charges would reduce the total return figures for all periods shown. |
| (r) | Certain expenses have been reduced without which performance would have been lower. |
| (s) | From time to time the fund may receive proceeds from litigation settlements, without which performance would be lower. Excluding the effect of the proceeds received from a non-recurring litigation settlement against Tyco International Ltd., the Initial Class and Service Class total returns for the year ended December 31, 2010 would have each been lower by approximately 0.63%. |
See Notes to Financial Statements
13
MFS Massachusetts Investors Growth Stock Portfolio
NOTES TO FINANCIAL STATEMENTS
| (1) | | Business and Organization |
MFS Massachusetts Investors Growth Stock Portfolio (the fund) is a series of MFS Variable Insurance Trust II (the trust). The trust is organized as a Massachusetts business trust and is registered under the Investment Company Act of 1940, as amended, as an open-end management investment company. The shareholders of each series of the trust are separate accounts of insurance companies, which offer variable annuity and/or life insurance products, and qualified retirement and pension plans.
| (2) | | Significant Accounting Policies |
General – The preparation of financial statements in conformity with U.S. generally accepted accounting principles requires management to make estimates and assumptions that affect the reported amounts of assets and liabilities, and disclosure of contingent assets and liabilities at the date of the financial statements and the reported amounts of revenues and expenses during the reporting period. Actual results could differ from those estimates. In the preparation of these financial statements, management has evaluated subsequent events occurring after the date of the fund’s Statement of Assets and Liabilities through the date that the financial statements were issued. The fund invests in foreign securities, including securities of emerging market issuers. Investments in foreign securities are vulnerable to the effects of changes in the relative values of the local currency and the U.S. dollar and to the effects of changes in each country’s legal, political, and economic environment. The markets of emerging markets countries are generally more volatile than the markets of developed countries with more mature economies. All of the risks of investing in foreign securities previously described are heightened when investing in emerging markets countries.
Investment Valuations – Equity securities, including restricted equity securities, are generally valued at the last sale or official closing price as provided by a third-party pricing service on the market or exchange on which they are primarily traded. Equity securities, for which there were no sales reported that day, are generally valued at the last quoted daily bid quotation as provided by a third-party pricing service on the market or exchange on which such securities are primarily traded. Equity securities held short, for which there were no sales reported for that day, are generally valued at the last quoted daily ask quotation as provided by a third-party pricing service on the market or exchange on which such securities are primarily traded. Short-term instruments with a maturity at issuance of 60 days or less generally are valued at amortized cost, which approximates market value. Open-end investment companies are generally valued at net asset value per share. Securities and other assets generally valued on the basis of information from a third-party pricing service may also be valued at a broker/dealer bid quotation. Values obtained from third-party pricing services can utilize both transaction data and market information such as yield, quality, coupon rate, maturity, type of issue, trading characteristics, and other market data. The values of foreign securities and other assets and liabilities expressed in foreign currencies are converted to U.S. dollars using the mean of bid and asked prices for rates provided by a third-party pricing service.
The Board of Trustees has delegated primary responsibility for determining or causing to be determined the value of the fund’s investments (including any fair valuation) to the adviser pursuant to valuation policies and procedures approved by the Board. If the adviser determines that reliable market quotations are not readily available, investments are valued at fair value as determined in good faith by the adviser in accordance with such procedures under the oversight of the Board of Trustees. Under the fund’s valuation policies and procedures, market quotations are not considered to be readily available for most types of debt instruments and floating rate loans and many types of derivatives. These investments are generally valued at fair value based on information from third-party pricing services. In addition, investments may be valued at fair value if the adviser determines that an investment’s value has been materially effected by events occurring after the close of the exchange or market on which the investment is principally traded (such as foreign exchange or market) and prior to the determination of the fund’s net asset value, or after the halting of trading of a specific security where trading does not resume prior to the close of the exchange or market on which the security is principally traded. Events that occur on a frequent basis after foreign markets close (such as developments in foreign markets and significant movements in the U.S. markets) and prior to the determination of the fund’s net asset value may be deemed to have a material effect on the value of securities traded in foreign markets. Accordingly, the fund’s foreign equity securities may often be valued at fair value. The adviser generally relies on third-party pricing services or other information (such as the correlation with price movements of similar securities in the same or other markets; the type, cost and investment characteristics of the security; the business and financial condition of the issuer; and trading and other market data) to assist in determining whether to fair value and at what value to fair value an investment. The value of an investment for purposes of calculating the fund’s net asset value can differ depending on the source and method used to determine value. When fair valuation is used, the value of an investment used to determine the fund’s net asset value may differ from quoted or published prices for the same investment. There can be no assurance that the fund could obtain the fair value assigned to an investment if it were to sell the investment at the same time at which the fund determines its net asset value per share.
14
MFS Massachusetts Investors Growth Stock Portfolio
Notes to Financial Statements – continued
Various inputs are used in determining the value of the fund’s assets or liabilities. These inputs are categorized into three broad levels. In certain cases, the inputs used to measure fair value may fall into different levels of the fair value hierarchy. In such cases, an investment’s level within the fair value hierarchy is based on the lowest level of input that is significant to the fair value measurement. The fund’s assessment of the significance of a particular input to the fair value measurement in its entirety requires judgment, and considers factors specific to the investment. Level 1 includes unadjusted quoted prices in active markets for identical assets or liabilities. Level 2 includes other significant observable market-based inputs (including quoted prices for similar securities, interest rates, prepayment speed, and credit risk). Level 3 includes unobservable inputs, which may include the adviser’s own assumptions in determining the fair value of investments. The following is a summary of the levels used as of December 31, 2010 in valuing the fund’s assets or liabilities:
| | | | | | | | | | | | | | | | |
| Investments at Value | | Level 1 | | | Level 2 | | | Level 3 | | | Total | |
| Equity Securities | | | $493,878,325 | | | | $— | | | | $— | | | | $493,878,325 | |
| Mutual Funds | | | 5,979,449 | | | | — | | | | — | | | | 5,979,449 | |
| Total Investments | | | $499,857,774 | | | | $— | | | | $— | | | | $499,857,774 | |
For further information regarding security characteristics, see the Portfolio of Investments.
Foreign Currency Translation – Purchases and sales of foreign investments, income, and expenses are converted into U.S. dollars based upon currency exchange rates prevailing on the respective dates of such transactions or on the reporting date for foreign denominated receivables and payables. Gains and losses attributable to foreign currency exchange rates on sales of securities are recorded for financial statement purposes as net realized gains and losses on investments. Gains and losses attributable to foreign exchange rate movements on receivables, payables, income and expenses are recorded for financial statement purposes as foreign currency transaction gains and losses. That portion of both realized and unrealized gains and losses on investments that results from fluctuations in foreign currency exchange rates is not separately disclosed.
Short Sales – The fund may enter into short sales whereby it sells a security it does not own in anticipation of a decline in the value of that security. The fund will realize a gain if the security price decreases and a loss if the security price increases between the date of the short sale and the date on which the fund replaces the borrowed security. Losses from short sales can exceed the proceeds of the security sold; and they can also exceed the potential loss from an ordinary buy and sell transaction. The amount of any premium, dividends, or interest the fund may be required to pay in connection with a short sale will be recognized as a fund expense. The fund segregates cash or marketable securities in an amount that, when combined with the amount of proceeds from the short sale deposited with the broker, at least equals the current market value of the security sold short. At December 31, 2010, the fund has yet to enter into such transactions.
Security Loans – State Street Bank and Trust Company (“State Street”), as lending agent, loans the securities of the fund to certain qualified institutions (the “Borrowers”) approved by the fund. The loans are collateralized by cash and/or U.S. Treasury and federal agency obligations in an amount typically at least equal to the market value of the securities loaned. The market value of the loaned securities is determined at the close of business of the fund and any additional required collateral is delivered to the fund on the next business day. State Street provides the fund with indemnification against Borrower default. The fund bears the risk of loss with respect to the investment of cash collateral. On loans collateralized by cash, the cash collateral is invested in a money market fund or short-term securities. A portion of the income generated upon investment of the collateral is remitted to the Borrowers, and the remainder is allocated between the fund and the lending agent. On loans collateralized by U.S. Treasury and/or federal agency obligations, a fee is received from the Borrower, and is allocated between the fund and the lending agent. Income from securities lending is included in interest income on the Statement of Operations. The dividend and interest income earned on the securities loaned is accounted for in the same manner as other dividend and interest income.
Indemnifications – Under the fund’s organizational documents, its officers and Trustees may be indemnified against certain liabilities and expenses arising out of the performance of their duties to the fund. Additionally, in the normal course of business, the fund enters into agreements with service providers that may contain indemnification clauses. The fund’s maximum exposure under these agreements is unknown as this would involve future claims that may be made against the fund that have not yet occurred.
Investment Transactions and Income – Investment transactions are recorded on the trade date. Interest income is recorded on the accrual basis. Dividends received in cash are recorded on the ex-dividend date. Certain dividends from foreign securities will be recorded when the fund is informed of the dividend if such information is obtained subsequent to the ex-dividend date. Dividend and interest payments received in additional securities are recorded on the ex-dividend or ex-interest date in an amount equal to the value of the security on such date.
15
MFS Massachusetts Investors Growth Stock Portfolio
Notes to Financial Statements – continued
The fund may receive proceeds from litigation settlements. Any proceeds received from litigation involving portfolio holdings are reflected in the Statement of Operations in realized gain/loss if the security has been disposed of by the fund or in unrealized gain/loss if the security is still held by the fund. Any other proceeds from litigation not related to portfolio holdings are reflected as other income in the Statement of Operations. On September 6, 2010, the fund received $2,471,274 from a non-recurring litigation settlement against Tyco International Ltd.
Fees Paid Indirectly – The fund’s custody fee may be reduced according to an arrangement that measures the value of cash deposited with the custodian by the fund. This amount, for the year ended December 31, 2010, is shown as a reduction of total expenses on the Statement of Operations.
Tax Matters and Distributions – The fund intends to qualify as a regulated investment company, as defined under Subchapter M of the Internal Revenue Code, and to distribute all of its taxable income, including realized capital gains. As a result, no provision for federal income tax is required. The fund’s federal tax returns for the prior three fiscal years remain subject to examination by the Internal Revenue Service. Foreign taxes, if any, have been accrued by the fund in the accompanying financial statements.
Distributions to shareholders are recorded on the ex-dividend date. Income and capital gain distributions are determined in accordance with income tax regulations, which may differ from U.S. generally accepted accounting principles. Certain capital accounts in the financial statements are periodically adjusted for permanent differences in order to reflect their tax character. These adjustments have no impact on net assets or net asset value per share. Temporary differences which arise from recognizing certain items of income, expense, gain or loss in different periods for financial statement and tax purposes will reverse at some time in the future. Distributions in excess of net investment income or net realized gains are temporary overdistributions for financial statement purposes resulting from differences in the recognition or classification of income or distributions for financial statement and tax purposes.
Book/tax differences primarily relate to expiration of capital loss carryforwards and wash sale loss deferrals.
The tax character of distributions declared to shareholders for the last two fiscal years is as follows:
| | | | | | | | |
| | | 12/31/10 | | | 12/31/09 | |
| Ordinary income (including any short-term capital gains) | | | $1,353,058 | | | | $1,718,063 | |
The federal tax cost and the tax basis components of distributable earnings were as follows:
| | | | |
| As of 12/31/10 | | | | |
| Cost of investments | | | $443,859,468 | |
| Gross appreciation | | | 73,604,063 | |
| Gross depreciation | | | (17,605,757 | ) |
| Net unrealized appreciation (depreciation) | | | $55,998,306 | |
| Undistributed ordinary income | | | 2,502,110 | |
| Capital loss carryforwards | | | (111,125,897 | ) |
| Other temporary differences | | | 10,608 | |
As of December 31, 2010, the fund had capital loss carryforwards available to offset future realized gains. Such losses expire as follows:
| | | | |
| 12/31/15 | | | $(43,030,094 | ) |
| 12/31/16 | | | (59,160,964 | ) |
| 12/31/17 | | | (8,934,839 | ) |
| Total | | | $(111,125,897 | ) |
The availability of a portion of the capital loss carryforwards, which were acquired on June 22, 2007 and December 4, 2009 in connection with the MFS Strategic Growth Series merger and MFS Capital Appreciation Portfolio merger, respectively, may be limited in a given year.
16
MFS Massachusetts Investors Growth Stock Portfolio
Notes to Financial Statements – continued
Multiple Classes of Shares of Beneficial Interest – The fund offers multiple classes of shares, which differ in their respective distribution and/or service fees. The fund’s income, realized and unrealized gain (loss), and common expenses are allocated to shareholders based on the daily net assets of each class. Dividends are declared separately for each class. Differences in per share dividend rates are generally due to differences in separate class expenses. The fund’s distributions declared to shareholders as reported on the Statements of Changes in Net Assets are presented by class as follows:
| | | | | | | | |
| | | From net investment
income | |
| | | Year ended
12/31/10 | | | Year ended
12/31/09 | |
| Initial Class | | | $1,281,103 | | | | $1,377,328 | |
| Service Class | | | 71,955 | | | | 340,735 | |
| Total | | | $1,353,058 | | | | $1,718,063 | |
| (3) | | Transactions with Affiliates |
Investment Adviser – The fund has an investment advisory agreement with MFS to provide overall investment management and related administrative services and facilities to the fund. The management fee is computed daily and paid monthly at an annual rate of 0.75% of the fund’s average daily net assets. The investment adviser has agreed in writing to reduce its management fee to 0.65% of average daily net assets in excess of $1 billion. This written agreement will continue until modified or rescinded by the fund’s shareholders. For the year ended December 31, 2010, the fund’s average daily net assets did not exceed $1 billion and therefore, the management fee was not reduced. The management fee incurred for the year ended December 31, 2010 was equivalent to an annual effective rate of 0.75% of the fund’s average daily net assets.
The investment adviser has agreed in writing to pay a portion of the fund’s total annual operating expenses, exclusive of interest, taxes, extraordinary expenses, brokerage and transaction costs, and investment-related expenses, such that the total annual operating expenses do not exceed 0.82% of average daily net assets for the Initial Class shares and 1.07% of average daily net assets for the Service Class shares. This written agreement will continue until April 30, 2012. For the year ended December 31, 2010, this reduction amounted to $176,815 and is reflected as a reduction of total expenses in the Statement of Operations.
Distributor – MFS Fund Distributors, Inc. (MFD), a wholly-owned subsidiary of MFS, is the distributor of shares of the fund. The Trustees have adopted a distribution plan for the Service Class shares pursuant to Rule 12b-1 under the Investment Company Act of 1940.
The fund’s distribution plan provides that the fund will pay MFD distribution and/or service fees equal to 0.25% per annum of its average daily net assets attributable to Service Class shares as partial consideration for services performed and expenses incurred by MFD and financial intermediaries (including participating insurance companies that invest in the fund to fund variable annuity and variable life insurance contracts, sponsors of qualified retirement and pension plans that invest in the fund, and affiliates of these participating insurance companies and plan sponsors) in connection with the sale and distribution of the Service Class shares. MFD may subsequently pay all, or a portion, of the distribution and/or service fees to financial intermediaries.
Shareholder Servicing Agent – MFS Service Center, Inc. (MFSC), a wholly-owned subsidiary of MFS, has contracted to provide transfer agent and recordkeeping functions in connection with the issuance, transfer, and redemption of each class of shares of the fund under a Shareholder Servicing Agent Agreement. During the year ended December 31, 2010, the fund did not pay MFSC a fee for this service.
Administrator – MFS provides certain financial, legal, shareholder communications, compliance, and other administrative services to the fund. Under an administrative services agreement, the fund partially reimburses MFS the costs incurred to provide these services. The fund is charged an annual fixed amount of $10,000 plus a fee based on average daily net assets. The administrative services fee incurred for the year ended December 31, 2010 was equivalent to an annual effective rate of 0.0351% of the fund’s average daily net assets.
Trustees’ and Officers’ Compensation – The fund pays compensation to Trustees in the form of a retainer, attendance fees, and additional compensation to the Board chairperson. The fund does not pay compensation directly to officers of the fund who are also officers of the investment adviser, all of whom receive remuneration for their services to the fund from MFS. Certain officers of the fund are officers or directors of MFS, MFD, and MFSC.
Other – This fund and certain other funds managed by MFS (the funds) have entered into services agreements (the Agreements) which provide for payment of fees by the funds to Tarantino LLC and Griffin Compliance LLC in return for the provision of services of an Independent Chief Compliance Officer (ICCO) and Assistant ICCO, respectively, for the funds. The ICCO and Assistant ICCO are officers of the funds and the sole members of Tarantino LLC and Griffin Compliance LLC,
17
MFS Massachusetts Investors Growth Stock Portfolio
Notes to Financial Statements – continued
respectively. The funds can terminate the Agreements with Tarantino LLC and Griffin Compliance LLC at any time under the terms of the Agreements. MFS has agreed to bear all expenses associated with office space, other administrative support, and supplies provided to the ICCO and Assistant ICCO. For the year ended December 31, 2010, the aggregate fees paid by the fund to Tarantino LLC and Griffin Compliance LLC were $8,324 and are included in miscellaneous expense on the Statement of Operations.
The fund invests in the MFS Institutional Money Market Portfolio which is managed by MFS and seeks a high level of current income consistent with preservation of capital and liquidity. Income earned on this investment is included in dividends from underlying funds on the Statement of Operations. This money market fund does not pay a management fee to MFS.
Purchases and sales of investments, other than U.S. Government securities, purchased option transactions, and short-term obligations, aggregated $206,306,357 and $286,318,975, respectively.
| (5) | | Shares of Beneficial Interest |
The fund’s Declaration of Trust permits the Trustees to issue an unlimited number of full and fractional shares of beneficial interest. Transactions in fund shares were as follows:
| | | | | | | | | | | | | | | | |
| | | Year ended 12/31/10 | | | Year ended 12/31/09 | |
| | | Shares | | | Amount | | | Shares | | | Amount | |
| Shares sold | | | | | | | | | | | | | | | | |
Initial Class | | | 260,261 | | | | $2,595,367 | | | | 664,081 | | | | $5,131,553 | |
Service Class | | | 191,998 | | | | 1,918,108 | | | | 220,773 | | | | 1,660,218 | |
| | | 452,259 | | | | $4,513,475 | | | | 884,854 | | | | $6,791,771 | |
| Shares issued in connection with acquisition of MFS Capital Appreciation Portfolio | | | | | | | | | | | | | | | | |
Initial Class | | | | | | | | | | | 27,551,763 | | | | $273,589,013 | |
Service Class | | | | | | | | | | | 1,622,091 | | | | 15,994,679 | |
| | | | | | | | | | | 29,173,854 | | | | $289,583,692 | |
| Shares issued to shareholders in reinvestment of distributions | | | | | | | | | | | | | | | | |
Initial Class | | | 119,617 | | | | $1,281,103 | | | | 183,889 | | | | $1,377,328 | |
Service Class | | | 6,756 | | | | 71,955 | | | | 45,736 | | | | 340,735 | |
| | | 126,373 | | | | $1,353,058 | | | | 229,625 | | | | $1,718,063 | |
| Shares reacquired | | | | | | | | | | | | | | | | |
Initial Class | | | (7,026,510 | ) | | | $(71,724,639 | ) | | | (4,110,630 | ) | | | $(33,784,807 | ) |
Service Class | | | (2,033,549 | ) | | | (20,840,734 | ) | | | (2,135,944 | ) | | | (17,615,190 | ) |
| | | (9,060,059 | ) | | | $(92,565,373 | ) | | | (6,246,574 | ) | | | $(51,399,997 | ) |
| Net change | | | | | | | | | | | | | | | | |
Initial Class | | | (6,646,632 | ) | | | $(67,848,169 | ) | | | 24,289,103 | | | | $246,313,087 | |
Service Class | | | (1,834,795 | ) | | | (18,850,671 | ) | | | (247,344 | ) | | | 380,442 | |
| | | (8,481,427 | ) | | | $(86,698,840 | ) | | | 24,041,759 | | | | $246,693,529 | |
The fund and certain other funds managed by MFS participate in a $1.1 billion unsecured committed line of credit, subject to a $1 billion sublimit, provided by a syndication of banks under a credit agreement. Borrowings may be made for temporary financing needs. Interest is charged to each fund, based on its borrowings, generally at a rate equal to the higher of the Federal Reserve funds rate or one month LIBOR plus an agreed upon spread. A commitment fee, based on the average daily, unused portion of the committed line of credit, is allocated among the participating funds at the end of each calendar quarter. In addition, the fund and other funds managed by MFS have established unsecured uncommitted borrowing arrangements with certain banks for temporary financing needs. Interest is charged to each fund, based on its borrowings, at a rate equal to the Federal Reserve funds rate plus an agreed upon spread. For the year ended December 31, 2010, the fund’s commitment fee and interest expense were $5,518 and $0, respectively, and are included in miscellaneous expense on the Statement of Operations.
18
MFS Massachusetts Investors Growth Stock Portfolio
Notes to Financial Statements – continued
| (7) | | Transactions in Underlying Funds – Affiliated Issuers |
An affiliated issuer may be considered one in which the fund owns 5% or more of the outstanding voting securities, or a company which is under common control. For the purposes of this report, the fund assumes the following to be affiliated issuers:
| | | | | | | | | | | | | | |
| Underlying Funds | | Beginning
Shares/Par
Amount | | Acquisitions
Shares/Par
Amount | | | Dispositions
Shares/Par
Amount | | | Ending
Shares/Par
Amount | |
| MFS Institutional Money Market Portfolio | | 4,308,898 | | | 93,712,731 | | | | (92,042,180 | ) | | | 5,979,449 | |
| | | | |
| Underlying Funds | | Realized
Gain (Loss) | | Capital Gain
Distributions | | | Dividend
Income | | | Ending
Value | |
| MFS Institutional Money Market Portfolio | | $— | | | $— | | | | $10,404 | | | | $5,979,449 | |
At close of business on December 4, 2009, the fund with net assets of $237,649,679, acquired all of the assets and liabilities of MFS Capital Appreciation Portfolio. The purpose of the transaction was to provide shareholders of the MFS Capital Appreciation Portfolio the opportunity to participate in a larger combined portfolio with an identical investment objective and similar investment policies and strategies. The acquisition was accomplished by a tax-free exchange of 29,173,854 shares of the fund (valued at $289,583,692) for all of the assets and liabilities of MFS Capital Appreciation Portfolio. MFS Capital Appreciation Portfolio then distributed the shares of the fund that MFS Capital Appreciation Portfolio received from the fund to its shareholders. MFS Capital Appreciation Portfolio’s net assets on that date were $289,583,692, including investments valued at $290,620,865 with a cost basis of $265,631,184. For financial reporting purposes, assets received and shares issued by the fund were recorded at fair value; however, the cost basis of the investments received from MFS Capital Appreciation Portfolio were carried forward to align ongoing reporting of the fund’s realized and unrealized gains and losses with amounts distributable to shareholders for tax purposes.
Assuming the acquisition had been completed on January 1, 2009, the fund’s pro forma results of operations for the year ended December 31, 2009 are as follows:
| | | | |
| Net investment income | | | $ 3,042,938 | |
Net realized and unrealized gain (loss) on investments
and foreign currency transactions | | | 157,830,440 | |
| Change in net assets from operations | | | $160,873,378 | |
19
MFS Massachusetts Investors Growth Stock Portfolio
REPORT OF INDEPENDENT REGISTERED PUBLIC ACCOUNTING FIRM
To the Board of Trustees of MFS Variable Insurance Trust II and the Shareholders of MFS Massachusetts Investors Growth Stock Portfolio:
We have audited the accompanying statement of assets and liabilities, including the portfolio of investments, of MFS Massachusetts Investors Growth Stock Portfolio (the “Fund”) (one of the portfolios comprising MFS Variable Insurance Trust II) as of December 31, 2010, and the related statement of operations for the year then ended, the statements of changes in net assets for each of the two years in the period then ended, and the financial highlights for each of the five years in the period then ended. These financial statements and financial highlights are the responsibility of the Fund’s management. Our responsibility is to express an opinion on these financial statements and financial highlights based on our audits.
We conducted our audits in accordance with the standards of the Public Company Accounting Oversight Board (United States). Those standards require that we plan and perform the audit to obtain reasonable assurance about whether the financial statements and financial highlights are free of material misstatement. The Fund is not required to have, nor were we engaged to perform, an audit of its internal control over financial reporting. Our audits included consideration of internal control over financial reporting as a basis for designing audit procedures that are appropriate in the circumstances, but not for the purpose of expressing an opinion on the effectiveness of the Fund’s internal control over financial reporting. Accordingly, we express no such opinion. An audit also includes examining, on a test basis, evidence supporting the amounts and disclosures in the financial statements, assessing the accounting principles used and significant estimates made by management, as well as evaluating the overall financial statement presentation. Our procedures included confirmation of securities owned as of December 31, 2010, by correspondence with the custodian. We believe that our audits provide a reasonable basis for our opinion.
In our opinion, the financial statements and financial highlights referred to above present fairly, in all material respects, the financial position of MFS Massachusetts Investors Growth Stock Portfolio as of December 31, 2010, the results of its operations for the year then ended, the changes in its net assets for each of the two years in the period then ended, and the financial highlights for each of the five years in the period then ended, in conformity with accounting principles generally accepted in the United States of America.
DELOITTE & TOUCHE LLP
Boston, Massachusetts
February 14, 2011
20
MFS Massachusetts Investors Growth Stock Portfolio
TRUSTEES AND OFFICERS – IDENTIFICATION AND BACKGROUND
The Trustees and officers of the Trust, as of February 1, 2011, are listed below, together with their principal occupations during the past five years. (Their titles may have varied during that period.) The address of each Trustee and officer is 500 Boylston Street, Boston, Massachusetts 02116.
| | | | | | |
Name, Date of Birth | | Position(s) Held
with Fund | | Trustee/Officer
Since (1) | | Principal Occupations During the Past Five Years and
Other Directorships (2) |
| INTERESTED TRUSTEE | | | | |
David D. Horn (3) (born 6/07/41) | | Trustee | | April 1986 | | Private investor; Sun Life Assurance Company of Canada, Senior Vice President and General Manager for the United States (until 1997); Director (until March 2004) |
| | |
| INDEPENDENT TRUSTEES | | | | |
J. Kermit Birchfield (born 1/08/40) | | Chairman | | May 1997 | | Consultant; Century Partners, Inc. (investments), Director; Displaytech, Inc. (technology), Chairman; Dessin Fournir LLC (furniture manufacturer), Director; Site Watch LLC (software to monitor oil tanks), Managing Director (2006 to present); Juridica Investments (fund investing in judicial matters), Director (2007 to present), Immuno Science, Inc. (medical research), Independent Director (2009 to present), Intermountain Industries, Inc. (oil & gas exploration and production), Director (until February 2009) |
| | | |
Robert C. Bishop (born 1/13/43) | | Trustee | | May 2001 | | AutoImmune, Inc. (pharmaceutical product development), Chairman, President and Chief Executive Officer; Caliper Life Sciences Corp. (laboratory analytical instruments), Chairman; Optobionics Corporation (ophthalmic devices), Director (until 2007); Millipore Corporation (purification/filtration products), Director (until July 2010); Waterstreet Capital (leverage buyouts), Advisory Board (until August 2010) |
| | | |
Frederick H. Dulles (born 3/12/42) | | Trustee | | May 2001 | | Dulles International Law LLC (law firm), Senior Lawyer (since 2009); Juridica Capital Management (US) Inc. (litigation financing), Vice President and General Counsel (since 2009); Dulles Properties LLC (real estate), Broker (since 2008); The Citadel School of Business Administration (education), Adjunct Professor (since 2003); Disher, Hamrick & Myers Residential, Inc. (real estate), Broker (until 2006); Frederick H. Dulles Law Practice (law firm), (until 2006); Charlestown School of Law (education), Adjunct Professor (until 2007); Prudential Carolina Real Estate, (real estate), Broker (until 2008); Free Enterprise Foundation Inc. (research institute), Director & Secretary (until 2008); Ten State International Law PLLP (law firm), Of Counsel (until 2009) |
| | | |
Marcia A. Kean (born 6/30/48) | | Trustee | | April 2005 | | Feinstein Kean Healthcare (consulting), Chief Executive Officer |
| | | |
Ronald G. Steinhart (born 6/15/40) | | Trustee | | May 2001 | | Private investor; Penske Automotive Group (automotive retailer), Director; Animal Health International, Inc. (animal health products), Director (since 2007); Texas Industries (concrete/aggregates/cement), Director (since 2007); Susser Holdings Corporation (retail convenience stores and distributor of wholesale motor fuel), Director (since 2009); Prentiss Properties Trust (real estate investment trust), Director (until 2006); Penson Worldwide, Inc. (securities clearance), Director (until 2008) |
| | | |
Haviland Wright (born 7/21/48) | | Trustee | | May 2001 | | X-Change Corp. (multi-media web services), Director (since 2010); Nano Loa Inc. (liquid crystal displays), Director (until 2009); Profitability of Hawaii (software), Chief Development Officer (until 2010); Elixir Technologies Corporation (software), Director (until 2010) |
| | | |
| OFFICERS | | | | | | |
Maria F. DiOrioDwyer (4)
(born 12/01/58) | | President | | November 2005 | | Massachusetts Financial Services Company, Executive Vice President and Chief Regulatory Officer; Chief Compliance Officer (since December 2006) |
| | | |
| Christopher R. Bohane (4) (born 1/18/74) | | Assistant Secretary and Assistant Clerk | | July 2005 | | Massachusetts Financial Services Company, Vice President and Senior Counsel |
| | | |
John M. Corcoran (4) (born 4/13/65) | | Treasurer | | October 2008 | | Massachusetts Financial Services Company, Senior Vice President (since October 2008); State Street Bank and Trust (financial services provider), Senior Vice President, (until September 2008) |
| | | |
Ethan D. Corey (4) (born 11/21/63) | | Assistant Secretary and Assistant Clerk | | July 2005 | | Massachusetts Financial Services Company, Senior Vice President and Associate General Counsel |
| | | |
David L. DiLorenzo (4) (born 8/10/68) | | Assistant Treasurer | | July 2005 | | Massachusetts Financial Services Company, Vice President |
| | | |
Timothy M. Fagan (4) (born 7/10/68) | | Assistant Secretary and Assistant Clerk | | September 2005 | | Massachusetts Financial Services Company, Vice President and Senior Counsel |
| | | |
Mark D. Fischer (4) (born 10/27/70) | | Assistant Treasurer | | July 2005 | | Massachusetts Financial Services Company, Vice President |
21
MFS Massachusetts Investors Growth Stock Portfolio
Trustees and Officers – continued
| | | | | | |
Name, Date of Birth | | Position(s) Held
with Fund | | Trustee/Officer
Since (1) | | Principal Occupations During the Past Five Years and
Other Directorships (2) |
Robyn L. Griffin (born 7/04/75) | | Assistant Independent Chief Compliance Officer | | August 2008 | | Griffin Compliance LLC (provider of compliance services), Principal (since August 2008); State Street Corporation (financial services provider), Mutual Fund Administration Assistant Vice President (October 2006 – July 2008); Liberty Mutual Group (insurance), Personal Market Assistant Controller (April 2006 – October 2006); Deloitte & Touche LLP (professional services firm), Senior Manager (prior to April 2006) |
| | | |
Brian E. Langenfeld (4) (born 3/07/73) | | Assistant Secretary and Assistant Clerk | | May 2006 | | Massachusetts Financial Services Company, Vice President and Senior Counsel (since May 2006); John Hancock Advisers, LLC, Assistant Vice President and Counsel (until April 2006) |
| | | |
Ellen Moynihan (4) (born 11/13/57) | | Assistant Treasurer | | May 1997 | | Massachusetts Financial Services Company, Senior Vice President |
| | | |
Susan S. Newton (4) (born 3/07/50) | | Assistant Secretary and Assistant Clerk | | May 2005 | | Massachusetts Financial Services Company, Senior Vice President and Associate General Counsel |
| | | |
Susan A. Pereira (4)
(born 11/05/70) | | Assistant Secretary and Assistant Clerk | | July 2005 | | Massachusetts Financial Services Company, Vice President and Senior Counsel |
| | | |
Mark N. Polebaum (4) (born 5/01/52) | | Secretary and Clerk | | February 2006 | | Massachusetts Financial Services Company, Executive Vice President, General Counsel and Secretary (since January 2006); Wilmer Cutler Pickering Hale and Dorr LLP (law firm), Partner (until January 2006) |
| | | |
Frank L. Tarantino (born 3/07/44) | | Independent Chief Compliance Officer | | September 2004 | | Tarantino LLC (provider of compliance services), Principal |
| | | |
Richard S. Weitzel (4) (born 7/16/70) | | Assistant Secretary and Assistant Clerk | | October 2007 | | Massachusetts Financial Services Company, Vice President and Assistant General Counsel |
| | | |
James O. Yost (4) (born 6/12/60) | | Assistant Treasurer | | April 1992 | | Massachusetts Financial Services Company, Senior Vice President |
| (1) | Date first appointed to serve as Trustee/Officer of an MFS fund or a Compass variable account. Each Trustee has served continuously since appointment. For the period March 2008 until October 2008, Ms. DiOrioDwyer served as Treasurer of the Funds. |
| (2) | Directorships or trusteeships of companies required to report to the Securities and Exchange Commission (i.e., “public companies”). |
| (3) | “Interested person” of the Trust, within the meaning of the Investment Company Act of 1940 (referred to as the 1940 Act), which is the principal federal law governing investment companies like the Trust, as a result of position with Sun Life of Canada (U.S.). The address of Sun Life of Canada (U.S.) is One Sun Life Executive Park, Wellesley Hills, Massachusetts 02481. |
| (4) | “Interested person” of MFS within the meaning of the 1940 Act. The address of MFS is 500 Boylston Street, Boston, Massachusetts 02116. |
The Trust does not hold annual meetings for the purpose of electing Trustees, and Trustees are not elected for fixed terms. Each Trustee and officer holds office until his or her successor is chosen and qualified, or until his or her earlier death, resignation, retirement or removal.
All Trustees currently serve as Trustees of the Trust and have served in that capacity since originally elected or appointed. All of the Trustees are also Managers of the Compass Variable Accounts. The executive officers of the Trust hold similar offices for the Compass Variable Accounts and other funds in the MFS fund complex. As of January 1, 2011, each Trustee serves as a Trustee or Manager of 31 Accounts/Portfolios.
22
MFS Massachusetts Investors Growth Stock Portfolio
Trustees and Officers – continued
The Statement of Additional Information contains further information about the Trustees and is available without charge upon request by calling 1-800-752-7215.
| | |
Investment Adviser
Massachusetts Financial Services Company 500 Boylston Street, Boston, MA 02116-3741 | | Custodian State Street Bank and Trust 1 Lincoln Street, Boston, MA 02111-2900 |
Distributor
MFS Fund Distributors, Inc. 500 Boylston Street, Boston, MA 02116-3741 | | Independent Registered Public Accounting Firm Deloitte & Touche LLP 200 Berkeley Street, Boston, MA 02116 |
Portfolio Manager Jeffrey Constantino | | |
23
MFS Massachusetts Investors Growth Stock Portfolio
BOARD REVIEW OF INVESTMENT ADVISORY AGREEMENT
The Investment Company Act of 1940 requires that both the full Board of Trustees and a majority of the non-interested (“independent”) Trustees, voting separately, annually approve the continuation of the investment advisory agreement between MFS Variable Insurance Trust II (the “Trust”) and Massachusetts Financial Services Company (“MFS”) on behalf of the Fund. The Trustees consider matters bearing on the Fund and the advisory arrangement at their meetings throughout the year, including a review of performance data at each regular meeting. In addition, the independent Trustees met in person in May and again in July 2010 (“contract review meetings”) for the specific purpose of considering whether to approve the continuation of the investment advisory agreement for the Fund. The independent Trustees were assisted in their evaluation of the investment advisory agreement by independent legal counsel, from whom they received separate legal advice and with whom they met separately from MFS management during various contract review meetings. The independent Trustees were also assisted in this process by the Fund’s Independent Chief Compliance Officer, a full-time senior officer appointed by and reporting to the independent Trustees.
In connection with their deliberations, the Trustees, including the independent Trustees, considered such information and factors as they believed, in light of the legal advice furnished to them and their own business judgment, to be relevant. The investment advisory agreement was considered separately for the Fund, although the Trustees also took into account the common interests of all Funds in the Trust in their review. As described below, the Trustees considered the nature, quality, and extent of the various investment advisory, administrative, and shareholder services performed by MFS under the existing investment advisory agreement and other arrangements with the Trust.
In connection with their contract review meetings, the Trustees received and relied upon materials which included, among other items: (i) information provided by Lipper Inc. (“Lipper”) on the investment performance of the Fund for various time periods ended December 31, 2009, compared to the investment performance of a group of funds with substantially similar investment classifications/objectives (the “Lipper performance universe”), (ii) information provided by Lipper on the Fund’s advisory fees and other expenses compared to the advisory fees and other expenses of comparable funds identified by Lipper (the “Lipper expense group”), (iii) information provided by MFS on the advisory fees of comparable portfolios of its other clients, including institutional separate account and other clients, (iv) information as to whether, and to what extent applicable, expense waivers, reimbursements or fee “breakpoints” are observed for the Fund, (v) information regarding MFS’ financial results and financial condition, including MFS’ and certain of its affiliates’ estimated profitability from services performed for the Fund, (vi) MFS’ views regarding the outlook for the mutual fund industry and its strategic business plans, (vii) descriptions of various functions performed by MFS for the Trust, such as compliance monitoring and portfolio trading practices, and (viii) information regarding the overall organization of MFS, including information about MFS’ senior management and other personnel providing investment advisory, administrative and other services to the Fund. The comparative performance, fee and expense information prepared and provided by Lipper was not independently verified, and the independent Trustees did not independently verify any information provided to them by MFS.
The Trustees’ conclusion as to the continuation of the investment advisory agreement was based on comprehensive consideration of all information provided to the Trustees and was not the result of any single factor. Some of the factors that figured particularly in the Trustees’ deliberations are described below for the Fund, while individual Trustees may have given different weight to various factors and evaluated the information presented as a whole differently than another individual Trustee. The Trustees recognized that the fee arrangements for the Fund reflect years of review and discussion between the independent Trustees and MFS, that certain aspects of such arrangements may receive greater scrutiny in some years than others, and that the Trustees’ conclusions may be based, in part, on their consideration of these same arrangements during the course of the year and in prior years.
Based on information provided by Lipper, the Trustees compared the Fund’s total return investment performance to the performance of the Lipper performance universe over various time periods. The Trustees placed particular emphasis on the total return performance of the Fund’s Initial Class shares in comparison to the performance of funds in its Lipper performance universe over the one-, three- and five-year periods ended December 31, 2009. The Trustees did not rely on performance results for more recent periods, including those shown elsewhere in this report.
The Trustees noted the performance of the Fund’s Initial Class shares was in the 3rd quintile relative to the other funds in the Lipper performance universe for the one-year period (the 1st quintile being the best performers and the 5th quintile being the worst performers). The total return performance of the Fund was in the 2nd quintile for the three-year and five-year periods ended December 31, 2009, relative to the Lipper performance universe. Based on the nature and quality of services provided by MFS, the Board of Trustees concluded that the Fund’s performance was satisfactory.
24
MFS Massachusetts Investors Growth Stock Portfolio
Board Review of Investment Advisory Agreement – continued
In the course of their deliberations, the Trustees took into account information provided by MFS during contract review meetings, as well as during investment review meetings conducted with portfolio management personnel during the course of the year.
In assessing the reasonableness of the Fund’s advisory fee, the Trustees considered, among other information, the Fund’s advisory fee and the total expense ratio of the Fund’s Initial Class shares as a percentage of average daily net assets, compared to the advisory fee and total expense ratios of its peer group of funds based on information provided by Lipper. The Trustees also considered the advisory fees charged by MFS to institutional accounts. In comparing these fees, the Trustees considered the generally broader scope of services provided by MFS to the Trust than those provided to institutional accounts. The Trustees also considered the higher demands placed on MFS’ investment personnel and trading infrastructure as a result of the daily cash in-flows and out-flows of the Fund, and the impact on MFS and related expenses due to the more extensive regulatory regime to which the Fund is subject, compared to institutional accounts.
In considering the fees, the Trustees noted from the Lipper data that the Fund’s effective advisory fee rate and total expense ratio were each approximately at the median of such fees and expenses of funds in the Lipper expense group. The Trustees further noted that MFS agreed to reduce its advisory fee on average daily net assets over $1 billion on a permanent basis, requiring shareholder approval for any modification or termination, and they accepted MFS’ offer to continue the expense limitation for the Fund. The Trustees further concluded that the existing breakpoint was sufficient to allow the Fund to benefit from economies of scale as its assets grow. The Trustees concluded that the fees were reasonable in light of the nature and quality of services provided.
The Trustees also considered information prepared by MFS relating to its costs and profits with respect to the Fund and other investment companies and accounts advised by MFS, as well as MFS’ methodologies used to determine and allocate its costs to the Fund and other accounts and products for purposes of estimating profitability.
After reviewing these and other factors described below, the Trustees concluded that the advisory fees charged to the Fund represent reasonable compensation in light of the nature and quality of the services being provided by MFS.
In addition, the Trustees considered MFS’ resources and related efforts to continue to retain, attract and motivate capable personnel to serve the Fund. The Trustees also considered the financial resources of MFS and its parent, Sun Life Financial Inc. The Trustees further considered any advantages and possible disadvantages of having an adviser which also serves other investment companies as well as institutional accounts.
The Trustees also considered the nature, quality, cost, and extent of administrative, transfer agency, and distribution services provided to the Fund by MFS and its affiliates under agreements and plans other than the investment advisory agreement, including the 12b-1 fees the Fund pays to MFS Fund Distributors, Inc., an affiliate of MFS. The Trustees also considered the nature, extent and quality of certain other services MFS performs or arranges on the Fund’s behalf, which may include securities lending programs, directed expense payment programs, class action recovery programs, and MFS’ interaction with third-party service providers, principally custodians and sub-custodians. The Trustees concluded that the various non-advisory services provided by MFS and its affiliates on behalf of the Fund were satisfactory. The Trustees also considered the benefits to MFS from the use of the Fund’s portfolio brokerage commissions to pay for investment research and various other factors. Additionally, the Trustees considered so-called “fall-out benefits” to MFS such as reputational value derived from serving as investment manager to the Trust, and determined that any such benefits derived by MFS were reasonable and fair.
Based on their evaluation of factors that they deemed to be material, including those factors described above, the Board of Trustees, including a majority of the independent Trustees, concluded that the investment advisory agreement should be continued for an additional one-year period, commencing September 1, 2010.
A discussion regarding the Board’s most recent review and renewal of the fund’s Investment Advisory Agreement with MFS is available by clicking on the fund’s name under “Variable Insurance Portfolios — VIT II” in the “Products and Performance” section of the MFS Web site (mfs.com).
25
MFS Massachusetts Investors Growth Stock Portfolio
PROXY VOTING POLICIES AND INFORMATION
A general description of the MFS funds’ proxy voting policies and procedures is available without charge, upon request, by calling
1-800-225-2606, by visiting the Proxy Voting section of mfs.com or by visiting the SEC’s Web site at http://www.sec.gov.
Information regarding how the fund voted proxies relating to portfolio securities during the most recent twelve-month period ended June 30 is available without charge by visiting the Proxy Voting section of mfs.com or by visiting the SEC’s Web site at http://www.sec.gov.
QUARTERLY PORTFOLIO DISCLOSURE
The fund will file a complete schedule of portfolio holdings with the Securities and Exchange Commission (the Commission) for the first and third quarters of each fiscal year on Form N-Q. The fund’s Form N-Q may be reviewed and copied at the:
Public Reference Room
Securities and Exchange Commission
100 F Street, NE, Room 1580
Washington, D.C. 20549
Information on the operation of the Public Reference Room may be obtained by calling the Commission at 1-800-SEC-0330. The fund’s Form N-Q is available on the EDGAR database on the Commission’s Internet Web site at http://www.sec.gov, and copies of this information may be obtained, upon payment of a duplicating fee, by electronic request at the following e-mail address: publicinfo@sec.gov or by writing the Public Reference Section at the above address.
FURTHER INFORMATION
From time to time, MFS may post important information about the fund or the MFS funds on the MFS web site (mfs.com). This information is available by visiting the “News & Commentary” section of mfs.com or by clicking on the fund’s name under “Variable Insurance Portfolios — VIT II” in the “Products and Performance” section of mfs.com.
FEDERAL TAX INFORMATION (unaudited)
The following information is provided pursuant to provisions of the Internal Revenue Code.
For corporate shareholders, 100% of the ordinary income dividends paid during the fiscal year qualify for the corporate dividends received deduction.
26
MFS Massachusetts Investors Growth Stock Portfolio
MFS® PRIVACY NOTICE
Privacy is a concern for every investor today. At MFS Investment Management® and the MFS funds, we take this concern very seriously. We want you to understand our policies about the investment products and services that we offer, and how we protect the nonpublic personal information of investors who have a direct relationship with us and our wholly owned subsidiaries.
Throughout our business relationship, you provide us with personal information. We maintain information and records about you, your investments, and the services you use. Examples of the nonpublic personal information we maintain include
| | Ÿ | | data from investment applications and other forms |
| | Ÿ | | share balances and transactional history with us, our affiliates, or others |
| | Ÿ | | facts from a consumer reporting agency |
We do not disclose any nonpublic personal information about our customers or former customers to anyone, except as permitted by law. We may share nonpublic personal information with third parties or certain of our affiliates in connection with servicing your account or processing your transactions. We may share information with companies or financial institutions that perform marketing services on our behalf or with other financial institutions with which we have joint marketing arrangements, subject to any legal requirements.
Authorization to access your nonpublic personal information is limited to appropriate personnel who provide products, services, or information to you. We maintain physical, electronic, and procedural safeguards to help protect the personal information we collect about you.
If you have any questions about the MFS privacy policy, please call 1-800-225-2606 any business day.
Note: If you own MFS products or receive MFS services in the name of a third party such as a bank or broker-dealer, their privacy policy may apply to you instead of ours.
27


MFS® NEW DISCOVERY PORTFOLIO
The report is prepared for the general information of contract owners. It is authorized for distribution to prospective investors only when preceded or accompanied by a current prospectus.
NOT FDIC INSURED Ÿ MAY LOSE VALUE Ÿ NO BANK GUARANTEE Ÿ NOT A DEPOSIT Ÿ NOT INSURED BY ANY FEDERAL GOVERNMENT AGENCY OR NCUA/NCUSIF
MFS New Discovery Portfolio
LETTER FROM THE CEO

Dear Contract Owners:
After an extended rebound in the financial markets, uncertainty returned in 2010 as investors began to question the durability of the recovery for global economies and markets. That uncertainty led to increased risk aversion, especially as investors saw the eurozone struggle with the debt woes of many of its members. In September, the U.S. Federal Reserve Board’s promises to further loosen monetary policy helped assuage market fears and drive asset prices off their recent lows. A combination of solid earnings and improving economic data gave an additional boost to investor sentiment. As we enter 2011, we are cautiously optimistic that economic growth will continue to improve and that the global economies will recover from the shocks of the past few years. We expect the pace of recovery worldwide will be uneven and volatile.
As always, we continue to be mindful of the many economic challenges faced at the local, national, and international levels. It is in times such as these that we want to remind investors of the merits of maintaining a long-term view, adhering to basic investing principles such as asset allocation and diversification, and working closely with their advisors to research and identify appropriate investment opportunities.
Respectfully,

Robert J. Manning
Chairman and Chief Executive Officer
MFS Investment Management®
February 14, 2011
The opinions expressed in this letter are subject to change, may not be relied upon for investment advice, and no forecasts can be guaranteed.
1
MFS New Discovery Portfolio
PORTFOLIO COMPOSITION
Portfolio structure
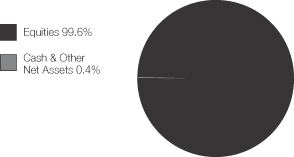
| | | | |
| Top ten holdings | | | | |
| Owens Corning | | | 1.8% | |
| FleetCor Technologies, Inc. | | | 1.8% | |
| Citi Trends, Inc. | | | 1.7% | |
| Brookdale Senior Living, Inc. | | | 1.7% | |
| Universal Forest Products, Inc. | | | 1.5% | |
| Dresser-Rand Group, Inc. | | | 1.5% | |
| Regal Beloit Corp. | | | 1.5% | |
| Forest Oil Corp. | | | 1.5% | |
| Stifel Financial Corp. | | | 1.4% | |
| Teradyne, Inc. | | | 1.4% | |
| | | | |
| Equity sectors | | | | |
| Technology | | | 28.4% | |
| Health Care | | | 17.1% | |
| Special Products & Services | | | 8.1% | |
| Financial Services | | | 7.3% | |
| Retailing | | | 7.1% | |
| Industrial Goods & Services | | | 6.2% | |
| Energy | | | 6.0% | |
| Leisure | | | 4.8% | |
| Autos & Housing | | | 4.8% | |
| Basic Materials | | | 4.6% | |
| Transportation | | | 3.3% | |
| Consumer Staples | | | 1.1% | |
| Utilities & Communications | | | 0.8% | |
Percentages are based on net assets as of 12/31/10.
The portfolio is actively managed and current holdings may be different.
2
MFS New Discovery Portfolio
MANAGEMENT REVIEW
Summary of Results
For the twelve months ended December 31, 2010, Initial Class shares of the MFS New Discovery Portfolio (the “fund”) provided a total return of 36.58%, while Service Class shares of the fund provided a total return of 36.21%. These compare with a return of 29.09% for the fund’s benchmark, the Russell 2000 Growth Index.
Market Environment
The first quarter of the reporting period witnessed a continuation of the financial market and macroeconomic rebounds that had begun in early 2009. These recoveries in global activity and asset valuations were generally synchronized around the world, led importantly by emerging Asian economies, but broadening to include most of the global economy to varying degrees. Primary drivers of the recoveries included an unwinding of the inventory destocking that took place earlier, the production of manufacturing and capital goods, as well as massive fiscal and monetary stimulus.
During most of the remainder of the period, heightened risk surrounding the public-debt profiles of several of the peripheral European countries impaired market sentiment. At the same time, the improving trend in global macroeconomic data began to weaken somewhat. These two dynamics caused many asset prices to retrench significantly, as many questioned the durability of the global recovery.
Towards the end of the period, the U.S. Federal Reserve led markets to believe that further monetary loosening would be forthcoming if macroeconomic activity did not show signs of improvement. The prospects for more easing by the Fed improved market sentiment and drove risk-asset prices markedly higher. However, in a text-book case of “buy the rumor, sell the fact,” the weeks following the early November announcement of further quantitative easing saw a sell-off in U.S. Treasury bonds. This rise in Treasury yields occurred despite risk-off behavior in equities and credit markets (which would normally result in Treasury yield compression), and appears to have been the result of a few factors: signs of improved U.S. and global economic activity; opposition to quantitative easing from some quarters; and crowded long positions in U.S. Treasuries. The December agreement on an expansionary U.S. fiscal package also boosted sentiment, leading markets to reach near-term highs in risky asset valuations toward year end.
Contributors to Performance
Security selection in the health care sector contributed to performance relative to the Russell 2000 Growth Index. The fund’s ownership in shares of strong-performing dialysis product manufacturer NxStage Medical and medical device company Dexcom boosted relative returns. Nxstage Medical reported increases in its revenue led by their critical and chronic care divisions. Management attributed the appreciation to increased patient density gaining traction in the market and the company’s focus on cost reduction.
Stock selection in the industrial goods & services sector also contributed to relative returns. Top relative contributors included holdings of industrial machinery manufacturer Bucyrus International (b)(h) and electrical components and equipment manufacturer Sensata Technologies (b) (Netherlands). Shares of Sensata appreciated following growth in key areas such as fuel sensors and its business in emerging markets. The company also increased their exposure in Asia and Europe through their acquisition of Honeywell’s automotive sensor business.
Favorable security selection in the basic materials sector was another positive factor for performance. Holdings of Australian mining company Iluka Resources Ltd. (b)(h) and diversified metals and mining company Molycorp Inc. (h) were top contributors.
Elsewhere, the fund’s holdings of network storage products company F5 Networks (b), digital products manufacturer ARM (b) (United Kingdom), and communications and data services provider Acme Packet (h) were all top relative contributors. The fund’s overweight position in shares of internet software and services provider Constant Contact was another positive factor.
During the reporting period, the fund’s currency exposure was a contributor to relative performance. All of MFS’ investment decisions are driven by the fundamentals of each individual opportunity and as such, it is common for our portfolios to have different currency exposure than the benchmark.
Detractors from Performance
Stock selection in the retailing sector detracted from the fund’s relative performance. Within this sector, urban fashion apparel retailer Citi Trends and computer and electronics retailer hhgregg were top relative detractors. Citi Trends’ shares came under pressure we believe as the company reported revenue that fell short of expectations. The company experienced weaker-than-expected revenue due to reductions in unemployment benefits which directly affected their core market.
In the transportation sector, security selection was a negative for relative returns. The fund’s ownership in shares of poor-performing marine ports and services operator Aegean Marine (b) (Greece) detracted from relative results.
3
MFS New Discovery Portfolio
Management Review – continued
Security selection in the energy sector also detracted from relative returns. Holdings of oil-focused exploration and production company Cobalt International Energy (b)(h) dampened returns as the stock underperformed the benchmark over the reporting period.
Elsewhere, health care equipment manufacturer Dynavox and semiconductor manufacturer Silicon Labs (b) weakened relative returns. The fund’s ownership in shares of health care equipment manufacturer Thoratec, healthcare technology provider Athenahealth (h), and managed health care facilitator IPC The Hospitalist also detracted from relative returns. The timing of our transactions in communications equipment provider Polycom (h) was another negative factor for performance as the fund missed some of the stock’s positive price gains during the reporting period.
Respectfully,
Thomas Wetherald
Portfolio Manager
| (b) | Security is not a benchmark constituent. |
| (h) | Security was not held in the portfolio at period end. |
The views expressed in this report are those of the portfolio manager only through the end of the period of the report as stated on the cover and do not necessarily reflect the views of MFS or any other person in the MFS organization. These views are subject to change at any time based on market or other conditions, and MFS disclaims any responsibility to update such views. These views may not be relied upon as investment advice or an indication of trading intent on behalf of any MFS portfolio. References to specific securities are not recommendations of such securities, and may not be representative of any MFS portfolio’s current or future investments.
4
MFS New Discovery Portfolio
PERFORMANCE SUMMARY THROUGH 12/31/10
The following chart illustrates the historical performance of the fund in comparison to its benchmark(s). Benchmarks are unmanaged and may not be invested in directly. Benchmark returns do not reflect any fees or expenses. The performance of other share classes will be greater than or less than that of the class depicted below. (See Notes to Performance Summary.)
Performance data shown represents past performance and is no guarantee of future results. Investment return and principal value fluctuate so your units, when sold, may be worth more or less than the original cost; current performance may be lower or higher than quoted. The performance shown does not reflect the deduction of taxes, if any, that a contract holder would pay on fund distributions or the redemption of contract units. The returns for the fund shown also do not reflect the deduction of expenses associated with variable products, such as mortality and expense risk charges, separate account charges, and sales charges imposed by the insurance company separate accounts. Such expenses would reduce the overall returns shown.
Growth of a Hypothetical $10,000 Investment
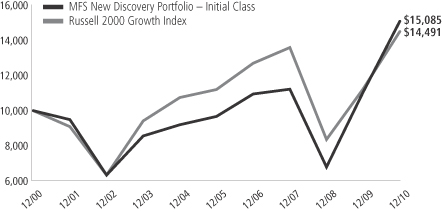
Total Returns through 12/31/10
Average annual total returns
| | | | | | | | | | | | | | |
| | | Share class | | Class inception date | | 1-yr | | 5-yr | | 10-yr | | Life (t) | | |
| | | Initial Class | | 5/06/98 | | 36.58% | | 9.32% | | 4.20% | | N/A | | |
| | | Service Class | | 8/24/01 | | 36.21% | | 9.04% | | N/A | | 5.41% | | |
| | | | | |
| Comparative benchmark | | | | | | | | | | |
| | | Russell 2000 Growth Index (f) | | 29.09% | | 5.30% | | 3.78% | | N/A | | |
| (f) | Source: FactSet Research Systems Inc. |
| (t) | For the period from the class inception date through the stated period end (for those share classes with less than 10 years of performance history). No comparative benchmark performance information is provided for “life” periods. (See Notes to Performance Summary.) |
Benchmark Definition
Russell 2000 Growth Index – constructed to provide a comprehensive barometer for growth securities in the small-cap segment of the U.S. equity universe. Companies in this index generally have higher price-to-book ratios and higher forecasted growth values.
It is not possible to invest directly in an index.
Notes to Performance Summary
Average annual total return represents the average annual change in value for each share class for the periods presented. Life returns are presented where the share class has less than 10 years of performance history and represent the average annual total return from the class inception date to the stated period end date. As the fund’s share classes may have different inception dates, the life returns may represent different time periods and may not be comparable. As a result, no comparative benchmark performance information is provided for life periods.
Performance results reflect any applicable expense subsidies and waivers in effect during the periods shown. Without such subsidies and waivers the fund’s performance results would be less favorable. Please see the prospectus and financial statements for complete details. All results are historical and assume the reinvestment of any dividends and capital gains distributions.
From time to time the fund may receive proceeds from litigation settlements, without which performance would be lower.
5
MFS New Discovery Portfolio
EXPENSE TABLE
Fund Expenses Borne by the Contract Holders During the Period,
July 1, 2010 through December 31, 2010
As a contract holder of the fund, you incur ongoing costs, including management fees; distribution and/or service (12b-1) fees; and other fund expenses. This example is intended to help you understand your ongoing costs (in dollars) of investing in the fund and to compare these costs with the ongoing costs of investing in other mutual funds.
The example is based on an investment of $1,000 invested at the beginning of the period and held for the entire period July 1, 2010 through December 31, 2010.
Actual Expenses
The first line for each share class in the following table provides information about actual account values and actual expenses. You may use the information in this line, together with the amount you invested, to estimate the expenses that you paid over the period. Simply divide your account value by $1,000 (for example, an $8,600 account value divided by $1,000 = 8.6), then multiply the result by the number in the first line under the heading entitled “Expenses Paid During Period” to estimate the expenses you paid on your account during this period.
Hypothetical Example for Comparison Purposes
The second line for each share class in the following table provides information about hypothetical account values and hypothetical expenses based on the fund’s actual expense ratio and an assumed rate of return of 5% per year before expenses, which is not the fund’s actual return. The hypothetical account values and expenses may not be used to estimate the actual ending account balance or expenses you paid for the period. You may use this information to compare the ongoing costs of investing in the fund and other funds. To do so, compare this 5% hypothetical example with the 5% hypothetical examples that appear in the shareholder reports of the other funds.
Please note that the expenses shown in the table are meant to highlight the fund’s ongoing costs only and do not take into account the fees and expenses imposed under the variable contracts through which your investment in the fund is made. Therefore, the second line for each share class in the table is useful in comparing ongoing costs associated with an investment in vehicles (such as the fund) which fund benefits under variable annuity and variable life insurance contracts and to qualified pension and retirement plans only, and will not help you determine the relative total costs of investing in the fund through variable annuity and variable life insurance contracts. If the fees and expenses imposed under the variable contracts were included, your costs would have been higher.
| | | | | | | | | | | | | | | | | | |
| Share Class | | | | Annualized
Expense Ratio | | | Beginning
Account Value
7/01/10 | | | Ending
Account Value
12/31/10 | | | Expenses Paid
During Period (p)
7/01/10-12/31/10 | |
| Initial Class | | Actual | | | 0.95% | | | | $1,000.00 | | | | $1,336.44 | | | | $5.59 | |
| | Hypothetical (h) | | | 0.95% | | | | $1,000.00 | | | | $1,020.42 | | | | $4.84 | |
| Service Class | | Actual | | | 1.20% | | | | $1,000.00 | | | | $1,334.07 | | | | $7.06 | |
| | Hypothetical (h) | | | 1.20% | | | | $1,000.00 | | | | $1,019.16 | | | | $6.11 | |
| (h) | 5% class return per year before expenses. |
| (p) | Expenses paid is equal to each class’ annualized expense ratio, as shown above, multiplied by the average account value over the period, multiplied by the number of days in the period, divided by the number of days in the year. |
6
MFS New Discovery Portfolio
PORTFOLIO OF INVESTMENTS – 12/31/10
The Portfolio of Investments is a complete list of all securities owned by your fund. It is categorized by broad-based asset classes.
| | | | | | | | |
| Issuer | | Shares/Par | | | Value ($) | |
| | | | | | | | |
| COMMON STOCKS – 99.6% | | | | | | | | |
| Apparel Manufacturers – 0.4% | | | | | | | | |
| Pandora A/S (a) | | | 9,190 | | | $ | 553,570 | |
| Stella International Holdings | | | 85,500 | | | | 170,498 | |
| | | | | | | | |
| | | | | | $ | 724,068 | |
| | | | | | | | |
| Biotechnology – 2.4% | | | | | | | | |
| Alimera Sciences, Inc. (a) | | | 23,520 | | | $ | 244,138 | |
| Anacor Pharmaceuticals, Inc. (a) | | | 124,140 | | | | 666,632 | |
| Gen-Probe, Inc. (a) | | | 43,230 | | | | 2,522,471 | |
| Human Genome Sciences, Inc. (a) | | | 15,270 | | | | 364,800 | |
| Pacific Biosciences of California, Inc. (a) | | | 49,530 | | | | 788,022 | |
| | | | | | | | |
| | | | | | $ | 4,586,063 | |
| | | | | | | | |
| Broadcasting – 0.7% | | | | | | | | |
| QuinStreet, Inc. (a) | | | 70,320 | | | $ | 1,350,847 | |
| | | | | | | | |
| Brokerage & Asset Managers – 1.4% | | | | | | | | |
| Stifel Financial Corp. (a) | | | 44,096 | | | $ | 2,735,716 | |
| | | | | | | | |
| Business Services – 5.7% | | | | | | | | |
| Concur Technologies, Inc. (a) | | | 37,030 | | | $ | 1,922,968 | |
| Constant Contact, Inc. (a) | | | 47,810 | | | | 1,481,632 | |
| CoStar Group, Inc. (a) | | | 12,030 | | | | 692,447 | |
| FleetCor Technologies, Inc. (a) | | | 113,650 | | | | 3,514,058 | |
| MSCI, Inc., “A” (a) | | | 38,820 | | | | 1,512,427 | |
| Ultimate Software Group, Inc. (a) | | | 10,340 | | | | 502,834 | |
| Verisk Analytics, Inc., “A” (a) | | | 42,230 | | | | 1,439,198 | |
| | | | | | | | |
| | | | | | $ | 11,065,564 | |
| | | | | | | | |
| Chemicals – 1.0% | | | | | | | | |
| Nalco Holding Co. | | | 58,440 | | | $ | 1,866,574 | |
| | | | | | | | |
| Computer Software – 7.6% | | | | | | | | |
| ANSYS, Inc. (a) | | | 27,320 | | | $ | 1,422,552 | |
| Ariba, Inc. (a) | | | 80,960 | | | | 1,901,750 | |
| Autonomy Corp. PLC (a) | | | 112,694 | | | | 2,644,302 | |
| Blackboard, Inc. (a) | | | 57,790 | | | | 2,386,727 | |
| CommVault Systems, Inc. (a) | | | 42,640 | | | | 1,220,357 | |
| Nuance Communications, Inc. (a) | | | 122,625 | | | | 2,229,323 | |
| SolarWinds, Inc. (a) | | | 87,550 | | | | 1,685,338 | |
| SuccessFactors, Inc. (a) | | | 46,580 | | | | 1,348,957 | |
| | | | | | | | |
| | | | | | $ | 14,839,306 | |
| | | | | | | | |
| Computer Software – Systems – 3.8% | | | | | | | | |
| IntraLinks Holdings, Inc. (a) | | | 88,660 | | | $ | 1,658,829 | |
| PROS Holdings, Inc. (a) | | | 118,800 | | | | 1,353,132 | |
| Qlik Technologies, Inc. (a) | | | 51,070 | | | | 1,318,117 | |
| SciQuest, Inc. (a) | | | 130,880 | | | | 1,702,749 | |
| Verifone Systems, Inc. (a) | | | 36,660 | | | | 1,413,610 | |
| | | | | | | | |
| | | | | | $ | 7,446,437 | |
| | | | | | | | |
| Construction – 4.8% | | | | | | | | |
| Beacon Roofing Supply, Inc. (a) | | | 53,080 | | | $ | 948,540 | |
| NVR, Inc. (a) | | | 3,950 | | | | 2,729,529 | |
| Owens Corning (a) | | | 114,560 | | | | 3,568,544 | |
| Pulte Homes, Inc. (a) | | | 269,810 | | | | 2,028,971 | |
| | | | | | | | |
| | | | | | $ | 9,275,584 | |
| | | | | | | | |
| | | | | | | | |
| Issuer | | Shares/Par | | | Value ($) | |
| | | | | | | | |
| COMMON STOCKS – continued | | | | | | | | |
| Consumer Services – 2.0% | | | | | | | | |
| Anhanguera Educacional Participacoes S.A. | | | 41,900 | | | $ | 1,009,639 | |
| Capella Education Co. (a) | | | 22,840 | | | | 1,520,687 | |
| Strayer Education, Inc. | | | 9,070 | | | | 1,380,635 | |
| | | | | | | | |
| | | | | | $ | 3,910,961 | |
| | | | | | | | |
| Electrical Equipment – 1.8% | | | | | | | | |
| Mettler-Toledo International, Inc. (a) | | | 7,670 | | | $ | 1,159,781 | |
| Sensata Technologies Holding B.V. (a) | | | 77,360 | | | | 2,329,310 | |
| | | | | | | | |
| | | | | | $ | 3,489,091 | |
| | | | | | | | |
| Electronics – 11.4% | | | | | | | | |
| Aeroflex Holding Corp. (a) | | | 67,980 | | | $ | 1,118,271 | |
| ARM Holdings PLC | | | 217,525 | | | | 1,435,593 | |
| DynaVox, Inc., “A” (a) | | | 155,130 | | | | 795,817 | |
| Fabrinet (a) | | | 95,700 | | | | 2,057,550 | |
| Hittite Microwave Corp. (a) | | | 29,640 | | | | 1,809,226 | |
| Inphi Corp. (a) | | | 79,270 | | | | 1,592,534 | |
| Lam Research Corp. (a) | | | 16,760 | | | | 867,833 | |
| Monolithic Power Systems, Inc. (a) | | | 148,580 | | | | 2,454,542 | |
| NetLogic Microsystems, Inc. (a) | | | 71,130 | | | | 2,234,193 | |
| PMC-Sierra, Inc. (a) | | | 234,520 | | | | 2,014,527 | |
| Silicon Laboratories, Inc. (a) | | | 42,420 | | | | 1,952,168 | |
| Stratasys, Inc. (a) | | | 35,740 | | | | 1,166,554 | |
| Teradyne, Inc. (a) | | | 194,540 | | | | 2,731,342 | |
| | | | | | | | |
| | | | | | $ | 22,230,150 | |
| | | | | | | | |
| Energy – Independent – 4.5% | | | | | | | | |
| Cabot Oil & Gas Corp. | | | 37,070 | | | $ | 1,403,100 | |
| Forest Oil Corp. (a) | | | 74,690 | | | | 2,835,979 | |
| Petrohawk Energy Corp. (a) | | | 139,490 | | | | 2,545,693 | |
| QEP Resources, Inc. | | | 54,470 | | | | 1,977,806 | |
| | | | | | | | |
| | | | | | $ | 8,762,578 | |
| | | | | | | | |
| Food & Beverages – 1.1% | | | | | | | | |
| Green Mountain Coffee Roasters, Inc. (a) | | | 66,240 | | | $ | 2,176,646 | |
| | | | | | | | |
| Forest & Paper Products – 1.5% | | | | | | | | |
| Universal Forest Products, Inc. | | | 77,050 | | | $ | 2,997,245 | |
| | | | | | | | |
| Gaming & Lodging – 1.6% | | | | | | | | |
| Morgans Hotel Group Co. (a) | | | 193,110 | | | $ | 1,751,508 | |
| WMS Industries, Inc. (a) | | | 28,330 | | | | 1,281,649 | |
| | | | | | | | |
| | | | | | $ | 3,033,157 | |
| | | | | | | | |
| Insurance – 1.3% | | | | | | | | |
| Brazil Insurance Participacoes e Administracao S.A. (a) | | | 2,200 | | | $ | 2,624,096 | |
| | | | | | | | |
| Internet – 2.7% | | | | | | | | |
| GSI Commerce, Inc. (a) | | | 84,990 | | | $ | 1,971,768 | |
| OpenTable, Inc. (a) | | | 7,460 | | | | 525,781 | |
| Shutterfly, Inc. (a) | | | 40,320 | | | | 1,412,410 | |
| TechTarget, Inc. (a) | | | 174,100 | | | | 1,380,613 | |
| | | | | | | | |
| | | | | | $ | 5,290,572 | |
| | | | | | | | |
7
MFS New Discovery Portfolio
Portfolio of Investments – continued
| | | | | | | | |
| Issuer | | Shares/Par | | | Value ($) | |
| | | | | | | | |
| COMMON STOCKS – continued | | | | | | | | |
| Leisure & Toys – 0.2% | | | | | | | | |
| Whistler Blackcomb Holdings, Inc. (a)(z) | | | 40,100 | | | $ | 490,008 | |
| | | | | | | | |
| Machinery & Tools – 4.4% | | | | | | | | |
| Douglas Dynamics, Inc. | | | 35,170 | | | $ | 532,826 | |
| Finning International, Inc. | | | 52,480 | | | | 1,429,833 | |
| Flowserve Corp. | | | 12,170 | | | | 1,450,907 | |
| Polypore International, Inc. (a) | | | 23,620 | | | | 962,043 | |
| Regal Beloit Corp. | | | 43,250 | | | | 2,887,370 | |
| WABCO Holdings, Inc. (a) | | | 22,640 | | | | 1,379,455 | |
| | | | | | | | |
| | | | | | $ | 8,642,434 | |
| | | | | | | | |
| Medical & Health Technology & Services – 8.3% | | | | | |
| Allscripts Healthcare Solutions, Inc. (a) | | | 115,420 | | | $ | 2,224,143 | |
| Amedisys, Inc. (a) | | | 51,970 | | | | 1,740,995 | |
| Brookdale Senior Living, Inc. (a) | | | 159,020 | | | | 3,404,618 | |
| Cerner Corp. (a) | | | 24,140 | | | | 2,287,024 | |
| DaVita, Inc. (a) | | | 19,890 | | | | 1,382,156 | |
| Gentiva Health Services, Inc. (a) | | | 83,060 | | | | 2,209,396 | |
| Healthcare Services Group, Inc. | | | 62,082 | | | | 1,010,074 | |
| IDEXX Laboratories, Inc. (a) | | | 19,436 | | | | 1,345,360 | |
| IPC The Hospitalist Co., Inc. (a) | | | 14,370 | | | | 560,574 | |
| | | | | | | | |
| | | | | | $ | 16,164,340 | |
| | | | | | | | |
| Medical Equipment – 6.0% | | | | | | | | |
| DexCom, Inc. (a) | | | 163,300 | | | $ | 2,229,045 | |
| Heartware International, Inc. (a) | | | 10,240 | | | | 896,717 | |
| Intuitive Surgical, Inc. (a) | | | 6,510 | | | | 1,677,953 | |
| Masimo Corp. | | | 52,050 | | | | 1,513,094 | |
| NxStage Medical, Inc. (a) | | | 64,800 | | | | 1,612,224 | |
| Thoratec Corp. (a) | | | 66,780 | | | | 1,891,210 | |
| Volcano Corp. (a) | | | 31,150 | | | | 850,707 | |
| Zoll Medical Corp. (a) | | | 26,100 | | | | 971,703 | |
| | | | | | | | |
| | | | | | $ | 11,642,653 | |
| | | | | | | | |
| Metals & Mining – 0.5% | | | | | | | | |
| Globe Specialty Metals, Inc. | | | 53,870 | | | $ | 920,638 | |
| | | | | | | | |
| Network & Telecom – 2.9% | | | | | | | | |
| Ciena Corp. (a) | | | 84,710 | | | $ | 1,783,146 | |
| F5 Networks, Inc. (a) | | | 10,100 | | | | 1,314,616 | |
| Fortinet, Inc. (a) | | | 41,740 | | | | 1,350,289 | |
| Riverbed Technology, Inc. (a) | | | 34,540 | | | | 1,214,772 | |
| | | | | | | | |
| | | | | | $ | 5,662,823 | |
| | | | | | | | |
| Oil Services – 1.5% | | | | | | | | |
| Dresser-Rand Group, Inc. (a) | | | 68,930 | | | $ | 2,935,729 | |
| | | | | | | | |
| Other Banks & Diversified Financials – 3.8% | | | | | |
| Cathay General Bancorp, Inc. | | | 76,140 | | | $ | 1,271,529 | |
| First Interstate BancSystem, Inc. | | | 81,530 | | | | 1,242,517 | |
| Metro Bancorp, Inc. (a) | | | 115,310 | | | | 1,269,563 | |
| PacWest Bancorp | | | 58,510 | | | | 1,250,944 | |
| Sterling Bancshares, Inc. | | | 147,230 | | | | 1,033,555 | |
| TCF Financial Corp. | | | 92,810 | | | | 1,374,516 | |
| | | | | | | | |
| | | | | | $ | 7,442,624 | |
| | | | | | | | |
| Pharmaceuticals – 0.4% | | | | | | | | |
| Auxilium Pharmaceuticals, Inc. (a) | | | 38,640 | | | $ | 815,304 | |
| | | | | | | | |
| | | | | | | | |
| Issuer | | Shares/Par | | | Value ($) | |
| | | | | | | | |
| COMMON STOCKS – continued | | | | | | | | |
| Precious Metals & Minerals – 0.8% | | | | | | | | |
| Stillwater Mining Co. (a) | | | 77,720 | | | $ | 1,659,322 | |
| | | | | | | | |
| Railroad & Shipping – 2.2% | | | | | | | | |
| Aegean Marine Petroleum Network, Inc. | | | 218,900 | | | $ | 2,283,127 | |
| Kansas City Southern Co. (a) | | | 41,010 | | | | 1,962,739 | |
| | | | | | | | |
| | | | | | $ | 4,245,866 | |
| | | | | | | | |
| Real Estate – 0.8% | | | | | | | | |
| Chesapeake Lodging Trust, REIT | | | 39,280 | | | $ | 738,857 | |
| Pebblebrook Hotel Trust, REIT | | | 41,510 | | | | 843,483 | |
| | | | | | | | |
| | | | | | $ | 1,582,340 | |
| | | | | | | | |
| Restaurants – 2.3% | | | | | | | | |
| P.F. Chang’s China Bistro, Inc. | | | 51,720 | | | $ | 2,506,351 | |
| Peet’s Coffee & Tea, Inc. (a) | | | 22,860 | | | | 954,176 | |
| Red Robin Gourmet Burgers, Inc. (a) | | | 48,180 | | | | 1,034,425 | |
| | | | | | | | |
| | | | | | $ | 4,494,952 | |
| | | | | | | | |
| Special Products & Services – 0.4% | | | | | | | | |
| PICO Holdings, Inc. (a) | | | 25,180 | | | $ | 800,724 | |
| | | | | | | | |
| Specialty Chemicals – 0.8% | | | | | | | | |
| Rockwood Holdings, Inc. (a) | | | 38,020 | | | $ | 1,487,342 | |
| | | | | | | | |
| Specialty Stores – 6.7% | | | | | | | | |
| Blue Nile, Inc. (a) | | | 33,080 | | | $ | 1,887,545 | |
| Citi Trends, Inc. (a) | | | 138,930 | | | | 3,410,732 | |
| hhgregg, Inc. (a) | | | 123,500 | | | | 2,587,325 | |
| Monro Muffler Brake, Inc. | | | 38,440 | | | | 1,329,640 | |
| Rue21, Inc. (a) | | | 45,340 | | | | 1,328,915 | |
| Urban Outfitters, Inc. (a) | | | 72,960 | | | | 2,612,698 | |
| | | | | | | | |
| | | | | | $ | 13,156,855 | |
| | | | | | | | |
| Telecommunications – Wireless – 0.8% | | | | | | | | |
| SBA Communications Corp. (a) | | | 37,180 | | | $ | 1,522,149 | |
| | | | | | | | |
| Trucking – 1.1% | | | | | | | | |
| Swift Transportation Co. (a) | | | 175,000 | | | $ | 2,189,250 | |
| | | | | | | | |
Total Common Stocks
(Identified Cost, $176,913,835) | | | | | | $ | 194,260,008 | |
| | | | | | | | |
| | | | | | | | | | | | | | | | |
| | | Strike
Price | | | First
Exercise | | | | | | | |
| | | | | | | | | | | | | | | | |
| WARRANTS – 0.0% | | | | | | | | | | | | | | | | |
| Alcoholic Beverages – 0.0% | | | | | | | | | | | | | |
| Castle Brands, Inc. (1 share for 1 warrant) (Identified Cost, $70,840) (a)(z) | | $ | 6.57 | | | | 5/08/07 | | | | 50,440 | | | $ | 5 | |
| | | | | | | | | | | | | | | | |
| MONEY MARKET FUNDS (v) – 0.2% | | | | | | | | | |
| MFS Institutional Money Market Portfolio, 0.18%, at Cost and Net Asset Value | | | | 334,228 | | | $ | 334,228 | |
| | | | | | | | | | | | | | | | |
Total Investments
(Identified Cost, $177,318,903) | | | | | | | $ | 194,594,241 | |
| | | | | | | | | | | | | | | | |
OTHER ASSETS, LESS
LIABILITIES – 0.2% | | | | | | | | | | | | 425,979 | |
| | | | | | | | | | | | | | | | |
| Net Assets – 100.0% | | | | | | | | | | | | | | $ | 195,020,220 | |
| | | | | | | | | | | | | | | | |
8
MFS New Discovery Portfolio
Portfolio of Investments – continued
| (a) | | Non-income producing security. |
| (v) | | Underlying fund that is available only to investment companies managed by MFS. The rate quoted is the annualized seven-day yield of the fund at period end. |
| (z) | | Restricted securities are not registered under the Securities Act of 1933 and are subject to legal restrictions on resale. These securities generally may be resold in transactions exempt from registration or to the public if the securities are subsequently registered. Disposal of these securities may involve time-consuming negotiations and prompt sale at an acceptable price may be difficult. The fund holds the following restricted securities: |
| | | | | | | | | | |
| Restricted Securities | | Acquisition
Date | | Cost | | | Value | |
| Castle Brands, Inc. (Warrant) | | 4/18/07 | | | $70,840 | | | | $5 | |
| Whistler Blackcomb Holdings, Inc. | | 11/02/10 | | | 476,648 | | | | 490,008 | |
| Total Restricted Securities | | | | | | | | | $490,013 | |
| % of Net Assets | | | | | | | | | 0.3% | |
The following abbreviations are used in this report and are defined:
| PLC | | Public Limited Company |
| REIT | | Real Estate Investment Trust |
See Notes to Financial Statements
9
MFS New Discovery Portfolio
FINANCIAL STATEMENTS | STATEMENT OF ASSETS AND LIABILITIES
This statement represents your fund’s balance sheet, which details the assets and liabilities comprising the total value of the fund.
| | | | | | | | |
At 12/31/10 | | | | | | | | |
Assets | | | | | | | | |
Investments – | | | | | | | | |
Non-affiliated issuers, at value (identified cost, $176,984,675) | | | $194,260,013 | | | | | |
Underlying funds, at cost and value | | | 334,228 | | | | | |
Total investments, at value (identified cost, $177,318,903) | | | $194,594,241 | | | | | |
Cash | | | 48 | | | | | |
Foreign currency, at value (identified cost, $48) | | | 48 | | | | | |
Receivables for | | | | | | | | |
Investments sold | | | 2,670,659 | | | | | |
Fund shares sold | | | 26,669 | | | | | |
Dividends | | | 35,034 | | | | | |
Receivable from investment adviser | | | 40,270 | | | | | |
Other assets | | | 6,046 | | | | | |
Total assets | | | | | | | $197,373,015 | |
Liabilities | | | | | | | | |
Payables for | | | | | | | | |
Investments purchased | | | $2,046,724 | | | | | |
Fund shares reacquired | | | 186,184 | | | | | |
Payable to affiliates | | | | | | | | |
Investment adviser | | | 9,667 | | | | | |
Distribution and/or service fees | | | 1,476 | | | | | |
Administrative services fee | | | 388 | | | | | |
Payable for Trustees’ compensation | | | 197 | | | | | |
Accrued expenses and other liabilities | | | 108,159 | | | | | |
Total liabilities | | | | | | | $2,352,795 | |
Net assets | | | | | | | $195,020,220 | |
Net assets consist of | | | | | | | | |
Paid-in capital | | | $163,461,475 | | | | | |
Unrealized appreciation (depreciation) on investments and translation of assets and liabilities in foreign currencies | | | 17,275,297 | | | | | |
Accumulated net realized gain (loss) on investments and foreign currency transactions | | | 14,283,448 | | | | | |
Net assets | | | | | | | $195,020,220 | |
Shares of beneficial interest outstanding | | | | | | | 10,624,295 | |
| | | | | | | | | | | | |
| | | Net assets | | | Shares
outstanding | | | Net asset value
per share | |
Initial Class | | | $87,805,817 | | | | 4,712,249 | | | | $18.63 | |
Service Class | | | 107,214,403 | | | | 5,912,046 | | | | 18.13 | |
See Notes to Financial Statements
10
MFS New Discovery Portfolio
FINANCIAL STATEMENTS | STATEMENT OF OPERATIONS
This statement describes how much your fund earned in investment income and accrued in expenses. It also describes any gains and/or losses generated by fund operations.
| | | | | | | | |
| Year ended 12/31/10 | | | | | | | | |
| Net investment loss | | | | | | | | |
Income | | | | | | | | |
Dividends | | | $854,445 | | | | | |
Interest | | | 28,867 | | | | | |
Dividends from underlying funds | | | 1,347 | | | | | |
Foreign taxes withheld | | | (4,208 | ) | | | | |
Total investment income | | | | | | | $880,451 | |
Expenses | | | | | | | | |
Management fee | | | $1,684,875 | | | | | |
Distribution and/or service fees | | | 269,728 | | | | | |
Administrative services fee | | | 67,611 | | | | | |
Trustees’ compensation | | | 25,695 | | | | | |
Custodian fee | | | 141,530 | | | | | |
Shareholder communications | | | 25,229 | | | | | |
Auditing fees | | | 71,655 | | | | | |
Legal fees | | | 7,199 | | | | | |
Miscellaneous | | | 22,968 | | | | | |
Total expenses | | | | | | | $2,316,490 | |
Fees paid indirectly | | | (24 | ) | | | | |
Reduction of expenses by investment adviser | | | (266,086 | ) | | | | |
Net expenses | | | | | | | $2,050,380 | |
Net investment loss | | | | | | | $(1,169,929 | ) |
Realized and unrealized gain (loss) on investments and foreign currency transactions | | | | | | | | |
Realized gain (loss) (identified cost basis) | | | | | | | | |
Investment transactions (net of $160,872 country tax) | | | $60,306,337 | | | | | |
Foreign currency transactions | | | (83,717 | ) | | | | |
Net realized gain (loss) on investments and foreign currency transactions | | | | | | | $60,222,620 | |
Change in unrealized appreciation (depreciation) | | | | | | | | |
Investments (net of $86,227 decrease in deferred country tax) | | | $62,322 | | | | | |
Translation of assets and liabilities in foreign currencies | | | (168 | ) | | | | |
Net unrealized gain (loss) on investments and foreign currency translation | | | | | | | $62,154 | |
Net realized and unrealized gain (loss) on investments and foreign currency | | | | | | | $60,284,774 | |
Change in net assets from operations | | | | | | | $59,114,845 | |
See Notes to Financial Statements
11
MFS New Discovery Portfolio
FINANCIAL STATEMENTS | STATEMENTS OF CHANGES IN NET ASSETS
These statements describe the increases and/or decreases in net assets resulting from operations, any distributions, and any shareholder transactions.
| | | | | | | | |
For years ended 12/31 | | | 2010 | | | | 2009 | |
Change in net assets | | | | | | | | |
From operations | | | | | | | | |
Net investment loss | | | $(1,169,929 | ) | | | $(1,119,458 | ) |
Net realized gain (loss) on investments and foreign currency transactions | | | 60,222,620 | | | | 26,984,792 | |
Net unrealized gain (loss) on investments and foreign currency translation | | | 62,154 | | | | 61,407,576 | |
Change in net assets from operations | | | $59,114,845 | | | | $87,272,910 | |
Change in net assets from fund share transactions | | | $(58,230,686 | ) | | | $(57,934,600 | ) |
Total change in net assets | | | $884,159 | | | | $29,338,310 | |
Net assets | | | | | | | | |
At beginning of period | | | 194,136,061 | | | | 164,797,751 | |
At end of period | | | $195,020,220 | | | | $194,136,061 | |
See Notes to Financial Statements
12
MFS New Discovery Portfolio
FINANCIAL STATEMENTS | FINANCIAL HIGHLIGHTS
The financial highlights table is intended to help you understand the fund’s financial performance for the past 5 years. Certain information reflects financial results for a single fund share. The total returns in the table represent the rate by which an investor would have earned (or lost) on an investment in the fund share class (assuming reinvestment of all distributions) held for the entire period.
| | | | | | | | | | | | | | | | | | | | |
| Initial Class | | Years ended 12/31 | |
| | | 2010 | | | 2009 | | | 2008 | | | 2007 | | | 2006 | |
Net asset value, beginning of period | | | $13.64 | | | | $8.37 | | | | $16.24 | | | | $16.24 | | | | $14.35 | |
| Income (loss) from investment operations | | | | | | | | | | | | | | | | | | | | |
Net investment loss (d) | | | $(0.07 | ) | | | $(0.05 | ) | | | $(0.04 | ) | | | $(0.08 | ) | | | $(0.09 | ) |
Net realized and unrealized gain (loss) on investments
and foreign currency | | | 5.06 | | | | 5.32 | | | | (5.42 | ) | | | 0.52 | | | | 1.98 | |
Total from investment operations | | | $4.99 | | | | $5.27 | | | | $(5.46 | ) | | | $0.44 | | | | $1.89 | |
| Less distributions declared to shareholders | | | | | | | | | | | | | | | | | | | | |
From net realized gain on investments | | | $— | | | | $— | | | | $(2.41 | ) | | | $(0.44 | ) | | | $— | |
Net asset value, end of period | | | $18.63 | | | | $13.64 | | | | $8.37 | | | | $16.24 | | | | $16.24 | |
Total return (%) (k)(r)(s) | | | 36.58 | | | | 62.96 | | | | (39.57 | ) | | | 2.56 | | | | 13.17 | |
Ratios (%) (to average net assets)
and Supplemental data: | | | | | | | | | | | | | | | | | | | | |
Expenses before expense reductions (f) | | | 1.09 | | | | 1.05 | | | | 1.02 | | | | 1.00 | | | | 1.00 | |
Expenses after expense reductions (f) | | | 0.95 | | | | 0.95 | | | | 0.95 | | | | 0.95 | | | | 0.98 | |
Net investment loss | | | (0.48 | ) | | | (0.49 | ) | | | (0.28 | ) | | | (0.45 | ) | | | (0.60 | ) |
Portfolio turnover | | | 192 | | | | 153 | | | | 127 | | | | 95 | | | | 107 | |
Net assets at end of period (000 omitted) | | | $87,806 | | | | $78,620 | | | | $59,861 | | | | $130,029 | | | | $163,825 | |
| |
| Service Class | | Years ended 12/31 | |
| | | 2010 | | | 2009 | | | 2008 | | | 2007 | | | 2006 | |
Net asset value, beginning of period | | | $13.31 | | | | $8.18 | | | | $15.97 | | | | $16.02 | | | | $14.19 | |
| Income (loss) from investment operations | | | | | | | | | | | | | | | | | | | | |
Net investment loss (d) | | | $(0.11 | ) | | | $(0.07 | ) | | | $(0.07 | ) | | | $(0.12 | ) | | | $(0.13 | ) |
Net realized and unrealized gain (loss) on investments
and foreign currency | | | 4.93 | | | | 5.20 | | | | (5.31 | ) | | | 0.51 | | | | 1.96 | |
Total from investment operations | | | $4.82 | | | | $5.13 | | | | $(5.38 | ) | | | $0.39 | | | | $1.83 | |
| Less distributions declared to shareholders | | | | | | | | | | | | | | | | | | | | |
From net realized gain on investments | | | $— | | | | $— | | | | $(2.41 | ) | | | $(0.44 | ) | | | $— | |
Net asset value, end of period | | | $18.13 | | | | $13.31 | | | | $8.18 | | | | $15.97 | | | | $16.02 | |
Total return (%) (k)(r)(s) | | | 36.21 | | | | 62.71 | | | | (39.76 | ) | | | 2.28 | | | | 12.90 | |
Ratios (%) (to average net assets)
and Supplemental data: | | | | | | | | | | | | | | | | | | | | |
Expenses before expense reductions (f) | | | 1.34 | | | | 1.30 | | | | 1.27 | | | | 1.25 | | | | 1.26 | |
Expenses after expense reductions (f) | | | 1.20 | | | | 1.20 | | | | 1.20 | | | | 1.20 | | | | 1.23 | |
Net investment loss | | | (0.73 | ) | | | (0.74 | ) | | | (0.54 | ) | | | (0.70 | ) | | | (0.84 | ) |
Portfolio turnover | | | 192 | | | | 153 | | | | 127 | | | | 95 | | | | 107 | |
Net assets at end of period (000 omitted) | | | $107,214 | | | | $115,516 | | | | $104,937 | | | | $186,516 | | | | $181,468 | |
| (d) | Per share data is based on average shares outstanding. |
| (f) | Ratios do not reflect reductions from fees paid indirectly, if applicable. |
| (k) | The total return does not reflect expenses that apply to separate accounts. Inclusion of these charges would reduce the total return figures for all periods shown. |
| (r) | Certain expenses have been reduced without which performance would have been lower. |
| (s) | From time to time the fund may receive proceeds from litigation settlements, without which performance would be lower. |
See Notes to Financial Statements
13
MFS New Discovery Portfolio
NOTES TO FINANCIAL STATEMENTS
| (1) | | Business and Organization |
MFS New Discovery Portfolio (the fund) is a series of MFS Variable Insurance Trust II (the trust). The trust is organized as a Massachusetts business trust and is registered under the Investment Company Act of 1940, as amended, as an open-end management investment company. The shareholders of each series of the trust are separate accounts of insurance companies, which offer variable annuity and/or life insurance products, and qualified retirement and pension plans.
| (2) | | Significant Accounting Policies |
General – The preparation of financial statements in conformity with U.S. generally accepted accounting principles requires management to make estimates and assumptions that affect the reported amounts of assets and liabilities, and disclosure of contingent assets and liabilities at the date of the financial statements and the reported amounts of revenues and expenses during the reporting period. Actual results could differ from those estimates. In the preparation of these financial statements, management has evaluated subsequent events occurring after the date of the fund’s Statement of Assets and Liabilities through the date that the financial statements were issued. The fund invests in foreign securities, including securities of emerging market issuers. Investments in foreign securities are vulnerable to the effects of changes in the relative values of the local currency and the U.S. dollar and to the effects of changes in each country’s legal, political, and economic environment. The markets of emerging markets countries are generally more volatile than the markets of developed countries with more mature economies. All of the risks of investing in foreign securities previously described are heightened when investing in emerging markets countries.
Investment Valuations – Equity securities, including restricted equity securities, are generally valued at the last sale or official closing price as provided by a third-party pricing service on the market or exchange on which they are primarily traded. Equity securities, for which there were no sales reported that day, are generally valued at the last quoted daily bid quotation as provided by a third-party pricing service on the market or exchange on which such securities are primarily traded. Equity securities held short, for which there were no sales reported for that day, are generally valued at the last quoted daily ask quotation as provided by a third-party pricing service on the market or exchange on which such securities are primarily traded. Short-term instruments with a maturity at issuance of 60 days or less generally are valued at amortized cost, which approximates market value. Open-end investment companies are generally valued at net asset value per share. Securities and other assets generally valued on the basis of information from a third-party pricing service may also be valued at a broker/dealer bid quotation. Values obtained from third-party pricing services can utilize both transaction data and market information such as yield, quality, coupon rate, maturity, type of issue, trading characteristics, and other market data. The values of foreign securities and other assets and liabilities expressed in foreign currencies are converted to U.S. dollars using the mean of bid and asked prices for rates provided by a third-party pricing service.
The Board of Trustees has delegated primary responsibility for determining or causing to be determined the value of the fund’s investments (including any fair valuation) to the adviser pursuant to valuation policies and procedures approved by the Board. If the adviser determines that reliable market quotations are not readily available, investments are valued at fair value as determined in good faith by the adviser in accordance with such procedures under the oversight of the Board of Trustees. Under the fund’s valuation policies and procedures, market quotations are not considered to be readily available for most types of debt instruments and floating rate loans and many types of derivatives. These investments are generally valued at fair value based on information from third-party pricing services. In addition, investments may be valued at fair value if the adviser determines that an investment’s value has been materially effected by events occurring after the close of the exchange or market on which the investment is principally traded (such as foreign exchange or market) and prior to the determination of the fund’s net asset value, or after the halting of trading of a specific security where trading does not resume prior to the close of the exchange or market on which the security is principally traded. Events that occur on a frequent basis after foreign markets close (such as developments in foreign markets and significant movements in the U.S. markets) and prior to the determination of the fund’s net asset value may be deemed to have a material effect on the value of securities traded in foreign markets. Accordingly, the fund’s foreign equity securities may often be valued at fair value. The adviser generally relies on third-party pricing services or other information (such as the correlation with price movements of similar securities in the same or other markets; the type, cost and investment characteristics of the security; the business and financial condition of the issuer; and trading and other market data) to assist in determining whether to fair value and at what value to fair value an investment. The value of an investment for purposes of calculating the fund’s net asset value can differ depending on the source and method used to determine value. When fair valuation is used, the value of an investment used to determine the fund’s net asset value may differ from quoted or published prices for the same investment. There can be no assurance that the fund could obtain the fair value assigned to an investment if it were to sell the investment at the same time at which the fund determines its net asset value per share.
14
MFS New Discovery Portfolio
Notes to Financial Statements – continued
Various inputs are used in determining the value of the fund’s assets or liabilities. These inputs are categorized into three broad levels. In certain cases, the inputs used to measure fair value may fall into different levels of the fair value hierarchy. In such cases, an investment’s level within the fair value hierarchy is based on the lowest level of input that is significant to the fair value measurement. The fund’s assessment of the significance of a particular input to the fair value measurement in its entirety requires judgment, and considers factors specific to the investment. Level 1 includes unadjusted quoted prices in active markets for identical assets or liabilities. Level 2 includes other significant observable market-based inputs (including quoted prices for similar securities, interest rates, prepayment speed, and credit risk). Level 3 includes unobservable inputs, which may include the adviser’s own assumptions in determining the fair value of investments. The following is a summary of the levels used as of December 31, 2010 in valuing the fund’s assets or liabilities:
| | | | | | | | | | | | | | | | |
| Investments at Value | | Level 1 | | | Level 2 | | | Level 3 | | | Total | |
| Equity Securities: | | | | | | | | | | | | | | | | |
United States | | | $180,722,625 | | | | $5 | | | | $— | | | | $180,722,630 | |
United Kingdom | | | 4,079,895 | | | | — | | | | — | | | | 4,079,895 | |
Brazil | | | 3,633,735 | | | | — | | | | — | | | | 3,633,735 | |
Greece | | | 2,283,127 | | | | — | | | | — | | | | 2,283,127 | |
Canada | | | 1,429,833 | | | | 490,008 | | | | — | | | | 1,919,841 | |
Australia | | | 896,717 | | | | — | | | | — | | | | 896,717 | |
Denmark | | | 553,570 | | | | — | | | | — | | | | 553,570 | |
Hong Kong | | | 170,498 | | | | — | | | | — | | | | 170,498 | |
| Mutual Funds | | | 334,228 | | | | — | | | | — | | | | 334,228 | |
| Total Investments | | | $194,104,228 | | | | $490,013 | | | | $— | | | | $194,594,241 | |
For further information regarding security characteristics, see the Portfolio of Investments.
Foreign Currency Translation – Purchases and sales of foreign investments, income, and expenses are converted into U.S. dollars based upon currency exchange rates prevailing on the respective dates of such transactions or on the reporting date for foreign denominated receivables and payables. Gains and losses attributable to foreign currency exchange rates on sales of securities are recorded for financial statement purposes as net realized gains and losses on investments. Gains and losses attributable to foreign exchange rate movements on receivables, payables, income and expenses are recorded for financial statement purposes as foreign currency transaction gains and losses. That portion of both realized and unrealized gains and losses on investments that results from fluctuations in foreign currency exchange rates is not separately disclosed.
Security Loans – State Street Bank and Trust Company (“State Street”), as lending agent, loans the securities of the fund to certain qualified institutions (the “Borrowers”) approved by the fund. The loans are collateralized by cash and/or U.S. Treasury and federal agency obligations in an amount typically at least equal to the market value of the securities loaned. The market value of the loaned securities is determined at the close of business of the fund and any additional required collateral is delivered to the fund on the next business day. State Street provides the fund with indemnification against Borrower default. The fund bears the risk of loss with respect to the investment of cash collateral. On loans collateralized by cash, the cash collateral is invested in a money market fund or short-term securities. A portion of the income generated upon investment of the collateral is remitted to the Borrowers, and the remainder is allocated between the fund and the lending agent. On loans collateralized by U.S. Treasury and/or federal agency obligations, a fee is received from the Borrower, and is allocated between the fund and the lending agent. Income from securities lending is included in interest income on the Statement of Operations. The dividend and interest income earned on the securities loaned is accounted for in the same manner as other dividend and interest income.
Indemnifications – Under the fund’s organizational documents, its officers and Trustees may be indemnified against certain liabilities and expenses arising out of the performance of their duties to the fund. Additionally, in the normal course of business, the fund enters into agreements with service providers that may contain indemnification clauses. The fund’s maximum exposure under these agreements is unknown as this would involve future claims that may be made against the fund that have not yet occurred.
Investment Transactions and Income – Investment transactions are recorded on the trade date. Interest income is recorded on the accrual basis. Dividends received in cash are recorded on the ex-dividend date. Certain dividends from foreign securities will be recorded when the fund is informed of the dividend if such information is obtained subsequent to the ex-dividend date. Dividend and interest payments received in additional securities are recorded on the ex-dividend or ex-interest date in an amount equal to the value of the security on such date.
15
MFS New Discovery Portfolio
Notes to Financial Statements – continued
The fund may receive proceeds from litigation settlements. Any proceeds received from litigation involving portfolio holdings are reflected in the Statement of Operations in realized gain/loss if the security has been disposed of by the fund or in unrealized gain/loss if the security is still held by the fund. Any other proceeds from litigation not related to portfolio holdings are reflected as other income in the Statement of Operations.
Fees Paid Indirectly – The fund’s custody fee may be reduced according to an arrangement that measures the value of cash deposited with the custodian by the fund. This amount, for the year ended December 31, 2010, is shown as a reduction of total expenses on the Statement of Operations.
Tax Matters and Distributions – The fund intends to qualify as a regulated investment company, as defined under Subchapter M of the Internal Revenue Code, and to distribute all of its taxable income, including realized capital gains. As a result, no provision for federal income tax is required. The fund’s federal tax returns for the prior three fiscal years remain subject to examination by the Internal Revenue Service. Foreign taxes, if any, have been accrued by the fund in the accompanying financial statements.
Distributions to shareholders are recorded on the ex-dividend date. Income and capital gain distributions are determined in accordance with income tax regulations, which may differ from U.S. generally accepted accounting principles. Certain capital accounts in the financial statements are periodically adjusted for permanent differences in order to reflect their tax character. These adjustments have no impact on net assets or net asset value per share. Temporary differences which arise from recognizing certain items of income, expense, gain or loss in different periods for financial statement and tax purposes will reverse at some time in the future. Distributions in excess of net investment income or net realized gains are temporary overdistributions for financial statement purposes resulting from differences in the recognition or classification of income or distributions for financial statement and tax purposes.
Book/tax differences primarily relate to wash sale loss deferrals.
The fund declared no distributions for the years ended December 31, 2010 and December 31, 2009.
The federal tax cost and the tax basis components of distributable earnings were as follows:
| | | | |
| As of 12/31/10 | | | | |
| Cost of investments | | | $177,546,134 | |
| Gross appreciation | | | 23,554,204 | |
| Gross depreciation | | | (6,506,097 | ) |
| Net unrealized appreciation (depreciation) | | | $17,048,107 | |
| Undistributed ordinary income | | | 10,183,223 | |
| Undistributed long-term capital gain | | | 4,327,456 | |
| Other temporary differences | | | (41 | ) |
Multiple Classes of Shares of Beneficial Interest – The fund offers multiple classes of shares, which differ in their respective distribution and/or service fees. The fund’s income, realized and unrealized gain (loss), and common expenses are allocated to shareholders based on the daily net assets of each class. Dividends are declared separately for each class. Differences in per share dividend rates are generally due to differences in separate class expenses.
| (3) | | Transactions with Affiliates |
Investment Adviser – The fund has an investment advisory agreement with MFS to provide overall investment management and related administrative services and facilities to the fund. The management fee is computed daily and paid monthly at the following annual rates:
| | | | |
| First $1 billion of average daily net assets | | | 0.90% | |
| Average daily net assets in excess of $1 billion | | | 0.80% | |
The investment adviser has agreed in writing to reduce its management fee to 0.75% of average daily net assets in excess of $2.5 billion. This written agreement will continue until modified or rescinded by the fund’s Board of Trustees, but such agreement will continue at least until April 30, 2012. For the year ended December 31, 2010, the fund’s average daily net assets did not exceed $2.5 billion and therefore, the management fee was not reduced. The management fee incurred for the year ended December 31, 2010 was equivalent to an annual effective rate of 0.90% of the fund’s average daily net assets.
The investment adviser has agreed in writing to pay a portion of the fund’s total annual operating expenses, exclusive of interest, taxes, extraordinary expenses, brokerage and transaction costs, and investment-related expenses, such that total annual operating expenses do not exceed 0.95% of average daily net assets for the Initial Class shares and 1.20% of average daily net
16
MFS New Discovery Portfolio
Notes to Financial Statements – continued
assets for the Service Class shares. This written agreement will continue until April 30, 2012. For the year ended December 31, 2010, this reduction amounted to $266,086 and is reflected as a reduction of total expenses in the Statement of Operations.
Distributor – MFS Fund Distributors, Inc. (MFD), a wholly-owned subsidiary of MFS, is the distributor of shares of the fund. The Trustees have adopted a distribution plan for the Service Class shares pursuant to Rule 12b-1 under the Investment Company Act of 1940.
The fund’s distribution plan provides that the fund will pay MFD distribution and/or service fees equal to 0.25% per annum of its average daily net assets attributable to Service Class shares as partial consideration for services performed and expenses incurred by MFD and financial intermediaries (including participating insurance companies that invest in the fund to fund variable annuity and variable life insurance contracts, sponsors of qualified retirement and pension plans that invest in the fund, and affiliates of these participating insurance companies and plan sponsors) in connection with the sale and distribution of the Service Class shares. MFD may subsequently pay all, or a portion, of the distribution and/or service fees to financial intermediaries.
Shareholder Servicing Agent – MFS Service Center, Inc. (MFSC), a wholly-owned subsidiary of MFS, has contracted to provide transfer agent and recordkeeping functions in connection with the issuance, transfer, and redemption of each class of shares of the fund under a Shareholder Servicing Agent Agreement. During the year ended December 31, 2010, the fund did not pay MFSC a fee for this service.
Administrator – MFS provides certain financial, legal, shareholder communications, compliance, and other administrative services to the fund. Under an administrative services agreement, the fund partially reimburses MFS the costs incurred to provide these services. The fund is charged an annual fixed amount of $10,000 plus a fee based on average daily net assets. The administrative services fee incurred for the year ended December 31, 2010 was equivalent to an annual effective rate of 0.0361% of the fund’s average daily net assets.
Trustees’ and Officers’ Compensation – The fund pays compensation to Trustees in the form of a retainer, attendance fees, and additional compensation to the Board chairperson. The fund does not pay compensation directly to officers of the fund who are also officers of the investment adviser, all of whom receive remuneration for their services to the fund from MFS. Certain officers of the fund are officers or directors of MFS, MFD, and MFSC.
Other – This fund and certain other funds managed by MFS (the funds) have entered into services agreements (the Agreements) which provide for payment of fees by the funds to Tarantino LLC and Griffin Compliance LLC in return for the provision of services of an Independent Chief Compliance Officer (ICCO) and Assistant ICCO, respectively, for the funds. The ICCO and Assistant ICCO are officers of the funds and the sole members of Tarantino LLC and Griffin Compliance LLC, respectively. The funds can terminate the Agreements with Tarantino LLC and Griffin Compliance LLC at any time under the terms of the Agreements. MFS has agreed to bear all expenses associated with office space, other administrative support, and supplies provided to the ICCO and Assistant ICCO. For the year ended December 31, 2010, the aggregate fees paid by the fund to Tarantino LLC and Griffin Compliance LLC were $3,174 and are included in miscellaneous expense on the Statement of Operations.
The fund invests in the MFS Institutional Money Market Portfolio which is managed by MFS and seeks a high level of current income consistent with preservation of capital and liquidity. Income earned on this investment is included in dividends from underlying funds on the Statement of Operations. This money market fund does not pay a management fee to MFS.
Purchases and sales of investments, other than U.S. Government securities, purchased option transactions, and short-term obligations, aggregated $355,087,587 and $413,861,560, respectively.
17
MFS New Discovery Portfolio
Notes to Financial Statements – continued
| (5) | | Shares of Beneficial Interest |
The fund’s Declaration of Trust permits the Trustees to issue an unlimited number of full and fractional shares of beneficial interest. Transactions in fund shares were as follows:
| | | | | | | | | | | | | | | | |
| | | Year ended 12/31/10 | | | Year ended 12/31/09 | |
| | | Shares | | | Amount | | | Shares | | | Amount | |
| Shares sold | | | | | | | | | | | | | | | | |
Initial Class | | | 158,454 | | | | $2,403,888 | | | | 381,699 | | | | $3,641,700 | |
Service Class | | | 114,963 | | | | 1,741,456 | | | | 346,397 | | | | 3,223,051 | |
| | | 273,417 | | | | $4,145,344 | | | | 728,096 | | | | $6,864,751 | |
| Shares reacquired | | | | | | | | | | | | | | | | |
Initial Class | | | (1,208,840 | ) | | | $(18,597,077 | ) | | | (1,775,010 | ) | | | $(18,353,031 | ) |
Service Class | | | (2,880,973 | ) | | | (43,778,953 | ) | | | (4,493,420 | ) | | | (46,446,320 | ) |
| | | (4,089,813 | ) | | | $(62,376,030 | ) | | | (6,268,430 | ) | | | $(64,799,351 | ) |
| Net change | | | | | | | | | | | | | | | | |
Initial Class | | | (1,050,386 | ) | | | $(16,193,189 | ) | | | (1,393,311 | ) | | | $(14,711,331 | ) |
Service Class | | | (2,766,010 | ) | | | (42,037,497 | ) | | | (4,147,023 | ) | | | (43,223,269 | ) |
| | | (3,816,396 | ) | | | $(58,230,686 | ) | | | (5,540,334 | ) | | | $(57,934,600 | ) |
The fund and certain other funds managed by MFS participate in a $1.1 billion unsecured committed line of credit, subject to a $1 billion sublimit, provided by a syndication of banks under a credit agreement. Borrowings may be made for temporary financing needs. Interest is charged to each fund, based on its borrowings, generally at a rate equal to the higher of the Federal Reserve funds rate or one month LIBOR plus an agreed upon spread. A commitment fee, based on the average daily, unused portion of the committed line of credit, is allocated among the participating funds at the end of each calendar quarter. In addition, the fund and other funds managed by MFS have established unsecured uncommitted borrowing arrangements with certain banks for temporary financing needs. Interest is charged to each fund, based on its borrowings, at a rate equal to the Federal Reserve funds rate plus an agreed upon spread. For the year ended December 31, 2010, the fund’s commitment fee and interest expense were $2,085 and $0, respectively, and are included in miscellaneous expense on the Statement of Operations.
| (7) | | Transactions in Underlying Funds – Affiliated Issuers |
An affiliated issuer may be considered one in which the fund owns 5% or more of the outstanding voting securities, or a company which is under common control. For the purposes of this report, the fund assumes the following to be affiliated issuers:
| | | | | | | | | | | | | | | | |
| Underlying Funds | | Beginning
Shares/Par
Amount | | | Acquisitions
Shares/Par
Amount | | | Dispositions
Shares/Par
Amount | | | Ending
Shares/Par
Amount | |
| MFS Institutional Money Market Portfolio | | | 1,095,029 | | | | 64,273,325 | | | | (65,034,126 | ) | | | 334,228 | |
| | | | |
| Underlying Funds | | Realized
Gain (Loss) | | | Capital Gain
Distributions | | | Dividend
Income | | | Ending
Value | |
| MFS Institutional Money Market Portfolio | | | $— | | | | $— | | | | $1,347 | | | | $334,228 | |
18
MFS New Discovery Portfolio
REPORT OF INDEPENDENT REGISTERED PUBLIC ACCOUNTING FIRM
To the Board of Trustees of MFS Variable Insurance Trust II and the Shareholders of
MFS New Discovery Portfolio:
We have audited the accompanying statement of assets and liabilities, including the portfolio of investments, of MFS New Discovery Portfolio (the “Fund”) (one of the portfolios comprising MFS Variable Insurance Trust II) as of December 31, 2010, and the related statement of operations for the year then ended, the statements of changes in net assets for each of the two years in the period then ended, and the financial highlights for each of the five years in the period then ended. These financial statements and financial highlights are the responsibility of the Fund’s management. Our responsibility is to express an opinion on these financial statements and financial highlights based on our audits.
We conducted our audits in accordance with the standards of the Public Company Accounting Oversight Board (United States). Those standards require that we plan and perform the audit to obtain reasonable assurance about whether the financial statements and financial highlights are free of material misstatement. The Fund is not required to have, nor were we engaged to perform, an audit of its internal control over financial reporting. Our audits included consideration of internal control over financial reporting as a basis for designing audit procedures that are appropriate in the circumstances, but not for the purpose of expressing an opinion on the effectiveness of the Fund’s internal control over financial reporting. Accordingly, we express no such opinion. An audit also includes examining, on a test basis, evidence supporting the amounts and disclosures in the financial statements, assessing the accounting principles used and significant estimates made by management, as well as evaluating the overall financial statement presentation. Our procedures included confirmation of securities owned as of December 31, 2010, by correspondence with the custodian. We believe that our audits provide a reasonable basis for our opinion.
In our opinion, the financial statements and financial highlights referred to above present fairly, in all material respects, the financial position of MFS New Discovery Portfolio as of December 31, 2010, the results of its operations for the year then ended, the changes in its net assets for each of the two years in the period then ended, and the financial highlights for each of the five years in the period then ended in conformity with accounting principles generally accepted in the United States of America.
DELOITTE & TOUCHE LLP
Boston, Massachusetts
February 14, 2011
19
MFS New Discovery Portfolio
TRUSTEES AND OFFICERS – IDENTIFICATION AND BACKGROUND
The Trustees and officers of the Trust, as of February 1, 2011, are listed below, together with their principal occupations during the past five years. (Their titles may have varied during that period.) The address of each Trustee and officer is 500 Boylston Street, Boston, Massachusetts 02116.
| | | | | | |
Name, Date of Birth | | Position(s) Held
with Fund | | Trustee/Officer
Since (1) | | Principal Occupations During the Past Five Years and
Other Directorships (2) |
| INTERESTED TRUSTEE | | | | |
David D. Horn (3) (born 6/07/41) | | Trustee | | April 1986 | | Private investor; Sun Life Assurance Company of Canada, Senior Vice President and General Manager for the United States (until 1997); Director (until March 2004) |
| | |
| INDEPENDENT TRUSTEES | | | | |
J. Kermit Birchfield (born 1/08/40) | | Chairman | | May 1997 | | Consultant; Century Partners, Inc. (investments), Director; Displaytech, Inc. (technology), Chairman; Dessin Fournir LLC (furniture manufacturer), Director; Site Watch LLC (software to monitor oil tanks), Managing Director (2006 to present); Juridica Investments (fund investing in judicial matters), Director (2007 to present), Immuno Science, Inc. (medical research), Independent Director (2009 to present), Intermountain Industries, Inc. (oil & gas exploration and production), Director (until February 2009) |
| | | |
Robert C. Bishop (born 1/13/43) | | Trustee | | May 2001 | | AutoImmune, Inc. (pharmaceutical product development), Chairman, President and Chief Executive Officer; Caliper Life Sciences Corp. (laboratory analytical instruments), Chairman; Optobionics Corporation (ophthalmic devices), Director (until 2007); Millipore Corporation (purification/filtration products), Director (until July 2010); Waterstreet Capital (leverage buyouts), Advisory Board (until August 2010) |
| | | |
Frederick H. Dulles (born 3/12/42) | | Trustee | | May 2001 | | Dulles International Law LLC (law firm), Senior Lawyer (since 2009); Juridica Capital Management (US) Inc. (litigation financing), Vice President and General Counsel (since 2009); Dulles Properties LLC (real estate), Broker (since 2008); The Citadel School of Business Administration (education), Adjunct Professor (since 2003); Disher, Hamrick & Myers Residential, Inc. (real estate), Broker (until 2006); Frederick H. Dulles Law Practice (law firm), (until 2006); Charlestown School of Law (education), Adjunct Professor (until 2007); Prudential Carolina Real Estate, (real estate), Broker (until 2008); Free Enterprise Foundation Inc. (research institute), Director & Secretary (until 2008); Ten State International Law PLLP (law firm), Of Counsel (until 2009) |
| | | |
Marcia A. Kean (born 6/30/48) | | Trustee | | April 2005 | | Feinstein Kean Healthcare (consulting), Chief Executive Officer |
| | | |
Ronald G. Steinhart (born 6/15/40) | | Trustee | | May 2001 | | Private investor; Penske Automotive Group (automotive retailer), Director; Animal Health International, Inc. (animal health products), Director (since 2007); Texas Industries (concrete/aggregates/cement), Director (since 2007); Susser Holdings Corporation (retail convenience stores and distributor of wholesale motor fuel), Director (since 2009); Prentiss Properties Trust (real estate investment trust), Director (until 2006); Penson Worldwide, Inc. (securities clearance), Director (until 2008) |
| | | |
Haviland Wright (born 7/21/48) | | Trustee | | May 2001 | | X-Change Corp. (multi-media web services), Director (since 2010); Nano Loa Inc. (liquid crystal displays), Director (until 2009); Profitability of Hawaii (software), Chief Development Officer (until 2010); Elixir Technologies Corporation (software), Director (until 2010) |
| | | |
| OFFICERS | | | | | | |
Maria F. DiOrioDwyer (4)
(born 12/01/58) | | President | | November 2005 | | Massachusetts Financial Services Company, Executive Vice President and Chief Regulatory Officer; Chief Compliance Officer (since December 2006) |
| | | |
| Christopher R. Bohane (4) (born 1/18/74) | | Assistant Secretary and Assistant Clerk | | July 2005 | | Massachusetts Financial Services Company, Vice President and Senior Counsel |
| | | |
John M. Corcoran (4) (born 4/13/65) | | Treasurer | | October 2008 | | Massachusetts Financial Services Company, Senior Vice President (since October 2008); State Street Bank and Trust (financial services provider), Senior Vice President, (until September 2008) |
| | | |
Ethan D. Corey (4) (born 11/21/63) | | Assistant Secretary and Assistant Clerk | | July 2005 | | Massachusetts Financial Services Company, Senior Vice President and Associate General Counsel |
| | | |
David L. DiLorenzo (4) (born 8/10/68) | | Assistant Treasurer | | July 2005 | | Massachusetts Financial Services Company, Vice President |
| | | |
Timothy M. Fagan (4) (born 7/10/68) | | Assistant Secretary and Assistant Clerk | | September 2005 | | Massachusetts Financial Services Company, Vice President and Senior Counsel |
| | | |
Mark D. Fischer (4) (born 10/27/70) | | Assistant Treasurer | | July 2005 | | Massachusetts Financial Services Company, Vice President |
20
MFS New Discovery Portfolio
Trustees and Officers – continued
| | | | | | |
Name, Date of Birth | | Position(s) Held
with Fund | | Trustee/Officer
Since (1) | | Principal Occupations During the Past Five Years and
Other Directorships (2) |
Robyn L. Griffin (born 7/04/75) | | Assistant Independent Chief Compliance Officer | | August 2008 | | Griffin Compliance LLC (provider of compliance services), Principal (since August 2008); State Street Corporation (financial services provider), Mutual Fund Administration Assistant Vice President (October 2006 – July 2008); Liberty Mutual Group (insurance), Personal Market Assistant Controller (April 2006 – October 2006); Deloitte & Touche LLP (professional services firm), Senior Manager (prior to April 2006) |
| | | |
Brian E. Langenfeld (4) (born 3/07/73) | | Assistant Secretary and Assistant Clerk | | May 2006 | | Massachusetts Financial Services Company, Vice President and Senior Counsel (since May 2006); John Hancock Advisers, LLC, Assistant Vice President and Counsel (until April 2006) |
| | | |
Ellen Moynihan (4) (born 11/13/57) | | Assistant Treasurer | | May 1997 | | Massachusetts Financial Services Company, Senior Vice President |
| | | |
Susan S. Newton (4) (born 3/07/50) | | Assistant Secretary and Assistant Clerk | | May 2005 | | Massachusetts Financial Services Company, Senior Vice President and Associate General Counsel |
| | | |
Susan A. Pereira (4)
(born 11/05/70) | | Assistant Secretary and Assistant Clerk | | July 2005 | | Massachusetts Financial Services Company, Vice President and Senior Counsel |
| | | |
Mark N. Polebaum (4) (born 5/01/52) | | Secretary and Clerk | | February 2006 | | Massachusetts Financial Services Company, Executive Vice President, General Counsel and Secretary (since January 2006); Wilmer Cutler Pickering Hale and Dorr LLP (law firm), Partner (until January 2006) |
| | | |
Frank L. Tarantino (born 3/07/44) | | Independent Chief Compliance Officer | | September 2004 | | Tarantino LLC (provider of compliance services), Principal |
| | | |
Richard S. Weitzel (4) (born 7/16/70) | | Assistant Secretary and Assistant Clerk | | October 2007 | | Massachusetts Financial Services Company, Vice President and Assistant General Counsel |
| | | |
James O. Yost (4) (born 6/12/60) | | Assistant Treasurer | | April 1992 | | Massachusetts Financial Services Company, Senior Vice President |
| (1) | Date first appointed to serve as Trustee/Officer of an MFS fund or a Compass variable account. Each Trustee has served continuously since appointment. For the period March 2008 until October 2008, Ms. DiOrioDwyer served as Treasurer of the Funds. |
| (2) | Directorships or trusteeships of companies required to report to the Securities and Exchange Commission (i.e., “public companies”). |
| (3) | “Interested person” of the Trust, within the meaning of the Investment Company Act of 1940 (referred to as the 1940 Act), which is the principal federal law governing investment companies like the Trust, as a result of position with Sun Life of Canada (U.S.). The address of Sun Life of Canada (U.S.) is One Sun Life Executive Park, Wellesley Hills, Massachusetts 02481. |
| (4) | “Interested person” of MFS within the meaning of the 1940 Act. The address of MFS is 500 Boylston Street, Boston, Massachusetts 02116. |
The Trust does not hold annual meetings for the purpose of electing Trustees, and Trustees are not elected for fixed terms. Each Trustee and officer holds office until his or her successor is chosen and qualified, or until his or her earlier death, resignation, retirement or removal.
All Trustees currently serve as Trustees of the Trust and have served in that capacity since originally elected or appointed. All of the Trustees are also Managers of the Compass Variable Accounts. The executive officers of the Trust hold similar offices for the Compass Variable Accounts and other funds in the MFS fund complex. As of January 1, 2011, each Trustee serves as a Trustee or Manager of 31 Accounts/Portfolios.
21
MFS New Discovery Portfolio
Trustees and Officers – continued
The Statement of Additional Information contains further information about the Trustees and is available without charge upon request by calling 1-800-752-7215.
| | |
Investment Adviser
Massachusetts Financial Services Company 500 Boylston Street, Boston, MA 02116-3741 | | Custodian State Street Bank and Trust 1 Lincoln Street, Boston, MA 02111-2900 |
Distributor
MFS Fund Distributors, Inc. 500 Boylston Street, Boston, MA 02116-3741 | | Independent Registered Public Accounting Firm Deloitte & Touche LLP 200 Berkeley Street, Boston, MA 02116 |
Portfolio Manager Thomas Wetherald | | |
22
MFS New Discovery Portfolio
BOARD REVIEW OF INVESTMENT ADVISORY AGREEMENT
The Investment Company Act of 1940 requires that both the full Board of Trustees and a majority of the non-interested (“independent”) Trustees, voting separately, annually approve the continuation of the investment advisory agreement between MFS Variable Insurance Trust II (the “Trust”) and Massachusetts Financial Services Company (“MFS”) on behalf of the Fund. The Trustees consider matters bearing on the Fund and the advisory arrangement at their meetings throughout the year, including a review of performance data at each regular meeting. In addition, the independent Trustees met in person in May and again in July 2010 (“contract review meetings”) for the specific purpose of considering whether to approve the continuation of the investment advisory agreement for the Fund. The independent Trustees were assisted in their evaluation of the investment advisory agreement by independent legal counsel, from whom they received separate legal advice and with whom they met separately from MFS management during various contract review meetings. The independent Trustees were also assisted in this process by the Fund’s Independent Chief Compliance Officer, a full-time senior officer appointed by and reporting to the independent Trustees.
In connection with their deliberations, the Trustees, including the independent Trustees, considered such information and factors as they believed, in light of the legal advice furnished to them and their own business judgment, to be relevant. The investment advisory agreement was considered separately for the Fund, although the Trustees also took into account the common interests of all Funds in the Trust in their review. As described below, the Trustees considered the nature, quality, and extent of the various investment advisory, administrative, and shareholder services performed by MFS under the existing investment advisory agreement and other arrangements with the Trust.
In connection with their contract review meetings, the Trustees received and relied upon materials which included, among other items: (i) information provided by Lipper Inc. (“Lipper”) on the investment performance of the Fund for various time periods ended December 31, 2009, compared to the investment performance of a group of funds with substantially similar investment classifications/objectives (the “Lipper performance universe”), (ii) information provided by Lipper on the Fund’s advisory fees and other expenses compared to the advisory fees and other expenses of comparable funds identified by Lipper (the “Lipper expense group”), (iii) information provided by MFS on the advisory fees of comparable portfolios of its other clients, including institutional separate account and other clients, (iv) information as to whether, and to what extent applicable, expense waivers, reimbursements or fee “breakpoints” are observed for the Fund, (v) information regarding MFS’ financial results and financial condition, including MFS’ and certain of its affiliates’ estimated profitability from services performed for the Fund, (vi) MFS’ views regarding the outlook for the mutual fund industry and its strategic business plans, (vii) descriptions of various functions performed by MFS for the Trust, such as compliance monitoring and portfolio trading practices, and (viii) information regarding the overall organization of MFS, including information about MFS’ senior management and other personnel providing investment advisory, administrative and other services to the Fund. The comparative performance, fee and expense information prepared and provided by Lipper was not independently verified, and the independent Trustees did not independently verify any information provided to them by MFS.
The Trustees’ conclusion as to the continuation of the investment advisory agreement was based on comprehensive consideration of all information provided to the Trustees and was not the result of any single factor. Some of the factors that figured particularly in the Trustees’ deliberations are described below for the Fund, while individual Trustees may have given different weight to various factors and evaluated the information presented as a whole differently than another Trustee. The Trustees recognized that the fee arrangements for the Fund reflect years of review and discussion between the independent Trustees and MFS, that certain aspects of such arrangements may receive greater scrutiny in some years than others, and that the Trustees’ conclusions may be based, in part, on their consideration of these same arrangements during the course of the year and in prior years.
Based on information provided by Lipper, the Trustees compared the Fund’s total return investment performance to the performance of the Lipper performance universe over various time periods. The Trustees placed particular emphasis on the total return performance of the Fund’s Initial Class shares in comparison to the performance of funds in its Lipper performance universe over the one-, three- and five-year periods ended December 31, 2009. The Trustees did not rely on performance results for more recent periods, including those shown elsewhere in this report.
The Trustees noted the performance of the Fund’s Initial Class shares was in the 1st quintile relative to the other funds in the Lipper performance universe for the one-year period (the 1st quintile being the best performers and the 5th quintile being the worst performers). The total return performance of the Fund was also in the 1st quintile for the three-year and the five-year periods ended December 31, 2009, relative to the Lipper performance universe. Based on the nature and quality of services provided by MFS, the Board of Trustees concluded that the Fund’s performance was satisfactory.
23
MFS New Discovery Portfolio
Board Review of Investment Advisory Agreement – continued
In the course of their deliberations, the Trustees took into account information provided by MFS during contract review meetings, as well as during investment review meetings conducted with portfolio management personnel during the course of the year.
In assessing the reasonableness of the Fund’s advisory fee, the Trustees considered, among other information, the Fund’s advisory fee and the total expense ratio of the Fund’s Initial Class shares as a percentage of average daily net assets, compared to the advisory fee and total expense ratios of its peer group of funds based on information provided by Lipper. The Trustees also considered the advisory fees charged by MFS to institutional accounts. In comparing these fees, the Trustees considered the generally broader scope of services provided by MFS to the Trust than those provided to institutional accounts. The Trustees also considered the higher demands placed on MFS’ investment personnel and trading infrastructure as a result of the daily cash in-flows and out-flows of the Fund, and the impact on MFS and related expenses due to the more extensive regulatory regime to which the Fund is subject, compared to institutional accounts.
In considering the fees, the Trustees noted from the Lipper data that the Fund’s effective advisory fee rate and total expense ratio were each approximately at the median of such fees and expenses of funds in the Lipper expense group. In addition, the Trustees noted that MFS agreed to continue its waiver to reduce its advisory fee on average daily net assets over $2.5 billion, and they accepted MFS’ offer to continue the expense limitation for the Fund. The Trustees further concluded that the existing breakpoints were sufficient to allow the Fund to benefit from economies of scale as its assets grow. The Trustees concluded that the fees were reasonable in light of the nature and quality of services provided.
The Trustees also considered information prepared by MFS relating to its costs and profits with respect to the Fund and other investment companies and accounts advised by MFS, as well as MFS’ methodologies used to determine and allocate its costs to the Fund and other accounts and products for purposes of estimating profitability.
After reviewing these and other factors described below, the Trustees concluded that the advisory fees charged to the Fund represent reasonable compensation in light of the nature and quality of the services being provided by MFS.
In addition, the Trustees considered MFS’ resources and related efforts to continue to retain, attract and motivate capable personnel to serve the Fund. The Trustees also considered the financial resources of MFS and its parent, Sun Life Financial Inc. The Trustees further considered any advantages and possible disadvantages of having an adviser which also serves other investment companies as well as institutional accounts.
The Trustees also considered the nature, quality, cost, and extent of administrative, transfer agency, and distribution services provided to the Fund by MFS and its affiliates under agreements and plans other than the investment advisory agreement, including the 12b-1 fees the Fund pays to MFS Fund Distributors, Inc., an affiliate of MFS. The Trustees also considered the nature, extent and quality of certain other services MFS performs or arranges on the Fund’s behalf, which may include securities lending programs, directed expense payment programs, class action recovery programs, and MFS’ interaction with third-party service providers, principally custodians and sub-custodians. The Trustees concluded that the various non-advisory services provided by MFS and its affiliates on behalf of the Fund were satisfactory. The Trustees also considered the benefits to MFS from the use of the Fund’s portfolio brokerage commissions to pay for investment research and various other factors. Additionally, the Trustees considered so-called “fall-out benefits” to MFS such as reputational value derived from serving as investment manager to the Trust, and determined that any such benefits derived by MFS were reasonable and fair.
Based on their evaluation of factors that they deemed to be material, including those factors described above, the Board of Trustees, including a majority of the independent Trustees, concluded that the investment advisory agreement should be continued for an additional one-year period, commencing September 1, 2010.
A discussion regarding the Board’s most recent review and renewal of the fund’s Investment Advisory Agreement with MFS is available by clicking on the fund’s name under “Variable Insurance Portfolios — VIT II” in the “Products and Performance” section of the MFS Web site (mfs.com).
24
MFS New Discovery Portfolio
PROXY VOTING POLICIES AND INFORMATION
A general description of the MFS funds’ proxy voting policies and procedures is available without charge, upon request, by calling
1-800-225-2606, by visiting the Proxy Voting section of mfs.com or by visiting the SEC’s Web site at http://www.sec.gov.
Information regarding how the fund voted proxies relating to portfolio securities during the most recent twelve-month period ended June 30 is available without charge by visiting the Proxy Voting section of mfs.com or by visiting the SEC’s Web site at http://www.sec.gov.
QUARTERLY PORTFOLIO DISCLOSURE
The fund will file a complete schedule of portfolio holdings with the Securities and Exchange Commission (the Commission) for the first and third quarters of each fiscal year on Form N-Q. The fund’s Form N-Q may be reviewed and copied at the:
Public Reference Room
Securities and Exchange Commission
100 F Street, NE, Room 1580
Washington, D.C. 20549
Information on the operation of the Public Reference Room may be obtained by calling the Commission at 1-800-SEC-0330. The fund’s Form N-Q is available on the EDGAR database on the Commission’s Internet Web site at http://www.sec.gov, and copies of this information may be obtained, upon payment of a duplicating fee, by electronic request at the following e-mail address: publicinfo@sec.gov or by writing the Public Reference Section at the above address.
FURTHER INFORMATION
From time to time, MFS may post important information about the fund or the MFS funds on the MFS web site (mfs.com). This information is available by visiting the “News & Commentary” section of mfs.com or by clicking on the fund’s name under “Variable Insurance Portfolios — VIT II” in the “Products and Performance” section of mfs.com.
25
MFS New Discovery Portfolio
MFS® PRIVACY NOTICE
Privacy is a concern for every investor today. At MFS Investment Management® and the MFS funds, we take this concern very seriously. We want you to understand our policies about the investment products and services that we offer, and how we protect the nonpublic personal information of investors who have a direct relationship with us and our wholly owned subsidiaries.
Throughout our business relationship, you provide us with personal information. We maintain information and records about you, your investments, and the services you use. Examples of the nonpublic personal information we maintain include
| | Ÿ | | data from investment applications and other forms |
| | Ÿ | | share balances and transactional history with us, our affiliates, or others |
| | Ÿ | | facts from a consumer reporting agency |
We do not disclose any nonpublic personal information about our customers or former customers to anyone, except as permitted by law. We may share nonpublic personal information with third parties or certain of our affiliates in connection with servicing your account or processing your transactions. We may share information with companies or financial institutions that perform marketing services on our behalf or with other financial institutions with which we have joint marketing arrangements, subject to any legal requirements.
Authorization to access your nonpublic personal information is limited to appropriate personnel who provide products, services, or information to you. We maintain physical, electronic, and procedural safeguards to help protect the personal information we collect about you.
If you have any questions about the MFS privacy policy, please call 1-800-225-2606 any business day.
Note: If you own MFS products or receive MFS services in the name of a third party such as a bank or broker-dealer, their privacy policy may apply to you instead of ours.
26


MFS® GROWTH PORTFOLIO
The report is prepared for the general information of contract owners. It is authorized for distribution to prospective investors only when preceded or accompanied by a current prospectus.
NOT FDIC INSURED Ÿ MAY LOSE VALUE Ÿ NO BANK GUARANTEE Ÿ NOT A DEPOSIT Ÿ NOT INSURED BY ANY FEDERAL GOVERNMENT AGENCY OR NCUA/NCUSIF
MFS Growth Portfolio
LETTER FROM THE CEO

Dear Contract Owners:
After an extended rebound in the financial markets, uncertainty returned in 2010 as investors began to question the durability of the recovery for global economies and markets. That uncertainty led to increased risk aversion, especially as investors saw the eurozone struggle with the debt woes of many of its members. In September, the U.S. Federal Reserve Board’s promises to further loosen monetary policy helped assuage market fears and drive asset prices off their recent lows. A combination of solid earnings and improving economic data gave an additional boost to investor sentiment. As we enter 2011, we are cautiously optimistic that economic growth will continue to improve and that the global economies will recover from the shocks of the past few years. We expect the pace of recovery worldwide will be uneven and volatile.
As always, we continue to be mindful of the many economic challenges faced at the local, national, and international levels. It is in times such as these that we want to remind investors of the merits of maintaining a long-term view, adhering to basic investing principles such as asset allocation and diversification, and working closely with their advisors to research and identify appropriate investment opportunities.
Respectfully,

Robert J. Manning
Chairman and Chief Executive Officer
MFS Investment Management®
February 14, 2011
The opinions expressed in this letter are subject to change, may not be relied upon for investment advice, and no forecasts can be guaranteed.
1
MFS Growth Portfolio
PORTFOLIO COMPOSITION
Portfolio structure
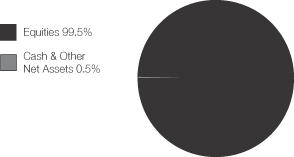
| | | | |
| Top ten holdings | | | | |
| Apple, Inc. | | | 4.8% | |
| Danaher Corp. | | | 2.8% | |
| Google, Inc., “A” | | | 2.8% | |
| Oracle Corp. | | | 2.4% | |
| EMC Corp. | | | 2.3% | |
| Cisco Systems, Inc. | | | 1.9% | |
| Schlumberger Ltd. | | | 1.8% | |
| American Tower Corp., “A” | | | 1.8% | |
| Target Corp. | | | 1.7% | |
| Autodesk, Inc. | | | 1.6% | |
| | | | |
| Equity sectors | | | | |
| Technology | | | 26.7% | |
| Energy | | | 11.4% | |
| Industrial Goods & Services | | | 9.2% | |
| Leisure | | | 8.8% | |
| Retailing | | | 8.1% | |
| Financial Services | | | 7.8% | |
| Health Care | | | 7.3% | |
| Basic Materials | | | 5.8% | |
| Special Products & Services | | | 5.7% | |
| Consumer Staples | | | 3.7% | |
| Transportation | | | 2.8% | |
| Utilities & Communications | | | 2.0% | |
| Autos & Housing | | | 0.2% | |
Percentages are based on net assets as of 12/31/10.
The portfolio is actively managed and current holdings may be different.
2
MFS Growth Portfolio
MANAGEMENT REVIEW
Summary of Results
For the twelve months ended December 31, 2010, Initial Class shares of the MFS Growth Portfolio (the “fund”) provided a total return of 15.81%, while Service Class shares of the fund provided a total return of 15.50%. These compare with a return of 16.71% for the fund’s benchmark, the Russell 1000 Growth Index.
Market Environment
The first quarter of the reporting period witnessed a continuation of the financial market and macroeconomic rebounds that had begun in early 2009. These recoveries in global activity and asset valuations were generally synchronized around the world, led importantly by emerging Asian economies, but broadening to include most of the global economy to varying degrees. Primary drivers of the recoveries included an unwinding of the inventory destocking that took place earlier, the production of manufacturing and capital goods, as well as massive fiscal and monetary stimulus.
During most of the remainder of the period, heightened risk surrounding the public-debt profiles of several of the peripheral European countries impaired market sentiment. At the same time, the improving trend in global macroeconomic data began to weaken somewhat. These two dynamics caused many asset prices to retrench significantly, as many questioned the durability of the global recovery.
Towards the end of the period, the U.S. Federal Reserve led markets to believe that further monetary loosening would be forthcoming if macroeconomic activity did not show signs of improvement. The prospects for more easing by the Fed improved market sentiment and drove risk-asset prices markedly higher. However, in a text-book case of “buy the rumor, sell the fact,” the weeks following the early November announcement of further quantitative easing saw a sell-off in U.S. Treasury bonds. This rise in Treasury yields occurred despite risk-off behavior in equities and credit markets (which would normally result in Treasury yield compression), and appears to have been the result of a few factors: signs of improved U.S. and global economic activity; opposition to quantitative easing from some quarters; and crowded long positions in U.S. Treasuries. The December agreement on an expansionary U.S. fiscal package also boosted sentiment, leading markets to reach near-term highs in risky asset valuations toward year end.
Detractors from Performance
Stock selection in the financial services sector hurt relative performance. Credit card companies, Visa and Mastercard, were among the fund’s top detractors over the reporting period. Shares of both companies declined sharply after the Federal Reserve released a debit interchange proposal that would substantially reduce debit card transaction fees. The Fed’s proposals on debit network exclusivity also created uncertainty surrounding the companies’ future market share and revenues.
Stock selection in the basic materials sector also had a negative impact on relative results. The fund’s underweight position in precious metals company Freeport-McMoRan and investment in agricultural products company Monsanto dampened relative returns. Shares of Monsanto declined during the first half of the reporting period on the company’s expected losses in sales and net income, due mostly to the repositioning of its Roundup product line. The company also lowered its 2010 earnings forecast and issued third quarter earnings guidance that was below market estimates.
Stock selection in the health care sector also detracted from relative performance. Generic drug manufacturer Teva Pharmaceutical Industries(b) (Israel) held back relative returns as the stock underperformed the benchmark. Shares of Teva declined after suffering two setbacks by U.S. regulators. First, regulators granted priority review to a competitor’s multiple sclerosis treatment drug which is viewed as a competitor to Teva’s copaxone drug. Second, the company failed to win U.S. approval for a medicine similar to another competing drug for fighting infections in chemotherapy.
Stocks in other sectors that detracted from relative results included internet search engine Google, animation film developer Dreamworks Animation (h), publishing software company Adobe Systems (h), and networking equipment maker Cisco Systems.
The fund’s cash position was also a detractor from relative performance. The fund strives to be fully invested and only holds cash to buy new holdings and to provide liquidity. In a period when equity markets rose, as measured by the fund’s benchmark, holding cash hurt performance versus the benchmark, which has no cash position.
Contributors to Performance
Stock selection in the technology sector was a positive factor for relative performance. Not owning poor-performing software developer Microsoft boosted results. Holdings of network storage products company F5 Networks, internet software service provider Akamai Technologies (h), and internet infrastructure services provider Verisign also had a positive impact on relative returns. Shares of F5 Networks climbed higher as the company released strong earnings results, as well as earnings guidance for the fourth quarter of 2010 that exceeded expectations.
3
MFS Growth Portfolio
Management Review – continued
Elsewhere, oil and gas drilling equipment manufacturer National Oilwell Varco (b), industrial machinery manufacturer Bucyrus International (h), casino resort operator Las Vegas Sands, specialty retailer Limited Brands, engineering and construction services provider Fluor Corp., and biopharmaceutical company Alexion Pharmaceuticals also aided relative results. The stock price of National Oilwell Varco rose as the company posted better-than-expected earnings results stemming from high oil and gas demand across North America. In addition, the company boosted its quarterly dividend during the latter part of the reporting period.
The total return of the fund includes proceeds from a non-recurring litigation settlement received during the reporting period, which if excluded would have resulted in a lower total return.
Respectfully,
Eric Fischman
Portfolio Manager
| (b) | Security is not a benchmark constituent. |
| (h) | Security was not held in the portfolio at period end. |
The views expressed in this report are those of the portfolio manager only through the end of the period of the report as stated on the cover and do not necessarily reflect the views of MFS or any other person in the MFS organization. These views are subject to change at any time based on market or other conditions, and MFS disclaims any responsibility to update such views. These views may not be relied upon as investment advice or an indication of trading intent on behalf of any MFS portfolio. References to specific securities are not recommendations of such securities, and may not be representative of any MFS portfolio’s current or future investments.
4
MFS Growth Portfolio
PERFORMANCE SUMMARY THROUGH 12/31/10
The following chart illustrates the historical performance of the fund in comparison to its benchmark(s). Benchmarks are unmanaged and may not be invested in directly. Benchmark returns do not reflect any fees or expenses. The performance of other share classes will be greater than or less than that of the class depicted below. (See Notes to Performance Summary.)
Performance data shown represents past performance and is no guarantee of future results. Investment return and principal value fluctuate so your units, when sold, may be worth more or less than the original cost; current performance may be lower or higher than quoted. The performance shown does not reflect the deduction of taxes, if any, that a contract holder would pay on fund distributions or the redemption of contract units. The returns for the fund shown also do not reflect the deduction of expenses associated with variable products, such as mortality and expense risk charges, separate account charges, and sales charges imposed by the insurance company separate accounts. Such expenses would reduce the overall returns shown.
Growth of a Hypothetical $10,000 Investment
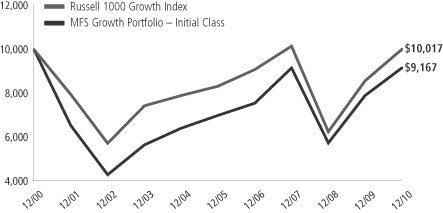
Total Returns through 12/31/10
Average annual total returns
| | | | | | | | | | | | | | |
| | | Share class | | Class inception date | | 1-yr | | 5-yr | | 10-yr | | Life (t) | | |
| | | Initial Class | | 5/01/95 | | 15.81% | | 5.54% | | (0.87)% | | N/A | | |
| | | Service Class | | 8/24/01 | | 15.50% | | 5.27% | | N/A | | 3.51% | | |
| | | | | |
| Comparative benchmark | | | | | | | | | | |
| | | Russell 1000 Growth Index (f) | | 16.71% | | 3.75% | | 0.02% | | N/A | | |
| (f) | Source: FactSet Research Systems Inc. |
| (t) | For the period from the class inception date through the stated period end (for those share classes with less than 10 years of performance history). No comparative benchmark performance information is provided for “life” periods. (See Notes to Performance Summary.) |
Included in the Initial Class and Service Class total returns for the year ended December 31, 2010 are proceeds received from a non-recurring litigation settlement against Tyco International Ltd. Had these proceeds not been included the 1-year total returns would have each been lower by approximately 0.61%.
Benchmark Definition
Russell 1000 Growth Index – constructed to provide a comprehensive barometer for growth securities in the large-cap segment of the U.S. equity universe. Companies in this index generally have higher price-to-book ratios and higher forecasted growth values.
It is not possible to invest directly in an index.
Notes to Performance Summary
Average annual total return represents the average annual change in value for each share class for the periods presented. Life returns are presented where the share class has less than 10 years of performance history and represent the average annual total return from the class inception date to the stated period end date. As the fund’s share classes may have different inception dates, the life returns may represent different time periods and may not be comparable. As a result, no comparative benchmark performance information is provided for life periods.
5
MFS Growth Portfolio
Performance Summary – continued
Performance results reflect any applicable expense subsidies and waivers in effect during the periods shown. Without such subsidies and waivers the fund’s performance results would be less favorable. Please see the prospectus and financial statements for complete details. All results are historical and assume the reinvestment of any dividends and capital gains distributions.
From time to time the fund may receive proceeds from litigation settlements, without which performance would be lower.
6
MFS Growth Portfolio
EXPENSE TABLE
Fund Expenses Borne by the Contract Holders During the Period,
July 1, 2010 through December 31, 2010
As a contract holder of the fund, you incur ongoing costs, including management fees; distribution and/or service (12b-1) fees; and other fund expenses. This example is intended to help you understand your ongoing costs (in dollars) of investing in the fund and to compare these costs with the ongoing costs of investing in other mutual funds.
The example is based on an investment of $1,000 invested at the beginning of the period and held for the entire period July 1, 2010 through December 31, 2010.
Actual Expenses
The first line for each share class in the following table provides information about actual account values and actual expenses. You may use the information in this line, together with the amount you invested, to estimate the expenses that you paid over the period. Simply divide your account value by $1,000 (for example, an $8,600 account value divided by $1,000 = 8.6), then multiply the result by the number in the first line under the heading entitled “Expenses Paid During Period” to estimate the expenses you paid on your account during this period.
Hypothetical Example for Comparison Purposes
The second line for each share class in the following table provides information about hypothetical account values and hypothetical expenses based on the fund’s actual expense ratio and an assumed rate of return of 5% per year before expenses, which is not the fund’s actual return. The hypothetical account values and expenses may not be used to estimate the actual ending account balance or expenses you paid for the period. You may use this information to compare the ongoing costs of investing in the fund and other funds. To do so, compare this 5% hypothetical example with the 5% hypothetical examples that appear in the shareholder reports of the other funds.
Please note that the expenses shown in the table are meant to highlight the fund’s ongoing costs only and do not take into account the fees and expenses imposed under the variable contracts through which your investment in the fund is made. Therefore, the second line for each share class in the table is useful in comparing ongoing costs associated with an investment in vehicles (such as the fund) which fund benefits under variable annuity and variable life insurance contracts and to qualified pension and retirement plans only, and will not help you determine the relative total costs of investing in the fund through variable annuity and variable life insurance contracts. If the fees and expenses imposed under the variable contracts were included, your costs would have been higher.
| | | | | | | | | | | | | | | | | | |
| Share Class | | | | Annualized
Expense Ratio | | | Beginning
Account Value
7/01/10 | | | Ending
Account Value
12/31/10 | | | Expenses Paid
During Period (p)
7/01/10-12/31/10 | |
| Initial Class | | Actual | | | 0.87% | | | | $1,000.00 | | | | $1,266.67 | | | | $4.97 | |
| | Hypothetical (h) | | | 0.87% | | | | $1,000.00 | | | | $1,020.82 | | | | $4.43 | |
| Service Class | | Actual | | | 1.12% | | | | $1,000.00 | | | | $1,264.77 | | | | $6.39 | |
| | Hypothetical (h) | | | 1.12% | | | | $1,000.00 | | | | $1,019.56 | | | | $5.70 | |
| (h) | 5% class return per year before expenses. |
| (p) | Expenses paid is equal to each class’ annualized expense ratio, as shown above, multiplied by the average account value over the period, multiplied by the number of days in the period, divided by the number of days in the year. |
7
MFS Growth Portfolio
PORTFOLIO OF INVESTMENTS – 12/31/10
The Portfolio of Investments is a complete list of all securities owned by your fund. It is categorized by broad-based asset classes.
| | | | | | | | |
| Issuer | | Shares/Par | | | Value ($) | |
| | | | | | | | |
| COMMON STOCKS – 99.5% | | | | | | | | |
| Aerospace – 3.3% | | | | | | | | |
| Goodrich Corp. | | | 22,960 | | | $ | 2,022,083 | |
| Honeywell International, Inc. | | | 29,470 | | | | 1,566,625 | |
| Precision Castparts Corp. | | | 14,090 | | | | 1,961,469 | |
| | | | | | | | |
| | | | | | $ | 5,550,177 | |
| | | | | | | | |
| Alcoholic Beverages – 0.6% | | | | | | | | |
| Diageo PLC | | | 51,529 | | | $ | 952,015 | |
| | | | | | | | |
| Apparel Manufacturers – 0.7% | | | | | | | | |
| LVMH Moet Hennessy Louis Vuitton S.A. | | | 2,017 | | | $ | 331,794 | |
| NIKE, Inc., “B” | | | 11,010 | | | | 940,474 | |
| | | | | | | | |
| | | | | | $ | 1,272,268 | |
| | | | | | | | |
| Biotechnology – 1.6% | | | | | | | | |
| Alexion Pharmaceuticals, Inc. (a) | | | 17,430 | | | $ | 1,403,987 | |
| Celgene Corp. (a) | | | 16,740 | | | | 990,004 | |
| Gilead Sciences, Inc. (a) | | | 11,390 | | | | 412,774 | |
| | | | | | | | |
| | | | | | $ | 2,806,765 | |
| | | | | | | | |
| Broadcasting – 3.8% | | | | | | | | |
| Discovery Communications, Inc., “A” (a) | | | 40,200 | | | $ | 1,676,340 | |
| Interpublic Group of Cos., Inc. (a) | | | 80,480 | | | | 854,698 | |
| Viacom, Inc., “B” | | | 50,080 | | | | 1,983,669 | |
| Walt Disney Co. | | | 52,620 | | | | 1,973,776 | |
| | | | | | | | |
| | | | | | $ | 6,488,483 | |
| | | | | | | | |
| Brokerage & Asset Managers – 3.2% | | | | | | | | |
| Affiliated Managers Group, Inc. (a) | | | 20,920 | | | $ | 2,075,682 | |
| Blackrock, Inc. | | | 3,481 | | | | 663,409 | |
| CME Group, Inc. | | | 7,060 | | | | 2,271,555 | |
| IntercontinentalExchange, Inc. (a) | | | 4,330 | | | | 515,920 | |
| | | | | | | | |
| | | | | | $ | 5,526,566 | |
| | | | | | | | |
| Business Services – 4.4% | | | | | | | | |
| Accenture Ltd., “A” | | | 33,370 | | | $ | 1,618,111 | |
| Cognizant Technology Solutions Corp., “A” (a) | | | 24,430 | | | | 1,790,475 | |
| Concur Technologies, Inc. (a) | | | 6,930 | | | | 359,875 | |
| FleetCor Technologies, Inc. (a) | | | 12,180 | | | | 376,606 | |
| MSCI, Inc., “A” (a) | | | 44,490 | | | | 1,733,330 | |
| Verisk Analytics, Inc., “A” (a) | | | 45,530 | | | | 1,551,662 | |
| | | | | | | | |
| | | | | | $ | 7,430,059 | |
| | | | | | | | |
| Cable TV – 0.6% | | | | | | | | |
| Virgin Media, Inc. | | | 38,430 | | | $ | 1,046,833 | |
| | | | | | | | |
| Chemicals – 2.3% | | | | | | | | |
| Celanese Corp. | | | 26,100 | | | $ | 1,074,537 | |
| Ecolab, Inc. | | | 12,600 | | | | 635,292 | |
| Monsanto Co. | | | 31,020 | | | | 2,160,233 | |
| | | | | | | | |
| | | | | | $ | 3,870,062 | |
| | | | | | | | |
| Computer Software – 6.9% | | | | | | | | |
| Ariba, Inc. (a) | | | 7,200 | | | $ | 169,128 | |
| Autodesk, Inc. (a) | | | 70,500 | | | | 2,693,100 | |
| Check Point Software Technologies Ltd. (a) | | | 15,270 | | | | 706,390 | |
| | | | | | | | |
| Issuer | | Shares/Par | | | Value ($) | |
| | | | | | | | |
| COMMON STOCKS – continued | | | | | | | | |
| Computer Software – continued | | | | | | | | |
| Citrix Systems, Inc. (a) | | | 5,010 | | | $ | 342,734 | |
| Intuit, Inc. (a) | | | 41,330 | | | | 2,037,569 | |
| Oracle Corp. | | | 130,230 | | | | 4,076,199 | |
| VeriSign, Inc. | | | 55,748 | | | | 1,821,287 | |
| | | | | | | | |
| | | | | | $ | 11,846,407 | |
| | | | | | | | |
| Computer Software – Systems – 9.7% | | | | | | | | |
| Apple, Inc. (a)(s) | | | 25,650 | | | $ | 8,273,664 | |
| EMC Corp. (a) | | | 172,010 | | | | 3,939,029 | |
| International Business Machines Corp. | | | 11,640 | | | | 1,708,286 | |
| MICROS Systems, Inc. (a) | | | 14,650 | | | | 642,549 | |
| NetApp, Inc. (a) | | | 13,770 | | | | 756,799 | |
| Verifone Systems, Inc. (a) | | | 33,140 | | | | 1,277,878 | |
| | | | | | | | |
| | | | | | $ | 16,598,205 | |
| | | | | | | | |
| Construction – 0.2% | | | | | | | | |
| Owens Corning (a) | | | 13,620 | | | $ | 424,263 | |
| | | | | | | | |
| Consumer Products – 0.4% | | | | | | | | |
| Avon Products, Inc. | | | 22,440 | | | $ | 652,106 | |
| | | | | | | | |
| Consumer Services – 1.3% | | | | | | | | |
| Anhanguera Educacional Participacoes S.A. | | | 11,500 | | | $ | 277,108 | |
| Monster Worldwide, Inc. (a) | | | 26,060 | | | | 615,798 | |
| Sotheby’s | | | 30,140 | | | | 1,356,300 | |
| | | | | | | | |
| | | | | | $ | 2,249,206 | |
| | | | | | | | |
| Electrical Equipment – 2.8% | | | | | | | | |
| Danaher Corp. (s) | | | 102,010 | | | $ | 4,811,812 | |
| | | | | | | | |
| Electronics – 3.1% | | | | | | | | |
| Advanced Micro Devices, Inc. (a) | | | 52,810 | | | $ | 431,986 | |
| ARM Holdings PLC | | | 59,283 | | | | 391,248 | |
| Broadcom Corp., “A” | | | 40,700 | | | | 1,772,485 | |
| First Solar, Inc. (a)(l) | | | 3,920 | | | | 510,149 | |
| Lam Research Corp. (a) | | | 10,280 | | | | 532,298 | |
| Linear Technology Corp. | | | 14,920 | | | | 516,083 | |
| Microchip Technology, Inc. | | | 18,860 | | | | 645,201 | |
| Teradyne, Inc. (a) | | | 37,790 | | | | 530,572 | |
| | | | | | | | |
| | | | | | $ | 5,330,022 | |
| | | | | | | | |
| Energy – Independent – 4.7% | | | | | | | | |
| Cenovus Energy, Inc. | | | 25,000 | | | $ | 831,000 | |
| Newfield Exploration Co. (a) | | | 25,210 | | | | 1,817,893 | |
| Noble Energy, Inc. | | | 14,150 | | | | 1,218,032 | |
| Occidental Petroleum Corp. | | | 27,010 | | | | 2,649,681 | |
| Southwestern Energy Co. (a) | | | 8,760 | | | | 327,887 | |
| Ultra Petroleum Corp. (a) | | | 9,430 | | | | 450,471 | |
| Whiting Petroleum Corp. (a) | | | 5,930 | | | | 694,937 | |
| | | | | | | | |
| | | | | | $ | 7,989,901 | |
| | | | | | | | |
| Engineering – Construction – 1.6% | | | | | | | | |
| Fluor Corp. | | | 40,350 | | | $ | 2,673,591 | |
| | | | | | | | |
8
MFS Growth Portfolio
Portfolio of Investments – continued
| | | | | | | | |
| Issuer | | Shares/Par | | | Value ($) | |
| | | | | | | | |
| COMMON STOCKS – continued | | | | | | | | |
| Food & Beverages – 2.2% | | | | | | | | |
| Coca-Cola Co. | | | 32,500 | | | $ | 2,137,525 | |
| Mead Johnson Nutrition Co., “A” | | | 26,450 | | | | 1,646,513 | |
| | | | | | | | |
| | | | | | $ | 3,784,038 | |
| | | | | | | | |
| Food & Drug Stores – 0.5% | | | | | | | | |
| Whole Foods Market, Inc. | | | 16,690 | | | $ | 844,347 | |
| | | | | | | | |
| Gaming & Lodging – 2.0% | | | | | | | | |
| Carnival Corp. | | | 26,630 | | | $ | 1,227,909 | |
| Las Vegas Sands Corp. (a) | | | 20,800 | | | | 955,760 | |
| Marriott International, Inc., “A” | | | 28,550 | | | | 1,185,967 | |
| | | | | | | | |
| | | | | | $ | 3,369,636 | |
| | | | | | | | |
| General Merchandise – 4.2% | | | | | | | | |
| Costco Wholesale Corp. | | | 23,210 | | | $ | 1,675,994 | |
| Dollar General Corp. (a) | | | 13,760 | | | | 422,019 | |
| Kohl’s Corp. (a) | | | 39,240 | | | | 2,132,302 | |
| Target Corp. | | | 47,750 | | | | 2,871,208 | |
| | | | | | | | |
| | | | | | $ | 7,101,523 | |
| | | | | | | | |
| Internet – 3.3% | | | | | | | | |
| eBay, Inc. (a) | | | 11,500 | | | $ | 320,045 | |
| Google, Inc., “A” (a)(s) | | | 7,980 | | | | 4,739,881 | |
| OpenTable, Inc. (a) | | | 8,210 | | | | 578,641 | |
| | | | | | | | |
| | | | | | $ | 5,638,567 | |
| | | | | | | | |
| Leisure & Toys – 0.5% | | | | | | | | |
| Hasbro, Inc. | | | 17,630 | | | $ | 831,783 | |
| | | | | | | | |
| Machinery & Tools – 1.2% | | | | | | | | |
| Flowserve Corp. | | | 13,330 | | | $ | 1,589,203 | |
| Polypore International, Inc. (a) | | | 9,590 | | | | 390,601 | |
| | | | | | | | |
| | | | | | $ | 1,979,804 | |
| | | | | | | | |
| Major Banks – 1.7% | | | | | | | | |
| Goldman Sachs Group, Inc. | | | 8,480 | | | $ | 1,425,997 | |
| JPMorgan Chase & Co. | | | 35,640 | | | | 1,511,849 | |
| | | | | | | | |
| | | | | | $ | 2,937,846 | |
| | | | | | | | |
| Medical & Health Technology & Services – 1.9% | |
| Cerner Corp. (a) | | | 10,980 | | | $ | 1,040,245 | |
| Diagnosticos da America S.A. | | | 25,100 | | | | 340,211 | |
| IDEXX Laboratories, Inc. (a) | | | 12,280 | | | | 850,022 | |
| Stericycle, Inc. (a) | | | 12,710 | | | | 1,028,493 | |
| | | | | | | | |
| | | | | | $ | 3,258,971 | |
| | | | | | | | |
| Medical Equipment – 2.6% | | | | | | | | |
| Becton, Dickinson & Co. | | | 8,570 | | | $ | 724,336 | |
| Edwards Lifesciences Corp. (a) | | | 5,710 | | | | 461,596 | |
| ResMed, Inc. (a) | | | 22,170 | | | | 767,969 | |
| Thermo Fisher Scientific, Inc. (a) | | | 44,260 | | | | 2,450,234 | |
| | | | | | | | |
| | | | | | $ | 4,404,135 | |
| | | | | | | | |
| Metals & Mining – 2.0% | | | | | | | | |
| BHP Billiton Ltd., ADR | | | 16,270 | | | $ | 1,511,808 | |
| Freeport-McMoRan Copper & Gold, Inc. | | | 1,550 | | | | 186,140 | |
| Teck Resources Ltd., “B” | | | 29,130 | | | | 1,801,108 | |
| | | | | | | | |
| | | | | | $ | 3,499,056 | |
| | | | | | | | |
| | | | | | | | |
| Issuer | | Shares/Par | | | Value ($) | |
| | | | | | | | |
| COMMON STOCKS – continued | | | | | | | | |
| Network & Telecom – 3.7% | | | | | | | | |
| Acme Packet, Inc. (a) | | | 6,850 | | | $ | 364,146 | |
| Ciena Corp. (a) | | | 20,450 | | | | 430,473 | |
| Cisco Systems, Inc. (a) | | | 162,660 | | | | 3,290,612 | |
| F5 Networks, Inc. (a) | | | 5,050 | | | | 657,308 | |
| Juniper Networks, Inc. (a) | | | 40,790 | | | | 1,505,967 | |
| | | | | | | | |
| | | | | | $ | 6,248,506 | |
| | | | | | | | |
| Oil Services – 6.7% | | | | | | | | |
| Cameron International Corp. (a) | | | 43,440 | | | $ | 2,203,711 | |
| Halliburton Co. | | | 34,600 | | | | 1,412,718 | |
| National Oilwell Varco, Inc. | | | 34,790 | | | | 2,339,628 | |
| Schlumberger Ltd. | | | 37,480 | | | | 3,129,580 | |
| Weatherford International Ltd. (a) | | | 100,070 | | | | 2,281,596 | |
| | | | | | | | |
| | | | | | $ | 11,367,233 | |
| | | | | | | | |
| Other Banks & Diversified Financials – 2.5% | |
| MasterCard, Inc., “A” | | | 8,000 | | | $ | 1,792,880 | |
| Visa, Inc., “A” | | | 34,750 | | | | 2,445,705 | |
| | | | | | | | |
| | | | | | $ | 4,238,585 | |
| | | | | | | | |
| Pharmaceuticals – 1.2% | | | | | | | | |
| Allergan, Inc. | | | 12,280 | | | $ | 843,268 | |
| Hospira, Inc. (a) | | | 9,570 | | | | 532,953 | |
| Teva Pharmaceutical Industries Ltd., ADR | | | 13,850 | | | | 722,001 | |
| | | | | | | | |
| | | | | | $ | 2,098,222 | |
| | | | | | | | |
| Pollution Control – 0.3% | | | | | | | | |
| Republic Services, Inc. | | | 17,740 | | | $ | 529,716 | |
| | | | | | | | |
| Precious Metals & Minerals – 0.5% | | | | | | | | |
| Goldcorp, Inc. | | | 19,550 | | | $ | 898,909 | |
| | | | | | | | |
| Printing & Publishing – 0.8% | | | | | | | | |
| Lamar Advertising Co., “A” (a) | | | 22,430 | | | $ | 893,611 | |
| Moody’s Corp. | | | 19,390 | | | | 514,611 | |
| | | | | | | | |
| | | | | | $ | 1,408,222 | |
| | | | | | | | |
| Railroad & Shipping – 1.5% | | | | | | | | |
| Kansas City Southern Co. (a) | | | 15,640 | | | $ | 748,530 | |
| Union Pacific Corp. | | | 20,360 | | | | 1,886,558 | |
| | | | | | | | |
| | | | | | $ | 2,635,088 | |
| | | | | | | | |
| Real Estate – 0.4% | | | | | | | | |
| Jones Lang LaSalle, Inc. | | | 9,050 | | | $ | 759,476 | |
| | | | | | | | |
| Restaurants – 1.1% | | | | | | | | |
| McDonald’s Corp. | | | 20,130 | | | $ | 1,545,179 | |
| Panera Bread Co., “A” (a) | | | 3,580 | | | | 362,332 | |
| | | | | | | | |
| | | | | | $ | 1,907,511 | |
| | | | | | | | |
| Specialty Chemicals – 1.0% | | | | | | | | |
| Airgas, Inc. | | | 5,440 | | | $ | 339,782 | |
| Praxair, Inc. | | | 14,330 | | | | 1,368,085 | |
| | | | | | | | |
| | | | | | $ | 1,707,867 | |
| | | | | | | | |
| Specialty Stores – 2.7% | | | | | | | | |
| Abercrombie & Fitch Co., “A” | | | 18,180 | | | $ | 1,047,713 | |
| Amazon.com, Inc. (a) | | | 9,800 | | | | 1,764,000 | |
| Limited Brands, Inc. | | | 33,240 | | | | 1,021,465 | |
9
MFS Growth Portfolio
Portfolio of Investments – continued
| | | | | | | | |
| Issuer | | Shares/Par | | | Value ($) | |
| | | | | | | | |
| COMMON STOCKS – continued | | | | | | | | |
| Specialty Stores – continued | | | | | | | | |
| PetSmart, Inc. | | | 13,330 | | | $ | 530,801 | |
| Tractor Supply Co. | | | 4,080 | | | | 197,839 | |
| | | | | | | | |
| | | | | | $ | 4,561,818 | |
| | | | | | | | |
| Telecommunications – Wireless – 0.2% | | | | | | | | |
| NII Holdings, Inc. (a) | | | 9,480 | | | $ | 423,377 | |
| | | | | | | | |
| Telephone Services – 1.8% | | | | | | | | |
| American Tower Corp., “A” (a) | | | 60,095 | | | $ | 3,103,306 | |
| | | | | | | | |
| Tobacco – 0.5% | | | | | | | | |
| Philip Morris International, Inc. | | | 14,700 | | | $ | 860,391 | |
| | | | | | | | |
| Trucking – 1.3% | | | | | | | | |
| Expeditors International of Washington, Inc. | | | 28,290 | | | $ | 1,544,634 | |
| FedEx Corp. | | | 6,420 | | | | 597,124 | |
| | | | | | | | |
| | | | | | $ | 2,141,758 | |
| | | | | | | | |
Total Common Stocks
(Identified Cost, $137,723,699) | | | | | | $ | 170,058,432 | |
| | | | | | | | |
| | |
| MONEY MARKET FUNDS (v) – 0.7% | | | | | | | | |
| MFS Institutional Money Market Portfolio, 0.18%, at Cost and Net Asset Value | | | 1,141,242 | | | $ | 1,141,242 | |
| | | | | | | | |
| | | | | | | | |
| Issuer | | Shares/Par | | | Value ($) | |
| | | | | | | | |
|
| COLLATERAL FOR SECURITIES LOANED – 0.2% | |
| Navigator Securities Lending Prime Portfolio, at Cost and Net Asset Value | | | 301,874 | | | $ | 301,874 | |
| | | | | | | | |
Total Investments
(Identified Cost, $139,166,815) | | | $ | 171,501,548 | |
| | | | | | | | |
OTHER ASSETS, LESS
LIABILITIES – (0.4)% | | | | (646,935 | ) |
| | | | | | | | |
| Net Assets – 100.0% | | | $ | 170,854,613 | |
| | | | | | | | |
| (a) | Non-income producing security. |
| (l) | All or a portion of this security is on loan. |
| (s) | Security or a portion of the security was pledged to cover collateral requirements for securities sold short. At December 31, 2010, the value of securities pledged amounted to $531,268. At December 31, 2010, the fund had no short sales outstanding. |
| (v) | Underlying fund that is available only to investment companies managed by MFS. The rate quoted is the annualized seven-day yield of the fund at period end. |
The following abbreviations are used in this report and are defined:
| ADR | | American Depository Receipt |
| PLC | | Public Limited Company |
See Notes to Financial Statements
10
MFS Growth Portfolio
FINANCIAL STATEMENTS | STATEMENT OF ASSETS AND LIABILITIES
This statement represents your fund’s balance sheet, which details the assets and liabilities comprising the total value of the fund.
| | | | | | | | |
At 12/31/10 | | | | | | | | |
Assets | | | | | | | | |
Investments – | | | | | | | | |
Non-affiliated issuers, at value (identified cost, $138,025,573) | | | $170,360,306 | | | | | |
Underlying funds, at cost and value | | | 1,141,242 | | | | | |
Total investments, at value, including $293,726 of securities on loan (identified cost, $139,166,815) | | | $171,501,548 | | | | | |
Cash | | | 4,255 | | | | | |
Receivable for interest and dividends | | | 101,896 | | | | | |
Other assets | | | 5,314 | | | | | |
Total assets | | | | | | | $171,613,013 | |
Liabilities | | | | | | | | |
Payables for | | | | | | | | |
Investments purchased | | | $219,487 | | | | | |
Fund shares reacquired | | | 170,969 | | | | | |
Collateral for securities loaned, at value | | | 301,874 | | | | | |
Payable to affiliates | | | | | | | | |
Investment adviser | | | 7,041 | | | | | |
Distribution and/or service fees | | | 193 | | | | | |
Administrative services fee | | | 341 | | | | | |
Payable for Trustees’ compensation | | | 184 | | | | | |
Accrued expenses and other liabilities | | | 58,311 | | | | | |
Total liabilities | | | | | | | $758,400 | |
Net assets | | | | | | | $170,854,613 | |
Net assets consist of | | | | | | | | |
Paid-in capital | | | $165,452,954 | | | | | |
Unrealized appreciation (depreciation) on investments and translation of assets and liabilities in foreign currencies | | | 32,335,569 | | | | | |
Accumulated net realized gain (loss) on investments and foreign currency transactions | | | (27,182,409 | ) | | | | |
Undistributed net investment income | | | 248,499 | | | | | |
Net assets | | | | | | | $170,854,613 | |
Shares of beneficial interest outstanding | | | | | | | 7,697,576 | |
| | | | | | | | | | | | |
| | | Net assets | | | Shares
outstanding | | | Net asset value
per share | |
Initial Class | | | $156,785,343 | | | | 7,053,148 | | | | $22.23 | |
Service Class | | | 14,069,270 | | | | 644,428 | | | | 21.83 | |
See Notes to Financial Statements
11
MFS Growth Portfolio
FINANCIAL STATEMENTS | STATEMENT OF OPERATIONS
This statement describes how much your fund earned in investment income and accrued in expenses. It also describes any gains and/or losses generated by fund operations.
| | | | | | | | |
Year ended 12/31/10 | | | | | | | | |
| Net investment income | | | | | | | | |
Income | | | | | | | | |
Dividends | | | $1,770,470 | | | | | |
Interest | | | 8,694 | | | | | |
Dividends from underlying funds | | | 5,909 | | | | | |
Foreign taxes withheld | | | (13,132 | ) | | | | |
Total investment income | | | | | | | $1,771,941 | |
Expenses | | | | | | | | |
Management fee | | | $1,211,042 | | | | | |
Distribution and/or service fees | | | 33,040 | | | | | |
Administrative services fee | | | 58,754 | | | | | |
Trustees’ compensation | | | 22,433 | | | | | |
Custodian fee | | | 43,948 | | | | | |
Shareholder communications | | | 18,200 | | | | | |
Auditing fees | | | 39,305 | | | | | |
Legal fees | | | 7,190 | | | | | |
Miscellaneous | | | 19,960 | | | | | |
Total expenses | | | | | | | $1,453,872 | |
Fees paid indirectly | | | (15 | ) | | | | |
Net expenses | | | | | | | $1,453,857 | |
Net investment income | | | | | | | $318,084 | |
Realized and unrealized gain (loss) on investments and foreign currency transactions | | | | | | | | |
Realized gain (loss) (identified cost basis) | | | | | | | | |
Investment transactions (s) | | | $14,193,331 | | | | | |
Foreign currency transactions | | | (68,547 | ) | | | | |
Net realized gain (loss) on investments and foreign currency transactions | | | | | | | $14,124,784 | |
Change in unrealized appreciation (depreciation) | | | | | | | | |
Investments | | | $9,292,440 | | | | | |
Translation of assets and liabilities in foreign currencies | | | 631 | | | | | |
Net unrealized gain (loss) on investments and foreign currency translation | | | | | | | $9,293,071 | |
Net realized and unrealized gain (loss) on investments and foreign currency | | | | | | | $23,417,855 | |
Change in net assets from operations | | | | | | | $23,735,939 | |
| (s) | Realized gain (loss) on investment transactions includes proceeds received from a non-recurring cash settlement in the amount of $794,947 from a litigation settlement against Tyco International Ltd. |
See Notes to Financial Statements
12
MFS Growth Portfolio
FINANCIAL STATEMENTS | STATEMENTS OF CHANGES IN NET ASSETS
These statements describe the increases and/or decreases in net assets resulting from operations, any distributions, and any shareholder transactions.
| | | | | | | | |
For years ended 12/31 | | | 2010 | | | | 2009 | |
Change in net assets | | | | | | | | |
From operations | | | | | | | | |
Net investment income | | | $318,084 | | | | $138,089 | |
Net realized gain (loss) on investments and foreign currency transactions | | | 14,124,784 | | | | (8,750,988 | ) |
Net unrealized gain (loss) on investments and foreign currency translation | | | 9,293,071 | | | | 56,941,221 | |
Change in net assets from operations | | | $23,735,939 | | | | $48,328,322 | |
Distributions declared to shareholders | | | | | | | | |
From net investment income | | | $(127,589 | ) | | | $(381,689 | ) |
Change in net assets from fund share transactions | | | $(22,395,996 | ) | | | $(23,251,969 | ) |
Total change in net assets | | | $1,212,354 | | | | $24,694,664 | |
Net assets | | | | | | | | |
At beginning of period | | | 169,642,259 | | | | 144,947,595 | |
At end of period (including undistributed net investment income of $248,499 and
$126,551, respectively) | | | $170,854,613 | | | | $169,642,259 | |
See Notes to Financial Statements
13
MFS Growth Portfolio
FINANCIAL STATEMENTS | FINANCIAL HIGHLIGHTS
The financial highlights table is intended to help you understand the fund’s financial performance for the past 5 years. Certain information reflects financial results for a single fund share. The total returns in the table represent the rate by which an investor would have earned (or lost) on an investment in the fund share class (assuming reinvestment of all distributions) held for the entire period.
| | | | | | | | | | | | | | | | | | | | |
| Initial Class | | Years ended 12/31 | |
| | | 2010 | | | 2009 | | | 2008 | | | 2007 | | | 2006 | |
Net asset value, beginning of period | | | $19.21 | | | | $13.99 | | | | $22.37 | | | | $18.45 | | | | $17.08 | |
| Income (loss) from investment operations | | | | | | | | | | | | | | | | | | | | |
Net investment income (loss) (d) | | | $0.04 | | | | $0.02 | | | | $0.04 | | | | $0.04 | | | | $(0.02 | ) |
Net realized and unrealized gain (loss) on investments
and foreign currency | | | 3.00 | | | | 5.24 | | | | (8.37 | ) | | | 3.88 | | | | 1.39 | |
Total from investment operations | | | $3.04 | | | | $5.26 | | | | $(8.33 | ) | | | $3.92 | | | | $1.37 | |
Less distributions declared to shareholders | | | | | | | | | | | | | | | | | | | | |
From net investment income | | | $(0.02 | ) | | | $(0.04 | ) | | | $(0.05 | ) | | | $— | | | | $— | |
Net asset value, end of period | | | $22.23 | | | | $19.21 | | | | $13.99 | | | | $22.37 | | | | $18.45 | |
Total return (%) (k)(s) | | | 15.81 | | | | 37.74 | | | | (37.33 | ) | | | 21.25 | | | | 8.02 | |
Ratios (%) (to average net assets)
and Supplemental data: | | | | | | | | | | | | | | | | | | | | |
Expenses (f) | | | 0.88 | | | | 0.89 | | | | 0.88 | | | | 0.84 | | | | 0.83 | |
Net investment income (loss) | | | 0.22 | | | | 0.11 | | | | 0.21 | | | | 0.19 | | | | (0.14 | ) |
Portfolio turnover | | | 99 | | | | 95 | | | | 120 | | | | 76 | | | | 123 | |
Net assets at end of period (000 omitted) | | | $156,785 | | | | $155,357 | | | | $131,692 | | | | $264,089 | | | | $291,965 | |
| |
| Service Class | | Years ended 12/31 | |
| | | 2010 | | | 2009 | | | 2008 | | | 2007 | | | 2006 | |
Net asset value, beginning of period | | | $18.90 | | | | $13.75 | | | | $22.01 | | | | $18.19 | | | | $16.89 | |
Income (loss) from investment operations | | | | | | | | | | | | | | | | | | | | |
Net investment loss (d) | | | $(0.01 | ) | | | $(0.02 | ) | | | $(0.01 | ) | | | $(0.01 | ) | | | $(0.07 | ) |
Net realized and unrealized gain (loss) on investments
and foreign currency | | | 2.94 | | | | 5.17 | | | | (8.25 | ) | | | 3.83 | | | | 1.37 | |
Total from investment operations | | | $2.93 | | | | $5.15 | | | | $(8.26 | ) | | | $3.82 | | | | $1.30 | |
Net asset value, end of period | | | $21.83 | | | | $18.90 | | | | $13.75 | | | | $22.01 | | | | $18.19 | |
Total return (%) (k)(s) | | | 15.50 | | | | 37.45 | | | | (37.53 | ) | | | 21.00 | | | | 7.70 | |
Ratios (%) (to average net assets)
and Supplemental data: | | | | | | | | | | | | | | | | | | | | |
Expenses (f) | | | 1.13 | | | | 1.14 | | | | 1.13 | | | | 1.09 | | | | 1.08 | |
Net investment loss | | | (0.03 | ) | | | (0.14 | ) | | | (0.04 | ) | | | (0.06 | ) | | | (0.38 | ) |
Portfolio turnover | | | 99 | | | | 95 | | | | 120 | | | | 76 | | | | 123 | |
Net assets at end of period (000 omitted) | | | $14,069 | | | | $14,286 | | | | $13,256 | | | | $23,773 | | | | $21,538 | |
| (d) | Per share data is based on average shares outstanding. |
| (f) | Ratios do not reflect reductions from fees paid indirectly, if applicable. |
| (k) | The total return does not reflect expenses that apply to separate accounts. Inclusion of these charges would reduce the total return figures for all periods shown. |
| (s) | From time to time the fund may receive proceeds from litigation settlements, without which performance would be lower. Excluding the effect of the proceeds received from a non-recurring litigation settlement against Tyco International Ltd., the Initial Class and Service Class total returns for the year ended December 31, 2010 would have each been lower by approximately 0.61%. |
See Notes to Financial Statements
14
MFS Growth Portfolio
NOTES TO FINANCIAL STATEMENTS
| (1) | | Business and Organization |
MFS Growth Portfolio (the fund) is a series of MFS Variable Insurance Trust II (the trust). The trust is organized as a Massachusetts business trust and is registered under the Investment Company Act of 1940, as amended, as an open-end management investment company. The shareholders of each series of the trust are separate accounts of insurance companies, which offer variable annuity and/or life insurance products, and qualified retirement and pension plans.
| (2) | | Significant Accounting Policies |
General – The preparation of financial statements in conformity with U.S. generally accepted accounting principles requires management to make estimates and assumptions that affect the reported amounts of assets and liabilities, and disclosure of contingent assets and liabilities at the date of the financial statements and the reported amounts of revenues and expenses during the reporting period. Actual results could differ from those estimates. In the preparation of these financial statements, management has evaluated subsequent events occurring after the date of the fund’s Statement of Assets and Liabilities through the date that the financial statements were issued. The fund invests in foreign securities, including securities of emerging market issuers. Investments in foreign securities are vulnerable to the effects of changes in the relative values of the local currency and the U.S. dollar and to the effects of changes in each country’s legal, political, and economic environment. The markets of emerging markets countries are generally more volatile than the markets of developed countries with more mature economies. All of the risks of investing in foreign securities previously described are heightened when investing in emerging markets countries.
Investment Valuations – Equity securities, including restricted equity securities, are generally valued at the last sale or official closing price as provided by a third-party pricing service on the market or exchange on which they are primarily traded. Equity securities, for which there were no sales reported that day, are generally valued at the last quoted daily bid quotation as provided by a third-party pricing service on the market or exchange on which such securities are primarily traded. Equity securities held short, for which there were no sales reported for that day, are generally valued at the last quoted daily ask quotation as provided by a third-party pricing service on the market or exchange on which such securities are primarily traded. Short-term instruments with a maturity at issuance of 60 days or less generally are valued at amortized cost, which approximates market value. Exchange-traded options are generally valued at the last sale or official closing price as provided by a third-party pricing service on the exchange on which such options are primarily traded. Exchange-traded options for which there were no sales reported that day are generally valued at the last daily bid quotation as provided by a third-party pricing service on the exchange on which such options are primarily traded. Options not traded on an exchange are generally valued at a broker/dealer bid quotation. Foreign currency options are generally valued at valuations provided by a third-party pricing service. Open-end investment companies are generally valued at net asset value per share. Securities and other assets generally valued on the basis of information from a third-party pricing service may also be valued at a broker/dealer bid quotation. Values obtained from third-party pricing services can utilize both transaction data and market information such as yield, quality, coupon rate, maturity, type of issue, trading characteristics, and other market data. The values of foreign securities and other assets and liabilities expressed in foreign currencies are converted to U.S. dollars using the mean of bid and asked prices for rates provided by a third-party pricing service.
The Board of Trustees has delegated primary responsibility for determining or causing to be determined the value of the fund’s investments (including any fair valuation) to the adviser pursuant to valuation policies and procedures approved by the Board. If the adviser determines that reliable market quotations are not readily available, investments are valued at fair value as determined in good faith by the adviser in accordance with such procedures under the oversight of the Board of Trustees. Under the fund’s valuation policies and procedures, market quotations are not considered to be readily available for most types of debt instruments and floating rate loans and many types of derivatives. These investments are generally valued at fair value based on information from third-party pricing services. In addition, investments may be valued at fair value if the adviser determines that an investment’s value has been materially effected by events occurring after the close of the exchange or market on which the investment is principally traded (such as foreign exchange or market) and prior to the determination of the fund’s net asset value, or after the halting of trading of a specific security where trading does not resume prior to the close of the exchange or market on which the security is principally traded. Events that occur on a frequent basis after foreign markets close (such as developments in foreign markets and significant movements in the U.S. markets) and prior to the determination of the fund’s net asset value may be deemed to have a material effect on the value of securities traded in foreign markets. Accordingly, the fund’s foreign equity securities may often be valued at fair value. The adviser generally relies on third-party pricing services or other information (such as the correlation with price movements of similar securities in the same or other markets; the type, cost and investment characteristics of the security; the business and financial condition of the issuer; and trading and other market data) to assist in determining whether to fair value and at what value to fair value an investment. The value of an investment for purposes of calculating the fund’s net asset value can differ depending on the
15
MFS Growth Portfolio
Notes to Financial Statements – continued
source and method used to determine value. When fair valuation is used, the value of an investment used to determine the fund’s net asset value may differ from quoted or published prices for the same investment. There can be no assurance that the fund could obtain the fair value assigned to an investment if it were to sell the investment at the same time at which the fund determines its net asset value per share.
Various inputs are used in determining the value of the fund’s assets or liabilities. These inputs are categorized into three broad levels. In certain cases, the inputs used to measure fair value may fall into different levels of the fair value hierarchy. In such cases, an investment’s level within the fair value hierarchy is based on the lowest level of input that is significant to the fair value measurement. The fund’s assessment of the significance of a particular input to the fair value measurement in its entirety requires judgment, and considers factors specific to the investment. Level 1 includes unadjusted quoted prices in active markets for identical assets or liabilities. Level 2 includes other significant observable market-based inputs (including quoted prices for similar securities, interest rates, prepayment speed, and credit risk). Level 3 includes unobservable inputs, which may include the adviser’s own assumptions in determining the fair value of investments. The following is a summary of the levels used as of December 31, 2010 in valuing the fund’s assets or liabilities:
| | | | | | | | | | | | | | | | |
| Investments at Value | | Level 1 | | | Level 2 | | | Level 3 | | | Total | |
| Equity Securities | | | $170,058,432 | | | | $— | | | | $— | | | | $170,058,432 | |
| Mutual Funds | | | 1,443,116 | | | | — | | | | — | | | | 1,443,116 | |
| Total Investments | | | $171,501,548 | | | | $— | | | | $— | | | | $171,501,548 | |
For further information regarding security characteristics, see the Portfolio of Investments.
Foreign Currency Translation – Purchases and sales of foreign investments, income, and expenses are converted into U.S. dollars based upon currency exchange rates prevailing on the respective dates of such transactions or on the reporting date for foreign denominated receivables and payables. Gains and losses attributable to foreign currency exchange rates on sales of securities are recorded for financial statement purposes as net realized gains and losses on investments. Gains and losses attributable to foreign exchange rate movements on receivables, payables, income and expenses are recorded for financial statement purposes as foreign currency transaction gains and losses. That portion of both realized and unrealized gains and losses on investments that results from fluctuations in foreign currency exchange rates is not separately disclosed.
Derivatives – The fund uses derivatives for different purposes, including to earn income and enhance returns, to increase or decrease exposure to a particular market, to manage or adjust the risk profile of the fund, or as alternatives to direct investments. Derivatives are used for hedging or non-hedging purposes. While hedging can reduce or eliminate losses, it can also reduce or eliminate gains. When the fund uses derivatives as an investment to increase market exposure, or for hedging purposes, gains and losses from derivative instruments may be substantially greater than the derivative’s original cost.
Derivative instruments used by the fund during the period include purchased options. At December 31, 2010, the fund did not have any outstanding derivative instruments.
The following table presents, by major type of derivative contract, the realized gain (loss) on derivatives held by the fund for the year ended December 31, 2010 as reported in the Statement of Operations:
| | | | |
| Risk | | Investment
Transactions
(Purchased Options) | |
| Equity Contracts | | | $(60,379 | ) |
There is no unrealized gain (loss) from derivative transactions at period end.
Derivative counterparty credit risk is managed through formal evaluation of the creditworthiness of all potential counterparties. On certain over-the-counter derivatives, the fund attempts to reduce its exposure to counterparty credit risk whenever possible by entering into an International Swaps and Derivatives Association (ISDA) Master Agreement on a bilateral basis with each of the counterparties with whom it undertakes a significant volume of transactions. The ISDA Master Agreement gives each party to the agreement the right to terminate all transactions traded under such agreement if there is a certain deterioration in the credit quality of the other party. The ISDA Master Agreement gives the fund the right, upon an event of default by the applicable counterparty or a termination of the agreement, to close out all transactions traded under such agreement and to net amounts owed under each transaction to one net amount payable by one party to the other. This right to close out and net payments across all transactions traded under the ISDA Master Agreement could result in a reduction of the fund’s credit risk to such counterparty equal to any amounts payable by the fund under the applicable transactions, if any. However, absent an event of default by the counterparty or a termination of the agreement, the ISDA Master Agreement does not result in an offset of reported amounts of assets and liabilities in the Statement of Assets and Liabilities across transactions between the fund and the applicable counterparty.
16
MFS Growth Portfolio
Notes to Financial Statements – continued
Collateral requirements differ by type of derivative. Collateral or margin requirements are set by the broker or exchange clearing house for exchange traded derivatives (i.e., futures and exchange-traded options) while collateral terms are contract specific for over-the-counter traded derivatives (i.e., forwards, swaps and over-the-counter options). For derivatives traded under an ISDA Master Agreement, the collateral requirements are netted across all transactions traded under such agreement and one amount is posted from one party to the other to collateralize such obligations. Cash collateral that has been pledged to cover obligations of the fund under derivative contracts, if any, will be reported separately on the Statement of Assets and Liabilities as restricted cash. Securities collateral pledged for the same purpose, if any, is noted in the Portfolio of Investments.
Purchased Options – The fund purchased put options for a premium. Purchased put options entitle the holder to sell a specified number of shares or units of a particular security, currency or index at a specified price at a specified date or within a specified period of time.
The premium paid is initially recorded as an investment in the Statement of Assets and Liabilities. That investment is subsequently marked-to-market daily with the difference between the premium paid and the market value of the purchased option being recorded as unrealized appreciation or depreciation. Premiums paid for purchased put options which have expired are treated as realized losses on investments in the Statement of Operations.
The risk in purchasing an option is that the fund pays a premium whether or not the option is exercised. The fund’s maximum risk of loss due to counterparty credit risk is limited to the market value of the option. For over-the-counter options, this risk is mitigated in cases where there is an ISDA Master Agreement between the fund and the counterparty providing for netting as described above and for posting of collateral by the counterparty to the fund to cover the fund’s exposure to the counterparty under such ISDA Master Agreement.
Short Sales – The fund may enter into short sales whereby it sells a security it does not own in anticipation of a decline in the value of that security. The fund will realize a gain if the security price decreases and a loss if the security price increases between the date of the short sale and the date on which the fund replaces the borrowed security. Losses from short sales can exceed the proceeds of the security sold; and they can also exceed the potential loss from an ordinary buy and sell transaction. The amount of any premium, dividends, or interest the fund may be required to pay in connection with a short sale will be recognized as a fund expense. The fund segregates cash or marketable securities in an amount that, when combined with the amount of proceeds from the short sale deposited with the broker, at least equals the current market value of the security sold short. At December 31, 2010, the fund has yet to enter into such transactions.
Security Loans – State Street Bank and Trust Company (“State Street”), as lending agent, loans the securities of the fund to certain qualified institutions (the “Borrowers”) approved by the fund. The loans are collateralized by cash and/or U.S. Treasury and federal agency obligations in an amount typically at least equal to the market value of the securities loaned. The market value of the loaned securities is determined at the close of business of the fund and any additional required collateral is delivered to the fund on the next business day. State Street provides the fund with indemnification against Borrower default. The fund bears the risk of loss with respect to the investment of cash collateral. On loans collateralized by cash, the cash collateral is invested in a money market fund or short-term securities. A portion of the income generated upon investment of the collateral is remitted to the Borrowers, and the remainder is allocated between the fund and the lending agent. On loans collateralized by U.S. Treasury and/or federal agency obligations, a fee is received from the Borrower, and is allocated between the fund and the lending agent. Income from securities lending is included in interest income on the Statement of Operations. The dividend and interest income earned on the securities loaned is accounted for in the same manner as other dividend and interest income.
Indemnifications – Under the fund’s organizational documents, its officers and Trustees may be indemnified against certain liabilities and expenses arising out of the performance of their duties to the fund. Additionally, in the normal course of business, the fund enters into agreements with service providers that may contain indemnification clauses. The fund’s maximum exposure under these agreements is unknown as this would involve future claims that may be made against the fund that have not yet occurred.
Investment Transactions and Income – Investment transactions are recorded on the trade date. Interest income is recorded on the accrual basis. Dividends received in cash are recorded on the ex-dividend date. Certain dividends from foreign securities will be recorded when the fund is informed of the dividend if such information is obtained subsequent to the ex-dividend date. Dividend and interest payments received in additional securities are recorded on the ex-dividend or ex-interest date in an amount equal to the value of the security on such date.
The fund may receive proceeds from litigation settlements. Any proceeds received from litigation involving portfolio holdings are reflected in the Statement of Operations in realized gain/loss if the security has been disposed of by the fund or in unrealized gain/loss if the security is still held by the fund. Any other proceeds from litigation not related to portfolio holdings
17
MFS Growth Portfolio
Notes to Financial Statements – continued
are reflected as other income in the Statement of Operations. On September 6, 2010, the fund received $493,968 and on September 9, 2010, the fund received $300,979 from a non-recurring litigation settlement against Tyco International Ltd.
Fees Paid Indirectly – The fund’s custody fee may be reduced according to an arrangement that measures the value of cash deposited with the custodian by the fund. This amount, for the year ended December 31, 2010, is shown as a reduction of total expenses on the Statement of Operations.
Tax Matters and Distributions – The fund intends to qualify as a regulated investment company, as defined under Subchapter M of the Internal Revenue Code, and to distribute all of its taxable income, including realized capital gains. As a result, no provision for federal income tax is required. The fund’s federal tax returns for the prior three fiscal years remain subject to examination by the Internal Revenue Service. Foreign taxes, if any, have been accrued by the fund in the accompanying financial statements.
Distributions to shareholders are recorded on the ex-dividend date. Income and capital gain distributions are determined in accordance with income tax regulations, which may differ from U.S. generally accepted accounting principles. Certain capital accounts in the financial statements are periodically adjusted for permanent differences in order to reflect their tax character. These adjustments have no impact on net assets or net asset value per share. Temporary differences which arise from recognizing certain items of income, expense, gain or loss in different periods for financial statement and tax purposes will reverse at some time in the future. Distributions in excess of net investment income or net realized gains are temporary overdistributions for financial statement purposes resulting from differences in the recognition or classification of income or distributions for financial statement and tax purposes.
Book/tax differences primarily relate to expiration of capital loss carryforwards, wash sale loss deferrals, and straddle loss deferrals.
The tax character of distributions declared to shareholders for the last two fiscal years is as follows:
| | | | | | | | |
| | | 12/31/10 | | | 12/31/09 | |
| Ordinary income (including any short-term capital gains) | | | $127,589 | | | | $381,689 | |
The federal tax cost and the tax basis components of distributable earnings were as follows:
| | | | |
| As of 12/31/10 | | | | |
| Cost of investments | | | $139,621,208 | |
| Gross appreciation | | | 32,489,293 | |
| Gross depreciation | | | (608,953 | ) |
| Net unrealized appreciation (depreciation) | | | $31,880,340 | |
| Undistributed ordinary income | | | 248,499 | |
| Capital loss carryforwards | | | (26,667,637 | ) |
| Other temporary differences | | | (59,543 | ) |
As of December 31, 2010, the fund had capital loss carryforwards available to offset future realized gains. Such losses expire as follows:
| | | | |
| 12/31/16 | | | $(16,338,857 | ) |
| 12/31/17 | | | (10,328,780 | ) |
| Total | | | $(26,667,637 | ) |
Multiple Classes of Shares of Beneficial Interest – The fund offers multiple classes of shares, which differ in their respective distribution and/or service fees. The fund’s income, realized and unrealized gain (loss), and common expenses are allocated to shareholders based on the daily net assets of each class. Dividends are declared separately for each class. Differences in per share dividend rates are generally due to differences in separate class expenses. The fund’s distributions declared to shareholders as reported on the Statements of Changes in Net Assets are presented by class as follows:
| | | | | | | | |
| | | From net investment
income | |
| | | Year ended
12/31/10 | | | Year ended
12/31/09 | |
| Initial Class | | | $127,589 | | | | $381,689 | |
| (3) | | Transactions with Affiliates |
Investment Adviser – The fund has an investment advisory agreement with MFS to provide overall investment management and related administrative services and facilities to the fund. The management fee is computed daily and paid monthly at the following annual rates:
| | | | |
| First $300 million of average daily net assets | | | 0.75% | |
| Average daily net assets in excess of $300 million | | | 0.675% | |
18
MFS Growth Portfolio
Notes to Financial Statements – continued
The management fee incurred for the year ended December 31, 2010 was equivalent to an annual effective rate of 0.75% of the fund’s average daily net assets.
Distributor – MFS Fund Distributors, Inc. (MFD), a wholly-owned subsidiary of MFS, is the distributor of shares of the fund. The Trustees have adopted a distribution plan for the Service Class shares pursuant to Rule 12b-1 under the Investment Company Act of 1940.
The fund’s distribution plan provides that the fund will pay MFD distribution and/or service fees equal to 0.25% per annum of its average daily net assets attributable to Service Class shares as partial consideration for services performed and expenses incurred by MFD and financial intermediaries (including participating insurance companies that invest in the fund to fund variable annuity and variable life insurance contracts, sponsors of qualified retirement and pension plans that invest in the fund, and affiliates of these participating insurance companies and plan sponsors) in connection with the sale and distribution of the Service Class shares. MFD may subsequently pay all, or a portion, of the distribution and/or service fees to financial intermediaries.
Shareholder Servicing Agent – MFS Service Center, Inc. (MFSC), a wholly-owned subsidiary of MFS, has contracted to provide transfer agent and recordkeeping functions in connection with the issuance, transfer, and redemption of each class of shares of the fund under a Shareholder Servicing Agent Agreement. During the year ended December 31, 2010, the fund did not pay MFSC a fee for this service.
Administrator – MFS provides certain financial, legal, shareholder communications, compliance, and other administrative services to the fund. Under an administrative services agreement, the fund partially reimburses MFS the costs incurred to provide these services. The fund is charged an annual fixed amount of $10,000 plus a fee based on average daily net assets. The administrative services fee incurred for the year ended December 31, 2010 was equivalent to an annual effective rate of 0.0364% of the fund’s average daily net assets.
Trustees’ and Officers’ Compensation – The fund pays compensation to Trustees in the form of a retainer, attendance fees, and additional compensation to the Board chairperson. The fund does not pay compensation directly to officers of the fund who are also officers of the investment adviser, all of whom receive remuneration for their services to the fund from MFS. Certain officers of the fund are officers or directors of MFS, MFD, and MFSC.
Other – This fund and certain other funds managed by MFS (the funds) have entered into services agreements (the Agreements) which provide for payment of fees by the funds to Tarantino LLC and Griffin Compliance LLC in return for the provision of services of an Independent Chief Compliance Officer (ICCO) and Assistant ICCO, respectively, for the funds. The ICCO and Assistant ICCO are officers of the funds and the sole members of Tarantino LLC and Griffin Compliance LLC, respectively. The funds can terminate the Agreements with Tarantino LLC and Griffin Compliance LLC at any time under the terms of the Agreements. MFS has agreed to bear all expenses associated with office space, other administrative support, and supplies provided to the ICCO and Assistant ICCO. For the year ended December 31, 2010, the aggregate fees paid by the fund to Tarantino LLC and Griffin Compliance LLC were $2,736 and are included in miscellaneous expense on the Statement of Operations.
The fund invests in the MFS Institutional Money Market Portfolio which is managed by MFS and seeks a high level of current income consistent with preservation of capital and liquidity. Income earned on this investment is included in dividends from underlying funds on the Statement of Operations. This money market fund does not pay a management fee to MFS.
Purchases and sales of investments, other than U.S. Government securities, purchased option transactions, and short-term obligations, aggregated $156,639,512 and $175,163,711, respectively.
19
MFS Growth Portfolio
Notes to Financial Statements – continued
| (5) | | Shares of Beneficial Interest |
The fund’s Declaration of Trust permits the Trustees to issue an unlimited number of full and fractional shares of beneficial interest. Transactions in fund shares were as follows:
| | | | | | | | | | | | | | | | |
| | | Year ended 12/31/10 | | | Year ended 12/31/09 | |
| | | Shares | | | Amount | | | Shares | | | Amount | |
| Shares sold | | | | | | | | | | | | | | | | |
Initial Class | | | 77,719 | | | | $1,522,967 | | | | 74,869 | | | | $1,153,758 | |
Service Class | | | 54,474 | | | | 1,085,267 | | | | 65,640 | | | | 987,139 | |
| | | 132,193 | | | | $2,608,234 | | | | 140,509 | | | | $2,140,897 | |
| Shares issued to shareholders in reinvestment of distributions | | | | | | | | | | | | | | | | |
Initial Class | | | 6,113 | | | | $127,589 | | | | 27,147 | | | | $381,689 | |
| Shares reacquired | | | | | | | | | | | | | | | | |
Initial Class | | | (1,118,255 | ) | | | $(21,944,381 | ) | | | (1,429,039 | ) | | | $(21,797,038 | ) |
Service Class | | | (165,950 | ) | | | (3,187,438 | ) | | | (273,528 | ) | | | (3,977,517 | ) |
| | | (1,284,205 | ) | | | $(25,131,819 | ) | | | (1,702,567 | ) | | | $(25,774,555 | ) |
| Net change | | | | | | | | | | | | | | | | |
Initial Class | | | (1,034,423 | ) | | | $(20,293,825 | ) | | | (1,327,023 | ) | | | $(20,261,591 | ) |
Service Class | | | (111,476 | ) | | | (2,102,171 | ) | | | (207,888 | ) | | | (2,990,378 | ) |
| | | (1,145,899 | ) | | | $(22,395,996 | ) | | | (1,534,911 | ) | | | $(23,251,969 | ) |
The fund and certain other funds managed by MFS participate in a $1.1 billion unsecured committed line of credit, subject to a $1 billion sublimit, provided by a syndication of banks under a credit agreement. Borrowings may be made for temporary financing needs. Interest is charged to each fund, based on its borrowings, generally at a rate equal to the higher of the Federal Reserve funds rate or one month LIBOR plus an agreed upon spread. A commitment fee, based on the average daily, unused portion of the committed line of credit, is allocated among the participating funds at the end of each calendar quarter. In addition, the fund and other funds managed by MFS have established unsecured uncommitted borrowing arrangements with certain banks for temporary financing needs. Interest is charged to each fund, based on its borrowings, at a rate equal to the Federal Reserve funds rate plus an agreed upon spread. For the year ended December 31, 2010, the fund’s commitment fee and interest expense were $1,807 and $0, respectively, and are included in miscellaneous expense on the Statement of Operations.
| (7) | | Transactions in Underlying Funds – Affiliated Issuers |
An affiliated issuer may be considered one in which the fund owns 5% or more of the outstanding voting securities, or a company which is under common control. For the purposes of this report, the fund assumes the following to be affiliated issuers:
| | | | | | | | | | | | | | | | |
| Underlying Funds | | Beginning
Shares/Par
Amount | | | Acquisitions
Shares/Par
Amount | | | Dispositions
Shares/Par
Amount | | | Ending
Shares/Par
Amount | |
| MFS Institutional Money Market Portfolio | | | 3,530,908 | | | | 41,848,985 | | | | (44,238,651 | ) | | | 1,141,242 | |
| | | | |
| Underlying Funds | | Realized
Gain (Loss) | | | Capital Gain
Distributions | | | Dividend
Income | | | Ending
Value | |
| MFS Institutional Money Market Portfolio | | | $— | | | | $— | | | | $5,909 | | | | $1,141,242 | |
20
MFS Growth Portfolio
REPORT OF INDEPENDENT REGISTERED PUBLIC ACCOUNTING FIRM
To the Board of Trustees of MFS Variable Insurance Trust II and the Shareholders of
MFS Growth Portfolio:
We have audited the accompanying statement of assets and liabilities, including the portfolio of investments, of MFS Growth Portfolio (the “Fund”) (one of the portfolios comprising MFS Variable Insurance Trust II) as of December 31, 2010, and the related statement of operations for the year then ended, the statements of changes in net assets for each of the two years in the period then ended, and the financial highlights for each of the five years in the period then ended. These financial statements and financial highlights are the responsibility of the Fund’s management. Our responsibility is to express an opinion on these financial statements and financial highlights based on our audits.
We conducted our audits in accordance with the standards of the Public Company Accounting Oversight Board (United States). Those standards require that we plan and perform the audit to obtain reasonable assurance about whether the financial statements and financial highlights are free of material misstatement. The Fund is not required to have, nor were we engaged to perform, an audit of its internal control over financial reporting. Our audits included consideration of internal control over financial reporting as a basis for designing audit procedures that are appropriate in the circumstances, but not for the purpose of expressing an opinion on the effectiveness of the Fund’s internal control over financial reporting. Accordingly, we express no such opinion. An audit also includes examining, on a test basis, evidence supporting the amounts and disclosures in the financial statements, assessing the accounting principles used and significant estimates made by management, as well as evaluating the overall financial statement presentation. Our procedures included confirmation of securities owned as of December 31, 2010, by correspondence with the custodian. We believe that our audits provide a reasonable basis for our opinion.
In our opinion, the financial statements and financial highlights referred to above present fairly, in all material respects, the financial position of MFS Growth Portfolio as of December 31, 2010, the results of its operations for the year then ended, the changes in its net assets for each of the two years in the period then ended, and the financial highlights for each of the five years in the period then ended, in conformity with accounting principles generally accepted in the United States of America.
DELOITTE & TOUCHE LLP
Boston, Massachusetts
February 14, 2011
21
MFS Growth Portfolio
TRUSTEES AND OFFICERS – IDENTIFICATION AND BACKGROUND
The Trustees and officers of the Trust, as of February 1, 2011, are listed below, together with their principal occupations during the past five years. (Their titles may have varied during that period.) The address of each Trustee and officer is 500 Boylston Street, Boston, Massachusetts 02116.
| | | | | | |
Name, Date of Birth | | Position(s) Held
with Fund | | Trustee/Officer
Since (1) | | Principal Occupations During the Past Five Years and
Other Directorships (2) |
| INTERESTED TRUSTEE | | | | |
David D. Horn (3) (born 6/07/41) | | Trustee | | April 1986 | | Private investor; Sun Life Assurance Company of Canada, Senior Vice President and General Manager for the United States (until 1997); Director (until March 2004) |
| | |
| INDEPENDENT TRUSTEES | | | | |
J. Kermit Birchfield (born 1/08/40) | | Chairman | | May 1997 | | Consultant; Century Partners, Inc. (investments), Director; Displaytech, Inc. (technology), Chairman; Dessin Fournir LLC (furniture manufacturer), Director; Site Watch LLC (software to monitor oil tanks), Managing Director (2006 to present); Juridica Investments (fund investing in judicial matters), Director (2007 to present), Immuno Science, Inc. (medical research), Independent Director (2009 to present), Intermountain Industries, Inc. (oil & gas exploration and production), Director (until February 2009) |
| | | |
Robert C. Bishop (born 1/13/43) | | Trustee | | May 2001 | | AutoImmune, Inc. (pharmaceutical product development), Chairman, President and Chief Executive Officer; Caliper Life Sciences Corp. (laboratory analytical instruments), Chairman; Optobionics Corporation (ophthalmic devices), Director (until 2007); Millipore Corporation (purification/filtration products), Director (until July 2010); Waterstreet Capital (leverage buyouts), Advisory Board (until August 2010) |
| | | |
Frederick H. Dulles (born 3/12/42) | | Trustee | | May 2001 | | Dulles International Law LLC (law firm), Senior Lawyer (since 2009); Juridica Capital Management (US) Inc. (litigation financing), Vice President and General Counsel (since 2009); Dulles Properties LLC (real estate), Broker (since 2008); The Citadel School of Business Administration (education), Adjunct Professor (since 2003); Disher, Hamrick & Myers Residential, Inc. (real estate), Broker (until 2006); Frederick H. Dulles Law Practice (law firm), (until 2006); Charlestown School of Law (education), Adjunct Professor (until 2007); Prudential Carolina Real Estate, (real estate), Broker (until 2008); Free Enterprise Foundation Inc. (research institute), Director & Secretary (until 2008); Ten State International Law PLLP (law firm), Of Counsel (until 2009) |
| | | |
Marcia A. Kean (born 6/30/48) | | Trustee | | April 2005 | | Feinstein Kean Healthcare (consulting), Chief Executive Officer |
| | | |
Ronald G. Steinhart (born 6/15/40) | | Trustee | | May 2001 | | Private investor; Penske Automotive Group (automotive retailer), Director; Animal Health International, Inc. (animal health products), Director (since 2007); Texas Industries (concrete/aggregates/cement), Director (since 2007); Susser Holdings Corporation (retail convenience stores and distributor of wholesale motor fuel), Director (since 2009); Prentiss Properties Trust (real estate investment trust), Director (until 2006); Penson Worldwide, Inc. (securities clearance), Director (until 2008) |
| | | |
Haviland Wright (born 7/21/48) | | Trustee | | May 2001 | | X-Change Corp. (multi-media web services), Director (since 2010); Nano Loa Inc. (liquid crystal displays), Director (until 2009); Profitability of Hawaii (software), Chief Development Officer (until 2010); Elixir Technologies Corporation (software), Director (until 2010) |
| | | |
| OFFICERS | | | | | | |
Maria F. DiOrioDwyer (4)
(born 12/01/58) | | President | | November 2005 | | Massachusetts Financial Services Company, Executive Vice President and Chief Regulatory Officer; Chief Compliance Officer (since December 2006) |
| | | |
| Christopher R. Bohane (4) (born 1/18/74) | | Assistant Secretary and Assistant Clerk | | July 2005 | | Massachusetts Financial Services Company, Vice President and Senior Counsel |
| | | |
John M. Corcoran (4) (born 4/13/65) | | Treasurer | | October 2008 | | Massachusetts Financial Services Company, Senior Vice President (since October 2008); State Street Bank and Trust (financial services provider), Senior Vice President, (until September 2008) |
| | | |
Ethan D. Corey (4) (born 11/21/63) | | Assistant Secretary and Assistant Clerk | | July 2005 | | Massachusetts Financial Services Company, Senior Vice President and Associate General Counsel |
| | | |
David L. DiLorenzo (4) (born 8/10/68) | | Assistant Treasurer | | July 2005 | | Massachusetts Financial Services Company, Vice President |
| | | |
Timothy M. Fagan (4) (born 7/10/68) | | Assistant Secretary and Assistant Clerk | | September 2005 | | Massachusetts Financial Services Company, Vice President and Senior Counsel |
| | | |
Mark D. Fischer (4) (born 10/27/70) | | Assistant Treasurer | | July 2005 | | Massachusetts Financial Services Company, Vice President |
22
MFS Growth Portfolio
Trustees and Officers – continued
| | | | | | |
Name, Date of Birth | | Position(s) Held
with Fund | | Trustee/Officer
Since (1) | | Principal Occupations During the Past Five Years and
Other Directorships (2) |
Robyn L. Griffin (born 7/04/75) | | Assistant Independent Chief Compliance Officer | | August 2008 | | Griffin Compliance LLC (provider of compliance services), Principal (since August 2008); State Street Corporation (financial services provider), Mutual Fund Administration Assistant Vice President (October 2006 – July 2008); Liberty Mutual Group (insurance), Personal Market Assistant Controller (April 2006 – October 2006); Deloitte & Touche LLP (professional services firm), Senior Manager (prior to April 2006) |
| | | |
Brian E. Langenfeld (4) (born 3/07/73) | | Assistant Secretary and Assistant Clerk | | May 2006 | | Massachusetts Financial Services Company, Vice President and Senior Counsel (since May 2006); John Hancock Advisers, LLC, Assistant Vice President and Counsel (until April 2006) |
| | | |
Ellen Moynihan (4) (born 11/13/57) | | Assistant Treasurer | | May 1997 | | Massachusetts Financial Services Company, Senior Vice President |
| | | |
Susan S. Newton (4) (born 3/07/50) | | Assistant Secretary and Assistant Clerk | | May 2005 | | Massachusetts Financial Services Company, Senior Vice President and Associate General Counsel |
| | | |
Susan A. Pereira (4)
(born 11/05/70) | | Assistant Secretary and Assistant Clerk | | July 2005 | | Massachusetts Financial Services Company, Vice President and Senior Counsel |
| | | |
Mark N. Polebaum (4) (born 5/01/52) | | Secretary and Clerk | | February 2006 | | Massachusetts Financial Services Company, Executive Vice President, General Counsel and Secretary (since January 2006); Wilmer Cutler Pickering Hale and Dorr LLP (law firm), Partner (until January 2006) |
| | | |
Frank L. Tarantino (born 3/07/44) | | Independent Chief Compliance Officer | | September 2004 | | Tarantino LLC (provider of compliance services), Principal |
| | | |
Richard S. Weitzel (4) (born 7/16/70) | | Assistant Secretary and Assistant Clerk | | October 2007 | | Massachusetts Financial Services Company, Vice President and Assistant General Counsel |
| | | |
James O. Yost (4) (born 6/12/60) | | Assistant Treasurer | | April 1992 | | Massachusetts Financial Services Company, Senior Vice President |
| (1) | Date first appointed to serve as Trustee/Officer of an MFS fund or a Compass variable account. Each Trustee has served continuously since appointment. For the period March 2008 until October 2008, Ms. DiOrioDwyer served as Treasurer of the Funds. |
| (2) | Directorships or trusteeships of companies required to report to the Securities and Exchange Commission (i.e., “public companies”). |
| (3) | “Interested person” of the Trust, within the meaning of the Investment Company Act of 1940 (referred to as the 1940 Act), which is the principal federal law governing investment companies like the Trust, as a result of position with Sun Life of Canada (U.S.). The address of Sun Life of Canada (U.S.) is One Sun Life Executive Park, Wellesley Hills, Massachusetts 02481. |
| (4) | “Interested person” of MFS within the meaning of the 1940 Act. The address of MFS is 500 Boylston Street, Boston, Massachusetts 02116. |
The Trust does not hold annual meetings for the purpose of electing Trustees, and Trustees are not elected for fixed terms. Each Trustee and officer holds office until his or her successor is chosen and qualified, or until his or her earlier death, resignation, retirement or removal.
All Trustees currently serve as Trustees of the Trust and have served in that capacity since originally elected or appointed. All of the Trustees are also Managers of the Compass Variable Accounts. The executive officers of the Trust hold similar offices for the Compass Variable Accounts and other funds in the MFS fund complex. As of January 1, 2011, each Trustee serves as a Trustee or Manager of 31 Accounts/Portfolios.
23
MFS Growth Portfolio
Trustees and Officers – continued
The Statement of Additional Information contains further information about the Trustees and is available without charge upon request by calling 1-800-752-7215.
| | |
Investment Adviser
Massachusetts Financial Services Company 500 Boylston Street, Boston, MA 02116-3741 | | Custodian State Street Bank and Trust 1 Lincoln Street, Boston, MA 02111-2900 |
Distributor
MFS Fund Distributors, Inc. 500 Boylston Street, Boston, MA 02116-3741 | | Independent Registered Public Accounting Firm Deloitte & Touche LLP 200 Berkeley Street, Boston, MA 02116 |
Portfolio Manager Eric Fischman | | |
24
MFS Growth Portfolio
BOARD REVIEW OF INVESTMENT ADVISORY AGREEMENT
The Investment Company Act of 1940 requires that both the full Board of Trustees and a majority of the non-interested (“independent”) Trustees, voting separately, annually approve the continuation of the investment advisory agreement between MFS Variable Insurance Trust II (the “Trust”) and Massachusetts Financial Services Company (“MFS”) on behalf of the Fund. The Trustees consider matters bearing on the Fund and the advisory arrangement at their meetings throughout the year, including a review of performance data at each regular meeting. In addition, the independent Trustees met in person in May and again in July 2010 (“contract review meetings”) for the specific purpose of considering whether to approve the continuation of the investment advisory agreement for the Fund. The independent Trustees were assisted in their evaluation of the investment advisory agreement by independent legal counsel, from whom they received separate legal advice and with whom they met separately from MFS management during various contract review meetings. The independent Trustees were also assisted in this process by the Fund’s Independent Chief Compliance Officer, a full-time senior officer appointed by and reporting to the independent Trustees.
In connection with their deliberations, the Trustees, including the independent Trustees, considered such information and factors as they believed, in light of the legal advice furnished to them and their own business judgment, to be relevant. The investment advisory agreement was considered separately for the Fund, although the Trustees also took into account the common interests of all Funds in the Trust in their review. As described below, the Trustees considered the nature, quality, and extent of the various investment advisory, administrative, and shareholder services performed by MFS under the existing investment advisory agreement and other arrangements with the Trust.
In connection with their contract review meetings, the Trustees received and relied upon materials which included, among other items: (i) information provided by Lipper Inc. (“Lipper”) on the investment performance of the Fund for various time periods ended December 31, 2009, compared to the investment performance of a group of funds with substantially similar investment classifications/objectives (the “Lipper performance universe”), (ii) information provided by Lipper on the Fund’s advisory fees and other expenses compared to the advisory fees and other expenses of comparable funds identified by Lipper (the “Lipper expense group”), (iii) information provided by MFS on the advisory fees of comparable portfolios of its other clients, including institutional separate account and other clients, (iv) information as to whether, and to what extent applicable, expense waivers, reimbursements or fee “breakpoints” are observed for the Fund, (v) information regarding MFS’ financial results and financial condition, including MFS’ and certain of its affiliates’ estimated profitability from services performed for the Fund, (vi) MFS’ views regarding the outlook for the mutual fund industry and its strategic business plans, (vii) descriptions of various functions performed by MFS for the Trust, such as compliance monitoring and portfolio trading practices, and (viii) information regarding the overall organization of MFS, including information about MFS’ senior management and other personnel providing investment advisory, administrative and other services to the Fund. The comparative performance, fee and expense information prepared and provided by Lipper was not independently verified, and the independent Trustees did not independently verify any information provided to them by MFS.
The Trustees’ conclusion as to the continuation of the investment advisory agreement was based on comprehensive consideration of all information provided to the Trustees and was not the result of any single factor. Some of the factors that figured particularly in the Trustees’ deliberations are described below for the Fund, while individual Trustees may have given different weight to various factors and evaluated the information presented as a whole differently than another individual Trustee. The Trustees recognized that the fee arrangements for the Fund reflect years of review and discussion between the independent Trustees and MFS, that certain aspects of such arrangements may receive greater scrutiny in some years than others, and that the Trustees’ conclusions may be based, in part, on their consideration of these same arrangements during the course of the year and in prior years.
Based on information provided by Lipper, the Trustees compared the Fund’s total return investment performance to the performance of the Lipper performance universe over various time periods. The Trustees placed particular emphasis on the total return performance of the Fund’s Initial Class shares in comparison to the performance of funds in its Lipper performance universe over the one-, three- and five-year periods ended December 31, 2009. The Trustees did not rely on performance results for more recent periods, including those shown elsewhere in this report.
The Trustees noted the performance of the Fund’s Initial Class shares was in the 3rd quintile relative to the other funds in the Lipper performance universe for the one-year period (the 1st quintile being the best performers and the 5th quintile being the worst performers). The total return performance of the Fund was in the 1st quintile for the three-year period and the 2nd quintile for the five-year period ended December 31, 2009, relative to the Lipper performance universe. Based on the nature and quality of services provided by MFS, the Board of Trustees concluded that the Fund’s performance was satisfactory.
In the course of their deliberations, the Trustees took into account information provided by MFS during contract review meetings, as well as during investment review meetings conducted with portfolio management personnel during the course of the year.
25
MFS Growth Portfolio
Board Review of Investment Advisory Agreement – continued
In assessing the reasonableness of the Fund’s advisory fee, the Trustees considered, among other information, the Fund’s advisory fee and the total expense ratio of the Fund’s Initial Class shares as a percentage of average daily net assets, compared to the advisory fee and total expense ratios of its peer group of funds based on information provided by Lipper. The Trustees also considered the advisory fees charged by MFS to institutional accounts. In comparing these fees, the Trustees considered the generally broader scope of services provided by MFS to the Trust than those provided to institutional accounts. The Trustees also considered the higher demands placed on MFS’ investment personnel and trading infrastructure as a result of the daily cash in-flows and out-flows of the Fund, and the impact on MFS and related expenses due to the more extensive regulatory regime to which the Fund is subject, compared to institutional accounts.
In considering the fees, the Trustees noted from the Lipper data that the Fund’s effective advisory fee rate and total expense ratio were each approximately at the median of such fees and expenses of funds in the Lipper expense group. The Trustees further concluded that the existing breakpoint was sufficient to allow the Fund to benefit from economies of scale as its assets grow. The Trustees concluded that the fees were reasonable in light of the nature and quality of services provided.
The Trustees also considered information prepared by MFS relating to its costs and profits with respect to the Fund and other investment companies and accounts advised by MFS, as well as MFS’ methodologies used to determine and allocate its costs to the Fund and other accounts and products for purposes of estimating profitability.
After reviewing these and other factors described below, the Trustees concluded that the advisory fees charged to the Fund represent reasonable compensation in light of the nature and quality of the services being provided by MFS.
In addition, the Trustees considered MFS’ resources and related efforts to continue to retain, attract and motivate capable personnel to serve the Fund. The Trustees also considered the financial resources of MFS and its parent, Sun Life Financial Inc. The Trustees further considered any advantages and possible disadvantages of having an adviser which also serves other investment companies as well as institutional accounts.
The Trustees also considered the nature, quality, cost, and extent of administrative, transfer agency, and distribution services provided to the Fund by MFS and its affiliates under agreements and plans other than the investment advisory agreement, including the 12b-1 fees the Fund pays to MFS Fund Distributors, Inc., an affiliate of MFS. The Trustees also considered the nature, extent and quality of certain other services MFS performs or arranges on the Fund’s behalf, which may include securities lending programs, directed expense payment programs, class action recovery programs, and MFS’ interaction with third-party service providers, principally custodians and sub-custodians. The Trustees concluded that the various non-advisory services provided by MFS and its affiliates on behalf of the Fund were satisfactory. The Trustees also considered the benefits to MFS from the use of the Fund’s portfolio brokerage commissions to pay for investment research and various other factors. Additionally, the Trustees considered so-called “fall-out benefits” to MFS such as reputational value derived from serving as investment manager to the Trust, and determined that any such benefits derived by MFS were reasonable and fair.
Based on their evaluation of factors that they deemed to be material, including those factors described above, the Board of Trustees, including a majority of the independent Trustees, concluded that the investment advisory agreement should be continued for an additional one-year period, commencing September 1, 2010.
A discussion regarding the Board’s most recent review and renewal of the fund’s Investment Advisory Agreement with MFS is available by clicking on the fund’s name under “Variable Insurance Portfolios — VIT II” in the “Products and Performance” section of the MFS Web site (mfs.com).
26
MFS Growth Portfolio
PROXY VOTING POLICIES AND INFORMATION
A general description of the MFS funds’ proxy voting policies and procedures is available without charge, upon request, by calling 1-800-225-2606, by visiting the Proxy Voting section of mfs.com or by visiting the SEC’s Web site at http://www.sec.gov.
Information regarding how the fund voted proxies relating to portfolio securities during the most recent twelve-month period ended June 30 is available without charge by visiting the Proxy Voting section of mfs.com or by visiting the SEC’s Web site at http://www.sec.gov.
QUARTERLY PORTFOLIO DISCLOSURE
The fund will file a complete schedule of portfolio holdings with the Securities and Exchange Commission (the Commission) for the first and third quarters of each fiscal year on Form N-Q. The fund’s Form N-Q may be reviewed and copied at the:
Public Reference Room
Securities and Exchange Commission
100 F Street, NE, Room 1580
Washington, D.C. 20549
Information on the operation of the Public Reference Room may be obtained by calling the Commission at 1-800-SEC-0330. The fund’s Form N-Q is available on the EDGAR database on the Commission’s Internet Web site at http://www.sec.gov, and copies of this information may be obtained, upon payment of a duplicating fee, by electronic request at the following e-mail address: publicinfo@sec.gov or by writing the Public Reference Section at the above address.
FURTHER INFORMATION
From time to time, MFS may post important information about the fund or the MFS funds on the MFS web site (mfs.com). This information is available by visiting the “News & Commentary” section of mfs.com or by clicking on the fund’s name under “Variable Insurance Portfolios — VIT II” in the “Products and Performance” section of mfs.com.
FEDERAL TAX INFORMATION (unaudited)
The following information is provided pursuant to provisions of the Internal Revenue Code.
For corporate shareholders, 100% of the ordinary income dividends paid during the fiscal year qualify for the corporate dividends received deduction.
27
MFS Growth Portfolio
MFS® PRIVACY NOTICE
Privacy is a concern for every investor today. At MFS Investment Management® and the MFS funds, we take this concern very seriously. We want you to understand our policies about the investment products and services that we offer, and how we protect the nonpublic personal information of investors who have a direct relationship with us and our wholly owned subsidiaries.
Throughout our business relationship, you provide us with personal information. We maintain information and records about you, your investments, and the services you use. Examples of the nonpublic personal information we maintain include
| | Ÿ | | data from investment applications and other forms |
| | Ÿ | | share balances and transactional history with us, our affiliates, or others |
| | Ÿ | | facts from a consumer reporting agency |
We do not disclose any nonpublic personal information about our customers or former customers to anyone, except as permitted by law. We may share nonpublic personal information with third parties or certain of our affiliates in connection with servicing your account or processing your transactions. We may share information with companies or financial institutions that perform marketing services on our behalf or with other financial institutions with which we have joint marketing arrangements, subject to any legal requirements.
Authorization to access your nonpublic personal information is limited to appropriate personnel who provide products, services, or information to you. We maintain physical, electronic, and procedural safeguards to help protect the personal information we collect about you.
If you have any questions about the MFS privacy policy, please call 1-800-225-2606 any business day.
Note: If you own MFS products or receive MFS services in the name of a third party such as a bank or broker-dealer, their privacy policy may apply to you instead of ours.
28


MFS® MID CAP GROWTH PORTFOLIO
The report is prepared for the general information of contract owners. It is authorized for distribution to prospective investors only when preceded or accompanied by a current prospectus.
NOT FDIC INSURED Ÿ MAY LOSE VALUE Ÿ NO BANK GUARANTEE Ÿ NOT A DEPOSIT Ÿ NOT INSURED BY ANY FEDERAL GOVERNMENT AGENCY OR NCUA/NCUSIF
MFS Mid Cap Growth Portfolio
LETTER FROM THE CEO

Dear Contract Owners:
After an extended rebound in the financial markets, uncertainty returned in 2010 as investors began to question the durability of the recovery for global economies and markets. That uncertainty led to increased risk aversion, especially as investors saw the eurozone struggle with the debt woes of many of its members. In September, the U.S. Federal Reserve Board’s promises to further loosen monetary policy helped assuage market fears and drive asset prices off their recent lows. A combination of solid earnings and improving economic data gave an additional boost to investor sentiment. As we enter 2011, we are cautiously optimistic that economic growth will continue to improve and that the global economies will recover from the shocks of the past few years. We expect the pace of recovery worldwide will be uneven and volatile.
As always, we continue to be mindful of the many economic challenges faced at the local, national, and international levels. It is in times such as these that we want to remind investors of the merits of maintaining a long-term view, adhering to basic investing principles such as asset allocation and diversification, and working closely with their advisors to research and identify appropriate investment opportunities.
Respectfully,

Robert J. Manning
Chairman and Chief Executive Officer
MFS Investment Management®
February 14, 2011
The opinions expressed in this letter are subject to change, may not be relied upon for investment advice, and no forecasts can be guaranteed.
1
MFS Mid Cap Growth Portfolio
PORTFOLIO COMPOSITION
Portfolio structure

| | | | |
| Top ten holdings | | | | |
| Newfield Exploration Co. | | | 1.8% | |
| AMETEK, Inc. | | | 1.6% | |
| Dresser-Rand Group, Inc. | | | 1.6% | |
| American Tower Corp., “A” | | | 1.6% | |
| Affiliated Managers Group, Inc. | | | 1.5% | |
| Goodrich Corp. | | | 1.5% | |
| Danaher Corp. | | | 1.5% | |
| Teck Resources Ltd., “B” | | | 1.4% | |
| Royal Caribbean Cruises Ltd. | | | 1.4% | |
| Autodesk, Inc. | | | 1.3% | |
| | | | |
| Equity sectors | | | | |
| Technology | | | 19.6% | |
| Industrial Goods & Services | | | 11.6% | |
| Health Care | | | 10.4% | |
| Special Products & Services | | | 9.7% | |
| Energy | | | 9.6% | |
| Leisure | | | 8.3% | |
| Financial Services | | | 8.0% | |
| Retailing | | | 7.8% | |
| Basic Materials | | | 4.2% | |
| Utilities & Communications | | | 2.9% | |
| Transportation | | | 2.6% | |
| Consumer Staples | | | 2.3% | |
| Autos & Housing | | | 2.3% | |
Percentages are based on net assets as of 12/31/10.
The portfolio is actively managed and current holdings may be different.
2
MFS Mid Cap Growth Portfolio
MANAGEMENT REVIEW
Summary of Results
For the twelve months ended December 31, 2010, Initial Class shares of the MFS Mid Cap Growth Portfolio (the “fund”) provided a total return of 29.25%, while Service Class shares of the fund provided a total return of 28.88% at net asset value. This compares with a return of 26.38% for the fund’s benchmark, the Russell Midcap Growth Index.
Market Environment
The first quarter of the reporting period witnessed a continuation of the financial market and macroeconomic rebounds that had begun in early 2009. These recoveries in global activity and asset valuations were generally synchronized around the world, led importantly by emerging Asian economies, but broadening to include most of the global economy to varying degrees. Primary drivers of the recoveries included an unwinding of the inventory destocking that took place earlier, the production of manufacturing and capital goods, as well as massive fiscal and monetary stimulus.
During most of the remainder of the period, heightened risk surrounding the public-debt profiles of several of the peripheral European countries impaired market sentiment. At the same time, the improving trend in global macroeconomic data began to weaken somewhat. These two dynamics caused many asset prices to retrench significantly, as many questioned the durability of the global recovery.
Towards the end of the period, the U.S. Federal Reserve led markets to believe that further monetary loosening would be forthcoming if macroeconomic activity did not show signs of improvement. The prospects for more easing by the Fed improved market sentiment and drove risk-asset prices markedly higher. However, in a text-book case of “buy the rumor, sell the fact,” the weeks following the early November announcement of further quantitative easing saw a sell-off in U.S. Treasury bonds. This rise in Treasury yields occurred despite risk-off behavior in equities and credit markets (which would normally result in Treasury yield compression), and appears to have been the result of a few factors: signs of improved U.S. and global economic activity; opposition to quantitative easing from some quarters; and crowded long positions in U.S. Treasuries. The December agreement on an expansionary U.S. fiscal package also boosted sentiment, leading markets to reach near-term highs in risky asset valuations toward year end.
Contributors to Performance
Stock selection in the special products & services sector was a primary factor contributing to the fund’s performance relative to the Russell Midcap Growth Index. The fund’s ownership in shares of strong-performing luxury collectibles auctioneer Sotheby’s benefited relative returns. Shares of Sotheby’s rose as the company announced better-than-expected revenues driven by strong sales in their London auctions. The company continued to see strength in demand from global markets, primarily China, during the reporting period.
Security selection in the technology sector was another positive factor for relative performance during the reporting period. Holdings of communications and data services provider Acme Packet (b), internet software provider Akamai Technologies, and digital products manufacturer ARM (b) boosted returns.
Stock selection in the energy sector contributed to relative returns. No individual securities within this sector were among the fund’s top relative contributors for the reporting period.
Stock selection in the industrial goods & services sector also benefited results. Holdings of industrial machinery manufacturer Bucyrus International (h) supported relative performance. Shares of Bucyrus International climbed as the company experienced strong demand for their surface mining equipment. The company’s announcement that they had accepted a buyout offer from diversified industrial manufacturer Caterpillar aided further price appreciation.
Elsewhere, the timing of our transactions in casino resort operator Las Vegas Sands bolstered relative performance as the fund was able to capture a greater impact from the stock’s price gains than the benchmark during the reporting period. Stocks in other sectors that were among the fund’s top contributors included industrial medical and specialty gas distributor Airgas, specialty retailer Limited Brands, cruise line operator Royal Caribbean Cruises, and Canadian diversified mining company Teck Resources (b).
During the reporting period, the fund’s currency exposure was a contributor to relative performance. All of MFS’ investment decisions are driven by the fundamentals of each individual opportunity and as such, it is common for our portfolios to have different currency exposure than the benchmark.
3
MFS Mid Cap Growth Portfolio
Management Review – continued
Detractors from Performance
Stock selection in the financial services sector detracted from relative performance. The fund’s ownership in shares of poor-performing credit card company Mastercard (b) hindered relative results. Although Mastercard reported strong earnings results, the company’s shares declined sharply after the Federal Reserve released a debit interchange proposal that would substantially reduce debit card transaction fees. The Fed’s proposals on debit network exclusivity also created uncertainty surrounding the companies’ future market share and revenues.
A combination of stock selection and an underweight position in the retailing sector detracted from relative performance during the reporting period. Holdings of office products supplier Staples (b) weighed on returns. Shares of Staples depreciated as the company experienced weaker-than-expected demand in Europe for their small business development products.
Stocks in other sectors that were among the fund’s top detractors included publishing software company Adobe Systems (b)(h), animation film developer Dreamworks Animation (h), and online university Capella Education (b)(h). Holdings of online travel company Priceline.com (h), higher education provider Devry Inc., and offshore oil and gas services provider Oceaneering International (h) detracted from relative returns. Not holding strong-performing customer information software manager Salesforce.com (h) also dampened relative performance.
The fund’s cash position was also a detractor from relative performance. The fund holds cash to buy new holdings and to provide liquidity. In a period when equity markets rose, as measured by the fund’s benchmark, holding cash hurt performance versus the benchmark, which has no cash position.
Respectfully,
| | | | | | |
| David DeGroff | | Eric Fischman | | | | |
| Portfolio Manager | | Portfolio Manager | | | | |
| (b) | Security is not a benchmark constituent. |
| (h) | Security was not held in the portfolio at period end. |
The views expressed in this report are those of the portfolio managers only through the end of the period of the report as stated on the cover and do not necessarily reflect the views of MFS or any other person in the MFS organization. These views are subject to change at any time based on market or other conditions, and MFS disclaims any responsibility to update such views. These views may not be relied upon as investment advice or an indication of trading intent on behalf of any MFS portfolio. References to specific securities are not recommendations of such securities, and may not be representative of any MFS portfolio’s current or future investments.
4
MFS Mid Cap Growth Portfolio
PERFORMANCE SUMMARY THROUGH 12/31/10
The following chart illustrates the historical performance of the fund in comparison to its benchmark(s). Benchmarks are unmanaged and may not be invested in directly. Benchmark returns do not reflect any fees or expenses. The performance of other share classes will be greater than or less than that of the class depicted below. (See Notes to Performance Summary.)
Performance data shown represents past performance and is no guarantee of future results. Investment return and principal value fluctuate so your units, when sold, may be worth more or less than the original cost; current performance may be lower or higher than quoted. The performance shown does not reflect the deduction of taxes, if any, that a contract holder would pay on fund distributions or the redemption of contract units. The returns for the fund shown also do not reflect the deduction of expenses associated with variable products, such as mortality and expense risk charges, separate account charges, and sales charges imposed by the insurance company separate accounts. Such expenses would reduce the overall returns shown.
Growth of a Hypothetical $10,000 Investment
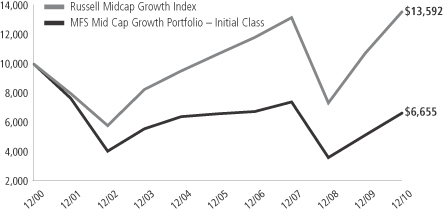
Total Returns through 12/31/10
Average annual total returns
| | | | | | | | | | | | | | |
| | | Share class | | Class inception date | | 1-yr | | 5-yr | | 10-yr | | Life (t) | | |
| | | Initial Class | | 8/31/00 | | 29.25% | | 0.12% | | (3.99)% | | N/A | | |
| | | Service Class | | 8/24/01 | | 28.88% | | (0.10)% | | N/A | | (1.68)% | | |
| | | | | |
| Comparative benchmark | | | | | | | | | | |
| | | Russell Midcap Growth Index (f) | | 26.38% | | 4.88% | | 3.12% | | N/A | | |
| (f) | Source: FactSet Research Systems Inc. |
| (t) | For the period from the class inception date through the stated period end (for those share classes with less than 10 years of performance history). No comparative benchmark performance information is provided for “life” periods. (See Notes to Performance Summary.) |
Benchmark Definition
Russell Midcap Growth Index – constructed to provide a comprehensive barometer for growth securities in the mid-cap segment of the U.S. equity universe. Companies in this index generally have higher price-to-book ratios and higher forecasted growth values.
It is not possible to invest directly in an index.
Notes to Performance Summary
Average annual total return represents the average annual change in value for each share class for the periods presented. Life returns are presented where the share class has less than 10 years of performance history and represent the average annual total return from the class inception date to the stated period end date. As the fund’s share classes may have different inception dates, the life returns may represent different time periods and may not be comparable. As a result, no comparative benchmark performance information is provided for life periods.
Performance results reflect any applicable expense subsidies and waivers in effect during the periods shown. Without such subsidies and waivers the fund’s performance results would be less favorable. Please see the prospectus and financial statements for complete details. All results are historical and assume the reinvestment of any dividends and capital gains distributions.
From time to time the fund may receive proceeds from litigation settlements, without which performance would be lower.
5
MFS Mid Cap Growth Portfolio
EXPENSE TABLE
Fund Expenses Borne by the Contract Holders During the Period,
July 1, 2010 through December 31, 2010
As a contract holder of the fund, you incur ongoing costs, including management fees; distribution and/or service (12b-1) fees; and other fund expenses. This example is intended to help you understand your ongoing costs (in dollars) of investing in the fund and to compare these costs with the ongoing costs of investing in other mutual funds.
The example is based on an investment of $1,000 invested at the beginning of the period and held for the entire period July 1, 2010 through December 31, 2010.
Actual Expenses
The first line for each share class in the following table provides information about actual account values and actual expenses. You may use the information in this line, together with the amount you invested, to estimate the expenses that you paid over the period. Simply divide your account value by $1,000 (for example, an $8,600 account value divided by $1,000 = 8.6), then multiply the result by the number in the first line under the heading entitled “Expenses Paid During Period” to estimate the expenses you paid on your account during this period.
Hypothetical Example for Comparison Purposes
The second line for each share class in the following table provides information about hypothetical account values and hypothetical expenses based on the fund’s actual expense ratio and an assumed rate of return of 5% per year before expenses, which is not the fund’s actual return. The hypothetical account values and expenses may not be used to estimate the actual ending account balance or expenses you paid for the period. You may use this information to compare the ongoing costs of investing in the fund and other funds. To do so, compare this 5% hypothetical example with the 5% hypothetical examples that appear in the shareholder reports of the other funds.
Please note that the expenses shown in the table are meant to highlight the fund’s ongoing costs only and do not take into account the fees and expenses imposed under the variable contracts through which your investment in the fund is made. Therefore, the second line for each share class in the table is useful in comparing ongoing costs associated with an investment in vehicles (such as the fund) which fund benefits under variable annuity and variable life insurance contracts and to qualified pension and retirement plans only, and will not help you determine the relative total costs of investing in the fund through variable annuity and variable life insurance contracts. If the fees and expenses imposed under the variable contracts were included, your costs would have been higher.
| | | | | | | | | | | | | | | | | | |
| Share Class | | | | Annualized
Expense Ratio | | | Beginning
Account Value
7/01/10 | | | Ending
Account Value
12/31/10 | | | Expenses Paid
During Period (p) 7/01/10-12/31/10 | |
| Initial Class | | Actual | | | 1.10% | | | | $1,000.00 | | | | $1,303.69 | | | | $6.39 | |
| | Hypothetical (h) | | | 1.10% | | | | $1,000.00 | | | | $1,019.66 | | | | $5.60 | |
| Service Class | | Actual | | | 1.35% | | | | $1,000.00 | | | | $1,303.10 | | | | $7.84 | |
| | Hypothetical (h) | | | 1.35% | | | | $1,000.00 | | | | $1,018.40 | | | | $6.87 | |
| (h) | 5% class return per year before expenses. |
| (p) | Expenses paid is equal to each class’ annualized expense ratio, as shown above, multiplied by the average account value over the period, multiplied by the number of days in the period, divided by the number of days in the year. |
6
MFS Mid Cap Growth Portfolio
PORTFOLIO OF INVESTMENTS – 12/31/10
The Portfolio of Investments is a complete list of all securities owned by your fund. It is categorized by broad-based asset classes.
| | | | | | | | |
| Issuer | | Shares/Par | | | Value ($) | |
| | | | | | | | |
| COMMON STOCKS – 99.3% | |
| Aerospace – 1.9% | | | | | | | | |
| BE Aerospace, Inc. (a) | | | 1,720 | | | $ | 63,692 | |
| Goodrich Corp. | | | 6,750 | | | | 594,473 | |
| Moog, Inc., “A” (a) | | | 2,450 | | | | 97,510 | |
| | | | | | | | |
| | | | | | $ | 755,675 | |
| | | | | | | | |
| Apparel Manufacturers – 0.7% | | | | | | | | |
| Li & Fung Ltd. | | | 10,000 | | | $ | 58,023 | |
| Phillips-Van Heusen Corp. | | | 3,870 | | | | 243,849 | |
| | | | | | | | |
| | | | | | $ | 301,872 | |
| | | | | | | | |
| Biotechnology – 2.0% | | | | | | | | |
| Alexion Pharmaceuticals, Inc. (a) | | | 6,710 | | | $ | 540,491 | |
| Gen-Probe, Inc. (a) | | | 4,500 | | | | 262,575 | |
| | | | | | | | |
| | | | | | $ | 803,066 | |
| | | | | | | | |
| Broadcasting – 1.6% | | | | | | | | |
| Discovery Communications, Inc., “A” (a) | | | 9,650 | | | $ | 402,405 | |
| Interpublic Group of Cos., Inc. (a) | | | 22,960 | | | | 243,835 | |
| | | | | | | | |
| | | | | | $ | 646,240 | |
| | | | | | | | |
| Brokerage & Asset Managers – 4.3% | |
| Affiliated Managers Group, Inc. (a) | | | 6,210 | | | $ | 616,156 | |
| BM&F Bovespa S.A. | | | 22,500 | | | | 177,967 | |
| Evercore Partners, Inc. | | | 3,230 | | | | 109,820 | |
| GFI Group, Inc. | | | 24,280 | | | | 113,873 | |
| IntercontinentalExchange, Inc. (a) | | | 2,090 | | | | 249,024 | |
| Lazard Ltd. | | | 7,300 | | | | 288,277 | |
| LPL Investment Holdings, Inc. (a) | | | 5,040 | | | | 183,305 | |
| | | | | | | | |
| | | | | | $ | 1,738,422 | |
| | | | | | | | |
| Business Services – 6.6% | |
| Cognizant Technology Solutions Corp., “A” (a) | | | 6,820 | | | $ | 499,838 | |
| Concur Technologies, Inc. (a) | | | 7,150 | | | | 371,300 | |
| Constant Contact, Inc. (a) | | | 7,590 | | | | 235,214 | |
| CoStar Group, Inc. (a) | | | 4,400 | | | | 253,264 | |
| FleetCor Technologies, Inc. (a) | | | 5,010 | | | | 154,909 | |
| Gartner, Inc. (a) | | | 4,360 | | | | 144,752 | |
| MSCI, Inc., “A” (a) | | | 12,880 | | | | 501,805 | |
| Ultimate Software Group, Inc. (a) | | | 860 | | | | 41,822 | |
| Verisk Analytics, Inc., “A” (a) | | | 14,070 | | | | 479,506 | |
| | | | | | | | |
| | | | | | $ | 2,682,410 | |
| | | | | | | | |
| Cable TV – 0.6% | |
| Virgin Media, Inc. | | | 9,050 | | | $ | 246,522 | |
| | | | | | | | |
| Chemicals – 1.2% | |
| Celanese Corp. | | | 7,180 | | | $ | 295,601 | |
| Ecolab, Inc. | | | 3,870 | | | | 195,125 | |
| | | | | | | | |
| | | | | | $ | 490,726 | |
| | | | | | | | |
| Computer Software – 7.4% | |
| Akamai Technologies, Inc. (a) | | | 1,550 | | | $ | 72,928 | |
| Ariba, Inc. (a) | | | 3,400 | | | | 79,866 | |
| Autodesk, Inc. (a) | | | 14,180 | | | | 541,676 | |
| Autonomy Corp. PLC (a) | | | 11,199 | | | | 262,778 | |
| | | | | | | | |
| Issuer | | Shares/Par | | | Value ($) | |
| | | | | | | | |
| COMMON STOCKS – continued | |
| Computer Software – continued | |
| Blackboard, Inc. (a) | | | 6,230 | | | $ | 257,299 | |
| Check Point Software Technologies Ltd. (a) | | | 3,520 | | | | 162,835 | |
| Citrix Systems, Inc. (a) | | | 2,200 | | | | 150,502 | |
| Intuit, Inc. (a) | | | 7,290 | | | | 359,397 | |
| Parametric Technology Corp. (a) | | | 21,420 | | | | 482,593 | |
| SuccessFactors, Inc. (a) | | | 6,520 | | | | 188,819 | |
| VeriSign, Inc. (s) | | | 13,390 | | | | 437,451 | |
| | | | | | | | |
| | | | | | $ | 2,996,144 | |
| | | | | | | | |
| Computer Software – Systems – 2.4% | |
| MICROS Systems, Inc. (a) | | | 10,380 | | | $ | 455,267 | |
| NICE Systems Ltd., ADR (a) | | | 4,650 | | | | 162,285 | |
| Verifone Systems, Inc. (a) | | | 9,440 | | | | 364,006 | |
| | | | | | | | |
| | | | | | $ | 981,558 | |
| | | | | | | | |
| Construction – 2.3% | |
| NVR, Inc. (a) | | | 300 | | | $ | 207,306 | |
| Owens Corning (a) | | | 3,930 | | | | 122,420 | |
| Sherwin-Williams Co. | | | 3,210 | | | | 268,838 | |
| Stanley Black & Decker, Inc. | | | 4,827 | | | | 322,781 | |
| | | | | | | | |
| | | | | | $ | 921,345 | |
| | | | | | | | |
| Consumer Products – 0.8% | |
| Avon Products, Inc. | | | 5,570 | | | $ | 161,864 | |
| Hypermarcas S.A. (a) | | | 10,900 | | | | 147,938 | |
| | | | | | | | |
| | | | | | $ | 309,802 | |
| | | | | | | | |
| Consumer Services – 3.1% | |
| Anhanguera Educacional Participacoes S.A. | | | 12,200 | | | $ | 293,976 | |
| DeVry, Inc. (s) | | | 6,960 | | | | 333,941 | |
| Monster Worldwide, Inc. (a) | | | 12,210 | | | | 288,522 | |
| Sotheby’s | | | 7,140 | | | | 321,300 | |
| | | | | | | | |
| | | | | | $ | 1,237,739 | |
| | | | | | | | |
| Containers – 1.0% | |
| Ball Corp. | | | 5,720 | | | $ | 389,246 | |
| | | | | | | | |
| Electrical Equipment – 3.6% | |
| AMETEK, Inc. | | | 16,735 | | | $ | 656,849 | |
| Danaher Corp. | | | 12,470 | | | | 588,210 | |
| Mettler-Toledo International, Inc. (a) | | | 1,380 | | | | 208,670 | |
| | | | | | | | |
| | | | | | $ | 1,453,729 | |
| | | | | | | | |
| Electronics – 5.6% | |
| Advanced Micro Devices, Inc. (a) | | | 19,980 | | | $ | 163,436 | |
| ARM Holdings PLC | | | 37,445 | | | | 247,125 | |
| First Solar, Inc. (a) | | | 790 | | | | 102,811 | |
| Hittite Microwave Corp. (a) | | | 3,730 | | | | 227,679 | |
| Lam Research Corp. (a) | | | 4,470 | | | | 231,457 | |
| Linear Technology Corp. | | | 10,270 | | | | 355,239 | |
| Microchip Technology, Inc. | | | 10,800 | | | | 369,468 | |
| PMC-Sierra, Inc. (a) | | | 32,360 | | | | 277,972 | |
| Teradyne, Inc. (a) | | | 20,810 | | | | 292,172 | |
| | | | | | | | |
| | | | | | $ | 2,267,359 | |
| | | | | | | | |
7
MFS Mid Cap Growth Portfolio
Portfolio of Investments – continued
| | | | | | | | |
| Issuer | | Shares/Par | | | Value ($) | |
| | | | | | | | |
| COMMON STOCKS – continued | |
| Energy – Independent – 5.5% | |
| Concho Resources, Inc. (a) | | | 4,280 | | | $ | 375,228 | |
| MEG Energy Corp. (a) | | | 5,282 | | | | 241,656 | |
| Newfield Exploration Co. (a)(s) | | | 10,190 | | | | 734,801 | |
| QEP Resources, Inc. | | | 5,450 | | | | 197,890 | |
| Ultra Petroleum Corp. (a) | | | 4,520 | | | | 215,920 | |
| Whiting Petroleum Corp. (a) | | | 4,070 | | | | 476,963 | |
| | | | | | | | |
| | | | | | $ | 2,242,458 | |
| | | | | | | | |
| Engineering – Construction – 1.0% | |
| Fluor Corp. | | | 6,210 | | | $ | 411,475 | |
| | | | | | | | |
| Food & Beverages – 1.5% | |
| Dr Pepper Snapple Group, Inc. | | | 2,790 | | | $ | 98,096 | |
| Mead Johnson Nutrition Co., “A” | | | 8,410 | | | | 523,523 | |
| | | | | | | | |
| | | | | | $ | 621,619 | |
| | | | | | | | |
| Food & Drug Stores – 0.4% | |
| Whole Foods Market, Inc. | | | 3,150 | | | $ | 159,359 | |
| | | | | | | | |
| Gaming & Lodging – 2.3% | |
| Las Vegas Sands Corp. (a) | | | 8,120 | | | $ | 373,114 | |
| Royal Caribbean Cruises Ltd. (a) | | | 11,760 | | | | 552,720 | |
| | | | | | | | |
| | | | | | $ | 925,834 | |
| | | | | | | | |
| General Merchandise – 0.2% | |
| Dollar General Corp. (a) | | | 3,280 | | | $ | 100,598 | |
| | | | | | | | |
| Insurance – 0.4% | |
| Allied World Assurance Co. | | | 2,450 | | | $ | 145,628 | |
| | | | | | | | |
| Internet – 0.6% | |
| OpenTable, Inc. (a) | | | 2,190 | | | $ | 154,351 | |
| Shutterfly, Inc. (a) | | | 2,900 | | | | 101,587 | |
| | | | | | | | |
| | | | | | $ | 255,938 | |
| | | | | | | | |
| Leisure & Toys – 0.9% | |
| Hasbro, Inc. | | | 7,550 | | | $ | 356,209 | |
| | | | | | | | |
| Machinery & Tools – 4.5% | |
| Cummins, Inc. | | | 3,450 | | | $ | 379,535 | |
| Finning International, Inc. | | | 11,990 | | | | 326,671 | |
| Flowserve Corp. | | | 2,810 | | | | 335,008 | |
| Kennametal, Inc. | | | 5,360 | | | | 211,506 | |
| Polypore International, Inc. (a) | | | 6,190 | | | | 252,119 | |
| WABCO Holdings, Inc. (a) | | | 5,250 | | | | 319,883 | |
| | | | | | | | |
| | | | | | $ | 1,824,722 | |
| | | | | | | | |
| Medical & Health Technology & Services – 5.2% | |
| Cerner Corp. (a) | | | 4,460 | | | $ | 422,540 | |
| Diagnosticos da America S.A. | | | 22,300 | | | | 302,259 | |
| IDEXX Laboratories, Inc. (a) | | | 4,430 | | | | 306,645 | |
| Medco Health Solutions, Inc. (a) | | | 3,840 | | | | 235,277 | |
| MEDNAX, Inc. (a) | | | 3,850 | | | | 259,067 | |
| Patterson Cos., Inc. | | | 9,630 | | | | 294,967 | |
| Stericycle, Inc. (a) | | | 3,240 | | | | 262,181 | |
| | | | | | | | |
| | | | | | $ | 2,082,936 | |
| | | | | | | | |
| Medical Equipment – 2.3% | |
| C.R. Bard, Inc. | | | 1,400 | | | $ | 128,478 | |
| Edwards Lifesciences Corp. (a) | | | 3,230 | | | | 261,113 | |
| | | | | | | | |
| Issuer | | Shares/Par | | | Value ($) | |
| | | | | | | | |
| COMMON STOCKS – continued | |
| Medical Equipment – continued | |
| ResMed, Inc. (a) | | | 9,350 | | | $ | 323,884 | |
| Sonova Holding AG | | | 759 | | | | 97,980 | |
| Thoratec Corp. (a) | | | 3,580 | | | | 101,386 | |
| | | | | | | | |
| | | | | | $ | 912,841 | |
| | | | | | | | |
| Metals & Mining – 1.6% | |
| Cameco Corp. | | | 2,610 | | | $ | 105,392 | |
| Teck Resources Ltd., “B” | | | 8,950 | | | | 553,379 | |
| | | | | | | | |
| | | | | | $ | 658,771 | |
| | | | | | | | |
| Network & Telecom – 3.6% | |
| Acme Packet, Inc. (a) | | | 5,720 | | | $ | 304,075 | |
| Ciena Corp. (a) | | | 13,770 | | | | 289,859 | |
| F5 Networks, Inc. (a) | | | 3,030 | | | | 394,385 | |
| Fortinet, Inc. (a) | | | 6,690 | | | | 216,422 | |
| Polycom, Inc. (a) | | | 5,930 | | | | 231,151 | |
| | | | | | | | |
| | | | | | $ | 1,435,892 | |
| | | | | | | | |
| Oil Services – 4.1% | |
| Cameron International Corp. (a) | | | 9,820 | | | $ | 498,169 | |
| Dresser-Rand Group, Inc. (a) | | | 15,290 | | | | 651,201 | |
| Weatherford International Ltd. (a) | | | 23,190 | | | | 528,732 | |
| | | | | | | | |
| | | | | | $ | 1,678,102 | |
| | | | | | | | |
| Other Banks & Diversified Financials – 2.7% | |
| Associated Banc-Corp. | | | 6,870 | | | $ | 104,081 | |
| Cathay General Bancorp, Inc. | | | 13,680 | | | | 228,456 | |
| MasterCard, Inc., “A” | | | 2,000 | | | | 448,220 | |
| Visa, Inc., “A” | | | 2,190 | | | | 154,132 | |
| Zions Bancorporation | | | 6,840 | | | | 165,733 | |
| | | | | | | | |
| | | | | | $ | 1,100,622 | |
| | | | | | | | |
| Pharmaceuticals – 0.9% | |
| Genomma Lab Internacional S.A., “B” (a) | | | 98,700 | | | $ | 236,241 | |
| Hospira, Inc. (a) | | | 2,150 | | | | 119,734 | |
| | | | | | | | |
| | | | | | $ | 355,975 | |
| | | | | | | | |
| Pollution Control – 0.6% | |
| Waste Connections, Inc. | | | 8,890 | | | $ | 244,742 | |
| | | | | | | | |
| Printing & Publishing – 1.6% | |
| Lamar Advertising Co., “A” (a) | | | 8,540 | | | $ | 340,234 | |
| Moody’s Corp. | | | 11,770 | | | | 312,376 | |
| | | | | | | | |
| | | | | | $ | 652,610 | |
| | | | | | | | |
| Railroad & Shipping – 0.7% | |
| Kansas City Southern Co. (a) | | | 6,170 | | | $ | 295,296 | |
| | | | | | | | |
| Real Estate – 0.6% | |
| Jones Lang LaSalle, Inc. | | | 2,650 | | | $ | 222,388 | |
| | | | | | | | |
| Restaurants – 1.3% | |
| P.F. Chang’s China Bistro, Inc. | | | 8,020 | | | $ | 388,649 | |
| Panera Bread Co., “A” (a) | | | 1,430 | | | | 144,730 | |
| | | | | | | | |
| | | | | | $ | 533,379 | |
| | | | | | | | |
| Specialty Chemicals – 0.4% | |
| Airgas, Inc. | | | 2,590 | | | $ | 161,771 | |
| | | | | | | | |
8
MFS Mid Cap Growth Portfolio
Portfolio of Investments – continued
| | | | | | | | |
| Issuer | | Shares/Par | | | Value ($) | |
| | | | | | | | |
| COMMON STOCKS – continued | |
| Specialty Stores – 6.5% | |
| Abercrombie & Fitch Co., “A” | | | 7,220 | | | $ | 416,089 | |
| Dick’s Sporting Goods, Inc. (a) | | | 13,130 | | | | 492,375 | |
| Limited Brands, Inc. | | | 14,270 | | | | 438,517 | |
| Ross Stores, Inc. | | | 7,620 | | | | 481,965 | |
| Staples, Inc. | | | 14,970 | | | | 340,867 | |
| Tractor Supply Co. | | | 3,740 | | | | 181,353 | |
| Urban Outfitters, Inc. (a) | | | 7,360 | | | | 263,562 | |
| | | | | | | | |
| | | | | | $ | 2,614,728 | |
| | | | | | | | |
| Telecommunications – Wireless – 0.9% | |
| NII Holdings, Inc. (a) | | | 3,510 | | | $ | 156,757 | |
| SBA Communications Corp. (a) | | | 4,980 | | | | 203,881 | |
| | | | | | | | |
| | | | | | $ | 360,638 | |
| | | | | | | | |
| Telephone Services – 1.6% | |
| American Tower Corp., “A” (a)(s) | | | 12,150 | | | $ | 627,426 | |
| | | | | | | | |
| Trucking – 1.9% | |
| Expeditors International of Washington, Inc. | | | 7,110 | | | $ | 388,206 | |
| Landstar System, Inc. | | | 9,770 | | | | 399,984 | |
| | | | | | | | |
| | | | | | $ | 788,190 | |
| | | | | | | | |
| Utilities – Electric Power – 0.4% | |
| CMS Energy Corp. | | | 9,680 | | | $ | 180,036 | |
| | | | | | | | |
Total Common Stocks (Identified Cost, $30,360,102) | | | | | | $ | 40,172,038 | |
| | | | | | | | |
| | | | | | | | |
| Issuer | | Shares/Par | | | Value ($) | |
| | | | | | | | |
| MONEY MARKET FUNDS (v) – 1.2% | |
| MFS Institutional Money Market Portfolio, 0.18%, at Cost and Net Asset Value | | | 475,366 | | | $ | 475,366 | |
| | | | | | | | |
Total Investments
(Identified Cost, $30,835,468) | | | | | | $ | 40,647,404 | |
| | | | | | | | |
OTHER ASSETS, LESS
LIABILITIES – (0.5)% | | | | | | | (200,104 | ) |
| | | | | | | | |
| Net Assets – 100.0% | | | | | | $ | 40,447,300 | |
| | | | | | | | |
| (a) | | Non-income producing security. |
| (s) | | Security or a portion of the security was pledged to cover collateral requirements for securities sold short. At December 31, 2010, the value of securities pledged amounted to $172,404. At December 31, 2010, the fund had no short sales outstanding. |
| (v) | | Underlying fund that is available only to investment companies managed by MFS. The rate quoted is the annualized seven-day yield of the fund at period end. |
The following abbreviations are used in this report and are defined:
| ADR | | American Depository Receipt |
| PLC | | Public Limited Company |
See Notes to Financial Statements
9
MFS Mid Cap Growth Portfolio
FINANCIAL STATEMENTS | STATEMENT OF ASSETS AND LIABILITIES
This statement represents your fund’s balance sheet, which details the assets and liabilities comprising the total value of the fund.
| | | | | | | | |
| At 12/31/10 | | | | | | | | |
Assets | | | | | | | | |
Investments – | | | | | | | | |
Non-affiliated issuers, at value (identified cost, $30,360,102) | | | $40,172,038 | | | | | |
Underlying funds, at cost and value | | | 475,366 | | | | | |
Total investments, at value (identified cost, $30,835,468) | | | $40,647,404 | | | | | |
Receivables for | | | | | | | | |
Fund shares sold | | | 80,856 | | | | | |
Interest and dividends | | | 12,250 | | | | | |
Other assets | | | 1,506 | | | | | |
Total assets | | | | | | | $40,742,016 | |
Liabilities | | | | | | | | |
Payables for | | | | | | | | |
Investments purchased | | | $98,102 | | | | | |
Fund shares reacquired | | | 151,137 | | | | | |
Payable to affiliates | | | | | | | | |
Investment adviser | | | 1,670 | | | | | |
Distribution and/or service fees | | | 214 | | | | | |
Administrative services fee | | | 94 | | | | | |
Payable for Trustees’ compensation | | | 33 | | | | | |
Accrued expenses and other liabilities | | | 43,466 | | | | | |
Total liabilities | | | | | | | $294,716 | |
Net assets | | | | | | | $40,447,300 | |
Net assets consist of | | | | | | | | |
Paid-in capital | | | $51,087,892 | | | | | |
Unrealized appreciation (depreciation) on investments and translation of assets and liabilities in foreign currencies | | | 9,811,993 | | | | | |
Accumulated net realized gain (loss) on investments and foreign currency transactions | | | (20,452,585 | ) | | | | |
Net assets | | | | | | | $40,447,300 | |
Shares of beneficial interest outstanding | | | | | | | 6,779,608 | |
| | | | | | | | | | | | |
| | | Net assets | | | Shares
outstanding | | | Net asset value
per share | |
Initial Class | | | $24,943,566 | | | | 4,147,507 | | | | $6.01 | |
Service Class | | | 15,503,734 | | | | 2,632,101 | | | | 5.89 | |
See Notes to Financial Statements
10
MFS Mid Cap Growth Portfolio
FINANCIAL STATEMENTS | STATEMENT OF OPERATIONS
This statement describes how much your fund earned in investment income and accrued in expenses. It also describes any gains and/or losses generated by fund operations.
| | | | | | | | |
| Year ended 12/31/10 | | | | | | | | |
| Net Investment loss | | | | | | | | |
Income | | | | | | | | |
Dividends | | | $349,711 | | | | | |
Interest | | | 462 | | | | | |
Dividends from underlying funds | | | 1,738 | | | | | |
Foreign taxes withheld | | | (1,821 | ) | | | | |
Total investment income | | | | | | | $350,090 | |
Expenses | | | | | | | | |
Management fee | | | $273,778 | | | | | |
Distribution and/or service fees | | | 38,010 | | | | | |
Administrative services fee | | | 15,690 | | | | | |
Trustees’ compensation | | | 4,812 | | | | | |
Custodian fee | | | 23,130 | | | | | |
Shareholder communications | | | 7,511 | | | | | |
Auditing fees | | | 46,619 | | | | | |
Legal fees | | | 7,120 | | | | | |
Miscellaneous | | | 13,559 | | | | | |
Total expenses | | | | | | | $430,229 | |
Fees paid indirectly | | | (1 | ) | | | | |
Net expenses | | | | | | | $430,228 | |
Net investment loss | | | | | | | $(80,138 | ) |
Realized and unrealized gain (loss) on investments and foreign currency transactions | | | | | | | | |
Realized gain (loss) (identified cost basis) | | | | | | | | |
Investment transactions | | | $6,147,214 | | | | | |
Foreign currency transactions | | | (12,969 | ) | | | | |
Net realized gain (loss) on investments and foreign currency transactions | | | | | | | $6,134,245 | |
Change in unrealized appreciation (depreciation) | | | | | | | | |
Investments | | | $3,418,875 | | | | | |
Translation of assets and liabilities in foreign currencies | | | 55 | | | | | |
Net unrealized gain (loss) on investments and foreign currency translation | | | | | | | $3,418,930 | |
Net realized and unrealized gain (loss) on investments and foreign currency | | | | | | | $9,553,175 | |
Change in net assets from operations | | | | | | | $9,473,037 | |
See Notes to Financial Statements
11
MFS Mid Cap Growth Portfolio
FINANCIAL STATEMENTS | STATEMENTS OF CHANGES IN NET ASSETS
These statements describe the increases and/or decreases in net assets resulting from operations, any distributions, and any shareholder transactions.
| | | | | | | | |
For years ended 12/31 | | | 2010 | | | | 2009 | |
Change in net assets | | | | | | | | |
From operations | | | | | | | | |
Net investment loss | | | $(80,138 | ) | | | $(109,884 | ) |
Net realized gain (loss) on investments and foreign currency transactions | | | 6,134,245 | | | | (3,767,710 | ) |
Net unrealized gain (loss) on investments and foreign currency translation | | | 3,418,930 | | | | 15,070,454 | |
Change in net assets from operations | | | $9,473,037 | | | | $11,192,860 | |
Distributions declared to shareholders | | | | | | | | |
From net investment income | | | $— | | | | $(11,707 | ) |
From tax return of capital | | | — | | | | (102 | ) |
Total distributions declared to shareholders | | | $— | | | | $(11,809 | ) |
Change in net assets from fund share transactions | | | $(5,270,471 | ) | | | $(5,049,354 | ) |
Total change in net assets | | | $4,202,566 | | | | $6,131,697 | |
Net assets | | | | | | | | |
At beginning of period | | | 36,244,734 | | | | 30,113,037 | |
At end of period | | | $40,447,300 | | | | $36,244,734 | |
See Notes to Financial Statements
12
MFS Mid Cap Growth Portfolio
FINANCIAL STATEMENTS | FINANCIAL HIGHLIGHTS
The financial highlights table is intended to help you understand the fund’s financial performance for the past 5 years. Certain information reflects financial results for a single fund share. The total returns in the table represent the rate by which an investor would have earned (or lost) on an investment in the fund share class (assuming reinvestment of all distributions) held for the entire period.
| | | | | | | | | | | | | | | | | | | | |
| Initial Class | | Years ended 12/31 | |
| | | 2010 | | | 2009 | | | 2008 | | | 2007 | | | 2006 | |
Net asset value, beginning of period | | | $4.65 | | | | $3.27 | | | | $6.72 | | | | $6.12 | | | | $5.98 | |
| Income (loss) from investment operations | | | | | | | | | | | | | | | | | | | | |
Net investment income (loss) (d) | | | $(0.01 | ) | | | $(0.01 | ) | | | $0.01 | | | | $(0.01 | ) | | | $0.01 | |
Net realized and unrealized gain (loss) on investments
and foreign currency | | | 1.37 | | | | 1.39 | | | | (3.46 | ) | | | 0.61 | | | | 0.13 | |
Total from investment operations | | | $1.36 | | | | $1.38 | | | | $(3.45 | ) | | | $0.60 | | | | $0.14 | |
| Less distributions declared to shareholders | | | | | | | | | | | | | | | | | | | | |
From net investment income | | | $— | | | | $(0.00 | )(w) | | | $— | | | | $(0.00 | )(w) | | | $— | |
From tax return of capital | | | — | | | | (0.00 | )(w) | | | — | | | | — | | | | — | |
Total distribution declared to shareholders | | | $— | | | | $(0.00 | )(w) | | | $— | | | | $(0.00 | )(w) | | | $— | |
Net asset value, end of period | | | $6.01 | | | | $4.65 | | | | $3.27 | | | | $6.72 | | | | $6.12 | |
Total return (%) (k)(r)(s) | | | 29.25 | | | | 42.31 | | | | (51.34 | ) | | | 9.84 | | | | 2.34 | |
Ratios (%) (to average net assets)
and Supplemental data: | | | | | | | | | | | | | | | | | | | | |
Expenses before expense reductions (f) | | | 1.07 | | | | 1.05 | | | | 0.97 | | | | 0.88 | | | | 0.93 | |
Expenses after expense reductions (f) | | | N/A | | | | N/A | | | | N/A | | | | 0.88 | | | | 0.91 | |
Net investment income (loss) | | | (0.11 | ) | | | (0.23 | ) | | | 0.13 | | | | (0.12 | ) | | | 0.11 | |
Portfolio turnover | | | 83 | | | | 100 | | | | 100 | | | | 80 | | | | 139 | |
Net assets at end of period (000 omitted) | | | $24,944 | | | | $20,300 | | | | $15,803 | | | | $44,944 | | | | $53,504 | |
| |
| Service Class | | Years ended 12/31 | |
| | | 2010 | | | 2009 | | | 2008 | | | 2007 | | | 2006 | |
Net asset value, beginning of period | | | $4.57 | | | | $3.22 | | | | $6.63 | | | | $6.05 | | | | $5.92 | |
| Income (loss) from investment operations | | | | | | | | | | | | | | | | | | | | |
Net investment loss (d) | | | $(0.02 | ) | | | $(0.02 | ) | | | $(0.01 | ) | | | $(0.02 | ) | | | $(0.01 | ) |
Net realized and unrealized gain (loss) on investments
and foreign currency | | | 1.34 | | | | 1.37 | | | | (3.40 | ) | | | 0.60 | | | | 0.14 | |
Total from investment operations | | | $1.32 | | | | $1.35 | | | | $(3.41 | ) | | | $0.58 | | | | $0.13 | |
Net asset value, end of period | | | $5.89 | | | | $4.57 | | | | $3.22 | | | | $6.63 | | | | $6.05 | |
Total return (%) (k)(r)(s) | | | 28.88 | | | | 41.93 | | | | (51.43 | ) | | | 9.59 | | | | 2.20 | |
Ratios (%) (to average net assets)
and Supplemental data: | | | | | | | | | | | | | | | | | | | | |
Expenses before expense reductions (f) | | | 1.32 | | | | 1.30 | | | | 1.22 | | | | 1.13 | | | | 1.18 | |
Expenses after expense reductions (f) | | | N/A | | | | N/A | | | | N/A | | | | 1.13 | | | | 1.16 | |
Net investment loss | | | (0.38 | ) | | | (0.48 | ) | | | (0.12 | ) | | | (0.37 | ) | | | (0.11 | ) |
Portfolio turnover | | | 83 | | | | 100 | | | | 100 | | | | 80 | | | | 139 | |
Net assets at end of period (000 omitted) | | | $15,504 | | | | $15,944 | | | | $14,310 | | | | $32,919 | | | | $36,645 | |
| (d) | Per share data is based on average shares outstanding. |
| (f) | Ratios do not reflect reductions from fees paid indirectly, if applicable. |
| (k) | The total return does not reflect expenses that apply to separate accounts. Inclusion of these charges would reduce the total return figures for all periods shown. |
| (r) | Certain expenses have been reduced without which performance would have been lower. |
| (s) | From time to time the fund may receive proceeds from litigation settlements, without which performance would be lower. |
| (w) | Per share amount was less than $0.01. |
See Notes to Financial Statements
13
MFS Mid Cap Growth Portfolio
NOTES TO FINANCIAL STATEMENTS
| (1) | | Business and Organization |
MFS Mid Cap Growth Portfolio (the fund) is a series of MFS Variable Insurance Trust II (the trust). The trust is organized as a Massachusetts business trust and is registered under the Investment Company Act of 1940, as amended, as an open-end management investment company. The shareholders of each series of the trust are separate accounts of insurance companies, which offer variable annuity and/or life insurance products, and qualified retirement and pension plans.
| (2) | | Significant Accounting Policies |
General – The preparation of financial statements in conformity with U.S. generally accepted accounting principles requires management to make estimates and assumptions that affect the reported amounts of assets and liabilities, and disclosure of contingent assets and liabilities at the date of the financial statements and the reported amounts of revenues and expenses during the reporting period. Actual results could differ from those estimates. In the preparation of these financial statements, management has evaluated subsequent events occurring after the date of the fund’s Statement of Assets and Liabilities through the date that the financial statements were issued. The fund invests in foreign securities, including securities of emerging market issuers. Investments in foreign securities are vulnerable to the effects of changes in the relative values of the local currency and the U.S. dollar and to the effects of changes in each country’s legal, political, and economic environment. The markets of emerging markets countries are generally more volatile than the markets of developed countries with more mature economies. All of the risks of investing in foreign securities previously described are heightened when investing in emerging markets countries.
Investment Valuations – Equity securities, including restricted equity securities, are generally valued at the last sale or official closing price as provided by a third-party pricing service on the market or exchange on which they are primarily traded. Equity securities, for which there were no sales reported that day, are generally valued at the last quoted daily bid quotation as provided by a third-party pricing service on the market or exchange on which such securities are primarily traded. Equity securities held short, for which there were no sales reported for that day, are generally valued at the last quoted daily ask quotation as provided by a third-party pricing service on the market or exchange on which such securities are primarily traded. Short-term instruments with a maturity at issuance of 60 days or less generally are valued at amortized cost, which approximates market value. Open-end investment companies are generally valued at net asset value per share. Securities and other assets generally valued on the basis of information from a third-party pricing service may also be valued at a broker/dealer bid quotation. Values obtained from third-party pricing services can utilize both transaction data and market information such as yield, quality, coupon rate, maturity, type of issue, trading characteristics, and other market data. The values of foreign securities and other assets and liabilities expressed in foreign currencies are converted to U.S. dollars using the mean of bid and asked prices for rates provided by a third-party pricing service.
The Board of Trustees has delegated primary responsibility for determining or causing to be determined the value of the fund’s investments (including any fair valuation) to the adviser pursuant to valuation policies and procedures approved by the Board. If the adviser determines that reliable market quotations are not readily available, investments are valued at fair value as determined in good faith by the adviser in accordance with such procedures under the oversight of the Board of Trustees. Under the fund’s valuation policies and procedures, market quotations are not considered to be readily available for most types of debt instruments and floating rate loans and many types of derivatives. These investments are generally valued at fair value based on information from third-party pricing services. In addition, investments may be valued at fair value if the adviser determines that an investment’s value has been materially effected by events occurring after the close of the exchange or market on which the investment is principally traded (such as foreign exchange or market) and prior to the determination of the fund’s net asset value, or after the halting of trading of a specific security where trading does not resume prior to the close of the exchange or market on which the security is principally traded. Events that occur on a frequent basis after foreign markets close (such as developments in foreign markets and significant movements in the U.S. markets) and prior to the determination of the fund’s net asset value may be deemed to have a material effect on the value of securities traded in foreign markets. Accordingly, the fund’s foreign equity securities may often be valued at fair value. The adviser generally relies on third-party pricing services or other information (such as the correlation with price movements of similar securities in the same or other markets; the type, cost and investment characteristics of the security; the business and financial condition of the issuer; and trading and other market data) to assist in determining whether to fair value and at what value to fair value an investment. The value of an investment for purposes of calculating the fund’s net asset value can differ depending on the source and method used to determine value. When fair valuation is used, the value of an investment used to determine the fund’s net asset value may differ from quoted or published prices for the same investment. There can be no assurance that the fund could obtain the fair value assigned to an investment if it were to sell the investment at the same time at which the fund determines its net asset value per share.
14
MFS Mid Cap Growth Portfolio
Notes to Financial Statements – continued
Various inputs are used in determining the value of the fund’s assets or liabilities. These inputs are categorized into three broad levels. In certain cases, the inputs used to measure fair value may fall into different levels of the fair value hierarchy. In such cases, an investment’s level within the fair value hierarchy is based on the lowest level of input that is significant to the fair value measurement. The fund’s assessment of the significance of a particular input to the fair value measurement in its entirety requires judgment, and considers factors specific to the investment. Level 1 includes unadjusted quoted prices in active markets for identical assets or liabilities. Level 2 includes other significant observable market-based inputs (including quoted prices for similar securities, interest rates, prepayment speed, and credit risk). Level 3 includes unobservable inputs, which may include the adviser’s own assumptions in determining the fair value of investments. The following is a summary of the levels used as of December 31, 2010 in valuing the fund’s assets or liabilities:
| | | | | | | | | | | | | | | | |
| Investments at Value | | Level 1 | | | Level 2 | | | Level 3 | | | Total | |
| Equity Securities | | | $40,172,038 | | | | $— | | | | $— | | | | $40,172,038 | |
| Mutual Funds | | | 475,366 | | | | — | | | | — | | | | 475,366 | |
| Total Investments | | | $40,647,404 | | | | $— | | | | $— | | | | $40,647,404 | |
For further information regarding security characteristics, see the Portfolio of Investments.
Foreign Currency Translation – Purchases and sales of foreign investments, income, and expenses are converted into U.S. dollars based upon currency exchange rates prevailing on the respective dates of such transactions or on the reporting date for foreign denominated receivables and payables. Gains and losses attributable to foreign currency exchange rates on sales of securities are recorded for financial statement purposes as net realized gains and losses on investments. Gains and losses attributable to foreign exchange rate movements on receivables, payables, income and expenses are recorded for financial statement purposes as foreign currency transaction gains and losses. That portion of both realized and unrealized gains and losses on investments that results from fluctuations in foreign currency exchange rates is not separately disclosed.
Short Sales – The fund may enter into short sales whereby it sells a security it does not own in anticipation of a decline in the value of that security. The fund will realize a gain if the security price decreases and a loss if the security price increases between the date of the short sale and the date on which the fund replaces the borrowed security. Losses from short sales can exceed the proceeds of the security sold; and they can also exceed the potential loss from an ordinary buy and sell transaction. The amount of any premium, dividends, or interest the fund may be required to pay in connection with a short sale will be recognized as a fund expense. The fund segregates cash or marketable securities in an amount that, when combined with the amount of proceeds from the short sale deposited with the broker, at least equals the current market value of the security sold short. At December 31, 2010, the fund has yet to enter into such transactions.
Security Loans – State Street Bank and Trust Company (“State Street”), as lending agent, loans the securities of the fund to certain qualified institutions (the “Borrowers”) approved by the fund. The loans are collateralized by cash and/or U.S. Treasury and federal agency obligations in an amount typically at least equal to the market value of the securities loaned. The market value of the loaned securities is determined at the close of business of the fund and any additional required collateral is delivered to the fund on the next business day. State Street provides the fund with indemnification against Borrower default. The fund bears the risk of loss with respect to the investment of cash collateral. On loans collateralized by cash, the cash collateral is invested in a money market fund or short-term securities. A portion of the income generated upon investment of the collateral is remitted to the Borrowers, and the remainder is allocated between the fund and the lending agent. On loans collateralized by U.S. Treasury and/or federal agency obligations, a fee is received from the Borrower, and is allocated between the fund and the lending agent. Income from securities lending is included in interest income on the Statement of Operations. The dividend and interest income earned on the securities loaned is accounted for in the same manner as other dividend and interest income.
Indemnifications – Under the fund’s organizational documents, its officers and Trustees may be indemnified against certain liabilities and expenses arising out of the performance of their duties to the fund. Additionally, in the normal course of business, the fund enters into agreements with service providers that may contain indemnification clauses. The fund’s maximum exposure under these agreements is unknown as this would involve future claims that may be made against the fund that have not yet occurred.
Investment Transactions and Income – Investment transactions are recorded on the trade date. Interest income is recorded on the accrual basis. All premium and discount is amortized or accreted for financial statement purposes in accordance with U.S. generally accepted accounting principles. Dividends received in cash are recorded on the ex-dividend date. Certain dividends from foreign securities will be recorded when the fund is informed of the dividend if such information is obtained subsequent to the ex-dividend date. Dividend and interest payments received in additional securities are recorded on the ex-dividend or ex-interest date in an amount equal to the value of the security on such date.
15
MFS Mid Cap Growth Portfolio
Notes to Financial Statements – continued
The fund may receive proceeds from litigation settlements. Any proceeds received from litigation involving portfolio holdings are reflected in the Statement of Operations in realized gain/loss if the security has been disposed of by the fund or in unrealized gain/loss if the security is still held by the fund. Any other proceeds from litigation not related to portfolio holdings are reflected as other income in the Statement of Operations.
Fees Paid Indirectly – The fund’s custody fee may be reduced according to an arrangement that measures the value of cash deposited with the custodian by the fund. This amount, for the year ended December 31, 2010, is shown as a reduction of total expenses on the Statement of Operations.
Tax Matters and Distributions – The fund intends to qualify as a regulated investment company, as defined under Subchapter M of the Internal Revenue Code, and to distribute all of its taxable income, including realized capital gains. As a result, no provision for federal income tax is required. The fund’s federal tax returns for the prior three fiscal years remain subject to examination by the Internal Revenue Service. Foreign taxes, if any, have been accrued by the fund in the accompanying financial statements.
Distributions to shareholders are recorded on the ex-dividend date. Income and capital gain distributions are determined in accordance with income tax regulations, which may differ from U.S. generally accepted accounting principles. Certain capital accounts in the financial statements are periodically adjusted for permanent differences in order to reflect their tax character. These adjustments have no impact on net assets or net asset value per share. Temporary differences which arise from recognizing certain items of income, expense, gain or loss in different periods for financial statement and tax purposes will reverse at some time in the future. Distributions in excess of net investment income or net realized gains are temporary overdistributions for financial statement purposes resulting from differences in the recognition or classification of income or distributions for financial statement and tax purposes.
Book/tax differences primarily relate to net operating losses and expiration of capital loss carryforwards.
The tax character of distributions declared to shareholders for the last two fiscal years is as follows:
| | | | | | | | |
| | | 12/31/10 | | | 12/31/09 | |
| Ordinary income (including any short-term capital gains) | | | $— | | | | $11,707 | |
| Tax return of capital (b) | | | — | | | | 102 | |
| Total distributions | | | $— | | | | $11,809 | |
(b) Distributions in excess of tax basis earnings and profits are reported in the financial statements as a tax return of capital. | |
The federal tax cost and the tax basis components of distributable earnings were as follows:
| | | | |
| As of 12/31/10 | | | | |
| Cost of investments | | | $30,845,606 | |
| Gross appreciation | | | 9,968,989 | |
| Gross depreciation | | | (167,191 | ) |
| Net unrealized appreciation (depreciation) | | | $9,801,798 | |
| Capital loss carryforwards | | | (20,442,476 | ) |
| Other temporary differences | | | 86 | |
As of December 31, 2010, the fund had capital loss carryforwards available to offset future realized gains. Such losses expire as follows:
| | | | |
| 12/31/16 | | | $(16,008,756 | ) |
| 12/31/17 | | | (4,433,720 | ) |
| Total | | | $(20,442,476 | ) |
Multiple Classes of Shares of Beneficial Interest – The fund offers multiple classes of shares, which differ in their respective distribution and/or service fees. The fund’s income, realized and unrealized gain (loss), and common expenses are allocated to shareholders based on the daily net assets of each class. Dividends are declared separately for each class. Differences in per share dividend rates are generally due to differences in separate class expenses. The fund’s distributions declared to shareholders as reported on the Statements of Changes in Net Assets are presented by class as follows:
| | | | | | | | | | | | | | | | |
| | | From net investment
income | | | From tax return of
capital | |
| | | Year ended
12/31/10 | | | Year ended
12/31/09 | | | Year ended
12/31/10 | | | Year ended
12/31/09 | |
| Initial Class | | | $— | | | | $11,707 | | | | $— | | | | $102 | |
16
MFS Mid Cap Growth Portfolio
Notes to Financial Statements – continued
| (3) | | Transactions with Affiliates |
Investment Adviser – The fund has an investment advisory agreement with MFS to provide overall investment management and related administrative services and facilities to the fund. The management fee is computed daily and paid monthly at the following annual rates:
| | | | |
| First $1 billion of average daily net assets | | | 0.75% | |
| Average daily net assets in excess of $1 billion | | | 0.70% | |
The investment adviser has agreed in writing to reduce its management fee to 0.65% of average daily net assets in excess of $2.5 billion. This written agreement will continue until modified or rescinded by the fund’s Board of Trustees, but such agreement will continue at least until April 30, 2012. For the year ended December 31, 2010, the fund’s average daily net assets did not exceed $2.5 billion and therefore, the management fee was not reduced. The management fee incurred for the year ended December 31, 2010 was equivalent to an annual effective rate of 0.75% of the fund’s average daily net assets.
Distributor – MFS Fund Distributors, Inc. (MFD), a wholly-owned subsidiary of MFS, is the distributor of shares of the fund. The Trustees have adopted a distribution plan for the Service Class shares pursuant to Rule 12b-1 under the Investment Company Act of 1940.
The fund’s distribution plan provides that the fund will pay MFD distribution and/or service fees equal to 0.25% per annum of its average daily net assets attributable to Service Class shares as partial consideration for services performed and expenses incurred by MFD and financial intermediaries (including participating insurance companies that invest in the fund to fund variable annuity and variable life insurance contracts, sponsors of qualified retirement and pension plans that invest in the fund, and affiliates of these participating insurance companies and plan sponsors) in connection with the sale and distribution of the Service Class shares. MFD may subsequently pay all, or a portion, of the distribution and/or service fees to financial intermediaries.
Shareholder Servicing Agent – MFS Service Center, Inc. (MFSC), a wholly-owned subsidiary of MFS, has contracted to provide transfer agent and recordkeeping functions in connection with the issuance, transfer, and redemption of each class of shares of the fund under a Shareholder Servicing Agent Agreement. During the year ended December 31, 2010, the fund did not pay MFSC a fee for this service.
Administrator – MFS provides certain financial, legal, shareholder communications, compliance, and other administrative services to the fund. Under an administrative services agreement, the fund partially reimburses MFS the costs incurred to provide these services. The fund is charged an annual fixed amount of $10,000 plus a fee based on average daily net assets. The administrative services fee incurred for the year ended December 31, 2010 was equivalent to an annual effective rate of 0.0430% of the fund’s average daily net assets.
Trustees’ and Officers’ Compensation – The fund pays compensation to Trustees in the form of a retainer, attendance fees, and additional compensation to the Board chairperson. The fund does not pay compensation directly to officers of the fund who are also officers of the investment adviser, all of whom receive remuneration for their services to the fund from MFS. Certain officers of the fund are officers or directors of MFS, MFD, and MFSC.
Other – This fund and certain other funds managed by MFS (the funds) have entered into services agreements (the Agreements) which provide for payment of fees by the funds to Tarantino LLC and Griffin Compliance LLC in return for the provision of services of an Independent Chief Compliance Officer (ICCO) and Assistant ICCO, respectively, for the funds. The ICCO and Assistant ICCO are officers of the funds and the sole members of Tarantino LLC and Griffin Compliance LLC, respectively. The funds can terminate the Agreements with Tarantino LLC and Griffin Compliance LLC at any time under the terms of the Agreements. MFS has agreed to bear all expenses associated with office space, other administrative support, and supplies provided to the ICCO and Assistant ICCO. For the year ended December 31, 2010, the aggregate fees paid by the fund to Tarantino LLC and Griffin Compliance LLC were $616 and are included in miscellaneous expense on the Statement of Operations.
The fund invests in the MFS Institutional Money Market Portfolio which is managed by MFS and seeks a high level of current income consistent with preservation of capital and liquidity. Income earned on this investment is included in dividends from underlying funds on the Statement of Operations. This money market fund does not pay a management fee to MFS.
Purchases and sales of investments, other than U.S. Government securities, purchased option transactions, and short-term obligations, aggregated $29,522,147 and $34,725,091, respectively.
17
MFS Mid Cap Growth Portfolio
Notes to Financial Statements – continued
| (5) | | Shares of Beneficial Interest |
The fund’s Declaration of Trust permits the Trustees to issue an unlimited number of full and fractional shares of beneficial interest. Transactions in fund shares were as follows:
| | | | | | | | | | | | | | | | |
| | | Year ended 12/31/10 | | | Year ended 12/31/09 | |
| | | Shares | | | Amount | | | Shares | | | Amount | |
| Shares sold | | | | | | | | | | | | | | | | |
Initial Class | | | 512,955 | | | | $2,729,233 | | | | 452,816 | | | | $1,799,092 | |
Service Class | | | 249,849 | | | | 1,320,751 | | | | 217,078 | | | | 734,486 | |
| | | 762,804 | | | | $4,049,984 | | | | 669,894 | | | | $2,533,578 | |
| Shares issued to shareholders in reinvestment of distributions | | | | | | | | | | | | | | | | |
Initial Class | | | — | | | | $— | | | | 3,484 | | | | $11,809 | |
| Shares reacquired | | | | | | | | | | | | | | | | |
Initial Class | | | (730,608 | ) | | | $(3,656,906 | ) | | | (922,970 | ) | | | $(3,364,108 | ) |
Service Class | | | (1,109,679 | ) | | | (5,663,549 | ) | | | (1,173,530 | ) | | | (4,230,633 | ) |
| | | (1,840,287 | ) | | | $(9,320,455 | ) | | | (2,096,500 | ) | | | $(7,594,741 | ) |
| Net change | | | | | | | | | | | | | | | | |
Initial Class | | | (217,653 | ) | | | $(927,673 | ) | | | (466,670 | ) | | | $(1,553,207 | ) |
Service Class | | | (859,830 | ) | | | (4,342,798 | ) | | | (956,452 | ) | | | (3,496,147 | ) |
| | | (1,077,483 | ) | | | $(5,270,471 | ) | | | (1,423,122 | ) | | | $(5,049,354 | ) |
The fund and certain other funds managed by MFS participate in a $1.1 billion unsecured committed line of credit, subject to a $1 billion sublimit, provided by a syndication of banks under a credit agreement. Borrowings may be made for temporary financing needs. Interest is charged to each fund, based on its borrowings, generally at a rate equal to the higher of the Federal Reserve funds rate or one month LIBOR plus an agreed upon spread. A commitment fee, based on the average daily, unused portion of the committed line of credit, is allocated among the participating funds at the end of each calendar quarter. In addition, the fund and other funds managed by MFS have established unsecured uncommitted borrowing arrangements with certain banks for temporary financing needs. Interest is charged to each fund, based on its borrowings, at a rate equal to the Federal Reserve funds rate plus an agreed upon spread. For the year ended December 31, 2010, the fund’s commitment fee and interest expense were $406 and $0, respectively, and are included in miscellaneous expense on the Statement of Operations.
| (7) | | Transactions in Underlying Funds – Affiliated Issuers |
An affiliated issuer may be considered one in which the fund owns 5% or more of the outstanding voting securities, or a company which is under common control. For the purposes of this report, the fund assumes the following to be affiliated issuers:
| | | | | | | | | | | | | | | | |
| Underlying Funds | | Beginning
Shares/Par
Amount | | | Acquisitions
Shares/Par
Amount | | | Dispositions
Shares/Par
Amount | | | Ending
Shares/Par
Amount | |
| MFS Institutional Money Market Portfolio | | | 450,920 | | | | 12,718,009 | | | | (12,693,563 | ) | | | 475,366 | |
| | | | |
| Underlying Funds | | Realized
Gain (Loss) | | | Capital Gain
Distributions | | | Dividend
Income | | | Ending
Value | |
| MFS Institutional Money Market Portfolio | | | $— | | | | $— | | | | $1,738 | | | | $475,366 | |
18
MFS Mid Cap Growth Portfolio
REPORT OF INDEPENDENT REGISTERED PUBLIC ACCOUNTING FIRM
To the Board of Trustees of MFS Variable Insurance Trust II and the Shareholders of
MFS Mid Cap Growth Portfolio:
We have audited the accompanying statement of assets and liabilities, including the portfolio of investments, of MFS Mid Cap Growth Portfolio (the “Fund”) (one of the portfolios comprising MFS Variable Insurance Trust II) as of December 31, 2010, and the related statement of operations for the year then ended, the statements of changes in net assets for each of the two years in the period then ended, and the financial highlights for each of the five years in the period then ended. These financial statements and financial highlights are the responsibility of the Fund’s management. Our responsibility is to express an opinion on these financial statements and financial highlights based on our audits.
We conducted our audits in accordance with the standards of the Public Company Accounting Oversight Board (United States). Those standards require that we plan and perform the audit to obtain reasonable assurance about whether the financial statements and financial highlights are free of material misstatement. The Fund is not required to have, nor were we engaged to perform, an audit of its internal control over financial reporting. Our audits included consideration of internal control over financial reporting as a basis for designing audit procedures that are appropriate in the circumstances, but not for the purpose of expressing an opinion on the effectiveness of the Fund’s internal control over financial reporting. Accordingly, we express no such opinion. An audit also includes examining, on a test basis, evidence supporting the amounts and disclosures in the financial statements, assessing the accounting principles used and significant estimates made by management, as well as evaluating the overall financial statement presentation. Our procedures included confirmation of securities owned as of December 31, 2010, by correspondence with the custodian. We believe that our audits provide a reasonable basis for our opinion.
In our opinion, the financial statements and financial highlights referred to above present fairly, in all material respects, the financial position of MFS Mid Cap Growth Portfolio as of December 31, 2010, the results of its operations for the year then ended, the changes in its net assets for each of the two years in the period then ended, and the financial highlights for each of the five years in the period then ended, in conformity with accounting principles generally accepted in the United States of America.
DELOITTE & TOUCHE LLP
Boston, Massachusetts
February 14, 2011
19
MFS Mid Cap Growth Portfolio
TRUSTEES AND OFFICERS – IDENTIFICATION AND BACKGROUND
The Trustees and officers of the Trust, as of February 1, 2011, are listed below, together with their principal occupations during the past five years. (Their titles may have varied during that period.) The address of each Trustee and officer is 500 Boylston Street, Boston, Massachusetts 02116.
| | | | | | |
Name, Date of Birth | | Position(s) Held
with Fund | | Trustee/Officer
Since (1) | | Principal Occupations During the Past Five Years and
Other Directorships (2) |
| INTERESTED TRUSTEE | | | | |
David D. Horn (3) (born 6/07/41) | | Trustee | | April 1986 | | Private investor; Sun Life Assurance Company of Canada, Senior Vice President and General Manager for the United States (until 1997); Director (until March 2004) |
| | |
| INDEPENDENT TRUSTEES | | | | |
J. Kermit Birchfield (born 1/08/40) | | Chairman | | May 1997 | | Consultant; Century Partners, Inc. (investments), Director; Displaytech, Inc. (technology), Chairman; Dessin Fournir LLC (furniture manufacturer), Director; Site Watch LLC (software to monitor oil tanks), Managing Director (2006 to present); Juridica Investments (fund investing in judicial matters), Director (2007 to present), Immuno Science, Inc. (medical research), Independent Director (2009 to present), Intermountain Industries, Inc. (oil & gas exploration and production), Director (until February 2009) |
| | | |
Robert C. Bishop (born 1/13/43) | | Trustee | | May 2001 | | AutoImmune, Inc. (pharmaceutical product development), Chairman, President and Chief Executive Officer; Caliper Life Sciences Corp. (laboratory analytical instruments), Chairman; Optobionics Corporation (ophthalmic devices), Director (until 2007); Millipore Corporation (purification/filtration products), Director (until July 2010); Waterstreet Capital (leverage buyouts), Advisory Board (until August 2010) |
| | | |
Frederick H. Dulles (born 3/12/42) | | Trustee | | May 2001 | | Dulles International Law LLC (law firm), Senior Lawyer (since 2009); Juridica Capital Management (US) Inc. (litigation financing), Vice President and General Counsel (since 2009); Dulles Properties LLC (real estate), Broker (since 2008); The Citadel School of Business Administration (education), Adjunct Professor (since 2003); Disher, Hamrick & Myers Residential, Inc. (real estate), Broker (until 2006); Frederick H. Dulles Law Practice (law firm), (until 2006); Charlestown School of Law (education), Adjunct Professor (until 2007); Prudential Carolina Real Estate, (real estate), Broker (until 2008); Free Enterprise Foundation Inc. (research institute), Director & Secretary (until 2008); Ten State International Law PLLP (law firm), Of Counsel (until 2009) |
| | | |
Marcia A. Kean (born 6/30/48) | | Trustee | | April 2005 | | Feinstein Kean Healthcare (consulting), Chief Executive Officer |
| | | |
Ronald G. Steinhart (born 6/15/40) | | Trustee | | May 2001 | | Private investor; Penske Automotive Group (automotive retailer), Director; Animal Health International, Inc. (animal health products), Director (since 2007); Texas Industries (concrete/aggregates/cement), Director (since 2007); Susser Holdings Corporation (retail convenience stores and distributor of wholesale motor fuel), Director (since 2009); Prentiss Properties Trust (real estate investment trust), Director (until 2006); Penson Worldwide, Inc. (securities clearance), Director (until 2008) |
| | | |
Haviland Wright (born 7/21/48) | | Trustee | | May 2001 | | X-Change Corp. (multi-media web services), Director (since 2010); Nano Loa Inc. (liquid crystal displays), Director (until 2009); Profitability of Hawaii (software), Chief Development Officer (until 2010); Elixir Technologies Corporation (software), Director (until 2010) |
| | | |
| OFFICERS | | | | | | |
Maria F. DiOrioDwyer (4)
(born 12/01/58) | | President | | November 2005 | | Massachusetts Financial Services Company, Executive Vice President and Chief Regulatory Officer; Chief Compliance Officer (since December 2006) |
| | | |
| Christopher R. Bohane (4) (born 1/18/74) | | Assistant Secretary and Assistant Clerk | | July 2005 | | Massachusetts Financial Services Company, Vice President and Senior Counsel |
| | | |
John M. Corcoran (4) (born 4/13/65) | | Treasurer | | October 2008 | | Massachusetts Financial Services Company, Senior Vice President (since October 2008); State Street Bank and Trust (financial services provider), Senior Vice President, (until September 2008) |
| | | |
Ethan D. Corey (4) (born 11/21/63) | | Assistant Secretary and Assistant Clerk | | July 2005 | | Massachusetts Financial Services Company, Senior Vice President and Associate General Counsel |
| | | |
David L. DiLorenzo (4) (born 8/10/68) | | Assistant Treasurer | | July 2005 | | Massachusetts Financial Services Company, Vice President |
| | | |
Timothy M. Fagan (4) (born 7/10/68) | | Assistant Secretary and Assistant Clerk | | September 2005 | | Massachusetts Financial Services Company, Vice President and Senior Counsel |
| | | |
Mark D. Fischer (4) (born 10/27/70) | | Assistant Treasurer | | July 2005 | | Massachusetts Financial Services Company, Vice President |
20
MFS Mid Cap Growth Portfolio
Trustees and Officers – continued
| | | | | | |
Name, Date of Birth | | Position(s) Held
with Fund | | Trustee/Officer
Since (1) | | Principal Occupations During the Past Five Years and
Other Directorships (2) |
Robyn L. Griffin (born 7/04/75) | | Assistant Independent Chief Compliance Officer | | August 2008 | | Griffin Compliance LLC (provider of compliance services), Principal (since August 2008); State Street Corporation (financial services provider), Mutual Fund Administration Assistant Vice President (October 2006 – July 2008); Liberty Mutual Group (insurance), Personal Market Assistant Controller (April 2006 – October 2006); Deloitte & Touche LLP (professional services firm), Senior Manager (prior to April 2006) |
| | | |
Brian E. Langenfeld (4) (born 3/07/73) | | Assistant Secretary and Assistant Clerk | | May 2006 | | Massachusetts Financial Services Company, Vice President and Senior Counsel (since May 2006); John Hancock Advisers, LLC, Assistant Vice President and Counsel (until April 2006) |
| | | |
Ellen Moynihan (4) (born 11/13/57) | | Assistant Treasurer | | May 1997 | | Massachusetts Financial Services Company, Senior Vice President |
| | | |
Susan S. Newton (4) (born 3/07/50) | | Assistant Secretary and Assistant Clerk | | May 2005 | | Massachusetts Financial Services Company, Senior Vice President and Associate General Counsel |
| | | |
Susan A. Pereira (4)
(born 11/05/70) | | Assistant Secretary and Assistant Clerk | | July 2005 | | Massachusetts Financial Services Company, Vice President and Senior Counsel |
| | | |
Mark N. Polebaum (4) (born 5/01/52) | | Secretary and Clerk | | February 2006 | | Massachusetts Financial Services Company, Executive Vice President, General Counsel and Secretary (since January 2006); Wilmer Cutler Pickering Hale and Dorr LLP (law firm), Partner (until January 2006) |
| | | |
Frank L. Tarantino (born 3/07/44) | | Independent Chief Compliance Officer | | September 2004 | | Tarantino LLC (provider of compliance services), Principal |
| | | |
Richard S. Weitzel (4) (born 7/16/70) | | Assistant Secretary and Assistant Clerk | | October 2007 | | Massachusetts Financial Services Company, Vice President and Assistant General Counsel |
| | | |
James O. Yost (4) (born 6/12/60) | | Assistant Treasurer | | April 1992 | | Massachusetts Financial Services Company, Senior Vice President |
| (1) | Date first appointed to serve as Trustee/Officer of an MFS fund or a Compass variable account. Each Trustee has served continuously since appointment. For the period March 2008 until October 2008, Ms. DiOrioDwyer served as Treasurer of the Funds. |
| (2) | Directorships or trusteeships of companies required to report to the Securities and Exchange Commission (i.e., “public companies”). |
| (3) | “Interested person” of the Trust, within the meaning of the Investment Company Act of 1940 (referred to as the 1940 Act), which is the principal federal law governing investment companies like the Trust, as a result of position with Sun Life of Canada (U.S.). The address of Sun Life of Canada (U.S.) is One Sun Life Executive Park, Wellesley Hills, Massachusetts 02481. |
| (4) | “Interested person” of MFS within the meaning of the 1940 Act. The address of MFS is 500 Boylston Street, Boston, Massachusetts 02116. |
The Trust does not hold annual meetings for the purpose of electing Trustees, and Trustees are not elected for fixed terms. Each Trustee and officer holds office until his or her successor is chosen and qualified, or until his or her earlier death, resignation, retirement or removal.
All Trustees currently serve as Trustees of the Trust and have served in that capacity since originally elected or appointed. All of the Trustees are also Managers of the Compass Variable Accounts. The executive officers of the Trust hold similar offices for the Compass Variable Accounts and other funds in the MFS fund complex. As of January 1, 2011, each Trustee serves as a Trustee or Manager of 31 Accounts/Portfolios.
21
MFS Mid Cap Growth Portfolio
Trustees and Officers – continued
The Statement of Additional Information contains further information about the Trustees and is available without charge upon request by calling 1-800-752-7215.
| | |
Investment Adviser
Massachusetts Financial Services Company 500 Boylston Street, Boston, MA 02116-3741 | | Custodian State Street Bank and Trust 1 Lincoln Street, Boston, MA 02111-2900 |
Distributor
MFS Fund Distributors, Inc. 500 Boylston Street, Boston, MA 02116-3741 | | Independent Registered Public Accounting Firm Deloitte & Touche LLP 200 Berkeley Street, Boston, MA 02116 |
Portfolio Managers David DeGroff Eric Fischman | | |
22
MFS Mid Cap Growth Portfolio
BOARD REVIEW OF INVESTMENT ADVISORY AGREEMENT
The Investment Company Act of 1940 requires that both the full Board of Trustees and a majority of the non-interested (“independent”) Trustees, voting separately, annually approve the continuation of the investment advisory agreement between MFS Variable Insurance Trust II (the “Trust”) and Massachusetts Financial Services Company (“MFS”) on behalf of the Fund. The Trustees consider matters bearing on the Fund and the advisory arrangement at their meetings throughout the year, including a review of performance data at each regular meeting. In addition, the independent Trustees met in person in May and again in July 2010 (“contract review meetings”) for the specific purpose of considering whether to approve the continuation of the investment advisory agreement for the Fund. The independent Trustees were assisted in their evaluation of the investment advisory agreement by independent legal counsel, from whom they received separate legal advice and with whom they met separately from MFS management during various contract review meetings. The independent Trustees were also assisted in this process by the Fund’s Independent Chief Compliance Officer, a full-time senior officer appointed by and reporting to the independent Trustees.
In connection with their deliberations, the Trustees, including the independent Trustees, considered such information and factors as they believed, in light of the legal advice furnished to them and their own business judgment, to be relevant. The investment advisory agreement was considered separately for the Fund, although the Trustees also took into account the common interests of all Funds in the Trust in their review. As described below, the Trustees considered the nature, quality, and extent of the various investment advisory, administrative, and shareholder services performed by MFS under the existing investment advisory agreement and other arrangements with the Trust.
In connection with their contract review meetings, the Trustees received and relied upon materials which included, among other items: (i) information provided by Lipper Inc. (“Lipper”) on the investment performance of the Fund for various time periods ended December 31, 2009, compared to the investment performance of a group of funds with substantially similar investment classifications/objectives (the “Lipper performance universe”), (ii) information provided by Lipper on the Fund’s advisory fees and other expenses compared to the advisory fees and other expenses of comparable funds identified by Lipper (the “Lipper expense group”), (iii) information provided by MFS on the advisory fees of comparable portfolios of its other clients, including institutional separate account and other clients, (iv) information as to whether, and to what extent applicable, expense waivers, reimbursements or fee “breakpoints” are observed for the Fund, (v) information regarding MFS’ financial results and financial condition, including MFS’ and certain of its affiliates’ estimated profitability from services performed for the Fund, (vi) MFS’ views regarding the outlook for the mutual fund industry and its strategic business plans, (vii) descriptions of various functions performed by MFS for the Trust, such as compliance monitoring and portfolio trading practices, and (viii) information regarding the overall organization of MFS, including information about MFS’ senior management and other personnel providing investment advisory, administrative and other services to the Fund. The comparative performance, fee and expense information prepared and provided by Lipper was not independently verified, and the independent Trustees did not independently verify any information provided to them by MFS.
The Trustees’ conclusion as to the continuation of the investment advisory agreement was based on comprehensive consideration of all information provided to the Trustees and was not the result of any single factor. Some of the factors that figured particularly in the Trustees’ deliberations are described below for the Fund, while individual Trustees may have given different weight to various factors and evaluated the information presented as a whole differently than another individual Trustee. The Trustees recognized that the fee arrangements for the Fund reflect years of review and discussion between the independent Trustees and MFS, that certain aspects of such arrangements may receive greater scrutiny in some years than others, and that the Trustees’ conclusions may be based, in part, on their consideration of these same arrangements during the course of the year and in prior years.
Based on information provided by Lipper, the Trustees compared the Fund’s total return investment performance to the performance of the Lipper performance universe over various time periods. The Trustees placed particular emphasis on the total return performance of the Fund’s Initial Class shares in comparison to the performance of funds in its Lipper performance universe over the one-, three- and five-year periods ended December 31, 2009. The Trustees did not rely on performance results for more recent periods, including those shown elsewhere in this report.
The Trustees noted the performance of the Fund’s Initial Class shares was in the 3rd quintile relative to the other funds in the Lipper performance universe for the one-year period (the 1st quintile being the best performers and the 5th quintile being the worst performers). The total return performance of the Fund was in the 5th quintile for the three-year and five-year periods ended December 31, 2009, relative to the Lipper performance universe. Based on the nature and quality of services provided by MFS and MFS’ explanation of steps taken to improve performance, the Board of Trustees concluded that the Fund’s performance was adequate.
23
MFS Mid Cap Growth Portfolio
Board Review of Investment Advisory Agreement – continued
In the course of their deliberations, the Trustees took into account information provided by MFS during contract review meetings, as well as during investment review meetings conducted with portfolio management personnel during the course of the year.
In assessing the reasonableness of the Fund’s advisory fee, the Trustees considered, among other information, the Fund’s advisory fee and the total expense ratio of the Fund’s Initial Class shares as a percentage of average daily net assets, compared to the advisory fee and total expense ratios of its peer group of funds based on information provided by Lipper. The Trustees also considered the advisory fees charged by MFS to institutional accounts. In comparing these fees, the Trustees considered the generally broader scope of services provided by MFS to the Trust than those provided to institutional accounts. The Trustees also considered the higher demands placed on MFS’ investment personnel and trading infrastructure as a result of the daily cash in-flows and out-flows of the Fund, and the impact on MFS and related expenses due to the more extensive regulatory regime to which the Fund is subject, compared to institutional accounts.
In considering the fees, the Trustees noted from the Lipper data that the Fund’s effective advisory fee rate and total expense ratio were each above the median of such fees and expenses of funds in the Lipper expense group. The Trustees further noted that MFS agreed to continue to reduce its advisory fee on average daily net assets over $2.5 billion, and concluded that the existing breakpoints were sufficient to allow the Fund to benefit from economies of scale as its assets grow. The Trustees concluded that the fees were reasonable in light of the nature and quality of services provided.
The Trustees also considered information prepared by MFS relating to its costs and profits with respect to the Fund and other investment companies and accounts advised by MFS, as well as MFS’ methodologies used to determine and allocate its costs to the Fund and other accounts and products for purposes of estimating profitability.
After reviewing these and other factors described below, the Trustees concluded that the advisory fees charged to the Fund represent reasonable compensation in light of the nature and quality of the services being provided by MFS.
In addition, the Trustees considered MFS’ resources and related efforts to continue to retain, attract and motivate capable personnel to serve the Fund. The Trustees also considered the financial resources of MFS and its parent, Sun Life Financial Inc. The Trustees further considered any advantages and possible disadvantages of having an adviser which also serves other investment companies as well as institutional accounts.
The Trustees also considered the nature, quality, cost, and extent of administrative, transfer agency, and distribution services provided to the Fund by MFS and its affiliates under agreements and plans other than the investment advisory agreement, including the 12b-1 fees the Fund pays to MFS Fund Distributors, Inc., an affiliate of MFS. The Trustees also considered the nature, extent and quality of certain other services MFS performs or arranges on the Fund’s behalf, which may include securities lending programs, directed expense payment programs, class action recovery programs, and MFS’ interaction with third-party service providers, principally custodians and sub-custodians. The Trustees concluded that the various non-advisory services provided by MFS and its affiliates on behalf of the Fund were satisfactory. The Trustees also considered the benefits to MFS from the use of the Fund’s portfolio brokerage commissions to pay for investment research and various other factors. Additionally, the Trustees considered so-called “fall-out benefits” to MFS such as reputational value derived from serving as investment manager to the Trust, and determined that any such benefits derived by MFS were reasonable and fair.
Based on their evaluation of factors that they deemed to be material, including those factors described above, the Board of Trustees, including a majority of the independent Trustees, concluded that the investment advisory agreement should be continued for an additional one-year period, commencing September 1, 2010.
A discussion regarding the Board’s most recent review and renewal of the fund’s Investment Advisory Agreement with MFS is available by clicking on the fund’s name under “Variable Insurance Portfolios — VIT II” in the “Products and Performance” section of the MFS Web site (mfs.com).
24
MFS Mid Cap Growth Portfolio
PROXY VOTING POLICIES AND INFORMATION
A general description of the MFS funds’ proxy voting policies and procedures is available without charge, upon request, by calling
1-800-225-2606, by visiting the Proxy Voting section of mfs.com or by visiting the SEC’s Web site at http://www.sec.gov.
Information regarding how the fund voted proxies relating to portfolio securities during the most recent twelve-month period ended June 30 is available without charge by visiting the Proxy Voting section of mfs.com or by visiting the SEC’s Web site at http://www.sec.gov.
QUARTERLY PORTFOLIO DISCLOSURE
The fund will file a complete schedule of portfolio holdings with the Securities and Exchange Commission (the Commission) for the first and third quarters of each fiscal year on Form N-Q. The fund’s Form N-Q may be reviewed and copied at the:
Public Reference Room
Securities and Exchange Commission
100 F Street, NE, Room 1580
Washington, D.C. 20549
Information on the operation of the Public Reference Room may be obtained by calling the Commission at 1-800-SEC-0330. The fund’s Form N-Q is available on the EDGAR database on the Commission’s Internet Web site at http://www.sec.gov, and copies of this information may be obtained, upon payment of a duplicating fee, by electronic request at the following e-mail address: publicinfo@sec.gov or by writing the Public Reference Section at the above address.
FURTHER INFORMATION
From time to time, MFS may post important information about the fund or the MFS funds on the MFS web site (mfs.com). This information is available by visiting the “News & Commentary” section of mfs.com or by clicking on the fund’s name under “Variable Insurance Portfolios — VIT II” in the “Products and Performance” section of mfs.com.
25
MFS Mid Cap Growth Portfolio
MFS® PRIVACY NOTICE
Privacy is a concern for every investor today. At MFS Investment Management® and the MFS funds, we take this concern very seriously. We want you to understand our policies about the investment products and services that we offer, and how we protect the nonpublic personal information of investors who have a direct relationship with us and our wholly owned subsidiaries.
Throughout our business relationship, you provide us with personal information. We maintain information and records about you, your investments, and the services you use. Examples of the nonpublic personal information we maintain include
| | Ÿ | | data from investment applications and other forms |
| | Ÿ | | share balances and transactional history with us, our affiliates, or others |
| | Ÿ | | facts from a consumer reporting agency |
We do not disclose any nonpublic personal information about our customers or former customers to anyone, except as permitted by law. We may share nonpublic personal information with third parties or certain of our affiliates in connection with servicing your account or processing your transactions. We may share information with companies or financial institutions that perform marketing services on our behalf or with other financial institutions with which we have joint marketing arrangements, subject to any legal requirements.
Authorization to access your nonpublic personal information is limited to appropriate personnel who provide products, services, or information to you. We maintain physical, electronic, and procedural safeguards to help protect the personal information we collect about you.
If you have any questions about the MFS privacy policy, please call 1-800-225-2606 any business day.
Note: If you own MFS products or receive MFS services in the name of a third party such as a bank or broker-dealer, their privacy policy may apply to you instead of ours.
26


MFS® UTILITIES PORTFOLIO
The report is prepared for the general information of contract owners. It is authorized for distribution to prospective investors only when preceded or accompanied by a current prospectus.
NOT FDIC INSURED Ÿ MAY LOSE VALUE Ÿ NO BANK GUARANTEE Ÿ NOT A DEPOSIT Ÿ NOT INSURED BY ANY FEDERAL GOVERNMENT AGENCY OR NCUA/NCUSIF
MFS Utilities Portfolio
LETTER FROM THE CEO

Dear Contract Owners:
After an extended rebound in the financial markets, uncertainty returned in 2010 as investors began to question the durability of the recovery for global economies and markets. That uncertainty led to increased risk aversion, especially as investors saw the eurozone struggle with the debt woes of many of its members. In September, the U.S. Federal Reserve Board’s promises to further loosen monetary policy helped assuage market fears and drive asset prices off their recent lows. A combination of solid earnings and improving economic data gave an additional boost to investor sentiment. As we enter 2011, we are cautiously optimistic that economic growth will continue to improve and that the global economies will recover from the shocks of the past few years. We expect the pace of recovery worldwide will be uneven and volatile.
As always, we continue to be mindful of the many economic challenges faced at the local, national, and international levels. It is in times such as these that we want to remind investors of the merits of maintaining a long-term view, adhering to basic investing principles such as asset allocation and diversification, and working closely with their advisors to research and identify appropriate investment opportunities.
Respectfully,

Robert J. Manning
Chairman and Chief Executive Officer
MFS Investment Management®
February 14, 2011
The opinions expressed in this letter are subject to change, may not be relied upon for investment advice, and no forecasts can be guaranteed.
1
MFS Utilities Portfolio
PORTFOLIO COMPOSITION
Portfolio structure (i)
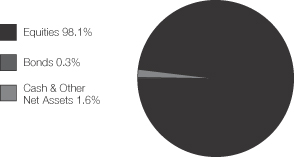
| | | | |
| Top ten holdings (i) | | | | |
| Virgin Media, Inc. | | | 3.5% | |
| CMS Energy Corp. | | | 3.4% | |
| Williams Cos., Inc. | | | 3.1% | |
| Comcast Corp. | | | 2.8% | |
| QEP Resources Inc. | | | 2.8% | |
| EQT Corp. | | | 2.7% | |
| Cellcom Israel Ltd. | | | 2.6% | |
| Nextera Energy Inc. | | | 2.4% | |
| AES Corp. | | | 2.3% | |
| Public Service Enterprise Group, Inc. | | | 2.2% | |
| | | | |
| Top five industries (i) | | | | |
| Utilities-Electric Power | | | 46.3% | |
Telecommunications-Wireless | | | 11.9% | |
Telephone Services | | | 11.4% | |
Cable TV | | | 9.4% | |
Natural Gas-Pipeline | | | 8.2% | |
| | | | |
| Issuer country weightings (i) | | | | |
| United States | | | 67.8% | |
| Brazil | | | 6.3% | |
| Israel | | | 4.4% | |
| United Kingdom | | | 4.3% | |
| Portugal | | | 3.5% | |
| Spain | | | 2.8% | |
| Finland | | | 1.5% | |
| Czech Republic | | | 1.3% | |
| Belgium | | | 1.2% | |
| Other Countries | | | 6.9% | |
| (i) | For purposes of this presentation, the components include the market value of securities, and reflect the impact of the equivalent exposure of derivative positions, if applicable. These amounts may be negative from time to time. The bond component will include any accrued interest amounts. Equivalent exposure is a calculated amount that translates the derivative position into a reasonable approximation of the amount of the underlying asset that the portfolio would have to hold at a given point in time to have the same price sensitivity that results from the portfolio’s ownership of the derivative contract. When dealing with derivatives, equivalent exposure is a more representative measure of the potential impact of a position on portfolio performance than market value. Where the fund holds convertible bonds, these are treated as part of the equity portion of the portfolio. |
Percentages are based on net assets as of 12/31/10.
The portfolio is actively managed and current holdings may be different.
2
MFS Utilities Portfolio
MANAGEMENT REVIEW
Summary of Results
For the twelve months ended December 31, 2010, Initial Class shares of the MFS Utilities Portfolio (the “fund”) provided a total return of 13.90%, while Service Class shares of the fund provided a total return of 13.60%. These compare with a return of 15.06% for the fund’s benchmark, the Standard & Poor’s 500 Stock Index, and a return of 5.46% for the fund’s other benchmark, the Standard & Poor’s 500 Utilities Index (S&P Utilities Index).
Market Environment
The first quarter of the reporting period witnessed a continuation of the financial market and macroeconomic rebounds that had begun in early 2009. These recoveries in global activity and asset valuations were generally synchronized around the world, led importantly by emerging Asian economies, but broadening to include most of the global economy to varying degrees. Primary drivers of the recoveries included an unwinding of the inventory destocking that took place earlier, the production of manufacturing and capital goods, as well as massive fiscal and monetary stimulus.
During most of the remainder of the period, heightened risk surrounding the public-debt profiles of several of the peripheral European countries impaired market sentiment. At the same time, the improving trend in global macroeconomic data began to weaken somewhat. These two dynamics caused many asset prices to retrench significantly, as many questioned the durability of the global recovery.
Towards the end of the period, the U.S. Federal Reserve led markets to believe that further monetary loosening would be forthcoming if macroeconomic activity did not show signs of improvement. The prospects for more easing by the Fed improved market sentiment and drove risk-asset prices markedly higher. However, in a text-book case of “buy the rumor, sell the fact,” the weeks following the early November announcement of further quantitative easing saw a sell-off in U.S. Treasury bonds. This rise in Treasury yields occurred despite risk-off behavior in equities and credit markets (which would normally result in Treasury yield compression), and appears to have been the result of a few factors: signs of improved U.S. and global economic activity; opposition to quantitative easing from some quarters; and crowded long positions in U.S. Treasuries. The December agreement on an expansionary U.S. fiscal package also boosted sentiment, leading markets to reach near-term highs in risky asset valuations toward year end.
Detractors from Performance
During the reporting period, individual securities that held back performance relative to the S&P Utilities Index included power and gas company E.ON (b)(h), integrated gas and electricity company Dominion Resources (h), electricity distributor Consolidated Edison (h), and Spain’s power transmission system operator Red Electrica (b). Shares of E.ON weakened as low natural gas prices depressed power prices and, at the same time, the German government imposed a nuclear tax. Elsewhere, not holding strong-performing electric company Southern Company also detracted from relative returns.
Contributors to Performance
The fund’s exposure to the cable TV industry, which is not represented in the benchmark, boosted relative performance. Holdings of media and communications services company Virgin Media (b), media firm Time Warner Cable (b), and cable services provider Comcast (b) aided relative returns as all three stocks significantly outperformed the benchmark over the reporting period. Shares of Virgin Media rose as the company reported solid earnings on strong revenue growth driven by increases in their business, cable, and mobile divisions. Additionally, the company announced an acceleration to their previously reported share repurchase program.
The fund’s exposure to the telephone services industry, which is not represented in the benchmark, also bolstered relative results. Integrated communications company Centurylink (b)(h) and local phone provider Qwest Communications (b) were among the fund’s top relative contributors over the reporting period.
The fund’s exposure to the wireless communications and natural gas pipeline industries, which are not represented in the benchmark, were additional positive factors for relative performance. No individual securities within the wireless communications industry were among the fund’s top relative contributors. Within the natural gas pipeline industry, gas pipeline company El Paso (b) benefited relative returns. The stock price of El Paso appreciated after its earnings beat expectations, fueled by an improving exploration and production business and execution of large capital expenditure projects.
3
MFS Utilities Portfolio
Management Review – continued
Elsewhere, not holding poor-performing electric company Exelon Corp., and the timing of our ownership in shares of power provider FirstEnergy (h), aided relative results. The fund’s holdings of strong-performing private energy supplier Tractebel Energia (b) (Brazil) and energy company CMS also helped. Shares of CMS rose as earnings increased on a year-over-year basis due to improvements in electric and gas operations.
Respectfully,
| | |
| Robert Persons | | Maura Shaughnessy |
| Portfolio Manager | | Portfolio Manager |
| (b) | Security is not a benchmark constituent. |
| (h) | Security was not held in the portfolio at period end. |
The views expressed in this report are those of the portfolio managers only through the end of the period of the report as stated on the cover and do not necessarily reflect the views of MFS or any other person in the MFS organization. These views are subject to change at any time based on market or other conditions, and MFS disclaims any responsibility to update such views. These views may not be relied upon as investment advice or an indication of trading intent on behalf of any MFS portfolio. References to specific securities are not recommendations of such securities, and may not be representative of any MFS portfolio’s current or future investments.
4
MFS Utilities Portfolio
PERFORMANCE SUMMARY THROUGH 12/31/10
The following chart illustrates the historical performance of the fund in comparison to its benchmark(s). Benchmarks are unmanaged and may not be invested in directly. Benchmark returns do not reflect any fees or expenses. The performance of other share classes will be greater than or less than that of the class depicted below. (See Notes to Performance Summary.)
Performance data shown represents past performance and is no guarantee of future results. Investment return and principal value fluctuate so your units, when sold, may be worth more or less than the original cost; current performance may be lower or higher than quoted. The performance shown does not reflect the deduction of taxes, if any, that a contract holder would pay on fund distributions or the redemption of contract units. The returns for the fund shown also do not reflect the deduction of expenses associated with variable products, such as mortality and expense risk charges, separate account charges, and sales charges imposed by the insurance company separate accounts. Such expenses would reduce the overall returns shown.
Growth of a Hypothetical $10,000 Investment
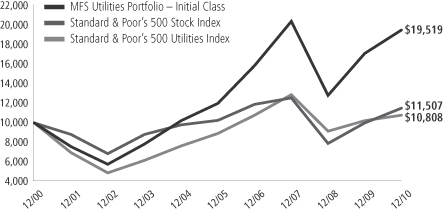
Total Returns through 12/31/10
Average annual total returns
| | | | | | | | | | | | | | |
| | | Share class | | Class inception date | | 1-yr | | 5-yr | | 10-yr | | Life (t) | | |
| | | Initial Class | | 11/16/93 | | 13.90% | | 10.23% | | 6.92% | | N/A | | |
| | | Service Class | | 8/24/01 | | 13.60% | | 9.94% | | N/A | | 9.26% | | |
| | | | | |
| Comparative benchmarks | | | | | | | | | | |
| | | Standard & Poor’s 500 Stock Index (f) | | 15.06% | | 2.29% | | 1.41% | | N/A | | |
| | | Standard & Poor’s 500 Utilities Index (f) | | 5.46% | | 3.90% | | 0.78% | | N/A | | |
| (f) | Source: FactSet Research Systems Inc. |
| (t) | For the period from the class inception date through the stated period end (for those share classes with less than 10 years of performance history). No comparative benchmark performance information is provided for “life” periods. (See Notes to Performance Summary.) |
Benchmark Definitions
Standard & Poor’s 500 Stock Index – a market capitalization-weighted index of 500 widely held equity securities, designed to measure broad U.S. equity performance.
Standard & Poor’s 500 Utilities Index – a market capitalization-weighted index designed to measure the utilities sector, including those companies considered electric, gas or water utilities, or companies that operate as independent producers and/or distributors of power.
It is not possible to invest directly in an index.
Notes to Performance Summary
Average annual total return represents the average annual change in value for each share class for the periods presented. Life returns are presented where the share class has less than 10 years of performance history and represent the average annual total return from the class inception date to the stated period end date. As the fund’s share classes may have different inception dates, the life returns may represent different time periods and may not be comparable. As a result, no comparative benchmark performance information is provided for life periods.
5
MFS Utilities Portfolio
Performance Summary – continued
Performance results reflect any applicable expense subsidies and waivers in effect during the periods shown. Without such subsidies and waivers the fund’s performance results would be less favorable. Please see the prospectus and financial statements for complete details. All results are historical and assume the reinvestment of any dividends and capital gains distributions.
From time to time the fund may receive proceeds from litigation settlements, without which performance would be lower.
6
MFS Utilities Portfolio
EXPENSE TABLE
Fund Expenses Borne by the Contract Holders During the Period,
July 1, 2010 through December 31, 2010
As a contract holder of the fund, you incur ongoing costs, including management fees; distribution and/or service (12b-1) fees; and other fund expenses. This example is intended to help you understand your ongoing costs (in dollars) of investing in the fund and to compare these costs with the ongoing costs of investing in other mutual funds.
The example is based on an investment of $1,000 invested at the beginning of the period and held for the entire period July 1, 2010 through December 31, 2010.
Actual Expenses
The first line for each share class in the following table provides information about actual account values and actual expenses. You may use the information in this line, together with the amount you invested, to estimate the expenses that you paid over the period. Simply divide your account value by $1,000 (for example, an $8,600 account value divided by $1,000 = 8.6), then multiply the result by the number in the first line under the heading entitled “Expenses Paid During Period” to estimate the expenses you paid on your account during this period.
Hypothetical Example for Comparison Purposes
The second line for each share class in the following table provides information about hypothetical account values and hypothetical expenses based on the fund’s actual expense ratio and an assumed rate of return of 5% per year before expenses, which is not the fund’s actual return. The hypothetical account values and expenses may not be used to estimate the actual ending account balance or expenses you paid for the period. You may use this information to compare the ongoing costs of investing in the fund and other funds. To do so, compare this 5% hypothetical example with the 5% hypothetical examples that appear in the shareholder reports of the other funds.
Please note that the expenses shown in the table are meant to highlight the fund’s ongoing costs only and do not take into account the fees and expenses imposed under the variable contracts through which your investment in the fund is made. Therefore, the second line for each share class in the table is useful in comparing ongoing costs associated with an investment in vehicles (such as the fund) which fund benefits under variable annuity and variable life insurance contracts and to qualified pension and retirement plans only, and will not help you determine the relative total costs of investing in the fund through variable annuity and variable life insurance contracts. If the fees and expenses imposed under the variable contracts were included, your costs would have been higher.
| | | | | | | | | | | | | | | | | | |
| Share Class | | | | Annualized
Expense Ratio | | | Beginning
Account Value
7/01/10 | | | Ending Account Value
12/31/10 | | | Expenses Paid
During Period (p)
7/01/10-12/31/10 | |
| Initial Class | | Actual | | | 0.88% | | | | $1,000.00 | | | | $1,228.15 | | | | $4.94 | |
| | Hypothetical (h) | | | 0.88% | | | | $1,000.00 | | | | $1,020.77 | | | | $4.48 | |
| Service Class | | Actual | | | 1.13% | | | | $1,000.00 | | | | $1,226.80 | | | | $6.34 | |
| | Hypothetical (h) | | | 1.13% | | | | $1,000.00 | | | | $1,019.51 | | | | $5.75 | |
| (h) | 5% class return per year before expenses. |
| (p) | Expenses paid is equal to each class’ annualized expense ratio, as shown above, multiplied by the average account value over the period, multiplied by the number of days in the period, divided by the number of days in the year. |
7
MFS Utilities Portfolio
PORTFOLIO OF INVESTMENTS – 12/31/10
The Portfolio of Investments is a complete list of all securities owned by your fund. It is categorized by broad-based asset classes.
| | | | | | | | |
| Issuer | | Shares/Par | | | Value ($) | |
| | | | | | | | |
| COMMON STOCKS – 93.4% | | | | | | | | |
| Business Services – 0.0% | | | | | | | | |
| Enernoc, Inc. (a) | | | 2,400 | | | $ | 57,384 | |
| | | | | | | | |
| Cable TV – 9.4% | | | | | | | | |
| Comcast Corp., “Special A” | | | 430,470 | | | $ | 8,958,081 | |
| DIRECTV, “A” (a) | | | 8,010 | | | | 319,839 | |
| Telenet Group Holding N.V. | | | 98,699 | | | | 3,888,160 | |
| Time Warner Cable, Inc. | | | 83,709 | | | | 5,527,305 | |
| Virgin Media, Inc. | | | 401,740 | | | | 10,943,398 | |
| | | | | | | | |
| | | | | | $ | 29,636,783 | |
| | | | | | | | |
| Energy – Independent – 6.5% | | | | | | | | |
| Apache Corp. | | | 5,280 | | | $ | 629,534 | |
| EQT Corp. | | | 193,860 | | | | 8,692,682 | |
| Occidental Petroleum Corp. | | | 14,500 | | | | 1,422,450 | |
| QEP Resources, Inc. | | | 241,630 | | | | 8,773,585 | |
| Southwestern Energy Co. (a) | | | 22,200 | | | | 830,946 | |
| Targa Resources Corp. (a) | | | 5,427 | | | | 145,498 | |
| | | | | | | | |
| | | | | | $ | 20,494,695 | |
| | | | | | | | |
| Natural Gas – Distribution – 4.7% | | | | | | | | |
| NiSource, Inc. | | | 121,200 | | | $ | 2,135,544 | |
| Questar Corp. | | | 179,900 | | | | 3,132,059 | |
| Sempra Energy | | | 79,400 | | | | 4,166,912 | |
| Southern Union Co. | | | 85,270 | | | | 2,052,449 | |
| Spectra Energy Corp. | | | 125,700 | | | | 3,141,243 | |
| UGI Corp. | | | 5,300 | | | | 167,374 | |
| | | | | | | | |
| | | | | | $ | 14,795,581 | |
| | | | | | | | |
| Natural Gas – Pipeline – 7.1% | | | | | | | | |
| El Paso Corp. | | | 502,800 | | | $ | 6,918,528 | |
| Enagas S.A. | | | 156,151 | | | | 3,112,232 | |
| Niska Gas Storage Partners LLC | | | 23,730 | | | | 473,414 | |
| Williams Cos., Inc. | | | 395,837 | | | | 9,785,091 | |
| Williams Partners LP | | | 48,600 | | | | 2,267,190 | |
| | | | | | | | |
| | | | | | $ | 22,556,455 | |
| | | | | | | | |
| Telecommunications – Wireless – 11.9% | | | | | |
| America Movil S.A.B. de C.V., “L”, ADR | | | 42,300 | | | $ | 2,425,482 | |
| Cellcom Israel Ltd. | | | 248,122 | | | | 8,111,108 | |
| Mobile TeleSystems OJSC, ADR | | | 141,020 | | | | 2,943,087 | |
| MTN Group Ltd. | | | 87,772 | | | | 1,791,014 | |
| NII Holdings, Inc. (a) | | | 154,230 | | | | 6,887,912 | |
| Partner Communication Co. Ltd., ADR | | | 171,000 | | | | 3,474,720 | |
| Tim Participacoes S.A., ADR | | | 52,500 | | | | 1,792,350 | |
| Vivo Participacoes S.A., ADR | | | 176,575 | | | | 5,754,579 | |
| Vodafone Group PLC | | | 1,732,270 | | | | 4,477,895 | |
| | | | | | | | |
| | | | | | $ | 37,658,147 | |
| | | | | | | | |
| Telephone Services – 10.4% | | | | | | | | |
| American Tower Corp., “A” (a) | | | 59,200 | | | $ | 3,057,088 | |
| Bezeq – The Israel Telecommunication Corp. Ltd. | | | 799,300 | | | | 2,437,206 | |
| CenturyLink, Inc. | | | 102,500 | | | | 4,732,425 | |
| Crown Castle International Corp. (a) | | | 27,700 | | | | 1,214,091 | |
| France Telecom S.A. | | | 106,108 | | | | 2,211,248 | |
| | | | | | | | |
| Issuer | | Shares/Par | | | Value ($) | |
| | | | | | | | |
| COMMON STOCKS – continued | | | | | |
| Telephone Services – continued | | | | | | | | |
| Portugal Telecom, SGPS, S.A. | | | 331,751 | | | $ | 3,715,012 | |
| PT XL Axiata Tbk (a) | | | 2,628,000 | | | | 1,545,882 | |
| Qwest Communications International, Inc. | | | 481,000 | | | | 3,660,410 | |
| Royal KPN N.V. | | | 253,899 | | | | 3,704,995 | |
| TDC A/S (a) | | | 370,050 | | | | 3,214,192 | |
| Telecom Italia S.p.A. | | | 2,158,052 | | | | 2,341,649 | |
| Windstream Corp. | | | 89,155 | | | | 1,242,821 | |
| | | | | | | | |
| | | | | | $ | 33,077,019 | |
| | | | | | | | |
| Utilities – Electric Power – 43.4% | | | | | | | | |
| AES Corp. (a) | | | 587,850 | | | $ | 7,160,013 | |
| AES Tiete S.A., IPS | | | 168,254 | | | | 2,432,588 | |
| Alliant Energy Corp. | | | 50,100 | | | | 1,842,177 | |
| American Electric Power Co., Inc. | | | 179,590 | | | | 6,461,648 | |
| American Water Works Co., Inc. | | | 94,320 | | | | 2,385,353 | |
| Calpine Corp. (a) | | | 323,120 | | | | 4,310,421 | |
| CenterPoint Energy, Inc. | | | 264,060 | | | | 4,151,023 | |
| CEZ AS | | | 101,839 | | | | 4,254,601 | |
| China Hydroelectric Corp., ADR (a) | | | 85,650 | | | | 632,954 | |
| CMS Energy Corp. | | | 572,460 | | | | 10,647,756 | |
| Companhia de Saneamento de Minas Gerais – Copasa MG | | | 119,800 | | | | 2,071,241 | |
| Companhia Paranaense de Energia, ADR | | | 55,600 | | | | 1,399,452 | |
| Companhia Paranaense de Energia, IPS | | | 42,200 | | | | 1,055,000 | |
| Constellation Energy Group, Inc. | | | 164,300 | | | | 5,032,509 | |
| DPL, Inc. | | | 113,500 | | | | 2,918,085 | |
| DTE Energy Co. | | | 17,200 | | | | 779,504 | |
| EDP Renovaveis S.A. (a) | | | 277,078 | | | | 1,605,815 | |
| Eletropaulo Metropolitana S.A., IPS | | | 52,240 | | | | 1,010,498 | |
| Energias de Portugal S.A. | | | 1,759,127 | | | | 5,855,647 | |
| Entergy Corp. | | | 64,470 | | | | 4,566,410 | |
| EVN AG | | | 23,744 | | | | 396,138 | |
| Federal Grid Co. of Unified Energy System JSC (a) | | | 13,674,100 | | | | 166,824 | |
| Fortum Corp. | | | 156,300 | | | | 4,705,699 | |
| GenOn Energy, Inc. (a) | | | 42,700 | | | | 162,687 | |
| Iberdrola S.A. | | | 139,100 | | | | 493,695 | |
| IDGC Holding JSC (a) | | | 907,600 | | | | 154,292 | |
| International Power PLC | | | 482,273 | | | | 3,290,365 | |
| National Grid PLC | | | 660,640 | | | | 5,695,918 | |
| NextEra Energy, Inc. | | | 147,700 | | | | 7,678,923 | |
| Northeast Utilities | | | 123,300 | | | | 3,930,804 | |
| NRG Energy, Inc. (a) | | | 167,086 | | | | 3,264,860 | |
| NV Energy, Inc. | | | 95,400 | | | | 1,340,370 | |
| OGE Energy Corp. | | | 82,700 | | | | 3,766,158 | |
| PG&E Corp. | | | 144,310 | | | | 6,903,790 | |
| Power Grid Corp. of India Ltd. | | | 146,638 | | | | 322,364 | |
| PPL Corp. | | | 179,970 | | | | 4,736,810 | |
| Public Service Enterprise Group, Inc. | | | 221,710 | | | | 7,052,595 | |
| Red Electrica de Espana | | | 108,230 | | | | 5,090,896 | |
| Tractebel Energia S.A. | | | 276,400 | | | | 4,570,590 | |
| Wisconsin Energy Corp. | | | 40,020 | | | | 2,355,577 | |
8
MFS Utilities Portfolio
Portfolio of Investments – continued
| | | | | | | | |
| Issuer | | Shares/Par | | | Value ($) | |
| | | | | | | | |
| COMMON STOCKS – continued | | | | | |
| Utilities – Electric Power – continued | | | | | |
| Xcel Energy, Inc. | | | 40,000 | | | $ | 942,000 | |
| | | | | | | | |
| | | | | | $ | 137,594,050 | |
| | | | | | | | |
Total Common Stocks
(Identified Cost, $275,004,568) | | | | | | $ | 295,870,114 | |
| | | | | | | | |
| BONDS – 0.3% | | | | | | | | |
| Asset-Backed & Securitized – 0.0% | | | | | | | | |
Falcon Franchise Loan LLC, FRN,
3.043%, 2023 (i)(z) | | $ | 419,417 | | | $ | 17,909 | |
| | | | | | | | |
| Utilities – Electric Power – 0.3% | | | | | | | | |
| Genon Escrow Corp., 9.875%, 2020 (n) | | $ | 775,000 | | | $ | 769,188 | |
| | | | | | | | |
Total Bonds
(Identified Cost, $795,505) | | | | | | $ | 787,097 | |
| | | | | | | | |
|
| CONVERTIBLE PREFERRED STOCKS – 3.7% | |
| Natural Gas – Pipeline – 1.1% | | | | | | | | |
| El Paso Corp., 4.99% | | | 2,870 | | | $ | 3,375,838 | |
| | | | | | | | |
| Utilities – Electric Power – 2.6% | | | | | | | | |
| Great Plains Energy, Inc., 12% | | | 24,350 | | | $ | 1,547,443 | |
| NextEra Energy, Inc., 7% | | | 39,160 | | | | 1,938,420 | |
| NextEra Energy, Inc., 8.375% | | | 49,200 | | | | 2,442,288 | |
| PPL Corp., 9.5% | | | 43,080 | | | | 2,368,108 | |
| | | | | | | | |
| | | | | | $ | 8,296,259 | |
| | | | | | | | |
| Total Convertible Preferred Stocks (Identified Cost, $11,417,598) | | | | | | $ | 11,672,097 | |
| | | | | | | | |
| | | | | | | | |
| Issuer | | Shares/Par | | | Value ($) | |
| | | | | | | | |
| |
| CONVERTIBLE BONDS – 1.0% | | | | | |
| Telephone Services – 1.0% | | | | | | | | |
Virgin Media, Inc., 6.5%, 2016
(Identified Cost, $1,723,082) | | $ | 1,880,000 | | | $ | 3,111,400 | |
| | | | | | | | |
| MONEY MARKET FUNDS (v) – 0.2% | | | | | | | | |
| MFS Institutional Money Market Portfolio, 0.18%, at Cost and Net Asset Value | | | 759,461 | | | $ | 759,461 | |
| | | | | | | | |
Total Investments
(Identified Cost, $289,700,214) | | | $ | 312,200,169 | |
| | | | | | | | |
OTHER ASSETS, LESS
LIABILITIES – 1.4% | | | | 4,481,568 | |
| | | | | | | | |
| Net Assets – 100.0% | | | $ | 316,681,737 | |
| | | | | | | | |
| (a) | | Non-income producing security. |
| (i) | | Interest only security for which the series receives interest on notional principal (Par amount). Par amount shown is the notional principal and does not reflect the cost of the security. |
| (n) | | Securities exempt from registration under Rule 144A of the Securities Act of 1933. These securities may be sold in the ordinary course of business in transactions exempt from registration, normally to qualified institutional buyers. At period end, the aggregate value of these securities was $769,188, representing 0.2% of net assets. |
| (v) | | Underlying fund that is available only to investment companies managed by MFS. The rate quoted is the annualized seven-day yield of the fund at period end. |
| (z) | | Restricted securities are not registered under the Securities Act of 1933 and are subject to legal restrictions on resale. These securities generally may be resold in transactions exempt from registration or to the public if the securities are subsequently registered. Disposal of these securities may involve time-consuming negotiations and prompt sale at an acceptable price may be difficult. The fund holds the following restricted securities: |
| | | | | | | | | | |
| Restricted Securities | | Acquisition
Date | | Cost | | | Value | |
| Falcon Franchise Loan LLC, FRN, 3.043%, 2023 | | 1/18/02 | | | $21,326 | | | | $17,909 | |
| % of Net Assets | | | | | | | | | 0.0% | |
The following abbreviations are used in this report and are defined:
| ADR | | American Depository Receipt |
| FRN | | Floating Rate Note. Interest rate resets periodically and may not be the rate reported at period end. |
| IPS | | International Preference Stock |
| PLC | | Public Limited Company |
Abbreviations indicate amounts shown in currencies other than the U.S. dollar. All amounts are stated in U.S. dollars unless otherwise indicated. A list of abbreviations is shown below:
9
MFS Utilities Portfolio
Portfolio of Investments – continued
Derivative Contracts at 12/31/10
Forward Foreign Currency Exchange Contracts at 12/31/10
| | | | | | | | | | | | | | | | | | | | | | | | |
Type | | Currency | | | Counterparty | | Contracts to
Deliver/Receive | | Settlement Date
Range | | In Exchange For | | | Contracts
at Value | | | Net Unrealized
Appreciation
(Depreciation) | |
| Asset Derivatives | | | | | | | | | | | | | | | | | | | |
| BUY | | | EUR | | | Credit Suisse Group | | 492,066 | | 1/12/11 | | $ | 644,408 | | | $ | 657,538 | | | $ | 13,130 | |
| BUY | | | EUR | | | Goldman Sachs International | | 31,948 | | 1/12/11 | | | 42,372 | | | | 42,691 | | | | 319 | |
| SELL | | | EUR | | | Barclays Bank PLC | | 355,605 | | 1/12/11 | | | 484,489 | | | | 475,188 | | | | 9,301 | |
| SELL | | | EUR | | | Citibank N.A. | | 167,627 | | 1/12/11 | | | 225,594 | | | | 223,997 | | | | 1,597 | |
| SELL | | | EUR | | | Credit Suisse Group | | 27,809 | | 1/12/11 | | | 37,832 | | | | 37,160 | | | | 672 | |
| SELL | | | EUR | | | Deutsche Bank AG | | 225,177 | | 1/12/11 | | | 309,290 | | | | 300,900 | | | | 8,390 | |
| SELL | | | EUR | | | HSBC Bank | | 665,110 | | 1/12/11 | | | 916,744 | | | | 888,775 | | | | 27,969 | |
| SELL | | | EUR | | | JPMorgan Chase Bank N.A. | | 1,289,419 | | 1/12/11 | | | 1,794,903 | | | | 1,723,027 | | | | 71,876 | |
| SELL | | | EUR | | | UBS AG | | 785,695 | | 1/12/11 | | | 1,073,077 | | | | 1,049,910 | | | | 23,167 | |
| BUY | | | GBP | | | Citibank N.A. | | 105,958 | | 1/12/11 | | | 164,317 | | | | 165,190 | | | | 873 | |
| SELL | | | GBP | | | Barclays Bank PLC | | 5,014,791 | | 1/12/11 | | | 7,982,282 | | | | 7,818,153 | | | | 164,129 | |
| SELL | | | GBP | | | Credit Suisse Group | | 201,748 | | 1/12/11 | | | 318,222 | | | | 314,529 | | | | 3,693 | |
| SELL | | | GBP | | | Deutsche Bank AG | | 5,075,158 | | 1/12/11 | | | 8,075,796 | | | | 7,912,266 | | | | 163,530 | |
| SELL | | | GBP | | | HSBC Bank | | 44,830 | | 1/12/11 | | | 70,654 | | | | 69,891 | | | | 764 | |
| | | | | | | | | | | | | | | | | | | | | | | | |
| | | | | | | | | | | | | | | | | | | | | | $ | 489,410 | |
| | | | | | | | | | | | | | | | | | | | | | | | |
| | | | | | |
| Liability Derivatives | | | | | | | | | | | | | | | | | | | |
| BUY | | | EUR | | | Credit Suisse Group | | 295,214 | | 1/12/11 | | $ | 412,704 | | | $ | 394,489 | | | $ | (18,215 | ) |
| BUY | | | EUR | | | Deutsche Bank AG | | 591,236 | | 1/12/11 | | | 826,693 | | | | 790,057 | | | | (36,636 | ) |
| BUY | | | EUR | | | Goldman Sachs International | | 57,948 | | 1/12/11 | | | 80,614 | | | | 77,434 | | | | (3,180 | ) |
| BUY | | | EUR | | | HSBC Bank | | 1,092,278 | | 1/12/11 | | | 1,521,571 | | | | 1,459,592 | | | | (61,979 | ) |
| BUY | | | EUR | | | UBS AG | | 512,192 | | 1/12/11 | | | 709,114 | | | | 684,432 | | | | (24,682 | ) |
| SELL | | | EUR | | | Barclays Bank PLC | | 430,572 | | 1/12/11 | | | 564,975 | | | | 575,365 | | | | (10,390 | ) |
| SELL | | | EUR | | | Citibank N.A. | | 109,694 | | 1/12/11 | | | 144,921 | | | | 146,582 | | | | (1,661 | ) |
| SELL | | | EUR | | | Credit Suisse Group | | 139,221 | | 1/12/11 | | | 182,937 | | | | 186,038 | | | | (3,101 | ) |
| SELL | | | EUR | | | Deutsche Bank AG | | 254,261 | | 1/12/11 | | | 337,542 | | | | 339,765 | | | | (2,223 | ) |
| SELL | | | EUR | | | Goldman Sachs International | | 267,862 | | 1/12/11 | | | 355,994 | | | | 357,939 | | | | (1,945 | ) |
| SELL | | | EUR | | | HSBC Bank | | 317,397 | | 1/12/11 | | | 416,250 | | | | 424,132 | | | | (7,882 | ) |
| SELL | | | EUR | | | JPMorgan Chase Bank N.A. | | 31,222 | | 1/12/11 | | | 41,136 | | | | 41,721 | | | | (585 | ) |
| SELL | | | EUR | | | Royal Bank of Scotland Group PLC | | 81,428 | | 1/12/11 | | | 107,728 | | | | 108,811 | | | | (1,083 | ) |
| SELL | | | EUR | | | UBS AG | | 15,887,624 | | 1/12/11-3/15/11 | | | 20,978,563 | | | | 21,225,847 | | | | (247,284 | ) |
| BUY | | | GBP | | | Barclays Bank PLC | | 38,429 | | 1/12/11 | | | 61,093 | | | | 59,911 | | | | (1,182 | ) |
| BUY | | | GBP | | | Credit Suisse Group | | 12,415 | | 1/12/11 | | | 19,789 | | | | 19,355 | | | | (434 | ) |
| BUY | | | GBP | | | Deutsche Bank AG | | 71,515 | | 1/12/11 | | | 114,622 | | | | 111,493 | | | | (3,129 | ) |
| BUY | | | GBP | | | HSBC Bank | | 170,112 | | 1/12/11 | | | 274,294 | | | | 265,208 | | | | (9,086 | ) |
| SELL | | | GBP | | | HSBC Bank | | 283,444 | | 1/12/11 | | | 441,580 | | | | 441,895 | | | | (315 | ) |
| SELL | | | GBP | | | Royal Bank of Scotland Group PLC | | 68,645 | | 1/12/11 | | | 106,851 | | | | 107,018 | | | | (167 | ) |
| | | | | | | | | | | | | | | | | | | | | | | | |
| | | | | | | | | | | | | | | | | | | | | | $ | (435,159 | ) |
| | | | | | | | | | | | | | | | | | | | | | | | |
At December 31, 2010, the fund had sufficient cash and/or securities to cover any commitments under these derivative contracts.
See Notes to Financial Statements
10
MFS Utilities Portfolio
FINANCIAL STATEMENTS | STATEMENT OF ASSETS AND LIABILITIES
This statement represents your fund’s balance sheet, which details the assets and liabilities comprising the total value of the fund.
| | | | | | | | |
At 12/31/10 | | | | | | | | |
Assets | | | | | | | | |
Investments – | | | | | | | | |
Non-affiliated issuers, at value (identified cost, $288,940,753) | | | $311,440,708 | | | | | |
Underlying funds, at cost and value | | | 759,461 | | | | | |
Total investments, at value (identified cost, $289,700,214) | | | $312,200,169 | | | | | |
Cash | | | 313,769 | | | | | |
Foreign currency, at value (identified cost, $28,209) | | | 29,197 | | | | | |
Receivables for | | | | | | | | |
Forward foreign currency exchange contracts | | | 489,410 | | | | | |
Investments sold | | | 4,482,934 | | | | | |
Fund shares sold | | | 274,464 | | | | | |
Interest and dividends | | | 806,493 | | | | | |
Other assets | | | 9,643 | | | | | |
Total assets | | | | | | | $318,606,079 | |
Liabilities | | | | | | | | |
Payables for | | | | | | | | |
Forward foreign currency exchange contracts | | | $435,159 | | | | | |
Investments purchased | | | 1,070,488 | | | | | |
Fund shares reacquired | | | 313,182 | | | | | |
Payable to affiliates | | | | | | | | |
Investment adviser | | | 12,943 | | | | | |
Distribution and/or service fees | | | 1,711 | | | | | |
Administrative services fee | | | 616 | | | | | |
Payable for Trustees’ compensation | | | 328 | | | | | |
Accrued expenses and other liabilities | | | 89,915 | | | | | |
Total liabilities | | | | | | | $1,924,342 | |
Net assets | | | | | | | $316,681,737 | |
Net assets consist of | | | | | | | | |
Paid-in capital | | | $315,298,467 | | | | | |
Unrealized appreciation (depreciation) on investments and translation of assets and liabilities in foreign currencies | | | 22,555,293 | | | | | |
| Accumulated net realized gain (loss) on investments and foreign currency transactions | | | (31,743,436 | ) | | | | |
Undistributed net investment income | | | 10,571,413 | | | | | |
Net assets | | | | | | | $316,681,737 | |
Shares of beneficial interest outstanding | | | | | | | 14,692,580 | |
| | | | | | | | | | | | |
| | | Net assets | | | Shares
outstanding | | | Net asset value
per share | |
Initial Class | | | $191,565,704 | | | | 8,852,500 | | | | $21.64 | |
Service Class | | | 125,116,033 | | | | 5,840,080 | | | | 21.42 | |
See Notes to Financial Statements
11
MFS Utilities Portfolio
FINANCIAL STATEMENTS | STATEMENT OF OPERATIONS
This statement describes how much your fund earned in investment income and accrued in expenses. It also describes any gains and/or losses generated by fund operations.
| | | | | | | | |
Year ended 12/31/10 | | | | | | | | |
Net investment income | | | | | | | | |
Income | | | | | | | | |
Dividends | | | $13,736,462 | | | | | |
Interest | | | 216,265 | | | | | |
Dividends from underlying funds | | | 7,251 | | | | | |
Foreign taxes withheld | | | (825,121 | ) | | | | |
Total investment income | | | | | | | $13,134,857 | |
| Expenses | | | | | | | | |
Management fee | | | $2,274,366 | | | | | |
Distribution and/or service fees | | | 294,357 | | | | | |
Administrative services fee | | | 107,821 | | | | | |
Trustees’ compensation | | | 41,652 | | | | | |
Custodian fee | | | 153,399 | | | | | |
Shareholder communications | | | 26,804 | | | | | |
Auditing fees | | | 44,948 | | | | | |
Legal fees | | | 7,272 | | | | | |
Miscellaneous | | | 32,718 | | | | | |
Total expenses | | | | | | | $2,983,337 | |
Fees paid indirectly | | | (14 | ) | | | | |
Net expenses | | | | | | | $2,983,323 | |
Net investment income | | | | | | | $10,151,534 | |
Realized and unrealized gain (loss) on investments and foreign currency transactions | | | | | | | | |
Realized gain (loss) (identified cost basis) | | | | | | | | |
Investment transactions | | | $14,237,900 | | | | | |
Foreign currency transactions | | | 601,174 | | | | | |
Net realized gain (loss) on investments and foreign currency transactions | | | | | | | $14,839,074 | |
Change in unrealized appreciation (depreciation) | | | | | | | | |
Investments | | | $14,106,380 | | | | | |
Translation of assets and liabilities in foreign currencies | | | (128,134 | ) | | | | |
Net unrealized gain (loss) on investments and foreign currency translation | | | | | | | $13,978,246 | |
Net realized and unrealized gain (loss) on investments and foreign currency | | | | | | | $28,817,320 | |
Change in net assets from operations | | | | | | | $38,968,854 | |
See Notes to Financial Statements
12
MFS Utilities Portfolio
FINANCIAL STATEMENTS | STATEMENTS OF CHANGES IN NET ASSETS
These statements describe the increases and/or decreases in net assets resulting from operations, any distributions, and any shareholder transactions.
| | | | | | | | |
For years ended 12/31 | | | 2010 | | | | 2009 | |
Change in net assets | | | | | | | | |
From operations | | | | | | | | |
Net investment income | | | $10,151,534 | | | | $10,872,249 | |
Net realized gain (loss) on investments and foreign currency transactions | | | 14,839,074 | | | | (18,736,111 | ) |
Net unrealized gain (loss) on investments and foreign currency translation | | | 13,978,246 | | | | 86,829,466 | |
Change in net assets from operations | | | $38,968,854 | | | | $78,965,604 | |
Distributions declared to shareholders | | | | | | | | |
From net investment income | | | $(9,661,054 | ) | | | $(13,093,061 | ) |
Change in net assets from fund share transactions | | | $(27,695,612 | ) | | | $(12,855,938 | ) |
Total change in net assets | | | $1,612,188 | | | | $53,016,605 | |
Net assets | | | | | | | | |
At beginning of period | | | 315,069,549 | | | | 262,052,944 | |
At end of period (including undistributed net investment income of $10,571,413 and
$9,469,094, respectively) | | | $316,681,737 | | | | $315,069,549 | |
See Notes to Financial Statements
13
MFS Utilities Portfolio
FINANCIAL STATEMENTS | FINANCIAL HIGHLIGHTS
The financial highlights table is intended to help you understand the fund’s financial performance for the past 5 years. Certain information reflects financial results for a single fund share. The total returns in the table represent the rate by which an investor would have earned (or lost) on an investment in the fund share class (assuming reinvestment of all distributions) held for the entire period.
| | | | | | | | | | | | | | | | | | | | |
| Initial Class | | Years ended 12/31 | |
| | | 2010 | | | 2009 | | | 2008 | | | 2007 | | | 2006 | |
Net asset value, beginning of period | | | $19.61 | | | | $15.56 | | | | $29.51 | | | | $23.25 | | | | $18.11 | |
| Income (loss) from investment operations | | | | | | | | | | | | | | | | | | | | |
Net investment income (d) | | | $0.67 | | | | $0.69 | | | | $0.62 | | | | $0.58 | | | | $0.48 | |
Net realized and unrealized gain (loss) on
investments and foreign currency | | | 1.98 | | | | 4.21 | | | | (9.78 | ) | | | 6.02 | | | | 5.25 | |
Total from investment operations | | | $2.65 | | | | $4.90 | | | | $(9.16 | ) | | | $6.60 | | | | $5.73 | |
| Less distributions declared to shareholders | | | | | | | | | | | | | | | | | | | | |
From net investment income | | | $(0.62 | ) | | | $(0.85 | ) | | | $(0.47 | ) | | | $(0.34 | ) | | | $(0.59 | ) |
From net realized gain on investments | | | — | | | | — | | | | (4.32 | ) | | | — | | | | — | |
Total distributions declared to shareholders | | | $(0.62 | ) | | | $(0.85 | ) | | | $(4.79 | ) | | | $(0.34 | ) | | | $(0.59 | ) |
Net asset value, end of period | | | $21.64 | | | | $19.61 | | | | $15.56 | | | | $29.51 | | | | $23.25 | |
Total return (%) (k)(s) | | | 13.90 | | | | 33.63 | | | | (37.16 | ) | | | 28.53 | | | | 32.35 | |
Ratios (%) (to average net assets)
and Supplemental data: | | | | | | | | | | | | | | | | | | | | |
Expenses (f) | | | 0.88 | | | | 0.88 | | | | 0.86 | | | | 0.84 | | | | 0.84 | |
Net investment income | | | 3.43 | | | | 4.14 | | | | 2.73 | | | | 2.18 | | | | 2.41 | |
Portfolio turnover | | | 55 | | | | 70 | | | | 63 | | | | 90 | | | | 93 | |
Net assets at end of period (000 omitted) | | | $191,566 | | | | $199,634 | | | | $178,805 | | | | $381,498 | | | | $377,354 | |
| |
| Service Class | | Years ended 12/31 | |
| | | 2010 | | | 2009 | | | 2008 | | | 2007 | | | 2006 | |
Net asset value, beginning of period | | | $19.43 | | | | $15.41 | | | | $29.28 | | | | $23.09 | | | | $18.01 | |
| Income (loss) from investment operations | | | | | | | | | | | | | | | | | | | | |
Net investment income (d) | | | $0.62 | | | | $0.63 | | | | $0.57 | | | | $0.52 | | | | $0.42 | |
Net realized and unrealized gain (loss) on
investments and foreign currency | | | 1.96 | | | | 4.18 | | | | (9.71 | ) | | | 5.97 | | | | 5.22 | |
Total from investment operations | | | $2.58 | | | | $4.81 | | | | $(9.14 | ) | | | $6.49 | | | | $5.64 | |
| Less distributions declared to shareholders | | | | | | | | | | | | | | | | | | | | |
From net investment income | | | $(0.59 | ) | | | $(0.79 | ) | | | $(0.41 | ) | | | $(0.30 | ) | | | $(0.56 | ) |
From net realized gain on investments | | | — | | | | — | | | | (4.32 | ) | | | — | | | | — | |
Total distributions declared to shareholders | | | $(0.59 | ) | | | $(0.79 | ) | | | $(4.73 | ) | | | $(0.30 | ) | | | $(0.56 | ) |
Net asset value, end of period | | | $21.42 | | | | $19.43 | | | | $15.41 | | | | $29.28 | | | | $23.09 | |
Total return (%) (k)(s) | | | 13.60 | | | | 33.27 | | | | (37.31 | ) | | | 28.24 | | | | 31.96 | |
Ratios (%) (to average net assets)
and Supplemental data: | | | | | | | | | | | | | | | | | | | | |
Expenses (f) | | | 1.13 | | | | 1.13 | | | | 1.12 | | | | 1.08 | | | | 1.09 | |
Net investment income | | | 3.20 | | | | 3.81 | | | | 2.57 | | | | 1.93 | | | | 2.12 | |
Portfolio turnover | | | 55 | | | | 70 | | | | 63 | | | | 90 | | | | 93 | |
Net assets at end of period (000 omitted) | | | $125,116 | | | | $115,435 | | | | $83,248 | | | | $126,288 | | | | $78,660 | |
| (d) | Per share data are based on average shares outstanding. |
| (f) | Ratios do not reflect reductions from fees paid indirectly, if applicable. |
| (k) | The total return does not reflect expenses that apply to separate accounts. Inclusion of these charges would reduce the total return figures for all periods shown. |
| (s) | From time to time the fund may receive proceeds from litigation settlements, without which performance would be lower. Excluding the effect of the proceeds received from a non-recurring litigation settlement against Enron Corp., the Initial Class and Service Class total returns for the year ended December 31, 2008 would have been lower by approximately 1.01%. |
See Notes to Financial Statements
14
MFS Utilities Portfolio
NOTES TO FINANCIAL STATEMENTS
| (1) | | Business and Organization |
MFS Utilities Portfolio (the fund) is a series of MFS Variable Insurance Trust II (the trust). The trust is organized as a Massachusetts business trust and is registered under the Investment Company Act of 1940, as amended, as an open-end management investment company. The shareholders of each series of the trust are separate accounts of insurance companies, which offer variable annuity and/or life insurance products, and qualified retirement and pension plans.
| (2) | | Significant Accounting Policies |
General – The preparation of financial statements in conformity with U.S. generally accepted accounting principles requires management to make estimates and assumptions that affect the reported amounts of assets and liabilities, and disclosure of contingent assets and liabilities at the date of the financial statements and the reported amounts of revenues and expenses during the reporting period. Actual results could differ from those estimates. In the preparation of these financial statements, management has evaluated subsequent events occurring after the date of the fund’s Statement of Assets and Liabilities through the date that the financial statements were issued. The fund invests primarily in securities of issuers in the utility industry. Issuers in a single industry can react similarly to market, economic, political and regulatory conditions and developments. The fund invests in foreign securities, including securities of emerging market issuers. Investments in foreign securities are vulnerable to the effects of changes in the relative values of the local currency and the U.S. dollar and to the effects of changes in each country’s legal, political, and economic environment. The markets of emerging markets countries are generally more volatile than the markets of developed countries with more mature economies. All of the risks of investing in foreign securities previously described are heightened when investing in emerging markets countries.
Investment Valuations – Equity securities, including restricted equity securities, are generally valued at the last sale or official closing price as provided by a third-party pricing service on the market or exchange on which they are primarily traded. Equity securities, for which there were no sales reported that day, are generally valued at the last quoted daily bid quotation as provided by a third-party pricing service on the market or exchange on which such securities are primarily traded. Equity securities held short, for which there were no sales reported for that day, are generally valued at the last quoted daily ask quotation as provided by a third-party pricing service on the market or exchange on which such securities are primarily traded. Debt instruments and floating rate loans (other than short-term instruments), including restricted debt instruments, are generally valued at an evaluated or composite bid as provided by a third-party pricing service. Short-term instruments with a maturity at issuance of 60 days or less generally are valued at amortized cost, which approximates market value. Forward foreign currency contracts are generally valued at the mean of bid and asked prices for the time period interpolated from rates provided by a third-party pricing service for proximate time periods. Open-end investment companies are generally valued at net asset value per share. Securities and other assets generally valued on the basis of information from a third-party pricing service may also be valued at a broker/dealer bid quotation. Values obtained from third-party pricing services can utilize both transaction data and market information such as yield, quality, coupon rate, maturity, type of issue, trading characteristics, and other market data. The values of foreign securities and other assets and liabilities expressed in foreign currencies are converted to U.S. dollars using the mean of bid and asked prices for rates provided by a third-party pricing service.
The Board of Trustees has delegated primary responsibility for determining or causing to be determined the value of the fund’s investments (including any fair valuation) to the adviser pursuant to valuation policies and procedures approved by the Board. If the adviser determines that reliable market quotations are not readily available, investments are valued at fair value as determined in good faith by the adviser in accordance with such procedures under the oversight of the Board of Trustees. Under the fund’s valuation policies and procedures, market quotations are not considered to be readily available for most types of debt instruments and floating rate loans and many types of derivatives. These investments are generally valued at fair value based on information from third-party pricing services. In addition, investments may be valued at fair value if the adviser determines that an investment’s value has been materially effected by events occurring after the close of the exchange or market on which the investment is principally traded (such as foreign exchange or market) and prior to the determination of the fund’s net asset value, or after the halting of trading of a specific security where trading does not resume prior to the close of the exchange or market on which the security is principally traded. Events that occur on a frequent basis after foreign markets close (such as developments in foreign markets and significant movements in the U.S. markets) and prior to the determination of the fund’s net asset value may be deemed to have a material effect on the value of securities traded in foreign markets. Accordingly, the fund’s foreign equity securities may often be valued at fair value. The adviser generally relies on third-party pricing services or other information (such as the correlation with price movements of similar securities in the same or other markets; the type, cost and investment characteristics of the security; the business and financial condition of the issuer; and trading and other market data) to assist in determining whether to fair value and at what value to fair value an investment. The value of an investment for purposes of calculating the fund’s net asset value can differ depending on the source and method used to determine value. When fair valuation is used, the value of an investment used to determine the
15
MFS Utilities Portfolio
Notes to Financial Statements – continued
fund’s net asset value may differ from quoted or published prices for the same investment. There can be no assurance that the fund could obtain the fair value assigned to an investment if it were to sell the investment at the same time at which the fund determines its net asset value per share.
Various inputs are used in determining the value of the fund’s assets or liabilities. These inputs are categorized into three broad levels. In certain cases, the inputs used to measure fair value may fall into different levels of the fair value hierarchy. In such cases, an investment’s level within the fair value hierarchy is based on the lowest level of input that is significant to the fair value measurement. The fund’s assessment of the significance of a particular input to the fair value measurement in its entirety requires judgment, and considers factors specific to the investment. Level 1 includes unadjusted quoted prices in active markets for identical assets or liabilities. Level 2 includes other significant observable market-based inputs (including quoted prices for similar securities, interest rates, prepayment speed, and credit risk). Level 3 includes unobservable inputs, which may include the adviser’s own assumptions in determining the fair value of investments. Other financial instruments are derivative instruments not reflected in total investments, such as futures, forwards, swap contracts, and written options. The following is a summary of the levels used as of December 31, 2010 in valuing the fund’s assets or liabilities:
| | | | | | | | | | | | | | | | |
| Investments at Value | | Level 1 | | | Level 2 | | | Level 3 | | | Total | |
| Equity Securities: | | | | | | | | | | | | | | | | |
United States | | | $202,020,985 | | | | $3,375,838 | | | | $ — | | | | $205,396,823 | |
Brazil | | | 20,086,298 | | | | — | | | | — | | | | 20,086,298 | |
Israel | | | 14,023,034 | | | | — | | | | — | | | | 14,023,034 | |
United Kingdom | | | 13,464,177 | | | | — | | | | — | | | | 13,464,177 | |
Portugal | | | 11,176,473 | | | | — | | | | — | | | | 11,176,473 | |
Spain | | | 8,696,824 | | | | — | | | | — | | | | 8,696,824 | |
Finland | | | 4,705,699 | | | | — | | | | — | | | | 4,705,699 | |
Czech Republic | | | 4,254,601 | | | | — | | | | — | | | | 4,254,601 | |
Belgium | | | 3,888,160 | | | | — | | | | — | | | | 3,888,160 | |
Other Countries | | | 21,850,122 | | | | — | | | | — | | | | 21,850,122 | |
| Corporate Bonds | | | — | | | | 3,880,588 | | | | — | | | | 3,880,588 | |
| Commercial Mortgage-Backed Securities | | | — | | | | 17,909 | | | | — | | | | 17,909 | |
| Mutual Funds | | | 759,461 | | | | — | | | | — | | | | 759,461 | |
| Total Investments | | | $304,925,834 | | | | $7,274,335 | | | | $ — | | | | $312,200,169 | |
| | | | |
| Other Financial Instruments | | | | | | | | | | | | |
| Forward Currency Contracts | | | $ — | | | | $54,251 | | | | $ — | | | | $54,251 | |
For further information regarding security characteristics, see the Portfolio of Investments.
Of the level 1 investments presented above, equity investments amounting to $32,739,664 were considered level 2 investments at the beginning of the period. The primary reason for changes in the classifications between levels 1 and 2 occurs when foreign equity securities are fair valued using other observable market-based inputs in place of the closing exchange price due to events occurring after the close of the exchange or market on which the investment is principally traded. The fund’s foreign equity securities may often be valued at fair value.
Foreign Currency Translation – Purchases and sales of foreign investments, income, and expenses are converted into U.S. dollars based upon currency exchange rates prevailing on the respective dates of such transactions or on the reporting date for foreign denominated receivables and payables. Gains and losses attributable to foreign currency exchange rates on sales of securities are recorded for financial statement purposes as net realized gains and losses on investments. Gains and losses attributable to foreign exchange rate movements on receivables, payables, income and expenses are recorded for financial statement purposes as foreign currency transaction gains and losses. That portion of both realized and unrealized gains and losses on investments that results from fluctuations in foreign currency exchange rates is not separately disclosed.
Derivatives – The fund uses derivatives for different purposes, including to earn income and enhance returns, to increase or decrease exposure to a particular market, to manage or adjust the risk profile of the fund, or as alternatives to direct investments. Derivatives are used for hedging or non-hedging purposes. While hedging can reduce or eliminate losses, it can also reduce or eliminate gains. When the fund uses derivatives as an investment to increase market exposure, or for hedging purposes, gains and losses from derivative instruments may be substantially greater than the derivative’s original cost.
Derivative instruments used by the fund during the period include forward foreign currency exchange contracts. The fund’s period end derivatives, as presented in the Portfolio of Investments and the associated Derivative Contract Tables, generally are indicative of the volume of its derivative activity during the period.
16
MFS Utilities Portfolio
Notes to Financial Statements – continued
The following table presents, by major type of derivative contract, the fair value, on a gross basis, of the asset and liability components of derivatives held by the fund at December 31, 2010 as reported in the Statement of Assets and Liabilities:
| | | | | | | | | | |
| | | | | Fair Value | |
| Risk | | Derivative | | Asset Derivatives | | | Liability Derivatives | |
| Foreign Exchange Contracts | | Forward Foreign Currency
Exchange Contracts | | | $489,410 | | | | $(435,159 | ) |
The following table presents, by major type of derivative contract, the realized gain (loss) on derivatives held by the fund for the year ended December 31, 2010 as reported in the Statement of Operations:
| | |
| Risk | | Foreign Currency Transactions |
| Foreign Exchange Contracts | | $791,582 |
The following table presents, by major type of derivative contract, the change in unrealized appreciation (depreciation) on derivatives held by the fund for the year ended December 31, 2010 as reported in the Statement of Operations:
| | |
| Risk | | Translation of Assets and
Liabilities in
Foreign Currencies |
| Foreign Exchange Contracts | | $(136,335) |
Derivative counterparty credit risk is managed through formal evaluation of the creditworthiness of all potential counterparties. On certain over-the-counter derivatives, the fund attempts to reduce its exposure to counterparty credit risk whenever possible by entering into an International Swaps and Derivatives Association (ISDA) Master Agreement on a bilateral basis with each of the counterparties with whom it undertakes a significant volume of transactions. The ISDA Master Agreement gives each party to the agreement the right to terminate all transactions traded under such agreement if there is a certain deterioration in the credit quality of the other party. The ISDA Master Agreement gives the fund the right, upon an event of default by the applicable counterparty or a termination of the agreement, to close out all transactions traded under such agreement and to net amounts owed under each transaction to one net amount payable by one party to the other. This right to close out and net payments across all transactions traded under the ISDA Master Agreement could result in a reduction of the fund’s credit risk to such counterparty equal to any amounts payable by the fund under the applicable transactions, if any. However, absent an event of default by the counterparty or a termination of the agreement, the ISDA Master Agreement does not result in an offset of reported amounts of assets and liabilities in the Statement of Assets and Liabilities across transactions between the fund and the applicable counterparty.
Collateral requirements differ by type of derivative. Collateral or margin requirements are set by the broker or exchange clearing house for exchange traded derivatives (i.e., futures and exchange-traded options) while collateral terms are contract specific for over-the-counter traded derivatives (i.e., forwards, swaps and over-the-counter options). For derivatives traded under an ISDA Master Agreement, the collateral requirements are netted across all transactions traded under such agreement and one amount is posted from one party to the other to collateralize such obligations. Cash collateral that has been pledged to cover obligations of the fund under derivative contracts, if any, will be reported separately on the Statement of Assets and Liabilities as restricted cash. Securities collateral pledged for the same purpose, if any, is noted in the Portfolio of Investments.
Forward Foreign Currency Exchange Contracts – The fund entered into forward foreign currency exchange contracts for the purchase or sale of a specific foreign currency at a fixed price on a future date. These contracts may be used to hedge the fund’s currency risk or for non-hedging purposes. For hedging purposes, the fund may enter into contracts to deliver or receive foreign currency that the fund will receive from or use in its normal investment activities. The fund may also use contracts to hedge against declines in the value of foreign currency denominated securities due to unfavorable exchange rate movements. For non-hedging purposes, the fund may enter into contracts with the intent of changing the relative exposure of the fund’s portfolio of securities to different currencies to take advantage of anticipated exchange rate changes.
Forward foreign currency exchange contracts are adjusted by the daily exchange rate of the underlying currency and any unrealized gains or losses are recorded as a receivable or payable for forward foreign currency exchange contracts until the contract settlement date. On contract settlement date, any gain or loss on the contract is recorded as realized gains or losses on foreign currency transactions.
Risks may arise upon entering into these contracts from unanticipated movements in the value of the contract and from the potential inability of counterparties to meet the terms of their contracts. Generally, the fund’s maximum risk due to
17
MFS Utilities Portfolio
Notes to Financial Statements – continued
counterparty credit risk is the unrealized gain on the contract due to our use of continuous linked settlement, an industry accepted settlement system. This risk is mitigated in cases where there is an ISDA Master Agreement between the fund and the counterparty providing for netting as described above and for posting of collateral by the counterparty to the fund to cover the fund’s exposure to the counterparty under such ISDA Master Agreement.
Security Loans – State Street Bank and Trust Company (“State Street”), as lending agent, loans the securities of the fund to certain qualified institutions (the “Borrowers”) approved by the fund. The loans are collateralized by cash and/or U.S. Treasury and federal agency obligations in an amount typically at least equal to the market value of the securities loaned. The market value of the loaned securities is determined at the close of business of the fund and any additional required collateral is delivered to the fund on the next business day. State Street provides the fund with indemnification against Borrower default. The fund bears the risk of loss with respect to the investment of cash collateral. On loans collateralized by cash, the cash collateral is invested in a money market fund or short-term securities. A portion of the income generated upon investment of the collateral is remitted to the Borrowers, and the remainder is allocated between the fund and the lending agent. On loans collateralized by U.S. Treasury and/or federal agency obligations, a fee is received from the Borrower, and is allocated between the fund and the lending agent. Income from securities lending is included in interest income on the Statement of Operations. The dividend and interest income earned on the securities loaned is accounted for in the same manner as other dividend and interest income.
Indemnifications – Under the fund’s organizational documents, its officers and Trustees may be indemnified against certain liabilities and expenses arising out of the performance of their duties to the fund. Additionally, in the normal course of business, the fund enters into agreements with service providers that may contain indemnification clauses. The fund’s maximum exposure under these agreements is unknown as this would involve future claims that may be made against the fund that have not yet occurred.
Investment Transactions and Income – Investment transactions are recorded on the trade date. Interest income is recorded on the accrual basis. All premium and discount is amortized or accreted for financial statement purposes in accordance with U.S. generally accepted accounting principles. Dividends received in cash are recorded on the ex-dividend date. Certain dividends from foreign securities will be recorded when the fund is informed of the dividend if such information is obtained subsequent to the ex-dividend date. Dividend and interest payments received in additional securities are recorded on the ex-dividend or ex-interest date in an amount equal to the value of the security on such date.
The fund may receive proceeds from litigation settlements. Any proceeds received from litigation involving portfolio holdings are reflected in the Statement of Operations in realized gain/loss if the security has been disposed of by the fund or in unrealized gain/loss if the security is still held by the fund. Any other proceeds from litigation not related to portfolio holdings are reflected as other income in the Statement of Operations.
Fees Paid Indirectly – The fund’s custody fee may be reduced according to an arrangement that measures the value of cash deposited with the custodian by the fund. This amount, for the year ended December 31, 2010, is shown as a reduction of total expenses on the Statement of Operations.
Tax Matters and Distributions – The fund intends to qualify as a regulated investment company, as defined under Subchapter M of the Internal Revenue Code, and to distribute all of its taxable income, including realized capital gains. As a result, no provision for federal income tax is required. The fund’s federal tax returns for the prior three fiscal years remain subject to examination by the Internal Revenue Service. Foreign taxes, if any, have been accrued by the fund in the accompanying financial statements.
Distributions to shareholders are recorded on the ex-dividend date. Income and capital gain distributions are determined in accordance with income tax regulations, which may differ from U.S. generally accepted accounting principles. Certain capital accounts in the financial statements are periodically adjusted for permanent differences in order to reflect their tax character. These adjustments have no impact on net assets or net asset value per share. Temporary differences which arise from recognizing certain items of income, expense, gain or loss in different periods for financial statement and tax purposes will reverse at some time in the future. Distributions in excess of net investment income or net realized gains are temporary overdistributions for financial statement purposes resulting from differences in the recognition or classification of income or distributions for financial statement and tax purposes.
Book/tax differences primarily relate to wash sale loss deferrals.
The tax character of distributions declared to shareholders for the last two fiscal years is as follows:
| | | | | | | | |
| | | 12/31/10 | | | 12/31/09 | |
| Ordinary income (including any short-term capital gains) | | | $ 9,661,054 | | | | $ 13,093,061 | |
18
MFS Utilities Portfolio
Notes to Financial Statements – continued
The federal tax cost and the tax basis components of distributable earnings were as follows:
| | | | |
| As of 12/31/10 | | | | |
| Cost of investments | | | $292,664,251 | |
| Gross appreciation | | | 37,100,803 | |
| Gross depreciation | | | (17,564,885 | ) |
| Net unrealized appreciation (depreciation) | | | $19,535,918 | |
| Undistributed ordinary income | | | 10,625,664 | |
| Capital loss carryforwards | | | (28,779,399 | ) |
| Other temporary differences | | | 1,087 | |
As of December 31, 2010, the fund had capital loss carryforwards available to offset future realized gains. Such losses expire as follows:
| | | | |
| 12/31/16 | | | $ (6,272,236 | ) |
| 12/31/17 | | | (22,507,163 | ) |
| Total | | | $(28,779,399 | ) |
Multiple Classes of Shares of Beneficial Interest – The fund offers multiple classes of shares, which differ in their respective distribution and/or service fees. The fund’s income, realized and unrealized gain (loss), and common expenses are allocated to shareholders based on the daily net assets of each class. Dividends are declared separately for each class. Differences in per share dividend rates are generally due to differences in separate class expenses. The fund’s distributions declared to shareholders as reported on the Statements of Changes in Net Assets are presented by class as follows:
| | | | | | | | |
| | | From net investment
income | |
| | | Year ended
12/31/10 | | | Year ended
12/31/09 | |
| Initial Class | | | $6,050,884 | | | | $8,907,825 | |
| Service Class | | | 3,610,170 | | | | 4,185,236 | |
| Total | | | $9,661,054 | | | | $13,093,061 | |
| (3) | | Transactions with Affiliates |
Investment Adviser – The fund has an investment advisory agreement with MFS to provide overall investment management and related administrative services and facilities to the fund.
The management fee is computed daily and paid monthly at the following annual rates:
| | | | |
| First $300 million of average daily net assets | | | 0.75% | |
| Average daily net assets in excess of $300 million | | | 0.675% | |
The management fee incurred for the year ended December 31, 2010 was equivalent to an annual effective rate of 0.75% of the fund’s average daily net assets.
Distributor – MFS Fund Distributors, Inc. (MFD), a wholly-owned subsidiary of MFS, is the distributor of shares of the fund. The Trustees have adopted a distribution plan for the Service Class shares pursuant to Rule 12b-1 under the Investment Company Act of 1940.
The fund’s distribution plan provides that the fund will pay MFD distribution and/or service fees equal to 0.25% per annum of its average daily net assets attributable to Service Class shares as partial consideration for services performed and expenses incurred by MFD and financial intermediaries (including participating insurance companies that invest in the fund to fund variable annuity and variable life insurance contracts, sponsors of qualified retirement and pension plans that invest in the fund, and affiliates of these participating insurance companies and plan sponsors) in connection with the sale and distribution of the Service Class shares. MFD may subsequently pay all, or a portion, of the distribution and/or service fees to financial intermediaries.
Shareholder Servicing Agent – MFS Service Center, Inc. (MFSC), a wholly-owned subsidiary of MFS, has contracted to provide transfer agent and recordkeeping functions in connection with the issuance, transfer, and redemption of each class of shares of the fund under a Shareholder Servicing Agent Agreement. During the year ended December 31, 2010, the fund did not pay MFSC a fee for this service.
Administrator – MFS provides certain financial, legal, shareholder communications, compliance, and other administrative services to the fund. Under an administrative services agreement, the fund partially reimburses MFS the costs incurred to provide these services. The fund is charged an annual fixed amount of $10,000 plus a fee based on average daily net assets. The
19
MFS Utilities Portfolio
Notes to Financial Statements – continued
administrative services fee incurred for the year ended December 31, 2010 was equivalent to an annual effective rate of 0.0355% of the fund’s average daily net assets.
Trustees’ and Officers’ Compensation – The fund pays compensation to Trustees in the form of a retainer, attendance fees, and additional compensation to the Board chairperson. The fund does not pay compensation directly to officers of the fund who are also officers of the investment adviser, all of whom receive remuneration for their services to the fund from MFS. Certain officers of the fund are officers or directors of MFS, MFD, and MFSC.
Other – This fund and certain other funds managed by MFS (the funds) have entered into services agreements (the Agreements) which provide for payment of fees by the funds to Tarantino LLC and Griffin Compliance LLC in return for the provision of services of an Independent Chief Compliance Officer (ICCO) and Assistant ICCO, respectively, for the funds. The ICCO and Assistant ICCO are officers of the funds and the sole members of Tarantino LLC and Griffin Compliance LLC, respectively. The funds can terminate the Agreements with Tarantino LLC and Griffin Compliance LLC at any time under the terms of the Agreements. MFS has agreed to bear all expenses associated with office space, other administrative support, and supplies provided to the ICCO and Assistant ICCO. For the year ended December 31, 2010, the aggregate fees paid by the fund to Tarantino LLC and Griffin Compliance LLC were $5,179 and are included in miscellaneous expense on the Statement of Operations.
The fund invests in the MFS Institutional Money Market Portfolio which is managed by MFS and seeks a high level of current income consistent with preservation of capital and liquidity. Income earned on this investment is included in dividends from underlying funds on the Statement of Operations. This money market fund does not pay a management fee to MFS.
Purchases and sales of investments, other than U.S. Government securities, purchased option transactions and short-term obligations, aggregated $162,805,416 and $184,970,801, respectively.
| (5) | | Shares of Beneficial Interest |
The fund’s Declaration of Trust permits the Trustees to issue an unlimited number of full and fractional shares of beneficial interest. Transactions in fund shares were as follows:
| | | | | | | | | | | | | | | | |
| | | Year ended 12/31/10 | | | Year ended 12/31/09 | |
| | | Shares | | | Amount | | | Shares | | | Amount | |
| Shares sold | | | | | | | | | | | | | | | | |
Initial Class | | | 200,012 | | | | $3,995,167 | | | | 215,871 | | | | $3,701,667 | |
Service Class | | | 790,180 | | | | 15,356,100 | | | | 1,240,433 | | | | 21,101,323 | |
| | | 990,192 | | | | $19,351,267 | | | | 1,456,304 | | | | $24,802,990 | |
| Shares issued to shareholders in reinvestment of distributions | | | | | | | | | | | | | | | | |
Initial Class | | | 312,062 | | | | $6,050,884 | | | | 634,008 | | | | $8,907,825 | |
Service Class | | | 187,736 | | | | 3,610,170 | | | | 300,017 | | | | 4,185,236 | |
| | | 499,798 | | | | $9,661,054 | | | | 934,025 | | | | $13,093,061 | |
| Shares reacquired | | | | | | | | | | | | | | | | |
Initial Class | | | (1,838,990 | ) | | | $(35,813,242 | ) | | | (2,161,977 | ) | | | $(34,577,975 | ) |
Service Class | | | (1,078,027 | ) | | | (20,894,691 | ) | | | (1,003,392 | ) | | | (16,174,014 | ) |
| | | (2,917,017 | ) | | | $(56,707,933 | ) | | | (3,165,369 | ) | | | $(50,751,989 | ) |
| Net change | | | | | | | | | | | | | | | | |
Initial Class | | | (1,326,916 | ) | | | $(25,767,191 | ) | | | (1,312,098 | ) | | | $(21,968,483 | ) |
Service Class | | | (100,111 | ) | | | (1,928,421 | ) | | | 537,058 | | | | 9,112,545 | |
| | | (1,427,027 | ) | | | $(27,695,612 | ) | | | (775,040 | ) | | | $(12,855,938 | ) |
The fund and certain other funds managed by MFS participate in a $1.1 billion unsecured committed line of credit, subject to a $1 billion sublimit, provided by a syndication of banks under a credit agreement. Borrowings may be made for temporary financing needs. Interest is charged to each fund, based on its borrowings, generally at a rate equal to the higher of the Federal Reserve funds rate or one month LIBOR plus an agreed upon spread. A commitment fee, based on the average daily, unused portion of the committed line of credit, is allocated among the participating funds at the end of each calendar quarter. In addition, the fund and other funds managed by MFS have established unsecured uncommitted borrowing arrangements with certain banks for temporary financing needs. Interest is charged to each fund, based on its borrowings, at a rate equal to the Federal Reserve funds rate plus an agreed upon spread. For the year ended December 31, 2010, the fund’s commitment fee and interest expense were $3,394 and $0, respectively, and are included in miscellaneous expense on the Statement of Operations.
20
MFS Utilities Portfolio
Notes to Financial Statements – continued
| (7) | | Transactions in Underlying Funds – Affiliated Issuers |
An affiliated issuer may be considered one in which the fund owns 5% or more of the outstanding voting securities, or a company which is under common control. For the purposes of this report, the fund assumes the following to be affiliated issuers:
| | | | | | | | | | | | | | | | |
| Underlying Funds | | Beginning
Shares/Par
Amount | | | Acquisitions
Shares/Par
Amount | | | Dispositions
Shares/Par
Amount | | | Ending
Shares/Par
Amount | |
| MFS Institutional Money Market Portfolio | | | 7,071,633 | | | | 69,545,432 | | | | (75,857,604 | ) | | | 759,461 | |
| | | | |
| Underlying Funds | | Realized
Gain (Loss) | | | Capital Gain
Distributions | | | Dividend
Income | | | Ending
Value | |
| MFS Institutional Money Market Portfolio | | | $— | | | | $— | | | | $7,251 | | | | $759,461 | |
21
MFS Utilities Portfolio
REPORT OF INDEPENDENT REGISTERED PUBLIC ACCOUNTING FIRM
To the Board of Trustees of MFS Variable Insurance Trust II and the Shareholders of
MFS Utilities Portfolio:
We have audited the accompanying statement of assets and liabilities, including the portfolio of investments, of MFS Utilities Portfolio (the “Fund”) (one of the portfolios comprising MFS Variable Insurance Trust II) as of December 31, 2010, and the related statement of operations for the year then ended, the statements of changes in net assets for each of the two years in the period then ended, and the financial highlights for each of the five years in the period then ended. These financial statements and financial highlights are the responsibility of the Fund’s management. Our responsibility is to express an opinion on these financial statements and financial highlights based on our audits.
We conducted our audits in accordance with the standards of the Public Company Accounting Oversight Board (United States). Those standards require that we plan and perform the audit to obtain reasonable assurance about whether the financial statements and financial highlights are free of material misstatement. The Fund is not required to have, nor were we engaged to perform, an audit of its internal control over financial reporting. Our audits included consideration of internal control over financial reporting as a basis for designing audit procedures that are appropriate in the circumstances, but not for the purpose of expressing an opinion on the effectiveness of the Fund’s internal control over financial reporting. Accordingly, we express no such opinion. An audit also includes examining, on a test basis, evidence supporting the amounts and disclosures in the financial statements, assessing the accounting principles used and significant estimates made by management, as well as evaluating the overall financial statement presentation. Our procedures included confirmation of securities owned as of December 31, 2010, by correspondence with the custodian and brokers; where replies were not received from brokers, we performed other auditing procedures. We believe that our audits provide a reasonable basis for our opinion.
In our opinion, the financial statements and financial highlights referrred to above present fairly, in all material respects, the financial position of MFS Utilities Portfolio as of December 31, 2010, the results of its operations for the year then ended, the changes in its net assets for each of the two years in the period then ended, and the financial highlights for each of the five years in the period then ended, in conformity with accounting principles generally accepted in the United States of America.
DELOITTE & TOUCHE LLP
Boston, Massachusetts
February 14, 2011
22
MFS Utilities Portfolio
TRUSTEES AND OFFICERS – IDENTIFICATION AND BACKGROUND
The Trustees and officers of the Trust, as of February 1, 2011, are listed below, together with their principal occupations during the past five years. (Their titles may have varied during that period.) The address of each Trustee and officer is 500 Boylston Street, Boston, Massachusetts 02116.
| | | | | | |
Name, Date of Birth | | Position(s) Held
with Fund | | Trustee/Officer
Since (1) | | Principal Occupations During the Past Five Years and
Other Directorships (2) |
| INTERESTED TRUSTEE | | | | |
David D. Horn (3) (born 6/07/41) | | Trustee | | April 1986 | | Private investor; Sun Life Assurance Company of Canada, Senior Vice President and General Manager for the United States (until 1997); Director (until March 2004) |
| | |
| INDEPENDENT TRUSTEES | | | | |
J. Kermit Birchfield (born 1/08/40) | | Chairman | | May 1997 | | Consultant; Century Partners, Inc. (investments), Director; Displaytech, Inc. (technology), Chairman; Dessin Fournir LLC (furniture manufacturer), Director; Site Watch LLC (software to monitor oil tanks), Managing Director (2006 to present); Juridica Investments (fund investing in judicial matters), Director (2007 to present), Immuno Science, Inc. (medical research), Independent Director (2009 to present), Intermountain Industries, Inc. (oil & gas exploration and production), Director (until February 2009) |
| | | |
Robert C. Bishop (born 1/13/43) | | Trustee | | May 2001 | | AutoImmune, Inc. (pharmaceutical product development), Chairman, President and Chief Executive Officer; Caliper Life Sciences Corp. (laboratory analytical instruments), Chairman; Optobionics Corporation (ophthalmic devices), Director (until 2007); Millipore Corporation (purification/filtration products), Director (until July 2010); Waterstreet Capital (leverage buyouts), Advisory Board (until August 2010) |
| | | |
Frederick H. Dulles (born 3/12/42) | | Trustee | | May 2001 | | Dulles International Law LLC (law firm), Senior Lawyer (since 2009); Juridica Capital Management (US) Inc. (litigation financing), Vice President and General Counsel (since 2009); Dulles Properties LLC (real estate), Broker (since 2008); The Citadel School of Business Administration (education), Adjunct Professor (since 2003); Disher, Hamrick & Myers Residential, Inc. (real estate), Broker (until 2006); Frederick H. Dulles Law Practice (law firm), (until 2006); Charlestown School of Law (education), Adjunct Professor (until 2007); Prudential Carolina Real Estate, (real estate), Broker (until 2008); Free Enterprise Foundation Inc. (research institute), Director & Secretary (until 2008); Ten State International Law PLLP (law firm), Of Counsel (until 2009) |
| | | |
Marcia A. Kean (born 6/30/48) | | Trustee | | April 2005 | | Feinstein Kean Healthcare (consulting), Chief Executive Officer |
| | | |
Ronald G. Steinhart (born 6/15/40) | | Trustee | | May 2001 | | Private investor; Penske Automotive Group (automotive retailer), Director; Animal Health International, Inc. (animal health products), Director (since 2007); Texas Industries (concrete/aggregates/cement), Director (since 2007); Susser Holdings Corporation (retail convenience stores and distributor of wholesale motor fuel), Director (since 2009); Prentiss Properties Trust (real estate investment trust), Director (until 2006); Penson Worldwide, Inc. (securities clearance), Director (until 2008) |
| | | |
Haviland Wright (born 7/21/48) | | Trustee | | May 2001 | | X-Change Corp. (multi-media web services), Director (since 2010); Nano Loa Inc. (liquid crystal displays), Director (until 2009); Profitability of Hawaii (software), Chief Development Officer (until 2010); Elixir Technologies Corporation (software), Director (until 2010) |
| | | |
| OFFICERS | | | | | | |
Maria F. DiOrioDwyer (4)
(born 12/01/58) | | President | | November 2005 | | Massachusetts Financial Services Company, Executive Vice President and Chief Regulatory Officer; Chief Compliance Officer (since December 2006) |
| | | |
| Christopher R. Bohane (4) (born 1/18/74) | | Assistant Secretary and Assistant Clerk | | July 2005 | | Massachusetts Financial Services Company, Vice President and Senior Counsel |
| | | |
John M. Corcoran (4) (born 4/13/65) | | Treasurer | | October 2008 | | Massachusetts Financial Services Company, Senior Vice President (since October 2008); State Street Bank and Trust (financial services provider), Senior Vice President, (until September 2008) |
| | | |
Ethan D. Corey (4) (born 11/21/63) | | Assistant Secretary and Assistant Clerk | | July 2005 | | Massachusetts Financial Services Company, Senior Vice President and Associate General Counsel |
| | | |
David L. DiLorenzo (4) (born 8/10/68) | | Assistant Treasurer | | July 2005 | | Massachusetts Financial Services Company, Vice President |
| | | |
Timothy M. Fagan (4) (born 7/10/68) | | Assistant Secretary and Assistant Clerk | | September 2005 | | Massachusetts Financial Services Company, Vice President and Senior Counsel |
| | | |
Mark D. Fischer (4) (born 10/27/70) | | Assistant Treasurer | | July 2005 | | Massachusetts Financial Services Company, Vice President |
23
MFS Utilities Portfolio
Trustees and Officers – continued
| | | | | | |
Name, Date of Birth | | Position(s) Held
with Fund | | Trustee/Officer
Since (1) | | Principal Occupations During the Past Five Years and
Other Directorships (2) |
Robyn L. Griffin (born 7/04/75) | | Assistant Independent Chief Compliance Officer | | August 2008 | | Griffin Compliance LLC (provider of compliance services), Principal (since August 2008); State Street Corporation (financial services provider), Mutual Fund Administration Assistant Vice President (October 2006 – July 2008); Liberty Mutual Group (insurance), Personal Market Assistant Controller (April 2006 – October 2006); Deloitte & Touche LLP (professional services firm), Senior Manager (prior to April 2006) |
| | | |
Brian E. Langenfeld (4) (born 3/07/73) | | Assistant Secretary and Assistant Clerk | | May 2006 | | Massachusetts Financial Services Company, Vice President and Senior Counsel (since May 2006); John Hancock Advisers, LLC, Assistant Vice President and Counsel (until April 2006) |
| | | |
Ellen Moynihan (4) (born 11/13/57) | | Assistant Treasurer | | May 1997 | | Massachusetts Financial Services Company, Senior Vice President |
| | | |
Susan S. Newton (4) (born 3/07/50) | | Assistant Secretary and Assistant Clerk | | May 2005 | | Massachusetts Financial Services Company, Senior Vice President and Associate General Counsel |
| | | |
Susan A. Pereira (4)
(born 11/05/70) | | Assistant Secretary and Assistant Clerk | | July 2005 | | Massachusetts Financial Services Company, Vice President and Senior Counsel |
| | | |
Mark N. Polebaum (4) (born 5/01/52) | | Secretary and Clerk | | February 2006 | | Massachusetts Financial Services Company, Executive Vice President, General Counsel and Secretary (since January 2006); Wilmer Cutler Pickering Hale and Dorr LLP (law firm), Partner (until January 2006) |
| | | |
Frank L. Tarantino (born 3/07/44) | | Independent Chief Compliance Officer | | September 2004 | | Tarantino LLC (provider of compliance services), Principal |
| | | |
Richard S. Weitzel (4) (born 7/16/70) | | Assistant Secretary and Assistant Clerk | | October 2007 | | Massachusetts Financial Services Company, Vice President and Assistant General Counsel |
| | | |
James O. Yost (4) (born 6/12/60) | | Assistant Treasurer | | April 1992 | | Massachusetts Financial Services Company, Senior Vice President |
| (1) | Date first appointed to serve as Trustee/Officer of an MFS fund or a Compass variable account. Each Trustee has served continuously since appointment. For the period March 2008 until October 2008, Ms. DiOrioDwyer served as Treasurer of the Funds. |
| (2) | Directorships or trusteeships of companies required to report to the Securities and Exchange Commission (i.e., “public companies”). |
| (3) | “Interested person” of the Trust, within the meaning of the Investment Company Act of 1940 (referred to as the 1940 Act), which is the principal federal law governing investment companies like the Trust, as a result of position with Sun Life of Canada (U.S.). The address of Sun Life of Canada (U.S.) is One Sun Life Executive Park, Wellesley Hills, Massachusetts 02481. |
| (4) | “Interested person” of MFS within the meaning of the 1940 Act. The address of MFS is 500 Boylston Street, Boston, Massachusetts 02116. |
The Trust does not hold annual meetings for the purpose of electing Trustees, and Trustees are not elected for fixed terms. Each Trustee and officer holds office until his or her successor is chosen and qualified, or until his or her earlier death, resignation, retirement or removal.
All Trustees currently serve as Trustees of the Trust and have served in that capacity since originally elected or appointed. All of the Trustees are also Managers of the Compass Variable Accounts. The executive officers of the Trust hold similar offices for the Compass Variable Accounts and other funds in the MFS fund complex. As of January 1, 2011, each Trustee serves as a Trustee or Manager of 31 Accounts/Portfolios.
24
MFS Utilities Portfolio
Trustees and Officers – continued
The Statement of Additional Information contains further information about the Trustees and is available without charge upon request by calling 1-800-752-7215.
| | |
Investment Adviser
Massachusetts Financial Services Company 500 Boylston Street, Boston, MA 02116-3741 | | Custodian State Street Bank and Trust 1 Lincoln Street, Boston, MA 02111-2900 |
Distributor
MFS Fund Distributors, Inc. 500 Boylston Street, Boston, MA 02116-3741 | | Independent Registered Public Accounting Firm Deloitte & Touche LLP 200 Berkeley Street, Boston, MA 02116 |
Portfolio Managers Robert Persons Maura Shaughnessy | | |
25
MFS Utilities Portfolio
BOARD REVIEW OF INVESTMENT ADVISORY AGREEMENT
The Investment Company Act of 1940 requires that both the full Board of Trustees and a majority of the non-interested (“independent”) Trustees, voting separately, annually approve the continuation of the investment advisory agreement between MFS Variable Insurance Trust II (the “Trust”) and Massachusetts Financial Services Company (“MFS”) on behalf of the Fund. The Trustees consider matters bearing on the Fund and the advisory arrangement at their meetings throughout the year, including a review of performance data at each regular meeting. In addition, the independent Trustees met in person in May and again in July 2010 (“contract review meetings”) for the specific purpose of considering whether to approve the continuation of the investment advisory agreement for the Fund. The independent Trustees were assisted in their evaluation of the investment advisory agreement by independent legal counsel, from whom they received separate legal advice and with whom they met separately from MFS management during various contract review meetings. The independent Trustees were also assisted in this process by the Fund’s Independent Chief Compliance Officer, a full-time senior officer appointed by and reporting to the independent Trustees.
In connection with their deliberations, the Trustees, including the independent Trustees, considered such information and factors as they believed, in light of the legal advice furnished to them and their own business judgment, to be relevant. The investment advisory agreement was considered separately for the Fund, although the Trustees also took into account the common interests of all Funds in the Trust in their review. As described below, the Trustees considered the nature, quality, and extent of the various investment advisory, administrative, and shareholder services performed by MFS under the existing investment advisory agreement and other arrangements with the Trust.
In connection with their contract review meetings, the Trustees received and relied upon materials which included, among other items: (i) information provided by Lipper Inc. (“Lipper”) on the investment performance of the Fund for various time periods ended December 31, 2009, compared to the investment performance of a group of funds with substantially similar investment classifications/objectives (the “Lipper performance universe”), (ii) information provided by Lipper on the Fund’s advisory fees and other expenses compared to the advisory fees and other expenses of comparable funds identified by Lipper (the “Lipper expense group”), (iii) information provided by MFS on the advisory fees of comparable portfolios of its other clients, including institutional separate account and other clients, (iv) information as to whether, and to what extent applicable, expense waivers, reimbursements or fee “breakpoints” are observed for the Fund, (v) information regarding MFS’ financial results and financial condition, including MFS’ and certain of its affiliates’ estimated profitability from services performed for the Fund, (vi) MFS’ views regarding the outlook for the mutual fund industry and its strategic business plans, (vii) descriptions of various functions performed by MFS for the Trust, such as compliance monitoring and portfolio trading practices, and (viii) information regarding the overall organization of MFS, including information about MFS’ senior management and other personnel providing investment advisory, administrative and other services to the Fund. The comparative performance, fee and expense information prepared and provided by Lipper was not independently verified, and the independent Trustees did not independently verify any information provided to them by MFS.
The Trustees’ conclusion as to the continuation of the investment advisory agreement was based on comprehensive consideration of all information provided to the Trustees and was not the result of any single factor. Some of the factors that figured particularly in the Trustees’ deliberations are described below for the Fund, while individual Trustees may have given different weight to various factors and evaluated the information presented as a whole differently than another individual Trustee. The Trustees recognized that the fee arrangements for the Fund reflect years of review and discussion between the independent Trustees and MFS, that certain aspects of such arrangements may receive greater scrutiny in some years than others, and that the Trustees’ conclusions may be based, in part, on their consideration of these same arrangements during the course of the year and in prior years.
Based on information provided by Lipper, the Trustees compared the Fund’s total return investment performance to the performance of the Lipper performance universe over various time periods. The Trustees placed particular emphasis on the total return performance of the Fund’s Initial Class shares in comparison to the performance of funds in its Lipper performance universe over the one-, three- and five-year periods ended December 31, 2009. The Trustees did not rely on performance results for more recent periods, including those shown elsewhere in this report.
The Trustees noted the performance of the Fund’s Initial Class shares was in the 1st quintile relative to the other funds in the Lipper performance universe for the one-year period (the 1st quintile being the best performers and the 5th quintile being the worst performers). The total return performance of the Fund was also in the 1st quintile for the three-year and the five-year periods ended December 31, 2009, relative to the Lipper performance universe. Based on the nature and quality of services provided by MFS, the Board of Trustees concluded that the Fund’s performance was satisfactory.
In the course of their deliberations, the Trustees took into account information provided by MFS during contract review meetings, as well as during investment review meetings conducted with portfolio management personnel during the course of the year.
26
MFS Utilities Portfolio
Board Review of Investment Advisory Agreement – continued
In assessing the reasonableness of the Fund’s advisory fee, the Trustees considered, among other information, the Fund’s advisory fee and the total expense ratio of the Fund’s Initial Class shares as a percentage of average daily net assets, compared to the advisory fee and total expense ratios of its peer group of funds based on information provided by Lipper. The Trustees also considered the advisory fees charged by MFS to institutional accounts. In comparing these fees, the Trustees considered the generally broader scope of services provided by MFS to the Trust than those provided to institutional accounts. The Trustees also considered the higher demands placed on MFS’ investment personnel and trading infrastructure as a result of the daily cash in-flows and out-flows of the Fund, and the impact on MFS and related expenses due to the more extensive regulatory regime to which the Fund is subject, compared to institutional accounts.
In considering the fees, the Trustees noted from the Lipper data that the Fund’s effective advisory fee rate was above the median and total expense ratio was approximately at the median of such fees and expenses of funds in the Lipper expense group. The Trustees further concluded that the existing breakpoint was sufficient to allow the Fund to benefit from economies of scale as its assets grow. The Trustees concluded that the fees were reasonable in light of the nature and quality of services provided.
The Trustees also considered information prepared by MFS relating to its costs and profits with respect to the Fund and other investment companies and accounts advised by MFS, as well as MFS’ methodologies used to determine and allocate its costs to the Fund and other accounts and products for purposes of estimating profitability.
After reviewing these and other factors described below, the Trustees concluded that the advisory fees charged to the Fund represent reasonable compensation in light of the nature and quality of the services being provided by MFS.
In addition, the Trustees considered MFS’ resources and related efforts to continue to retain, attract and motivate capable personnel to serve the Fund. The Trustees also considered the financial resources of MFS and its parent, Sun Life Financial Inc. The Trustees further considered any advantages and possible disadvantages of having an adviser which also serves other investment companies as well as institutional accounts.
The Trustees also considered the nature, quality, cost, and extent of administrative, transfer agency, and distribution services provided to the Fund by MFS and its affiliates under agreements and plans other than the investment advisory agreement, including the 12b-1 fees the Fund pays to MFS Fund Distributors, Inc., an affiliate of MFS. The Trustees also considered the nature, extent and quality of certain other services MFS performs or arranges on the Fund’s behalf, which may include securities lending programs, directed expense payment programs, class action recovery programs, and MFS’ interaction with third-party service providers, principally custodians and sub-custodians. The Trustees concluded that the various non-advisory services provided by MFS and its affiliates on behalf of the Fund were satisfactory. The Trustees also considered the benefits to MFS from the use of the Fund’s portfolio brokerage commissions to pay for investment research and various other factors. Additionally, the Trustees considered so-called “fall-out benefits” to MFS such as reputational value derived from serving as investment manager to the Trust, and determined that any such benefits derived by MFS were reasonable and fair.
Based on their evaluation of factors that they deemed to be material, including those factors described above, the Board of Trustees, including a majority of the independent Trustees, concluded that the investment advisory agreement should be continued for an additional one-year period, commencing September 1, 2010.
A discussion regarding the Board’s most recent review and renewal of the fund’s Investment Advisory Agreement with MFS is available by clicking on the fund’s name under “Variable Insurance Portfolios — VIT II” in the “Products and Performance” section of the MFS Web site (mfs.com).
27
MFS Utilities Portfolio
PROXY VOTING POLICIES AND INFORMATION
A general description of the MFS funds’ proxy voting policies and procedures is available without charge, upon request, by calling
1-800-225-2606, by visiting the Proxy Voting section of mfs.com or by visiting the SEC’s Web site at http://www.sec.gov.
Information regarding how the fund voted proxies relating to portfolio securities during the most recent twelve-month period ended June 30 is available without charge by visiting the Proxy Voting section of mfs.com or by visiting the SEC’s Web site at http://www.sec.gov.
QUARTERLY PORTFOLIO DISCLOSURE
The fund will file a complete schedule of portfolio holdings with the Securities and Exchange Commission (the Commission) for the first and third quarters of each fiscal year on Form N-Q. The fund’s Form N-Q may be reviewed and copied at the:
Public Reference Room
Securities and Exchange Commission
100 F Street, NE, Room 1580
Washington, D.C. 20549
Information on the operation of the Public Reference Room may be obtained by calling the Commission at 1-800-SEC-0330. The fund’s Form N-Q is available on the EDGAR database on the Commission’s Internet Web site at http://www.sec.gov, and copies of this information may be obtained, upon payment of a duplicating fee, by electronic request at the following e-mail address: publicinfo@sec.gov or by writing the Public Reference Section at the above address.
FURTHER INFORMATION
From time to time, MFS may post important information about the fund or the MFS funds on the MFS web site (mfs.com). This information is available by visiting the “News & Commentary” section of mfs.com or by clicking on the fund’s name under “Variable Insurance Portfolios — VIT II” in the “Products and Performance” section of mfs.com.
FEDERAL TAX INFORMATION (unaudited)
The following information is provided pursuant to provisions of the Internal Revenue Code.
For corporate shareholders, 70.90% of the ordinary income dividends paid during the fiscal year qualify for the corporate dividends received deduction.
28
MFS Utilities Portfolio
MFS® PRIVACY NOTICE
Privacy is a concern for every investor today. At MFS Investment Management® and the MFS funds, we take this concern very seriously. We want you to understand our policies about the investment products and services that we offer, and how we protect the nonpublic personal information of investors who have a direct relationship with us and our wholly owned subsidiaries.
Throughout our business relationship, you provide us with personal information. We maintain information and records about you, your investments, and the services you use. Examples of the nonpublic personal information we maintain include
| | Ÿ | | data from investment applications and other forms |
| | Ÿ | | share balances and transactional history with us, our affiliates, or others |
| | Ÿ | | facts from a consumer reporting agency |
We do not disclose any nonpublic personal information about our customers or former customers to anyone, except as permitted by law. We may share nonpublic personal information with third parties or certain of our affiliates in connection with servicing your account or processing your transactions. We may share information with companies or financial institutions that perform marketing services on our behalf or with other financial institutions with which we have joint marketing arrangements, subject to any legal requirements.
Authorization to access your nonpublic personal information is limited to appropriate personnel who provide products, services, or information to you. We maintain physical, electronic, and procedural safeguards to help protect the personal information we collect about you.
If you have any questions about the MFS privacy policy, please call 1-800-225-2606 any business day.
Note: If you own MFS products or receive MFS services in the name of a third party such as a bank or broker-dealer, their privacy policy may apply to you instead of ours.
29


MFS® VALUE PORTFOLIO
This report is prepared for the general information of contract owners. It is authorized for distribution to prospective investors only when preceded or accompanied by a current prospectus.
NOT FDIC INSURED Ÿ MAY LOSE VALUE Ÿ NO BANK OR CREDIT UNION GUARANTEE Ÿ NOT A DEPOSIT Ÿ NOT INSURED BY ANY FEDERAL GOVERNMENT AGENCY OR NCUA/NCUSIF
MFS Value Portfolio
LETTER FROM THE CEO

Dear Contract Owners:
After an extended rebound in the financial markets, uncertainty returned in 2010 as investors began to question the durability of the recovery for global economies and markets. That uncertainty led to increased risk aversion, especially as investors saw the eurozone struggle with the debt woes of many of its members. In September, the U.S. Federal Reserve Board’s promises to further loosen monetary policy helped assuage market fears and drive asset prices off their recent lows. A combination of solid earnings and improving economic data gave an additional boost to investor sentiment. As we enter 2011, we are cautiously optimistic that economic growth will continue to improve and that the global economies will recover from the shocks of the past few years. We expect the pace of recovery worldwide will be uneven and volatile.
As always, we continue to be mindful of the many economic challenges faced at the local, national, and international levels. It is in times such as these that we want to remind investors of the merits of maintaining a long-term view, adhering to basic investing principles such as asset allocation and diversification, and working closely with their advisors to research and identify appropriate investment opportunities.
Respectfully,

Robert J. Manning
Chairman and Chief Executive Officer
MFS Investment Management®
February 14, 2011
The opinions expressed in this letter are subject to change, may not be relied upon for investment advice, and no forecasts can be guaranteed.
1
MFS Value Portfolio
PORTFOLIO COMPOSITION
Portfolio structure
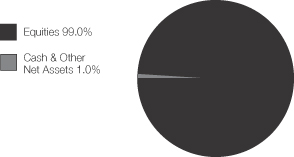
| | | | |
| Top ten holdings | | | | |
| Lockheed Martin Corp. | | | 3.7% | |
| Philip Morris International, Inc. | | | 3.3% | |
| Goldman Sachs Group, Inc. | | | 3.2% | |
| AT&T, Inc. | | | 2.9% | |
| JPMorgan Chase & Co. | | | 2.8% | |
| Bank of New York Mellon Corp. | | | 2.8% | |
| Johnson & Johnson | | | 2.7% | |
| MetLife, Inc. | | | 2.6% | |
| Pfizer, Inc. | | | 2.4% | |
| Accenture Ltd., “A” | | | 2.4% | |
| | | | |
| Equity sectors | | | | |
| Financial Services | | | 23.6% | |
| Health Care | | | 12.3% | |
| Consumer Staples | | | 11.3% | |
| Energy | | | 10.9% | |
| Industrial Goods & Services | | | 10.8% | |
| Utilities & Communications | | | 7.3% | |
| Technology | | | 6.8% | |
| Special Products & Services | | | 3.6% | |
| Basic Materials | | | 3.5% | |
| Leisure | | | 3.1% | |
| Autos & Housing | | | 2.8% | |
| Retailing | | | 2.5% | |
| Transportation | | | 0.5% | |
Percentages are based on net assets as of 12/31/10.
The portfolio is actively managed and current holdings may be different.
2
MFS Value Portfolio
MANAGEMENT REVIEW
Summary of Results
For the twelve months ended December 31, 2010, Initial Class shares of the MFS Value Portfolio (the “fund”) provided a total return of 11.51%, while Service Class shares of the fund provided a total return of 11.22%. These compare with a return of 15.51% for the fund’s benchmark, the Russell 1000 Value Index.
Market Environment
The first quarter of the reporting period witnessed a continuation of the financial market and macroeconomic rebounds that had begun in early 2009. These recoveries in global activity and asset valuations were generally synchronized around the world, led importantly by emerging Asian economies, but broadening to include most of the global economy to varying degrees. Primary drivers of the recoveries included an unwinding of the inventory destocking that took place earlier, the production of manufacturing and capital goods, as well as massive fiscal and monetary stimulus.
During most of the remainder of the period, heightened risk surrounding the public-debt profiles of several of the peripheral European countries impaired market sentiment. At the same time, the improving trend in global macroeconomic data began to weaken somewhat. These two dynamics caused many asset prices to retrench significantly, as many questioned the durability of the global recovery.
Towards the end of the period, the U.S. Federal Reserve led markets to believe that further monetary loosening would be forthcoming if macroeconomic activity did not show signs of improvement. The prospects for more easing by the Fed improved market sentiment and drove risk-asset prices markedly higher. However, in a text-book case of “buy the rumor, sell the fact,” the weeks following the early November announcement of further quantitative easing saw a sell-off in U.S. Treasury bonds. This rise in Treasury yields occurred despite risk-off behavior in equities and credit markets (which would normally result in Treasury yield compression), and appears to have been the result of a few factors: signs of improved U.S. and global economic activity; opposition to quantitative easing from some quarters; and crowded long positions in U.S. Treasuries. The December agreement on an expansionary U.S. fiscal package also boosted sentiment, leading markets to reach near-term highs in risky asset valuations toward year end.
Detractors from Performance
Stock selection in the energy sector detracted from performance relative to the Russell 1000 Value Index. The fund’s holdings of integrated oil company Total S.A. (b) (France) and energy exploration and production company EOG Resources hindered relative results. Not owning oil and gas company ConocoPhillips (h), during the second half of the reporting period, also hurt.
Stock selection in the industrial goods & services sector held back relative returns. Within this sector, holdings of poor-performing defense contractor Lockheed Martin and not holding strong-performing aerospace company Boeing dampened relative performance.
A combination of stock selection and an overweight position in the health care sector was another negative factor for relative performance. Holdings of pharmaceutical and medical products maker Abbott Laboratories, medical device maker Medtronic, and diversified medical products maker Johnson & Johnson were among the fund’s top relative detractors over the reporting period. Shares of Medtronic came under pressure due to weaker-than-expected sales, lower margins in its Cardiac Rhythm Management (CRM) business, and a reduction in management’s revenue guidance.
A combination of an underweight position and stock selection in the leisure sector also contributed to relative performance. No individual stocks within this sector were among the fund’s top relative detractors.
Elsewhere, not holding strong-performing financial services firm Citigroup held back relative results. Holdings of network equipment company Cisco Systems (b) also dampened relative performance. Shares of Cisco Systems fell during the period hurting relative performance. We believe the decline was due to the company’s lower-than-expected forecasted fiscal second quarter revenue and earnings. Management attributed the shortfall to lower government spending and weaker sales in Europe.
Contributors to Performance
Stock selection in the retailing sector boosted relative performance. Auto parts retailer Advance Auto Parts (b) outperformed the benchmark over the reporting period and was one of the fund’s top contributors. Shares of Advance Auto Parts rose as performance significantly exceeded expectations driven by strong same store sales, gross margin improvement, and an accelerated share repurchase program.
Elsewhere, not holding poor-performing insurance and investment firm Berkshire Hathaway aided relative performance. Holdings of integrated oil and gas company Exxon Mobil, tobacco company Philip Morris International, insurance company
3
MFS Value Portfolio
Management Review – continued
MetLife, chemical company PPG Industries, enterprise software products maker Oracle (b), paints and coatings manufacturer Sherwin-Williams, and diversified industrial manufacturer Eaton Corp. were also among the fund’s top relative contributors. Shares of Philip Morris rose on strong results led by solid price increases which more than offset volume declines in its developed markets. Our underweight position in pharmaceutical company Merck benefited relative performance as this stock underperformed the benchmark over the reporting period.
Respectfully,
| | |
| Nevin Chitkara | | Steven Gorham |
| Portfolio Manager | | Portfolio Manager |
| (b) | Security is not a benchmark constituent. |
| (h) | Security was not held in the portfolio at period end. |
The views expressed in this report are those of the portfolio managers only through the end of the period of the report as stated on the cover and do not necessarily reflect the views of MFS or any other person in the MFS organization. These views are subject to change at any time based on market or other conditions, and MFS disclaims any responsibility to update such views. These views may not be relied upon as investment advice or an indication of trading intent on behalf of any MFS portfolio. References to specific securities are not recommendations of such securities, and may not be representative of any MFS portfolio’s current or future investments.
4
MFS Value Portfolio
PERFORMANCE SUMMARY THROUGH 12/31/10
The following chart illustrates the historical performance of the fund in comparison to its benchmark(s). Benchmarks are unmanaged and may not be invested in directly. Benchmark returns do not reflect any fees or expenses. The performance of other share classes will be greater than or less than that of the class depicted below. (See Notes to Performance Summary.)
Performance data shown represents past performance and is no guarantee of future results. Investment return and principal value fluctuate so your units, when sold, may be worth more or less than the original cost; current performance may be lower or higher than quoted. The performance shown does not reflect the deduction of taxes, if any, that a contract holder would pay on fund distributions or the redemption of contract units. The returns for the fund shown also do not reflect the deduction of expenses associated with variable products, such as mortality and expense risk charges, separate account charges, and sales charges imposed by the insurance company separate accounts. Such expenses would reduce the overall returns shown.
Growth of a Hypothetical $10,000 Investment
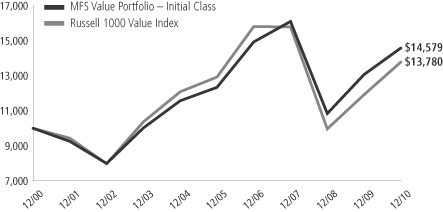
Total Returns through 12/31/10
Average annual total returns
| | | | | | | | | | | | | | |
| | | Share class | | Class inception date | | 1-yr | | 5-yr | | 10-yr | | Life (t) | | |
| | | Initial Class | | 5/06/98 | | 11.51% | | 3.39% | | 3.84% | | N/A | | |
| | | Service Class | | 8/24/01 | | 11.22% | | 3.14% | | N/A | | 4.61% | | |
| | | | | |
| Comparative benchmark | | | | | | | | | | |
| | | Russell 1000 Value Index (f) | | 15.51% | | 1.28% | | 3.26% | | N/A | | |
| (f) | Source: FactSet Research Systems Inc. |
| (t) | For the period from the class inception date through the stated period end (for those share classes with less than 10 years of performance history). No comparative benchmark performance information is provided for “life” periods. (See Notes to Performance Summary.) |
Benchmark Definition
Russell 1000 Value Index – constructed to provide a comprehensive barometer for the value securities in the large-cap segment of the U.S. equity universe. Companies in this index generally have lower price-to-book ratios and lower forecasted growth values.
It is not possible to invest directly in an index.
Notes to Performance Summary
Average annual total return represents the average annual change in value for each share class for the periods presented. Life returns are presented where the share class has less than 10 years of performance history and represent the average annual total return from the class inception date to the stated period end date. As the fund’s share classes may have different inception dates, the life returns may represent different time periods and may not be comparable. As a result, no comparative benchmark performance information is provided for life periods.
Performance results reflect any applicable expense subsidies and waivers in effect during the periods shown. Without such subsidies and waivers the fund’s performance results would be less favorable. Please see the prospectus and financial
5
MFS Value Portfolio
Performance Summary – continued
statements for complete details. All results are historical and assume the reinvestment of any dividends and capital gains distributions.
From time to time the fund may receive proceeds from litigation settlements, without which performance would be lower.
6
MFS Value Portfolio
EXPENSE TABLE
Fund Expenses Borne by the Contract Holders During the Period,
July 1, 2010 through December 31, 2010
As a contract holder of the fund, you incur ongoing costs, including management fees; distribution and/or service (12b-1) fees; and other fund expenses. This example is intended to help you understand your ongoing costs (in dollars) of investing in the fund and to compare these costs with the ongoing costs of investing in other mutual funds.
The example is based on an investment of $1,000 invested at the beginning of the period and held for the entire period July 1, 2010 through December 31, 2010.
Actual Expenses
The first line for each share class in the following table provides information about actual account values and actual expenses. You may use the information in this line, together with the amount you invested, to estimate the expenses that you paid over the period. Simply divide your account value by $1,000 (for example, an $8,600 account value divided by $1,000 = 8.6), then multiply the result by the number in the first line under the heading entitled “Expenses Paid During Period” to estimate the expenses you paid on your account during this period.
Hypothetical Example for Comparison Purposes
The second line for each share class in the following table provides information about hypothetical account values and hypothetical expenses based on the fund’s actual expense ratio and an assumed rate of return of 5% per year before expenses, which is not the fund’s actual return. The hypothetical account values and expenses may not be used to estimate the actual ending account balance or expenses you paid for the period. You may use this information to compare the ongoing costs of investing in the fund and other funds. To do so, compare this 5% hypothetical example with the 5% hypothetical examples that appear in the shareholder reports of the other funds.
Please note that the expenses shown in the table are meant to highlight the fund’s ongoing costs only and do not take into account the fees and expenses imposed under the variable contracts through which your investment in the fund is made. Therefore, the second line for each share class in the table is useful in comparing ongoing costs associated with an investment in vehicles (such as the fund) which fund benefits under variable annuity and variable life insurance contracts and to qualified pension and retirement plans only, and will not help you determine the relative total costs of investing in the fund through variable annuity and variable life insurance contracts. If the fees and expenses imposed under the variable contracts were included, your costs would have been higher.
| | | | | | | | | | | | | | | | | | |
| Share Class | | | | Annualized
Expense Ratio | | | Beginning
Account Value
7/01/10 | | | Ending
Account Value
12/31/10 | | | Expenses Paid
During Period (p)
7/01/10-12/31/10 | |
| Initial Class | | Actual | | | 0.84% | | | | $1,000.00 | | | | $1,201.21 | | | | $4.66 | |
| | Hypothetical (h) | | | 0.84% | | | | $1,000.00 | | | | $1,020.97 | | | | $4.28 | |
| Service Class | | Actual | | | 1.09% | | | | $1,000.00 | | | | $1,200.17 | | | | $6.04 | |
| | Hypothetical (h) | | | 1.09% | | | | $1,000.00 | | | | $1,019.71 | | | | $5.55 | |
| (h) | 5% class return per year before expenses. |
| (p) | Expenses paid is equal to each class’ annualized expense ratio, as shown above, multiplied by the average account value over the period, multiplied by the number of days in the period, divided by the number of days in the year. |
7
MFS Value Portfolio
PORTFOLIO OF INVESTMENTS – 12/31/10
The Portfolio of Investments is a complete list of all securities owned by your fund. It is categorized by broad-based asset classes.
| | | | | | | | |
| Issuer | | Shares/Par | | | Value ($) | |
| | | | | | | | |
| COMMON STOCKS – 98.6% | |
| Aerospace – 9.0% | |
| Honeywell International, Inc. | | | 148,690 | | | $ | 7,904,360 | |
| Lockheed Martin Corp. | | | 282,987 | | | | 19,783,621 | |
| Northrop Grumman Corp. | | | 123,050 | | | | 7,971,179 | |
| United Technologies Corp. | | | 154,325 | | | | 12,148,464 | |
| | | | | | | | |
| | | | | | $ | 47,807,624 | |
| | | | | | | | |
| Alcoholic Beverages – 1.3% | |
| Diageo PLC | | | 384,728 | | | $ | 7,107,975 | |
| | | | | | | | |
| Automotive – 0.6% | |
| General Motors Co. (a) | | | 28,080 | | | $ | 1,035,029 | |
| Johnson Controls, Inc. | | | 53,235 | | | | 2,033,577 | |
| | | | | | | | |
| | | | | | $ | 3,068,606 | |
| | | | | | | | |
| Broadcasting – 2.4% | |
| Omnicom Group, Inc. | | | 118,928 | | | $ | 5,446,902 | |
| Walt Disney Co. | | | 188,712 | | | | 7,078,587 | |
| | | | | | | | |
| | | | | | $ | 12,525,489 | |
| | | | | | | | |
| Brokerage & Asset Managers – 0.3% | |
| Blackrock, Inc. | | | 8,957 | | | $ | 1,707,025 | |
| | | | | | | | |
| Business Services – 3.6% | |
| Accenture Ltd., “A” | | | 260,407 | | | $ | 12,627,135 | |
| Dun & Bradstreet Corp. | | | 39,347 | | | | 3,229,995 | |
| Western Union Co. | | | 167,325 | | | | 3,107,225 | |
| | | | | | | | |
| | | | | | $ | 18,964,355 | |
| | | | | | | | |
| Chemicals – 2.4% | |
| 3M Co. | | | 77,178 | | | $ | 6,660,461 | |
| PPG Industries, Inc. | | | 74,857 | | | | 6,293,228 | |
| | | | | | | | |
| | | | | | $ | 12,953,689 | |
| | | | | | | | |
| Computer Software – 2.0% | |
| Oracle Corp. | | | 342,673 | | | $ | 10,725,665 | |
| | | | | | | | |
| Computer Software – Systems – 2.6% | |
| Hewlett-Packard Co. | | | 65,640 | | | $ | 2,763,444 | |
| International Business Machines Corp. | | | 74,585 | | | | 10,946,095 | |
| | | | | | | | |
| | | | | | $ | 13,709,539 | |
| | | | | | | | |
| Construction – 2.2% | |
| Pulte Homes, Inc. (a) | | | 185,528 | | | $ | 1,395,171 | |
| Sherwin-Williams Co. | | | 83,622 | | | | 7,003,343 | |
| Stanley Black & Decker, Inc. | | | 53,226 | | | | 3,559,223 | |
| | | | | | | | |
| | | | | | $ | 11,957,737 | |
| | | | | | | | |
| Consumer Products – 0.9% | |
| Avon Products, Inc. | | | 44,300 | | | $ | 1,287,358 | |
| Procter & Gamble Co. | | | 54,228 | | | | 3,488,487 | |
| | | | | | | | |
| | | | | | $ | 4,775,845 | |
| | | | | | | | |
| Electrical Equipment – 0.8% | |
| Danaher Corp. | | | 86,270 | | | $ | 4,069,356 | |
| | | | | | | | |
| | | | | | | | |
| Issuer | | Shares/Par | | | Value ($) | |
| | | | | | | | |
| COMMON STOCKS – continued | |
| Electronics – 1.4% | |
| Intel Corp. | | | 349,712 | | | $ | 7,354,443 | |
| | | | | | | | |
| Energy – Independent – 3.2% | |
| Apache Corp. | | | 67,525 | | | $ | 8,051,006 | |
| EOG Resources, Inc. | | | 41,382 | | | | 3,782,729 | |
| Occidental Petroleum Corp. | | | 50,797 | | | | 4,983,186 | |
| | | | | | | | |
| | | | | | $ | 16,816,921 | |
| | | | | | | | |
| Energy – Integrated – 5.8% | |
| Chevron Corp. | | | 137,063 | | | $ | 12,506,999 | |
| Exxon Mobil Corp. | | | 119,597 | | | | 8,744,933 | |
| Hess Corp. | | | 84,215 | | | | 6,445,816 | |
| TOTAL S.A., ADR | | | 56,375 | | | | 3,014,935 | |
| | | | | | | | |
| | | | | | $ | 30,712,683 | |
| | | | | | | | |
| Engineering – Construction – 0.2% | |
| Fluor Corp. | | | 16,370 | | | $ | 1,084,676 | |
| | | | | | | | |
| Food & Beverages – 5.2% | |
| General Mills, Inc. | | | 217,270 | | | $ | 7,732,639 | |
| J.M. Smucker Co. | | | 42,137 | | | | 2,766,294 | |
| Kellogg Co. | | | 78,840 | | | | 4,027,147 | |
| Nestle S.A. | | | 125,927 | | | | 7,373,800 | |
| PepsiCo, Inc. | | | 86,723 | | | | 5,665,614 | |
| | | | | | | | |
| | | | | | $ | 27,565,494 | |
| | | | | | | | |
| Food & Drug Stores – 1.0% | |
| CVS Caremark Corp. | | | 90,403 | | | $ | 3,143,312 | |
| Walgreen Co. | | | 56,650 | | | | 2,207,084 | |
| | | | | | | | |
| | | | | | $ | 5,350,396 | |
| | | | | | | | |
| General Merchandise – 0.8% | |
| Kohl’s Corp. (a) | | | 38,050 | | | $ | 2,067,637 | |
| Target Corp. | | | 35,600 | | | | 2,140,628 | |
| | | | | | | | |
| | | | | | $ | 4,208,265 | |
| | | | | | | | |
| Insurance – 7.9% | |
| ACE Ltd. | | | 46,990 | | | $ | 2,925,127 | |
| Allstate Corp. | | | 104,175 | | | | 3,321,099 | |
| Aon Corp. | | | 132,550 | | | | 6,098,626 | |
| Chubb Corp. | | | 61,755 | | | | 3,683,068 | |
| MetLife, Inc. | | | 306,988 | | | | 13,642,547 | |
| Prudential Financial, Inc. | | | 122,567 | | | | 7,195,909 | |
| Travelers Cos., Inc. | | | 92,645 | | | | 5,161,253 | |
| | | | | | | | |
| | | | | | $ | 42,027,629 | |
| | | | | | | | |
| Leisure & Toys – 0.4% | |
| Hasbro, Inc. | | | 47,143 | | | $ | 2,224,207 | |
| | | | | | | | |
| Machinery & Tools – 0.8% | |
| Eaton Corp. | | | 42,500 | | | $ | 4,314,175 | |
| | | | | | | | |
| Major Banks – 14.6% | |
| Bank of America Corp. | | | 683,390 | | | $ | 9,116,423 | |
| Bank of New York Mellon Corp. | | | 484,145 | | | | 14,621,179 | |
| Goldman Sachs Group, Inc. | | | 100,032 | | | | 16,821,381 | |
8
MFS Value Portfolio
Portfolio of Investments – continued
| | | | | | | | |
| Issuer | | Shares/Par | | | Value ($) | |
| | | | | | | | |
| COMMON STOCKS – continued | |
| Major Banks – continued | |
| JPMorgan Chase & Co. | | | 349,842 | | | $ | 14,840,298 | |
| PNC Financial Services Group, Inc. | | | 72,695 | | | | 4,414,040 | |
| State Street Corp. | | | 133,295 | | | | 6,176,890 | |
| Wells Fargo & Co. | | | 368,112 | | | | 11,407,791 | |
| | | | | | | | |
| | | | | | $ | 77,398,002 | |
| | | | | | | | |
| Medical & Health Technology & Services – 0.4% | |
| Quest Diagnostics, Inc. | | | 40,320 | | | $ | 2,176,070 | |
| | | | | | | | |
| Medical Equipment – 3.8% | |
| Becton, Dickinson & Co. | | | 58,102 | | | $ | 4,910,781 | |
| Medtronic, Inc. | | | 194,120 | | | | 7,199,911 | |
| St. Jude Medical, Inc. (a) | | | 130,270 | | | | 5,569,042 | |
| Thermo Fisher Scientific, Inc. (a) | | | 45,955 | | | | 2,544,069 | |
| | | | | | | | |
| | | | | | $ | 20,223,803 | |
| | | | | | | | |
| Network & Telecom – 0.8% | |
| Cisco Systems, Inc. (a) | | | 208,950 | | | $ | 4,227,058 | |
| | | | | | | | |
| Oil Services – 1.7% | |
| National Oilwell Varco, Inc. | | | 41,010 | | | $ | 2,757,922 | |
| Noble Corp. | | | 56,650 | | | | 2,026,370 | |
| Transocean, Inc. (a) | | | 58,150 | | | | 4,042,006 | |
| | | | | | | | |
| | | | | | $ | 8,826,298 | |
| | | | | | | | |
| Other Banks & Diversified Financials – 0.8% | |
| MasterCard, Inc., “A” | | | 19,070 | | | $ | 4,273,778 | |
| | | | | | | | |
| Pharmaceuticals – 8.1% | |
| Abbott Laboratories | | | 194,472 | | | $ | 9,317,154 | |
| GlaxoSmithKline PLC | | | 110,210 | | | | 2,130,671 | |
| Johnson & Johnson | | | 228,887 | | | | 14,156,661 | |
| Merck & Co., Inc. | | | 60,172 | | | | 2,168,599 | |
| Pfizer, Inc. | | | 741,628 | | | | 12,985,906 | |
| Roche Holding AG | | | 17,190 | | | | 2,518,749 | |
| | | | | | | | |
| | | | | | $ | 43,277,740 | |
| | | | | | | | |
| Railroad & Shipping – 0.5% | |
| Canadian National Railway Co. | | | 39,480 | | | $ | 2,624,236 | |
| | | | | | | | |
| Restaurants – 0.3% | |
| McDonald’s Corp. | | | 20,270 | | | $ | 1,555,925 | |
| | | | | | | | |
| Specialty Chemicals – 1.1% | |
| Air Products & Chemicals, Inc. | | | 64,187 | | | $ | 5,837,808 | |
| | | | | | | | |
| Specialty Stores – 0.7% | |
| Advance Auto Parts, Inc. | | | 28,260 | | | $ | 1,869,399 | |
| Staples, Inc. | | | 80,980 | | | | 1,843,915 | |
| | | | | | | | |
| | | | | | $ | 3,713,314 | |
| | | | | | | | |
| Telecommunications – Wireless – 1.3% | |
| Vodafone Group PLC | | | 2,772,573 | | | $ | 7,167,064 | |
| | | | | | | | |
| Telephone Services – 2.9% | |
| AT&T, Inc. | | | 523,712 | | | $ | 15,386,659 | |
| | | | | | | | |
| | | | | | | | |
| Issuer | | Shares/Par | | | Value ($) | |
| | | | | | | | |
| COMMON STOCKS – continued | |
| Tobacco – 3.9% | |
| Altria Group, Inc. | | | 60,752 | | | $ | 1,495,714 | |
| Philip Morris International, Inc. | | | 295,525 | | | | 17,297,078 | |
| Reynolds American, Inc. | | | 55,300 | | | | 1,803,886 | |
| | | | | | | | |
| | | | | | $ | 20,596,678 | |
| | | | | | | | |
| Utilities – Electric Power – 2.9% | |
| Dominion Resources, Inc. | | | 64,810 | | | $ | 2,768,683 | |
| Entergy Corp. | | | 24,425 | | | | 1,730,023 | |
| PG&E Corp. | | | 121,738 | | | | 5,823,946 | |
| PPL Corp. | | | 66,182 | | | | 1,741,910 | |
| Public Service Enterprise Group, Inc. | | | 106,573 | | | | 3,390,087 | |
| | | | | | | | |
| | | | | | $ | 15,454,649 | |
| | | | | | | | |
Total Common Stocks
(Identified Cost, $478,841,988) | | | | | | $ | 523,770,876 | |
| | | | | | | | |
|
| CONVERTIBLE PREFERRED STOCKS – 0.4% | |
| Energy – Independent – 0.2% | |
| Apache Corp., 6% | | �� | 15,840 | | | $ | 1,049,558 | |
| | | | | | | | |
| Utilities – Electric Power – 0.2% | |
| PPL Corp., 9.5% | | | 17,340 | | | $ | 953,180 | |
| | | | | | | | |
Total Convertible Preferred Stocks
(Identified Cost, $1,676,585) | | | | | | $ | 2,002,738 | |
| | | | | | | | |
|
| MONEY MARKET FUNDS (v) – 0.8% | |
| MFS Institutional Money Market Portfolio, 0.18%, at Cost and Net Asset Value | | | 4,137,996 | | | $ | 4,137,996 | |
| | | | | | | | |
Total Investments
(Identified Cost, $484,656,569) | | | | | | $ | 529,911,610 | |
| | | | | | | | |
OTHER ASSETS, LESS
LIABILITIES – 0.2% | | | | | | | 1,312,705 | |
| | | | | | | | |
| Net Assets – 100.0% | | | | | | $ | 531,224,315 | |
| | | | | | | | |
| (a) | Non-income producing security. |
| (v) | Underlying fund that is available only to investment companies managed by MFS. The rate quoted is the annualized seven-day yield of the fund at period end. |
The following abbreviations are used in this report and are defined:
| ADR | | American Depository Receipt |
| PLC | | Public Limited Company |
See Notes to Financial Statements
9
MFS Value Portfolio
FINANCIAL STATEMENTS | STATEMENT OF ASSETS AND LIABILITIES
This statement represents your fund’s balance sheet, which details the assets and liabilities comprising the total value of the fund.
At 12/31/10
| | | | | | | | |
Assets | | | | | | | | |
Investments – | | | | | | | | |
Non-affiliated issuers, at value (identified cost, $480,518,573) | | | $525,773,614 | | | | | |
Underlying funds, at cost and value | | | 4,137,996 | | | | | |
Total investments, at value (identified cost, $484,656,569) | | | $529,911,610 | | | | | |
Receivables for | | | | | | | | |
Fund shares sold | | | 991,477 | | | | | |
Interest and dividends | | | 875,932 | | | | | |
Other assets | | | 16,890 | | | | | |
Total assets | | | | | | | $531,795,909 | |
Liabilities | | | | | | | | |
Payable to custodian | | | $50,308 | | | | | |
Payable for fund shares reacquired | | | 401,812 | | | | | |
Payable to affiliates | | | | | | | | |
Investment adviser | | | 21,804 | | | | | |
Distribution and/or service fees | | | 3,187 | | | | | |
Administrative services fee | | | 1,020 | | | | | |
Payable for Trustees’ compensation | | | 355 | | | | | |
Accrued expenses and other liabilities | | | 93,108 | | | | | |
Total liabilities | | | | | | | $571,594 | |
Net assets | | | | | | | $531,224,315 | |
Net assets consist of | | | | | | | | |
Paid-in capital | | | $449,468,472 | | | | | |
Unrealized appreciation (depreciation) on investments and translation of assets and liabilities in foreign currencies | | | 45,259,619 | | | | | |
Accumulated net realized gain (loss) on investments and foreign currency transactions | | | 28,589,985 | | | | | |
Undistributed net investment income | | | 7,906,239 | | | | | |
Net assets | | | | | | | $531,224,315 | |
Shares of beneficial interest outstanding | | | | | | | 38,326,860 | |
| | | | | | | | | | | | |
| | | Net assets | | | Shares
outstanding | | | Net asset value
per share | |
Initial Class | | | $298,798,925 | | | | 21,473,646 | | | | $13.91 | |
Service Class | | | 232,425,390 | | | | 16,853,214 | | | | 13.79 | |
See Notes to Financial Statements
10
MFS Value Portfolio
FINANCIAL STATEMENTS | STATEMENT OF OPERATIONS
This statement describes how much your fund earned in investment income and accrued in expenses. It also describes any gains and/or losses generated by fund operations.
| | | | | | | | |
| Year ended 12/31/10 | | | | | | | | |
| Net investment income | | | | | | | | |
Income | | | | | | | | |
Dividends | | | $13,009,894 | | | | | |
Interest | | | 21,707 | | | | | |
Dividends from underlying funds | | | 13,023 | | | | | |
Foreign taxes withheld | | | (98,927 | ) | | | | |
Total investment income | | | | | | | $12,945,697 | |
Expenses | | | | | | | | |
Management fee | | | $4,008,217 | | | | | |
Distribution and/or service fees | | | 562,554 | | | | | |
Administrative services fee | | | 187,050 | | | | | |
Trustees’ compensation | | | 66,235 | | | | | |
Custodian fee | | | 90,889 | | | | | |
Shareholder communications | | | 32,950 | | | | | |
Auditing fees | | | 46,838 | | | | | |
Legal fees | | | 7,483 | | | | | |
Miscellaneous | | | 46,261 | | | | | |
Total expenses | | | | | | | $5,048,477 | |
Fees paid indirectly | | | (5 | ) | | | | |
Net expenses | | | | | | | $5,048,472 | |
Net investment income | | | | | | | $7,897,225 | |
Realized and unrealized gain (loss) on investments and foreign currency transactions | | | | | | | | |
Realized gain (loss) (identified cost basis) | | | | | | | | |
Investment transactions | | | $46,348,591 | | | | | |
Foreign currency transactions | | | 10,498 | | | | | |
Net realized gain (loss) on investments and foreign currency transactions | | | | | | | $46,359,089 | |
Change in unrealized appreciation (depreciation) | | | | | | | | |
Investments | | | $4,697,008 | | | | | |
Translation of assets and liabilities in foreign currencies | | | 5,644 | | | | | |
Net unrealized gain (loss) on investments and foreign currency translation | | | | | | | $4,702,652 | |
Net realized and unrealized gain (loss) on investments and foreign currency | | | | | | | $51,061,741 | |
Change in net assets from operations | | | | | | | $58,958,966 | |
See Notes to Financial Statements
11
MFS Value Portfolio
FINANCIAL STATEMENTS | STATEMENTS OF CHANGES IN NET ASSETS
These statements describe the increases and/or decreases in net assets resulting from operations, any distributions, and any shareholder transactions.
| | | | | | | | |
For years ended 12/31 | | | 2010 | | | | 2009 | |
Change in net assets | | | | | | | | |
From operations | | | | | | | | |
Net investment income | | | $7,897,225 | | | | $6,923,653 | |
Net realized gain (loss) on investments and foreign currency transactions | | | 46,359,089 | | | | (1,217,466 | ) |
Net unrealized gain (loss) on investments and foreign currency translation | | | 4,702,652 | | | | 75,383,535 | |
Change in net assets from operations | | | $58,958,966 | | | | $81,089,722 | |
Distributions declared to shareholders | | | | | | | | |
From net investment income | | | $(6,932,160 | ) | | | $(5,894,567 | ) |
Change in net assets from fund share transactions | | | $(17,191,538 | ) | | | $109,663,966 | |
Total change in net assets | | | $34,835,268 | | | | $184,859,121 | |
Net assets | | | | | | | | |
At beginning of period | | | 496,389,047 | | | | 311,529,926 | |
At end of period (including undistributed net investment income of $7,906,239 and
$6,930,676, respectively) | | | $531,224,315 | | | | $496,389,047 | |
See Notes to Financial Statements
12
MFS Value Portfolio
FINANCIAL STATEMENTS | FINANCIAL HIGHLIGHTS
The financial highlights table is intended to help you understand the fund’s financial performance for the past 5 years. Certain information reflects financial results for a single fund share. The total returns in the table represent the rate by which an investor would have earned (or lost) on an investment in the fund share class (assuming reinvestment of all distributions) held for the entire period.
| | | | | | | | | | | | | | | | | | | | |
| Initial Class | | Years ended 12/31 | |
| | | 2010 | | | 2009 | | | 2008 | | | 2007 | | | 2006 | |
Net asset value, beginning of period | | | $12.64 | | | | $10.70 | | | | $18.78 | | | | $18.70 | | | | $16.30 | |
| Income (loss) from investment operations | | | | | | | | | | | | | | | | | | | | |
Net investment income (d) | | | $0.20 | | | | $0.22 | | | | $0.25 | | | | $0.27 | | | | $0.28 | |
Net realized and unrealized gain (loss) on investments
and foreign currency | | | 1.25 | | | | 1.92 | | | | (5.50 | ) | | | 1.22 | | | | 3.04 | |
Total from investment operations | | | $1.45 | | | | $2.14 | | | | $(5.25 | ) | | | $1.49 | | | | $3.32 | |
| Less distributions declared to shareholders | | | | | | | | | | | | | | | | | | | | |
From net investment income | | | $(0.18 | ) | | | $(0.20 | ) | | | $(0.30 | ) | | | $(0.30 | ) | | | $(0.27 | ) |
From net realized gain on investments | | | — | | | | — | | | | (2.53 | ) | | | (1.11 | ) | | | (0.65 | ) |
Total distributions declared to shareholders | | | $(0.18 | ) | | | $(0.20 | ) | | | $(2.83 | ) | | | $(1.41 | ) | | | $(0.92 | ) |
Net asset value, end of period | | | $13.91 | | | | $12.64 | | | | $10.70 | | | | $18.78 | | | | $18.70 | |
Total return (%) (k)(s) | | | 11.51 | | | | 20.49 | | | | (32.64 | ) | | | 7.92 | | | | 20.96 | |
Ratios (%) (to average net assets)
and Supplemental data: | | | | | | | | | | | | | | | | | | | | |
Expenses (f) | | | 0.84 | | | | 0.85 | | | | 0.84 | | | | 0.83 | | | | 0.86 | |
Net investment income | | | 1.59 | | | | 1.98 | | | | 1.75 | | | | 1.40 | | | | 1.62 | |
Portfolio turnover | | | 34 | | | | 27 | | | | 44 | | | | 25 | | | | 26 | |
Net assets at end of period (000 omitted) | | | $298,799 | | | | $268,001 | | | | $146,011 | | | | $267,967 | | | | $323,094 | |
| |
| Service Class | | Years ended 12/31 | |
| | | 2010 | | | 2009 | | | 2008 | | | 2007 | | | 2006 | |
Net asset value, beginning of period | | | $12.54 | | | | $10.61 | | | | $18.66 | | | | $18.59 | | | | $16.21 | |
| Income (loss) from investment operations | | | | | | | | | | | | | | | | | | | | |
Net investment income (d) | | | $0.17 | | | | $0.19 | | | | $0.22 | | | | $0.22 | | | | $0.23 | |
Net realized and unrealized gain (loss) on investments
and foreign currency | | | 1.23 | | | | 1.91 | | | | (5.48 | ) | | | 1.22 | | | | 3.02 | |
Total from investment operations | | | $1.40 | | | | $2.10 | | | | $(5.26 | ) | | | $1.44 | | | | $3.25 | |
| Less distributions declared to shareholders | | | | | | | | | | | | | | | | | | | | |
From net investment income | | | $(0.15 | ) | | | $(0.17 | ) | | | $(0.26 | ) | | | $(0.26 | ) | | | $(0.22 | ) |
From net realized gain on investments | | | — | | | | — | | | | (2.53 | ) | | | (1.11 | ) | | | (0.65 | ) |
Total distributions declared to shareholders | | | $(0.15 | ) | | | $(0.17 | ) | | | $(2.79 | ) | | | $(1.37 | ) | | | $(0.87 | ) |
Net asset value, end of period | | | $13.79 | | | | $12.54 | | | | $10.61 | | | | $18.66 | | | | $18.59 | |
Total return (%) (k)(s) | | | 11.22 | | | | 20.30 | | | | (32.87 | ) | | | 7.67 | | | | 20.66 | |
Ratios (%) (to average net assets)
and Supplemental data: | | | | | | | | | | | | | | | | | | | | |
Expenses (f) | | | 1.09 | | | | 1.10 | | | | 1.09 | | | | 1.08 | | | | 1.11 | |
Net investment income | | | 1.33 | | | | 1.73 | | | | 1.62 | | | | 1.16 | | | | 1.37 | |
Portfolio turnover | | | 34 | | | | 27 | | | | 44 | | | | 25 | | | | 26 | |
Net assets at end of period (000 omitted) | | | $232,425 | | | | $228,388 | | | | $165,519 | | | | $141,584 | | | | $141,334 | |
| (d) | Per share data is based on average shares outstanding. |
| (f) | Ratios do not reflect reductions from fees paid indirectly, if applicable. |
| (k) | The total return does not reflect expenses that apply to separate accounts. Inclusion of these charges would reduce the total return figures for all periods shown. |
| (s) | From time to time the fund may receive proceeds from litigation settlements, without which performance would be lower. |
See Notes to Financial Statements
13
MFS Value Portfolio
NOTES TO FINANCIAL STATEMENTS
| (1) | | Business and Organization |
MFS Value Portfolio (the fund) is a series of MFS Variable Insurance Trust II (the trust). The trust is organized as a Massachusetts business trust and is registered under the Investment Company Act of 1940, as amended, as an open-end management investment company. The shareholders of each series of the trust are separate accounts of insurance companies, which offer variable annuity and/or life insurance products, and qualified retirement and pension plans.
| (2) | | Significant Accounting Policies |
General – The preparation of financial statements in conformity with U.S. generally accepted accounting principles requires management to make estimates and assumptions that affect the reported amounts of assets and liabilities, and disclosure of contingent assets and liabilities at the date of the financial statements and the reported amounts of revenues and expenses during the reporting period. Actual results could differ from those estimates. In the preparation of these financial statements, management has evaluated subsequent events occurring after the date of the fund’s Statement of Assets and Liabilities through the date that the financial statements were issued. The fund invests in foreign securities. Investments in foreign securities are vulnerable to the effects of changes in the relative values of the local currency and the U.S. dollar and to the effects of changes in each country’s legal, political, and economic environment.
Investment Valuations – Equity securities, including restricted equity securities, are generally valued at the last sale or official closing price as provided by a third-party pricing service on the market or exchange on which they are primarily traded. Equity securities, for which there were no sales reported that day, are generally valued at the last quoted daily bid quotation as provided by a third-party pricing service on the market or exchange on which such securities are primarily traded. Equity securities held short, for which there were no sales reported for that day, are generally valued at the last quoted daily ask quotation as provided by a third-party pricing service on the market or exchange on which such securities are primarily traded. Short-term instruments with a maturity at issuance of 60 days or less generally are valued at amortized cost, which approximates market value. Open-end investment companies are generally valued at net asset value per share. Securities and other assets generally valued on the basis of information from a third-party pricing service may also be valued at a broker/dealer bid quotation. Values obtained from third-party pricing services can utilize both transaction data and market information such as yield, quality, coupon rate, maturity, type of issue, trading characteristics, and other market data. The values of foreign securities and other assets and liabilities expressed in foreign currencies are converted to U.S. dollars using the mean of bid and asked prices for rates provided by a third-party pricing service.
The Board of Trustees has delegated primary responsibility for determining or causing to be determined the value of the fund’s investments (including any fair valuation) to the adviser pursuant to valuation policies and procedures approved by the Board. If the adviser determines that reliable market quotations are not readily available, investments are valued at fair value as determined in good faith by the adviser in accordance with such procedures under the oversight of the Board of Trustees. Under the fund’s valuation policies and procedures, market quotations are not considered to be readily available for most types of debt instruments and floating rate loans and many types of derivatives. These investments are generally valued at fair value based on information from third-party pricing services. In addition, investments may be valued at fair value if the adviser determines that an investment’s value has been materially effected by events occurring after the close of the exchange or market on which the investment is principally traded (such as foreign exchange or market) and prior to the determination of the fund’s net asset value, or after the halting of trading of a specific security where trading does not resume prior to the close of the exchange or market on which the security is principally traded. Events that occur on a frequent basis after foreign markets close (such as developments in foreign markets and significant movements in the U.S. markets) and prior to the determination of the fund’s net asset value may be deemed to have a material effect on the value of securities traded in foreign markets. Accordingly, the fund’s foreign equity securities may often be valued at fair value. The adviser generally relies on third-party pricing services or other information (such as the correlation with price movements of similar securities in the same or other markets; the type, cost and investment characteristics of the security; the business and financial condition of the issuer; and trading and other market data) to assist in determining whether to fair value and at what value to fair value an investment. The value of an investment for purposes of calculating the fund’s net asset value can differ depending on the source and method used to determine value. When fair valuation is used, the value of an investment used to determine the fund’s net asset value may differ from quoted or published prices for the same investment. There can be no assurance that the fund could obtain the fair value assigned to an investment if it were to sell the investment at the same time at which the fund determines its net asset value per share.
Various inputs are used in determining the value of the fund’s assets or liabilities. These inputs are categorized into three broad levels. In certain cases, the inputs used to measure fair value may fall into different levels of the fair value hierarchy. In such cases, an investment’s level within the fair value hierarchy is based on the lowest level of input that is significant to the fair value measurement. The fund’s assessment of the significance of a particular input to the fair value measurement in its entirety
14
MFS Value Portfolio
Notes to Financial Statements – continued
requires judgment, and considers factors specific to the investment. Level 1 includes unadjusted quoted prices in active markets for identical assets or liabilities. Level 2 includes other significant observable market-based inputs (including quoted prices for similar securities, interest rates, prepayment speed, and credit risk). Level 3 includes unobservable inputs, which may include the adviser’s own assumptions in determining the fair value of investments. The following is a summary of the levels used as of December 31, 2010 in valuing the fund’s assets or liabilities:
| | | | | | | | | | | | | | | | |
| Investments at Value | | Level 1 | | | Level 2 | | | Level 3 | | | Total | |
| Equity Securities | | | $525,773,614 | | | | $— | | | | $— | | | | $525,773,614 | |
| Mutual Funds | | | 4,137,996 | | | | — | | | | — | | | | 4,137,996 | |
| Total Investments | | | $529,911,610 | | | | $— | | | | $— | | | | $529,911,610 | |
For further information regarding security characteristics, see the Portfolio of Investments.
Foreign Currency Translation – Purchases and sales of foreign investments, income, and expenses are converted into U.S. dollars based upon currency exchange rates prevailing on the respective dates of such transactions or on the reporting date for foreign denominated receivables and payables. Gains and losses attributable to foreign currency exchange rates on sales of securities are recorded for financial statement purposes as net realized gains and losses on investments. Gains and losses attributable to foreign exchange rate movements on receivables, payables, income and expenses are recorded for financial statement purposes as foreign currency transaction gains and losses. That portion of both realized and unrealized gains and losses on investments that results from fluctuations in foreign currency exchange rates is not separately disclosed.
Security Loans – State Street Bank and Trust Company (“State Street”), as lending agent, loans the securities of the fund to certain qualified institutions (the “Borrowers”) approved by the fund. The loans are collateralized by cash and/or U.S. Treasury and federal agency obligations in an amount typically at least equal to the market value of the securities loaned. The market value of the loaned securities is determined at the close of business of the fund and any additional required collateral is delivered to the fund on the next business day. State Street provides the fund with indemnification against Borrower default. The fund bears the risk of loss with respect to the investment of cash collateral. On loans collateralized by cash, the cash collateral is invested in a money market fund or short-term securities. A portion of the income generated upon investment of the collateral is remitted to the Borrowers, and the remainder is allocated between the fund and the lending agent. On loans collateralized by U.S. Treasury and/or federal agency obligations, a fee is received from the Borrower, and is allocated between the fund and the lending agent. Income from securities lending is included in interest income on the Statement of Operations. The dividend and interest income earned on the securities loaned is accounted for in the same manner as other dividend and interest income.
Indemnifications – Under the fund’s organizational documents, its officers and Trustees may be indemnified against certain liabilities and expenses arising out of the performance of their duties to the fund. Additionally, in the normal course of business, the fund enters into agreements with service providers that may contain indemnification clauses. The fund’s maximum exposure under these agreements is unknown as this would involve future claims that may be made against the fund that have not yet occurred.
Investment Transactions and Income – Investment transactions are recorded on the trade date. Interest income is recorded on the accrual basis. Dividends received in cash are recorded on the ex-dividend date. Certain dividends from foreign securities will be recorded when the fund is informed of the dividend if such information is obtained subsequent to the ex-dividend date. Dividend and interest payments received in additional securities are recorded on the ex-dividend or ex-interest date in an amount equal to the value of the security on such date.
The fund may receive proceeds from litigation settlements. Any proceeds received from litigation involving portfolio holdings are reflected in the Statement of Operations in realized gain/loss if the security has been disposed of by the fund or in unrealized gain/loss if the security is still held by the fund. Any other proceeds from litigation not related to portfolio holdings are reflected as other income in the Statement of Operations.
Fees Paid Indirectly – The fund’s custody fee may be reduced according to an arrangement that measures the value of cash deposited with the custodian by the fund. This amount, for the year ended December 31, 2010, is shown as a reduction of total expenses on the Statement of Operations.
Tax Matters and Distributions – The fund intends to qualify as a regulated investment company, as defined under Subchapter M of the Internal Revenue Code, and to distribute all of its taxable income, including realized capital gains. As a result, no provision for federal income tax is required. The fund’s federal tax returns for the prior three fiscal years remain subject to examination by the Internal Revenue Service. Foreign taxes, if any, have been accrued by the fund in the accompanying financial statements.
15
MFS Value Portfolio
Notes to Financial Statements – continued
Distributions to shareholders are recorded on the ex-dividend date. Income and capital gain distributions are determined in accordance with income tax regulations, which may differ from U.S. generally accepted accounting principles. Certain capital accounts in the financial statements are periodically adjusted for permanent differences in order to reflect their tax character. These adjustments have no impact on net assets or net asset value per share. Temporary differences which arise from recognizing certain items of income, expense, gain or loss in different periods for financial statement and tax purposes will reverse at some time in the future. Distributions in excess of net investment income or net realized gains are temporary overdistributions for financial statement purposes resulting from differences in the recognition or classification of income or distributions for financial statement and tax purposes.
Book/tax differences primarily relate to wash sale loss deferrals.
The tax character of distributions declared to shareholders for the last two fiscal years is as follows:
| | | | | | | | |
| | | 12/31/10 | | | 12/31/09 | |
| Ordinary income (including any short-term capital gains) | | | $6,932,160 | | | | $5,894,567 | |
The federal tax cost and the tax basis components of distributable earnings were as follows:
| | | | |
| As of 12/31/10 | | | | |
| Cost of investments | | | $485,549,132 | |
| Gross appreciation | | | 61,648,555 | |
| Gross depreciation | | | (17,286,077 | ) |
| Net unrealized appreciation (depreciation) | | | $44,362,478 | |
| Undistributed ordinary income | | | 9,457,518 | |
| Undistributed long-term capital gain | | | 33,776,193 | |
| Capital loss carryforwards | | | (5,844,924 | ) |
| Other temporary differences | | | 4,578 | |
As of December 31, 2010, the fund had capital loss carryforwards available to offset future realized gains. Such losses expire as follows:
| | | | |
| 12/31/15 | | | $(5,469,246 | ) |
| 12/31/16 | | | (375,678 | ) |
| Total | | | $(5,844,924 | ) |
The availability of a portion of the capital loss carryforwards, which were acquired on June 26, 2009 in connection with the MFS Strategic Value Portfolio merger and on December 4, 2009 in connection with the MFS Mid Cap Value Portfolio merger, may be limited in a given year.
Multiple Classes of Shares of Beneficial Interest – The fund offers multiple classes of shares, which differ in their respective distribution and/or service fees. The fund’s income, realized and unrealized gain (loss), and common expenses are allocated to shareholders based on the daily net assets of each class. Dividends are declared separately for each class. Differences in per share dividend rates are generally due to differences in separate class expenses. The fund’s distributions declared to shareholders as reported on the Statements of Changes in Net Assets are presented by class as follows:
| | | | | | | | |
| | | From net investment
income | |
| | | Year ended
12/31/10 | | | Year ended
12/31/09 | |
| Initial Class | | | $4,231,627 | | | | $2,944,412 | |
| Service Class | | | 2,700,533 | | | | 2,950,155 | |
| Total | | | $6,932,160 | | | | $5,894,567 | |
| (3) | | Transactions with Affiliates |
Investment Adviser – The fund has an investment advisory agreement with MFS to provide overall investment management and related administrative services and facilities to the fund. The management fee is computed daily and paid monthly at the following annual rates:
| | | | |
| First $1 billion of average daily net assets | | | 0.75% | |
| Average daily net assets in excess of $1 billion | | | 0.65% | |
The management fee incurred for the year ended December 31, 2010 was equivalent to an annual effective rate of 0.75% of the fund’s average daily net assets.
16
MFS Value Portfolio
Notes to Financial Statements – continued
The investment adviser has agreed in writing to pay a portion of the fund’s total annual operating expenses, exclusive of interest, taxes, extraordinary expenses, brokerage and transaction costs and investment-related expenses, such that total annual operating expenses do not exceed 0.90% of average daily net assets for the Initial Class shares and 1.15% of average daily net assets for the Service Class shares. This written agreement will continue until April 30, 2012. For the year ended December 31, 2010, the fund’s actual operating expenses did not exceed the limit and therefore, the investment adviser did not pay any portion of the fund’s expenses.
Distributor – MFS Fund Distributors, Inc. (MFD), a wholly-owned subsidiary of MFS, is the distributor of shares of the fund. The Trustees have adopted a distribution plan for the Service Class shares pursuant to Rule 12b-1 under the Investment Company Act of 1940.
The fund’s distribution plan provides that the fund will pay MFD distribution and/or service fees equal to 0.25% per annum of its average daily net assets attributable to Service Class shares as partial consideration for services performed and expenses incurred by MFD and financial intermediaries (including participating insurance companies that invest in the fund to fund variable annuity and variable life insurance contracts, sponsors of qualified retirement and pension plans that invest in the fund, and affiliates of these participating insurance companies and plan sponsors) in connection with the sale and distribution of the Service Class shares. MFD may subsequently pay all, or a portion, of the distribution and/or service fees to financial intermediaries.
Shareholder Servicing Agent – MFS Service Center, Inc. (MFSC), a wholly-owned subsidiary of MFS, has contracted to provide transfer agent and recordkeeping functions in connection with the issuance, transfer, and redemption of each class of shares of the fund under a Shareholder Servicing Agent Agreement. During the year ended December 31, 2010, the fund did not pay MFSC a fee for this service.
Administrator – MFS provides certain financial, legal, shareholder communications, compliance, and other administrative services to the fund. Under an administrative services agreement, the fund partially reimburses MFS the costs incurred to provide these services. The fund is charged an annual fixed amount of $10,000 plus a fee based on average daily net assets. The administrative services fee incurred for the year ended December 31, 2010 was equivalent to an annual effective rate of 0.0350% of the fund’s average daily net assets.
Trustees’ and Officers’ Compensation – The fund pays compensation to Trustees in the form of a retainer, attendance fees, and additional compensation to the Board chairperson. The fund does not pay compensation directly to officers of the fund who are also officers of the investment adviser, all of whom receive remuneration for their services to the fund from MFS. Certain officers of the fund are officers or directors of MFS, MFD, and MFSC.
Other – This fund and certain other funds managed by MFS (the funds) have entered into services agreements (the Agreements) which provide for payment of fees by the funds to Tarantino LLC and Griffin Compliance LLC in return for the provision of services of an Independent Chief Compliance Officer (ICCO) and Assistant ICCO, respectively, for the funds. The ICCO and Assistant ICCO are officers of the funds and the sole members of Tarantino LLC and Griffin Compliance LLC, respectively. The funds can terminate the Agreements with Tarantino LLC and Griffin Compliance LLC at any time under the terms of the Agreements. MFS has agreed to bear all expenses associated with office space, other administrative support, and supplies provided to the ICCO and Assistant ICCO. For the year ended December 31, 2010, the aggregate fees paid by the fund to Tarantino LLC and Griffin Compliance LLC were $9,100 and are included in miscellaneous expense on the Statement of Operations.
The fund invests in the MFS Institutional Money Market Portfolio which is managed by MFS and seeks a high level of current income consistent with preservation of capital and liquidity. Income earned on this investment is included in dividends from underlying funds on the Statement of Operations. This money market fund does not pay a management fee to MFS.
Purchases and sales of investments, other than U.S. Government securities, purchased option transactions, and short-term obligations, aggregated $178,950,245 and $193,925,551, respectively.
17
MFS Value Portfolio
Notes to Financial Statements – continued
| (5) | | Shares of Beneficial Interest |
The fund’s Declaration of Trust permits the Trustees to issue an unlimited number of full and fractional shares of beneficial interest. Transactions in fund shares were as follows:
| | | | | | | | | | | | | | | | |
| | | Year ended 12/31/10 | | | Year ended 12/31/09 | |
| | | Shares | | | Amount | | | Shares | | | Amount | |
| Shares sold | | | | | | | | | | | | | | | | |
Initial Class | | | 7,430,622 | | | | $93,805,921 | | | | 9,685,135 | | | | $106,694,744 | |
Service Class | | | 1,125,101 | | | | 13,970,482 | | | | 3,247,251 | | | | 31,552,403 | |
| | | 8,555,723 | | | | $107,776,403 | | | | 12,932,386 | | | | $138,247,147 | |
| Shares issued in connection with acquisition of MFS Strategic Value Portfolio | | | | | | | | | | | | | | | | |
Initial Class | | | | | | | | | | | 6,041 | | | | $64,532 | |
Service Class | | | | | | | | | | | 228,743 | | | | 2,426,959 | |
| | | | | | | | | | | 234,784 | | | | $2,491,491 | |
| Shares issued in connection with acquisition of MFS Mid Cap Value Portfolio | | | | | | | | | | | | | | | | |
Initial Class | | | | | | | | | | | — | | | | $— | |
Service Class | | | | | | | | | | | 969,447 | | | | 12,059,916 | |
| | | | | | | | | | | 969,447 | | | | $12,059,916 | |
| Shares issued to shareholders in reinvestment of distributions | | | | | | | | | | | | | | | | |
Initial Class | | | 314,619 | | | | $4,231,627 | | | | 301,373 | | | | $2,944,412 | |
Service Class | | | 202,287 | | | | 2,700,533 | | | | 304,140 | | | | 2,950,155 | |
| | | 516,906 | | | | $6,932,160 | | | | 605,513 | | | | $5,894,567 | |
| Shares reacquired | | | | | | | | | | | | | | | | |
Initial Class | | | (7,467,590 | ) | | | $(97,638,535 | ) | | | (2,446,952 | ) | | | $(25,925,344 | ) |
Service Class | | | (2,685,686 | ) | | | (34,261,566 | ) | | | (2,133,996 | ) | | | (23,103,811 | ) |
| | | (10,153,276 | ) | | | $(131,900,101 | ) | | | (4,580,948 | ) | | | $(49,029,155 | ) |
| Net change | | | | | | | | | | | | | | | | |
Initial Class | | | 277,651 | | | | $399,013 | | | | 7,545,597 | | | | $83,778,344 | |
Service Class | | | (1,358,298 | ) | | | (17,590,551 | )�� | | | 2,615,585 | | | | 25,885,622 | |
| | | (1,080,647 | ) | | | $(17,191,538 | ) | | | 10,161,182 | | | | $109,663,966 | |
The fund and certain other funds managed by MFS participate in a $1.1 billion unsecured committed line of credit, subject to a $1 billion sublimit, provided by a syndication of banks under a credit agreement. Borrowings may be made for temporary financing needs. Interest is charged to each fund, based on its borrowings, generally at a rate equal to the higher of the Federal Reserve funds rate or one month LIBOR plus an agreed upon spread. A commitment fee, based on the average daily, unused portion of the committed line of credit, is allocated among the participating funds at the end of each calendar quarter. In addition, the fund and other funds managed by MFS have established unsecured uncommitted borrowing arrangements with certain banks for temporary financing needs. Interest is charged to each fund, based on its borrowings, at a rate equal to the Federal Reserve funds rate plus an agreed upon spread. For the year ended December 31, 2010, the fund’s commitment fee and interest expense were $5,980 and $2,248, respectively, and are included in miscellaneous expense on the Statement of Operations.
| (7) | | Transactions in Underlying Funds – Affiliated Issuers |
An affiliated issuer may be considered one in which the fund owns 5% or more of the outstanding voting securities, or a company which is under common control. For the purposes of this report, the fund assumes the following to be affiliated issuers:
| | | | | | | | | | | | | | | | |
| Underlying Funds | | Beginning
Shares/Par
Amount | | | Acquisitions
Shares/Par
Amount | | | Dispositions
Shares/Par
Amount | | | Ending
Shares/Par
Amount | |
| MFS Institutional Money Market Portfolio | | | 9,025,795 | | | | 101,308,239 | | | | (106,196,038 | ) | | | 4,137,996 | |
| | | | |
| Underlying Funds | | Realized
Gain (Loss) | | | Capital Gain
Distributions | | | Dividend
Income | | | Ending
Value | |
| MFS Institutional Money Market Portfolio | | | $— | | | | $— | | | | $13,023 | | | | $4,137,996 | |
18
MFS Value Portfolio
Notes to Financial Statements – continued
At close of business on June 26, 2009, the fund with net assets of $355,099,729, acquired all of the assets and liabilities of MFS Strategic Value Portfolio. The purpose of the transaction was to provide shareholders of the MFS Strategic Value Portfolio the opportunity to participate in a larger combined portfolio with an identical investment objective and similar investment policies and strategies. The acquisition was accomplished by a tax-free exchange of 234,784 shares of the fund (valued at $2,491,491) for all of the assets and liabilities of MFS Strategic Value Portfolio. MFS Strategic Value Portfolio then distributed the shares of the fund that MFS Strategic Value Portfolio received from the fund to its shareholders. MFS Strategic Value Portfolio’s net assets on that date were $2,491,491, including investments valued at $2,465,078 with a cost basis of $2,663,205. For financial reporting purposes, assets received and shares issued by the fund were recorded at fair value; however, the cost basis of the investments received from MFS Strategic Value Portfolio were carried forward to align ongoing reporting of the fund’s realized and unrealized gains and losses with amounts distributable to shareholders for tax purposes. No pro forma information is provided as it is not material to the combined fund results.
At close of business on December 4, 2009, the fund with net assets valued at $470,376,146, acquired all of the assets and liabilities of MFS Mid Cap Value Portfolio. The purpose of the transaction was to provide shareholders of the MFS Mid Cap Value Portfolio the opportunity to participate in a larger combined portfolio with an identical investment objective and similar investment strategies and policies. The acquisition was accomplished by a tax-free exchange of 969,447 shares of the fund (valued at $12,059,916) for all of the assets and liabilities of MFS Mid Cap Value Portfolio. MFS Mid Cap Value Portfolio then distributed the shares of the fund that MFS Mid Cap Value Portfolio received from the fund to its shareholders. MFS Mid Cap Value Portfolio’s net assets on that date were $12,059,916, including investments valued at $12,330,572 with a cost basis of $11,960,655. For financial reporting purposes, assets received and shares issued by the fund were recorded at fair value; however, the cost basis of the investments received from MFS Mid Cap Value Portfolio were carried forward to align ongoing reporting of the fund’s realized and unrealized gains and losses with amounts distributable to shareholders for tax purposes. No pro forma information is provided as it is not material to the combined fund results.
19
MFS Value Portfolio
REPORT OF INDEPENDENT REGISTERED PUBLIC ACCOUNTING FIRM
To the Board of Trustees of MFS Variable Insurance Trust II and the Shareholders of
MFS Value Portfolio:
We have audited the accompanying statement of assets and liabilities, including the portfolio of investments, of MFS Value Portfolio (the “Fund”) (one of the portfolios comprising MFS Variable Insurance Trust II) as of December 31, 2010, and the related statement of operations for the year then ended, the statements of changes in net assets for each of the two years in the period then ended, and the financial highlights for each of the five years in the period then ended. These financial statements and financial highlights are the responsibility of the Fund’s management. Our responsibility is to express an opinion on these financial statements and financial highlights based on our audits.
We conducted our audits in accordance with the standards of the Public Company Accounting Oversight Board (United States). Those standards require that we plan and perform the audit to obtain reasonable assurance about whether the financial statements and financial highlights are free of material misstatement. The Fund is not required to have, nor were we engaged to perform, an audit of its internal control over financial reporting. Our audits included consideration of internal control over financial reporting as a basis for designing audit procedures that are appropriate in the circumstances, but not for the purpose of expressing an opinion on the effectiveness of the Fund’s internal control over financial reporting. Accordingly, we express no such opinion. An audit also includes examining, on a test basis, evidence supporting the amounts and disclosures in the financial statements, assessing the accounting principles used and significant estimates made by management, as well as evaluating the overall financial statement presentation. Our procedures included confirmation of securities owned as of December 31, 2010, by correspondence with the custodian. We believe that our audits provide a reasonable basis for our opinion.
In our opinion, the financial statements and financial highlights referred to above present fairly, in all material respects, the financial position of MFS Value Portfolio as of December 31, 2010, the results of its operations for the year then ended, the changes in its net assets for each of the two years in the period then ended, and the financial highlights for each of the five years in the period then ended, in conformity with accounting principles generally accepted in the United States of America.
DELOITTE & TOUCHE LLP
Boston, Massachusetts
February 14, 2011
20
MFS Value Portfolio
TRUSTEES AND OFFICERS – IDENTIFICATION AND BACKGROUND
The Trustees and officers of the Trust, as of February 1, 2011, are listed below, together with their principal occupations during the past five years. (Their titles may have varied during that period.) The address of each Trustee and officer is 500 Boylston Street, Boston, Massachusetts 02116.
| | | | | | |
Name, Date of Birth | | Position(s) Held
with Fund | | Trustee/Officer
Since (1) | | Principal Occupations During the Past Five Years and
Other Directorships (2) |
| INTERESTED TRUSTEE | | | | |
David D. Horn (3) (born 6/07/41) | | Trustee | | April 1986 | | Private investor; Sun Life Assurance Company of Canada, Senior Vice President and General Manager for the United States (until 1997); Director (until March 2004) |
| | |
| INDEPENDENT TRUSTEES | | | | |
J. Kermit Birchfield (born 1/08/40) | | Chairman | | May 1997 | | Consultant; Century Partners, Inc. (investments), Director; Displaytech, Inc. (technology), Chairman; Dessin Fournir LLC (furniture manufacturer), Director; Site Watch LLC (software to monitor oil tanks), Managing Director (2006 to present); Juridica Investments (fund investing in judicial matters), Director (2007 to present), Immuno Science, Inc. (medical research), Independent Director (2009 to present), Intermountain Industries, Inc. (oil & gas exploration and production), Director (until February 2009) |
| | | |
Robert C. Bishop (born 1/13/43) | | Trustee | | May 2001 | | AutoImmune, Inc. (pharmaceutical product development), Chairman, President and Chief Executive Officer; Caliper Life Sciences Corp. (laboratory analytical instruments), Chairman; Optobionics Corporation (ophthalmic devices), Director (until 2007); Millipore Corporation (purification/filtration products), Director (until July 2010); Waterstreet Capital (leverage buyouts), Advisory Board (until August 2010) |
| | | |
Frederick H. Dulles (born 3/12/42) | | Trustee | | May 2001 | | Dulles International Law LLC (law firm), Senior Lawyer (since 2009); Juridica Capital Management (US) Inc. (litigation financing), Vice President and General Counsel (since 2009); Dulles Properties LLC (real estate), Broker (since 2008); The Citadel School of Business Administration (education), Adjunct Professor (since 2003); Disher, Hamrick & Myers Residential, Inc. (real estate), Broker (until 2006); Frederick H. Dulles Law Practice (law firm), (until 2006); Charlestown School of Law (education), Adjunct Professor (until 2007); Prudential Carolina Real Estate, (real estate), Broker (until 2008); Free Enterprise Foundation Inc. (research institute), Director & Secretary (until 2008); Ten State International Law PLLP (law firm), Of Counsel (until 2009) |
| | | |
Marcia A. Kean (born 6/30/48) | | Trustee | | April 2005 | | Feinstein Kean Healthcare (consulting), Chief Executive Officer |
| | | |
Ronald G. Steinhart (born 6/15/40) | | Trustee | | May 2001 | | Private investor; Penske Automotive Group (automotive retailer), Director; Animal Health International, Inc. (animal health products), Director (since 2007); Texas Industries (concrete/aggregates/cement), Director (since 2007); Susser Holdings Corporation (retail convenience stores and distributor of wholesale motor fuel), Director (since 2009); Prentiss Properties Trust (real estate investment trust), Director (until 2006); Penson Worldwide, Inc. (securities clearance), Director (until 2008) |
| | | |
Haviland Wright (born 7/21/48) | | Trustee | | May 2001 | | X-Change Corp. (multi-media web services), Director (since 2010); Nano Loa Inc. (liquid crystal displays), Director (until 2009); Profitability of Hawaii (software), Chief Development Officer (until 2010); Elixir Technologies Corporation (software), Director (until 2010) |
| | | |
| OFFICERS | | | | | | |
Maria F. DiOrioDwyer (4)
(born 12/01/58) | | President | | November 2005 | | Massachusetts Financial Services Company, Executive Vice President and Chief Regulatory Officer; Chief Compliance Officer (since December 2006) |
| | | |
| Christopher R. Bohane (4) (born 1/18/74) | | Assistant Secretary and Assistant Clerk | | July 2005 | | Massachusetts Financial Services Company, Vice President and Senior Counsel |
| | | |
John M. Corcoran (4) (born 4/13/65) | | Treasurer | | October 2008 | | Massachusetts Financial Services Company, Senior Vice President (since October 2008); State Street Bank and Trust (financial services provider), Senior Vice President, (until September 2008) |
| | | |
Ethan D. Corey (4) (born 11/21/63) | | Assistant Secretary and Assistant Clerk | | July 2005 | | Massachusetts Financial Services Company, Senior Vice President and Associate General Counsel |
| | | |
David L. DiLorenzo (4) (born 8/10/68) | | Assistant Treasurer | | July 2005 | | Massachusetts Financial Services Company, Vice President |
| | | |
Timothy M. Fagan (4) (born 7/10/68) | | Assistant Secretary and Assistant Clerk | | September 2005 | | Massachusetts Financial Services Company, Vice President and Senior Counsel |
| | | |
Mark D. Fischer (4) (born 10/27/70) | | Assistant Treasurer | | July 2005 | | Massachusetts Financial Services Company, Vice President |
21
MFS Value Portfolio
Trustees and Officers – continued
| | | | | | |
Name, Date of Birth | | Position(s) Held
with Fund | | Trustee/Officer
Since (1) | | Principal Occupations During the Past Five Years and
Other Directorships (2) |
Robyn L. Griffin (born 7/04/75) | | Assistant Independent Chief Compliance Officer | | August 2008 | | Griffin Compliance LLC (provider of compliance services), Principal (since August 2008); State Street Corporation (financial services provider), Mutual Fund Administration Assistant Vice President (October 2006 – July 2008); Liberty Mutual Group (insurance), Personal Market Assistant Controller (April 2006 – October 2006); Deloitte & Touche LLP (professional services firm), Senior Manager (prior to April 2006) |
| | | |
Brian E. Langenfeld (4) (born 3/07/73) | | Assistant Secretary and Assistant Clerk | | May 2006 | | Massachusetts Financial Services Company, Vice President and Senior Counsel (since May 2006); John Hancock Advisers, LLC, Assistant Vice President and Counsel (until April 2006) |
| | | |
Ellen Moynihan (4) (born 11/13/57) | | Assistant Treasurer | | May 1997 | | Massachusetts Financial Services Company, Senior Vice President |
| | | |
Susan S. Newton (4) (born 3/07/50) | | Assistant Secretary and Assistant Clerk | | May 2005 | | Massachusetts Financial Services Company, Senior Vice President and Associate General Counsel |
| | | |
Susan A. Pereira (4)
(born 11/05/70) | | Assistant Secretary and Assistant Clerk | | July 2005 | | Massachusetts Financial Services Company, Vice President and Senior Counsel |
| | | |
Mark N. Polebaum (4) (born 5/01/52) | | Secretary and Clerk | | February 2006 | | Massachusetts Financial Services Company, Executive Vice President, General Counsel and Secretary (since January 2006); Wilmer Cutler Pickering Hale and Dorr LLP (law firm), Partner (until January 2006) |
| | | |
Frank L. Tarantino (born 3/07/44) | | Independent Chief Compliance Officer | | September 2004 | | Tarantino LLC (provider of compliance services), Principal |
| | | |
Richard S. Weitzel (4) (born 7/16/70) | | Assistant Secretary and Assistant Clerk | | October 2007 | | Massachusetts Financial Services Company, Vice President and Assistant General Counsel |
| | | |
James O. Yost (4) (born 6/12/60) | | Assistant Treasurer | | April 1992 | | Massachusetts Financial Services Company, Senior Vice President |
| (1) | Date first appointed to serve as Trustee/Officer of an MFS fund or a Compass variable account. Each Trustee has served continuously since appointment. For the period March 2008 until October 2008, Ms. DiOrioDwyer served as Treasurer of the Funds. |
| (2) | Directorships or trusteeships of companies required to report to the Securities and Exchange Commission (i.e., “public companies”). |
| (3) | “Interested person” of the Trust, within the meaning of the Investment Company Act of 1940 (referred to as the 1940 Act), which is the principal federal law governing investment companies like the Trust, as a result of position with Sun Life of Canada (U.S.). The address of Sun Life of Canada (U.S.) is One Sun Life Executive Park, Wellesley Hills, Massachusetts 02481. |
| (4) | “Interested person” of MFS within the meaning of the 1940 Act. The address of MFS is 500 Boylston Street, Boston, Massachusetts 02116. |
The Trust does not hold annual meetings for the purpose of electing Trustees, and Trustees are not elected for fixed terms. Each Trustee and officer holds office until his or her successor is chosen and qualified, or until his or her earlier death, resignation, retirement or removal.
All Trustees currently serve as Trustees of the Trust and have served in that capacity since originally elected or appointed. All of the Trustees are also Managers of the Compass Variable Accounts. The executive officers of the Trust hold similar offices for the Compass Variable Accounts and other funds in the MFS fund complex. As of January 1, 2011, each Trustee serves as a Trustee or Manager of 31 Accounts/Portfolios.
22
MFS Value Portfolio
Trustees and Officers – continued
The Statement of Additional Information contains further information about the Trustees and is available without charge upon request by calling 1-800-752-7215.
| | |
Investment Adviser
Massachusetts Financial Services Company 500 Boylston Street, Boston, MA 02116-3741 | | Custodian State Street Bank and Trust 1 Lincoln Street, Boston, MA 02111-2900 |
Distributor
MFS Fund Distributors, Inc. 500 Boylston Street, Boston, MA 02116-3741 | | Independent Registered Public Accounting Firm Deloitte & Touche LLP 200 Berkeley Street, Boston, MA 02116 |
Portfolio Managers Nevin Chitkara Steven Gorham | | |
23
MFS Value Portfolio
BOARD REVIEW OF INVESTMENT ADVISORY AGREEMENT
The Investment Company Act of 1940 requires that both the full Board of Trustees and a majority of the non-interested (“independent”) Trustees, voting separately, annually approve the continuation of the investment advisory agreement between MFS Variable Insurance Trust II (the “Trust”) and Massachusetts Financial Services Company (“MFS”) on behalf of the Fund. The Trustees consider matters bearing on the Fund and the advisory arrangement at their meetings throughout the year, including a review of performance data at each regular meeting. In addition, the independent Trustees met in person in May and again in July 2010 (“contract review meetings”) for the specific purpose of considering whether to approve the continuation of the investment advisory agreement for the Fund. The independent Trustees were assisted in their evaluation of the investment advisory agreement by independent legal counsel, from whom they received separate legal advice and with whom they met separately from MFS management during various contract review meetings. The independent Trustees were also assisted in this process by the Fund’s Independent Chief Compliance Officer, a full-time senior officer appointed by and reporting to the independent Trustees.
In connection with their deliberations, the Trustees, including the independent Trustees, considered such information and factors as they believed, in light of the legal advice furnished to them and their own business judgment, to be relevant. The investment advisory agreement was considered separately for the Fund, although the Trustees also took into account the common interests of all Funds in the Trust in their review. As described below, the Trustees considered the nature, quality, and extent of the various investment advisory, administrative, and shareholder services performed by MFS under the existing investment advisory agreement and other arrangements with the Trust.
In connection with their contract review meetings, the Trustees received and relied upon materials which included, among other items: (i) information provided by Lipper Inc. (“Lipper”) on the investment performance of the Fund for various time periods ended December 31, 2009, compared to the investment performance of a group of funds with substantially similar investment classifications/objectives (the “Lipper performance universe”), (ii) information provided by Lipper on the Fund’s advisory fees and other expenses compared to the advisory fees and other expenses of comparable funds identified by Lipper (the “Lipper expense group”), (iii) information provided by MFS on the advisory fees of comparable portfolios of its other clients, including institutional separate account and other clients, (iv) information as to whether, and to what extent applicable, expense waivers, reimbursements or fee “breakpoints” are observed for the Fund, (v) information regarding MFS’ financial results and financial condition, including MFS’ and certain of its affiliates’ estimated profitability from services performed for the Fund, (vi) MFS’ views regarding the outlook for the mutual fund industry and its strategic business plans, (vii) descriptions of various functions performed by MFS for the Trust, such as compliance monitoring and portfolio trading practices, and (viii) information regarding the overall organization of MFS, including information about MFS’ senior management and other personnel providing investment advisory, administrative and other services to the Fund. The comparative performance, fee and expense information prepared and provided by Lipper was not independently verified, and the independent Trustees did not independently verify any information provided to them by MFS.
The Trustees’ conclusion as to the continuation of the investment advisory agreement was based on comprehensive consideration of all information provided to the Trustees and was not the result of any single factor. Some of the factors that figured particularly in the Trustees’ deliberations are described below for the Fund, while individual Trustees may have given different weight to various factors and evaluated the information presented as a whole differently than another individual Trustee. The Trustees recognized that the fee arrangements for the Fund reflect years of review and discussion between the independent Trustees and MFS, that certain aspects of such arrangements may receive greater scrutiny in some years than others, and that the Trustees’ conclusions may be based, in part, on their consideration of these same arrangements during the course of the year and in prior years.
Based on information provided by Lipper, the Trustees compared the Fund’s total return investment performance to the performance of the Lipper performance universe over various time periods. The Trustees placed particular emphasis on the total return performance of the Fund’s Initial Class shares in comparison to the performance of funds in its Lipper performance universe over the one-, three- and five-year periods ended December 31, 2009. The Trustees did not rely on performance results for more recent periods, including those shown elsewhere in this report.
The Trustees noted the performance of the Fund’s Initial Class shares was in the 4th quintile relative to the other funds in the Lipper performance universe for the one-year period (the 1st quintile being the best performers and the 5th quintile being the worst performers). The total return performance of the Fund was in the 1st quintile for the three-year and the five-year periods ended December 31, 2009, relative to the Lipper performance universe. Based on the nature and quality of services provided by MFS, the Board of Trustees concluded that the Fund’s performance was satisfactory.
24
MFS Value Portfolio
Board Review of Investment Advisory Agreement – continued
In the course of their deliberations, the Trustees took into account information provided by MFS during contract review meetings, as well as during investment review meetings conducted with portfolio management personnel during the course of the year.
In assessing the reasonableness of the Fund’s advisory fee, the Trustees considered, among other information, the Fund’s advisory fee and the total expense ratio of the Fund’s Initial Class shares as a percentage of average daily net assets, compared to the advisory fee and total expense ratios of its peer group of funds based on information provided by Lipper. The Trustees also considered the advisory fees charged by MFS to institutional accounts. In comparing these fees, the Trustees considered the generally broader scope of services provided by MFS to the Trust than those provided to institutional accounts. The Trustees also considered the higher demands placed on MFS’ investment personnel and trading infrastructure as a result of the daily cash in-flows and out-flows of the Fund, and the impact on MFS and related expenses due to the more extensive regulatory regime to which the Fund is subject, compared to institutional accounts.
In considering the fees, the Trustees noted from the Lipper data that the Fund’s effective advisory fee rate was above the median and total expense ratio was approximately at the median of such fees and expenses of funds in the Lipper expense group. In addition, the Trustees accepted MFS’ offer to continue the expense limitation for the Fund. The Trustees further concluded that the existing breakpoint was sufficient to allow the Fund to benefit from economies of scale as its assets grow. The Trustees concluded that the fees were reasonable in light of the nature and quality of services provided.
The Trustees also considered information prepared by MFS relating to its costs and profits with respect to the Fund and other investment companies and accounts advised by MFS, as well as MFS’ methodologies used to determine and allocate its costs to the Fund and other accounts and products for purposes of estimating profitability.
After reviewing these and other factors described below, the Trustees concluded that the advisory fees charged to the Fund represent reasonable compensation in light of the nature and quality of the services being provided by MFS.
In addition, the Trustees considered MFS’ resources and related efforts to continue to retain, attract and motivate capable personnel to serve the Fund. The Trustees also considered the financial resources of MFS and its parent, Sun Life Financial Inc. The Trustees further considered any advantages and possible disadvantages of having an adviser which also serves other investment companies as well as institutional accounts.
The Trustees also considered the nature, quality, cost, and extent of administrative, transfer agency, and distribution services provided to the Fund by MFS and its affiliates under agreements and plans other than the investment advisory agreement, including the 12b-1 fees the Fund pays to MFS Fund Distributors, Inc., an affiliate of MFS. The Trustees also considered the nature, extent and quality of certain other services MFS performs or arranges on the Fund’s behalf, which may include securities lending programs, directed expense payment programs, class action recovery programs, and MFS’ interaction with third-party service providers, principally custodians and sub-custodians. The Trustees concluded that the various non-advisory services provided by MFS and its affiliates on behalf of the Fund were satisfactory. The Trustees also considered the benefits to MFS from the use of the Fund’s portfolio brokerage commissions to pay for investment research and various other factors. Additionally, the Trustees considered so-called “fall-out benefits” to MFS such as reputational value derived from serving as investment manager to the Trust, and determined that any such benefits derived by MFS were reasonable and fair.
Based on their evaluation of factors that they deemed to be material, including those factors described above, the Board of Trustees, including a majority of the independent Trustees, concluded that the investment advisory agreement should be continued for an additional one-year period, commencing September 1, 2010.
A discussion regarding the Board’s most recent review and renewal of the fund’s Investment Advisory Agreement with MFS is available by clicking on the fund’s name under “Variable Insurance Portfolios — VIT II” in the “Products and Performance” section of the MFS Web site (mfs.com).
25
MFS Value Portfolio
PROXY VOTING POLICIES AND INFORMATION
A general description of the MFS funds’ proxy voting policies and procedures is available without charge, upon request, by calling
1-800-225-2606, by visiting the Proxy Voting section of mfs.com or by visiting the SEC’s Web site at http://www.sec.gov.
Information regarding how the fund voted proxies relating to portfolio securities during the most recent twelve-month period ended June 30 is available without charge by visiting the Proxy Voting section of mfs.com or by visiting the SEC’s Web site at http://www.sec.gov.
QUARTERLY PORTFOLIO DISCLOSURE
The fund will file a complete schedule of portfolio holdings with the Securities and Exchange Commission (the Commission) for the first and third quarters of each fiscal year on Form N-Q. The fund’s Form N-Q may be reviewed and copied at the:
Public Reference Room
Securities and Exchange Commission
100 F Street, NE, Room 1580
Washington, D.C. 20549
Information on the operation of the Public Reference Room may be obtained by calling the Commission at 1-800-SEC-0330. The fund’s Form N-Q is available on the EDGAR database on the Commission’s Internet Web site at http://www.sec.gov, and copies of this information may be obtained, upon payment of a duplicating fee, by electronic request at the following e-mail address: publicinfo@sec.gov or by writing the Public Reference Section at the above address.
FURTHER INFORMATION
From time to time, MFS may post important information about the fund or the MFS funds on the MFS web site (mfs.com). This information is available by visiting the “News & Commentary” section of mfs.com or by clicking on the fund’s name under “Variable Insurance Portfolios — VIT II” in the “Products and Performance” section of mfs.com.
FEDERAL TAX INFORMATION (unaudited)
The following information is provided pursuant to provisions of the Internal Revenue Code.
For corporate shareholders, 100% of the ordinary income dividends paid during the fiscal year qualify for the corporate dividends received deduction.
26
MFS Value Portfolio
MFS® PRIVACY NOTICE
Privacy is a concern for every investor today. At MFS Investment Management® and the MFS funds, we take this concern very seriously. We want you to understand our policies about the investment products and services that we offer, and how we protect the nonpublic personal information of investors who have a direct relationship with us and our wholly owned subsidiaries.
Throughout our business relationship, you provide us with personal information. We maintain information and records about you, your investments, and the services you use. Examples of the nonpublic personal information we maintain include
| | Ÿ | | data from investment applications and other forms |
| | Ÿ | | share balances and transactional history with us, our affiliates, or others |
| | Ÿ | | facts from a consumer reporting agency |
We do not disclose any nonpublic personal information about our customers or former customers to anyone, except as permitted by law. We may share nonpublic personal information with third parties or certain of our affiliates in connection with servicing your account or processing your transactions. We may share information with companies or financial institutions that perform marketing services on our behalf or with other financial institutions with which we have joint marketing arrangements, subject to any legal requirements.
Authorization to access your nonpublic personal information is limited to appropriate personnel who provide products, services, or information to you. We maintain physical, electronic, and procedural safeguards to help protect the personal information we collect about you.
If you have any questions about the MFS privacy policy, please call 1-800-225-2606 any business day.
Note: If you own MFS products or receive MFS services in the name of a third party such as a bank or broker-dealer, their privacy policy may apply to you instead of ours.
27


MFS® CORE EQUITY PORTFOLIO
The report is prepared for the general information of contract owners. It is authorized for distribution to prospective investors only when preceded or accompanied by a current prospectus.
NOT FDIC INSURED Ÿ MAY LOSE VALUE Ÿ NO BANK GUARANTEE Ÿ NOT A DEPOSIT Ÿ NOT INSURED BY ANY FEDERAL GOVERNMENT AGENCY OR NCUA/NCUSIF
MFS Core Equity Portfolio
LETTER FROM THE CEO

Dear Contract Owners:
After an extended rebound in the financial markets, uncertainty returned in 2010 as investors began to question the durability of the recovery for global economies and markets. That uncertainty led to increased risk aversion, especially as investors saw the eurozone struggle with the debt woes of many of its members. In September, the U.S. Federal Reserve Board’s promises to further loosen monetary policy helped assuage market fears and drive asset prices off their recent lows. A combination of solid earnings and improving economic data gave an additional boost to investor sentiment. As we enter 2011, we are cautiously optimistic that economic growth will continue to improve and that the global economies will recover from the shocks of the past few years. We expect the pace of recovery worldwide will be uneven and volatile.
As always, we continue to be mindful of the many economic challenges faced at the local, national, and international levels. It is in times such as these that we want to remind investors of the merits of maintaining a long-term view, adhering to basic investing principles such as asset allocation and diversification, and working closely with their advisors to research and identify appropriate investment opportunities.
Respectfully,

Robert J. Manning
Chairman and Chief Executive Officer
MFS Investment Management®
February 14, 2011
The opinions expressed in this letter are subject to change, may not be relied upon for investment advice, and no forecasts can be guaranteed.
1
MFS Core Equity Portfolio
PORTFOLIO COMPOSITION
Portfolio structure

| | | | |
| Top ten holdings | | | | |
| Apple, Inc. | | | 3.4% | |
| Exxon Mobil Corp. | | | 3.2% | |
| JPMorgan Chase & Co. | | | 1.8% | |
| Danaher Corp. | | | 1.7% | |
| Fluor Corp. | | | 1.7% | |
| Target Corp. | | | 1.6% | |
| Abbott Laboratories | | | 1.5% | |
| Philip Morris International, Inc. | | | 1.5% | |
| International Business Machines Corp. | | | 1.5% | |
| Oracle Corp. | | | 1.4% | |
| | | | |
| Equity sectors | | | | |
| Financial Services | | | 16.5% | |
| Technology (s) | | | 16.0% | |
| Energy | | | 11.2% | |
| Health Care | | | 10.9% | |
| Industrial Goods & Services (s) | | | 8.1% | |
| Consumer Staples | | | 7.2% | |
| Retailing | | | 6.8% | |
| Utilities & Communications | | | 5.9% | |
| Leisure | | | 5.7% | |
| Basic Materials | | | 5.3% | |
| Transportation | | | 2.3% | |
| Special Products & Services | | | 2.1% | |
| Autos & Housing | | | 0.9% | |
| (s) | Equity Sector includes equities and securities sold short. |
Percentages are based on net assets as of 12/31/10.
The portfolio is actively managed and current holdings may be different.
2
MFS Core Equity Portfolio
MANAGEMENT REVIEW
Summary of Results
For the twelve months ended December 31, 2010, Initial Class shares of the MFS Core Equity Portfolio (the “fund”) provided a total return of 17.22%, while Service Class shares of the fund provided a total return of 16.95%. These compare with a return of 16.93% for the fund’s benchmark, the Russell 3000 Index.
Market Environment
The first quarter of the reporting period witnessed a continuation of the financial market and macroeconomic rebounds that had begun in early 2009. These recoveries in global activity and asset valuations were generally synchronized around the world, led importantly by emerging Asian economies, but broadening to include most of the global economy to varying degrees. Primary drivers of the recoveries included an unwinding of the inventory destocking that took place earlier, the production of manufacturing and capital goods, as well as massive fiscal and monetary stimulus.
During most of the remainder of the period, heightened risk surrounding the public-debt profiles of several of the peripheral European countries impaired market sentiment. At the same time, the improving trend in global macroeconomic data began to weaken somewhat. These two dynamics caused many asset prices to retrench significantly, as many questioned the durability of the global recovery.
Towards the end of the period, the U.S. Federal Reserve led markets to believe that further monetary loosening would be forthcoming if macroeconomic activity did not show signs of improvement. The prospects for more easing by the Fed improved market sentiment and drove risk-asset prices markedly higher. However, in a text-book case of “buy the rumor, sell the fact,” the weeks following the early November announcement of further quantitative easing saw a sell-off in U.S. Treasury bonds. This rise in Treasury yields occurred despite risk-off behavior in equities and credit markets (which would normally result in Treasury yield compression), and appears to have been the result of a few factors: signs of improved U.S. and global economic activity; opposition to quantitative easing from some quarters; and crowded long positions in U.S. Treasuries. The December agreement on an expansionary U.S. fiscal package also boosted sentiment, leading markets to reach near-term highs in risky asset valuations toward year end.
Contributors to Performance
Stock selection in the financial services sector contributed to the fund’s performance relative to the Russell 3000 Index. Not owning poor-performing insurance and investment firm Berkshire Hathaway had a positive impact on relative results.
Security selection in the retailing sector also bolstered relative returns. The fund’s overweight positions in strong-performing specialty retailer Limited Brands and apparel retailer Abercrombie & Fitch benefited performance. Shares of Limited Brands appreciated as the company experienced a rise in same store sales that exceeded expectations. In addition, the company announced a special dividend along with a new share repurchase program.
Stock selection in the industrial goods & services sector was another positive factor for relative results. Strong-performing engineering and construction services provider Fluor Corp. was among the fund’s top contributors. Shares of Fluor traded higher after the company forecasted 2011 earnings that were higher than expected. The company also raised its share buyback program and announced that its order backlog had expanded amid new project awards for infrastructure, mining, oil and gas, including an oil sands project in Canada, which also helped the stock’s performance.
Several individual standout performers in other sectors that contributed to relative performance included medical device manufacturer NxStage Medical, computer and personal electronics maker Apple, casino resorts operator Las Vegas Sands, mining company Teck Resources (b), and software design and service company Autodesk. Not holding weak-performing software giant Microsoft also aided relative results.
Detractors from Performance
Stock selection in the technology sector detracted from relative performance. The timing of our ownership in shares of network storage company Compellent Technologies (h), business intelligence software provider MicroStrategy (h), and publishing software company Adobe Systems (h) hindered relative returns. The fund’s overweight positions in computer products and services provider Hewlett-Packard and network equipment company Cisco Systems also held back results. We believe the decline in Cisco’s shares was due to the company’s lower-than-expected forecasted fiscal second quarter revenue and earnings. Management attributed the shortfall to lower government spending and weaker sales in Europe. In addition, the fund’s short position in semiconductor and passive electronic components producer Vishay Intertechnology also hurt relative performance.
Elsewhere, marine fuel logistics company Aegean Marine Petroleum Network (b), pharmaceutical and medical products maker Abbott Laboratories, and consumer products company Colgate-Palmolive (h) were among the fund’s top relative detractors.
3
MFS Core Equity Portfolio
Management Review – continued
Colgate-Palmolive’s shares depreciated after the company posted revenue below expectations as results in Latin America were softer than expected. Colgate faced increasing competition from rival Procter & Gamble, which is making a bigger push into the oral-care business in many parts of the world, particularly in developing markets. The timing of our ownership in shares of diversified financial services company Marshall & Ilsley also dampened relative results.
Respectfully,
| | |
| Joseph MacDougall | | Katrina Mead |
| Portfolio Manager | | Portfolio Manager |
| (b) | Security is not a benchmark constituent. |
| (h) | Security was not held in the portfolio at period end. |
The views expressed in this report are those of the portfolio managers only through the end of the period of the report as stated on the cover and do not necessarily reflect the views of MFS or any other person in the MFS organization. These views are subject to change at any time based on market or other conditions, and MFS disclaims any responsibility to update such views. These views may not be relied upon as investment advice or an indication of trading intent on behalf of any MFS portfolio. References to specific securities are not recommendations of such securities, and may not be representative of any MFS portfolio’s current or future investments.
4
MFS Core Equity Portfolio
PERFORMANCE SUMMARY THROUGH 12/31/10
The following chart illustrates the historical performance of the fund in comparison to its benchmark(s). Benchmarks are unmanaged and may not be invested in directly. Benchmark returns do not reflect any fees or expenses. The performance of other share classes will be greater than or less than that of the class depicted below. (See Notes to Performance Summary.)
Performance data shown represents past performance and is no guarantee of future results. Investment return and principal value fluctuate so your units, when sold, may be worth more or less than the original cost; current performance may be lower or higher than quoted. The performance shown does not reflect the deduction of taxes, if any, that a contract holder would pay on fund distributions or the redemption of contract units. The returns for the fund shown also do not reflect the deduction of expenses associated with variable products, such as mortality and expense risk charges, separate account charges, and sales charges imposed by the insurance company separate accounts. Such expenses would reduce the overall returns shown.
Growth of a Hypothetical $10,000 Investment
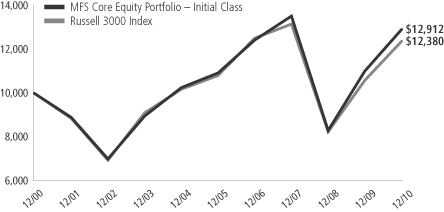
Total Returns through 12/31/10
Average annual total returns
| | | | | | | | | | | | | | |
| | | Share class | | Class inception date | | 1-yr | | 5-yr | | 10-yr | | Life (t) | | |
| | | Initial Class | | 5/12/97 | | 17.22% | | 3.38% | | 2.59% | | N/A | | |
| | | Service Class | | 8/24/01 | | 16.95% | | 3.12% | | N/A | | 3.88% | | |
| | | | | |
| Comparative benchmark | | | | | | | | | | |
| | | Russell 3000 Index (f) | | 16.93% | | 2.74% | | 2.16% | | N/A | | |
| (f) | Source: FactSet Research Systems Inc. |
| (t) | For the period from the class’ inception date through the stated period end (for those share classes with less than 10 years of performance history). No comparative benchmark performance information is provided for “life” periods. (See Notes to Performance Summary). |
Benchmark Definition
Russell 3000 Index – constructed to provide a comprehensive barometer for the 3,000 largest U.S. companies based on total market capitalization, which represents approximately 98% of the investable U.S. equity market.
It is not possible to invest directly in an index.
Notes to Performance Summary
Average annual total return represents the average annual change in value for each share class for the periods presented. Life returns are presented where the share class has less than 10 years of performance history and represent the average annual total return from the class inception date to the stated period end date. As the fund’s share classes may have different inception dates, the life returns may represent different time periods and may not be comparable. As a result, no comparative benchmark performance information is provided for life periods.
5
MFS Core Equity Portfolio
Performance Summary – continued
Performance results reflect any applicable expense subsidies and waivers in effect during the periods shown. Without such subsidies and waivers the fund’s performance results would be less favorable. Please see the prospectus and financial statements for complete details. All results are historical and assume the reinvestment of any dividends and capital gains distributions.
From time to time the fund may receive proceeds from litigation settlements, without which performance would be lower.
6
MFS Core Equity Portfolio
EXPENSE TABLE
Fund Expenses Borne by the Contract Holders During the Period, July 1, 2010 through December 31, 2010
As a contract holder of the fund, you incur ongoing costs, including management fees; distribution and/or service (12b-1) fees; and other fund expenses. This example is intended to help you understand your ongoing costs (in dollars) of investing in the fund and to compare these costs with the ongoing costs of investing in other mutual funds.
The example is based on an investment of $1,000 invested at the beginning of the period and held for the entire period July 1, 2010 through December 31, 2010.
Actual Expenses
The first line for each share class in the following table provides information about actual account values and actual expenses. You may use the information in this line, together with the amount you invested, to estimate the expenses that you paid over the period. Simply divide your account value by $1,000 (for example, an $8,600 account value divided by $1,000 = 8.6), then multiply the result by the number in the first line under the heading entitled “Expenses Paid During Period” to estimate the expenses you paid on your account during this period.
Hypothetical Example for Comparison Purposes
The second line for each share class in the following table provides information about hypothetical account values and hypothetical expenses based on the fund’s actual expense ratio and an assumed rate of return of 5% per year before expenses, which is not the fund’s actual return. The hypothetical account values and expenses may not be used to estimate the actual ending account balance or expenses you paid for the period. You may use this information to compare the ongoing costs of investing in the fund and other funds. To do so, compare this 5% hypothetical example with the 5% hypothetical examples that appear in the shareholder reports of the other funds.
Please note that the expenses shown in the table are meant to highlight the fund’s ongoing costs only and do not take into account the fees and expenses imposed under the variable contracts through which your investment in the fund is made. Therefore, the second line for each share class in the table is useful in comparing ongoing costs associated with an investment in vehicles (such as the fund) which fund benefits under variable annuity and variable life insurance contracts and to qualified pension and retirement plans only, and will not help you determine the relative total costs of investing in the fund through variable annuity and variable life insurance contracts. If the fees and expenses imposed under the variable contracts were included, your costs would have been higher.
| | | | | | | | | | | | | | | | | | |
| Share Class | | | | Annualized
Expense Ratio | | | Beginning
Account Value
7/01/10 | | | Ending Account Value
12/31/10 | | | Expenses Paid
During Period (p)
7/01/10-12/31/10 | |
| Initial Class | | Actual | | | 0.86% | | | | $1,000.00 | | | | $1,252.64 | | | | $4.88 | |
| | Hypothetical (h) | | | 0.86% | | | | $1,000.00 | | | | $1,020.87 | | | | $4.38 | |
| Service Class | | Actual | | | 1.11% | | | | $1,000.00 | | | | $1,251.55 | | | | $6.30 | |
| | Hypothetical (h) | | | 1.11% | | | | $1,000.00 | | | | $1,019.61 | | | | $5.65 | |
| (h) | 5% class return per year before expenses. |
| (p) | Expenses paid is equal to each class’ annualized expense ratio, as shown above, multiplied by the average account value over the period, multiplied by the number of days in the period, divided by the number of days in the year. |
7
MFS Core Equity Portfolio
PORTFOLIO OF INVESTMENTS – 12/31/10
The Portfolio of Investments is a complete list of all securities owned by your fund. It is categorized by broad-based asset classes.
| | | | | | | | |
| Issuer | | Shares/Par | | | Value ($) | |
| | | | | | | | |
| COMMON STOCKS – 99.3% | | | | | |
| Aerospace – 2.9% | | | | | | | | |
| Goodrich Corp. | | | 7,900 | | | $ | 695,752 | |
| Honeywell International, Inc. | | | 18,050 | | | | 959,538 | |
| Lockheed Martin Corp. | | | 5,380 | | | | 376,116 | |
| Precision Castparts Corp. | | | 4,360 | | | | 606,956 | |
| Textron, Inc. | | | 17,010 | | | | 402,116 | |
| United Technologies Corp. | | | 16,590 | | | | 1,305,965 | |
| | | | | | | | |
| | | | | | $ | 4,346,443 | |
| | | | | | | | |
| Airlines – 0.2% | | | | | | | | |
| Copa Holdings S.A., “A” | | | 2,100 | | | $ | 123,564 | |
| United Continental Holdings, Inc. (a) | | | 8,810 | | | | 209,854 | |
| | | | | | | | |
| | | | | | $ | 333,418 | |
| | | | | | | | |
| Apparel Manufacturers – 0.7% | | | | | | | | |
| Hanesbrands, Inc. (a) | | | 10,200 | | | $ | 259,080 | |
| NIKE, Inc., “B” | | | 8,540 | | | | 729,487 | |
| | | | | | | | |
| | | | | | $ | 988,567 | |
| | | | | | | | |
| Automotive – 0.4% | | | | | | | | |
| General Motors Co. (a) | | | 15,710 | | | $ | 579,071 | |
| | | | | | | | |
| Biotechnology – 1.7% | | | | | | | | |
| Amgen, Inc. (a) | | | 28,800 | | | $ | 1,581,120 | |
| Anacor Pharmaceuticals, Inc. (a) | | | 28,150 | | | | 151,164 | |
| Gilead Sciences, Inc. (a) | | | 21,580 | | | | 782,059 | |
| | | | | | | | |
| | | | | | $ | 2,514,343 | |
| | | | | | | | |
| Broadcasting – 1.8% | | | | | | | | |
| CBS Corp., “B” | | | 25,560 | | | $ | 486,918 | |
| Discovery Communications, Inc., “A” (a) | | | 7,320 | | | | 305,244 | |
| Viacom, Inc., “B” | | | 14,930 | | | | 591,377 | |
| Walt Disney Co. | | | 32,950 | | | | 1,235,952 | |
| | | | | | | | |
| | | | | | $ | 2,619,491 | |
| | | | | | | | |
| Brokerage & Asset Managers – 1.6% | | | | | |
| Affiliated Managers Group, Inc. (a) | | | 3,740 | | | $ | 371,083 | |
| Charles Schwab Corp. | | | 21,300 | | | | 364,443 | |
| CME Group, Inc. | | | 1,530 | | | | 492,276 | |
| Franklin Resources, Inc. | | | 3,520 | | | | 391,459 | |
| FXCM, Inc. “A” (a) | | | 720 | | | | 9,540 | |
| GFI Group, Inc. | | | 54,360 | | | | 254,948 | |
| LaBranche & Co., Inc. (a) | | | 23,240 | | | | 83,664 | |
| NASDAQ OMX Group, Inc. (a) | | | 9,740 | | | | 230,935 | |
| TradeStation Group, Inc. (a) | | | 21,990 | | | | 148,433 | |
| | | | | | | | |
| | | | | | $ | 2,346,781 | |
| | | | | | | | |
| Business Services – 1.8% | | | | | | | | |
| Accenture Ltd., “A” | | | 10,210 | | | $ | 495,083 | |
| Dun & Bradstreet Corp. | | | 5,950 | | | | 488,436 | |
| FleetCor Technologies, Inc. (a) | | | 18,000 | | | | 556,560 | |
| MSCI, Inc., “A” (a) | | | 7,730 | | | | 301,161 | |
| Paychex, Inc. | | | 24,560 | | | | 759,150 | |
| | | | | | | | |
| | | | | | $ | 2,600,390 | |
| | | | | | | | |
| | | | | | | | |
| Issuer | | Shares/Par | | | Value ($) | |
| | | | | | | | |
| COMMON STOCKS – continued | | | | | | | | |
| Cable TV – 1.1% | | | | | | | | |
| Comcast Corp., “Special A” | | | 49,370 | | | $ | 1,027,390 | |
| DIRECTV, “A” (a) | | | 13,720 | | | | 547,840 | |
| | | | | | | | |
| | | | | | $ | 1,575,230 | |
| | | | | | | | |
| Chemicals – 2.7% | | | | | | | | |
| Celanese Corp. | | | 25,830 | | | $ | 1,063,421 | |
| Ecolab, Inc. | | | 24,090 | | | | 1,214,618 | |
| Monsanto Co. | | | 25,390 | | | | 1,768,160 | |
| | | | | | | | |
| | | | | | $ | 4,046,199 | |
| | | | | | | | |
| Computer Software – 4.3% | | | | | | | | |
| Autodesk, Inc. (a) | | | 37,570 | | | $ | 1,435,174 | |
| Check Point Software Technologies Ltd. (a) | | | 4,820 | | | | 222,973 | |
| Citrix Systems, Inc. (a) | | | 4,830 | | | | 330,420 | |
| Intuit, Inc. (a) | | | 21,120 | | | | 1,041,216 | |
| Nuance Communications, Inc. (a) | | | 13,600 | | | | 247,248 | |
| Oracle Corp. | | | 68,430 | | | | 2,141,859 | |
| VeriSign, Inc. | | | 29,360 | | | | 959,191 | |
| | | | | | | | |
| | | | | | $ | 6,378,081 | |
| | | | | | | | |
| Computer Software – Systems – 7.4% | | | | | |
| Apple, Inc. (a)(s) | | | 15,410 | | | $ | 4,970,650 | |
| EMC Corp. (a) | | | 77,710 | | | | 1,779,559 | |
| Hewlett-Packard Co. | | | 35,350 | | | | 1,488,235 | |
| International Business Machines Corp. | | | 14,820 | | | | 2,174,983 | |
| NICE Systems Ltd., ADR (a) | | | 14,680 | | | | 512,332 | |
| | | | | | | | |
| | | | | | $ | 10,925,759 | |
| | | | | | | | |
| Construction – 0.5% | | | | | | | | |
| Owens Corning (a) | | | 12,550 | | | $ | 390,933 | |
| Sherwin-Williams Co. | | | 4,450 | | | | 372,688 | |
| | | | | | | | |
| | | | | | $ | 763,621 | |
| | | | | | | | |
| Consumer Products – 1.7% | | | | | | | | |
| Avon Products, Inc. | | | 45,030 | | | $ | 1,308,572 | |
| Procter & Gamble Co. | | | 18,700 | | | | 1,202,971 | |
| | | | | | | | |
| | | | | | $ | 2,511,543 | |
| | | | | | | | |
| Consumer Services – 0.3% | | | | | | | | |
| DeVry, Inc. | | | 4,590 | | | $ | 220,228 | |
| Priceline.com, Inc. (a) | | | 390 | | | | 155,825 | |
| | | | | | | | |
| | | | | | $ | 376,053 | |
| | | | | | | | |
| Containers – 0.0% | | | | | | | | |
| Owens-Illinois, Inc. (a) | | | 1,100 | | | $ | 33,770 | |
| | | | | | | | |
| Electrical Equipment – 2.4% | | | | | | | | |
| Danaher Corp. | | | 54,250 | | | $ | 2,558,971 | |
| Sensata Technologies Holding B.V. (a) | | | 31,390 | | | | 945,153 | |
| | | | | | | | |
| | | | | | $ | 3,504,124 | |
| | | | | | | | |
| Electronics – 2.4% | | | | | | | | |
| Advanced Micro Devices, Inc. (a) | | | 62,310 | | | $ | 509,696 | |
| First Solar, Inc. (a) | | | 6,040 | | | | 786,046 | |
8
MFS Core Equity Portfolio
Portfolio of Investments – continued
| | | | | | | | |
| Issuer | | Shares/Par | | | Value ($) | |
| | | | | | | | |
| COMMON STOCKS – continued | | | | | |
| Electronics – continued | | | | | | | | |
| Hittite Microwave Corp. (a) | | | 2,620 | | | $ | 159,925 | |
| Intel Corp. | | | 22,490 | | | | 472,965 | |
| Linear Technology Corp. | | | 18,950 | | | | 655,481 | |
| Microchip Technology, Inc. | | | 29,600 | | | | 1,012,616 | |
| | | | | | | | |
| | | | | | $ | 3,596,729 | |
| | | | | | | | |
| Energy – Independent – 3.9% | | | | | | | | |
| Alpha Natural Resources, Inc. (a) | | | 3,930 | | | $ | 235,918 | |
| Apache Corp. | | | 8,120 | | | | 968,148 | |
| CONSOL Energy, Inc. | | | 3,250 | | | | 158,405 | |
| Newfield Exploration Co. (a) | | | 7,020 | | | | 506,212 | |
| Noble Energy, Inc. | | | 6,830 | | | | 587,926 | |
| Occidental Petroleum Corp. | | | 16,940 | | | | 1,661,814 | |
| Peabody Energy Corp. | | | 3,610 | | | | 230,968 | |
| QEP Resources, Inc. | | | 31,580 | | | | 1,146,670 | |
| Targa Resources Corp. (a) | | | 5,243 | | | | 140,565 | |
| Walter Energy, Inc. | | | 1,620 | | | | 207,101 | |
| | | | | | | | |
| | | | | | $ | 5,843,727 | |
| | | | | | | | |
| Energy – Integrated – 4.9% | | | | | | | | |
| Chevron Corp. | | | 19,120 | | | $ | 1,744,700 | |
| Exxon Mobil Corp. (s) | | | 64,536 | | | | 4,718,872 | |
| Hess Corp. | | | 10,680 | | | | 817,447 | |
| | | | | | | | |
| | | | | | $ | 7,281,019 | |
| | | | | | | | |
| Engineering – Construction – 1.7% | | | | | | | | |
| Fluor Corp. | | | 38,530 | | | $ | 2,552,998 | |
| | | | | | | | |
| Food & Beverages – 3.3% | | | | | | | | |
| Bunge Ltd. | | | 4,420 | | | $ | 289,598 | |
| Coca-Cola Co. | | | 27,630 | | | | 1,817,225 | |
| Dr Pepper Snapple Group, Inc. | | | 18,470 | | | | 649,405 | |
| General Mills, Inc. | | | 21,500 | | | | 765,185 | |
| PepsiCo, Inc. (s) | | | 21,127 | | | | 1,380,227 | |
| | | | | | | | |
| | | | | | $ | 4,901,640 | |
| | | | | | | | |
| Food & Drug Stores – 1.1% | | | | | | | | |
| Walgreen Co. | | | 25,110 | | | $ | 978,286 | |
| Whole Foods Market, Inc. | | | 12,040 | | | | 609,104 | |
| | | | | | | | |
| | | | | | $ | 1,587,390 | |
| | | | | | | | |
| Gaming & Lodging – 0.9% | | | | | | | | |
| Carnival Corp. | | | 4,900 | | | $ | 225,939 | |
| Las Vegas Sands Corp. (a) | | | 9,020 | | | | 414,469 | |
| Marriott International, Inc., “A” | | | 17,510 | | | | 727,365 | |
| | | | | | | | |
| | | | | | $ | 1,367,773 | |
| | | | | | | | |
| General Merchandise – 2.5% | | | | | | | | |
| Kohl’s Corp. (a) | | | 24,410 | | | $ | 1,326,439 | |
| Target Corp. | | | 38,440 | | | | 2,311,397 | |
| | | | | | | | |
| | | | | | $ | 3,637,836 | |
| | | | | | | | |
| Health Maintenance Organizations – 0.5% | | | | | |
| Aetna, Inc. | | | 7,730 | | | $ | 235,842 | |
| WellPoint, Inc. (a) | | | 8,500 | | | | 483,310 | |
| | | | | | | | |
| | | | | | $ | 719,152 | |
| | | | | | | | |
| | | | | | | | |
| Issuer | | Shares/Par | | | Value ($) | |
| | | | | | | | |
| COMMON STOCKS – continued | | | | | |
| Insurance – 4.1% | | | | | | | | |
| ACE Ltd. | | | 27,540 | | | $ | 1,714,365 | |
| Aflac, Inc. | | | 9,800 | | | | 553,014 | |
| Allied World Assurance Co. | | | 9,520 | | | | 565,869 | |
| Aon Corp. | | | 41,710 | | | | 1,919,077 | |
| Chubb Corp. | | | 7,780 | | | | 463,999 | |
| MetLife, Inc. | | | 5,240 | | | | 232,866 | |
| Prudential Financial, Inc. | | | 9,300 | | | | 546,003 | |
| | | | | | | | |
| | | | | | $ | 5,995,193 | |
| | | | | | | | |
| Internet – 1.2% | | | | | | | | |
| Google, Inc., “A” (a) | | | 3,020 | | | $ | 1,793,789 | |
| | | | | | | | |
| Leisure & Toys – 0.4% | | | | | | | | |
| Hasbro, Inc. | | | 13,950 | | | $ | 658,161 | |
| | | | | | | | |
| Machinery & Tools – 0.9% | | | | | | | | |
| Finning International, Inc. | | | 18,460 | | | $ | 502,948 | |
| Regal Beloit Corp. | | | 7,080 | | | | 472,661 | |
| WABCO Holdings, Inc. (a) | | | 7,020 | | | | 427,729 | |
| | | | | | | | |
| | | | | | $ | 1,403,338 | |
| | | | | | | | |
| Major Banks – 5.8% | | | | | | | | |
| Bank of America Corp. | | | 140,660 | | | $ | 1,876,404 | |
| Bank of New York Mellon Corp. | | | 22,815 | | | | 689,013 | |
| Goldman Sachs Group, Inc. | | | 8,680 | | | | 1,459,629 | |
| JPMorgan Chase & Co. (s) | | | 62,030 | | | | 2,631,313 | |
| KeyCorp | | | 66,570 | | | | 589,145 | |
| State Street Corp. | | | 12,330 | | | | 571,372 | |
| SunTrust Banks, Inc. | | | 26,370 | | | | 778,179 | |
| | | | | | | | |
| | | | | | $ | 8,595,055 | |
| | | | | | | | |
| Medical & Health Technology & Services – 1.2% | | | | | |
| Medco Health Solutions, Inc. (a) | | | 11,710 | | | $ | 717,472 | |
| Patterson Cos., Inc. | | | 13,060 | | | | 400,028 | |
| Quest Diagnostics, Inc. | | | 5,440 | | | | 293,597 | |
| VCA Antech, Inc. (a) | | | 14,420 | | | | 335,842 | |
| | | | | | | | |
| | | | | | $ | 1,746,939 | |
| | | | | | | | |
| Medical Equipment – 3.0% | | | | | | | | |
| Becton, Dickinson & Co. | | | 7,090 | | | $ | 599,247 | |
| Covidien PLC | | | 9,910 | | | | 452,491 | |
| DexCom, Inc. (a) | | | 1,570 | | | | 21,431 | |
| Medtronic, Inc. | | | 17,150 | | | | 636,094 | |
| NxStage Medical, Inc. (a) | | | 6,876 | | | | 171,075 | |
| NxStage Medical, Inc. (a) | | | 15,814 | | | | 393,452 | |
| St. Jude Medical, Inc. (a) | | | 15,170 | | | | 648,518 | |
| Thermo Fisher Scientific, Inc. (a) | | | 15,120 | | | | 837,043 | |
| Thoratec Corp. (a) | | | 19,460 | | | | 551,107 | |
| Waters Corp. (a) | | | 2,150 | | | | 167,077 | |
| | | | | | | | |
| | | | | | $ | 4,477,535 | |
| | | | | | | | |
| Metals & Mining – 1.3% | | | | | | | | |
| Cliffs Natural Resources, Inc. | | | 3,100 | | | $ | 241,831 | |
| Steel Dynamics, Inc. | | | 3,500 | | | | 64,050 | |
| Teck Resources Ltd., “B” | | | 15,094 | | | | 938,005 | |
| United States Steel Corp. | | | 11,260 | | | | 657,809 | |
| | | | | | | | |
| | | | | | $ | 1,901,695 | |
| | | | | | | | |
9
MFS Core Equity Portfolio
Portfolio of Investments – continued
| | | | | | | | |
| Issuer | | Shares/Par | | | Value ($) | |
| | | | | | | | |
| COMMON STOCKS – continued | | | | | | | | |
| Network & Telecom – 1.4% | | | | | | | | |
| Cisco Systems, Inc. (a) | | | 84,800 | | | $ | 1,715,504 | |
| F5 Networks, Inc. (a) | | | 3,170 | | | | 412,607 | |
| | | | | | | | |
| | | | | | $ | 2,128,111 | |
| | | | | | | | |
| Oil Services – 2.4% | | | | | | | | |
| Halliburton Co. | | | 43,370 | | | $ | 1,770,797 | |
| Schlumberger Ltd. | | | 20,710 | | | | 1,729,285 | |
| | | | | | | | |
| | | | | | $ | 3,500,082 | |
| | | | | | | | |
| Other Banks & Diversified Financials – 2.5% | | | | | |
| American Express Co. | | | 8,930 | | | $ | 383,276 | |
| Cathay General Bancorp, Inc. | | | 55,810 | | | | 932,027 | |
| EuroDekania Ltd. (a)(z) | | | 100,530 | | | | 154,875 | |
| Marshall & Ilsley Corp. | | | 82,040 | | | | 567,717 | |
| MasterCard, Inc., “A” | | | 2,940 | | | | 658,883 | |
| Sterling Bancshares, Inc. | | | 77,960 | | | | 547,279 | |
| Zions Bancorporation | | | 18,780 | | | | 455,039 | |
| | | | | | | | |
| | | | | | $ | 3,699,096 | |
| | | | | | | | |
| Pharmaceuticals – 4.5% | | | | | | | | |
| Abbott Laboratories | | | 46,560 | | | $ | 2,230,690 | |
| Johnson & Johnson | | | 29,350 | | | | 1,815,296 | |
| Pfizer, Inc. | | | 102,962 | | | | 1,802,865 | |
| Teva Pharmaceutical Industries Ltd., ADR | | | 15,770 | | | | 822,090 | |
| | | | | | | | |
| | | | | | $ | 6,670,941 | |
| | | | | | | | |
| Pollution Control – 0.4% | | | | | | | | |
| Republic Services, Inc. | | | 17,760 | | | $ | 530,314 | |
| | | | | | | | |
| Precious Metals & Minerals – 0.2% | | | | | | | | |
| Goldcorp, Inc. | | | 5,450 | | | $ | 250,591 | |
| | | | | | | | |
| Printing & Publishing – 0.4% | | | | | | | | |
| Moody’s Corp. | | | 22,160 | | | $ | 588,126 | |
| | | | | | | | |
| Railroad & Shipping – 1.4% | | | | | | | | |
| Aegean Marine Petroleum Network, Inc. | | | 48,800 | | | $ | 508,984 | |
| Canadian National Railway Co. | | | 7,440 | | | | 494,537 | |
| CSX Corp. | | | 10,300 | | | | 665,483 | |
| Kansas City Southern Co. (a) | | | 7,580 | | | | 362,779 | |
| | | | | | | | |
| | | | | | $ | 2,031,783 | |
| | | | | | | | |
| Real Estate – 2.2% | | | | | | | | |
| Annaly Mortgage Management, Inc., REIT | | | 41,790 | | | $ | 748,877 | |
| Entertainment Properties Trust, REIT | | | 33,620 | | | | 1,554,925 | |
| Kilroy Realty Corp., REIT | | | 13,540 | | | | 493,804 | |
| Mack-Cali Realty Corp., REIT | | | 14,990 | | | | 495,569 | |
| | | | | | | | |
| | | | | | $ | 3,293,175 | |
| | | | | | | | |
| Restaurants – 1.1% | | | | | | | | |
| McDonald’s Corp. | | | 21,380 | | | $ | 1,641,129 | |
| | | | | | | | |
| Specialty Chemicals – 1.1% | | | | | | | | |
| Air Products & Chemicals, Inc. | | | 3,130 | | | $ | 284,672 | |
| Airgas, Inc. | | | 12,930 | | | | 807,608 | |
| Cytec Industries, Inc. | | | 4,630 | | | | 245,668 | |
| W. R. Grace & Co. (a) | | | 8,220 | | | | 288,769 | |
| | | | | | | | |
| | | | | | $ | 1,626,717 | |
| | | | | | | | |
| | | | | | | | |
| Issuer | | Shares/Par | | | Value ($) | |
| | | | | | | | |
| COMMON STOCKS – continued | | | | | | | | |
| Specialty Stores – 2.5% | | | | | | | | |
| Abercrombie & Fitch Co., “A” | | | 10,510 | | | $ | 605,691 | |
| Amazon.com, Inc. (a) | | | 6,670 | | | | 1,200,600 | |
| Best Buy Co., Inc. | | | 12,630 | | | | 433,083 | |
| Dick’s Sporting Goods, Inc. (a) | | | 9,130 | | | | 342,375 | |
| Limited Brands, Inc. | | | 10,240 | | | | 314,675 | |
| Staples, Inc. | | | 20,900 | | | | 475,893 | |
| Urban Outfitters, Inc. (a) | | | 9,240 | | | | 330,884 | |
| | | | | | | | |
| | | | | | $ | 3,703,201 | |
| | | | | | | | |
| Telecommunications – Wireless – 0.3% | | | | | | | | |
| Cellcom Israel Ltd. | | | 8,310 | | | $ | 271,654 | |
| Sprint Nextel Corp. (a) | | | 31,390 | | | | 132,780 | |
| | | | | | | | |
| | | | | | $ | 404,434 | |
| | | | | | | | |
| Telephone Services – 2.4% | | | | | | | | |
| American Tower Corp., “A” (a) | | | 13,520 | | | $ | 698,173 | |
| AT&T, Inc. | | | 55,510 | | | | 1,630,884 | |
| Qwest Communications International, Inc. | | | 118,810 | | | | 904,144 | |
| Verizon Communications, Inc. | | | 10,550 | | | | 377,479 | |
| | | | | | | | |
| | | | | | $ | 3,610,680 | |
| | | | | | | | |
| Tobacco – 2.2% | | | | | | | | |
| Philip Morris International, Inc. | | | 37,780 | | | $ | 2,211,263 | |
| Reynolds American, Inc. | | | 31,240 | | | | 1,019,049 | |
| | | | | | | | |
| | | | | | $ | 3,230,312 | |
| | | | | | | | |
| Trucking – 0.7% | | | | | | | | |
| Expeditors International of Washington, Inc. | | | 12,270 | | | $ | 669,942 | |
| Swift Transportation Co. (a) | | | 30,600 | | | | 382,806 | |
| | | | | | | | |
| | | | | | $ | 1,052,748 | |
| | | | | | | | |
| Utilities – Electric Power – 3.0% | | | | | | | | |
| American Electric Power Co., Inc. | | | 21,120 | | | $ | 759,898 | |
| Calpine Corp. (a) | | | 16,860 | | | | 224,912 | |
| CenterPoint Energy, Inc. | | | 35,690 | | | | 561,047 | |
| CMS Energy Corp. | | | 35,430 | | | | 658,998 | |
| PG&E Corp. | | | 17,140 | | | | 819,978 | |
| PPL Corp. | | | 15,440 | | | | 406,381 | |
| Public Service Enterprise Group, Inc. | | | 9,650 | | | | 306,967 | |
| Wisconsin Energy Corp. | | | 11,560 | | | | 680,422 | |
| | | | | | | | |
| | | | | | $ | 4,418,603 | |
| | | | | | | | |
Total Common Stocks
(Identified Cost, $131,497,079) | | | | | | $ | 146,882,896 | |
| | | | | | | | |
|
| CONVERTIBLE PREFERRED STOCKS – 0.5% | |
| Other Banks & Diversified Financials – 0.3% | | | | | |
| Citigroup, Inc., 7.5% | | | 3,500 | | | $ | 478,415 | |
| | | | | | | | |
| Utilities – Electric Power – 0.2% | | | | | | | | |
| PPL Corp., 9.5% | | | 6,610 | | | $ | 363,352 | |
| | | | | | | | |
| Total Convertible Preferred Stocks (Identified Cost, $781,551) | | | | | | $ | 841,767 | |
| | | | | | | | |
10
MFS Core Equity Portfolio
Portfolio of Investments – continued
| | | | | | | | |
| Issuer | | Shares/Par | | | Value ($) | |
| | | | | | | | |
| MONEY MARKET FUNDS (v) – 0.0% | |
| MFS Institutional Money Market Portfolio, 0.18%, at Cost and Net Asset Value | | | 60 | | | $ | 60 | |
| | | | | | | | |
Total Investments (Identified Cost, $132,278,690) | | | | | | $ | 147,724,723 | |
| | | | | | | | |
| | |
| SECURITIES SOLD SHORT – (0.9)% | | | | | | | | |
| Electrical Equipment – (0.2)% | | | | | | | | |
| Emerson Electric Co. | | | (6,700 | ) | | $ | (383,039 | ) |
| | | | | | | | |
| | | | | | | | |
| Issuer | | Shares/Par | | | Value ($) | |
| | | | | | | | |
| SECURITIES SOLD SHORT – continued | | | | | | | | |
| Electronics – (0.7)% | | | | | | | | |
| Vishay Intertechnology, Inc. (a) | | | (67,100 | ) | | $ | (985,028 | ) |
| | | | | | | | |
Total Securities Sold Short (Proceeds received, $986,213) | | | | | | $ | (1,368,067 | ) |
| | | | | | | | |
OTHER ASSETS, LESS
LIABILITIES – 1.1% | | | | | | | 1,583,311 | |
| | | | | | | | |
| Net Assets – 100.0% | | | | | | $ | 147,939,967 | |
| | | | | | | | |
| (a) | | Non-income producing security. |
| (s) | | Security or a portion of the security was pledged to cover collateral requirements for securities sold short. At December 31, 2010, the value of securities pledged amounted to $786,533. |
| (v) | | Underlying fund that is available only to investment companies managed by MFS. The rate quoted is the annualized seven-day yield of the fund at period end. |
| (z) | | Restricted securities are not registered under the Securities Act of 1933 and are subject to legal restrictions on resale. These securities generally may be resold in transactions exempt from registration or to the public if the securities are subsequently registered. Disposal of these securities may involve time-consuming negotiations and prompt sale at an acceptable price may be difficult. The fund holds the following restricted security: |
| | | | | | | | | | |
| Restricted Security | | Acquisition
Date | | Cost | | | Value | |
| EuroDekania Ltd. | | 3/08/07-6/25/07 | | | $1,412,164 | | | | $154,875 | |
| % of Net Assets | | | | | | | | | 0.1% | |
The following abbreviations are used in this report and are defined:
| ADR | | American Depository Receipt |
| PLC | | Public Limited Company |
| REIT | | Real Estate Investment Trust |
See Notes to Financial Statements
11
MFS Core Equity Portfolio
FINANCIAL STATEMENTS | STATEMENT OF ASSETS AND LIABILITIES
This statement represents your fund’s balance sheet, which details the assets and liabilities comprising the total value of the fund.
| | | | | | | | |
At 12/31/10 | | | | | | | | |
Assets | | | | | | | | |
Investments – | | | | | | | | |
Non-affiliated issuers, at value (identified cost, $132,278,630) | | | $147,724,663 | | | | | |
Underlying funds, at cost and value | | | 60 | | | | | |
Total investments, at value (identified cost, $132,278,690) | | | $147,724,723 | | | | | |
Restricted cash | | | 24,841 | | | | | |
Deposits with brokers for securities sold short | | | 1,339,642 | | | | | |
Receivables for | | | | | | | | |
Fund shares sold | | | 99,892 | | | | | |
Interest and dividends | | | 198,691 | | | | | |
Receivable from investment adviser | | | 3,102 | | | | | |
Other assets | | | 4,617 | | | | | |
Total assets | | | | | | | $149,395,508 | |
Liabilities | | | | | | | | |
Securities sold short, at value (proceeds received, $(986,213)) | | | $1,368,067 | | | | | |
Payable for fund shares reacquired | | | 27,985 | | | | | |
Payable to affiliates | | | | | | | | |
Investment adviser | | | 6,085 | | | | | |
Distribution and/or service fees | | | 490 | | | | | |
Administrative services fee | | | 297 | | | | | |
Payable for Trustees’ compensation | | | 145 | | | | | |
Accrued expenses and other liabilities | | | 52,472 | | | | | |
Total liabilities | | | | | | | $1,455,541 | |
Net assets | | | | | | | $147,939,967 | |
Net assets consist of | | | | | | | | |
Paid-in capital | | | $168,723,683 | | | | | |
Unrealized appreciation (depreciation) on investments and translation of assets and liabilities in foreign currencies | | | 15,064,216 | | | | | |
Accumulated net realized gain (loss) on investments and foreign currency transactions | | | (37,129,367 | ) | | | | |
Undistributed net investment income | | | 1,281,435 | | | | | |
Net assets | | | | | | | $147,939,967 | |
Shares of beneficial interest outstanding | | | | | | | 10,411,548 | |
| | | | | | | | | | | | |
| | | Net assets | | | Shares
outstanding | | | Net asset value
per share | |
Initial Class | | | $112,121,287 | | | | 7,876,586 | | | | $14.23 | |
Service Class | | | 35,818,680 | | | | 2,534,962 | | | | 14.13 | |
See Notes to Financial Statements
12
MFS Core Equity Portfolio
FINANCIAL STATEMENTS | STATEMENT OF OPERATIONS
This statement describes how much your fund earned in investment income and accrued in expenses. It also describes any gains and/or losses generated by fund operations.
| | | | | | | | |
Year ended 12/31/10 | | | | | | | | |
Net investment income | | | | | | | | |
Income | | | | | | | | |
Dividends | | | $2,569,786 | | | | | |
Interest | | | 6,820 | | | | | |
Dividends from underlying funds | | | 1,446 | | | | | |
Foreign taxes withheld | | | (9,129 | ) | | | | |
Total investment income | | | | | | | $2,568,923 | |
Expenses | | | | | | | | |
Management fee | | | $1,046,991 | | | | | |
Distribution and/or service fees | | | 83,459 | | | | | |
Administrative services fee | | | 51,201 | | | | | |
Trustees’ compensation | | | 18,932 | | | | | |
Custodian fee | | | 32,152 | | | | | |
Shareholder communications | | | 13,914 | | | | | |
Auditing fees | | | 47,023 | | | | | |
Legal fees | | | 7,600 | | | | | |
Dividend and interest expense on securities sold short | | | 15,009 | | | | | |
Miscellaneous | | | 18,735 | | | | | |
Total expenses | | | | | | | $1,335,016 | |
Fees paid indirectly | | | (8 | ) | | | | |
Reduction of expenses by investment adviser | | | (48,944 | ) | | | | |
Net expenses | | | | | | | $1,286,064 | |
Net investment income | | | | | | | $1,282,859 | |
Realized and unrealized gain (loss) on investments and foreign currency transactions | | | | | | | | |
Realized gain (loss) (identified cost basis) | | | | | | | | |
Investment transactions | | | $11,004,167 | | | | | |
Securities sold short | | | 127,371 | | | | | |
Foreign currency transactions | | | 257 | | | | | |
Net realized gain (loss) on investments and foreign currency transactions | | | | | | | $11,131,795 | |
Change in unrealized appreciation (depreciation) | | | | | | | | |
Investments | | | $10,394,516 | | | | | |
Securities sold short | | | (381,854 | ) | | | | |
Translation of assets and liabilities in foreign currencies | | | 23 | | | | | |
Net unrealized gain (loss) on investments and foreign currency translation | | | | | | | $10,012,685 | |
Net realized and unrealized gain (loss) on investments and foreign currency | | | | | | | $21,144,480 | |
Change in net assets from operations | | | | | | | $22,427,339 | |
See Notes to Financial Statements
13
MFS Core Equity Portfolio
FINANCIAL STATEMENTS | STATEMENTS OF CHANGES IN NET ASSETS
These statements describe the increases and/or decreases in net assets resulting from operations, any distributions, and any shareholder transactions.
| | | | | | | | |
For years ended 12/31 | | | 2010 | | | | 2009 | |
Change in net assets | | | | | | | | |
From operations | | | | | | | | |
Net investment income | | | $1,282,859 | | | | $1,515,124 | |
Net realized gain (loss) on investments and foreign currency transactions | | | 11,131,795 | | | | (15,548,923 | ) |
Net unrealized gain (loss) on investments and foreign currency translation | | | 10,012,685 | | | | 49,751,919 | |
Change in net assets from operations | | | $22,427,339 | | | | $35,718,120 | |
| Distributions declared to shareholders | | | | | | | | |
From net investment income | | | $(1,519,015 | ) | | | $(2,144,224 | ) |
Change in net assets from fund share transactions | | | $(15,874,134 | ) | | | $(10,000,204 | ) |
Total change in net assets | | | $5,034,190 | | | | $23,573,692 | |
| Net assets | | | | | | | | |
At beginning of period | | | 142,905,777 | | | | 119,332,085 | |
At end of period (including undistributed net investment income of $1,281,435 and
$1,517,334, respectively) | | | $147,939,967 | | | | $142,905,777 | |
See Notes to Financial Statements
14
MFS Core Equity Portfolio
FINANCIAL STATEMENTS | FINANCIAL HIGHLIGHTS
The financial highlights table is intended to help you understand the fund’s financial performance for the past 5 years. Certain information reflects financial results for a single fund share. The total returns in the table represent the rate by which an investor would have earned (or lost) on an investment in the fund share class (assuming reinvestment of all distributions) held for the entire period.
| | | | | | | | | | | | | | | | | | | | |
| Initial Class | | Years ended 12/31 | |
| | | 2010 | | | 2009 | | | 2008 | | | 2007 | | | 2006 | |
Net asset value, beginning of period | | | $12.27 | | | | $9.43 | | | | $16.52 | | | | $17.13 | | | | $15.15 | |
| Income (loss) from investment operations | | | | | | | | | | | | | | | | | | | | |
Net investment income (d) | | | $0.12 | | | | $0.13 | | | | $0.16 | | | | $0.11 | | | | $0.08 | |
Net realized and unrealized gain (loss) on investments
and foreign currency | | | 1.98 | | | | 2.89 | | | | (6.11 | ) | | | 1.41 | | | | 1.99 | |
Total from investment operations | | | $2.10 | | | | $3.02 | | | | $(5.95 | ) | | | $1.52 | | | | $2.07 | |
| Less distributions declared to shareholders | | | | | | | | | | | | | | | | | | | | |
From net investment income | | | $(0.14 | ) | | | $(0.18 | ) | | | $(0.09 | ) | | | $(0.09 | ) | | | $(0.09 | ) |
From net realized gain on investments | | | — | | | | — | | | | (1.05 | ) | | | (2.04 | ) | | | — | |
Total distributions declared to shareholders | | | $(0.14 | ) | | | $(0.18 | ) | | | $(1.14 | ) | | | $(2.13 | ) | | | $(0.09 | ) |
Net asset value, end of period | | | $14.23 | | | | $12.27 | | | | $9.43 | | | | $16.52 | | | | $17.13 | |
Total return (%) (k)(r)(s) | | | 17.22 | | | | 32.74 | | | | (38.63 | ) | | | 8.71 | | | | 13.74 | |
Ratios (%) (to average net assets)
and Supplemental data: | | | | | | | | | | | | | | | | | | | | |
Expenses before expense reductions (f) | | | 0.90 | | | | 0.89 | | | | 0.88 | | | | 0.86 | | | | 0.91 | |
Expenses after expense reductions (f) | | | 0.86 | | | | 0.85 | | | | 0.85 | | | | N/A | | | | 0.91 | |
Net investment income | | | 0.98 | | | | 1.28 | | | | 1.22 | | | | 0.65 | | | | 0.53 | |
Portfolio turnover | | | 69 | | | | 91 | | | | 109 | | | | 156 | | | | 122 | |
Net assets at end of period (000 omitted) | | | $112,121 | | | | $109,322 | | | | $97,648 | | | | $212,063 | | | | $80,024 | |
| Supplemental Ratios (%): | | | | | | | | | | | | | | | | | | | | |
Ratio of expenses to average net assets after expense reductions excluding short sale dividend and interest expense (f) | | | 0.85 | | | | 0.85 | | | | N/A | | | | N/A | | | | N/A | |
See Notes to Financial Statements
15
MFS Core Equity Portfolio
Financial Highlights – continued
| | | | | | | | | | | | | | | | | | | | |
| Service Class | | Years ended 12/31 | |
| | | 2010 | | | 2009 | | | 2008 | | | 2007 | | | 2006 | |
Net asset value, beginning of period | | | $12.19 | | | | $9.36 | | | | $16.42 | | | | $17.05 | | | | $15.09 | |
| Income (loss) from investment operations | | | | | | | | | | | | | | | | | | | | |
Net investment income (d) | | | $0.09 | | | | $0.10 | | | | $0.13 | | | | $0.07 | | | | $0.04 | |
Net realized and unrealized gain (loss) on investments
and foreign currency | | | 1.97 | | | | 2.88 | | | | (6.08 | ) | | | 1.39 | | | | 1.98 | |
Total from investment operations | | | $2.06 | | | | $2.98 | | | | $(5.95 | ) | | | $1.46 | | | | $2.02 | |
| Less distributions declared to shareholders | | | | | | | | | | | | | | | | | | | | |
From net investment income | | | $(0.12 | ) | | | $(0.15 | ) | | | $(0.06 | ) | | | $(0.05 | ) | | | $(0.06 | ) |
From net realized gain on investments | | | — | | | | — | | | | (1.05 | ) | | | (2.04 | ) | | | — | |
Total distributions declared to shareholders | | | $(0.12 | ) | | | $(0.15 | ) | | | $(1.11 | ) | | | $(2.09 | ) | | | $(0.06 | ) |
Net asset value, end of period | | | $14.13 | | | | $12.19 | | | | $9.36 | | | | $16.42 | | | | $17.05 | |
Total return (%) (k)(r)(s) | | | 16.95 | | | | 32.44 | | | | (38.79 | ) | | | 8.40 | | | | 13.44 | |
Ratios (%) (to average net assets)
and Supplemental data: | | | | | | | | | | | | | | | | | | | | |
Expenses before expense reductions (f) | | | 1.15 | | | | 1.14 | | | | 1.13 | | | | 1.11 | | | | 1.16 | |
Expenses after expense reductions (f) | | | 1.11 | | | | 1.10 | | | | 1.10 | | | | N/A | | | | 1.16 | |
Net investment income | | | 0.73 | | | | 1.02 | | | | 1.00 | | | | 0.41 | | | | 0.29 | |
Portfolio turnover | | | 69 | | | | 91 | | | | 109 | | | | 156 | | | | 122 | |
Net assets at end of period (000 omitted) | | | $35,819 | | | | $33,583 | | | | $21,684 | | | | $34,932 | | | | $12,675 | |
| Supplemental Ratios (%): | | | | | | | | | | | | | | | | | | | | |
Ratio of expenses to average net assets after expense reductions
excluding short sale dividend and interest expense (f) | | | 1.10 | | | | 1.10 | | | | N/A | | | | N/A | | | | N/A | |
| (d) | Per share data is based on average shares outstanding. |
| (f) | Ratios do not reflect reductions from fees paid indirectly, if applicable. |
| (k) | The total return does not reflect expenses that apply to separate accounts. Inclusion of these charges would reduce the total return figures for all periods shown. |
| (r) | Certain expenses have been reduced without which performance would have been lower. |
| (s) | From time to time the fund may receive proceeds from litigation settlements, without which performance would be lower. Excluding the effect of the proceeds received from a non-recurring litigation settlement against Enron Corp., the total return for the year ended December 31, 2008 would have been lower by approximately 1.32%. |
See Notes to Financial Statements
16
MFS Core Equity Portfolio
NOTES TO FINANCIAL STATEMENTS
| (1) | | Business and Organization |
MFS Core Equity Portfolio (the fund) is a series of MFS Variable Insurance Trust II (the trust). The trust is organized as a Massachusetts business trust and is registered under the Investment Company Act of 1940, as amended, as an open-end management investment company. The shareholders of each series of the trust are separate accounts of insurance companies, which offer variable annuity and/or life insurance products, and qualified retirement and pension plans.
| (2) | | Significant Accounting Policies |
General – The preparation of financial statements in conformity with U.S. generally accepted accounting principles requires management to make estimates and assumptions that affect the reported amounts of assets and liabilities, and disclosure of contingent assets and liabilities at the date of the financial statements and the reported amounts of revenues and expenses during the reporting period. Actual results could differ from those estimates. In the preparation of these financial statements, management has evaluated subsequent events occurring after the date of the fund’s Statement of Assets and Liabilities through the date that the financial statements were issued. The fund invests in foreign securities, including securities of emerging market issuers. Investments in foreign securities are vulnerable to the effects of changes in the relative values of the local currency and the U.S. dollar and to the effects of changes in each country’s legal, political, and economic environment. The markets of emerging markets countries are generally more volatile than the markets of developed countries with more mature economies. All of the risks of investing in foreign securities previously described are heightened when investing in emerging markets countries.
Investment Valuations – Equity securities, including restricted equity securities, are generally valued at the last sale or official closing price as provided by a third-party pricing service on the market or exchange on which they are primarily traded. Equity securities, for which there were no sales reported that day, are generally valued at the last quoted daily bid quotation as provided by a third-party pricing service on the market or exchange on which such securities are primarily traded. Equity securities held short, for which there were no sales reported for that day, are generally valued at the last quoted daily ask quotation as provided by a third-party pricing service on the market or exchange on which such securities are primarily traded. Short-term instruments with a maturity at issuance of 60 days or less generally are valued at amortized cost, which approximates market value. Open-end investment companies are generally valued at net asset value per share. Securities and other assets generally valued on the basis of information from a third-party pricing service may also be valued at a broker/dealer bid quotation. Values obtained from third-party pricing services can utilize both transaction data and market information such as yield, quality, coupon rate, maturity, type of issue, trading characteristics, and other market data. The values of foreign securities and other assets and liabilities expressed in foreign currencies are converted to U.S. dollars using the mean of bid and asked prices for rates provided by a third-party pricing service.
The Board of Trustees has delegated primary responsibility for determining or causing to be determined the value of the fund’s investments (including any fair valuation) to the adviser pursuant to valuation policies and procedures approved by the Board. If the adviser determines that reliable market quotations are not readily available, investments are valued at fair value as determined in good faith by the adviser in accordance with such procedures under the oversight of the Board of Trustees. Under the fund’s valuation policies and procedures, market quotations are not considered to be readily available for most types of debt instruments and floating rate loans and many types of derivatives. These investments are generally valued at fair value based on information from third-party pricing services. In addition, investments may be valued at fair value if the adviser determines that an investment’s value has been materially effected by events occurring after the close of the exchange or market on which the investment is principally traded (such as foreign exchange or market) and prior to the determination of the fund’s net asset value, or after the halting of trading of a specific security where trading does not resume prior to the close of the exchange or market on which the security is principally traded. Events that occur on a frequent basis after foreign markets close (such as developments in foreign markets and significant movements in the U.S. markets) and prior to the determination of the fund’s net asset value may be deemed to have a material effect on the value of securities traded in foreign markets. Accordingly, the fund’s foreign equity securities may often be valued at fair value. The adviser generally relies on third-party pricing services or other information (such as the correlation with price movements of similar securities in the same or other markets; the type, cost and investment characteristics of the security; the business and financial condition of the issuer; and trading and other market data) to assist in determining whether to fair value and at what value to fair value an investment. The value of an investment for purposes of calculating the fund’s net asset value can differ depending on the source and method used to determine value. When fair valuation is used, the value of an investment used to determine the fund’s net asset value may differ from quoted or published prices for the same investment. There can be no assurance that the fund could obtain the fair value assigned to an investment if it were to sell the investment at the same time at which the fund determines its net asset value per share.
17
MFS Core Equity Portfolio
Notes to Financial Statements – continued
Various inputs are used in determining the value of the fund’s assets or liabilities. These inputs are categorized into three broad levels. In certain cases, the inputs used to measure fair value may fall into different levels of the fair value hierarchy. In such cases, an investment’s level within the fair value hierarchy is based on the lowest level of input that is significant to the fair value measurement. The fund’s assessment of the significance of a particular input to the fair value measurement in its entirety requires judgment, and considers factors specific to the investment. Level 1 includes unadjusted quoted prices in active markets for identical assets or liabilities. Level 2 includes other significant observable market-based inputs (including quoted prices for similar securities, interest rates, prepayment speed, and credit risk). Level 3 includes unobservable inputs, which may include the adviser’s own assumptions in determining the fair value of investments. The following is a summary of the levels used as of December 31, 2010 in valuing the fund’s assets or liabilities:
| | | | | | | | | | | | | | | | |
| Investments at Value | | Level 1 | | | Level 2 | | | Level 3 | | | Total | |
| Equity Securities: | | | | | | | | | | | | | | | | |
United States | | | $142,528,658 | | | | $393,452 | | | | $— | | | | $142,922,110 | |
Canada | | | 2,186,081 | | | | — | | | | — | | | | 2,186,081 | |
Israel | | | 1,829,049 | | | | — | | | | — | | | | 1,829,049 | |
Greece | | | 508,984 | | | | — | | | | — | | | | 508,984 | |
United Kingdom | | | — | | | | — | | | | 154,875 | | | | 154,875 | |
Panama | | | 123,564 | | | | — | | | | — | | | | 123,564 | |
| Mutual Funds | | | 60 | | | | — | | | | — | | | | 60 | |
| Total Investments | | | $147,176,396 | | | | $393,452 | | | | $154,875 | | | | $147,724,723 | |
| | | | |
| Short Sales | | | $(1,368,067 | ) | | | $— | | | | $— | | | | $(1,368,067 | ) |
For further information regarding security characteristics, see the Portfolio of Investments.
The following is a reconciliation of level 3 assets for which significant unobservable inputs were used to determine fair value. The table presents the activity of level 3 securities held at the beginning and the end of the period.
| | | | |
| | | Equity
Securities | |
| Balance as of 12/31/09 | | | $152,762 | |
Accrued discounts/premiums | | | — | |
Realized gain (loss) | | | — | |
Change in unrealized appreciation (depreciation) | | | 2,113 | |
Purchases | | | — | |
Sales | | | — | |
Transfers into level 3 | | | — | |
Transfers out of level 3 | | | — | |
| Balance as of 12/31/10 | | | $154,875 | |
The net change in unrealized appreciation (depreciation) from investments still held as level 3 at December 31, 2010 is $2,113.
Foreign Currency Translation – Purchases and sales of foreign investments, income, and expenses are converted into U.S. dollars based upon currency exchange rates prevailing on the respective dates of such transactions or on the reporting date for foreign denominated receivables and payables. Gains and losses attributable to foreign currency exchange rates on sales of securities are recorded for financial statement purposes as net realized gains and losses on investments. Gains and losses attributable to foreign exchange rate movements on receivables, payables, income and expenses are recorded for financial statement purposes as foreign currency transaction gains and losses. That portion of both realized and unrealized gains and losses on investments that results from fluctuations in foreign currency exchange rates is not separately disclosed.
Short Sales – The fund entered into short sales whereby it sells a security it does not own in anticipation of a decline in the value of that security. The fund will realize a gain if the security price decreases and a loss if the security price increases between the date of the short sale and the date on which the fund replaces the borrowed security. Losses from short sales can exceed the proceeds of the security sold; and they can also exceed the potential loss from an ordinary buy and sell transaction. The amount of any premium, dividends, or interest the fund may be required to pay in connection with a short sale will be recognized as a fund expense. During the year ended December 31, 2010, this expense amounted to $15,009. The fund segregates cash or marketable securities in an amount that, when combined with the amount of proceeds from the short sale deposited with the broker, at least equals the current market value of the security sold short.
Security Loans – State Street Bank and Trust Company (“State Street”), as lending agent, loans the securities of the fund to certain qualified institutions (the “Borrowers”) approved by the fund. The loans are collateralized by cash and/or U.S. Treasury and federal agency obligations in an amount typically at least equal to the market value of the securities loaned. The market
18
MFS Core Equity Portfolio
Notes to Financial Statements – continued
value of the loaned securities is determined at the close of business of the fund and any additional required collateral is delivered to the fund on the next business day. State Street provides the fund with indemnification against Borrower default. The fund bears the risk of loss with respect to the investment of cash collateral. On loans collateralized by cash, the cash collateral is invested in a money market fund or short-term securities. A portion of the income generated upon investment of the collateral is remitted to the Borrowers, and the remainder is allocated between the fund and the lending agent. On loans collateralized by U.S. Treasury and/or federal agency obligations, a fee is received from the Borrower, and is allocated between the fund and the lending agent. Income from securities lending is included in interest income on the Statement of Operations. The dividend and interest income earned on the securities loaned is accounted for in the same manner as other dividend and interest income.
Indemnifications – Under the fund’s organizational documents, its officers and Trustees may be indemnified against certain liabilities and expenses arising out of the performance of their duties to the fund. Additionally, in the normal course of business, the fund enters into agreements with service providers that may contain indemnification clauses. The fund’s maximum exposure under these agreements is unknown as this would involve future claims that may be made against the fund that have not yet occurred.
Investment Transactions and Income – Investment transactions are recorded on the trade date. Interest income is recorded on the accrual basis. Dividends received in cash are recorded on the ex-dividend date. Certain dividends from foreign securities will be recorded when the fund is informed of the dividend if such information is obtained subsequent to the ex-dividend date. Dividend and interest payments received in additional securities are recorded on the ex-dividend or ex-interest date in an amount equal to the value of the security on such date.
The fund may receive proceeds from litigation settlements. Any proceeds received from litigation involving portfolio holdings are reflected in the Statement of Operations in realized gain/loss if the security has been disposed of by the fund or in unrealized gain/loss if the security is still held by the fund. Any other proceeds from litigation not related to portfolio holdings are reflected as other income in the Statement of Operations.
Fees Paid Indirectly – The fund’s custody fee may be reduced according to an arrangement that measures the value of cash deposited with the custodian by the fund. This amount, for the year ended December 31, 2010, is shown as a reduction of total expenses on the Statement of Operations.
Tax Matters and Distributions – The fund intends to qualify as a regulated investment company, as defined under Subchapter M of the Internal Revenue Code, and to distribute all of its taxable income, including realized capital gains. As a result, no provision for federal income tax is required. The fund’s federal tax returns for the prior three fiscal years remain subject to examination by the Internal Revenue Service. Foreign taxes, if any, have been accrued by the fund in the accompanying financial statements.
Distributions to shareholders are recorded on the ex-dividend date. Income and capital gain distributions are determined in accordance with income tax regulations, which may differ from U.S. generally accepted accounting principles. Certain capital accounts in the financial statements are periodically adjusted for permanent differences in order to reflect their tax character. These adjustments have no impact on net assets or net asset value per share. Temporary differences which arise from recognizing certain items of income, expense, gain or loss in different periods for financial statement and tax purposes will reverse at some time in the future. Distributions in excess of net investment income or net realized gains are temporary overdistributions for financial statement purposes resulting from differences in the recognition or classification of income or distributions for financial statement and tax purposes.
Book/tax differences primarily relate to wash sale loss deferrals.
The tax character of distributions declared to shareholders for the last two fiscal years is as follows:
| | | | | | | | |
| | | 12/31/10 | | | 12/31/09 | |
| Ordinary income (including any short-term capital gains) | | | $1,519,015 | | | | $2,144,224 | |
19
MFS Core Equity Portfolio
Notes to Financial Statements – continued
The federal tax cost and the tax basis components of distributable earnings were as follows:
| | | | |
| As of 12/31/10 | | | | |
| Cost of investments | | | $132,443,486 | |
| Gross appreciation | | | 21,354,451 | |
| Gross depreciation | | | (6,073,214 | ) |
| Net unrealized appreciation (depreciation) | | | $15,281,237 | |
| Undistributed ordinary income | | | 1,281,435 | |
| Capital loss carryforwards | | | (36,964,571 | ) |
| Other temporary differences | | | (381,817 | ) |
As of December 31, 2010, the fund had capital loss carryforwards available to offset future realized gains. Such losses expire as follows:
| | | | |
| 12/31/16 | | | $(20,593,645 | ) |
| 12/31/17 | | | (16,370,926 | ) |
| Total | | | $(36,964,571 | ) |
Multiple Classes of Shares of Beneficial Interest – The fund offers multiple classes of shares, which differ in their respective distribution and/or service fees. The fund’s income, realized and unrealized gain (loss), and common expenses are allocated to shareholders based on the daily net assets of each class. Dividends are declared separately for each class. Differences in per share dividend rates are generally due to differences in separate class expenses. The fund’s distributions declared to shareholders as reported on the Statements of Changes in Net Assets are presented by class as follows:
| | | | | | | | |
| | | From net investment
income | |
| | | Year ended
12/31/10 | | | Year ended
12/31/09 | |
| Initial Class | | | $1,210,524 | | | | $1,773,261 | |
| Service Class | | | 308,491 | | | | 370,963 | |
| Total | | | $1,519,015 | | | | $2,144,224 | |
| (3) | | Transactions with Affiliates |
Investment Adviser – The fund has an investment advisory agreement with MFS to provide overall investment management and related administrative services and facilities to the fund. The management fee is computed daily and paid monthly at the following annual rates:
| | | | |
| First $1 billion of average daily net assets | | | 0.75% | |
| Average daily net assets in excess of $1 billion | | | 0.65% | |
The investment adviser has agreed in writing to reduce its management fee to 0.60% of average daily net assets in excess of $2.5 billion. This written agreement will continue until modified or rescinded by the fund’s Board of Trustees, but such agreement will continue at least until April 30, 2012. For the year ended December 31, 2010, the fund’s average daily net assets did not exceed $2.5 billion and therefore, the management fee was not reduced. The management fee incurred for the year ended December 31, 2010 was equivalent to an annual effective rate of 0.75% of the fund’s average daily net assets.
The investment adviser has agreed in writing to pay a portion of the fund’s total annual operating expenses, exclusive of interest, taxes, extraordinary expenses, brokerage and transaction costs and investment-related expenses such that total annual operating expenses do not exceed 0.85% of average daily net assets for the Initial Class shares and 1.10% of average daily net assets for the Service Class shares. This written agreement will continue until April 30, 2011. For the year ended December 31, 2010, this reduction amounted to $48,944 and is reflected as a reduction of total expenses in the Statement of Operations.
Distributor – MFS Fund Distributors, Inc. (MFD), a wholly-owned subsidiary of MFS, is the distributor of shares of the fund. The Trustees have adopted a distribution plan for the Service Class shares pursuant to Rule 12b-1 under the Investment Company Act of 1940.
The fund’s distribution plan provides that the fund will pay MFD distribution and/or service fees equal to 0.25% per annum of its average daily net assets attributable to Service Class shares as partial consideration for services performed and expenses incurred by MFD and financial intermediaries (including participating insurance companies that invest in the fund to fund variable annuity and variable life insurance contracts, sponsors of qualified retirement and pension plans that invest in the
20
MFS Core Equity Portfolio
Notes to Financial Statements – continued
fund, and affiliates of these participating insurance companies and plan sponsors) in connection with the sale and distribution of the Service Class shares. MFD may subsequently pay all, or a portion, of the distribution and/or service fees to financial intermediaries.
Shareholder Servicing Agent – MFS Service Center, Inc. (MFSC), a wholly-owned subsidiary of MFS, has contracted to provide transfer agent and recordkeeping functions in connection with the issuance, transfer, and redemption of each class of shares of the fund under a Shareholder Servicing Agent Agreement. During the year ended December 31, 2010, the fund did not pay MFSC a fee for this service.
Administrator – MFS provides certain financial, legal, shareholder communications, compliance, and other administrative services to the fund. Under an administrative services agreement, the fund partially reimburses MFS the costs incurred to provide these services. The fund is charged an annual fixed amount of $10,000 plus a fee based on average daily net assets. The administrative services fee incurred for the year ended December 31, 2010 was equivalent to an annual effective rate of 0.0367% of the fund’s average daily net assets.
Trustees’ and Officers’ Compensation – The fund pays compensation to Trustees in the form of a retainer, attendance fees, and additional compensation to the Board chairperson. The fund does not pay compensation directly to officers of the fund who are also officers of the investment adviser, all of whom receive remuneration for their services to the fund from MFS. Certain officers of the fund are officers or directors of MFS, MFD, and MFSC.
Other – This fund and certain other funds managed by MFS (the funds) have entered into services agreements (the Agreements) which provide for payment of fees by the funds to Tarantino LLC and Griffin Compliance LLC in return for the provision of services of an Independent Chief Compliance Officer (ICCO) and Assistant ICCO, respectively, for the funds. The ICCO and Assistant ICCO are officers of the funds and the sole members of Tarantino LLC and Griffin Compliance LLC, respectively. The funds can terminate the Agreements with Tarantino LLC and Griffin Compliance LLC at any time under the terms of the Agreements. MFS has agreed to bear all expenses associated with office space, other administrative support, and supplies provided to the ICCO and Assistant ICCO. For the year ended December 31, 2010, the aggregate fees paid by the fund to Tarantino LLC and Griffin Compliance LLC were $2,364 and are included in miscellaneous expense on the Statement of Operations.
The fund invests in the MFS Institutional Money Market Portfolio which is managed by MFS and seeks a high level of current income consistent with preservation of capital and liquidity. Income earned on this investment is included in dividends from underlying funds on the Statement of Operations. This money market fund does not pay a management fee to MFS.
Purchases and sales of investments, other than U.S. Government securities, purchased option transactions, and short-term obligations, aggregated $95,221,800 and $110,509,314, respectively.
| (5) | | Shares of Beneficial Interest |
The fund’s Declaration of Trust permits the Trustees to issue an unlimited number of full and fractional shares of beneficial interest. Transactions in fund shares were as follows:
| | | | | | | | | | | | | | | | |
| | | Year ended 12/31/10 | | | Year ended 12/31/09 | |
| | | Shares | | | Amount | | | Shares | | | Amount | |
| Shares sold | | | | | | | | | | | | | | | | |
Initial Class | | | 120,904 | | | | $1,459,987 | | | | 49,334 | | | | $520,084 | |
Service Class | | | 344,200 | | | | 4,323,006 | | | | 828,177 | | | | 8,475,311 | |
| | | 465,104 | | | | $5,782,993 | | | | 877,511 | | | | $8,995,395 | |
| Shares issued to shareholders in reinvestment of distributions | | | | | | | | | | | | | | | | |
Initial Class | | | 91,292 | | | | $1,210,524 | | | | 195,078 | | | | $1,773,261 | |
Service Class | | | 23,406 | | | | 308,491 | | | | 41,036 | | | | 370,963 | |
| | | 114,698 | | | | $1,519,015 | | | | 236,114 | | | | $2,144,224 | |
| Shares reacquired | | | | | | | | | | | | | | | | |
Initial Class | | | (1,244,574 | ) | | | $(15,747,976 | ) | | | (1,687,964 | ) | | | $(16,790,054 | ) |
Service Class | | | (587,843 | ) | | | (7,428,166 | ) | | | (429,882 | ) | | | (4,349,769 | ) |
| | | (1,832,417 | ) | | | $(23,176,142 | ) | | | (2,117,846 | ) | | | $(21,139,823 | ) |
| Net change | | | | | | | | | | | | | | | | |
Initial Class | | | (1,032,378 | ) | | | $(13,077,465 | ) | | | (1,443,552 | ) | | | $(14,496,709 | ) |
Service Class | | | (220,237 | ) | | | (2,796,669 | ) | | | 439,331 | | | | 4,496,505 | |
| | | (1,252,615 | ) | | | $(15,874,134 | ) | | | (1,004,221 | ) | | | $(10,000,204 | ) |
21
MFS Core Equity Portfolio
Notes to Financial Statements – continued
The fund and certain other funds managed by MFS participate in a $1.1 billion unsecured committed line of credit, subject to a $1 billion sublimit, provided by a syndication of banks under a credit agreement. Borrowings may be made for temporary financing needs. Interest is charged to each fund, based on its borrowings, generally at a rate equal to the higher of the Federal Reserve funds rate or one month LIBOR plus an agreed upon spread. A commitment fee, based on the average daily, unused portion of the committed line of credit, is allocated among the participating funds at the end of each calendar quarter. In addition, the fund and other funds managed by MFS have established unsecured uncommitted borrowing arrangements with certain banks for temporary financing needs. Interest is charged to each fund, based on its borrowings, at a rate equal to the Federal Reserve funds rate plus an agreed upon spread. For the year ended December 31, 2010, the fund’s commitment fee and interest expense were $1,556 and $0, respectively, and are included in miscellaneous expense on the Statement of Operations.
| (7) | | Transactions in Underlying Funds – Affiliated Issuers |
An affiliated issuer may be considered one in which the fund owns 5% or more of the outstanding voting securities, or a company which is under common control. For the purposes of this report, the fund assumes the following to be affiliated issuers:
| | | | | | | | | | | | | | | | |
| Underlying Funds | | Beginning
Shares/Par
Amount | | | Acquisitions
Shares/Par
Amount | | | Dispositions
Shares/Par
Amount | | | Ending
Shares/Par
Amount | |
| MFS Institutional Money Market Portfolio | | | 990,356 | | | | 21,012,008 | | | | (22,002,304 | ) | | | 60 | |
| | | | |
| Underlying Funds | | Realized
Gain (Loss) | | | Capital Gain
Distributions | | | Dividend
Income | | | Ending
Value | |
| MFS Institutional Money Market Portfolio | | | $— | | | | $— | | | | $1,446 | | | | $60 | |
22
MFS Core Equity Portfolio
REPORT OF INDEPENDENT REGISTERED PUBLIC ACCOUNTING FIRM
To the Board of Trustees of MFS Variable Insurance Trust II and the Shareholders of
MFS Core Equity Portfolio:
We have audited the accompanying statement of assets and liabilities, including the portfolio of investments, of MFS Core Equity Portfolio (the “Fund”) (one of the portfolios comprising MFS Variable Insurance Trust II) as of December 31, 2010, and the related statement of operations for the year then ended, the statements of changes in net assets for each of the two years in the period then ended, and the financial highlights for each of the five years in the period then ended. These financial statements and financial highlights are the responsibility of the Fund’s management. Our responsibility is to express an opinion on these financial statements and financial highlights based on our audits.
We conducted our audits in accordance with the standards of the Public Company Accounting Oversight Board (United States). Those standards require that we plan and perform the audit to obtain reasonable assurance about whether the financial statements and financial highlights are free of material misstatement. The Fund is not required to have, nor were we engaged to perform, an audit of its internal control over financial reporting. Our audits included consideration of internal control over financial reporting as a basis for designing audit procedures that are appropriate in the circumstances, but not for the purpose of expressing an opinion on the effectiveness of the Fund’s internal control over financial reporting. Accordingly, we express no such opinion. An audit also includes examining, on a test basis, evidence supporting the amounts and disclosures in the financial statements, assessing the accounting principles used and significant estimates made by management, as well as evaluating the overall financial statement presentation. Our procedures included confirmation of securities owned as of December 31, 2010, by correspondence with the custodian. We believe that our audits provide a reasonable basis for our opinion.
In our opinion, the financial statements and financial highlights referred to above present fairly, in all material respects, the financial position of MFS Core Equity Portfolio as of December 31, 2010, the results of its operations for the year then ended, the changes in its net assets for each of the two years in the period then ended, and the financial highlights for each of the five years in the period then ended in conformity with accounting principles generally accepted in the United States of America.
DELOITTE & TOUCHE LLP
Boston, Massachusetts
February 14, 2011
23
MFS Core Equity Portfolio
TRUSTEES AND OFFICERS – IDENTIFICATION AND BACKGROUND
The Trustees and officers of the Trust, as of February 1, 2011, are listed below, together with their principal occupations during the past five years. (Their titles may have varied during that period.) The address of each Trustee and officer is 500 Boylston Street, Boston, Massachusetts 02116.
| | | | | | |
Name, Date of Birth | | Position(s) Held
with Fund | | Trustee/Officer
Since (1) | | Principal Occupations During the Past Five Years and
Other Directorships (2) |
| INTERESTED TRUSTEE | | | | |
David D. Horn (3) (born 6/07/41) | | Trustee | | April 1986 | | Private investor; Sun Life Assurance Company of Canada, Senior Vice President and General Manager for the United States (until 1997); Director (until March 2004) |
| | |
| INDEPENDENT TRUSTEES | | | | |
J. Kermit Birchfield (born 1/08/40) | | Chairman | | May 1997 | | Consultant; Century Partners, Inc. (investments), Director; Displaytech, Inc. (technology), Chairman; Dessin Fournir LLC (furniture manufacturer), Director; Site Watch LLC (software to monitor oil tanks), Managing Director (2006 to present); Juridica Investments (fund investing in judicial matters), Director (2007 to present), Immuno Science, Inc. (medical research), Independent Director (2009 to present), Intermountain Industries, Inc. (oil & gas exploration and production), Director (until February 2009) |
| | | |
Robert C. Bishop (born 1/13/43) | | Trustee | | May 2001 | | AutoImmune, Inc. (pharmaceutical product development), Chairman, President and Chief Executive Officer; Caliper Life Sciences Corp. (laboratory analytical instruments), Chairman; Optobionics Corporation (ophthalmic devices), Director (until 2007); Millipore Corporation (purification/filtration products), Director (until July 2010); Waterstreet Capital (leverage buyouts), Advisory Board (until August 2010) |
| | | |
Frederick H. Dulles (born 3/12/42) | | Trustee | | May 2001 | | Dulles International Law LLC (law firm), Senior Lawyer (since 2009); Juridica Capital Management (US) Inc. (litigation financing), Vice President and General Counsel (since 2009); Dulles Properties LLC (real estate), Broker (since 2008); The Citadel School of Business Administration (education), Adjunct Professor (since 2003); Disher, Hamrick & Myers Residential, Inc. (real estate), Broker (until 2006); Frederick H. Dulles Law Practice (law firm), (until 2006); Charlestown School of Law (education), Adjunct Professor (until 2007); Prudential Carolina Real Estate, (real estate), Broker (until 2008); Free Enterprise Foundation Inc. (research institute), Director & Secretary (until 2008); Ten State International Law PLLP (law firm), Of Counsel (until 2009) |
| | | |
Marcia A. Kean (born 6/30/48) | | Trustee | | April 2005 | | Feinstein Kean Healthcare (consulting), Chief Executive Officer |
| | | |
Ronald G. Steinhart (born 6/15/40) | | Trustee | | May 2001 | | Private investor; Penske Automotive Group (automotive retailer), Director; Animal Health International, Inc. (animal health products), Director (since 2007); Texas Industries (concrete/aggregates/cement), Director (since 2007); Susser Holdings Corporation (retail convenience stores and distributor of wholesale motor fuel), Director (since 2009); Prentiss Properties Trust (real estate investment trust), Director (until 2006); Penson Worldwide, Inc. (securities clearance), Director (until 2008) |
| | | |
Haviland Wright (born 7/21/48) | | Trustee | | May 2001 | | X-Change Corp. (multi-media web services), Director (since 2010); Nano Loa Inc. (liquid crystal displays), Director (until 2009); Profitability of Hawaii (software), Chief Development Officer (until 2010); Elixir Technologies Corporation (software), Director (until 2010) |
| | | |
| OFFICERS | | | | | | |
Maria F. DiOrioDwyer (4)
(born 12/01/58) | | President | | November 2005 | | Massachusetts Financial Services Company, Executive Vice President and Chief Regulatory Officer; Chief Compliance Officer (since December 2006) |
| | | |
| Christopher R. Bohane (4) (born 1/18/74) | | Assistant Secretary and Assistant Clerk | | July 2005 | | Massachusetts Financial Services Company, Vice President and Senior Counsel |
| | | |
John M. Corcoran (4) (born 4/13/65) | | Treasurer | | October 2008 | | Massachusetts Financial Services Company, Senior Vice President (since October 2008); State Street Bank and Trust (financial services provider), Senior Vice President, (until September 2008) |
| | | |
Ethan D. Corey (4) (born 11/21/63) | | Assistant Secretary and Assistant Clerk | | July 2005 | | Massachusetts Financial Services Company, Senior Vice President and Associate General Counsel |
| | | |
David L. DiLorenzo (4) (born 8/10/68) | | Assistant Treasurer | | July 2005 | | Massachusetts Financial Services Company, Vice President |
| | | |
Timothy M. Fagan (4) (born 7/10/68) | | Assistant Secretary and Assistant Clerk | | September 2005 | | Massachusetts Financial Services Company, Vice President and Senior Counsel |
| | | |
Mark D. Fischer (4) (born 10/27/70) | | Assistant Treasurer | | July 2005 | | Massachusetts Financial Services Company, Vice President |
24
MFS Core Equity Portfolio
Trustees and Officers – continued
| | | | | | |
Name, Date of Birth | | Position(s) Held
with Fund | | Trustee/Officer
Since (1) | | Principal Occupations During the Past Five Years and
Other Directorships (2) |
Robyn L. Griffin (born 7/04/75) | | Assistant Independent Chief Compliance Officer | | August 2008 | | Griffin Compliance LLC (provider of compliance services), Principal (since August 2008); State Street Corporation (financial services provider), Mutual Fund Administration Assistant Vice President (October 2006 – July 2008); Liberty Mutual Group (insurance), Personal Market Assistant Controller (April 2006 – October 2006); Deloitte & Touche LLP (professional services firm), Senior Manager (prior to April 2006) |
| | | |
Brian E. Langenfeld (4) (born 3/07/73) | | Assistant Secretary and Assistant Clerk | | May 2006 | | Massachusetts Financial Services Company, Vice President and Senior Counsel (since May 2006); John Hancock Advisers, LLC, Assistant Vice President and Counsel (until April 2006) |
| | | |
Ellen Moynihan (4) (born 11/13/57) | | Assistant Treasurer | | May 1997 | | Massachusetts Financial Services Company, Senior Vice President |
| | | |
Susan S. Newton (4) (born 3/07/50) | | Assistant Secretary and Assistant Clerk | | May 2005 | | Massachusetts Financial Services Company, Senior Vice President and Associate General Counsel |
| | | |
Susan A. Pereira (4)
(born 11/05/70) | | Assistant Secretary and Assistant Clerk | | July 2005 | | Massachusetts Financial Services Company, Vice President and Senior Counsel |
| | | |
Mark N. Polebaum (4) (born 5/01/52) | | Secretary and Clerk | | February 2006 | | Massachusetts Financial Services Company, Executive Vice President, General Counsel and Secretary (since January 2006); Wilmer Cutler Pickering Hale and Dorr LLP (law firm), Partner (until January 2006) |
| | | |
Frank L. Tarantino (born 3/07/44) | | Independent Chief Compliance Officer | | September 2004 | | Tarantino LLC (provider of compliance services), Principal |
| | | |
Richard S. Weitzel (4) (born 7/16/70) | | Assistant Secretary and Assistant Clerk | | October 2007 | | Massachusetts Financial Services Company, Vice President and Assistant General Counsel |
| | | |
James O. Yost (4) (born 6/12/60) | | Assistant Treasurer | | April 1992 | | Massachusetts Financial Services Company, Senior Vice President |
| (1) | Date first appointed to serve as Trustee/Officer of an MFS fund or a Compass variable account. Each Trustee has served continuously since appointment. For the period March 2008 until October 2008, Ms. DiOrioDwyer served as Treasurer of the Funds. |
| (2) | Directorships or trusteeships of companies required to report to the Securities and Exchange Commission (i.e., “public companies”). |
| (3) | “Interested person” of the Trust, within the meaning of the Investment Company Act of 1940 (referred to as the 1940 Act), which is the principal federal law governing investment companies like the Trust, as a result of position with Sun Life of Canada (U.S.). The address of Sun Life of Canada (U.S.) is One Sun Life Executive Park, Wellesley Hills, Massachusetts 02481. |
| (4) | “Interested person” of MFS within the meaning of the 1940 Act. The address of MFS is 500 Boylston Street, Boston, Massachusetts 02116. |
The Trust does not hold annual meetings for the purpose of electing Trustees, and Trustees are not elected for fixed terms. Each Trustee and officer holds office until his or her successor is chosen and qualified, or until his or her earlier death, resignation, retirement or removal.
All Trustees currently serve as Trustees of the Trust and have served in that capacity since originally elected or appointed. All of the Trustees are also Managers of the Compass Variable Accounts. The executive officers of the Trust hold similar offices for the Compass Variable Accounts and other funds in the MFS fund complex. As of January 1, 2011, each Trustee serves as a Trustee or Manager of 31 Accounts/Portfolios.
25
MFS Core Equity Portfolio
Trustees and Officers – continued
The Statement of Additional Information contains further information about the Trustees and is available without charge upon request by calling 1-800-752-7215.
| | |
Investment Adviser
Massachusetts Financial Services Company 500 Boylston Street, Boston, MA 02116-3741 | | Custodian State Street Bank and Trust 1 Lincoln Street, Boston, MA 02111-2900 |
Distributor
MFS Fund Distributors, Inc. 500 Boylston Street, Boston, MA 02116-3741 | | Independent Registered Public Accounting Firm Deloitte & Touche LLP 200 Berkeley Street, Boston, MA 02116 |
Portfolio Managers Joseph MacDougall Katrina Mead | | |
26
MFS Core Equity Portfolio
BOARD REVIEW OF INVESTMENT ADVISORY AGREEMENT
The Investment Company Act of 1940 requires that both the full Board of Trustees and a majority of the non-interested (“independent”) Trustees, voting separately, annually approve the continuation of the investment advisory agreement between MFS Variable Insurance Trust II (the “Trust”) and Massachusetts Financial Services Company (“MFS”) on behalf of the Fund. The Trustees consider matters bearing on the Fund and the advisory arrangement at their meetings throughout the year, including a review of performance data at each regular meeting. In addition, the independent Trustees met in person in May and again in July 2010 (“contract review meetings”) for the specific purpose of considering whether to approve the continuation of the investment advisory agreement for the Fund. The independent Trustees were assisted in their evaluation of the investment advisory agreement by independent legal counsel, from whom they received separate legal advice and with whom they met separately from MFS management during various contract review meetings. The independent Trustees were also assisted in this process by the Fund’s Independent Chief Compliance Officer, a full-time senior officer appointed by and reporting to the independent Trustees.
In connection with their deliberations, the Trustees, including the independent Trustees, considered such information and factors as they believed, in light of the legal advice furnished to them and their own business judgment, to be relevant. The investment advisory agreement was considered separately for the Fund, although the Trustees also took into account the common interests of all Funds in the Trust in their review. As described below, the Trustees considered the nature, quality, and extent of the various investment advisory, administrative, and shareholder services performed by MFS under the existing investment advisory agreement and other arrangements with the Trust.
In connection with their contract review meetings, the Trustees received and relied upon materials which included, among other items: (i) information provided by Lipper Inc. (“Lipper”) on the investment performance of the Fund for various time periods ended December 31, 2009, compared to the investment performance of a group of funds with substantially similar investment classifications/objectives (the “Lipper performance universe”), (ii) information provided by Lipper on the Fund’s advisory fees and other expenses compared to the advisory fees and other expenses of comparable funds identified by Lipper (the “Lipper expense group”), (iii) information provided by MFS on the advisory fees of comparable portfolios of its other clients, including institutional separate account and other clients, (iv) information as to whether, and to what extent applicable, expense waivers, reimbursements or fee “breakpoints” are observed for the Fund, (v) information regarding MFS’ financial results and financial condition, including MFS’ and certain of its affiliates’ estimated profitability from services performed for the Fund, (vi) MFS’ views regarding the outlook for the mutual fund industry and its strategic business plans, (vii) descriptions of various functions performed by MFS for the Trust, such as compliance monitoring and portfolio trading practices, and (viii) information regarding the overall organization of MFS, including information about MFS’ senior management and other personnel providing investment advisory, administrative and other services to the Fund. The comparative performance, fee and expense information prepared and provided by Lipper was not independently verified, and the independent Trustees did not independently verify any information provided to them by MFS.
The Trustees’ conclusion as to the continuation of the investment advisory agreement was based on comprehensive consideration of all information provided to the Trustees and was not the result of any single factor. Some of the factors that figured particularly in the Trustees’ deliberations are described below for the Fund, while individual Trustees may have given different weight to various factors and evaluated the information presented as a whole differently than another individual Trustee. The Trustees recognized that the fee arrangements for the Fund reflect years of review and discussion between the independent Trustees and MFS, that certain aspects of such arrangements may receive greater scrutiny in some years than others, and that the Trustees’ conclusions may be based, in part, on their consideration of these same arrangements during the course of the year and in prior years.
Based on information provided by Lipper, the Trustees compared the Fund’s total return investment performance to the performance of the Lipper performance universe over various time periods. The Trustees placed particular emphasis on the total return performance of the Fund’s Initial Class shares in comparison to the performance of funds in its Lipper performance universe over the one-, three- and five-year periods ended December 31, 2009. The Trustees did not rely on performance results for more recent periods, including those shown elsewhere in this report.
The Trustees noted the performance of the Fund’s Initial Class shares was in the 2nd quintile relative to the other funds in the Lipper performance universe for the one-year period (the 1st quintile being the best performers and the 5th quintile being the worst performers). The total return performance of the Fund was in the 2nd quintile for the three-year period and in the 3rd quintile for the five-year period ended December 31, 2009, relative to the Lipper performance universe. Based on the nature and quality of services provided by MFS, the Board of Trustees concluded that the Fund’s performance was satisfactory.
27
MFS Core Equity Portfolio
Board Review of Investment Advisory Agreement – continued
In the course of their deliberations, the Trustees took into account information provided by MFS during contract review meetings, as well as during investment review meetings conducted with portfolio management personnel during the course of the year.
In assessing the reasonableness of the Fund’s advisory fee, the Trustees considered, among other information, the Fund’s advisory fee and the total expense ratio of the Fund’s Initial Class shares as a percentage of average daily net assets, compared to the advisory fee and total expense ratios of its peer group of funds based on information provided by Lipper. The Trustees also considered the advisory fees charged by MFS to institutional accounts. In comparing these fees, the Trustees considered the generally broader scope of services provided by MFS to the Trust than those provided to institutional accounts. The Trustees also considered the higher demands placed on MFS’ investment personnel and trading infrastructure as a result of the daily cash in-flows and out-flows of the Fund, and the impact on MFS and related expenses due to the more extensive regulatory regime to which the Fund is subject, compared to institutional accounts.
In considering the fees, the Trustees noted from the Lipper data that the Fund’s effective advisory fee rate and total expense ratio were each approximately at the median of such fees and expenses of funds in the Lipper expense group. In addition, the Trustees noted that MFS agreed to continue its waiver to reduce its advisory fee on average daily net assets over $2.5 billion, and they accepted MFS’ offer to continue the expense limitation for the Fund. The Trustees further concluded that the existing breakpoints were sufficient to allow the Fund to benefit from economies of scale as its assets grow. The Trustees concluded that the fees were reasonable in light of the nature and quality of services provided.
The Trustees also considered information prepared by MFS relating to its costs and profits with respect to the Fund and other investment companies and accounts advised by MFS, as well as MFS’ methodologies used to determine and allocate its costs to the Fund and other accounts and products for purposes of estimating profitability.
After reviewing these and other factors described below, the Trustees concluded that the advisory fees charged to the Fund represent reasonable compensation in light of the nature and quality of the services being provided by MFS.
In addition, the Trustees considered MFS’ resources and related efforts to continue to retain, attract and motivate capable personnel to serve the Fund. The Trustees also considered the financial resources of MFS and its parent, Sun Life Financial Inc. The Trustees further considered any advantages and possible disadvantages of having an adviser which also serves other investment companies as well as institutional accounts.
The Trustees also considered the nature, quality, cost, and extent of administrative, transfer agency, and distribution services provided to the Fund by MFS and its affiliates under agreements and plans other than the investment advisory agreement, including the 12b-1 fees the Fund pays to MFS Fund Distributors, Inc., an affiliate of MFS. The Trustees also considered the nature, extent and quality of certain other services MFS performs or arranges on the Fund’s behalf, which may include securities lending programs, directed expense payment programs, class action recovery programs, and MFS’ interaction with third-party service providers, principally custodians and sub-custodians. The Trustees concluded that the various non-advisory services provided by MFS and its affiliates on behalf of the Fund were satisfactory. The Trustees also considered the benefits to MFS from the use of the Fund’s portfolio brokerage commissions to pay for investment research and various other factors. Additionally, the Trustees considered so-called “fall-out benefits” to MFS such as reputational value derived from serving as investment manager to the Trust, and determined that any such benefits derived by MFS were reasonable and fair.
Based on their evaluation of factors that they deemed to be material, including those factors described above, the Board of Trustees, including a majority of the independent Trustees, concluded that the investment advisory agreement should be continued for an additional one-year period, commencing September 1, 2010.
A discussion regarding the Board’s most recent review and renewal of the fund’s Investment Advisory Agreement with MFS is available by clicking on the fund’s name under “Variable Insurance Portfolios — VIT II” in the “Products and Performance” section of the MFS Web site (mfs.com).
28
MFS Core Equity Portfolio
PROXY VOTING POLICIES AND INFORMATION
A general description of the MFS funds’ proxy voting policies and procedures is available without charge, upon request, by calling 1-800-225-2606, by visiting the Proxy Voting section of mfs.com or by visiting the SEC’s Web site at http://www.sec.gov.
Information regarding how the fund voted proxies relating to portfolio securities during the most recent twelve-month period ended June 30 is available without charge by visiting the Proxy Voting section of mfs.com or by visiting the SEC’s Web site at http://www.sec.gov.
QUARTERLY PORTFOLIO DISCLOSURE
The fund will file a complete schedule of portfolio holdings with the Securities and Exchange Commission (the Commission) for the first and third quarters of each fiscal year on Form N-Q. The fund’s Form N-Q may be reviewed and copied at the:
Public Reference Room
Securities and Exchange Commission
100 F Street, NE, Room 1580
Washington, D.C. 20549
Information on the operation of the Public Reference Room may be obtained by calling the Commission at 1-800-SEC-0330. The fund’s Form N-Q is available on the EDGAR database on the Commission’s Internet Web site at http://www.sec.gov, and copies of this information may be obtained, upon payment of a duplicating fee, by electronic request at the following e-mail address: publicinfo@sec.gov or by writing the Public Reference Section at the above address.
FURTHER INFORMATION
From time to time, MFS may post important information about the fund or the MFS funds on the MFS web site (mfs.com). This information is available by visiting the “News & Commentary” section of mfs.com or by clicking on the fund’s name under “Variable Insurance Portfolios — VIT II” in the “Products and Performance” section of mfs.com.
FEDERAL TAX INFORMATION (unaudited)
The following information is provided pursuant to provisions of the Internal Revenue Code.
For corporate shareholders, 100% of the ordinary income dividends paid during the fiscal year qualify for the corporate dividends received deduction.
29
MFS Core Equity Portfolio
MFS® PRIVACY NOTICE
Privacy is a concern for every investor today. At MFS Investment Management® and the MFS funds, we take this concern very seriously. We want you to understand our policies about the investment products and services that we offer, and how we protect the nonpublic personal information of investors who have a direct relationship with us and our wholly owned subsidiaries.
Throughout our business relationship, you provide us with personal information. We maintain information and records about you, your investments, and the services you use. Examples of the nonpublic personal information we maintain include
| | Ÿ | | data from investment applications and other forms |
| | Ÿ | | share balances and transactional history with us, our affiliates, or others |
| | Ÿ | | facts from a consumer reporting agency |
We do not disclose any nonpublic personal information about our customers or former customers to anyone, except as permitted by law. We may share nonpublic personal information with third parties or certain of our affiliates in connection with servicing your account or processing your transactions. We may share information with companies or financial institutions that perform marketing services on our behalf or with other financial institutions with which we have joint marketing arrangements, subject to any legal requirements.
Authorization to access your nonpublic personal information is limited to appropriate personnel who provide products, services, or information to you. We maintain physical, electronic, and procedural safeguards to help protect the personal information we collect about you.
If you have any questions about the MFS privacy policy, please call 1-800-225-2606 any business day.
Note: If you own MFS products or receive MFS services in the name of a third party such as a bank or broker-dealer, their privacy policy may apply to you instead of ours.
30


MFS® STRATEGIC INCOME PORTFOLIO
The report is prepared for the general information of contract owners. It is authorized for distribution to prospective investors only when preceded or accompanied by a current prospectus.
NOT FDIC INSURED Ÿ MAY LOSE VALUE Ÿ NO BANK GUARANTEE Ÿ NOT A DEPOSIT Ÿ NOT INSURED BY ANY FEDERAL GOVERNMENT AGENCY OR NCUA/NCUSIF
MFS Strategic Income Portfolio
LETTER FROM THE CEO

Dear Contract Owners:
After an extended rebound in the financial markets, uncertainty returned in 2010 as investors began to question the durability of the recovery for global economies and markets. That uncertainty led to increased risk aversion, especially as investors saw the eurozone struggle with the debt woes of many of its members. In September, the U.S. Federal Reserve Board’s promises to further loosen monetary policy helped assuage market fears and drive asset prices off their recent lows. A combination of solid earnings and improving economic data gave an additional boost to investor sentiment. As we enter 2011, we are cautiously optimistic that economic growth will continue to improve and that the global economies will recover from the shocks of the past few years. We expect the pace of recovery worldwide will be uneven and volatile.
As always, we continue to be mindful of the many economic challenges faced at the local, national, and international levels. It is in times such as these that we want to remind investors of the merits of maintaining a long-term view, adhering to basic investing principles such as asset allocation and diversification, and working closely with their advisors to research and identify appropriate investment opportunities.
Respectfully,

Robert J. Manning
Chairman and Chief Executive Officer
MFS Investment Management®
February 14, 2011
The opinions expressed in this letter are subject to change, may not be relied upon for investment advice, and no forecasts can be guaranteed.
1
MFS Strategic Income Portfolio
PORTFOLIO COMPOSITION
Portfolio structure (i)

| | | | |
| Fixed income sectors (i) | | | | |
| High Grade Corporates | | | 36.4% | |
| High Yield Corporates | | | 33.6% | |
| Non-U.S. Government Bonds | | | 15.9% | |
| Emerging Markets Bonds | | | 7.0% | |
| Commercial Mortgage-Backed Securities | | | 3.0% | |
| U.S. Government Agencies | | | 1.4% | |
| Collateralized Debt Obligations | | | 0.7% | |
| Floating Rate Loans | | | 0.6% | |
| Mortgage-Backed Securities | | | 0.6% | |
| Asset-Backed Securities | | | 0.5% | |
| U.S. Treasury Securities | | | (0.9)% | |
| | | | |
| Composition including fixed income credit quality (a)(i) | | | | |
| AAA | | | 11.4% | |
| AA | | | 12.1% | |
| A | | | 13.0% | |
| BBB | | | 26.2% | |
| BB | | | 14.1% | |
| B | | | 15.0% | |
| CCC | | | 6.0% | |
| CC | | | 0.1% | |
| C | | | 0.1% | |
| D (o) | | | 0.0% | |
| U.S. Agency (NR) | | | 1.1% | |
| Other Fixed Income (NR) | | | (0.3)% | |
| Non-Fixed Income (NR) | | | 0.4% | |
| Cash & Other | | | 0.8% | |
| | | | |
| Portfolio facts (i) | | | | |
| Average Duration (d) | | | 4.8 | |
| Average Effective Maturity (m) | | | 7.3 yrs. | |
| | | | |
| Issuer country weightings (i) | | | | |
| United States | | | 63.9% | |
| Japan | | | 5.1% | |
| France | | | 4.2% | |
| Canada | | | 3.1% | |
| Germany | | | 3.1% | |
| United Kingdom | | | 2.9% | |
| Netherlands | | | 2.5% | |
| Italy | | | 1.8% | |
| Brazil | | | 1.4% | |
| Other Countries | | | 12.0% | |
| (a) | | The rating categories include debt securities, fixed-income structured products, and securities underlying credit default swaps, where these have long-term public ratings. The credit default swap itself is not rated. All ratings are assigned in accordance with the following hierarchy: If a security is rated by Moody’s, then that rating is used; if not rated by Moody’s, then a Standard & Poor’s rating is used; if not rated by S&P, then a Fitch rating is used. Ratings from Moody’s are shown in the S&P and Fitch scale (e.g., AAA). All ratings are subject to change. U.S. Agency (NR) includes unrated U.S. Agency fixed income securities and collateralized mortgage obligations of U.S. Agency mortgage-backed securities. Other Fixed Income (NR) includes unrated long-term fixed income securities, interest rate swaps and fixed income futures. Non-Fixed Income (NR) includes equity securities (including convertible bonds and equity derivatives) and commodities. Cash & Other includes cash, other assets less liabilities, offsets to derivative positions, and short-term securities. The fund may not hold all of these instruments. |
| (d) | | Duration is a measure of how much a bond’s price is likely to fluctuate with general changes in interest rates, e.g., if rates rise 1.00%, a bond with a 5-year duration is likely to lose about 5.00% of its value due to the interest rate move. |
| (i) | | For purposes of this presentation, the components include the market value of securities, and reflect the impact of the equivalent exposure of derivative positions, if applicable. These amounts may be negative from time to time. The bond component will include any accrued interest amounts. Equivalent exposure is a calculated amount that translates the derivative position into a reasonable approximation of the amount of the underlying asset that the portfolio would have to hold at a given point in time to have the same price sensitivity that results from the portfolio’s ownership of the derivative contract. When dealing with derivatives, equivalent exposure is a more representative measure of the potential impact of a position on portfolio performance than market value. Where the fund holds convertible bonds, these are treated as part of the equity portion of the portfolio. |
| (m) | | In determining an instrument’s effective maturity for purposes of calculating the fund’s dollar-weighted average effective maturity, MFS uses the instrument’s stated maturity or, if applicable, an earlier date on which MFS believes it is probable that a maturity-shortening device (such as a put, pre-refunding or prepayment) will cause the instrument to be repaid. Such an earlier date can be substantially shorter than the instrument’s stated maturity. |
Percentages are based on net assets as of 12/31/10, unless otherwise noted.
The portfolio is actively managed and current holdings may be different.
2
MFS Strategic Income Portfolio
MANAGEMENT REVIEW
Summary of Results
For the twelve months ended December 31, 2010, Initial Class shares of the MFS Strategic Income Portfolio (the “fund”) provided a total return of 10.27%, while Service Class shares of the fund provided a total return of 10.05%. These compare with a return of 15.12% for the fund’s benchmark, the Barclays Capital U.S. High-Yield Corporate Bond Index. The fund’s other benchmark, the Strategic Income Blended Index (the “Blended Index”), generated a return of 9.56%. The Blended Index reflects the blended returns of various fixed income market indices, with percentage allocations to each index designed to resemble the fixed income allocations of the fund. The market indices and related percentage allocations used to compile the Blended Index are set forth in the Performance Summary.
Market Environment
The first quarter of the reporting period witnessed a continuation of the financial market and macroeconomic rebounds that had begun in early 2009. These recoveries in global activity and asset valuations were generally synchronized around the world, led importantly by emerging Asian economies, but broadening to include most of the global economy to varying degrees. Primary drivers of the recoveries included an unwinding of the inventory destocking that took place earlier, the production of manufacturing and capital goods, as well as massive fiscal and monetary stimulus.
During most of the remainder of the period, heightened risk surrounding the public-debt profiles of several of the peripheral European countries impaired market sentiment. At the same time, the improving trend in global macroeconomic data began to weaken somewhat. These two dynamics caused many asset prices to retrench significantly, as many questioned the durability of the global recovery.
Towards the end of the period, the U.S. Federal Reserve led markets to believe that further monetary loosening would be forthcoming if macroeconomic activity did not show signs of improvement. The prospects for more easing by the Fed improved market sentiment and drove risk-asset prices markedly higher. However, in a text-book case of “buy the rumor, sell the fact,” the weeks following the early November announcement of further quantitative easing saw a sell-off in U.S. Treasury bonds. This rise in Treasury yields occurred despite risk-off behavior in equities and credit markets (which would normally result in Treasury yield compression), and appears to have been the result of a few factors: signs of improved U.S. and global economic activity; opposition to quantitative easing from some quarters; and crowded long positions in U.S. Treasuries. The December agreement on an expansionary U.S. fiscal package also boosted sentiment, leading markets to reach near-term highs in risky asset valuations toward year end.
Detractors from Performance
Relative to the Blended Index, the fund’s lesser exposure to mortgage-backed securities, particularly to Government National Mortgage Association (Ginnie Mae) and Federal National Mortgage Association (Fannie Mae) securities, detracted from relative performance as this market segment turned in strong performance over the reporting period.
A lower relative exposure to “CCC” rated (r) securities also detracted from performance as credit spreads narrowed and securities in this rating category generally increased in value.
Contributors to Performance
The fund’s return from yield, which was greater than that of the Blended Index, was a key driver of positive relative performance.
A greater relative exposure to “BBB” rated securities also contributed to performance as bonds within this credit quality sector outperformed higher-quality issues over the reporting period.
Security selection was another positive factor for relative results. Individual securities that were among the fund’s top contributors included television station operator Local TV Finance LLC, financial services company ING Groep N.V. and television station holding company Newport Television LLC.
Our underweight position in the PIIGS (Portugal, Italy, Ireland, Greece and Spain) also benefited relative returns as these bonds turned in weak performance relative to the benchmark over the reporting period.
3
MFS Strategic Income Portfolio
Management Review – continued
Respectfully,
| | | | | | | | |
| John Addeo | | James Calmas | | Robert Persons | | Matthew Ryan | | Erik Weisman |
| Portfolio Manager | | Portfolio Manager | | Portfolio Manager | | Portfolio Manager | | Portfolio Manager |
| (r) | Bonds rated “BBB”, “Baa”, or higher are considered investment grade; bonds rated “BB”, “Ba”, or below are considered non-investment grade. The primary source for bond quality ratings is Moody’s Investors Service. If not available, ratings by Standard & Poor’s are used, else ratings by Fitch, Inc. For securities which are not rated by any of the three agencies, the security is considered Not Rated. |
The views expressed in this report are those of the portfolio managers only through the end of the period of the report as stated on the cover and do not necessarily reflect the views of MFS or any other person in the MFS organization. These views are subject to change at any time based on market or other conditions, and MFS disclaims any responsibility to update such views. These views may not be relied upon as investment advice or an indication of trading intent on behalf of any MFS portfolio. References to specific securities are not recommendations of such securities, and may not be representative of any MFS portfolio’s current or future investments.
4
MFS Strategic Income Portfolio
PERFORMANCE SUMMARY THROUGH 12/31/10
The following chart illustrates the historical performance of the fund in comparison to its benchmark(s). Benchmarks are unmanaged and may not be invested in directly. Benchmark returns do not reflect any fees or expenses. The performance of other share classes will be greater than or less than that of the class depicted below. (See Notes to Performance Summary.)
Performance data shown represents past performance and is no guarantee of future results. Investment return and principal value fluctuate so your units, when sold, may be worth more or less than the original cost; current performance may be lower or higher than quoted. The performance shown does not reflect the deduction of taxes, if any, that a contract holder would pay on fund distributions or the redemption of contract units. The returns for the fund shown also do not reflect the deduction of expenses associated with variable products, such as mortality and expense risk charges, separate account charges, and sales charges imposed by the insurance company separate accounts. Such expenses would reduce the overall returns shown.
Growth of a Hypothetical $10,000 Investment
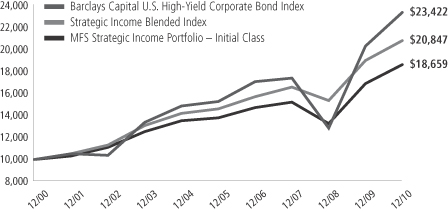
Total Returns through 12/31/10
Average annual total returns
| | | | | | | | | | | | | | |
| | | Share class | | Class inception date | | 1-yr | | 5-yr | | 10-yr | | Life (t) | | |
| | | Initial Class | | 5/06/98 | | 10.27% | | 6.21% | | 6.44% | | N/A | | |
| | | Service Class | | 8/24/01 | | 10.05% | | 5.96% | | N/A | | 6.40% | | |
Comparative benchmarks
| | | | | | | | | | | | | | |
| | | Barclays Capital U.S. High-Yield Corporate Bond Index (f) | | 15.12% | | 8.91% | | 8.88% | | N/A | | |
| | | Strategic Income Blended Index (f)(x) | | 9.56% | | 7.35% | | 7.62% | | N/A | | |
| | | Barclays Capital U.S. Credit Bond Index (f) | | 8.47% | | 5.98% | | 6.55% | | N/A | | |
| | | Barclays Capital U.S. Government/Mortgage Bond Index (f) | | 5.41% | | 5.88% | | 5.64% | | N/A | | |
| | | Citigroup World Government Bond Non-Dollar Hedged Index (f) | | 2.48% | | 4.15% | | 4.64% | | N/A | | |
| | | Citigroup World Government Bond Non-Dollar Index (f) | | 5.21% | | 7.59% | | 7.42% | | N/A | | |
| | | JPMorgan Emerging Markets Bond Index Global (f) | | 12.04% | | 8.36% | | 10.29% | | N/A | | |
| (f) | Source: FactSet Research Systems Inc. |
| (t) | For the period from the class inception date through the stated period end (for those share classes with less than 10 years of performance history). No comparative benchmark performance information is provided for “life” periods. (See Notes to Performance Summary.) |
| (x) | Strategic Income Blended Index is at a point in time and allocations during the period can change. As of December 31, 2010, the blended index was comprised of 10% Barclays Capital U.S. Credit Bond Index, 33% Barclays Capital U.S. High-Yield Corporate Bond Index, 14% JPMorgan Emerging Markets Bond Index Global, 8.5% Citigroup World Government Bond Non-Dollar Hedged Index, 8.5% Citigroup World Government Bond Non-Dollar Index, and 26% Barclays Capital U.S. Government/Mortgage Bond Index. |
5
MFS Strategic Income Portfolio
Performance Summary – continued
Benchmark Definitions
Barclays Capital U.S. Credit Bond Index – a market capitalization-weighted index that measures the performance of publicly issued, SEC-registered, U.S. corporate and specified foreign debentures and secured notes that meet specified maturity, liquidity, and quality requirements.
Barclays Capital U.S. Government/Mortgage Bond Index – measures debt issued by the U.S. Government, and its agencies, as well as mortgage-backed pass-through securities of Ginnie Mae (GNMA), Fannie Mae (FNMA), and Freddie Mac (FHLMC).
Barclays Capital U.S. High-Yield Corporate Bond Index – a market capitalization-weighted index that measures the performance of non-investment grade, fixed rate debt. Eurobonds and debt issues from countries designated as emerging markets (e.g., Argentina, Brazil, Venezuela, etc.) are excluded.
Citigroup World Government Bond Non-Dollar Hedged Index – a market capitalization-weighted index that is designed to represent the currency-hedged performance of the international developed government bond markets, excluding the United States.
Citigroup World Government Bond Non-Dollar Index – a market capitalization-weighted index that is designed to represent the performance of the international developed government bond markets, excluding the United States.
JPMorgan Emerging Markets Bond Index Global – measures the performance of U.S.-dollar-denominated debt instruments issued by emerging market sovereign and quasi-sovereign entities: Brady bonds, loans, Eurobonds.
It is not possible to invest directly in an index.
Notes to Performance Summary
Average annual total return represents the average annual change in value for each share class for the periods presented. Life returns are presented where the share class has less than 10 years of performance history and represent the average annual total return from the class inception date to the stated period end date. As the fund’s share classes may have different inception dates, the life returns may represent different time periods and may not be comparable. As a result, no comparative benchmark performance information is provided for life periods.
Performance results reflect any applicable expense subsidies and waivers in effect during the periods shown. Without such subsidies and waivers the fund’s performance results would be less favorable. Please see the prospectus and financial statements for complete details. All results are historical and assume the reinvestment of any dividends and capital gains distributions.
From time to time the fund may receive proceeds from litigation settlements, without which performance would be lower.
6
MFS Strategic Income Portfolio
EXPENSE TABLE
Fund Expenses Borne by the Contract Holders During the Period,
July 1, 2010 through December 31, 2010
As a contract holder of the fund, you incur ongoing costs, including management fees; distribution and/or service (12b-1) fees; and other fund expenses. This example is intended to help you understand your ongoing costs (in dollars) of investing in the fund and to compare these costs with the ongoing costs of investing in other mutual funds.
The example is based on an investment of $1,000 invested at the beginning of the period and held for the entire period July 1, 2010 through December 31, 2010.
Actual Expenses
The first line for each share class in the following table provides information about actual account values and actual expenses. You may use the information in this line, together with the amount you invested, to estimate the expenses that you paid over the period. Simply divide your account value by $1,000 (for example, an $8,600 account value divided by $1,000 = 8.6), then multiply the result by the number in the first line under the heading entitled “Expenses Paid During Period” to estimate the expenses you paid on your account during this period.
Hypothetical Example for Comparison Purposes
The second line for each share class in the following table provides information about hypothetical account values and hypothetical expenses based on the fund’s actual expense ratio and an assumed rate of return of 5% per year before expenses, which is not the fund’s actual return. The hypothetical account values and expenses may not be used to estimate the actual ending account balance or expenses you paid for the period. You may use this information to compare the ongoing costs of investing in the fund and other funds. To do so, compare this 5% hypothetical example with the 5% hypothetical examples that appear in the shareholder reports of the other funds.
Please note that the expenses shown in the table are meant to highlight the fund’s ongoing costs only and do not take into account the fees and expenses imposed under the variable contracts through which your investment in the fund is made. Therefore, the second line for each share class in the table is useful in comparing ongoing costs associated with an investment in vehicles (such as the fund) which fund benefits under variable annuity and variable life insurance contracts and to qualified pension and retirement plans only, and will not help you determine the relative total costs of investing in the fund through variable annuity and variable life insurance contracts. If the fees and expenses imposed under the variable contracts were included, your costs would have been higher.
| | | | | | | | | | | | | | | | | | |
| Share Class | | | | Annualized
Expense Ratio | | | Beginning
Account Value
7/01/10 | | | Ending Account Value
12/31/10 | | | Expenses Paid
During Period (p)
7/01/10-12/31/10 | |
| Initial Class | | Actual | | | 0.90% | | | | $1,000.00 | | | | $1,060.15 | | | | $4.67 | |
| | Hypothetical (h) | | | 0.90% | | | | $1,000.00 | | | | $1,020.67 | | | | $4.58 | |
| Service Class | | Actual | | | 1.15% | | | | $1,000.00 | | | | $1,059.40 | | | | $5.97 | |
| | Hypothetical (h) | | | 1.15% | | | | $1,000.00 | | | | $1,019.41 | | | | $5.85 | |
| (h) | 5% class return per year before expenses. |
| (p) | Expenses paid is equal to each class’ annualized expense ratio, as shown above, multiplied by the average account value over the period, multiplied by the number of days in the period, divided by the number of days in the year. |
7
MFS Strategic Income Portfolio
PORTFOLIO OF INVESTMENTS – 12/31/10
The Portfolio of Investments is a complete list of all securities owned by your fund. It is categorized by broad-based asset classes.
| | | | | | | | |
| Issuer | | Shares/Par | | | Value ($) | |
| | | | | | | | |
| BONDS – 97.1% | | | | | | | | |
| Aerospace – 0.5% | | | | | |
| Alliant Techsystems, Inc., 6.875%, 2020 | | $ | 25,000 | | | $ | 25,719 | |
| BE Aerospace, Inc., 8.5%, 2018 | | | 45,000 | | | | 49,275 | |
| Bombardier, Inc., 7.5%, 2018 (n) | | | 85,000 | | | | 91,163 | |
Hawker Beechcraft Acquisition Co. LLC,
8.5%, 2015 | | | 75,000 | | | | 55,688 | |
| Oshkosh Corp., 8.25%, 2017 | | | 35,000 | | | | 38,028 | |
| | | | | | | | |
| | | | | | $ | 259,873 | |
| | | | | | | | |
| Apparel Manufacturers – 0.3% | | | | | |
| Hanesbrands, Inc., 8%, 2016 | | $ | 50,000 | | | $ | 53,625 | |
| Hanesbrands, Inc., 6.375%, 2020 (n) | | | 20,000 | | | | 19,000 | |
Phillips-Van Heusen Corp.,
7.375%, 2020 | | | 55,000 | | | | 58,438 | |
| | | | | | | | |
| | | | | | $ | 131,063 | |
| | | | | | | | |
| Asset-Backed & Securitized – 5.5% | | | | | |
| Anthracite Ltd., CDO, 6%, 2037 (z) | | $ | 200,000 | | | $ | 60,000 | |
| ARCap REIT, Inc., CDO, “H”, 6.078%, 2045 (z) | | | 200,000 | | | | 11,500 | |
| Bank of Nova Scotia, 1.45%, 2013 (n) | | | 240,000 | | | | 240,029 | |
| Bayview Financial Revolving Mortgage Loan Trust, FRN, 1.86%, 2040 (z) | | | 187,219 | | | | 85,353 | |
| Brazilian Merchant Voucher Receivables Ltd., 5.911%, 2011 (z) | | | 37,996 | | | | 38,566 | |
Capital Trust Realty Ltd., CDO,
5.16%, 2035 (z) | | | 160,000 | | | | 160,800 | |
| Chase Commercial Mortgage Securities Corp., 6.6%, 2029 (z) | | | 89,817 | | | | 94,378 | |
Compagnie de Financement Foncier,
FRN, 1.038%, 2012 (n) | | | 400,000 | | | | 399,422 | |
Crest Ltd., “A1” CDO,
FRN, 0.782%, 2018 (z) | | | 147,206 | | | | 125,125 | |
| Crest Ltd., CDO, 7%, 2040 | | | 279,533 | | | | 13,977 | |
Deutsche Mortgage & Asset Receiving Corp.,
FRN, 7.5%, 2031 | | | 151,034 | | | | 151,984 | |
| Falcon Franchise Loan LLC, 6.5%, 2014 (z) | | | 99,333 | | | | 84,433 | |
Falcon Franchise Loan LLC, FRN,
3.165%, 2023 (i)(z) | | | 343,252 | | | | 14,657 | |
Falcon Franchise Loan LLC, FRN,
3.246%, 2025 (i)(z) | | | 530,968 | | | | 40,885 | |
| First Union-Lehman Brothers Bank of America, FRN, 0.426%, 2035 (i) | | | 2,196,079 | | | | 37,844 | |
| First Union-Lehman Brothers Commercial Mortgage Trust, 7%, 2029 (n) | | | 81,851 | | | | 85,267 | |
| GMAC LLC, FRN, 6.02%, 2033 (z) | | | 350,000 | | | | 360,153 | |
| Hertz Global Holdings, Inc., 4.26%, 2014 (n) | | | 150,000 | | | | 156,956 | |
Morgan Stanley Capital I, Inc., FRN,
1.419%, 2039 (i)(z) | | | 1,710,087 | | | | 41,897 | |
| Prudential Securities Secured Financing Corp., FRN, 7.285%, 2013 (z) | | | 411,000 | | | | 412,468 | |
| Salomon Brothers Mortgage Securities, Inc., FRN, 7.078%, 2032 (z) | | | 210,129 | | | | 221,509 | |
| | | | | | | | |
| | | | | | $ | 2,837,203 | |
| | | | | | | | |
| | | | | | | | |
| Issuer | | Shares/Par | | | Value ($) | |
| | | | | | | | |
| BONDS – continued | | | | | |
| Automotive – 1.3% | | | | | |
| Accuride Corp., 9.5%, 2018 (n) | | $ | 50,000 | | | $ | 54,125 | |
| Allison Transmission, Inc., 11%, 2015 (n) | | | 55,000 | | | | 59,950 | |
| Ford Motor Credit Co. LLC, 12%, 2015 | | | 330,000 | | | | 415,120 | |
| General Motors Corp., 7.125%, 2013 (d) | | | 69,000 | | | | 23,115 | |
| Goodyear Tire & Rubber Co., 10.5%, 2016 | | | 75,000 | | | | 85,500 | |
| Johnson Controls, Inc., 5.25%, 2011 | | | 60,000 | | | | 60,069 | |
| | | | | | | | |
| | | | | | $ | 697,879 | |
| | | | | | | | |
| Basic Industry – 0.1% | | | | | |
| Trimas Corp., 9.75%, 2017 | | $ | 55,000 | | | $ | 60,225 | |
| | | | | | | | |
| Broadcasting – 2.9% | | | | | | | | |
| Allbritton Communications Co., 8%, 2018 | | $ | 45,000 | | | $ | 45,450 | |
| CBS Corp., 5.75%, 2020 | | | 40,000 | | | | 42,507 | |
Citadel Broadcasting Corp.,
7.75%, 2018 (z) | | | 5,000 | | | | 5,175 | |
Entravision Communications Corp.,
8.75%, 2017 (n) | | | 10,000 | | | | 10,550 | |
| Intelsat Bermuda Ltd., 11.25%, 2017 | | | 25,000 | | | | 27,250 | |
| Intelsat Jackson Holdings Ltd., 9.5%, 2016 | | | 180,000 | | | | 189,900 | |
Intelsat Jackson Holdings Ltd.,
7.25%, 2020 (n) | | | 30,000 | | | | 30,300 | |
| Lamar Media Corp., “C”, 6.625%, 2015 | | | 55,000 | | | | 55,825 | |
| LBI Media, Inc., 8.5%, 2017 (z) | | | 55,000 | | | | 44,688 | |
| Local TV Finance LLC, 9.25%, 2015 (p)(z) | | | 66,375 | | | | 60,401 | |
| NBC Universal, Inc., 5.95%, 2041 (n) | | | 161,000 | | | | 160,984 | |
| Newport Television LLC, 13%, 2017 (n)(p) | | | 21,849 | | | | 19,620 | |
| News America, Inc., 6.4%, 2035 | | | 220,000 | | | | 236,369 | |
| News America, Inc., 6.9%, 2039 | | | 47,000 | | | | 53,811 | |
Nexstar Broadcasting, Inc.,
0.5% to 2011, 7% to 2014 (p) | | | 89,774 | | | | 87,093 | |
| Nexstar Broadcasting, Inc., 7%, 2014 | | | 30,000 | | | | 29,325 | |
| Salem Communications Corp., 9.625%, 2016 | | | 7,000 | | | | 7,420 | |
Sinclair Broadcast Group, Inc.,
9.25%, 2017 (n) | | | 25,000 | | | | 27,063 | |
Sinclair Broadcast Group, Inc.,
8.375%, 2018 (n) | | | 5,000 | | | | 5,163 | |
| SIRIUS XM Radio, Inc., 13%, 2013 (z) | | | 15,000 | | | | 17,850 | |
| SIRIUS XM Radio, Inc., 8.75%, 2015 (n) | | | 30,000 | | | | 32,475 | |
| SIRIUS XM Radio, Inc., 7.625%, 2018 (n) | | | 35,000 | | | | 36,138 | |
| Univision Communications, Inc., 12%, 2014 (n) | | | 11,000 | | | | 12,045 | |
Univision Communications, Inc.,
9.75%, 2015 (n)(p) | | | 213,069 | | | | 223,279 | |
Univision Communications, Inc.,
7.875%, 2020 (n) | | | 20,000 | | | | 21,000 | |
| | | | | | | | |
| | | | | | $ | 1,481,681 | |
| | | | | | | | |
| Brokerage & Asset Managers – 0.9% | | | | | |
| E*TRADE Financial Corp., 7.875%, 2015 | | $ | 40,000 | | | $ | 39,700 | |
| E*TRADE Financial Corp., 12.5%, 2017 | | | 25,000 | | | | 29,375 | |
| Janus Capital Group, Inc., 6.95%, 2017 | | | 70,000 | | | | 72,928 | |
| TD AMERITRADE Holding Corp., 5.6%, 2019 | | | 310,000 | | | | 324,634 | |
| | | | | | | | |
| | | | | | $ | 466,637 | |
| | | | | | | | |
8
MFS Strategic Income Portfolio
Portfolio of Investments – continued
| | | | | | | | |
| Issuer | | Shares/Par | | | Value ($) | |
| | | | | | | | |
| BONDS – continued | | | | | |
| Building – 1.3% | | | | | |
Building Materials Holding Corp.,
6.875%, 2018 (n) | | $ | 20,000 | | | $ | 19,800 | |
Building Materials Holding Corp.,
7%, 2020 (n) | | | 20,000 | | | | 20,550 | |
| CRH PLC, 8.125%, 2018 | | | 120,000 | | | | 138,708 | |
| Lafarge S.A., 6.15%, 2011 | | | 330,000 | | | | 338,608 | |
| Nortek, Inc., 11%, 2013 | | | 80,288 | | | | 85,507 | |
| Nortek, Inc., 10%, 2018 (z) | | | 10,000 | | | | 10,325 | |
| Ply Gem Industries, Inc., 11.75%, 2013 | | | 35,000 | | | | 37,450 | |
| | | | | | | | |
| | | | | | $ | 650,948 | |
| | | | | | | | |
| Business Services – 0.6% | | | | | |
| First Data Corp., 9.875%, 2015 | | $ | 70,000 | | | $ | 66,675 | |
| Interactive Data Corp., 10.25%, 2018 (n) | | | 45,000 | | | | 49,275 | |
| Iron Mountain, Inc., 6.625%, 2016 | | | 60,000 | | | | 60,225 | |
| Iron Mountain, Inc., 8.375%, 2021 | | | 25,000 | | | | 26,813 | |
| SunGard Data Systems, Inc., 10.25%, 2015 | | | 91,000 | | | | 95,664 | |
| SunGard Data Systems, Inc., 7.375%, 2018 (n) | | | 20,000 | | | | 20,100 | |
| SunGard Data Systems, Inc., 7.625%, 2020 (n) | | | 10,000 | | | | 10,125 | |
| | | | | | | | |
| | | | | | $ | 328,877 | |
| | | | | | | | |
| Cable TV – 2.6% | | | | | |
| Bresnan Broadband Holdings LLC, 8%, 2018 (z) | | $ | 10,000 | | | $ | 10,300 | |
| Cablevision Systems Corp., 8.625%, 2017 | | | 35,000 | | | | 38,106 | |
| CCH II LLC, 13.5%, 2016 | | | 55,000 | | | | 65,588 | |
| CCO Holdings LLC, 7.875%, 2018 | | | 85,000 | | | | 87,975 | |
| CCO Holdings LLC, 8.125%, 2020 | | | 10,000 | | | | 10,525 | |
| Charter Communications Operating LLC, 10.875%, 2014 (n) | | | 35,000 | | | | 39,113 | |
| CSC Holdings LLC, 8.5%, 2014 | | | 80,000 | | | | 87,900 | |
| CSC Holdings LLC, 8.5%, 2015 | | | 25,000 | | | | 27,125 | |
| DIRECTV Holdings LLC, 5.875%, 2019 | | | 70,000 | | | | 76,079 | |
| EchoStar Corp., 7.125%, 2016 | | | 35,000 | | | | 36,138 | |
Insight Communications Co., Inc.,
9.375%, 2018 (n) | | | 30,000 | | | | 31,950 | |
| Mediacom LLC, 9.125%, 2019 | | | 55,000 | | | | 56,100 | |
Myriad International Holdings B.V.,
6.375%, 2017 (n) | | | 128,000 | | | | 134,067 | |
| TCI Communications, Inc., 9.8%, 2012 | | | 245,000 | | | | 266,666 | |
| Time Warner Cable, Inc., 8.25%, 2019 | | | 190,000 | | | | 236,013 | |
| Videotron LTEE, 6.875%, 2014 | | | 35,000 | | | | 35,438 | |
| Virgin Media Finance PLC, 9.125%, 2016 | | | 100,000 | | | | 106,500 | |
| | | | | | | | |
| | | | | | $ | 1,345,583 | |
| | | | | | | | |
| Chemicals – 2.6% | | | | | |
| Ashland, Inc., 9.125%, 2017 | | $ | 95,000 | | | $ | 109,488 | |
| Braskem S.A., 7%, 2020 (n) | | | 129,000 | | | | 133,193 | |
Celanese U.S. Holdings LLC,
6.625%, 2018 (n) | | | 30,000 | | | | 30,975 | |
| Dow Chemical Co., 8.55%, 2019 | | | 260,000 | | | | 325,844 | |
Hexion Specialty Chemicals, Inc.,
8.875%, 2018 | | | 70,000 | | | | 74,813 | |
| Hexion U.S. Finance Corp/Hexion Nova Scotia Finance, 9%, 2020 (n) | | | 10,000 | | | | 10,575 | |
Huntsman International LLC,
8.625%, 2021 (n) | | | 80,000 | | | | 86,400 | |
| | | | | | | | |
| Issuer | | Shares/Par | | | Value ($) | |
| | | | | | | | |
| BONDS – continued | | | | | |
| Chemicals – continued | | | | | |
| Lyondell Chemical Co., 11%, 2018 | | $ | 143,356 | | | $ | 162,351 | |
| Momentive Performance Materials, Inc., 12.5%, 2014 | | | 65,000 | | | | 72,556 | |
| Momentive Performance Materials, Inc., 11.5%, 2016 | | | 36,000 | | | | 39,060 | |
Momentive Performance Materials, Inc.,
9%, 2021 (n) | | | 25,000 | | | | 26,375 | |
| Nalco Finance Holdings, Inc., 9%, 2014 | | | 115,000 | | | | 117,300 | |
| Polypore International, Inc., 7.5%, 2017 (z) | | | 5,000 | | | | 5,100 | |
| Sociedad Quimica y Minera de Chile S.A., 5.5%, 2020 (n) | | | 100,000 | | | | 102,011 | |
| Solutia, Inc., 7.875%, 2020 | | | 60,000 | | | | 64,200 | |
| | | | | | | | |
| | | | | | $ | 1,360,241 | |
| | | | | | | | |
| Computer Software – 0.3% | | | | | |
| Oracle Corp., 5.375%, 2040 (n) | | $ | 103,000 | | | $ | 104,299 | |
| Syniverse Holdings, Inc., 9.125%, 2019 (z) | | | 35,000 | | | | 36,138 | |
| | | | | | | | |
| | | | | | $ | 140,437 | |
| | | | | | | | |
| Computer Software – Systems – 0.1% | | | | | |
DuPont Fabros Technology, Inc., REIT,
8.5%, 2017 | | $ | 45,000 | | | $ | 48,150 | |
| | | | | | | | |
| Conglomerates – 0.2% | | | | | |
| Amsted Industries, Inc., 8.125%, 2018 (n) | | $ | 50,000 | | | $ | 53,063 | |
| Pinafore LLC, 9%, 2018 (n) | | | 45,000 | | | | 48,600 | |
| | | | | | | | |
| | | | | | $ | 101,663 | |
| | | | | | | | |
| Consumer Products – 0.9% | | | | | |
| ACCO Brands Corp., 10.625%, 2015 | | $ | 5,000 | | | $ | 5,625 | |
| ACCO Brands Corp., 7.625%, 2015 | | | 25,000 | | | | 25,000 | |
| Central Garden & Pet Co., 8.25%, 2018 | | | 40,000 | | | | 40,500 | |
| Easton-Bell Sports, Inc., 9.75%, 2016 | | | 45,000 | | | | 49,388 | |
| Jarden Corp., 7.5%, 2017 | | | 55,000 | | | | 57,956 | |
| Libbey Glass, Inc., 10%, 2015 (n) | | | 45,000 | | | | 48,375 | |
| NBTY, Inc., 9%, 2018 (n) | | | 5,000 | | | | 5,338 | |
| Newell Rubbermaid, Inc., 4.7%, 2020 | | | 97,000 | | | | 96,219 | |
| Scotts Miracle-Gro Co., 6.625%, 2020 (z) | | | 5,000 | | | | 5,000 | |
| Visant Corp., 10%, 2017 (n) | | | 40,000 | | | | 42,500 | |
| Whirlpool Corp., 8%, 2012 | | | 91,000 | | | | 98,063 | |
| | | | | | | | |
| | | | | | $ | 473,964 | |
| | | | | | | | |
| Consumer Services – 1.0% | | | | | |
| KAR Holdings, Inc., 10%, 2015 | | $ | 11,000 | | | $ | 11,660 | |
| KAR Holdings, Inc., FRN, 4.286%, 2014 | | | 35,000 | | | | 33,163 | |
| Service Corp. International, 7%, 2017 | | | 135,000 | | | | 137,700 | |
| Service Corp. International, 7%, 2019 | | | 65,000 | | | | 65,000 | |
Ticketmaster Entertainment, Inc.,
10.75%, 2016 | | | 40,000 | | | | 43,300 | |
| Western Union Co., 5.4%, 2011 | | | 230,000 | | | | 239,103 | |
| | | | | | | | |
| | | | | | $ | 529,926 | |
| | | | | | | | |
| Containers – 0.5% | | | | | |
| Graham Packaging Co. LP/GPC Capital Corp., 9.875%, 2014 | | $ | 100,000 | | | $ | 103,500 | |
| Graham Packaging Co. LP/GPC Capital Corp., 8.25%, 2018 | | | 5,000 | | | | 5,250 | |
9
MFS Strategic Income Portfolio
Portfolio of Investments – continued
| | | | | | | | |
| Issuer | | Shares/Par | | | Value ($) | |
| | | | | | | | |
| BONDS – continued | | | | | |
| Containers – continued | | | | | |
| Greif, Inc., 6.75%, 2017 | | $ | 125,000 | | | $ | 130,625 | |
| Owens-Illinois, Inc., 7.375%, 2016 | | | 35,000 | | | | 37,188 | |
| | | | | | | | |
| | | | | | $ | 276,563 | |
| | | | | | | | |
| Defense Electronics – 0.7% | | | | | |
| BAE Systems Holdings, Inc., 5.2%, 2015 (n) | | $ | 212,000 | | | $ | 226,092 | |
| BAE Systems Holdings, Inc., 6.375%, 2019 (n) | | | 60,000 | | | | 66,687 | |
| ManTech International Corp., 7.25%, 2018 | | | 35,000 | | | | 36,575 | |
| MOOG, Inc., 7.25%, 2018 | | | 25,000 | | | | 26,125 | |
| | | | | | | | |
| | | | | | $ | 355,479 | |
| | | | | | | | |
| Electronics – 0.2% | | | | | |
Freescale Semiconductor, Inc.,
10.125%, 2018 (n) | | $ | 25,000 | | | $ | 28,125 | |
Freescale Semiconductor, Inc.,
9.25%, 2018 (n) | | | 35,000 | | | | 38,500 | |
| Jabil Circuit, Inc., 7.75%, 2016 | | | 50,000 | | | | 56,125 | |
| | | | | | | | |
| | | | | | $ | 122,750 | |
| | | | | | | | |
| Emerging Market Quasi-Sovereign – 2.7% | | | | | |
| Banco do Brasil S.A., 5.375%, 2021 (n) | | $ | 166,000 | | | $ | 162,680 | |
| IIRSA Norte Finance Ltd., 8.75%, 2024 | | | 129,937 | | | | 144,555 | |
Petrobras International Finance Co.,
7.875%, 2019 | | | 117,000 | | | | 138,314 | |
| Petroleos Mexicanos, 5.5%, 2021 | | | 106,000 | | | | 107,325 | |
| Qtel International Finance Ltd., 7.875%, 2019 | | | 100,000 | | | | 119,477 | |
| Ras Laffan Liquefied Natural Gas Co. Ltd., 5.832%, 2016 (n) | | | 223,050 | | | | 239,779 | |
| VEB Finance Ltd., 6.902%, 2020 (n) | | | 132,000 | | | | 138,270 | |
| VTB Capital S.A., 6.465%, 2015 (n) | | | 158,000 | | | | 164,510 | |
| VTB Capital S.A., 6.551%, 2020 (n) | | | 190,000 | | | | 186,675 | |
| | | | | | | | |
| | | | | | $ | 1,401,585 | |
| | | | | | | | |
| Emerging Market Sovereign – 0.6% | | | | | |
| Republic of Argentina, FRN, 0.677%, 2012 | | $ | 75,725 | | | $ | 71,721 | |
| Republic of Philippines, 6.375%, 2034 | | | 100,000 | | | | 106,000 | |
| Republic of South Africa, 5.5%, 2020 | | | 113,000 | | | | 120,204 | |
| United Mexican States, 5.95%, 2019 | | | 6,000 | | | | 6,690 | |
| United Mexican States, 5.75%, 2110 | | | 10,000 | | | | 8,875 | |
| | | | | | | | |
| | | | | | $ | 313,490 | |
| | | | | | | | |
| Energy – Independent – 2.9% | | | | | |
| Anadarko Petroleum Corp., 5.95%, 2016 | | $ | 160,000 | | | $ | 171,886 | |
| Anadarko Petroleum Corp., 8.7%, 2019 | | | 25,000 | | | | 30,530 | |
| Carrizo Oil & Gas, Inc., 8.625%, 2018 (n) | | | 60,000 | | | | 61,800 | |
| Concho Resources, Inc., 8.625%, 2017 | | | 15,000 | | | | 16,350 | |
| Denbury Resources, Inc., 8.25%, 2020 | | | 50,000 | | | | 54,250 | |
| Energy XXI Gulf Coast, Inc., 9.25%, 2017 (z) | | | 170,000 | | | | 176,800 | |
| Harvest Operations Corp., 6.875%, 2017 (n) | | | 55,000 | | | | 56,650 | |
| Hilcorp Energy I LP, 9%, 2016 (n) | | | 85,000 | | | | 89,888 | |
| Linn Energy LLC, 8.625%, 2020 (n) | | | 20,000 | | | | 21,550 | |
| Linn Energy LLC, 7.75%, 2021 (n) | | | 37,000 | | | | 37,925 | |
| Newfield Exploration Co., 6.625%, 2014 | | | 60,000 | | | | 61,200 | |
| Newfield Exploration Co., 6.625%, 2016 | | | 25,000 | | | | 25,688 | |
| OPTI Canada, Inc., 9.75%, 2013 (n) | | | 40,000 | | | | 40,000 | |
| OPTI Canada, Inc., 8.25%, 2014 | | | 95,000 | | | | 67,688 | |
| | | | | | | | |
| Issuer | | Shares/Par | | | Value ($) | |
| | | | | | | | |
| BONDS – continued | | | | | |
| Energy – Independent – continued | | | | | |
| Penn Virginia Corp., 10.375%, 2016 | | $ | 70,000 | | | $ | 78,050 | |
| Pioneer Natural Resources Co., 6.875%, 2018 | | | 55,000 | | | | 58,471 | |
| Pioneer Natural Resources Co., 7.5%, 2020 | | | 50,000 | | | | 54,901 | |
| Plains Exploration & Production Co., 7%, 2017 | | | 95,000 | | | | 97,613 | |
| QEP Resources, Inc., 6.875%, 2021 | | | 55,000 | | | | 57,750 | |
| Quicksilver Resources, Inc., 8.25%, 2015 | | | 55,000 | | | | 57,063 | |
| Quicksilver Resources, Inc., 9.125%, 2019 | | | 45,000 | | | | 49,388 | |
| Range Resources Corp., 8%, 2019 | | | 35,000 | | | | 38,106 | |
| SandRidge Energy, Inc., 8%, 2018 (n) | | | 60,000 | | | | 60,900 | |
| Talisman Energy, Inc., 7.75%, 2019 | | | 20,000 | | | | 24,691 | |
| | | | | | | | |
| | | | | | $ | 1,489,138 | |
| | | | | | | | |
| Energy – Integrated – 0.9% | | | | | |
| BP Capital Markets PLC, 4.5%, 2020 | | $ | 46,000 | | | $ | 45,889 | |
| Cenovus Energy, Inc., 4.5%, 2014 | | | 60,000 | | | | 64,293 | |
| Hess Corp., 8.125%, 2019 | | | 60,000 | | | | 75,802 | |
| Pacific Rubiales Energy Corp., 8.75%, 2016 (n) | | | 100,000 | | | | 112,500 | |
| Petro-Canada, 5%, 2014 | | | 170,000 | | | | 183,715 | |
| | | | | | | | |
| | | | | | $ | 482,199 | |
| | | | | | | | |
| Entertainment – 0.5% | | | | | |
| AMC Entertainment, Inc., 11%, 2016 | | $ | 65,000 | | | $ | 68,900 | |
| AMC Entertainment, Inc., 8.75%, 2019 | | | 55,000 | | | | 58,713 | |
| AMC Entertainment, Inc., 9.75%, 2020 (z) | | | 25,000 | | | | 26,000 | |
| Cinemark USA, Inc., 8.625%, 2019 | | | 75,000 | | | | 81,188 | |
NAI Entertainment Holdings LLC,
8.25%, 2017 (z) | | | 20,000 | | | | 21,000 | |
| | | | | | | | |
| | | | | | $ | 255,801 | |
| | | | | | | | |
| Financial Institutions – 2.7% | | | | | |
American General Finance Corp.,
5.375%, 2012 | | $ | 25,000 | | | $ | 23,625 | |
| CIT Group, Inc., 7%, 2014 | | | 65,000 | | | | 65,650 | |
| CIT Group, Inc., 7%, 2016 | | | 85,000 | | | | 85,319 | |
| CIT Group, Inc., 7%, 2017 | | | 200,000 | | | | 200,500 | |
| General Electric Capital Corp., 6%, 2019 | | | 50,000 | | | | 55,630 | |
| General Electric Capital Corp., 5.5%, 2020 | | | 110,000 | | | | 117,644 | |
General Electric Capital Corp.,
6.375% to 2017, FRN to 2067 | | | 30,000 | | | | 29,700 | |
General Electric Capital Corp., FRN,
0.416%, 2012 | | | 170,000 | | | | 169,099 | |
| GMAC, Inc., 6.75%, 2014 | | | 125,000 | | | | 131,563 | |
International Lease Finance Corp.,
5.625%, 2013 | | | 40,000 | | | | 40,200 | |
International Lease Finance Corp.,
8.75%, 2017 (n) | | | 70,000 | | | | 75,075 | |
International Lease Finance Corp.,
7.125%, 2018 (n) | | | 69,000 | | | | 73,313 | |
International Lease Finance Corp.,
8.25%, 2020 | | | 10,000 | | | | 10,300 | |
| Nationstar Mortgage LLC, 10.875%, 2015 (z) | | | 35,000 | | | | 34,388 | |
| ORIX Corp., 5.48%, 2011 | | | 200,000 | | | | 207,519 | |
| SLM Corp., 8%, 2020 | | | 70,000 | | | | 70,973 | |
| | | | | | | | |
| | | | | | $ | 1,390,498 | |
| | | | | | | | |
10
MFS Strategic Income Portfolio
Portfolio of Investments – continued
| | | | | | | | |
| Issuer | | Shares/Par | | | Value ($) | |
| | | | | | | | |
| BONDS – continued | | | | | |
| Food & Beverages – 1.8% | | | | | |
| Anheuser-Busch InBev S.A., 7.75%, 2019 (n) | | $ | 220,000 | | | $ | 273,757 | |
| ARAMARK Corp., 8.5%, 2015 | | | 50,000 | | | | 52,250 | |
| B&G Foods, Inc., 7.625%, 2018 | | | 35,000 | | | | 36,838 | |
| Constellation Brands, Inc., 7.25%, 2016 | | | 25,000 | �� | | | 26,500 | |
| Del Monte Foods Co., 6.75%, 2015 | | | 90,000 | | | | 91,913 | |
| Kraft Foods, Inc., 6.125%, 2018 | | | 170,000 | | | | 194,378 | |
| Pinnacle Foods Finance LLC, 9.25%, 2015 | | | 65,000 | | | | 67,681 | |
| TreeHouse Foods, Inc., 7.75%, 2018 | | | 45,000 | | | | 48,769 | |
| Tyson Foods, Inc., 7.35%, 2016 | | | 120,000 | | | | 131,625 | |
| | | | | | | | |
| | | | | | $ | 923,711 | |
| | | | | | | | |
| Forest & Paper Products – 0.9% | | | | | |
| Boise, Inc., 8%, 2020 | | $ | 45,000 | | | $ | 48,150 | |
| Cascades, Inc., 7.75%, 2017 | | | 35,000 | | | | 36,488 | |
| Georgia-Pacific Corp., 7.125%, 2017 (n) | | | 60,000 | | | | 63,900 | |
| Georgia-Pacific Corp., 8%, 2024 | | | 65,000 | | | | 74,263 | |
| Georgia-Pacific Corp., 7.25%, 2028 | | | 15,000 | | | | 16,238 | |
| Graphic Packaging Holding Co., 7.875%, 2018 | | | 30,000 | | | | 31,425 | |
Millar Western Forest Products Ltd.,
7.75%, 2013 | | | 60,000 | | | | 56,850 | |
| Sappi Papier Holding GmbH, 6.75%, 2012 (z) | | | 25,000 | | | | 25,636 | |
| Votorantim Participacoes S.A., 6.75%, 2021 (n) | | | 100,000 | | | | 104,500 | |
| | | | | | | | |
| | | | | | $ | 457,450 | |
| | | | | | | | |
| Gaming & Lodging – 2.0% | | | | | |
Firekeepers Development Authority, 13.875%, 2015 (n) | | $ | 65,000 | | | $ | 76,863 | |
Fontainebleau Las Vegas Holdings LLC, 10.25%, 2015 (d)(n) | | | 95,000 | | | | 333 | |
| Gaylord Entertainment Co., 6.75%, 2014 | | | 55,000 | | | | 54,175 | |
GWR Operating Partnership LLP,
10.875%, 2017 | | | 35,000 | | | | 36,925 | |
| Harrah’s Operating Co., Inc., 11.25%, 2017 | | | 55,000 | | | | 61,875 | |
| Harrah’s Operating Co., Inc., 10%, 2018 | | | 4,000 | | | | 3,650 | |
| Harrah’s Operating Co., Inc., 10%, 2018 | | | 57,000 | | | | 52,013 | |
| Host Hotels & Resorts, Inc., 6.75%, 2016 | | | 45,000 | | | | 45,956 | |
| Host Hotels & Resorts, Inc., 9%, 2017 | | | 50,000 | | | | 55,500 | |
| Marriott International, Inc., 5.625%, 2013 | | | 120,000 | | | | 128,699 | |
| MGM Mirage, 10.375%, 2014 | | | 5,000 | | | | 5,613 | |
| MGM Mirage, 11.125%, 2017 | | | 20,000 | | | | 23,000 | |
| MGM Mirage, 9%, 2020 (n) | | | 45,000 | | | | 49,500 | |
| MGM Resorts International, 11.375%, 2018 | | | 45,000 | | | | 48,825 | |
| Penn National Gaming, Inc., 8.75%, 2019 | | | 50,000 | | | | 55,125 | |
Royal Caribbean Cruises Ltd.,
11.875%, 2015 | | | 25,000 | | | | 30,875 | |
| Station Casinos, Inc., 6.5%, 2014 (d) | | | 150,000 | | | | 15 | |
| Station Casinos, Inc., 6.875%, 2016 (d) | | | 140,000 | | | | 14 | |
| Wyndham Worldwide Corp., 6%, 2016 | | | 90,000 | | | | 94,179 | |
| Wyndham Worldwide Corp., 5.75%, 2018 | | | 140,000 | | | | 142,357 | |
| Wyndham Worldwide Corp., 7.375%, 2020 | | | 50,000 | | | | 54,967 | |
| Wynn Las Vegas LLC, 7.75%, 2020 | | | 20,000 | | | | 21,650 | |
| | | | | | | | |
| | | | | | $ | 1,042,109 | |
| | | | | | | | |
| | | | | | | | |
| Issuer | | Shares/Par | | | Value ($) | |
| | | | | | | | |
| BONDS – continued | | | | | |
| Industrial – 0.6% | | | | | |
| Altra Holdings, Inc., 8.125%, 2016 | | $ | 35,000 | | | $ | 37,100 | |
| Diversey, Inc., 8.25%, 2019 | | | 30,000 | | | | 32,550 | |
Great Lakes Dredge & Dock Corp., 7.75%, 2013 | | | 45,000 | | | | 45,394 | |
| Mueller Water Products, Inc., 7.375%, 2017 | | | 35,000 | | | | 33,775 | |
| Mueller Water Products, Inc., 8.75%, 2020 | | | 25,000 | | | | 27,625 | |
| Steelcase, Inc., 6.5%, 2011 | | | 117,000 | | | | 119,565 | |
| | | | | | | | |
| | | | | | $ | 296,009 | |
| | | | | | | | |
| Insurance – 3.3% | | | | | |
| Aflac, Inc., 6.45%, 2040 | | $ | 120,000 | | | $ | 122,901 | |
| Allianz AG, 5.5% to 2014, FRN to 2049 | | EUR | 248,000 | | | | 324,774 | |
American International Group, Inc., 8.175% to 2038, FRN to 2068 | | | 170,000 | | | | 181,018 | |
ING Groep N.V., 5.775% to 2015, FRN to 2049 | | | 290,000 | | | | 249,400 | |
Metropolitan Life Global Funding, 2.875%, 2012 (n) | | | 160,000 | | | | 163,989 | |
Metropolitan Life Global Funding, 5.125%, 2014 (n) | | | 80,000 | | | | 87,020 | |
Principal Financial Group, Inc.,
8.875%, 2019 | | | 130,000 | | | | 163,551 | |
| Prudential Financial, Inc., 6.2%, 2015 | | | 130,000 | | | | 143,365 | |
| Prudential Financial, Inc., 5.375%, 2020 | | | 90,000 | | | | 94,046 | |
| Unum Group, 7.125%, 2016 | | | 160,000 | | | | 179,714 | |
| | | | | | | | |
| | | | | | $ | 1,709,778 | |
| | | | | | | | |
| Insurance – Property & Casualty – 2.1% | | | | | |
| Aon Corp., 3.5%, 2015 | | $ | 140,000 | | | $ | 140,069 | |
| AXIS Capital Holdings Ltd., 5.75%, 2014 | | | 205,000 | | | | 217,989 | |
| AXIS Capital Holdings Ltd., 5.875%, 2020 | | | 50,000 | | | | 49,922 | |
| CNA Financial Corp., 5.875%, 2020 | | | 160,000 | | | | 159,308 | |
Liberty Mutual Group, Inc.,
10.75% to 2038, FRN to 2088 (n) | | | 80,000 | | | | 96,800 | |
| PartnerRe Ltd., 5.5%, 2020 | | | 107,000 | | | | 107,752 | |
| Travelers Cos., Inc., 3.9%, 2020 | | | 220,000 | | | | 213,716 | |
| USI Holdings Corp., 9.75%, 2015 (z) | | | 75,000 | | | | 75,750 | |
| | | | | | | | |
| | | | | | $ | 1,061,306 | |
| | | | | | | | |
| International Market Quasi-Sovereign – 2.6% | | | | | |
| Bank of Ireland, 2.75%, 2012 (n) | | $ | 130,000 | | | $ | 123,922 | |
| Canada Housing Trust, 4.6%, 2011 (n) | | CAD | 120,000 | | | | 123,376 | |
EDF Energies Nouvelles S.A.,
6.5%, 2019 (n) | | | 230,000 | | | | 268,356 | |
| ING Bank N.V., 3.9%, 2014 (n) | | | 190,000 | | | | 204,142 | |
Irish Life & Permanent PLC,
3.6%, 2013 (e)(n) | | | 200,000 | | | | 179,404 | |
| LeasePlan Corp. N.V., 3%, 2012 (n) | | | 90,000 | | | | 92,463 | |
| Swedbank AB, 2.8%, 2012 (n) | | | 100,000 | | | | 102,138 | |
| Vestjysk Bank A/S, FRN, 0.851%, 2013 (n) | | | 130,000 | | | | 131,074 | |
| Westpac Banking Corp., 3.45%, 2014 (n) | | | 100,000 | | | | 106,580 | |
| | | | | | | | |
| | | | | | $ | 1,331,455 | |
| | | | | | | | |
11
MFS Strategic Income Portfolio
Portfolio of Investments – continued
| | | | | | | | |
| Issuer | | Shares/Par | | | Value ($) | |
| | | | | | | | |
| BONDS – continued | | | | | |
| International Market Sovereign – 12.8% | | | | | |
Federal Republic of Germany,
3.75%, 2015 | | EUR | 291,000 | | | $ | 420,727 | |
Federal Republic of Germany,
4.25%, 2018 | | EUR | 346,000 | | | | 511,596 | |
Federal Republic of Germany,
6.25%, 2030 | | EUR | 141,000 | | | | 259,518 | |
| Government of Canada, 4.5%, 2015 | | CAD | 92,000 | | | | 101,058 | |
| Government of Canada, 4.25%, 2018 | | CAD | 48,000 | | | | 52,768 | |
| Government of Canada, 5.75%, 2033 | | CAD | 17,000 | | | | 22,868 | |
| Government of Japan, 1.5%, 2012 | | JPY | 21,000,000 | | | | 263,631 | |
| Government of Japan, 1.3%, 2014 | | JPY | 45,700,000 | | | | 583,925 | |
| Government of Japan, 1.7%, 2017 | | JPY | 64,300,000 | | | | 845,938 | |
| Government of Japan, 2.2%, 2027 | | JPY | 20,650,000 | | | | 272,171 | |
| Government of Japan, 2.4%, 2037 | | JPY | 21,800,000 | | | | 291,940 | |
| Kingdom of Belgium, 5.5%, 2017 | | EUR | 63,000 | | | | 93,519 | |
| Kingdom of Spain, 4.6%, 2019 | | EUR | 70,000 | | | | 88,893 | |
Kingdom of the Netherlands,
3.75%, 2014 | | EUR | 309,000 | | | | 444,934 | |
| Kingdom of the Netherlands, 5.5%, 2028 | | EUR | 38,000 | | | | 63,385 | |
| Republic of Austria, 4.65%, 2018 | | EUR | 150,000 | | | | 221,329 | |
| Republic of France, 4.75%, 2012 | | EUR | 141,000 | | | | 201,044 | |
| Republic of France, 6%, 2025 | | EUR | 118,000 | | | | 199,460 | |
| Republic of France, 4.75%, 2035 | | EUR | 160,000 | | | | 242,266 | |
| Republic of Italy, 4.75%, 2013 | | EUR | 287,000 | | | | 397,463 | |
| Republic of Italy, 5.25%, 2017 | | EUR | 385,000 | | | | 544,675 | |
| United Kingdom Treasury, 8%, 2015 | | GBP | 146,000 | | | | 288,956 | |
| United Kingdom Treasury, 8%, 2021 | | GBP | 55,000 | | | | 119,445 | |
| United Kingdom Treasury, 4.25%, 2036 | | GBP | 77,000 | | | | 120,891 | |
| | | | | | | | |
| | | | | | $ | 6,652,400 | |
| | | | | | | | |
| Local Authorities – 0.6% | | | | | |
Louisiana Gas & Fuels Tax Rev.
(Build America Bonds), FRN, 3%, 2043 | | $ | 160,000 | | | $ | 161,576 | |
| Province of Ontario, 5.45%, 2016 | | | 145,000 | | | | 164,901 | |
| | | | | | | | |
| | | | | | $ | 326,477 | |
| | | | | | | | |
| Machinery & Tools – 0.8% | | | | | |
| Atlas Copco AB, 5.6%, 2017 (n) | | $ | 214,000 | | | $ | 230,569 | |
| Case Corp., 7.25%, 2016 | | | 25,000 | | | | 27,000 | |
| Case New Holland, Inc., 7.875%, 2017 (n) | | | 100,000 | | | | 109,250 | |
| Rental Service Corp., 9.5%, 2014 | | | 35,000 | | | | 36,750 | |
| | | | | | | | |
| | | | | | $ | 403,569 | |
| | | | | | | | |
| Major Banks – 4.8% | | | | | |
BAC Capital Trust XIV, 5.63% to 2012,
FRN to 2049 | | $ | 460,000 | | | $ | 326,692 | |
| Bank of America Corp., 7.375%, 2014 | | | 65,000 | | | | 72,253 | |
Bank of America Corp., 8% to 2018,
FRN to 2049 | | | 85,000 | | | | 85,663 | |
| Barclays Bank PLC, 5.125%, 2020 | | | 130,000 | | | | 132,763 | |
| BNP Paribas, 5.186% to 2015, FRN to 2049 (n) | | | 108,000 | | | | 98,280 | |
| BNP Paribas, 7.195% to 2037, FRN to 2049 (n) | | | 100,000 | | | | 95,500 | |
Commonwealth Bank of Australia,
5%, 2019 (n) | | | 140,000 | | | | 146,541 | |
| | | | | | | | |
| Issuer | | Shares/Par | | | Value ($) | |
| | | | | | | | |
| BONDS – continued | | | | | |
| Major Banks – continued | | | | | |
| Credit Suisse New York, 5.5%, 2014 | | $ | 130,000 | | | $ | 142,565 | |
| Goldman Sachs Group, Inc., 6%, 2014 | | | 90,000 | | | | 99,147 | |
| JPMorgan Chase Capital XXII, 6.45%, 2037 | | | 110,000 | | | | 109,571 | |
| JPMorgan Chase Capital XXVII, 7%, 2039 | | | 30,000 | | | | 31,411 | |
| Macquarie Group Ltd., 6%, 2020 (n) | | | 171,000 | | | | 171,670 | |
| Merrill Lynch & Co., Inc., 6.4%, 2017 | | | 90,000 | | | | 95,154 | |
| Morgan Stanley, 6%, 2014 | | | 100,000 | | | | 108,048 | |
| Morgan Stanley, 7.3%, 2019 | | | 100,000 | | | | 112,564 | |
| Morgan Stanley, 5.625%, 2019 | | | 100,000 | | | | 101,968 | |
Royal Bank of Scotland Group PLC,
7.648% to 2031, FRN to 2049 | | | 155,000 | | | | 129,619 | |
| Standard Chartered PLC, 3.85%, 2015 (n) | | | 150,000 | | | | 154,435 | |
| UFJ Finance Aruba AEC, 6.75%, 2013 | | | 159,000 | | | | 177,302 | |
Wells Fargo & Co., 7.98% to 2018,
FRN to 2049 | | | 78,000 | | | | 82,290 | |
| | | | | | | | |
| | | | | | $ | 2,473,436 | |
| | | | | | | | |
| Medical & Health Technology & Services – 3.5% | | | | | |
| Biomet, Inc., 10%, 2017 | | $ | 5,000 | | | $ | 5,463 | |
| Biomet, Inc., 10.375%, 2017 (p) | | | 25,000 | | | | 27,313 | |
| Biomet, Inc., 11.625%, 2017 | | | 85,000 | | | | 93,925 | |
| Cardinal Health, Inc., 5.8%, 2016 | | | 201,000 | | | | 225,529 | |
Community Health Systems, Inc.,
8.875%, 2015 | | | 115,000 | | | | 120,750 | |
| Cooper Cos., Inc., 7.125%, 2015 | | | 55,000 | | | | 56,650 | |
| Davita, Inc., 6.375%, 2018 | | | 45,000 | | | | 44,775 | |
| Davita, Inc., 6.625%, 2020 | | | 20,000 | | | | 19,800 | |
Fresenius Medical Care AG & Co. KGaA,
9%, 2015 (n) | | | 35,000 | | | | 40,075 | |
| HCA, Inc., 9.25%, 2016 | | | 255,000 | | | | 272,053 | |
| HCA, Inc., 8.5%, 2019 | | | 40,000 | | | | 43,800 | |
| HealthSouth Corp., 8.125%, 2020 | | | 90,000 | | | | 96,750 | |
| Hospira, Inc., 6.05%, 2017 | | | 100,000 | | | | 112,033 | |
| McKesson Corp., 5.7%, 2017 | | | 90,000 | | | | 99,960 | |
| Owens & Minor, Inc., 6.35%, 2016 | | | 170,000 | | | | 173,075 | |
| Tenet Healthcare Corp., 9.25%, 2015 | | | 85,000 | | | | 90,525 | |
| Tenet Healthcare Corp., 8%, 2020 (n) | | | 15,000 | | | | 15,225 | |
| United Surgical Partners International, Inc., 8.875%, 2017 | | | 15,000 | | | | 15,450 | |
| United Surgical Partners International, Inc., 9.25%, 2017 (p) | | | 25,000 | | | | 26,000 | |
Universal Hospital Services, Inc.,
8.5%, 2015 (p) | | | 85,000 | | | | 87,338 | |
Universal Hospital Services, Inc., FRN,
3.834%, 2015 | | | 20,000 | | | | 18,300 | |
| Vanguard Health Systems, Inc., 8%, 2018 | | | 60,000 | | | | 61,500 | |
| VWR Funding, Inc., 10.25%, 2015 (p) | | | 69,500 | | | | 72,975 | |
| | | | | | | | |
| | | | | | $ | 1,819,264 | |
| | | | | | | | |
| Metals & Mining – 1.5% | | | | | |
| Arch Coal, Inc., 7.25%, 2020 | | $ | 20,000 | | | $ | 21,100 | |
| Arch Western Finance LLC, 6.75%, 2013 | | | 26,000 | | | | 26,260 | |
| Cloud Peak Energy, Inc., 8.25%, 2017 | | | 55,000 | | | | 59,056 | |
| Cloud Peak Energy, Inc., 8.5%, 2019 | | | 70,000 | | | | 76,650 | |
| CONSOL Energy, Inc., 8%, 2017 (n) | | | 35,000 | | | | 37,275 | |
| CONSOL Energy, Inc., 8.25%, 2020 (n) | | | 20,000 | | | | 21,600 | |
12
MFS Strategic Income Portfolio
Portfolio of Investments – continued
| | | | | | | | |
| Issuer | | Shares/Par | | | Value ($) | |
| | | | | | | | |
| BONDS – continued | | | | | |
| Metals & Mining – continued | | | | | |
Gold Fields Orogen Holdings Ltd.,
4.875%, 2020 (n) | | $ | 221,000 | | | $ | 211,416 | |
| Novelis, Inc., 8.375%, 2017 (z) | | | 25,000 | | | | 25,875 | |
| Novelis, Inc., 8.75%, 2020 (z) | | | 10,000 | | | | 10,375 | |
| Southern Copper Corp., 6.75%, 2040 | | | 104,000 | | | | 107,692 | |
| U.S. Steel Corp., 7.375%, 2020 | | | 30,000 | | | | 30,750 | |
| Vale Overseas Ltd., 4.625%, 2020 | | | 100,000 | | | | 99,008 | |
| Vale Overseas Ltd., 6.875%, 2039 | | | 51,000 | | | | 56,351 | |
| | | | | | | | |
| | | | | | $ | 783,408 | |
| | | | | | | | |
| Mortgage-Backed – 0.6% | | | | | |
| Fannie Mae, 6.5%, 2032 (f) | | $ | 126,897 | | | $ | 142,685 | |
| Freddie Mac, 4.224%, 2020 | | | 146,497 | | | | 148,521 | |
| | | | | | | | |
| | | | | | $ | 291,206 | |
| | | | | | | | |
| Natural Gas – Distribution – 0.4% | | | | | |
| AmeriGas Partners LP, 7.125%, 2016 | | $ | 85,000 | | | $ | 87,975 | |
| Ferrellgas Partners LP, 8.625%, 2020 | | | 55,000 | | | | 59,125 | |
| Inergy LP, 6.875%, 2014 | | | 65,000 | | | | 65,975 | |
| | | | | | | | |
| | | | | | $ | 213,075 | |
| | | | | | | | |
| Natural Gas – Pipeline – 2.2% | | | | | |
| Atlas Pipeline Partners LP, 8.125%, 2015 | | $ | 30,000 | | | $ | 30,900 | |
| Atlas Pipeline Partners LP, 8.75%, 2018 | | | 40,000 | | | | 41,800 | |
| CenterPoint Energy, Inc., 7.875%, 2013 | | | 228,000 | | | | 257,739 | |
| Crosstex Energy, Inc., 8.875%, 2018 | | | 50,000 | | | | 53,563 | |
| El Paso Corp., 7%, 2017 | | | 75,000 | | | | 79,149 | |
| El Paso Corp., 7.75%, 2032 | | | 25,000 | | | | 24,868 | |
| Energy Transfer Equity LP, 7.5%, 2020 | | | 85,000 | | | | 87,550 | |
Enterprise Products Partners LP, FRN,
8.375%, 2066 | | | 33,000 | | | | 35,434 | |
Enterprise Products Partners LP, FRN,
7.034%, 2068 | | | 20,000 | | | | 20,750 | |
| Kinder Morgan Energy Partners, 5.85%, 2012 | | | 143,000 | | | | 153,332 | |
| Kinder Morgan Finance Corp., 5.35%, 2011 | | | 162,000 | | | | 162,000 | |
| Spectra Energy Capital LLC, 8%, 2019 | | | 164,000 | | | | 199,794 | |
| | | | | | | | |
| | | | | | $ | 1,146,879 | |
| | | | | | | | |
| Network & Telecom – 2.7% | | | | | |
| AT&T, Inc., 5.5%, 2018 | | $ | 150,000 | | | $ | 166,632 | |
| CenturyLink, Inc., 7.6%, 2039 | | | 150,000 | | | | 151,185 | |
| Cincinnati Bell, Inc., 8.25%, 2017 | | | 15,000 | | | | 14,850 | |
| Cincinnati Bell, Inc., 8.75%, 2018 | | | 55,000 | | | | 51,563 | |
| Citizens Communications Co., 9%, 2031 | | | 20,000 | | | | 20,550 | |
| France Telecom, 4.375%, 2014 | | | 120,000 | | | | 128,217 | |
| Frontier Communications Corp., 8.5%, 2020 | | | 55,000 | | | | 60,088 | |
Qwest Communications International, Inc.,
8%, 2015 | | | 20,000 | | | | 21,500 | |
| Qwest Communications International, Inc., 7.125%, 2018 (n) | | | 50,000 | | | | 51,750 | |
| Qwest Corp., 7.5%, 2014 | | | 140,000 | | | | 156,800 | |
| Telefonica S.A., 5.877%, 2019 | | | 150,000 | | | | 153,263 | |
| Verizon Communications, Inc., 8.75%, 2018 | | | 140,000 | | | | 182,814 | |
| Verizon New England, Inc., 6.5%, 2011 | | | 80,000 | | | | 83,111 | |
| Windstream Corp., 8.625%, 2016 | | | 110,000 | | | | 115,775 | |
| | | | | | | | |
| Issuer | | Shares/Par | | | Value ($) | |
| | | | | | | | |
| BONDS – continued | | | | | |
| Network & Telecom – continued | | | | | |
| Windstream Corp., 8.125%, 2018 | | $ | 10,000 | | | $ | 10,500 | |
| Windstream Corp., 7.75%, 2020 | | | 25,000 | | | | 25,750 | |
| | | | | | | | |
| | | | | | $ | 1,394,348 | |
| | | | | | | | |
| Oil Services – 0.3% | | | | | |
| Basic Energy Services, Inc., 7.125%, 2016 | | $ | 15,000 | | | $ | 14,550 | |
| Edgen Murray Corp., 12.25%, 2015 | | | 30,000 | | | | 26,100 | |
McJunkin Red Man Holding Corp.,
9.5%, 2016 (n) | | | 30,000 | | | | 28,350 | |
| Pioneer Drilling Co., 9.875%, 2018 | | | 55,000 | | | | 58,163 | |
| Pride International, Inc., 6.875%, 2020 | | | 11,000 | | | | 11,413 | |
| Trinidad Drilling Ltd., 7.875%, 2019 (z) | | | 25,000 | | | | 25,250 | |
| | | | | | | | |
| | | | | | $ | 163,826 | |
| | | | | | | | |
| Other Banks & Diversified Financials – 4.5% | | | | | |
| Alfa Bank, 7.875%, 2017 (n) | | $ | 100,000 | | | $ | 101,750 | |
Banco Santander U.S. Debt S.A.U.,
2.991%, 2013 (n) | | | 100,000 | | | | 97,147 | |
| Bangkok Bank (Hong Kong), 4.8%, 2020 (n) | | | 100,000 | | | | 95,822 | |
Bank of China (Hong Kong) Ltd.,
5.55%, 2020 (n) | | | 203,000 | | | | 212,083 | |
| Bosphorus Financial Services Ltd., FRN, 2.085%, 2012 (z) | | | 62,500 | | | | 61,596 | |
| Capital One Financial Corp., 8.8%, 2019 | | | 250,000 | | | | 307,510 | |
| Capital One Financial Corp., 10.25%, 2039 | | | 160,000 | | | | 171,200 | |
Citigroup Capital XXI, 8.3% to 2037,
FRN to 2057 | | | 35,000 | | | | 36,400 | |
| Citigroup, Inc., 6.375%, 2014 | | | 120,000 | | | | 132,625 | |
| Citigroup, Inc., 6.01%, 2015 | | | 100,000 | | | | 109,703 | |
| Citigroup, Inc., 8.5%, 2019 | | | 88,000 | | | | 109,246 | |
Groupe BPCE S.A., 12.5% to 2019,
FRN to 2049 (n) | | | 157,000 | | | | 180,446 | |
| Lloyds TSB Bank PLC, 5.8%, 2020 (n) | | | 200,000 | | | | 197,473 | |
Santander UK PLC, 8.963% to 2030,
FRN to 2049 | | | 73,000 | | �� | | 77,015 | |
| Svenska Handelsbanken AB, 4.875%, 2014 (n) | | | 180,000 | | | | 191,338 | |
UBS Preferred Funding Trust V,
6.243% to 2016, FRN to 2049 | | | 270,000 | | | | 259,200 | |
| | | | | | | | |
| | | | | | $ | 2,340,554 | |
| | | | | | | | |
| Pharmaceuticals – 1.5% | | | | | |
| Celgene Corp., 3.95%, 2020 | | $ | 160,000 | | | $ | 152,118 | |
| Pfizer, Inc., 6.2%, 2019 | | | 230,000 | | | | 269,413 | |
| Roche Holdings, Inc., 6%, 2019 (n) | | | 200,000 | | | | 232,568 | |
| Teva Pharmaceutical Finance LLC, 5.55%, 2016 | | | 87,000 | | | | 98,014 | |
| Valeant Pharmaceuticals International, Inc., 6.75%, 2017 (n) | | | 5,000 | | | | 4,975 | |
| Valeant Pharmaceuticals International, Inc., 7%, 2020 (n) | | | 5,000 | | | | 4,938 | |
| | | | | | | | |
| | | | | | $ | 762,026 | |
| | | | | | | | |
| Pollution Control – 0.7% | | | | | |
Allied Waste North America, Inc.,
7.125%, 2016 | | $ | 205,000 | | | $ | 217,044 | |
| Republic Services, Inc., 5.25%, 2021 | | | 130,000 | | | | 137,005 | |
| | | | | | | | |
| | | | | | $ | 354,049 | |
| | | | | | | | |
13
MFS Strategic Income Portfolio
Portfolio of Investments – continued
| | | | | | | | |
| Issuer | | Shares/Par | | | Value ($) | |
| | | | | | | | |
| BONDS – continued | | | | | |
| Printing & Publishing – 0.4% | | | | | |
| American Media, Inc., 13.5%, 2018 (z) | | $ | 6,759 | | | $ | 6,867 | |
| McClatchy Co., 11.5%, 2017 | | | 15,000 | | | | 16,856 | |
| Nielsen Finance LLC, 11.5%, 2016 | | | 40,000 | | | | 46,200 | |
Nielsen Finance LLC, 0% to 2011,
12.5% to 2016 | | | 134,000 | | | | 140,700 | |
| Nielsen Finance LLC, 7.75%, 2018 (n) | | | 20,000 | | | | 20,700 | |
| | | | | | | | |
| | | | | | $ | 231,323 | |
| | | | | | | | |
| Railroad & Shipping – 0.3% | | | | | |
| Kansas City Southern Railway, 8%, 2015 | | $ | 70,000 | | | $ | 75,250 | |
| Panama Canal Railway Co., 7%, 2026 (n) | | | 93,800 | | | | 84,420 | |
| | | | | | | | |
| | | | | | $ | 159,670 | |
| | | | | | | | |
| Real Estate – 1.1% | | | | | |
| Boston Properties LP, REIT, 4.125%, 2021 | | $ | 110,000 | | | $ | 104,284 | |
| Developers Diversified Realty Corp., REIT, 7.875%, 2020 | | | 15,000 | | | | 16,798 | |
Entertainment Properties Trust, REIT,
7.75%, 2020 (n) | | | 45,000 | | | | 47,588 | |
| Kimco Realty Corp., REIT, 6.875%, 2019 | | | 36,000 | | | | 40,727 | |
| Simon Property Group, Inc., REIT, 6.1%, 2016 | | | 230,000 | | | | 257,834 | |
| WEA Finance LLC, REIT, 6.75%, 2019 (n) | | | 110,000 | | | | 122,543 | |
| | | | | | | | |
| | | | | | $ | 589,774 | |
| | | | | | | | |
| Restaurants – 0.0% | | | | | |
| Dunkin Finance Corp., 9.625%, 2018 (n) | | $ | 20,000 | | | $ | 20,200 | |
| | | | | | | | |
| Retailers – 2.2% | | | | | |
| AutoZone, Inc., 6.5%, 2014 | | $ | 230,000 | | | $ | 255,422 | |
Express LLC/Express Finance Corp.,
8.75%, 2018 | | | 35,000 | | | | 37,188 | |
| Limited Brands, Inc., 5.25%, 2014 | | | 59,000 | | | | 61,065 | |
| Limited Brands, Inc., 6.9%, 2017 | | | 40,000 | | | | 42,500 | |
| Limited Brands, Inc., 6.95%, 2033 | | | 20,000 | | | | 18,700 | |
| Macy’s, Inc., 8.375%, 2015 | | | 200,000 | | | | 234,000 | |
| Neiman Marcus Group, Inc., 10.375%, 2015 | | | 55,000 | | | | 58,094 | |
| QVC, Inc., 7.375%, 2020 (n) | | | 40,000 | | | | 41,900 | |
| Rent-A-Center, Inc., 6.625%, 2020 | | | 5,000 | | | | 4,975 | |
| Sally Beauty Holdings, Inc., 10.5%, 2016 | | | 110,000 | | | | 121,275 | |
| Staples, Inc., 9.75%, 2014 | | | 140,000 | | | | 169,659 | |
| Toys “R” Us Property Co. II LLC, 8.5%, 2017 | | | 30,000 | | | | 32,250 | |
| Toys “R” Us, Inc., 10.75%, 2017 | | | 50,000 | | | | 57,000 | |
| | | | | | | | |
| | | | | | $ | 1,134,028 | |
| | | | | | | | |
| Specialty Stores – 0.4% | | | | | |
| Giraffe Acquisition Corp., 9.125%, 2018 (n) | | $ | 35,000 | | | $ | 36,488 | |
| Michaels Stores, Inc., 11.375%, 2016 | | | 35,000 | | | | 38,150 | |
| Michaels Stores, Inc., 7.75%, 2018 (n) | | | 35,000 | | | | 34,913 | |
| Payless ShoeSource, Inc., 8.25%, 2013 | | | 76,000 | | | | 77,330 | |
| | | | | | | | |
| | | | | | $ | 186,881 | |
| | | | | | | | |
| Supermarkets – 0.3% | | | | | |
| Delhaize Group, 5.875%, 2014 | | $ | 150,000 | | | $ | 165,534 | |
| | | | | | | | |
| Supranational – 0.6% | | | | | | | | |
| Central American Bank, 4.875%, 2012 (n) | | $ | 305,000 | | | $ | 314,174 | |
| | | | | | | | |
| | | | | | | | |
| Issuer | | Shares/Par | | | Value ($) | |
| | | | | | | | |
| BONDS – continued | | | | | |
| Telecommunications – Wireless – 2.0% | | | | | |
| American Tower Corp., 4.625%, 2015 | | $ | 80,000 | | | $ | 83,575 | |
| Clearwire Corp., 12%, 2015 (n) | | | 105,000 | | | | 113,138 | |
| Cricket Communications, Inc., 7.75%, 2016 | | | 35,000 | | | | 36,313 | |
| Crown Castle International Corp., 9%, 2015 | | | 35,000 | | | | 38,588 | |
Crown Castle International Corp.,
7.125%, 2019 | | | 85,000 | | | | 89,888 | |
| Crown Castle Towers LLC, 6.113%, 2020 (n) | | | 157,000 | | | | 163,801 | |
| MetroPCS Wireless, Inc., 7.875%, 2018 | | | 20,000 | | | | 20,750 | |
| Nextel Communications, 7.375%, 2015 | | | 45,000 | | | | 45,056 | |
| NII Holdings, Inc., 10%, 2016 | | | 50,000 | | | | 55,375 | |
| NII Holdings, Inc., 8.875%, 2019 | | | 30,000 | | | | 32,325 | |
| Rogers Cable, Inc., 5.5%, 2014 | | | 164,000 | | | | 179,109 | |
| SBA Communications Corp., 8.25%, 2019 | | | 20,000 | | | | 21,850 | |
| Sprint Capital Corp., 6.875%, 2028 | | | 25,000 | | | | 21,875 | |
| Sprint Nextel Corp., 8.375%, 2017 | | | 105,000 | | | | 112,613 | |
| Sprint Nextel Corp., 8.75%, 2032 | | | 20,000 | | | | 20,200 | |
| | | | | | | | |
| | | | | | $ | 1,034,456 | |
| | | | | | | | |
| Telephone Services – 0.1% | | | | | |
| Frontier Communications Corp., 8.125%, 2018 | | $ | 60,000 | | | $ | 65,850 | |
| | | | | | | | |
| Tobacco – 1.3% | | | | | |
| Altria Group, Inc., 9.25%, 2019 | | $ | 210,000 | | | $ | 274,058 | |
| Lorillard Tobacco Co., 8.125%, 2019 | | | 63,000 | | | | 70,102 | |
| Lorillard Tobacco Co., 6.875%, 2020 | | | 70,000 | | | | 72,298 | |
| Reynolds American, Inc., 6.75%, 2017 | | | 240,000 | | | | 268,252 | |
| | | | | | | | |
| | | | | | $ | 684,710 | |
| | | | | | | | |
| Transportation – Services – 1.0% | | | | | |
American Petroleum Tankers LLC,
10.25%, 2015 (n) | | $ | 25,000 | | | $ | 25,875 | |
| Commercial Barge Line Co., 12.5%, 2017 | | | 60,000 | | | | 69,300 | |
| Erac USA Finance Co., 6.375%, 2017 (n) | | | 180,000 | | | | 199,824 | |
| Hertz Corp., 8.875%, 2014 | | | 74,000 | | | | 75,665 | |
| Hertz Corp., 7.5%, 2018 (n) | | | 35,000 | | | | 36,313 | |
| Hertz Corp., 7.375%, 2021 (z) | | | 50,000 | | | | 50,500 | |
Navios Maritime Acquisition Corp.,
8.625%, 2017 (n) | | | 20,000 | | | | 20,450 | |
| Navios Maritime Holdings, Inc., 8.875%, 2017 | | | 25,000 | | | | 27,063 | |
| Swift Services Holdings, Inc., 10%, 2018 (z) | | | 35,000 | | | | 36,663 | |
| | | | | | | | |
| | | | | | $ | 541,653 | |
| | | | | | | | |
| U.S. Government Agencies and Equivalents – 1.4% | | | | | |
| National Credit Union Administration Guaranteed Note, 2.9%, 2020 | | $ | 50,000 | | | $ | 48,614 | |
| Small Business Administration, 4.34%, 2024 | | | 216,709 | | | | 227,225 | |
| Small Business Administration, 4.77%, 2024 | | | 174,911 | | | | 185,444 | |
| Small Business Administration, 4.625%, 2025 | | | 132,875 | | | | 140,455 | |
| Small Business Administration, 5.11%, 2025 | | | 119,911 | | | | 128,519 | |
| | | | | | | | |
| | | | | | $ | 730,257 | |
| | | | | | | | |
| Utilities – Electric Power – 3.0% | | | | | |
| AES Corp., 8%, 2017 | | $ | 105,000 | | | $ | 111,038 | |
| Allegheny Energy, Inc., 5.75%, 2019 (n) | | | 150,000 | | | | 150,981 | |
| Calpine Corp., 8%, 2016 (n) | | | 55,000 | | | | 58,438 | |
| Calpine Corp., 7.875%, 2020 (n) | | | 30,000 | | | | 30,375 | |
| CMS Energy Corp., 4.25%, 2015 | | | 140,000 | | | | 138,625 | |
14
MFS Strategic Income Portfolio
Portfolio of Investments – continued
| | | | | | | | |
| Issuer | | Shares/Par | | | Value ($) | |
| | | | | | | | |
| BONDS – continued | | | | | |
| Utilities – Electric Power – continued | | | | | |
| Colbun S.A., 6%, 2020 (n) | | $ | 115,000 | | | $ | 119,607 | |
| Covanta Holding Corp., 7.25%, 2020 | | | 20,000 | | | | 20,276 | |
| Duke Energy Corp., 3.35%, 2015 | | | 150,000 | | | | 154,417 | |
| Dynegy Holdings, Inc., 7.75%, 2019 | | | 70,000 | | | | 46,725 | |
| Edison Mission Energy, 7%, 2017 | | | 95,000 | | | | 75,288 | |
| EDP Finance B.V., 6%, 2018 (n) | | | 200,000 | | | | 186,935 | |
| Energy Future Holdings Corp., 10%, 2020 (n) | | | 65,000 | | | | 66,870 | |
| Energy Future Holdings Corp., 10%, 2020 | | | 105,000 | | | | 108,284 | |
| Entergy Corp., 5.125%, 2020 | | | 77,000 | | | | 75,965 | |
| Exelon Generation Co. LLC, 5.2%, 2019 | | | 70,000 | | | | 73,230 | |
| FirstEnergy Corp., 6.45%, 2011 | | | 9,000 | | | | 9,366 | |
| Genon Escrow Corp., 9.875%, 2020 (n) | | | 55,000 | | | | 54,588 | |
| NRG Energy, Inc., 7.375%, 2016 | | | 30,000 | | | | 30,750 | |
| Texas Competitive Electric Holdings LLC, 10.25%, 2015 | | | 55,000 | | | | 31,075 | |
| | | | | | | | |
| | | | | | $ | 1,542,833 | |
| | | | | | | | |
Total Bonds
(Identified Cost, $48,599,693) | | | | | | $ | 50,349,531 | |
| | | | | | | | |
| |
| FLOATING RATE LOANS (g)(r) – 0.6% | | | | | |
| Automotive – 0.2% | | | | | |
| Allison Transmission, Inc., Term Loan B, 3.02%, 2014 | | $ | 81,253 | | | $ | 79,307 | |
| Ford Motor Co., Term Loan B-1, 3.02%, 2013 | | | 33,450 | | | | 33,287 | |
| | | | | | | | |
| | | | | | $ | 112,594 | |
| | | | | | | | |
| Broadcasting – 0.1% | | | | | |
Gray Television, Inc., Term Loan B,
3.78%, 2014 | | $ | 22,477 | | | $ | 21,893 | |
| New Young Broadcasting Holding Co., Inc., Term Loan, 8%, 2015 | | | 20,853 | | | | 20,879 | |
| | | | | | | | |
| | | | | | $ | 42,772 | |
| | | | | | | | |
| Building – 0.0% | | | | | |
Goodman Global Holdings, Inc.,
2nd Lien Term Loan, 9%, 2017 | | $ | 2,458 | | | $ | 2,531 | |
| | | | | | | | |
| Consumer Services – 0.1% | | | | | |
| Realogy Corp., Letter of Credit, 3.3%, 2013 | | $ | 3,360 | | | $ | 3,144 | |
| Realogy Corp., Term Loan, 3.28%, 2013 | | | 24,663 | | | | 23,082 | |
| | | | | | | | |
| | | | | | $ | 26,226 | |
| | | | | | | | |
| Financial Institutions – 0.0% | | | | | |
| American General Financial Corp., Term Loan B, 7.25%, 2015 | | $ | 9,469 | | | $ | 9,593 | |
| | | | | | | | |
| Gaming & Lodging – 0.1% | | | | | |
Green Valley Ranch Gaming LLC,
Second Lien Term Loan, 3.05%, 2014 (d) | | $ | 74,178 | | | $ | 1,298 | |
| MGM Mirage, Term Loan, 7%, 2014 (o) | | | 74,206 | | | | 70,069 | |
| | | | | | | | |
| | | | | | $ | 71,367 | |
| | | | | | | | |
| | | | | | | | |
| Issuer | | Shares/Par | | | Value ($) | |
| | | | | | | | |
| FLOATING RATE LOANS (g)(r) – continued | | | | | |
| Utilities – Electric Power – 0.1% | | | | | |
| Texas Competitive Electric Holdings Co. LLC, Term Loan B-2, 3.76%, 2014 | | $ | 44,111 | | | $ | 34,025 | |
| | | | | | | | |
Total Floating Rate Loans
(Identified Cost, $335,608) | | | | | | $ | 299,108 | |
| | | | | | | | |
| |
| COMMON STOCKS – 0.1% | | | | | |
| Automotive – 0.0% | | | | | |
| Accuride Corp. (a) | | | 1,318 | | | $ | 20,930 | |
| | | | | | | | |
| Broadcasting – 0.0% | | | | | |
| New Young Broadcasting Holding Co., Inc. (a) | | | 9 | | | $ | 21,375 | |
| | | | | | | | |
| Construction – 0.0% | | | | | |
| Nortek, Inc. (a) | | | 341 | | | $ | 12,276 | |
| | | | | | | | |
| Printing & Publishing – 0.1% | | | | | |
| American Media Operations, Inc. | | | 1,733 | | | $ | 24,730 | |
| Quad/Graphics, Inc. (a) | | | 81 | | | | 3,342 | |
| | | | | | | | |
| | | | | | $ | 28,072 | |
| | | | | | | | |
Total Common Stocks
(Identified Cost, $74,590) | | | | | | $ | 82,653 | |
| | | | | | | | |
| |
| CONVERTIBLE PREFERRED STOCKS – 0.1% | | | | | |
| Automotive – 0.1% | | | | | |
General Motors Co., 4.75% (a)
(Identified Cost, $50,000) | | | 1,000 | | | $ | 54,110 | |
| | | | | | | | |
| | |
| PREFERRED STOCKS – 0.0% | | | | | | | | |
| Other Banks & Diversified Financials – 0.0% | | | | | |
Citigroup Capital XIII, 7.875% (a)
(Identified Cost, $10,625) | | | 425 | | | $ | 11,437 | |
| | | | | | | | |
| | | | | | | | | | | | | | | | |
| | | Strike
Price | | | First
Exercise | | | | | | | |
| | | | | | | | | | | | | | | | |
| WARRANTS – 0.1% | | | | | | | | | | | | | |
| Broadcasting – 0.1% | | | | | | | | | | | | | |
New Young Broadcasting Holding Co., Inc. (1 share for 1 warrant) (a)
(Identified Cost, $47,888) | | $ | 0.10 | | | | 7/14/10 | | | | 25 | | | $ | 59,375 | |
| | | | | | | | | | | | | | | | |
| | | | | | | | |
| | | | | | | | |
| | |
| MONEY MARKET FUNDS (v) – 0.0% | | | | | | | | |
MFS Institutional Money Market Portfolio,
0.18%, at Cost and Net Asset Value | | | 55 | | | $ | 55 | |
| | | | | | | | |
Total Investments
(Identified Cost, $49,118,459) | | | | | | $ | 50,856,269 | |
| | | | | | | | |
OTHER ASSETS, LESS
LIABILITIES – 2.0% | | | | | | | 1,012,333 | |
| | | | | | | | |
| Net Assets –100.0% | | | | | | $ | 51,868,602 | |
| | | | | | | | |
15
MFS Strategic Income Portfolio
Portfolio of Investments – continued
| (a) | | Non-income producing security. |
| (d) | | Non-income producing security – in default. |
| (e) | | Guaranteed by Minister for Finance of Ireland. |
| (f) | | All or a portion of the security has been segregated as collateral for open futures contracts. |
| (g) | | The rate shown represents a weighted average coupon rate on settled positions at period end, unless otherwise indicated. |
| (i) | | Interest only security for which the fund receives interest on notional principal (Par amount). Par amount shown is the notional principal and does not reflect the cost of the security. |
| (n) | | Securities exempt from registration under Rule 144A of the Securities Act of 1933. These securities may be sold in the ordinary course of business in transactions exempt from registration, normally to qualified institutional buyers. At period end, the aggregate value of these securities was $11,510,846, representing 22.19% of net assets. |
| (o) | | All or a portion of this position has not settled. Upon settlement date, interest rates for unsettled amounts will be determined. The rate shown represents the weighted average coupon rate for settled amounts. |
| (p) | | Payment-in-kind security. |
| (r) | | Remaining maturities of floating rate loans may be less than stated maturities shown as a result of contractual or optional prepayments by the borrower. Such prepayments cannot be predicted with certainty. These loans may be subject to restrictions on resale. Floating rate loans generally have rates of interest which are determined periodically by reference to a base lending rate plus a premium. |
| (v) | | Underlying fund that is available only to investment companies managed by MFS. The rate quoted is the annualized seven-day yield of the fund at period end. |
| (z) | | Restricted securities are not registered under the Securities Act of 1933 and are subject to legal restrictions on resale. These securities generally may be resold in transactions exempt from registration or to the public if the securities are subsequently registered. Disposal of these securities may involve time-consuming negotiations and prompt sale at an acceptable price may be difficult. The fund holds the following restricted securities: |
| | | | | | | | | | |
| Restricted Securities | | Acquisition
Date | | Cost | | | Value | |
| AMC Entertainment, Inc., 9.75%, 2020 | | 12/01/10 | | | $25,000 | | | | $26,000 | |
| American Media, Inc., 13.5%, 2018 | | 12/22/10 | | | 6,868 | | | | 6,867 | |
| Anthracite Ltd., CDO, 6%, 2037 | | 5/14/02 | | | 179,559 | | | | 60,000 | |
| ARCap REIT, Inc., CDO, “H”, 6.078%, 2045 | | 9/21/04 | | | 175,592 | | | | 11,500 | |
| Bayview Financial Revolving Mortgage Loan Trust, FRN, 1.86%, 2040 | | 3/01/06 | | | 187,219 | | | | 85,353 | |
| Bosphorus Financial Services Ltd., FRN, 2.085%, 2012 | | 3/08/05 | | | 62,500 | | | | 61,596 | |
| Brazilian Merchant Voucher Receivables Ltd., 5.911%, 2011 | | 3/08/07 | | | 38,018 | | | | 38,566 | |
| Bresnan Broadband Holdings LLC, 8%, 2018 | | 12/01/10 | | | 10,000 | | | | 10,300 | |
| Capital Trust Realty Ltd., CDO, 5.16%, 2035 | | 9/16/10 | | | 160,198 | | | | 160,800 | |
| Chase Commercial Mortgage Securities Corp., 6.6%, 2029 | | 6/07/00 | | | 78,049 | | | | 94,378 | |
| Citadel Broadcasting Corp., 7.75%, 2018 | | 12/06/10 | | | 5,000 | | | | 5,175 | |
| Crest Ltd., “A1” CDO, FRN, 0.769%, 2018 | | 1/21/10 | | | 111,487 | | | | 125,125 | |
| Energy XXI Gulf Coast, Inc., 9.25%, 2017 | | 12/03/10 | | | 170,000 | | | | 176,800 | |
| Falcon Franchise Loan LLC, 6.5%, 2014 | | 7/15/05 | | | 93,936 | | | | 84,433 | |
| Falcon Franchise Loan LLC, FRN, 3.165%, 2023 | | 1/18/02 | | | 14,748 | | | | 14,657 | |
| Falcon Franchise Loan LLC, FRN, 3.246%, 2025 | | 1/29/03 | | | 49,127 | | | | 40,885 | |
| GMAC LLC, FRN, 6.02%, 2033 | | 11/17/00 | | | 289,434 | | | | 360,153 | |
| Hertz Corp., 7.375%, 2021 | | 12/06/10 | | | 50,000 | | | | 50,500 | |
| LBI Media, Inc., 8.5%, 2017 | | 7/18/07 | | | 54,321 | | | | 44,688 | |
| Local TV Finance LLC, 9.25%, 2015 | | 11/28/07-11/30/10 | | | 65,305 | | | | 60,401 | |
| Morgan Stanley Capital I, Inc., FRN, 1.419%, 2039 | | 7/20/04 | | | 57,831 | | | | 41,897 | |
| NAI Entertainment Holdings LLC, 8.25%, 2017 | | 12/02/10-12/20/10 | | | 20,798 | | | | 21,000 | |
| Nationstar Mortgage LLC, 10.875%, 2015 | | 3/23/10-12/08/10 | | | 34,137 | | | | 34,388 | |
| Nortek, Inc., 10%, 2018 | | 11/18/10 | | | 10,000 | | | | 10,325 | |
| Novelis, Inc., 8.375%, 2017 | | 12/10/10 | | | 25,224 | | | | 25,875 | |
| Novelis, Inc., 8.75%, 2020 | | 12/10/10 | | | 10,000 | | | | 10,375 | |
| Polypore International, Inc., 7.5%, 2017 | | 11/10/10 | | | 5,000 | | | | 5,100 | |
| Prudential Securities Secured Financing Corp., FRN, 7.285%, 2013 | | 12/06/04 | | | 424,275 | | | | 412,468 | |
| SIRIUS XM Radio, Inc., 13%, 2013 | | 12/15/10 | | | 17,804 | | | | 17,850 | |
16
MFS Strategic Income Portfolio
Portfolio of Investments – continued
| | | | | | | | | | |
| Restricted Securities – continued | | Acquisition
Date | | Cost | | | Value | |
| Salomon Brothers Mortgage Securities, Inc., FRN, 7.078%, 2032 | | 1/07/05 | | | $217,522 | | | | $221,509 | |
| Sappi Papier Holding GmbH, 6.75%, 2012 | | 7/29/10-8/02/10 | | | 25,138 | | | | 25,636 | |
| Scotts Miracle-Gro Co., 6.625%, 2020 | | 12/13/10 | | | 5,000 | | | | 5,000 | |
| Swift Services Holdings, Inc., 10%, 2018 | | 12/15/10 | | | 35,000 | | | | 36,663 | |
| Syniverse Holdings, Inc., 9.125%, 2019 | | 12/16/10 | | | 35,736 | | | | 36,138 | |
| Trinidad Drilling Ltd., 7.875%, 2019 | | 12/09/10 | | | 24,812 | | | | 25,250 | |
| USI Holdings Corp., 9.75%, 2015 | | 4/26/07-6/08/07 | | | 75,548 | | | | 75,750 | |
| Total Restricted Securities | | | | | | | | | $2,523,401 | |
| % of Net Assets | | | | | | | | | 4.9% | |
The following abbreviations are used in this report and are defined:
| CDO | | Collateralized Debt Obligation |
| FRN | | Floating Rate Note. Interest rate resets periodically and may not be the rate reported at period end. |
| PLC | | Public Limited Company |
| REIT | | Real Estate Investment Trust |
Abbreviations indicate amounts shown in currencies other than the U.S. dollar. All amounts are stated in U.S. dollars unless otherwise indicated. A list of abbreviations is shown below:
| CNY | | Chinese Yuan Renminbi |
Derivative Contracts at 12/31/10
Forward Foreign Currency Exchange Contracts at 12/31/10
| | | | | | | | | | | | | | | | | | | | | | | | |
Type | | Currency | | | Counterparty | | Contracts to
Deliver/Receive | | Settlement Date
Range | | In Exchange For | | | Contracts
at Value | | | Net Unrealized
Appreciation
(Depreciation) | |
| Asset Derivatives | | | | | | | | | | | | | | | | | | | | | | |
| BUY | | | CNY | | | JPMorgan Chase Bank N.A. | | 1,766,000 | | 1/18/11 | | $ | 265,564 | | | $ | 267,934 | | | $ | 2,370 | |
| SELL | | | GBP | | | Barclays Bank PLC | | 170,415 | | 1/12/11 | | | 271,301 | | | | 265,680 | | | | 5,621 | |
| SELL | | | GBP | | | Deutsche Bank AG | | 170,415 | | 1/12/11 | | | 271,239 | | | | 265,680 | | | | 5,559 | |
| BUY | | | IDR | | | JPMorgan Chase Bank N.A. | | 727,447,000 | | 1/14/11 | | | 80,416 | | | | 80,614 | | | | 198 | |
| BUY | | | KRW | | | JPMorgan Chase Bank N.A. | | 74,173,000 | | 1/05/11 | | | 63,466 | | | | 65,353 | | | | 1,887 | |
| SELL | | | KRW | | | JPMorgan Chase Bank N.A. | | 48,479,000 | | 1/05/11 | | | 42,898 | | | | 42,714 | | | | 184 | |
| | | | | | | | | | | | | | | | | | | | | | | | |
| | | | | | | | | | | | | | | | | | | | | | $ | 15,819 | |
| | | | | | | | | | | | | | | | | | | | | | | | |
17
MFS Strategic Income Portfolio
Portfolio of Investments – continued
Forward Foreign Currency Exchange Contracts at 12/31/10 – continued
| | | | | | | | | | | | | | | | | | | | | | | | |
Type | | Currency | | | Counterparty | | Contracts to
Deliver/Receive | | Settlement Date
Range | | In Exchange For | | | Contracts
at Value | | | Net Unrealized
Appreciation
(Depreciation) | |
| Liability Derivatives | | | | | | | | | | | | | | | | | | | | | | |
| SELL | | | CAD | | | Credit Suisse Group | | 54,921 | | 1/12/11 | | $ | 54,606 | | | $ | 55,228 | | | $ | (622 | ) |
| SELL | | | CAD | | | Goldman Sachs International | | 260,734 | | 1/12/11 | | | 254,863 | | | | 262,190 | | | | (7,327 | ) |
| BUY | | | EUR | | | JPMorgan Chase Bank N.A. | | 37,373 | | 1/12/11 | | | 52,024 | | | | 49,941 | | | | (2,083 | ) |
| SELL | | | EUR | | | UBS AG | | 1,384,510 | | 3/15/11 | | | 1,828,716 | | | | 1,849,686 | | | | (20,970 | ) |
| SELL | | | JPY | | | JPMorgan Chase Bank N.A. | | 31,293,817 | | 1/12/11 | | | 382,645 | | | | 385,468 | | | | (2,823 | ) |
| BUY | | | KRW | | | JPMorgan Chase Bank N.A. | | 48,479,000 | | 1/27/11 | | | 42,856 | | | | 42,664 | | | | (192 | ) |
| SELL | | | KRW | | | Deutsche Bank AG | | 25,694,000 | | 1/05/11 | | | 22,314 | | | | 22,639 | | | | (325 | ) |
| SELL | | | KRW | | | HSBC Bank | | 18,182,000 | | 1/12/11 | | | 15,790 | | | | 16,014 | | | | (224 | ) |
| SELL | | | KRW | | | JPMorgan Chase Bank N.A. | | 30,228,000 | | 1/27/11 | | | 26,244 | | | | 26,602 | | | | (358 | ) |
| BUY | | | SEK | | | Credit Suisse Group | | 63,821 | | 1/12/11 | | | 9,517 | | | | 9,487 | | | | (30 | ) |
| | | | | | | | | | | | | | | | | | | | | | | | |
| | | | | | | | | | | | | | | | | | | | | | $ | (34,954 | ) |
| | | | | | | | | | | | | | | | | | | | | | | | |
Futures Contracts Outstanding at 12/31/10
| | | | | | | | | | | | | | | | | | |
| Description | | Currency | | | Contracts | | | Value | | Expiration
Date | | | Unrealized
Appreciation
(Depreciation) | |
| Asset Derivatives | | | | | | | | | | | | | | | | | | |
| Interest Rate Futures | | | | | | | | | | | | | | | | | | |
| U.S. Treasury Bond 30 yr (Short) | | | USD | | | | 2 | | | $244,250 | | | March-2011 | | | | $9,931 | |
| U.S. Treasury Note 2 yr (Short) | | | USD | | | | 1 | | | 218,906 | | | March-2011 | | | | 418 | |
| | | | | | | | | | | | | | | | | | |
| | | | | | | | | | | | | | | | | $10,349 | |
| | | | | | | | | | | | | | | | | | |
Swap Agreements at 12/31/10
| | | | | | | | | | | | | | | | | | | | | | |
| Expiration | | Notional
Amount | | | Counterparty | | Cash Flows to
Receive | | | Cash Flows
to Pay | | | Fair
Value | |
| Asset Derivatives | | | | | | | | | | | | | | | |
| Credit Default Swaps | | | | | | | | | | | | | | | |
| 9/20/14 | | | USD | | | | 250,000(a | ) | | Goldman Sachs International | | | 1.00% (fixed rate) | | | | (1) | | | | $5,072 | |
| | | | | | | | | | | | | | | | | | | | | | |
| (1) | | Fund, as protection seller, to pay notional amount upon a defined credit event by Cargill, Inc., 7.375%, 10/01/25, an A2 rated bond. The fund entered into the contract to gain issuer exposure. |
| (a) | | Net unamortized premiums received by the fund amounted to $428. |
The credit ratings presented here are an indicator of the current payment/performance risk of the related swap, the reference obligation for which may be either a single security or, in case of a credit default index, a basket of securities issued by corporate or sovereign issuers. Each reference security, including each individual security within a reference basket of securities, is assigned a rating from Moody’s Investor Service. If not rated by Moody’s, the rating will be that assigned by Standard & Poor’s. Likewise, if not assigned by Standard & Poor’s, it will be based on the rating assigned by Fitch, Inc. The ratings for a credit default index are calculated by MFS as a weighted average of the external credit ratings of the individual securities that compose the index’s reference basket of securities.
At December 31, 2010, the fund had sufficient cash and/or other liquid securities to cover any commitments under these contracts.
See Notes to Financial Statements
18
MFS Strategic Income Portfolio
FINANCIAL STATEMENTS | STATEMENT OF ASSETS AND LIABILITIES
This statement represents your fund’s balance sheet, which details the assets and liabilities comprising the total value of the fund.
| | | | | | | | |
At 12/31/10 | | | | | | | | |
Assets | | | | | | | | |
Investments – | | | | | | | | |
Non-affiliated issuers, at value (identified cost, $49,118,404) | | | $50,856,214 | | | | | |
Underlying funds, at cost and value | | | 55 | | | | | |
Total investments, at value (identified cost, $49,118,459) | | | $50,856,269 | | | | | |
Cash | | | 89,832 | | | | | |
Receivables for | | | | | | | | |
Forward foreign currency exchange contracts | | | 15,819 | | | | | |
Investments sold | | | 157,390 | | | | | |
Fund shares sold | | | 33,444 | | | | | |
Interest | | | 816,870 | | | | | |
Swaps, at value (net unamortized premiums received, $428) | | | 5,072 | | | | | |
Receivable from investment adviser | | | 5,404 | | | | | |
Other assets | | | 2,040 | | | | | |
Total assets | | | | | | | $51,982,140 | |
Liabilities | | | | | | | | |
Payables for | | | | | | | | |
Forward foreign currency exchange contracts | | | $34,954 | | | | | |
Daily variation margin on open futures contracts | | | 2,516 | | | | | |
Investments purchased | | | 23,799 | | | | | |
Fund shares reacquired | | | 1,262 | | | | | |
Payable to affiliates | | | | | | | | |
Investment adviser | | | 1,984 | | | | | |
Distribution and/or service fees | | | 149 | | | | | |
Administrative services fee | | | 115 | | | | | |
Payable for Trustees’ compensation | | | 49 | | | | | |
Accrued expenses and other liabilities | | | 48,710 | | | | | |
Total liabilities | | | | | | | $113,538 | |
Net assets | | | | | | | $51,868,602 | |
Net assets consist of | | | | | | | | |
Paid-in capital | | | $51,959,653 | | | | | |
Unrealized appreciation (depreciation) on investments and translation of assets and liabilities in foreign currencies | | | 1,735,442 | | | | | |
Accumulated net realized gain (loss) on investments and foreign currency transactions | | | (4,245,614 | ) | | | | |
Undistributed net investment income | | | 2,419,121 | | | | | |
Net assets | | | | | | | $51,868,602 | |
Shares of beneficial interest outstanding | | | | | | | 5,261,957 | |
| | | | | | | | | | | | |
| | | Net assets | | | Shares
outstanding | | | Net asset value
per share | |
Initial Class | | | $40,926,621 | | | | 4,146,431 | | | | $9.87 | |
Service Class | | | 10,941,981 | | | | 1,115,526 | | | | 9.81 | |
See Notes to Financial Statements
19
MFS Strategic Income Portfolio
FINANCIAL STATEMENTS | STATEMENT OF OPERATIONS
This statement describes how much your fund earned in investment income and accrued in expenses. It also describes any gains and/or losses generated by fund operations.
| | | | | | | | |
Year ended 12/31/10 | | | | | | | | |
Net investment income | | | | | | | | |
Income | | | | | | | | |
Interest | | | $3,172,436 | | | | | |
Dividends | | | 1,910 | | | | | |
Dividends from underlying funds | | | 2,864 | | | | | |
Total investment income | | | | | | | $3,177,210 | |
Expenses | | | | | | | | |
Management fee | | | $396,047 | | | | | |
Distribution and/or service fees | | | 28,741 | | | | | |
Administrative services fee | | | 21,288 | | | | | |
Trustees’ compensation | | | 6,896 | | | | | |
Custodian fee | | | 36,268 | | | | | |
Shareholder communications | | | 8,069 | | | | | |
Auditing fees | | | 70,682 | | | | | |
Legal fees | | | 7,603 | | | | | |
Miscellaneous | | | 13,140 | | | | | |
Total expenses | | | | | | | $588,734 | |
Fees paid indirectly | | | (44 | ) | | | | |
Reduction of expenses by investment adviser | | | (84,406 | ) | | | | |
Net expenses | | | | | | | $504,284 | |
Net investment income | | | | | | | $2,672,926 | |
Realized and unrealized gain (loss) on investments and foreign currency transactions | | | | | | | | |
Realized gain (loss) (identified cost basis) | | | | | | | | |
Investment transactions | | | $704,030 | | | | | |
Futures contracts | | | (9,731 | ) | | | | |
Swap transactions | | | 1,243 | | | | | |
Foreign currency transactions | | | 264,880 | | | | | |
Net realized gain (loss) on investments and foreign currency transactions | | | | | | | $960,422 | |
Change in unrealized appreciation (depreciation) | | | | | | | | |
Investments | | | $1,540,001 | | | | | |
Futures contracts | | | 58,278 | | | | | |
Swap transactions | | | (1,375 | ) | | | | |
Translation of assets and liabilities in foreign currencies | | | (75,794 | ) | | | | |
Net unrealized gain (loss) on investments and foreign currency translation | | | | | | | $1,521,110 | |
Net realized and unrealized gain (loss) on investments and foreign currency | | | | | | | $2,481,532 | |
Change in net assets from operations | | | | | | | $5,154,458 | |
See Notes to Financial Statements
20
MFS Strategic Income Portfolio
FINANCIAL STATEMENTS | STATEMENTS OF CHANGES IN NET ASSETS
These statements describe the increases and/or decreases in net assets resulting from operations, any distributions, and any shareholder transactions.
| | | | | | | | |
For years ended 12/31 | | | 2010 | | | | 2009 | |
Change in net assets | | | | | | | | |
From operations | | | | | | | | |
Net investment income | | | $2,672,926 | | | | $2,889,016 | |
Net realized gain (loss) on investments and foreign currency transactions | | | 960,422 | | | | (1,437,735 | ) |
Net unrealized gain (loss) on investments and foreign currency translation | | | 1,521,110 | | | | 9,820,196 | |
Change in net assets from operations | | | $5,154,458 | | | | $11,271,477 | |
Distributions declared to shareholders | | | | | | | | |
From net investment income | | | $(2,808,031 | ) | | | $(4,831,795 | ) |
Change in net assets from fund share transactions | | | $(2,342,922 | ) | | | $3,074,206 | |
Total change in net assets | | | $3,505 | | | | $9,513,888 | |
Net assets | | | | | | | | |
At beginning of period | | | 51,865,097 | | | | 42,351,209 | |
At end of period (including undistributed net investment income of $2,419,121 and
$2,118,580, respectively) | | | $51,868,602 | | | | $51,865,097 | |
See Notes to Financial Statements
21
MFS Strategic Income Portfolio
FINANCIAL STATEMENTS | FINANCIAL HIGHLIGHTS
The financial highlights table is intended to help you understand the fund’s financial performance for the past 5 years. Certain information reflects financial results for a single fund share. The total returns in the table represent the rate by which an investor would have earned (or lost) on an investment in the fund share class (assuming reinvestment of all distributions) held for the entire period.
| | | | | | | | | | | | | | | | | | | | |
| Initial Class | | Years ended 12/31 | |
| | | 2010 | | | 2009 | | | 2008 | | | 2007 | | | 2006 | |
Net asset value, beginning of period | | | $9.46 | | | | $8.36 | | | | $10.40 | | | | $10.61 | | | | $10.71 | |
| Income (loss) from investment operations | | | | | | | | | | | | | | | | | | | | |
Net investment income (d) | | | $0.49 | | | | $0.55 | | | | $0.58 | | | | $0.60 | | | | $0.57 | |
Net realized and unrealized gain (loss) on investments
and foreign currency | | | 0.45 | | | | 1.54 | | | | (1.82 | ) | | | (0.23 | ) | | | 0.11 | |
Total from investment operations | | | $0.94 | | | | $2.09 | | | | $(1.24 | ) | | | $0.37 | | | | $0.68 | |
| Less distributions declared to shareholders | | | | | | | | | | | | | | | | | | | | |
From net investment income | | | $(0.53 | ) | | | $(0.99 | ) | | | $(0.80 | ) | | | $(0.58 | ) | | | $(0.66 | ) |
From net realized gain on investments | | | — | | | | — | | | | — | | | | — | | | | (0.12 | ) |
Total distributions declared to shareholders | | | $(0.53 | ) | | | $(0.99 | ) | | | $(0.80 | ) | | | $(0.58 | ) | | | $(0.78 | ) |
Net asset value, end of period | | | $9.87 | | | | $9.46 | | | | $8.36 | | | | $10.40 | | | | $10.61 | |
Total return (%) (k)(r)(s) | | | 10.27 | | | | 27.52 | | | | (12.94 | ) | | | 3.49 | | | | 6.71 | |
Ratios (%) (to average net assets) and Supplemental data: | | | | | | | | | | | | | | | | | | | | |
Expenses before expense reductions (f) | | | 1.06 | | | | 1.03 | | | | 1.02 | | | | 0.95 | | | | 0.97 | |
Expenses after expense reductions (f) | | | 0.90 | | | | 0.90 | | | | 0.90 | | | | 0.90 | | | | 0.95 | |
Net investment income | | | 5.11 | | | | 6.23 | | | | 6.07 | | | | 5.70 | | | | 5.44 | |
Portfolio turnover | | | 48 | | | | 63 | | | | 38 | | | | 49 | | | | 64 | |
Net assets at end of period (000 omitted) | | | $40,927 | | | | $40,221 | | | | $31,159 | | | | $49,582 | | | | $54,423 | |
| |
| Service Class | | Years ended 12/31 | |
| | | 2010 | | | 2009 | | | 2008 | | | 2007 | | | 2006 | |
Net asset value, beginning of period | | | $9.40 | | | | $8.30 | | | | $10.33 | | | | $10.54 | | | | $10.64 | |
| Income (loss) from investment operations | | | | | | | | | | | | | | | | | | | | |
Net investment income (d) | | | $0.47 | | | | $0.52 | | | | $0.55 | | | | $0.57 | | | | $0.54 | |
Net realized and unrealized gain (loss) on investments
and foreign currency | | | 0.45 | | | | 1.54 | | | | (1.80 | ) | | | (0.23 | ) | | | 0.11 | |
Total from investment operations | | | $0.92 | | | | $2.06 | | | | $(1.25 | ) | | | $0.34 | | | | $0.65 | |
| Less distributions declared to shareholders | | | | | | | | | | | | | | | | | | | | |
From net investment income | | | $(0.51 | ) | | | $(0.96 | ) | | | $(0.78 | ) | | | $(0.55 | ) | | | $(0.63 | ) |
From net realized gain on investments | | | — | | | | — | | | | — | | | | — | | | | (0.12 | ) |
Total distributions declared to shareholders | | | $(0.51 | ) | | | $(0.96 | ) | | | $(0.78 | ) | | | $(0.55 | ) | | | $(0.75 | ) |
Net asset value, end of period | | | $9.81 | | | | $9.40 | | | | $8.30 | | | | $10.33 | | | | $10.54 | |
Total return (%) (k)(r)(s) | | | 10.05 | | | | 27.24 | | | | (13.21 | ) | | | 3.24 | | | | 6.45 | |
Ratios (%) (to average net assets) and Supplemental data: | | | | | | | | | | | | | | | | | | | | |
Expenses before expense reductions (f) | | | 1.31 | | | | 1.28 | | | | 1.26 | | | | 1.20 | | | | 1.22 | |
Expenses after expense reductions (f) | | | 1.15 | | | | 1.15 | | | | 1.15 | | | | 1.15 | | | | 1.19 | |
Net investment income | | | 4.87 | | | | 6.02 | | | | 5.82 | | | | 5.45 | | | | 5.19 | |
Portfolio turnover | | | 48 | | | | 63 | | | | 38 | | | | 49 | | | | 64 | |
Net assets at end of period (000 omitted) | | | $10,942 | | | | $11,644 | | | | $11,192 | | | | $19,232 | | | | $21,949 | |
| (d) | Per share data is based on average shares outstanding. |
| (f) | Ratios do not reflect reductions from fees paid indirectly, if applicable. |
| (k) | The total return does not reflect expenses that apply to separate accounts. Inclusion of these charges would reduce the total return figures for all periods shown. |
| (r) | Certain expenses have been reduced without which performance would have been lower. |
| (s) | From time to time the fund may receive proceeds from litigation settlements, without which performance would be lower. |
See Notes to Financial Statements
22
MFS Strategic Income Portfolio
NOTES TO FINANCIAL STATEMENTS
| (1) | | Business and Organization |
MFS Strategic Income Portfolio (the fund) is a series of MFS Variable Insurance Trust II (the trust). The trust is organized as a Massachusetts business trust and is registered under the Investment Company Act of 1940, as amended, as an open-end management investment company. The shareholders of each series of the trust are separate accounts of insurance companies, which offer variable annuity and/or life insurance products, and qualified retirement and pension plans.
| (2) | | Significant Accounting Policies |
General – The preparation of financial statements in conformity with U.S. generally accepted accounting principles requires management to make estimates and assumptions that affect the reported amounts of assets and liabilities, and disclosure of contingent assets and liabilities at the date of the financial statements and the reported amounts of revenues and expenses during the reporting period. Actual results could differ from those estimates. In the preparation of these financial statements, management has evaluated subsequent events occurring after the date of the fund’s Statement of Assets and Liabilities through the date that the financial statements were issued. The fund invests in foreign securities, including securities of emerging market issuers. Investments in foreign securities are vulnerable to the effects of changes in the relative values of the local currency and the U.S. dollar and to the effects of changes in each country’s legal, political, and economic environment. The markets of emerging markets countries are generally more volatile than the markets of developed countries with more mature economies. All of the risks of investing in foreign securities previously described are heightened when investing in emerging markets countries.
Investment Valuations – Debt instruments and floating rate loans (other than short-term instruments), including restricted debt instruments, are generally valued at an evaluated or composite bid as provided by a third-party pricing service. Equity securities, including restricted equity securities, are generally valued at the last sale or official closing price as provided by a third-party pricing service on the market or exchange on which they are primarily traded. Equity securities, for which there were no sales reported that day, are generally valued at the last quoted daily bid quotation as provided by a third-party pricing service on the market or exchange on which such securities are primarily traded. Equity securities held short, for which there were no sales reported for that day, are generally valued at the last quoted daily ask quotation as provided by a third-party pricing service on the market or exchange on which such securities are primarily traded. Short-term instruments with a maturity at issuance of 60 days or less generally are valued at amortized cost, which approximates market value. Futures contracts are generally valued at last posted settlement price as provided by a third-party pricing service on the market on which they are primarily traded. Futures contracts for which there were no trades that day for a particular position are generally valued at the closing bid quotation as provided by a third-party pricing service on the market on which such futures contracts are primarily traded. Forward foreign currency contracts are generally valued at the mean of bid and asked prices for the time period interpolated from rates provided by a third-party pricing service for proximate time periods. Swaps are generally valued at valuations provided by a third-party pricing service. Open-end investment companies are generally valued at net asset value per share. Securities and other assets generally valued on the basis of information from a third-party pricing service may also be valued at a broker/dealer bid quotation. Values obtained from third-party pricing services can utilize both transaction data and market information such as yield, quality, coupon rate, maturity, type of issue, trading characteristics, and other market data. The values of foreign securities and other assets and liabilities expressed in foreign currencies are converted to U.S. dollars using the mean of bid and asked prices for rates provided by a third-party pricing service.
The Board of Trustees has delegated primary responsibility for determining or causing to be determined the value of the fund’s investments (including any fair valuation) to the adviser pursuant to valuation policies and procedures approved by the Board. If the adviser determines that reliable market quotations are not readily available, investments are valued at fair value as determined in good faith by the adviser in accordance with such procedures under the oversight of the Board of Trustees. Under the fund’s valuation policies and procedures, market quotations are not considered to be readily available for most types of debt instruments and floating rate loans and many types of derivatives. These investments are generally valued at fair value based on information from third-party pricing services. In addition, investments may be valued at fair value if the adviser determines that an investment’s value has been materially effected by events occurring after the close of the exchange or market on which the investment is principally traded (such as foreign exchange or market) and prior to the determination of the fund’s net asset value, or after the halting of trading of a specific security where trading does not resume prior to the close of the exchange or market on which the security is principally traded. The adviser generally relies on third-party pricing services or other information (such as the correlation with price movements of similar securities in the same or other markets; the type, cost and investment characteristics of the security; the business and financial condition of the issuer; and trading and other market data) to assist in determining whether to fair value and at what value to fair value an investment. The value of an investment for purposes of calculating the fund’s net asset value can differ depending on the source and method used to determine value. When fair valuation is used, the value of an investment used to determine the fund’s net asset value may
23
MFS Strategic Income Portfolio
Notes to Financial Statements – continued
differ from quoted or published prices for the same investment. There can be no assurance that the fund could obtain the fair value assigned to an investment if it were to sell the investment at the same time at which the fund determines its net asset value per share.
Various inputs are used in determining the value of the fund’s assets or liabilities. These inputs are categorized into three broad levels. In certain cases, the inputs used to measure fair value may fall into different levels of the fair value hierarchy. In such cases, an investment’s level within the fair value hierarchy is based on the lowest level of input that is significant to the fair value measurement. The fund’s assessment of the significance of a particular input to the fair value measurement in its entirety requires judgment, and considers factors specific to the investment. Level 1 includes unadjusted quoted prices in active markets for identical assets or liabilities. Level 2 includes other significant observable market-based inputs (including quoted prices for similar securities, interest rates, prepayment speed, and credit risk). Level 3 includes unobservable inputs, which may include the adviser’s own assumptions in determining the fair value of investments. Other financial instruments are derivative instruments not reflected in total investments, such as futures, forwards, and swap contracts. The following is a summary of the levels used as of December 31, 2010 in valuing the fund’s assets or liabilities:
| | | | | | | | | | | | | | | | |
| Investments at Value | | Level 1 | | | Level 2 | | | Level 3 | | | Total | |
| Equity Securities | | | $102,095 | | | | $105,480 | | | | $— | | | | $207,575 | |
| U.S. Treasury Bonds & U.S. Government Agency & Equivalents | | | — | | | | 730,257 | | | | — | | | | 730,257 | |
| Non-U.S. Sovereign Debt | | | — | | | | 10,013,104 | | | | — | | | | 10,013,104 | |
| Corporate Bonds | | | — | | | | 28,697,412 | | | | 6,867 | | | | 28,704,279 | |
| Residential Mortgage-Backed Securities | | | — | | | | 291,206 | | | | — | | | | 291,206 | |
| Commercial Mortgage-Backed Securities | | | — | | | | 1,545,475 | | | | — | | | | 1,545,475 | |
| Asset-Backed Securities (including CDOs) | | | — | | | | 652,277 | | | | — | | | | 652,277 | |
| Foreign Bonds | | | — | | | | 8,412,933 | | | | — | | | | 8,412,933 | |
| Floating Rate Loans | | | — | | | | 299,108 | | | | — | | | | 299,108 | |
| Mutual Funds | | | 55 | | | | — | | | | — | | | | 55 | |
| Total Investments | | | $102,150 | | | | $50,747,252 | | | | $6,867 | | | | $50,856,269 | |
| | | | |
| Other Financial Instruments | | | | | | | | | | | | |
| Futures | | | $10,349 | | | | $— | | | | $— | | | | $10,349 | |
| Swaps | | | — | | | | 5,072 | | | | — | | | | 5,072 | |
| Forward Currency Contracts | | | — | | | | (19,135 | ) | | | — | | | | (19,135 | ) |
For further information regarding security characteristics, see the Portfolio of Investments.
The following is a reconciliation of level 3 assets for which significant unobservable inputs were used to determine fair value. The table presents the activity of level 3 securities held at the beginning and the end of the period.
| | | | | | | | | | | | |
| | | Equity Securities | | | Corporate
Bonds | | | Total | |
| Balance as of 12/31/09 | | | $3,242 | | | | $— | | | | $3,242 | |
Accrued discounts/premiums | | | — | | | | — | | | | — | |
Realized gain (loss) | | | (2,418 | ) | | | — | | | | (2,418 | ) |
Change in unrealized appreciation (depreciation) | | | (824 | ) | | | — | | | | (824 | ) |
Purchases | | | — | | | | — | | | | — | |
Sales | | | — | | | | — | | | | — | |
Transfers into level 3 | | | — | | | | 6,867 | | | | 6,867 | |
Transfers out of level 3 | | | — | | | | — | | | | — | |
| Balance as of 12/31/10 | | | $— | | | | $6,867 | | | | $6,867 | |
The net change in unrealized (depreciation) from investments still held as level 3 at December 31, 2010 is $0.
Foreign Currency Translation – Purchases and sales of foreign investments, income, and expenses are converted into U.S. dollars based upon currency exchange rates prevailing on the respective dates of such transactions or on the reporting date for foreign denominated receivables and payables. Gains and losses attributable to foreign currency exchange rates on sales of securities are recorded for financial statement purposes as net realized gains and losses on investments. Gains and losses attributable to foreign exchange rate movements on receivables, payables, income and expenses are recorded for financial statement purposes as foreign currency transaction gains and losses. That portion of both realized and unrealized gains and losses on investments that results from fluctuations in foreign currency exchange rates is not separately disclosed.
Derivatives – The fund uses derivatives for different purposes, including to earn income and enhance returns, to increase or decrease exposure to a particular market, to manage or adjust the risk profile of the fund, or as alternatives to direct
24
MFS Strategic Income Portfolio
Notes to Financial Statements – continued
investments. Derivatives are used for hedging or non-hedging purposes. While hedging can reduce or eliminate losses, it can also reduce or eliminate gains. When the fund uses derivatives as an investment to increase market exposure, or for hedging purposes, gains and losses from derivative instruments may be substantially greater than the derivative’s original cost.
Derivative instruments used by the fund include futures contracts, forward foreign currency exchange contracts, and swap agreements. The fund’s period end derivatives, as presented in the Portfolio of Investments and the associated Derivative Contract Tables, generally are indicative of the volume of its derivative activity during the period.
The following table presents, by major type of derivative contract, the fair value, on a gross basis, of the asset and liability components of derivatives held by the fund at December 31, 2010 as reported in the Statement of Assets and Liabilities:
| | | | | | | | | | |
| | | | | Fair Value (a) | |
| Risk | | Derivative | | Asset Derivatives | | | Liability Derivatives | |
| Interest Rate Contracts | | Interest Rate Futures | | | $10,349 | | | | $— | |
| Foreign Exchange Contracts | | Forward Foreign Currency Exchange Contracts | | | 15,819 | | | | (34,954 | ) |
| Credit Contracts | | Credit Default Swaps | | | 5,072 | | | | — | |
| Total | | | | | $31,240 | | | | $(34,954 | ) |
| (a) | The value of futures contracts outstanding includes cumulative appreciation (depreciation) as reported in the fund’s Portfolio of Investments. Only the current day variation margin for futures contracts is separately reported within the fund’s Statement of Assets and Liabilities. |
The following table presents, by major type of derivative contract, the realized gain (loss) on derivatives held by the fund for the year ended December 31, 2010 as reported in the Statement of Operations:
| | | | | | | | | | | | |
| Risk | | Futures
Contracts | | | Swap
Transactions | | | Foreign
Currency
Transactions | |
| Interest Rate Contracts | | | $(9,731 | ) | | | $— | | | | $— | |
| Foreign Exchange Contracts | | | — | | | | — | | | | 279,143 | |
| Credit Contracts | | | — | | | | 1,243 | | | | — | |
| Total | | | $(9,731 | ) | | | $1,243 | | | | $279,143 | |
The following table presents, by major type of derivative contract, the change in unrealized appreciation (depreciation) on derivatives held by the fund for the year ended December 31, 2010 as reported in the Statement of Operations:
| | | | | | | | | | | | |
| Risk | | Futures
Contracts | | | Swap
Transactions | | | Translation of
Assets and
Liabilities in
Foreign Currencies | |
| Interest Rate Contracts | | | $58,278 | | | | $— | | | | $— | |
| Foreign Exchange Contracts | | | — | | | | — | | | | (76,448 | ) |
| Credit Contracts | | | — | | | | (1,375 | ) | | | — | |
| Total | | | $58,278 | | | | $(1,375 | ) | | | $(76,448 | ) |
Derivative counterparty credit risk is managed through formal evaluation of the creditworthiness of all potential counterparties. On certain over-the-counter derivatives, the fund attempts to reduce its exposure to counterparty credit risk whenever possible by entering into an International Swaps and Derivatives Association (ISDA) Master Agreement on a bilateral basis with each of the counterparties with whom it undertakes a significant volume of transactions. The ISDA Master Agreement gives each party to the agreement the right to terminate all transactions traded under such agreement if there is a certain deterioration in the credit quality of the other party. The ISDA Master Agreement gives the fund the right, upon an event of default by the applicable counterparty or a termination of the agreement, to close out all transactions traded under such agreement and to net amounts owed under each transaction to one net amount payable by one party to the other. This right to close out and net payments across all transactions traded under the ISDA Master Agreement could result in a reduction of the fund’s credit risk to such counterparty equal to any amounts payable by the fund under the applicable transactions, if any. However, absent an event of default by the counterparty or a termination of the agreement, the ISDA Master Agreement does not result in an offset of reported amounts of assets and liabilities in the Statement of Assets and Liabilities across transactions between the fund and the applicable counterparty.
Collateral requirements differ by type of derivative. Collateral or margin requirements are set by the broker or exchange clearing house for exchange traded derivatives (i.e., futures and exchange-traded options) while collateral terms are contract specific for over-the-counter traded derivatives (i.e., forwards, swaps and over-the-counter options). For derivatives traded under an ISDA Master Agreement, the collateral requirements are netted across all transactions traded under such agreement and one amount is posted from one party to the other to collateralize such obligations. Cash collateral that has been pledged to
25
MFS Strategic Income Portfolio
Notes to Financial Statements – continued
cover obligations of the fund under derivative contracts, if any, will be reported separately on the Statement of Assets and Liabilities as restricted cash. Securities collateral pledged for the same purpose, if any, is noted in the Portfolio of Investments.
Futures Contracts – The fund entered into futures contracts which may be used to gain or to hedge against broad market, interest rate or currency exposure. A futures contract represents a commitment for the future purchase or sale of an asset at a specified price on a specified date.
Upon entering into a futures contract, the fund is required to deposit with the broker, either in cash or securities, an initial margin in an amount equal to a certain percentage of the notional amount of the contract. Subsequent payments (variation margin) are made or received by the fund each day, depending on the daily fluctuations in the value of the contract, and are recorded for financial statement purposes as unrealized gain or loss by the fund until the contract is closed or expires at which point the gain or loss on futures is realized.
The fund bears the risk of interest rates, exchange rates or securities prices moving unexpectedly, in which case, the fund may not achieve the anticipated benefits of the futures contracts and may realize a loss. While futures may present less counterparty risk to the fund since the contracts are exchange traded and the exchange’s clearinghouse guarantees payments to the broker, there is still counterparty credit risk due to the insolvency of the broker. The fund’s maximum risk of loss due to counterparty credit risk is equal to the margin posted by the fund to the broker plus any gains or minus any losses on the outstanding futures contracts.
Forward Foreign Currency Exchange Contracts – The fund entered into forward foreign currency exchange contracts for the purchase or sale of a specific foreign currency at a fixed price on a future date. These contracts may be used to hedge the fund’s currency risk or for non-hedging purposes. For hedging purposes, the fund may enter into contracts to deliver or receive foreign currency that the fund will receive from or use in its normal investment activities. The fund may also use contracts to hedge against declines in the value of foreign currency denominated securities due to unfavorable exchange rate movements. For non-hedging purposes, the fund may enter into contracts with the intent of changing the relative exposure of the fund’s portfolio of securities to different currencies to take advantage of anticipated exchange rate changes.
Forward foreign currency exchange contracts are adjusted by the daily exchange rate of the underlying currency and any unrealized gains or losses are recorded as a receivable or payable for forward foreign currency exchange contracts until the contract settlement date. On contract settlement date, any gain or loss on the contract is recorded as realized gains or losses on foreign currency transactions.
Risks may arise upon entering into these contracts from unanticipated movements in the value of the contract and from the potential inability of counterparties to meet the terms of their contracts. Generally, the fund’s maximum risk due to counterparty credit risk is the unrealized gain on the contract due to our use of continuous linked settlement, an industry accepted settlement system. This risk is mitigated in cases where there is an ISDA Master Agreement between the fund and the counterparty providing for netting as described above and for posting of collateral by the counterparty to the fund to cover the fund’s exposure to the counterparty under such ISDA Master Agreement.
Swap Agreements – The fund entered into swap agreements. A swap is generally an exchange of cash payments, at specified intervals or upon the occurrence of specified events, between the fund and a counterparty. The net cash payments exchanged are recorded as a realized gain or loss on swap transactions in the Statement of Operations. The value of the swap, which is adjusted daily and includes any related interest accruals to be paid or received by the fund, is recorded on the Statement of Assets and Liabilities. The daily change in value, including any related interest accruals to be paid or received, is recorded as unrealized appreciation or depreciation on swap transactions in the Statement of Operations. Amounts paid or received at the inception of the swap are reflected as premiums paid or received on the Statement of Assets and Liabilities and are amortized using the effective interest method over the term of the agreement. A liquidation payment received or made upon early termination is recorded as a realized gain or loss on swap transactions in the Statement of Operations.
Risks related to swap agreements include the possible lack of a liquid market, unfavorable market and interest rate movements of the underlying instrument and the failure of the counterparty to perform under the terms of the agreements. To address counterparty risk, swap transactions are limited to only highly-rated counterparties. The risk is further mitigated by having an ISDA Master Agreement between the fund and the counterparty providing for netting as described above and by the posting of collateral by the counterparty to the fund to cover the fund’s exposure to the counterparty under such ISDA Master Agreement.
The fund entered into credit default swaps in order to manage its exposure to the market or certain sectors of the market, to reduce its credit risk exposure to defaults of corporate and sovereign issuers or to create exposure to corporate or sovereign issuers to which it is not otherwise exposed. In a credit default swap, the protection buyer can make an upfront payment and will make a stream of payments based on a fixed percentage applied to the contract notional amount to the protection seller in
26
MFS Strategic Income Portfolio
Notes to Financial Statements – continued
exchange for the right to receive a specified return upon the occurrence of a defined credit event on the reference obligation (which may be either a single security or a basket of securities issued by corporate or sovereign issuers) and, with respect to the rare cases where physical settlement applies, the delivery by the buyer to the seller of a defined deliverable obligation. Although contract-specific, credit events generally consist of a combination of the following: bankruptcy, failure to pay, restructuring, obligation acceleration, obligation default, or repudiation/moratorium, each as defined in the 2003 ISDA Credit Derivatives Definitions as amended by the relevant contract. Restructuring is generally not applicable when the reference obligation is issued by a North American corporation and obligation acceleration, obligation default, or repudiation/moratorium are generally only applicable when the reference obligation is issued by a sovereign entity or an entity in an emerging country. Upon determination of the final price for the deliverable obligation (or upon delivery of the deliverable obligation in the case of physical settlement), the difference between the value of the deliverable obligation and the swap’s notional amount is recorded as realized gain or loss on swap transactions in the Statement of Operations.
Credit default swaps are considered to have credit-risk-related contingent features since they trigger payment by the protection seller to the protection buyer upon the occurrence of a defined credit event. As discussed earlier in this note, any collateral requirements for these swaps are based generally on the market value of the swap netted against collateral requirements for other types of over-the-counter derivatives traded under each counterparty’s ISDA Master Agreement. The maximum amount of future, undiscounted payments that the fund, as protection seller, could be required to make is equal to the swap’s notional amount. The protection seller’s payment obligation would be offset to the extent of the value of the contract’s deliverable obligation. At December 31, 2010, the fund did not hold any credit default swaps at an unrealized loss where it is the protection seller.
The fund’s maximum risk of loss from counterparty risk, either as the protection seller or as the protection buyer, is the fair value of the contract. This risk is mitigated by having an ISDA Master Agreement between the fund and the counterparty providing for netting as described above and by the posting of collateral by the counterparty to the fund to cover the fund’s exposure to the counterparty under such ISDA Master Agreement.
Loans and Other Direct Debt Instruments – The fund invests in loans and loan participations or other receivables. These investments may include standby financing commitments, including revolving credit facilities, which obligate the fund to supply additional cash to the borrower on demand. Loan participations involve a risk of insolvency of the lending bank or other financial intermediary.
Indemnifications – Under the fund’s organizational documents, its officers and Trustees may be indemnified against certain liabilities and expenses arising out of the performance of their duties to the fund. Additionally, in the normal course of business, the fund enters into agreements with service providers that may contain indemnification clauses. The fund’s maximum exposure under these agreements is unknown as this would involve future claims that may be made against the fund that have not yet occurred.
Investment Transactions and Income – Investment transactions are recorded on the trade date. Interest income is recorded on the accrual basis. All premium and discount is amortized or accreted for financial statement purposes in accordance with U.S. generally accepted accounting principles. The fund earns certain fees in connection with its floating rate loan purchasing activities. These fees are in addition to interest payments earned and may include amendment fees, commitment fees, facility fees, consent fees, and prepayment fees. Commitment fees are recorded on an accrual basis as income in the accompanying financial statements. Dividends received in cash are recorded on the ex-dividend date. Certain dividends from foreign securities will be recorded when the fund is informed of the dividend if such information is obtained subsequent to the ex-dividend date. Dividend and interest payments received in additional securities are recorded on the ex-dividend or ex-interest date in an amount equal to the value of the security on such date. Debt obligations may be placed on non-accrual status or set to accrue at a rate of interest less than the contractual coupon when the collection of all or a portion of interest has become doubtful. Interest income for those debt obligations may be further reduced by the write-off of the related interest receivables when deemed uncollectible.
The fund may receive proceeds from litigation settlements. Any proceeds received from litigation involving portfolio holdings are reflected in the Statement of Operations in realized gain/loss if the security has been disposed of by the fund or in unrealized gain/loss if the security is still held by the fund. Any other proceeds from litigation not related to portfolio holdings are reflected as other income in the Statement of Operations.
Fees Paid Indirectly – The fund’s custody fee may be reduced according to an arrangement that measures the value of cash deposited with the custodian by the fund. This amount, for the year ended December 31, 2010, is shown as a reduction of total expenses on the Statement of Operations.
Tax Matters and Distributions – The fund intends to qualify as a regulated investment company, as defined under Subchapter M of the Internal Revenue Code, and to distribute all of its taxable income, including realized capital gains. As a result, no
27
MFS Strategic Income Portfolio
Notes to Financial Statements – continued
provision for federal income tax is required. The fund’s federal tax returns for the prior three fiscal years remain subject to examination by the Internal Revenue Service. Foreign taxes, if any, have been accrued by the fund in the accompanying financial statements.
Distributions to shareholders are recorded on the ex-dividend date. Income and capital gain distributions are determined in accordance with income tax regulations, which may differ from U.S. generally accepted accounting principles. Certain capital accounts in the financial statements are periodically adjusted for permanent differences in order to reflect their tax character. These adjustments have no impact on net assets or net asset value per share. Temporary differences which arise from recognizing certain items of income, expense, gain or loss in different periods for financial statement and tax purposes will reverse at some time in the future. Distributions in excess of net investment income or net realized gains are temporary overdistributions for financial statement purposes resulting from differences in the recognition or classification of income or distributions for financial statement and tax purposes.
Book/tax differences primarily relate to amortization and accretion of debt securities and straddle loss deferrals.
The tax character of distributions declared to shareholders for the last two fiscal years is as follows:
| | | | | | | | |
| | | 12/31/10 | | | 12/31/09 | |
| Ordinary income (including any short-term capital gains) | | | $2,808,031 | | | | $4,831,795 | |
The federal tax cost and the tax basis components of distributable earnings were as follows:
| | | | |
| As of 12/31/10 | | | | |
| Cost of investments | | | $49,511,857 | |
| Gross appreciation | | | 3,120,742 | |
| Gross depreciation | | | (1,776,330 | ) |
| Net unrealized appreciation (depreciation) | | | $1,344,412 | |
| Undistributed ordinary income | | | 2,836,348 | |
| Capital loss carryforwards | | | (3,806,830 | ) |
| Other temporary differences | | | (464,981 | ) |
As of December 31, 2010, the fund had capital loss carryforwards available to offset future realized gains. Such losses expire as follows:
| | | | |
| 12/31/15 | | | $(8,256 | ) |
| 12/31/16 | | | (2,156,556 | ) |
| 12/31/17 | | | (1,642,018 | ) |
| Total | | | $(3,806,830 | ) |
Multiple Classes of Shares of Beneficial Interest – The fund offers multiple classes of shares, which differ in their respective distribution and/or service fees. The fund’s income, realized and unrealized gain (loss), and common expenses are allocated to shareholders based on the daily net assets of each class. Dividends are declared separately for each class. Differences in per share dividend rates are generally due to differences in separate class expenses. The fund’s distributions declared to shareholders as reported on the Statements of Changes in Net Assets are presented by class as follows:
| | | | | | | | |
| | | From net investment
income | |
| | | Year ended
12/31/10 | | | Year ended
12/31/09 | |
| Initial Class | | | $2,214,015 | | | | $3,605,134 | �� |
| Service Class | | | 594,016 | | | | 1,226,661 | |
| Total | | | $2,808,031 | | | | $4,831,795 | |
| (3) | | Transactions with Affiliates |
Investment Adviser – The fund has an investment advisory agreement with MFS to provide overall investment management and related administrative services and facilities to the fund. The management fee is computed daily and paid monthly at the following annual rates:
| | | | |
| First $1 billion of average daily net assets | | | 0.75% | |
| Average daily net assets in excess of $1 billion | | | 0.65% | |
The investment adviser has agreed in writing to reduce its management fee to 0.70% for the first $1 billion of average daily net assets. This written agreement will continue until modified or rescinded by the fund’s shareholders. This management fee
28
MFS Strategic Income Portfolio
Notes to Financial Statements – continued
reduction amounted to $26,401, which is shown as a reduction of total expenses in the Statement of Operations. The management fee incurred for the year ended December 31, 2010 was equivalent to an annual effective rate of 0.70% of the fund’s average daily net assets.
The investment adviser has agreed in writing to pay a portion of the fund’s total annual operating expenses, exclusive of interest, taxes, extraordinary expenses, brokerage and transaction costs, and investment-related expenses, such that total annual operating expenses do not exceed 0.90% of average daily net assets for the Initial Class shares and 1.15% of average daily net assets for the Service Class shares. This written agreement will continue until April 30, 2012. For the year ended December 31, 2010, this reduction amounted to $58,005 and is reflected as a reduction of total expenses in the Statement of Operations.
Distributor – MFS Fund Distributors, Inc. (MFD), a wholly-owned subsidiary of MFS, is the distributor of shares of the fund. The Trustees have adopted a distribution plan for the Service Class shares pursuant to Rule 12b-1 under the Investment Company Act of 1940.
The fund’s distribution plan provides that the fund will pay MFD distribution and/or service fees equal to 0.25% per annum of its average daily net assets attributable to Service Class shares as partial consideration for services performed and expenses incurred by MFD and financial intermediaries (including participating insurance companies that invest in the fund to fund variable annuity and variable life insurance contracts, sponsors of qualified retirement and pension plans that invest in the fund, and affiliates of these participating insurance companies and plan sponsors) in connection with the sale and distribution of the Service Class shares. MFD may subsequently pay all, or a portion, of the distribution and/or service fees to financial intermediaries.
Shareholder Servicing Agent – MFS Service Center, Inc. (MFSC), a wholly-owned subsidiary of MFS, has contracted to provide transfer agent and recordkeeping functions in connection with the issuance, transfer, and redemption of each class of shares of the fund under a Shareholder Servicing Agent Agreement. During the year ended December 31, 2010, the fund did not pay MFSC a fee for this service.
Administrator – MFS provides certain financial, legal, shareholder communications, compliance, and other administrative services to the fund. Under an administrative services agreement, the fund partially reimburses MFS the costs incurred to provide these services. The fund is charged an annual fixed amount of $10,000 plus a fee based on average daily net assets. The administrative services fee incurred for the year ended December 31, 2010 was equivalent to an annual effective rate of 0.0403% of the fund’s average daily net assets.
Trustees’ and Officers’ Compensation – The fund pays compensation to Trustees in the form of a retainer, attendance fees, and additional compensation to the Board chairperson. The fund does not pay compensation directly to officers of the fund who are also officers of the investment adviser, all of whom receive remuneration for their services to the fund from MFS. Certain officers of the fund are officers or directors of MFS, MFD, and MFSC.
Other – This fund and certain other funds managed by MFS (the funds) have entered into services agreements (the Agreements) which provide for payment of fees by the funds to Tarantino LLC and Griffin Compliance LLC in return for the provision of services of an Independent Chief Compliance Officer (ICCO) and Assistant ICCO, respectively, for the funds. The ICCO and Assistant ICCO are officers of the funds and the sole members of Tarantino LLC and Griffin Compliance LLC, respectively. The funds can terminate the Agreements with Tarantino LLC and Griffin Compliance LLC at any time under the terms of the Agreements. MFS has agreed to bear all expenses associated with office space, other administrative support, and supplies provided to the ICCO and Assistant ICCO. For the year ended December 31, 2010, the aggregate fees paid by the fund to Tarantino LLC and Griffin Compliance LLC were $905 and are included in miscellaneous expense on the Statement of Operations.
The fund invests in the MFS Institutional Money Market Portfolio which is managed by MFS and seeks a high level of current income consistent with preservation of capital and liquidity. Income earned on this investment is included in dividends from underlying funds on the Statement of Operations. This money market fund does not pay a management fee to MFS.
Purchases and sales of investments, other than purchased option transactions and short-term obligations, were as follows:
| | | | | | | | |
| | | Purchases | | | Sales | |
| U.S. Government securities | | | $9,707 | | | | $292,975 | |
| Investments (non-U.S. Government securities) | | | $24,270,523 | | | | $25,458,985 | |
29
MFS Strategic Income Portfolio
Notes to Financial Statements – continued
| (5) | | Shares of Beneficial Interest |
The fund’s Declaration of Trust permits the Trustees to issue an unlimited number of full and fractional shares of beneficial interest. Transactions in fund shares were as follows:
| | | | | | | | | | | | | | | | |
| | | Year ended 12/31/10 | | | Year ended 12/31/09 | |
| | | Shares | | | Amount | | | Shares | | | Amount | |
| Shares sold | | | | | | | | | | | | | | | | |
Initial Class | | | 355,970 | | | | $3,411,617 | | | | 615,780 | | | | $5,390,270 | |
Service Class | | | 162,760 | | | | 1,564,769 | | | | 159,835 | | | | 1,350,527 | |
| | | 518,730 | | | | $4,976,386 | | | | 775,615 | | | | $6,740,797 | |
| Shares issued to shareholders in reinvestment of distributions | | | | | | | | | | | | | | | | |
Initial Class | | | 237,301 | | | | $2,214,015 | | | | 463,981 | | | | $3,605,134 | |
Service Class | | | 63,941 | | | | 594,016 | | | | 158,483 | | | | 1,226,661 | |
| | | 301,242 | | | | $2,808,031 | | | | 622,464 | | | | $4,831,795 | |
| Shares reacquired | | | | | | | | | | | | | | | | |
Initial Class | | | (698,800 | ) | | | $(6,759,659 | ) | | | (556,450 | ) | | | $(4,823,570 | ) |
Service Class | | | (349,494 | ) | | | (3,367,680 | ) | | | (428,155 | ) | | | (3,674,816 | ) |
| | | (1,048,294 | ) | | | $(10,127,339 | ) | | | (984,605 | ) | | | $(8,498,386 | ) |
| Net change | | | | | | | | | | | | | | | | |
Initial Class | | | (105,529 | ) | | | $(1,134,027 | ) | | | 523,311 | | | | $4,171,834 | |
Service Class | | | (122,793 | ) | | | (1,208,895 | ) | | | (109,837 | ) | | | (1,097,628 | ) |
| | | (228,322 | ) | | | $(2,342,922 | ) | | | 413,474 | | | | $3,074,206 | |
The fund and certain other funds managed by MFS participate in a $1.1 billion unsecured committed line of credit, subject to a $1 billion sublimit, provided by a syndication of banks under a credit agreement. Borrowings may be made for temporary financing needs. Interest is charged to each fund, based on its borrowings, generally at a rate equal to the higher of the Federal Reserve funds rate or one month LIBOR plus an agreed upon spread. A commitment fee, based on the average daily, unused portion of the committed line of credit, is allocated among the participating funds at the end of each calendar quarter. In addition, the fund and other funds managed by MFS have established unsecured uncommitted borrowing arrangements with certain banks for temporary financing needs. Interest is charged to each fund, based on its borrowings, at a rate equal to the Federal Reserve funds rate plus an agreed upon spread. For the year ended December 31, 2010, the fund’s commitment fee and interest expense were $591 and $0, respectively, and are included in miscellaneous expense on the Statement of Operations.
| (7) | | Transactions in Underlying Funds – Affiliated Issuers |
An affiliated issuer may be considered one in which the fund owns 5% or more of the outstanding voting securities, or a company which is under common control. For the purposes of this report, the fund assumes the following to be affiliated issuers:
| | | | | | | | | | | | | | | | |
| Underlying Funds | | Beginning
Shares/Par
Amount | | | Acquisitions
Shares/Par
Amount | | | Dispositions
Shares/Par
Amount | | | Ending
Shares/Par
Amount | |
MFS Institutional Money Market Portfolio | | | 751,282 | | | | 15,608,384 | | | | (16,359,611 | ) | | | 55 | |
| | | | |
| Underlying Funds | | Realized
Gain (Loss) | | | Capital Gain
Distributions | | | Dividend
Income | | | Ending
Value | |
MFS Institutional Money Market Portfolio | | | $— | | | | $— | | | | $2,864 | | | | $55 | |
30
MFS Strategic Income Portfolio
REPORT OF INDEPENDENT REGISTERED PUBLIC ACCOUNTING FIRM
To the Board of Trustees of MFS Variable Insurance Trust II and the Shareholders of MFS Strategic Income Portfolio:
We have audited the accompanying statement of assets and liabilities, including the portfolio of investments, of MFS Strategic Income Portfolio (the “Fund”) (one of the portfolios comprising MFS Variable Insurance Trust II) as of December 31, 2010, and the related statement of operations for the year then ended, the statements of changes in net assets for each of the two years in the period then ended, and the financial highlights for each of the five years in the period then ended. These financial statements and financial highlights are the responsibility of the Fund’s management. Our responsibility is to express an opinion on these financial statements and financial highlights based on our audits.
We conducted our audits in accordance with the standards of the Public Company Accounting Oversight Board (United States). Those standards require that we plan and perform the audit to obtain reasonable assurance about whether the financial statements and financial highlights are free of material misstatement. The Fund is not required to have, nor were we engaged to perform, an audit of its internal control over financial reporting. Our audits included consideration of internal control over financial reporting as a basis for designing audit procedures that are appropriate in the circumstances, but not for the purpose of expressing an opinion on the effectiveness of the Fund’s internal control over financial reporting. Accordingly, we express no such opinion. An audit also includes examining, on a test basis, evidence supporting the amounts and disclosures in the financial statements, assessing the accounting principles used and significant estimates made by management, as well as evaluating the overall financial statement presentation. Our procedures included confirmation of securities owned as of December 31, 2010, by correspondence with the custodian and brokers; where replies were not received from brokers, we performed other auditing procedures. We believe that our audits provide a reasonable basis for our opinion.
In our opinion, the financial statements and financial highlights referred to above present fairly, in all material respects, the financial position of MFS Strategic Income Portfolio as of December 31, 2010, the results of its operations for the year then ended, the changes in its net assets for each of the two years in the period then ended, and the financial highlights for each of the five years in the period then ended, in conformity with accounting principles generally accepted in the United States of America.
DELOITTE & TOUCHE LLP
Boston, Massachusetts
February 14, 2011
31
MFS Strategic Income Portfolio
TRUSTEES AND OFFICERS – IDENTIFICATION AND BACKGROUND
The Trustees and officers of the Trust, as of February 1, 2011, are listed below, together with their principal occupations during the past five years. (Their titles may have varied during that period.) The address of each Trustee and officer is 500 Boylston Street, Boston, Massachusetts 02116.
| | | | | | |
Name, Date of Birth | | Position(s) Held
with Fund | | Trustee/Officer
Since (1) | | Principal Occupations During the Past Five Years and
Other Directorships (2) |
| INTERESTED TRUSTEE | | | | |
David D. Horn (3) (born 6/07/41) | | Trustee | | April 1986 | | Private investor; Sun Life Assurance Company of Canada, Senior Vice President and General Manager for the United States (until 1997); Director (until March 2004) |
| | |
| INDEPENDENT TRUSTEES | | | | |
J. Kermit Birchfield (born 1/08/40) | | Chairman | | May 1997 | | Consultant; Century Partners, Inc. (investments), Director; Displaytech, Inc. (technology), Chairman; Dessin Fournir LLC (furniture manufacturer), Director; Site Watch LLC (software to monitor oil tanks), Managing Director (2006 to present); Juridica Investments (fund investing in judicial matters), Director (2007 to present), Immuno Science, Inc. (medical research), Independent Director (2009 to present), Intermountain Industries, Inc. (oil & gas exploration and production), Director (until February 2009) |
| | | |
Robert C. Bishop (born 1/13/43) | | Trustee | | May 2001 | | AutoImmune, Inc. (pharmaceutical product development), Chairman, President and Chief Executive Officer; Caliper Life Sciences Corp. (laboratory analytical instruments), Chairman; Optobionics Corporation (ophthalmic devices), Director (until 2007); Millipore Corporation (purification/filtration products), Director (until July 2010); Waterstreet Capital (leverage buyouts), Advisory Board (until August 2010) |
| | | |
Frederick H. Dulles (born 3/12/42) | | Trustee | | May 2001 | | Dulles International Law LLC (law firm), Senior Lawyer (since 2009); Juridica Capital Management (US) Inc. (litigation financing), Vice President and General Counsel (since 2009); Dulles Properties LLC (real estate), Broker (since 2008); The Citadel School of Business Administration (education), Adjunct Professor (since 2003); Disher, Hamrick & Myers Residential, Inc. (real estate), Broker (until 2006); Frederick H. Dulles Law Practice (law firm), (until 2006); Charlestown School of Law (education), Adjunct Professor (until 2007); Prudential Carolina Real Estate, (real estate), Broker (until 2008); Free Enterprise Foundation Inc. (research institute), Director & Secretary (until 2008); Ten State International Law PLLP (law firm), Of Counsel (until 2009) |
| | | |
Marcia A. Kean (born 6/30/48) | | Trustee | | April 2005 | | Feinstein Kean Healthcare (consulting), Chief Executive Officer |
| | | |
Ronald G. Steinhart (born 6/15/40) | | Trustee | | May 2001 | | Private investor; Penske Automotive Group (automotive retailer), Director; Animal Health International, Inc. (animal health products), Director (since 2007); Texas Industries (concrete/aggregates/cement), Director (since 2007); Susser Holdings Corporation (retail convenience stores and distributor of wholesale motor fuel), Director (since 2009); Prentiss Properties Trust (real estate investment trust), Director (until 2006); Penson Worldwide, Inc. (securities clearance), Director (until 2008) |
| | | |
Haviland Wright (born 7/21/48) | | Trustee | | May 2001 | | X-Change Corp. (multi-media web services), Director (since 2010); Nano Loa Inc. (liquid crystal displays), Director (until 2009); Profitability of Hawaii (software), Chief Development Officer (until 2010); Elixir Technologies Corporation (software), Director (until 2010) |
| | | |
| OFFICERS | | | | | | |
Maria F. DiOrioDwyer (4)
(born 12/01/58) | | President | | November 2005 | | Massachusetts Financial Services Company, Executive Vice President and Chief Regulatory Officer; Chief Compliance Officer (since December 2006) |
| | | |
| Christopher R. Bohane (4) (born 1/18/74) | | Assistant Secretary and Assistant Clerk | | July 2005 | | Massachusetts Financial Services Company, Vice President and Senior Counsel |
| | | |
John M. Corcoran (4) (born 4/13/65) | | Treasurer | | October 2008 | | Massachusetts Financial Services Company, Senior Vice President (since October 2008); State Street Bank and Trust (financial services provider), Senior Vice President, (until September 2008) |
| | | |
Ethan D. Corey (4) (born 11/21/63) | | Assistant Secretary and Assistant Clerk | | July 2005 | | Massachusetts Financial Services Company, Senior Vice President and Associate General Counsel |
| | | |
David L. DiLorenzo (4) (born 8/10/68) | | Assistant Treasurer | | July 2005 | | Massachusetts Financial Services Company, Vice President |
| | | |
Timothy M. Fagan (4) (born 7/10/68) | | Assistant Secretary and Assistant Clerk | | September 2005 | | Massachusetts Financial Services Company, Vice President and Senior Counsel |
| | | |
Mark D. Fischer (4) (born 10/27/70) | | Assistant Treasurer | | July 2005 | | Massachusetts Financial Services Company, Vice President |
32
MFS Strategic Income Portfolio
Trustees and Officers – continued
| | | | | | |
Name, Date of Birth | | Position(s) Held
with Fund | | Trustee/Officer
Since (1) | | Principal Occupations During the Past Five Years and
Other Directorships (2) |
Robyn L. Griffin (born 7/04/75) | | Assistant Independent Chief Compliance Officer | | August 2008 | | Griffin Compliance LLC (provider of compliance services), Principal (since August 2008); State Street Corporation (financial services provider), Mutual Fund Administration Assistant Vice President (October 2006 – July 2008); Liberty Mutual Group (insurance), Personal Market Assistant Controller (April 2006 – October 2006); Deloitte & Touche LLP (professional services firm), Senior Manager (prior to April 2006) |
| | | |
Brian E. Langenfeld (4) (born 3/07/73) | | Assistant Secretary and Assistant Clerk | | May 2006 | | Massachusetts Financial Services Company, Vice President and Senior Counsel (since May 2006); John Hancock Advisers, LLC, Assistant Vice President and Counsel (until April 2006) |
| | | |
Ellen Moynihan (4) (born 11/13/57) | | Assistant Treasurer | | May 1997 | | Massachusetts Financial Services Company, Senior Vice President |
| | | |
Susan S. Newton (4) (born 3/07/50) | | Assistant Secretary and Assistant Clerk | | May 2005 | | Massachusetts Financial Services Company, Senior Vice President and Associate General Counsel |
| | | |
Susan A. Pereira (4)
(born 11/05/70) | | Assistant Secretary and Assistant Clerk | | July 2005 | | Massachusetts Financial Services Company, Vice President and Senior Counsel |
| | | |
Mark N. Polebaum (4) (born 5/01/52) | | Secretary and Clerk | | February 2006 | | Massachusetts Financial Services Company, Executive Vice President, General Counsel and Secretary (since January 2006); Wilmer Cutler Pickering Hale and Dorr LLP (law firm), Partner (until January 2006) |
| | | |
Frank L. Tarantino (born 3/07/44) | | Independent Chief Compliance Officer | | September 2004 | | Tarantino LLC (provider of compliance services), Principal |
| | | |
Richard S. Weitzel (4) (born 7/16/70) | | Assistant Secretary and Assistant Clerk | | October 2007 | | Massachusetts Financial Services Company, Vice President and Assistant General Counsel |
| | | |
James O. Yost (4) (born 6/12/60) | | Assistant Treasurer | | April 1992 | | Massachusetts Financial Services Company, Senior Vice President |
| (1) | Date first appointed to serve as Trustee/Officer of an MFS fund or a Compass variable account. Each Trustee has served continuously since appointment. For the period March 2008 until October 2008, Ms. DiOrioDwyer served as Treasurer of the Funds. |
| (2) | Directorships or trusteeships of companies required to report to the Securities and Exchange Commission (i.e., “public companies”). |
| (3) | “Interested person” of the Trust, within the meaning of the Investment Company Act of 1940 (referred to as the 1940 Act), which is the principal federal law governing investment companies like the Trust, as a result of position with Sun Life of Canada (U.S.). The address of Sun Life of Canada (U.S.) is One Sun Life Executive Park, Wellesley Hills, Massachusetts 02481. |
| (4) | “Interested person” of MFS within the meaning of the 1940 Act. The address of MFS is 500 Boylston Street, Boston, Massachusetts 02116. |
The Trust does not hold annual meetings for the purpose of electing Trustees, and Trustees are not elected for fixed terms. Each Trustee and officer holds office until his or her successor is chosen and qualified, or until his or her earlier death, resignation, retirement or removal.
All Trustees currently serve as Trustees of the Trust and have served in that capacity since originally elected or appointed. All of the Trustees are also Managers of the Compass Variable Accounts. The executive officers of the Trust hold similar offices for the Compass Variable Accounts and other funds in the MFS fund complex. As of January 1, 2011, each Trustee serves as a Trustee or Manager of 31 Accounts/Portfolios.
33
MFS Strategic Income Portfolio
Trustees and Officers – continued
The Statement of Additional Information contains further information about the Trustees and is available without charge upon request by calling 1-800-752-7215.
| | |
Investment Adviser
Massachusetts Financial Services Company 500 Boylston Street, Boston, MA 02116-3741 | | Custodian State Street Bank and Trust 1 Lincoln Street, Boston, MA 02111-2900 |
Distributor
MFS Fund Distributors, Inc. 500 Boylston Street, Boston, MA 02116-3741 | | Independent Registered Public Accounting Firm Deloitte & Touche LLP 200 Berkeley Street, Boston, MA 02116 |
Portfolio Managers John Addeo James Calmas Robert Persons Matthew Ryan Erik Weisman | | |
34
MFS Strategic Income Portfolio
BOARD REVIEW OF INVESTMENT ADVISORY AGREEMENT
The Investment Company Act of 1940 requires that both the full Board of Trustees and a majority of the non-interested (“independent”) Trustees, voting separately, annually approve the continuation of the investment advisory agreement between MFS Variable Insurance Trust II (the “Trust”) and Massachusetts Financial Services Company (“MFS”) on behalf of the Fund. The Trustees consider matters bearing on the Fund and the advisory arrangement at their meetings throughout the year, including a review of performance data at each regular meeting. In addition, the independent Trustees met in person in May and again in July 2010 (“contract review meetings”) for the specific purpose of considering whether to approve the continuation of the investment advisory agreement for the Fund. The independent Trustees were assisted in their evaluation of the investment advisory agreement by independent legal counsel, from whom they received separate legal advice and with whom they met separately from MFS management during various contract review meetings. The independent Trustees were also assisted in this process by the Fund’s Independent Chief Compliance Officer, a full-time senior officer appointed by and reporting to the independent Trustees.
In connection with their deliberations, the Trustees, including the independent Trustees, considered such information and factors as they believed, in light of the legal advice furnished to them and their own business judgment, to be relevant. The investment advisory agreement was considered separately for the Fund, although the Trustees also took into account the common interests of all Funds in the Trust in their review. As described below, the Trustees considered the nature, quality, and extent of the various investment advisory, administrative, and shareholder services performed by MFS under the existing investment advisory agreement and other arrangements with the Trust.
In connection with their contract review meetings, the Trustees received and relied upon materials which included, among other items: (i) information provided by Lipper Inc. (“Lipper”) on the investment performance of the Fund for various time periods ended December 31, 2009, compared to the investment performance of a group of funds with substantially similar investment classifications/objectives (the “Lipper performance universe”), (ii) information provided by Lipper on the Fund’s advisory fees and other expenses compared to the advisory fees and other expenses of comparable funds identified by Lipper (the “Lipper expense group”), (iii) information provided by MFS on the advisory fees of comparable portfolios of its other clients, including institutional separate account and other clients, (iv) information as to whether, and to what extent applicable, expense waivers, reimbursements or fee “breakpoints” are observed for the Fund, (v) information regarding MFS’ financial results and financial condition, including MFS’ and certain of its affiliates’ estimated profitability from services performed for the Fund, (vi) MFS’ views regarding the outlook for the mutual fund industry and its strategic business plans, (vii) descriptions of various functions performed by MFS for the Trust, such as compliance monitoring and portfolio trading practices, and (viii) information regarding the overall organization of MFS, including information about MFS’ senior management and other personnel providing investment advisory, administrative and other services to the Fund. The comparative performance, fee and expense information prepared and provided by Lipper was not independently verified, and the independent Trustees did not independently verify any information provided to them by MFS.
The Trustees’ conclusion as to the continuation of the investment advisory agreement was based on comprehensive consideration of all information provided to the Trustees and was not the result of any single factor. Some of the factors that figured particularly in the Trustees’ deliberations are described below for the Fund, while individual Trustees may have given different weight to various factors and evaluated the information presented as a whole differently than another individual Trustee. The Trustees recognized that the fee arrangements for the Fund reflect years of review and discussion between the independent Trustees and MFS, that certain aspects of such arrangements may receive greater scrutiny in some years than others, and that the Trustees’ conclusions may be based, in part, on their consideration of these same arrangements during the course of the year and in prior years.
Based on information provided by Lipper, the Trustees compared the Fund’s total return investment performance to the performance of the Lipper performance universe over various time periods. The Trustees placed particular emphasis on the total return performance of the Fund’s Initial Class shares in comparison to the performance of funds in its Lipper performance universe over the one-, three- and five-year periods ended December 31, 2009. The Trustees did not rely on performance results for more recent periods, including those shown elsewhere in this report.
The Trustees noted the performance of the Fund’s Initial Class shares was in the 1st quintile relative to the other funds in the Lipper performance universe for the one-year period (the 1st quintile being the best performers and the 5th quintile being the worst performers). The total return performance of the Fund was in the 3rd quintile for the three-year and five-year periods ended December 31, 2009, relative to the Lipper performance universe. Based on the nature and quality of services provided by MFS, the Board of Trustees concluded that the Fund’s performance was satisfactory.
35
MFS Strategic Income Portfolio
Board Review of Investment Advisory Agreement – continued
In the course of their deliberations, the Trustees took into account information provided by MFS during contract review meetings, as well as during investment review meetings conducted with portfolio management personnel during the course of the year.
In assessing the reasonableness of the Fund’s advisory fee, the Trustees considered, among other information, the Fund’s advisory fee and the total expense ratio of the Fund’s Initial Class shares as a percentage of average daily net assets, compared to the advisory fee and total expense ratios of its peer group of funds based on information provided by Lipper. The Trustees also considered the advisory fees charged by MFS to institutional accounts. In comparing these fees, the Trustees considered the generally broader scope of services provided by MFS to the Trust than those provided to institutional accounts. The Trustees also considered the higher demands placed on MFS’ investment personnel and trading infrastructure as a result of the daily cash in-flows and out-flows of the Fund, and the impact on MFS and related expenses due to the more extensive regulatory regime to which the Fund is subject, compared to institutional accounts.
In considering the fees, the Trustees noted from the Lipper data that the Fund’s effective advisory fee rate and total expense ratio were each approximately at the median of such fees and expenses of funds in the Lipper expense group. The Trustees further noted that MFS agreed to reduce its advisory fee on average daily net assets up to $1 billion on a permanent basis, requiring shareholder approval for any modification or termination, and they accepted MFS’ offer to continue the expense limitation for the Fund. The Trustees further concluded that the existing breakpoint was sufficient to allow the Fund to benefit from economies of scale as its assets grow. The Trustees concluded that the fees were reasonable in light of the nature and quality of services provided.
The Trustees also considered information prepared by MFS relating to its costs and profits with respect to the Fund and other investment companies and accounts advised by MFS, as well as MFS’ methodologies used to determine and allocate its costs to the Fund and other accounts and products for purposes of estimating profitability.
After reviewing these and other factors described below, the Trustees concluded that the advisory fees charged to the Fund represent reasonable compensation in light of the nature and quality of the services being provided by MFS.
In addition, the Trustees considered MFS’ resources and related efforts to continue to retain, attract and motivate capable personnel to serve the Fund. The Trustees also considered the financial resources of MFS and its parent, Sun Life Financial Inc. The Trustees further considered any advantages and possible disadvantages of having an adviser which also serves other investment companies as well as institutional accounts.
The Trustees also considered the nature, quality, cost, and extent of administrative, transfer agency, and distribution services provided to the Fund by MFS and its affiliates under agreements and plans other than the investment advisory agreement, including the 12b-1 fees the Fund pays to MFS Fund Distributors, Inc., an affiliate of MFS. The Trustees also considered the nature, extent and quality of certain other services MFS performs or arranges on the Fund’s behalf, which may include securities lending programs, directed expense payment programs, class action recovery programs, and MFS’ interaction with third-party service providers, principally custodians and sub-custodians. The Trustees concluded that the various non-advisory services provided by MFS and its affiliates on behalf of the Fund were satisfactory. The Trustees also considered the benefits to MFS from the use of the Fund’s portfolio brokerage commissions to pay for investment research and various other factors. Additionally, the Trustees considered so-called “fall-out benefits” to MFS such as reputational value derived from serving as investment manager to the Trust, and determined that any such benefits derived by MFS were reasonable and fair.
Based on their evaluation of factors that they deemed to be material, including those factors described above, the Board of Trustees, including a majority of the independent Trustees, concluded that the investment advisory agreement should be continued for an additional one-year period, commencing September 1, 2010.
A discussion regarding the Board’s most recent review and renewal of the fund’s Investment Advisory Agreement with MFS is available by clicking on the fund’s name under “Variable Insurance Portfolios — VIT II” in the “Products and Performance” section of the MFS Web site (mfs.com).
36
MFS Strategic Income Portfolio
PROXY VOTING POLICIES AND INFORMATION
A general description of the MFS funds’ proxy voting policies and procedures is available without charge, upon request, by calling 1-800-225-2606, by visiting the Proxy Voting section of mfs.com or by visiting the SEC’s Web site at http://www.sec.gov.
Information regarding how the fund voted proxies relating to portfolio securities during the most recent twelve-month period ended June 30 is available without charge by visiting the Proxy Voting section of mfs.com or by visiting the SEC’s Web site at http://www.sec.gov.
QUARTERLY PORTFOLIO DISCLOSURE
The fund will file a complete schedule of portfolio holdings with the Securities and Exchange Commission (the Commission) for the first and third quarters of each fiscal year on Form N-Q. The fund’s Form N-Q may be reviewed and copied at the:
Public Reference Room
Securities and Exchange Commission
100 F Street, NE, Room 1580
Washington, D.C. 20549
Information on the operation of the Public Reference Room may be obtained by calling the Commission at 1-800-SEC-0330. The fund’s Form N-Q is available on the EDGAR database on the Commission’s Internet Web site at http://www.sec.gov, and copies of this information may be obtained, upon payment of a duplicating fee, by electronic request at the following e-mail address: publicinfo@sec.gov or by writing the Public Reference Section at the above address.
FURTHER INFORMATION
From time to time, MFS may post important information about the fund or the MFS funds on the MFS web site (mfs.com). This information is available by visiting the “News & Commentary” section of mfs.com or by clicking on the fund’s name under “Variable Insurance Portfolios — VIT II” in the “Products and Performance” section of mfs.com.
37
MFS Strategic Income Portfolio
MFS® PRIVACY NOTICE
Privacy is a concern for every investor today. At MFS Investment Management® and the MFS funds, we take this concern very seriously. We want you to understand our policies about the investment products and services that we offer, and how we protect the nonpublic personal information of investors who have a direct relationship with us and our wholly owned subsidiaries.
Throughout our business relationship, you provide us with personal information. We maintain information and records about you, your investments, and the services you use. Examples of the nonpublic personal information we maintain include
| | Ÿ | | data from investment applications and other forms |
| | Ÿ | | share balances and transactional history with us, our affiliates, or others |
| | Ÿ | | facts from a consumer reporting agency |
We do not disclose any nonpublic personal information about our customers or former customers to anyone, except as permitted by law. We may share nonpublic personal information with third parties or certain of our affiliates in connection with servicing your account or processing your transactions. We may share information with companies or financial institutions that perform marketing services on our behalf or with other financial institutions with which we have joint marketing arrangements, subject to any legal requirements.
Authorization to access your nonpublic personal information is limited to appropriate personnel who provide products, services, or information to you. We maintain physical, electronic, and procedural safeguards to help protect the personal information we collect about you.
If you have any questions about the MFS privacy policy, please call 1-800-225-2606 any business day.
Note: If you own MFS products or receive MFS services in the name of a third party such as a bank or broker-dealer, their privacy policy may apply to you instead of ours.
38


MFS® GLOBAL GOVERNMENTS PORTFOLIO
The report is prepared for the general information of contract owners. It is authorized for distribution to prospective investors only when preceded or accompanied by a current prospectus.
NOT FDIC INSURED Ÿ MAY LOSE VALUE Ÿ NO BANK GUARANTEE Ÿ NOT A DEPOSIT Ÿ NOT INSURED BY ANY FEDERAL GOVERNMENT AGENCY OR NCUA/NCUSIF
MFS Global Governments Portfolio
LETTER FROM THE CEO

Dear Contract Owners:
After an extended rebound in the financial markets, uncertainty returned in 2010 as investors began to question the durability of the recovery for global economies and markets. That uncertainty led to increased risk aversion, especially as investors saw the eurozone struggle with the debt woes of many of its members. In September, the U.S. Federal Reserve Board’s promises to further loosen monetary policy helped assuage market fears and drive asset prices off their recent lows. A combination of solid earnings and improving economic data gave an additional boost to investor sentiment. As we enter 2011, we are cautiously optimistic that economic growth will continue to improve and that the global economies will recover from the shocks of the past few years. We expect the pace of recovery worldwide will be uneven and volatile.
As always, we continue to be mindful of the many economic challenges faced at the local, national, and international levels. It is in times such as these that we want to remind investors of the merits of maintaining a long-term view, adhering to basic investing principles such as asset allocation and diversification, and working closely with their advisors to research and identify appropriate investment opportunities.
Respectfully,

Robert J. Manning
Chairman and Chief Executive Officer
MFS Investment Management®
February 14, 2011
The opinions expressed in this letter are subject to change, may not be relied upon for investment advice, and no forecasts can be guaranteed.
1
MFS Global Governments Portfolio
PORTFOLIO COMPOSITION
Portfolio structure (i)
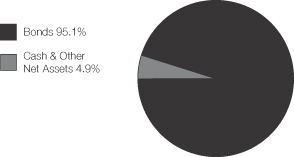
| | | | |
| Fixed income sectors (i) | | | | |
| Non-U.S. Government Bonds | | | 61.9% | |
| U.S. Treasury Securities | | | 25.9% | |
| Mortgage-Backed Securities | | | 3.1% | |
| U.S. Government Agencies | | | 2.3% | |
| Commercial Mortgage-Backed Securities | | | 1.7% | |
| High Grade Corporates | | | 0.2% | |
| | | | |
| Composition including fixed income credit quality (a)(i) | | | | |
| AAA | | | 53.4% | |
| AA | | | 36.6% | |
| BBB | | | 0.5% | |
| U.S. Agency (NR) | | | 4.6% | |
| Cash & Other | | | 4.9% | |
| | | | |
| Portfolio facts (i) | | | | |
| Average Duration (d) | | | 6.4 | |
| Average Effective Maturity (m) | | | 8.3 yrs. | |
| | | | |
| Issuer country weightings (i) | | | | |
| United States | | | 37.7% | |
| Japan | | | 23.9% | |
| Italy | | | 10.2% | |
| Germany | | | 8.8% | |
| United Kingdom | | | 4.8% | |
| Netherlands | | | 3.5% | |
| Canada | | | 2.7% | |
| Finland | | | 2.6% | |
| France | | | 2.4% | |
| Other Countries | | | 3.4% | |
| (a) | The rating categories include debt securities and fixed-income structured products where these have long-term public ratings. All ratings are assigned in accordance with the following hierarchy: If a security is rated by Moody’s, then that rating is used; if not rated by Moody’s, then a Standard & Poor’s rating is used; if not rated by S&P, then a Fitch rating is used. Ratings from Moody’s are shown in the S&P and Fitch scale (e.g., AAA). All ratings are subject to change. U.S. Agency (NR) includes unrated U.S. Agency fixed income securities and collateralized mortgage obligations of U.S. Agency mortgage-backed securities. Cash & Other includes cash, other assets less liabilities, offsets to derivative positions, and short-term securities. The fund may not hold all of these instruments. |
| (d) | Duration is a measure of how much a bond’s price is likely to fluctuate with general changes in interest rates, e.g., if rates rise 1.00%, a bond with a 5-year duration is likely to lose about 5.00% of its value due to the interest rate move. |
| (i) | For purposes of this presentation, the components include the market value of securities, and reflect the impact of the equivalent exposure of derivative positions, if applicable. These amounts may be negative from time to time. The bond component will include any accrued interest amounts. Equivalent exposure is a calculated amount that translates the derivative position into a reasonable approximation of the amount of the underlying asset that the portfolio would have to hold at a given point in time to have the same price sensitivity that results from the portfolio’s ownership of the derivative contract. When dealing with derivatives, equivalent exposure is a more representative measure of the potential impact of a position on portfolio performance than market value. Where the fund holds convertible bonds, these are treated as part of the equity portion of the portfolio. |
| (m) | In determining an instrument’s effective maturity for purposes of calculating the fund’s dollar-weighted average effective maturity, MFS uses the instrument’s stated maturity or, if applicable, an earlier date on which MFS believes it is probable that a maturity-shortening device (such as a put, pre-refunding or prepayment) will cause the instrument to be repaid. Such an earlier date can be substantially shorter than the instrument’s stated maturity. |
Percentages are based on net assets as of 12/31/10, unless otherwise noted.
The portfolio is actively managed and current holdings may be different.
2
MFS Global Governments Portfolio
MANAGEMENT REVIEW
Summary of Results
For the twelve months ended December 31, 2010, Initial Class shares of the MFS Global Governments Portfolio (the “fund”) provided a total return of 4.61%, while Service Class shares of the fund provided a total return of 4.38%. These compare with a return of 6.42% for the fund’s benchmark, the JPMorgan Global Government Bond Index (Unhedged).
Market Environment
The first quarter of the reporting period witnessed a continuation of the financial market and macroeconomic rebounds that had begun in early 2009. These recoveries in global activity and asset valuations were generally synchronized around the world, led importantly by emerging Asian economies, but broadening to include most of the global economy to varying degrees. Primary drivers of the recoveries included an unwinding of the inventory destocking that took place earlier, the production of manufacturing and capital goods, as well as massive fiscal and monetary stimulus.
During most of the remainder of the period, heightened risk surrounding the public-debt profiles of several of the peripheral European countries impaired market sentiment. At the same time, the improving trend in global macroeconomic data began to weaken somewhat. These two dynamics caused many asset prices to retrench significantly, as many questioned the durability of the global recovery.
Towards the end of the period, the U.S. Federal Reserve led markets to believe that further monetary loosening would be forthcoming if macroeconomic activity did not show signs of improvement. The prospects for more easing by the Fed improved market sentiment and drove risk-asset prices markedly higher. However, in a text-book case of “buy the rumor, sell the fact,” the weeks following the early November announcement of further quantitative easing saw a sell-off in U.S. Treasury bonds. This rise in Treasury yields occurred despite risk-off behavior in equities and credit markets (which would normally result in Treasury yield compression), and appears to have been the result of a few factors: signs of improved U.S. and global economic activity; opposition to quantitative easing from some quarters; and crowded long positions in U.S. Treasuries. The December agreement on an expansionary U.S. fiscal package also boosted sentiment, leading markets to reach near-term highs in risky asset valuations toward year end.
Detractors from Performance
Relative to the JPMorgan Global Government Bond Index (Unhedged), the primary detractor from performance occurred during the second quarter of the year. As risk sentiment plummeted, the fund significantly sold down its more risk-on exposure, including emerging markets debt, U.S. corporate bonds, and exposure to emerging markets currency, to mitigate the risk of further declines in asset valuations. Ultimately, as markets improved late in the year, this positioning held back relative performance.
The fund’s yield curve (y) positioning in North America, particularly lesser exposures to shifts in the middle portion (centered around maturities of 7 years) and at the long end (centered around maturities of 30 years) of the yield curve, also held back relative performance.
Contributors to Performance
During the reporting period, the fund’s return from yield, which was greater than that of the benchmark, contributed to relative performance.
Yield curve positioning in Europe, particularly a greater exposure to Euro bonds at the long end of the yield curve, also benefited relative results.
The fund’s out-of-benchmark exposure to Treasury Inflation-Protected Securities (TIPS), delegated underwriting and servicing (DUS) bonds (pools of multifamily housing loans issued by the Federal National Mortgage Association (Fannie Mae)), and to Small Business Administration (SBA) bonds aided relative performance. Our heavy underweight position in the PIIGS (Portugal, Italy, Ireland, Greece and Spain) was another positive factor for relative returns as these bonds turned in weak performance relative to the benchmark over the reporting period.
The fund’s long Euro currency position also helped relative results.
Respectfully,
| | |
| Matthew Ryan | | Erik Weisman |
| Portfolio Manager | | Portfolio Manager |
| (y) | A yield curve graphically depicts the yields of different maturity bonds of the same credit quality and type; a normal yield curve is upward sloping, with short-term rates lower than long-term rates. |
3
MFS Global Governments Portfolio
Management Review – continued
The views expressed in this report are those of the portfolio managers only through the end of the period of the report as stated on the cover and do not necessarily reflect the views of MFS or any other person in the MFS organization. These views are subject to change at any time based on market or other conditions, and MFS disclaims any responsibility to update such views. These views may not be relied upon as investment advice or an indication of trading intent on behalf of any MFS portfolio. References to specific securities are not recommendations of such securities, and may not be representative of any MFS portfolio’s current or future investments.
4
MFS Global Governments Portfolio
PERFORMANCE SUMMARY THROUGH 12/31/10
The following chart illustrates the historical performance of the fund in comparison to its benchmark(s). Benchmarks are unmanaged and may not be invested in directly. Benchmark returns do not reflect any fees or expenses. The performance of other share classes will be greater than or less than that of the class depicted below. (See Notes to Performance Summary.)
Performance data shown represents past performance and is no guarantee of future results. Investment return and principal value fluctuate so your units, when sold, may be worth more or less than the original cost; current performance may be lower or higher than quoted. The performance shown does not reflect the deduction of taxes, if any, that a contract holder would pay on fund distributions or the redemption of contract units. The returns for the fund shown also do not reflect the deduction of expenses associated with variable products, such as mortality and expense risk charges, separate account charges, and sales charges imposed by the insurance company separate accounts. Such expenses would reduce the overall returns shown.
Growth of a Hypothetical $10,000 Investment
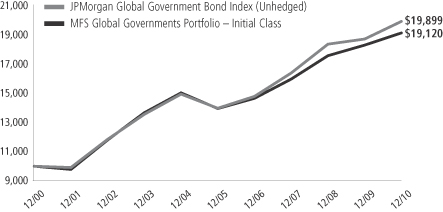
Total Returns through 12/31/10
Average annual total returns
| | | | | | | | | | | | | | |
| | | Share class | | Class inception date | | 1-yr | | 5-yr | | 10-yr | | Life (t) | | |
| | | Initial Class | | 5/16/88 | | 4.61% | | 6.52% | | 6.70% | | N/A | | |
| | | Service Class | | 8/24/01 | | 4.38% | | 6.26% | | N/A | | 6.82% | | |
| | | | | |
| Comparative benchmark | | | | | | | | | | |
| | | JPMorgan Global Government Bond Index (Unhedged) (f) | | 6.42% | | 7.35% | | 7.12% | | N/A | | |
| (f) | Source: FactSet Research Systems Inc. |
| (t) | For the period from the class inception date through the stated period end (for those share classes with less than 10 years of performance history). No comparative benchmark performance information is provided for “life” periods. (See Notes to Performance Summary.) |
Benchmark Definition
JPMorgan Global Government Bond Index (Unhedged) – measures developed government bond markets around the world.
It is not possible to invest directly in an index.
Notes to Performance Summary
Average annual total return represents the average annual change in value for each share class for the periods presented. Life returns are presented where the share class has less than 10 years of performance history and represent the average annual total return from the class inception date to the stated period end date. As the fund’s share classes may have different inception dates, the life returns may represent different time periods and may not be comparable. As a result, no comparative benchmark performance information is provided for life periods.
Performance results reflect any applicable expense subsidies and waivers in effect during the periods shown. Without such subsidies and waivers the fund’s performance results would be less favorable. Please see the prospectus and financial statements for complete details. All results are historical and assume the reinvestment of any dividends and capital gains distributions.
From time to time the fund may receive proceeds from litigation settlements, without which performance would be lower.
5
MFS Global Governments Portfolio
EXPENSE TABLE
Fund Expenses Borne by the Contract Holders During the Period,
July 1, 2010 through December 31, 2010
As a contract holder of the fund, you incur ongoing costs, including management fees; distribution and/or service (12b-1) fees; and other fund expenses. This example is intended to help you understand your ongoing costs (in dollars) of investing in the fund and to compare these costs with the ongoing costs of investing in other mutual funds.
The example is based on an investment of $1,000 invested at the beginning of the period and held for the entire period July 1, 2010 through December 31, 2010.
Actual Expenses
The first line for each share class in the following table provides information about actual account values and actual expenses. You may use the information in this line, together with the amount you invested, to estimate the expenses that you paid over the period. Simply divide your account value by $1,000 (for example, an $8,600 account value divided by $1,000 = 8.6), then multiply the result by the number in the first line under the heading entitled “Expenses Paid During Period” to estimate the expenses you paid on your account during this period.
Hypothetical Example for Comparison Purposes
The second line for each share class in the following table provides information about hypothetical account values and hypothetical expenses based on the fund’s actual expense ratio and an assumed rate of return of 5% per year before expenses, which is not the fund’s actual return. The hypothetical account values and expenses may not be used to estimate the actual ending account balance or expenses you paid for the period. You may use this information to compare the ongoing costs of investing in the fund and other funds. To do so, compare this 5% hypothetical example with the 5% hypothetical examples that appear in the shareholder reports of the other funds.
Please note that the expenses shown in the table are meant to highlight the fund’s ongoing costs only and do not take into account the fees and expenses imposed under the variable contracts through which your investment in the fund is made. Therefore, the second line for each share class in the table is useful in comparing ongoing costs associated with an investment in vehicles (such as the fund) which fund benefits under variable annuity and variable life insurance contracts and to qualified pension and retirement plans only, and will not help you determine the relative total costs of investing in the fund through variable annuity and variable life insurance contracts. If the fees and expenses imposed under the variable contracts were included, your costs would have been higher.
| | | | | | | | | | | | | | | | | | |
| Share Class | | | | Annualized
Expense Ratio | | | Beginning
Account Value
7/01/10 | | | Ending
Account Value
12/31/10 | | | Expenses Paid
During Period (p)
7/01/10-12/31/10 | |
| Initial Class | | Actual | | | 1.00% | | | | $1,000.00 | | | | $1,049.62 | | | | $5.17 | |
| | Hypothetical (h) | | | 1.00% | | | | $1,000.00 | | | | $1,020.16 | | | | $5.09 | |
| Service Class | | Actual | | | 1.25% | | | | $1,000.00 | | | | $1,048.31 | | | | $6.45 | |
| | Hypothetical (h) | | | 1.25% | | | | $1,000.00 | | | | $1,018.90 | | | | $6.36 | |
| (h) | 5% class return per year before expenses. |
| (p) | Expenses paid is equal to each class’ annualized expense ratio, as shown above, multiplied by the average account value over the period, multiplied by the number of days in the period, divided by the number of days in the year. |
6
MFS Global Governments Portfolio
PORTFOLIO OF INVESTMENTS – 12/31/10
The Portfolio of Investments is a complete list of all securities owned by your fund. It is categorized by broad-based asset classes.
| | | | | | | | |
| Issuer | | Shares/Par | | | Value ($) | |
| | | | | | | | |
| BONDS – 93.9% | |
| Foreign Bonds – 61.5% | |
| Austria – 0.9% | |
| Republic of Austria, 4.65%, 2018 | | EUR | 206,000 | | | $ | 303,959 | |
| | | | | | | | |
| Belgium – 0.4% | |
| Kingdom of Belgium, 5.5%, 2017 | | EUR | 98,000 | | | $ | 145,474 | |
| | | | | | | | |
| Canada – 2.7% | |
| Bayview Commercial Asset Trust, FRN, 1.687%, 2023 (z) | | CAD | 150,000 | | | $ | 123,444 | |
| Canada Housing Trust, 4.6%, 2011 (n) | | CAD | 280,000 | | | | 287,877 | |
| Government of Canada, 4.25%, 2018 | | CAD | 367,000 | | | | 403,456 | |
| Government of Canada, 5.75%, 2033 | | CAD | 47,000 | | | | 63,224 | |
| | | | | | | | |
| | | | | | $ | 878,001 | |
| | | | | | | | |
| Finland – 2.6% | |
| Republic of Finland, 3.875%, 2017 | | EUR | 591,000 | | | $ | 851,480 | |
| | | | | | | | |
| France – 2.4% | |
| Republic of France, 6%, 2025 | | EUR | 260,000 | | | $ | 439,488 | |
| Republic of France, 4.75%, 2035 | | EUR | 225,000 | | | | 340,686 | |
| | | | | | | | |
| | | | | | $ | 780,174 | |
| | | | | | | | |
| Germany – 8.6% | |
| Federal Republic of Germany, 3.75%, 2013 | | EUR | 1,043,000 | | | $ | 1,487,505 | |
| Federal Republic of Germany, 3.75%, 2015 | | EUR | 548,000 | | | | 792,296 | |
| Federal Republic of Germany, 4.25%, 2018 | | EUR | 168,000 | | | | 248,405 | |
| Federal Republic of Germany, 6.25%, 2030 | | EUR | 165,000 | | | | 303,691 | |
| | | | | | | | |
| | | | | | $ | 2,831,897 | |
| | | | | | | | |
| Ireland – 0.5% | |
| Irish Life & Permanent PLC, 3.6%, 2013 (e)(n) | | $ | 200,000 | | | $ | 179,404 | |
| | | | | | | | |
| Italy – 10.0% | |
| Republic of Italy, 4.75%, 2013 | | EUR | 1,212,000 | | | $ | 1,678,484 | |
| Republic of Italy, 5.25%, 2017 | | EUR | 1,156,000 | | | | 1,635,440 | |
| | | | | | | | |
| | | | | | $ | 3,313,924 | |
| | | | | | | | |
| Japan – 23.8% | |
| Government of Japan, 1.7%, 2017 | | JPY | 331,450,000 | | | $ | 4,360,594 | |
| Government of Japan, 2.1%, 2024 | | JPY | 122,000,000 | | | | 1,616,519 | |
| Government of Japan, 2.2%, 2027 | | JPY | 103,000,000 | | | | 1,357,558 | |
| Government of Japan, 2.4%, 2037 | | JPY | 41,000,000 | | | | 549,062 | |
| | | | | | | | |
| | | | | | $ | 7,883,733 | |
| | | | | | | | |
| Netherlands – 3.4% | |
| Kingdom of the Netherlands, 3.75%, 2014 | | EUR | 658,000 | | | $ | 947,465 | |
| Kingdom of the Netherlands, 5.5%, 2028 | | EUR | 113,000 | | | | 188,487 | |
| | | | | | | | |
| | | | | | $ | 1,135,952 | |
| | | | | | | | |
| | | | | | | | |
| Issuer | | Shares/Par | | | Value ($) | |
| | | | | | | | |
| BONDS – continued | |
| Foreign Bonds – continued | |
| Norway – 0.5% | |
| Eksportfinans A.S.A., 1.875%, 2013 | | $ | 170,000 | | | $ | 171,982 | |
| | | | | | | | |
| Spain – 0.9% | |
| Kingdom of Spain, 4.6%, 2019 | | EUR | 238,000 | | | $ | 302,235 | |
| | | | | | | | |
| United Kingdom – 4.8% | |
| United Kingdom Treasury, 8%, 2015 | | GBP | 228,000 | | | $ | 451,247 | |
| United Kingdom Treasury, 8%, 2021 | | GBP | 112,000 | | | | 243,234 | |
| United Kingdom Treasury, 4.25%, 2027 | | GBP | 259,000 | | | | 414,265 | |
| United Kingdom Treasury, 4.25%, 2036 | | GBP | 313,000 | | | | 491,414 | |
| | | | | | | | |
| | | | | | $ | 1,600,160 | |
| | | | | | | | |
| Total Foreign Bonds | | | | | | $ | 20,378,375 | |
| | | | | | | | |
| U.S. Bonds – 32.4% | |
| Asset-Backed & Securitized – 1.3% | |
| Commercial Mortgage Asset Trust, FRN, 0.84%, 2032 (i)(z) | | $ | 4,996,200 | | | $ | 96,379 | |
| Commercial Mortgage Pass-Through Certificates, FRN, 0.45%, 2017 (n) | | | 331,000 | | | | 317,332 | |
| First Union National Bank Commercial Mortgage Trust, FRN, 0.738%, 2043 (i)(n) | | | 3,126,323 | | | | 12,434 | |
| | | | | | | | |
| | | | | | $ | 426,145 | |
| | | | | | | | |
| Local Authorities – 0.2% | |
| University of California Rev. (Build America Bonds), 5.77%, 2043 | | $ | 70,000 | | | $ | 65,954 | |
| | | | | | | | |
| Mortgage-Backed – 3.1% | |
| Fannie Mae, 4.771%, 2012 | | $ | 173,428 | | | $ | 180,816 | |
| Fannie Mae, 5.37%, 2013 | | | 93,519 | | | | 98,254 | |
| Fannie Mae, 4.7%, 2015 | | | 44,091 | | | | 47,413 | |
| Fannie Mae, 4.78%, 2015 | | | 68,783 | | | | 74,181 | |
| Fannie Mae, 5.5%, 2015 | | | 39,617 | | | | 43,532 | |
| Fannie Mae, 5.09%, 2016 | | | 59,000 | | | | 64,047 | |
| Fannie Mae, 5.424%, 2016 | | | 68,032 | | | | 74,464 | |
| Fannie Mae, 5.05%, 2017 | | | 53,362 | | | | 57,917 | |
| Fannie Mae, 5.161%, 2018 | | | 117,314 | | | | 127,806 | |
| Fannie Mae, 5.1%, 2019 | | | 52,940 | | | | 56,883 | |
| Fannie Mae, 5.18%, 2019 | | | 52,958 | | | | 56,999 | |
| Fannie Mae, 6.16%, 2019 | | | 44,889 | | | | 50,282 | |
| Freddie Mac, 5.085%, 2019 | | | 33,000 | | | | 34,891 | |
| Freddie Mac, 5%, 2025 – 2028 | | | 75,551 | | | | 77,051 | |
| | | | | | | | |
| | | | | | $ | 1,044,536 | |
| | | | | | | | |
| U.S. Government Agencies and Equivalents – 2.3% | |
| Aid-Egypt, 4.45%, 2015 | | $ | 252,000 | | | $ | 276,207 | |
| Small Business Administration, 5.09%, 2025 | | | 35,022 | | | | 37,510 | |
| Small Business Administration, 5.21%, 2026 | | | 404,424 | | | | 434,128 | |
| | | | | | | | |
| | | | | | $ | 747,845 | |
| | | | | | | | |
7
MFS Global Governments Portfolio
Portfolio of Investments – continued
| | | | | | | | |
| Issuer | | Shares/Par | | | Value ($) | |
| | | | | | | | |
| BONDS – continued | |
| U.S. Bonds – continued | |
| U.S. Treasury Obligations – 25.5% | |
| U.S. Treasury Bonds, 6.875%, 2025 | | $ | 758,000 | | | $ | 1,013,233 | |
| U.S. Treasury Bonds, 5.25%, 2029 | | | 526,000 | | | | 603,256 | |
| U.S. Treasury Bonds, 4.5%, 2039 | | | 86,300 | | | | 88,619 | |
| U.S. Treasury Notes, 4.75%, 2012 | | | 1,130,000 | | | | 1,183,145 | |
| U.S. Treasury Notes, 4.125%, 2015 | | | 991,000 | | | | 1,091,261 | |
| U.S. Treasury Notes, 4.75%, 2017 | | | 2,297,000 | | | | 2,604,761 | |
| U.S. Treasury Notes, 3.5%, 2020 | | | 1,025,000 | | | | 1,049,990 | |
| U.S. Treasury Notes, TIPS, 1.25%, 2020 | | | 812,325 | | | | 831,744 | |
| | | | | | | | |
| | | | | | $ | 8,466,009 | |
| | | | | | | | |
| Total U.S. Bonds | | | | | | $ | 10,750,489 | |
| | | | | | | | |
Total Bonds
(Identified Cost, $29,643,345) | | | | | | $ | 31,128,864 | |
| | | | | | | | |
| | | | | | | | |
| Issuer | | Shares/Par | | | Value ($) | |
| | | | | | | | |
|
| SHORT-TERM OBLIGATIONS (y) – 3.0% | |
| Abbey National North America LLC, 0.14%, due 1/03/11, at Amortized Cost and Value | | $ | 989,000 | | | $ | 988,992 | |
| | | | | | | | |
|
| REPURCHASE AGREEMENTS – 2.3% | |
| Goldman Sachs, 0.15%, dated 12/31/10, due 1/03/11, total to be received $770,010 (secured by U.S. Treasury and Federal Agency obligations valued at $785,403 in a jointly traded account), at Cost | | $ | 770,000 | | | $ | 770,000 | |
| | | | | | | | |
Total Investments
(Identified Cost, $31,402,337) | | | | | | $ | 32,887,856 | |
| | | | | | | | |
OTHER ASSETS, LESS
LIABILITIES – 0.8% | | | | | | | 252,121 | |
| | | | | | | | |
| Net Assets – 100.0% | | | | | | $ | 33,139,977 | |
| | | | | | | | |
| (e) | Guaranteed by Minister for Finance of Ireland. |
| (i) | Interest only security for which the fund receives interest on notional principal (Par amount). Par amount shown is the notional principal and does not reflect the cost of the security. |
| (n) | Securities exempt from registration under Rule 144A of the Securities Act of 1933. These securities may be sold in the ordinary course of business in transactions exempt from registration, normally to qualified institutional buyers. At period end, the aggregate value of these securities was $797,047, representing 2.4% of net assets. |
| (y) | The rate shown represents an annualized yield at time of purchase. |
| (z) | Restricted securities are not registered under the Securities Act of 1933 and are subject to legal restrictions on resale. These securities generally may be resold in transactions exempt from registration or to the public if the securities are subsequently registered. Disposal of these securities may involve time-consuming negotiations and prompt sale at an acceptable price may be difficult. The fund holds the following restricted securities: |
| | | | | | | | | | |
| Restricted Securities | | Acquisition
Date | | Cost | | | Value | |
| Bayview Commercial Asset Trust, FRN, 1.687%, 2023 | | 5/25/06 | | | $135,624 | | | | $123,444 | |
| Commercial Mortgage Asset Trust, FRN, 0.84%, 2032 | | 8/25/03 | | | 94,206 | | | | 96,379 | |
| Total Restricted Securities | | | | | | | | | $219,823 | |
| % of Net Assets | | | | | | | | | 0.7% | |
The following abbreviations are used in this report and are defined:
| FRN | | Floating Rate Note. Interest rate resets periodically and may not be the rate reported at period end. |
| PLC | | Public Limited Company |
| TIPS | | Treasury Inflation Protected Security |
Abbreviations indicate amounts shown in currencies other than the U.S. dollar. All amounts are stated in U.S. dollars unless otherwise indicated. A list of abbreviations is shown below:
| CNY | | Chinese Yuan Renminbi |
8
MFS Global Governments Portfolio
Portfolio of Investments – continued
Derivative Contracts at 12/31/10
Forward Foreign Currency Exchange Contracts at 12/31/10
| | | | | | | | | | | | | | | | | | | | | | | | |
Type | | Currency | | | Counterparty | | Contracts to
Deliver/Receive | | Settlement Date
Range | | In Exchange For | | | Contracts
at Value | | | Net Unrealized
Appreciation
(Depreciation) | |
| Asset Derivatives | |
| BUY | | | AUD | | | Citibank N.A. | | 36,000 | | 1/12/11 | | $ | 35,347 | | | $ | 36,789 | | | $ | 1,442 | |
| BUY | | | AUD | | | Credit Suisse Group | | 36,000 | | 1/12/11 | | | 35,329 | | | | 36,789 | | | | 1,460 | |
| BUY | | | AUD | | | Goldman Sachs International | | 8,000 | | 1/12/11 | | | 7,890 | | | | 8,175 | | | | 285 | |
| BUY | | | AUD | | | Westpac Banking Corp. | | 236,866 | | 1/12/11 | | | 230,227 | | | | 242,057 | | | | 11,830 | |
| BUY | | | CAD | | | Barclays Bank PLC | | 5,000 | | 1/12/11 | | | 4,958 | | | | 5,028 | | | | 70 | |
| BUY | | | CAD | | | Goldman Sachs International | | 199,923 | | 1/12/11 | | | 195,422 | | | | 201,039 | | | | 5,617 | |
| BUY | | | CAD | | | UBS AG | | 36,000 | | 1/12/11 | | | 35,585 | | | | 36,201 | | | | 616 | |
| BUY | | | CLP | | | Barclays Bank PLC | | 39,701,000 | | 1/10/11 | | | 83,231 | | | | 84,791 | | | | 1,560 | |
| BUY | | | CNY | | | JPMorgan Chase Bank N.A. | | 544,000 | | 1/14/11-4/18/11 | | | 82,178 | | | | 82,551 | | | | 373 | |
| SELL | | | DKK | | | Royal Bank of Scotland PLC | | 180,000 | | 1/12/11 | | | 32,854 | | | | 32,269 | | | | 585 | |
| BUY | | | EUR | | | Citibank N.A. | | 68,000 | | 1/12/11 | | | 89,902 | | | | 90,867 | | | | 965 | |
| BUY | | | EUR | | | Deutsche Bank AG | | 126,000 | | 1/12/11 | | | 165,363 | | | | 168,372 | | | | 3,009 | |
| BUY | | | EUR | | | JPMorgan Chase Bank N.A. | | 272,796 | | 1/12/11 | | | 355,623 | | | | 364,532 | | | | 8,909 | |
| BUY | | | EUR | | | UBS AG | | 62,000 | | 1/12/11 | | | 82,226 | | | | 82,849 | | | | 623 | |
| SELL | | | EUR | | | Credit Suisse Group | | 18,000 | | 1/12/11 | | | 24,433 | | | | 24,053 | | | | 380 | |
| SELL | | | EUR | | | Deutsche Bank AG | | 30,000 | | 1/12/11 | | | 40,753 | | | | 40,088 | | | | 665 | |
| SELL | | | EUR | | | HSBC Bank | | 187,000 | | 1/12/11 | | | 256,569 | | | | 249,885 | | | | 6,684 | |
| SELL | | | EUR | | | JPMorgan Chase Bank N.A. | | 248,000 | | 1/12/11 | | | 348,564 | | | | 331,398 | | | | 17,166 | |
| SELL | | | EUR | | | UBS AG | | 93,665 | | 1/12/11 | | | 129,132 | | | | 125,163 | | | | 3,969 | |
| BUY | | | GBP | | | Barclays Bank PLC | | 8,000 | | 1/12/11 | | | 12,328 | | | | 12,472 | | | | 144 | |
| SELL | | | GBP | | | Barclays Bank PLC | | 20,000 | | 1/12/11 | | | 31,513 | | | | 31,180 | | | | 333 | |
| SELL | | | GBP | | | Goldman Sachs International | | 70,000 | | 1/12/11 | | | 111,288 | | | | 109,131 | | | | 2,157 | |
| SELL | | | GBP | | | UBS AG | | 31,000 | | 1/12/11 | | | 49,542 | | | | 48,330 | | | | 1,212 | |
| BUY | | | JPY | | | Barclays Bank PLC | | 13,119,000 | | 1/12/11 | | | 157,595 | | | | 161,596 | | | | 4,001 | |
| BUY | | | JPY | | | Citibank N.A. | | 4,030,000 | | 1/12/11 | | | 48,163 | | | | 49,640 | | | | 1,477 | |
| BUY | | | JPY | | | Credit Suisse Group | | 5,743,000 | | 1/12/11 | | | 70,152 | | | | 70,741 | | | | 589 | |
| BUY | | | JPY | | | Goldman Sachs International | | 1,681,000 | | 1/12/11 | | | 20,575 | | | | 20,706 | | | | 131 | |
| BUY | | | JPY | | | JPMorgan Chase Bank N.A. | | 249,786,592 | | 1/12/11 | | | 3,054,261 | | | | 3,076,800 | | | | 22,539 | |
| BUY | | | JPY | | | UBS AG | | 5,006,000 | | 1/12/11 | | | 59,850 | | | | 61,663 | | | | 1,813 | |
| SELL | | | KRW | | | JPMorgan Chase Bank N.A. | | 439,000 | | 1/05/11 | | | 389 | | | | 387 | | | | 2 | |
| BUY | | | MXN | | | HSBC Bank | | 1,025,000 | | 1/12/11 | | | 82,488 | | | | 82,952 | | | | 464 | |
| BUY | | | NZD | | | Barclays Bank PLC | | 47,000 | | 1/12/11 | | | 35,576 | | | | 36,605 | | | | 1,029 | |
| BUY | | | PHP | | | JPMorgan Chase Bank N.A. | | 1,885,000 | | 1/28/11 | | | 42,695 | | | | 43,038 | | | | 343 | |
| SELL | | | SEK | | | Barclays Bank PLC | | 97,000 | | 1/12/11 | | | 14,446 | | | | 14,419 | | | | 27 | |
| BUY | | | SGD | | | HSBC Bank | | 115,000 | | 1/12/11 | | | 88,865 | | | | 89,610 | | | | 745 | |
| BUY | | | SGD | | | JPMorgan Chase Bank N.A. | | 107,000 | | 2/07/11 | | | 81,939 | | | | 83,379 | | | | 1,440 | |
| SELL | | | TRY | | | Barclays Bank PLC | | 99,000 | | 1/26/11 | | | 65,162 | | | | 63,950 | | | | 1,212 | |
| SELL | | | TRY | | | Deutsche Bank AG | | 206,000 | | 2/22/11 | | | 136,913 | | | | 132,615 | | | | 4,298 | |
| BUY | | | TWD | | | Barclays Bank PLC | | 2,700,000 | | 1/27/11 | | | 88,918 | | | | 92,662 | | | | 3,744 | |
| BUY | | | ZAR | | | Deutsche Bank AG | | 1,000 | | 1/18/11 | | | 140 | | | | 151 | | | | 11 | |
| | | | | | | | | | | | | | | | | | | | | | | | |
| | | | | | | | | | | | | | | | | | | | | | $ | 113,919 | |
| | | | | | | | | | | | | | | | | | | | | | | | |
9
MFS Global Governments Portfolio
Portfolio of Investments – continued
Forward Foreign Currency Exchange Contracts at 12/31/10 – continued
| | | | | | | | | | | | | | | | | | | | | | | | |
| | | Type | | Currency | | | Counterparty | | Contracts to
Deliver/Receive | | Settlement Date
Range | | In Exchange For | | | Contracts
at Value | | | Net Unrealized
Appreciation
(Depreciation) | |
| Liability Derivatives | |
| SELL | | | AUD | | | Citibank N.A. | | 66,000 | | 1/12/11 | | $ | 64,633 | | | $ | 67,446 | | | $ | (2,813 | ) |
| SELL | | | CAD | | | Barclays Bank PLC | | 52,000 | | 1/12/11 | | | 51,480 | | | | 52,290 | | | | (810 | ) |
| SELL | | | CAD | | | Credit Suisse Group | | 419,916 | | 1/12/11 | | | 417,507 | | | | 422,260 | | | | (4,753 | ) |
| BUY | | | DKK | | | Credit Suisse Group | | 1,304,922 | | 1/12/11 | | | 243,505 | | | | 233,934 | | | | (9,571 | ) |
| BUY | | | EUR | | | Deutsche Bank AG | | 142,000 | | 1/12/11 | | | 193,540 | | | | 189,752 | | | | (3,788 | ) |
| BUY | | | EUR | | | Goldman Sachs International | | 18,000 | | 1/12/11 | | | 24,788 | | | | 24,053 | | | | (735 | ) |
| BUY | | | EUR | | | JPMorgan Chase Bank N.A. | | 1,097,257 | | 1/12/11 | | | 1,529,427 | | | | 1,466,244 | | | | (63,183 | ) |
| SELL | | | EUR | | | Barclays Bank PLC | | 62,000 | | 1/12/11 | | | 80,477 | | | | 82,849 | | | | (2,372 | ) |
| SELL | | | EUR | | | Deutsche Bank AG | | 2,000 | | 1/12/11 | | | 2,658 | | | | 2,673 | | | | (15 | ) |
| SELL | | | EUR | | | Goldman Sachs International | | 56,000 | | 1/12/11 | | | 74,810 | | | | 74,832 | | | | (22 | ) |
| SELL | | | EUR | | | HSBC Bank | | 189,745 | | 1/12/11 | | | 252,684 | | | | 253,553 | | | | (869 | ) |
| SELL | | | EUR | | | UBS AG | | 1,805,247 | | 1/12/11-3/15/11 | | | 2,384,594 | | | | 2,411,793 | | | | (27,199 | ) |
| BUY | | | GBP | | | Barclays Bank PLC | | 149,484 | | 1/12/11 | | | 237,557 | | | | 233,049 | | | | (4,508 | ) |
| BUY | | | GBP | | | Credit Suisse Group | | 3,000 | | 1/12/11 | | | 4,782 | | | | 4,677 | | | | (105 | ) |
| BUY | | | GBP | | | Deutsche Bank AG | | 211,484 | | 1/12/11 | | | 335,589 | | | | 329,708 | | | | (5,881 | ) |
| BUY | | | GBP | | | Royal Bank of Scotland PLC | | 31,000 | | 1/12/11 | | | 49,738 | | | | 48,330 | | | | (1,408 | ) |
| BUY | | | GBP | | | UBS AG | | 18,000 | | 1/12/11 | | | 28,459 | | | | 28,062 | | | | (397 | ) |
| BUY | | | IDR | | | Barclays Bank PLC | | 773,536,000 | | 4/01/11 | | | 85,285 | | | | 84,704 | | | | (581 | ) |
| BUY | | | IDR | | | JPMorgan Chase Bank N.A. | | 488,100,000 | | 1/14/11 | | | 54,276 | | | | 54,090 | | | | (186 | ) |
| SELL | | | IDR | | | JPMorgan Chase Bank N.A. | | 1,260,865,000 | | 1/14/11 | | | 139,384 | | | | 139,726 | | | | (342 | ) |
| BUY | | | JPY | | | Barclays Bank PLC | | 1,283,000 | | 1/12/11 | | | 15,827 | | | | 15,804 | | | | (23 | ) |
| SELL | | | JPY | | | Barclays Bank PLC | | 3,714,000 | | 1/12/11 | | | 45,664 | | | | 45,748 | | | | (84 | ) |
| SELL | | | JPY | | | Citibank N.A. | | 274,000 | | 1/12/11 | | | 3,310 | | | | 3,375 | | | | (65 | ) |
| SELL | | | JPY | | | Credit Suisse Group | | 4,491,000 | | 1/12/11 | | | 55,299 | | | | 55,319 | | | | (20 | ) |
| SELL | | | JPY | | | HSBC Bank | | 32,621,000 | | 1/12/11 | | | 389,380 | | | | 401,816 | | | | (12,436 | ) |
| SELL | | | JPY | | | Royal Bank of Scotland PLC | | 4,253,000 | | 1/12/11 | | | 52,088 | | | | 52,387 | | | | (299 | ) |
| SELL | | | JPY | | | UBS AG | | 14,440,000 | | 1/12/11 | | | 173,870 | | | | 177,868 | | | | (3,998 | ) |
| BUY | | | KRW | | | Barclays Bank PLC | | 146,277,000 | | 1/05/11-1/18/11 | | | 130,246 | | | | 128,822 | | | | (1,424 | ) |
| BUY | | | KRW | | | JPMorgan Chase Bank N.A. | | 439,000 | | 1/18/11 | | | 386 | | | | 387 | | | | (2 | ) |
| SELL | | | KRW | | | Barclays Bank PLC | | 146,167,000 | | 1/05/11-1/18/11 | | | 125,123 | | | | 128,725 | | | | (3,602 | ) |
| SELL | | | NOK | | | Deutsche Bank AG | | 14,000 | | 1/12/11 | | | 2,257 | | | | 2,398 | | | | (141 | ) |
| SELL | | | NZD | | | Barclays Bank PLC | | 46,000 | | 1/12/11 | | | 35,471 | | | | 35,826 | | | | (355 | ) |
| BUY | | | PHP | | | JPMorgan Chase Bank N.A. | | 5,650,000 | | 1/06/11-1/26/11 | | | 130,045 | | | | 128,988 | | | | (1,057 | ) |
| SELL | | | PHP | | | JPMorgan Chase Bank N.A. | | 3,814,000 | | 1/26/11 | | | 85,746 | | | | 87,079 | | | | (1,333 | ) |
| BUY | | | SEK | | | Credit Suisse Group | | 2,551,650 | | 1/12/11 | | | 380,497 | | | | 379,291 | | | | (1,206 | ) |
| SELL | | | SEK | | | Barclays Bank PLC | | 87,000 | | 1/12/11 | | | 12,626 | | | | 12,932 | | | | (306 | ) |
| BUY | | | SGD | | | Deutsche Bank AG | | 56,000 | | 1/12/11 | | | 43,671 | | | | 43,636 | | | | (35 | ) |
| SELL | | | SGD | | | Deutsche Bank AG | | 62,000 | | 1/12/11 | | | 46,864 | | | | 48,312 | | | | (1,448 | ) |
| BUY | | | TRY | | | HSBC Bank | | 89,000 | | 2/22/11 | | | 60,716 | | | | 57,295 | | | | (3,421 | ) |
| BUY | | | TRY | | | JPMorgan Chase Bank N.A. | | 216,000 | | 1/26/11-2/22/11 | | | 145,674 | | | | 139,332 | | | | (6,342 | ) |
| SELL | | | TWD | | | Credit Suisse Group | | 2,482,550 | | 1/27/11 | | | 82,000 | | | | 85,199 | | | | (3,199 | ) |
| SELL | | | TWD | | | JPMorgan Chase Bank N.A. | | 191,000 | | 1/27/11 | | | 6,499 | | | | 6,556 | | | | (57 | ) |
| | | | | | | | | | | | | | | | | | | | | | | | |
| | | | | | | | | | | | | | | | | | | | | | $ | (170,391 | ) |
| | | | | | | | | | | | | | | | | | | | | | | | |
At December 31, 2010, the fund had sufficient cash and/or securities to cover any commitments under these derivative contracts.
See Notes to Financial Statements
10
MFS Global Governments Portfolio
FINANCIAL STATEMENTS | STATEMENT OF ASSETS AND LIABILITIES
This statement represents your fund’s balance sheet, which details the assets and liabilities comprising the total value of the fund.
| | | | | | | | |
At 12/31/10 | | | | | | | | |
Assets | | | | | | | | |
Investments, at value (identified cost, $31,402,337) | | | $32,887,856 | | | | | |
Cash | | | 990 | | | | | |
Foreign currency, at value (identified cost, $226) | | | 230 | | | | | |
Receivables for | | | | | | | | |
Forward foreign currency exchange contracts | | | 113,919 | | | | | |
Interest | | | 397,139 | | | | | |
Receivable from investment adviser | | | 3,059 | | | | | |
Other assets | | | 1,444 | | | | | |
Total assets | | | | | | | $33,404,637 | |
Liabilities | | | | | | | | |
Payables for | | | | | | | | |
Forward foreign currency exchange contracts | | | $170,391 | | | | | |
Fund shares reacquired | | | 40,092 | | | | | |
Payable to affiliates | | | | | | | | |
Investment adviser | | | 1,353 | | | | | |
Distribution and/or service fees | | | 42 | | | | | |
Administrative services fee | | | 79 | | | | | |
Payable for Trustees’ compensation | | | 40 | | | | | |
Accrued expenses and other liabilities | | | 52,663 | | | | | |
Total liabilities | | | | | | | $264,660 | |
Net assets | | | | | | | $33,139,977 | |
Net assets consist of | | | | | | | | |
Paid-in capital | | | $31,386,558 | | | | | |
Unrealized appreciation (depreciation) on investments and translation of assets and liabilities in foreign currencies | | | 1,430,414 | | | | | |
Accumulated distributions in excess of net realized gain on investments and foreign currency transactions | | | (182,623 | ) | | | | |
Undistributed net investment income | | | 505,628 | | | | | |
Net assets | | | | | | | $33,139,977 | |
Shares of beneficial interest outstanding | | | | | | | 3,016,903 | |
| | | | | | | | | | | | |
| | | Net assets | | | Shares
outstanding | | | Net asset value
per share | |
Initial Class | | | $30,046,688 | | | | 2,731,783 | | | | $11.00 | |
Service Class | | | 3,093,289 | | | | 285,120 | | | | 10.85 | |
See Notes to Financial Statements
11
MFS Global Governments Portfolio
FINANCIAL STATEMENTS | STATEMENT OF OPERATIONS
This statement describes how much your fund earned in investment income and accrued in expenses. It also describes any gains and/or losses generated by fund operations.
| | | | | | | | |
Year ended 12/31/10 | | | | | | | | |
Net investment income | | | | | | | | |
Interest income | | | | | | | $898,730 | |
Expenses | | | | | | | | |
Management fee | | | $255,445 | | | | | |
Distribution and/or service fees | | | 7,983 | | | | | |
Administrative services fee | | | 14,844 | | | | | |
Trustees’ compensation | | | 4,714 | | | | | |
Custodian fee | | | 31,240 | | | | | |
Shareholder communications | | | 6,996 | | | | | |
Auditing fees | | | 58,800 | | | | | |
Legal fees | | | 7,119 | | | | | |
Miscellaneous | | | 11,989 | | | | | |
Total expenses | | | | | | | $399,130 | |
Fees paid indirectly | | | (7 | ) | | | | |
Reduction of expenses by investment adviser | | | (50,433 | ) | | | | |
Net expenses | | | | | | | $348,690 | |
Net investment income | | | | | | | $550,040 | |
Realized and unrealized gain (loss) on investments and foreign currency transactions | | | | | | | | |
Realized gain (loss) (identified cost basis) | | | | | | | | |
Investment transactions | | | $(54,618 | ) | | | | |
Foreign currency transactions | | | 468,130 | | | | | |
Net realized gain (loss) on investments and foreign currency transactions | | | | | | | $413,512 | |
Change in unrealized appreciation (depreciation) | | | | | | | | |
Investments | | | $473,005 | | | | | |
Translation of assets and liabilities in foreign currencies | | | 57,550 | | | | | |
Net unrealized gain (loss) on investments and foreign currency translation | | | | | | | $530,555 | |
Net realized and unrealized gain (loss) on investments and foreign currency | | | | | | | $944,067 | |
Change in net assets from operations | | | | | | | $1,494,107 | |
See Notes to Financial Statements
12
MFS Global Governments Portfolio
FINANCIAL STATEMENTS | STATEMENTS OF CHANGES IN NET ASSETS
These statements describe the increases and/or decreases in net assets resulting from operations, any distributions, and any shareholder transactions.
| | | | | | | | |
For years ended 12/31 | | | 2010 | | | | 2009 | |
Change in net assets | | | | | | | | |
From operations | | | | | | | | |
Net investment income | | | $550,040 | | | | $765,918 | |
Net realized gain (loss) on investments and foreign currency transactions | | | 413,512 | | | | (308,731 | ) |
Net unrealized gain (loss) on investments and foreign currency translation | | | 530,555 | | | | 726,570 | |
Change in net assets from operations | | | $1,494,107 | | | | $1,183,757 | |
Distributions declared to shareholders | | | | | | | | |
From net investment income | | | $— | | | | $(4,466,015 | ) |
From net realized gain on investments | | | (271,570 | ) | | | — | |
Total distributions declared to shareholders | | | $(271,150 | ) | | | $(4,466,015 | ) |
Change in net assets from fund share transactions | | | $(3,689,597 | ) | | | $(4,294,763 | ) |
Total change in net assets | | | $(2,467,060 | ) | | | $(7,577,021 | ) |
| Net assets | | | | | | | | |
At beginning of period | | | 35,607,037 | | | | 43,184,058 | |
At end of period (including undistributed net investment income of $505,628 and
accumulated distributions in excess of net investment income of $312,004, respectively) | | | $33,139,977 | | | | $35,607,037 | |
See Notes to Financial Statements
13
MFS Global Governments Portfolio
FINANCIAL STATEMENTS | FINANCIAL HIGHLIGHTS
The financial highlights table is intended to help you understand the fund’s financial performance for the past 5 years. Certain information reflects financial results for a single fund share. The total returns in the table represent the rate by which an investor would have earned (or lost) on an investment in the fund share class (assuming reinvestment of all distributions) held for the entire period.
| | | | | | | | | | | | | | | | | | | | |
| Initial Class | | Years ended 12/31 | |
| | | 2010 | | | 2009 | | | 2008 | | | 2007 | | | 2006 | |
Net asset value, beginning of period | | | $10.60 | | | | $11.59 | | | | $11.43 | | | | $10.70 | | | | $10.29 | |
| Income (loss) from investment operations | | | | | | | | | | | | | | | | | | | | |
Net investment income (d) | | | $0.18 | | | | $0.22 | | | | $0.26 | | | | $0.36 | | | | $0.34 | |
Net realized and unrealized gain (loss) on investments
and foreign currency | | | 0.30 | | | | 0.13 | | | | 0.84 | | | | 0.58 | | | | 0.17 | |
Total from investment operations | | | $0.48 | | | | $0.35 | | | | $1.10 | | | | $0.94 | | | | $0.51 | |
| Less distributions declared to shareholders | | | | | | | | | | | | | | | | | | | | |
From net investment income | | | $— | | | | $(1.34 | ) | | | $(0.94 | ) | | | $(0.21 | ) | | | $— | |
From net realized gain on investments | | | (0.08 | ) | | | — | | | | — | | | | — | | | | (0.10 | ) |
Total distributions declared to shareholders | | | $(0.08 | ) | | | $(1.34 | ) | | | $(0.94 | ) | | | $(0.21 | ) | | | $(0.10 | ) |
Net asset value, end of period | | | $11.00 | | | | $10.60 | | | | $11.59 | | | | $11.43 | | | | $10.70 | |
Total return (%) (k)(r)(s) | | | 4.61 | | | | 4.06 | | | | 10.12 | | | | 8.99 | | | | 4.97 | |
Ratios (%) (to average net assets) and Supplemental data: | | | | | | | | | | | | | | | | | | | | |
Expenses before expense reductions (f) | | | 1.15 | | | | 1.16 | | | | 1.09 | | | | 1.08 | | | | 1.13 | |
Expenses after expense reductions (f) | | | 1.00 | | | | 1.00 | | | | 1.00 | | | | 1.00 | | | | 1.00 | |
Net investment income | | | 1.64 | | | | 2.08 | | | | 2.31 | | | | 3.33 | | | | 3.21 | |
Portfolio turnover | | | 66 | | | | 84 | | | | 113 | | | | 134 | | | | 122 | |
Net assets at end of period (000 omitted) | | | $30,047 | | | | $32,034 | | | | $36,813 | | | | $36,559 | | | | $39,637 | |
| |
| Service Class | | Years ended 12/31 | |
| | | 2010 | | | 2009 | | | 2008 | | | 2007 | | | 2006 | |
Net asset value, beginning of period | | | $10.48 | | | | $11.47 | | | | $11.32 | | | | $10.60 | | | | $10.22 | |
| Income (loss) from investment operations | | | | | | | | | | | | | | | | | | | | |
Net investment income (d) | | | $0.15 | | | | $0.19 | | | | $0.23 | | | | $0.33 | | | | $0.31 | |
Net realized and unrealized gain (loss) on investments
and foreign currency | | | 0.30 | | | | 0.12 | | | | 0.84 | | | | 0.58 | | | | 0.17 | |
Total from investment operations | | | $0.45 | | | | $0.31 | | | | $1.07 | | | | $0.91 | | | | $0.48 | |
| Less distributions declared to shareholders | | | | | | | | | | | | | | | | | | | | |
From net investment income | | | $— | | | | $(1.30 | ) | | | $(0.92 | ) | | | $(0.19 | ) | | | $— | |
From net realized gain on investments | | | (0.08 | ) | | | — | | | | — | | | | — | | | | (0.10 | ) |
Total distributions declared to shareholders | | | $(0.08 | ) | | | $(1.30 | ) | | | $(0.92 | ) | | | $(0.19 | ) | | | $(0.10 | ) |
Net asset value, end of period | | | $10.85 | | | | $10.48 | | | | $11.47 | | | | $11.32 | | | | $10.60 | |
Total return (%) (k)(r)(s) | | | 4.38 | | | | 3.77 | | | | 9.93 | | | | 8.67 | | | | 4.70 | |
Ratios (%) (to average net assets) and Supplemental data: | | | | | | | | | | | | | | | | | | | | |
Expenses before expense reductions (f) | | | 1.40 | | | | 1.41 | | | | 1.35 | | | | 1.33 | | | | 1.38 | |
Expenses after expense reductions (f) | | | 1.25 | | | | 1.25 | | | | 1.25 | | | | 1.25 | | | | 1.25 | |
Net investment income | | | 1.39 | | | | 1.78 | | | | 2.03 | | | | 3.08 | | | | 2.96 | |
Portfolio turnover | | | 66 | | | | 84 | | | | 113 | | | | 134 | | | | 122 | |
Net assets at end of period (000 omitted) | | | $3,093 | | | | $3,573 | | | | $6,371 | | | | $4,063 | | | | $3,793 | |
| (d) | Per share data is based on average shares outstanding. |
| (f) | Ratios do not reflect reductions from fees paid indirectly, if applicable. |
| (k) | The total return does not reflect expenses that apply to separate accounts. Inclusion of these charges would reduce the total return figures for all periods shown. |
| (r) | Certain expenses have been reduced without which performance would have been lower. |
| (s) | From time to time the fund may receive proceeds from litigation settlements, without which performance would be lower. |
See Notes to Financial Statements
14
MFS Global Governments Portfolio
NOTES TO FINANCIAL STATEMENTS
| (1) | | Business and Organization |
MFS Global Governments Portfolio (the fund) is a series of MFS Variable Insurance Trust II (the trust). The trust is organized as a Massachusetts business trust and is registered under the Investment Company Act of 1940, as amended, as an open-end management investment company. The shareholders of each series of the trust are separate accounts of insurance companies, which offer variable annuity and/or life insurance products, and qualified retirement and pension plans.
| (2) | | Significant Accounting Policies |
General – The preparation of financial statements in conformity with U.S. generally accepted accounting principles requires management to make estimates and assumptions that affect the reported amounts of assets and liabilities, and disclosure of contingent assets and liabilities at the date of the financial statements and the reported amounts of revenues and expenses during the reporting period. Actual results could differ from those estimates. In the preparation of these financial statements, management has evaluated subsequent events occurring after the date of the fund’s Statement of Assets and Liabilities through the date that the financial statements were issued. The fund invests in foreign securities, including securities of emerging market issuers. Investments in foreign securities are vulnerable to the effects of changes in the relative values of the local currency and the U.S. dollar and to the effects of changes in each country’s legal, political, and economic environment. The markets of emerging markets countries are generally more volatile than the markets of developed countries with more mature economies. All of the risks of investing in foreign securities previously described are heightened when investing in emerging markets countries.
Investment Valuations – Debt instruments and floating rate loans (other than short-term instruments), including restricted debt instruments, are generally valued at an evaluated or composite bid as provided by a third-party pricing service. Short-term instruments with a maturity at issuance of 60 days or less generally are valued at amortized cost, which approximates market value. Exchange-traded options are generally valued at the last sale or official closing price as provided by a third-party pricing service on the exchange on which such options are primarily traded. Exchange-traded options for which there were no sales reported that day are generally valued at the last daily bid quotation as provided by a third-party pricing service on the exchange on which such options are primarily traded. Options not traded on an exchange are generally valued at a broker/dealer bid quotation. Foreign currency options are generally valued at valuations provided by a third-party pricing service. Forward foreign currency contracts are generally valued at the mean of bid and asked prices for the time period interpolated from rates provided by a third-party pricing service for proximate time periods. Securities and other assets generally valued on the basis of information from a third-party pricing service may also be valued at a broker/dealer bid quotation. Values obtained from third-party pricing services can utilize both transaction data and market information such as yield, quality, coupon rate, maturity, type of issue, trading characteristics, and other market data. The values of foreign securities and other assets and liabilities expressed in foreign currencies are converted to U.S. dollars using the mean of bid and asked prices for rates provided by a third-party pricing service.
The Board of Trustees has delegated primary responsibility for determining or causing to be determined the value of the fund’s investments (including any fair valuation) to the adviser pursuant to valuation policies and procedures approved by the Board. If the adviser determines that reliable market quotations are not readily available, investments are valued at fair value as determined in good faith by the adviser in accordance with such procedures under the oversight of the Board of Trustees. Under the fund’s valuation policies and procedures, market quotations are not considered to be readily available for most types of debt instruments and floating rate loans and many types of derivatives. These investments are generally valued at fair value based on information from third-party pricing services. In addition, investments may be valued at fair value if the adviser determines that an investment’s value has been materially effected by events occurring after the close of the exchange or market on which the investment is principally traded (such as foreign exchange or market) and prior to the determination of the fund’s net asset value, or after the halting of trading of a specific security where trading does not resume prior to the close of the exchange or market on which the security is principally traded. The adviser generally relies on third-party pricing services or other information (such as the correlation with price movements of similar securities in the same or other markets; the type, cost and investment characteristics of the security; the business and financial condition of the issuer; and trading and other market data) to assist in determining whether to fair value and at what value to fair value an investment. The value of an investment for purposes of calculating the fund’s net asset value can differ depending on the source and method used to determine value. When fair valuation is used, the value of an investment used to determine the fund’s net asset value may differ from quoted or published prices for the same investment. There can be no assurance that the fund could obtain the fair value assigned to an investment if it were to sell the investment at the same time at which the fund determines its net asset value per share.
Various inputs are used in determining the value of the fund’s assets or liabilities. These inputs are categorized into three broad levels. In certain cases, the inputs used to measure fair value may fall into different levels of the fair value hierarchy. In such
15
MFS Global Governments Portfolio
Notes to Financial Statements – continued
cases, an investment’s level within the fair value hierarchy is based on the lowest level of input that is significant to the fair value measurement. The fund’s assessment of the significance of a particular input to the fair value measurement in its entirety requires judgment, and considers factors specific to the investment. Level 1 includes unadjusted quoted prices in active markets for identical assets or liabilities. Level 2 includes other significant observable market-based inputs (including quoted prices for similar securities, interest rates, prepayment speed, and credit risk). Level 3 includes unobservable inputs, which may include the adviser’s own assumptions in determining the fair value of investments. Other financial instruments are derivative instruments not reflected in total investments, such as forwards. The following is a summary of the levels used as of December 31, 2010 in valuing the fund’s assets or liabilities:
| | | | | | | | | | | | | | | | |
| Investments at Value | | Level 1 | | | Level 2 | | | Level 3 | | | Total | |
| U.S. Treasury Bonds & U.S. Government Agency & Equivalents | | | $— | | | | $9,213,854 | | | | $— | | | | $9,213,854 | |
| Non-U.S. Sovereign Debt | | | — | | | | 20,254,931 | | | | — | | | | 20,254,931 | |
| Corporate Bonds | | | — | | | | 65,954 | | | | — | | | | 65,954 | |
| Residential Mortgage-Backed Securities | | | — | | | | 1,044,536 | | | | — | | | | 1,044,536 | |
| Commercial Mortgage-Backed Securities | | | — | | | | 549,589 | | | | — | | | | 549,589 | |
| Short Term Securities | | | — | | | | 1,758,992 | | | | — | | | | 1,758,992 | |
| Total Investments | | | $— | | | | $32,887,856 | | | | $— | | | | $32,887,856 | |
| | | | |
| Other Financial Instruments | | | | | | | | | | | | |
| Forward Currency Contracts | | | $— | | | | $(56,472 | ) | | | $— | | | | $(56,472 | ) |
For further information regarding security characteristics, see the Portfolio of Investments.
Repurchase Agreements – The fund entered into repurchase agreements with approved counterparties. Each repurchase agreement is recorded at cost. The fund requires that the securities collateral in a repurchase transaction be transferred to a custodian. The fund monitors, on a daily basis, the value of the collateral to ensure that its value, including accrued interest, is greater than amounts owed to the fund under each such repurchase agreement. The fund and other funds managed by MFS may utilize a joint trading account for the purpose of entering into one or more repurchase agreements.
Inflation-Adjusted Debt Securities – The fund invests in inflation-adjusted debt securities issued by the U.S. Treasury. The fund may also invest in inflation-adjusted debt securities issued by U.S. Government agencies and instrumentalities other than the U.S. Treasury and by other entities such as U.S. and foreign corporations and foreign governments. The principal value of these debt securities is adjusted through income according to changes in the Consumer Price Index or another general price or wage index. These debt securities typically pay a fixed rate of interest, but this fixed rate is applied to the inflation-adjusted principal amount. The principal paid at maturity of the debt security is typically equal to the inflation-adjusted principal amount, or the security’s original par value, whichever is greater. Other types of inflation-adjusted securities may use other methods to adjust for other measures of inflation.
Foreign Currency Translation – Purchases and sales of foreign investments, income, and expenses are converted into U.S. dollars based upon currency exchange rates prevailing on the respective dates of such transactions or on the reporting date for foreign denominated receivables and payables. Gains and losses attributable to foreign currency exchange rates on sales of securities are recorded for financial statement purposes as net realized gains and losses on investments. Gains and losses attributable to foreign exchange rate movements on receivables, payables, income and expenses are recorded for financial statement purposes as foreign currency transaction gains and losses. That portion of both realized and unrealized gains and losses on investments that results from fluctuations in foreign currency exchange rates is not separately disclosed.
Derivatives – The fund uses derivatives for different purposes, including to earn income and enhance returns, to increase or decrease exposure to a particular market, to manage or adjust the risk profile of the fund, or as alternatives to direct investments. Derivatives are used for hedging or non-hedging purposes. While hedging can reduce or eliminate losses, it can also reduce or eliminate gains. When the fund uses derivatives as an investment to increase market exposure, or for hedging purposes, gains and losses from derivative instruments may be substantially greater than the derivative’s original cost.
Derivative instruments used by the fund during the period include purchased options and forward foreign currency exchange contracts. The fund’s period end derivatives, as presented in the Portfolio of Investments and the associated Derivative Contract Tables, generally are indicative of the volume of its derivative activity during the period.
The following table presents, by major type of derivative contract, the fair value, on a gross basis, of the asset and liability components of derivatives held by the fund at December 31, 2010 as reported in the Statement of Assets and Liabilities:
| | | | | | | | | | |
| | | | | Fair Value | |
| Risk | | Derivative | | Asset Derivatives | | | Liability Derivatives | |
| Foreign Exchange Contracts | | Forward Foreign Currency Exchange Contracts | | | $113,919 | | | | $(170,391 | ) |
16
MFS Global Governments Portfolio
Notes to Financial Statements – continued
The following table presents, by major type of derivative contract, the realized gain (loss) on derivatives held by the fund for the year ended December 31, 2010 as reported in the Statement of Operations:
| | | | | | | | |
| Risk | | Foreign Currency
Transactions | | | Investment Transactions
(Purchased Options) | |
| Foreign Exchange Contracts | | | $480,499 | | | | $(4,491 | ) |
| Interest Rate Contracts | | | — | | | | (2,710 | ) |
| Total | | | $480,499 | | | | $(7,201 | ) |
The following table presents, by major type of derivative contract, the change in unrealized appreciation (depreciation) on derivatives held by the fund for the year ended December 31, 2010 as reported in the Statement of Operations:
| | | | |
| Risk | | Translation of
Assets and
Liabilities in
Foreign Currencies | |
| Foreign Exchange Contracts | | | $51,743 | |
Derivative counterparty credit risk is managed through formal evaluation of the creditworthiness of all potential counterparties. On certain over-the-counter derivatives, the fund attempts to reduce its exposure to counterparty credit risk whenever possible by entering into an International Swaps and Derivatives Association (ISDA) Master Agreement on a bilateral basis with each of the counterparties with whom it undertakes a significant volume of transactions. The ISDA Master Agreement gives each party to the agreement the right to terminate all transactions traded under such agreement if there is a certain deterioration in the credit quality of the other party. The ISDA Master Agreement gives the fund the right, upon an event of default by the applicable counterparty or a termination of the agreement, to close out all transactions traded under such agreement and to net amounts owed under each transaction to one net amount payable by one party to the other. This right to close out and net payments across all transactions traded under the ISDA Master Agreement could result in a reduction of the fund’s credit risk to such counterparty equal to any amounts payable by the fund under the applicable transactions, if any. However, absent an event of default by the counterparty or a termination of the agreement, the ISDA Master Agreement does not result in an offset of reported amounts of assets and liabilities in the Statement of Assets and Liabilities across transactions between the fund and the applicable counterparty.
Collateral requirements differ by type of derivative. Collateral or margin requirements are set by the broker or exchange clearing house for exchange traded derivatives (i.e., futures and exchange-traded options) while collateral terms are contract specific for over-the-counter traded derivatives (i.e., forwards, swaps and over-the-counter options). For derivatives traded under an ISDA Master Agreement, the collateral requirements are netted across all transactions traded under such agreement and one amount is posted from one party to the other to collateralize such obligations. Cash collateral that has been pledged to cover obligations of the fund under derivative contracts, if any, will be reported separately on the Statement of Assets and Liabilities as restricted cash. Securities collateral pledged for the same purpose, if any, is noted in the Portfolio of Investments.
Purchased Options – The fund purchased call and put options for a premium. Purchased call and put options entitle the holder to buy and sell a specified number of shares or units of a particular security, currency or index at a specified price at a specified date or within a specified period of time. Purchasing call options may be used to hedge against an anticipated increase in the dollar cost of securities or currency to be acquired or to increase the fund’s exposure to an underlying instrument. Purchasing put options may hedge against a decline in the value of portfolio securities or currency.
The premium paid is initially recorded as an investment in the Statement of Assets and Liabilities. That investment is subsequently marked-to-market daily with the difference between the premium paid and the market value of the purchased option being recorded as unrealized appreciation or depreciation. Premiums paid for purchased call and put options which have expired are treated as realized losses on investments in the Statement of Operations. Upon the exercise or closing of a purchased call option, the premium paid is added to the cost of the security or financial instrument. Upon the exercise or closing of a purchased put option, the premium paid is offset against the proceeds on the sale of the underlying security or financial instrument in order to determine the realized gain or loss on investments.
The risk in purchasing an option is that the fund pays a premium whether or not the option is exercised. The fund’s maximum risk of loss due to counterparty credit risk is limited to the market value of the option. For over-the-counter options, this risk is mitigated in cases where there is an ISDA Master Agreement between the fund and the counterparty providing for netting as described above and for posting of collateral by the counterparty to the fund to cover the fund’s exposure to the counterparty under such ISDA Master Agreement.
17
MFS Global Governments Portfolio
Notes to Financial Statements – continued
Forward Foreign Currency Exchange Contracts – The fund entered into forward foreign currency exchange contracts for the purchase or sale of a specific foreign currency at a fixed price on a future date. These contracts may be used to hedge the fund’s currency risk or for non-hedging purposes. For hedging purposes, the fund may enter into contracts to deliver or receive foreign currency that the fund will receive from or use in its normal investment activities. The fund may also use contracts to hedge against declines in the value of foreign currency denominated securities due to unfavorable exchange rate movements. For non-hedging purposes, the fund may enter into contracts with the intent of changing the relative exposure of the fund’s portfolio of securities to different currencies to take advantage of anticipated exchange rate changes.
Forward foreign currency exchange contracts are adjusted by the daily exchange rate of the underlying currency and any unrealized gains or losses are recorded as a receivable or payable for forward foreign currency exchange contracts until the contract settlement date. On contract settlement date, any gain or loss on the contract is recorded as realized gains or losses on foreign currency transactions.
Risks may arise upon entering into these contracts from unanticipated movements in the value of the contract and from the potential inability of counterparties to meet the terms of their contracts. Generally, the fund’s maximum risk due to counterparty credit risk is the unrealized gain on the contract due to our use of continuous linked settlement, an industry accepted settlement system. This risk is mitigated in cases where there is an ISDA Master Agreement between the fund and the counterparty providing for netting as described above and for posting of collateral by the counterparty to the fund to cover the fund’s exposure to the counterparty under such ISDA Master Agreement.
Indemnifications – Under the fund’s organizational documents, its officers and Trustees may be indemnified against certain liabilities and expenses arising out of the performance of their duties to the fund. Additionally, in the normal course of business, the fund enters into agreements with service providers that may contain indemnification clauses. The fund’s maximum exposure under these agreements is unknown as this would involve future claims that may be made against the fund that have not yet occurred.
Investment Transactions and Income – Investment transactions are recorded on the trade date. Interest income is recorded on the accrual basis. All premium and discount is amortized or accreted for financial statement purposes in accordance with U.S. generally accepted accounting principles. Inflation-indexed bonds are fixed-income securities whose principal value is periodically adjusted upward or downward to the rate of inflation. Interest is accrued based on the principal value, which is adjusted for inflation. Any increase or decrease in the principal amount of an inflation-indexed bond is generally recorded as an increase or decrease in interest income, respectively, even though the adjusted principal is not received until maturity.
The fund may receive proceeds from litigation settlements. Any proceeds received from litigation involving portfolio holdings are reflected in the Statement of Operations in realized gain/loss if the security has been disposed of by the fund or in unrealized gain/loss if the security is still held by the fund. Any other proceeds from litigation not related to portfolio holdings are reflected as other income in the Statement of Operations.
Fees Paid Indirectly – The fund’s custody fee may be reduced according to an arrangement that measures the value of cash deposited with the custodian by the fund. This amount, for the year ended December 31, 2010, is shown as a reduction of total expenses on the Statement of Operations.
Tax Matters and Distributions – The fund intends to qualify as a regulated investment company, as defined under Subchapter M of the Internal Revenue Code, and to distribute all of its taxable income, including realized capital gains. As a result, no provision for federal income tax is required. The fund’s federal tax returns for the prior three fiscal years remain subject to examination by the Internal Revenue Service. Foreign taxes, if any, have been accrued by the fund in the accompanying financial statements.
Distributions to shareholders are recorded on the ex-dividend date. Income and capital gain distributions are determined in accordance with income tax regulations, which may differ from U.S. generally accepted accounting principles. Certain capital accounts in the financial statements are periodically adjusted for permanent differences in order to reflect their tax character. These adjustments have no impact on net assets or net asset value per share. Temporary differences which arise from recognizing certain items of income, expense, gain or loss in different periods for financial statement and tax purposes will reverse at some time in the future. Distributions in excess of net investment income or net realized gains are temporary overdistributions for financial statement purposes resulting from differences in the recognition or classification of income or distributions for financial statement and tax purposes.
Book/tax differences primarily relate to amortization and accretion of debt securities, wash sale loss deferrals, straddle loss deferrals, and derivative transactions.
18
MFS Global Governments Portfolio
Notes to Financial Statements – continued
The tax character of distributions declared to shareholders for the last two fiscal years is as follows:
| | | | | | | | |
| | | 12/31/10 | | | 12/31/09 | |
| Ordinary income (including any short-term capital gains) | | | $52,511 | | | | $4,466,015 | |
| Long-term capital gain | | | 219,059 | | | | — | |
| | | $271,570 | | | | $4,466,015 | |
The federal tax cost and the tax basis components of distributable earnings were as follows:
| | | | |
| As of 12/31/10 | | | | |
| Cost of investments | | | $31,805,617 | |
| Gross appreciation | | | 1,958,808 | |
| Gross depreciation | | | (876,569 | ) |
| Net unrealized appreciation (depreciation) | | | $1,082,239 | |
| Undistributed ordinary income | | | 862,929 | |
| Undistributed long term capital gain | | | 171,440 | |
| Post -October capital loss deferral | | | (96,491 | ) |
| Other temporary differences | | | (266,698 | ) |
Multiple Classes of Shares of Beneficial Interest – The fund offers multiple classes of shares, which differ in their respective distribution and/or service fees. The fund’s income, realized and unrealized gain (loss), and common expenses are allocated to shareholders based on the daily net assets of each class. Dividends are declared separately for each class. Differences in per share dividend rates are generally due to differences in separate class expenses. The fund’s distributions declared to shareholders as reported on the Statements of Changes in Net Assets are presented by class as follows:
| | | | | | | | | | | | | | | | |
| | | From net investment
income | | | From net realized gain on
investments | |
| | | Year ended
12/31/10 | | | Year ended
12/31/09 | | | Year ended
12/31/10 | | | Year ended
12/31/09 | |
| Initial Class | | | $— | | | | $3,886,577 | | | | $246,429 | | | | $— | |
| Service Class | | | — | | | | 579,438 | | | | 25,141 | | | | — | |
| Total | | | $— | | | | $4,466,015 | | | | $271,570 | | | | $— | |
| (3) | | Transactions with Affiliates |
Investment Adviser – The fund has an investment advisory agreement with MFS to provide overall investment management and related administrative services and facilities to the fund. The management fee is computed daily and paid monthly at the following annual rates:
| | | | |
| First $300 million of average daily net assets | | | 0.75% | |
| Average daily net assets in excess of $300 million | | | 0.675% | |
The management fee incurred for the year ended December 31, 2010 was equivalent to an annual effective rate of 0.75% of the fund’s average daily net assets.
The investment adviser has agreed in writing to pay a portion of the fund’s total annual operating expenses, exclusive of interest, taxes, brokerage commissions, and extraordinary expenses, such that the total annual operating expenses of the fund do not exceed 1.25% of the fund’s average daily net assets. MFS’ agreement to limit the fund’s operating expenses is contained in the investment advisory agreement between MFS and the fund and may not be rescinded without shareholder approval. In addition, the investment adviser has voluntarily agreed to pay a portion of the fund’s total operating expenses, exclusive of interest, taxes, brokerage commissions, and extraordinary expenses, such that total operating expenses do not exceed 1.00% annually of the fund’s average daily net assets attributable to Initial Class shares. This voluntary agreement may be changed or rescinded at any time by MFS. For the year ended December 31, 2010, this reduction amounted to $50,433 and is reflected as a reduction of total expenses in the Statement of Operations.
Distributor – MFS Fund Distributors, Inc. (MFD), a wholly-owned subsidiary of MFS, is the distributor of shares of the fund. The Trustees have adopted a distribution plan for the Service Class shares pursuant to Rule 12b-1 under the Investment Company Act of 1940.
The fund’s distribution plan provides that the fund will pay MFD distribution and/or service fees equal to 0.25% per annum of its average daily net assets attributable to Service Class shares as partial consideration for services performed and expenses incurred by MFD and financial intermediaries (including participating insurance companies that invest in the fund to fund variable annuity and variable life insurance contracts, sponsors of qualified retirement and pension plans that invest in the
19
MFS Global Governments Portfolio
Notes to Financial Statements – continued
fund, and affiliates of these participating insurance companies and plan sponsors) in connection with the sale and distribution of the Service Class shares. MFD may subsequently pay all, or a portion, of the distribution and/or service fees to financial intermediaries.
Shareholder Servicing Agent – MFS Service Center, Inc. (MFSC), a wholly-owned subsidiary of MFS, has contracted to provide transfer agent and recordkeeping functions in connection with the issuance, transfer, and redemption of each class of shares of the fund under a Shareholder Servicing Agent Agreement. During the year ended December 31, 2010, the fund did not pay MFSC a fee for this service.
Administrator – MFS provides certain financial, legal, shareholder communications, compliance, and other administrative services to the fund. Under an administrative services agreement, the fund partially reimburses MFS the costs incurred to provide these services. The fund is charged an annual fixed amount of $10,000 plus a fee based on average daily net assets. The administrative services fee incurred for the year ended December 31, 2010 was equivalent to an annual effective rate of 0.0436% of the fund’s average daily net assets.
Trustees’ and Officers’ Compensation – The fund pays compensation to Trustees in the form of a retainer, attendance fees, and additional compensation to the Board chairperson. The fund does not pay compensation directly to officers of the fund who are also officers of the investment adviser, all of whom receive remuneration for their services to the fund from MFS. Certain officers of the fund are officers or directors of MFS, MFD, and MFSC.
Other – This fund and certain other funds managed by MFS (the funds) have entered into services agreements (the Agreements) which provide for payment of fees by the funds to Tarantino LLC and Griffin Compliance LLC in return for the provision of services of an Independent Chief Compliance Officer (ICCO) and Assistant ICCO, respectively, for the funds. The ICCO and Assistant ICCO are officers of the funds and the sole members of Tarantino LLC and Griffin Compliance LLC, respectively. The funds can terminate the Agreements with Tarantino LLC and Griffin Compliance LLC at any time under the terms of the Agreements. MFS has agreed to bear all expenses associated with office space, other administrative support, and supplies provided to the ICCO and Assistant ICCO. For the year ended December 31, 2010, the aggregate fees paid by the fund to Tarantino LLC and Griffin Compliance LLC were $587 and are included in miscellaneous expense on the Statement of Operations.
Purchases and sales of investments, other than purchased option transactions, and short-term obligations, were as follows:
| | | | | | | | |
| | | Purchases | | | Sales | |
| U.S. Government securities | | | $12,074,064 | | | | $7,921,209 | |
| Investments (non-U.S. Government securities) | | | $8,819,770 | | | | $14,642,137 | |
| (5) | | Shares of Beneficial Interest |
The fund’s Declaration of Trust permits the Trustees to issue an unlimited number of full and fractional shares of beneficial interest. Transactions in fund shares were as follows:
| | | | | | | | | | | | | | | | |
| | | Year ended 12/31/10 | | | Year ended 12/31/09 | |
| | | Shares | | | Amount | | | Shares | | | Amount | |
| Shares sold | | | | | | | | | | | | | | | | |
Initial Class | | | 168,578 | | | | $1,826,044 | | | | 242,056 | | | | $2,577,485 | |
Service Class | | | 62,979 | | | | 669,806 | | | | 57,701 | | | | 608,695 | |
| | | 231,557 | | | | $2,495,850 | | | | 299,757 | | | | $3,186,180 | |
| Shares issued to shareholders in reinvestment of distributions | | | | | | | | | | | | | | | | |
Initial Class | | | 23,627 | | | | $246,429 | | | | 401,092 | | | | $3,886,577 | |
Service Class | | | 2,441 | | | | 25,141 | | | | 60,358 | | | | 579,438 | |
| | | 26,068 | | | | $271,570 | | | | 461,450 | | | | $4,466,015 | |
| Shares reacquired | | | | | | | | | | | | | | | | |
Initial Class | | | (483,326 | ) | | | $(5,176,405 | ) | | | (795,387 | ) | | | $(8,483,737 | ) |
Service Class | | | (121,224 | ) | | | (1,280,612 | ) | | | (332,428 | ) | | | (3,463,221 | ) |
| | | (604,550 | ) | | | $(6,457,017 | ) | | | (1,127,815 | ) | | | $(11,946,958 | ) |
| Net change | | | | | | | | | | | | | | | | |
Initial Class | | | (291,121 | ) | | | $(3,103,932 | ) | | | (152,239 | ) | | | $(2,019,675 | ) |
Service Class | | | (55,804 | ) | | | (585,665 | ) | | | (214,369 | ) | | | (2,275,088 | ) |
| | | (346,925 | ) | | | $(3,689,597 | ) | | | (366,608 | ) | | | $(4,294,763 | ) |
20
MFS Global Governments Portfolio
Notes to Financial Statements – continued
The fund and certain other funds managed by MFS participate in a $1.1 billion unsecured committed line of credit, subject to a $1 billion sublimit, provided by a syndication of banks under a credit agreement. Borrowings may be made for temporary financing needs. Interest is charged to each fund, based on its borrowings, generally at a rate equal to the higher of the Federal Reserve funds rate or one month LIBOR plus an agreed upon spread. A commitment fee, based on the average daily, unused portion of the committed line of credit, is allocated among the participating funds at the end of each calendar quarter. In addition, the fund and other funds managed by MFS have established unsecured uncommitted borrowing arrangements with certain banks for temporary financing needs. Interest is charged to each fund, based on its borrowings, at a rate equal to the Federal Reserve funds rate plus an agreed upon spread. For the year ended December 31, 2010, the fund’s commitment fee and interest expense were $384 and $0, respectively, and are included in miscellaneous expense on the Statement of Operations.
21
MFS Global Governments Portfolio
REPORT OF INDEPENDENT REGISTERED PUBLIC ACCOUNTING FIRM
To the Board of Trustees of MFS Variable Insurance Trust II and the Shareholders of
MFS Global Governments Portfolio:
We have audited the accompanying statement of assets and liabilities, including the portfolio of investments, of MFS Global Governments Portfolio (the “Fund”) (one of the portfolios comprising MFS Variable Insurance Trust II) as of December 31, 2010, and the related statement of operations for the year then ended, the statements of changes in net assets for each of the two years in the period then ended, and the financial highlights for each of the five years in the period then ended. These financial statements and financial highlights are the responsibility of the Fund’s management. Our responsibility is to express an opinion on these financial statements and financial highlights based on our audits.
We conducted our audits in accordance with the standards of the Public Company Accounting Oversight Board (United States). Those standards require that we plan and perform the audit to obtain reasonable assurance about whether the financial statements and financial highlights are free of material misstatement. The Fund is not required to have, nor were we engaged to perform, an audit of its internal control over financial reporting. Our audits included consideration of internal control over financial reporting as a basis for designing audit procedures that are appropriate in the circumstances, but not for the purpose of expressing an opinion on the effectiveness of the Fund’s internal control over financial reporting. Accordingly, we express no such opinion. An audit also includes examining, on a test basis, evidence supporting the amounts and disclosures in the financial statements, assessing the accounting principles used and significant estimates made by management, as well as evaluating the overall financial statement presentation. Our procedures included confirmation of securities owned as of December 31, 2010, by correspondence with the custodian and brokers; where replies were not received from brokers, we performed other auditing procedures. We believe that our audits provide a reasonable basis for our opinion.
In our opinion, the financial statements and financial highlights referred to above present fairly, in all material respects, the financial position of MFS Global Governments Portfolio as of December 31, 2010, the results of its operations for the year then ended, the changes in its net assets for each of the two years in the period then ended, and the financial highlights for each of the five years in the period then ended, in conformity with accounting principles generally accepted in the United States of America.
DELOITTE & TOUCHE LLP
Boston, Massachusetts
February 14, 2011
22
MFS Global Governments Portfolio
TRUSTEES AND OFFICERS – IDENTIFICATION AND BACKGROUND
The Trustees and officers of the Trust, as of February 1, 2011, are listed below, together with their principal occupations during the past five years. (Their titles may have varied during that period.) The address of each Trustee and officer is 500 Boylston Street, Boston, Massachusetts 02116.
| | | | | | |
Name, Date of Birth | | Position(s) Held
with Fund | | Trustee/Officer
Since (1) | | Principal Occupations During the Past Five Years and
Other Directorships (2) |
| INTERESTED TRUSTEE | | | | |
David D. Horn (3) (born 6/07/41) | | Trustee | | April 1986 | | Private investor; Sun Life Assurance Company of Canada, Senior Vice President and General Manager for the United States (until 1997); Director (until March 2004) |
| | |
| INDEPENDENT TRUSTEES | | | | |
J. Kermit Birchfield (born 1/08/40) | | Chairman | | May 1997 | | Consultant; Century Partners, Inc. (investments), Director; Displaytech, Inc. (technology), Chairman; Dessin Fournir LLC (furniture manufacturer), Director; Site Watch LLC (software to monitor oil tanks), Managing Director (2006 to present); Juridica Investments (fund investing in judicial matters), Director (2007 to present), Immuno Science, Inc. (medical research), Independent Director (2009 to present), Intermountain Industries, Inc. (oil & gas exploration and production), Director (until February 2009) |
| | | |
Robert C. Bishop (born 1/13/43) | | Trustee | | May 2001 | | AutoImmune, Inc. (pharmaceutical product development), Chairman, President and Chief Executive Officer; Caliper Life Sciences Corp. (laboratory analytical instruments), Chairman; Optobionics Corporation (ophthalmic devices), Director (until 2007); Millipore Corporation (purification/filtration products), Director (until July 2010); Waterstreet Capital (leverage buyouts), Advisory Board (until August 2010) |
| | | |
Frederick H. Dulles (born 3/12/42) | | Trustee | | May 2001 | | Dulles International Law LLC (law firm), Senior Lawyer (since 2009); Juridica Capital Management (US) Inc. (litigation financing), Vice President and General Counsel (since 2009); Dulles Properties LLC (real estate), Broker (since 2008); The Citadel School of Business Administration (education), Adjunct Professor (since 2003); Disher, Hamrick & Myers Residential, Inc. (real estate), Broker (until 2006); Frederick H. Dulles Law Practice (law firm), (until 2006); Charlestown School of Law (education), Adjunct Professor (until 2007); Prudential Carolina Real Estate, (real estate), Broker (until 2008); Free Enterprise Foundation Inc. (research institute), Director & Secretary (until 2008); Ten State International Law PLLP (law firm), Of Counsel (until 2009) |
| | | |
Marcia A. Kean (born 6/30/48) | | Trustee | | April 2005 | | Feinstein Kean Healthcare (consulting), Chief Executive Officer |
| | | |
Ronald G. Steinhart (born 6/15/40) | | Trustee | | May 2001 | | Private investor; Penske Automotive Group (automotive retailer), Director; Animal Health International, Inc. (animal health products), Director (since 2007); Texas Industries (concrete/aggregates/cement), Director (since 2007); Susser Holdings Corporation (retail convenience stores and distributor of wholesale motor fuel), Director (since 2009); Prentiss Properties Trust (real estate investment trust), Director (until 2006); Penson Worldwide, Inc. (securities clearance), Director (until 2008) |
| | | |
Haviland Wright (born 7/21/48) | | Trustee | | May 2001 | | X-Change Corp. (multi-media web services), Director (since 2010); Nano Loa Inc. (liquid crystal displays), Director (until 2009); Profitability of Hawaii (software), Chief Development Officer (until 2010); Elixir Technologies Corporation (software), Director (until 2010) |
| | | |
| OFFICERS | | | | | | |
Maria F. DiOrioDwyer (4)
(born 12/01/58) | | President | | November 2005 | | Massachusetts Financial Services Company, Executive Vice President and Chief Regulatory Officer; Chief Compliance Officer (since December 2006) |
| | | |
| Christopher R. Bohane (4) (born 1/18/74) | | Assistant Secretary and Assistant Clerk | | July 2005 | | Massachusetts Financial Services Company, Vice President and Senior Counsel |
| | | |
John M. Corcoran (4) (born 4/13/65) | | Treasurer | | October 2008 | | Massachusetts Financial Services Company, Senior Vice President (since October 2008); State Street Bank and Trust (financial services provider), Senior Vice President, (until September 2008) |
| | | |
Ethan D. Corey (4) (born 11/21/63) | | Assistant Secretary and Assistant Clerk | | July 2005 | | Massachusetts Financial Services Company, Senior Vice President and Associate General Counsel |
| | | |
David L. DiLorenzo (4) (born 8/10/68) | | Assistant Treasurer | | July 2005 | | Massachusetts Financial Services Company, Vice President |
| | | |
Timothy M. Fagan (4) (born 7/10/68) | | Assistant Secretary and Assistant Clerk | | September 2005 | | Massachusetts Financial Services Company, Vice President and Senior Counsel |
| | | |
Mark D. Fischer (4) (born 10/27/70) | | Assistant Treasurer | | July 2005 | | Massachusetts Financial Services Company, Vice President |
23
MFS Global Governments Portfolio
Trustees and Officers – continued
| | | | | | |
Name, Date of Birth | | Position(s) Held
with Fund | | Trustee/Officer
Since (1) | | Principal Occupations During the Past Five Years and
Other Directorships (2) |
Robyn L. Griffin (born 7/04/75) | | Assistant Independent Chief Compliance Officer | | August 2008 | | Griffin Compliance LLC (provider of compliance services), Principal (since August 2008); State Street Corporation (financial services provider), Mutual Fund Administration Assistant Vice President (October 2006 – July 2008); Liberty Mutual Group (insurance), Personal Market Assistant Controller (April 2006 – October 2006); Deloitte & Touche LLP (professional services firm), Senior Manager (prior to April 2006) |
| | | |
Brian E. Langenfeld (4) (born 3/07/73) | | Assistant Secretary and Assistant Clerk | | May 2006 | | Massachusetts Financial Services Company, Vice President and Senior Counsel (since May 2006); John Hancock Advisers, LLC, Assistant Vice President and Counsel (until April 2006) |
| | | |
Ellen Moynihan (4) (born 11/13/57) | | Assistant Treasurer | | May 1997 | | Massachusetts Financial Services Company, Senior Vice President |
| | | |
Susan S. Newton (4) (born 3/07/50) | | Assistant Secretary and Assistant Clerk | | May 2005 | | Massachusetts Financial Services Company, Senior Vice President and Associate General Counsel |
| | | |
Susan A. Pereira (4)
(born 11/05/70) | | Assistant Secretary and Assistant Clerk | | July 2005 | | Massachusetts Financial Services Company, Vice President and Senior Counsel |
| | | |
Mark N. Polebaum (4) (born 5/01/52) | | Secretary and Clerk | | February 2006 | | Massachusetts Financial Services Company, Executive Vice President, General Counsel and Secretary (since January 2006); Wilmer Cutler Pickering Hale and Dorr LLP (law firm), Partner (until January 2006) |
| | | |
Frank L. Tarantino (born 3/07/44) | | Independent Chief Compliance Officer | | September 2004 | | Tarantino LLC (provider of compliance services), Principal |
| | | |
Richard S. Weitzel (4) (born 7/16/70) | | Assistant Secretary and Assistant Clerk | | October 2007 | | Massachusetts Financial Services Company, Vice President and Assistant General Counsel |
| | | |
James O. Yost (4) (born 6/12/60) | | Assistant Treasurer | | April 1992 | | Massachusetts Financial Services Company, Senior Vice President |
| (1) | Date first appointed to serve as Trustee/Officer of an MFS fund or a Compass variable account. Each Trustee has served continuously since appointment. For the period March 2008 until October 2008, Ms. DiOrioDwyer served as Treasurer of the Funds. |
| (2) | Directorships or trusteeships of companies required to report to the Securities and Exchange Commission (i.e., “public companies”). |
| (3) | “Interested person” of the Trust, within the meaning of the Investment Company Act of 1940 (referred to as the 1940 Act), which is the principal federal law governing investment companies like the Trust, as a result of position with Sun Life of Canada (U.S.). The address of Sun Life of Canada (U.S.) is One Sun Life Executive Park, Wellesley Hills, Massachusetts 02481. |
| (4) | “Interested person” of MFS within the meaning of the 1940 Act. The address of MFS is 500 Boylston Street, Boston, Massachusetts 02116. |
The Trust does not hold annual meetings for the purpose of electing Trustees, and Trustees are not elected for fixed terms. Each Trustee and officer holds office until his or her successor is chosen and qualified, or until his or her earlier death, resignation, retirement or removal.
All Trustees currently serve as Trustees of the Trust and have served in that capacity since originally elected or appointed. All of the Trustees are also Managers of the Compass Variable Accounts. The executive officers of the Trust hold similar offices for the Compass Variable Accounts and other funds in the MFS fund complex. As of January 1, 2011, each Trustee serves as a Trustee or Manager of 31 Accounts/Portfolios.
24
MFS Global Governments Portfolio
Trustees and Officers – continued
The Statement of Additional Information contains further information about the Trustees and is available without charge upon request by calling 1-800-752-7215.
| | |
Investment Adviser
Massachusetts Financial Services Company 500 Boylston Street, Boston, MA 02116-3741 | | Custodian State Street Bank and Trust 1 Lincoln Street, Boston, MA 02111-2900 |
Distributor
MFS Fund Distributors, Inc. 500 Boylston Street, Boston, MA 02116-3741 | | Independent Registered Public Accounting Firm Deloitte & Touche LLP 200 Berkeley Street, Boston, MA 02116 |
Portfolio Managers Matthew Ryan Erik Weisman | | |
25
MFS Global Governments Portfolio
BOARD REVIEW OF INVESTMENT ADVISORY AGREEMENT
The Investment Company Act of 1940 requires that both the full Board of Trustees and a majority of the non-interested (“independent”) Trustees, voting separately, annually approve the continuation of the investment advisory agreement between MFS Variable Insurance Trust II (the “Trust”) and Massachusetts Financial Services Company (“MFS”) on behalf of the Fund. The Trustees consider matters bearing on the Fund and the advisory arrangement at their meetings throughout the year, including a review of performance data at each regular meeting. In addition, the independent Trustees met in person in May and again in July 2010 (“contract review meetings”) for the specific purpose of considering whether to approve the continuation of the investment advisory agreement for the Fund. The independent Trustees were assisted in their evaluation of the investment advisory agreement by independent legal counsel, from whom they received separate legal advice and with whom they met separately from MFS management during various contract review meetings. The independent Trustees were also assisted in this process by the Fund’s Independent Chief Compliance Officer, a full-time senior officer appointed by and reporting to the independent Trustees.
In connection with their deliberations, the Trustees, including the independent Trustees, considered such information and factors as they believed, in light of the legal advice furnished to them and their own business judgment, to be relevant. The investment advisory agreement was considered separately for the Fund, although the Trustees also took into account the common interests of all Funds in the Trust in their review. As described below, the Trustees considered the nature, quality, and extent of the various investment advisory, administrative, and shareholder services performed by MFS under the existing investment advisory agreement and other arrangements with the Trust.
In connection with their contract review meetings, the Trustees received and relied upon materials which included, among other items: (i) information provided by Lipper Inc. (“Lipper”) on the investment performance of the Fund for various time periods ended December 31, 2009, compared to the investment performance of a group of funds with substantially similar investment classifications/objectives (the “Lipper performance universe”), (ii) information provided by Lipper on the Fund’s advisory fees and other expenses compared to the advisory fees and other expenses of comparable funds identified by Lipper (the “Lipper expense group”), (iii) information provided by MFS on the advisory fees of comparable portfolios of its other clients, including institutional separate account and other clients, (iv) information as to whether, and to what extent applicable, expense waivers, reimbursements or fee “breakpoints” are observed for the Fund, (v) information regarding MFS’ financial results and financial condition, including MFS’ and certain of its affiliates’ estimated profitability from services performed for the Fund, (vi) MFS’ views regarding the outlook for the mutual fund industry and its strategic business plans, (vii) descriptions of various functions performed by MFS for the Trust, such as compliance monitoring and portfolio trading practices, and (viii) information regarding the overall organization of MFS, including information about MFS’ senior management and other personnel providing investment advisory, administrative and other services to the Fund. The comparative performance, fee and expense information prepared and provided by Lipper was not independently verified, and the independent Trustees did not independently verify any information provided to them by MFS.
The Trustees’ conclusion as to the continuation of the investment advisory agreement was based on comprehensive consideration of all information provided to the Trustees and was not the result of any single factor. Some of the factors that figured particularly in the Trustees’ deliberations are described below for the Fund, while individual Trustees may have given different weight to various factors and evaluated the information presented as a whole differently than another individual Trustee. The Trustees recognized that the fee arrangements for the Fund reflect years of review and discussion between the independent Trustees and MFS, that certain aspects of such arrangements may receive greater scrutiny in some years than others, and that the Trustees’ conclusions may be based, in part, on their consideration of these same arrangements during the course of the year and in prior years.
Based on information provided by Lipper, the Trustees compared the Fund’s total return investment performance to the performance of the Lipper performance universe over various time periods. The Trustees placed particular emphasis on the total return performance of the Fund’s Initial Class shares in comparison to the performance of funds in its Lipper performance universe over the one-, three- and five-year periods ended December 31, 2009. The Trustees did not rely on performance results for more recent periods, including those shown elsewhere in this report.
The Trustees noted the performance of the Fund’s Initial Class shares was in the 5th quintile relative to the other funds in the Lipper performance universe for the one-year period (the 1st quintile being the best performers and the 5th quintile being the worst performers). The total return performance of the Fund was in the 2nd quintile for the three-year period and the 4th quintile for the five-year period ended December 31, 2009, relative to the Lipper performance universe. Based on the nature and quality of services provided by MFS, the Board of Trustees concluded that the Fund’s performance was adequate.
26
MFS Global Governments Portfolio
Board Review of Investment Advisory Agreement – continued
In the course of their deliberations, the Trustees took into account information provided by MFS during contract review meetings, as well as during investment review meetings conducted with portfolio management personnel during the course of the year.
In assessing the reasonableness of the Fund’s advisory fee, the Trustees considered, among other information, the Fund’s advisory fee and the total expense ratio of the Fund’s Initial Class shares as a percentage of average daily net assets, compared to the advisory fee and total expense ratios of its peer group of funds based on information provided by Lipper. The Trustees also considered the advisory fees charged by MFS to institutional accounts. In comparing these fees, the Trustees considered the generally broader scope of services provided by MFS to the Trust than those provided to institutional accounts. The Trustees also considered the higher demands placed on MFS’ investment personnel and trading infrastructure as a result of the daily cash in-flows and out-flows of the Fund, and the impact on MFS and related expenses due to the more extensive regulatory regime to which the Fund is subject, compared to institutional accounts.
In considering the fees, the Trustees noted from the Lipper data that the Fund’s effective advisory fee rate and total expense ratio were each approximately at the median of such fees and expenses of funds in the Lipper expense group. In addition, the Trustees accepted MFS’ offer to continue the expense limitation for the Fund. The Trustees further concluded that the existing breakpoint was sufficient to allow the Fund to benefit from economies of scale as its assets grow. The Trustees concluded that the fees were reasonable in light of the nature and quality of services provided.
The Trustees also considered information prepared by MFS relating to its costs and profits with respect to the Fund and other investment companies and accounts advised by MFS, as well as MFS’ methodologies used to determine and allocate its costs to the Fund and other accounts and products for purposes of estimating profitability.
After reviewing these and other factors described below, the Trustees concluded that the advisory fees charged to the Fund represent reasonable compensation in light of the nature and quality of the services being provided by MFS.
In addition, the Trustees considered MFS’ resources and related efforts to continue to retain, attract and motivate capable personnel to serve the Fund. The Trustees also considered the financial resources of MFS and its parent, Sun Life Financial Inc. The Trustees further considered any advantages and possible disadvantages of having an adviser which also serves other investment companies as well as institutional accounts.
The Trustees also considered the nature, quality, cost, and extent of administrative, transfer agency, and distribution services provided to the Fund by MFS and its affiliates under agreements and plans other than the investment advisory agreement, including the 12b-1 fees the Fund pays to MFS Fund Distributors, Inc., an affiliate of MFS. The Trustees also considered the nature, extent and quality of certain other services MFS performs or arranges on the Fund’s behalf, which may include securities lending programs, directed expense payment programs, class action recovery programs, and MFS’ interaction with third-party service providers, principally custodians and sub-custodians. The Trustees concluded that the various non-advisory services provided by MFS and its affiliates on behalf of the Fund were satisfactory. The Trustees also considered the benefits to MFS from the use of the Fund’s portfolio brokerage commissions to pay for investment research and various other factors. Additionally, the Trustees considered so-called “fall-out benefits” to MFS such as reputational value derived from serving as investment manager to the Trust, and determined that any such benefits derived by MFS were reasonable and fair.
Based on their evaluation of factors that they deemed to be material, including those factors described above, the Board of Trustees, including a majority of the independent Trustees, concluded that the investment advisory agreement should be continued for an additional one-year period, commencing September 1, 2010.
A discussion regarding the Board’s most recent review and renewal of the fund’s Investment Advisory Agreement with MFS is available by clicking on the fund’s name under “Variable Insurance Portfolios — VIT II” in the “Products and Performance” section of the MFS Web site (mfs.com).
27
MFS Global Governments Portfolio
PROXY VOTING POLICIES AND INFORMATION
A general description of the MFS funds’ proxy voting policies and procedures is available without charge, upon request, by calling 1-800-225-2606, by visiting the Proxy Voting section of mfs.com or by visiting the SEC’s Web site at http://www.sec.gov.
Information regarding how the fund voted proxies relating to portfolio securities during the most recent twelve-month period ended June 30 is available without charge by visiting the Proxy Voting section of mfs.com or by visiting the SEC’s Web site at http://www.sec.gov.
QUARTERLY PORTFOLIO DISCLOSURE
The fund will file a complete schedule of portfolio holdings with the Securities and Exchange Commission (the Commission) for the first and third quarters of each fiscal year on Form N-Q. The fund’s Form N-Q may be reviewed and copied at the:
Public Reference Room
Securities and Exchange Commission
100 F Street, NE, Room 1580
Washington, D.C. 20549
Information on the operation of the Public Reference Room may be obtained by calling the Commission at 1-800-SEC-0330. The fund’s Form N-Q is available on the EDGAR database on the Commission’s Internet Web site at http://www.sec.gov, and copies of this information may be obtained, upon payment of a duplicating fee, by electronic request at the following e-mail address: publicinfo@sec.gov or by writing the Public Reference Section at the above address.
FURTHER INFORMATION
From time to time, MFS may post important information about the fund or the MFS funds on the MFS web site (mfs.com). This information is available by visiting the “News & Commentary” section of mfs.com or by clicking on the fund’s name under “Variable Insurance Portfolios — VIT II” in the “Products and Performance” section of mfs.com.
FEDERAL TAX INFORMATION (unaudited)
The following information is provided pursuant to provisions of the Internal Revenue Code.
The fund designates $241,000 as capital gain dividends paid during the fiscal year.
28
��
MFS Global Governments Portfolio
MFS® PRIVACY NOTICE
Privacy is a concern for every investor today. At MFS Investment Management® and the MFS funds, we take this concern very seriously. We want you to understand our policies about the investment products and services that we offer, and how we protect the nonpublic personal information of investors who have a direct relationship with us and our wholly owned subsidiaries.
Throughout our business relationship, you provide us with personal information. We maintain information and records about you, your investments, and the services you use. Examples of the nonpublic personal information we maintain include
| | Ÿ | | data from investment applications and other forms |
| | Ÿ | | share balances and transactional history with us, our affiliates, or others |
| | Ÿ | | facts from a consumer reporting agency |
We do not disclose any nonpublic personal information about our customers or former customers to anyone, except as permitted by law. We may share nonpublic personal information with third parties or certain of our affiliates in connection with servicing your account or processing your transactions. We may share information with companies or financial institutions that perform marketing services on our behalf or with other financial institutions with which we have joint marketing arrangements, subject to any legal requirements.
Authorization to access your nonpublic personal information is limited to appropriate personnel who provide products, services, or information to you. We maintain physical, electronic, and procedural safeguards to help protect the personal information we collect about you.
If you have any questions about the MFS privacy policy, please call 1-800-225-2606 any business day.
Note: If you own MFS products or receive MFS services in the name of a third party such as a bank or broker-dealer, their privacy policy may apply to you instead of ours.
29

MFS® HIGH YIELD PORTFOLIO
The report is prepared for the general information of contract owners. It is authorized for distribution to prospective investors only when preceded or accompanied by a current prospectus.
NOT FDIC INSURED Ÿ MAY LOSE VALUE Ÿ NO BANK GUARANTEE Ÿ NOT A DEPOSIT Ÿ NOT INSURED BY ANY FEDERAL GOVERNMENT AGENCY OR NCUA/NCUSIF
MFS High Yield Portfolio
LETTER FROM THE CEO

Dear Contract Owners:
After an extended rebound in the financial markets, uncertainty returned in 2010 as investors began to question the durability of the recovery for global economies and markets. That uncertainty led to increased risk aversion, especially as investors saw the eurozone struggle with the debt woes of many of its members. In September, the U.S. Federal Reserve Board’s promises to further loosen monetary policy helped assuage market fears and drive asset prices off their recent lows. A combination of solid earnings and improving economic data gave an additional boost to investor sentiment. As we enter 2011, we are cautiously optimistic that economic growth will continue to improve and that the global economies will recover from the shocks of the past few years. We expect the pace of recovery worldwide will be uneven and volatile.
As always, we continue to be mindful of the many economic challenges faced at the local, national, and international levels. It is in times such as these that we want to remind investors of the merits of maintaining a long-term view, adhering to basic investing principles such as asset allocation and diversification, and working closely with their advisors to research and identify appropriate investment opportunities.
Respectfully,

Robert J. Manning
Chairman and Chief Executive Officer
MFS Investment Management®
February 14, 2011
The opinions expressed in this letter are subject to change, may not be relied upon for investment advice, and no forecasts can be guaranteed.
1
MFS High Yield Portfolio
PORTFOLIO COMPOSITION
Portfolio structure (i)
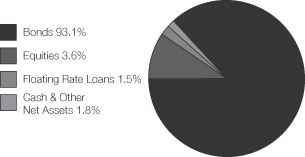
| | | | |
| Top five industries (i) | | | | |
| Broadcasting | | | 7.1% | |
| Medical & Health Technology & Services | | | 6.4% | |
| Energy-Independent | | | 6.3% | |
| Gaming & Lodging | | | 5.3% | |
| Telecommunications – Wireless | | | 4.4% | |
| | | | |
| Composition including fixed income credit quality (a)(i) | | | | |
| A | | | 0.2% | |
| BBB | | | 3.8% | |
| BB | | | 29.0% | |
| B | | | 44.2% | |
| CCC | | | 15.6% | |
| CC | | | 0.6% | |
| C | | | 0.1% | |
| D (o) | | | 0.0% | |
| Other Fixed Income (NR) | | | 1.1% | |
| Non-Fixed Income (NR) | | | 3.6% | |
| Cash & Other | | | 1.8% | |
| | | | |
| Portfolio facts (i) | | | | |
| Average Duration (d) | | | 4.3 | |
| Average Effective Maturity (m) | | | 7.2 yrs. | |
| (a) | The rating categories include debt securities and fixed-income structured products where these have long-term public ratings. All ratings are assigned in accordance with the following hierarchy: If a security is rated by Moody’s, then that rating is used; if not rated by Moody’s, then a Standard & Poor’s rating is used; if not rated by S&P, then a Fitch rating is used. Ratings from Moody’s are shown in the S&P and Fitch scale (e.g., AAA). All ratings are subject to change. Other Fixed Income (NR) includes unrated long-term fixed income securities, interest rate swaps and fixed income futures. Non-Fixed Income (NR) includes equity securities (including convertible bonds and equity derivatives) and commodities. Cash & Other includes cash, other assets less liabilities, offsets to derivative positions, and short-term securities. The fund may not hold all of these instruments. |
| (d) | Duration is a measure of how much a bond’s price is likely to fluctuate with general changes in interest rates, e.g., if rates rise 1.00%, a bond with a 5-year duration is likely to lose about 5.00% of its value due to the interest rate move. |
| (i) | For purposes of this presentation, the components include the market value of securities, and reflect the impact of the equivalent exposure of derivative positions, if applicable. These amounts may be negative from time to time. The bond component will include any accrued interest amounts. Equivalent exposure is a calculated amount that translates the derivative position into a reasonable approximation of the amount of the underlying asset that the portfolio would have to hold at a given point in time to have the same price sensitivity that results from the portfolio’s ownership of the derivative contract. When dealing with derivatives, equivalent exposure is a more representative measure of the potential impact of a position on portfolio performance than market value. Where the fund holds convertible bonds, these are treated as part of the equity portion of the portfolio. |
| (m) | In determining an instrument’s effective maturity for purposes of calculating the fund’s dollar-weighted average effective maturity, MFS uses the instrument’s stated maturity or, if applicable, an earlier date on which MFS believes it is probable that a maturity-shortening device (such as a put, pre-refunding or prepayment) will cause the instrument to be repaid. Such an earlier date can be substantially shorter than the instrument’s stated maturity. |
Percentages are based on net assets as of 12/31/10, unless otherwise noted.
The portfolio is actively managed and current holdings may be different.
2
MFS High Yield Portfolio
MANAGEMENT REVIEW
Summary of Results
For the twelve months ended December 31, 2010, Initial Class shares of the MFS High Yield Portfolio (the “fund”) provided a total return of 15.53%, while Service Class shares of the fund provided a total return of 15.17%. These compare with a return of 15.12% for the fund’s benchmark, the Barclays Capital U.S. High-Yield Corporate Bond Index.
Market Environment
The first quarter of the reporting period witnessed a continuation of the financial market and macroeconomic rebounds that had begun in early 2009. These recoveries in global activity and asset valuations were generally synchronized around the world, led importantly by emerging Asian economies, but broadening to include most of the global economy to varying degrees. Primary drivers of the recoveries included an unwinding of the inventory destocking that took place earlier, the production of manufacturing and capital goods, as well as massive fiscal and monetary stimulus.
During most of the remainder of the period, heightened risk surrounding the public-debt profiles of several of the peripheral European countries impaired market sentiment. At the same time, the improving trend in global macroeconomic data began to weaken somewhat. These two dynamics caused many asset prices to retrench significantly, as many questioned the durability of the global recovery.
Towards the end of the period, the U.S. Federal Reserve led markets to believe that further monetary loosening would be forthcoming if macroeconomic activity did not show signs of improvement. The prospects for more easing by the Fed improved market sentiment and drove risk-asset prices markedly higher. However, in a text-book case of “buy the rumor, sell the fact,” the weeks following the early November announcement of further quantitative easing saw a sell-off in U.S. Treasury bonds. This rise in Treasury yields occurred despite risk-off behavior in equities and credit markets (which would normally result in Treasury yield compression), and appears to have been the result of a few factors: signs of improved U.S. and global economic activity; opposition to quantitative easing from some quarters; and crowded long positions in U.S. Treasuries. The December agreement on an expansionary U.S. fiscal package also boosted sentiment, leading markets to reach near-term highs in risky asset valuations toward year end.
Contributors to Performance
Relative to the Barclays Capital U.S. High-Yield Corporate Bond Index, security selection was a key contributor to the fund’s outperformance during the reporting period. Top individual contributors during the reporting period included the fund’s debt holdings of television station operator Local TV Finance LLC and television station holding company Newport Television LLC.
The fund’s greater relative exposure to “B” and “BBB” (r) rated securities also contributed to performance as credit spreads narrowed and bonds in these credit quality sectors outperformed higher-quality issues over the reporting period.
The fund’s return from yield, which was greater than that of the benchmark, was another positive factor for relative performance.
Detractors from Performance
The fund’s lower exposure to “CCC” rated securities detracted from performance as bonds in this credit quality segment outperformed higher-quality issues.
During the reporting period, the fund’s shorter duration (d) stance was another negative factor for relative performance.
Among individual securities, the fund’s holdings of power generation company Texas Competitive Electric Holdings were among the fund’s top relative detractors for the reporting period. Debt holdings of publishing company American Media and resorts operators Green Valley Ranch Gaming, LLC and Station Casinos also hurt relative returns.
Respectfully,
| | |
| John Addeo | | David Cole |
| Portfolio Manager | | Portfolio Manager |
| (d) | Duration is a measure of how much a bond’s price is likely to fluctuate with general changes in interest rates, e.g., if rates rise 1.00%, a bond with a 5-year duration is likely to lose about 5.00% of its value. |
| (r) | Bonds rated “BBB”, “Baa”, or higher are considered investment grade; bonds rated “BB”, “Ba”, or below are considered non-investment grade. The primary source for bond quality ratings is Moody’s Investors Service. If not available, ratings by Standard & Poor’s are used, else ratings by Fitch, Inc. For securities which are not rated by any of the three agencies, the security is considered Not Rated. |
3
MFS High Yield Portfolio
Management Review – continued
The views expressed in this report are those of the portfolio managers only through the end of the period of the report as stated on the cover and do not necessarily reflect the views of MFS or any other person in the MFS organization. These views are subject to change at any time based on market or other conditions, and MFS disclaims any responsibility to update such views. These views may not be relied upon as investment advice or an indication of trading intent on behalf of any MFS portfolio. References to specific securities are not recommendations of such securities, and may not be representative of any MFS portfolio’s current or future investments.
4
MFS High Yield Portfolio
PERFORMANCE SUMMARY THROUGH 12/31/10
The following chart illustrates the historical performance of the fund in comparison to its benchmark(s). Benchmarks are unmanaged and may not be invested in directly. Benchmark returns do not reflect any fees or expenses. The performance of other share classes will be greater than or less than that of the class depicted below. (See Notes to Performance Summary.)
Performance data shown represents past performance and is no guarantee of future results. Investment return and principal value fluctuate so your units, when sold, may be worth more or less than the original cost; current performance may be lower or higher than quoted. The performance shown does not reflect the deduction of taxes, if any, that a contract holder would pay on fund distributions or the redemption of contract units. The returns for the fund shown also do not reflect the deduction of expenses associated with variable products, such as mortality and expense risk charges, separate account charges, and sales charges imposed by the insurance company separate accounts. Such expenses would reduce the overall returns shown.
Growth of a Hypothetical $10,000 Investment
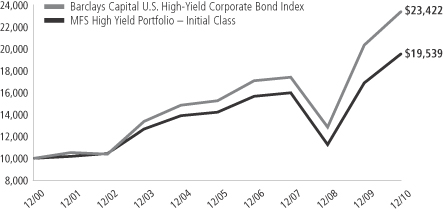
Total Returns through 12/31/10
Average annual total returns
| | | | | | | | | | | | | | |
| | | Share class | | Class inception date | | 1-yr | | 5-yr | | 10-yr | | Life (t) | | |
| | | Initial Class | | 6/12/85 | | 15.53% | | 6.57% | | 6.93% | | N/A | | |
| | | Service Class | | 8/24/01 | | 15.17% | | 6.31% | | N/A | | 6.89% | | |
Comparative benchmark
| | | | | | | | | | | | | | |
| | | Barclays Capital U.S. High-Yield Corporate Bond Index (f) | | 15.12% | | 8.91% | | 8.88% | | N/A | | |
| (f) | Source: FactSet Research Systems Inc. |
| (t) | For the period from the class inception date through the stated period end (for those share classes with less than 10 years of performance history). No comparative benchmark performance information is provided for “life” periods. (See Notes to Performance Summary.) |
Benchmark Definition
Barclays Capital U.S. High-Yield Corporate Bond Index – a market capitalization-weighted index that measures the performance of non-investment grade, fixed rate debt. Eurobonds and debt issues from countries designated as emerging markets (e.g., Argentina, Brazil, Venezuela, etc.) are excluded.
It is not possible to invest directly in an index.
Notes to Performance Summary
Average annual total return represents the average annual change in value for each share class for the periods presented. Life returns are presented where the share class has less than 10 years of performance history and represent the average annual total return from the class inception date to the stated period end date. As the fund’s share classes may have different inception dates, the life returns may represent different time periods and may not be comparable. As a result, no comparative benchmark performance information is provided for life periods.
5
MFS High Yield Portfolio
Performance Summary – continued
Performance results reflect any applicable expense subsidies and waivers in effect during the periods shown. Without such subsidies and waivers the fund’s performance results would be less favorable. Please see the prospectus and financial statements for complete details. All results are historical and assume the reinvestment of any dividends and capital gains distributions.
From time to time the fund may receive proceeds from litigation settlements, without which performance would be lower.
6
MFS High Yield Portfolio
EXPENSE TABLE
Fund Expenses Borne by the Contract Holders During the Period,
July 1, 2010 through December 31, 2010
As a contract holder of the fund, you incur ongoing costs, including management fees; distribution and/or service (12b-1) fees; and other fund expenses. This example is intended to help you understand your ongoing costs (in dollars) of investing in the fund and to compare these costs with the ongoing costs of investing in other mutual funds.
The example is based on an investment of $1,000 invested at the beginning of the period and held for the entire period July 1, 2010 through December 31, 2010.
Actual Expenses
The first line for each share class in the following table provides information about actual account values and actual expenses. You may use the information in this line, together with the amount you invested, to estimate the expenses that you paid over the period. Simply divide your account value by $1,000 (for example, an $8,600 account value divided by $1,000 = 8.6), then multiply the result by the number in the first line under the heading entitled “Expenses Paid During Period” to estimate the expenses you paid on your account during this period.
Hypothetical Example for Comparison Purposes
The second line for each share class in the following table provides information about hypothetical account values and hypothetical expenses based on the fund’s actual expense ratio and an assumed rate of return of 5% per year before expenses, which is not the fund’s actual return. The hypothetical account values and expenses may not be used to estimate the actual ending account balance or expenses you paid for the period. You may use this information to compare the ongoing costs of investing in the fund and other funds. To do so, compare this 5% hypothetical example with the 5% hypothetical examples that appear in the shareholder reports of the other funds.
Please note that the expenses shown in the table are meant to highlight the fund’s ongoing costs only and do not take into account the fees and expenses imposed under the variable contracts through which your investment in the fund is made. Therefore, the second line for each share class in the table is useful in comparing ongoing costs associated with an investment in vehicles (such as the fund) which fund benefits under variable annuity and variable life insurance contracts and to qualified pension and retirement plans only, and will not help you determine the relative total costs of investing in the fund through variable annuity and variable life insurance contracts. If the fees and expenses imposed under the variable contracts were included, your costs would have been higher.
| | | | | | | | | | | | | | | | | | |
| Share Class | | | | Annualized
Expense Ratio | | | Beginning
Account Value
7/01/10 | | | Ending
Account Value
12/31/10 | | | Expenses Paid
During Period (p)
7/01/10-12/31/10 | |
| Initial Class | | Actual | | | 0.82% | | | | $1,000.00 | | | | $1,103.70 | | | | $4.35 | |
| | Hypothetical (h) | | | 0.82% | | | | $1,000.00 | | | | $1,021.07 | | | | $4.18 | |
| Service Class | | Actual | | | 1.07% | | | | $1,000.00 | | | | $1,104.67 | | | | $5.68 | |
| | Hypothetical (h) | | | 1.07% | | | | $1,000.00 | | | | $1,019.81 | | | | $5.45 | |
| (h) | 5% class return per year before expenses. |
| (p) | Expenses paid is equal to each class’ annualized expense ratio, as shown above, multiplied by the average account value over the period, multiplied by the number of days in the period, divided by the number of days in the year. |
7
MFS High Yield Portfolio
PORTFOLIO OF INVESTMENTS – 12/31/10
The Portfolio of Investments is a complete list of all securities owned by your fund. It is categorized by broad-based asset classes.
| | | | | | | | |
| Issuer | | Shares/Par | | | Value ($) | |
| | | | | | | | |
| BONDS – 92.2% | | | | | | | | |
| Aerospace – 1.4% | | | | | | | | |
| Alliant Techsystems, Inc., 6.875%, 2020 | | $ | 115,000 | | | $ | 118,306 | |
| BE Aerospace, Inc., 8.5%, 2018 | | | 620,000 | | | | 678,900 | |
| Bombardier, Inc., 7.5%, 2018 (n) | | | 935,000 | | | | 1,002,788 | |
| Bombardier, Inc., 7.45%, 2034 (n) | | | 160,000 | | | | 156,800 | |
| Hawker Beechcraft Acquisition Co. LLC, 8.5%, 2015 | | | 1,016,000 | | | | 754,380 | |
| Oshkosh Corp., 8.25%, 2017 | | | 400,000 | | | | 435,000 | |
| | | | | | | | |
| | | | | | $ | 3,146,174 | |
| | | | | | | | |
| Airlines – 0.1% | | | | | | | | |
| Continental Airlines, Inc., 6.748%, 2018 | | $ | 113,178 | | | $ | 112,329 | |
| | | | | | | | |
| Apparel Manufacturers – 0.6% | | | | | | | | |
| Hanesbrands, Inc., 8%, 2016 | | $ | 605,000 | | | $ | 648,863 | |
| Phillips-Van Heusen Corp., 7.375%, 2020 | | | 655,000 | | | | 695,937 | |
| | | | | | | | |
| | | | | | $ | 1,344,800 | |
| | | | | | | | |
| Asset-Backed & Securitized – 1.7% | | | | | | | | |
| Airlie LCDO Ltd., CDO, FRN, 2.2%, 2011 (a)(p)(z) | | $ | 717,270 | | | $ | 315,599 | |
| Anthracite Ltd., CDO, 6%, 2037 (z) | | | 1,300,000 | | | | 390,000 | |
| Arbor Realty Mortgage Securities, CDO, FRN, 2.589%, 2038 (z) | | | 577,317 | | | | 75,051 | |
| Babson Ltd., CLO, “D”, FRN, 1.789%, 2018 (n) | | | 670,000 | | | | 520,925 | |
| Citigroup Commercial Mortgage Trust, FRN, 5.697%, 2049 | | | 952,699 | | | | 435,135 | |
| CWCapital Cobalt Ltd., CDO, 6.23%, 2045 (a)(p)(z) | | | 1,075,028 | | | | 21,501 | |
| CWCapital Cobalt Ltd., CDO, “F”, FRN, 1.588%, 2050 (z) | | | 508,349 | | | | 10,167 | |
| First Union National Bank Commercial Mortgage Trust, 6.75%, 2032 | | | 855,000 | | | | 828,953 | |
| JPMorgan Chase Commercial Mortgage Securities Corp., FRN, 6.06%, 2051 | | | 690,000 | | | | 319,835 | |
| Merrill Lynch Mortgage Trust, “B”, FRN, 5.825%, 2050 | | | 690,000 | | | | 347,322 | |
| Merrill Lynch/Countrywide Commercial Mortgage Trust, FRN, 5.747%, 2050 | | | 404,000 | | | | 345,596 | |
| Wachovia Bank Commercial Mortgage Trust, FRN, 5.753%, 2047 | | | 557,306 | | | | 106,704 | |
| Wachovia Credit, CDO, FRN, 1.652%, 2026 (z) | | | 376,000 | | | | 131,600 | |
| | | | | | | | |
| | | | | | $ | 3,848,388 | |
| | | | | | | | |
| Automotive – 2.4% | | | | | | | | |
| Accuride Corp., 9.5%, 2018 (n) | | $ | 610,000 | | | $ | 660,325 | |
| Allison Transmission, Inc., 11%, 2015 (n) | | | 610,000 | | | | 664,900 | |
| Ford Motor Credit Co. LLC, 12%, 2015 | | | 2,826,000 | | | | 3,554,936 | |
| General Motors Corp., 7.125%, 2013 (d) | | | 777,000 | | | | 260,295 | |
| Goodyear Tire & Rubber Co., 10.5%, 2016 | | | 195,000 | | | | 222,300 | |
| | | | | | | | |
| | | | | | $ | 5,362,756 | |
| | | | | | | | |
| | | | | | | | |
| Issuer | | Shares/Par | | | Value ($) | |
| | | | | | | | |
| BONDS – continued | | | | | | | | |
| Basic Industry – 0.3% | | | | | | | | |
| Trimas Corp., 9.75%, 2017 | | $ | 645,000 | | | $ | 706,275 | |
| | | | | | | | |
| Broadcasting – 6.0% | | | | | | | | |
| Allbritton Communications Co., 8%, 2018 | | $ | 545,000 | | | $ | 550,450 | |
| Bonten Media Acquisition Co., 9%, 2015 (p)(z) | | | 181,025 | | | | 94,729 | |
| Citadel Broadcasting Corp., 7.75%, 2018 (z) | | | 110,000 | | | | 113,850 | |
| Entravision Communications Corp., 8.75%, 2017 (n) | | | 185,000 | | | | 195,175 | |
| Inmarsat Finance PLC, 7.375%, 2017 (n) | | | 860,000 | | | | 903,000 | |
| Intelsat Bermuda Ltd., 11.25%, 2017 | | | 295,000 | | | | 321,550 | |
| Intelsat Jackson Holdings Ltd., 9.5%, 2016 | | | 2,190,000 | | | | 2,310,450 | |
| Lamar Media Corp., 6.625%, 2015 | | | 420,000 | | | | 430,500 | |
| Lamar Media Corp., “C”, 6.625%, 2015 | | | 220,000 | | | | 223,300 | |
| LBI Media, Inc., 8.5%, 2017 (z) | | | 640,000 | | | | 520,000 | |
| Local TV Finance LLC, 9.25%, 2015 (p)(z) | | | 783,161 | | | | 712,677 | |
| Newport Television LLC, 13%, 2017 (n)(p) | | | 256,939 | | | | 230,728 | |
| Nexstar Broadcasting, Inc., 0.5% to 2011, 7% to 2014 (p) | | | 1,295,759 | | | | 1,257,066 | |
| Nexstar Broadcasting, Inc., 7%, 2014 | | | 426,000 | | | | 416,415 | |
| Salem Communications Corp., 9.625%, 2016 | | | 113,000 | | | | 119,780 | |
| Sinclair Broadcast Group, Inc., 9.25%, 2017 (n) | | | 400,000 | | | | 433,000 | |
| Sinclair Broadcast Group, Inc., 8.375%, 2018 (n) | | | 115,000 | | | | 118,738 | |
| SIRIUS XM Radio, Inc., 13%, 2013 (z) | | | 175,000 | | | | 208,250 | |
| SIRIUS XM Radio, Inc., 8.75%, 2015 (n) | | | 665,000 | | | | 719,863 | |
| SIRIUS XM Radio, Inc., 7.625%, 2018 (n) | | | 435,000 | | | | 449,138 | |
| Univision Communications, Inc., 12%, 2014 (n) | | | 172,000 | | | | 188,340 | |
| Univision Communications, Inc., 9.75%, 2015 (n)(p) | | | 2,570,696 | | | | 2,693,875 | |
| Univision Communications, Inc., 7.875%, 2020 (n) | | | 285,000 | | | | 299,250 | |
| Young Broadcasting, Inc., 8.75%, 2014 (d) | | | 525,000 | | | | 0 | |
| | | | | | | | |
| | | | | | $ | 13,510,124 | |
| | | | | | | | |
| Brokerage & Asset Managers – 0.8% | | | | | |
| E*TRADE Financial Corp., 7.875%, 2015 | | $ | 265,000 | | | $ | 263,012 | |
| E*TRADE Financial Corp., 12.5%, 2017 | | | 465,000 | | | | 546,375 | |
| Janus Capital Group, Inc., 6.95%, 2017 | | | 825,000 | | | | 859,507 | |
| | | | | | | | |
| | | | | | $ | 1,668,894 | |
| | | | | | | | |
| Building – 1.6% | | | | | | | | |
| Building Materials Holding Corp., 6.875%, 2018 (n) | | $ | 480,000 | | | $ | 475,200 | |
| Building Materials Holding Corp., 7%, 2020 (n) | | | 290,000 | | | | 297,975 | |
| CEMEX Finance Europe B.V., 9.625%, 2017 (n) | | EUR | 435,000 | | | | 572,868 | |
| Nortek, Inc., 11%, 2013 | | $ | 845,933 | | | | 900,919 | |
| Nortek, Inc., 10%, 2018 (z) | | | 190,000 | | | | 196,175 | |
8
MFS High Yield Portfolio
Portfolio of Investments – continued
| | | | | | | | |
| Issuer | | Shares/Par | | | Value ($) | |
| | | | | | | | |
| BONDS – continued | | | | | | | | |
| Building – continued | | | | | | | | |
| Owens Corning, 9%, 2019 | | $ | 555,000 | | | $ | 651,123 | |
| Ply Gem Industries, Inc., 11.75%, 2013 | | | 450,000 | | | | 481,500 | |
| | | | | | | | |
| | | | | | $ | 3,575,760 | |
| | | | | | | | |
| Business Services – 2.0% | | | | | | | | |
| First Data Corp., 9.875%, 2015 | | $ | 820,000 | | | $ | 781,050 | |
| Interactive Data Corp., 10.25%, 2018 (n) | | | 610,000 | | | | 667,950 | |
| Iron Mountain, Inc., 6.625%, 2016 | | | 870,000 | | | | 873,262 | |
| Iron Mountain, Inc., 8.375%, 2021 | | | 415,000 | | | | 445,087 | |
| SunGard Data Systems, Inc., 10.25%, 2015 | | | 832,000 | | | | 874,640 | |
| SunGard Data Systems, Inc., 7.375%, 2018 (n) | | | 275,000 | | | | 276,375 | |
| SunGard Data Systems, Inc., 7.625%, 2020 (n) | | | 335,000 | | | | 339,188 | |
| Terremark Worldwide, Inc., 12%, 2017 | | | 160,000 | | | | 183,200 | |
| | | | | | | | |
| | | | | | $ | 4,440,752 | |
| | | | | | | | |
| Cable TV – 3.7% | | | | | | | | |
| Bresnan Broadband Holdings LLC, 8%, 2018 (z) | | $ | 165,000 | | | $ | 169,950 | |
| Cablevision Systems Corp., 8.625%, 2017 | | | 465,000 | | | | 506,269 | |
| CCH II LLC, 13.5%, 2016 | | | 665,000 | | | | 793,013 | |
| CCO Holdings LLC, 7.875%, 2018 | | | 1,030,000 | | | | 1,066,050 | |
| CCO Holdings LLC, 8.125%, 2020 | | | 125,000 | | | | 131,562 | |
| Charter Communications Operating LLC, 10.875%, 2014 (n) | | | 405,000 | | | | 452,588 | |
| CSC Holdings LLC, 8.5%, 2014 | | | 1,095,000 | | | | 1,203,131 | |
| CSC Holdings LLC, 8.5%, 2015 | | | 315,000 | | | | 341,775 | |
| EchoStar Corp., 7.125%, 2016 | | | 425,000 | | | | 438,812 | |
| Insight Communications Co., Inc., 9.375%, 2018 (n) | | | 420,000 | | | | 447,300 | |
| Mediacom LLC, 9.125%, 2019 | | | 655,000 | | | | 668,100 | |
| Videotron LTEE, 6.875%, 2014 | | | 510,000 | | | | 516,375 | |
| Virgin Media Finance PLC, 9.125%, 2016 | | | 1,275,000 | | | | 1,357,875 | |
| Virgin Media Finance PLC, 9.5%, 2016 | | | 225,000 | | | | 254,250 | |
| | | | | | | | |
| | | | | | $ | 8,347,050 | |
| | | | | | | | |
| Chemicals – 4.2% | | | | | | | | |
| Ashland, Inc., 9.125%, 2017 | | $ | 1,255,000 | | | $ | 1,446,387 | |
| Celanese U.S. Holdings LLC, 6.625%, 2018 (n) | | | 415,000 | | | | 428,488 | |
| Hexion Specialty Chemicals, Inc., 8.875%, 2018 | | | 1,130,000 | | | | 1,207,688 | |
| Hexion U.S. Finance Corp/Hexion Nova Scotia Finance, 9%, 2020 (n) | | | 170,000 | | | | 179,775 | |
| Huntsman International LLC, 8.625%, 2021 (n) | | | 600,000 | | | | 648,000 | |
| Lumena Resources Corp., 12%, 2014 (n) | | | 331,000 | | | | 307,830 | |
| Lyondell Chemical Co., 11%, 2018 | | | 2,248,711 | | | | 2,546,665 | |
| Momentive Performance Materials, Inc., 12.5%, 2014 | | | 946,000 | | | | 1,055,973 | |
| Momentive Performance Materials, Inc., 11.5%, 2016 | | | 391,000 | | | | 424,235 | |
| Momentive Performance Materials, Inc., 9%, 2021 (n) | | | 330,000 | | | | 348,150 | |
| | | | | | | | |
| Issuer | | Shares/Par | | | Value ($) | |
| | | | | | | | |
| BONDS – continued | | | | | | | | |
| Chemicals – continued | | | | | | | | |
| Polypore International, Inc., 7.5%, 2017 (z) | | $ | 110,000 | | | $ | 112,200 | |
| Solutia, Inc., 7.875%, 2020 | | | 685,000 | | | | 732,950 | |
| | | | | | | | |
| | | | | | $ | 9,438,341 | |
| | | | | | | | |
| Computer Software – 0.2% | | | | | | | | |
| Syniverse Holdings, Inc., 9.125%, 2019 (z) | | $ | 430,000 | | | $ | 443,975 | |
| | | | | | | | |
| Computer Software – Systems – 0.4% | | | | | | | | |
| DuPont Fabros Technology, Inc., REIT, 8.5%, 2017 | | $ | 915,000 | | | $ | 979,050 | |
| | | | | | | | |
| Conglomerates – 0.6% | | | | | | | | |
| Amsted Industries, Inc., 8.125%, 2018 (n) | | $ | 640,000 | | | $ | 679,200 | |
| Pinafore LLC, 9%, 2018 (n) | | | 580,000 | | | | 626,400 | |
| | | | | | | | |
| | | | | | $ | 1,305,600 | |
| | | | | | | | |
| Consumer Products – 1.4% | | | | | | | | |
| ACCO Brands Corp., 10.625%, 2015 | | $ | 100,000 | | | $ | 112,500 | |
| ACCO Brands Corp., 7.625%, 2015 | | | 360,000 | | | | 360,000 | |
| Central Garden & Pet Co., 8.25%, 2018 | | | 460,000 | | | | 465,750 | |
| Easton-Bell Sports, Inc., 9.75%, 2016 | | | 170,000 | | | | 186,575 | |
| Jarden Corp., 7.5%, 2017 | | | 620,000 | | | | 653,325 | |
| Libbey Glass, Inc., 10%, 2015 (n) | | | 545,000 | | | | 585,875 | |
| NBTY, Inc., 9%, 2018 (n) | | | 80,000 | | | | 85,400 | |
| Scotts Miracle-Gro Co., 6.625%, 2020 (z) | | | 110,000 | | | | 110,000 | |
| Visant Corp., 10%, 2017 (n) | | | 570,000 | | | | 605,625 | |
| | | | | | | | |
| | | | | | $ | 3,165,050 | |
| | | | | | | | |
| Consumer Services – 1.7% | | | | | | | | |
| KAR Holdings, Inc., 10%, 2015 | | $ | 175,000 | | | $ | 185,500 | |
| KAR Holdings, Inc., FRN, 4.286%, 2014 | | | 525,000 | | | | 497,437 | |
| Service Corp. International, 6.75%, 2015 | | | 375,000 | | | | 384,375 | |
| Service Corp. International, 7%, 2017 | | | 1,510,000 | | | | 1,540,200 | |
| Service Corp. International, 7%, 2019 | | | 185,000 | | | | 185,000 | |
| Ticketmaster Entertainment, Inc., 10.75%, 2016 | | | 910,000 | | | | 985,075 | |
| | | | | | | | |
| | | | | | $ | 3,777,587 | |
| | | | | | | | |
| Containers – 1.6% | | | | | | | | |
| Graham Packaging Co. LP/GPC Capital Corp., 9.875%, 2014 | | $ | 1,365,000 | | | $ | 1,412,775 | |
| Graham Packaging Co. LP/GPC Capital Corp., 8.25%, 2018 | | | 115,000 | | | | 120,750 | |
| Greif, Inc., 6.75%, 2017 | | | 855,000 | | | | 893,475 | |
| Owens-Illinois, Inc., 7.375%, 2016 | | | 400,000 | | | | 425,000 | |
| Reynolds Group, 7.75%, 2016 (n) | | | 325,000 | | | | 343,688 | |
| Reynolds Group, 7.125%, 2019 (n) | | | 335,000 | | | | 340,863 | |
| | | | | | | | |
| | | | | | $ | 3,536,551 | |
| | | | | | | | |
| Defense Electronics – 0.4% | | | | | | | | |
| ManTech International Corp., 7.25%, 2018 | | $ | 450,000 | | | $ | 470,250 | |
| MOOG, Inc., 7.25%, 2018 | | | 315,000 | | | | 329,175 | |
| | | | | | | | |
| | | | | | $ | 799,425 | |
| | | | | | | | |
| Electronics – 0.9% | | | | | | | | |
| Freescale Semiconductor, Inc., 10.125%, 2018 (n) | | $ | 325,000 | | | $ | 365,625 | |
9
MFS High Yield Portfolio
Portfolio of Investments – continued
| | | | | | | | |
| Issuer | | Shares/Par | | | Value ($) | |
| | | | | | | | |
| BONDS – continued | | | | | | | | |
| Electronics – continued | | | | | | | | |
| Freescale Semiconductor, Inc., 9.25%, 2018 (n) | | $ | 440,000 | | | $ | 484,000 | |
| Jabil Circuit, Inc., 7.75%, 2016 | | | 700,000 | | | | 785,750 | |
| NXP B.V., 7.875%, 2014 | | | 325,000 | | | | 338,000 | |
| NXP B.V., 9.75%, 2018 (n) | | | 105,000 | | | | 118,125 | |
| | | | | | | | |
| | | | | | $ | 2,091,500 | |
| | | | | | | | |
| Emerging Market Sovereign – 0.1% | | | | | | | | |
| Republic of Argentina, FRN, 0.677%, 2012 | | $ | 240,750 | | | $ | 228,020 | |
| | | | | | | | |
| Energy – Independent – 6.2% | | | | | | | | |
| Anadarko Petroleum Corp., 8.7%, 2019 | | $ | 310,000 | | | $ | 378,574 | |
| Carrizo Oil & Gas, Inc., 8.625%, 2018 (n) | | | 705,000 | | | | 726,150 | |
| Concho Resources, Inc., 8.625%, 2017 | | | 145,000 | | | | 158,050 | |
| Denbury Resources, Inc., 8.25%, 2020 | | | 595,000 | | | | 645,575 | |
| Energy XXI Gulf Coast, Inc., 9.25%, 2017 (z) | | | 705,000 | | | | 733,200 | |
| Harvest Operations Corp., 6.875%, 2017 (n) | | | 625,000 | | | | 643,750 | |
| Hilcorp Energy I LP, 9%, 2016 (n) | | | 1,020,000 | | | | 1,078,650 | |
| Linn Energy LLC, 8.625%, 2020 (n) | | | 185,000 | | | | 199,338 | |
| Linn Energy LLC, 7.75%, 2021 (n) | | | 472,000 | | | | 483,800 | |
| Newfield Exploration Co., 6.625%, 2014 | | | 725,000 | | | | 739,500 | |
| Newfield Exploration Co., 6.625%, 2016 | | | 315,000 | | | | 323,662 | |
| OPTI Canada, Inc., 9.75%, 2013 (n) | | | 490,000 | | | | 490,000 | |
| OPTI Canada, Inc., 8.25%, 2014 | | | 1,080,000 | | | | 769,500 | |
| Penn Virginia Corp., 10.375%, 2016 | | | 935,000 | | | | 1,042,525 | |
| Pioneer Natural Resources Co., 6.875%, 2018 | | | 740,000 | | | | 786,697 | |
| Pioneer Natural Resources Co., 7.5%, 2020 | | | 760,000 | | | | 834,501 | |
| Plains Exploration & Production Co., 7%, 2017 | | | 1,115,000 | | | | 1,145,662 | |
| QEP Resources, Inc., 6.875%, 2021 | | | 645,000 | | | | 677,250 | |
| Quicksilver Resources, Inc., 8.25%, 2015 | | | 625,000 | | | | 648,437 | |
| Quicksilver Resources, Inc., 9.125%, 2019 | | | 545,000 | | | | 598,137 | |
| Range Resources Corp., 8%, 2019 | | | 315,000 | �� | | | 342,956 | |
| SandRidge Energy, Inc., 8%, 2018 (n) | | | 385,000 | | | | 390,775 | |
| | | | | | | | |
| | | | | | $ | 13,836,689 | |
| | | | | | | | |
| Entertainment – 1.1% | | | | | | | | |
| AMC Entertainment, Inc., 11%, 2016 | | $ | 450,000 | | | $ | 477,000 | |
| AMC Entertainment, Inc., 8.75%, 2019 | | | 740,000 | | | | 789,950 | |
| AMC Entertainment, Inc., 9.75%, 2020 (z) | | | 330,000 | | | | 343,200 | |
| Cinemark USA, Inc., 8.625%, 2019 | | | 535,000 | | | | 579,137 | |
| NAI Entertainment Holdings LLC, 8.25%, 2017 (z) | | | 280,000 | | | | 294,000 | |
| | | | | | | | |
| | | | | | $ | 2,483,287 | |
| | | | | | | | |
| Financial Institutions – 4.6% | | | | | | | | |
| American General Finance Corp., 5.375%, 2012 | | $ | 290,000 | | | $ | 274,050 | |
| American General Finance Corp., 6.9%, 2017 | | | 655,000 | | | | 528,912 | |
| CIT Group, Inc., 7%, 2014 | | | 820,000 | | | | 828,200 | |
| CIT Group, Inc., 7%, 2016 | | | 990,000 | | | | 993,713 | |
| CIT Group, Inc., 7%, 2017 | | | 2,610,000 | | | | 2,616,525 | |
| GMAC, Inc., 6.75%, 2014 | | | 1,455,000 | | | | 1,531,387 | |
| International Lease Finance Corp., 5.625%, 2013 | | | 385,000 | | | | 386,925 | |
| | | | | | | | |
| Issuer | | Shares/Par | | | Value ($) | |
| | | | | | | | |
| BONDS – continued | | | | | | | | |
| Financial Institutions – continued | | | | | |
| International Lease Finance Corp., 8.75%, 2017 (n) | | $ | 865,000 | | | $ | 927,713 | |
| International Lease Finance Corp., 7.125%, 2018 (n) | | | 837,000 | | | | 889,313 | |
| International Lease Finance Corp., 8.25%, 2020 | | | 165,000 | | | | 169,950 | |
| Nationstar Mortgage LLC, 10.875%, 2015 (z) | | | 410,000 | | | | 402,825 | |
| SLM Corp., 8%, 2020 | | | 825,000 | | | | 836,472 | |
| | | | | | | | |
| | | | | | $ | 10,385,985 | |
| | | | | | | | |
| Food & Beverages – 2.0% | | | | | | | | |
| ARAMARK Corp., 8.5%, 2015 | | $ | 535,000 | | | $ | 559,075 | |
| B&G Foods, Inc., 7.625%, 2018 | | | 460,000 | | | | 484,150 | |
| CEDC Finance Corp. International, Inc., 9.125%, 2016 (n) | | | 715,000 | | | | 759,688 | |
| Constellation Brands, Inc., 7.25%, 2016 | | | 335,000 | | | | 355,100 | |
| Del Monte Foods Co., 6.75%, 2015 | | | 850,000 | | | | 868,062 | |
| Pinnacle Foods Finance LLC, 9.25%, 2015 | | | 865,000 | | | | 900,681 | |
| TreeHouse Foods, Inc., 7.75%, 2018 | | | 495,000 | | | | 536,456 | |
| | | | | | | | |
| | | | | | $ | 4,463,212 | |
| | | | | | | | |
| Forest & Paper Products – 2.1% | | | | | | | | |
| Boise, Inc., 8%, 2020 | | $ | 465,000 | | | $ | 497,550 | |
| Cascades, Inc., 7.75%, 2017 | | | 455,000 | | | | 474,338 | |
| Georgia-Pacific Corp., 7.125%, 2017 (n) | | | 635,000 | | | | 676,275 | |
| Georgia-Pacific Corp., 8%, 2024 | | | 505,000 | | | | 576,962 | |
| Georgia-Pacific Corp., 7.25%, 2028 | | | 210,000 | | | | 227,325 | |
| Graphic Packaging Holding Co., 7.875%, 2018 | | | 405,000 | | | | 424,238 | |
| JSG Funding PLC, 7.75%, 2015 | | | 190,000 | | | | 194,750 | |
| Millar Western Forest Products Ltd., 7.75%, 2013 | | | 705,000 | | | | 667,987 | |
| Sappi Papier Holding GmbH, 6.75%, 2012 (z) | | | 315,000 | | | | 323,019 | |
| Smurfit Kappa Group PLC, 7.75%, 2019 (n) | | EUR | 465,000 | | | | 652,448 | |
| | | | | | | | |
| | | | | | $ | 4,714,892 | |
| | | | | | | | |
| Gaming & Lodging – 4.8% | | | | | | | | |
| Firekeepers Development Authority, 13.875%, 2015 (n) | | $ | 530,000 | | | $ | 626,725 | |
| Fontainebleau Las Vegas Holdings LLC, 10.25%, 2015 (d)(n) | | | 1,270,000 | | | | 4,445 | |
| Gaylord Entertainment Co., 6.75%, 2014 | | | 575,000 | | | | 566,375 | |
| GWR Operating Partnership LLP, 10.875%, 2017 | | | 470,000 | | | | 495,850 | |
| Harrah’s Operating Co., Inc., 11.25%, 2017 | | | 1,330,000 | | | | 1,496,250 | |
| Harrah’s Operating Co., Inc., 10%, 2018 | | | 667,000 | | | | 608,637 | |
| Harrah’s Operating Co., Inc., 10%, 2018 | | | 353,000 | | | | 322,112 | |
| Host Hotels & Resorts, Inc., 6.75%, 2016 | | | 950,000 | | | | 970,187 | |
| Host Hotels & Resorts, Inc., 9%, 2017 | | | 720,000 | | | | 799,200 | |
| MGM Mirage, 10.375%, 2014 | | | 150,000 | | | | 168,375 | |
| MGM Mirage, 11.125%, 2017 | | | 370,000 | | | | 425,500 | |
| MGM Mirage, 9%, 2020 (n) | | | 625,000 | | | | 687,500 | |
10
MFS High Yield Portfolio
Portfolio of Investments – continued
| | | | | | | | |
| Issuer | | Shares/Par | | | Value ($) | |
| | | | | | | | |
| BONDS – continued | | | | | | | | |
| Gaming & Lodging – continued | | | | | |
| MGM Resorts International, 11.375%, 2018 | | $ | 525,000 | | | $ | 569,625 | |
| Penn National Gaming, Inc., 8.75%, 2019 | | | 745,000 | | | | 821,363 | |
| Royal Caribbean Cruises Ltd., 11.875%, 2015 | | | 270,000 | | | | 333,450 | |
| Starwood Hotels & Resorts Worldwide, Inc., 6.75%, 2018 | | | 385,000 | | | | 421,575 | |
| Station Casinos, Inc., 6.5%, 2014 (d) | | | 2,020,000 | | | | 202 | |
| Station Casinos, Inc., 6.875%, 2016 (d) | | | 2,495,000 | | | | 249 | |
| Station Casinos, Inc., 7.75%, 2016 (d) | | | 452,000 | | | | 45 | |
| Wyndham Worldwide Corp., 6%, 2016 | | | 445,000 | | | | 465,664 | |
| Wyndham Worldwide Corp., 7.375%, 2020 | | | 595,000 | | | | 654,111 | |
| Wynn Las Vegas LLC, 7.75%, 2020 | | | 300,000 | | | | 324,750 | |
| | | | | | | | |
| | | | | | $ | 10,762,190 | |
| | | | | | | | |
| Industrial – 1.1% | | | | | | | | |
| Altra Holdings, Inc., 8.125%, 2016 | | $ | 480,000 | | | $ | 508,800 | |
| Diversey, Inc., 8.25%, 2019 | | | 475,000 | | | | 515,375 | |
| Great Lakes Dredge & Dock Corp., 7.75%, 2013 | | | 575,000 | | | | 580,031 | |
| Mueller Water Products, Inc., 7.375%, 2017 | | | 440,000 | | | | 424,600 | |
| Mueller Water Products, Inc., 8.75%, 2020 | | | 328,000 | | | | 362,440 | |
| | | | | | | | |
| | | | | | $ | 2,391,246 | |
| | | | | | | | |
| Insurance – 2.0% | | | | | | | | |
| American International Group, Inc., 8.175% to 2038, FRN to 2068 | | $ | 2,060,000 | | | $ | 2,193,507 | |
| ING Capital Funding Trust III, FRN, 3.9%, 2049 | | | 555,000 | | | | 511,987 | |
| ING Groep N.V., 5.775% to 2015, FRN to 2049 | | | 1,000,000 | | | | 860,000 | |
| MetLife, Inc., 9.25% to 2038, FRN to 2038 (n) | | | 800,000 | | | | 940,000 | |
| | | | | | | | |
| | | | | | $ | 4,505,494 | |
| | | | | | | | |
| Insurance – Property & Casualty – 1.2% | | | | | | | | |
| Liberty Mutual Group, Inc., 10.75% to 2038, FRN to 2088 (n) | | $ | 995,000 | | | $ | 1,203,950 | |
| USI Holdings Corp., 9.75%, 2015 (z) | | | 990,000 | | | | 999,900 | |
| XL Group PLC, 6.5% to 2017, FRN to 2049 | | | 565,000 | | | | 485,900 | |
| | | | | | | | |
| | | | | | $ | 2,689,750 | |
| | | | | | | | |
| Machinery & Tools – 1.0% | | | | | | | | |
| Case Corp., 7.25%, 2016 | | $ | 330,000 | | | $ | 356,400 | |
| Case New Holland, Inc., 7.875%, 2017 (n) | | | 1,285,000 | | | | 1,403,863 | |
| Rental Service Corp., 9.5%, 2014 | | | 410,000 | | | | 430,500 | |
| | | | | | | | |
| | | | | | $ | 2,190,763 | |
| | | | | | | | |
| Major Banks – 1.7% | | | | | | | | |
| Bank of America Corp., 8% to 2018, FRN to 2049 | | $ | 975,000 | | | $ | 982,605 | |
| JPMorgan Chase & Co., 7.9% to 2018, FRN to 2049 | | | 930,000 | | | | 988,581 | |
| Royal Bank of Scotland Group PLC, 7.648% to 2031, FRN to 2049 | | | 1,855,000 | | | | 1,551,244 | |
| Royal Bank of Scotland Group PLC, 6.99% to 2017, FRN to 2049 (d)(n) | | | 320,000 | | | | 246,400 | |
| | | | | | | | |
| | | | | | $ | 3,768,830 | |
| | | | | | | | |
| | | | | | | | |
| Issuer | | Shares/Par | | | Value ($) | |
| | | | | | | | |
| BONDS – continued | | | | | | | | |
| Medical & Health Technology & Services – 6.3% | |
| Biomet, Inc., 10%, 2017 | | $ | 530,000 | | | $ | 579,025 | |
| Biomet, Inc., 10.375%, 2017 (p) | | | 295,000 | | | | 322,287 | |
| Biomet, Inc., 11.625%, 2017 | | | 575,000 | | | | 635,375 | |
| Community Health Systems, Inc., 8.875%, 2015 | | | 1,160,000 | | | | 1,218,000 | |
| Cooper Cos., Inc., 7.125%, 2015 | | | 370,000 | | | | 381,100 | |
| Davita, Inc., 6.375%, 2018 | | | 580,000 | | | | 577,100 | |
| Davita, Inc., 6.625%, 2020 | | | 285,000 | | | | 282,150 | |
| Fresenius Medical Care AG & Co. KGaA, 9%, 2015 (n) | | | 595,000 | | | | 681,275 | |
| HCA, Inc., 9.25%, 2016 | | | 2,440,000 | | | | 2,603,175 | |
| HCA, Inc., 8.5%, 2019 | | | 625,000 | | | | 684,375 | |
| HealthSouth Corp., 8.125%, 2020 | | | 1,055,000 | | | | 1,134,125 | |
| Tenet Healthcare Corp., 9.25%, 2015 | | | 1,065,000 | | | | 1,134,225 | |
| Tenet Healthcare Corp., 8%, 2020 (n) | | | 240,000 | | | | 243,600 | |
| United Surgical Partners International, Inc., 8.875%, 2017 | | | 215,000 | | | | 221,450 | |
| United Surgical Partners International, Inc., 9.25%, 2017 (p) | | | 335,000 | | | | 348,400 | |
| Universal Hospital Services, Inc., 8.5%, 2015 (p) | | | 1,195,000 | | | | 1,227,862 | |
| Universal Hospital Services, Inc., FRN, 3.834%, 2015 | | | 290,000 | | | | 265,350 | |
| Vanguard Health Systems, Inc., 8%, 2018 | | | 715,000 | | | | 732,875 | |
| VWR Funding, Inc., 10.25%, 2015 (p) | | | 799,531 | | | | 839,508 | |
| | | | | | | | |
| | | | | | $ | 14,111,257 | |
| | | | | | | | |
| Metals & Mining – 2.0% | | | | | | | | |
| Arch Coal, Inc., 7.25%, 2020 | | $ | 295,000 | | | $ | 311,225 | |
| Arch Western Finance LLC, 6.75%, 2013 | | | 313,000 | | | | 316,130 | |
| Cloud Peak Energy, Inc., 8.25%, 2017 | | | 675,000 | | | | 724,781 | |
| Cloud Peak Energy, Inc., 8.5%, 2019 | | | 865,000 | | | | 947,175 | |
| CONSOL Energy, Inc., 8%, 2017 (n) | | | 470,000 | | | | 500,550 | |
| CONSOL Energy, Inc., 8.25%, 2020 (n) | | | 315,000 | | | | 340,200 | |
| Novelis, Inc., 8.375%, 2017 (z) | | | 340,000 | | | | 351,900 | |
| Novelis, Inc., 8.75%, 2020 (z) | | | 165,000 | | | | 171,188 | |
| Peabody Energy Corp., 5.875%, 2016 | | | 570,000 | | | | 572,850 | |
| U.S. Steel Corp., 7.375%, 2020 | | | 320,000 | | | | 328,000 | |
| | | | | | | | |
| | | | | | $ | 4,563,999 | |
| | | | | | | | |
| Natural Gas – Distribution – 1.0% | | | | | | | | |
| AmeriGas Partners LP, 7.125%, 2016 | | $ | 865,000 | | | $ | 895,275 | |
| Ferrellgas Partners LP, 8.625%, 2020 | | | 660,000 | | | | 709,500 | |
| Inergy LP, 6.875%, 2014 | | | 680,000 | | | | 690,200 | |
| | | | | | | | |
| | | | | | $ | 2,294,975 | |
| | | | | | | | |
| Natural Gas – Pipeline – 2.1% | | | | | | | | |
| Atlas Pipeline Partners LP, 8.125%, 2015 | | $ | 185,000 | | | $ | 190,550 | |
| Atlas Pipeline Partners LP, 8.75%, 2018 | | | 470,000 | | | | 491,150 | |
| Crosstex Energy, Inc., 8.875%, 2018 | | | 710,000 | | | | 760,588 | |
| El Paso Corp., 7%, 2017 | | | 1,020,000 | | | | 1,076,421 | |
| El Paso Corp., 7.75%, 2032 | | | 350,000 | | | | 348,156 | |
| Energy Transfer Equity LP, 7.5%, 2020 | | | 1,005,000 | | | | 1,035,150 | |
| Enterprise Products Partners LP, FRN, 8.375%, 2066 | | | 392,000 | | | | 420,910 | |
11
MFS High Yield Portfolio
Portfolio of Investments – continued
| | | | | | | | |
| Issuer | | Shares/Par | | | Value ($) | |
| | | | | | | | |
| BONDS – continued | | | | | | | | |
| Natural Gas – Pipeline – continued | | | | | |
| Enterprise Products Partners LP, FRN, 7.034%, 2068 | | $ | 243,000 | | | $ | 252,112 | |
| MarkWest Energy Partners LP, 8.75%, 2018 | | | 180,000 | | | | 194,850 | |
| | | | | | | | |
| | | | | | $ | 4,769,887 | |
| | | | | | | | |
| Network & Telecom – 2.4% | | | | | | | | |
| CenturyLink, Inc., 7.6%, 2039 | | $ | 430,000 | | | $ | 433,396 | |
| Cincinnati Bell, Inc., 8.25%, 2017 | | | 195,000 | | | | 193,050 | |
| Cincinnati Bell, Inc., 8.75%, 2018 | | | 770,000 | | | | 721,875 | |
| Citizens Communications Co., 9%, 2031 | | | 280,000 | | | | 287,700 | |
| Frontier Communications Corp., 8.25%, 2017 | | | 175,000 | | | | 192,063 | |
| Frontier Communications Corp., 8.5%, 2020 | | | 275,000 | | | | 300,438 | |
| Qwest Communications International, Inc., 8%, 2015 | | | 335,000 | | | | 360,125 | |
| Qwest Communications International, Inc., 7.125%, 2018 (n) | | | 1,050,000 | | | | 1,086,750 | |
| Windstream Corp., 8.625%, 2016 | | | 1,205,000 | | | | 1,268,262 | |
| Windstream Corp., 8.125%, 2018 | | | 130,000 | | | | 136,500 | |
| Windstream Corp., 7.75%, 2020 | | | 335,000 | | | | 345,050 | |
| | | | | | | | |
| | | | | | $ | 5,325,209 | |
| | | | | | | | |
| Oil Services – 1.3% | | | | | | | | |
| Basic Energy Services, Inc., 7.125%, 2016 | | $ | 190,000 | | | $ | 184,300 | |
| Edgen Murray Corp., 12.25%, 2015 | | | 385,000 | | | | 334,950 | |
| Expro Finance Luxembourg, 8.5%, 2016 (n) | | | 940,000 | | | | 897,700 | |
| McJunkin Red Man Holding Corp., 9.5%, 2016 (n) | | | 355,000 | | | | 335,475 | |
| Pioneer Drilling Co., 9.875%, 2018 | | | 655,000 | | | | 692,663 | |
| Trinidad Drilling Ltd., 7.875%, 2019 (z) | | | 335,000 | | | | 338,350 | |
| | | | | | | | |
| | | | | | $ | 2,783,438 | |
| | | | | | | | |
| Oils – 0.1% | | | | | | | | |
| Petroplus Holdings AG, 9.375%, 2019 (n) | | $ | 335,000 | | | $ | 309,875 | |
| | | | | | | | |
| Other Banks & Diversified Financials – 1.9% | | | | | |
| Capital One Financial Corp., 10.25%, 2039 | | $ | 825,000 | | | $ | 882,750 | |
| Citigroup Capital XXI, 8.3% to 2037, FRN to 2057 | | | 1,120,000 | | | | 1,164,800 | |
| Groupe BPCE S.A., 12.5% to 2019, FRN to 2049 (n) | | | 445,000 | | | | 511,456 | |
| LBG Capital No.1 PLC, 7.875%, 2020 (n) | | | 605,000 | | | | 550,550 | |
| Santander UK PLC, 8.963% to 2030, FRN to 2049 | | | 1,131,000 | | | | 1,193,205 | |
| | | | | | | | |
| | | | | | $ | 4,302,761 | |
| | | | | | | | |
| Pharmaceuticals – 0.1% | | | | | | | | |
| Valeant Pharmaceuticals International, Inc., 6.75%, 2017 (n) | | $ | 200,000 | | | $ | 199,000 | |
| Valeant Pharmaceuticals International, Inc., 7%, 2020 (n) | | | 55,000 | | | | 54,313 | |
| | | | | | | | |
| | | | | | $ | 253,313 | |
| | | | | | | | |
| Printing & Publishing – 0.5% | | | | | | | | |
| American Media, Inc., 13.5%, 2018 (z) | | $ | 85,857 | | | $ | 87,231 | |
| McClatchy Co., 11.5%, 2017 | | | 175,000 | | | | 196,656 | |
| Nielsen Finance LLC, 11.5%, 2016 | | | 340,000 | | | | 392,700 | |
| | | | | | | | |
| Issuer | | Shares/Par | | | Value ($) | |
| | | | | | | | |
| BONDS – continued | | | | | | | | |
| Printing & Publishing – continued | | | | | |
| Nielsen Finance LLC, 0% to 2011, 12.5% to 2016 | | $ | 216,000 | | | $ | 226,800 | |
| Nielsen Finance LLC, 7.75%, 2018 (n) | | | 280,000 | | | | 289,800 | |
| | | | | | | | |
| | | | | | $ | 1,193,187 | |
| | | | | | | | |
| Railroad & Shipping – 0.4% | | | | | | | | |
| Kansas City Southern Railway, 8%, 2015 | | $ | 860,000 | | | $ | 924,500 | |
| | | | | | | | |
| Real Estate – 0.6% | | | | | | | | |
| CB Richard Ellis Group, Inc., REIT, 11.625%, 2017 | | $ | 285,000 | | | $ | 330,244 | |
| Developers Diversified Realty Corp., REIT, 7.875%, 2020 | | | 290,000 | | | | 324,759 | |
| Entertainment Properties Trust, REIT, 7.75%, 2020 (n) | | | 700,000 | | | | 740,250 | |
| | | | | | | | |
| | | | | | $ | 1,395,253 | |
| | | | | | | | |
| Restaurants – 0.1% | | | | | | | | |
| Dunkin Finance Corp., 9.625%, 2018 (n) | | $ | 285,000 | | | $ | 287,850 | |
| | | | | | | | |
| Retailers – 2.0% | | | | | | | | |
| Express LLC/Express Finance Corp., 8.75%, 2018 | | $ | 405,000 | | | $ | 430,313 | |
| Limited Brands, Inc., 6.9%, 2017 | | | 465,000 | | | | 494,062 | |
| Limited Brands, Inc., 6.95%, 2033 | | | 280,000 | | | | 261,800 | |
| Neiman Marcus Group, Inc., 10.375%, 2015 | | | 490,000 | | | | 517,562 | |
| QVC, Inc., 7.375%, 2020 (n) | | | 310,000 | | | | 324,725 | |
| Rent-A-Center, Inc., 6.625%, 2020 | | | 115,000 | | | | 114,425 | |
| Sally Beauty Holdings, Inc., 10.5%, 2016 | | | 725,000 | | | | 799,312 | |
| Toys “R” Us Property Co. II LLC, 8.5%, 2017 | | | 440,000 | | | | 473,000 | |
| Toys “R” Us, Inc., 10.75%, 2017 | | | 865,000 | | | | 986,100 | |
| | | | | | | | |
| | | | | | $ | 4,401,299 | |
| | | | | | | | |
| Specialty Stores – 1.1% | | | | | | | | |
| Giraffe Acquisition Corp., 9.125%, 2018 (n) | | $ | 415,000 | | | $ | 432,638 | |
| Michaels Stores, Inc., 11.375%, 2016 | | | 450,000 | | | | 490,500 | |
| Michaels Stores, Inc., 7.75%, 2018 (n) | | | 455,000 | | | | 453,863 | |
| Payless ShoeSource, Inc., 8.25%, 2013 | | | 937,000 | | | | 953,397 | |
| | | | | | | | |
| | | | | | $ | 2,330,398 | |
| | | | | | | | |
| Telecommunications – Wireless – 4.4% | | | | | |
| Clearwire Corp., 12%, 2015 (n) | | $ | 1,265,000 | | | $ | 1,363,038 | |
| Cricket Communications, Inc., 7.75%, 2016 | | | 580,000 | | | | 601,750 | |
| Crown Castle International Corp., 9%, 2015 | | | 750,000 | | | | 826,875 | |
| Crown Castle International Corp., 7.125%, 2019 | | | 525,000 | | | | 555,187 | |
| Digicel Group Ltd., 12%, 2014 (n) | | | 140,000 | | | | 162,750 | |
| Digicel Group Ltd., 8.25%, 2017 (n) | | | 760,000 | | | | 779,000 | |
| Digicel Group Ltd., 10.5%, 2018 (n) | | | 150,000 | | | | 165,000 | |
| MetroPCS Wireless, Inc., 7.875%, 2018 | | | 290,000 | | | | 300,875 | |
| Nextel Communications, 7.375%, 2015 | | | 585,000 | | | | 585,731 | |
| NII Holdings, Inc., 10%, 2016 | | | 675,000 | | | | 747,562 | |
| NII Holdings, Inc., 8.875%, 2019 | | | 350,000 | | | | 377,125 | |
| SBA Communications Corp., 8%, 2016 | | | 255,000 | | | | 276,038 | |
| SBA Communications Corp., 8.25%, 2019 | | | 430,000 | | | | 469,775 | |
| Sprint Capital Corp., 6.875%, 2028 | | | 330,000 | | | | 288,750 | |
| Sprint Nextel Corp., 8.375%, 2017 | | | 920,000 | | | | 986,700 | |
12
MFS High Yield Portfolio
Portfolio of Investments – continued
| | | | | | | | |
| Issuer | | Shares/Par | | | Value ($) | |
| | | | | | | | |
| BONDS – continued | | | | | | | | |
| Telecommunications – continued | | | | | |
| Sprint Nextel Corp., 8.75%, 2032 | | $ | 680,000 | | | $ | 686,800 | |
| Wind Acquisition Finance S.A., 7.25%, 2018 (n) | | | 555,000 | | | | 564,713 | |
| | | | | | | | |
| | | | | | $ | 9,737,669 | |
| | | | | | | | |
| Telephone Services – 0.4% | | | | | | | | |
| Frontier Communications Corp., 8.125%, 2018 | | $ | 765,000 | | | $ | 839,587 | |
| | | | | | | | |
| Transportation – Services – 1.9% | | | | | | | | |
| American Petroleum Tankers LLC, 10.25%, 2015 (n) | | $ | 335,000 | | | $ | 346,725 | |
| Commercial Barge Line Co., 12.5%, 2017 | | | 1,065,000 | | | | 1,230,075 | |
| Hertz Corp., 8.875%, 2014 | | | 752,000 | | | | 768,920 | |
| Hertz Corp., 7.5%, 2018 (n) | | | 430,000 | | | | 446,125 | |
| Hertz Corp., 7.375%, 2021 (z) | | | 580,000 | | | | 585,800 | |
| Navios Maritime Acquisition Corp., 8.625%, 2017 (n) | | | 275,000 | | | | 281,188 | |
| Swift Services Holdings, Inc., 10%, 2018 (z) | | | 450,000 | | | | 471,375 | |
| | | | | | | | |
| | | | | | $ | 4,130,208 | |
| | | | | | | | |
| Utilities – Electric Power – 3.7% | | | | | | | | |
| AES Corp., 8%, 2017 | | $ | 1,470,000 | | | $ | 1,554,525 | |
| Calpine Corp., 8%, 2016 (n) | | | 770,000 | | | | 818,125 | |
| Calpine Corp., 7.875%, 2020 (n) | | | 270,000 | | | | 273,375 | |
| Covanta Holding Corp., 7.25%, 2020 | | | 275,000 | | | | 278,789 | |
| Dynegy Holdings, Inc., 7.75%, 2019 | | | 825,000 | | | | 550,687 | |
| Edison Mission Energy, 7%, 2017 | | | 1,070,000 | | | | 847,975 | |
| EDP Finance B.V., 6%, 2018 (n) | | | 135,000 | | | | 126,181 | |
| Energy Future Holdings Corp., 10%, 2020 (n) | | | 805,000 | | | | 828,162 | |
| Energy Future Holdings Corp., 10%, 2020 | | | 1,240,000 | | | | 1,278,779 | |
| Genon Escrow Corp., 9.875%, 2020 (n) | | | 810,000 | | | | 803,925 | |
| NRG Energy, Inc., 7.375%, 2016 | | | 610,000 | | | | 625,250 | |
| Texas Competitive Electric Holdings LLC, 10.25%, 2015 | | | 630,000 | | | | 355,950 | |
| | | | | | | | |
| | | | | | $ | 8,341,723 | |
| | | | | | | | |
Total Bonds
(Identified Cost, $205,695,455) | | | | | | $ | 206,317,127 | |
| | | | | | | | |
| |
| FLOATING RATE LOANS (g)(r) – 1.5% | | | | | |
| Aerospace – 0.2% | | | | | | | | |
| Hawker Beechcraft Acquisition Co. LLC, Term Loan, 10.5%, 2014 | | $ | 466,120 | | | $ | 462,916 | |
| | | | | | | | |
| Automotive – 0.2% | | | | | | | | |
| Ford Motor Co., Term Loan B-1, 3.02%, 2013 | | $ | 402,564 | | | $ | 400,604 | |
| | | | | | | | |
| Broadcasting – 0.3% | | | | | | | | |
| Gray Television, Inc., Term Loan B, 3.78%, 2014 | | $ | 307,291 | | | $ | 299,301 | |
| Local TV Finance LLC, Term Loan B, 2.31%, 2013 | | | 68,300 | | | | 64,771 | |
| New Young Broadcasting Holding Co., Inc., Term Loan, 8%, 2015 | | | 358,980 | | | | 359,429 | |
| | | | | | | | |
| | | | | | $ | 723,501 | |
| | | | | | | | |
| | | | | | | | |
| Issuer | | Shares/Par | | | Value ($) | |
| | | | | | | | |
| FLOATING RATE LOANS (g)(r) – continued | | | | | |
| Building – 0.0% | | | | | | | | |
| Goodman Global Holdings, Inc., 2nd Lien Term Loan, 9%, 2017 | | $ | 37,044 | | | $ | 38,146 | |
| | | | | | | | |
| Consumer Services – 0.1% | | | | | | | | |
| Realogy Corp., Letter of Credit, 3.3%, 2013 | | $ | 42,123 | | | $ | 39,422 | |
| Realogy Corp., Term Loan, 3.28%, 2013 | | | 309,232 | | | | 289,403 | |
| | | | | | | | |
| | | | | | $ | 328,825 | |
| | | | | | | | |
| Financial Institutions – 0.1% | | | | | | | | |
| American General Financial Corp., Term Loan B, 7.25%, 2015 | | $ | 123,382 | | | $ | 125,001 | |
| | | | | | | | |
| Gaming & Lodging – 0.4% | | | | | | | | |
| Green Valley Ranch Gaming LLC, Second Lien Term Loan, 3.5%, 2014 (d) | | $ | 1,601,789 | | | $ | 28,031 | |
| MGM Mirage, Term Loan, 7%, 2014 (o) | | | 879,986 | | | | 830,927 | |
| | | | | | | | |
| | | | | | $ | 858,958 | |
| | | | | | | | |
| Utilities – Electric Power – 0.2% | | | | | | | | |
| Texas Competitive Electric Holdings Co. LLC, Term Loan B-2, 3.76%, 2014 | | $ | 522,044 | | | $ | 402,686 | |
| | | | | | | | |
Total Floating Rate Loans (Identified Cost, $4,246,236) | | | | | | $ | 3,340,637 | |
| | | | | | | | |
| | |
| COMMON STOCKS – 0.6% | | | | | | | | |
| Automotive – 0.1% | | | | | | | | |
| Accuride Corp. (a) | | | 16,071 | | | $ | 255,207 | |
| Oxford Automotive, Inc. (a) | | | 21 | | | | 0 | |
| | | | | | | | |
| | | | | | $ | 255,207 | |
| | | | | | | | |
| Broadcasting – 0.2% | | | | | | | | |
| New Young Broadcasting Holding Co., Inc. (a) | | | 161 | | | $ | 382,375 | |
| | | | | | | | |
| Construction – 0.1% | | | | | | | | |
| Nortek, Inc. (a) | | | 4,027 | | | $ | 144,972 | |
| | | | | | | | |
| Gaming & Lodging – 0.1% | | | | | | | | |
| Ameristar Casinos, Inc. | | | 9,100 | | | $ | 142,233 | |
| | | | | | | | |
| Printing & Publishing – 0.1% | | | | | | | | |
| American Media Operations, Inc. (a) | | | 22,002 | | | $ | 313,969 | |
| Golden Books Family Entertainment, Inc. (a) | | | 17,708 | | | | 0 | |
| Quad/Graphics, Inc. (a) | | | 1,190 | | | | 49,099 | |
| | | | | | | | |
| | | | | | $ | 363,068 | |
| | | | | | | | |
| Special Products & Services – 0.0% | | | | | | | | |
| Mark IV Industries LLC, Common Units, “A” (a) | | | 663 | | | $ | 33,233 | |
| | | | | | | | |
Total Common Stocks
(Identified Cost, $2,247,700) | | | | | | $ | 1,321,088 | |
| | | | | | | | |
|
| CONVERTIBLE PREFERRED STOCKS – 0.3% | |
| Automotive – 0.3% | | | | | | | | |
| General Motors Co., 4.75% (a) (Identified Cost, $602,500) | | $ | 12,050 | | | $ | 652,026 | |
| | | | | | | | |
13
MFS High Yield Portfolio
Portfolio of Investments – continued
| | | | | | | | |
| Issuer | | Shares/Par | | | Value ($) | |
| | | | | | | | |
| PREFERRED STOCKS – 0.1% | | | | | |
| Other Banks & Diversified Financials – 0.1% | |
| Citigroup Capital XIII, 7.875% (a) (Identified Cost, $126,875) | | | 5,075 | | | $ | 136,568 | |
| | | | | | | | |
| | | | | | | | | | | | | | | | |
| | | Strike
Price | | | First
Exercise | | | | | | | |
| | | | | | | | | | | | | | | | |
| WARRANTS – 0.4% | | | | | | | | | | | | | |
| Broadcasting – 0.4% | | | | | | | | | | | | | |
| New Young Broadcasting Holding Co., Inc. (1 share for 1 warrant) (a) (Identified Cost, $827,810) | | $ | 0.10 | | | | 7/14/10 | | | | 437 | | | $ | 1,037,875 | |
| | | | | | | | | | | | | | | | |
| | | | | | | | | | | | | | | | |
| Issuer/Expiration Date/Strike Price | | | Number of
Contracts | | | Value ($) | |
| CALL OPTIONS PURCHASED – 0.1% | | | | | |
| Market Index Securities – 0.1% | | | | | | | | | |
S&P 500 Index – March 2011 @ $1,225
(Premiums Paid, $241,986) | | | | 62 | | | $ | 359,600 | |
| | | | | | | | | | | | | | | | |
| Issuer | | | | | | | | Shares/Par | | | | |
| | | | | | | | | | | | | | | | |
| MONEY MARKET FUNDS (v) – 2.1% | | | | | |
| MFS Institutional Money Market Portfolio, 0.18%, at Cost and Net Asset Value | | | | 4,748,268 | | | $ | 4,748,268 | |
| | | | | | | | | | | | | | | | |
Total Investments
(Identified Cost, $218,736,830) | | | | | | | $ | 217,913,189 | |
| | | | | | | | | | | | | | | | |
OTHER ASSETS, LESS
LIABILITIES – 2.7% | | | | | | | | 5,941,241 | |
| | | | | | | | | | | | | | | | |
| Net Assets – 100.0% | | | | | | | | | | | | | | $ | 223,854,430 | |
| | | | | | | | | | | | | | | | |
| (a) | | Non-income producing security. |
| (d) | | Non-income producing security – in default. |
| (g) | | The rate shown represents a weighted average coupon rate on settled positions at period end, unless otherwise indicated. |
| (n) | | Securities exempt from registration under Rule 144A of the Securities Act of 1933. These securities may be sold in the ordinary course of business in transactions exempt from registration, normally to qualified institutional buyers. At period end, the aggregate value of these securities was $47,142,293, representing 21.06% of net assets. |
| (o) | | All or a portion of this position has not settled. Upon settlement date, interest rates for unsettled amounts will be determined. The rate shown represents the weighted average coupon rate for settled amounts. |
| (p) | | Payment-in-kind security. |
| (r) | | Remaining maturities of floating rate loans may be less than stated maturities shown as a result of contractual or optional prepayments by the borrower. Such prepayments cannot be predicted with certainty. These loans may be subject to restrictions on resale. Floating rate loans generally have rates of interest which are determined periodically by reference to a base lending rate plus a premium. |
| (v) | | Underlying fund that is available only to investment companies managed by MFS. The rate quoted is the annualized seven-day yield of the fund at period end. |
| (z) | | Restricted securities are not registered under the Securities Act of 1933 and are subject to legal restrictions on resale. These securities generally may be resold in transactions exempt from registration or to the public if the securities are subsequently registered. Disposal of these securities may involve time-consuming negotiations and prompt sale at an acceptable price may be difficult. The fund holds the following restricted securities: |
| | | | | | | | | | |
| Restricted Securities | | Acquisition Date | | Cost | | | Value | |
| AMC Entertainment, Inc., 9.75%, 2020 | | 12/01/10 | | | $330,000 | | | | $343,200 | |
| Airlie LCDO Ltd., CDO, FRN, 2.2%, 2011 | | 10/13/06 | | | 701,221 | | | | 315,599 | |
| American Media, Inc., 13.5%, 2018 | | 12/22/10 | | | 87,228 | | | | 87,231 | |
| Anthracite Ltd., CDO, 6%, 2037 | | 5/14/02 | | | 908,320 | | | | 390,000 | |
| Arbor Realty Mortgage Securities, CDO, FRN, 2.589%, 2038 | | 12/20/05 | | | 577,317 | | | | 75,051 | |
| Bonten Media Acquisition Co., 9%, 2015 | | 5/22/07-11/15/10 | | | 181,993 | | | | 94,729 | |
| Bresnan Broadband Holdings LLC, 8%, 2018 | | 12/01/10 | | | 165,000 | | | | 169,950 | |
| CWCapital Cobalt Ltd., CDO, 6.23%, 2045 | | 3/20/06 | | | 964,912 | | | | 21,501 | |
| CWCapital Cobalt Ltd., CDO, “F”, FRN, 1.588%, 2050 | | 4/12/06 | | | 508,349 | | | | 10,167 | |
| Citadel Broadcasting Corp., 7.75%, 2018 | | 12/06/10 | | | 110,000 | | | | 113,850 | |
| Energy XXI Gulf Coast, Inc., 9.25%, 2017 | | 12/03/10 | | | 705,000 | | | | 733,200 | |
| Hertz Corp., 7.375%, 2021 | | 12/06/10 | | | 580,000 | | | | 585,800 | |
| LBI Media, Inc., 8.5%, 2017 | | 7/18/07 | | | 632,103 | | | | 520,000 | |
| Local TV Finance LLC, 9.25%, 2015 | | 11/28/07-11/30/10 | | | 770,841 | | | | 712,677 | |
| NAI Entertainment Holdings LLC, 8.25%, 2017 | | 12/02/10-12/20/10 | | | 289,303 | | | | 294,000 | |
| Nationstar Mortgage LLC, 10.875%, 2015 | | 3/23/10-12/08/10 | | | 399,894 | | | | 402,825 | |
| Nortek, Inc., 10%, 2018 | | 11/18/10 | | | 190,000 | | | | 196,175 | |
| Novelis, Inc., 8.375%, 2017 | | 12/10/10 | | | $342,613 | | | | $351,900 | |
14
MFS High Yield Portfolio
Portfolio of Investments – continued
| | | | | | | | | | |
| Restricted Securities – continued | | Acquisition Date | | Cost | | | Value | |
| Novelis, Inc., 8.75%, 2020 | | 12/10/10 | | | $165,000 | | | | $ 171,188 | |
| Polypore International, Inc., 7.5%, 2017 | | 11/10/10 | | | 110,000 | | | | 112,200 | |
| SIRIUS XM Radio, Inc., 13%, 2013 | | 12/15/10 | | | 207,710 | | | | 208,250 | |
| Sappi Papier Holding GmbH, 6.75%, 2012 | | 7/29/10-8/02/10 | | | 316,736 | | | | 323,019 | |
| Scotts Miracle-Gro Co., 6.625%, 2020 | | 12/13/10 | | | 110,000 | | | | 110,000 | |
| Swift Services Holdings, Inc., 10%, 2018 | | 12/15/10 | | | 450,000 | | | | 471,375 | |
| Syniverse Holdings, Inc., 9.125%, 2019 | | 12/16/10 | | | 438,611 | | | | 443,975 | |
| Trinidad Drilling Ltd., 7.875%, 2019 | | 12/09/10 | | | 332,484 | | | | 338,350 | |
| USI Holdings Corp., 9.75%, 2015 | | 4/26/07-6/08/07 | | | 997,254 | | | | 999,900 | |
| Wachovia Credit, CDO, FRN, 1.652%, 2026 | | 6/08/06 | | | 376,000 | | | | 131,600 | |
| Total Restricted Securities | | | | | | | | | $8,727,712 | |
| % of Net Assets | | | | | | | | | 3.9% | |
The following abbreviations are used in this report and are defined:
| CDO | | Collateralized Debt Obligation |
| CLO | | Collateralized Loan Obligation |
| FRN | | Floating Rate Note. Interest rate resets periodically and may not be the rate reported at period end. |
| PLC | | Public Limited Company |
| REIT | | Real Estate Investment Trust |
Abbreviations indicate amounts shown in currencies other than the U.S. dollar. All amounts are stated in U.S. dollars unless otherwise indicated. A list of abbreviations is shown below:
Derivative Contracts at 12/31/10
Forward Foreign Currency Exchange Contracts at 12/31/10
| | | | | | | | | | | | | | | | | | | | | | | | |
| | | Type | | Currency | | | Counterparty | | Contracts to
Deliver/Receive | | Settlement Date
Range | | In Exchange For | | | Contracts
at Value | | | Net Unrealized
Appreciation
(Depreciation) | |
| Liability Derivatives | | | | | | | | | | | | | | | | | | | | | | |
| SELL | | | EUR | | | UBS AG | | 925,379 | | 3/15/2011 | | $ | 1,222,169 | | | $ | 1,236,294 | | | $ | (14,125 | ) |
| | | | | | | | | | | | | | | | | | | | | | | | |
Futures Contracts Outstanding at 12/31/10
| | | | | | | | | | | | | | | | | | |
| Description | | Currency | | | Contracts | | | Value | | Expiration
Date | | | Unrealized
Appreciation
(Depreciation) | |
| Asset Derivatives | | | | | | | | | | | | | | | | | | |
| Interest Rate Futures | | | | | | | | | | | | | | | | | | |
| U.S. Treasury Note 10 yr (Short) | | | USD | | | | 14 | | | $1,686,125 | | | March - 2011 | | | | $55,842 | |
| | | | | | | | | | | | | | | | | | |
At December 31, 2010, the fund had sufficient cash and/or other liquid securities to cover any commitments under these derivative contracts.
See Notes to Financial Statements
15
MFS High Yield Portfolio
FINANCIAL STATEMENTS | STATEMENT OF ASSETS AND LIABILITIES
This statement represents your fund’s balance sheet, which details the assets and liabilities comprising the total value of the fund.
| | | | | | | | |
At 12/31/10 | | | | | | | | |
Assets | | | | | | | | |
Investments – | | | | | | | | |
Non-affiliated issuers, at value (identified cost, $213,988,562) | | | $213,164,921 | | | | | |
Underlying funds, at cost and value | | | 4,748,268 | | | | | |
Total investments, at value (identified cost, $218,736,830) | | | $217,913,189 | | | | | |
Cash | | | 172,943 | | | | | |
Restricted cash | | | 22,400 | | | | | |
Receivables for | | | | | | | | |
Investments sold | | | 468,937 | | | | | |
Fund shares sold | | | 1,998,527 | | | | | |
Interest | | | 3,817,815 | | | | | |
Other assets | | | 6,945 | | | | | |
Total assets | | | | | | | $224,400,756 | |
Liabilities | | | | | | | | |
Payables for | | | | | | | | |
Forward foreign currency exchange contracts | | | $14,125 | | | | | |
Daily variation margin on open futures contracts | | | 6,344 | | | | | |
Investments purchased | | | 289,568 | | | | | |
Fund shares reacquired | | | 138,770 | | | | | |
Payable to affiliates | | | | | | | | |
Investment adviser | | | 8,541 | | | | | |
Distribution and/or service fees | | | 1,385 | | | | | |
Administrative services fee | | | 438 | | | | | |
Payable for Trustees’ compensation | | | 249 | | | | | |
Accrued expenses and other liabilities | | | 86,906 | | | | | |
Total liabilities | | | | | | | $546,326 | |
Net assets | | | | | | | $223,854,430 | |
Net assets consist of | | | | | | | | |
Paid-in capital | | | $255,655,339 | | | | | |
Unrealized appreciation (depreciation) on investments and translation of assets and liabilities in foreign currencies | | | (781,859 | ) | | | | |
Accumulated net realized gain (loss) on investments and foreign currency transactions | | | (47,948,715 | ) | | | | |
Undistributed net investment income | | | 16,929,665 | | | | | |
Net assets | | | | | | | $223,854,430 | |
Shares of beneficial interest outstanding | | | | | | | 37,689,342 | |
| | | | | | | | | | | | |
| | | Net assets | | | Shares
outstanding | | | Net asset value
per share | |
Initial Class | | | $122,665,835 | | | | 20,565,184 | | | | $5.96 | |
Service Class | | | 101,188,595 | | | | 17,124,158 | | | | 5.91 | |
See Notes to Financial Statements
16
MFS High Yield Portfolio
FINANCIAL STATEMENTS | STATEMENT OF OPERATIONS
This statement describes how much your fund earned in investment income and accrued in expenses. It also describes any gains and/or losses generated by fund operations.
| | | | | | | | |
Year ended 12/31/10 | | | | | | | | |
Net investment income | | | | | | | | |
Income | | | | | | | | |
Interest | | | $18,192,059 | | | | | |
Dividends | | | 47,056 | | | | | |
Dividends from underlying funds | | | 9,116 | | | | | |
Total investment income | | | | | | | $18,248,231 | |
Expenses | | | | | | | | |
Management fee | | | $1,658,576 | | | | | |
Distribution and/or service fees | | | 254,995 | | | | | |
Administrative services fee | | | 79,246 | | | | | |
Trustees’ compensation | | | 30,407 | | | | | |
Custodian fee | | | 48,671 | | | | | |
Shareholder communications | | | 26,793 | | | | | |
Auditing fees | | | 65,372 | | | | | |
Legal fees | | | 6,429 | | | | | |
Miscellaneous | | | 25,089 | | | | | |
Total expenses | | | | | | | $2,195,578 | |
Fees paid indirectly | | | (322 | ) | | | | |
Reduction of expenses by investment adviser | | | (110,572 | ) | | | | |
Net expenses | | | | | | | $2,084,684 | |
Net investment income | | | | | | | $16,163,547 | |
Realized and unrealized gain (loss) on investments and foreign currency transactions | | | | | | | | |
Realized gain (loss) (identified cost basis) | | | | | | | | |
Investment transactions | | | $3,373,303 | | | | | |
Futures contracts | | | 100,003 | | | | | |
Foreign currency transactions | | | 185,593 | | | | | |
Net realized gain (loss) on investments and foreign currency transactions | | | | | | | $3,658,899 | |
Change in unrealized appreciation (depreciation) | | | | | | | | |
Investments | | | $11,527,375 | | | | | |
Futures contracts | | | 55,842 | | | | | |
Translation of assets and liabilities in foreign currencies | | | (55,935 | ) | | | | |
Net unrealized gain (loss) on investments and foreign currency translation | | | | | | | $11,527,282 | |
Net realized and unrealized gain (loss) on investments and foreign currency | | | | | | | $15,186,181 | |
Change in net assets from operations | | | | | | | $31,349,728 | |
See Notes to Financial Statements
17
MFS High Yield Portfolio
FINANCIAL STATEMENTS | STATEMENTS OF CHANGES IN NET ASSETS
These statements describe the increases and/or decreases in net assets resulting from operations, any distributions, and any shareholder transactions.
| | | | | | | | |
For years ended 12/31 | | | 2010 | | | | 2009 | |
Change in net assets | | | | | | | | |
From operations | | | | | | | | |
Net investment income | | | $16,163,547 | | | | $19,563,579 | |
Net realized gain (loss) on investments and foreign currency transactions | | | 3,658,899 | | | | (13,094,736 | ) |
Net unrealized gain (loss) on investments and foreign currency translation | | | 11,527,282 | | | | 78,783,462 | |
Change in net assets from operations | | | $31,349,728 | | | | $85,252,305 | |
| Distributions declared to shareholders | | | | | | | | |
From net investment income | | | $(20,660,022 | ) | | | $(21,199,945 | ) |
Change in net assets from fund share transactions | | | $(16,468,998 | ) | | | $(34,192,945 | ) |
Total change in net assets | | | $(5,779,292 | ) | | | $29,859,415 | |
| Net assets | | | | | | | | |
At beginning of period | | | 229,633,722 | | | | 199,774,307 | |
At end of period (including undistributed net investment income of $16,929,665 and
$20,073,167, respectively) | | | $223,854,430 | | | | $229,633,722 | |
See Notes to Financial Statements
18
MFS High Yield Portfolio
FINANCIAL STATEMENTS | FINANCIAL HIGHLIGHTS
The financial highlights table is intended to help you understand the fund’s financial performance for the past 5 years. Certain information reflects financial results for a single fund share. The total returns in the table represent the rate by which an investor would have earned (or lost) on an investment in the fund share class (assuming reinvestment of all distributions) held for the entire period.
| | | | | | | | | | | | | | | | | | | | |
| Initial Class | | Years ended 12/31 | |
| | | 2010 | | | 2009 | | | 2008 | | | 2007 | | | 2006 | |
Net asset value, beginning of period | | | $5.67 | | | | $4.25 | | | | $6.56 | | | | $6.93 | | | | $6.83 | |
| Income (loss) from investment operations | | | | | | | | | | | | | | | | | | | | |
Net investment income (d) | | | $0.42 | | | | $0.44 | | | | $0.49 | | | | $0.49 | | | | $0.48 | |
Net realized and unrealized gain (loss) on investments
and foreign currency | | | 0.42 | | | | 1.49 | | | | (2.26 | ) | | | (0.34 | ) | | | 0.19 | |
Total from investment operations | | | $0.84 | | | | $1.93 | | | | $(1.77 | ) | | | $0.15 | | | | $0.67 | |
| Less distributions declared to shareholders | | | | | | | | | | | | | | | | | | | | |
From net investment income | | | $(0.55 | ) | | | $(0.51 | ) | | | $(0.54 | ) | | | $(0.52 | ) | | | $(0.57 | ) |
Net asset value, end of period | | | $5.96 | | | | $5.67 | | | | $4.25 | | | | $6.56 | | | | $6.93 | |
Total return (%) (k)(r)(s) | | | 15.53 | | | | 50.00 | | | | (29.50 | ) | | | 1.93 | | | | 10.39 | |
Ratios (%) (to average net assets)
and Supplemental data: | | | | | | | | | | | | | | | | | | | | |
Expenses before expense reductions (f) | | | 0.88 | | | | 0.87 | | | | 0.89 | | | | 0.84 | | | | 0.85 | |
Expenses after expense reductions (f) | | | 0.83 | | | | 0.82 | | | | 0.84 | | | | 0.79 | | | | 0.83 | |
Net investment income | | | 7.42 | | | | 9.21 | | | | 8.60 | | | | 7.25 | | | | 7.14 | |
Portfolio turnover | | | 62 | | | | 58 | | | | 63 | | | | 69 | | | | 92 | |
Net assets at end of period (000 omitted) | | | $122,666 | | | | $121,416 | | | | $96,605 | | | | $175,408 | | | | $224,412 | |
| |
| Service Class | | Years ended 12/31 | |
| | | 2010 | | | 2009 | | | 2008 | | | 2007 | | | 2006 | |
Net asset value, beginning of period | | | $5.63 | | | | $4.21 | | | | $6.50 | | | | $6.88 | | | | $6.79 | |
| Income (loss) from investment operations | | | | | | | | | | | | | | | | | | | | |
Net investment income (d) | | | $0.41 | | | | $0.43 | | | | $0.47 | | | | $0.47 | | | | $0.46 | |
Net realized and unrealized gain (loss) on investments
and foreign currency | | | 0.40 | | | | 1.49 | | | | (2.24 | ) | | | (0.35 | ) | | | 0.19 | |
Total from investment operations | | | $0.81 | | | | $1.92 | | | | $(1.77 | ) | | | $0.12 | | | | $0.65 | |
| Less distributions declared to shareholders | | | | | | | | | | | | | | | | | | | | |
From net investment income | | | $(0.53 | ) | | | $(0.50 | ) | | | $(0.52 | ) | | | $(0.50 | ) | | | $(0.56 | ) |
Net asset value, end of period | | | $5.91 | | | | $5.63 | | | | $4.21 | | | | $6.50 | | | | $6.88 | |
Total return (%) (k)(r)(s) | | | 15.17 | | | | 49.97 | | | | (29.64 | ) | | | 1.56 | | | | 10.04 | |
Ratios (%) (to average net assets)
and Supplemental data: | | | | | | | | | | | | | | | | | | | | |
Expenses before expense reductions (f) | | | 1.13 | | | | 1.12 | | | | 1.14 | | | | 1.09 | | | | 1.10 | |
Expenses after expense reductions (f) | | | 1.08 | | | | 1.07 | | | | 1.09 | | | | 1.04 | | | | 1.08 | |
Net investment income | | | 7.18 | | | | 9.01 | | | | 8.38 | | | | 7.01 | | | | 6.89 | |
Portfolio turnover | | | 62 | | | | 58 | | | | 63 | | | | 69 | | | | 92 | |
Net assets at end of period (000 omitted) | | | $101,189 | | | | $108,217 | | | | $103,169 | | | | $149,162 | | | | $131,839 | |
| (d) | Per share data is based on average shares outstanding. |
| (f) | Ratios do not reflect reductions from fees paid indirectly, if applicable. |
| (k) | The total return does not reflect expenses that apply to separate accounts. Inclusion of these charges would reduce the total return figures for all periods shown. |
| (r) | Certain expenses have been reduced without which performance would have been lower. |
| (s) | From time to time the fund may receive proceeds from litigation settlements, without which performance would be lower. |
See Notes to Financial Statements
19
MFS High Yield Portfolio
NOTES TO FINANCIAL STATEMENTS
| (1) | | Business and Organization |
MFS High Yield Portfolio (the fund) is a series of MFS Variable Insurance Trust II (the trust). The trust is organized as a Massachusetts business trust and is registered under the Investment Company Act of 1940, as amended, as an open-end management investment company. The shareholders of each series of the trust are separate accounts of insurance companies, which offer variable annuity and/or life insurance products, and qualified retirement and pension plans.
| (2) | | Significant Accounting Policies |
General – The preparation of financial statements in conformity with U.S. generally accepted accounting principles requires management to make estimates and assumptions that affect the reported amounts of assets and liabilities, and disclosure of contingent assets and liabilities at the date of the financial statements and the reported amounts of revenues and expenses during the reporting period. Actual results could differ from those estimates. In the preparation of these financial statements, management has evaluated subsequent events occurring after the date of the fund’s Statement of Assets and Liabilities through the date that the financial statements were issued. The fund invests in high-yield securities rated below investment grade. Investments in high-yield securities involve greater degrees of credit and market risk than investments in higher-rated securities and tend to be more sensitive to economic conditions. The fund invests in foreign securities, including securities of emerging market issuers. Investments in foreign securities are vulnerable to the effects of changes in the relative values of the local currency and the U.S. dollar and to the effects of changes in each country’s legal, political, and economic environment. The markets of emerging markets countries are generally more volatile than the markets of developed countries with more mature economies. All of the risks of investing in foreign securities previously described are heightened when investing in emerging markets countries.
Investment Valuations – Debt instruments and floating rate loans (other than short-term instruments), including restricted debt instruments, are generally valued at an evaluated or composite bid as provided by a third-party pricing service. Equity securities, including restricted equity securities, are generally valued at the last sale or official closing price as provided by a third-party pricing service on the market or exchange on which they are primarily traded. Equity securities, for which there were no sales reported that day, are generally valued at the last quoted daily bid quotation as provided by a third-party pricing service on the market or exchange on which such securities are primarily traded. Equity securities held short, for which there were no sales reported for that day, are generally valued at the last quoted daily ask quotation as provided by a third-party pricing service on the market or exchange on which such securities are primarily traded. Short-term instruments with a maturity at issuance of 60 days or less generally are valued at amortized cost, which approximates market value. Exchange-traded options are generally valued at the last sale or official closing price as provided by a third-party pricing service on the exchange on which such options are primarily traded. Exchange-traded options for which there were no sales reported that day are generally valued at the last daily bid quotation as provided by a third-party pricing service on the exchange on which such options are primarily traded. Options not traded on an exchange are generally valued at a broker/dealer bid quotation. Foreign currency options are generally valued at valuations provided by a third-party pricing service. Futures contracts are generally valued at last posted settlement price as provided by a third-party pricing service on the market on which they are primarily traded. Futures contracts for which there were no trades that day for a particular position are generally valued at the closing bid quotation as provided by a third-party pricing service on the market on which such futures contracts are primarily traded. Forward foreign currency contracts are generally valued at the mean of bid and asked prices for the time period interpolated from rates provided by a third-party pricing service for proximate time periods. Open-end investment companies are generally valued at net asset value per share. Securities and other assets generally valued on the basis of information from a third-party pricing service may also be valued at a broker/dealer bid quotation. Values obtained from third-party pricing services can utilize both transaction data and market information such as yield, quality, coupon rate, maturity, type of issue, trading characteristics, and other market data. The values of foreign securities and other assets and liabilities expressed in foreign currencies are converted to U.S. dollars using the mean of bid and asked prices for rates provided by a third-party pricing service.
The Board of Trustees has delegated primary responsibility for determining or causing to be determined the value of the fund’s investments (including any fair valuation) to the adviser pursuant to valuation policies and procedures approved by the Board. If the adviser determines that reliable market quotations are not readily available, investments are valued at fair value as determined in good faith by the adviser in accordance with such procedures under the oversight of the Board of Trustees. Under the fund’s valuation policies and procedures, market quotations are not considered to be readily available for most types of debt instruments and floating rate loans and many types of derivatives. These investments are generally valued at fair value based on information from third-party pricing services. In addition, investments may be valued at fair value if the adviser determines that an investment’s value has been materially effected by events occurring after the close of the exchange or market on which the investment is principally traded (such as foreign exchange or market) and prior to the determination of
20
MFS High Yield Portfolio
Notes to Financial Statements – continued
the fund’s net asset value, or after the halting of trading of a specific security where trading does not resume prior to the close of the exchange or market on which the security is principally traded. The adviser generally relies on third-party pricing services or other information (such as the correlation with price movements of similar securities in the same or other markets; the type, cost and investment characteristics of the security; the business and financial condition of the issuer; and trading and other market data) to assist in determining whether to fair value and at what value to fair value an investment. The value of an investment for purposes of calculating the fund’s net asset value can differ depending on the source and method used to determine value. When fair valuation is used, the value of an investment used to determine the fund’s net asset value may differ from quoted or published prices for the same investment. There can be no assurance that the fund could obtain the fair value assigned to an investment if it were to sell the investment at the same time at which the fund determines its net asset value per share.
Various inputs are used in determining the value of the fund’s assets or liabilities. These inputs are categorized into three broad levels. In certain cases, the inputs used to measure fair value may fall into different levels of the fair value hierarchy. In such cases, an investment’s level within the fair value hierarchy is based on the lowest level of input that is significant to the fair value measurement. The fund’s assessment of the significance of a particular input to the fair value measurement in its entirety requires judgment, and considers factors specific to the investment. Level 1 includes unadjusted quoted prices in active markets for identical assets or liabilities. Level 2 includes other significant observable market-based inputs (including quoted prices for similar securities, interest rates, prepayment speed, and credit risk). Level 3 includes unobservable inputs, which may include the adviser’s own assumptions in determining the fair value of investments. Other financial instruments are derivative instruments not reflected in total investments, such as futures and forwards. The following is a summary of the levels used as of December 31, 2010 in valuing the fund’s assets or liabilities:
| | | | | | | | | | | | | | | | |
| Investments at Value | | Level 1 | | | Level 2 | | | Level 3 | | | Total | |
| Equity Securities | | | $1,739,706 | | | | $1,767,451 | | | | $0 | | | | $3,507,157 | |
| Non-U.S. Sovereign Debt | | | — | | | | 228,020 | | | | — | | | | 228,020 | |
| Corporate Bonds | | | — | | | | 177,740,810 | | | | 87,231 | | | | 177,828,041 | |
| Commercial Mortgage-Backed Securities | | | — | | | | 2,383,546 | | | | — | | | | 2,383,546 | |
| Asset-Backed Securities (including CDOs) | | | — | | | | 1,149,244 | | | | 315,599 | | | | 1,464,843 | |
| Foreign Bonds | | | — | | | | 24,412,677 | | | | — | | | | 24,412,677 | |
| Floating Rate Loans | | | — | | | | 3,340,637 | | | | — | | | | 3,340,637 | |
| Mutual Funds | | | 4,748,268 | | | | — | | | | — | | | | 4,748,268 | |
| Total | | | $6,487,974 | | | | $211,022,385 | | | | $402,830 | | | | $217,913,189 | |
| | | | |
| Other Financial Instruments | | | | | | | | | | | | |
| Futures | | | $55,842 | | | | $— | | | | $— | | | | $55,842 | |
| Forward Currency Contracts | | | — | | | | (14,125 | ) | | | — | | | | (14,125 | ) |
For further information regarding security characteristics, see the Portfolio of Investments.
The following is a reconciliation of level 3 assets for which significant unobservable inputs were used to determine fair value. The table presents the activity of level 3 securities held at the beginning and the end of the period.
| | | | | | | | | | | | | | | | |
| | | Equity
Securities | | | Asset-Backed
Securities | | | Corporate
Bonds | | | Total | |
| Balance as of 12/31/09 | | | $41,163 | | | | $343,598 | | | | $— | | | | $384,761 | |
Accrued discounts/premiums | | | — | | | | — | | | | — | | | | — | |
Realized gain (loss) | | | (30,692 | ) | | | — | | | | — | | | | (30,692 | ) |
Change in unrealized appreciation (depreciation) | | | (10,471 | ) | | | (27,999 | ) | | | — | | | | (38,470 | ) |
Purchases | | | — | | | | — | | | | — | | | | — | |
Sales | | | — | | | | — | | | | — | | | | — | |
Transfers into level 3 | | | — | | | | — | | | | 87,231 | | | | 87,231 | |
Transfers out of level 3 | | | — | | | | — | | | | — | | | | — | |
| Balance as of 12/31/10 | | | $0 | | | | $315,599 | | | | $87,231 | | | | $402,830 | |
The net change in unrealized appreciation (depreciation) from investments still held as level 3 at December 31, 2010 is $(27,999).
Foreign Currency Translation – Purchases and sales of foreign investments, income, and expenses are converted into U.S. dollars based upon currency exchange rates prevailing on the respective dates of such transactions or on the reporting date for foreign denominated receivables and payables. Gains and losses attributable to foreign currency exchange rates on sales of securities are recorded for financial statement purposes as net realized gains and losses on investments. Gains and losses
21
MFS High Yield Portfolio
Notes to Financial Statements – continued
attributable to foreign exchange rate movements on receivables, payables, income and expenses are recorded for financial statement purposes as foreign currency transaction gains and losses. That portion of both realized and unrealized gains and losses on investments that results from fluctuations in foreign currency exchange rates is not separately disclosed.
Derivatives – The fund uses derivatives for different purposes, including to earn income and enhance returns, to increase or decrease exposure to a particular market, to manage or adjust the risk profile of the fund, or as alternatives to direct investments. Derivatives are used for hedging or non-hedging purposes. While hedging can reduce or eliminate losses, it can also reduce or eliminate gains. When the fund uses derivatives as an investment to increase market exposure, or for hedging purposes, gains and losses from derivative instruments may be substantially greater than the derivative’s original cost.
Derivative instruments used by the fund during the period include purchased options, futures contracts, and forward foreign currency exchange contracts. The fund’s period end derivatives, as presented in the Portfolio of Investments and the associated Derivative Contract Tables, generally are indicative of the volume of its derivative activity during the period.
The following table presents, by major type of derivative contract, the fair value, on a gross basis, of the asset and liability components of derivatives held by the fund at December 31, 2010 as reported in the Statement of Assets and Liabilities:
| | | | | | | | | | |
| | | | | Fair Value (a) | |
| Risk | | Derivative | | Asset Derivatives | | | Liability Derivatives | |
| Interest Rate Contracts | | Interest Rate Futures | | | $55,842 | | | | $— | |
| Foreign Exchange Contracts | | Forward Foreign Currency Exchange Contracts | | | — | | | | (14,125 | ) |
| Equity Contracts | | Purchased Options | | | 359,600 | | | | — | |
| Total | | | | | $415,442 | | | | $(14,125 | ) |
| (a) | The value of purchased options outstanding is included in total investments, at value, within the fund’s Statement of Assets and Liabilities. The value of futures contracts outstanding includes cumulative appreciation (depreciation) as reported in the fund’s Portfolio of Investments. Only the current day variation margin for futures contracts is separately reported within the fund’s Statement of Assets and Liabilities. |
The following table presents, by major type of derivative contract, the realized gain (loss) on derivatives held by the fund for the year ended December 31, 2010 as reported in the Statement of Operations:
| | | | | | | | | | | | |
| Risk | | Futures
Contracts | | | Foreign Currency
Transactions | | | Investment
Transactions
(Purchased
Options) | |
| Interest Rate Contracts | | | $100,003 | | | | $— | | | | $— | |
| Foreign Exchange Contracts | | | — | | | | 186,041 | | | | — | |
| Equity Contracts | | | — | | | | — | | | | 49,072 | |
| Total | | | $100,003 | | | | $186,041 | | | | $49,072 | |
The following table presents, by major type of derivative contract, the change in unrealized appreciation (depreciation) on derivatives held by the fund for the year ended December 31, 2010 as reported in the Statement of Operations:
| | | | | | | | | | | | |
| Risk | | Futures
Contracts | | | Translation
of Assets and
Liabilities in
Foreign Currencies | | | Investments
(Purchased
Options) | |
| Interest Rate Contracts | | | $55,842 | | | | $— | | | | $— | |
| Foreign Exchange Contracts | | | — | | | | (51,492 | ) | | | — | |
| Equity Contracts | | | — | | | | — | | | | 117,614 | |
| Total | | | $55,842 | | | | $(51,492 | ) | | | $117,614 | |
Derivative counterparty credit risk is managed through formal evaluation of the creditworthiness of all potential counterparties. On certain over-the-counter derivatives, the fund attempts to reduce its exposure to counterparty credit risk whenever possible by entering into an International Swaps and Derivatives Association (ISDA) Master Agreement on a bilateral basis with each of the counterparties with whom it undertakes a significant volume of transactions. The ISDA Master Agreement gives each party to the agreement the right to terminate all transactions traded under such agreement if there is a certain deterioration in the credit quality of the other party. The ISDA Master Agreement gives the fund the right, upon an event of default by the applicable counterparty or a termination of the agreement, to close out all transactions traded under such agreement and to net amounts owed under each transaction to one net amount payable by one party to the other. This right to close out and net payments across all transactions traded under the ISDA Master Agreement could result in a reduction of the fund’s credit risk to such counterparty equal to any amounts payable by the fund under the applicable transactions, if
22
MFS High Yield Portfolio
Notes to Financial Statements – continued
any. However, absent an event of default by the counterparty or a termination of the agreement, the ISDA Master Agreement does not result in an offset of reported amounts of assets and liabilities in the Statement of Assets and Liabilities across transactions between the fund and the applicable counterparty.
Collateral requirements differ by type of derivative. Collateral or margin requirements are set by the broker or exchange clearing house for exchange traded derivatives (i.e., futures and exchange-traded options) while collateral terms are contract specific for over-the-counter traded derivatives (i.e., forwards, swaps and over-the-counter options). For derivatives traded under an ISDA Master Agreement, the collateral requirements are netted across all transactions traded under such agreement and one amount is posted from one party to the other to collateralize such obligations. Cash collateral that has been pledged to cover obligations of the fund under derivative contracts, if any, will be reported separately on the Statement of Assets and Liabilities as restricted cash. Securities collateral pledged for the same purpose, if any, is noted in the Portfolio of Investments.
Purchased Options – The fund purchased call options for a premium. Purchased call options entitle the holder to buy a specified number of shares or units of a particular security, currency or index at a specified price at a specified date or within a specified period of time. Purchasing call options may be used to hedge against an anticipated increase in the dollar cost of securities or currency to be acquired or to increase the fund’s exposure to an underlying instrument.
The premium paid is initially recorded as an investment in the Statement of Assets and Liabilities. That investment is subsequently marked-to-market daily with the difference between the premium paid and the market value of the purchased option being recorded as unrealized appreciation or depreciation. Premiums paid for purchased call options which have expired are treated as realized losses on investments in the Statement of Operations. Upon the exercise or closing of a purchased call option, the premium paid is added to the cost of the security or financial instrument.
The risk in purchasing an option is that the fund pays a premium whether or not the option is exercised. The fund’s maximum risk of loss due to counterparty credit risk is limited to the market value of the option. For over-the-counter options, this risk is mitigated in cases where there is an ISDA Master Agreement between the fund and the counterparty providing for netting as described above and for posting of collateral by the counterparty to the fund to cover the fund’s exposure to the counterparty under such ISDA Master Agreement.
Futures Contracts – The fund entered into futures contracts which may be used to gain or to hedge against broad market, interest rate or currency exposure. A futures contract represents a commitment for the future purchase or sale of an asset at a specified price on a specified date.
Upon entering into a futures contract, the fund is required to deposit with the broker, either in cash or securities, an initial margin in an amount equal to a certain percentage of the notional amount of the contract. Subsequent payments (variation margin) are made or received by the fund each day, depending on the daily fluctuations in the value of the contract, and are recorded for financial statement purposes as unrealized gain or loss by the fund until the contract is closed or expires at which point the gain or loss on futures is realized.
The fund bears the risk of interest rates, exchange rates or securities prices moving unexpectedly, in which case, the fund may not achieve the anticipated benefits of the futures contracts and may realize a loss. While futures may present less counterparty risk to the fund since the contracts are exchange traded and the exchange’s clearinghouse guarantees payments to the broker, there is still counterparty credit risk due to the insolvency of the broker. The fund’s maximum risk of loss due to counterparty credit risk is equal to the margin posted by the fund to the broker plus any gains or minus any losses on the outstanding futures contracts.
Forward Foreign Currency Exchange Contracts – The fund entered into forward foreign currency exchange contracts for the purchase or sale of a specific foreign currency at a fixed price on a future date. These contracts may be used to hedge the fund’s currency risk or for non-hedging purposes. For hedging purposes, the fund may enter into contracts to deliver or receive foreign currency that the fund will receive from or use in its normal investment activities. The fund may also use contracts to hedge against declines in the value of foreign currency denominated securities due to unfavorable exchange rate movements. For non-hedging purposes, the fund may enter into contracts with the intent of changing the relative exposure of the fund’s portfolio of securities to different currencies to take advantage of anticipated exchange rate changes.
Forward foreign currency exchange contracts are adjusted by the daily exchange rate of the underlying currency and any unrealized gains or losses are recorded as a receivable or payable for forward foreign currency exchange contracts until the contract settlement date. On contract settlement date, any gain or loss on the contract is recorded as realized gains or losses on foreign currency transactions.
Risks may arise upon entering into these contracts from unanticipated movements in the value of the contract and from the potential inability of counterparties to meet the terms of their contracts. Generally, the fund’s maximum risk due to
23
MFS High Yield Portfolio
Notes to Financial Statements – continued
counterparty credit risk is the unrealized gain on the contract due to our use of continuous linked settlement, an industry accepted settlement system. This risk is mitigated in cases where there is an ISDA Master Agreement between the fund and the counterparty providing for netting as described above and for posting of collateral by the counterparty to the fund to cover the fund’s exposure to the counterparty under such ISDA Master Agreement.
Loans and Other Direct Debt Instruments – The fund invests in loans and loan participations or other receivables. These investments may include standby financing commitments, including revolving credit facilities, which obligate the fund to supply additional cash to the borrower on demand. Loan participations involve a risk of insolvency of the lending bank or other financial intermediary.
Indemnifications – Under the fund’s organizational documents, its officers and Trustees may be indemnified against certain liabilities and expenses arising out of the performance of their duties to the fund. Additionally, in the normal course of business, the fund enters into agreements with service providers that may contain indemnification clauses. The fund’s maximum exposure under these agreements is unknown as this would involve future claims that may be made against the fund that have not yet occurred.
Investment Transactions and Income – Investment transactions are recorded on the trade date. Interest income is recorded on the accrual basis. All premium and discount is amortized or accreted for financial statement purposes in accordance with U.S. generally accepted accounting principles. The fund earns certain fees in connection with its floating rate loan purchasing activities. These fees are in addition to interest payments earned and may include amendment fees, commitment fees, facility fees, consent fees, and prepayment fees. Commitment fees are recorded on an accrual basis as income in the accompanying financial statements. Dividends received in cash are recorded on the ex-dividend date. Certain dividends from foreign securities will be recorded when the fund is informed of the dividend if such information is obtained subsequent to the ex-dividend date. Dividend and interest payments received in additional securities are recorded on the ex-dividend or ex-interest date in an amount equal to the value of the security on such date. Debt obligations may be placed on non-accrual status or set to accrue at a rate of interest less than the contractual coupon when the collection of all or a portion of interest has become doubtful. Interest income for those debt obligations may be further reduced by the write-off of the related interest receivables when deemed uncollectible.
The fund may receive proceeds from litigation settlements. Any proceeds received from litigation involving portfolio holdings are reflected in the Statement of Operations in realized gain/loss if the security has been disposed of by the fund or in unrealized gain/loss if the security is still held by the fund. Any other proceeds from litigation not related to portfolio holdings are reflected as other income in the Statement of Operations.
Fees Paid Indirectly – The fund’s custody fee may be reduced according to an arrangement that measures the value of cash deposited with the custodian by the fund. This amount, for the year ended December 31, 2010, is shown as a reduction of total expenses on the Statement of Operations.
Tax Matters and Distributions – The fund intends to qualify as a regulated investment company, as defined under Subchapter M of the Internal Revenue Code, and to distribute all of its taxable income, including realized capital gains. As a result, no provision for federal income tax is required. The fund’s federal tax returns for the prior three fiscal years remain subject to examination by the Internal Revenue Service. Foreign taxes, if any, have been accrued by the fund in the accompanying financial statements.
Distributions to shareholders are recorded on the ex-dividend date. Income and capital gain distributions are determined in accordance with income tax regulations, which may differ from U.S. generally accepted accounting principles. Certain capital accounts in the financial statements are periodically adjusted for permanent differences in order to reflect their tax character. These adjustments have no impact on net assets or net asset value per share. Temporary differences which arise from recognizing certain items of income, expense, gain or loss in different periods for financial statement and tax purposes will reverse at some time in the future. Distributions in excess of net investment income or net realized gains are temporary overdistributions for financial statement purposes resulting from differences in the recognition or classification of income or distributions for financial statement and tax purposes.
Book/tax differences primarily relate to expiration of capital loss carryforwards, amortization and accretion of debt securities, and defaulted bonds.
The tax character of distributions declared to shareholders for the last two fiscal years is as follows:
| | | | | | | | |
| | | 12/31/10 | | | 12/31/09 | |
| Ordinary income (including any short-term capital gains) | | | $20,660,022 | | | | $21,199,945 | |
24
MFS High Yield Portfolio
Notes to Financial Statements – continued
The federal tax cost and the tax basis components of distributable earnings were as follows:
| | | | |
| As of 12/31/10 | | | | |
| Cost of investments | | | $219,973,053 | |
| Gross appreciation | | | 12,349,515 | |
| Gross depreciation | | | (14,409,379 | ) |
| Net unrealized appreciation (depreciation) | | | $(2,059,864 | ) |
| Undistributed ordinary income | | | 17,369,512 | |
| Capital loss carryforwards | | | (46,539,036 | ) |
| Other temporary differences | | | (571,521 | ) |
As of December 31, 2010, the fund had capital loss carryforwards available to offset future realized gains. Such losses expire as follows:
| | | | |
| 12/31/13 | | | $(5,089,839 | ) |
| 12/31/14 | | | (7,011,353 | ) |
| 12/31/16 | | | (23,243,372 | ) |
| 12/31/17 | | | (11,194,472 | ) |
| Total | | | $(46,539,036 | ) |
Multiple Classes of Shares of Beneficial Interest – The fund offers multiple classes of shares, which differ in their respective distribution and/or service fees. The fund’s income, realized and unrealized gain (loss), and common expenses are allocated to shareholders based on the daily net assets of each class. Dividends are declared separately for each class. Differences in per share dividend rates are generally due to differences in separate class expenses. The fund’s distributions declared to shareholders as reported on the Statements of Changes in Net Assets are presented by class as follows:
| | | | | | | | |
| | | From net investment
income | |
| | | Year ended
12/31/10 | | | Year ended
12/31/09 | |
| Initial Class | | | $11,086,633 | | | | $10,861,982 | |
| Service Class | | | 9,573,389 | | | | 10,337,963 | |
| Total | | | $20,660,022 | | | | $21,199,945 | |
| (3) | | Transactions with Affiliates |
Investment Adviser –The fund has an investment advisory agreement with MFS to provide overall investment management and related administrative services and facilities to the fund. The management fee is computed daily and paid monthly at an annual rate of 0.75% of the fund’s average daily net assets. The investment adviser has agreed in writing to reduce its management fee to 0.70% for the first $1 billion of average daily net assets and 0.65% of average daily net assets in excess of $1 billion. This written agreement will continue until modified or rescinded by the fund’s shareholders. This management fee reduction amounted to $110,572, which is shown as a reduction of total expenses in the Statement of Operations. The management fee incurred for the year ended December 31, 2010 was equivalent to an annual effective rate of 0.70% of the fund’s average daily net assets.
The investment adviser has agreed in writing to pay a portion of the fund’s total annual operating expenses, exclusive of interest, taxes, extraordinary expenses, and brokerage commissions, such that total annual fund operating expenses do not exceed 1.25% of the fund’s average daily net assets. MFS’ agreement to limit the fund’s total annual operating expenses is contained in the investment advisory agreement between MFS and the fund and may not be rescinded without shareholder approval. In addition, the investment adviser has voluntarily agreed to pay a portion of the fund’s total annual operating expenses, exclusive of interest, taxes, extraordinary expenses, and brokerage commissions, such that total annual operating expenses do not exceed 1.00% of the fund’s average daily net assets attributable to Initial Class shares. This voluntary agreement may be changed or rescinded at any time by MFS. For the year ended December 31, 2010, the fund’s actual operating expenses did not exceed the limit and therefore, the investment adviser did not pay any portion of the fund’s expenses related to this agreement.
Distributor – MFS Fund Distributors, Inc. (MFD), a wholly-owned subsidiary of MFS, is the distributor of shares of the fund. The Trustees have adopted a distribution plan for the Service Class shares pursuant to Rule 12b-1 under the Investment Company Act of 1940.
The fund’s distribution plan provides that the fund will pay MFD distribution and/or service fees equal to 0.25% per annum of its average daily net assets attributable to Service Class shares as partial consideration for services performed and expenses
25
MFS High Yield Portfolio
Notes to Financial Statements – continued
incurred by MFD and financial intermediaries (including participating insurance companies that invest in the fund to fund variable annuity and variable life insurance contracts, sponsors of qualified retirement and pension plans that invest in the fund, and affiliates of these participating insurance companies and plan sponsors) in connection with the sale and distribution of the Service Class shares. MFD may subsequently pay all, or a portion, of the distribution and/or service fees to financial intermediaries.
Shareholder Servicing Agent – MFS Service Center, Inc. (MFSC), a wholly-owned subsidiary of MFS, has contracted to provide transfer agent and recordkeeping functions in connection with the issuance, transfer, and redemption of each class of shares of the fund under a Shareholder Servicing Agent Agreement. During the year ended December 31, 2010, the fund did not pay MFSC a fee for this service.
Administrator – MFS provides certain financial, legal, shareholder communications, compliance, and other administrative services to the fund. Under an administrative services agreement, the fund partially reimburses MFS the costs incurred to provide these services. The fund is charged an annual fixed amount of $10,000 plus a fee based on average daily net assets. The administrative services fee incurred for the year ended December 31, 2010 was equivalent to an annual effective rate of 0.0358% of the fund’s average daily net assets.
Trustees’ and Officers’ Compensation – The fund pays compensation to Trustees in the form of a retainer, attendance fees, and additional compensation to the Board chairperson. The fund does not pay compensation directly to officers of the fund who are also officers of the investment adviser, all of whom receive remuneration for their services to the fund from MFS. Certain officers of the fund are officers or directors of MFS, MFD, and MFSC.
Other – This fund and certain other funds managed by MFS (the funds) have entered into services agreements (the Agreements) which provide for payment of fees by the funds to Tarantino LLC and Griffin Compliance LLC in return for the provision of services of an Independent Chief Compliance Officer (ICCO) and Assistant ICCO, respectively, for the funds. The ICCO and Assistant ICCO are officers of the funds and the sole members of Tarantino LLC and Griffin Compliance LLC, respectively. The funds can terminate the Agreements with Tarantino LLC and Griffin Compliance LLC at any time under the terms of the Agreements. MFS has agreed to bear all expenses associated with office space, other administrative support, and supplies provided to the ICCO and Assistant ICCO. For the year ended December 31, 2010, the aggregate fees paid by the fund to Tarantino LLC and Griffin Compliance LLC were $3,785 and are included in miscellaneous expense on the Statement of Operations.
The fund invests in the MFS Institutional Money Market Portfolio which is managed by MFS and seeks a high level of current income consistent with preservation of capital and liquidity. Income earned on this investment is included in dividends from underlying funds on the Statement of Operations. This money market fund does not pay a management fee to MFS.
Purchases and sales of investments, other than U.S. Government securities, purchased option transactions, and short-term obligations, aggregated $131,603,908 and $157,196,239, respectively.
| (5) | | Shares of Beneficial Interest |
The fund’s Declaration of Trust permits the Trustees to issue an unlimited number of full and fractional shares of beneficial interest. Transactions in fund shares were as follows:
| | | | | | | | | | | | | | | | |
| | | Year ended 12/31/10 | | | Year ended 12/31/09 | |
| | | Shares | | | Amount | | | Shares | | | Amount | |
| Shares sold | | | | | | | | | | | | | | | | |
Initial Class | | | 3,370,209 | | | | $19,314,937 | | | | 1,528,393 | | | | $6,890,150 | |
Service Class | | | 2,073,739 | | | | 11,938,579 | | | | 1,358,723 | | | | 6,068,280 | |
| | | 5,443,948 | | | | $31,253,516 | | | | 2,887,116 | | | | $12,958,430 | |
| Shares issued to shareholders in reinvestment of distributions | | | | | | | | | | | | | | | | |
Initial Class | | | 2,012,093 | | | | $11,086,633 | | | | 2,642,818 | | | | $10,861,982 | |
Service Class | | | 1,750,163 | | | | 9,573,389 | | | | 2,533,814 | | | | 10,337,963 | |
| | | 3,762,256 | | | | $20,660,022 | | | | 5,176,632 | | | | $21,199,945 | |
| Shares reacquired | | | | | | | | | | | | | | | | |
Initial Class | | | (6,217,269 | ) | | | $(35,131,534 | ) | | | (5,492,264 | ) | | | $(25,876,431 | ) |
Service Class | | | (5,938,351 | ) | | | (33,251,002 | ) | | | (9,130,838 | ) | | | (42,474,889 | ) |
| | | (12,155,620 | ) | | | $(68,382,536 | ) | | | (14,623,102 | ) | | | $(68,351,320 | ) |
26
MFS High Yield Portfolio
Notes to Financial Statements – continued
| | | | | | | | | | | | | | | | |
| | | Year ended 12/31/10 | | | Year ended 12/31/09 | |
| | | Shares | | | Amount | | | Shares | | | Amount | |
| Net change | | | | | | | | | | | | | | | | |
Initial Class | | | (834,967 | ) | | | $(4,729,964 | ) | | | (1,321,053 | ) | | | $(8,124,299 | ) |
Service Class | | | (2,114,449 | ) | | | (11,739,034 | ) | | | (5,238,301 | ) | | | (26,068,646 | ) |
| | | (2,949,416 | ) | | | $(16,468,998 | ) | | | (6,559,354 | ) | | | $(34,192,945 | ) |
The fund and certain other funds managed by MFS participate in a $1.1 billion unsecured committed line of credit, subject to a $1 billion sublimit, provided by a syndication of banks under a credit agreement. Borrowings may be made for temporary financing needs. Interest is charged to each fund, based on its borrowings, generally at a rate equal to the higher of the Federal Reserve funds rate or one month LIBOR plus an agreed upon spread. A commitment fee, based on the average daily, unused portion of the committed line of credit, is allocated among the participating funds at the end of each calendar quarter. In addition, the fund and other funds managed by MFS have established unsecured uncommitted borrowing arrangements with certain banks for temporary financing needs. Interest is charged to each fund, based on its borrowings, at a rate equal to the Federal Reserve funds rate plus an agreed upon spread. For the year ended December 31, 2010, the fund’s commitment fee and interest expense were $2,467 and $0, respectively, and are included in miscellaneous expense on the Statement of Operations.
| (7) | | Transactions in Underlying Funds – Affiliated Issuers |
An affiliated issuer may be considered one in which the fund owns 5% or more of the outstanding voting securities, or a company which is under common control. For the purposes of this report, the fund assumes the following to be affiliated issuers:
| | | | | | | | | | | | | | | | |
| Underlying Funds | | Beginning
Shares/Par
Amount | | | Acquisitions
Shares/Par
Amount | | | Dispositions
Shares/Par
Amount | | | Ending
Shares/Par
Amount | |
| MFS Institutional Money Market Portfolio | | | 3,286,982 | | | | 89,605,358 | | | | (88,144,072 | ) | | | 4,748,268 | |
| | | | |
| Underlying Funds | | Realized
Gain (Loss) | | | Capital Gain
Distributions | | | Dividend
Income | | | Ending
Value | |
| MFS Institutional Money Market Portfolio | | | $— | | | | $— | | | | $9,116 | | | | $4,748,268 | |
27
MFS High Yield Portfolio
REPORT OF INDEPENDENT REGISTERED PUBLIC ACCOUNTING FIRM
To the Board of Trustees of MFS Variable Insurance Trust II and the Shareholders of
MFS High Yield Portfolio:
We have audited the accompanying statement of assets and liabilities, including the portfolio of investments, of MFS High Yield Portfolio (the “Fund”) (one of the portfolios comprising MFS Variable Insurance Trust II) as of December 31, 2010, and the related statement of operations for the year then ended, the statements of changes in net assets for each of the two years in the period then ended, and the financial highlights for each of the five years in the period then ended. These financial statements and financial highlights are the responsibility of the Fund’s management. Our responsibility is to express an opinion on these financial statements and financial highlights based on our audits.
We conducted our audits in accordance with the standards of the Public Company Accounting Oversight Board (United States). Those standards require that we plan and perform the audit to obtain reasonable assurance about whether the financial statements and financial highlights are free of material misstatement. The Fund is not required to have, nor were we engaged to perform, an audit of its internal control over financial reporting. Our audits included consideration of internal control over financial reporting as a basis for designing audit procedures that are appropriate in the circumstances, but not for the purpose of expressing an opinion on the effectiveness of the Fund’s internal control over financial reporting. Accordingly, we express no such opinion. An audit also includes examining, on a test basis, evidence supporting the amounts and disclosures in the financial statements, assessing the accounting principles used and significant estimates made by management, as well as evaluating the overall financial statement presentation. Our procedures included confirmation of securities owned as of December 31, 2010, by correspondence with the custodian and brokers; where replies were not received from brokers, we performed other auditing procedures. We believe that our audits provide a reasonable basis for our opinion.
In our opinion, the financial statements and financial highlights referred to above present fairly, in all material respects, the financial position of MFS High Yield Portfolio as of December 31, 2010, the results of its operations for the year then ended, the changes in its net assets for each of the two years in the period then ended, and the financial highlights for each of the five years in the period then ended, in conformity with accounting principles generally accepted in the United States of America.
DELOITTE & TOUCHE LLP
Boston, Massachusetts
February 14, 2011
28
MFS High Yield Portfolio
TRUSTEES AND OFFICERS – IDENTIFICATION AND BACKGROUND
The Trustees and officers of the Trust, as of February 1, 2011, are listed below, together with their principal occupations during the past five years. (Their titles may have varied during that period.) The address of each Trustee and officer is 500 Boylston Street, Boston, Massachusetts 02116.
| | | | | | |
Name, Date of Birth | | Position(s) Held
with Fund | | Trustee/Officer
Since (1) | | Principal Occupations During the Past Five Years and
Other Directorships (2) |
| INTERESTED TRUSTEE | | | | |
David D. Horn (3) (born 6/07/41) | | Trustee | | April 1986 | | Private investor; Sun Life Assurance Company of Canada, Senior Vice President and General Manager for the United States (until 1997); Director (until March 2004) |
| | |
| INDEPENDENT TRUSTEES | | | | |
J. Kermit Birchfield (born 1/08/40) | | Chairman | | May 1997 | | Consultant; Century Partners, Inc. (investments), Director; Displaytech, Inc. (technology), Chairman; Dessin Fournir LLC (furniture manufacturer), Director; Site Watch LLC (software to monitor oil tanks), Managing Director (2006 to present); Juridica Investments (fund investing in judicial matters), Director (2007 to present), Immuno Science, Inc. (medical research), Independent Director (2009 to present), Intermountain Industries, Inc. (oil & gas exploration and production), Director (until February 2009) |
| | | |
Robert C. Bishop (born 1/13/43) | | Trustee | | May 2001 | | AutoImmune, Inc. (pharmaceutical product development), Chairman, President and Chief Executive Officer; Caliper Life Sciences Corp. (laboratory analytical instruments), Chairman; Optobionics Corporation (ophthalmic devices), Director (until 2007); Millipore Corporation (purification/filtration products), Director (until July 2010); Waterstreet Capital (leverage buyouts), Advisory Board (until August 2010) |
| | | |
Frederick H. Dulles (born 3/12/42) | | Trustee | | May 2001 | | Dulles International Law LLC (law firm), Senior Lawyer (since 2009); Juridica Capital Management (US) Inc. (litigation financing), Vice President and General Counsel (since 2009); Dulles Properties LLC (real estate), Broker (since 2008); The Citadel School of Business Administration (education), Adjunct Professor (since 2003); Disher, Hamrick & Myers Residential, Inc. (real estate), Broker (until 2006); Frederick H. Dulles Law Practice (law firm), (until 2006); Charlestown School of Law (education), Adjunct Professor (until 2007); Prudential Carolina Real Estate, (real estate), Broker (until 2008); Free Enterprise Foundation Inc. (research institute), Director & Secretary (until 2008); Ten State International Law PLLP (law firm), Of Counsel (until 2009) |
| | | |
Marcia A. Kean (born 6/30/48) | | Trustee | | April 2005 | | Feinstein Kean Healthcare (consulting), Chief Executive Officer |
| | | |
Ronald G. Steinhart (born 6/15/40) | | Trustee | | May 2001 | | Private investor; Penske Automotive Group (automotive retailer), Director; Animal Health International, Inc. (animal health products), Director (since 2007); Texas Industries (concrete/aggregates/cement), Director (since 2007); Susser Holdings Corporation (retail convenience stores and distributor of wholesale motor fuel), Director (since 2009); Prentiss Properties Trust (real estate investment trust), Director (until 2006); Penson Worldwide, Inc. (securities clearance), Director (until 2008) |
| | | |
Haviland Wright (born 7/21/48) | | Trustee | | May 2001 | | X-Change Corp. (multi-media web services), Director (since 2010); Nano Loa Inc. (liquid crystal displays), Director (until 2009); Profitability of Hawaii (software), Chief Development Officer (until 2010); Elixir Technologies Corporation (software), Director (until 2010) |
| | | |
| OFFICERS | | | | | | |
Maria F. DiOrioDwyer (4)
(born 12/01/58) | | President | | November 2005 | | Massachusetts Financial Services Company, Executive Vice President and Chief Regulatory Officer; Chief Compliance Officer (since December 2006) |
| | | |
| Christopher R. Bohane (4) (born 1/18/74) | | Assistant Secretary and Assistant Clerk | | July 2005 | | Massachusetts Financial Services Company, Vice President and Senior Counsel |
| | | |
John M. Corcoran (4) (born 4/13/65) | | Treasurer | | October 2008 | | Massachusetts Financial Services Company, Senior Vice President (since October 2008); State Street Bank and Trust (financial services provider), Senior Vice President, (until September 2008) |
| | | |
Ethan D. Corey (4) (born 11/21/63) | | Assistant Secretary and Assistant Clerk | | July 2005 | | Massachusetts Financial Services Company, Senior Vice President and Associate General Counsel |
| | | |
David L. DiLorenzo (4) (born 8/10/68) | | Assistant Treasurer | | July 2005 | | Massachusetts Financial Services Company, Vice President |
| | | |
Timothy M. Fagan (4) (born 7/10/68) | | Assistant Secretary and Assistant Clerk | | September 2005 | | Massachusetts Financial Services Company, Vice President and Senior Counsel |
| | | |
Mark D. Fischer (4) (born 10/27/70) | | Assistant Treasurer | | July 2005 | | Massachusetts Financial Services Company, Vice President |
29
MFS High Yield Portfolio
Trustees and Officers – continued
| | | | | | |
Name, Date of Birth | | Position(s) Held
with Fund | | Trustee/Officer
Since (1) | | Principal Occupations During the Past Five Years and
Other Directorships (2) |
Robyn L. Griffin (born 7/04/75) | | Assistant Independent Chief Compliance Officer | | August 2008 | | Griffin Compliance LLC (provider of compliance services), Principal (since August 2008); State Street Corporation (financial services provider), Mutual Fund Administration Assistant Vice President (October 2006 – July 2008); Liberty Mutual Group (insurance), Personal Market Assistant Controller (April 2006 – October 2006); Deloitte & Touche LLP (professional services firm), Senior Manager (prior to April 2006) |
| | | |
Brian E. Langenfeld (4) (born 3/07/73) | | Assistant Secretary and Assistant Clerk | | May 2006 | | Massachusetts Financial Services Company, Vice President and Senior Counsel (since May 2006); John Hancock Advisers, LLC, Assistant Vice President and Counsel (until April 2006) |
| | | |
Ellen Moynihan (4) (born 11/13/57) | | Assistant Treasurer | | May 1997 | | Massachusetts Financial Services Company, Senior Vice President |
| | | |
Susan S. Newton (4) (born 3/07/50) | | Assistant Secretary and Assistant Clerk | | May 2005 | | Massachusetts Financial Services Company, Senior Vice President and Associate General Counsel |
| | | |
Susan A. Pereira (4)
(born 11/05/70) | | Assistant Secretary and Assistant Clerk | | July 2005 | | Massachusetts Financial Services Company, Vice President and Senior Counsel |
| | | |
Mark N. Polebaum (4) (born 5/01/52) | | Secretary and Clerk | | February 2006 | | Massachusetts Financial Services Company, Executive Vice President, General Counsel and Secretary (since January 2006); Wilmer Cutler Pickering Hale and Dorr LLP (law firm), Partner (until January 2006) |
| | | |
Frank L. Tarantino (born 3/07/44) | | Independent Chief Compliance Officer | | September 2004 | | Tarantino LLC (provider of compliance services), Principal |
| | | |
Richard S. Weitzel (4) (born 7/16/70) | | Assistant Secretary and Assistant Clerk | | October 2007 | | Massachusetts Financial Services Company, Vice President and Assistant General Counsel |
| | | |
James O. Yost (4) (born 6/12/60) | | Assistant Treasurer | | April 1992 | | Massachusetts Financial Services Company, Senior Vice President |
| (1) | Date first appointed to serve as Trustee/Officer of an MFS fund or a Compass variable account. Each Trustee has served continuously since appointment. For the period March 2008 until October 2008, Ms. DiOrioDwyer served as Treasurer of the Funds. |
| (2) | Directorships or trusteeships of companies required to report to the Securities and Exchange Commission (i.e., “public companies”). |
| (3) | “Interested person” of the Trust, within the meaning of the Investment Company Act of 1940 (referred to as the 1940 Act), which is the principal federal law governing investment companies like the Trust, as a result of position with Sun Life of Canada (U.S.). The address of Sun Life of Canada (U.S.) is One Sun Life Executive Park, Wellesley Hills, Massachusetts 02481. |
| (4) | “Interested person” of MFS within the meaning of the 1940 Act. The address of MFS is 500 Boylston Street, Boston, Massachusetts 02116. |
The Trust does not hold annual meetings for the purpose of electing Trustees, and Trustees are not elected for fixed terms. Each Trustee and officer holds office until his or her successor is chosen and qualified, or until his or her earlier death, resignation, retirement or removal.
All Trustees currently serve as Trustees of the Trust and have served in that capacity since originally elected or appointed. All of the Trustees are also Managers of the Compass Variable Accounts. The executive officers of the Trust hold similar offices for the Compass Variable Accounts and other funds in the MFS fund complex. As of January 1, 2011, each Trustee serves as a Trustee or Manager of 31 Accounts/Portfolios.
30
MFS High Yield Portfolio
Trustees and Officers – continued
The Statement of Additional Information contains further information about the Trustees and is available without charge upon request by calling 1-800-752-7215.
| | |
Investment Adviser
Massachusetts Financial Services Company 500 Boylston Street, Boston, MA 02116-3741 | | Custodian State Street Bank and Trust 1 Lincoln Street, Boston, MA 02111-2900 |
Distributor
MFS Fund Distributors, Inc. 500 Boylston Street, Boston, MA 02116-3741 | | Independent Registered Public Accounting Firm Deloitte & Touche LLP 200 Berkeley Street, Boston, MA 02116 |
Portfolio Managers John Addeo David Cole | | |
31
MFS High Yield Portfolio
BOARD REVIEW OF INVESTMENT ADVISORY AGREEMENT
The Investment Company Act of 1940 requires that both the full Board of Trustees and a majority of the non-interested (“independent”) Trustees, voting separately, annually approve the continuation of the investment advisory agreement between MFS Variable Insurance Trust II (the “Trust”) and Massachusetts Financial Services Company (“MFS”) on behalf of the Fund. The Trustees consider matters bearing on the Fund and the advisory arrangement at their meetings throughout the year, including a review of performance data at each regular meeting. In addition, the independent Trustees met in person in May and again in July 2010 (“contract review meetings”) for the specific purpose of considering whether to approve the continuation of the investment advisory agreement for the Fund. The independent Trustees were assisted in their evaluation of the investment advisory agreement by independent legal counsel, from whom they received separate legal advice and with whom they met separately from MFS management during various contract review meetings. The independent Trustees were also assisted in this process by the Fund’s Independent Chief Compliance Officer, a full-time senior officer appointed by and reporting to the independent Trustees.
In connection with their deliberations, the Trustees, including the independent Trustees, considered such information and factors as they believed, in light of the legal advice furnished to them and their own business judgment, to be relevant. The investment advisory agreement was considered separately for the Fund, although the Trustees also took into account the common interests of all Funds in the Trust in their review. As described below, the Trustees considered the nature, quality, and extent of the various investment advisory, administrative, and shareholder services performed by MFS under the existing investment advisory agreement and other arrangements with the Trust.
In connection with their contract review meetings, the Trustees received and relied upon materials which included, among other items: (i) information provided by Lipper Inc. (“Lipper”) on the investment performance of the Fund for various time periods ended December 31, 2009, compared to the investment performance of a group of funds with substantially similar investment classifications/objectives (the “Lipper performance universe”), (ii) information provided by Lipper on the Fund’s advisory fees and other expenses compared to the advisory fees and other expenses of comparable funds identified by Lipper (the “Lipper expense group”), (iii) information provided by MFS on the advisory fees of comparable portfolios of its other clients, including institutional separate account and other clients, (iv) information as to whether, and to what extent applicable, expense waivers, reimbursements or fee “breakpoints” are observed for the Fund, (v) information regarding MFS’ financial results and financial condition, including MFS’ and certain of its affiliates’ estimated profitability from services performed for the Fund, (vi) MFS’ views regarding the outlook for the mutual fund industry and its strategic business plans, (vii) descriptions of various functions performed by MFS for the Trust, such as compliance monitoring and portfolio trading practices, and (viii) information regarding the overall organization of MFS, including information about MFS’ senior management and other personnel providing investment advisory, administrative and other services to the Fund. The comparative performance, fee and expense information prepared and provided by Lipper was not independently verified, and the independent Trustees did not independently verify any information provided to them by MFS.
The Trustees’ conclusion as to the continuation of the investment advisory agreement was based on comprehensive consideration of all information provided to the Trustees and was not the result of any single factor. Some of the factors that figured particularly in the Trustees’ deliberations are described below for the Fund, while individual Trustees may have given different weight to various factors and evaluated the information presented as a whole differently than another individual Trustee. The Trustees recognized that the fee arrangements for the Fund reflect years of review and discussion between the independent Trustees and MFS, that certain aspects of such arrangements may receive greater scrutiny in some years than others, and that the Trustees’ conclusions may be based, in part, on their consideration of these same arrangements during the course of the year and in prior years.
Based on information provided by Lipper, the Trustees compared the Fund’s total return investment performance to the performance of the Lipper performance universe over various time periods. The Trustees placed particular emphasis on the total return performance of the Fund’s Initial Class shares in comparison to the performance of funds in its Lipper performance universe over the one-, three- and five-year periods ended December 31, 2009. The Trustees did not rely on performance results for more recent periods, including those shown elsewhere in this report.
The Trustees noted the performance of the Fund’s Initial Class shares was in the 2nd quintile relative to the other funds in the Lipper performance universe for the one-year period (the 1st quintile being the best performers and the 5th quintile being the worst performers). The total return performance of the Fund was in the 4th quintile for the three-year and the five-year periods ended December 31, 2009, relative to the Lipper performance universe. Based on the nature and quality of services provided by MFS and MFS’ explanation of steps taken to improve the recent performance, including changes to the portfolio management team, the Board of Trustees concluded that the Fund’s performance was adequate.
32
MFS High Yield Portfolio
Board Review of Investment Advisory Agreement – continued
In the course of their deliberations, the Trustees took into account information provided by MFS during contract review meetings, as well as during investment review meetings conducted with portfolio management personnel during the course of the year.
In assessing the reasonableness of the Fund’s advisory fee, the Trustees considered, among other information, the Fund’s advisory fee and the total expense ratio of the Fund’s Initial Class shares as a percentage of average daily net assets, compared to the advisory fee and total expense ratios of its peer group of funds based on information provided by Lipper. The Trustees also considered the advisory fees charged by MFS to institutional accounts. In comparing these fees, the Trustees considered the generally broader scope of services provided by MFS to the Trust than those provided to institutional accounts. The Trustees also considered the higher demands placed on MFS’ investment personnel and trading infrastructure as a result of the daily cash in-flows and out-flows of the Fund, and the impact on MFS and related expenses due to the more extensive regulatory regime to which the Fund is subject, compared to institutional accounts.
In considering the fees, the Trustees noted from the Lipper data that the Fund’s effective advisory fee rate and total expense ratio were each above the median of such fees and expenses of funds in the Lipper expense group. The Trustees further noted that MFS agreed to reduce its advisory fee on a permanent basis, requiring shareholder approval for any modification or termination, and they accepted MFS’ offer to continue the expense limitation for the Fund. The Trustees further concluded that the existing breakpoint was sufficient to allow the Fund to benefit from economies of scale as its assets grow. The Trustees concluded that the reduced fees were reasonable in light of the nature and quality of services provided.
The Trustees also considered information prepared by MFS relating to its costs and profits with respect to the Fund and other investment companies and accounts advised by MFS, as well as MFS’ methodologies used to determine and allocate its costs to the Fund and other accounts and products for purposes of estimating profitability.
After reviewing these and other factors described below, the Trustees concluded that the advisory fees charged to the Fund represent reasonable compensation in light of the nature and quality of the services being provided by MFS.
In addition, the Trustees considered MFS’ resources and related efforts to continue to retain, attract and motivate capable personnel to serve the Fund. The Trustees also considered the financial resources of MFS and its parent, Sun Life Financial Inc. The Trustees further considered any advantages and possible disadvantages of having an adviser which also serves other investment companies as well as institutional accounts.
The Trustees also considered the nature, quality, cost, and extent of administrative, transfer agency, and distribution services provided to the Fund by MFS and its affiliates under agreements and plans other than the investment advisory agreement, including the 12b-1 fees the Fund pays to MFS Fund Distributors, Inc., an affiliate of MFS. The Trustees also considered the nature, extent and quality of certain other services MFS performs or arranges on the Fund’s behalf, which may include securities lending programs, directed expense payment programs, class action recovery programs, and MFS’ interaction with third-party service providers, principally custodians and sub-custodians. The Trustees concluded that the various non-advisory services provided by MFS and its affiliates on behalf of the Fund were satisfactory. The Trustees also considered the benefits to MFS from the use of the Fund’s portfolio brokerage commissions to pay for investment research and various other factors. Additionally, the Trustees considered so-called “fall-out benefits” to MFS such as reputational value derived from serving as investment manager to the Trust, and determined that any such benefits derived by MFS were reasonable and fair.
Based on their evaluation of factors that they deemed to be material, including those factors described above, the Board of Trustees, including a majority of the independent Trustees, concluded that the investment advisory agreement should be continued for an additional one-year period, commencing September 1, 2010.
A discussion regarding the Board’s most recent review and renewal of the fund’s Investment Advisory Agreement with MFS is available by clicking on the fund’s name under “Variable Insurance Portfolios — VIT II” in the “Products and Performance” section of the MFS Web site (mfs.com).
33
MFS High Yield Portfolio
PROXY VOTING POLICIES AND INFORMATION
A general description of the MFS funds’ proxy voting policies and procedures is available without charge, upon request, by calling 1-800-225-2606, by visiting the Proxy Voting section of mfs.com or by visiting the SEC’s Web site at http://www.sec.gov.
Information regarding how the fund voted proxies relating to portfolio securities during the most recent twelve-month period ended June 30 is available without charge by visiting the Proxy Voting section of mfs.com or by visiting the SEC’s Web site at http://www.sec.gov.
QUARTERLY PORTFOLIO DISCLOSURE
The fund will file a complete schedule of portfolio holdings with the Securities and Exchange Commission (the Commission) for the first and third quarters of each fiscal year on Form N-Q. The fund’s Form N-Q may be reviewed and copied at the:
Public Reference Room
Securities and Exchange Commission
100 F Street, NE, Room 1580
Washington, D.C. 20549
Information on the operation of the Public Reference Room may be obtained by calling the Commission at 1-800-SEC-0330. The fund’s Form N-Q is available on the EDGAR database on the Commission’s Internet Web site at http://www.sec.gov, and copies of this information may be obtained, upon payment of a duplicating fee, by electronic request at the following e-mail address: publicinfo@sec.gov or by writing the Public Reference Section at the above address.
FURTHER INFORMATION
From time to time, MFS may post important information about the fund or the MFS funds on the MFS web site (mfs.com). This information is available by visiting the “News & Commentary” section of mfs.com or by clicking on the fund’s name under “Variable Insurance Portfolios — VIT II” in the “Products and Performance” section of mfs.com.
34
MFS High Yield Portfolio
MFS® PRIVACY NOTICE
Privacy is a concern for every investor today. At MFS Investment Management® and the MFS funds, we take this concern very seriously. We want you to understand our policies about the investment products and services that we offer, and how we protect the nonpublic personal information of investors who have a direct relationship with us and our wholly owned subsidiaries.
Throughout our business relationship, you provide us with personal information. We maintain information and records about you, your investments, and the services you use. Examples of the nonpublic personal information we maintain include
| | Ÿ | | data from investment applications and other forms |
| | Ÿ | | share balances and transactional history with us, our affiliates, or others |
| | Ÿ | | facts from a consumer reporting agency |
We do not disclose any nonpublic personal information about our customers or former customers to anyone, except as permitted by law. We may share nonpublic personal information with third parties or certain of our affiliates in connection with servicing your account or processing your transactions. We may share information with companies or financial institutions that perform marketing services on our behalf or with other financial institutions with which we have joint marketing arrangements, subject to any legal requirements.
Authorization to access your nonpublic personal information is limited to appropriate personnel who provide products, services, or information to you. We maintain physical, electronic, and procedural safeguards to help protect the personal information we collect about you.
If you have any questions about the MFS privacy policy, please call 1-800-225-2606 any business day.
Note: If you own MFS products or receive MFS services in the name of a third party such as a bank or broker-dealer, their privacy policy may apply to you instead of ours.
35


MFS® BOND PORTFOLIO
The report is prepared for the general information of contract owners. It is authorized for distribution to prospective investors only when preceded or accompanied by a current prospectus.
NOT FDIC INSURED Ÿ MAY LOSE VALUE Ÿ NO BANK GUARANTEE Ÿ NOT A DEPOSIT Ÿ NOT INSURED BY ANY FEDERAL GOVERNMENT AGENCY OR NCUA/NCUSIF
MFS Bond Portfolio
LETTER FROM THE CEO

Dear Contract Owners:
After an extended rebound in the financial markets, uncertainty returned in 2010 as investors began to question the durability of the recovery for global economies and markets. That uncertainty led to increased risk aversion, especially as investors saw the eurozone struggle with the debt woes of many of its members. In September, the U.S. Federal Reserve Board’s promises to further loosen monetary policy helped assuage market fears and drive asset prices off their recent lows. A combination of solid earnings and improving economic data gave an additional boost to investor sentiment. As we enter 2011, we are cautiously optimistic that economic growth will continue to improve and that the global economies will recover from the shocks of the past few years. We expect the pace of recovery worldwide will be uneven and volatile.
As always, we continue to be mindful of the many economic challenges faced at the local, national, and international levels. It is in times such as these that we want to remind investors of the merits of maintaining a long-term view, adhering to basic investing principles such as asset allocation and diversification, and working closely with their advisors to research and identify appropriate investment opportunities.
Respectfully,

Robert J. Manning
Chairman and Chief Executive Officer
MFS Investment Management®
February 14, 2011
The opinions expressed in this letter are subject to change, may not be relied upon for investment advice, and no forecasts can be guaranteed.
1
MFS Bond Portfolio
PORTFOLIO COMPOSITION
Portfolio structure (i)
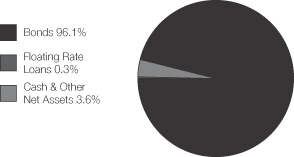
| | | | |
| Fixed income sectors (i) | | | | |
| High Grade Corporates | | | 57.7% | |
| High Yield Corporates | | | 26.6% | |
| Emerging Markets Bonds | | | 6.0% | |
| Commercial Mortgage-Backed Securities | | | 4.5% | |
| Collateralized Debt Obligations | | | 1.2% | |
| Floating Rate Loans | | | 0.3% | |
| Asset-Backed Securities | | | 0.1% | |
| Mortgage-Backed Securities (o) | | | 0.0% | |
| | | | |
| Composition including fixed income credit quality (a)(i) | | | | |
| AAA | | | 2.2% | |
| AA | | | 5.7% | |
| A | | | 15.3% | |
| BBB | | | 45.6% | |
| BB | | | 23.1% | |
| B | | | 3.9% | |
| CCC | | | 0.6% | |
| U.S. Agency (NR) (o) | | | 0.0% | |
| Cash & Other | | | 3.6% | |
| | | | |
| Portfolio facts (i) | | | | |
| Average Duration (d) | | | 5.2 | |
| Average Effective Maturity (m) | | | 8.3 yrs. | |
| (a) | The rating categories include debt securities, fixed-income structured products, and securities underlying credit default swaps, where these have long-term public ratings. The credit default swap itself is not rated. All ratings are assigned in accordance with the following hierarchy: If a security is rated by Moody’s, then that rating is used; if not rated by Moody’s, then a Standard & Poor’s rating is used; if not rated by S&P, then a Fitch rating is used. Ratings from Moody’s are shown in the S&P and Fitch scale (e.g., AAA). All ratings are subject to change. U.S. Agency (NR) includes unrated U.S. Agency fixed income securities and collateralized mortgage obligations of U.S. Agency mortgage-backed securities. Cash & Other includes cash, other assets less liabilities, offsets to derivative positions, and short-term securities. The fund may not hold all of these instruments. |
| (d) | Duration is a measure of how much a bond’s price is likely to fluctuate with general changes in interest rates, e.g., if rates rise 1.00%, a bond with a 5-year duration is likely to lose about 5.00% of its value due to the interest rate move. |
| (i) | For purposes of this presentation, the components include the market value of securities, and reflect the impact of the equivalent exposure of derivative positions, if applicable. These amounts may be negative from time to time. The bond component will include any accrued interest amounts. Equivalent exposure is a calculated amount that translates the derivative position into a reasonable approximation of the amount of the underlying asset that the portfolio would have to hold at a given point in time to have the same price sensitivity that results from the portfolio’s ownership of the derivative contract. When dealing with derivatives, equivalent exposure is a more representative measure of the potential impact of a position on portfolio performance than market value. Where the fund holds convertible bonds, these are treated as part of the equity portion of the portfolio. |
| (m) | In determining an instrument’s effective maturity for purposes of calculating the fund’s dollar-weighted average effective maturity, MFS uses the instrument’s stated maturity or, if applicable, an earlier date on which MFS believes it is probable that a maturity-shortening device (such as a put, pre-refunding or prepayment) will cause the instrument to be repaid. Such an earlier date can be substantially shorter than the instrument’s stated maturity. |
Percentages are based on net assets as of 12/31/10, unless otherwise noted.
The portfolio is actively managed and current holdings may be different.
2
MFS Bond Portfolio
MANAGEMENT REVIEW
Summary of Results
For the twelve months ended December 31, 2010, Initial Class shares of the MFS Bond Portfolio (the “fund”) provided a total return of 10.86%, while Service Class shares of the fund provided a total return of 10.67%. These compare with a return of 8.47% for the fund’s benchmark, the Barclays Capital U.S. Credit Bond Index.
Market Environment
The first quarter of the reporting period witnessed a continuation of the financial market and macroeconomic rebounds that had begun in early 2009. These recoveries in global activity and asset valuations were generally synchronized around the world, led importantly by emerging Asian economies, but broadening to include most of the global economy to varying degrees. Primary drivers of the recoveries included an unwinding of the inventory destocking that took place earlier, the production of manufacturing and capital goods, as well as massive fiscal and monetary stimulus.
During most of the remainder of the period, heightened risk surrounding the public-debt profiles of several of the peripheral European countries impaired market sentiment. At the same time, the improving trend in global macroeconomic data began to weaken somewhat. These two dynamics caused many asset prices to retrench significantly, as many questioned the durability of the global recovery.
Towards the end of the period, the U.S. Federal Reserve led markets to believe that further monetary loosening would be forthcoming if macroeconomic activity did not show signs of improvement. The prospects for more easing by the Fed improved market sentiment and drove risk-asset prices markedly higher. However, in a text-book case of “buy the rumor, sell the fact,” the weeks following the early November announcement of further quantitative easing saw a sell-off in U.S. Treasury bonds. This rise in Treasury yields occurred despite risk-off behavior in equities and credit markets (which would normally result in Treasury yield compression), and appears to have been the result of a few factors: signs of improved U.S. and global economic activity; opposition to quantitative easing from some quarters; and crowded long positions in U.S. Treasuries. The December agreement on an expansionary U.S. fiscal package also boosted sentiment, leading markets to reach near-term highs in risky asset valuations toward year end.
Factors Affecting Performance
The fund’s return from yield, which was greater than that of the Barclays Capital U.S Credit Bond Index, was a key driver of relative performance over the reporting period.
A greater exposure to “BBB” and “BB” rated (r) corporate bonds was another positive factor for strong relative results as securities within these credit quality sectors outperformed the overall benchmark. The fund’s holdings of commercial mortgage-backed securities also benefited relative returns.
During the reporting period, the fund’s shorter duration (d) had a negative impact on relative performance as interest rates fell.
Respectfully,
| | |
| Richard Hawkins | | Robert Persons |
| Portfolio Manager | | Portfolio Manager |
| (d) | Duration is a measure of how much a bond’s price is likely to fluctuate with general changes in interest rates, e.g., if rates rise 1.00%, a bond with a 5-year duration is likely to lose about 5.00% of its value. |
| (r) | Bonds rated “BBB”, “Baa”, or higher are considered investment grade; bonds rated “BB”, “Ba”, or below are considered non-investment grade. The primary source for bond quality ratings is Moody’s Investors Service. If not available, ratings by Standard & Poor’s are used, else ratings by Fitch, Inc. For securities which are not rated by any of the three agencies, the security is considered Not Rated. |
The views expressed in this report are those of the portfolio managers only through the end of the period of the report as stated on the cover and do not necessarily reflect the views of MFS or any other person in the MFS organization. These views are subject to change at any time based on market or other conditions, and MFS disclaims any responsibility to update such views. These views may not be relied upon as investment advice or an indication of trading intent on behalf of any MFS portfolio. References to specific securities are not recommendations of such securities, and may not be representative of any MFS portfolio’s current or future investments.
3
MFS Bond Portfolio
PERFORMANCE SUMMARY THROUGH 12/31/10
The following chart illustrates the historical performance of the fund in comparison to its benchmark(s). Benchmarks are unmanaged and may not be invested in directly. Benchmark returns do not reflect any fees or expenses. The performance of other share classes will be greater than or less than that of the class depicted below. (See Notes to Performance Summary.)
Performance data shown represents past performance and is no guarantee of future results. Investment return and principal value fluctuate so your units, when sold, may be worth more or less than the original cost; current performance may be lower or higher than quoted. The performance shown does not reflect the deduction of taxes, if any, that a contract holder would pay on fund distributions or the redemption of contract units. The returns for the fund shown also do not reflect the deduction of expenses associated with variable products, such as mortality and expense risk charges, separate account charges, and sales charges imposed by the insurance company separate accounts. Such expenses would reduce the overall returns shown.
Growth of a Hypothetical $10,000 Investment
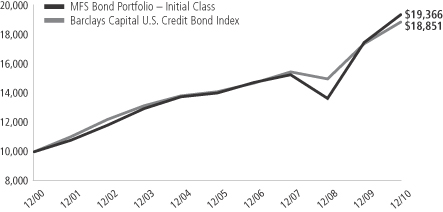
Total Return through 12/31/10
Average annual total returns
| | | | | | | | | | | | | | |
| | | Share class | | Class inception date | | 1-yr | | 5-yr | | 10-yr | | Life (t) | | |
| | | Initial Class | | 5/06/98 | | 10.86% | | 6.69% | | 6.83% | | N/A | | |
| | | Service Class | | 8/24/01 | | 10.67% | | 6.43% | | N/A | | 6.34% | | |
Comparative benchmark
| | | | | | | | | | | | | | |
| | | Barclays Capital U.S. Credit Bond Index (f) | | 8.47% | | 5.98% | | 6.55% | | N/A | | |
| (f) | Source: FactSet Research Systems Inc. |
| (t) | For the period from the class inception date through the stated period end (for those share classes with less than 10 years of performance history). No comparative benchmark performance information is provided for “life” periods. (See Notes to Performance Summary.) |
Benchmark Definition
Barclays Capital U.S. Credit Bond Index – a market capitalization-weighted index that measures the performance of publicly issued, SEC-registered, U.S. corporate and specified foreign debentures and secured notes that meet specified maturity, liquidity, and quality requirements.
It is not possible to invest directly in an index.
Notes to Performance Summary
Average annual total return represents the average annual change in value for each share class for the periods presented. Life returns are presented where the share class has less than 10 years of performance history and represent the average annual total return from the class inception date to the stated period end date. As the fund’s share classes may have different inception dates, the life returns may represent different time periods and may not be comparable. As a result, no comparative benchmark performance information is provided for life periods.
4
MFS Bond Portfolio
Performance Summary – continued
Performance results reflect any applicable expense subsidies and waivers in effect during the periods shown. Without such subsidies and waivers the fund’s performance results would be less favorable. Please see the prospectus and financial statements for complete details. All results are historical and assume the reinvestment of any dividends and capital gains distributions.
From time to time the fund may receive proceeds from litigation settlements, without which performance would be lower.
5
MFS Bond Portfolio
EXPENSE TABLE
Fund Expenses Borne by the Contract Holders During the Period,
July 1, 2010 through December 31, 2010
As a contract holder of the fund, you incur ongoing costs, including management fees; distribution and/or service (12b-1) fees; and other fund expenses. This example is intended to help you understand your ongoing costs (in dollars) of investing in the fund and to compare these costs with the ongoing costs of investing in other mutual funds.
The example is based on an investment of $1,000 invested at the beginning of the period and held for the entire period July 1, 2010 through December 31, 2010.
Actual Expenses
The first line for each share class in the following table provides information about actual account values and actual expenses. You may use the information in this line, together with the amount you invested, to estimate the expenses that you paid over the period. Simply divide your account value by $1,000 (for example, an $8,600 account value divided by $1,000 = 8.6), then multiply the result by the number in the first line under the heading entitled “Expenses Paid During Period” to estimate the expenses you paid on your account during this period.
Hypothetical Example for Comparison Purposes
The second line for each share class in the following table provides information about hypothetical account values and hypothetical expenses based on the fund’s actual expense ratio and an assumed rate of return of 5% per year before expenses, which is not the fund’s actual return. The hypothetical account values and expenses may not be used to estimate the actual ending account balance or expenses you paid for the period. You may use this information to compare the ongoing costs of investing in the fund and other funds. To do so, compare this 5% hypothetical example with the 5% hypothetical examples that appear in the shareholder reports of the other funds.
Please note that the expenses shown in the table are meant to highlight the fund’s ongoing costs only and do not take into account the fees and expenses imposed under the variable contracts through which your investment in the fund is made. Therefore, the second line for each share class in the table is useful in comparing ongoing costs associated with an investment in vehicles (such as the fund) which fund benefits under variable annuity and variable life insurance contracts and to qualified pension and retirement plans only, and will not help you determine the relative total costs of investing in the fund through variable annuity and variable life insurance contracts. If the fees and expenses imposed under the variable contracts were included, your costs would have been higher.
| | | | | | | | | | | | | | | | | | |
| Share Class | | | | Annualized
Expense Ratio | | | Beginning
Account Value
7/01/10 | | | Ending
Account Value
12/31/10 | | | Expenses Paid
During Period (p)
7/01/10-12/31/10 | |
| Initial Class | | Actual | | | 0.72% | | | | $1,000.00 | | | | $1,053.16 | | | | $3.73 | |
| | Hypothetical (h) | | | 0.72% | | | | $1,000.00 | | | | $1,021.58 | | | | $3.67 | |
| Service Class | | Actual | | | 0.97% | | | | $1,000.00 | | | | $1,052.63 | | | | $5.02 | |
| | Hypothetical (h) | | | 0.97% | | | | $1,000.00 | | | | $1,020.32 | | | | $4.94 | |
| (h) | 5% class return per year before expenses. |
| (p) | Expenses paid is equal to each class’ annualized expense ratio, as shown above, multiplied by the average account value over the period, multiplied by the number of days in the period, divided by the number of days in the year. |
6
MFS Bond Portfolio
PORTFOLIO OF INVESTMENTS – 12/31/10
The Portfolio of Investments is a complete list of all securities owned by your fund. It is categorized by broad-based asset classes.
| | | | | | | | |
| Issuer | | Shares/Par | | | Value ($) | |
| | | | | | | | |
| BONDS – 94.5% | | | | | | | | |
| Aerospace – 1.1% | | | | | | | | |
| BE Aerospace, Inc., 8.5%, 2018 | | $ | 1,170,000 | | | $ | 1,281,150 | |
| Bombardier, Inc., 7.75%, 2020 (n) | | | 1,315,000 | | | | 1,416,911 | |
| | | | | | | | |
| | | | | | $ | 2,698,061 | |
| | | | | | | | |
| Airlines – 0.7% | | | | | | | | |
American Airlines Pass-Through Trust, 6.817%, 2012 | | $ | 1,169,000 | | | $ | 1,180,104 | |
| Continental Airlines, Inc., 7.25%, 2021 | | | 364,640 | | | | 406,574 | |
| | | | | | | | |
| | | | | | $ | 1,586,678 | |
| | | | | | | | |
| Asset-Backed & Securitized – 5.8% | | | | | | | | |
Anthracite Ltd., “A”, CDO, FRN,
0.62%, 2019 (z) | | $ | 516,879 | | | $ | 397,997 | |
ARCap REIT, Inc., CDO, “G”, 6.078%, 2045 (z) | | | 350,000 | | | | 42,875 | |
| Bayview Financial Revolving Mortgage Loan Trust, FRN, 1.86%, 2040 (z) | | | 351,971 | | | | 160,464 | |
| Brazilian Merchant Voucher Receivables Ltd., 5.911%, 2011 (z) | | | 112,526 | | | | 114,214 | |
Capital Trust Realty Ltd., CDO, 5.16%, 2035 (z) | | | 1,530,404 | | | | 1,538,056 | |
| Citigroup/Deutsche Bank Commercial Mortgage Trust, 5.322%, 2049 | | | 514,266 | | | | 533,047 | |
| Commercial Mortgage Acceptance Corp., FRN, 1.762%, 2030 (i) | | | 1,226,293 | | | | 57,680 | |
| Commercial Mortgage Pass-Through Certificates, “A4”, 5.306%, 2046 | | | 397,355 | | | | 414,436 | |
| Credit Suisse Mortgage Capital Certificate, 5.311%, 2039 | | | 454,000 | | | | 472,861 | |
| Crest Ltd., “A2”, CDO, 4.669%, 2018 (z) | | | 416,265 | | | | 398,574 | |
| Falcon Franchise Loan LLC, 6.5%, 2014 (z) | | | 174,827 | | | | 148,603 | |
Falcon Franchise Loan LLC, FRN, 3.058%, 2025 (i)(z) | | | 1,778,211 | | | | 136,922 | |
| First Union-Lehman Brothers Commercial Mortgage Trust, 7%, 2029 (n) | | | 331,225 | | | | 345,048 | |
| GMAC LLC, FRN, 6.02%, 2033 (z) | | | 800,000 | | | | 823,208 | |
| GMAC LLC, FRN, 7.643%, 2034 (n) | | | 825,000 | | | | 797,021 | |
| Greenwich Capital Commercial Funding Corp., FRN, 5.882%, 2038 | | | 350,000 | | | | 360,465 | |
| JPMorgan Chase Commercial Mortgage Securities Corp., 5.42%, 2049 | | | 1,020,006 | | | | 1,060,871 | |
| JPMorgan Chase Commercial Mortgage Securities Corp., FRN, 5.378%, 2042 (n) | | | 765,072 | | | | 386,600 | |
| JPMorgan Chase Commercial Mortgage Securities Corp., FRN, 5.817%, 2049 | | | 1,195,039 | | | | 1,250,315 | |
| JPMorgan Chase Commercial Mortgage Securities Corp., FRN, 5.988%, 2051 | | | 2,617,888 | | | | 2,741,945 | |
KKR Financial CLO Ltd., “C”, FRN, 1.735%, 2021 (n) | | | 505,395 | | | | 427,059 | |
| Lehman Brothers Commercial Conduit Mortgage Trust, FRN, 0.883%, 2030 (i) | | | 1,508,492 | | | | 34,526 | |
Merrill Lynch Mortgage Trust, FRN, 5.825%, 2050 | | | 234,000 | | | | 68,576 | |
| | | | | | | | |
| Issuer | | Shares/Par | | | Value ($) | |
| | | | | | | | |
| BONDS – continued | | | | | | | | |
| Asset-Backed & Securitized – continued | |
Morgan Stanley Capital I, Inc., FRN, 1.007%, 2030 (i)(n) | | $ | 3,041,127 | | | $ | 79,948 | |
PNC Mortgage Acceptance Corp., 7.1%, 2032 (z) | | | 334,887 | | | | 334,772 | |
| Prudential Securities Secured Financing Corp., FRN, 7.285%, 2013 (z) | | | 567,000 | | | | 569,025 | |
| Spirit Master Funding LLC, 5.05%, 2023 (z) | | | 366,740 | | | | 320,465 | |
| | | | | | | | |
| | | | | | $ | 14,015,573 | |
| | | | | | | | |
| Biotechnology – 0.3% | | | | | | | | |
| Life Technologies Corp., 6%, 2020 | | $ | 760,000 | | | $ | 814,063 | |
| | | | | | | | |
| Broadcasting – 2.1% | | | | | | | | |
| CBS Corp., 8.875%, 2019 | | $ | 760,000 | | | $ | 956,142 | |
| CBS Corp., 5.75%, 2020 | | | 440,000 | | | | 467,572 | |
| Inmarsat Finance PLC, 7.375%, 2017 (n) | | | 1,104,000 | | | | 1,159,200 | |
| NBC Universal, Inc., 5.95%, 2041 (n) | | | 1,069,000 | | | | 1,068,891 | |
| News America, Inc., 8.5%, 2025 | | | 770,000 | | | | 940,965 | |
| WPP Finance, 8%, 2014 | | | 366,000 | | | | 421,064 | |
| | | | | | | | |
| | | | | | $ | 5,013,834 | |
| | | | | | | | |
| Brokerage & Asset Managers – 0.4% | | | | | | | | |
| TD Ameritrade Holding Co., 4.15%, 2014 | | $ | 855,000 | | | $ | 884,150 | |
| | | | | | | | |
| Building – 1.7% | | | | | | | | |
| Mohawk Industries, Inc., 6.875%, 2016 | | $ | 2,340,000 | | | $ | 2,509,650 | |
| Owens Corning, Inc., 6.5%, 2016 | | | 1,415,000 | | | | 1,498,656 | |
| | | | | | | | |
| | | | | | $ | 4,008,306 | |
| | | | | | | | |
| Cable TV – 3.3% | | | | | | | | |
| Cablevision Systems Corp., 8%, 2020 | | $ | 1,105,000 | | | $ | 1,182,350 | |
| Cox Communications, Inc., 4.625%, 2013 | | | 994,000 | | | | 1,063,727 | |
| Cox Communications, Inc., 6.25%, 2018 (n) | | | 261,000 | | | | 291,502 | |
| DIRECTV Holdings LLC, 7.625%, 2016 | | | 1,620,000 | | | | 1,796,175 | |
| DIRECTV Holdings LLC, 5.875%, 2019 | | | 490,000 | | | | 532,553 | |
Myriad International Holdings B.V., 6.375%, 2017 (n) | | | 746,000 | | | | 781,360 | |
| TCI Communications, Inc., 9.8%, 2012 | | | 439,000 | | | | 477,822 | |
| Time Warner Cable, Inc., 8.25%, 2019 | | | 850,000 | | | | 1,055,847 | |
| Time Warner Cable, Inc., 5%, 2020 | | | 354,000 | | | | 364,315 | |
Time Warner Entertainment Co. LP, 8.375%, 2033 | | | 266,000 | | | | 335,686 | |
| | | | | | | | |
| | | | | | $ | 7,881,337 | |
| | | | | | | | |
| Chemicals – 3.4% | | | | | | | | |
| Ashland, Inc., 9.125%, 2017 | | $ | 1,432,000 | | | $ | 1,650,380 | |
| Dow Chemical Co., 8.55%, 2019 | | | 1,636,000 | | | | 2,050,314 | |
| Dow Chemical Co., 9.4%, 2039 | | | 364,000 | | | | 528,321 | |
| Lyondell Chemical Co., 11%, 2018 | | | 1,510,000 | | | | 1,710,075 | |
| Nalco Co., 8.25%, 2017 | | | 2,033,000 | | | | 2,203,264 | |
| | | | | | | | |
| | | | | | $ | 8,142,354 | |
| | | | | | | | |
| Computer Software – 0.9% | | | | | | | | |
Seagate Technology HDD Holdings, 6.375%, 2011 | | $ | 2,070,000 | | | $ | 2,124,338 | |
| | | | | | | | |
7
MFS Bond Portfolio
Portfolio of Investments – continued
| | | | | | | | |
| Issuer | | Shares/Par | | | Value ($) | |
| | | | | | | | |
| BONDS – continued | | | | | | | | |
| Conglomerates – 0.2% | | | | | | | | |
| Kennametal, Inc., 7.2%, 2012 | | $ | 526,000 | | | $ | 554,543 | |
| | | | | | | | |
| Consumer Products – 2.7% | | | | | | | | |
| Clorox Co., 5%, 2013 | | $ | 700,000 | | | $ | 747,693 | |
| Hasbro, Inc., 6.35%, 2040 | | | 1,544,000 | | | | 1,562,347 | |
| Newell Rubbermaid, Inc., 5.5%, 2013 | | | 1,702,000 | | | | 1,831,347 | |
| Newell Rubbermaid, Inc., 4.7%, 2020 | | | 771,000 | | | | 764,793 | |
| Whirlpool Corp., 8%, 2012 | | | 1,634,000 | | | | 1,760,826 | |
| | | | | | | | |
| | | | | | $ | 6,667,006 | |
| | | | | | | | |
| Consumer Services – 1.0% | | | | | | | | |
| Service Corp. International, 7.375%, 2014 | | $ | 820,000 | | | $ | 879,450 | |
| Service Corp. International, 7%, 2019 | | | 450,000 | | | | 450,000 | |
| Western Union Co., 5.4%, 2011 | | | 1,133,000 | | | | 1,177,841 | |
| | | | | | | | |
| | | | | | $ | 2,507,291 | |
| | | | | | | | |
| Containers – 1.3% | | | | | | | | |
| Crown Americas LLC, 7.625%, 2017 | | $ | 956,000 | | | $ | 1,027,700 | |
| Greif, Inc., 6.75%, 2017 | | | 1,136,000 | | | | 1,187,120 | |
| Owens-Illinois, Inc., 7.375%, 2016 | | | 850,000 | | | | 903,125 | |
| | | | | | | | |
| | | | | | $ | 3,117,945 | |
| | | | | | | | |
| Defense Electronics – 0.6% | | | | | | | | |
BAE Systems Holdings, Inc., 6.375%, 2019 (n) | | $ | 1,358,000 | | | $ | 1,509,353 | |
| | | | | | | | |
| Electronics – 0.6% | | | | | | | | |
| Tyco Electronics Group S.A., 6.55%, 2017 | | $ | 360,000 | | | $ | 409,109 | |
| Tyco Electronics Group S.A., 7.125%, 2037 | | | 897,000 | | | | 1,030,321 | |
| | | | | | | | |
| | | | | | $ | 1,439,430 | |
| | | | | | | | |
| Emerging Market Quasi-Sovereign – 2.3% | |
| BNDES Participacoes S.A., 6.5%, 2019 (n) | | $ | 344,000 | | | $ | 377,540 | |
| Corporacion Nacional del Cobre de Chile, 3.75%, 2020 (n) | | | 330,000 | | | | 312,687 | |
| Gaz Capital S.A., 8.125%, 2014 (n) | | | 409,000 | | | | 462,170 | |
KazMunaiGaz Finance B.V., 11.75%, 2015 (n) | | | 403,000 | | | | 500,204 | |
| Majapahit Holding B.V., 7.75%, 2020 (n) | | | 589,000 | | | | 678,823 | |
| Qatari Diar Finance Q.S.C., 5%, 2020 (n) | | | 938,000 | | | | 933,546 | |
Qtel International Finance Ltd., 7.875%, 2019 (n) | | | 184,000 | | | | 219,837 | |
Qtel International Finance Ltd., 7.875%, 2019 | | | 205,000 | | | | 244,927 | |
Qtel International Finance Ltd., 4.75%, 2021 (n) | | | 360,000 | | | | 343,466 | |
Sinochem Overseas Capital Co. Ltd., 4.5%, 2020 (n) | | | 100,000 | | | | 98,563 | |
| VEB Finance Ltd., 6.902%, 2020 (n) | | | 653,000 | | | | 684,018 | |
| VTB Capital S.A., 6.465%, 2015 (n) | | | 305,000 | | | | 317,566 | |
| VTB Capital S.A., 6.551%, 2020 (n) | | | 403,000 | | | | 395,948 | |
| | | | | | | | |
| | | | | | $ | 5,569,295 | |
| | | | | | | | |
| Energy – Independent – 4.2% | | | | | | | | |
| Anadarko Petroleum Corp., 6.375%, 2017 | | $ | 1,337,000 | | | $ | 1,456,403 | |
| Anadarko Petroleum Corp., 6.45%, 2036 | | | 804,000 | | | | 801,901 | |
| Anadarko Petroleum Corp., 6.2%, 2040 | | | 750,000 | | | | 732,136 | |
| Newfield Exploration Co., 6.625%, 2016 | | | 1,715,000 | | | | 1,762,163 | |
| | | | | | | | |
| Issuer | | Shares/Par | | | Value ($) | |
| | | | | | | | |
| BONDS – continued | | | | | | | | |
| Energy – Independent – continued | | | | | | | | |
| Nexen, Inc., 6.4%, 2037 | | $ | 456,000 | | | $ | 441,810 | |
| Nexen, Inc., 7.5%, 2039 | | | 500,000 | | | | 543,748 | |
| Pioneer Natural Resources Co., 6.65%, 2017 | | | 1,100,000 | | | | 1,168,318 | |
| Pioneer Natural Resources Co., 7.5%, 2020 | | | 518,000 | | | | 568,778 | |
| Southwestern Energy Co., 7.5%, 2018 | | | 1,851,000 | | | | 2,087,003 | |
| Talisman Energy, Inc., 7.75%, 2019 | | | 590,000 | | | | 728,386 | |
| | | | | | | | |
| | | | | | $ | 10,290,646 | |
| | | | | | | | |
| Energy – Integrated – 0.5% | | | | | | | | |
| BP Capital Markets PLC, 4.5%, 2020 | | $ | 747,000 | | | $ | 745,199 | |
| Hess Corp., 8.125%, 2019 | | | 440,000 | | | | 555,883 | |
| | | | | | | | |
| | | | | | $ | 1,301,082 | |
| | | | | | | | |
| Financial Institutions – 2.0% | | | | | | | | |
| CIT Group, Inc., 10.25%, 2017 | | $ | 1,520,628 | | | $ | 1,553,019 | |
| General Electric Capital Corp., 3.75%, 2014 | | | 413,000 | | | | 426,926 | |
| General Electric Capital Corp., 5.5%, 2020 | | | 1,470,000 | | | | 1,572,146 | |
| GMAC, Inc., 7.25%, 2011 | | | 609,000 | | | | 612,045 | |
International Lease Finance Corp., 8.75%, 2017 (n) | | | 90,000 | | | | 96,525 | |
International Lease Finance Corp., 7.125%, 2018 (n) | | | 570,000 | | | | 605,625 | |
| | | | | | | | |
| | | | | | $ | 4,866,286 | |
| | | | | | | | |
| Food & Beverages – 4.7% | | | | | | | | |
| Anheuser-Busch InBev S.A., 7.2%, 2014 (n) | | $ | 1,280,000 | | | $ | 1,463,802 | |
| Anheuser-Busch InBev S.A., 7.75%, 2019 (n) | | | 610,000 | | | | 759,052 | |
| Del Monte Foods Co., 7.5%, 2019 | | | 1,485,000 | | | | 1,731,881 | |
| Kraft Foods, Inc., 6.125%, 2018 | | | 920,000 | | | | 1,051,927 | |
| Kraft Foods, Inc., 6.5%, 2040 | | | 555,000 | | | | 621,949 | |
| Miller Brewing Co., 5.5%, 2013 (n) | | | 1,724,000 | | | | 1,871,224 | |
| Tyson Foods, Inc., 7.35%, 2016 | | | 1,800,000 | | | | 1,974,375 | |
| Wm. Wrigley Jr. Co., 3.05%, 2013 (n) | | | 1,797,000 | | | | 1,835,490 | |
| | | | | | | | |
| | | | | | $ | 11,309,700 | |
| | | | | | | | |
| Food & Drug Stores – 0.4% | | | | | | | | |
| CVS Caremark Corp., 3.25%, 2015 | | $ | 296,000 | | | $ | 300,822 | |
| CVS Caremark Corp., 5.75%, 2017 | | | 664,000 | | | | 738,800 | |
| | | | | | | | |
| | | | | | $ | 1,039,622 | |
| | | | | | | | |
| Forest & Paper Products – 0.6% | | | | | | | | |
| Georgia-Pacific Corp., 7.125%, 2017 (n) | | $ | 1,000,000 | | | $ | 1,065,000 | |
| Georgia-Pacific Corp., 5.4%, 2020 (n) | | | 389,000 | | | | 384,596 | |
| | | | | | | | |
| | | | | | $ | 1,449,596 | |
| | | | | | | | |
| Gaming & Lodging – 1.3% | | | | | | | | |
| Host Hotels & Resorts, Inc., 6.75%, 2016 | | $ | 1,600,000 | | | $ | 1,634,000 | |
| Wyndham Worldwide Corp., 6%, 2016 | | | 1,530,000 | | | | 1,601,046 | |
| | | | | | | | |
| | | | | | $ | 3,235,046 | |
| | | | | | | | |
| Insurance – 3.4% | | | | | | | | |
| Aflac, Inc., 6.45%, 2040 | | $ | 1,290,000 | | | $ | 1,321,190 | |
| American International Group, 6.4%, 2020 | | | 2,000,000 | | | | 2,098,418 | |
ING Groep N.V., 5.775% to 2015, FRN to 2049 | | | 792,000 | | | | 681,120 | |
Metropolitan Life Global Funding, 5.125%, 2013 (n) | | | 600,000 | | | | 646,031 | |
8
MFS Bond Portfolio
Portfolio of Investments – continued
| | | | | | | | |
| Issuer | | Shares/Par | | | Value ($) | |
| | | | | | | | |
| BONDS -– continued | | | | | | | | |
| Insurance – continued | | | | | | | | |
Metropolitan Life Global Funding, 5.125%, 2014 (n) | | $ | 370,000 | | | $ | 402,466 | |
| Prudential Financial, Inc., 4.75%, 2015 | | | 631,000 | | | | 667,589 | |
| Prudential Financial, Inc., 5.375%, 2020 | | | 470,000 | | | | 491,128 | |
| Unum Group, 7.125%, 2016 | | | 500,000 | | | | 561,605 | |
| UnumProvident Corp., 6.85%, 2015 (n) | | | 1,340,000 | | | | 1,486,445 | |
| | | | | | | | |
| | | | | | $ | 8,355,992 | |
| | | | | | | | |
| Insurance – Health – 0.4% | | | | | | | | |
| Humana, Inc., 7.2%, 2018 | | $ | 754,000 | | | $ | 851,755 | |
| | | | | | | | |
| Insurance – Property & Casualty – 2.2% | |
| Aon Corp., 6.25%, 2040 | | $ | 843,000 | | | $ | 866,585 | |
| AXIS Capital Holdings Ltd., 5.75%, 2014 | | | 855,000 | | | | 909,173 | |
| AXIS Capital Holdings Ltd., 5.875%, 2020 | | | 190,000 | | | | 189,702 | |
| Chubb Corp., 6.375% to 2017, FRN to 2067 | | | 279,000 | | | | 290,856 | |
| CNA Financial Corp., 5.875%, 2020 | | | 1,570,000 | | | | 1,563,207 | |
| XL Group PLC, 6.5% to 2017, FRN to 2049 | | | 663,000 | | | | 570,180 | |
ZFS Finance USA Trust V, 6.5% to 2017, FRN to 2067 (n) | | | 896,000 | | | | 873,600 | |
| | | | | | | | |
| | | | | | $ | 5,263,303 | |
| | | | | | | | |
| Machinery & Tools – 0.9% | | | | | | | | |
| Case New Holland, Inc., 7.875%, 2017 (n) | | $ | 1,989,000 | | | $ | 2,172,981 | |
| | | | | | | | |
| Major Banks – 9.6% | | | | | | | | |
BAC Capital Trust XIV, 5.63% to 2012, FRN to 2049 | | $ | 320,000 | | | $ | 227,264 | |
| Bank of America Corp., 5.65%, 2018 | | | 580,000 | | | | 592,628 | |
| Bank of America Corp., 7.625%, 2019 | | | 990,000 | | | | 1,139,921 | |
| Bank Of America Corp., 5.625%, 2020 | | | 235,000 | | | | 239,581 | |
| Bank Of America Corp., 5.875%, 2021 | | | 1,500,000 | | | | 1,551,912 | |
Bank of America Corp., 8% to 2018, FRN to 2049 | | | 533,000 | | | | 537,157 | |
| BB&T Corp., 3.95%, 2016 | | | 500,000 | | | | 516,071 | |
BNP Paribas, 7.195% to 2037, FRN to 2049 (n) | | | 700,000 | | | | 668,500 | |
Commonwealth Bank of Australia, 5%, 2019 (n) | | | 400,000 | | | | 418,688 | |
| Credit Suisse (USA), Inc., 6%, 2018 | | | 180,000 | | | | 193,013 | |
| Goldman Sachs Group, Inc., 5.625%, 2017 | | | 1,123,000 | | | | 1,187,503 | |
| Goldman Sachs Group, Inc., 7.5%, 2019 | | | 1,927,000 | | | | 2,246,865 | |
| Goldman Sachs Group, Inc., 5.375%, 2020 | | | 1,000,000 | | | | 1,033,361 | |
| HSBC USA, Inc., 4.875%, 2020 | | | 1,540,000 | | | | 1,530,865 | |
| JPMorgan Chase & Co., 6%, 2017 | | | 1,000,000 | | | | 1,108,562 | |
| JPMorgan Chase Capital XXII, 6.45%, 2037 | | | 758,000 | | | | 755,043 | |
| JPMorgan Chase Capital XXVII, 7%, 2039 | | | 199,000 | | | | 208,359 | |
| Macquarie Group Ltd., 6%, 2020 (n) | | | 1,000,000 | | | | 1,003,917 | |
| Merrill Lynch & Co., Inc., 6.15%, 2013 | | | 500,000 | | | | 536,504 | |
| Merrill Lynch & Co., Inc., 6.05%, 2016 | | | 349,000 | | | | 359,579 | |
| Morgan Stanley, 5.75%, 2016 | | | 906,000 | | | | 966,226 | |
| Morgan Stanley, 6.625%, 2018 | | | 701,000 | | | | 760,423 | |
| Morgan Stanley, 7.3%, 2019 | | | 540,000 | | | | 607,845 | |
| PNC Funding Corp., 5.625%, 2017 | | | 1,095,000 | | | | 1,170,485 | |
| Santander UK PLC, 3.875%, 2014 (n) | | | 413,000 | | | | 409,257 | |
| UFJ Finance Aruba AEC, 6.75%, 2013 | | | 1,028,000 | | | | 1,146,327 | |
| | | | | | | | |
| Issuer | | Shares/Par | | | Value ($) | |
| | | | | | | | |
| BONDS – continued | | | | | | | | |
| Major Banks – continued | | | | | | | | |
UniCredito Luxembourg Finance S.A., 6%, 2017 (n) | | $ | 510,000 | | | $ | 498,730 | |
| Wachovia Corp., 6.605%, 2025 | | | 1,270,000 | | | | 1,309,124 | |
Wells Fargo & Co., 7.98% to 2018, FRN to 2049 | | | 348,000 | | | | 367,140 | |
| | | | | | | | |
| | | | | | $ | 23,290,850 | |
| | | | | | | | |
| Medical & Health Technology & Services – 0.8% | | | | | |
| Hospira, Inc., 6.05%, 2017 | | $ | 906,000 | | | $ | 1,015,016 | |
| McKesson Corp., 5.7%, 2017 | | | 770,000 | | | | 855,216 | |
| McKesson Corp., 7.5%, 2019 | | | 120,000 | | | | 145,771 | |
| | | | | | | | |
| | | | | | $ | 2,016,003 | |
| | | | | | | | |
| Metals & Mining – 5.3% | | | | | | | | |
| ArcelorMittal, 6.125%, 2018 | | $ | 263,000 | | | $ | 280,223 | |
| ArcelorMittal, 9.85%, 2019 | | | 455,000 | | | | 575,038 | |
| Freeport-McMoRan Copper & Gold, Inc., 8.25%, 2015 | | | 708,000 | | | | 746,055 | |
| Freeport-McMoRan Copper & Gold, Inc., 8.375%, 2017 | | | 1,517,000 | | | | 1,678,181 | |
Gold Fields Orogen Holdings Ltd., 4.875%, 2020 (n) | | | 927,000 | | | | 886,800 | |
| International Steel Group, Inc., 6.5%, 2014 | | | 945,000 | | | | 1,029,769 | |
| Peabody Energy Corp., 5.875%, 2016 | | | 500,000 | | | | 502,500 | |
| Peabody Energy Corp., 7.375%, 2016 | | | 1,470,000 | | | | 1,631,700 | |
| Southern Copper Corp., 6.75%, 2040 | | | 1,681,000 | | | | 1,740,670 | |
| Teck Resources Ltd., 10.25%, 2016 | | | 1,035,000 | | | | 1,280,813 | |
| Teck Resources Ltd., 10.75%, 2019 | | | 940,000 | | | | 1,222,000 | |
| Vale Overseas Ltd., 6.875%, 2039 | | | 1,110,000 | | | | 1,226,472 | |
| | | | | | | | |
| | | | | | $ | 12,800,221 | |
| | | | | | | | |
| Mortgage-Backed – 0.0% | | | | | | | | |
| Fannie Mae, 7.5%, 2030 - 2031 | | $ | 69,194 | | | $ | 79,417 | |
| | | | | | | | |
| | | | | | $ | 79,417 | |
| | | | | | | | |
| Natural Gas – Pipeline – 4.6% | | | | | | | | |
| CenterPoint Energy, Inc., 7.875%, 2013 | | $ | 1,383,000 | | | $ | 1,563,392 | |
| El Paso Pipeline Partners LP, 6.5%, 2020 | | | 940,000 | | | | 986,240 | |
| Energy Transfer Partners LP, 8.5%, 2014 | | | 1,252,000 | | | | 1,453,653 | |
| Energy Transfer Partners LP, 9.7%, 2019 | | | 480,000 | | | | 620,381 | |
Enterprise Products Operating LP, 5.65%, 2013 | | | 354,000 | | | | 381,177 | |
Enterprise Products Partners LP, 6.3%, 2017 | | | 540,000 | | | | 609,327 | |
Enterprise Products Partners LP, FRN, 8.375%, 2066 | | | 506,000 | | | | 543,316 | |
Enterprise Products Partners LP, FRN, 7.034%, 2068 | | | 267,000 | | | | 277,013 | |
Kinder Morgan Energy Partners, 6.85%, 2020 | | | 370,000 | | | | 423,940 | |
| Kinder Morgan Energy Partners LP, 5.125%, 2014 | | | 410,000 | | | | 444,837 | |
Kinder Morgan Energy Partners LP, 7.4%, 2031 | | | 581,000 | | | | 649,801 | |
9
MFS Bond Portfolio
Portfolio of Investments – continued
| | | | | | | | |
| Issuer | | Shares/Par | | | Value ($) | |
| | | | | | | | |
| BONDS – continued | | | | | | | | |
| Natural Gas – Pipeline – continued | | | | | | | | |
Plains All American Pipeline, LP, 3.95%, 2015 | | $ | 1,290,000 | | | $ | 1,332,929 | |
| Rockies Express Pipeline, 5.625%, 2020 (n) | | | 697,000 | | | | 673,738 | |
| Spectra Energy Capital LLC, 8%, 2019 | | | 942,000 | | | | 1,147,597 | |
| | | | | | | | |
| | | | | | $ | 11,107,341 | |
| | | | | | | | |
| Network & Telecom – 1.9% | | | | | | | | |
| CenturyLink, Inc., 7.6%, 2039 | | $ | 1,670,000 | | | $ | 1,683,188 | |
| Qwest Corp., 7.875%, 2011 | | | 1,010,000 | | | | 1,040,300 | |
| Verizon New York, Inc., 6.875%, 2012 | | | 51,000 | | | | 54,404 | |
| Windstream Corp., 8.625%, 2016 | | | 1,800,000 | | | | 1,894,500 | |
| | | | | | | | |
| | | | | | $ | 4,672,392 | |
| | | | | | | | |
| Oil Services – 0.1% | | | | | | | | |
| Pride International, Inc., 6.875%, 2020 | | $ | 248,000 | | | $ | 257,300 | |
| | | | | | | | |
| Oils – 0.5% | | | | | | | | |
LUKOIL International Finance B.V., 6.125%, 2020 (n) | | $ | 1,199,000 | | | $ | 1,200,439 | |
| | | | | | | | |
| Other Banks & Diversified Financials – 5.0% | | | | | |
American Express Centurion Bank, 5.55%, 2012 | | $ | 590,000 | | | $ | 631,075 | |
| American Express Co., 8.125%, 2019 | | | 320,000 | | | | 398,148 | |
| Banco Bradesco S.A., 6.75%, 2019 (n) | | | 786,000 | | | | 837,090 | |
| Banco Santander Chile, 2.875%, 2012 (n) | | | 1,047,000 | | | | 1,052,012 | |
Banco Santander U.S. Debt S.A.U., 3.781%, 2015 (n) | | | 1,500,000 | | | | 1,409,375 | |
| Capital One Financial Corp., 8.8%, 2019 | | | 1,000,000 | | | | 1,230,039 | |
| Capital One Financial Corp., 10.25%, 2039 | | | 510,000 | | | | 545,700 | |
| Citigroup, Inc., 6.125%, 2018 | | | 635,000 | | | | 695,660 | |
| Citigroup, Inc., 8.5%, 2019 | | | 928,000 | | | | 1,152,052 | |
| Citigroup, Inc., 5.375%, 2020 | | | 800,000 | | | | 831,206 | |
| Citigroup, Inc., 8.125%, 2039 | | | 500,000 | | | | 636,067 | |
| Discover Bank, 7%, 2020 | | | 1,426,000 | | | | 1,533,010 | |
| Grupo Financiero BBVA Bancomer S.A. de C.V., 7.25%, 2020 (n) | | | 233,000 | | | | 246,468 | |
Nordea Bank AB, 5.424% to 2015, FRN to 2049 (n) | | | 412,000 | | | | 390,483 | |
| UBS Preferred Funding Trust V, 6.243% to 2016, FRN to 2049 | | | 547,000 | | | | 525,120 | |
| | | | | | | | |
| | | | | | $ | 12,113,505 | |
| | | | | | | | |
| Pharmaceuticals – 0.8% | | | | | | | | |
| Celgene Corp., 2.45%, 2015 | | $ | 606,000 | | | $ | 588,625 | |
| Mylan Laboratories, Inc., 7.625%, 2017 (n) | | | 1,216,000 | | | | 1,293,520 | |
| | | | | | | | |
| | | | | | $ | 1,882,145 | |
| | | | | | | | |
| Pollution Control – 0.9% | | | | | | | | |
| Allied Waste North America, Inc., 6.875%, 2017 | | $ | 1,110,000 | | | $ | 1,221,000 | |
| Republic Services, Inc., 5.25%, 2021 | | | 860,000 | | | | 906,339 | |
| | | | | | | | |
| | | | | | $ | 2,127,339 | |
| | | | | | | | |
| Printing & Publishing – 0.1% | | | | | | | | |
| Pearson PLC, 5.5%, 2013 (n) | | $ | 260,000 | | | $ | 280,382 | |
| | | | | | | | |
| | | | | | | | |
| Issuer | | Shares/Par | | | Value ($) | |
| | | | | | | | |
| BONDS – continued | | | | | | | | |
| Railroad & Shipping – 0.2% | | | | | | | | |
| CSX Corp., 7.375%, 2019 | | $ | 165,000 | | | $ | 199,029 | |
| Kansas City Southern, 7.375%, 2014 | | | 330,000 | | | | 344,850 | |
| | | | | | | | |
| | | | | | $ | 543,879 | |
| | | | | | | | |
| Real Estate – 2.9% | | | | | | | | |
| Boston Properties LP, REIT, 4.125%, 2021 | | $ | 1,260,000 | | | $ | 1,194,523 | |
| HRPT Properties Trust, REIT, 6.25%, 2016 | | | 1,027,000 | | | | 1,071,550 | |
| Liberty Property LP, REIT, 5.5%, 2016 | | | 660,000 | | | | 714,538 | |
| Simon Property Group, Inc., REIT, 5.75%, 2015 | | | 440,000 | | | | 488,836 | |
| Simon Property Group, Inc., REIT, 10.35%, 2019 | | | 1,026,000 | | | | 1,402,746 | |
| WEA Finance LLC, REIT, 6.75%, 2019 (n) | | | 1,947,000 | | | | 2,169,003 | |
| | | | | | | | |
| | | | | �� | $ | 7,041,196 | |
| | | | | | | | |
| Retailers – 1.2% | | | | | | | | |
| Limited Brands, Inc., 7%, 2020 | | $ | 880,000 | | | $ | 928,400 | |
| Macy’s, Inc., 6.625%, 2011 | | | 1,236,000 | | | | 1,251,450 | |
| Staples, Inc., 7.75%, 2011 | | | 370,000 | | | | 375,956 | |
| Staples, Inc., 9.75%, 2014 | | | 335,000 | | | | 405,970 | |
| | | | | | | | |
| | | | | | $ | 2,961,776 | |
| | | | | | | | |
| Specialty Stores – 0.4% | | | | | | | | |
| Advance Auto Parts, Inc., 5.75%, 2020 | | $ | 965,000 | | | $ | 1,008,077 | |
| | | | | | | | |
| Telecommunications – Wireless – 2.6% | |
| American Tower Corp., 4.625%, 2015 | | $ | 1,770,000 | | | $ | 1,849,098 | |
| American Tower Corp., 4.5%, 2018 | | | 1,150,000 | | | | 1,139,956 | |
Crown Castle International Corp., 7.75%, 2017 (n) | | | 960,000 | | | | 1,048,800 | |
| Crown Castle Towers LLC, 6.113%, 2040 (n) | | | 955,000 | | | | 996,372 | |
| Rogers Cable, Inc., 5.5%, 2014 | | | 364,000 | | | | 397,535 | |
| Rogers Wireless, Inc., 7.25%, 2012 | | | 535,000 | | | | 596,161 | |
| Vodafone Group PLC, 5.625%, 2017 | | | 201,000 | | | | 224,386 | |
| | | | | | | | |
| | | | | | $ | 6,252,308 | |
| | | | | | | | |
| Telephone Services – 0.9% | | | | | | | | |
| Embarq Corp., 7.082%, 2016 | | $ | 540,000 | | | $ | 597,190 | |
| Frontier Communications, 8.75%, 2022 (z) | | | 1,509,000 | | | | 1,644,810 | |
| | | | | | | | |
| | | | | | $ | 2,242,000 | |
| | | | | | | | |
| Tobacco – 3.0% | | | | | | | | |
| Altria Group, Inc., 9.95%, 2038 | | $ | 1,510,000 | | | $ | 2,127,789 | |
BAT International Finance PLC, 9.5%, 2018 (n) | | | 600,000 | | | | 789,583 | |
| Lorillard Tobacco Co., 8.125%, 2019 | | | 2,023,000 | | | | 2,251,053 | |
| Reynolds American, Inc., 7.25%, 2012 | | | 881,000 | | | | 942,093 | |
| Reynolds American, Inc., 6.75%, 2017 | | | 1,100,000 | | | | 1,229,489 | |
| | | | | | | | |
| | | | | | $ | 7,340,007 | |
| | | | | | | | |
| Transportation – Services – 0.8% | | | | | | | | |
| Erac USA Finance Co., 6.375%, 2017 (n) | | $ | 200,000 | | | $ | 222,027 | |
| Erac USA Finance Co., 7%, 2037 (n) | | | 1,509,000 | | | | 1,624,929 | |
| | | | | | | | |
| | | | | | $ | 1,846,956 | |
| | | | | | | | |
10
MFS Bond Portfolio
Portfolio of Investments – continued
| | | | | | | | |
| Issuer | | Shares/Par | | | Value ($) | |
| | | | | | | | |
| BONDS – continued | | | | | | | | |
| Utilities – Electric Power – 3.9% | | | | | | | | |
Allegheny Energy Supply Co. LLC, 8.25%, 2012 (n) | | $ | 610,000 | | | $ | 654,460 | |
| CenterPoint Energy, Inc., 5.95%, 2017 | | | 800,000 | | | | 859,556 | |
| CMS Energy Corp., 6.25%, 2020 | | | 995,000 | | | | 1,015,429 | |
| DPL, Inc., 6.875%, 2011 | | | 614,000 | | | | 637,218 | |
| Duke Energy Corp., 5.65%, 2013 | | | 930,000 | | | | 1,021,225 | |
| EDP Finance B.V., 6%, 2018 (n) | | | 1,863,000 | | | | 1,741,301 | |
| Enersis S.A., 7.375%, 2014 | | | 686,000 | | | | 758,176 | |
| Entergy Corp., 5.125%, 2020 | | | 808,000 | | | | 797,143 | |
| Oncor Electric Delivery Co., 6.8%, 2018 | | | 561,000 | | | | 656,690 | |
| PSEG Power LLC, 5.32%, 2016 | | | 288,000 | | | | 315,130 | |
System Energy Resources, Inc., 5.129%, 2014 (z) | | | 362,809 | | | | 374,564 | |
| Waterford 3 Funding Corp., 8.09%, 2017 | | | 681,001 | | | | 688,799 | |
| | | | | | | | |
| | | | | | $ | 9,519,691 | |
| | | | | | | | |
Total Bonds (Identified Cost, $218,492,263) | | | | | | $ | 229,252,790 | |
| | | | | | | | |
| | | | | | | | |
| Issuer | | Shares/Par | | | Value ($) | |
| | | | | | | | |
| FLOATING RATE LOANS (g)(r) – 0.3% | |
| Automotive – 0.3% | | | | | | | | |
Ford Motor Co., Term Loan B1,
3.02%, 2013
(Identified Cost, $629,349) | | $ | 670,576 | | | $ | 667,313 | |
| | | | | | | | |
| MONEY MARKET FUNDS (v) – 3.8% | |
| MFS Institutional Money Market Portfolio, 0.18%, at Cost and Net Asset Value | | | 9,282,745 | | | $ | 9,282,745 | |
| | | | | | | | |
Total Investments (Identified Cost, $228,404,357) | | | | | | $ | 239,202,848 | |
| | | | | | | | |
OTHER ASSETS, LESS LIABILITIES – 1.4% | | | | | | | 3,358,689 | |
| | | | | | | | |
| Net Assets – 100.0% | | | | | | $ | 242,561,537 | |
| | | | | | | | |
| (g) | | The rate shown represents a weighted average coupon rate on settled positions at period end, unless otherwise indicated. |
| (i) | | Interest only security for which the fund receives interest on notional principal (Par amount). Par amount shown is the notional principal and does not reflect the cost of the security. |
| (n) | | Securities exempt from registration under Rule 144A of the Securities Act of 1933. These securities may be sold in the ordinary course of business in transactions exempt from registration, normally to qualified institutional buyers. At period end, the aggregate value of these securities was $47,765,972, representing 19.7% of net assets. |
| (r) | | Remaining maturities of floating rate loans may be less than stated maturities shown as a result of contractual or optional prepayments by the borrower. Such prepayments cannot be predicted with certainty. These loans may be subject to restrictions on resale. Floating rate loans generally have rates of interest which are determined periodically by reference to a base lending rate plus a premium. |
| (v) | | Underlying fund that is available only to investment companies managed by MFS. The rate quoted is the annualized seven-day yield of the fund at period end. |
| (z) | | Restricted securities are not registered under the Securities Act of 1933 and are subject to legal restrictions on resale. These securities generally may be resold in transactions exempt from registration or to the public if the securities are subsequently registered. Disposal of these securities may involve time-consuming negotiations and prompt sale at an acceptable price may be difficult. The fund holds the following restricted securities: |
| | | | | | | | | | |
| Restricted Securities | | Acquisition Date | | Cost | | | Value | |
| ARCap REIT, Inc., CDO, “G”, 6.078%, 2045 | | 9/21/04 | | | $330,606 | | | | $42,875 | |
| Anthracite Ltd., “A”, CDO, FRN, 0.62%, 2019 | | 1/15/10 | | | 369,350 | | | | 397,997 | |
| Bayview Financial Revolving Mortgage Loan Trust, FRN, 1.86%, 2040 | | 3/01/06 | | | 351,971 | | | | 160,464 | |
| Brazilian Merchant Voucher Receivables Ltd., 5.911%, 2011 | | 3/08/07 | | | 112,593 | | | | 114,214 | |
| Capital Trust Realty Ltd., CDO, 5.16%, 2035 | | 9/14/10 - 9/16/10 | | | 1,531,921 | | | | 1,538,056 | |
| Crest Ltd., “A2”, CDO, 4.669%, 2018 | | 3/02/10 | | | 339,237 | | | | 398,574 | |
| Falcon Franchise Loan LLC, 6.5%, 2014 | | 7/15/05 | | | 165,328 | | | | 148,603 | |
| Falcon Franchise Loan LLC, FRN, 3.058%, 2025 | | 1/29/03 | | | 168,523 | | | | 136,922 | |
| Frontier Communications, 8.75%, 2022 | | 11/04/10 | | | 1,767,027 | | | | 1,644,810 | |
| GMAC LLC, FRN, 6.02%, 2033 | | 3/20/02 | | | 664,883 | | | | 823,208 | |
| PNC Mortgage Acceptance Corp., 7.1%, 2032 | | 3/25/08 | | | 334,887 | | | | 334,772 | |
| Prudential Securities Secured Financing Corp., FRN, 7.285%, 2013 | | 12/06/04 | | | 585,313 | | | | 569,025 | |
| Spirit Master Funding LLC, 5.05%, 2023 | | 10/04/05 | | | 363,226 | | | | 320,465 | |
| System Energy Resources, Inc., 5.129%, 2014 | | 4/16/04 - 9/08/04 | | | 362,887 | | | | 374,564 | |
| Total Restricted Securities | | | | | | | | | $7,004,549 | |
| % of Net Assets | | | | | | | | | 2.9% | |
11
MFS Bond Portfolio
Portfolio of Investments – continued
The following abbreviations are used in this report and are defined:
| CDO | | Collateralized Debt Obligation |
| CLO | | Collateralized Loan Obligation |
| FRN | | Floating Rate Note. Interest rate resets periodically and may not be the rate reported at period end. |
| PLC | | Public Limited Company |
| REIT | | Real Estate Investment Trust |
Derivative Contracts at 12/31/10
Swap Agreements at 12/31/10
| | | | | | | | | | | | | | | | | | | | |
| Expiration | | | | Notional
Amount | | | Counterparty | | Cash Flows to
Receive | | | Cash Flows
to Pay | | | Fair
Value | |
| Liability Derivatives | | | | | | | | | | | | | | | | | | |
| Credit Default Swaps | | | | | | | | | | | | | | | | | | |
| 12/20/12 | | USD | | | 910,000 | | | Merrill Lynch International | | | 1.0% (fixed rate) | | | | (1) | | | | $(335,335 | ) |
| | | | | | | | | | | | | | | | | | | | |
| (1) | | Fund, as protection seller, to pay notional amount upon a defined credit event by MBIA, Inc., 9.375%, 2/15/11, a Ba3 rated bond. The fund entered into the contract to gain issuer exposure. |
| | | The credit ratings presented here are an indicator of the current payment/performance risk of the related swap, the reference obligation for which may be either a single security or, in case of a credit default index, a basket of securities issued by corporate or sovereign issuers. Each reference security, including each individual security within a reference basket of securities, is assigned a rating from Moody’s Investor Service. If not rated by Moody’s, the rating will be that assigned by Standard & Poor’s. Likewise, if not assigned by Standard & Poor’s, it will be based on the rating assigned by Fitch, Inc. The ratings for a credit default index are calculated by MFS as a weighted average of the external credit ratings of the individual securities that compose the index's reference basket of securities. |
| | | At December 31, 2010, the fund had sufficient cash and/or other liquid securities to cover any commitments under these derivative contracts. |
See Notes to Financial Statements
12
MFS Bond Portfolio
FINANCIAL STATEMENTS | STATEMENT OF ASSETS AND LIABILITIES
This statement represents your fund’s balance sheet, which details the assets and liabilities comprising the total value of the fund.
| | | | | | | | |
At 12/31/10 | | | | | | | | |
Assets | | | | | | | | |
Investments – | | | | | | | | |
Non-affiliated issuers, at value (identified cost, $219,121,612) | | | $229,920,103 | | | | | |
Underlying funds, at cost and value | | | 9,282,745 | | | | | |
Total investments, at value (identified cost, $228,404,357) | | | $239,202,848 | | | | | |
Cash | | | 17,490 | | | | | |
Restricted cash | | | 290,000 | | | | | |
Receivables for | | | | | | | | |
Fund shares sold | | | 141,173 | | | | | |
Interest | | | 3,382,416 | | | | | |
Other assets | | | 7,468 | | | | | |
Total assets | | | | | | | $243,041,395 | |
Liabilities | | | | | | | | |
Payables for | | | | | | | | |
Fund shares reacquired | | | $61,362 | | | | | |
Swaps, at value | | | 335,335 | | | | | |
Payable to affiliates | | | | | | | | |
Investment adviser | | | 7,948 | | | | | |
Distribution and/or service fees | | | 2,006 | | | | | |
Administrative services fee | | | 474 | | | | | |
Payable for Trustees’ compensation | | | 69 | | | | | |
Accrued expenses and other liabilities | | | 72,664 | | | | | |
Total liabilities | | | | | | | $479,858 | |
Net assets | | | | | | | $242,561,537 | |
Net assets consist of | | | | | | | | |
Paid-in capital | | | $226,144,836 | | | | | |
Unrealized appreciation (depreciation) on investments | | | 10,463,156 | | | | | |
Accumulated net realized gain (loss) on investments | | | (6,570,902 | ) | | | | |
Undistributed net investment income | | | 12,524,447 | | | | | |
Net assets | | | | | | | $242,561,537 | |
Shares of beneficial interest outstanding | | | | | | | 21,213,903 | |
| | | | | | | | | | | | |
| | | Net assets | | | Shares
outstanding | | | Net asset value
per share | |
Initial Class | | | $95,584,452 | | | | 8,316,870 | | | | $11.49 | |
Service Class | | | 146,977,085 | | | | 12,897,033 | | | | 11.40 | |
See Notes to Financial Statements
13
MFS Bond Portfolio
FINANCIAL STATEMENTS | STATEMENT OF OPERATIONS
This statement describes how much your fund earned in investment income and accrued in expenses. It also describes any gains and/or losses generated by fund operations.
| | | | | | | | |
| Year ended 12/31/10 | | | | | | | | |
| Net investment income | | | | | | | | |
Income | | | | | | | | |
Interest | | | $12,925,241 | | | | | |
Dividends | | | 4,557 | | | | | |
Dividends from underlying funds | | | 15,021 | | | | | |
Foreign taxes withheld | | | (3,287 | ) | | | | |
Total investment income | | | | | | | $12,941,532 | |
Expenses | | | | | | | | |
Management fee | | | $1,318,877 | | | | | |
Distribution and/or service fees | | | 307,930 | | | | | |
Administrative services fee | | | 78,702 | | | | | |
Trustees’ compensation | | | 25,297 | | | | | |
Custodian fee | | | 51,284 | | | | | |
Shareholder communications | | | 21,054 | | | | | |
Auditing fees | | | 62,050 | | | | | |
Legal fees | | | 7,130 | | | | | |
Miscellaneous | | | 22,091 | | | | | |
Total expenses | | | | | | | $1,894,415 | |
Fees paid indirectly | | | (236 | ) | | | | |
Net expenses | | | | | | | $1,894,179 | |
Net investment income | | | | | | | $11,047,353 | |
Realized and unrealized gain (loss) on investments | | | | | | | | |
Realized gain (loss) (identified cost basis) | | | | | | | | |
Investment transactions | | | $5,195,333 | | | | | |
Swap transactions | | | 9,201 | | | | | |
Net realized gain (loss) on investments | | | | | | | $5,204,534 | |
Change in unrealized appreciation (depreciation) | | | | | | | | |
Investments | | | $5,439,955 | | | | | |
Swap transactions | | | 230,088 | | | | | |
Net unrealized gain (loss) on investments | | | | | | | $5,670,043 | |
Net realized and unrealized gain (loss) on investments | | | | | | | $10,874,577 | |
Change in net assets from operations | | | | | | | $21,921,930 | |
See Notes to Financial Statements
14
MFS Bond Portfolio
FINANCIAL STATEMENTS | STATEMENTS OF CHANGES IN NET ASSETS
These statements describe the increases and/or decreases in net assets resulting from operations, any distributions, and any shareholder transactions.
| | | | | | | | |
For years ended 12/31 | | | 2010 | | | | 2009 | |
Change in net assets | | | | | | | | |
From operations | | | | | | | | |
Net investment income | | | $11,047,353 | | | | $8,888,041 | |
Net realized gain (loss) on investments | | | 5,204,534 | | | | 81,297 | |
Net unrealized gain (loss) on investments | | | 5,670,043 | | | | 27,975,865 | |
Change in net assets from operations | | | $21,921,930 | | | | $36,945,203 | |
Distributions declared to shareholders | | | | | | | | |
From net investment income | | | $(9,040,106 | ) | | | $(9,101,368 | ) |
Change in net assets from fund share transactions | | | $41,142,255 | | | | $38,151,700 | |
Total change in net assets | | | $54,024,079 | | | | $65,995,535 | |
Net assets | | | | | | | | |
At beginning of period | | | 188,537,458 | | | | 122,541,923 | |
At end of period (including undistributed net investment income of $12,524,447 and
$9,604,544, respectively) | | | $242,561,537 | | | | $188,537,458 | |
See Notes to Financial Statements
15
MFS Bond Portfolio
FINANCIAL STATEMENTS | FINANCIAL HIGHLIGHTS
The financial highlights table is intended to help you understand the fund’s financial performance for the past 5 years. Certain information reflects financial results for a single fund share. The total returns in the table represent the rate by which an investor would have earned (or lost) on an investment in the fund share class (assuming reinvestment of all distributions) held for the entire period.
| | | | | | | | | | | | | | | | | | | | |
| Initial Class | | Years ended 12/31 | |
| | | 2010 | | | 2009 | | | 2008 | | | 2007 | | | 2006 | |
Net asset value, beginning of period | | | $10.84 | | | | $9.11 | | | | $10.89 | | | | $11.19 | | | | $11.40 | |
| Income (loss) from investment operations | | | | | | | | | | | | | | | | | | | | |
Net investment income (d) | | | $0.58 | | | | $0.59 | | | | $0.57 | | | | $0.60 | | | | $0.59 | |
Net realized and unrealized gain (loss) on investments | | | 0.57 | | | | 1.81 | | | | (1.64 | ) | | | (0.21 | ) | | | (0.04 | ) |
Total from investment operations | | | $1.15 | | | | $2.40 | | | | $(1.07 | ) | | | $0.39 | | | | $0.55 | |
| Less distributions declared to shareholders | | | | | | | | | | | | | | | | | | | | |
From net investment income | | | $(0.50 | ) | | | $(0.67 | ) | | | $(0.71 | ) | | | $(0.69 | ) | | | $(0.69 | ) |
From net realized gain on investments | | | — | | | | — | | | | — | | | | — | | | | (0.07 | ) |
Total distributions declared to shareholders | | | $(0.50 | ) | | | $(0.67 | ) | | | $(0.71 | ) | | | $(0.69 | ) | | | $(0.76 | ) |
Net asset value, end of period | | | $11.49 | | | | $10.84 | | | | $9.11 | | | | $10.89 | | | | $11.19 | |
Total return (%) (k)(s) | | | 10.86 | | | | 27.96 | | | | (10.53 | ) | | | 3.53 | | | | 5.20 | |
Ratios (%) (to average net assets)
and Supplemental data: | | | | | | | | | | | | | | | | | | | | |
Expenses (f) | | | 0.72 | | | | 0.74 | | | | 0.74 | | | | 0.71 | | | | 0.71 | |
Net investment income | | | 5.17 | | | | 5.93 | | | | 5.64 | | | | 5.50 | | | | 5.32 | |
Portfolio turnover | | | 58 | | | | 71 | | | | 46 | | | | 42 | | | | 47 | |
Net assets at end of period (000 omitted) | | | $95,584 | | | | $92,244 | | | | $70,504 | | | | $105,554 | | | | $120,991 | |
| |
| Service Class | | Years ended 12/31 | |
| | | 2010 | | | 2009 | | | 2008 | | | 2007 | | | 2006 | |
Net asset value, beginning of period | | | $10.76 | | | | $9.04 | | | | $10.81 | | | | $11.11 | | | | $11.33 | |
| Income (loss) from investment operations | | | | | | | | | | | | | | | | | | | | |
Net investment income (d) | | | $0.55 | | | | $0.56 | | | | $0.54 | | | | $0.57 | | | | $0.56 | |
Net realized and unrealized gain (loss) on investments | | | 0.57 | | | | 1.80 | | | | (1.63 | ) | | | (0.21 | ) | | | (0.05 | ) |
Total from investment operations | | | $1.12 | | | | $2.36 | | | | $(1.09 | ) | | | $0.36 | | | | $0.51 | |
| Less distributions declared to shareholders | | | | | | | | | | | | | | | | | | | | |
From net investment income | | | $(0.48 | ) | | | $(0.64 | ) | | | $(0.68 | ) | | | $(0.66 | ) | | | $(0.66 | ) |
From net realized gain on investments | | | — | | | | — | | | | — | | | | — | | | | (0.07 | ) |
Total distributions declared to shareholders | | | $(0.48 | ) | | | $(0.64 | ) | | | $(0.68 | ) | | | $(0.66 | ) | | | $(0.73 | ) |
Net asset value, end of period | | | $11.40 | | | | $10.76 | | | | $9.04 | | | | $10.81 | | | | $11.11 | |
Total return (%) (k)(s) | | | 10.67 | | | | 27.66 | | | | (10.77 | ) | | | 3.28 | | | | 4.87 | |
Ratios (%) (to average net assets)
and Supplemental data: | | | | | | | | | | | | | | | | | | | | |
Expenses (f) | | | 0.97 | | | | 0.99 | | | | 0.99 | | | | 0.96 | | | | 0.96 | |
Net investment income | | | 4.90 | | | | 5.64 | | | | 5.39 | | | | 5.25 | | | | 5.07 | |
Portfolio turnover | | | 58 | | | | 71 | | | | 46 | | | | 42 | | | | 47 | |
Net assets at end of period (000 omitted) | | | $146,977 | | | | $96,293 | | | | $52,038 | | | | $77,588 | | | | $76,471 | |
| (d) | Per share data is based on average shares outstanding. |
| (f) | Ratios do not reflect reductions from fees paid indirectly, if applicable. |
| (k) | The total return does not reflect expenses that apply to separate accounts. Inclusion of these charges would reduce the total return figures for all periods shown. |
| (s) | From time to time the fund may receive proceeds from litigation settlements, without which performance would be lower. |
See Notes to Financial Statements
16
MFS Bond Portfolio
NOTES TO FINANCIAL STATEMENTS
| (1) | | Business and Organization |
MFS Bond Portfolio (the fund) is a series of MFS Variable Insurance Trust II (the trust). The trust is organized as a Massachusetts business trust and is registered under the Investment Company Act of 1940, as amended, as an open-end management investment company. The shareholders of each series of the trust are separate accounts of insurance companies, which offer variable annuity and/or life insurance products, and qualified retirement and pension plans.
| (2) | | Significant Accounting Policies |
General – The preparation of financial statements in conformity with U.S. generally accepted accounting principles requires management to make estimates and assumptions that affect the reported amounts of assets and liabilities, and disclosure of contingent assets and liabilities at the date of the financial statements and the reported amounts of revenues and expenses during the reporting period. Actual results could differ from those estimates. In the preparation of these financial statements, management has evaluated subsequent events occurring after the date of the fund’s Statement of Assets and Liabilities through the date that the financial statements were issued. The fund invests in foreign securities, including securities of emerging market issuers. Investments in foreign securities are vulnerable to the effects of changes in the relative values of the local currency and the U.S. dollar and to the effects of changes in each country’s legal, political, and economic environment. The markets of emerging markets countries are generally more volatile than the markets of developed countries with more mature economies. All of the risks of investing in foreign securities previously described are heightened when investing in emerging markets countries.
Investment Valuations – Debt instruments and floating rate loans (other than short-term instruments), including restricted debt instruments, are generally valued at an evaluated or composite bid as provided by a third-party pricing service. Equity securities, including restricted equity securities, are generally valued at the last sale or official closing price as provided by a third-party pricing service on the market or exchange on which they are primarily traded. Equity securities, for which there were no sales reported that day, are generally valued at the last quoted daily bid quotation as provided by a third-party pricing service on the market or exchange on which such securities are primarily traded. Equity securities held short, for which there were no sales reported for that day, are generally valued at the last quoted daily ask quotation as provided by a third-party pricing service on the market or exchange on which such securities are primarily traded. Short-term instruments with a maturity at issuance of 60 days or less generally are valued at amortized cost, which approximates market value. Swaps are generally valued at valuations provided by a third-party pricing service. Open-end investment companies are generally valued at net asset value per share. Securities and other assets generally valued on the basis of information from a third-party pricing service may also be valued at a broker/dealer bid quotation. Values obtained from third-party pricing services can utilize both transaction data and market information such as yield, quality, coupon rate, maturity, type of issue, trading characteristics, and other market data. The values of foreign securities and other assets and liabilities expressed in foreign currencies are converted to U.S. dollars using the mean of bid and asked prices for rates provided by a third-party pricing service.
The Board of Trustees has delegated primary responsibility for determining or causing to be determined the value of the fund’s investments (including any fair valuation) to the adviser pursuant to valuation policies and procedures approved by the Board. If the adviser determines that reliable market quotations are not readily available, investments are valued at fair value as determined in good faith by the adviser in accordance with such procedures under the oversight of the Board of Trustees. Under the fund’s valuation policies and procedures, market quotations are not considered to be readily available for most types of debt instruments and floating rate loans and many types of derivatives. These investments are generally valued at fair value based on information from third-party pricing services. In addition, investments may be valued at fair value if the adviser determines that an investment’s value has been materially effected by events occurring after the close of the exchange or market on which the investment is principally traded (such as foreign exchange or market) and prior to the determination of the fund’s net asset value, or after the halting of trading of a specific security where trading does not resume prior to the close of the exchange or market on which the security is principally traded. The adviser generally relies on third-party pricing services or other information (such as the correlation with price movements of similar securities in the same or other markets; the type, cost and investment characteristics of the security; the business and financial condition of the issuer; and trading and other market data) to assist in determining whether to fair value and at what value to fair value an investment. The value of an investment for purposes of calculating the fund’s net asset value can differ depending on the source and method used to determine value. When fair valuation is used, the value of an investment used to determine the fund’s net asset value may differ from quoted or published prices for the same investment. There can be no assurance that the fund could obtain the fair value assigned to an investment if it were to sell the investment at the same time at which the fund determines its net asset value per share.
17
MFS Bond Portfolio
Notes to Financial Statements – continued
Various inputs are used in determining the value of the fund’s assets or liabilities. These inputs are categorized into three broad levels. In certain cases, the inputs used to measure fair value may fall into different levels of the fair value hierarchy. In such cases, an investment’s level within the fair value hierarchy is based on the lowest level of input that is significant to the fair value measurement. The fund’s assessment of the significance of a particular input to the fair value measurement in its entirety requires judgment, and considers factors specific to the investment. Level 1 includes unadjusted quoted prices in active markets for identical assets or liabilities. Level 2 includes other significant observable market-based inputs (including quoted prices for similar securities, interest rates, prepayment speed, and credit risk). Level 3 includes unobservable inputs, which may include the adviser’s own assumptions in determining the fair value of investments. Other financial instruments are derivative instruments not reflected in total investments, such as swap contracts. The following is a summary of the levels used as of December 31, 2010 in valuing the fund’s assets or liabilities:
| | | | | | | | | | | | | | | | |
| Investments at Value | | Level 1 | | | Level 2 | | | Level 3 | | | Total | |
| Non-U.S. Sovereign Debt | | | $— | | | | $5,569,295 | | | | $— | | | | $5,569,295 | |
| Corporate Bonds | | | — | | | | 176,282,039 | | | | — | | | | 176,282,039 | |
| Residential Mortgage-Backed Securities | | | — | | | | 79,417 | | | | — | | | | 79,417 | |
| Commercial Mortgage-Backed Securities | | | — | | | | 10,936,334 | | | | — | | | | 10,936,334 | |
| Asset-Backed Securities (including CDOs) | | | — | | | | 3,079,239 | | | | — | | | | 3,079,239 | |
| Foreign Bonds | | | — | | | | 33,306,466 | | | | — | | | | 33,306,466 | |
| Floating Rate Loans | | | — | | | | 667,313 | | | | — | | | | 667,313 | |
| Mutual Funds | | | 9,282,745 | | | | — | | | | — | | | | 9,282,745 | |
| Total Investments | | | $9,282,745 | | | | $229,920,103 | | | | $— | | | | $239,202,848 | |
| | | | |
| Other Financial Instruments | | | | | | | | | | | | |
| Swaps | | | $— | | | | $(335,335 | ) | | | $— | | | | $(335,335 | ) |
For further information regarding security characteristics, see the Portfolio of Investments.
Derivatives – The fund uses derivatives for different purposes, including to earn income and enhance returns, to increase or decrease exposure to a particular market, to manage or adjust the risk profile of the fund, or as alternatives to direct investments. Derivatives are used for hedging or non-hedging purposes. While hedging can reduce or eliminate losses, it can also reduce or eliminate gains. When the fund uses derivatives as an investment to increase market exposure, or for hedging purposes, gains and losses from derivative instruments may be substantially greater than the derivative’s original cost.
Derivative instruments used by the fund during the period include swap agreements. The fund’s period end derivatives, as presented in the Portfolio of Investments and the associated Derivative Contract Tables, generally are indicative of the volume of its derivative activity during the period.
The following table presents, by major type of derivative contract, the fair value, on a gross basis, of the asset and liability components of derivatives held by the fund at December 31, 2010 as reported in the Statement of Assets and Liabilities:
| | | | | | | | | | |
| | | | | Fair Value | |
| Risk | | Derivative | | Asset Derivatives | | | Liability Derivatives | |
| Credit Contracts | | Credit Default Swaps | | | $— | | | | $(335,335 | ) |
The following table presents, by major type of derivative contract, the realized gain (loss) on derivatives held by the fund for the year ended December 31, 2010 as reported in the Statement of Operations:
| | | | |
| Risk | | Swap Transactions | |
| Credit Contracts | | | $9,201 | |
The following table presents, by major type of derivative contract, the change in unrealized appreciation (depreciation) on derivatives held by the fund for the year ended December 31, 2010 as reported in the Statement of Operations:
| | | | |
| Risk | | Swap Transactions | |
| Credit Contracts | | | $230,088 | |
Derivative counterparty credit risk is managed through formal evaluation of the creditworthiness of all potential counterparties. On certain over-the-counter derivatives, the fund attempts to reduce its exposure to counterparty credit risk whenever possible by entering into an International Swaps and Derivatives Association (ISDA) Master Agreement on a bilateral basis with each of the counterparties with whom it undertakes a significant volume of transactions. The ISDA Master Agreement gives each party to the agreement the right to terminate all transactions traded under such agreement if there is a certain deterioration in the credit quality of the other party. The ISDA Master Agreement gives the fund the right, upon an
18
MFS Bond Portfolio
Notes to Financial Statements – continued
event of default by the applicable counterparty or a termination of the agreement, to close out all transactions traded under such agreement and to net amounts owed under each transaction to one net amount payable by one party to the other. This right to close out and net payments across all transactions traded under the ISDA Master Agreement could result in a reduction of the fund’s credit risk to such counterparty equal to any amounts payable by the fund under the applicable transactions, if any. However, absent an event of default by the counterparty or a termination of the agreement, the ISDA Master Agreement does not result in an offset of reported amounts of assets and liabilities in the Statement of Assets and Liabilities across transactions between the fund and the applicable counterparty.
Collateral requirements differ by type of derivative. Collateral or margin requirements are set by the broker or exchange clearing house for exchange traded derivatives (i.e., futures and exchange-traded options) while collateral terms are contract specific for over-the-counter traded derivatives (i.e., forwards, swaps and over-the-counter options). For derivatives traded under an ISDA Master Agreement, the collateral requirements are netted across all transactions traded under such agreement and one amount is posted from one party to the other to collateralize such obligations. Cash collateral that has been pledged to cover obligations of the fund under derivative contracts, if any, will be reported separately on the Statement of Assets and Liabilities as restricted cash. Securities collateral pledged for the same purpose, if any, is noted in the Portfolio of Investments.
Swap Agreements – The fund entered into swap agreements. A swap is generally an exchange of cash payments, at specified intervals or upon the occurrence of specified events, between the fund and a counterparty. The net cash payments exchanged are recorded as a realized gain or loss on swap transactions in the Statement of Operations. The value of the swap, which is adjusted daily and includes any related interest accruals to be paid or received by the fund, is recorded on the Statement of Assets and Liabilities. The daily change in value, including any related interest accruals to be paid or received, is recorded as unrealized appreciation or depreciation on swap transactions in the Statement of Operations. Amounts paid or received at the inception of the swap are reflected as premiums paid or received on the Statement of Assets and Liabilities and are amortized using the effective interest method over the term of the agreement. A liquidation payment received or made upon early termination is recorded as a realized gain or loss on swap transactions in the Statement of Operations.
Risks related to swap agreements include the possible lack of a liquid market, unfavorable market and interest rate movements of the underlying instrument and the failure of the counterparty to perform under the terms of the agreements. To address counterparty risk, swap transactions are limited to only highly-rated counterparties. The risk is further mitigated by having an ISDA Master Agreement between the fund and the counterparty providing for netting as described above and by the posting of collateral by the counterparty to the fund to cover the fund’s exposure to the counterparty under such ISDA Master Agreement.
The fund entered into credit default swaps in order to manage its exposure to the market or certain sectors of the market, to reduce its credit risk exposure to defaults of corporate and sovereign issuers or to create exposure to corporate or sovereign issuers to which it is not otherwise exposed. In a credit default swap, the protection buyer can make an upfront payment and will make a stream of payments based on a fixed percentage applied to the contract notional amount to the protection seller in exchange for the right to receive a specified return upon the occurrence of a defined credit event on the reference obligation (which may be either a single security or a basket of securities issued by corporate or sovereign issuers) and, with respect to the rare cases where physical settlement applies, the delivery by the buyer to the seller of a defined deliverable obligation. Although contract-specific, credit events generally consist of a combination of the following: bankruptcy, failure to pay, restructuring, obligation acceleration, obligation default, or repudiation/moratorium, each as defined in the 2003 ISDA Credit Derivatives Definitions as amended by the relevant contract. Restructuring is generally not applicable when the reference obligation is issued by a North American corporation and obligation acceleration, obligation default, or repudiation/moratorium are generally only applicable when the reference obligation is issued by a sovereign entity or an entity in an emerging country. Upon determination of the final price for the deliverable obligation (or upon delivery of the deliverable obligation in the case of physical settlement), the difference between the value of the deliverable obligation and the swap’s notional amount is recorded as realized gain or loss on swap transactions in the Statement of Operations.
Credit default swaps are considered to have credit-risk-related contingent features since they trigger payment by the protection seller to the protection buyer upon the occurrence of a defined credit event. The aggregate fair value of credit default swaps in a net liability position as of December 31, 2010 is disclosed in the footnotes to the Portfolio of Investments. As discussed earlier in this note, collateral requirements for these swaps are based generally on the market value of the swap netted against collateral requirements for other types of over-the-counter derivatives traded under each counterparty’s ISDA Master Agreement. The maximum amount of future, undiscounted payments that the fund, as protection seller, could be required to make is equal to the swap’s notional amount. The protection seller’s payment obligation would be offset to the extent of the value of the contract’s deliverable obligation. If a defined credit event had occurred as of December 31, 2010, the swaps’ credit-risk-related contingent features would have been triggered and, for those swaps in a net liability position for which the
19
MFS Bond Portfolio
Notes to Financial Statements – continued
fund is the protection seller, the fund in order to settle these swaps would have been required to either (1) pay the swap’s notional value of $910,000 less the value of the contracts’ related deliverable obligations as decided through an ISDA auction or (2) pay the notional value of the swaps in return for physical receipt of the deliverable obligations.
The fund’s maximum risk of loss from counterparty risk, either as the protection seller or as the protection buyer, is the fair value of the contract. This risk is mitigated by having an ISDA Master Agreement between the fund and the counterparty providing for netting as described above and by the posting of collateral by the counterparty to the fund to cover the fund’s exposure to the counterparty under such ISDA Master Agreement.
Loans and Other Direct Debt Instruments – The fund invests in loans and loan participations or other receivables. These investments may include standby financing commitments, including revolving credit facilities, which obligate the fund to supply additional cash to the borrower on demand. Loan participations involve a risk of insolvency of the lending bank or other financial intermediary.
Indemnifications – Under the fund’s organizational documents, its officers and Trustees may be indemnified against certain liabilities and expenses arising out of the performance of their duties to the fund. Additionally, in the normal course of business, the fund enters into agreements with service providers that may contain indemnification clauses. The fund’s maximum exposure under these agreements is unknown as this would involve future claims that may be made against the fund that have not yet occurred.
Investment Transactions and Income – Investment transactions are recorded on the trade date. Interest income is recorded on the accrual basis. All premium and discount is amortized or accreted for financial statement purposes in accordance with U.S. generally accepted accounting principles. The fund earns certain fees in connection with its floating rate loan purchasing activities. These fees are in addition to interest payments earned and may include amendment fees, commitment fees, facility fees, consent fees, and prepayment fees. Commitment fees are recorded on an accrual basis as income in the accompanying financial statements. Dividends received in cash are recorded on the ex-dividend date. Dividend and interest payments received in additional securities are recorded on the ex-dividend or ex-interest date in an amount equal to the value of the security on such date.
The fund may receive proceeds from litigation settlements. Any proceeds received from litigation involving portfolio holdings are reflected in the Statement of Operations in realized gain/loss if the security has been disposed of by the fund or in unrealized gain/loss if the security is still held by the fund. Any other proceeds from litigation not related to portfolio holdings are reflected as other income in the Statement of Operations.
Fees Paid Indirectly – The fund’s custody fee may be reduced according to an arrangement that measures the value of cash deposited with the custodian by the fund. This amount, for the year ended December 31, 2010, is shown as a reduction of total expenses on the Statement of Operations.
Tax Matters and Distributions – The fund intends to qualify as a regulated investment company, as defined under Subchapter M of the Internal Revenue Code, and to distribute all of its taxable income, including realized capital gains. As a result, no provision for federal income tax is required. The fund’s federal tax returns for the prior three fiscal years remain subject to examination by the Internal Revenue Service. Foreign taxes, if any, have been accrued by the fund in the accompanying financial statements.
Distributions to shareholders are recorded on the ex-dividend date. Income and capital gain distributions are determined in accordance with income tax regulations, which may differ from U.S. generally accepted accounting principles. Certain capital accounts in the financial statements are periodically adjusted for permanent differences in order to reflect their tax character. These adjustments have no impact on net assets or net asset value per share. Temporary differences which arise from recognizing certain items of income, expense, gain or loss in different periods for financial statement and tax purposes will reverse at some time in the future. Distributions in excess of net investment income or net realized gains are temporary overdistributions for financial statement purposes resulting from differences in the recognition or classification of income or distributions for financial statement and tax purposes.
Book/tax differences primarily relate to amortization and accretion of debt securities and derivative transactions.
The tax character of distributions declared to shareholders for the last two fiscal years is as follows:
| | | | | | | | |
| | | 12/31/10 | | | 12/31/09 | |
| Ordinary income (including any short-term capital gains) | | | $9,040,106 | | | | $9,101,368 | |
20
MFS Bond Portfolio
Notes to Financial Statements – continued
The federal tax cost and the tax basis components of distributable earnings were as follows:
| | | | |
| As of 12/31/10 | | | | |
| Cost of investments | | | $229,506,753 | |
| Gross appreciation | | | 12,532,969 | |
| Gross depreciation | | | (2,836,874 | ) |
| Net unrealized appreciation (depreciation) | | | $9,696,095 | |
| Undistributed ordinary income | | | 12,188,809 | |
| Capital loss carryforwards | | | (5,468,203 | ) |
As of December 31, 2010, the fund had capital loss carryforwards available to offset future realized gains. Such losses expire as follows:
| | | | |
| 12/31/16 | | | $(5,020,083 | ) |
| 12/31/17 | | | (448,120 | ) |
| Total | | | $(5,468,203 | ) |
Multiple Classes of Shares of Beneficial Interest – The fund offers multiple classes of shares, which differ in their respective distribution and/or service fees. The fund’s income, realized and unrealized gain (loss), and common expenses are allocated to shareholders based on the daily net assets of each class. Dividends are declared separately for each class. Differences in per share dividend rates are generally due to differences in separate class expenses. The fund’s distributions declared to shareholders as reported on the Statements of Changes in Net Assets are presented by class as follows:
| | | | | | | | |
| | | From net investment
income | |
| | | Year ended
12/31/10 | | | Year ended
12/31/09 | |
| Initial Class | | | $4,170,932 | | | | $5,289,494 | |
| Service Class | | | 4,869,174 | | | | 3,811,874 | |
| Total | | | $9,040,106 | | | | $9,101,368 | |
| (3) | | Transactions with Affiliates |
Investment Adviser – The fund has an investment advisory agreement with MFS to provide overall investment management and related administrative services and facilities to the fund. The management fee is computed daily and paid monthly at an annual rate of 0.60% of the fund’s average daily net assets.
The investment adviser has agreed in writing to reduce its management fee to 0.50% of average daily net assets in excess of $1 billion. This written agreement will continue until modified or rescinded by the fund’s shareholders. For the year ended December 31, 2010, the fund’s average daily net assets did not exceed $1 billion and therefore, the management fee was not reduced. The management fee incurred for the year ended December 31, 2010 was equivalent to an annual effective rate of 0.60% ofthe fund’s average daily net assets.
Distributor – MFS Fund Distributors, Inc. (MFD), a wholly-owned subsidiary of MFS, is the distributor of shares of the fund. The Trustees have adopted a distribution plan for the Service Class shares pursuant to Rule 12b-1 under the Investment Company Act of 1940.
The fund’s distribution plan provides that the fund will pay MFD distribution and/or service fees equal to 0.25% per annum of its average daily net assets attributable to Service Class shares as partial consideration for services performed and expenses incurred by MFD and financial intermediaries (including participating insurance companies that invest in the fund to fund variable annuity and variable life insurance contracts, sponsors of qualified retirement and pension plans that invest in the fund, and affiliates of these participating insurance companies and plan sponsors) in connection with the sale and distribution of the Service Class shares. MFD may subsequently pay all, or a portion, of the distribution and/or service fees to financial intermediaries.
Shareholder Servicing Agent – MFS Service Center, Inc. (MFSC), a wholly-owned subsidiary of MFS, has contracted to provide transfer agent and recordkeeping functions in connection with the issuance, transfer, and redemption of each class of shares of the fund under a Shareholder Servicing Agent Agreement. During the year ended December 31, 2010, the fund did not pay MFSC a fee for this service.
Administrator – MFS provides certain financial, legal, shareholder communications, compliance, and other administrative services to the fund. Under an administrative services agreement, the fund partially reimburses MFS the costs incurred to
21
MFS Bond Portfolio
Notes to Financial Statements – continued
provide these services. The fund is charged an annual fixed amount of $10,000 plus a fee based on average daily net assets. The administrative services fee incurred for the year ended December 31, 2010 was equivalent to an annual effective rate of 0.0358% of the fund’s average daily net assets.
Trustees’ and Officers’ Compensation – The fund pays compensation to Trustees in the form of a retainer, attendance fees, and additional compensation to the Board chairperson. The fund does not pay compensation directly to officers of the fund who are also officers of the investment adviser, all of whom receive remuneration for their services to the fund from MFS. Certain officers of the fund are officers or directors of MFS, MFD, and MFSC.
Other – This fund and certain other funds managed by MFS (the funds) have entered into services agreements (the Agreements) which provide for payment of fees by the funds to Tarantino LLC and Griffin Compliance LLC in return for the provision of services of an Independent Chief Compliance Officer (ICCO) and Assistant ICCO, respectively, for the funds. The ICCO and Assistant ICCO are officers of the funds and the sole members of Tarantino LLC and Griffin Compliance LLC, respectively. The funds can terminate the Agreements with Tarantino LLC and Griffin Compliance LLC at any time under the terms of the Agreements. MFS has agreed to bear all expenses associated with office space, other administrative support, and supplies provided to the ICCO and Assistant ICCO. For the year ended December 31, 2010, the aggregate fees paid by the fund to Tarantino LLC and Griffin Compliance LLC were $3,509 and are included in miscellaneous expense on the Statement of Operations.
The fund invests in the MFS Institutional Money Market Portfolio which is managed by MFS and seeks a high level of current income consistent with preservation of capital and liquidity. Income earned on this investment is included in dividends from underlying funds on the Statement of Operations. This money market fund does not pay a management fee to MFS.
Purchases and sales of investments, other than purchased option transactions, and short-term obligations, were as follows:
| | | | | | | | |
| | | Purchases | | | Sales | |
| U.S. Government securities | | | $— | | | | $247,258 | |
| Investments (non-U.S. Government securities) | | | $161,704,330 | | | | $122,218,053 | |
| (5) | | Shares of Beneficial Interest |
The fund’s Declaration of Trust permits the Trustees to issue an unlimited number of full and fractional shares of beneficial interest. Transactions in fund shares were as follows:
| | | | | | | | | | | | | | | | |
| | | Year ended 12/31/10 | | | Year ended 12/31/09 | |
| | | Shares | | | Amount | | | Shares | | | Amount | |
| Shares sold | | | | | | | | | | | | | | | | |
Initial Class | | | 789,328 | | | | $8,770,173 | | | | 1,165,319 | | | | $11,304,830 | |
Service Class | | | 4,489,214 | | | | 49,686,140 | | | | 3,840,207 | | | | 37,713,447 | |
| | | 5,278,542 | | | | $58,456,313 | | | | 5,005,526 | | | | $49,018,277 | |
| Shares issued to shareholders in reinvestment of distributions | | | | | | | | | | | | | | | | |
Initial Class | | | 383,710 | | | | $4,170,932 | | | | 593,658 | | | | $5,289,494 | |
Service Class | | | 451,267 | | | | 4,869,174 | | | | 430,234 | | | | 3,811,874 | |
| | | 834,977 | | | | $9,040,106 | | | | 1,023,892 | | | | $9,101,368 | |
| Shares reacquired | | | | | | | | | | | | | | | | |
Initial Class | | | (1,364,016 | ) | | | $(15,376,313 | ) | | | (989,878 | ) | | | $(9,727,338 | ) |
Service Class | | | (988,611 | ) | | | (10,977,851 | ) | | | (1,078,796 | ) | | | (10,240,607 | ) |
| | | (2,352,627 | ) | | | $(26,354,164 | ) | | | (2,068,674 | ) | | | $(19,967,945 | ) |
| Net change | | | | | | | | | | | | | | | | |
Initial Class | | | (190,978 | ) | | | $(2,435,208 | ) | | | 769,099 | | | | $6,866,986 | |
Service Class | | | 3,951,870 | | | | 43,577,463 | | | | 3,191,645 | | | | 31,284,714 | |
| | | 3,760,892 | | | | $41,142,255 | | | | 3,960,744 | | | | $38,151,700 | |
The fund and certain other funds managed by MFS participate in a $1.1 billion unsecured committed line of credit, subject to a $1 billion sublimit, provided by a syndication of banks under a credit agreement. Borrowings may be made for temporary financing needs. Interest is charged to each fund, based on its borrowings, generally at a rate equal to the higher of the Federal Reserve funds rate or one month LIBOR plus an agreed upon spread. A commitment fee, based on the average daily, unused portion of the committed line of credit, is allocated among the participating funds at the end of each calendar quarter. In
22
MFS Bond Portfolio
Notes to Financial Statements – continued
addition, the fund and other funds managed by MFS have established unsecured uncommitted borrowing arrangements with certain banks for temporary financing needs. Interest is charged to each fund, based on its borrowings, at a rate equal to the Federal Reserve funds rate plus an agreed upon spread. For the year ended December 31, 2010, the fund’s commitment fee and interest expense were $2,448 and $0, respectively, and are included in miscellaneous expense on the Statement of Operations.
| (7) | | Transactions in Underlying Funds – Affiliated Issuers |
An affiliated issuer may be considered one in which the fund owns 5% or more of the outstanding voting securities, or a company which is under common control. For the purposes of this report, the fund assumes the following to be affiliated issuers:
| | | | | | | | | | | | | | | | |
| Underlying Funds | | Beginning
Shares/Par
Amount | | | Acquisitions
Shares/Par
Amount | | | Dispositions
Shares/Par
Amount | | | Ending
Shares/Par
Amount | |
| MFS Institutional Money Market Portfolio | | | 5,163,314 | | | | 109,575,227 | | | | (105,455,796 | ) | | | 9,282,745 | |
| | | | |
| Underlying Funds | | Realized
Gain (Loss) | | | Capital Gain
Distributions | | | Dividend
Income | | | Ending
Value | |
| MFS Institutional Money Market Portfolio | | | $— | | | | $— | | | | $15,021 | | | | $9,282,745 | |
23
MFS Bond Portfolio
REPORT OF INDEPENDENT REGISTERED PUBLIC ACCOUNTING FIRM
To the Board of Trustees of MFS Variable Insurance Trust II and the Shareholders of
MFS Bond Portfolio:
We have audited the accompanying statement of assets and liabilities, including the portfolio of investments, of MFS Bond Portfolio (the “Fund”) (one of the portfolios comprising MFS Variable Insurance Trust II) as of December 31, 2010, and the related statement of operations for the year then ended, the statements of changes in net assets for each of the two years in the period then ended, and the financial highlights for each of the five years in the period then ended. These financial statements and financial highlights are the responsibility of the Fund’s management. Our responsibility is to express an opinion on these financial statements and financial highlights based on our audits.
We conducted our audits in accordance with the standards of the Public Company Accounting Oversight Board (United States). Those standards require that we plan and perform the audit to obtain reasonable assurance about whether the financial statements and financial highlights are free of material misstatement. The Fund is not required to have, nor were we engaged to perform, an audit of its internal control over financial reporting. Our audits included consideration of internal control over financial reporting as a basis for designing audit procedures that are appropriate in the circumstances, but not for the purpose of expressing an opinion on the effectiveness of the Fund’s internal control over financial reporting. Accordingly, we express no such opinion. An audit also includes examining, on a test basis, evidence supporting the amounts and disclosures in the financial statements, assessing the accounting principles used and significant estimates made by management, as well as evaluating the overall financial statement presentation. Our procedures included confirmation of securities owned as of December 31, 2010, by correspondence with the custodian and brokers; where replies were not received from brokers, we performed other auditing procedures. We believe that our audits provide a reasonable basis for our opinion.
In our opinion, the financial statements and financial highlights referred to above present fairly, in all material respects, the financial position of MFS Bond Portfolio as of December 31, 2010, the results of its operations for the year then ended, the changes in its net assets for each of the two years in the period then ended, and the financial highlights for each of the five years in the period then ended, in conformity with accounting principles generally accepted in the United States of America.
DELOITTE & TOUCHE LLP
Boston, Massachusetts
February 14, 2011
24
MFS Bond Portfolio
TRUSTEES AND OFFICERS – IDENTIFICATION AND BACKGROUND
The Trustees and officers of the Trust, as of February 1, 2011, are listed below, together with their principal occupations during the past five years. (Their titles may have varied during that period.) The address of each Trustee and officer is 500 Boylston Street, Boston, Massachusetts 02116.
| | | | | | |
Name, Date of Birth | | Position(s) Held
with Fund | | Trustee/Officer
Since (1) | | Principal Occupations During the Past Five Years and
Other Directorships (2) |
| INTERESTED TRUSTEE | | | | |
David D. Horn (3) (born 6/07/41) | | Trustee | | April 1986 | | Private investor; Sun Life Assurance Company of Canada, Senior Vice President and General Manager for the United States (until 1997); Director (until March 2004) |
| | |
| INDEPENDENT TRUSTEES | | | | |
J. Kermit Birchfield (born 1/08/40) | | Chairman | | May 1997 | | Consultant; Century Partners, Inc. (investments), Director; Displaytech, Inc. (technology), Chairman; Dessin Fournir LLC (furniture manufacturer), Director; Site Watch LLC (software to monitor oil tanks), Managing Director (2006 to present); Juridica Investments (fund investing in judicial matters), Director (2007 to present), Immuno Science, Inc. (medical research), Independent Director (2009 to present), Intermountain Industries, Inc. (oil & gas exploration and production), Director (until February 2009) |
| | | |
Robert C. Bishop (born 1/13/43) | | Trustee | | May 2001 | | AutoImmune, Inc. (pharmaceutical product development), Chairman, President and Chief Executive Officer; Caliper Life Sciences Corp. (laboratory analytical instruments), Chairman; Optobionics Corporation (ophthalmic devices), Director (until 2007); Millipore Corporation (purification/filtration products), Director (until July 2010); Waterstreet Capital (leverage buyouts), Advisory Board (until August 2010) |
| | | |
Frederick H. Dulles (born 3/12/42) | | Trustee | | May 2001 | | Dulles International Law LLC (law firm), Senior Lawyer (since 2009); Juridica Capital Management (US) Inc. (litigation financing), Vice President and General Counsel (since 2009); Dulles Properties LLC (real estate), Broker (since 2008); The Citadel School of Business Administration (education), Adjunct Professor (since 2003); Disher, Hamrick & Myers Residential, Inc. (real estate), Broker (until 2006); Frederick H. Dulles Law Practice (law firm), (until 2006); Charlestown School of Law (education), Adjunct Professor (until 2007); Prudential Carolina Real Estate, (real estate), Broker (until 2008); Free Enterprise Foundation Inc. (research institute), Director & Secretary (until 2008); Ten State International Law PLLP (law firm), Of Counsel (until 2009) |
| | | |
Marcia A. Kean (born 6/30/48) | | Trustee | | April 2005 | | Feinstein Kean Healthcare (consulting), Chief Executive Officer |
| | | |
Ronald G. Steinhart (born 6/15/40) | | Trustee | | May 2001 | | Private investor; Penske Automotive Group (automotive retailer), Director; Animal Health International, Inc. (animal health products), Director (since 2007); Texas Industries (concrete/aggregates/cement), Director (since 2007); Susser Holdings Corporation (retail convenience stores and distributor of wholesale motor fuel), Director (since 2009); Prentiss Properties Trust (real estate investment trust), Director (until 2006); Penson Worldwide, Inc. (securities clearance), Director (until 2008) |
| | | |
Haviland Wright (born 7/21/48) | | Trustee | | May 2001 | | X-Change Corp. (multi-media web services), Director (since 2010); Nano Loa Inc. (liquid crystal displays), Director (until 2009); Profitability of Hawaii (software), Chief Development Officer (until 2010); Elixir Technologies Corporation (software), Director (until 2010) |
| | | |
| OFFICERS | | | | | | |
Maria F. DiOrioDwyer (4)
(born 12/01/58) | | President | | November 2005 | | Massachusetts Financial Services Company, Executive Vice President and Chief Regulatory Officer; Chief Compliance Officer (since December 2006) |
| | | |
| Christopher R. Bohane (4) (born 1/18/74) | | Assistant Secretary and Assistant Clerk | | July 2005 | | Massachusetts Financial Services Company, Vice President and Senior Counsel |
| | | |
John M. Corcoran (4) (born 4/13/65) | | Treasurer | | October 2008 | | Massachusetts Financial Services Company, Senior Vice President (since October 2008); State Street Bank and Trust (financial services provider), Senior Vice President, (until September 2008) |
| | | |
Ethan D. Corey (4) (born 11/21/63) | | Assistant Secretary and Assistant Clerk | | July 2005 | | Massachusetts Financial Services Company, Senior Vice President and Associate General Counsel |
| | | |
David L. DiLorenzo (4) (born 8/10/68) | | Assistant Treasurer | | July 2005 | | Massachusetts Financial Services Company, Vice President |
| | | |
Timothy M. Fagan (4) (born 7/10/68) | | Assistant Secretary and Assistant Clerk | | September 2005 | | Massachusetts Financial Services Company, Vice President and Senior Counsel |
| | | |
Mark D. Fischer (4) (born 10/27/70) | | Assistant Treasurer | | July 2005 | | Massachusetts Financial Services Company, Vice President |
25
MFS Bond Portfolio
Trustees and Officers – continued
| | | | | | |
Name, Date of Birth | | Position(s) Held
with Fund | | Trustee/Officer
Since (1) | | Principal Occupations During the Past Five Years and
Other Directorships (2) |
Robyn L. Griffin (born 7/04/75) | | Assistant Independent Chief Compliance Officer | | August 2008 | | Griffin Compliance LLC (provider of compliance services), Principal (since August 2008); State Street Corporation (financial services provider), Mutual Fund Administration Assistant Vice President (October 2006 – July 2008); Liberty Mutual Group (insurance), Personal Market Assistant Controller (April 2006 – October 2006); Deloitte & Touche LLP (professional services firm), Senior Manager (prior to April 2006) |
| | | |
Brian E. Langenfeld (4) (born 3/07/73) | | Assistant Secretary and Assistant Clerk | | May 2006 | | Massachusetts Financial Services Company, Vice President and Senior Counsel (since May 2006); John Hancock Advisers, LLC, Assistant Vice President and Counsel (until April 2006) |
| | | |
Ellen Moynihan (4) (born 11/13/57) | | Assistant Treasurer | | May 1997 | | Massachusetts Financial Services Company, Senior Vice President |
| | | |
Susan S. Newton (4) (born 3/07/50) | | Assistant Secretary and Assistant Clerk | | May 2005 | | Massachusetts Financial Services Company, Senior Vice President and Associate General Counsel |
| | | |
Susan A. Pereira (4)
(born 11/05/70) | | Assistant Secretary and Assistant Clerk | | July 2005 | | Massachusetts Financial Services Company, Vice President and Senior Counsel |
| | | |
Mark N. Polebaum (4) (born 5/01/52) | | Secretary and Clerk | | February 2006 | | Massachusetts Financial Services Company, Executive Vice President, General Counsel and Secretary (since January 2006); Wilmer Cutler Pickering Hale and Dorr LLP (law firm), Partner (until January 2006) |
| | | |
Frank L. Tarantino (born 3/07/44) | | Independent Chief Compliance Officer | | September 2004 | | Tarantino LLC (provider of compliance services), Principal |
| | | |
Richard S. Weitzel (4) (born 7/16/70) | | Assistant Secretary and Assistant Clerk | | October 2007 | | Massachusetts Financial Services Company, Vice President and Assistant General Counsel |
| | | |
James O. Yost (4) (born 6/12/60) | | Assistant Treasurer | | April 1992 | | Massachusetts Financial Services Company, Senior Vice President |
| (1) | Date first appointed to serve as Trustee/Officer of an MFS fund or a Compass variable account. Each Trustee has served continuously since appointment. For the period March 2008 until October 2008, Ms. DiOrioDwyer served as Treasurer of the Funds. |
| (2) | Directorships or trusteeships of companies required to report to the Securities and Exchange Commission (i.e., “public companies”). |
| (3) | “Interested person” of the Trust, within the meaning of the Investment Company Act of 1940 (referred to as the 1940 Act), which is the principal federal law governing investment companies like the Trust, as a result of position with Sun Life of Canada (U.S.). The address of Sun Life of Canada (U.S.) is One Sun Life Executive Park, Wellesley Hills, Massachusetts 02481. |
| (4) | “Interested person” of MFS within the meaning of the 1940 Act. The address of MFS is 500 Boylston Street, Boston, Massachusetts 02116. |
The Trust does not hold annual meetings for the purpose of electing Trustees, and Trustees are not elected for fixed terms. Each Trustee and officer holds office until his or her successor is chosen and qualified, or until his or her earlier death, resignation, retirement or removal.
All Trustees currently serve as Trustees of the Trust and have served in that capacity since originally elected or appointed. All of the Trustees are also Managers of the Compass Variable Accounts. The executive officers of the Trust hold similar offices for the Compass Variable Accounts and other funds in the MFS fund complex. As of January 1, 2011, each Trustee serves as a Trustee or Manager of 31 Accounts/Portfolios.
26
MFS Bond Portfolio
Trustees and Officers – continued
The Statement of Additional Information contains further information about the Trustees and is available without charge upon request by calling 1-800-752-7215.
| | |
Investment Adviser
Massachusetts Financial Services Company 500 Boylston Street, Boston, MA 02116-3741 | | Custodian State Street Bank and Trust 1 Lincoln Street, Boston, MA 02111-2900 |
Distributor
MFS Fund Distributors, Inc. 500 Boylston Street, Boston, MA 02116-3741 | | Independent Registered Public Accounting Firm Deloitte & Touche LLP 200 Berkeley Street, Boston, MA 02116 |
Portfolio Managers Richard Hawkins Robert Persons | | |
27
MFS Bond Portfolio
BOARD REVIEW OF INVESTMENT ADVISORY AGREEMENT
The Investment Company Act of 1940 requires that both the full Board of Trustees and a majority of the non-interested (“independent”) Trustees, voting separately, annually approve the continuation of the investment advisory agreement between MFS Variable Insurance Trust II (the “Trust”) and Massachusetts Financial Services Company (“MFS”) on behalf of the Fund. The Trustees consider matters bearing on the Fund and the advisory arrangement at their meetings throughout the year, including a review of performance data at each regular meeting. In addition, the independent Trustees met in person in May and again in July 2010 (“contract review meetings”) for the specific purpose of considering whether to approve the continuation of the investment advisory agreement for the Fund. The independent Trustees were assisted in their evaluation of the investment advisory agreement by independent legal counsel, from whom they received separate legal advice and with whom they met separately from MFS management during various contract review meetings. The independent Trustees were also assisted in this process by the Fund’s Independent Chief Compliance Officer, a full-time senior officer appointed by and reporting to the independent Trustees.
In connection with their deliberations, the Trustees, including the independent Trustees, considered such information and factors as they believed, in light of the legal advice furnished to them and their own business judgment, to be relevant. The investment advisory agreement was considered separately for the Fund, although the Trustees also took into account the common interests of all Funds in the Trust in their review. As described below, the Trustees considered the nature, quality, and extent of the various investment advisory, administrative, and shareholder services performed by MFS under the existing investment advisory agreement and other arrangements with the Trust.
In connection with their contract review meetings, the Trustees received and relied upon materials which included, among other items: (i) information provided by Lipper Inc. (“Lipper”) on the investment performance of the Fund for various time periods ended December 31, 2009, compared to the investment performance of a group of funds with substantially similar investment classifications/objectives (the “Lipper performance universe”), (ii) information provided by Lipper on the Fund’s advisory fees and other expenses compared to the advisory fees and other expenses of comparable funds identified by Lipper (the “Lipper expense group”), (iii) information provided by MFS on the advisory fees of comparable portfolios of its other clients, including institutional separate account and other clients, (iv) information as to whether, and to what extent applicable, expense waivers, reimbursements or fee “breakpoints” are observed for the Fund, (v) information regarding MFS’ financial results and financial condition, including MFS’ and certain of its affiliates’ estimated profitability from services performed for the Fund, (vi) MFS’ views regarding the outlook for the mutual fund industry and its strategic business plans, (vii) descriptions of various functions performed by MFS for the Trust, such as compliance monitoring and portfolio trading practices, and (viii) information regarding the overall organization of MFS, including information about MFS’ senior management and other personnel providing investment advisory, administrative and other services to the Fund. The comparative performance, fee and expense information prepared and provided by Lipper was not independently verified, and the independent Trustees did not independently verify any information provided to them by MFS.
The Trustees’ conclusion as to the continuation of the investment advisory agreement was based on comprehensive consideration of all information provided to the Trustees and was not the result of any single factor. Some of the factors that figured particularly in the Trustees’ deliberations are described below for the Fund, while individual Trustees may have given different weight to various factors and evaluated the information presented as a whole differently than another individual Trustee. The Trustees recognized that the fee arrangements for the Fund reflect years of review and discussion between the independent Trustees and MFS, that certain aspects of such arrangements may receive greater scrutiny in some years than others, and that the Trustees’ conclusions may be based, in part, on their consideration of these same arrangements during the course of the year and in prior years.
Based on information provided by Lipper, the Trustees compared the Fund’s total return investment performance to the performance of the Lipper performance universe over various time periods. The Trustees placed particular emphasis on the total return performance of the Fund’s Initial Class shares in comparison to the performance of funds in its Lipper performance universe over the one-, three- and five-year periods ended December 31, 2009. The Trustees did not rely on performance results for more recent periods, including those shown elsewhere in this report.
The Trustees noted the performance of the Fund’s Initial Class shares was in the 1st quintile relative to the other funds in the Lipper performance universe for the one-year period (the 1st quintile being the best performers and the 5th quintile being the worst performers). The total return performance of the Fund was in the 3rd quintile for the three-year and the five-year periods ended December 31, 2009, relative to the Lipper performance universe. Based on the nature and quality of services provided by MFS, the Board of Trustees concluded that the Fund’s performance was satisfactory.
28
MFS Bond Portfolio
Board Review of Investment Advisory Agreement – continued
In the course of their deliberations, the Trustees took into account information provided by MFS during contract review meetings, as well as during investment review meetings conducted with portfolio management personnel during the course of the year.
In assessing the reasonableness of the Fund’s advisory fee, the Trustees considered, among other information, the Fund’s advisory fee and the total expense ratio of the Fund’s Initial Class shares as a percentage of average daily net assets, compared to the advisory fee and total expense ratios of its peer group of funds based on information provided by Lipper. The Trustees also considered the advisory fees charged by MFS to institutional accounts. In comparing these fees, the Trustees considered the generally broader scope of services provided by MFS to the Trust than those provided to institutional accounts. The Trustees also considered the higher demands placed on MFS’ investment personnel and trading infrastructure as a result of the daily cash in-flows and out-flows of the Fund, and the impact on MFS and related expenses due to the more extensive regulatory regime to which the Fund is subject, compared to institutional accounts.
In considering the fees, the Trustees noted from the Lipper data that the Fund’s effective advisory fee rate and total expense ratio were each above the median of such fees and expenses of funds in the Lipper expense group. The Trustees further noted that MFS agreed to reduce its advisory fee on average daily net assets over $1 billion on a permanent basis, requiring shareholder approval for any modification or termination, and concluded that the existing breakpoint was sufficient to allow the Fund to benefit from economies of scale as its assets grow. The Trustees concluded that the fees were reasonable in light of the nature and quality of services provided.
The Trustees also considered information prepared by MFS relating to its costs and profits with respect to the Fund and other investment companies and accounts advised by MFS, as well as MFS’ methodologies used to determine and allocate its costs to the Fund and other accounts and products for purposes of estimating profitability.
After reviewing these and other factors described below, the Trustees concluded that the advisory fees charged to the Fund represent reasonable compensation in light of the nature and quality of the services being provided by MFS.
In addition, the Trustees considered MFS’ resources and related efforts to continue to retain, attract and motivate capable personnel to serve the Fund. The Trustees also considered the financial resources of MFS and its parent, Sun Life Financial Inc. The Trustees further considered any advantages and possible disadvantages of having an adviser which also serves other investment companies as well as institutional accounts.
The Trustees also considered the nature, quality, cost, and extent of administrative, transfer agency, and distribution services provided to the Fund by MFS and its affiliates under agreements and plans other than the investment advisory agreement, including the 12b-1 fees the Fund pays to MFS Fund Distributors, Inc., an affiliate of MFS. The Trustees also considered the nature, extent and quality of certain other services MFS performs or arranges on the Fund’s behalf, which may include securities lending programs, directed expense payment programs, class action recovery programs, and MFS’ interaction with third-party service providers, principally custodians and sub-custodians. The Trustees concluded that the various non-advisory services provided by MFS and its affiliates on behalf of the Fund were satisfactory. The Trustees also considered the benefits to MFS from the use of the Fund’s portfolio brokerage commissions to pay for investment research and various other factors. Additionally, the Trustees considered so-called “fall-out benefits” to MFS such as reputational value derived from serving as investment manager to the Trust, and determined that any such benefits derived by MFS were reasonable and fair.
Based on their evaluation of factors that they deemed to be material, including those factors described above, the Board of Trustees, including a majority of the independent Trustees, concluded that the investment advisory agreement should be continued for an additional one-year period, commencing September 1, 2010.
A discussion regarding the Board’s most recent review and renewal of the fund’s Investment Advisory Agreement with MFS is available by clicking on the fund’s name under “Variable Insurance Portfolios — VIT II” in the “Products and Performance” section of the MFS Web site (mfs.com).
29
MFS Bond Portfolio
PROXY VOTING POLICIES AND INFORMATION
A general description of the MFS funds’ proxy voting policies and procedures is available without charge, upon request, by calling 1-800-225-2606, by visiting the Proxy Voting section of mfs.com or by visiting the SEC’s Web site at http://www.sec.gov.
Information regarding how the fund voted proxies relating to portfolio securities during the most recent twelve-month period ended June 30 is available without charge by visiting the Proxy Voting section of mfs.com or by visiting the SEC’s Web site at http://www.sec.gov.
QUARTERLY PORTFOLIO DISCLOSURE
The fund will file a complete schedule of portfolio holdings with the Securities and Exchange Commission (the Commission) for the first and third quarters of each fiscal year on Form N-Q. The fund’s Form N-Q may be reviewed and copied at the:
Public Reference Room
Securities and Exchange Commission
100 F Street, NE, Room 1580
Washington, D.C. 20549
Information on the operation of the Public Reference Room may be obtained by calling the Commission at 1-800-SEC-0330. The fund’s Form N-Q is available on the EDGAR database on the Commission’s Internet Web site at http://www.sec.gov, and copies of this information may be obtained, upon payment of a duplicating fee, by electronic request at the following e-mail address: publicinfo@sec.gov or by writing the Public Reference Section at the above address.
FURTHER INFORMATION
From time to time, MFS may post important information about the fund or the MFS funds on the MFS web site (mfs.com). This information is available by visiting the “News & Commentary” section of mfs.com or by clicking on the fund’s name under “Variable Insurance Portfolios — VIT II” in the “Products and Performance” section of mfs.com.
30
MFS Bond Portfolio
MFS® PRIVACY NOTICE
Privacy is a concern for every investor today. At MFS Investment Management® and the MFS funds, we take this concern very seriously. We want you to understand our policies about the investment products and services that we offer, and how we protect the nonpublic personal information of investors who have a direct relationship with us and our wholly owned subsidiaries.
Throughout our business relationship, you provide us with personal information. We maintain information and records about you, your investments, and the services you use. Examples of the nonpublic personal information we maintain include
| | Ÿ | | data from investment applications and other forms |
| | Ÿ | | share balances and transactional history with us, our affiliates, or others |
| | Ÿ | | facts from a consumer reporting agency |
We do not disclose any nonpublic personal information about our customers or former customers to anyone, except as permitted by law. We may share nonpublic personal information with third parties or certain of our affiliates in connection with servicing your account or processing your transactions. We may share information with companies or financial institutions that perform marketing services on our behalf or with other financial institutions with which we have joint marketing arrangements, subject to any legal requirements.
Authorization to access your nonpublic personal information is limited to appropriate personnel who provide products, services, or information to you. We maintain physical, electronic, and procedural safeguards to help protect the personal information we collect about you.
If you have any questions about the MFS privacy policy, please call 1-800-225-2606 any business day.
Note: If you own MFS products or receive MFS services in the name of a third party such as a bank or broker-dealer, their privacy policy may apply to you instead of ours.
31

MFS® GOVERNMENT SECURITIES PORTFOLIO
The report is prepared for the general information of contract owners. It is authorized for distribution to prospective investors only when preceded or accompanied by a current prospectus.
NOT FDIC INSURED Ÿ MAY LOSE VALUE Ÿ NO BANK GUARANTEE Ÿ NOT A DEPOSIT Ÿ NOT INSURED BY ANY FEDERAL GOVERNMENT AGENCY OR NCUA/NCUSIF
MFS Government Securities Portfolio
LETTER FROM THE CEO

Dear Contract Owners:
After an extended rebound in the financial markets, uncertainty returned in 2010 as investors began to question the durability of the recovery for global economies and markets. That uncertainty led to increased risk aversion, especially as investors saw the eurozone struggle with the debt woes of many of its members. In September, the U.S. Federal Reserve Board’s promises to further loosen monetary policy helped assuage market fears and drive asset prices off their recent lows. A combination of solid earnings and improving economic data gave an additional boost to investor sentiment. As we enter 2011, we are cautiously optimistic that economic growth will continue to improve and that the global economies will recover from the shocks of the past few years. We expect the pace of recovery worldwide will be uneven and volatile.
As always, we continue to be mindful of the many economic challenges faced at the local, national, and international levels. It is in times such as these that we want to remind investors of the merits of maintaining a long-term view, adhering to basic investing principles such as asset allocation and diversification, and working closely with their advisors to research and identify appropriate investment opportunities.
Respectfully,

Robert J. Manning
Chairman and Chief Executive Officer
MFS Investment Management®
February 14, 2011
The opinions expressed in this letter are subject to change, may not be relied upon for investment advice, and no forecasts can be guaranteed.
1
MFS Government Securities Portfolio
PORTFOLIO COMPOSITION
Portfolio structure (i)
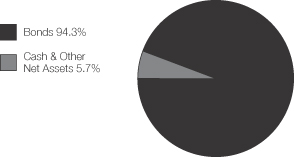
| | | | |
| Fixed income sectors (i) | | | | |
| Mortgage-Backed Securities | | | 45.5% | |
| U.S. Treasury Securities | | | 36.0% | |
| U.S. Government Agencies | | | 9.1% | |
| Municipal Bonds | | | 1.8% | |
| Commercial Mortgage-Backed Securities | | | 1.4% | |
| High Grade Corporates | | | 0.5% | |
| | | | |
| Composition including fixed income credit quality (a)(i) | | | | |
| AAA | | | 43.4% | |
| AA | | | 2.5% | |
| U.S. Agency (NR) | | | 48.6% | |
| Other Fixed Income (NR) | | | (0.2)% | |
| Cash & Other | | | 5.7% | |
| | | | |
| Portfolio facts (i) | | | | |
| Average Duration (d) | | | 4.6 | |
| Average Effective Maturity (m) | | | 6.5 yrs. | |
| (a) | The rating categories include debt securities and fixed-income structured products where these have long-term public ratings. All ratings are assigned in accordance with the following hierarchy: If a security is rated by Moody’s, then that rating is used; if not rated by Moody’s, then a Standard & Poor’s rating is used; if not rated by S&P, then a Fitch rating is used. Ratings from Moody’s are shown in the S&P and Fitch scale (e.g., AAA). All ratings are subject to change. U.S. Agency (NR) includes unrated U.S. Agency fixed income securities and collateralized mortgage obligations of U.S. Agency mortgage-backed securities. Other Fixed Income (NR) includes unrated long-term fixed income securities, interest rate swaps and fixed income futures. Cash & Other includes cash, other assets less liabilities, offsets to derivative positions, and short-term securities. The fund may not hold all of these instruments. |
| (d) | Duration is a measure of how much a bond’s price is likely to fluctuate with general changes in interest rates, e.g., if rates rise 1.00%, a bond with a 5-year duration is likely to lose about 5.00% of its value due to the interest rate move. |
| (i) | For purposes of this presentation, the components include the market value of securities, and reflect the impact of the equivalent exposure of derivative positions, if applicable. These amounts may be negative from time to time. The bond component will include any accrued interest amounts. Equivalent exposure is a calculated amount that translates the derivative position into a reasonable approximation of the amount of the underlying asset that the portfolio would have to hold at a given point in time to have the same price sensitivity that results from the portfolio’s ownership of the derivative contract. When dealing with derivatives, equivalent exposure is a more representative measure of the potential impact of a position on portfolio performance than market value. Where the fund holds convertible bonds, these are treated as part of the equity portion of the portfolio. |
| (m) | In determining an instrument’s effective maturity for purposes of calculating the fund’s dollar-weighted average effective maturity, MFS uses the instrument’s stated maturity or, if applicable, an earlier date on which MFS believes it is probable that a maturity-shortening device (such as a put, pre-refunding or prepayment) will cause the instrument to be repaid. Such an earlier date can be substantially shorter than the instrument’s stated maturity. |
Percentages are based on net assets as of 12/31/10, unless otherwise noted.
The portfolio is actively managed and current holdings may be different.
2
MFS Government Securities Portfolio
MANAGEMENT REVIEW
Summary of Results
For the twelve months ended December 31, 2010, Initial Class shares of the MFS Government Securities Portfolio (the “fund”) provided a total return of 4.75%, while Service Class shares of the fund provided a total return of 4.49%. These compare with a return of 5.41% for the fund’s benchmark, the Barclays Capital U.S. Government/Mortgage Bond Index.
Market Environment
The first quarter of the reporting period witnessed a continuation of the financial market and macroeconomic rebounds that had begun in early 2009. These recoveries in global activity and asset valuations were generally synchronized around the world, led importantly by emerging Asian economies, but broadening to include most of the global economy to varying degrees. Primary drivers of the recoveries included an unwinding of the inventory destocking that took place earlier, the production of manufacturing and capital goods, as well as massive fiscal and monetary stimulus.
During most of the remainder of the period, heightened risk surrounding the public-debt profiles of several of the peripheral European countries impaired market sentiment. At the same time, the improving trend in global macroeconomic data began to weaken somewhat. These two dynamics caused many asset prices to retrench significantly, as many questioned the durability of the global recovery.
Towards the end of the period, the U.S. Federal Reserve led markets to believe that further monetary loosening would be forthcoming if macroeconomic activity did not show signs of improvement. The prospects for more easing by the Fed improved market sentiment and drove risk-asset prices markedly higher. However, in a text-book case of “buy the rumor, sell the fact,” the weeks following the early November announcement of further quantitative easing saw a sell-off in U.S. Treasury bonds. This rise in Treasury yields occurred despite risk-off behavior in equities and credit markets (which would normally result in Treasury yield compression), and appears to have been the result of a few factors: signs of improved U.S. and global economic activity; opposition to quantitative easing from some quarters; and crowded long positions in U.S. Treasuries. The December agreement on an expansionary U.S. fiscal package also boosted sentiment, leading markets to reach near-term highs in risky asset valuations toward year end.
Detractors from Performance
Relative to the Barclays Capital U.S. Government/Mortgage Bond Index, the fund’s yield curve (y) positioning, particularly a lesser exposure to shifts in the middle portion of the yield curve (centered around maturities of 7 years) detracted from relative performance.
The fund’s lower exposure to pure pass-through mortgage-backed securities, particularly to Government National Mortgage Association (Ginnie Mae) securities, also held back relative results as these bonds outperformed the benchmark return over the reporting period. A lesser exposure to U.S. treasury securities, which also outperformed the benchmark, also detracted from relative returns.
The fund’s return from yield, which was less than that of the benchmark, was another negative factor for relative performance.
Contributors to Performance
The fund’s greater exposure to commercial mortgage-backed securities, which are not represented in the benchmark, contributed to relative returns as these securities turned in strong performance over the reporting period.
The fund’s lesser exposure to U.S. agency debt also benefited relative performance as this market segment underperformed the benchmark.
A shorter duration (d) stance, relative to the benchmark, was another positive factor for relative results.
Respectfully,
Geoffrey Schechter
Portfolio Manager
| (d) | Duration is a measure of how much a bond’s price is likely to fluctuate with general changes in interest rates, e.g., if rates rise 1.00%, a bond with a 5-year duration is likely to lose about 5.00% of its value. |
| (y) | A yield curve graphically depicts the yields of different maturity bonds of the same credit quality and type; a normal yield curve is upward sloping, with short-term rates lower than long-term rates. |
The views expressed in this report are those of the portfolio manager only through the end of the period of the report as stated on the cover and do not necessarily reflect the views of MFS or any other person in the MFS organization. These views are subject to change at any time based on market or other conditions, and MFS disclaims any responsibility to update such views. These views may not be relied upon as investment advice or an indication of trading intent on behalf of any MFS portfolio. References to specific securities are not recommendations of such securities, and may not be representative of any MFS portfolio’s current or future investments.
3
MFS Government Securities Portfolio
PERFORMANCE SUMMARY THROUGH 12/31/10
The following chart illustrates the historical performance of the fund in comparison to its benchmark(s). Benchmarks are unmanaged and may not be invested in directly. Benchmark returns do not reflect any fees or expenses. The performance of other share classes will be greater than or less than that of the class depicted below. (See Notes to Performance Summary.)
Performance data shown represents past performance and is no guarantee of future results. Investment return and principal value fluctuate so your units, when sold, may be worth more or less than the original cost; current performance may be lower or higher than quoted. The performance shown does not reflect the deduction of taxes, if any, that a contract holder would pay on fund distributions or the redemption of contract units. The returns for the fund shown also do not reflect the deduction of expenses associated with variable products, such as mortality and expense risk charges, separate account charges, and sales charges imposed by the insurance company separate accounts. Such expenses would reduce the overall returns shown.
Growth of a Hypothetical $10,000 Investment
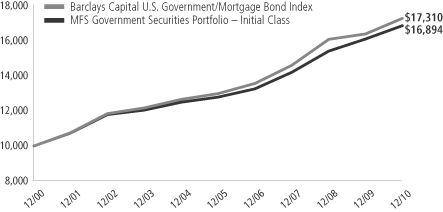
Total Returns through 12/31/10
Average annual total returns
| | | | | | | | | | | | | | |
| | | Share class | | Class inception date | | 1-yr | | 5-yr | | 10-yr | | Life (t) | | |
| | | Initial Class | | 6/12/85 | | 4.75% | | 5.72% | | 5.38% | | N/A | | |
| | | Service Class | | 8/24/01 | | 4.49% | | 5.46% | | N/A | | 4.87% | | |
Comparative benchmark
| | | | | | | | | | | | | | |
| | | Barclays Capital U.S. Government/Mortgage Bond Index (f) | | 5.41% | | 5.88% | | 5.64% | | N/A | | |
| (f) | Source: FactSet Research Systems Inc. |
| (t) | For the period from the class inception date through the stated period end (for those share classes with less than 10 years of performance history). No comparative benchmark performance information is provided for “life” periods. (See Notes to Performance Summary.) |
Benchmark Definition
Barclays Capital U.S. Government/Mortgage Bond Index – measures debt issued by the U.S. Government, and its agencies, as well as mortgage-backed pass-through securities of Ginnie Mae (GNMA), Fannie Mae (FNMA), and Freddie Mac (FHLMC).
It is not possible to invest directly in an index.
Notes to Performance Summary
Average annual total return represents the average annual change in value for each share class for the periods presented. Life returns are presented where the share class has less than 10 years of performance history and represent the average annual total return from the class inception date to the stated period end date. As the fund’s share classes may have different inception dates, the life returns may represent different time periods and may not be comparable. As a result, no comparative benchmark performance information is provided for life periods.
Performance results reflect any applicable expense subsidies and waivers in effect during the periods shown. Without such subsidies and waivers the fund’s performance results would be less favorable. Please see the prospectus and financial statements for complete details. All results are historical and assume the reinvestment of any dividends and capital gains distributions.
From time to time the fund may receive proceeds from litigation settlements, without which performance would be lower.
4
MFS Government Securities Portfolio
EXPENSE TABLE
Fund Expenses Borne by the Contract Holders During the Period,
July 1, 2010 through December 31, 2010
As a contract holder of the fund, you incur ongoing costs, including management fees; distribution and/or service (12b-1) fees; and other fund expenses. This example is intended to help you understand your ongoing costs (in dollars) of investing in the fund and to compare these costs with the ongoing costs of investing in other mutual funds.
The example is based on an investment of $1,000 invested at the beginning of the period and held for the entire period July 1, 2010 through December 31, 2010.
Actual Expenses
The first line for each share class in the following table provides information about actual account values and actual expenses. You may use the information in this line, together with the amount you invested, to estimate the expenses that you paid over the period. Simply divide your account value by $1,000 (for example, an $8,600 account value divided by $1,000 = 8.6), then multiply the result by the number in the first line under the heading entitled “Expenses Paid During Period” to estimate the expenses you paid on your account during this period.
Hypothetical Example for Comparison Purposes
The second line for each share class in the following table provides information about hypothetical account values and hypothetical expenses based on the fund’s actual expense ratio and an assumed rate of return of 5% per year before expenses, which is not the fund’s actual return. The hypothetical account values and expenses may not be used to estimate the actual ending account balance or expenses you paid for the period. You may use this information to compare the ongoing costs of investing in the fund and other funds. To do so, compare this 5% hypothetical example with the 5% hypothetical examples that appear in the shareholder reports of the other funds.
Please note that the expenses shown in the table are meant to highlight the fund’s ongoing costs only and do not take into account the fees and expenses imposed under the variable contracts through which your investment in the fund is made. Therefore, the second line for each share class in the table is useful in comparing ongoing costs associated with an investment in vehicles (such as the fund) which fund benefits under variable annuity and variable life insurance contracts and to qualified pension and retirement plans only, and will not help you determine the relative total costs of investing in the fund through variable annuity and variable life insurance contracts. If the fees and expenses imposed under the variable contracts were included, your costs would have been higher.
| | | | | | | | | | | | | | | | | | |
| Share Class | | | | Annualized
Expense Ratio | | | Beginning
Account Value
7/01/10 | | | Ending
Account Value
12/31/10 | | | Expenses Paid
During Period (p)
7/01/10-12/31/10 | |
| Initial Class | | Actual | | | 0.64% | | | | $1,000.00 | | | | $999.25 | | | | $3.23 | |
| | Hypothetical (h) | | | 0.64% | | | | $1,000.00 | | | | $1,021.98 | | | | $3.26 | |
| Service Class | | Actual | | | 0.89% | | | | $1,000.00 | | | | $998.49 | | | | $4.48 | |
| | Hypothetical (h) | | | 0.89% | | | | $1,000.00 | | | | $1,020.72 | | | | $4.53 | |
| (h) | 5% class return per year before expenses. |
| (p) | Expenses paid is equal to each class’ annualized expense ratio, as shown above, multiplied by the average account value over the period, multiplied by the number of days in the period, divided by the number of days in the year. |
5
MFS Government Securities Portfolio
PORTFOLIO OF INVESTMENTS – 12/31/10
The Portfolio of Investments is a complete list of all securities owned by your fund. It is categorized by broad-based asset classes.
| | | | | | | | |
| Issuer | | Shares/Par | | | Value ($) | |
| | | | | | | | |
| BONDS – 94.0% | | | | | | | | |
| Agency – Other – 4.7% | | | | | | | | |
| Financing Corp., 9.4%, 2018 | | $ | 5,475,000 | | | $ | 7,672,347 | |
| Financing Corp., 9.8%, 2018 | | | 7,760,000 | | | | 11,121,143 | |
| Financing Corp., 10.35%, 2018 | | | 3,415,000 | | | | 5,050,686 | |
| Financing Corp., STRIPS, 0%, 2017 | | | 8,940,000 | | | | 7,193,938 | |
| | | | | | | | |
| | | | | | $ | 31,038,114 | |
| | | | | | | | |
| Asset-Backed & Securitized – 1.4% | | | | | | | | |
| Citigroup/Deutsche Bank Commercial Mortgage Trust, 5.322%, 2049 | | $ | 1,709,000 | | | $ | 1,771,413 | |
| Commercial Mortgage Pass-Through Certificates, “A4”, 5.306%, 2046 | | | 3,445,785 | | | | 3,593,906 | |
| JPMorgan Chase Commercial Mortgage Securities Corp., FRN, 5.817%, 2049 | | | 2,026,008 | | | | 2,119,720 | |
| JPMorgan Chase Commercial Mortgage Securities Corp., FRN, 5.988%, 2051 | | | 1,981,480 | | | | 2,075,379 | |
| | | | | | | | |
| | | | | | $ | 9,560,418 | |
| | | | | | | | |
| Local Authorities – 0.5% | | | | | | | | |
Nashville & Davidson County, TN, Metropolitan Government Convention Center Authority (Build America Bonds), 6.731%, 2043 | | $ | 2,045,000 | | | $ | 2,013,752 | |
| San Francisco, CA, City & County Public Utilities Commission, Water Rev. (Build America Bonds), 6%, 2040 | | | 320,000 | | | | 303,091 | |
| University of California Rev. (Build America Bonds), 5.77%, 2043 | | | 1,220,000 | | | | 1,149,484 | |
| | | | | | | | |
| | | | | | $ | 3,466,327 | |
| | | | | | | | |
| Mortgage-Backed – 45.3% | | | | | | | | |
| Fannie Mae, 5.503%, 2011 | | $ | 649,000 | | | $ | 668,178 | |
| Fannie Mae, 6.088%, 2011 | | | 1,020,000 | | | | 1,038,078 | |
| Fannie Mae, 4.73%, 2012 | | | 863,284 | | | | 905,695 | |
| Fannie Mae, 4.791%, 2012 | | | 393,423 | | | | 410,191 | |
| Fannie Mae, 6.005%, 2012 | | | 262,983 | | | | 270,079 | |
| Fannie Mae, 4.517%, 2013 | | | 779,973 | | | | 818,468 | |
| Fannie Mae, 4.542%, 2013 | | | 1,391,238 | | | | 1,466,227 | |
| Fannie Mae, 4.845%, 2013 | | | 1,653,750 | | | | 1,757,288 | |
| Fannie Mae, 5.06%, 2013 | | | 841,088 | | | | 876,909 | |
| Fannie Mae, 5.159%, 2013 | | | 2,188,509 | | | | 2,348,199 | |
| Fannie Mae, 5.371%, 2013 | | | 1,508,461 | | | | 1,584,841 | |
| Fannie Mae, 4.562%, 2014 | | | 985,303 | | | | 1,053,375 | |
| Fannie Mae, 4.6%, 2014 | | | 803,460 | | | | 857,349 | |
| Fannie Mae, 4.61%, 2014 | | | 3,138,243 | | | | 3,356,551 | |
| Fannie Mae, 4.77%, 2014 | | | 688,448 | | | | 740,720 | |
| Fannie Mae, 4.82%, 2014 | | | 706,610 | | | | 766,228 | |
| Fannie Mae, 4.841%, 2014 | | | 4,664,991 | | | | 5,013,438 | |
| Fannie Mae, 4.872%, 2014 | | | 2,916,444 | | | | 3,102,640 | |
| Fannie Mae, 4.88%, 2014 - 2020 | | | 854,897 | | | | 911,105 | |
| Fannie Mae, 5.1%, 2014 | | | 870,132 | | | | 943,136 | |
| Fannie Mae, 4.56%, 2015 | | | 1,040,414 | | | | 1,114,972 | |
| Fannie Mae, 4.62%, 2015 | | | 1,453,325 | | | | 1,559,829 | |
| Fannie Mae, 4.665%, 2015 | | | 703,349 | | | | 756,178 | |
| | | | | | | | |
| Issuer | | Shares/Par | | | Value ($) | |
| | | | | | | | |
| BONDS – continued | | | | | | | | |
| Mortgage-Backed – continued | | | | | | | | |
| Fannie Mae, 4.69%, 2015 | | $ | 573,816 | | | $ | 617,279 | |
| Fannie Mae, 4.7%, 2015 | | | 1,041,652 | | | | 1,121,090 | |
| Fannie Mae, 4.74%, 2015 | | | 660,079 | | | | 710,840 | |
| Fannie Mae, 4.78%, 2015 | | | 915,267 | | | | 987,097 | |
| Fannie Mae, 4.79%, 2015 | | | 951,290 | | | | 1,025,509 | |
| Fannie Mae, 4.81%, 2015 | | | 919,301 | | | | 992,503 | |
| Fannie Mae, 4.815%, 2015 | | | 818,387 | | | | 883,278 | |
| Fannie Mae, 4.85%, 2015 | | | 575,847 | | | | 622,436 | |
| Fannie Mae, 4.856%, 2015 | | | 312,314 | | | | 335,839 | |
| Fannie Mae, 4.87%, 2015 | | | 606,246 | | | | 656,029 | |
| Fannie Mae, 4.89%, 2015 | | | 685,069 | | | | 741,598 | |
| Fannie Mae, 4.922%, 2015 | | | 2,310,893 | | | | 2,508,849 | |
| Fannie Mae, 4.997%, 2015 | | | 160,356 | | | | 174,613 | |
| Fannie Mae, 5.466%, 2015 | | | 3,055,245 | | | | 3,347,027 | |
| Fannie Mae, 4.5%, 2016 - 2029 | | | 15,882,197 | | | | 16,738,409 | |
| Fannie Mae, 5.157%, 2016 | | | 1,454,596 | | | | 1,594,011 | |
| Fannie Mae, 5.424%, 2016 | | | 1,870,892 | | | | 2,047,758 | |
| Fannie Mae, 5.725%, 2016 | | | 1,582,944 | | | | 1,729,160 | |
| Fannie Mae, 6.5%, 2016 - 2037 | | | 5,336,229 | | | | 5,977,137 | |
| Fannie Mae, 4.99%, 2017 | | | 3,434,845 | | | | 3,752,078 | |
| Fannie Mae, 5.5%, 2017 - 2038 | | | 48,808,571 | | | | 52,385,856 | |
| Fannie Mae, 6%, 2017 - 2037 | | | 10,831,912 | | | | 11,785,998 | |
| Fannie Mae, 5.161%, 2018 | | | 1,419,723 | | | | 1,546,701 | |
| Fannie Mae, 5.68%, 2018 | | | 473,681 | | | | 514,283 | |
| Fannie Mae, 4.67%, 2019 | | | 525,000 | | | | 551,468 | |
| Fannie Mae, 4.83%, 2019 | | | 394,313 | | | | 418,005 | |
| Fannie Mae, 4.874%, 2019 | | | 2,382,926 | | | | 2,590,016 | |
| Fannie Mae, 5%, 2019 - 2039 | | | 29,806,910 | | | | 31,516,718 | |
| Fannie Mae, 5.05%, 2019 | | | 329,960 | | | | 353,750 | |
| Fannie Mae, 5.6%, 2019 | | | 606,476 | | | | 656,924 | |
| Fannie Mae, 7.5%, 2022 - 2031 | | | 655,229 | | | | 751,028 | |
| Fannie Mae, 4.5%, 2025 | | | 1,219,340 | | | | 1,281,069 | |
| Freddie Mac, 4.375%, 2015 | | | 658,506 | | | | 671,285 | |
| Freddie Mac, 4.5%, 2015 - 2028 | | | 3,018,860 | | | | 3,130,396 | |
| Freddie Mac, 5%, 2016 - 2040 | | | 16,273,523 | | | | 17,118,105 | |
| Freddie Mac, 4.186%, 2019 | | | 814,000 | | | | 825,351 | |
| Freddie Mac, 5.085%, 2019 | | | 2,879,000 | | | | 3,043,942 | |
| Freddie Mac, 4.224%, 2020 | | | 1,758,821 | | | | 1,783,115 | |
| Freddie Mac, 4.251%, 2020 | | | 1,330,000 | | | | 1,348,787 | |
| Freddie Mac, 6%, 2021 - 2038 | | | 22,034,299 | | | | 24,161,729 | |
| Freddie Mac, 5.5%, 2022 - 2036 | | | 28,423,517 | | | | 30,494,072 | |
| Freddie Mac, 4%, 2025 | | | 5,685,905 | | | | 5,857,370 | |
| Freddie Mac, 6.5%, 2032 - 2037 | | | 3,495,346 | | | | 3,918,655 | |
| Ginnie Mae, 4%, 2032 | | | 166,228 | | | | 169,520 | |
| Ginnie Mae, 5.5%, 2033 - 2038 | | | 10,240,479 | | | | 11,100,121 | |
| Ginnie Mae, 4.5%, 2039 - 2040 | | | 7,407,815 | | | | 7,739,045 | |
| Ginnie Mae, 5.612%, 2058 | | | 4,819,867 | | | | 5,185,319 | |
| Ginnie Mae, 6.357%, 2058 | | | 2,840,198 | | | | 3,087,273 | |
| | | | | | | | |
| | | | | | $ | 302,868,115 | |
| | | | | | | | |
6
MFS Government Securities Portfolio
Portfolio of Investments – continued
| | | | | | | | |
| Issuer | | Shares/Par | | | Value ($) | |
| | | | | | | | |
| BONDS – continued | | | | | | | | |
| Municipals – 1.8% | | | | | | | | |
| California Educational Facilities Authority Rev. (Stanford University), 5.25%, 2040 | | $ | 2,185,000 | | | $ | 2,342,080 | |
| Massachusetts Bay Transportation Authority, Sales Tax Rev., “A-1”, 5.25%, 2028 | | | 2,995,000 | | | | 3,197,342 | |
| Massachusetts Health & Educational Facilities Authority Rev. (Boston College), 5.5%, 2027 | | | 2,125,000 | | | | 2,343,493 | |
| Massachusetts Health & Educational Facilities Authority Rev. (Massachusetts Institute of Technology), “K”, 5.5%, 2032 | | | 2,445,000 | | | | 2,704,268 | |
| Massachusetts Water Pollution Abatement Trust, 5.25%, 2033 | | | 1,020,000 | | | | 1,090,115 | |
| | | | | | | | |
| | | | | | $ | 11,677,298 | |
| | | | | | | | |
| U.S. Government Agencies and Equivalents – 4.3% | | | | | |
| Aid-Egypt, 4.45%, 2015 | | $ | 2,827,000 | | | $ | 3,098,562 | |
| Farmer Mac, 5.5%, 2011 (n) | | | 5,370,000 | | | | 5,514,716 | |
FDIC Structured Sale Guarantee Note, 0%, 2012 (n) | | | 473,000 | | | | 460,409 | |
| Small Business Administration, 6.35%, 2021 | | | 1,069,677 | | | | 1,163,612 | |
| Small Business Administration, 6.34%, 2021 | | | 997,470 | | | | 1,085,512 | |
| Small Business Administration, 6.44%, 2021 | | | 1,285,973 | | | | 1,402,560 | |
Small Business Administration, 6.625%, 2021 | | | 1,548,525 | | | | 1,691,370 | |
| Small Business Administration, 6.07%, 2022 | | | 1,265,125 | | | | 1,400,595 | |
| Small Business Administration, 4.98%, 2023 | | | 1,116,114 | | | | 1,179,314 | |
| Small Business Administration, 4.77%, 2024 | | | 1,918,326 | | | | 2,033,850 | |
| Small Business Administration, 5.52%, 2024 | | | 1,477,431 | | | | 1,582,883 | |
| Small Business Administration, 5.11%, 2025 | | | 1,452,121 | | | | 1,544,921 | |
| U.S. Department of Housing & Urban Development, 6.36%, 2016 | | | 6,000,000 | | | | 6,187,740 | |
| U.S. Department of Housing & Urban Development, 6.59%, 2016 | | | 307,000 | | | | 303,216 | |
| | | | | | | | |
| | | | | | $ | 28,649,260 | |
| | | | | | | | |
| U.S. Treasury Obligations – 36.0% | | | | | | | | |
| U.S. Treasury Bonds, 7.875%, 2021 | | $ | 114,000 | | | $ | 159,030 | |
| U.S. Treasury Bonds, 6.25%, 2023 | | | 2,875,000 | | | | 3,613,516 | |
| U.S. Treasury Bonds, 6%, 2026 | | | 2,699,000 | | | | 3,337,060 | |
| U.S. Treasury Bonds, 6.75%, 2026 | | | 1,829,000 | | | | 2,428,568 | |
| U.S. Treasury Bonds, 6.375%, 2027 | | | 2,221,000 | | | | 2,858,149 | |
| | | | | | | | |
| Issuer | | Shares/Par | | | Value ($) | |
| | | | | | | | |
| BONDS – continued | | | | | | | | |
| U.S. Treasury Obligations – continued | | | | | | | | |
| U.S. Treasury Bonds, 5.25%, 2029 | | $ | 25,261,000 | | | $ | 28,971,209 | |
| U.S. Treasury Bonds, 5%, 2037 | | | 488,000 | | | | 544,501 | |
| U.S. Treasury Bonds, 4.375%, 2038 | | | 7,074,000 | | | | 7,149,161 | |
| U.S. Treasury Bonds, 4.5%, 2039 | | | 11,564,200 | | | | 11,874,988 | |
| U.S. Treasury Notes, 0.75%, 2011 | | | 28,000,000 | | | | 28,110,460 | |
| U.S. Treasury Notes, 3.125%, 2013 (f) | | | 28,438,000 | | | | 30,168,708 | |
| U.S. Treasury Notes, 1.875%, 2014 | | | 10,810,000 | | | | 11,055,755 | |
| U.S. Treasury Notes, 4%, 2015 | | | 6,108,000 | | | | 6,691,601 | |
| U.S. Treasury Notes, 2.125%, 2015 | | | 22,402,000 | | | | 22,759,088 | |
| U.S. Treasury Notes, 3.75%, 2018 | | | 52,224,000 | | | | 55,549,207 | |
| U.S. Treasury Notes, 3.125%, 2019 | | | 4,709,000 | | | | 4,758,666 | |
| U.S. Treasury Notes, 3.5%, 2020 | | | 11,150,000 | | | | 11,421,837 | |
| U.S. Treasury Notes, TIPS, 1.25%, 2020 | | | 9,237,436 | | | | 9,458,266 | |
| | | | | | | | |
| | | | | | $ | 240,909,770 | |
| | | | | | | | |
Total Bonds (Identified Cost, $603,631,846) | | | | | | $ | 628,169,302 | |
| | | | | | | | |
| MONEY MARKET FUNDS (v) – 5.4% | | | | | | | | |
| MFS Institutional Money Market Portfolio, 0.18%, at Cost and Net Asset Value | | | 36,330,825 | | | $ | 36,330,825 | |
| | | | | | | | |
Total Investments (Identified Cost, $639,962,671) | | | | | | $ | 664,500,127 | |
| | | | | | | | |
OTHER ASSETS, LESS LIABILITIES – 0.6% | | | | | | | 4,124,150 | |
| | | | | | | | |
| Net Assets – 100.0% | | | | | | $ | 668,624,277 | |
| | | | | | | | |
| (f) | | All or a portion of the security has been segregated as collateral for open futures contracts. |
| (n) | | Securities exempt from registration under Rule 144A of the Securities Act of 1933. These securities may be sold in the ordinary course of business in transactions exempt from registration, normally to qualified institutional buyers. At period end, the aggregate value of these securities was $5,975,125, representing 0.9% of net assets. |
| (v) | | Underlying fund that is available only to investment companies managed by MFS. The rate quoted is the annualized seven-day yield of the fund at period end. |
The following abbreviations are used in this report and are defined:
| FRN | | Floating Rate Note. Interest rate resets periodically and may not be the rate reported at period end. |
| STRIPS | | Separate Trading of Registered Interest and Principal of Securities |
| TIPS | | Treasury Inflation Protected Security |
Derivative Contracts at 12/31/10
Futures Contracts Outstanding at 12/31/10
| | | | | | | | | | | | | | | | |
| Description | | Currency | | | Contracts | | | Value | | Expiration
Date | | Unrealized
Appreciation
(Depreciation) | |
| Asset Derivatives | | | | | | | | | | | | | |
| Interest Rate Futures | | | | | | | | | | | | | | | | |
| U.S. Treasury Bond 30 yr (Short) | | | USD | | | | 18 | | | $2,198,250 | | March - 2011 | | | $89,375 | |
| | | | | | | | | | | | | | | | |
At December 31, 2010, the fund had sufficient cash and/or other liquid securities to cover any commitments under these derivative contracts.
See Notes to Financial Statements
7
MFS Government Securities Portfolio
FINANCIAL STATEMENTS | STATEMENT OF ASSETS AND LIABILITIES
This statement represents your fund’s balance sheet, which details the assets and liabilities comprising the total value of the fund.
| | | | | | | | |
At 12/31/10 | | | | | | | | |
| Assets | | | | | | | | |
Investments – | | | | | | | | |
Non-affiliated issuers, at value (identified cost, $603,631,846) | | | $628,169,302 | | | | | |
Underlying funds, at cost and value | | | 36,330,825 | | | | | |
Total investments, at value (identified cost, $639,962,671) | | | $664,500,127 | | | | | |
Receivables for | | | | | | | | |
Fund shares sold | | | 20,169 | | | | | |
Interest | | | 4,459,420 | | | | | |
Other assets | | | 19,519 | | | | | |
Total assets | | | | | | | $668,999,235 | |
Liabilities | | | | | | | | |
Payables for | | | | | | | | |
Daily variation margin on open futures contracts | | | $20,250 | | | | | |
Fund shares reacquired | | | 216,169 | | | | | |
Payable to affiliates | | | | | | | | |
Investment adviser | | | 20,102 | | | | | |
Distribution and/or service fees | | | 6,024 | | | | | |
Administrative services fee | | | 1,278 | | | | | |
Payable for Trustees’ compensation | | | 682 | | | | | |
Accrued expenses and other liabilities | | | 110,453 | | | | | |
Total liabilities | | | | | | | $374,958 | |
Net assets | | | | | | | $668,624,277 | |
Net assets consist of | | | | | | | | |
Paid-in capital | | | $625,262,684 | | | | | |
Unrealized appreciation (depreciation) on investments | | | 24,626,831 | | | | | |
Accumulated net realized gain (loss) on investments | | | (4,482,545 | ) | | | | |
Undistributed net investment income | | | 23,217,307 | | | | | |
Net assets | | | | | | | $668,624,277 | |
Shares of beneficial interest outstanding | | | | | | | 50,612,309 | |
| | | | | | | | | | | | |
| | | Net assets | | | Shares
outstanding | | | Net asset value
per share | |
Initial Class | | | $227,694,456 | | | | 17,154,121 | | | | $13.27 | |
Service Class | | | 440,929,821 | | | | 33,458,188 | | | | 13.18 | |
See Notes to Financial Statements
8
MFS Government Securities Portfolio
FINANCIAL STATEMENTS | STATEMENT OF OPERATIONS
This statement describes how much your fund earned in investment income and accrued in expenses. It also describes any gains and/or losses generated by fund operations.
| | | | | | | | |
| Year ended 12/31/10 | | | | | | | | |
| Net investment income | | | | | | | | |
Income | | | | | | | | |
Interest | | | $26,863,280 | | | | | |
Dividends from underlying funds | | | 85,762 | | | | | |
Total investment income | | | | | | | $26,949,042 | |
Expenses | | | | | | | | |
Management fee | | | $3,682,685 | | | | | |
Distribution and/or service fees | | | 1,069,815 | | | | | |
Administrative services fee | | | 233,537 | | | | | |
Trustees’ compensation | | | 88,666 | | | | | |
Custodian fee | | | 124,958 | | | | | |
Shareholder communications | | | 47,010 | | | | | |
Auditing fees | | | 50,103 | | | | | |
Legal fees | | | 7,372 | | | | | |
Miscellaneous | | | 56,826 | | | | | |
Total expenses | | | | | | | $5,360,972 | |
Fees paid indirectly | | | (47 | ) | | | | |
Net expenses | | | | | | | $5,360,925 | |
Net investment income | | | | | | | $21,588,117 | |
Realized and unrealized gain (loss) on investments | | | | | | | | |
Realized gain (loss) (identified cost basis) | | | | | | | | |
Investment transactions | | | $2,959,445 | | | | | |
Futures contracts | | | (137,849 | ) | | | | |
Net realized gain (loss) on investments | | | | | | | $2,821,596 | |
Change in unrealized appreciation (depreciation) | | | | | | | | |
Investments | | | $5,946,914 | | | | | |
Futures contracts | | | 112,526 | | | | | |
Net unrealized gain (loss) on investments | | | | | | | $6,059,440 | |
Net realized and unrealized gain (loss) on investments | | | | | | | $8,881,036 | |
Change in net assets from operations | | | | | | | $30,469,153 | |
See Notes to Financial Statements
9
MFS Government Securities Portfolio
FINANCIAL STATEMENTS | STATEMENTS OF CHANGES IN NET ASSETS
These statements describe the increases and/or decreases in net assets resulting from operations, any distributions, and any shareholder transactions.
| | | | | | | | |
Year ended 12/31 | | | 2010 | | | | 2009 | |
Change in net assets | | | | | | | | |
From operations | | | | | | | | |
Net investment income | | | $21,588,117 | | | | $21,895,224 | |
Net realized gain (loss) on investments | | | 2,821,596 | | | | 2,976,893 | |
Net unrealized gain (loss) on investments | | | 6,059,440 | | | | 499,119 | |
Change in net assets from operations | | | $30,469,153 | | | | $25,371,236 | |
Distributions declared to shareholders | | | | | | | | |
From net investment income | | | $(23,390,230 | ) | | | $(26,160,014 | ) |
Change in net assets from fund share transactions | | | $(5,850,571 | ) | | | $130,962,885 | |
Total change in net assets | | | $1,228,352 | | | | $130,174,107 | |
Net assets | | | | | | | | |
At beginning of period | | | 667,395,925 | | | | 537,221,818 | |
At end of period (including undistributed net investment income of $23,217,307 and
$23,384,354, respectively) | | | $668,624,277 | | | | $667,395,925 | |
See Notes to Financial Statements
10
MFS Government Securities Portfolio
FINANCIAL STATEMENTS | FINANCIAL HIGHLIGHTS
The financial highlights table is intended to help you understand the fund’s financial performance for the past 5 years. Certain information reflects financial results for a single fund share. The total returns in the table represent the rate by which an investor would have earned (or lost) on an investment in the fund share class (assuming reinvestment of all distributions) held for the entire period.
| | | | | | | | | | | | | | | | | | | | |
| Initial Class | | Years ended 12/31 | |
| | | 2010 | | | 2009 | | | 2008 | | | 2007 | | | 2006 | |
Net asset value, beginning of period | | | $13.14 | | | | $13.23 | | | | $12.89 | | | | $12.65 | | | | $12.84 | |
| Income (loss) from investment operations | | | | | | | | | | | | | | | | | | | | |
Net investment income (d) | | | $0.45 | | | | $0.50 | | | | $0.55 | | | | $0.56 | | | | $0.56 | |
Net realized and unrealized gain (loss) on investments | | | 0.16 | | | | 0.08 | | | | 0.51 | | | | 0.31 | | | | (0.12 | ) |
Total from investment operations | | | $0.61 | | | | $0.58 | | | | $1.06 | | | | $0.87 | | | | $0.44 | |
| Less distributions declared to shareholders | | | | | | | | | | | | | | | | | | | | |
From net investment income | | | $(0.48 | ) | | | $(0.67 | ) | | | $(0.72 | ) | | | $(0.63 | ) | | | $(0.63 | ) |
Net asset value, end of period | | | $13.27 | | | | $13.14 | | | | $13.23 | | | | $12.89 | | | | $12.65 | |
Total return (%) (k)(s) | | | 4.75 | | | | 4.49 | | | | 8.55 | | | | 7.18 | | | | 3.68 | |
Ratios (%) (to average net assets)
and Supplemental data: | | | | | | | | | | | | | | | | | | | | |
Expenses (f) | | | 0.64 | | | | 0.64 | | | | 0.65 | | | | 0.63 | | | | 0.63 | |
Net investment income | | | 3.39 | | | | 3.85 | | | | 4.31 | | | | 4.48 | | | | 4.47 | |
Portfolio turnover | | | 36 | | | | 36 | | | | 52 | | | | 39 | | | | 29 | |
Net assets at end of period (000 omitted) | | | $227,694 | | | | $250,133 | | | | $266,170 | | | | $299,871 | | | | $351,906 | |
| |
| Service Class | | Years ended 12/31 | |
| | | 2010 | | | 2009 | | | 2008 | | | 2007 | | | 2006 | |
Net asset value, beginning of period | | | $13.06 | | | | $13.15 | | | | $12.81 | | | | $12.58 | | | | $12.77 | |
| Income (loss) from investment operations | | | | | | | | | | | | | | | | | | | | |
Net investment income (d) | | | $0.41 | | | | $0.46 | | | | $0.52 | | | | $0.53 | | | | $0.53 | |
Net realized and unrealized gain (loss) on investments | | | 0.17 | | | | 0.08 | | | | 0.50 | | | | 0.31 | | | | (0.12 | ) |
Total from investment operations | | | $0.58 | | | | $0.54 | | | | $1.02 | | | | $0.84 | | | | $0.41 | |
| Less distributions declared to shareholders | | | | | | | | | | | | | | | | | | | | |
From net investment income | | | $(0.46 | ) | | | $(0.63 | ) | | | $(0.68 | ) | | | $(0.61 | ) | | | $(0.60 | ) |
Net asset value, end of period | | | $13.18 | | | | $13.06 | | | | $13.15 | | | | $12.81 | | | | $12.58 | |
Total return (%) (k)(s) | | | 4.49 | | | | 4.23 | | | | 8.29 | | | | 6.91 | | | | 3.47 | |
Ratios (%) (to average net assets)
and Supplemental data: | | | | | | | | | | | | | | | | | | | | |
Expenses (f) | | | 0.89 | | | | 0.89 | | | | 0.90 | | | | 0.88 | | | | 0.88 | |
Net investment income | | | 3.13 | | | | 3.54 | | | | 4.06 | | | | 4.23 | | | | 4.22 | |
Portfolio turnover | | | 36 | | | | 36 | | | | 52 | | | | 39 | | | | 29 | |
Net assets at end of period (000 omitted) | | | $440,930 | | | | $417,263 | | | | $271,052 | | | | $320,695 | | | | $309,162 | |
| (d) | Per share data is based on average shares outstanding. |
| (f) | Ratios do not reflect reductions from fees paid indirectly, if applicable. |
| (k) | The total return does not reflect expenses that apply to separate accounts. Inclusion of these charges would reduce the total return figures for all periods shown. |
| (s) | From time to time the fund may receive proceeds from litigation settlements, without which performance would be lower. |
See Notes to Financial Statements
11
MFS Government Securities Portfolio
NOTES TO FINANCIAL STATEMENTS
| (1) | | Business and Organization |
MFS Government Securities Portfolio (the fund) is a series of MFS Variable Insurance Trust II (the trust). The trust is organized as a Massachusetts business trust and is registered under the Investment Company Act of 1940, as amended, as an open-end management investment company. The shareholders of each series of the trust are separate accounts of insurance companies, which offer variable annuity and/or life insurance products, and qualified retirement and pension plans.
| (2) | | Significant Accounting Policies |
General – The preparation of financial statements in conformity with U.S. generally accepted accounting principles requires management to make estimates and assumptions that affect the reported amounts of assets and liabilities, and disclosure of contingent assets and liabilities at the date of the financial statements and the reported amounts of revenues and expenses during the reporting period. Actual results could differ from those estimates. In the preparation of these financial statements, management has evaluated subsequent events occurring after the date of the fund’s Statement of Assets and Liabilities through the date that the financial statements were issued. The fund invests a significant portion of its assets in asset-backed and/or mortgage-backed securities. The value of these securities may depend, in part, on the issuer’s or borrower’s credit quality or ability to pay principal and interest when due and may fall if an issuer or borrower defaults on its obligation to pay principal or interest or if the instrument’s credit rating is downgraded by a credit rating agency. U.S. Government securities not supported as to the payment of principal or interest by the U.S. Treasury, such as those issued by Fannie Mae, Freddie Mac, and the Federal Home Loan Banks, are subject to greater credit risk than are U.S. Government securities supported by the U.S. Treasury, such as those issued by Ginnie Mae.
Investment Valuations – Debt instruments and floating rate loans (other than short-term instruments), including restricted debt instruments, are generally valued at an evaluated or composite bid as provided by a third-party pricing service. Short-term instruments with a maturity at issuance of 60 days or less generally are valued at amortized cost, which approximates market value. Futures contracts are generally valued at last posted settlement price as provided by a third-party pricing service on the market on which they are primarily traded. Futures contracts for which there were no trades that day for a particular position are generally valued at the closing bid quotation as provided by a third-party pricing service on the market on which such futures contracts are primarily traded. Open-end investment companies are generally valued at net asset value per share. Securities and other assets generally valued on the basis of information from a third-party pricing service may also be valued at a broker/dealer bid quotation. Values obtained from third-party pricing services can utilize both transaction data and market information such as yield, quality, coupon rate, maturity, type of issue, trading characteristics, and other market data.
The Board of Trustees has delegated primary responsibility for determining or causing to be determined the value of the fund’s investments (including any fair valuation) to the adviser pursuant to valuation policies and procedures approved by the Board. If the adviser determines that reliable market quotations are not readily available, investments are valued at fair value as determined in good faith by the adviser in accordance with such procedures under the oversight of the Board of Trustees. Under the fund’s valuation policies and procedures, market quotations are not considered to be readily available for most types of debt instruments and floating rate loans and many types of derivatives. These investments are generally valued at fair value based on information from third-party pricing services. In addition, investments may be valued at fair value if the adviser determines that an investment’s value has been materially effected by events occurring after the close of the exchange or market on which the investment is principally traded (such as foreign exchange or market) and prior to the determination of the fund’s net asset value, or after the halting of trading of a specific security where trading does not resume prior to the close of the exchange or market on which the security is principally traded. The adviser generally relies on third-party pricing services or other information (such as the correlation with price movements of similar securities in the same or other markets; the type, cost and investment characteristics of the security; the business and financial condition of the issuer; and trading and other market data) to assist in determining whether to fair value and at what value to fair value an investment. The value of an investment for purposes of calculating the fund’s net asset value can differ depending on the source and method used to determine value. When fair valuation is used, the value of an investment used to determine the fund’s net asset value may differ from quoted or published prices for the same investment. There can be no assurance that the fund could obtain the fair value assigned to an investment if it were to sell the investment at the same time at which the fund determines its net asset value per share.
Various inputs are used in determining the value of the fund’s assets or liabilities. These inputs are categorized into three broad levels. In certain cases, the inputs used to measure fair value may fall into different levels of the fair value hierarchy. In such cases, an investment’s level within the fair value hierarchy is based on the lowest level of input that is significant to the fair value measurement. The fund’s assessment of the significance of a particular input to the fair value measurement in its entirety requires judgment, and considers factors specific to the investment. Level 1 includes unadjusted quoted prices in active
12
MFS Government Securities Portfolio
Notes to Financial Statements – continued
markets for identical assets or liabilities. Level 2 includes other significant observable market-based inputs (including quoted prices for similar securities, interest rates, prepayment speed, and credit risk). Level 3 includes unobservable inputs, which may include the adviser’s own assumptions in determining the fair value of investments. Other financial instruments are derivative instruments not reflected in total investments, such as futures. The following is a summary of the levels used as of December 31, 2010 in valuing the fund’s assets or liabilities:
| | | | | | | | | | | | | | | | |
| Investments at Value | | Level 1 | | | Level 2 | | | Level 3 | | | Total | |
| U.S. Treasury Bonds & U.S. Government Agency & Equivalents | | | $— | | | | $300,597,144 | | | | $— | | | | $300,597,144 | |
| Municipal Bonds | | | — | | | | 11,677,298 | | | | — | | | | 11,677,298 | |
| Corporate Bonds | | | — | | | | 3,466,327 | | | | — | | | | 3,466,327 | |
| Residential Mortgage-Backed Securities | | | — | | | | 302,868,115 | | | | — | | | | 302,868,115 | |
| Commercial Mortgage-Backed Securities | | | — | | | | 9,560,418 | | | | — | | | | 9,560,418 | |
| Mutual Funds | | | 36,330,825 | | | | — | | | | — | | | | 36,330,825 | |
| Total Investments | | | $36,330,825 | | | | $628,169,302 | | | | $— | | | | $664,500,127 | |
| | | | |
| Other Financial Instruments | | | | | | | | | | | | |
| Futures | | | $89,375 | | | | $— | | | | $— | | | | $89,375 | |
For further information regarding security characteristics, see the Portfolio of Investments.
Inflation-Adjusted Debt Securities – The fund invests in inflation-adjusted debt securities issued by the U.S. Treasury. The fund may also invest in inflation-adjusted debt securities issued by U.S. Government agencies and instrumentalities other than the U.S. Treasury and by other entities such as U.S. and foreign corporations and foreign governments. The principal value of these debt securities is adjusted through income according to changes in the Consumer Price Index or another general price or wage index. These debt securities typically pay a fixed rate of interest, but this fixed rate is applied to the inflation-adjusted principal amount. The principal paid at maturity of the debt security is typically equal to the inflation-adjusted principal amount, or the security’s original par value, whichever is greater. Other types of inflation-adjusted securities may use other methods to adjust for other measures of inflation.
Derivatives – The fund uses derivatives for different purposes, including to earn income and enhance returns, to increase or decrease exposure to a particular market, to manage or adjust the risk profile of the fund, or as alternatives to direct investments. Derivatives are used for hedging or non-hedging purposes. While hedging can reduce or eliminate losses, it can also reduce or eliminate gains. When the fund uses derivatives as an investment to increase market exposure, or for hedging purposes, gains and losses from derivative instruments may be substantially greater than the derivative’s original cost.
Derivative instruments used by the fund during the period include futures contracts. The fund’s period end derivatives, as presented in the Portfolio of Investments and the associated Derivative Contract Tables, generally are indicative of the volume of its derivative activity during the period.
The following table presents, by major type of derivative contract, the fair value, on a gross basis, of the asset and liability components of derivatives held by the fund at December 31, 2010 as reported in the Statement of Assets and Liabilities:
| | | | | | | | | | |
| | | | | Fair Value (a) | |
| Risk | | Derivative | | Asset Derivatives | | | Liability Derivatives | |
| Interest Rate Contracts | | Interest Rate Futures | | | $89,375 | | | | $— | |
| (a) | The value of futures contracts outstanding includes cumulative appreciation (depreciation) as reported in the fund’s Portfolio of Investments. Only the current day variation margin for futures contracts is separately reported within the fund’s Statement of Assets and Liabilities. |
The following table presents, by major type of derivative contract, the realized gain (loss) on derivatives held by the fund for the year ended December 31, 2010 as reported in the Statement of Operations:
| | | | |
| Risk | | Futures Contracts | |
| Interest Rate Contracts | | | $(137,849 | ) |
The following table presents, by major type of derivative contract, the change in unrealized appreciation (depreciation) on derivatives held by the fund for the year ended December 31, 2010 as reported in the Statement of Operations:
| | | | |
| Risk | | Futures Contracts | |
| Interest Rate Contracts | | | $112,526 | |
Derivative counterparty credit risk is managed through formal evaluation of the creditworthiness of all potential counterparties. On certain over-the-counter derivatives, the fund attempts to reduce its exposure to counterparty credit risk
13
MFS Government Securities Portfolio
Notes to Financial Statements – continued
whenever possible by entering into an International Swaps and Derivatives Association (ISDA) Master Agreement on a bilateral basis with each of the counterparties with whom it undertakes a significant volume of transactions. The ISDA Master Agreement gives each party to the agreement the right to terminate all transactions traded under such agreement if there is a certain deterioration in the credit quality of the other party. The ISDA Master Agreement gives the fund the right, upon an event of default by the applicable counterparty or a termination of the agreement, to close out all transactions traded under such agreement and to net amounts owed under each transaction to one net amount payable by one party to the other. This right to close out and net payments across all transactions traded under the ISDA Master Agreement could result in a reduction of the fund’s credit risk to such counterparty equal to any amounts payable by the fund under the applicable transactions, if any. However, absent an event of default by the counterparty or a termination of the agreement, the ISDA Master Agreement does not result in an offset of reported amounts of assets and liabilities in the Statement of Assets and Liabilities across transactions between the fund and the applicable counterparty.
Collateral requirements differ by type of derivative. Collateral or margin requirements are set by the broker or exchange clearing house for exchange traded derivatives (i.e., futures and exchange-traded options) while collateral terms are contract specific for over-the-counter traded derivatives (i.e., forwards, swaps and over-the-counter options). For derivatives traded under an ISDA Master Agreement, the collateral requirements are netted across all transactions traded under such agreement and one amount is posted from one party to the other to collateralize such obligations. Cash collateral that has been pledged to cover obligations of the fund under derivative contracts, if any, will be reported separately on the Statement of Assets and Liabilities as restricted cash. Securities collateral pledged for the same purpose, if any, is noted in the Portfolio of Investments.
Futures Contracts – The fund entered into futures contracts which may be used to gain or to hedge against broad market, interest rate or currency exposure. A futures contract represents a commitment for the future purchase or sale of an asset at a specified price on a specified date.
Upon entering into a futures contract, the fund is required to deposit with the broker, either in cash or securities, an initial margin in an amount equal to a certain percentage of the notional amount of the contract. Subsequent payments (variation margin) are made or received by the fund each day, depending on the daily fluctuations in the value of the contract, and are recorded for financial statement purposes as unrealized gain or loss by the fund until the contract is closed or expires at which point the gain or loss on futures is realized.
The fund bears the risk of interest rates, exchange rates or securities prices moving unexpectedly, in which case, the fund may not achieve the anticipated benefits of the futures contracts and may realize a loss. While futures may present less counterparty risk to the fund since the contracts are exchange traded and the exchange’s clearinghouse guarantees payments to the broker, there is still counterparty credit risk due to the insolvency of the broker. The fund’s maximum risk of loss due to counterparty credit risk is equal to the margin posted by the fund to the broker plus any gains or minus any losses on the outstanding futures contracts.
Indemnifications – Under the fund’s organizational documents, its officers and Trustees may be indemnified against certain liabilities and expenses arising out of the performance of their duties to the fund. Additionally, in the normal course of business, the fund enters into agreements with service providers that may contain indemnification clauses. The fund’s maximum exposure under these agreements is unknown as this would involve future claims that may be made against the fund that have not yet occurred.
Investment Transactions and Income – Investment transactions are recorded on the trade date. Interest income is recorded on the accrual basis. All premium and discount is amortized or accreted for financial statement purposes in accordance with U.S. generally accepted accounting principles. Inflation-indexed bonds are fixed-income securities whose principal value is periodically adjusted upward or downward to the rate of inflation. Interest is accrued based on the principal value, which is adjusted for inflation. Any increase or decrease in the principal amount of an inflation-indexed bond is generally recorded as an increase or decrease in interest income, respectively, even though the adjusted principal is not received until maturity.
The fund may receive proceeds from litigation settlements. Any proceeds received from litigation involving portfolio holdings are reflected in the Statement of Operations in realized gain/loss if the security has been disposed of by the fund or in unrealized gain/loss if the security is still held by the fund. Any other proceeds from litigation not related to portfolio holdings are reflected as other income in the Statement of Operations.
The fund entered into “TBA” (to be announced) purchase commitments to purchase securities for a fixed unit price at a future date. Although the unit price has been established, the principal value has not been finalized. However, the principal amount of the commitments will not fluctuate more than 0.01%. The fund holds, and maintains until settlement date, cash or high-grade debt obligations in an amount sufficient to meet the purchase price, or the fund may enter into offsetting contracts for the
14
MFS Government Securities Portfolio
Notes to Financial Statements – continued
forward sale of other securities it owns. Income on the securities will not be earned until settlement date. TBA purchase commitments may be considered securities in themselves, and involve a risk of loss if the value of the security to be purchased declines prior to settlement date, which is in addition to the risk of decline in the value of the fund’s other assets. Unsettled TBA purchase commitments are valued at the current market value of the underlying securities.
The fund entered into “TBA” (to be announced) sale commitments to hedge its portfolio positions or to sell mortgage-backed securities it owns under delayed delivery arrangements. Proceeds of TBA sale commitments are not received until the contractual settlement date. During the time a TBA sale commitment is outstanding, equivalent deliverable securities, or an offsetting TBA purchase commitment deliverable on or before the sale commitment date, are held as “cover” for the transaction.
Fees Paid Indirectly – The fund’s custody fee may be reduced according to an arrangement that measures the value of cash deposited with the custodian by the fund. This amount, for the year ended December 31, 2010, is shown as a reduction of total expenses on the Statement of Operations.
Tax Matters and Distributions – The fund intends to qualify as a regulated investment company, as defined under Subchapter M of the Internal Revenue Code, and to distribute all of its taxable income, including realized capital gains. As a result, no provision for federal income tax is required. The fund’s federal tax returns for the prior three fiscal years remain subject to examination by the Internal Revenue Service. Foreign taxes, if any, have been accrued by the fund in the accompanying financial statements.
Distributions to shareholders are recorded on the ex-dividend date. Income and capital gain distributions are determined in accordance with income tax regulations, which may differ from U.S. generally accepted accounting principles. Certain capital accounts in the financial statements are periodically adjusted for permanent differences in order to reflect their tax character. These adjustments have no impact on net assets or net asset value per share. Temporary differences which arise from recognizing certain items of income, expense, gain or loss in different periods for financial statement and tax purposes will reverse at some time in the future. Distributions in excess of net investment income or net realized gains are temporary overdistributions for financial statement purposes resulting from differences in the recognition or classification of income or distributions for financial statement and tax purposes.
Book/tax differences primarily relate to amortization and accretion of debt securities.
The tax character of distributions declared to shareholders for the last two fiscal years is as follows:
| | | | | | | | |
| | | 12/31/10 | | | 12/31/09 | |
| Ordinary income (including any short-term capital gains) | | | $23,390,230 | | | | $26,160,014 | |
The federal tax cost and the tax basis components of distributable earnings were as follows:
| | | | |
| As of 12/31/10 | | | | |
| Cost of investments | | | $644,514,656 | |
| Gross appreciation | | | 24,534,895 | |
| Gross depreciation | | | (4,549,424 | ) |
| Net unrealized appreciation (depreciation) | | | $19,985,471 | |
| Undistributed ordinary income | | | 23,217,307 | |
| Undistributed long-term capital gain | | | 228,548 | |
| Other temporary differences | | | (69,733 | ) |
Multiple Classes of Shares of Beneficial Interest – The fund offers multiple classes of shares, which differ in their respective distribution and/or service fees. The fund’s income, realized and unrealized gain (loss), and common expenses are allocated to shareholders based on the daily net assets of each class. Dividends are declared separately for each class. Differences in per share dividend rates are generally due to differences in separate class expenses. The fund’s distributions declared to shareholders as reported on the Statements of Changes in Net Assets are presented by class as follows:
| | | | | | | | |
| | | From net investment
income | |
| | | Year ended
12/31/10 | | | Year ended
12/31/09 | |
| Initial Class | | | $8,713,299 | | | | $12,895,028 | |
| Service Class | | | 14,676,931 | | | | 13,264,986 | |
| Total | | | $23,390,230 | | | | $26,160,014 | |
15
MFS Government Securities Portfolio
Notes to Financial Statements – continued
| (3) | | Transactions with Affiliates |
Investment Adviser – The fund has an investment advisory agreement with MFS to provide overall investment management and related administrative services and facilities to the fund. The management fee is computed daily and paid monthly at the following annual rates:
| | | | |
| First $1 billion of average daily net assets | | | 0.55% | |
| Average daily net assets in excess of $1 billion | | | 0.50% | |
The management fee incurred for the year ended December 31, 2010 was equivalent to an annual effective rate of 0.55% of the fund’s average daily net assets.
The investment adviser has agreed in writing to pay a portion of the fund’s total annual operating expenses, exclusive of interest, taxes, brokerage commissions, and extraordinary expenses, such that the total annual operating expenses of the fund do not exceed 1.25% of the fund’s average daily net assets. MFS’ agreement to limit the fund’s operating expenses is contained in the investment advisory agreement between MFS and the fund and may not be rescinded without shareholder approval. In addition, the investment adviser has voluntarily agreed to pay a portion of the fund’s total operating expenses, exclusive of interest, taxes, brokerage commissions and extraordinary expenses, such that the total annual operating expenses do not exceed 1.00% of the fund’s average daily net assets attributable to Initial Class shares. This voluntary agreement may be changed or rescinded at any time by MFS. For the year ended December 31, 2010, the fund’s actual operating expenses did not exceed the limit and therefore, the investment adviser did not pay a portion of the fund’s expenses.
Distributor – MFS Fund Distributors, Inc. (MFD), a wholly-owned subsidiary of MFS, is the distributor of shares of the fund. The Trustees have adopted a distribution plan for the Service Class shares pursuant to Rule 12b-1 under the Investment Company Act of 1940.
The fund’s distribution plan provides that the fund will pay MFD distribution and/or service fees equal to 0.25% per annum of its average daily net assets attributable to Service Class shares as partial consideration for services performed and expenses incurred by MFD and financial intermediaries (including participating insurance companies that invest in the fund to fund variable annuity and variable life insurance contracts, sponsors of qualified retirement and pension plans that invest in the fund, and affiliates of these participating insurance companies and plan sponsors) in connection with the sale and distribution of the Service Class shares. MFD may subsequently pay all, or a portion, of the distribution and/or service fees to financial intermediaries.
Shareholder Servicing Agent – MFS Service Center, Inc. (MFSC), a wholly-owned subsidiary of MFS, has contracted to provide transfer agent and recordkeeping functions in connection with the issuance, transfer, and redemption of each class of shares of the fund under a Shareholder Servicing Agent Agreement. During the year ended December 31, 2010, the fund did not pay MFSC a fee for this service.
Administrator – MFS provides certain financial, legal, shareholder communications, compliance, and other administrative services to the fund. Under an administrative services agreement, the fund partially reimburses MFS the costs incurred to provide these services. The fund is charged an annual fixed amount of $10,000 plus a fee based on average daily net assets. The administrative services fee incurred for the year ended December 31, 2010 was equivalent to an annual effective rate of 0.0349% of the fund’s average daily net assets.
Trustees’ and Officers’ Compensation – The fund pays compensation to Trustees in the form of a retainer, attendance fees, and additional compensation to the Board chairperson. The fund does not pay compensation directly to officers of the fund who are also officers of the investment adviser, all of whom receive remuneration for their services to the fund from MFS. Certain officers of the fund are officers or directors of MFS, MFD, and MFSC.
Other – This fund and certain other funds managed by MFS (the funds) have entered into services agreements (the Agreements) which provide for payment of fees by the funds to Tarantino LLC and Griffin Compliance LLC in return for the provision of services of an Independent Chief Compliance Officer (ICCO) and Assistant ICCO, respectively, for the funds. The ICCO and Assistant ICCO are officers of the funds and the sole members of Tarantino LLC and Griffin Compliance LLC, respectively. The funds can terminate the Agreements with Tarantino LLC and Griffin Compliance LLC at any time under the terms of the Agreements. MFS has agreed to bear all expenses associated with office space, other administrative support, and supplies provided to the ICCO and Assistant ICCO. For the year ended December 31, 2010, the aggregate fees paid by the fund to Tarantino LLC and Griffin Compliance LLC were $11,427 and are included in miscellaneous expense on the Statement of Operations.
The fund invests in the MFS Institutional Money Market Portfolio which is managed by MFS and seeks a high level of current income consistent with preservation of capital and liquidity. Income earned on this investment is included in dividends from underlying funds on the Statement of Operations. This money market fund does not pay a management fee to MFS.
16
MFS Government Securities Portfolio
Notes to Financial Statements – continued
Purchases and sales of investments, other than purchased option transactions, and short-term obligations, were as follows:
| | | | | | | | |
| | | Purchases | | | Sales | |
| U.S. Government securities | | | $226,830,152 | | | | $205,073,369 | |
| Investments (non-U.S. Government securities) | | | $10,986,793 | | | | $20,318,352 | |
| (5) | | Shares of Beneficial Interest |
The fund’s Declaration of Trust permits the Trustees to issue an unlimited number of full and fractional shares of beneficial interest. Transactions in fund shares were as follows:
| | | | | | | | | | | | | | | | |
| | | Year ended 12/31/10 | | | Year ended 12/31/09 | |
| | | Shares | | | Amount | | | Shares | | | Amount | |
| Shares sold | | | | | | | | | | | | | | | | |
Initial Class | | | 1,095,324 | | | | $14,559,638 | | | | 2,063,849 | | | | $26,840,152 | |
Service Class | | | 4,738,186 | | | | 62,491,854 | | | | 13,292,413 | | | | 171,590,407 | |
| | | 5,833,510 | | | | $77,051,492 | | | | 15,356,262 | | | | $198,430,559 | |
| Shares issued to shareholders in reinvestment of distributions | | | | | | | | | | | | | | | | |
Initial Class | | | 674,404 | | | | $8,713,299 | | | | 1,004,286 | | | | $12,895,028 | |
Service Class | | | 1,142,174 | | | | 14,676,931 | | | | 1,037,949 | | | | 13,264,986 | |
| | | 1,816,578 | | | | $23,390,230 | | | | 2,042,235 | | | | $26,160,014 | |
| Shares reacquired | | | | | | | | | | | | | | | | |
Initial Class | | | (3,646,469 | ) | | | $(48,569,228 | ) | | | (4,149,064 | ) | | | $(54,363,397 | ) |
Service Class | | | (4,373,733 | ) | | | (57,723,065 | ) | | | (2,989,941 | ) | | | (39,264,291 | ) |
| | | (8,020,202 | ) | | | $(106,292,293 | ) | | | (7,139,005 | ) | | | $(93,627,688 | ) |
| Net change | | | | | | | | | | | | | | | | |
Initial Class | | | (1,876,741 | ) | | | $(25,296,291 | ) | | | (1,080,929 | ) | | | $(14,628,217 | ) |
Service Class | | | 1,506,627 | | | | 19,445,720 | | | | 11,340,421 | | | | 145,591,102 | |
| | | (370,114 | ) | | | $(5,850,571 | ) | | | 10,259,492 | | | | $130,962,885 | |
The fund and certain other funds managed by MFS participate in a $1.1 billion unsecured committed line of credit, subject to a $1 billion sublimit, provided by a syndication of banks under a credit agreement. Borrowings may be made for temporary financing needs. Interest is charged to each fund, based on its borrowings, generally at a rate equal to the higher of the Federal Reserve funds rate or one month LIBOR plus an agreed upon spread. A commitment fee, based on the average daily, unused portion of the committed line of credit, is allocated among the participating funds at the end of each calendar quarter. In addition, the fund and other funds managed by MFS have established unsecured uncommitted borrowing arrangements with certain banks for temporary financing needs. Interest is charged to each fund, based on its borrowings, at a rate equal to the Federal Reserve funds rate plus an agreed upon spread. For the year ended December 31, 2010, the fund’s commitment fee and interest expense were $7,465 and $0, respectively, and are included in miscellaneous expense on the Statement of Operations.
| (7) | | Transactions in Underlying Funds – Affiliated Issuers |
An affiliated issuer may be considered one in which the fund owns 5% or more of the outstanding voting securities, or a company which is under common control. For the purposes of this report, the fund assumes the following to be affiliated issuers:
| | | | | | | | | | | | | | | | |
| Underlying Funds | | Beginning
Shares/Par
Amount | | | Acquisitions
Shares/Par
Amount | | | Dispositions
Shares/Par
Amount | | | Ending
Shares/Par
Amount | |
| MFS Institutional Money Market Portfolio | | | 55,015,709 | | | | 247,396,937 | | | | (266,081,821 | ) | | | 36,330,825 | |
| | | | |
| Underlying Funds | | Realized
Gain (Loss) | | | Capital Gain Distributions | | | Dividend Income | | | Ending Value | |
| MFS Institutional Money Market Portfolio | | | $— | | | | $— | | | | $85,762 | | | | $36,330,825 | |
17
MFS Government Securities Portfolio
REPORT OF INDEPENDENT REGISTERED PUBLIC ACCOUNTING FIRM
To the Board of Trustees of MFS Variable Insurance Trust II and the Shareholders of
MFS Government Securities Portfolio:
We have audited the accompanying statement of assets and liabilities, including the portfolio of investments, of MFS Government Securities Portfolio (the “Fund”) (one of the portfolios comprising MFS Variable Insurance Trust II) as of December 31, 2010, and the related statement of operations for the year then ended, the statements of changes in net assets for each of the two years in the period then ended, and the financial highlights for each of the five years in the period then ended. These financial statements and financial highlights are the responsibility of the Fund’s management. Our responsibility is to express an opinion on these financial statements and financial highlights based on our audits.
We conducted our audits in accordance with the standards of the Public Company Accounting Oversight Board (United States). Those standards require that we plan and perform the audit to obtain reasonable assurance about whether the financial statements and financial highlights are free of material misstatement. The Fund is not required to have, nor were we engaged to perform, an audit of its internal control over financial reporting. Our audits included consideration of internal control over financial reporting as a basis for designing audit procedures that are appropriate in the circumstances, but not for the purpose of expressing an opinion on the effectiveness of the Fund’s internal control over financial reporting. Accordingly, we express no such opinion. An audit also includes examining, on a test basis, evidence supporting the amounts and disclosures in the financial statements, assessing the accounting principles used and significant estimates made by management, as well as evaluating the overall financial statement presentation. Our procedures included confirmation of securities owned as of December 31, 2010, by correspondence with the custodian and brokers; where replies were not received from brokers, we performed other auditing procedures. We believe that our audits provide a reasonable basis for our opinion.
In our opinion, such financial statements and financial highlights present fairly, in all material respects, the financial position of MFS Government Securities Portfolio as of December 31, 2010, the results of its operations for the year then ended, the changes in its net assets for each of the two years in the period then ended, and the financial highlights for each of the five years in the period then ended, in conformity with accounting principles generally accepted in the United States of America.
DELOITTE & TOUCHE LLP
Boston, Massachusetts
February 14, 2011
18
MFS Government Securities Portfolio
TRUSTEES AND OFFICERS – IDENTIFICATION AND BACKGROUND
The Trustees and officers of the Trust, as of February 1, 2011, are listed below, together with their principal occupations during the past five years. (Their titles may have varied during that period.) The address of each Trustee and officer is 500 Boylston Street, Boston, Massachusetts 02116.
| | | | | | |
Name, Date of Birth | | Position(s) Held
with Fund | | Trustee/Officer
Since (1) | | Principal Occupations During the Past Five Years and
Other Directorships (2) |
| INTERESTED TRUSTEE | | | | |
David D. Horn (3) (born 6/07/41) | | Trustee | | April 1986 | | Private investor; Sun Life Assurance Company of Canada, Senior Vice President and General Manager for the United States (until 1997); Director (until March 2004) |
| | |
| INDEPENDENT TRUSTEES | | | | |
J. Kermit Birchfield (born 1/08/40) | | Chairman | | May 1997 | | Consultant; Century Partners, Inc. (investments), Director; Displaytech, Inc. (technology), Chairman; Dessin Fournir LLC (furniture manufacturer), Director; Site Watch LLC (software to monitor oil tanks), Managing Director (2006 to present); Juridica Investments (fund investing in judicial matters), Director (2007 to present), Immuno Science, Inc. (medical research), Independent Director (2009 to present), Intermountain Industries, Inc. (oil & gas exploration and production), Director (until February 2009) |
| | | |
Robert C. Bishop (born 1/13/43) | | Trustee | | May 2001 | | AutoImmune, Inc. (pharmaceutical product development), Chairman, President and Chief Executive Officer; Caliper Life Sciences Corp. (laboratory analytical instruments), Chairman; Optobionics Corporation (ophthalmic devices), Director (until 2007); Millipore Corporation (purification/filtration products), Director (until July 2010); Waterstreet Capital (leverage buyouts), Advisory Board (until August 2010) |
| | | |
Frederick H. Dulles (born 3/12/42) | | Trustee | | May 2001 | | Dulles International Law LLC (law firm), Senior Lawyer (since 2009); Juridica Capital Management (US) Inc. (litigation financing), Vice President and General Counsel (since 2009); Dulles Properties LLC (real estate), Broker (since 2008); The Citadel School of Business Administration (education), Adjunct Professor (since 2003); Disher, Hamrick & Myers Residential, Inc. (real estate), Broker (until 2006); Frederick H. Dulles Law Practice (law firm), (until 2006); Charlestown School of Law (education), Adjunct Professor (until 2007); Prudential Carolina Real Estate, (real estate), Broker (until 2008); Free Enterprise Foundation Inc. (research institute), Director & Secretary (until 2008); Ten State International Law PLLP (law firm), Of Counsel (until 2009) |
| | | |
Marcia A. Kean (born 6/30/48) | | Trustee | | April 2005 | | Feinstein Kean Healthcare (consulting), Chief Executive Officer |
| | | |
Ronald G. Steinhart (born 6/15/40) | | Trustee | | May 2001 | | Private investor; Penske Automotive Group (automotive retailer), Director; Animal Health International, Inc. (animal health products), Director (since 2007); Texas Industries (concrete/aggregates/cement), Director (since 2007); Susser Holdings Corporation (retail convenience stores and distributor of wholesale motor fuel), Director (since 2009); Prentiss Properties Trust (real estate investment trust), Director (until 2006); Penson Worldwide, Inc. (securities clearance), Director (until 2008) |
| | | |
Haviland Wright (born 7/21/48) | | Trustee | | May 2001 | | X-Change Corp. (multi-media web services), Director (since 2010); Nano Loa Inc. (liquid crystal displays), Director (until 2009); Profitability of Hawaii (software), Chief Development Officer (until 2010); Elixir Technologies Corporation (software), Director (until 2010) |
| | | |
| OFFICERS | | | | | | |
Maria F. DiOrioDwyer (4)
(born 12/01/58) | | President | | November 2005 | | Massachusetts Financial Services Company, Executive Vice President and Chief Regulatory Officer; Chief Compliance Officer (since December 2006) |
| | | |
| Christopher R. Bohane (4) (born 1/18/74) | | Assistant Secretary and Assistant Clerk | | July 2005 | | Massachusetts Financial Services Company, Vice President and Senior Counsel |
| | | |
John M. Corcoran (4) (born 4/13/65) | | Treasurer | | October 2008 | | Massachusetts Financial Services Company, Senior Vice President (since October 2008); State Street Bank and Trust (financial services provider), Senior Vice President, (until September 2008) |
| | | |
Ethan D. Corey (4) (born 11/21/63) | | Assistant Secretary and Assistant Clerk | | July 2005 | | Massachusetts Financial Services Company, Senior Vice President and Associate General Counsel |
| | | |
David L. DiLorenzo (4) (born 8/10/68) | | Assistant Treasurer | | July 2005 | | Massachusetts Financial Services Company, Vice President |
| | | |
Timothy M. Fagan (4) (born 7/10/68) | | Assistant Secretary and Assistant Clerk | | September 2005 | | Massachusetts Financial Services Company, Vice President and Senior Counsel |
| | | |
Mark D. Fischer (4) (born 10/27/70) | | Assistant Treasurer | | July 2005 | | Massachusetts Financial Services Company, Vice President |
19
MFS Government Securities Portfolio
Trustees and Officers – continued
| | | | | | |
Name, Date of Birth | | Position(s) Held
with Fund | | Trustee/Officer
Since (1) | | Principal Occupations During the Past Five Years and
Other Directorships (2) |
Robyn L. Griffin (born 7/04/75) | | Assistant Independent Chief Compliance Officer | | August 2008 | | Griffin Compliance LLC (provider of compliance services), Principal (since August 2008); State Street Corporation (financial services provider), Mutual Fund Administration Assistant Vice President (October 2006 – July 2008); Liberty Mutual Group (insurance), Personal Market Assistant Controller (April 2006 – October 2006); Deloitte & Touche LLP (professional services firm), Senior Manager (prior to April 2006) |
| | | |
Brian E. Langenfeld (4) (born 3/07/73) | | Assistant Secretary and Assistant Clerk | | May 2006 | | Massachusetts Financial Services Company, Vice President and Senior Counsel (since May 2006); John Hancock Advisers, LLC, Assistant Vice President and Counsel (until April 2006) |
| | | |
Ellen Moynihan (4) (born 11/13/57) | | Assistant Treasurer | | May 1997 | | Massachusetts Financial Services Company, Senior Vice President |
| | | |
Susan S. Newton (4) (born 3/07/50) | | Assistant Secretary and Assistant Clerk | | May 2005 | | Massachusetts Financial Services Company, Senior Vice President and Associate General Counsel |
| | | |
Susan A. Pereira (4)
(born 11/05/70) | | Assistant Secretary and Assistant Clerk | | July 2005 | | Massachusetts Financial Services Company, Vice President and Senior Counsel |
| | | |
Mark N. Polebaum (4) (born 5/01/52) | | Secretary and Clerk | | February 2006 | | Massachusetts Financial Services Company, Executive Vice President, General Counsel and Secretary (since January 2006); Wilmer Cutler Pickering Hale and Dorr LLP (law firm), Partner (until January 2006) |
| | | |
Frank L. Tarantino (born 3/07/44) | | Independent Chief Compliance Officer | | September 2004 | | Tarantino LLC (provider of compliance services), Principal |
| | | |
Richard S. Weitzel (4) (born 7/16/70) | | Assistant Secretary and Assistant Clerk | | October 2007 | | Massachusetts Financial Services Company, Vice President and Assistant General Counsel |
| | | |
James O. Yost (4) (born 6/12/60) | | Assistant Treasurer | | April 1992 | | Massachusetts Financial Services Company, Senior Vice President |
| (1) | Date first appointed to serve as Trustee/Officer of an MFS fund or a Compass variable account. Each Trustee has served continuously since appointment. For the period March 2008 until October 2008, Ms. DiOrioDwyer served as Treasurer of the Funds. |
| (2) | Directorships or trusteeships of companies required to report to the Securities and Exchange Commission (i.e., “public companies”). |
| (3) | “Interested person” of the Trust, within the meaning of the Investment Company Act of 1940 (referred to as the 1940 Act), which is the principal federal law governing investment companies like the Trust, as a result of position with Sun Life of Canada (U.S.). The address of Sun Life of Canada (U.S.) is One Sun Life Executive Park, Wellesley Hills, Massachusetts 02481. |
| (4) | “Interested person” of MFS within the meaning of the 1940 Act. The address of MFS is 500 Boylston Street, Boston, Massachusetts 02116. |
The Trust does not hold annual meetings for the purpose of electing Trustees, and Trustees are not elected for fixed terms. Each Trustee and officer holds office until his or her successor is chosen and qualified, or until his or her earlier death, resignation, retirement or removal.
All Trustees currently serve as Trustees of the Trust and have served in that capacity since originally elected or appointed. All of the Trustees are also Managers of the Compass Variable Accounts. The executive officers of the Trust hold similar offices for the Compass Variable Accounts and other funds in the MFS fund complex. As of January 1, 2011, each Trustee serves as a Trustee or Manager of 31 Accounts/Portfolios.
20
MFS Government Securities Portfolio
Trustees and Officers – continued
The Statement of Additional Information contains further information about the Trustees and is available without charge upon request by calling 1-800-752-7215.
| | |
Investment Adviser
Massachusetts Financial Services Company 500 Boylston Street, Boston, MA 02116-3741 | | Custodian State Street Bank and Trust 1 Lincoln Street, Boston, MA 02111-2900 |
Distributor
MFS Fund Distributors, Inc. 500 Boylston Street, Boston, MA 02116-3741 | | Independent Registered Public Accounting Firm Deloitte & Touche LLP 200 Berkeley Street, Boston, MA 02116 |
Portfolio Manager Geoffrey Schechter | | |
21
MFS Government Securities Portfolio
BOARD REVIEW OF INVESTMENT ADVISORY AGREEMENT
The Investment Company Act of 1940 requires that both the full Board of Trustees and a majority of the non-interested (“independent”) Trustees, voting separately, annually approve the continuation of the investment advisory agreement between MFS Variable Insurance Trust II (the “Trust”) and Massachusetts Financial Services Company (“MFS”) on behalf of the Fund. The Trustees consider matters bearing on the Fund and the advisory arrangement at their meetings throughout the year, including a review of performance data at each regular meeting. In addition, the independent Trustees met in person in May and again in July 2010 (“contract review meetings”) for the specific purpose of considering whether to approve the continuation of the investment advisory agreement for the Fund. The independent Trustees were assisted in their evaluation of the investment advisory agreement by independent legal counsel, from whom they received separate legal advice and with whom they met separately from MFS management during various contract review meetings. The independent Trustees were also assisted in this process by the Fund’s Independent Chief Compliance Officer, a full-time senior officer appointed by and reporting to the independent Trustees.
In connection with their deliberations, the Trustees, including the independent Trustees, considered such information and factors as they believed, in light of the legal advice furnished to them and their own business judgment, to be relevant. The investment advisory agreement was considered separately for the Fund, although the Trustees also took into account the common interests of all Funds in the Trust in their review. As described below, the Trustees considered the nature, quality, and extent of the various investment advisory, administrative, and shareholder services performed by MFS under the existing investment advisory agreement and other arrangements with the Trust.
In connection with their contract review meetings, the Trustees received and relied upon materials which included, among other items: (i) information provided by Lipper Inc. (“Lipper”) on the investment performance of the Fund for various time periods ended December 31, 2009, compared to the investment performance of a group of funds with substantially similar investment classifications/objectives (the “Lipper performance universe”), (ii) information provided by Lipper on the Fund’s advisory fees and other expenses compared to the advisory fees and other expenses of comparable funds identified by Lipper (the “Lipper expense group”), (iii) information provided by MFS on the advisory fees of comparable portfolios of its other clients, including institutional separate account and other clients, (iv) information as to whether, and to what extent applicable, expense waivers, reimbursements or fee “breakpoints” are observed for the Fund, (v) information regarding MFS’ financial results and financial condition, including MFS’ and certain of its affiliates’ estimated profitability from services performed for the Fund, (vi) MFS’ views regarding the outlook for the mutual fund industry and its strategic business plans, (vii) descriptions of various functions performed by MFS for the Trust, such as compliance monitoring and portfolio trading practices, and (viii) information regarding the overall organization of MFS, including information about MFS’ senior management and other personnel providing investment advisory, administrative and other services to the Fund. The comparative performance, fee and expense information prepared and provided by Lipper was not independently verified, and the independent Trustees did not independently verify any information provided to them by MFS.
The Trustees’ conclusion as to the continuation of the investment advisory agreement was based on comprehensive consideration of all information provided to the Trustees and was not the result of any single factor. Some of the factors that figured particularly in the Trustees’ deliberations are described below for the Fund, while individual Trustees may have given different weight to various factors and evaluated the information presented as a whole differently than another Trustee. The Trustees recognized that the fee arrangements for the Fund reflect years of review and discussion between the independent Trustees and MFS, that certain aspects of such arrangements may receive greater scrutiny in some years than others, and that the Trustees’ conclusions may be based, in part, on their consideration of these same arrangements during the course of the year and in prior years.
Based on information provided by Lipper, the Trustees compared the Fund’s total return investment performance to the performance of the Lipper performance universe over various time periods. The Trustees placed particular emphasis on the total return performance of the Fund’s Initial Class shares in comparison to the performance of funds in its Lipper performance universe over the one-, three- and five-year periods ended December 31, 2009. The Trustees did not rely on performance results for more recent periods, including those shown elsewhere in this report.
The Trustees noted the performance of the Fund’s Initial Class shares was in the 3rd quintile relative to the other funds in the Lipper performance universe for the one-year period (the 1st quintile being the best performers and the 5th quintile being the worst performers). The total return performance of the Fund was in the 1st quintile for the three-year and the five-year periods ended December 31, 2009, relative to the Lipper performance universe. Based on the nature and quality of services provided by MFS, the Board of Trustees concluded that the Fund’s performance was satisfactory.
22
MFS Government Securities Portfolio
Board Review of Investment Advisory Agreement – continued
In the course of their deliberations, the Trustees took into account information provided by MFS during contract review meetings, as well as during investment review meetings conducted with portfolio management personnel during the course of the year.
In assessing the reasonableness of the Fund’s advisory fee, the Trustees considered, among other information, the Fund’s advisory fee and the total expense ratio of the Fund’s Initial Class shares as a percentage of average daily net assets, compared to the advisory fee and total expense ratios of its peer group of funds based on information provided by Lipper. The Trustees also considered the advisory fees charged by MFS to institutional accounts. In comparing these fees, the Trustees considered the generally broader scope of services provided by MFS to the Trust than those provided to institutional accounts. The Trustees also considered the higher demands placed on MFS’ investment personnel and trading infrastructure as a result of the daily cash in-flows and out-flows of the Fund, and the impact on MFS and related expenses due to the more extensive regulatory regime to which the Fund is subject, compared to institutional accounts.
In considering the fees, the Trustees noted from the Lipper data that the Fund’s effective advisory fee rate was above the median and total expense ratio was approximately at the median of such fees and expenses of funds in the Lipper expense group. In addition, the Trustees accepted MFS’ offer to continue the expense limitation for the Fund. The Trustees further concluded that the existing breakpoint was sufficient to allow the Fund to benefit from economies of scale as its assets grow. The Trustees concluded that the fees were reasonable in light of the nature and quality of services provided.
The Trustees also considered information prepared by MFS relating to its costs and profits with respect to the Fund and other investment companies and accounts advised by MFS, as well as MFS’ methodologies used to determine and allocate its costs to the Fund and other accounts and products for purposes of estimating profitability.
After reviewing these and other factors described below, the Trustees concluded that the advisory fees charged to the Fund represent reasonable compensation in light of the nature and quality of the services being provided by MFS.
In addition, the Trustees considered MFS’ resources and related efforts to continue to retain, attract and motivate capable personnel to serve the Fund. The Trustees also considered the financial resources of MFS and its parent, Sun Life Financial Inc. The Trustees further considered any advantages and possible disadvantages of having an adviser which also serves other investment companies as well as institutional accounts.
The Trustees also considered the nature, quality, cost, and extent of administrative, transfer agency, and distribution services provided to the Fund by MFS and its affiliates under agreements and plans other than the investment advisory agreement, including the 12b-1 fees the Fund pays to MFS Fund Distributors, Inc., an affiliate of MFS. The Trustees also considered the nature, extent and quality of certain other services MFS performs or arranges on the Fund’s behalf, which may include securities lending programs, directed expense payment programs, class action recovery programs, and MFS’ interaction with third-party service providers, principally custodians and sub-custodians. The Trustees concluded that the various non-advisory services provided by MFS and its affiliates on behalf of the Fund were satisfactory. The Trustees also considered the benefits to MFS from the use of the Fund’s portfolio brokerage commissions to pay for investment research and various other factors. Additionally, the Trustees considered so-called “fall-out benefits” to MFS such as reputational value derived from serving as investment manager to the Trust, and determined that any such benefits derived by MFS were reasonable and fair.
Based on their evaluation of factors that they deemed to be material, including those factors described above, the Board of Trustees, including a majority of the independent Trustees, concluded that the investment advisory agreement should be continued for an additional one-year period, commencing September 1, 2010.
A discussion regarding the Board’s most recent review and renewal of the fund’s Investment Advisory Agreement with MFS is available by clicking on the fund’s name under “Variable Insurance Portfolios — VIT II” in the “Products and Performance” section of the MFS Web site (mfs.com).
23
MFS Government Securities Portfolio
PROXY VOTING POLICIES AND INFORMATION
A general description of the MFS funds’ proxy voting policies and procedures is available without charge, upon request, by calling 1-800-225-2606, by visiting the Proxy Voting section of mfs.com or by visiting the SEC’s Web site at http://www.sec.gov.
Information regarding how the fund voted proxies relating to portfolio securities during the most recent twelve-month period ended June 30 is available without charge by visiting the Proxy Voting section of mfs.com or by visiting the SEC’s Web site at http://www.sec.gov.
QUARTERLY PORTFOLIO DISCLOSURE
The fund will file a complete schedule of portfolio holdings with the Securities and Exchange Commission (the Commission) for the first and third quarters of each fiscal year on Form N-Q. The fund’s Form N-Q may be reviewed and copied at the:
Public Reference Room
Securities and Exchange Commission
100 F Street, NE, Room 1580
Washington, D.C. 20549
Information on the operation of the Public Reference Room may be obtained by calling the Commission at 1-800-SEC-0330. The fund’s Form N-Q is available on the EDGAR database on the Commission’s Internet Web site at http://www.sec.gov, and copies of this information may be obtained, upon payment of a duplicating fee, by electronic request at the following e-mail address: publicinfo@sec.gov or by writing the Public Reference Section at the above address.
FURTHER INFORMATION
From time to time, MFS may post important information about the fund or the MFS funds on the MFS web site (mfs.com). This information is available by visiting the “News & Commentary” section of mfs.com or by clicking on the fund’s name under “Variable Insurance Portfolios — VIT II” in the “Products and Performance” section of mfs.com.
24
MFS Government Securities Portfolio
MFS® PRIVACY NOTICE
Privacy is a concern for every investor today. At MFS Investment Management® and the MFS funds, we take this concern very seriously. We want you to understand our policies about the investment products and services that we offer, and how we protect the nonpublic personal information of investors who have a direct relationship with us and our wholly owned subsidiaries.
Throughout our business relationship, you provide us with personal information. We maintain information and records about you, your investments, and the services you use. Examples of the nonpublic personal information we maintain include
| | Ÿ | | data from investment applications and other forms |
| | Ÿ | | share balances and transactional history with us, our affiliates, or others |
| | Ÿ | | facts from a consumer reporting agency |
We do not disclose any nonpublic personal information about our customers or former customers to anyone, except as permitted by law. We may share nonpublic personal information with third parties or certain of our affiliates in connection with servicing your account or processing your transactions. We may share information with companies or financial institutions that perform marketing services on our behalf or with other financial institutions with which we have joint marketing arrangements, subject to any legal requirements.
Authorization to access your nonpublic personal information is limited to appropriate personnel who provide products, services, or information to you. We maintain physical, electronic, and procedural safeguards to help protect the personal information we collect about you.
If you have any questions about the MFS privacy policy, please call 1-800-225-2606 any business day.
Note: If you own MFS products or receive MFS services in the name of a third party such as a bank or broker-dealer, their privacy policy may apply to you instead of ours.
25


MFS® TOTAL RETURN PORTFOLIO
The report is prepared for the general information of contract owners. It is authorized for distribution to prospective investors only when preceded or accompanied by a current prospectus.
NOT FDIC INSURED Ÿ MAY LOSE VALUE Ÿ NO BANK GUARANTEE Ÿ NOT A DEPOSIT Ÿ NOT INSURED BY ANY FEDERAL GOVERNMENT AGENCY OR NCUA/NCUSIF
MFS Total Return Portfolio
LETTER FROM THE CEO

Dear Contract Owners:
After an extended rebound in the financial markets, uncertainty returned in 2010 as investors began to question the durability of the recovery for global economies and markets. That uncertainty led to increased risk aversion, especially as investors saw the eurozone struggle with the debt woes of many of its members. In September, the U.S. Federal Reserve Board’s promises to further loosen monetary policy helped assuage market fears and drive asset prices off their recent lows. A combination of solid earnings and improving economic data gave an additional boost to investor sentiment. As we enter 2011, we are cautiously optimistic that economic growth will continue to improve and that the global economies will recover from the shocks of the past few years. We expect the pace of recovery worldwide will be uneven and volatile.
As always, we continue to be mindful of the many economic challenges faced at the local, national, and international levels. It is in times such as these that we want to remind investors of the merits of maintaining a long-term view, adhering to basic investing principles such as asset allocation and diversification, and working closely with their advisors to research and identify appropriate investment opportunities.
Respectfully,

Robert J. Manning
Chairman and Chief Executive Officer
MFS Investment Management®
February 14, 2011
The opinions expressed in this letter are subject to change, may not be relied upon for investment advice, and no forecasts can be guaranteed.
1
MFS Total Return Portfolio
PORTFOLIO COMPOSITION
Portfolio structure (i)
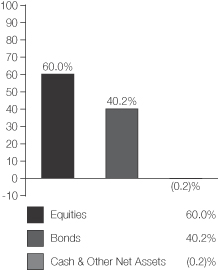
| | | | |
| Top ten holdings (i) | | | | |
| U.S. Treasury Notes, 3.125%, 2013 | | | 3.1% | |
| U.S. Treasury Notes, 3.75%, 2018 | | | 2.7% | |
| U.S. Treasury Notes, 1.375%, 2013 | | | 2.6% | |
| Fannie Mae, 5.5%, 30 Years | | | 2.2% | |
| JPMorgan Chase & Co. | | | 2.1% | |
| Philip Morris International, Inc. | | | 1.7% | |
| Exxon Mobil Corp. | | | 1.7% | |
| Lockheed Martin Corp. | | | 1.6% | |
| Goldman Sachs Group, Inc. | | | 1.6% | |
| AT&T, Inc. | | | 1.5% | |
| |
| Composition including fixed income credit quality (a)(i) | | | | |
| AAA | | | 16.7% | |
| AA | | | 1.5% | |
| A | | | 3.2% | |
| BBB | | | 5.0% | |
| BB | | | 0.3% | |
| B (o) | | | 0.0% | |
| CCC | | | 0.2% | |
| C (o) | | | 0.0% | |
| U.S. Agency (NR) | | | 13.3% | |
| Non-Fixed Income (NR) | | | 60.0% | |
| Cash & Other | | | (0.2)% | |
| | | | |
| Equity sectors | | | | |
| Financial Services | | | 14.3% | |
| Energy | | | 7.6% | |
| Consumer Staples | | | 6.7% | |
| Health Care | | | 6.3% | |
| Industrial Goods & Services | | | 5.9% | |
| Utilities & Communications | | | 5.1% | |
| Technology | | | 3.6% | |
| Retailing | | | 2.6% | |
| Basic Materials | | | 2.6% | |
| Leisure | | | 2.6% | |
| Autos & Housing | | | 1.1% | |
| Special Products & Services | | | 1.1% | |
| Transportation | | | 0.5% | |
| |
| Fixed income sectors (i) | | | | |
| U.S. Treasury Securities | | | 14.1% | |
| Mortgage-Backed Securities | | | 13.2% | |
| High Grade Corporates | | | 8.0% | |
| Commercial Mortgage-Backed Securities | | | 2.0% | |
| Non-U.S. Government Bonds | | | 0.7% | |
| Emerging Markets Bonds | | | 0.7% | |
| U.S. Government Agencies | | | 0.5% | |
| High Yield Corporates | | | 0.3% | |
| Collateralized Debt Obligations | | | 0.3% | |
| Asset-Backed Securities | | | 0.2% | |
| Municipal Bonds | | | 0.2% | |
| Residential Mortgage-Backed Securities (o) | | | 0.0% | |
2
MFS Total Return Portfolio
Portfolio Composition – continued
| (a) | The rating categories include debt securities and fixed-income structured products where these have long-term public ratings. All ratings are assigned in accordance with the following hierarchy: If a security is rated by Moody’s, then that rating is used; if not rated by Moody’s, then a Standard & Poor’s rating is used; if not rated by S&P, then a Fitch rating is used. Ratings from Moody’s are shown in the S&P and Fitch scale (e.g., AAA). All ratings are subject to change. U.S. Agency (NR) includes unrated U.S. Agency fixed income securities and collateralized mortgage obligations of U.S. Agency mortgage-backed securities. Non-Fixed Income (NR) includes equity securities (including convertible bonds and equity derivatives) and commodities. Cash & Other includes cash, other assets less liabilities, offsets to derivative positions, and short-term securities. The fund may not hold all of these instruments. |
| (i) | For purposes of this presentation, the components include the market value of securities, and reflect the impact of the equivalent exposure of derivative positions, if applicable. These amounts may be negative from time to time. The bond component will include any accrued interest amounts. Equivalent exposure is a calculated amount that translates the derivative position into a reasonable approximation of the amount of the underlying asset that the portfolio would have to hold at a given point in time to have the same price sensitivity that results from the portfolio’s ownership of the derivative contract. When dealing with derivatives, equivalent exposure is a more representative measure of the potential impact of a position on portfolio performance than market value. Where the fund holds convertible bonds, these are treated as part of the equity portion of the portfolio. |
From time to time “Cash & Other Net Assets” may be negative due to timing of cash receipts and/or equivalent exposure from any derivative holdings.
Percentages are based on net assets as of 12/31/10, unless otherwise noted.
The portfolio is actively managed and current holdings may be different.
3
MFS Total Return Portfolio
MANAGEMENT REVIEW
Summary of Results
For the twelve months ended December 31, 2010, Initial Class shares of the MFS Total Return Portfolio (the “fund”) provided a total return of 9.97%, while Service Class shares of the fund provided a total return of 9.69%. These compare with returns of 15.06% and 6.54% for the fund’s benchmarks, the Standard & Poor’s 500 Stock Index (“S&P 500 Index”) and the Barclays Capital U.S. Aggregate Bond Index (“Barclays Capital Index”), respectively.
Market Environment
The first quarter of the reporting period witnessed a continuation of the financial market and macroeconomic rebounds that had begun in early 2009. These recoveries in global activity and asset valuations were generally synchronized around the world, led importantly by emerging Asian economies, but broadening to include most of the global economy to varying degrees. Primary drivers of the recoveries included an unwinding of the inventory destocking that took place earlier, the production of manufacturing and capital goods, as well as massive fiscal and monetary stimulus.
During most of the remainder of the period, heightened risk surrounding the public-debt profiles of several of the peripheral European countries impaired market sentiment. At the same time, the improving trend in global macroeconomic data began to weaken somewhat. These two dynamics caused many asset prices to retrench significantly, as many questioned the durability of the global recovery.
Towards the end of the period, the U.S. Federal Reserve led markets to believe that further monetary loosening would be forthcoming if macroeconomic activity did not show signs of improvement. The prospects for more easing by the Fed improved market sentiment and drove risk-asset prices markedly higher. However, in a text-book case of “buy the rumor, sell the fact,” the weeks following the early November announcement of further quantitative easing saw a sell-off in U.S. Treasury bonds. This rise in Treasury yields occurred despite risk-off behavior in equities and credit markets (which would normally result in Treasury yield compression), and appears to have been the result of a few factors: signs of improved U.S. and global economic activity; opposition to quantitative easing from some quarters; and crowded long positions in U.S. Treasuries. The December agreement on an expansionary U.S. fiscal package also boosted sentiment, leading markets to reach near-term highs in risky asset valuations toward year end.
Detractors from Performance
Within the equity portion of the fund, stock selection and an overweight position in the financial services sector held back performance relative to the S&P 500 Index. Holdings of financial services firms, JPMorgan Chase and Bank of America, were among the fund’s top detractors. Shares of Bank of America fell during the period as the company reported weaker-than-expected capital markets revenues and net interest income. We believe concerns about potential losses tied to loan repurchases also weighed on the company’s stock price. Not owning strong-performing diversified financial services company Citigroup also hurt relative results.
Stock selection in the energy and industrial goods & services sectors negatively impacted relative performance. In the energy sector, integrated oil and gas company TOTAL (b) (France) was among the top detractors. In the industrial goods & services sector, holdings of defense contractor Lockheed Martin, and not owning strong-performing heavy machine manufacturer Caterpillar, weighed on returns. The stock price of Lockheed Martin declined as increasing concerns about the potential for defense budget cuts negatively affected the company’s future revenue and margin prospects.
Holdings in other sectors that detracted from relative performance included pharmaceutical company Abbott Laboratories and medical device maker Medtronic. Not owning consumer electronics maker Apple and automobile manufacturer Ford Motor Co. also dampened relative results as both stocks significantly outperformed the benchmark.
Within the fixed income portion of the fund, a lesser exposure to Government National Mortgage Association (Ginnie Mae) mortgage-backed securities held back relative performance as bonds in this sector performed well compared with the Barclays Capital Index.
Contributors to Performance
Within the equity portion of the fund, holdings of chemical company PPG Industries, insurance company MetLife, diversified industrial manufacturer Eaton Corp., tobacco company Philip Morris International, and automotive parts retailer Advance Auto Parts (b) contributed to relative returns. Shares of Philip Morris rose as the company announced strong earnings results on the back of solid price increases from its tobacco products. Not owning poor-performing software products developer Microsoft, and the timing of our ownership in shares of internet search engine Google (h), also had a positive impact on relative results.
4
MFS Total Return Portfolio
Management Review – continued
Within the fixed income portion of the fund, a primary positive factor in relative performance was the fund’s holdings in commercial mortgage-backed securities as these bonds significantly outperformed the Barclays Capital Index.
The fund’s return from yield, which was greater than that of the benchmark, also had a positive impact on relative performance. A greater exposure to Federal National Mortgage Association (Fannie Mae) mortgage-backed securities also helped. Other positive factors for relative performance included the fund’s greater exposure to bonds in the financial sector and to “BBB” rated (r) securities.
Respectfully,
| | | | | | | | |
| Nevin Chitkara | | William Douglas | | Steven Gorham | | Richard Hawkins | | Joshua Marston |
| Portfolio Manager | | Portfolio Manager | | Portfolio Manager | | Portfolio Manager | | Portfolio Manager |
| | | | |
| Michael Roberge | | Brooks Taylor | | | | | | |
| Portfolio Manager | | Portfolio Manager | | | | | | |
| (b) | Security is not a benchmark constituent. |
| (h) | Security was not held in the portfolio at period end. |
| (r) | Bonds rated “BBB”, “Baa”, or higher are considered investment grade; bonds rated “BB”, “Ba”, or below are considered non-investment grade. The primary source for bond quality ratings is Moody’s Investors Service. If not available, ratings by Standard & Poor’s are used, else ratings by Fitch, Inc. For securities which are not rated by any of the three agencies, the security is considered not rated. |
The views expressed in this report are those of the portfolio managers only through the end of the period of the report as stated on the cover and do not necessarily reflect the views of MFS or any other person in the MFS organization. These views are subject to change at any time based on market or other conditions, and MFS disclaims any responsibility to update such views. These views may not be relied upon as investment advice or an indication of trading intent on behalf of any MFS portfolio. References to specific securities are not recommendations of such securities, and may not be representative of any MFS portfolio’s current or future investments.
5
MFS Total Return Portfolio
PERFORMANCE SUMMARY THROUGH 12/31/10
The following chart illustrates the historical performance of the fund in comparison to its benchmark(s). Benchmarks are unmanaged and may not be invested in directly. Benchmark returns do not reflect any fees or expenses. The performance of other share classes will be greater than or less than that of the class depicted below. (See Notes to Performance Summary.)
Performance data shown represents past performance and is no guarantee of future results. Investment return and principal value fluctuate so your units, when sold, may be worth more or less than the original cost; current performance may be lower or higher than quoted. The performance shown does not reflect the deduction of taxes, if any, that a contract holder would pay on fund distributions or the redemption of contract units. The returns for the fund shown also do not reflect the deduction of expenses associated with variable products, such as mortality and expense risk charges, separate account charges, and sales charges imposed by the insurance company separate accounts. Such expenses would reduce the overall returns shown.
Growth of a Hypothetical $10,000 Investment
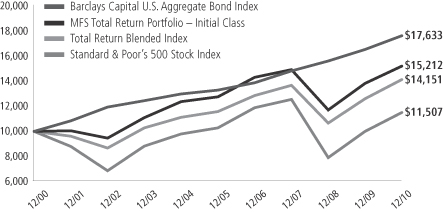
Total Returns through 12/31/10
Average annual total returns
| | | | | | | | | | | | | | |
| | | Share class | | Class inception date | | 1-yr | | 5-yr | | 10-yr | | Life (t) | | |
| | | Initial Class | | 5/11/88 | | 9.97% | | 3.59% | | 4.28% | | N/A | | |
| | | Service Class | | 8/24/01 | | 9.69% | | 3.33% | | N/A | | 4.33% | | |
| | | | | |
| Comparative benchmarks | | | | | | | | | | |
| | | Standard & Poor’s 500 Stock Index (f) | | 15.06% | | 2.29% | | 1.41% | | N/A | | |
| | | Barclays Capital U.S. Aggregate Bond Index (f) | | 6.54% | | 5.80% | | 5.84% | | N/A | | |
| | | Total Return Blended Index (f)(x) | | 12.13% | | 4.08% | | 3.53% | | N/A | | |
| (f) | Source: FactSet Research Systems Inc. |
| (t) | For the period from the class inception date through the stated period end. The comparative benchmark performance information provided for the “life” period is from the inception date of the Initial Class shares. (See Notes to Performance Summary.) |
| (x) | Total Return Blended Index consists of 60% Standard & Poor’s 500 Stock Index and 40% Barclays Capital U.S. Aggregate Bond Index. |
Benchmark Definitions
Barclays Capital U.S. Aggregate Bond Index – a market capitalization-weighted index that measures the performance of the U.S. investment-grade, fixed rate bond market, with index components for government and corporate securities, mortgage pass-through securities, and asset-backed securities with at least one year to final maturity.
Standard & Poor’s 500 Stock Index – a market capitalization-weighted index of 500 widely held equity securities, designed to measure broad U.S. equity performance.
It is not possible to invest directly in an index.
6
MFS Total Return Portfolio
Performance Summary – continued
Notes to Performance Summary
Average annual total return represents the average annual change in value for each share class for the periods presented. Life returns are presented where the share class has less than 10 years of performance history and represent the average annual total return from the class inception date to the stated period end date. As the fund’s share classes may have different inception dates, the life returns may represent different time periods and may not be comparable. As a result, no comparative benchmark performance information is provided for life periods.
Performance results reflect any applicable expense subsidies and waivers in effect during the periods shown. Without such subsidies and waivers the fund’s performance results would be less favorable. Please see the prospectus and financial statements for complete details. All results are historical and assume the reinvestment of any dividends and capital gains distributions.
From time to time the fund may receive proceeds from litigation settlements, without which performance would be lower.
7
MFS Total Return Portfolio
EXPENSE TABLE
Fund Expenses Borne by the Contract Holders During the Period,
July 1, 2010 through December 31, 2010
As a contract holder of the fund, you incur ongoing costs, including management fees; distribution and/or service (12b-1) fees; and other fund expenses. This example is intended to help you understand your ongoing costs (in dollars) of investing in the fund and to compare these costs with the ongoing costs of investing in other mutual funds.
The example is based on an investment of $1,000 invested at the beginning of the period and held for the entire period July 1, 2010 through December 31, 2010.
Actual Expenses
The first line for each share class in the following table provides information about actual account values and actual expenses. You may use the information in this line, together with the amount you invested, to estimate the expenses that you paid over the period. Simply divide your account value by $1,000 (for example, an $8,600 account value divided by $1,000 = 8.6), then multiply the result by the number in the first line under the heading entitled “Expenses Paid During Period” to estimate the expenses you paid on your account during this period.
Hypothetical Example for Comparison Purposes
The second line for each share class in the following table provides information about hypothetical account values and hypothetical expenses based on the fund’s actual expense ratio and an assumed rate of return of 5% per year before expenses, which is not the fund’s actual return. The hypothetical account values and expenses may not be used to estimate the actual ending account balance or expenses you paid for the period. You may use this information to compare the ongoing costs of investing in the fund and other funds. To do so, compare this 5% hypothetical example with the 5% hypothetical examples that appear in the shareholder reports of the other funds.
Please note that the expenses shown in the table are meant to highlight the fund’s ongoing costs only and do not take into account the fees and expenses imposed under the variable contracts through which your investment in the fund is made. Therefore, the second line for each share class in the table is useful in comparing ongoing costs associated with an investment in vehicles (such as the fund) which fund benefits under variable annuity and variable life insurance contracts and to qualified pension and retirement plans only, and will not help you determine the relative total costs of investing in the fund through variable annuity and variable life insurance contracts. If the fees and expenses imposed under the variable contracts were included, your costs would have been higher.
| | | | | | | | | | | | | | | | | | |
| Share Class | | | | Annualized
Expense Ratio | | | Beginning
Account Value
7/01/10 | | | Ending
Account Value
12/31/10 | | | Expenses Paid
During Period (p)
7/01/10-12/31/10 | |
| Initial Class | | Actual | | | 0.74% | | | | $1,000.00 | | | | $1,127.77 | | | | $3.97 | |
| | Hypothetical (h) | | | 0.74% | | | | $1,000.00 | | | | $1,021.48 | | | | $3.77 | |
| Service Class | | Actual | | | 0.99% | | | | $1,000.00 | | | | $1,126.10 | | | | $5.31 | |
| | Hypothetical (h) | | | 0.99% | | | | $1,000.00 | | | | $1,020.21 | | | | $5.04 | |
| (h) | 5% class return per year before expenses. |
| (p) | Expenses paid is equal to each class’ annualized expense ratio, as shown above, multiplied by the average account value over the period, multiplied by the number of days in the period, divided by the number of days in the year. |
8
MFS Total Return Portfolio
PORTFOLIO OF INVESTMENTS 12/31/10
The Portfolio of Investments is a complete list of all securities owned by your fund. It is categorized by broad-based asset classes.
| | | | | | | | |
| Issuer | | Shares/Par | | | Value ($) | |
| | | | | | | | |
| COMMON STOCKS – 59.7% | | | | | |
| Aerospace – 4.1% | | | | | | | | |
| Honeywell International, Inc. | | | 120,100 | | | $ | 6,384,515 | |
| Lockheed Martin Corp. | | | 324,410 | | | | 22,679,502 | |
| Northrop Grumman Corp. | | | 99,120 | | | | 6,420,994 | |
| Precision Castparts Corp. | | | 16,960 | | | | 2,361,002 | |
| United Technologies Corp. | | | 245,900 | | | | 19,357,248 | |
| | | | | | | | |
| | | | | | $ | 57,203,261 | |
| | | | | | | | |
| Alcoholic Beverages – 0.8% | | | | | | | | |
| Diageo PLC | | | 487,734 | | | $ | 9,011,045 | |
| Heineken N.V. | | | 41,935 | | | | 2,056,025 | |
| | | | | | | | |
| | | | | | $ | 11,067,070 | |
| | | | | | | | |
| Apparel Manufacturers – 0.2% | | | | | | | | |
| NIKE, Inc., “B” | | | 39,670 | | | $ | 3,388,611 | |
| | | | | | | | |
| Automotive – 0.4% | | | | | | | | |
| General Motors Co. (a) | | | 57,280 | | | $ | 2,111,341 | |
| Johnson Controls, Inc. | | | 97,170 | | | | 3,711,894 | |
| | | | | | | | |
| | | | | | $ | 5,823,235 | |
| | | | | | | | |
| Broadcasting – 1.5% | | | | | | | | |
| Omnicom Group, Inc. | | | 167,900 | | | $ | 7,689,820 | |
| Time Warner, Inc. | | | 67,930 | | | | 2,185,308 | |
| Walt Disney Co. | | | 282,820 | | | | 10,608,578 | |
| | | | | | | | |
| | | | | | $ | 20,483,706 | |
| | | | | | | | |
| Brokerage & Asset Managers – 0.7% | | | | | |
| Blackrock, Inc. | | | 12,829 | | | $ | 2,444,951 | |
| Charles Schwab Corp. | | | 180,150 | | | | 3,082,367 | |
| Deutsche Boerse AG | | | 24,105 | | | | 1,668,556 | |
| Franklin Resources, Inc. | | | 29,220 | | | | 3,249,556 | |
| | | | | | | | |
| | | | | | $ | 10,445,430 | |
| | | | | | | | |
| Business Services – 1.1% | | | | | | | | |
| Accenture Ltd., “A” | | | 210,150 | | | $ | 10,190,174 | |
| Dun & Bradstreet Corp. | | | 31,670 | | | | 2,599,790 | |
| Western Union Co. | | | 134,050 | | | | 2,489,309 | |
| | | | | | | | |
| | | | | | $ | 15,279,273 | |
| | | | | | | | |
| Cable TV – 0.4% | | | | | | | | |
| Comcast Corp., “Special A” | | | 238,740 | | | $ | 4,968,179 | |
| | | | | | | | |
| Chemicals – 1.8% | | | | | | | | |
| 3M Co. | | | 127,800 | | | $ | 11,029,140 | |
| E.I. du Pont de Nemours & Co. | | | 56,160 | | | | 2,801,261 | |
| PPG Industries, Inc. | | | 130,450 | | | | 10,966,932 | |
| | | | | | | | |
| | | | | | $ | 24,797,333 | |
| | | | | | | | |
| Computer Software – 1.0% | | | | | | | | |
| Oracle Corp. | | | 442,580 | | | $ | 13,852,754 | |
| | | | | | | | |
| Computer Software – Systems – 1.5% | | | | | | | | |
| Hewlett-Packard Co. | | | 186,890 | | | $ | 7,868,069 | |
| International Business Machines Corp. | | | 87,670 | | | | 12,866,449 | |
| | | | | | | | |
| | | | | | $ | 20,734,518 | |
| | | | | | | | |
| | | | | | | | |
| Issuer | | Shares/Par | | | Value ($) | |
| | | | | | | | |
| COMMON STOCKS – continued | | | | | |
| Construction – 0.6% | | | | | | | | |
| Pulte Homes, Inc. (a) | | | 149,610 | | | $ | 1,125,067 | |
| Sherwin-Williams Co. | | | 61,320 | | | | 5,135,550 | |
| Stanley Black & Decker, Inc. | | | 42,944 | | | | 2,871,665 | |
| | | | | | | | |
| | | | | | $ | 9,132,282 | |
| | | | | | | | |
| Consumer Products – 1.0% | | | | | | | | |
| Avon Products, Inc. | | | 35,500 | | | $ | 1,031,630 | |
| Clorox Co. | | | 35,980 | | | | 2,276,814 | |
| Procter & Gamble Co. | | | 160,201 | | | | 10,305,730 | |
| | | | | | | | |
| | | | | | $ | 13,614,174 | |
| | | | | | | | |
| Electrical Equipment – 1.0% | | | | | | | | |
| Danaher Corp. | | | 256,070 | | | $ | 12,078,822 | |
| General Electric Co. | | | 124,940 | | | | 2,285,153 | |
| | | | | | | | |
| | | | | | $ | 14,363,975 | |
| | | | | | | | |
| Electronics – 0.6% | | | | | | | | |
| Intel Corp. | | | 373,140 | | | $ | 7,847,134 | |
| | | | | | | | |
| Energy – Independent – 3.1% | | | | | | | | |
| Anadarko Petroleum Corp. | | | 40,900 | | | $ | 3,114,944 | |
| Apache Corp. | | | 153,390 | | | | 18,288,690 | |
| EOG Resources, Inc. | | | 59,670 | | | | 5,454,435 | |
| Noble Energy, Inc. | | | 50,360 | | | | 4,334,989 | |
| Occidental Petroleum Corp. | | | 85,070 | | | | 8,345,367 | |
| QEP Resources, Inc. | | | 40,230 | | | | 1,460,751 | |
| Southwestern Energy Co. (a) | | | 63,280 | | | | 2,368,570 | |
| | | | | | | | |
| | | | | | $ | 43,367,746 | |
| | | | | | | | |
| Energy – Integrated – 3.6% | | | | | | | | |
| Chevron Corp. | | | 172,277 | | | $ | 15,720,276 | |
| Exxon Mobil Corp. | | | 321,866 | | | | 23,534,842 | |
| Hess Corp. | | | 125,210 | | | | 9,583,573 | |
| TOTAL S.A., ADR | | | 45,320 | | | | 2,423,714 | |
| | | | | | | | |
| | | | | | $ | 51,262,405 | |
| | | | | | | | |
| Engineering – Construction – 0.3% | | | | | | | | |
| Fluor Corp. | | | 63,780 | | | $ | 4,226,063 | |
| | | | | | | | |
| Food & Beverages – 3.0% | | | | | | | | |
| General Mills, Inc. | | | 265,520 | | | $ | 9,449,857 | |
| Groupe Danone | | | 36,087 | | | | 2,267,448 | |
| J.M. Smucker Co. | | | 35,433 | | | | 2,326,176 | |
| Kellogg Co. | | | 63,550 | | | | 3,246,134 | |
| Nestle S.A. | | | 245,395 | | | | 14,369,386 | |
| PepsiCo, Inc. | | | 165,070 | | | | 10,784,023 | |
| | | | | | | | |
| | | | | | $ | 42,443,024 | |
| | | | | | | | |
| Food & Drug Stores – 0.9% | | | | | | | | |
| CVS Caremark Corp. | | | 161,552 | | | $ | 5,617,163 | |
| Kroger Co. | | | 92,770 | | | | 2,074,337 | |
| Walgreen Co. | | | 139,650 | | | | 5,440,764 | |
| | | | | | | | |
| | | | | | $ | 13,132,264 | |
| | | | | | | | |
9
MFS Total Return Portfolio
Portfolio of Investments – continued
| | | | | | | | |
| Issuer | | Shares/Par | | | Value ($) | |
| | | | | | | | |
| COMMON STOCKS – continued | | | | | |
| Gaming & Lodging – 0.1% | | | | | | | | |
| Starwood Hotels & Resorts Worldwide, Inc. | | | 15,990 | | | $ | 971,872 | |
| | | | | | | | |
| General Merchandise – 1.0% | | | | | | | | |
| Kohl’s Corp. (a) | | | 111,760 | | | $ | 6,073,038 | |
| Target Corp. | | | 124,580 | | | | 7,490,995 | |
| | | | | | | | |
| | | | | | $ | 13,564,033 | |
| | | | | | | | |
| Insurance – 4.4% | | | | | | | | |
| ACE Ltd. | | | 106,070 | | | $ | 6,602,858 | |
| Aflac, Inc. | | | 48,430 | | | | 2,732,905 | |
| Allstate Corp. | | | 85,410 | | | | 2,722,871 | |
| Aon Corp. | | | 159,460 | | | | 7,336,755 | |
| Chubb Corp. | | | 48,970 | | | | 2,920,571 | |
| MetLife, Inc. | | | 400,620 | | | | 17,803,553 | |
| Prudential Financial, Inc. | | | 204,770 | | | | 12,022,047 | |
| Travelers Cos., Inc. | | | 179,680 | | | | 10,009,973 | |
| | | | | | | | |
| | | | | | $ | 62,151,533 | |
| | | | | | | | |
| Leisure & Toys – 0.3% | | | | | | | | |
| Hasbro, Inc. | | | 79,450 | | | $ | 3,748,451 | |
| | | | | | | | |
| Machinery & Tools – 0.5% | | | | | | | | |
| Eaton Corp. | | | 65,750 | | | $ | 6,674,283 | |
| | | | | | | | |
| Major Banks – 8.4% | | | | | | | | |
| Bank of America Corp. | | | 1,060,450 | | | $ | 14,146,403 | |
| Bank of New York Mellon Corp. | | | 658,535 | | | | 19,887,757 | |
| Goldman Sachs Group, Inc. | | | 129,970 | | | | 21,855,755 | |
| JPMorgan Chase & Co. | | | 708,492 | | | | 30,054,231 | |
| PNC Financial Services Group, Inc. | | | 95,420 | | | | 5,793,902 | |
| State Street Corp. | | | 223,360 | | | | 10,350,502 | |
| Wells Fargo & Co. | | | 509,120 | | | | 15,777,629 | |
| | | | | | | | |
| | | | | | $ | 117,866,179 | |
| | | | | | | | |
| Medical & Health Technology & Services – 0.1% | | | | | |
| Quest Diagnostics, Inc. | | | 32,650 | | | $ | 1,762,121 | |
| | | | | | | | |
| Medical Equipment – 2.3% | | | | | | | | |
| Becton, Dickinson & Co. | | | 85,530 | | | $ | 7,228,996 | |
| Covidien PLC | | | 51,730 | | | | 2,361,992 | |
| Medtronic, Inc. | | | 229,220 | | | | 8,501,770 | |
| St. Jude Medical, Inc. (a) | | | 169,890 | | | | 7,262,798 | |
| Thermo Fisher Scientific, Inc. (a) | | | 101,780 | | | | 5,634,541 | |
| Waters Corp. (a) | | | 22,700 | | | | 1,764,017 | |
| | | | | | | | |
| | | | | | $ | 32,754,114 | |
| | | | | | | | |
| Metals & Mining – 0.1% | | | | | | | | |
| United States Steel Corp. | | | 33,460 | | | $ | 1,954,732 | |
| | | | | | | | |
| Natural Gas – Distribution – 0.1% | | | | | | | | |
| Sempra Energy | | | 32,110 | | | $ | 1,685,133 | |
| | | | | | | | |
| Natural Gas – Pipeline – 0.2% | | | | | | | | |
| Williams Cos., Inc. | | | 140,500 | | | $ | 3,473,160 | |
| | | | | | | | |
| Network & Telecom – 0.5% | | | | | | | | |
| Cisco Systems, Inc. (a) | | | 349,340 | | | $ | 7,067,148 | |
| | | | | | | | |
| Oil Services – 0.8% | | | | | | | | |
| Halliburton Co. | | | 34,360 | | | $ | 1,402,919 | |
| National Oilwell Varco, Inc. | | | 33,050 | | | | 2,222,613 | |
| | | | | | | | |
| Issuer | | Shares/Par | | | Value ($) | |
| | | | | | | | |
| COMMON STOCKS – continued | | | | | |
| Oil Services – continued | | | | | | | | |
| Noble Corp. | | | 45,320 | | | $ | 1,621,095 | |
| Schlumberger Ltd. | | | 25,610 | | | | 2,138,435 | |
| Transocean, Inc. (a) | | | 47,070 | | | | 3,271,836 | |
| | | | | | | | |
| | | | | | $ | 10,656,898 | |
| | | | | | | | |
| Other Banks & Diversified Financials – 0.8% | | | | | |
| Marshall & Ilsley Corp. | | | 274,850 | | | $ | 1,901,962 | |
| MasterCard, Inc., “A” | | | 22,630 | | | | 5,071,609 | |
| Visa, Inc., “A” | | | 23,830 | | | | 1,677,155 | |
| Zions Bancorporation | | | 88,660 | | | | 2,148,232 | |
| | | | | | | | |
| | | | | | $ | 10,798,958 | |
| | | | | | | | |
| Pharmaceuticals – 3.9% | | | | | | | | |
| Abbott Laboratories | | | 252,760 | | | $ | 12,109,732 | |
| Bayer AG | | | 27,117 | | | | 2,003,875 | |
| GlaxoSmithKline PLC | | | 85,237 | | | | 1,647,872 | |
| Johnson & Johnson | | | 324,900 | | | | 20,095,065 | |
| Merck & Co., Inc. | | | 52,180 | | | | 1,880,567 | |
| Pfizer, Inc. | | | 870,331 | | | | 15,239,496 | |
| Roche Holding AG | | | 13,776 | | | | 2,018,516 | |
| | | | | | | | |
| | | | | | $ | 54,995,123 | |
| | | | | | | | |
| Railroad & Shipping – 0.3% | | | | | | | | |
| Canadian National Railway Co. | | | 31,560 | | | $ | 2,097,793 | |
| Union Pacific Corp. | | | 17,100 | | | | 1,584,486 | |
| | | | | | | | |
| | | | | | $ | 3,682,279 | |
| | | | | | | | |
| Restaurants – 0.3% | | | | | | | | |
| McDonald’s Corp. | | | 54,050 | | | $ | 4,148,878 | |
| | | | | | | | |
| Specialty Chemicals – 0.7% | | | | | | | | |
| Air Products & Chemicals, Inc. | | | 107,990 | | | $ | 9,821,691 | |
| | | | | | | | |
| Specialty Stores – 0.5% | | | | | | | | |
| Advance Auto Parts, Inc. | | | 21,710 | | | $ | 1,436,117 | |
| Best Buy Co., Inc. | | | 28,340 | | | | 971,779 | |
| Staples, Inc. | | | 186,250 | | | | 4,240,913 | |
| | | | | | | | |
| | | | | | $ | 6,648,809 | |
| | | | | | | | |
| Telecommunications – Wireless – 0.8% | | | | | |
| Vodafone Group PLC | | | 4,485,537 | | | $ | 11,595,053 | |
| | | | | | | | |
| Telephone Services – 1.7% | | | | | | | | |
| AT&T, Inc. | | | 705,416 | | | $ | 20,725,122 | |
| CenturyLink, Inc. | | | 76,343 | | | | 3,524,756 | |
| | | | | | | | |
| | | | | | $ | 24,249,878 | |
| | | | | | | | |
| Tobacco – 1.9% | | | | | | | | |
| Altria Group, Inc. | | | 48,860 | | | $ | 1,202,933 | |
| Philip Morris International, Inc. | | | 402,480 | | | | 23,557,154 | |
| Reynolds American, Inc. | | | 44,720 | | | | 1,458,766 | |
| | | | | | | | |
| | | | | | $ | 26,218,853 | |
| | | | | | | | |
| Trucking – 0.2% | | | | | | | | |
| United Parcel Service, Inc., “B” | | | 43,280 | | | $ | 3,141,262 | |
| | | | | | | | |
| Utilities – Electric Power – 2.2% | | | | | | | | |
| American Electric Power Co., Inc. | | | 82,160 | | | $ | 2,956,117 | |
| CenterPoint Energy, Inc. | | | 38,190 | | | | 600,347 | |
10
MFS Total Return Portfolio
Portfolio of Investments – continued
| | | | | | | | |
| Issuer | | Shares/Par | | | Value ($) | |
| | | | | | | | |
| COMMON STOCKS – continued | | | | | |
| Utilities – Electric Power – continued | | | | | |
| Dominion Resources, Inc. | | | 47,538 | | | $ | 2,030,823 | |
| Entergy Corp. | | | 66,680 | | | | 4,722,944 | |
| NextEra Energy, Inc. | | | 40,960 | | | | 2,129,510 | |
| NRG Energy, Inc. (a) | | | 100,200 | | | | 1,957,908 | |
| PG&E Corp. | | | 131,580 | | | | 6,294,787 | |
| PPL Corp. | | | 182,190 | | | | 4,795,241 | |
| Public Service Enterprise Group, Inc. | | | 191,560 | | | | 6,093,524 | |
| | | | | | | | |
| | | | | | $ | 31,581,201 | |
| | | | | | | | |
Total Common Stocks
(Identified Cost, $765,611,702) | | | $ | 838,644,079 | |
| | | | | | | | |
| | |
| BONDS – 39.9% | | | | | | | | |
| Agency – Other – 0.1% | | | | | | | | |
| Financing Corp., 9.65%, 2018 | | $ | 490,000 | | | $ | 704,681 | |
| | | | | | | | |
| Asset-Backed & Securitized – 2.5% | | | | | |
Anthracite Ltd., “A”, CDO, FRN,
0.71%, 2017 (z) | | $ | 1,563,470 | | | $ | 1,485,297 | |
| Banc of America Commercial Mortgage, Inc., FRN, 5.742%, 2017 | | | 800,000 | | | | 852,146 | |
| Bayview Financial Revolving Mortgage Loan Trust, FRN, 1.86%, 2040 (z) | | | 1,385,417 | | | | 631,612 | |
BlackRock Capital Finance LP,
7.75%, 2026 (n) | | | 149,282 | | | | 20,108 | |
Capital Trust Realty Ltd., CDO,
5.16%, 2035 (z) | | | 1,168,500 | | | | 1,174,343 | |
| Citigroup Commercial Mortgage Trust, FRN, 5.697%, 2017 | | | 4,050,000 | | | | 4,329,344 | |
| Citigroup/Deutsche Bank Commercial Mortgage Trust, 5.322%, 2049 | | | 1,360,000 | | | | 1,409,667 | |
| Countrywide Asset-Backed Certificates, FRN, 5.689%, 2046 | | | 1,120,000 | | | | 752,385 | |
| Credit Suisse Mortgage Capital Certificate, 5.695%, 2017 | | | 1,881,580 | | | | 1,931,840 | |
| Crest G-Star, CDO, FRN, 0.761%, 2016 | | | 1,618,348 | | | | 1,602,165 | |
| GMAC Mortgage Corp. Loan Trust, FRN, 5.805%, 2036 | | | 999,539 | | | | 603,202 | |
| JPMorgan Chase Commercial Mortgage Securities Corp., 4.78%, 2042 | | | 1,620,000 | | | | 1,637,280 | |
| JPMorgan Chase Commercial Mortgage Securities Corp., 5.552%, 2045 | | | 1,034,871 | | | | 1,105,649 | |
| JPMorgan Chase Commercial Mortgage Securities Corp., FRN, 5.232%, 2041 | | | 1,985,000 | | | | 2,112,675 | |
| JPMorgan Chase Commercial Mortgage Securities Corp., FRN, 5.475%, 2043 | | | 2,438,368 | | | | 2,612,021 | |
| JPMorgan Chase Commercial Mortgage Securities Corp., FRN, 5.872%, 2045 | | | 2,420,000 | | | | 2,646,534 | |
| JPMorgan Chase Commercial Mortgage Securities Corp., FRN, 5.817%, 2049 | | | 1,300,000 | | | | 1,360,131 | |
| JPMorgan Chase Commercial Mortgage Securities Corp., FRN, 5.988%, 2051 | | | 2,664,573 | | | | 2,790,843 | |
Merrill Lynch Mortgage Trust, FRN,
5.825%, 2050 | | | 999,000 | | | | 292,765 | |
| Merrill Lynch/Countrywide Commercial Mortgage Trust, FRN, 5.747%, 2039 | | | 1,881,580 | | | | 1,938,597 | |
| | | | | | | | |
| Issuer | | Shares/Par | | | Value ($) | |
| | | | | | | | |
| BONDS – continued | | | | | | | | |
| Asset-Backed & Securitized – continued | | | | | |
| Morgan Stanley Capital I, Inc., FRN, 1.007%, 2030 (i)(n) | | $ | 8,449,426 | | | $ | 222,128 | |
| Residential Asset Mortgage Products, Inc., FRN, 4.97%, 2034 | | | 840,031 | | | | 848,952 | |
| Residential Funding Mortgage Securities, Inc., 5.32%, 2035 | | | 1,405,000 | | | | 509,327 | |
| Spirit Master Funding LLC, 5.05%, 2023 (z) | | | 1,320,266 | | | | 1,153,674 | |
| Structured Asset Securities Corp., FRN, 4.67%, 2035 | | | 277,105 | | | | 275,342 | |
| Wachovia Bank Commercial Mortgage Trust, FRN, 5.902%, 2017 | | | 1,300,000 | | | | 1,349,237 | |
| | | | | | | | |
| | | | | | $ | 35,647,264 | |
| | | | | | | | |
| Automotive – 0.1% | | | | | | | | |
| Toyota Motor Credit Corp., 3.2%, 2015 | | $ | 720,000 | | | $ | 743,716 | |
| | | | | | | | |
| Broadcasting – 0.1% | | | | | | | | |
| News America, Inc., 8.5%, 2025 | | $ | 1,154,000 | | | $ | 1,410,226 | |
| | | | | | | | |
| Cable TV – 0.4% | | | | | | | | |
| Cox Communications, Inc., 4.625%, 2013 | | $ | 1,167,000 | | | $ | 1,248,862 | |
| DIRECTV Holdings LLC, 4.6%, 2021 | | | 1,500,000 | | | | 1,480,490 | |
| Time Warner Entertainment Co. LP, 8.375%, 2033 | | | 1,830,000 | | | | 2,309,418 | |
| | | | | | | | |
| | | | | | $ | 5,038,770 | |
| | | | | | | | |
| Conglomerates – 0.1% | | | | | | | | |
| Kennametal, Inc., 7.2%, 2012 | | $ | 1,780,000 | | | $ | 1,876,590 | |
| | | | | | | | |
| Consumer Services – 0.1% | | | | | | | | |
| Western Union Co., 5.4%, 2011 | | $ | 1,877,000 | | | $ | 1,951,285 | |
| | | | | | | | |
| Defense Electronics – 0.1% | | | | | | | | |
| BAE Systems Holdings, Inc., 5.2%, 2015 (n) | | $ | 1,853,000 | | | $ | 1,976,171 | |
| | | | | | | | |
| Electronics – 0.1% | | | | | | | | |
| Tyco Electronics Group S.A., 6.55%, 2017 | | $ | 1,492,000 | | | $ | 1,695,531 | |
| | | | | | | | |
| Emerging Market Quasi-Sovereign – 0.2% | | | | | |
| Corporacion Nacional del Cobre de Chile, 3.75%, 2020 (n) | | $ | 488,000 | | | $ | 462,397 | |
| Petroleos Mexicanos, 8%, 2019 | | | 852,000 | | | | 1,026,660 | |
Qtel International Finance Ltd.,
7.875%, 2019 (n) | | | 240,000 | | | | 286,744 | |
| Ras Laffan Liquefied Natural Gas Co. Ltd., 5.832%, 2016 (n) | | | 1,008,186 | | | | 1,083,800 | |
| | | | | | | | |
| | | | | | $ | 2,859,601 | |
| | | | | | | | |
| Emerging Market Sovereign – 0.2% | | | | | | | | |
| Republic of Peru, 7.35%, 2025 | | $ | 103,000 | | | $ | 125,300 | |
| Russian Federation, 3.625%, 2015 (z) | | | 2,500,000 | | | | 2,503,250 | |
| | | | | | | | |
| | | | | | $ | 2,628,550 | |
| | | | | | | | |
| Energy – Independent – 0.1% | | | | | | | | |
| Anadarko Petroleum Corp., 6.45%, 2036 | | $ | 1,510,000 | | | $ | 1,506,057 | |
| | | | | | | | |
| Energy – Integrated – 0.3% | | | | | | | | |
| BP Capital Markets PLC, 4.5%, 2020 | | $ | 346,000 | | | $ | 345,166 | |
| Hess Corp., 8.125%, 2019 | | | 330,000 | | | | 416,912 | |
| Husky Energy, Inc., 5.9%, 2014 | | | 875,000 | | | | 961,617 | |
11
MFS Total Return Portfolio
Portfolio of Investments – continued
| | | | | | | | |
| Issuer | | Shares/Par | | | Value ($) | |
| | | | | | | | |
| BONDS – continued | | | | | | | | |
| Energy – Integrated – continued | | | | | |
| Husky Energy, Inc., 7.25%, 2019 | | $ | 888,000 | | | $ | 1,054,417 | |
| Petro-Canada, 6.05%, 2018 | | | 1,794,000 | | | | 2,038,278 | |
| | | | | | | | |
| | | | | | $ | 4,816,390 | |
| | | | | | | | |
| Financial Institutions – 0.0% | | | | | | | | |
General Electric Capital Corp.,
5.45%, 2013 | | $ | 179,000 | | | $ | 192,496 | |
| | | | | | | | |
| Food & Beverages – 0.3% | | | | | | | | |
| Anheuser-Busch Cos., Inc., 8%, 2039 (n) | | $ | 1,450,000 | | | $ | 1,937,273 | |
| Miller Brewing Co., 5.5%, 2013 (n) | | | 1,475,000 | | | | 1,600,961 | |
| | | | | | | | |
| | | | | | $ | 3,538,234 | |
| | | | | | | | |
| Food & Drug Stores – 0.1% | | | | | | | | |
| CVS Caremark Corp., 6.125%, 2016 | | $ | 1,140,000 | | | $ | 1,293,424 | |
| | | | | | | | |
| Gaming & Lodging – 0.1% | | | | | | | | |
| Wyndham Worldwide Corp., 6%, 2016 | | $ | 1,146,000 | | | $ | 1,199,215 | |
| | | | | | | | |
| Insurance – 0.3% | | | | | | | | |
ING Groep N.V., 5.775% to 2015,
FRN to 2049 | | $ | 1,405,000 | | | $ | 1,208,300 | |
| MetLife, Inc., 4.75%, 2021 | | | 370,000 | | | | 377,779 | |
Metropolitan Life Global Funding,
5.125%, 2013 (n) | | | 590,000 | | | | 635,264 | |
Metropolitan Life Global Funding,
5.125%, 2014 (n) | | | 640,000 | | | | 696,157 | |
| Prudential Financial, Inc., 5.375%, 2020 | | | 310,000 | | | | 323,934 | |
| Prudential Financial, Inc., 6.625%, 2040 | | | 500,000 | | | | 557,904 | |
| | | | | | | | |
| | | | | | $ | 3,799,338 | |
| | | | | | | | |
| Insurance – Property & Casualty – 0.2% | | | | | |
Chubb Corp., 6.375% to 2017,
FRN to 2067 | | $ | 2,340,000 | | | $ | 2,439,450 | |
| ZFS Finance USA Trust IV, 5.875% to 2012, FRN to 2032 (n) | | | 146,000 | | | | 142,460 | |
| ZFS Finance USA Trust V, 6.5% to 2017, FRN to 2037 (n) | | | 524,000 | | | | 510,900 | |
| | | | | | | | |
| | | | | | $ | 3,092,810 | |
| | | | | | | | |
| International Market Quasi-Sovereign – 0.7% | | | | | |
Achmea Hypotheekbank N.V.,
3.2%, 2014 (n) | | $ | 980,000 | | | $ | 1,019,616 | |
| ING Bank N.V., 3.9%, 2014 (n) | | | 1,450,000 | | | | 1,557,929 | |
Irish Life & Permanent PLC,
3.6%, 2013 (e)(n) | | | 1,800,000 | | | | 1,614,632 | |
KFW International Finance, Inc.,
4.875%, 2019 | | | 1,460,000 | | | | 1,618,912 | |
| Royal Bank of Scotland Group PLC, 2.625%, 2012 (n) | | | 2,610,000 | | | | 2,671,755 | |
| Societe Financement de l’ Economie Francaise, 3.375%, 2014 (n) | | | 793,000 | | | | 835,196 | |
| | | | | | | | |
| | | | | | $ | 9,318,040 | |
| | | | | | | | |
| Local Authorities – 0.1% | | | | | | | | |
| New Jersey Turnpike Authority Rev. (Build America Bonds), “F”, 7.414%, 2040 | | $ | 1,190,000 | | | $ | 1,306,144 | |
| | | | | | | | |
| | | | | | | | |
| Issuer | | Shares/Par | | | Value ($) | |
| | | | | | | | |
| BONDS – continued | | | | | | | | |
| Machinery & Tools – 0.1% | | | | | | | | |
| Atlas Copco AB, 5.6%, 2017 (n) | | $ | 1,760,000 | | | $ | 1,896,268 | |
| | | | | | | | |
| Major Banks – 1.4% | | | | | | | | |
| Bank of America Corp., 7.375%, 2014 | | $ | 550,000 | | | $ | 611,369 | |
| Bank of America Corp., 5.49%, 2019 | | | 729,000 | | | | 711,107 | |
| Bank of America Corp., 7.625%, 2019 | | | 780,000 | | | | 898,119 | |
BNP Paribas, 7.195% to 2037,
FRN to 2049 (n) | | | 700,000 | | | | 668,500 | |
Commonwealth Bank of Australia,
5%, 2019 (n) | | | 780,000 | | | | 816,441 | |
| Credit Suisse New York, 5.5%, 2014 | | | 1,600,000 | | | | 1,754,643 | |
| DBS Group Holdings Ltd., 7.657% to 2011, FRN to 2049 (n) | | | 998,000 | | | | 1,007,980 | |
| Goldman Sachs Group, Inc., 5.625%, 2017 | | | 1,446,000 | | | | 1,529,055 | |
| HSBC USA, Inc., 4.875%, 2020 | | | 860,000 | | | | 854,898 | |
| JPMorgan Chase & Co., 6.3%, 2019 | | | 1,310,000 | | | | 1,491,114 | |
| JPMorgan Chase Capital XXII, 6.45%, 2037 | | | 632,000 | | | | 629,535 | |
| JPMorgan Chase Capital XXVII, 7%, 2039 | | | 166,000 | | | | 173,807 | |
| Merrill Lynch & Co., Inc., 6.15%, 2013 | | | 1,220,000 | | | | 1,309,069 | |
| Morgan Stanley, 5.75%, 2016 | | | 1,145,000 | | | | 1,221,114 | |
| Morgan Stanley, 6.625%, 2018 | | | 1,650,000 | | | | 1,789,869 | |
| PNC Funding Corp., 5.625%, 2017 | | | 1,180,000 | | | | 1,261,344 | |
UniCredito Luxembourg Finance S.A.,
6%, 2017 (n) | | | 1,610,000 | | | | 1,574,422 | |
| Wachovia Corp., 5.25%, 2014 | | | 787,000 | | | | 839,331 | |
| | | | | | | | |
| | | | | | $ | 19,141,717 | |
| | | | | | | | |
| Medical & Health Technology & Services – 0.2% | |
| CareFusion Corp., 6.375%, 2019 | | $ | 1,300,000 | | | $ | 1,468,727 | |
| Hospira, Inc., 6.05%, 2017 | | | 1,071,000 | | | | 1,199,870 | |
| | | | | | | | |
| | | | | | $ | 2,668,597 | |
| | | | | | | | |
| Metals & Mining – 0.2% | | | | | | | | |
| ArcelorMittal, 6.125%, 2018 | | $ | 638,000 | | | $ | 679,781 | |
| ArcelorMittal, 5.25%, 2020 | | | 1,250,000 | | | | 1,235,779 | |
| Vale Overseas Ltd., 4.625%, 2020 | | | 337,000 | | | | 333,658 | |
| Vale Overseas Ltd., 6.875%, 2039 | | | 257,000 | | | | 283,967 | |
| | | | | | | | |
| | | | | | $ | 2,533,185 | |
| | | | | | | | |
| Mortgage-Backed – 13.1% | | | | | | | | |
| Fannie Mae, 4.01%, 2013 | | $ | 177,329 | | | $ | 185,679 | |
| Fannie Mae, 4.562%, 2014 | | | 824,432 | | | | 881,389 | |
| Fannie Mae, 4.63%, 2014 | | | 444,316 | | | | 474,838 | |
| Fannie Mae, 4.841%, 2014 | | | 748,049 | | | | 803,924 | |
| Fannie Mae, 4.88%, 2014 | | | 301,920 | | | | 326,061 | |
| Fannie Mae, 4.56%, 2015 | | | 296,312 | | | | 317,546 | |
| Fannie Mae, 4.7%, 2015 | | | 639,051 | | | | 687,786 | |
| Fannie Mae, 4.78%, 2015 | | | 423,701 | | | | 456,953 | |
| Fannie Mae, 4.856%, 2015 | | | 303,128 | | | | 325,961 | |
| Fannie Mae, 4.997%, 2015 | | | 133,254 | | | | 145,101 | |
| Fannie Mae, 5.1%, 2015 | | | 480,000 | | | | 509,901 | |
| Fannie Mae, 5.09%, 2016 | | | 460,000 | | | | 499,349 | |
| Fannie Mae, 5.27%, 2016 | | | 545,000 | | | | 591,686 | |
| Fannie Mae, 5.5%, 2016 - 2040 | | | 31,750,420 | | | | 34,212,083 | |
12
MFS Total Return Portfolio
Portfolio of Investments – continued
| | | | | | | | |
| Issuer | | Shares/Par | | | Value ($) | |
| | | | | | | | |
| BONDS – continued | | | | | | | | |
| Mortgage-Backed – continued | | | | | | | | |
| Fannie Mae, 5.662%, 2016 | | $ | 427,050 | | | $ | 468,023 | |
| Fannie Mae, 5.725%, 2016 | | | 288,654 | | | | 315,317 | |
| Fannie Mae, 5.05%, 2017 | | | 454,562 | | | | 493,368 | |
| Fannie Mae, 6%, 2017 - 2037 | | | 19,958,847 | | | | 21,939,319 | |
| Fannie Mae, 4.5%, 2018 - 2035 | | | 3,460,792 | | | | 3,607,159 | |
| Fannie Mae, 5%, 2018 - 2039 | | | 17,297,042 | | | | 18,323,636 | |
| Fannie Mae, 5.37%, 2018 | | | 600,000 | | | | 649,881 | |
| Fannie Mae, 7.5%, 2030 - 2031 | | | 181,730 | | | | 208,583 | |
| Fannie Mae, 6.5%, 2031 - 2037 | | | 5,623,432 | | | | 6,312,755 | |
| Freddie Mac, 6%, 2016 - 2037 | | | 8,557,993 | | | | 9,374,674 | |
| Freddie Mac, 5%, 2017 - 2039 | | | 14,237,651 | | | | 15,042,709 | |
| Freddie Mac, 4%, 2018 - 2040 | | | 10,731,806 | | | | 10,752,670 | |
| Freddie Mac, 4.5%, 2018 - 2039 | | | 11,806,892 | | | | 12,274,625 | |
| Freddie Mac, 5.085%, 2019 | | | 1,417,000 | | | | 1,498,182 | |
| Freddie Mac, 5.5%, 2019 - 2037 | | | 9,933,129 | | | | 10,684,802 | |
| Freddie Mac, 3.808%, 2020 | | | 1,217,000 | | | | 1,196,436 | |
| Freddie Mac, 6.5%, 2034 - 2038 | | | 3,427,819 | | | | 3,829,078 | |
| Ginnie Mae, 4.5%, 2033 - 2040 | | | 6,399,173 | | | | 6,686,962 | |
| Ginnie Mae, 5%, 2033 - 2039 | | | 7,536,878 | | | | 8,021,059 | |
| Ginnie Mae, 5.5%, 2033 - 2035 | | | 3,830,565 | | | | 4,161,138 | |
| Ginnie Mae, 6%, 2033 - 2038 | | | 3,480,876 | | | | 3,869,827 | |
| Ginnie Mae, 4%, 2040 | | | 4,048,000 | | | | 4,071,434 | |
| | | | | | | | |
| | | | | | $ | 184,199,894 | |
| | | | | | | | |
| Municipals – 0.2% | | | | | | | | |
California Educational Facilities Authority Rev. (Stanford University), “T-1”,
5%, 2039 | | $ | 105,000 | | | $ | 107,562 | |
Massachusetts Health & Educational Facilities Authority Rev. (Boston College),
5.5%, 2030 | | | 795,000 | | | | 855,293 | |
| Massachusetts Health & Educational Facilities Authority Rev. (Massachusetts Institute of Technology), “K”, 5.5%, 2032 | | | 1,275,000 | | | | 1,410,201 | |
| | | | | | | | |
| | | | | | $ | 2,373,056 | |
| | | | | | | | |
| Natural Gas – Pipeline – 0.5% | | | | | | | | |
| CenterPoint Energy, Inc., 7.875%, 2013 | | $ | 1,285,000 | | | $ | 1,452,609 | |
Enterprise Products Operating LLC,
6.5%, 2019 | | | 966,000 | | | | 1,096,849 | |
| Kinder Morgan Energy Partners LP, 6.75%, 2011 | | | 1,620,000 | | | | 1,637,984 | |
Kinder Morgan Energy Partners LP,
7.4%, 2031 | | | 804,000 | | | | 899,209 | |
| Kinder Morgan Energy Partners LP, 7.75%, 2032 | | | 590,000 | | | | 684,649 | |
| Spectra Energy Capital LLC, 8%, 2019 | | | 987,000 | | | | 1,202,419 | |
| | | | | | | | |
| | | | | | $ | 6,973,719 | |
| | | | | | | | |
| Network & Telecom – 0.5% | | | | | | | | |
| AT&T, Inc., 6.55%, 2039 | | $ | 1,390,000 | | | $ | 1,512,951 | |
| BellSouth Corp., 6.55%, 2034 | | | 1,472,000 | | | | 1,548,108 | |
| Telecom Italia Capital, 5.25%, 2013 | | | 752,000 | | | | 783,438 | |
| Verizon New York, Inc., 6.875%, 2012 | | | 2,443,000 | | | | 2,606,073 | |
| | | | | | | | |
| | | | | | $ | 6,450,570 | |
| | | | | | | | |
| | | | | | | | |
| Issuer | | Shares/Par | | | Value ($) | |
| | | | | | | | |
| BONDS – continued | | | | | | | | |
| Other Banks & Diversified Financials – 1.0% | |
| American Express Co., 5.5%, 2016 | | $ | 938,000 | | | $ | 1,030,475 | |
| Banco Bradesco S.A., 6.75%, 2019 (n) | | | 681,000 | | | | 725,265 | |
Banco Santander U.S. Debt S.A.U.,
3.781%, 2015 (n) | | | 600,000 | | | | 563,750 | |
| Capital One Financial Corp., 6.15%, 2016 | | | 1,540,000 | | | | 1,667,236 | |
Groupe BPCE S.A., 12.5% to 2019,
FRN to 2049 (n) | | | 1,494,000 | | | | 1,717,114 | |
Nordea Bank AB, 5.424% to 2015,
FRN to 2049 (n) | | | 599,000 | | | | 567,717 | |
Svenska Handelsbanken AB,
4.875%, 2014 (n) | | | 2,000,000 | | | | 2,125,976 | |
UBS Preferred Funding Trust V,
6.243% to 2016, FRN to 2049 | | | 2,970,000 | | | | 2,851,200 | |
Woori Bank, 6.125% to 2011,
FRN to 2016 (n) | | | 2,715,000 | | | | 2,749,130 | |
| | | | | | | | |
| | | | | | $ | 13,997,863 | |
| | | | | | | | |
| Pharmaceuticals – 0.2% | | | | | | | | |
| Pfizer, Inc., 7.2%, 2039 | | $ | 590,000 | | | $ | 763,482 | |
| Roche Holdings, Inc., 6%, 2019 (n) | | | 1,980,000 | | | | 2,302,421 | |
| | | | | | | | |
| | | | | | $ | 3,065,903 | |
| | | | | | | | |
| Real Estate – 0.3% | | | | | | | | |
| Boston Properties, Inc., REIT, 5%, 2015 | | $ | 369,000 | | | $ | 395,713 | |
| HRPT Properties Trust, REIT, 6.25%, 2016 | | | 2,545,000 | | | | 2,655,400 | |
Simon Property Group, Inc., REIT,
5.875%, 2017 | | | 1,131,000 | | | | 1,241,511 | |
| WEA Finance LLC, REIT, 6.75%, 2019 (n) | | | 426,000 | | | | 474,574 | |
| | | | | | | | |
| | | | | | $ | 4,767,198 | |
| | | | | | | | |
| Retailers – 0.2% | | | | | | | | |
| Limited Brands, Inc., 5.25%, 2014 | | $ | 404,000 | | | $ | 418,140 | |
| Wal-Mart Stores, Inc., 5.25%, 2035 | | | 2,241,000 | | | | 2,255,226 | |
| | | | | | | | |
| | | | | | $ | 2,673,366 | |
| | | | | | | | |
| Supranational – 0.1% | | | | | | | | |
| Asian Development Bank, 2.75%, 2014 | | $ | 1,040,000 | | | $ | 1,082,826 | |
| | | | | | | | |
| Telecommunications – Wireless – 0.2% | |
Crown Castle Towers LLC,
6.113%, 2020 (n) | | $ | 783,000 | | | $ | 816,920 | |
Crown Castle Towers LLC,
4.883%, 2020 (n) | | | 420,000 | | | | 403,653 | |
| Rogers Communications, Inc., 6.8%, 2018 | | | 1,554,000 | | | | 1,868,310 | |
| | | | | | | | |
| | | | | | $ | 3,088,883 | |
| | | | | | | | |
| Transportation – Services – 0.1% | | | | | | | | |
| Erac USA Finance Co., 7%, 2037 (n) | | $ | 1,325,000 | | | $ | 1,426,793 | |
| | | | | | | | |
| U.S. Government Agencies and Equivalents – 0.4% | |
| Fannie Mae, 6%, 2011 | | $ | 1,539,000 | | | $ | 1,571,564 | |
Small Business Administration,
4.77%, 2024 | | | 608,048 | | | | 644,665 | |
Small Business Administration,
5.18%, 2024 | | | 994,837 | | | | 1,061,245 | |
Small Business Administration,
4.99%, 2024 | | | 892,080 | | | | 951,719 | |
13
MFS Total Return Portfolio
Portfolio of Investments – continued
| | | | | | | | |
| Issuer | | Shares/Par | | | Value ($) | |
| | | | | | | | |
| BONDS – continued | | | | | | | | |
| U.S. Government Agencies and Equivalents – continued | |
Small Business Administration,
5.11%, 2025 | | $ | 1,929,637 | | | $ | 2,068,169 | |
| | | | | | | | |
| | | | | | $ | 6,297,362 | |
| | | | | | | | |
| U.S. Treasury Obligations – 14.0% | | | | | | | | |
| U.S. Treasury Bonds, 2%, 2013 | | $ | 2,348,000 | | | $ | 2,417,339 | |
| U.S. Treasury Bonds, 8.5%, 2020 | | | 2,554,000 | | | | 3,654,215 | |
| U.S. Treasury Bonds, 8%, 2021 | | | 320,000 | | | | 452,600 | |
| U.S. Treasury Bonds, 6%, 2026 | | | 651,000 | | | | 804,900 | |
| U.S. Treasury Bonds, 6.75%, 2026 | | | 408,000 | | | | 541,747 | |
| U.S. Treasury Bonds, 5.25%, 2029 | | | 1,229,000 | | | | 1,409,509 | |
| U.S. Treasury Bonds, 5.375%, 2031 | | | 2,921,000 | | | | 3,409,812 | |
| U.S. Treasury Bonds, 5%, 2037 | | | 7,630,000 | | | | 8,513,409 | |
| U.S. Treasury Bonds, 4.5%, 2039 | | | 14,705,200 | | | | 15,100,402 | |
| U.S. Treasury Notes, 0.875%, 2011 | | | 7,515,000 | | | | 7,522,928 | |
| U.S. Treasury Notes, 5.125%, 2011 | | | 357,000 | | | | 365,660 | |
| U.S. Treasury Notes, 4.5%, 2012 | | | 1,924,000 | | | | 2,029,895 | |
| U.S. Treasury Notes, 4.625%, 2012 | | | 1,800,000 | | | | 1,918,265 | |
| U.S. Treasury Notes, 1.375%, 2012 | | | 6,962,000 | | | | 7,064,529 | |
| U.S. Treasury Notes, 1.375%, 2013 | | | 36,404,000 | | | | 36,935,862 | |
| U.S. Treasury Notes, 3.125%, 2013 | | | 40,447,000 | | | | 42,908,564 | |
| U.S. Treasury Notes, 2.75%, 2013 | | | 1,080,000 | | | | 1,135,266 | |
| U.S. Treasury Notes, 1.875%, 2014 | | | 13,481,000 | | | | 13,787,477 | |
| U.S. Treasury Notes, 4.125%, 2015 | | | 4,512,000 | | | | 4,968,488 | |
| U.S. Treasury Notes, 2.625%, 2016 | | | 868,000 | | | | 890,853 | |
| U.S. Treasury Notes, 5.125%, 2016 | | | 488,000 | | | | 562,229 | |
| U.S. Treasury Notes, 4.75%, 2017 | | | 2,210,000 | | | | 2,506,105 | |
| U.S. Treasury Notes, 3.75%, 2018 | | | 35,419,000 | | | | 37,674,199 | |
| | | | | | | | |
| | | | | | $ | 196,574,253 | |
| | | | | | | | |
| Utilities – Electric Power – 1.0% | | | | | | | | |
| Bruce Mansfield Unit, 6.85%, 2034 | | $ | 2,531,254 | | | $ | 2,686,529 | |
| EDP Finance B.V., 6%, 2018 (n) | | | 1,139,000 | | | | 1,064,596 | |
Enel Finance International S.A.,
6.25%, 2017 (n) | | | 1,183,000 | | | | 1,292,071 | |
| | | | | | | | |
| Issuer | | Shares/Par | | | Value ($) | |
| | | | | | | | |
| BONDS – continued | | | | | | | | |
| Utilities – Electric Power – continued | |
| MidAmerican Funding LLC, 6.927%, 2029 | | $ | 2,762,000 | | | $ | 3,194,507 | |
| Oncor Electric Delivery Co., 7%, 2022 | | | 1,582,000 | | | | 1,858,331 | |
| PSEG Power LLC, 6.95%, 2012 | | | 1,177,000 | | | | 1,268,993 | |
| PSEG Power LLC, 5.32%, 2016 | | | 923,000 | | | | 1,009,948 | |
System Energy Resources, Inc.,
5.129%, 2014 (z) | | | 442,025 | | | | 456,347 | |
| Waterford 3 Funding Corp., 8.09%, 2017 | | | 1,629,291 | | | | 1,647,947 | |
| | | | | | | | |
| | | | | | $ | 14,479,269 | |
| | | | | | | | |
Total Bonds
(Identified Cost, $542,088,757) | | | $ | 560,285,255 | |
| | | | | | | | |
| CONVERTIBLE PREFERRED STOCKS – 0.3% | |
| Automotive – 0.1% | | | | | | | | |
| General Motors Co., 4.75% (a) | | | 43,700 | | | $ | 2,364,607 | |
| | | | | | | | |
| Energy – Independent – 0.1% | | | | | | | | |
| Apache Corp., 6% | | | 12,760 | | | $ | 845,478 | |
| | | | | | | | |
| Utilities – Electric Power – 0.1% | | | | | | | | |
| PPL Corp., 9.5% | | | 12,920 | | | $ | 710,212 | |
| | | | | | | | |
Total Convertible Preferred Stocks
(Identified Cost, $3,501,519) | | | $ | 3,920,297 | |
| | | | | | | | |
|
| MONEY MARKET FUNDS (v) – 0.6% | |
| MFS Institutional Money Market Portfolio, 0.18%, at Cost and Net Asset Value | | | 9,034,481 | | | $ | 9,034,481 | |
| | | | | | | | |
Total Investments
(Identified Cost, $1,320,236,459) | | | $ | 1,411,884,112 | |
| | | | | | | | |
OTHER ASSETS, LESS
LIABILITIES – (0.5)% | | | | (7,043,843 | ) |
| | | | | | | | |
| Net Assets – 100.0% | | | $ | 1,404,840,269 | |
| | | | | | | | |
| (a) | | Non-income producing security. |
| (e) | | Guaranteed by Minister for Finance of Ireland. |
| (i) | | Interest only security for which the fund receives interest on notional principal (Par amount). Par amount shown is the notional principal and does not reflect the cost of the security. |
| (n) | | Securities exempt from registration under Rule 144A of the Securities Act of 1933. These securities may be sold in the ordinary course of business in transactions exempt from registration, normally to qualified institutional buyers. At period end, the aggregate value of these securities was $39,467,082, representing 2.8% of net assets. |
| (v) | | Underlying fund that is available only to investment companies managed by MFS. The rate quoted is the annualized seven-day yield of the fund at period end. |
| (z) | | Restricted securities are not registered under the Securities Act of 1933 and are subject to legal restrictions on resale. These securities generally may be resold in transactions exempt from registration or to the public if the securities are subsequently registered. Disposal of these securities may involve time-consuming negotiations and prompt sale at an acceptable price may be difficult. The fund holds the following restricted securities: |
| | | | | | | | | | |
| Restricted Securities | | Acquisition
Date | | Cost | | | Value | |
| Anthracite Ltd., “A”, CDO, FRN, 0.71%, 2017 | | 3/19/10 | | | $1,457,935 | | | | $1,485,297 | |
| Bayview Financial Revolving Mortgage Loan Trust, FRN, 1.86%, 2040 | | 3/01/06 | | | 1,385,417 | | | | 631,612 | |
| Capital Trust Realty Ltd., CDO, 5.16%, 2035 | | 9/14/10 | | | 1,169,224 | | | | 1,174,343 | |
| Russian Federation, 3.625%, 2015 | | 4/22/10 | | | 2,488,513 | | | | 2,503,250 | |
| Spirit Master Funding LLC, 5.05%, 2023 | | 10/04/05 | | | 1,307,612 | | | | 1,153,674 | |
| System Energy Resources, Inc., 5.129%, 2014 | | 4/16/04 | | | 442,025 | | | | 456,347 | |
| Total Restricted Securities | | | | | | | | | $7,404,523 | |
| % of Net Assets | | | | | | | | | 0.5 % | |
14
MFS Total Return Portfolio
Portfolio of Investments – continued
The following abbreviations are used in this report and are defined:
| ADR | | American Depository Receipt |
| CDO | | Collateralized Debt Obligation |
| FRN | | Floating Rate Note. Interest rate resets periodically and may not be the rate reported at period end. |
| PLC | | Public Limited Company |
| REIT | | Real Estate Investment Trust |
See Notes to Financial Statements
15
MFS Total Return Portfolio
FINANCIAL STATEMENTS | STATEMENT OF ASSETS AND LIABILITIES
This statement represents your fund’s balance sheet, which details the assets and liabilities comprising the total value of the fund.
| | | | | | | | |
At 12/31/10 | | | | | | | | |
Assets | | | | | | | | |
Investments – | | | | | | | | |
Non-affiliated issuers, at value (identified cost, $1,311,201,978) | | | $1,402,849,631 | | | | | |
Underlying funds, at cost and value | | | 9,034,481 | | | | | |
Total investments, at value (identified cost, $1,320,236,459) | | | $1,411,884,112 | | | | | |
Cash | | | 7,551 | | | | | |
Receivables for | | | | | | | | |
Fund shares sold | | | 174,209 | | | | | |
Interest and dividends | | | 5,531,852 | | | | | |
Other assets | | | 40,142 | | | | | |
Total assets | | | | | | | $1,417,637,866 | |
Liabilities | | | | | | | | |
Payables for | | | | | | | | |
Investments purchased | | | $10,755,525 | | | | | |
Fund shares reacquired | | | 1,817,583 | | | | | |
Payable to affiliates | | | | | | | | |
Investment adviser | | | 62,494 | | | | | |
Distribution and/or service fees | | | 11,415 | | | | | |
Administrative services fee | | | 2,673 | | | | | |
Payable for Trustees’ compensation | | | 1,604 | | | | | |
Accrued expenses and other liabilities | | | 146,303 | | | | | |
Total liabilities | | | | | | | $12,797,597 | |
Net assets | | | | | | | $1,404,840,269 | |
Net assets consist of | | | | | | | | |
Paid-in capital | | | $1,410,180,289 | | | | | |
Unrealized appreciation (depreciation) on investments and translation of assets and liabilities in foreign currencies | | | 91,656,617 | | | | | |
Accumulated net realized gain (loss) on investments and foreign currency transactions | | | (130,156,424 | ) | | | | |
Undistributed net investment income | | | 33,159,787 | | | | | |
Net assets | | | | | | | $1,404,840,269 | |
Shares of beneficial interest outstanding | | | | | | | 84,239,657 | |
| | | | | | | | | | | | |
| | | Net assets | | | Shares
outstanding | | | Net asset value
per share | |
Initial Class | | | $571,781,101 | | | | 34,088,090 | | | | $16.77 | |
Service Class | | | 833,059,168 | | | | 50,151,567 | | | | 16.61 | |
See Notes to Financial Statements
16
MFS Total Return Portfolio
FINANCIAL STATEMENTS | STATEMENT OF OPERATIONS
This statement describes how much your fund earned in investment income and accrued in expenses. It also describes any gains and/or losses generated by fund operations.
| | | | | | | | |
Year ended 12/31/10 | | | | | | | | |
| Net investment income | | | | | | | | |
Income | | | | | | | | |
Interest | | | $24,519,803 | | | | | |
Dividends | | | 19,793,350 | | | | | |
Dividends from underlying funds | | | 30,719 | | | | | |
Foreign taxes withheld | | | (179,385 | ) | | | | |
Total investment income | | | | | | | $44,164,487 | |
Expenses | | | | | | | | |
Management fee | | | $9,488,862 | | | | | |
Distribution and/or service fees | | | 2,099,930 | | | | | |
Administrative services fee | | | 491,648 | | | | | |
Trustees’ compensation | | | 193,343 | | | | | |
Custodian fee | | | 200,984 | | | | | |
Shareholder communications | | | 34,015 | | | | | |
Auditing fees | | | 62,355 | | | | | |
Legal fees | | | 8,128 | | | | | |
Miscellaneous | | | 109,051 | | | | | |
Total expenses | | | | | | | $12,688,316 | |
Fees paid indirectly | | | (150 | ) | | | | |
Reduction of expenses by investment adviser | | | (27,978 | ) | | | | |
Net expenses | | | | | | | $12,660,188 | |
Net investment income | | | | | | | $31,504,299 | |
Realized and unrealized gain (loss) on investments and foreign currency transactions | | | | | | | | |
Realized gain (loss) (identified cost basis) | | | | | | | | |
Investment transactions | | | $56,478,008 | | | | | |
Foreign currency transactions | | | 6,393 | | | | | |
Net realized gain (loss) on investments and foreign currency transactions | | | | | | | $56,484,401 | |
Change in unrealized appreciation (depreciation) | | | | | | | | |
Investments | | | $44,049,581 | | | | | |
Translation of assets and liabilities in foreign currencies | | | 8,846 | | | | | |
Net unrealized gain (loss) on investments and foreign currency translation | | | | | | | $44,058,427 | |
Net realized and unrealized gain (loss) on investments and foreign currency | | | | | | | $100,542,828 | |
Change in net assets from operations | | | | | | | $132,047,127 | |
See Notes to Financial Statements
17
MFS Total Return Portfolio
FINANCIAL STATEMENTS | STATEMENTS OF CHANGES IN NET ASSETS
These statements describe the increases and/or decreases in net assets resulting from operations, any distributions, and any shareholder transactions.
| | | | | | | | |
For years ended 12/31 | | | 2010 | | | | 2009 | |
Change in net assets | | | | | | | | |
From operations | | | | | | | | |
Net investment income | | | $31,504,299 | | | | $36,057,847 | |
Net realized gain (loss) on investments and foreign currency transactions | | | 56,484,401 | | | | 14,124,114 | |
Net unrealized gain (loss) on investments and foreign currency translation | | | 44,058,427 | | | | 170,981,578 | |
Change in net assets from operations | | | $132,047,127 | | | | $221,163,539 | |
Distributions declared to shareholders | | | | | | | | |
From net investment income | | | $(37,470,337 | ) | | | $(48,700,594 | ) |
Change in net assets from fund share transactions | | | $(149,042,604 | ) | | | $(26,516,386 | ) |
Total change in net assets | | | $(54,465,814 | ) | | | $145,946,559 | |
Net assets | | | | | | | | |
At beginning of period | | | 1,459,306,083 | | | | 1,313,359,524 | |
At end of period (including undistributed net investment income of $33,159,787 and
$37,468,127, respectively) | | | $1,404,840,269 | | | | $1,459,306,083 | |
See Notes to Financial Statements
18
MFS Total Return Portfolio
FINANCIAL STATEMENTS | FINANCIAL HIGHLIGHTS
The financial highlights table is intended to help you understand the fund’s financial performance for the past 5 years. Certain information reflects financial results for a single fund share. The total returns in the table represent the rate by which an investor would have earned (or lost) on an investment in the fund share class (assuming reinvestment of all distributions) held for the entire period.
| | | | | | | | | | | | | | | | | | | | |
| Initial Class | | Years ended 12/31 | |
| | | 2010 | | | 2009 | | | 2008 | | | 2007 | | | 2006 | �� |
Net asset value, beginning of period | | | $15.66 | | | | $13.83 | | | | $19.50 | | | | $20.02 | | | | $19.10 | |
| Income (loss) from investment operations | | | | | | | | | | | | | | | | | | | | |
Net investment income (d) | | | $0.38 | | | | $0.40 | | | | $0.49 | | | | $0.53 | | | | $0.54 | |
Net realized and unrealized gain (loss) on investments
and foreign currency | | | 1.16 | | | | 1.98 | | | | (4.30 | ) | | | 0.36 | | | | 1.69 | |
Total from investment operations | | | $1.54 | | | | $2.38 | | | | $(3.81 | ) | | | $0.89 | | | | $2.23 | |
| Less distributions declared to shareholders | | | | | | | | | | | | | | | | | | | | |
From net investment income | | | $(0.43 | ) | | | $(0.55 | ) | | | $(0.60 | ) | | | $(0.60 | ) | | | $(0.54 | ) |
From net realized gain on investments | | | — | | | | — | | | | (1.26 | ) | | | (0.81 | ) | | | (0.77 | ) |
Total distributions declared to shareholders | | | $(0.43 | ) | | | $(0.55 | ) | | | $(1.86 | ) | | | $(1.41 | ) | | | $(1.31 | ) |
Net asset value, end of period | | | $16.77 | | | | $15.66 | | | | $13.83 | | | | $19.50 | | | | $20.02 | |
Total return (%) (k)(r)(s) | | | 9.97 | | | | 18.09 | | | | (21.55 | ) | | | 4.32 | | | | 12.22 | |
Ratios (%) (to average net assets) and Supplemental data: | | | | | | | | | | | | | | | | | | | | |
Expenses before expense reductions (f) | | | 0.75 | | | | 0.76 | | | | 0.74 | | | | 0.70 | | | | 0.71 | |
Expenses after expense reductions (f) | | | 0.74 | | | | — | | | | — | | | | — | | | | — | |
Net investment income | | | 2.37 | | | | 2.87 | | | | 2.93 | | | | 2.67 | | | | 2.81 | |
Portfolio turnover | | | 32 | | | | 45 | | | | 62 | | | | 60 | | | | 48 | |
Net assets at end of period (000 omitted) | | | $571,781 | | | | $604,214 | | | | $604,843 | | | | $1,013,465 | | | | $1,210,549 | |
| |
| Service Class | | Years ended 12/31 | |
| | | 2010 | | | 2009 | | | 2008 | | | 2007 | | | 2006 | |
Net asset value, beginning of period | | | $15.52 | | | | $13.70 | | | | $19.33 | | | | $19.86 | | | | $18.97 | |
| Income (loss) from investment operations | | | | | | | | | | | | | | | | | | | | |
Net investment income (d) | | | $0.33 | | | | $0.36 | | | | $0.44 | | | | $0.48 | | | | $0.49 | |
Net realized and unrealized gain (loss) on investments
and foreign currency | | | 1.16 | | | | 1.97 | | | | (4.26 | ) | | | 0.36 | | | | 1.67 | |
Total from investment operations | | | $1.49 | | | | $2.33 | | | | $(3.82 | ) | | | $0.84 | | | | $2.16 | |
| Less distributions declared to shareholders | | | | | | | | | | | | | | | | | | | | |
From net investment income | | | $(0.40 | ) | | | $(0.51 | ) | | | $(0.55 | ) | | | $(0.56 | ) | | | $(0.50 | ) |
From net realized gain on investments | | | — | | | | — | | | | (1.26 | ) | | | (0.81 | ) | | | (0.77 | ) |
Total distributions declared to shareholders | | | $(0.40 | ) | | | $(0.51 | ) | | | $(1.81 | ) | | | $(1.37 | ) | | | $(1.27 | ) |
Net asset value, end of period | | | $16.61 | | | | $15.52 | | | | $13.70 | | | | $19.33 | | | | $19.86 | |
Total return (%) (k)(r)(s) | | | 9.69 | | | | 17.81 | | | | (21.74 | ) | | | 4.07 | | | | 11.91 | |
Ratios (%) (to average net assets) and Supplemental data: | | | | | | | | | | | | | | | | | | | | |
Expenses before expense reductions (f) | | | 1.00 | | | | 1.00 | | | | 0.99 | | | | 0.95 | | | | 0.96 | |
Expenses after expense reductions (f) | | | 0.99 | | | | — | | | | — | | | | — | | | | — | |
Net investment income | | | 2.12 | | | | 2.60 | | | | 2.69 | | | | 2.42 | | | | 2.58 | |
Portfolio turnover | | | 32 | | | | 45 | | | | 62 | | | | 60 | | | | 48 | |
Net assets at end of period (000 omitted) | | | $833,059 | | | | $855,092 | | | | $708,517 | | | | $994,977 | | | | $903,202 | |
| (d) | Per share data is based on average shares outstanding. |
| (f) | Ratios do not reflect reductions from fees paid indirectly, if applicable. |
| (k) | The total return does not reflect expenses that apply to separate accounts. Inclusion of these charges would reduce the total return figures for all periods shown. |
| (s) | From time to time the fund may receive proceeds from litigation settlements, without which performance would be lower. |
See Notes to Financial Statements
19
MFS Total Return Portfolio
NOTES TO FINANCIAL STATEMENTS
| (1) | | Business and Organization |
MFS Total Return Portfolio (the fund) is a series of MFS Variable Insurance Trust II (the trust). The trust is organized as a Massachusetts business trust and is registered under the Investment Company Act of 1940, as amended, as an open-end management investment company. The shareholders of each series of the trust are separate accounts of insurance companies, which offer variable annuity and/or life insurance products, and qualified retirement and pension plans.
| (2) | | Significant Accounting Policies |
General – The preparation of financial statements in conformity with U.S. generally accepted accounting principles requires management to make estimates and assumptions that affect the reported amounts of assets and liabilities, and disclosure of contingent assets and liabilities at the date of the financial statements and the reported amounts of revenues and expenses during the reporting period. Actual results could differ from those estimates. In the preparation of these financial statements, management has evaluated subsequent events occurring after the date of the fund’s Statement of Assets and Liabilities through the date that the financial statements were issued. The fund invests a significant portion of its assets in asset-backed and/or mortgage-backed securities. The value of these securities may depend, in part, on the issuer’s or borrower’s credit quality or ability to pay principal and interest when due and may fall if an issuer or borrower defaults on its obligation to pay principal or interest or if the instrument’s credit rating is downgraded by a credit rating agency. U.S. Government securities not supported as to the payment of principal or interest by the U.S. Treasury, such as those issued by Fannie Mae, Freddie Mac, and the Federal Home Loan Banks, are subject to greater credit risk than are U.S. Government securities supported by the U.S. Treasury, such as those issued by Ginnie Mae. The fund invests in foreign securities, including securities of emerging market issuers. Investments in foreign securities are vulnerable to the effects of changes in the relative values of the local currency and the U.S. dollar and to the effects of changes in each country’s legal, political, and economic environment. The markets of emerging markets countries are generally more volatile than the markets of developed countries with more mature economies. All of the risks of investing in foreign securities previously described are heightened when investing in emerging markets countries.
Investment Valuations – Equity securities, including restricted equity securities, are generally valued at the last sale or official closing price as provided by a third-party pricing service on the market or exchange on which they are primarily traded. Equity securities, for which there were no sales reported that day, are generally valued at the last quoted daily bid quotation as provided by a third-party pricing service on the market or exchange on which such securities are primarily traded. Equity securities held short, for which there were no sales reported for that day, are generally valued at the last quoted daily ask quotation as provided by a third-party pricing service on the market or exchange on which such securities are primarily traded. Debt instruments and floating rate loans (other than short-term instruments), including restricted debt instruments, are generally valued at an evaluated or composite bid as provided by a third-party pricing service. Short-term instruments with a maturity at issuance of 60 days or less generally are valued at amortized cost, which approximates market value. Open-end investment companies are generally valued at net asset value per share. Securities and other assets generally valued on the basis of information from a third-party pricing service may also be valued at a broker/dealer bid quotation. Values obtained from third-party pricing services can utilize both transaction data and market information such as yield, quality, coupon rate, maturity, type of issue, trading characteristics, and other market data. The values of foreign securities and other assets and liabilities expressed in foreign currencies are converted to U.S. dollars using the mean of bid and asked prices for rates provided by a third-party pricing service.
The Board of Trustees has delegated primary responsibility for determining or causing to be determined the value of the fund’s investments (including any fair valuation) to the adviser pursuant to valuation policies and procedures approved by the Board. If the adviser determines that reliable market quotations are not readily available, investments are valued at fair value as determined in good faith by the adviser in accordance with such procedures under the oversight of the Board of Trustees. Under the fund’s valuation policies and procedures, market quotations are not considered to be readily available for most types of debt instruments and floating rate loans and many types of derivatives. These investments are generally valued at fair value based on information from third-party pricing services. In addition, investments may be valued at fair value if the adviser determines that an investment’s value has been materially effected by events occurring after the close of the exchange or market on which the investment is principally traded (such as foreign exchange or market) and prior to the determination of the fund’s net asset value, or after the halting of trading of a specific security where trading does not resume prior to the close of the exchange or market on which the security is principally traded. Events that occur on a frequent basis after foreign markets close (such as developments in foreign markets and significant movements in the U.S. markets) and prior to the determination of the fund’s net asset value may be deemed to have a material effect on the value of securities traded in foreign markets. Accordingly, the fund’s foreign equity securities may often be valued at fair value. The adviser generally relies on third-party pricing services or other information (such as the correlation with price movements of similar securities in the same or other markets; the type, cost and investment characteristics of the security; the business and financial condition of the
20
MFS Total Return Portfolio
Notes to Financial Statements – continued
issuer; and trading and other market data) to assist in determining whether to fair value and at what value to fair value an investment. The value of an investment for purposes of calculating the fund’s net asset value can differ depending on the source and method used to determine value. When fair valuation is used, the value of an investment used to determine the fund’s net asset value may differ from quoted or published prices for the same investment. There can be no assurance that the fund could obtain the fair value assigned to an investment if it were to sell the investment at the same time at which the fund determines its net asset value per share.
Various inputs are used in determining the value of the fund’s assets or liabilities. These inputs are categorized into three broad levels. In certain cases, the inputs used to measure fair value may fall into different levels of the fair value hierarchy. In such cases, an investment’s level within the fair value hierarchy is based on the lowest level of input that is significant to the fair value measurement. The fund’s assessment of the significance of a particular input to the fair value measurement in its entirety requires judgment, and considers factors specific to the investment. Level 1 includes unadjusted quoted prices in active markets for identical assets or liabilities. Level 2 includes other significant observable market-based inputs (including quoted prices for similar securities, interest rates, prepayment speed, and credit risk). Level 3 includes unobservable inputs, which may include the adviser’s own assumptions in determining the fair value of investments. The following is a summary of the levels used as of December 31, 2010 in valuing the fund’s assets or liabilities:
| | | | | | | | | | | | | | | | |
| Investments at Value | | Level 1 | | | Level 2 | | | Level 3 | | | Total | |
| Equity Securities | | | $842,564,376 | | | | $— | | | | $— | | | | $842,564,376 | |
| U.S. Treasury Bonds & U.S. Government Agency & Equivalents | | | — | | | | 203,576,296 | | | | — | | | | 203,576,296 | |
| Non-U.S. Sovereign Debt | | | — | | | | 15,889,017 | | | | — | | | | 15,889,017 | |
| Municipal Bonds | | | — | | | | 2,373,056 | | | | — | | | | 2,373,056 | |
| Corporate Bonds | | | — | | | | 85,810,535 | | | | — | | | | 85,810,535 | |
| Residential Mortgage-Backed Securities | | | — | | | | 187,209,208 | | | | — | | | | 187,209,208 | |
| Commercial Mortgage-Backed Securities | | | — | | | | 27,744,533 | | | | — | | | | 27,744,533 | |
| Asset-Backed Securities (including CDOs) | | | — | | | | 4,893,417 | | | | — | | | | 4,893,417 | |
| Foreign Bonds | | | — | | | | 32,789,193 | | | | — | | | | 32,789,193 | |
| Mutual Funds | | | 9,034,481 | | | | — | | | | — | | | | 9,034,481 | |
| Total Investments | | | $851,598,857 | | | | $560,285,255 | | | | $— | | | | $1,411,884,112 | |
For further information regarding security characteristics, see the Portfolio of Investments.
Foreign Currency Translation – Purchases and sales of foreign investments, income, and expenses are converted into U.S. dollars based upon currency exchange rates prevailing on the respective dates of such transactions or on the reporting date for foreign denominated receivables and payables. Gains and losses attributable to foreign currency exchange rates on sales of securities are recorded for financial statement purposes as net realized gains and losses on investments. Gains and losses attributable to foreign exchange rate movements on receivables, payables, income and expenses are recorded for financial statement purposes as foreign currency transaction gains and losses. That portion of both realized and unrealized gains and losses on investments that results from fluctuations in foreign currency exchange rates is not separately disclosed.
Security Loans – State Street Bank and Trust Company (“State Street”), as lending agent, loans the securities of the fund to certain qualified institutions (the “Borrowers”) approved by the fund. The loans are collateralized by cash and/or U.S. Treasury and federal agency obligations in an amount typically at least equal to the market value of the securities loaned. The market value of the loaned securities is determined at the close of business of the fund and any additional required collateral is delivered to the fund on the next business day. State Street provides the fund with indemnification against Borrower default. The fund bears the risk of loss with respect to the investment of cash collateral. On loans collateralized by cash, the cash collateral is invested in a money market fund or short-term securities. A portion of the income generated upon investment of the collateral is remitted to the Borrowers, and the remainder is allocated between the fund and the lending agent. On loans collateralized by U.S. Treasury and/or federal agency obligations, a fee is received from the Borrower, and is allocated between the fund and the lending agent. Income from securities lending is included in interest income on the Statement of Operations. The dividend and interest income earned on the securities loaned is accounted for in the same manner as other dividend and interest income.
Indemnifications – Under the fund’s organizational documents, its officers and Trustees may be indemnified against certain liabilities and expenses arising out of the performance of their duties to the fund. Additionally, in the normal course of business, the fund enters into agreements with service providers that may contain indemnification clauses. The fund’s maximum exposure under these agreements is unknown as this would involve future claims that may be made against the fund that have not yet occurred.
21
MFS Total Return Portfolio
Notes to Financial Statements – continued
Investment Transactions and Income – Investment transactions are recorded on the trade date. Interest income is recorded on the accrual basis. All premium and discount is amortized or accreted for financial statement purposes in accordance with U.S. generally accepted accounting principles. Dividends received in cash are recorded on the ex-dividend date. Certain dividends from foreign securities will be recorded when the fund is informed of the dividend if such information is obtained subsequent to the ex-dividend date. Dividend and interest payments received in additional securities are recorded on the ex-dividend or ex-interest date in an amount equal to the value of the security on such date.
The fund may receive proceeds from litigation settlements. Any proceeds received from litigation involving portfolio holdings are reflected in the Statement of Operations in realized gain/loss if the security has been disposed of by the fund or in unrealized gain/loss if the security is still held by the fund. Any other proceeds from litigation not related to portfolio holdings are reflected as other income in the Statement of Operations.
The fund entered into “TBA” (to be announced) purchase commitments to purchase securities for a fixed unit price at a future date. Although the unit price has been established, the principal value has not been finalized. However, the principal amount of the commitments will not fluctuate more than 0.01%. The fund holds, and maintains until settlement date, cash or high-grade debt obligations in an amount sufficient to meet the purchase price, or the fund may enter into offsetting contracts for the forward sale of other securities it owns. Income on the securities will not be earned until settlement date. TBA purchase commitments may be considered securities in themselves, and involve a risk of loss if the value of the security to be purchased declines prior to settlement date, which is in addition to the risk of decline in the value of the fund’s other assets. Unsettled TBA purchase commitments are valued at the current market value of the underlying securities.
Fees Paid Indirectly – The fund’s custody fee may be reduced according to an arrangement that measures the value of cash deposited with the custodian by the fund. This amount, for the year ended December 31, 2010, is shown as a reduction of total expenses on the Statement of Operations.
Tax Matters and Distributions – The fund intends to qualify as a regulated investment company, as defined under Subchapter M of the Internal Revenue Code, and to distribute all of its taxable income, including realized capital gains. As a result, no provision for federal income tax is required. The fund’s federal tax returns for the prior three fiscal years remain subject to examination by the Internal Revenue Service. Foreign taxes, if any, have been accrued by the fund in the accompanying financial statements.
Distributions to shareholders are recorded on the ex-dividend date. Income and capital gain distributions are determined in accordance with income tax regulations, which may differ from U.S. generally accepted accounting principles. Certain capital accounts in the financial statements are periodically adjusted for permanent differences in order to reflect their tax character. These adjustments have no impact on net assets or net asset value per share. Temporary differences which arise from recognizing certain items of income, expense, gain or loss in different periods for financial statement and tax purposes will reverse at some time in the future. Distributions in excess of net investment income or net realized gains are temporary overdistributions for financial statement purposes resulting from differences in the recognition or classification of income or distributions for financial statement and tax purposes.
Book/tax differences primarily relate to amortization and accretion of debt securities and wash sale loss deferrals.
The tax character of distributions declared to shareholders for the last two fiscal years is as follows:
| | | | | | | | |
| | | 12/31/10 | | | 12/31/09 | |
| Ordinary income (including any short-term capital gains) | | | $37,470,337 | | | | $48,700,594 | |
The federal tax cost and the tax basis components of distributable earnings were as follows:
| | | | |
| As of 12/31/10 | | | | |
| Cost of investments | | | $1,334,900,105 | |
| Gross appreciation | | | 112,397,674 | |
| Gross depreciation | | | (35,413,667 | ) |
| Net unrealized appreciation (depreciation) | | | $76,984,007 | |
| Undistributed ordinary income | | | 33,159,787 | |
| Capital loss carryforwards | | | (115,492,778 | ) |
| Other temporary differences | | | 8,964 | |
22
MFS Total Return Portfolio
Notes to Financial Statements – continued
As of December 31, 2010, the fund had capital loss carryforwards available to offset future realized gains. Such losses expire as follows:
| | | | |
| 12/31/16 | | | $(99,438,460 | ) |
| 12/31/17 | | | (16,054,318 | ) |
| Total | | | $(115,492,778 | ) |
Multiple Classes of Shares of Beneficial Interest – The fund offers multiple classes of shares, which differ in their respective distribution and/or service fees. The fund’s income, realized and unrealized gain (loss), and common expenses are allocated to shareholders based on the daily net assets of each class. Dividends are declared separately for each class. Differences in per share dividend rates are generally due to differences in separate class expenses. The fund’s distributions declared to shareholders as reported on the Statements of Changes in Net Assets are presented by class as follows:
| | | | | | | | |
| | | From net investment
income | |
| | | Year ended
12/31/10 | | | Year ended
12/31/09 | |
| Initial Class | | | $15,999,098 | | | | $22,536,162 | |
| Service Class | | | 21,471,239 | | | | 26,164,432 | |
| Total | | | $37,470,337 | | | | $48,700,594 | |
| (3) | | Transactions with Affiliates |
Investment Adviser – The fund has an investment advisory agreement with MFS to provide overall investment management and related administrative services and facilities to the fund.
The management fee is computed daily and paid monthly at the following annual rates:
| | | | |
| First $300 million of average daily net assets | | | 0.75% | |
| Next $700 million of average daily net assets | | | 0.675% | |
| Average daily net assets in excess of $1 billion | | | 0.60% | |
The management fee incurred for the year ended December 31, 2010 was equivalent to an annual effective rate of 0.67 % of the fund’s average daily net assets.
The investment adviser has agreed in writing to pay a portion of the fund’s total annual operating expenses, exclusive of interest, taxes, extraordinary expenses, and brokerage commissions, such that total annual fund operating expenses do not exceed 1.25% of the fund’s average daily net assets. MFS’ agreement to limit the fund’s total annual operating expenses is contained in the investment advisory agreement between MFS and the fund and may not be rescinded without shareholder approval. Prior to September 1, 2010, the investment adviser had voluntarily agreed to pay a portion of the fund’s total operating expenses, exclusive of interest, taxes, brokerage commissions and extraordinary expenses, such that the total annual operating expenses do not exceed 1.00% of the fund’s average daily net assets attributable to Initial Class shares. This voluntary agreement terminated on August 31, 2010. For the year ended December 31, 2010, the fund’s actual operating expenses did not exceed the limit and therefore, the investment adviser did not pay a portion of the fund’s expenses.
Effective September 1, 2010, the investment adviser has agreed in writing to pay a portion of the fund’s total annual operating expenses, exclusive of interest, taxes, extraordinary expenses, brokerage and transaction costs and investment related expenses, such that the total annual operating expenses do not exceed 0.74% of average daily net assets for the Initial Class shares and 0.99% of average daily net assets for the Service Class shares. This written agreement will continue until April 30, 2012. For the year ended December 31, 2010, this reduction amounted to $27,978 and is reflected as a reduction of total expenses in the Statement of Operations.
Distributor – MFS Fund Distributors, Inc. (MFD), a wholly-owned subsidiary of MFS, is the distributor of shares of the fund. The Trustees have adopted a distribution plan for the Service Class shares pursuant to Rule 12b-1 under the Investment Company Act of 1940.
The fund’s distribution plan provides that the fund will pay MFD distribution and/or service fees equal to 0.25% per annum of its average daily net assets attributable to Service Class shares as partial consideration for services performed and expenses incurred by MFD and financial intermediaries (including participating insurance companies that invest in the fund to fund variable annuity and variable life insurance contracts, sponsors of qualified retirement and pension plans that invest in the fund, and affiliates of these participating insurance companies and plan sponsors) in connection with the sale and distribution of the Service Class shares. MFD may subsequently pay all, or a portion, of the distribution and/or service fees to financial intermediaries.
23
MFS Total Return Portfolio
Notes to Financial Statements – continued
Shareholder Servicing Agent – MFS Service Center, Inc. (MFSC), a wholly-owned subsidiary of MFS, has contracted to provide transfer agent and recordkeeping functions in connection with the issuance, transfer, and redemption of each class of shares of the fund under a Shareholder Servicing Agent Agreement. During the year ended December 31, 2010, the fund did not pay MFSC a fee for this service.
Administrator – MFS provides certain financial, legal, shareholder communications, compliance, and other administrative services to the fund. Under an administrative services agreement, the fund partially reimburses MFS the costs incurred to provide these services. The fund is charged an annual fixed amount of $10,000 plus a fee based on average daily net assets. The administrative services fee incurred for the year ended December 31, 2010 was equivalent to an annual effective rate of 0.0347% of the fund’s average daily net assets.
Trustees’ and Officers’ Compensation – The fund pays compensation to Trustees in the form of a retainer, attendance fees, and additional compensation to the Board chairperson. The fund does not pay compensation directly to officers of the fund who are also officers of the investment adviser, all of whom receive remuneration for their services to the fund from MFS. Certain officers of the fund are officers or directors of MFS, MFD, and MFSC.
Other – This fund and certain other funds managed by MFS (the funds) have entered into services agreements (the Agreements) which provide for payment of fees by the funds to Tarantino LLC and Griffin Compliance LLC in return for the provision of services of an Independent Chief Compliance Officer (ICCO) and Assistant ICCO, respectively, for the funds. The ICCO and Assistant ICCO are officers of the funds and the sole members of Tarantino LLC and Griffin Compliance LLC, respectively. The funds can terminate the Agreements with Tarantino LLC and Griffin Compliance LLC at any time under the terms of the Agreements. MFS has agreed to bear all expenses associated with office space, other administrative support, and supplies provided to the ICCO and Assistant ICCO. For the year ended December 31, 2010, the aggregate fees paid by the fund to Tarantino LLC and Griffin Compliance LLC were $24,115 and are included in miscellaneous expense on the Statement of Operations.
The fund invests in the MFS Institutional Money Market Portfolio which is managed by MFS and seeks a high level of current income consistent with preservation of capital and liquidity. Income earned on this investment is included in dividends from underlying funds on the Statement of Operations. This money market fund does not pay a management fee to MFS.
Purchases and sales of investments, other than purchased option transactions and short-term obligations, were as follows:
| | | | | | | | |
| | | Purchases | | | Sales | |
| U.S. Government securities | | | $120,186,619 | | | | $171,452,189 | |
| Investments (non-U.S. Government securities) | | | $318,942,662 | | | | $405,745,732 | |
| (5) | | Shares of Beneficial Interest |
The fund’s Declaration of Trust permits the Trustees to issue an unlimited number of full and fractional shares of beneficial interest. Transactions in fund shares were as follows:
| | | | | | | | | | | | | | | | |
| | | Year ended 12/31/10 | | | Year ended 12/31/09 | |
| | | Shares | | | Amount | | | Shares | | | Amount | |
| Shares sold | | | | | | | | | | | | | | | | |
Initial Class | | | 409,999 | | | | $6,469,643 | | | | 672,781 | | | | $9,372,909 | |
Service Class | | | 1,433,031 | | | | 22,334,230 | | | | 5,685,771 | | | | 80,037,857 | |
| | | 1,843,030 | | | | $28,803,873 | | | | 6,358,552 | | | | $89,410,766 | |
| Shares issued to shareholders in reinvestment of distributions | | | | | | | | | | | | | | | | |
Initial Class | | | 993,116 | | | | $15,999,098 | | | | 1,742,936 | | | | $22,536,162 | |
Service Class | | | 1,343,632 | | | | 21,471,239 | | | | 2,037,728 | | | | 26,164,432 | |
| | | 2,336,748 | | | | $37,470,337 | | | | 3,780,664 | | | | $48,700,594 | |
| Shares reacquired | | | | | | | | | | | | | | | | |
Initial Class | | | (5,903,250 | ) | | | $(93,426,169 | ) | | | (7,567,033 | ) | | | $(104,697,805 | ) |
Service Class | | | (7,737,752 | ) | | | (121,890,645 | ) | | | (4,338,223 | ) | | | (59,929,941 | ) |
| | | (13,641,002 | ) | | | $(215,316,814 | ) | | | (11,905,256 | ) | | | $(164,627,746 | ) |
| Net change | | | | | | | | | | | | | | | | |
Initial Class | | | (4,500,135 | ) | | | $(70,957,428 | ) | | | (5,151,316 | ) | | | $(72,788,734 | ) |
Service Class | | | (4,961,089 | ) | | | (78,085,176 | ) | | | 3,385,276 | | | | 46,272,348 | |
| | | (9,461,224 | ) | | | $(149,042,604 | ) | | | (1,766,040 | ) | | | $(26,516,386 | ) |
24
MFS Total Return Portfolio
Notes to Financial Statements – continued
The fund and certain other funds managed by MFS participate in a $1.1 billion unsecured committed line of credit, subject to a $1 billion sublimit, provided by a syndication of banks under a credit agreement. Borrowings may be made for temporary financing needs. Interest is charged to each fund, based on its borrowings, generally at a rate equal to the higher of the Federal Reserve funds rate or one month LIBOR plus an agreed upon spread. A commitment fee, based on the average daily, unused portion of the committed line of credit, is allocated among the participating funds at the end of each calendar quarter. In addition, the fund and other funds managed by MFS have established unsecured uncommitted borrowing arrangements with certain banks for temporary financing needs. Interest is charged to each fund, based on its borrowings, at a rate equal to the Federal Reserve funds rate plus an agreed upon spread. For the year ended December 31, 2010, the fund’s commitment fee and interest expense were $15,883 and $0, respectively, and are included in miscellaneous expense on the Statement of Operations.
| (7) | | Transactions in Underlying Funds – Affiliated Issuers |
An affiliated issuer may be considered one in which the fund owns 5% or more of the outstanding voting securities, or a company which is under common control. For the purposes of this report, the fund assumes the following to be affiliated issuers:
| | | | | | | | | | | | | | | | |
| Underlying Funds | | Beginning
Shares/Par
Amount | | | Acquisitions
Shares/Par
Amount | | | Dispositions
Shares/Par
Amount | | | Ending
Shares/Par
Amount | |
| MFS Institutional Money Market Portfolio | | | 17,588,859 | | | | 283,796,098 | | | | (292,350,476 | ) | | | 9,034,481 | |
| | | | |
| Underlying Funds | | Realized
Gain (Loss) | | | Capital Gain
Distributions | | | Dividend
Income | | | Ending
Value | |
| MFS Institutional Money Market Portfolio | | | $— | | | | $— | | | | $30,719 | | | | $9,034,481 | |
25
MFS Total Return Portfolio
REPORT OF INDEPENDENT REGISTERED PUBLIC ACCOUNTING FIRM
To the Board of Trustees of MFS Variable Insurance Trust II and the Shareholders of
MFS Total Return Portfolio:
We have audited the accompanying statement of assets and liabilities, including the portfolio of investments, of MFS Total Return Portfolio (the “Fund”) (one of the portfolios comprising MFS Variable Insurance Trust II) as of December 31, 2010, and the related statement of operations for the year then ended, the statements of changes in net assets for each of the two years in the period then ended, and the financial highlights for each of the five years in the period then ended. These financial statements and financial highlights are the responsibility of the Fund’s management. Our responsibility is to express an opinion on these financial statements and financial highlights based on our audits.
We conducted our audits in accordance with the standards of the Public Company Accounting Oversight Board (United States). Those standards require that we plan and perform the audit to obtain reasonable assurance about whether the financial statements and financial highlights are free of material misstatement. The Fund is not required to have, nor were we engaged to perform, an audit of its internal control over financial reporting. Our audits included consideration of internal control over financial reporting as a basis for designing audit procedures that are appropriate in the circumstances, but not for the purpose of expressing an opinion on the effectiveness of the Fund’s internal control over financial reporting. Accordingly, we express no such opinion. An audit also includes examining, on a test basis, evidence supporting the amounts and disclosures in the financial statements, assessing the accounting principles used and significant estimates made by management, as well as evaluating the overall financial statement presentation. Our procedures included confirmation of securities owned as of December 31, 2010, by correspondence with the custodian and brokers; where replies were not received from brokers, we performed other auditing procedures. We believe that our audits provide a reasonable basis for our opinion.
In our opinion, such financial statements and financial highlights present fairly, in all material respects, the financial position of MFS Total Return Portfolio as of December 31, 2010, the results of its operations for the year then ended, the changes in its net assets for each of the two years in the period then ended, and the financial highlights for each of the five years in the period then ended, in conformity with accounting principles generally accepted in the United States of America.
DELOITTE & TOUCHE LLP
Boston, Massachusetts
February 14, 2011
26
MFS Total Return Portfolio
TRUSTEES AND OFFICERS – IDENTIFICATION AND BACKGROUND
The Trustees and officers of the Trust, as of February 1, 2011, are listed below, together with their principal occupations during the past five years. (Their titles may have varied during that period.) The address of each Trustee and officer is 500 Boylston Street, Boston, Massachusetts 02116.
| | | | | | |
Name, Date of Birth | | Position(s) Held
with Fund | | Trustee/Officer
Since (1) | | Principal Occupations During the Past Five Years and
Other Directorships (2) |
| INTERESTED TRUSTEE | | | | |
David D. Horn (3) (born 6/07/41) | | Trustee | | April 1986 | | Private investor; Sun Life Assurance Company of Canada, Senior Vice President and General Manager for the United States (until 1997); Director (until March 2004) |
| | |
| INDEPENDENT TRUSTEES | | | | |
J. Kermit Birchfield (born 1/08/40) | | Chairman | | May 1997 | | Consultant; Century Partners, Inc. (investments), Director; Displaytech, Inc. (technology), Chairman; Dessin Fournir LLC (furniture manufacturer), Director; Site Watch LLC (software to monitor oil tanks), Managing Director (2006 to present); Juridica Investments (fund investing in judicial matters), Director (2007 to present), Immuno Science, Inc. (medical research), Independent Director (2009 to present), Intermountain Industries, Inc. (oil & gas exploration and production), Director (until February 2009) |
| | | |
Robert C. Bishop (born 1/13/43) | | Trustee | | May 2001 | | AutoImmune, Inc. (pharmaceutical product development), Chairman, President and Chief Executive Officer; Caliper Life Sciences Corp. (laboratory analytical instruments), Chairman; Optobionics Corporation (ophthalmic devices), Director (until 2007); Millipore Corporation (purification/filtration products), Director (until July 2010); Waterstreet Capital (leverage buyouts), Advisory Board (until August 2010) |
| | | |
Frederick H. Dulles (born 3/12/42) | | Trustee | | May 2001 | | Dulles International Law LLC (law firm), Senior Lawyer (since 2009); Juridica Capital Management (US) Inc. (litigation financing), Vice President and General Counsel (since 2009); Dulles Properties LLC (real estate), Broker (since 2008); The Citadel School of Business Administration (education), Adjunct Professor (since 2003); Disher, Hamrick & Myers Residential, Inc. (real estate), Broker (until 2006); Frederick H. Dulles Law Practice (law firm), (until 2006); Charlestown School of Law (education), Adjunct Professor (until 2007); Prudential Carolina Real Estate, (real estate), Broker (until 2008); Free Enterprise Foundation Inc. (research institute), Director & Secretary (until 2008); Ten State International Law PLLP (law firm), Of Counsel (until 2009) |
| | | |
Marcia A. Kean (born 6/30/48) | | Trustee | | April 2005 | | Feinstein Kean Healthcare (consulting), Chief Executive Officer |
| | | |
Ronald G. Steinhart (born 6/15/40) | | Trustee | | May 2001 | | Private investor; Penske Automotive Group (automotive retailer), Director; Animal Health International, Inc. (animal health products), Director (since 2007); Texas Industries (concrete/aggregates/cement), Director (since 2007); Susser Holdings Corporation (retail convenience stores and distributor of wholesale motor fuel), Director (since 2009); Prentiss Properties Trust (real estate investment trust), Director (until 2006); Penson Worldwide, Inc. (securities clearance), Director (until 2008) |
| | | |
Haviland Wright (born 7/21/48) | | Trustee | | May 2001 | | X-Change Corp. (multi-media web services), Director (since 2010); Nano Loa Inc. (liquid crystal displays), Director (until 2009); Profitability of Hawaii (software), Chief Development Officer (until 2010); Elixir Technologies Corporation (software), Director (until 2010) |
| | | |
| OFFICERS | | | | | | |
Maria F. DiOrioDwyer (4)
(born 12/01/58) | | President | | November 2005 | | Massachusetts Financial Services Company, Executive Vice President and Chief Regulatory Officer; Chief Compliance Officer (since December 2006) |
| | | |
| Christopher R. Bohane (4) (born 1/18/74) | | Assistant Secretary and Assistant Clerk | | July 2005 | | Massachusetts Financial Services Company, Vice President and Senior Counsel |
| | | |
John M. Corcoran (4) (born 4/13/65) | | Treasurer | | October 2008 | | Massachusetts Financial Services Company, Senior Vice President (since October 2008); State Street Bank and Trust (financial services provider), Senior Vice President, (until September 2008) |
| | | |
Ethan D. Corey (4) (born 11/21/63) | | Assistant Secretary and Assistant Clerk | | July 2005 | | Massachusetts Financial Services Company, Senior Vice President and Associate General Counsel |
| | | |
David L. DiLorenzo (4) (born 8/10/68) | | Assistant Treasurer | | July 2005 | | Massachusetts Financial Services Company, Vice President |
| | | |
Timothy M. Fagan (4) (born 7/10/68) | | Assistant Secretary and Assistant Clerk | | September 2005 | | Massachusetts Financial Services Company, Vice President and Senior Counsel |
| | | |
Mark D. Fischer (4) (born 10/27/70) | | Assistant Treasurer | | July 2005 | | Massachusetts Financial Services Company, Vice President |
27
MFS Total Return Portfolio
Trustees and Officers – continued
| | | | | | |
Name, Date of Birth | | Position(s) Held
with Fund | | Trustee/Officer
Since (1) | | Principal Occupations During the Past Five Years and
Other Directorships (2) |
Robyn L. Griffin (born 7/04/75) | | Assistant Independent Chief Compliance Officer | | August 2008 | | Griffin Compliance LLC (provider of compliance services), Principal (since August 2008); State Street Corporation (financial services provider), Mutual Fund Administration Assistant Vice President (October 2006 – July 2008); Liberty Mutual Group (insurance), Personal Market Assistant Controller (April 2006 – October 2006); Deloitte & Touche LLP (professional services firm), Senior Manager (prior to April 2006) |
| | | |
Brian E. Langenfeld (4) (born 3/07/73) | | Assistant Secretary and Assistant Clerk | | May 2006 | | Massachusetts Financial Services Company, Vice President and Senior Counsel (since May 2006); John Hancock Advisers, LLC, Assistant Vice President and Counsel (until April 2006) |
| | | |
Ellen Moynihan (4) (born 11/13/57) | | Assistant Treasurer | | May 1997 | | Massachusetts Financial Services Company, Senior Vice President |
| | | |
Susan S. Newton (4) (born 3/07/50) | | Assistant Secretary and Assistant Clerk | | May 2005 | | Massachusetts Financial Services Company, Senior Vice President and Associate General Counsel |
| | | |
Susan A. Pereira (4)
(born 11/05/70) | | Assistant Secretary and Assistant Clerk | | July 2005 | | Massachusetts Financial Services Company, Vice President and Senior Counsel |
| | | |
Mark N. Polebaum (4) (born 5/01/52) | | Secretary and Clerk | | February 2006 | | Massachusetts Financial Services Company, Executive Vice President, General Counsel and Secretary (since January 2006); Wilmer Cutler Pickering Hale and Dorr LLP (law firm), Partner (until January 2006) |
| | | |
Frank L. Tarantino (born 3/07/44) | | Independent Chief Compliance Officer | | September 2004 | | Tarantino LLC (provider of compliance services), Principal |
| | | |
Richard S. Weitzel (4) (born 7/16/70) | | Assistant Secretary and Assistant Clerk | | October 2007 | | Massachusetts Financial Services Company, Vice President and Assistant General Counsel |
| | | |
James O. Yost (4) (born 6/12/60) | | Assistant Treasurer | | April 1992 | | Massachusetts Financial Services Company, Senior Vice President |
| (1) | Date first appointed to serve as Trustee/Officer of an MFS fund or a Compass variable account. Each Trustee has served continuously since appointment. For the period March 2008 until October 2008, Ms. DiOrioDwyer served as Treasurer of the Funds. |
| (2) | Directorships or trusteeships of companies required to report to the Securities and Exchange Commission (i.e., “public companies”). |
| (3) | “Interested person” of the Trust, within the meaning of the Investment Company Act of 1940 (referred to as the 1940 Act), which is the principal federal law governing investment companies like the Trust, as a result of position with Sun Life of Canada (U.S.). The address of Sun Life of Canada (U.S.) is One Sun Life Executive Park, Wellesley Hills, Massachusetts 02481. |
| (4) | “Interested person” of MFS within the meaning of the 1940 Act. The address of MFS is 500 Boylston Street, Boston, Massachusetts 02116. |
The Trust does not hold annual meetings for the purpose of electing Trustees, and Trustees are not elected for fixed terms. Each Trustee and officer holds office until his or her successor is chosen and qualified, or until his or her earlier death, resignation, retirement or removal.
All Trustees currently serve as Trustees of the Trust and have served in that capacity since originally elected or appointed. All of the Trustees are also Managers of the Compass Variable Accounts. The executive officers of the Trust hold similar offices for the Compass Variable Accounts and other funds in the MFS fund complex. As of January 1, 2011, each Trustee serves as a Trustee or Manager of 31 Accounts/Portfolios.
28
MFS Total Return Portfolio
Trustees and Officers – continued
The Statement of Additional Information contains further information about the Trustees and is available without charge upon request by calling 1-800-752-7215.
| | |
Investment Adviser
Massachusetts Financial Services Company 500 Boylston Street, Boston, MA 02116-3741 | | Custodian State Street Bank and Trust 1 Lincoln Street, Boston, MA 02111-2900 |
Distributor
MFS Fund Distributors, Inc. 500 Boylston Street, Boston, MA 02116-3741 | | Independent Registered Public Accounting Firm Deloitte & Touche LLP 200 Berkeley Street, Boston, MA 02116 |
Portfolio Managers Nevin Chitkara William Douglas Steven Gorham Richard Hawkins Joshua Marston Michael Roberge Brooks Taylor | | |
29
MFS Total Return Portfolio
BOARD REVIEW OF INVESTMENT ADVISORY AGREEMENT
The Investment Company Act of 1940 requires that both the full Board of Trustees and a majority of the non-interested (“independent”) Trustees, voting separately, annually approve the continuation of the investment advisory agreement between MFS Variable Insurance Trust II (the “Trust”) and Massachusetts Financial Services Company (“MFS”) on behalf of the Fund. The Trustees consider matters bearing on the Fund and the advisory arrangement at their meetings throughout the year, including a review of performance data at each regular meeting. In addition, the independent Trustees met in person in May and again in July 2010 (“contract review meetings”) for the specific purpose of considering whether to approve the continuation of the investment advisory agreement for the Fund. The independent Trustees were assisted in their evaluation of the investment advisory agreement by independent legal counsel, from whom they received separate legal advice and with whom they met separately from MFS management during various contract review meetings. The independent Trustees were also assisted in this process by the Fund’s Independent Chief Compliance Officer, a full-time senior officer appointed by and reporting to the independent Trustees.
In connection with their deliberations, the Trustees, including the independent Trustees, considered such information and factors as they believed, in light of the legal advice furnished to them and their own business judgment, to be relevant. The investment advisory agreement was considered separately for the Fund, although the Trustees also took into account the common interests of all Funds in the Trust in their review. As described below, the Trustees considered the nature, quality, and extent of the various investment advisory, administrative, and shareholder services performed by MFS under the existing investment advisory agreement and other arrangements with the Trust.
In connection with their contract review meetings, the Trustees received and relied upon materials which included, among other items: (i) information provided by Lipper Inc. (“Lipper”) on the investment performance of the Fund for various time periods ended December 31, 2009, compared to the investment performance of a group of funds with substantially similar investment classifications/objectives (the “Lipper performance universe”), (ii) information provided by Lipper on the Fund’s advisory fees and other expenses compared to the advisory fees and other expenses of comparable funds identified by Lipper (the “Lipper expense group”), (iii) information provided by MFS on the advisory fees of comparable portfolios of its other clients, including institutional separate account and other clients, (iv) information as to whether, and to what extent applicable, expense waivers, reimbursements or fee “breakpoints” are observed for the Fund, (v) information regarding MFS’ financial results and financial condition, including MFS’ and certain of its affiliates’ estimated profitability from services performed for the Fund, (vi) MFS’ views regarding the outlook for the mutual fund industry and its strategic business plans, (vii) descriptions of various functions performed by MFS for the Trust, such as compliance monitoring and portfolio trading practices, and (viii) information regarding the overall organization of MFS, including information about MFS’ senior management and other personnel providing investment advisory, administrative and other services to the Fund. The comparative performance, fee and expense information prepared and provided by Lipper was not independently verified, and the independent Trustees did not independently verify any information provided to them by MFS.
The Trustees’ conclusion as to the continuation of the investment advisory agreement was based on comprehensive consideration of all information provided to the Trustees and was not the result of any single factor. Some of the factors that figured particularly in the Trustees’ deliberations are described below for the Fund, while individual Trustees may have given different weight to various factors and evaluated the information presented as a whole differently than another individual Trustee. The Trustees recognized that the fee arrangements for the Fund reflect years of review and discussion between the independent Trustees and MFS, that certain aspects of such arrangements may receive greater scrutiny in some years than others, and that the Trustees’ conclusions may be based, in part, on their consideration of these same arrangements during the course of the year and in prior years.
Based on information provided by Lipper, the Trustees compared the Fund’s total return investment performance to the performance of the Lipper performance universe over various time periods. The Trustees placed particular emphasis on the total return performance of the Fund’s Initial Class shares in comparison to the performance of funds in its Lipper performance universe over the one-, three- and five-year periods ended December 31, 2009. The Trustees did not rely on performance results for more recent periods, including those shown elsewhere in this report.
The Trustees noted the performance of the Fund’s Initial Class shares was in the 5th quintile relative to the other funds in the Lipper performance universe for the one-year period (the 1st quintile being the best performers and the 5th quintile being the worst performers). The total return performance of the Fund was in the 3rd quintile for the three-year period and in the 4th quintile for the five-year period ended December 31, 2009, relative to the Lipper performance universe. Based on the nature and quality of services provided by MFS, the Board of Trustees concluded that the Fund’s performance was adequate.
30
MFS Total Return Portfolio
Board Review of Investment Advisory Agreement – continued
In the course of their deliberations, the Trustees took into account information provided by MFS during contract review meetings, as well as during investment review meetings conducted with portfolio management personnel during the course of the year.
In assessing the reasonableness of the Fund’s advisory fee, the Trustees considered, among other information, the Fund’s advisory fee and the total expense ratio of the Fund’s Initial Class shares as a percentage of average daily net assets, compared to the advisory fee and total expense ratios of its peer group of funds based on information provided by Lipper. The Trustees also considered the advisory fees charged by MFS to institutional accounts. In comparing these fees, the Trustees considered the generally broader scope of services provided by MFS to the Trust than those provided to institutional accounts. The Trustees also considered the higher demands placed on MFS’ investment personnel and trading infrastructure as a result of the daily cash in-flows and out-flows of the Fund, and the impact on MFS and related expenses due to the more extensive regulatory regime to which the Fund is subject, compared to institutional accounts.
In considering the fees, the Trustees noted from the Lipper data that the Fund’s effective advisory fee rate and total expense ratio were each above the median of such fees and expenses of funds in the Lipper expense group. In addition, the Trustees accepted MFS’ offer to reduce the expense limitation for the Fund through December 31, 2011. The Trustees further concluded that the existing breakpoints were sufficient to allow the Fund to benefit from economies of scale as its assets grow. The Trustees concluded that the fees were reasonable in light of the nature and quality of services provided.
The Trustees also considered information prepared by MFS relating to its costs and profits with respect to the Fund and other investment companies and accounts advised by MFS, as well as MFS’ methodologies used to determine and allocate its costs to the Fund and other accounts and products for purposes of estimating profitability.
After reviewing these and other factors described below, the Trustees concluded that the advisory fees charged to the Fund represent reasonable compensation in light of the nature and quality of the services being provided by MFS.
In addition, the Trustees considered MFS’ resources and related efforts to continue to retain, attract and motivate capable personnel to serve the Fund. The Trustees also considered the financial resources of MFS and its parent, Sun Life Financial Inc. The Trustees further considered any advantages and possible disadvantages of having an adviser which also serves other investment companies as well as institutional accounts.
The Trustees also considered the nature, quality, cost, and extent of administrative, transfer agency, and distribution services provided to the Fund by MFS and its affiliates under agreements and plans other than the investment advisory agreement, including the 12b-1 fees the Fund pays to MFS Fund Distributors, Inc., an affiliate of MFS. The Trustees also considered the nature, extent and quality of certain other services MFS performs or arranges on the Fund’s behalf, which may include securities lending programs, directed expense payment programs, class action recovery programs, and MFS’ interaction with third-party service providers, principally custodians and sub-custodians. The Trustees concluded that the various non-advisory services provided by MFS and its affiliates on behalf of the Fund were satisfactory. The Trustees also considered the benefits to MFS from the use of the Fund’s portfolio brokerage commissions to pay for investment research and various other factors. Additionally, the Trustees considered so-called “fall-out benefits” to MFS such as reputational value derived from serving as investment manager to the Trust, and determined that any such benefits derived by MFS were reasonable and fair.
Based on their evaluation of factors that they deemed to be material, including those factors described above, the Board of Trustees, including a majority of the independent Trustees, concluded that the investment advisory agreement should be continued for an additional one-year period, commencing September 1, 2010.
A discussion regarding the Board’s most recent review and renewal of the fund’s Investment Advisory Agreement with MFS is available by clicking on the fund’s name under “Variable Insurance Portfolios — VIT II” in the “Products and Performance” section of the MFS Web site (mfs.com).
31
MFS Total Return Portfolio
PROXY VOTING POLICIES AND INFORMATION
A general description of the MFS funds’ proxy voting policies and procedures is available without charge, upon request, by calling
1-800-225-2606, by visiting the Proxy Voting section of mfs.com or by visiting the SEC’s Web site at http://www.sec.gov.
Information regarding how the fund voted proxies relating to portfolio securities during the most recent twelve-month period ended June 30 is available without charge by visiting the Proxy Voting section of mfs.com or by visiting the SEC’s Web site at http://www.sec.gov.
QUARTERLY PORTFOLIO DISCLOSURE
The fund will file a complete schedule of portfolio holdings with the Securities and Exchange Commission (the Commission) for the first and third quarters of each fiscal year on Form N-Q. The fund’s Form N-Q may be reviewed and copied at the:
Public Reference Room
Securities and Exchange Commission
100 F Street, NE, Room 1580
Washington, D.C. 20549
Information on the operation of the Public Reference Room may be obtained by calling the Commission at 1-800-SEC-0330. The fund’s Form N-Q is available on the EDGAR database on the Commission’s Internet Web site at http://www.sec.gov, and copies of this information may be obtained, upon payment of a duplicating fee, by electronic request at the following e-mail address: publicinfo@sec.gov or by writing the Public Reference Section at the above address.
FURTHER INFORMATION
From time to time, MFS may post important information about the fund or the MFS funds on the MFS web site (mfs.com). This information is available by visiting the “News & Commentary” section of mfs.com or by clicking on the fund’s name under “Variable Insurance Portfolios — VIT II” in the “Products and Performance” section of mfs.com.
FEDERAL TAX INFORMATION (unaudited)
The following information is provided pursuant to provisions of the Internal Revenue Code.
For corporate shareholders, 50.74% of the ordinary income dividends paid during the fiscal year qualify for the corporate dividends received deduction.
32
MFS Total Return Portfolio
MFS® PRIVACY NOTICE
Privacy is a concern for every investor today. At MFS Investment Management® and the MFS funds, we take this concern very seriously. We want you to understand our policies about the investment products and services that we offer, and how we protect the nonpublic personal information of investors who have a direct relationship with us and our wholly owned subsidiaries.
Throughout our business relationship, you provide us with personal information. We maintain information and records about you, your investments, and the services you use. Examples of the nonpublic personal information we maintain include
| | Ÿ | | data from investment applications and other forms |
| | Ÿ | | share balances and transactional history with us, our affiliates, or others |
| | Ÿ | | facts from a consumer reporting agency |
We do not disclose any nonpublic personal information about our customers or former customers to anyone, except as permitted by law. We may share nonpublic personal information with third parties or certain of our affiliates in connection with servicing your account or processing your transactions. We may share information with companies or financial institutions that perform marketing services on our behalf or with other financial institutions with which we have joint marketing arrangements, subject to any legal requirements.
Authorization to access your nonpublic personal information is limited to appropriate personnel who provide products, services, or information to you. We maintain physical, electronic, and procedural safeguards to help protect the personal information we collect about you.
If you have any questions about the MFS privacy policy, please call 1-800-225-2606 any business day.
Note: If you own MFS products or receive MFS services in the name of a third party such as a bank or broker-dealer, their privacy policy may apply to you instead of ours.
33

The Registrant has adopted a Code of Ethics pursuant to Section 406 of the Sarbanes-Oxley Act and as defined in Form N-CSR that applies to the Registrant’s principal executive officer and principal financial and accounting officer. During the period covered by this report, the Registrant has not amended any provision in its Code of Ethics (the “Code”) that relates to an element of the Code’s definitions enumerated in paragraph (b) of Item 2 of this Form N-CSR. During the period covered by this report, the Registrant did not grant a waiver, including an implicit waiver, from any provision of the Code.
A copy of the Code of Ethics is filed as an exhibit to this Form N-CSR.
| ITEM 3. | AUDIT COMMITTEE FINANCIAL EXPERT. |
Messrs. J. Kermit Birchfield, Robert C. Bishop, and Haviland Wright, members of the Audit Committee, have been determined by the Board of Trustees in their reasonable business judgment to meet the definition of “audit committee financial expert” as such term is defined in Form N-CSR. In addition, Messrs. J. Kermit Birchfield, Robert C. Bishop, and Haviland Wright are “independent” members of the Audit Committee as defined in Form N-CSR.
| ITEM 4. | PRINCIPAL ACCOUNTANT FEES AND SERVICES. |
Items 4(a) through 4(d) and 4(g):
The Board of Trustees has appointed Deloitte & Touche LLP (“Deloitte”) to serve as independent accountants to each series of the Registrant (collectively, the “Funds”). The tables below set forth the audit fees billed to the Funds as well as fees for non-audit services provided to the Funds and/or to the Funds’ investment adviser, Massachusetts Financial Services Company (“MFS”) and to various entities either controlling, controlled by, or under common control with MFS that provide ongoing services to the Funds (“MFS Related Entities”).
For the fiscal years ended December 31, 2010 and 2009, audit fees billed to the Funds by Deloitte were as follows:
| | | | | | | | |
| | | Audit Fees | |
| | | 2010 | | | 2009 | |
Fees billed by Deloitte: | | | | | | | | |
MFS Blended Research Core Equity Portfolio | | | 39,056 | | | | 40,270 | |
MFS Blended Research Growth Portfolio | | | 37,152 | | | | 38,403 | |
MFS Blended Research Value Portfolio | | | 37,152 | | | | 38,403 | |
MFS Bond Portfolio | | | 53,979 | | | | 52,937 | |
| | | | | | | | |
MFS Core Equity Portfolio | | | 40,564 | | | | 39,785 | |
MFS Growth Portfolio | | | 39,309 | | | | 38,554 | |
MFS Emerging Markets Equity Portfolio | | | 41,149 | | | | 42,322 | |
MFS Global Governments Portfolio | | | 51,868 | | | | 50,867 | |
MFS Global Growth Portfolio | | | 50,221 | | | | 51,216 | |
MFS Global Tactical Allocation Portfolio | | | 50,221 | | | | 51,216 | |
MFS Government Securities Portfolio | | | 44,193 | | | | 43,343 | |
MFS High Yield Portfolio | | | 57,092 | | | | 55,989 | |
MFS International Growth Portfolio | | | 41,149 | | | | 42,322 | |
MFS International Value Portfolio | | | 41,847 | | | | 43,006 | |
MFS Massachusetts Investors Growth Stock Portfolio | | | 40,564 | | | | 39,785 | |
MFS Mid Cap Growth Portfolio | | | 38,611 | | | | 37,870 | |
MFS Money Market Portfolio | | | 23,958 | | | | 23,504 | |
MFS New Discovery Portfolio | | | 38,611 | | | | 37,870 | |
MFS Research International Portfolio | | | 39,056 | | | | 40,270 | |
MFS Global Research Portfolio | | | 39,754 | | | | 40,954 | |
MFS Strategic Income Portfolio | | | 56,855 | | | | 55,756 | |
MFS Technology Portfolio | | | 39,056 | | | | 40,270 | |
MFS Total Return Portfolio | | | 51,868 | | | | 50,867 | |
MFS Utilities Portfolio | | | 38,611 | | | | 37,870 | |
MFS Value Portfolio | | | 38,611 | | | | 37,870 | |
Total | | | 1,070,507 | | | | 1,071,519 | |
For the fiscal years ended December 31, 2010 and 2009, fees billed by Deloitte for audit-related, tax and other services provided to the Funds and for audit-related, tax and other services provided to MFS and MFS Related Entities were as follows:
| | | | | | | | | | | | | | | | | | | | | | | | |
| | | Audit-Related Fees1 | | | Tax Fees2 | | | All Other Fees3 | |
| | | 2010 | | | 2009 | | | 2010 | | | 2009 | | | 2010 | | | 2009 | |
Fees billed by Deloitte: | | | | | | | | | | | | | | | | | | | | | | | | |
To MFS Blended Research Core Equity Portfolio | | | 0 | | | | 0 | | | | 4,362 | | | | 4,276 | | | | 1,376 | | | | 1,166 | |
To MFS Blended Research Growth Portfolio | | | 0 | | | | 0 | | | | 5,051 | | | | 4,952 | | | | 1,376 | | | | 1,166 | |
To MFS Blended Research Value Portfolio | | | 0 | | | | 0 | | | | 5,051 | | | | 4,952 | | | | 1,376 | | | | 1,166 | |
To MFS Bond Portfolio | | | 0 | | | | 0 | | | | 4,362 | | | | 4,276 | | | | 1,376 | | | | 1,166 | |
To MFS Core Equity Portfolio | | | 0 | | | | 0 | | | | 4,362 | | | | 4,276 | | | | 1,376 | | | | 1,166 | |
| | | | | | | | | | | | | | | | | | | | | | | | |
To MFS Growth Portfolio | | | 0 | | | | 0 | | | | 4,362 | | | | 4,276 | | | | 1,376 | | | | 1,166 | |
To MFS Emerging Markets Equity Portfolio | | | 0 | | | | 0 | | | | 4,362 | | | | 4,276 | | | | 1,376 | | | | 1,166 | |
To MFS Global Governments Portfolio | | | 0 | | | | 0 | | | | 4,362 | | | | 4,276 | | | | 1,376 | | | | 1,166 | |
To MFS Global Growth Portfolio | | | 0 | | | | 0 | | | | 4,362 | | | | 4,276 | | | | 1,376 | | | | 1,166 | |
To MFS Global Tactical Allocation Portfolio | | | 0 | | | | 0 | | | | 4,362 | | | | 4,276 | | | | 1,376 | | | | 1,166 | |
To MFS Government Securities Portfolio | | | 0 | | | | 0 | | | | 4,362 | | | | 4,276 | | | | 1,376 | | | | 1,166 | |
To MFS High Yield Portfolio | | | 0 | | | | 0 | | | | 4,362 | | | | 4,276 | | | | 1,376 | | | | 1,166 | |
To MFS International Growth Portfolio | | | 0 | | | | 0 | | | | 4,362 | | | | 4,276 | | | | 1,376 | | | | 1,166 | |
To MFS International Value Portfolio | | | 0 | | | | 0 | | | | 4,362 | | | | 4,276 | | | | 1,376 | | | | 1,166 | |
To MFS Massachusetts Investors Growth Stock Portfolio | | | 0 | | | | 0 | | | | 4,362 | | | | 4,276 | | | | 1,376 | | | | 1,166 | |
To MFS Mid Cap Growth Portfolio | | | 0 | | | | 0 | | | | 4,362 | | | | 4,276 | | | | 1,376 | | | | 1,166 | |
To MFS Money Market Portfolio | | | 0 | | | | 0 | | | | 4,362 | | | | 4,276 | | | | 1,376 | | | | 1,166 | |
To MFS New Discovery Portfolio | | | 0 | | | | 0 | | | | 4,362 | | | | 4,276 | | | | 1,376 | | | | 1,166 | |
To MFS Research International Portfolio | | | 0 | | | | 0 | | | | 4,362 | | | | 4,276 | | | | 1,376 | | | | 1,166 | |
To MFS Global Research Portfolio | | | 0 | | | | 0 | | | | 4,362 | | | | 4,276 | | | | 1,376 | | | | 1,166 | |
To MFS Strategic Income Portfolio | | | 0 | | | | 0 | | | | 4,362 | | | | 4,276 | | | | 1,376 | | | | 1,166 | |
To MFS Technology Portfolio | | | 0 | | | | 0 | | | | 4,362 | | | | 4,276 | | | | 1,376 | | | | 1,166 | |
To MFS Total Return Portfolio | | | 0 | | | | 0 | | | | 4,362 | | | | 4,276 | | | | 1,376 | | | | 1,166 | |
To MFS Utilities Portfolio | | | 0 | | | | 0 | | | | 4,362 | | | | 4,276 | | | | 1,376 | | | | 1,166 | |
To MFS Value Portfolio | | | 0 | | | | 0 | | | | 4,362 | | | | 4,276 | | | | 1,376 | | | | 1,166 | |
Total fees billed by Deloitte To above Funds: | | | 0 | | | | 0 | | | | 110,428 | | | | 108,252 | | | | 34,400 | | | | 29,150 | |
To MFS and MFS Related Entities of MFS Blended Research Core Equity Portfolio* | | | 1,241,490 | | | | 1,061,841 | | | | 0 | | | | 0 | | | | 60,000 | | | | 59,174 | |
To MFS and MFS Related Entities of MFS Blended Research Growth Portfolio* | | | 1,241,490 | | | | 1,061,841 | | | | 0 | | | | 0 | | | | 60,000 | | | | 59,174 | |
| | | | | | | | | | | | | | | | | | | | | | | | |
To MFS and MFS Related Entities of MFS Blended Research Value Portfolio* | | | 1,241,490 | | | | 1,061,841 | | | | 0 | | | | 0 | | | | 60,000 | | | | 59,174 | |
To MFS and MFS Related Entities of MFS Bond Portfolio* | | | 1,241,490 | | | | 1,061,841 | | | | 0 | | | | 0 | | | | 60,000 | | | | 59,174 | |
To MFS and MFS Related Entities of MFS Core Equity Portfolio* | | | 1,241,490 | | | | 1,061,841 | | | | 0 | | | | 0 | | | | 60,000 | | | | 59,174 | |
To MFS and MFS Related Entities of MFS Growth Portfolio* | | | 1,241,490 | | | | 1,061,841 | | | | 0 | | | | 0 | | | | 60,000 | | | | 59,174 | |
To MFS and MFS Related Entities of MFS Emerging Markets Equity Portfolio* | | | 1,241,490 | | | | 1,061,841 | | | | 0 | | | | 0 | | | | 60,000 | | | | 59,174 | |
To MFS and MFS Related Entities of MFS Global Governments Portfolio* | | | 1,241,490 | | | | 1,061,841 | | | | 0 | | | | 0 | | | | 60,000 | | | | 59,174 | |
To MFS and MFS Related Entities of MFS Global Growth Portfolio* | | | 1,241,490 | | | | 1,061,841 | | | | 0 | | | | 0 | | | | 60,000 | | | | 59,174 | |
To MFS and MFS Related Entities of MFS Global Tactical Allocation Portfolio# | | | 1,241,490 | | | | 1,061,841 | | | | 0 | | | | 0 | | | | 60,000 | | | | 59,174 | |
To MFS and MFS Related Entities of MFS Government Securities Portfolio* | | | 1,241,490 | | | | 1,061,841 | | | | 0 | | | | 0 | | | | 60,000 | | | | 59,174 | |
To MFS and MFS Related Entities of MFS High Yield Portfolio* | | | 1,241,490 | | | | 1,061,841 | | | | 0 | | | | 0 | | | | 60,000 | | | | 59,174 | |
To MFS and MFS Related Entities of MFS International Growth Portfolio* | | | 1,241,490 | | | | 1,061,841 | | | | 0 | | | | 0 | | | | 60,000 | | | | 59,174 | |
To MFS and MFS Related Entities of MFS International Value Portfolio* | | | 1,241,490 | | | | 1,061,841 | | | | 0 | | | | 0 | | | | 60,000 | | | | 59,174 | |
To MFS and MFS Related Entities of MFS Massachusetts Investors Growth Stock Portfolio* | | | 1,241,490 | | | | 1,061,841 | | | | 0 | | | | 0 | | | | 60,000 | | | | 59,174 | |
To MFS and MFS Related Entities of MFS Mid Cap Growth Portfolio* | | | 1,241,490 | | | | 1,061,841 | | | | 0 | | | | 0 | | | | 60,000 | | | | 59,174 | |
To MFS and MFS Related Entities of MFS Money Market Portfolio* | | | 1,241,490 | | | | 1,061,841 | | | | 0 | | | | 0 | | | | 60,000 | | | | 59,174 | |
To MFS and MFS Related Entities of MFS New Discovery Portfolio* | | | 1,241,490 | | | | 1,061,841 | | | | 0 | | | | 0 | | | | 60,000 | | | | 59,174 | |
| | | | | | | | | | | | | | | | | | | | | | | | |
To MFS and MFS Related Entities of MFS Research International Portfolio* | | | 1,241,490 | | | | 1,061,841 | | | | 0 | | | | 0 | | | | 60,000 | | | | 59,174 | |
To MFS and MFS Related Entities of MFS Global Research Portfolio* | | | 1,241,490 | | | | 1,061,841 | | | | 0 | | | | 0 | | | | 60,000 | | | | 59,174 | |
To MFS and MFS Related Entities of MFS Strategic Income Portfolio* | | | 1,241,490 | | | | 1,061,841 | | | | 0 | | | | 0 | | | | 60,000 | | | | 59,174 | |
To MFS and MFS Related Entities of MFS Technology Portfolio* | | | 1,241,490 | | | | 1,061,841 | | | | 0 | | | | 0 | | | | 60,000 | | | | 59,174 | |
To MFS and MFS Related Entities of MFS Total Return Portfolio* | | | 1,241,490 | | | | 1,061,841 | | | | 0 | | | | 0 | | | | 60,000 | | | | 59,174 | |
To MFS and MFS Related Entities of MFS Utilities Portfolio* | | | 1,241,490 | | | | 1,061,841 | | | | 0 | | | | 0 | | | | 60,000 | | | | 59,174 | |
To MFS and MFS Related Entities of MFS Value Portfolio* | | | 1,241,490 | | | | 1,061,841 | | | | 0 | | | | 0 | | | | 60,000 | | | | 59,174 | |
| | | | | | |
| | | 2010 | | | | | | 2009 | | | | | | | | | | |
Aggregate fees for non-audit services: | | | | | | | | | | | | | | | | | | | | | | | | |
To MFS Blended Research Core Equity Portfolio, MFS and MFS Related Entities# | | | 1,782,124 | | | | | | | | 1,224,582 | | | | | | | | | | | | | |
To MFS Blended Research Growth Portfolio, MFS and MFS Related Entities# | | | 1,782,813 | | | | | | | | 1,225,258 | | | | | | | | | | | | | |
To MFS Blended Research Value Portfolio, MFS and MFS Related Entities# | | | 1,782,813 | | | | | | | | 1,225,258 | | | | | | | | | | | | | |
To MFS Bond Portfolio, MFS and MFS Related Entities# | | | 1,782,124 | | | | | | | | 1,224,582 | | | | | | | | | | | | | |
To MFS Core Equity Portfolio, MFS and MFS Related Entities# | | | 1,782,124 | | | | | | | | 1,224,582 | | | | | | | | | | | | | |
To MFS Growth Portfolio, MFS and MFS Related Entities# | | | 1,782,124 | | | | | | | | 1,224,582 | | | | | | | | | | | | | |
To MFS Emerging Markets Equity Portfolio, MFS and MFS Related Entities# | | | 1,782,124 | | | | | | | | 1,224,582 | | | | | | | | | | | | | |
| | | | | | | | | | | | | | | | | | | | | | | | |
To MFS Global Governments Portfolio, MFS and MFS Related Entities# | | | 1,782,124 | | | | | | | | 1,224,582 | | | | | | | | | | | | | |
To MFS Global Growth Portfolio MFS and MFS Related Entities# | | | 1,782,124 | | | | | | | | 1,224,582 | | | | | | | | | | | | | |
To MFS Global Tactical Allocation Portfolio, MFS and MFS Related Entities# | | | 1,782,124 | | | | | | | | 1,224,582 | | | | | | | | | | | | | |
To MFS Government Securities Portfolio, MFS and MFS Related Entities# | | | 1,782,124 | | | | | | | | 1,224,582 | | | | | | | | | | | | | |
To MFS High Yield Portfolio, MFS and MFS Related Entities# | | | 1,782,124 | | | | | | | | 1,224,582 | | | | | | | | | | | | | |
To MFS International Growth Portfolio, MFS and MFS Related Entities# | | | 1,782,124 | | | | | | | | 1,224,582 | | | | | | | | | | | | | |
To MFS International Value Portfolio, MFS and MFS Related Entities# | | | 1,782,124 | | | | | | | | 1,224,582 | | | | | | | | | | | | | |
To MFS Massachusetts Investors Growth Stock Portfolio, MFS and MFS Related Entities# | | | 1,782,124 | | | | | | | | 1,224,582 | | | | | | | | | | | | | |
To MFS Mid Cap Growth Portfolio, MFS and MFS Related Entities# | | | 1,782,124 | | | | | | | | 1,224,582 | | | | | | | | | | | | | |
To MFS Money Market Portfolio, MFS and MFS Related Entities# | | | 1,782,124 | | | | | | | | 1,224,582 | | | | | | | | | | | | | |
To MFS New Discovery Portfolio, MFS and MFS Related Entities# | | | 1,782,124 | | | | | | | | 1,224,582 | | | | | | | | | | | | | |
To MFS Research International Portfolio, MFS and MFS Related Entities# | | | 1,782,124 | | | | | | | | 1,224,582 | | | | | | | | | | | | | |
To MFS Global Research Portfolio, MFS and MFS Related Entities# | | | 1,782,124 | | | | | | | | 1,224,582 | | | | | | | | | | | | | |
To MFS Strategic Income Portfolio, MFS and MFS Related Entities# | | | 1,782,124 | | | | | | | | 1,224,582 | | | | | | | | | | | | | |
To MFS Technology Portfolio, MFS and MFS Related Entities# | | | 1,782,124 | | | | | | | | 1,224,582 | | | | | | | | | | | | | |
To MFS Total Return Portfolio, MFS and MFS Related Entities# | | | 1,782,124 | | | | | | | | 1,224,581 | | | | | | | | | | | | | |
| | | | | | | | | | | | | | | | | | | | | | | | |
To MFS Utilities Portfolio, MFS and MFS Related Entities# | | | 1,782,124 | | | | | | | | 1,224,581 | | | | | | | | | | | | | |
To MFS Value Portfolio, MFS and MFS Related Entities# | | | 1,782,124 | | | | | | | | 1,224,581 | | | | | | | | | | | | | |
| * | This amount reflects the fees billed to MFS and MFS Related Entities for non-audit services relating directly to the operations and financial reporting of the Funds (portions of which services also related to the operations and financial reporting of other funds within the MFS Funds complex). |
| # | This amount reflects the aggregate fees billed by Deloitte for non-audit services rendered to the Funds and for non-audit services rendered to MFS and the MFS Related Entities. |
| 1 | The fees included under “Audit-Related Fees” are fees related to assurance and related services that are reasonably related to the performance of the audit or review of financial statements, but not reported under “Audit Fees,” including accounting consultations, agreed-upon procedure reports, attestation reports, comfort letters and internal control reviews. |
| 2 | The fees included under “Tax Fees” are fees associated with tax compliance, tax advice and tax planning, including services relating to the filing or amendment of federal, state or local income tax returns, regulated investment company qualification reviews and tax distribution and analysis. |
| 3 | The fees included under “All Other Fees” are fees for products and services provided by Deloitte other than those reported under “Audit Fees,” “Audit-Related Fees” and “Tax Fees,” including fees for services related to analysis of certain portfolio holdings and, review of internal controls and review of Rule 38a-1 compliance program. |
Item 4(e)(1):
Set forth below are the policies and procedures established by the Audit Committee of the Board of Trustees relating to the pre-approval of audit and non-audit related services: To the extent required by applicable law, pre-approval by the Audit Committee of the Board is needed for all audit and permissible non-audit services rendered to the Funds and all permissible non-audit services rendered to MFS or MFS Related Entities if the services relate directly to the operations and financial reporting of the Registrant. Pre-approval is currently on an engagement-by-engagement basis. In the event pre-approval of such services is necessary between regular meetings of the Audit Committee and it is not practical to wait to seek pre-approval at the next regular meeting of the Audit Committee, pre-approval of such services may be referred to the Chair of the Audit Committee for approval; provided that the Chair may not pre-approve any individual engagement for such services exceeding $50,000 or multiple engagements for such services in the aggregate exceeding $100,000 in each period between regular meetings of the Audit Committee. Any engagement pre-approved by the Chair between regular meetings of the Audit Committee
shall be presented for ratification by the entire Audit Committee at its next regularly scheduled meeting.
Item 4(e)(2):
None, or 0%, of the services relating to the Audit-Related Fees, Tax Fees and All Other Fees paid by the Fund and MFS and MFS Related Entities relating directly to the operations and financial reporting of the Registrant disclosed above were approved by the audit committee pursuant to paragraphs (c)(7)(i)(C) of Rule 2-01 of Regulation S-X (which permits audit committee approval after the start of the engagement with respect to services other than audit, review or attest services, if certain conditions are satisfied).
Item 4(f): Not applicable.
Item 4(h): The Registrant’s Audit Committee has considered whether the provision by a Registrant’s independent registered public accounting firm of non-audit services to MFS and MFS Related Entities that were not pre-approved by the Committee (because such services did not relate directly to the operations and financial reporting of the Registrant) was compatible with maintaining the independence of the independent registered public accounting firm as the Registrant’s principal auditors.
| ITEM 5. | AUDIT COMMITTEE OF LISTED REGISTRANTS. |
Not applicable to the Registrant.
| ITEM 6. | SCHEDULE OF INVESTMENTS |
A schedule of investments of the Registrant is included as part of the report to shareholders of such series under Item 1 of this Form N-CSR.
| ITEM 7. | DISCLOSURE OF PROXY VOTING POLICIES AND PROCEDURES FOR CLOSED-END MANAGEMENT INVESTMENT COMPANIES. |
Not applicable to the Registrant.
| ITEM 8. | PORTFOLIO MANAGERS OF CLOSED-END MANAGEMENT INVESTMENT COMPANIES. |
Not applicable to the Registrant.
| ITEM 9. | PURCHASES OF EQUITY SECURITIES BY CLOSED-END MANAGEMENT INVESTMENT COMPANY AND AFFILIATED PURCHASERS. |
Not applicable to the Registrant.
| ITEM 10. | SUBMISSION OF MATTERS TO A VOTE OF SECURITY HOLDERS. |
There were no material changes to the procedures by which shareholders may send recommendations to the Board for nominees to the Registrant’s Board since the Registrant last provided disclosure as to such procedures in response to the requirements of Item 407 (c)(iv) of Regulation S-K or this Item.
| ITEM 11. | CONTROLS AND PROCEDURES. |
| (a) | Based upon their evaluation of the effectiveness of the registrant’s disclosure controls and procedures (as defined in Rule 30a-3(c) under the Investment Company Act of 1940 (the “Act”)) as conducted within 90 days of the filing date of this report on Form N-CSR, the registrant’s principal financial officer and principal executive officer have concluded that those disclosure controls and procedures provide reasonable assurance that the material information required to be disclosed by the registrant on this report is recorded, processed, summarized and reported within the time periods specified in the Securities and Exchange Commission’s rules and forms. |
| (b) | There were no changes in the registrant’s internal controls over financial reporting (as defined in Rule 30a-3(d) under the Act) that occurred during the second fiscal quarter of the period covered by the report that have materially affected, or are reasonably likely to materially affect, the registrant’s internal control over financial reporting. |
| (a) | File the exhibits listed below as part of this form. Letter or number the exhibits in the sequence indicated. |
| | (1) | Any code of ethics, or amendment thereto, that is the subject of the disclosure required by Item 2, to the extent that the registrant intends to satisfy the Item 2 requirements through filing of an exhibit: Code of Ethics attached hereto. |
| | (2) | A separate certification for each principal executive officer and principal financial officer of the registrant as required by Rule 30a-2(a) under the Act (17 CFR 270.30a-2): Attached hereto. |
| (b) | If the report is filed under Section 13(a) or 15(d) of the Exchange Act, provide the certifications required by Rule 30a-2(b) under the Act (17 CFR 270.30a-2(b)), Rule 13a-14(b) or Rule 15d-14(b) under the Exchange Act (17 CFR 240.13a-14(b) or 240.15d-14(b)) and Section 1350 of Chapter 63 of Title 18 of the United States Code (18 U.S.C. 1350) as an exhibit. A certification furnished pursuant to this paragraph will not be deemed “filed” for the purposes of Section 18 of the Exchange Act (15 U.S.C. 78r), or otherwise subject to the liability of that section. Such certification will not be deemed to be incorporated by reference into any filing under the Securities Act of 1933 or the Exchange Act, except to the extent that the registrant specifically incorporates it by reference: Attached hereto. |
Notice
A copy of the Amended and Restated Declaration of Trust, as amended, of the Registrant is on file with the Secretary of State of The Commonwealth of Massachusetts and notice is hereby given that this instrument is executed on behalf of the Registrant by an officer of the Registrant as an officer and not individually and the obligations of or arising out of this instrument are not binding upon any of the Trustees or shareholders individually, but are binding only upon the assets and property of the respective constituent series of the Registrant.
SIGNATURES
Pursuant to the requirements of the Securities Exchange Act of 1934 and the Investment Company Act of 1940, the registrant has duly caused this report to be signed on its behalf by the undersigned, thereunto duly authorized.
(Registrant) MFS VARIABLE INSURANCE TRUST II
| | |
| By (Signature and Title)* | | MARIA F. DIORIODWYER |
| | Maria F. DiOrioDwyer, President |
Date: February 14, 2011
Pursuant to the requirements of the Securities Exchange Act of 1934 and the Investment Company Act of 1940, this report has been signed below by the following persons on behalf of the registrant and in the capacities and on the dates indicated.
| | |
| By (Signature and Title)* | | MARIA F. DIORIODWYER |
| | Maria F. DiOrioDwyer, President (Principal Executive Officer) |
Date: February 14, 2011
| | |
| By (Signature and Title)* | | JOHN M. CORCORAN |
| | John M. Corcoran, Treasurer (Principal Financial Officer and Accounting Officer) |
Date: February 14, 2011
| * | Print name and title of each signing officer under his or her signature. |