UNITED STATES
SECURITIES AND EXCHANGE COMMISSION
Washington, D.C. 20549
FORMN-CSR
CERTIFIED SHAREHOLDER REPORT OF
REGISTERED MANAGEMENT INVESTMENT COMPANIES
Investment Company Act file number811-03732
MFS VARIABLE INSURANCE TRUST II
(Exact name of registrant as specified in charter)
111 Huntington Avenue, Boston, Massachusetts 02199
(Address of principal executive offices) (Zip code)
Christopher R. Bohane
Massachusetts Financial Services Company
111 Huntington Avenue
Boston, Massachusetts 02199
(Name and address of agents for service)
Registrant’s telephone number, including area code: (617)954-5000
Date of fiscal year end: December 31
Date of reporting period: December 31, 2018
| ITEM 1. | REPORTS TO STOCKHOLDERS. |
Annual Report
December 31, 2018

MFS® Blended Research® Core Equity Portfolio

MFS® Variable Insurance Trust II
Beginning on January 1, 2021, as permitted by regulations adopted by the U.S. Securities and Exchange Commission, the insurance company that offers your contract may determine that it will no longer send you paper copies of the fund’s annual and semiannual shareholder reports unless you specifically request paper copies from the insurance company or from your financial intermediary. Instead, the shareholder reports will be made available on a Web site (insurancefunds.mfs.com or other Web site of which you will be notified), and the insurance company will notify you by mail each time a report is posted and provide you with a Web site link to access the report. Instructions for requesting paper copies will be provided by your insurance company or financial intermediary.
If you already elected to receive shareholder reports by email, you will not be affected by this change and you need not take any action. If your insurance company or financial intermediary offers electronic delivery, you may elect to receive shareholder reports and other communications from the insurance company or financial intermediary by email by following the instructions provided by the insurance company or financial intermediary.
Beginning on January 1, 2019, you may elect to receive all future reports in paper free of charge from the insurance company or financial intermediary. You can inform the insurance company or financial intermediary that you wish to continue receiving paper copies of your shareholder reports by contacting your insurance company or financial intermediary. Your election to receive reports in paper will apply to all funds held in your account with your insurance company or financial intermediary.
CGS-ANN
MFS® Blended Research® Core Equity Portfolio
CONTENTS
The report is prepared for the general information of contract owners. It is authorized for distribution to prospective investors only when preceded or accompanied by a current prospectus.
NOT FDIC INSURED• MAY LOSE VALUE• NO BANK OR CREDIT UNION GUARANTEE• NOT A DEPOSIT• NOT INSURED BY ANY FEDERAL GOVERNMENT AGENCY OR NCUA/NCUSIF
MFS Blended Research Core Equity Portfolio
LETTER FROM THE EXECUTIVE CHAIRMAN

Dear Contract Owners:
Higher interest rates, international trade friction, and geopolitical uncertainty surrounding issues such as Brexit have contributed to an uptick in market volatility in recent quarters — a departure from thelow-volatility environment that prevailed for much of the past several years. Against this more challenging backdrop, equity markets in the United States outperformed most international markets on a relative basis in 2018, though broad market returns were modestly negative on an absolute basis. Global economic growth has become less synchronized over the past few quarters, with Europe, China, and some emerging markets having shown signs of significantly slowing growth. While U.S. growth has remained above average, the pace of that growth slowed in the second half of 2018.
Slowing global growth and tighter financial conditions have clouded the outlook for U.S. monetary policy, with the chairman of the U.S. Federal Reserve acknowledging that policy rates are close to levels that the Fed deems neutral for the U.S. economy. This suggests that the predictable pattern of quarterly rate increases is behind us. At the same time, markets must contend with a shift from years of quantitative easing toward a cycle of quantitative tightening now that the European Central Bank has halted asset purchases. U.S. tax reforms adopted in late 2017 have been welcomed by equity markets while emerging market economies have recently had to contend with tighter financial conditions as a result of firmer U.S. interest rates and a stronger dollar. With the Republicans losing control of the U.S. House of Representatives, further meaningful U.S. fiscal stimulus appears less likely over the remainder of this presidential term. A partial U.S. government shutdown, beginning in late 2018, also added to political uncertainty. Globally, inflation remains largely subdued thanks in part to falling oil prices, but tight labor markets and moderate global demand have investors on the lookout for its potential reappearance. Increased U.S. protectionism is also a growing concern, as investors fear trade disputes could dampen business sentiment, leading to even slower global growth. While there has been progress on this front — a NAFTA replacement has been agreed upon between the U.S., Mexico, and Canada; the free trade pact with Korea has been updated; and a negotiating framework with the European Union has been agreed upon — tensions over trade with China remain quite high, though the two sides have recently returned to the negotiating table.
As a global investment manager with nearly a century of expertise, MFS® firmly believes active risk management offers downside mitigation and may help improve investment outcomes. We built our active investment platform with this belief in mind. Ourlong-term perspective influences nearly every aspect of our business, ensuring our investment decisions align with the investing time horizons of our clients.
Respectfully,

Robert J. Manning
Executive Chairman
MFS Investment Management
February 15, 2019
The opinions expressed in this letter are subject to change and may not be relied upon for investment advice. No forecasts can be guaranteed.
1
MFS Blended Research Core Equity Portfolio
PORTFOLIO COMPOSITION
Portfolio structure

| | | | |
| Top ten holdings | | | | |
| Microsoft Corp. | | | 5.1% | |
| Amazon.com, Inc. | | | 3.6% | |
| Johnson & Johnson | | | 3.1% | |
| Apple, Inc. | | | 2.4% | |
| Bank of America Corp. | | | 2.4% | |
| Cisco Systems, Inc. | | | 2.4% | |
| Intel Corp. | | | 2.3% | |
| Boeing Co. | | | 2.2% | |
| Comcast Corp., “A” | | | 2.1% | |
| Alphabet, Inc., “C” | | | 2.0% | |
| | | | |
| Equity sectors (k) | | | | |
| Technology | | | 19.5% | |
| Financial Services | | | 17.8% | |
| Health Care | | | 16.5% | |
| Leisure | | | 7.6% | |
| Utilities & Communications | | | 6.7% | |
| Retailing | | | 5.7% | |
| Industrial Goods & Services | | | 5.6% | |
| Consumer Staples | | | 5.2% | |
| Special Products & Services | | | 4.1% | |
| Energy | | | 3.7% | |
| Transportation | | | 3.0% | |
| Basic Materials | | | 2.1% | |
| Autos & Housing | | | 1.7% | |
| (k) | The sectors set forth above and the associated portfolio composition are based on MFS’ own custom sector classification methodology. |
Cash & Cash Equivalents includes any cash, investments in money market funds, short-term securities, and other assets less liabilities. Please see the Statement of Assets and Liabilities for additional information related to the fund’s cash position and other assets and liabilities.
Percentages are based on net assets as of December 31, 2018.
The portfolio is actively managed and current holdings may be different.
2
MFS Blended Research Core Equity Portfolio
MANAGEMENT REVIEW
Summary of Results
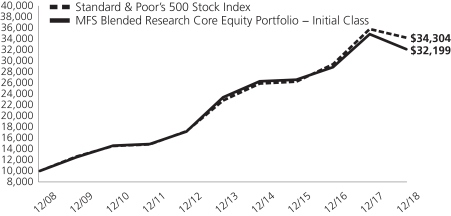
For the twelve months ended December 31, 2018, Initial Class shares of the MFS Blended Research Core Equity Portfolio (“fund”) provided a total return of –7.74%, while Service Class shares of the fund provided a total return of –7.99%. These compare with a return of –4.38% over the same period for the fund’s benchmark, the Standard & Poor’s 500 Stock Index (“S&P 500 Index”).
Market Environment
During the reporting period, the US Federal Reserve raised interest rates by 100 basis points, bringing the total number of rate hikes to nine since the central bank began to normalize monetary policy in late 2015. Economic growth rates in the US, Eurozone and Japan remained above trend, despite a slowing in global growth, particularly toward the end of the period. Inflation remained contained, particularly outside the US. Late in the period, the European Central Bank halted its asset purchase program but issued forward guidance that it does not expect to raise interest rates at least until after the summer of 2019. The Bank of England (once) and the Bank of Canada (three times) each raised rates during the period. The European political backdrop became a bit more volatile, late in the period, spurred by concerns over cohesion in the eurozone after the election of an anti-establishment, Eurosceptic coalition government in Italy and widespread protests over stagnant wage growth in France.
Bond yields rose in the US during most of the period, but remained low by historical standards and slipped from their highs, late in the period, as market volatility increased. Yields in many developed markets fell. Outside of emerging markets, where spreads and currencies came under pressure, credit spreads remained quite tight until the end of the period, when thinner liquidity, lower oil prices and concerns over high degrees of corporate leverage emerged. Growing concern over increasing global trade friction appeared to have weighed on business sentiment during the period’s second half, especially outside the US. Tighter financial conditions from rising US rates and a strong dollar, combined with trade uncertainty, helped expose structural weaknesses in several emerging markets in the second half of the period.
Volatility increased, at the end of the period, amid signs of slowing global economic growth and increasing trade tensions, which prompted a market setback shortly after US markets set record highs in September. It was the second such equity market decline during the reporting period. The correction came despite a third consecutive quarter of strong growth in US earnings per share. Strong earnings growth, combined with the market decline, brought US equity valuations down from elevated levels, earlier in the period, to multiples more in line with long-term averages. While the US economy held up better than most, global economic growth became less synchronized during the period, with Europe and China showing signs of a slowdown and some emerging markets coming under stress.
Detractors from Performance
Stock selection within both thefinancial servicesandhealth care sectors was a primary factor that detracted from performance relative to the S&P 500 Index. Within thefinancial services sector, the fund’s overweight positions in financial services provider Synchrony Financial, insurance company Prudential Financial and direct banking and payment services provider Discover Financial Services held back relative returns. Shares of Synchrony Financial came under pressure as the company announced that it was losing one of its major customers (Walmart), which was the first of five major contracts up for renewal in the next five years. Walmart had been a customer of Synchrony Financial for 20 years, and this loss signaled that tenure might not have been as much of a hurdle to switching companies as investors appeared to have assumed. Within thehealth caresector, not owning shares of pharmaceutical company Merck held back relative performance. Shares of Merck advanced as the company posted solid earnings results on the back of strong growth from its flagship immuno-oncology drug Keytruda. In addition, Merck’s management raised themid-point of its earnings guidance, increased its dividend and announced a share repurchase program, which further supported the stock. The fund’s overweight position in shares of health services and information technology company McKesson (h) further weakened relative results.
Elsewhere, the fund’s overweight positions in food producer Tyson Foods, information technology company DXC Technology and tobacco company Philip Morris International negatively impacted relative performance. Thedrop-off in the share price of Tyson Foods, early in the year, coincided with a class action lawsuit in Minnesota. Later in the year, the company lowered its fiscal-year 2018 earnings per share guidance, driven by lower pork exports, as a result of tariffs, and increased US pork processing capacity, which both drove domestic pork prices down. The fund’s holdings of automotive seats manufacturer Lear (b) and residential and commercial building materials manufacturer Owens Corning (b)(h) further weighed on relative results.
Contributors to Performance
Stock selection in both theindustrial goods & services andutilitiessectors contributed to relative performance. Within theindustrial goods & services sector, avoiding shares of poor-performing diversified industrial conglomerate General Electric contributed to relative performance. The share price of General Electric declined during the year after the company significantly lowered its expectations for future earnings and cash flows, reduced its dividend, changed its management team and moved forward with
3
MFS Blended Research Core Equity Portfolio
Management Review – continued
additional portfolio restructuring after reporting losses in its power segment. Within theutilities & communications sector, the fund’s overweight holdings of power generation company NRG Energy, utility services provider Exelon and integrated electric power company AES positively impacted relative returns. Shares of NRG Energy advanced during the reporting period after the company announced a share buyback program and reported earnings results that were in line with expectations.
In other sectors, the fund’s overweight holdings of pharmaceutical company Eli Lilly, network equipment company Cisco Systems, medical device maker Medtronic and health care provider Humana aided relative returns. Avoiding shares of poor-performing telecommunication services provider AT&T also strengthened relative performance. Holdings of real estate investment trust Store Capital (b) were also among the fund’s top relative contributors. Shares of Store Capital benefited from stronger-than-expected financial results, driven by higher net operating income from more robust acquisition volume. The company also raised its revenue guidance figures, which further supported the stock.
Respectfully,
Portfolio Manager(s)
Jim Fallon, Matt Krummell, Jonathan Sage, and Jed Stocks
| (b) | Security is not a benchmark constituent. |
| (h) | Security was not held in the fund at period end. |
The views expressed in this report are those of the portfolio manager(s) only through the end of the period of the report as stated on the cover and do not necessarily reflect the views of MFS or any other person in the MFS organization. These views are subject to change at any time based on market or other conditions, and MFS disclaims any responsibility to update such views. These views may not be relied upon as investment advice or an indication of trading intent on behalf of any MFS portfolio. References to specific securities are not recommendations of such securities, and may not be representative of any MFS portfolio’s current or future investments.
4
MFS Blended Research Core Equity Portfolio
PERFORMANCE SUMMARY THROUGH 12/31/18
The following chart illustrates the historical performance of the fund in comparison to its benchmark(s). Benchmarks are unmanaged and may not be invested in directly. Benchmark returns do not reflect any fees or expenses. The performance of other share classes will be greater than or less than that of the class depicted below. (See Notes to Performance Summary.)
Performance data shown represents past performance and is no guarantee of future results. Investment return and principal value fluctuate so your units, when sold, may be worth more or less than the original cost; current performance may be lower or higher than quoted. The performance shown does not reflect the deduction of taxes, if any, that a contract holder would pay on fund distributions or the redemption of contract units. The returns for the fund shown also do not reflect the deduction of expenses associated with variable products, such as mortality and expense risk charges, separate account charges, and sales charges imposed by the insurance company separate accounts. Such expenses would reduce the overall returns shown.
Growth of a Hypothetical $10,000 Investment
Total Returns through 12/31/18
Average annual total returns
| | | | | | | | | | | | |
| | | Share Class | | Class Inception Date | | 1-yr | | 5-yr | | 10-yr | | |
| | | Initial Class | | 11/14/86 | | (7.74)% | | 6.58% | | 12.40% | | |
| | | Service Class | | 8/24/01 | | (7.99)% | | 6.31% | | 12.12% | | |
| | | | |
| Comparative benchmark(s) | | | | | | | | |
| | | Standard & Poor’s 500 Stock Index (f) | | (4.38)% | | 8.49% | | 13.12% | | |
| (f) | Source: FactSet Research Systems Inc. |
Benchmark Definition(s)
Standard & Poor’s 500 Stock Index – a market capitalization-weighted index of 500 widely held equity securities, designed to measure broad U.S. equity performance.
It is not possible to invest directly in an index.
Notes to Performance Summary
Average annual total return represents the average annual change in value for each share class for the periods presented.
Performance results reflect any applicable expense subsidies and waivers in effect during the periods shown. Without such subsidies and waivers the fund’s performance results would be less favorable. Please see the prospectus and financial statements for complete details. All results are historical and assume the reinvestment of any dividends and capital gains distributions.
Performance results do not include adjustments made for financial reporting purposes in accordance with U.S. generally accepted accounting principles and may differ from amounts reported in the financial highlights.
From time to time the fund may receive proceeds from litigation settlements, without which performance would be lower.
5
MFS Blended Research Core Equity Portfolio
EXPENSE TABLE
Fund Expenses Borne by the Contract Holders during the Period,
July 1, 2018 through December 31, 2018
As a contract holder of the fund, you incur ongoing costs, including management fees; distribution and/or service(12b-1) fees; and other fund expenses. This example is intended to help you understand your ongoing costs (in dollars) of investing in the fund and to compare these costs with the ongoing costs of investing in other mutual funds.
The example is based on an investment of $1,000 invested at the beginning of the period and held for the entire period July 1, 2018 through December 31, 2018.
Actual Expenses
The first line for each share class in the following table provides information about actual account values and actual expenses. You may use the information in this line, together with the amount you invested, to estimate the expenses that you paid over the period. Simply divide your account value by $1,000 (for example, an $8,600 account value divided by $1,000 = 8.6), then multiply the result by the number in the first line under the heading entitled “Expenses Paid During Period” to estimate the expenses you paid on your account during this period.
Hypothetical Example for Comparison Purposes
The second line for each share class in the following table provides information about hypothetical account values and hypothetical expenses based on the fund’s actual expense ratio and an assumed rate of return of 5% per year before expenses, which is not the fund’s actual return. The hypothetical account values and expenses may not be used to estimate the actual ending account balance or expenses you paid for the period. You may use this information to compare the ongoing costs of investing in the fund and other funds. To do so, compare this 5% hypothetical example with the 5% hypothetical examples that appear in the shareholder reports of the other funds.
Please note that the expenses shown in the table are meant to highlight the fund’s ongoing costs only and do not take into account the fees and expenses imposed under the variable contracts through which your investment in the fund is made. Therefore, the second line for each share class in the table is useful in comparing ongoing costs associated with an investment in vehicles (such as the fund) which fund benefits under variable annuity and variable life insurance contracts and to qualified pension and retirement plans only, and will not help you determine the relative total costs of investing in the fund through variable annuity and variable life insurance contracts. If the fees and expenses imposed under the variable contracts were included, your costs would have been higher.
| | | | | | | | | | | | | | | | | | |
| Share Class | | | | Annualized
Expense Ratio | | | Beginning
Account Value
7/01/18 | | | Ending
Account Value
12/31/18 | | | Expenses Paid
During Period (p)
7/01/18-12/31/18 | |
| Initial Class | | Actual | | | 0.44% | | | | $1,000.00 | | | | $914.85 | | | | $2.12 | |
| | Hypothetical (h) | | | 0.44% | | | | $1,000.00 | | | | $1,022.99 | | | | $2.24 | |
| Service Class | | Actual | | | 0.69% | | | | $1,000.00 | | | | $913.48 | | | | $3.33 | |
| | Hypothetical (h) | | | 0.69% | | | | $1,000.00 | | | | $1,021.73 | | | | $3.52 | |
| (h) | 5% class return per year before expenses. |
| (p) | “Expenses Paid During Period” are equal to each class’s annualized expense ratio, as shown above, multiplied by the average account value over the period, multiplied by 184/365 (to reflect theone-half year period). |
6
MFS Blended Research Core Equity Portfolio
PORTFOLIO OF INVESTMENTS – 12/31/18
The Portfolio of Investments is a complete list of all securities owned by your fund. It is categorized by broad-based asset classes.
| | | | | | | | |
| | |
| Issuer | | Shares/Par | | | Value ($) | |
| COMMON STOCKS – 99.2% | | | | | | | | |
| Aerospace – 3.3% | | | | | |
| Boeing Co. | | | 28,642 | | | $ | 9,237,045 | |
| Honeywell International, Inc. | | | 20,103 | | | | 2,656,008 | |
| Leidos Holdings, Inc. | | | 35,530 | | | | 1,873,142 | |
| | | | | | | | |
| | | | | | $ | 13,766,195 | |
| | | | | | | | |
| Airlines – 1.1% | | | | | | | | |
| Delta Air Lines, Inc. | | | 94,506 | | | $ | 4,715,849 | |
| | | | | | | | |
| Alcoholic Beverages – 1.2% | | | | | | | | |
| Molson Coors Brewing Co. | | | 85,087 | | | $ | 4,778,486 | |
| | | | | | | | |
| Automotive – 1.2% | | | | | | | | |
| Lear Corp. | | | 40,125 | | | $ | 4,929,757 | |
| | | | | | | | |
| Biotechnology – 2.3% | | | | | | | | |
| Biogen, Inc. (a) | | | 23,900 | | | $ | 7,191,988 | |
| Celgene Corp. (a) | | | 37,551 | | | | 2,406,644 | |
| | | | | | | | |
| | | | | | $ | 9,598,632 | |
| | | | | | | | |
| Business Services – 2.5% | | | | | | | | |
| DXC Technology Co. | | | 71,974 | | | $ | 3,826,858 | |
| FleetCor Technologies, Inc. (a) | | | 30,121 | | | | 5,594,072 | |
| Global Payments, Inc. | | | 9,958 | | | | 1,026,968 | |
| | | | | | | | |
| | | | | | $ | 10,447,898 | |
| | | | | | | | |
| Cable TV – 2.0% | | | | | | | | |
| Comcast Corp., “A” | | | 249,400 | | | $ | 8,492,070 | |
| | | | | | | | |
| Chemicals – 2.1% | | | | | | | | |
| CF Industries Holdings, Inc. | | | 141,622 | | | $ | 6,161,973 | |
| Eastman Chemical Co. | | | 36,672 | | | | 2,681,090 | |
| | | | | | | | |
| | | | | | $ | 8,843,063 | |
| | | | | | | | |
| Computer Software – 6.9% | | | | | | | | |
| Adobe Systems, Inc. (a) | | | 28,814 | | | $ | 6,518,879 | |
| Microsoft Corp. | | | 206,777 | | | | 21,002,340 | |
| Salesforce.com, Inc. (a) | | | 7,214 | | | | 988,102 | |
| | | | | | | | |
| | | | | | $ | 28,509,321 | |
| | | | | | | | |
| Computer Software – Systems – 3.1% | |
| Apple, Inc. | | | 64,088 | | | $ | 10,109,241 | |
| Hewlett Packard Enterprise | | | 192,641 | | | | 2,544,788 | |
| | | | | | | | |
| | | | | | $ | 12,654,029 | |
| | | | | | | | |
| Construction – 0.5% | | | | | | | | |
| Pulte Homes, Inc. | | | 84,444 | | | $ | 2,194,700 | |
| | | | | | | | |
| Consumer Products – 0.4% | | | | | | | | |
| Kimberly-Clark Corp. | | | 11,092 | | | $ | 1,263,822 | |
| Procter & Gamble Co. | | | 3,340 | | | | 307,013 | |
| | | | | | | | |
| | | | | | $ | 1,570,835 | |
| | | | | | | | |
| Consumer Services – 1.6% | | | | | | | | |
| Bookings Holdings, Inc. (a) | | | 3,905 | | | $ | 6,726,050 | |
| | | | | | | | |
| Electrical Equipment – 0.2% | | | | | | | | |
| HD Supply Holdings, Inc. (a) | | | 17,435 | | | $ | 654,161 | |
| | | | | | | | |
| | | | | | | | |
| | |
| Issuer | | Shares/Par | | | Value ($) | |
| COMMON STOCKS – continued | | | | | |
| Electronics – 2.7% | | | | | | | | |
| Intel Corp. | | | 205,725 | | | $ | 9,654,674 | |
| Lam Research Corp. | | | 10,080 | | | | 1,372,594 | |
| | | | | | | | |
| | | | | | $ | 11,027,268 | |
| | | | | | | | |
| Energy – Independent – 3.4% | | | | | | | | |
| EOG Resources, Inc. | | | 59,660 | | | $ | 5,202,949 | |
| Phillips 66 | | | 61,111 | | | | 5,264,713 | |
| Pioneer Natural Resources Co. | | | 4,577 | | | | 601,967 | |
| Valero Energy Corp. | | | 38,656 | | | | 2,898,040 | |
| | | | | | | | |
| | | | | | $ | 13,967,669 | |
| | | | | | | | |
| Energy – Integrated – 0.4% | | | | | | | | |
| Exxon Mobil Corp. | | | 22,346 | | | $ | 1,523,774 | |
| | | | | | | | |
| Food & Beverages – 2.0% | | | | | | | | |
| PepsiCo, Inc. | | | 53,226 | | | $ | 5,880,408 | |
| Tyson Foods, Inc., “A” | | | 42,257 | | | | 2,256,524 | |
| | | | | | | | |
| | | | | | $ | 8,136,932 | |
| | | | | | | | |
| Gaming & Lodging – 1.2% | | | | | | | | |
| Marriott International, Inc., “A” | | | 46,510 | | | $ | 5,049,126 | |
| | | | | | | | |
| Health Maintenance Organizations – 1.0% | |
| Humana Inc. | | | 13,812 | | | $ | 3,956,862 | |
| UnitedHealth Group, Inc. | | | 877 | | | | 218,478 | |
| | | | | | | | |
| | | | | | $ | 4,175,340 | |
| | | | | | | | |
| Insurance – 3.5% | | | | | | | | |
| Allstate Corp. | | | 22,000 | | | $ | 1,817,860 | |
| Berkshire Hathaway, Inc., “B” (a) | | | 14,082 | | | | 2,875,263 | |
| MetLife, Inc. | | | 122,314 | | | | 5,022,213 | |
| Prudential Financial, Inc. | | | 57,385 | | | | 4,679,746 | |
| | | | | | | | |
| | | | | | $ | 14,395,082 | |
| | | | | | | | |
| Internet – 4.5% | | | | | | | | |
| Alphabet, Inc., “A” (a) | | | 7,824 | | | $ | 8,175,767 | |
| Alphabet, Inc., “C” (a) | | | 8,131 | | | | 8,420,545 | |
| Facebook, Inc., “A” (a) | | | 16,985 | | | | 2,226,564 | |
| | | | | | | | |
| | | | | | $ | 18,822,876 | |
| | | | | | | | |
| Leisure & Toys – 1.5% | | | | | | | | |
| Brunswick Corp. | | | 31,673 | | | $ | 1,471,211 | |
| Electronic Arts, Inc. (a) | | | 62,032 | | | | 4,894,945 | |
| | | | | | | | |
| | | | | | $ | 6,366,156 | |
| | | | | | | | |
| Machinery & Tools – 2.1% | | | | | | | | |
| AGCO Corp. | | | 23,601 | | | $ | 1,313,868 | |
| Eaton Corp. PLC | | | 84,088 | | | | 5,773,482 | |
| Ingersoll-Rand Co. PLC, “A” | | | 19,327 | | | | 1,763,202 | |
| | | | | | | | |
| | | | | | $ | 8,850,552 | |
| | | | | | | | |
| Major Banks – 6.5% | | | | | | | | |
| Bank of America Corp. | | | 405,434 | | | $ | 9,989,894 | |
| Goldman Sachs Group, Inc. | | | 5,443 | | | | 909,253 | |
| JPMorgan Chase & Co. | | | 23,009 | | | | 2,246,139 | |
7
MFS Blended Research Core Equity Portfolio
Portfolio of Investments – continued
| | | | | | | | |
| | |
| Issuer | | Shares/Par | | | Value ($) | |
| COMMON STOCKS – continued | | | | | |
| Major Banks – continued | | | | | | | | |
| Morgan Stanley | | | 151,484 | | | $ | 6,006,341 | |
| Wells Fargo & Co. | | | 171,606 | | | | 7,907,604 | |
| | | | | | | | |
| | | | | | $ | 27,059,231 | |
| | | | | | | | |
| Medical & Health Technology & Services – 4.2% | |
| CVS Health Corp. | | | 69,700 | | | $ | 4,566,744 | |
| HCA Healthcare, Inc. | | | 45,359 | | | | 5,644,927 | |
| Walgreens Boots Alliance, Inc. | | | 106,003 | | | | 7,243,185 | |
| | | | | | | | |
| | | | | | $ | 17,454,856 | |
| | | | | | | | |
| Medical Equipment – 2.3% | | | | | | | | |
| Boston Scientific Corp. (a) | | | 28,370 | | | $ | 1,002,596 | |
| Medtronic PLC | | | 91,592 | | | | 8,331,208 | |
| | | | | | | | |
| | | | | | $ | 9,333,804 | |
| | | | | | | | |
| Natural Gas – Pipeline – 1.1% | | | | | | | | |
| Kinder Morgan, Inc. | | | 228,908 | | | $ | 3,520,605 | |
| ONEOK, Inc. | | | 21,530 | | | | 1,161,543 | |
| | | | | | | | |
| | | | | | $ | 4,682,148 | |
| | | | | | | | |
| Network & Telecom – 2.4% | | | | | | | | |
| Cisco Systems, Inc. | | | 224,756 | | | $ | 9,738,677 | |
| | | | | | | | |
| Other Banks & Diversified Financials – 3.9% | |
| Citigroup, Inc. | | | 79,778 | | | $ | 4,153,243 | |
| Discover Financial Services | | | 82,133 | | | | 4,844,204 | |
| Mastercard, Inc., “A” | | | 15,873 | | | | 2,994,441 | |
| Synchrony Financial | | | 140,438 | | | | 3,294,676 | |
| Visa, Inc., “A” | | | 6,704 | | | | 884,526 | |
| | | | | | | | |
| | | | | | $ | 16,171,090 | |
| | | | | | | | |
| Pharmaceuticals – 6.7% | | | | | | | | |
| Bristol-Myers Squibb Co. | | | 133,749 | | | $ | 6,952,273 | |
| Eli Lilly & Co. | | | 33,504 | | | | 3,877,083 | |
| Johnson & Johnson | | | 99,495 | | | | 12,839,830 | |
| Pfizer, Inc. | | | 91,399 | | | | 3,989,566 | |
| | | | | | | | |
| | | | | | $ | 27,658,752 | |
| | | | | | | | |
| Railroad & Shipping – 1.8% | | | | | | | | |
| Union Pacific Corp. | | | 54,744 | | | $ | 7,567,263 | |
| | | | | | | | |
| Real Estate – 3.8% | | | | | | | | |
| EPR Properties, REIT | | | 30,990 | | | $ | 1,984,290 | |
| Life Storage, Inc., REIT | | | 31,831 | | | | 2,959,965 | |
| Simon Property Group, Inc., REIT | | | 39,216 | | | | 6,587,896 | |
| Store Capital Corp., REIT | | | 152,886 | | | | 4,328,202 | |
| | | | | | | | |
| | | | | | $ | 15,860,353 | |
| | | | | | | | |
| Restaurants – 2.8% | | | | | | | | |
| Aramark | | | 29,809 | | | $ | 863,567 | |
| Domino’s Pizza, Inc. | | | 3,196 | | | | 792,576 | |
| Starbucks Corp. | | | 105,900 | | | | 6,819,960 | |
| U.S. Foods Holding Corp. (a) | | | 96,865 | | | | 3,064,808 | |
| | | | | | | | |
| | | | | | $ | 11,540,911 | |
| | | | | | | | |
| | | | | | | | |
| | |
| Issuer | | Shares/Par | | | Value ($) | |
| COMMON STOCKS – continued | | | | | |
| Specialty Stores – 5.7% | | | | | | | | |
| Amazon.com, Inc. (a) | | | 9,962 | | | $ | 14,962,625 | |
| Costco Wholesale Corp. | | | 31,729 | | | | 6,463,515 | |
| Lululemon Athletica, Inc. (a) | | | 2,025 | | | | 246,260 | |
| Urban Outfitters, Inc. (a) | | | 52,488 | | | | 1,742,602 | |
| | | | | | | | |
| | | | | | $ | 23,415,002 | |
| | | | | | | | |
| Telephone Services – 1.0% | | | | | | | | |
| CenturyLink, Inc. | | | 118,027 | | | $ | 1,788,109 | |
| Verizon Communications, Inc. | | | 39,971 | | | | 2,247,170 | |
| | | | | | | | |
| | | | | | $ | 4,035,279 | |
| | | | | | | | |
| Tobacco – 1.7% | | | | | | | | |
| Philip Morris International, Inc. | | | 105,822 | | | $ | 7,064,677 | |
| | | | | | | | |
| Utilities – Electric Power – 4.6% | | | | | |
| AES Corp. | | | 358,499 | | | $ | 5,183,896 | |
| Exelon Corp. | | | 168,384 | | | | 7,594,118 | |
| NRG Energy, Inc. | | | 144,805 | | | | 5,734,278 | |
| Vistra Energy Corp. (a) | | | 23,459 | | | | 536,976 | |
| | | | | | | | |
| | | | | | $ | 19,049,268 | |
| | | | | | | | |
Total Common Stocks
(Identified Cost, $357,827,282) | | | | | | $ | 410,827,132 | |
| | | | | | | | |
| |
| INVESTMENT COMPANIES (h) – 0.8% | | | | | |
| Money Market Funds – 0.8% | | | | | | | | |
| MFS Institutional Money Market Portfolio, 2.4% (v) (Identified Cost, $3,121,333) | | | 3,121,645 | | | $ | 3,121,333 | |
| | | | | | | | |
OTHER ASSETS, LESS
LIABILITIES – 0.0% | | | | | | | 12,342 | |
| | | | | | | | |
| NET ASSETS – 100.0% | | | | | | $ | 413,960,807 | |
| | | | | | | | |
| (a) | | Non-income producing security. |
| (h) | | An affiliated issuer, which may be considered one in which the fund owns 5% or more of the outstanding voting securities, or a company which is under common control. At period end, the aggregate values of the fund’s investments in affiliated issuers and in unaffiliated issuers were $3,121,333 and $410,827,132, respectively. |
| (v) | | Affiliated issuer that is available only to investment companies managed by MFS. The rate quoted for the MFS Institutional Money Market Portfolio is the annualizedseven-day yield of the fund at period end. |
The following abbreviations are used in this report and are defined:
| PLC | | Public Limited Company |
| REIT | | Real Estate Investment Trust |
See Notes to Financial Statements
8
MFS Blended Research Core Equity Portfolio
FINANCIAL STATEMENTS | STATEMENT OF ASSETS AND LIABILITIES
This statement represents your fund’s balance sheet, which details the assets and liabilities comprising the total value of the fund.
| | | | |
At 12/31/18 | | | | |
| |
Assets | | | | |
Investments in unaffiliated issuers, at value (identified cost, $357,827,282) | | | $410,827,132 | |
Investments in affiliated issuers, at value (identified cost, $3,121,333) | | | 3,121,333 | |
Cash | | | 10,172 | |
Receivables for | | | | |
Fund shares sold | | | 166,451 | |
Dividends | | | 441,911 | |
Other assets | | | 2,926 | |
Total assets | | | $414,569,925 | |
| |
Liabilities | | | | |
Payables for | | | | |
Fund shares reacquired | | | $508,401 | |
Payable to affiliates | | | | |
Investment adviser | | | 18,189 | |
Shareholder servicing costs | | | 122 | |
Distribution and/or service fees | | | 4,280 | |
Payable for independent Trustees’ compensation | | | 8 | |
Accrued expenses and other liabilities | | | 78,118 | |
Total liabilities | | | $609,118 | |
Net assets | | | $413,960,807 | |
| |
Net assets consist of | | | | |
Paid-in capital | | | $321,564,552 | |
Total distributable earnings (loss) | | | 92,396,255 | |
Net assets | | | $413,960,807 | |
Shares of beneficial interest outstanding | | | 9,173,088 | |
| | | | | | | | | | | | |
| | | |
| | | Net assets | | | Shares
outstanding | | | Net asset value
per share | |
Initial Class | | | $256,438,739 | | | | 5,662,740 | | | | $45.29 | |
Service Class | | | 157,522,068 | | | | 3,510,348 | | | | 44.87 | |
See Notes to Financial Statements
9
MFS Blended Research Core Equity Portfolio
FINANCIAL STATEMENTS | STATEMENT OF OPERATIONS
This statement describes how much your fund earned in investment income and accrued in expenses. It also describes any gains and/or losses generated by fund operations.
| | | | |
Year ended 12/31/18 | | | | |
| |
Net investment income (loss) | | | | |
Income | | | | |
Dividends | | | $8,767,001 | |
Dividends from affiliated issuers | | | 54,256 | |
Other | | | 24,031 | |
Total investment income | | | $8,845,288 | |
Expenses | | | | |
Management fee | | | $1,932,891 | |
Distribution and/or service fees | | | 446,822 | |
Shareholder servicing costs | | | 15,274 | |
Administrative services fee | | | 78,605 | |
Independent Trustees’ compensation | | | 12,201 | |
Custodian fee | | | 23,935 | |
Shareholder communications | | | 31,898 | |
Audit and tax fees | | | 53,461 | |
Legal fees | | | 4,266 | |
Miscellaneous | | | 26,381 | |
Total expenses | | | $2,625,734 | |
Reduction of expenses by investment adviser | | | (46,012 | ) |
Net expenses | | | $2,579,722 | |
Net investment income (loss) | | | $6,265,566 | |
| |
Realized and unrealized gain (loss) | | | | |
Realized gain (loss) (identified cost basis) | | | | |
Unaffiliated issuers | | | $33,515,592 | |
Affiliated issuers | | | (748 | ) |
Net realized gain (loss) | | | $33,514,844 | |
Change in unrealized appreciation or depreciation | | | | |
Unaffiliated issuers | | | $(73,329,128 | ) |
Net realized and unrealized gain (loss) | | | $(39,814,284 | ) |
Change in net assets from operations | | | $(33,548,718 | ) |
See Notes to Financial Statements
10
MFS Blended Research Core Equity Portfolio
FINANCIAL STATEMENTS | STATEMENTS OF CHANGES IN NET ASSETS
These statements describe the increases and/or decreases in net assets resulting from operations, any distributions, and any shareholder transactions.
| | | | | | | | |
| | | Year ended | |
| | | 12/31/18 | | | 12/31/17 | |
Change in net assets | | | | | | | | |
| | |
From operations | | | | | | | | |
Net investment income (loss) | | | $6,265,566 | | | | $6,161,470 | |
Net realized gain (loss) | | | 33,514,844 | | | | 40,921,145 | |
Net unrealized gain (loss) | | | (73,329,128 | ) | | | 44,745,227 | |
Change in net assets from operations | | | $(33,548,718 | ) | | | $91,827,842 | |
Total distributions to shareholders (a) | | | $(47,187,077 | ) | | | $(17,233,087 | ) |
Change in net assets from fund share transactions | | | $(7,790,686 | ) | | | $(48,097,121 | ) |
Total change in net assets | | | $(88,526,481 | ) | | | $26,497,634 | |
| | |
Net assets | | | | | | | | |
At beginning of period | | | 502,487,288 | | | | 475,989,654 | |
At end of period (b) | | | $413,960,807 | | | | $502,487,288 | |
| (a) | Distributions from net investment income and from net realized gain are no longer required to be separately disclosed. See Note 2. For the year ended December 31, 2017, distributions from net investment income and from net realized gain were $6,939,009 and $10,294,078, respectively. |
| (b) | Parenthetical disclosure of undistributed net investment income is no longer required. See Note 2. For the year ended December 31, 2017, end of period net assets included undistributed net investment income of $6,160,999. |
See Notes to Financial Statements
11
MFS Blended Research Core Equity Portfolio
FINANCIAL STATEMENTS | FINANCIAL HIGHLIGHTS
The financial highlights table is intended to help you understand the fund’s financial performance for the past 5 years. Certain information reflects financial results for a single fund share. The total returns in the table represent the rate that an investor would have earned (or lost) on an investment in the fund share class (assuming reinvestment of all distributions) held for the entire period.
| | | | | | | | | | | | | | | | | | | | |
| Initial Class | | Year ended | |
| | | | | |
| | | 12/31/18 | | | 12/31/17 | | | 12/31/16 | | | 12/31/15 | | | 12/31/14 | |
| | | | | |
Net asset value, beginning of period | | | $54.23 | | | | $46.62 | | | | $48.56 | | | | $53.50 | | | | $48.31 | |
| | | | | |
| Income (loss) from investment operations | | | | | | | | | | | | | | | | | | | | |
Net investment income (loss) (d) | | | $0.74 | | | | $0.68 | | | | $0.74 | (c) | | | $0.76 | | | | $0.77 | |
Net realized and unrealized gain (loss) | | | (4.12 | ) | | | 8.80 | | | | 3.24 | | | | (0.62 | ) | | | 5.28 | |
Total from investment operations | | | $(3.38 | ) | | | $9.48 | | | | $3.98 | | | | $0.14 | | | | $6.05 | |
| | | | | |
| Less distributions declared to shareholders | | | | | | | | | | | | | | | | | | | | |
From net investment income | | | $(0.77 | ) | | | $(0.78 | ) | | | $(0.72 | ) | | | $(0.87 | ) | | | $(0.86 | ) |
From net realized gain | | | (4.79 | ) | | | (1.09 | ) | | | (5.20 | ) | | | (4.21 | ) | | | — | |
Total distributions declared to shareholders | | | $(5.56 | ) | | | $(1.87 | ) | | | $(5.92 | ) | | | $(5.08 | ) | | | $(0.86 | ) |
Net asset value, end of period (x) | | | $45.29 | | | | $54.23 | | | | $46.62 | | | | $48.56 | | | | $53.50 | |
Total return (%) (k)(r)(s)(x) | | | (7.74 | ) | | | 20.76 | | | | 8.45 | (c) | | | 1.13 | | | | 12.57 | |
| | | | | |
Ratios (%) (to average net assets)
and Supplemental data: | | | | | | | | | | | | | | | | | | | | |
Expenses before expense reductions (f) | | | 0.45 | | | | 0.46 | | | | 0.49 | (c) | | | 0.60 | | | | 0.60 | |
Expenses after expense reductions (f) | | | 0.44 | | | | 0.45 | | | | 0.44 | (c) | | | 0.45 | | | | 0.45 | |
Net investment income (loss) | | | 1.39 | | | | 1.35 | | | | 1.56 | (c) | | | 1.45 | | | | 1.53 | |
Portfolio turnover | | | 54 | | | | 51 | | | | 49 | | | | 51 | �� | | | 41 | |
Net assets at end of period (000 omitted) | | | $256,439 | | | | $320,384 | | | | $306,368 | | | | $319,721 | | | | $361,501 | |
| |
| Service Class | | Year ended | |
| | | | | |
| | | 12/31/18 | | | 12/31/17 | | | 12/31/16 | | | 12/31/15 | | | 12/31/14 | |
| | | | | |
Net asset value, beginning of period | | | $53.79 | | | | $46.26 | | | | $48.26 | | | | $53.18 | | | | $48.02 | |
| | | | | |
| Income (loss) from investment operations | | | | | | | | | | | | | | | | | | | | |
Net investment income (loss) (d) | | | $0.61 | | | | $0.55 | | | | $0.61 | (c) | | | $0.62 | | | | $0.64 | |
Net realized and unrealized gain (loss) | | | (4.11 | ) | | | 8.73 | | | | 3.22 | | | | (0.61 | ) | | | 5.23 | |
Total from investment operations | | | $(3.50 | ) | | | $9.28 | | | | $3.83 | | | | $0.01 | | | | $5.87 | |
| | | | | |
| Less distributions declared to shareholders | | | | | | | | | | | | | | | | | | | | |
From net investment income | | | $(0.63 | ) | | | $(0.66 | ) | | | $(0.63 | ) | | | $(0.72 | ) | | | $(0.71 | ) |
From net realized gain | | | (4.79 | ) | | | (1.09 | ) | | | (5.20 | ) | | | (4.21 | ) | | | — | |
Total distributions declared to shareholders | | | $(5.42 | ) | | | $(1.75 | ) | | | $(5.83 | ) | | | $(4.93 | ) | | | $(0.71 | ) |
Net asset value, end of period (x) | | | $44.87 | | | | $53.79 | | | | $46.26 | | | | $48.26 | | | | $53.18 | |
Total return (%) (k)(r)(s)(x) | | | (7.99 | ) | | | 20.47 | | | | 8.17 | (c) | | | 0.87 | | | | 12.28 | |
| | | | | |
Ratios (%) (to average net assets)
and Supplemental data: | | | | | | | | | | | | | | | | | | | | |
Expenses before expense reductions (f) | | | 0.70 | | | | 0.71 | | | | 0.74 | (c) | | | 0.85 | | | | 0.85 | |
Expenses after expense reductions (f) | | | 0.69 | | | | 0.70 | | | | 0.69 | (c) | | | 0.70 | | | | 0.70 | |
Net investment income (loss) | | | 1.14 | | | | 1.10 | | | | 1.30 | (c) | | | 1.20 | | | | 1.28 | |
Portfolio turnover | | | 54 | | | | 51 | | | | 49 | | | | 51 | | | | 41 | |
Net assets at end of period (000 omitted) | | | $157,522 | | | | $182,103 | | | | $169,622 | | | | $143,427 | | | | $116,301 | |
See Notes to Financial Statements
12
MFS Blended Research Core Equity Portfolio
Financial Highlights – continued
| (c) | Amount reflects aone-time reimbursement of expenses by the custodian (or former custodian) without which net investment income and performance would be lower and expenses would be higher. |
| (d) | Per share data is based on average shares outstanding. |
| (f) | Ratios do not reflect reductions from fees paid indirectly, if applicable. |
| (k) | The total return does not reflect expenses that apply to separate accounts. Inclusion of these charges would reduce the total return figures for all periods shown. |
| (r) | Certain expenses have been reduced without which performance would have been lower. |
| (s) | From time to time the fund may receive proceeds from litigation settlements, without which performance would be lower. |
| (x) | The net asset values and total returns have been calculated on net assets which include adjustments made in accordance with U.S. generally accepted accounting principles required at period end for financial reporting purposes. |
See Notes to Financial Statements
13
MFS Blended Research Core Equity Portfolio
NOTES TO FINANCIAL STATEMENTS
| (1) | | Business and Organization |
MFS Blended Research Core Equity Portfolio (the fund) is a diversified series of MFS Variable Insurance Trust II (the trust). The trust is organized as a Massachusetts business trust and is registered under the Investment Company Act of 1940, as amended, as anopen-end management investment company. The shareholders of each series of the trust are separate accounts of insurance companies, which offer variable annuity and/or life insurance products, and qualified retirement and pension plans.
The fund is an investment company and accordingly follows the investment company accounting and reporting guidance of the Financial Accounting Standards Board (FASB) Accounting Standards Codification Topic 946 Financial Services – Investment Companies.
| (2) | | Significant Accounting Policies |
General– The preparation of financial statements in conformity with U.S. generally accepted accounting principles requires management to make estimates and assumptions that affect the reported amounts of assets and liabilities, and disclosure of contingent assets and liabilities at the date of the financial statements and the reported amounts of increases and decreases in net assets from operations during the reporting period. Actual results could differ from those estimates. In the preparation of these financial statements, management has evaluated subsequent events occurring after the date of the fund’s Statement of Assets and Liabilities through the date that the financial statements were issued.
In August 2018, the FASB issued Accounting Standards Update2018-13, Fair Value Measurement (Topic 820) – Disclosure Framework – Changes to the Disclosure Requirements for Fair Value Measurement (“ASU2018-13”) which introduces new fair value disclosure requirements as well as eliminates and modifies certain existing fair value disclosure requirements. ASU2018-13 would be effective for fiscal years beginning after December 15, 2019, and interim periods within those fiscal years; however, management has elected to early adopt ASU2018-13 effective with the current reporting period. The impact of the fund’s adoption was limited to changes in the fund’s financial statement disclosures regarding fair value, primarily those disclosures related to transfers between levels of the fair value hierarchy.
In August 2018, the Securities and Exchange Commission (SEC) released its Final Rule on Disclosure Update and Simplification (the “Final Rule”) which is intended to simplify an issuer’s disclosure compliance efforts by removing redundant or outdated disclosure requirements without significantly altering the mix of information provided to investors. Effective with the current reporting period, the fund adopted the Final Rule with the impacts being that the fund is no longer required to present the components of distributable earnings on the Statement of Assets and Liabilities or the sources of distributions to shareholders and the amount of undistributed net investment income on the Statements of Changes in Net Assets.
Balance Sheet Offsetting– The fund’s accounting policy with respect to balance sheet offsetting is that, absent an event of default by the counterparty or a termination of the agreement, the International Swaps and Derivatives Association (ISDA) Master Agreement, or similar agreement, does not result in an offset of reported amounts of financial assets and financial liabilities in the Statement of Assets and Liabilities across transactions between the fund and the applicable counterparty. The fund’s right to setoff may be restricted or prohibited by the bankruptcy or insolvency laws of the particular jurisdiction to which a specific master netting agreement counterparty is subject. Balance sheet offsetting disclosures, to the extent applicable to the fund, have been included in the fund’s Significant Accounting Policies note under the captions for each of the fund’sin-scope financial instruments and transactions.
Investment Valuations– Equity securities, including restricted equity securities, are generally valued at the last sale or official closing price on their primary market or exchange as provided by a third-party pricing service. Equity securities, for which there were no sales reported that day, are generally valued at the last quoted daily bid quotation on their primary market or exchange as provided by a third-party pricing service. Short-term instruments with a maturity at issuance of 60 days or less may be valued at amortized cost, which approximates market value.Open-end investment companies are generally valued at net asset value per share. Securities and other assets generally valued on the basis of information from a third-party pricing service may also be valued at a broker/dealer bid quotation. In determining values, third-party pricing services can utilize both transaction data and market information such as yield, quality, coupon rate, maturity, type of issue, trading characteristics, and other market data.
The Board of Trustees has delegated primary responsibility for determining or causing to be determined the value of the fund’s investments (including any fair valuation) to the adviser pursuant to valuation policies and procedures approved by the Board. If the adviser determines that reliable market quotations are not readily available, investments are valued at fair value as determined in good faith by the adviser in accordance with such procedures under the oversight of the Board of Trustees. Under the fund’s valuation policies and procedures, market quotations are not considered to be readily available for most types of debt instruments and floating rate loans and many types of derivatives. These investments are generally valued at fair value based on information from third-party pricing services. In addition, investments may be valued at fair value if the adviser determines that an investment’s value has been materially affected by events occurring after the close of the exchange or market on which the investment is principally traded (such as foreign exchange or market) and prior to the determination of the fund’s net asset value, or after the halting of
14
MFS Blended Research Core Equity Portfolio
Notes to Financial Statements – continued
trading of a specific security where trading does not resume prior to the close of the exchange or market on which the security is principally traded. Events that occur on a frequent basis after foreign markets close (such as developments in foreign markets and significant movements in the U.S. markets) and prior to the determination of the fund’s net asset value may be deemed to have a material effect on the value of securities traded in foreign markets. Accordingly, the fund’s foreign equity securities may often be valued at fair value. The adviser generally relies on third-party pricing services or other information (such as the correlation with price movements of similar securities in the same or other markets; the type, cost and investment characteristics of the security; the business and financial condition of the issuer; and trading and other market data) to assist in determining whether to fair value and at what value to fair value an investment. The value of an investment for purposes of calculating the fund’s net asset value can differ depending on the source and method used to determine value. When fair valuation is used, the value of an investment used to determine the fund’s net asset value may differ from quoted or published prices for the same investment. There can be no assurance that the fund could obtain the fair value assigned to an investment if it were to sell the investment at the same time at which the fund determines its net asset value per share.
Various inputs are used in determining the value of the fund’s assets or liabilities. These inputs are categorized into three broad levels. In certain cases, the inputs used to measure fair value may fall into different levels of the fair value hierarchy. In such cases, an investment’s level within the fair value hierarchy is based on the lowest level of input that is significant to the fair value measurement. The fund’s assessment of the significance of a particular input to the fair value measurement in its entirety requires judgment, and considers factors specific to the investment. Level 1 includes unadjusted quoted prices in active markets for identical assets or liabilities. Level 2 includes other significant observable market-based inputs (including quoted prices for similar securities, interest rates, prepayment speed, and credit risk). Level 3 includes unobservable inputs, which may include the adviser’s own assumptions in determining the fair value of investments. The following is a summary of the levels used as of December 31, 2018 in valuing the fund’s assets or liabilities:
| | | | | | | | | | | | | | | | |
| Financial Instruments | | Level 1 | | | Level 2 | | | Level 3 | | | Total | |
| Equity Securities | | | $410,827,132 | | | | $— | | | | $— | | | | $410,827,132 | |
| Mutual Funds | | | 3,121,333 | | | | — | | | | — | | | | 3,121,333 | |
| Total | | | $413,948,465 | | | | $— | | | | $— | | | | $413,948,465 | |
For further information regarding security characteristics, see the Portfolio of Investments.
Indemnifications– Under the fund’s organizational documents, its officers and Trustees may be indemnified against certain liabilities and expenses arising out of the performance of their duties to the fund. Additionally, in the normal course of business, the fund enters into agreements with service providers that may contain indemnification clauses. The fund’s maximum exposure under these agreements is unknown as this would involve future claims that may be made against the fund that have not yet occurred.
Investment Transactions and Income– Investment transactions are recorded on the trade date. Dividends received in cash are recorded on theex-dividend date. Certain dividends from foreign securities will be recorded when the fund is informed of the dividend if such information is obtained subsequent to theex-dividend date. Dividend payments received in additional securities are recorded on theex-dividend date in an amount equal to the value of the security on such date.
The fund may receive proceeds from litigation settlements. Any proceeds received from litigation involving portfolio holdings are reflected in the Statement of Operations in realized gain/loss if the security has been disposed of by the fund or in unrealized gain/loss if the security is still held by the fund. Any other proceeds from litigation not related to portfolio holdings are reflected as other income in the Statement of Operations.
Tax Matters and Distributions– The fund intends to qualify as a regulated investment company, as defined under Subchapter M of the Internal Revenue Code, and to distribute all of its taxable income, including realized capital gains. As a result, no provision for federal income tax is required. The fund’s federal tax returns, when filed, will remain subject to examination by the Internal Revenue Service for a three year period. Management has analyzed the fund’s tax positions taken on federal and state tax returns for all open tax years and does not believe that there are any uncertain tax positions that require recognition of a tax liability. Foreign taxes, if any, have been accrued by the fund in the accompanying financial statements in accordance with the applicable foreign tax law. Foreign income taxes may be withheld by certain countries in which the fund invests. Additionally, capital gains realized by the fund on securities issued in or by certain foreign countries may be subject to capital gains tax imposed by those countries.
Distributions to shareholders are recorded on theex-dividend date. Income and capital gain distributions are determined in accordance with income tax regulations, which may differ from U.S. generally accepted accounting principles. Certain capital accounts in the financial statements are periodically adjusted for permanent differences in order to reflect their tax character. These adjustments have no impact on net assets or net asset value per share. Temporary differences which arise from recognizing certain items of income, expense, gain or loss in different periods for financial statement and tax purposes will reverse at some time in the future. Distributions in excess of net investment income or net realized gains are temporary overdistributions for financial statement purposes resulting from differences in the recognition or classification of income or distributions for financial statement and tax purposes.
15
MFS Blended Research Core Equity Portfolio
Notes to Financial Statements – continued
Book/tax differences primarily relate to wash sale loss deferrals.
The tax character of distributions declared to shareholders for the last two fiscal years is as follows:
| | | | | | | | |
| | | Year ended
12/31/18 | | | Year ended
12/31/17 | |
| Ordinary income (including any short-term capital gains) | | | $6,509,038 | | | | $6,939,009 | |
| Long-term capital gains | | | 40,678,039 | | | | 10,294,078 | |
| Total distributions | | | $47,187,077 | | | | $17,233,087 | |
The federal tax cost and the tax basis components of distributable earnings were as follows:
| | | | |
| As of 12/31/18 | | | | |
| |
| Cost of investments | | | $361,688,628 | |
| Gross appreciation | | | 71,563,454 | |
| Gross depreciation | | | (19,303,617 | ) |
| Net unrealized appreciation (depreciation) | | | $52,259,837 | |
| |
| Undistributed ordinary income | | | 6,264,931 | |
| Undistributed long-term capital gain | | | 33,871,487 | |
Multiple Classes of Shares of Beneficial Interest– The fund offers multiple classes of shares, which differ in their respective distribution and/or service fees. The fund’s income, realized and unrealized gain (loss), and common expenses are allocated to shareholders based on the daily net assets of each class. Dividends are declared separately for each class. Differences in per share dividend rates are generally due to differences in separate class expenses. The fund’s distributions declared to shareholders as reported in the Statements of Changes in Net Assets are presented by class as follows:
| | | | | | | | | | | | | | | | |
| | | From net investment
income | | | From net realized
gain | |
| | | | |
| | | Year ended
12/31/18 | | | Year ended
12/31/17 | | | Year ended
12/31/18 | | | Year ended
12/31/17 | |
| Initial Class | | | $4,125,022 | | | | $4,671,636 | | | | $25,645,863 | | | | $6,553,119 | |
| Service Class | | | 2,036,008 | | | | 2,267,373 | | | | 15,380,184 | | | | 3,740,959 | |
| Total | | | $6,161,030 | | | | $6,939,009 | | | | $41,026,047 | | | | $10,294,078 | |
| (3) | | Transactions with Affiliates |
Investment Adviser– The fund has an investment advisory agreement with MFS to provide overall investment management and related administrative services and facilities to the fund. The management fee is computed daily and paid monthly at the following annual rates based on the fund’s average daily net assets:
| | | | |
| Up to $1 billion | | | 0.40% | |
| In excess of $1 billion and up to $2.5 billion | | | 0.375% | |
| In excess of $2.5 billion | | | 0.35% | |
MFS has agreed in writing to reduce its management fee by a specified amount if certain MFS mutual fund assets exceed thresholds agreed to by MFS and the fund’s Board of Trustees. For the year ended December 31, 2018, this management fee reduction amounted to $46,012, which is included in the reduction of total expenses in the Statement of Operations. The management fee incurred for the year ended December 31, 2018 was equivalent to an annual effective rate of 0.39% of the fund’s average daily net assets.
Distributor– MFS Fund Distributors, Inc. (MFD), a wholly-owned subsidiary of MFS, is the distributor of shares of the fund. The Trustees have adopted a distribution plan for the Service Class shares pursuant to Rule12b-1 under the Investment Company Act of 1940.
The fund’s distribution plan provides that the fund will pay MFD distribution and/or service fees equal to 0.25% per annum of its average daily net assets attributable to Service Class shares as partial consideration for services performed and expenses incurred by MFD and financial intermediaries (including participating insurance companies that invest in the fund to fund variable annuity and variable life insurance contracts, sponsors of qualified retirement and pension plans that invest in the fund, and affiliates of these participating insurance companies and plan sponsors) in connection with the sale and distribution of the Service Class shares. MFD may subsequently pay all, or a portion, of the distribution and/or service fees to financial intermediaries.
Shareholder Servicing Agent– MFS Service Center, Inc. (MFSC), a wholly-owned subsidiary of MFS, receives a fee from the fund for its services as shareholder servicing agent. For the year ended December 31, 2018, the fee was $14,606, which equated to 0.0030% annually of the fund’s average daily net assets. MFSC also receives payment from the fund forout-of-pocket expenses paid by MFSC on behalf of the fund. For the year ended December 31, 2018, these costs amounted to $668.
16
MFS Blended Research Core Equity Portfolio
Notes to Financial Statements – continued
Administrator– MFS provides certain financial, legal, shareholder communications, compliance, and other administrative services to the fund. Under an administrative services agreement, the fund reimburses MFS the costs incurred to provide these services. The fund is charged an annual fixed amount of $17,500 plus a fee based on average daily net assets. The administrative services fee incurred for the year ended December 31, 2018 was equivalent to an annual effective rate of 0.0163% of the fund’s average daily net assets.
Trustees’ and Officers’ Compensation– The fund pays compensation to independent Trustees in the form of a retainer, attendance fees, and additional compensation to Board and Committee chairpersons. The fund does not pay compensation directly to Trustees or officers of the fund who are also officers of the investment adviser, all of whom receive remuneration for their services to the fund from MFS. Certain officers and Trustees of the fund are officers or directors of MFS, MFD, and MFSC.
Other– This fund and certain other funds managed by MFS (the funds) have entered into a service agreement (the ISO Agreement) which provides for payment of fees solely by the funds to Tarantino LLC in return for the provision of services of an Independent Senior Officer (ISO) for the funds. Frank L. Tarantino serves as the ISO and is an officer of the funds and the sole member of Tarantino LLC. The funds can terminate the ISO Agreement with Tarantino LLC at any time under the terms of the ISO Agreement. For the year ended December 31, 2018, the fee paid by the fund under this agreement was $824 and is included in “Miscellaneous” expense in the Statement of Operations. MFS has agreed to bear all expenses associated with office space, other administrative support, and supplies provided to the ISO.
The fund invests in the MFS Institutional Money Market Portfolio which is managed by MFS and seeks current income consistent with preservation of capital and liquidity. This money market fund does not pay a management fee to MFS.
The fund is permitted to engage in purchase and sale transactions with funds and accounts for which MFS serves as investment adviser orsub-adviser (“cross-trades”) pursuant to a policy adopted by the Board of Trustees. This policy has been designed to ensure that cross-trades conducted by the fund comply with Rule17a-7 under the Investment Company Act of 1940. During the year ended December 31, 2018, the fund engaged in purchase transactions pursuant to this policy, which amounted to $848,311.
Effective on or about January 3, 2018, the adviser has voluntarily undertaken to reimburse the fund from its own resources on a quarterly basis for the cost of investment research embedded in the cost of the fund’s securities trades. This agreement may be rescinded at any time. For the period on or about January 3, 2018 to December 31, 2018, this reimbursement amounted to $23,945, which is included in “Other” income in the Statement of Operations.
For the year ended December 31, 2018, purchases and sales of investments, other than short-term obligations, aggregated $259,264,466 and $307,859,618, respectively.
| (5) | | Shares of Beneficial Interest |
The fund’s Declaration of Trust permits the Trustees to issue an unlimited number of full and fractional shares of beneficial interest. Transactions in fund shares were as follows:
| | | | | | | | | | | | | | | | |
| | | Year ended 12/31/18 | | | Year ended 12/31/17 | |
| | | Shares | | | Amount | | | Shares | | | Amount | |
| Shares sold | | | | | | | | | | | | | | | | |
Initial Class | | | 98,132 | | | | $5,079,123 | | | | 84,685 | | | | $4,227,596 | |
Service Class | | | 253,350 | | | | 13,012,309 | | | | 167,159 | | | | 8,469,294 | |
| | | 351,482 | | | | $18,091,432 | | | | 251,844 | | | | $12,696,890 | |
| Shares issued to shareholders in reinvestment of distributions | | | | | | | | | | | | | | | | |
Initial Class | | | 552,893 | | | | $29,330,972 | | | | 225,279 | | | | $11,063,474 | |
Service Class | | | 331,043 | | | | 17,416,192 | | | | 123,248 | | | | 6,008,332 | |
| | | 883,936 | | | | $46,747,164 | | | | 348,527 | | | | $17,071,806 | |
| Shares reacquired | | | | | | | | | | | | | | | | |
Initial Class | | | (896,433 | ) | | | $(48,014,750 | ) | | | (973,435 | ) | | | $(49,201,989 | ) |
Service Class | | | (459,784 | ) | | | (24,614,532 | ) | | | (571,295 | ) | | | (28,663,828 | ) |
| | | (1,356,217 | ) | | | $(72,629,282 | ) | | | (1,544,730 | ) | | | $(77,865,817 | ) |
| Net change | | | | | | | | | | | | | | | | |
Initial Class | | | (245,408 | ) | | | $(13,604,655 | ) | | | (663,471 | ) | | | $(33,910,919 | ) |
Service Class | | | 124,609 | | | | 5,813,969 | | | | (280,888 | ) | | | (14,186,202 | ) |
| | | (120,799 | ) | | | $(7,790,686 | ) | | | (944,359 | ) | | | $(48,097,121 | ) |
17
MFS Blended Research Core Equity Portfolio
Notes to Financial Statements – continued
The fund and certain other funds managed by MFS participate in a $1.25 billion unsecured committed line of credit, subject to a $1 billion sublimit, provided by a syndication of banks under a credit agreement. Borrowings may be made for temporary financing needs. Interest is charged to each fund, based on its borrowings, generally at a rate equal to the higher of the Overnight Bank Funding rate or daily one month LIBOR plus an agreed upon spread. A commitment fee, based on the average daily, unused portion of the committed line of credit, is allocated among the participating funds. In addition, the fund and other funds managed by MFS have established unsecured uncommitted borrowing arrangements with certain banks for temporary financing needs. Interest is charged to each fund, based on its borrowings, at a rate equal to the Overnight Bank Funding rate plus an agreed upon spread. For the year ended December 31, 2018, the fund’s commitment fee and interest expense were $2,825 and $0, respectively, and are included in “Miscellaneous” expense in the Statement of Operations.
| (7) | | Investments in Affiliated Issuers |
An affiliated issuer may be considered one in which the fund owns 5% or more of the outstanding voting securities, or a company which is under common control. For the purposes of this report, the fund assumes the following to be affiliated issuers:
| | | | | | | | | | | | | | | | | | |
| Affiliated Issuers | | | | Beginning
Shares/Par
Amount | | | Acquisitions
Shares/Par
Amount | | | Dispositions
Shares/Par
Amount | | | Ending
Shares/Par
Amount | |
| | | | | |
| MFS Institutional Money Market Portfolio | | | | | 2,531,684 | | | | 58,659,419 | | | | (58,069,458 | ) | | | 3,121,645 | |
| | | | | |
| Affiliated Issuers | | Realized
Gain (Loss) | | Change in
Unrealized
Appreciation/
Depreciation | | | Capital Gain
Distributions | | | Dividend
Income | | | Ending
Value | |
| | | | | |
| MFS Institutional Money Market Portfolio | | $(748) | | | $— | | | | $— | | | | $54,256 | | | | $3,121,333 | |
18
MFS Blended Research Core Equity Portfolio
REPORT OF INDEPENDENT REGISTERED PUBLIC ACCOUNTING FIRM
To the Board of Trustees of MFS Variable Insurance Trust II and the Shareholders of MFS Blended Research Core Equity Portfolio:
Opinion on the Financial Statements and Financial Highlights
We have audited the accompanying statement of assets and liabilities of MFS Blended Research Core Equity Portfolio (the “Fund”), including the portfolio of investments, as of December 31, 2018, the related statement of operations for the year then ended, the statements of changes in net assets for each of the two years in the period then ended, the financial highlights for each of the five years in the period then ended, and the related notes. In our opinion, the financial statements and financial highlights present fairly, in all material respects, the financial position of the Fund as of December 31, 2018, and the results of its operations for the year then ended, the changes in its net assets for each of the two years in the period then ended, and the financial highlights for each of the five years in the period then ended, in conformity with accounting principles generally accepted in the United States of America.
Basis for Opinion
These financial statements and financial highlights are the responsibility of the Fund’s management. Our responsibility is to express an opinion on the Fund’s financial statements and financial highlights based on our audits. We are a public accounting firm registered with the Public Company Accounting Oversight Board (United States) (PCAOB) and are required to be independent with respect to the Fund in accordance with the U.S. federal securities laws and the applicable rules and regulations of the Securities and Exchange Commission and the PCAOB.
We conducted our audits in accordance with the standards of the PCAOB. Those standards require that we plan and perform the audit to obtain reasonable assurance about whether the financial statements and financial highlights are free of material misstatement, whether due to error or fraud. The Fund is not required to have, nor were we engaged to perform, an audit of its internal control over financial reporting. As part of our audits we are required to obtain an understanding of internal control over financial reporting but not for the purpose of expressing an opinion on the effectiveness of the Fund’s internal control over financial reporting. Accordingly, we express no such opinion.
Our audits included performing procedures to assess the risks of material misstatement of the financial statements and financial highlights, whether due to error or fraud, and performing procedures that respond to those risks. Such procedures included examining, on a test basis, evidence regarding the amounts and disclosures in the financial statements and financial highlights. Our audits also included evaluating the accounting principles used and significant estimates made by management, as well as evaluating the overall presentation of the financial statements and financial highlights. Our procedures included confirmation of securities owned as of December 31, 2018, by correspondence with the custodian. We believe that our audits provide a reasonable basis for our opinion.
DELOITTE & TOUCHE LLP
Boston, Massachusetts
February 15, 2019
We have served as the auditor of one or more of the MFS investment companies since 1924.
19
MFS Blended Research Core Equity Portfolio
TRUSTEES AND OFFICERS – IDENTIFICATION AND BACKGROUND
The Trustees and Officers of the Trust, as of February 1, 2019, are listed below, together with their principal occupations during the past five years. (Their titles may have varied during that period.) The address of each Trustee and Officer is 111 Huntington Avenue, Boston, Massachusetts 02199-7618.
| | | | | | | | | | |
Name, Age | | Position(s)
Held with Fund | | Trustee/Officer
Since (h) | | Number of MFS Funds overseen by the Trustee | | Principal Occupations
During the Past Five Years | | Other Directorships During the Past Five Years (j) |
| INTERESTED TRUSTEES |
Robert J. Manning (k) (age 55) | | Trustee | | February 2004 | | 135 | | Massachusetts Financial Services Company, Executive Chairman (since January 2017); Director; Chairman of the Board; Chief Executive Officer (until 2015);Co-Chief Executive Officer(2015-2016) | | N/A |
| | | | | |
Robin A. Stelmach (k) (age 57) | | Trustee | | January 2014 | | 135 | | Massachusetts Financial Services Company, Vice Chair (since January 2017); Chief Operating Officer and Executive Vice President (until January 2017) | | N/A |
|
| INDEPENDENT TRUSTEES |
John P. Kavanaugh (age 64) | | Trustee and Chair of Trustees | | January 2009 | | 135 | | Private investor | | N/A |
| | | | | |
Steven E. Buller (age 67) | | Trustee | | February 2014 | | 135 | | Financial Accounting Standards Advisory Council, Chairman(2014-2015); Public Company Accounting Oversight Board, Standing Advisory Group, Member (until 2014); BlackRock, Inc. (investment management), Managing Director (until 2014), BlackRock Finco UK (investment management), Director (until 2014) | | N/A |
| | | | | |
John A. Caroselli (age 64) | | Trustee | | March 2017 | | 135 | | JC Global Advisors, LLC (management consulting), President (since 2015); First Capital Corporation (commercial finance), Executive Vice President (until 2015) | | N/A |
| | | | | |
Maureen R. Goldfarb (age 63) | | Trustee | | January 2009 | | 135 | | Private investor | | N/A |
| | | | | |
Michael Hegarty (age 74) | | Trustee | | December 2004 | | 135 | | Private investor | | Rouse Properties Inc., Director (until 2016); Capmark Financial Group Inc., Director (until 2015) |
| | | | | |
Peter D. Jones (age 63) | | Trustee | | January 2019 | | 135 | | Franklin Templeton Distributors, Inc. (investment management), President (until 2015); Franklin Templeton Institutional, LLC (investment management), Chairman (until 2015) | | N/A |
| | | | | |
James W. Kilman, Jr. (age 57) | | Trustee | | January 2019 | | 135 | | KielStrand Capital LLC (family office and merchant bank), Chief Executive Officer (since 2016); Morgan Stanley & Co. (financial services), Vice Chairman of Investment Banking,Co-Head of Diversified Financials Coverage – Financial Institutions Investment Banking Group (until 2016) | | alpha-En Corporation, Director (since 2016) |
20
MFS Blended Research Core Equity Portfolio
Trustees and Officers – continued
| | | | | | | | | | |
Name, Age | | Position(s)
Held with Fund | | Trustee/Officer
Since (h) | | Number of MFS Funds overseen by the Trustee | | Principal Occupations
During the Past Five Years | | Other Directorships During the Past Five Years (j) |
Clarence Otis, Jr. (age 62) | | Trustee | | March 2017 | | 135 | | Darden Restaurants, Inc., Chief Executive Officer (until 2014) | | VF Corporation, Director; Verizon Communications, Inc., Director; The Travelers Companies, Director; Federal Reserve Bank of Atlanta, Director (until 2015) |
| | | | | |
Maryanne L. Roepke (age 62) | | Trustee | | May 2014 | | 135 | | American Century Investments (investment management), Senior Vice President and Chief Compliance Officer (until 2014) | | N/A |
| | | | | |
Laurie J. Thomsen
(age 61) | | Trustee | | March 2005 | | 135 | | Private investor | | The Travelers Companies, Director; Dycom Industries, Inc., Director (since 2015) |
| | | | | | | | |
Name, Age | | Position(s)
Held with Fund | | Trustee/Officer
Since (h) | | Number of MFS Funds for which the Person is an Officer | | Principal Occupations During the Past Five Years |
| OFFICERS | | | | | | |
Christopher R. Bohane (k)
(age 45) | | Assistant Secretary and Assistant Clerk | | July 2005 | | 135 | | Massachusetts Financial Services Company, Vice President and Assistant General Counsel |
| | | | |
Kino Clark (k) (age 50) | | Assistant Treasurer | | January 2012 | | 135 | | Massachusetts Financial Services Company, Vice President |
| | | | |
John W. Clark, Jr. (k) (age 51) | | Assistant Treasurer | | April 2017 | | 135 | | Massachusetts Financial Services Company, Vice President (since March 2017); Deutsche Bank (financial services), Department Head – Treasurer’s Office (until February 2017) |
| | | | |
Thomas H. Connors (k) (age 59) | | Assistant Secretary and Assistant Clerk | | September 2012 | | 135 | | Massachusetts Financial Services Company, Vice President and Senior Counsel |
| | | | |
Ethan D. Corey (k)
(age 55) | | Assistant
Secretary and Assistant Clerk | | July 2005 | | 135 | | Massachusetts Financial Services Company, Senior Vice President and Associate General Counsel |
| | | | |
David L. DiLorenzo (k)
(age 50) | | President | | July 2005 | | 135 | | Massachusetts Financial Services Company, Senior Vice President |
| | | | |
Heidi W. Hardin (k) (age 51) | | Secretary and Clerk | | April 2017 | | 135 | | Massachusetts Financial Services Company, Executive Vice President and General Counsel (since March 2017); Harris Associates (investment management), General Counsel (from September 2015 to January 2017); Janus Capital Management LLC (investment management), Senior Vice President and General Counsel (until September 2015) |
| | | | |
Brian E. Langenfeld (k) (age 45) | | Assistant
Secretary and Assistant Clerk | | June 2006 | | 135 | | Massachusetts Financial Services Company, Vice President and Senior Counsel |
| | | | |
Amanda S. Mooradian (k) (age 39) | | Assistant
Secretary and Assistant Clerk | | September 2018 | | 135 | | Massachusetts Financial Services Company, Assistant Vice President and Counsel |
| | | | |
Susan A. Pereira (k)
(age 48) | | Assistant
Secretary and Assistant Clerk | | July 2005 | | 135 | | Massachusetts Financial Services Company, Vice President and Senior Counsel |
| | | | |
Kasey L. Phillips (k) (age 48) | | Assistant Treasurer | | September 2012 | | 135 | | Massachusetts Financial Services Company, Vice President |
| | | | |
Matthew A. Stowe (k) (age 44) | | Assistant Secretary and Assistant Clerk | | October 2014 | | 135 | | Massachusetts Financial Services Company, Vice President and Assistant General Counsel |
21
MFS Blended Research Core Equity Portfolio
Trustees and Officers – continued
| | | | | | | | |
Name, Age | | Position(s)
Held with Fund | | Trustee/Officer
Since (h) | | Number of MFS Funds for which the Person is an Officer | | Principal Occupations During the Past Five Years |
Frank L. Tarantino
(age 74) | | Independent
Senior Officer | | June 2004 | | 135 | | Tarantino LLC (provider of compliance services), Principal |
| | | | |
Richard S. Weitzel (k)
(age 48) | | Assistant Secretary and Assistant Clerk | | October 2007 | | 135 | | Massachusetts Financial Services Company, Senior Vice President and Associate General Counsel |
| | | | |
Martin J. Wolin (k) (age 51) | | Chief Compliance Officer | | July 2015 | | 135 | | Massachusetts Financial Services Company, Senior Vice President and Chief Compliance Officer (since July 2015); Mercer (financial service provider), Chief Risk and Compliance Officer, North America and Latin America (until June 2015) |
| | | | |
James O. Yost (k)
(age 58) | | Treasurer | | September 1990 | | 135 | | Massachusetts Financial Services Company, Senior Vice President |
| (h) | Date first appointed to serve as Trustee/officer of an MFS Fund. Each Trustee has served continuously since appointment unless indicated otherwise. For the period from December 15, 2004 until February 22, 2005, Mr. Manning served as Advisory Trustee. From January 2012 through December 2016, Messrs. DiLorenzo and Yost served as Treasurer and Deputy Treasurer of the Funds, respectively. |
| (j) | Directorships or trusteeships of companies required to report to the Securities and Exchange Commission (i.e., “public companies”). |
| (k) | “Interested person” of the Trust within the meaning of the Investment Company Act of 1940 (referred to as the 1940 Act), which is the principal federal law governing investment companies like the fund, as a result of a position with MFS. The address of MFS is 111 Huntington Avenue, Boston, Massachusetts 02199-7618. |
Each Trustee has been elected by shareholders and each Trustee and officer holds office until his or her successor is chosen and qualified or until his or her earlier death, resignation, retirement or removal. The Trust does not hold annual meetings for the purpose of electing Trustees, and Trustees are not elected for fixed terms. Under the terms of the Board’s retirement policy, an Independent Trustee shall retire at the end of the calendar year in which he or she reaches the earlier of 75 years of age or 15 years of service on the Board (or, in the case of any Independent Trustee who joined the Board prior to 2015, 20 years of service on the Board).
Messrs. Buller, Hegarty, Kilman and Otis and Ms. Roepke are members of the Trust’s Audit Committee.
Each of the Interested Trustees and certain Officers hold comparable officer positions with certain affiliates of MFS.
The Statement of Additional Information for a Fund includes further information about the Trustees and is available without charge upon request by calling1-800-225-2606.
| | |
Investment Adviser Massachusetts Financial Services Company 111 Huntington Avenue Boston, MA 02199-7618 | | Custodian State Street Bank and Trust Company 1 Lincoln Street Boston, MA 02111-2900 |
Distributor MFS Fund Distributors, Inc. 111 Huntington Avenue Boston, MA 02199-7618 | | Independent Registered Public Accounting Firm Deloitte & Touche LLP 200 Berkeley Street Boston, MA 02116 |
Portfolio Manager(s) Jim Fallon Matt Krummell Jonathan Sage Jed Stocks | | |
22
MFS Blended Research Core Equity Portfolio
BOARD REVIEW OF INVESTMENT ADVISORY AGREEMENT
The Investment Company Act of 1940 requires that both the full Board of Trustees and a majority of thenon-interested (“independent”) Trustees, voting separately, annually approve the continuation of the Fund’s investment advisory agreement with MFS. The Trustees consider matters bearing on the Fund and its advisory arrangements at their meetings throughout the year, including a review of performance data at each regular meeting. In addition, the independent Trustees met several times over the course of three months beginning in May and ending in July, 2018 (“contract review meetings”) for the specific purpose of considering whether to approve the continuation of the investment advisory agreement for the Fund and the other investment companies that the Board oversees (the “MFS Funds”). The independent Trustees were assisted in their evaluation of the Fund’s investment advisory agreement by independent legal counsel, from whom they received separate legal advice and with whom they met separately from MFS during various contract review meetings. The independent Trustees were also assisted in this process by the MFS Funds’ Independent Senior Officer, a senior officer appointed by and reporting to the independent Trustees.
In connection with their deliberations regarding the continuation of the investment advisory agreement, the Trustees, including the independent Trustees, considered such information and factors as they believed, in light of the legal advice furnished to them and their own business judgment, to be relevant. The investment advisory agreement for the Fund was considered separately, although the Trustees also took into account the common interests of all MFS Funds in their review. As described below, the Trustees considered the nature, quality, and extent of the various investment advisory, administrative, and shareholder services performed by MFS under the existing investment advisory agreement and other arrangements with the Fund.
In connection with their contract review meetings, the Trustees received and relied upon materials that included, among other items: (i) information provided by Broadridge Financial Solutions, Inc. (“Broadridge”), an independent third party, on the investment performance of the Fund for various time periods ended December 31, 2017 and the investment performance of a group of funds with substantially similar investment classifications/objectives (the “Broadridge performance universe”), (ii) information provided by Broadridge on the Fund’s advisory fees and other expenses and the advisory fees and other expenses of comparable funds identified by Broadridge (the “Broadridge expense group”), (iii) information provided by MFS on the advisory fees of portfolios of other clients of MFS, including institutional separate accounts and other clients, (iv) information as to whether and to what extent applicable expense waivers, reimbursements or fee “breakpoints” are observed for the Fund, (v) information regarding MFS’ financial results and financial condition, including MFS’ and certain of its affiliates’ estimated profitability from services performed for the Fund and the MFS Funds as a whole, and compared to MFS’ institutional business, (vi) MFS’ views regarding the outlook for the mutual fund industry and the strategic business plans of MFS, (vii) descriptions of various functions performed by MFS for the Funds, such as compliance monitoring and portfolio trading practices, and (viii) information regarding the overall organization of MFS, including information about MFS’ senior management and other personnel providing investment advisory, administrative and other services to the Fund and the other MFS Funds. The comparative performance, fee and expense information prepared and provided by Broadridge was not independently verified and the independent Trustees did not independently verify any information provided to them by MFS.
The Trustees’ conclusion as to the continuation of the investment advisory agreement was based on a comprehensive consideration of all information provided to the Trustees and not the result of any single factor. Some of the factors that figured particularly in the Trustees’ deliberations are described below, although individual Trustees may have evaluated the information presented differently from one another, giving different weights to various factors. It is also important to recognize that the fee arrangements for the Fund and other MFS Funds are the result of years of review and discussion between the independent Trustees and MFS, that certain aspects of such arrangements may receive greater scrutiny in some years than in others, and that the Trustees’ conclusions may be based, in part, on their consideration of these same arrangements during the course of the year and in prior years.
Based on information provided by Broadridge and MFS, the Trustees reviewed the Fund’s total return investment performance as well as the Broadridge performance universe over various time periods. The Trustees placed particular emphasis on the total return performance of the Fund’s Initial Class shares in comparison to the performance of funds in its Broadridge performance universe over the three-year period ended December 31, 2017, which the Trustees believed was a long enough period to reflect differing market conditions. The total return performance of the Fund’s Initial Class shares was in the 4th quintile relative to the other funds in the universe for this three-year period (the 1st quintile being the best performers and the 5th quintile being the worst performers). The total return performance of the Fund’s Initial Class shares was in the 3rd quintile for theone-year period and the 2nd quintile for the five-year period ended December 31, 2017 relative to the Broadridge performance universe. Because of the passage of time, these performance results may differ from the performance results for more recent periods, including those shown elsewhere in this report.
The Trustees expressed concern to MFS about the substandard investment performance of the Fund and the Fund’s retail counterpart, MFS Blended Research Core Equity Fund, which has substantially similar investment strategies and experienced substantially similar investment performance as the Fund. In the course of their deliberations, the Trustees took into account information provided by MFS in connection with the contract review meetings, as well as during investment review meetings conducted with portfolio management personnel during the course of the year as to MFS’ efforts to improve the performance of the
23
MFS Blended Research Core Equity Portfolio
Board Review of Investment Advisory Agreement – continued
Fund and the Fund’s retail counterpart. In addition, the Trustees requested that they receive a separate update on the Fund’s retail counterpart at each of their regular meetings. After reviewing these and related factors, the Trustees concluded, within the context of their overall conclusions regarding the investment advisory agreement, that MFS’ responses and efforts and plans to improve investment performance were sufficient to support approval of the continuance of the investment advisory agreement for an additionalone-year period, but that they would continue to closely monitor the performance of the Fund’s retail counterpart.
In assessing the reasonableness of the Fund’s advisory fee, the Trustees considered, among other information, the Fund’s advisory fee and the total expense ratio of the Fund’s Initial Class shares as a percentage of average daily net assets and the advisory fee and total expense ratios of peer groups of funds based on information provided by Broadridge. The Trustees considered that, according to the data provided by Broadridge (which takes into account any fee reductions or expense limitations that were in effect during the Fund’s last fiscal year), the Fund’s effective advisory fee rate and total expense ratio were each lower than the Broadridge expense group median.
The Trustees also considered the advisory fees charged by MFS to any institutional separate accounts advised by MFS (“separate accounts”) and unaffiliated investment companies for which MFS serves as subadviser (“subadvised funds”) that have comparable investment strategies to the Fund, if any. In comparing these fees, the Trustees considered information provided by MFS as to the generally broader scope of services provided by MFS to the Fund, as well as the more extensive regulatory burdens imposed on MFS in managing the Fund, in comparison to separate accounts and subadvised funds. The Trustees also considered the higher demands placed on MFS’ investment personnel and trading infrastructure as a result of the daily cashin-flows andout-flows of the Fund in comparison to separate accounts.
The Trustees also considered whether the Fund may benefit from any economies of scale in the management of the Fund in the event of growth in assets of the Fund and/or growth in assets of the MFS Funds as a whole. They noted that the Fund’s advisory fee rate schedule is subject to contractual breakpoints that reduce the Fund’s advisory fee rate on the Fund’s average daily net assets over $1 billion and $2.5 billion. The Trustees also noted that MFS has agreed in writing to waive a portion of the management fees of certain MFS Funds, including the Fund, if the total combined assets of certain funds within the MFS Funds’ complex increase above agreed upon thresholds (the “group fee waiver”), enabling the Fund’s shareholders to share in the benefits from any economies of scale at the complex level. The group fee waiver is reviewed and renewed annually between the Board and MFS. The Trustees concluded that the breakpoints and the group fee waiver were sufficient to allow the Fund to benefit from economies of scale as its assets and overall complex assets grow.
The Trustees also considered information prepared by MFS relating to MFS’ costs and profits with respect to the Fund, the MFS Funds considered as a group, and other investment companies and accounts advised by MFS, as well as MFS’ methodologies used to determine and allocate its costs to the MFS Funds, the Fund and other accounts and products for purposes of estimating profitability.
After reviewing these and other factors described herein, the Trustees concluded, within the context of their overall conclusions regarding the investment advisory agreement, that the advisory fees charged to the Fund represent reasonable compensation in light of the services being provided by MFS to the Fund.
In addition, the Trustees considered MFS’ resources and related efforts to continue to retain, attract and motivate capable personnel to serve the Fund. The Trustees also considered current and developing conditions in the financial services industry, including the presence of large and well-capitalized companies which are spending, and appear to be prepared to continue to spend, substantial sums to engage personnel and to provide services to competing investment companies. In this regard, the Trustees also considered the financial resources of MFS and its ultimate parent, Sun Life Financial Inc. The Trustees also considered the advantages and possible disadvantages to the Fund of having an adviser that also serves other investment companies as well as other accounts.
The Trustees also considered the nature, quality, cost, and extent of administrative, transfer agency, and distribution services provided to the Fund by MFS and its affiliates under agreements and plans other than the investment advisory agreement, including any12b-1 fees the Fund pays to MFS Fund Distributors, Inc., an affiliate of MFS. The Trustees also considered the nature, extent and quality of certain other services MFS performs or arranges for on the Fund’s behalf, which may include securities lending programs, directed expense payment programs, class action recovery programs, and MFS’ interaction with third-party service providers, principally custodians andsub-custodians. The Trustees concluded that the variousnon-advisory services provided by MFS and its affiliates on behalf of the Fund were satisfactory.
The Trustees consideredso-called“fall-out benefits” to MFS such as reputational value derived from serving as investment manager to the MFS Funds. The Trustees also considered that, effective January 3, 2018, MFS had discontinued its historic practice of obtaining investment research from portfolio brokerage commissions paid by certain MFS Funds and would thereafter voluntarily reimburse a Fund, if applicable, for the costs of external research acquired through the use of the Fund’s portfolio brokerage commissions.
Based on their evaluation of factors that they deemed to be material, including those factors described above, the Board of Trustees, including the independent Trustees, concluded that the Fund’s investment advisory agreement with MFS should be continued for an additionalone-year period, commencing August 1, 2018.
24
MFS Blended Research Core Equity Portfolio
PROXY VOTING POLICIES AND INFORMATION
MFS votes proxies on behalf of the fund pursuant to proxy voting policies and procedures that are available without charge, upon request, by calling 1-800-225-2606, by visitingmfs.com/proxyvoting, or by visiting the SEC’s Web site athttp://www.sec.gov.
Information regarding how the fund voted proxies relating to portfolio securities during the most recent twelve-month period ended June 30 is available by August 31 of each year without charge by visitingmfs.com/proxyvoting, or by visiting the SEC’s Web site athttp://www.sec.gov.
QUARTERLY PORTFOLIO DISCLOSURE
The fund files a complete schedule of portfolio holdings with the SEC for the first and third quarters of each fiscal year on Form N-Q. The fund’s Form N-Q is available on the SEC’s website athttp://www.sec.gov.A shareholder can obtain the portfolio holdings report for the first and third quarters of the fund’s fiscal year atmfs.com/vit2 by choosing the fund’s name and then selecting the “Resources” tab and clicking on “Prospectus and Reports”.
FURTHER INFORMATION
From time to time, MFS may post important information about the fund or the MFS funds on the MFS web site (mfs.com). This information is available athttps://www.mfs.com/en-us/what-we-do/announcements.htmlor atmfs.com/vit2 by choosing the fund’s name.
INFORMATION ABOUT FUND CONTRACTS AND LEGAL CLAIMS
The fund has entered into contractual arrangements with an investment adviser, administrator, distributor, shareholder servicing agent, 529 program manager (if applicable), and custodian who each provide services to the fund. Unless expressly stated otherwise, shareholders are not parties to, or intended beneficiaries of these contractual arrangements, and these contractual arrangements are not intended to create any shareholder right to enforce them against the service providers or to seek any remedy under them against the service providers, either directly or on behalf of the fund.
Under the Trust’s By-Laws and Declaration of Trust, any claims asserted against or on behalf of the MFS Funds, including claims against Trustees and Officers, must be brought in state and federal courts located within the Commonwealth of Massachusetts.
FEDERAL TAX INFORMATION (unaudited)
The following information is provided pursuant to provisions of the Internal Revenue Code.
The fund designates $44,746,000 as capital gain dividends paid during the fiscal year.
For corporate shareholders, 100% of the ordinary income dividends paid during the fiscal year qualify for the corporate dividends received deduction.
25
rev. 3/16
| | | | |
| | | |
| FACTS | | WHAT DOES MFS DO WITH YOUR
PERSONAL INFORMATION? | |  |
| | |
| Why? | | Financial companies choose how they share your personal information. Federal law gives consumers the right to limit some but not all sharing. Federal law also requires us to tell you how we collect, share, and protect your personal information. Please read this notice carefully to understand what we do. |
| | |
| What? | | The types of personal information we collect and share depend on the product or service you have with us. This information can include: • Social Security number and account balances • Account transactions and transaction history • Checking account information and wire transfer instructions When you areno longer our customer, we continue to share your information as described in this notice. |
| | |
| How? | | All financial companies need to share customers’ personal information to run their everyday business. In the section below, we list the reasons financial companies can share their customers’ personal information; the reasons MFS chooses to share; and whether you can limit this sharing. |
| | | | |
Reasons we can share your
personal information | | Does MFS share? | | Can you limit this
sharing? |
For our everyday business purposes – such as to process your transactions, maintain your account(s), respond to court orders and legal investigations, or report to credit bureaus | | Yes | | No |
For our marketing purposes – to offer our products and services to you | | No | | We don’t share |
| For joint marketing with other financial companies | | No | | We don’t share |
For our affiliates’ everyday business purposes – information about your transactions and experiences | | No | | We don’t share |
For our affiliates’ everyday business purposes – information about your creditworthiness | | No | | We don’t share |
| For nonaffiliates to market to you | | No | | We don’t share |
| | |
| | |
| Questions? | | Call800-225-2606 or go tomfs.com. |
26
| | |
| Who we are |
| Who is providing this notice? | | MFS Funds, MFS Investment Management, MFS Institutional Advisors, Inc., and MFS Heritage Trust Company. |
| | |
| What we do |
| How does MFS protect my personal information? | | To protect your personal information from unauthorized access and use, we use security measures that comply with federal law. These measures include procedural, electronic, and physical safeguards for the protection of the personal information we collect about you. |
How does MFS
collect my personal information? | | We collect your personal information, for example, when you • open an account or provide account information • direct us to buy securities or direct us to sell your securities • make a wire transfer We also collect your personal information from others, such as credit bureaus, affiliates, or other companies. |
| Why can’t I limit all sharing? | | Federal law gives you the right to limit only • sharing for affiliates’ everyday business purposes – information about your creditworthiness • affiliates from using your information to market to you • sharing for nonaffiliates to market to you State laws and individual companies may give you additional rights to limit sharing. |
| | |
| Definitions |
| Affiliates | | Companies related by common ownership or control. They can be financial and nonfinancial companies. • MFS does not share personal information with affiliates, except for everyday business purposes as described on page one of this notice. |
| Nonaffiliates | | Companies not related by common ownership or control. They can be financial and nonfinancial companies. • MFS does not share with nonaffiliates so they can market to you. |
| Joint marketing | | A formal agreement between nonaffiliated financial companies that together market financial products or services to you. • MFS doesn’t jointly market. |
| | |
| Other important information |
| If you own an MFS product or receive an MFS service in the name of a third party such as a bank or broker-dealer, their privacy policy may apply to you instead of ours. |
27
Annual Report
December 31, 2018

MFS® Corporate Bond Portfolio

MFS® Variable Insurance Trust II
Beginning on January 1, 2021, as permitted by regulations adopted by the U.S. Securities and Exchange Commission, the insurance company that offers your contract may determine that it will no longer send you paper copies of the fund’s annual and semiannual shareholder reports unless you specifically request paper copies from the insurance company or from your financial intermediary. Instead, the shareholder reports will be made available on a Web site (insurancefunds.mfs.com or other Web site of which you will be notified), and the insurance company will notify you by mail each time a report is posted and provide you with a Web site link to access the report. Instructions for requesting paper copies will be provided by your insurance company or financial intermediary.
If you already elected to receive shareholder reports by email, you will not be affected by this change and you need not take any action. If your insurance company or financial intermediary offers electronic delivery, you may elect to receive shareholder reports and other communications from the insurance company or financial intermediary by email by following the instructions provided by the insurance company or financial intermediary.
Beginning on January 1, 2019, you may elect to receive all future reports in paper free of charge from the insurance company or financial intermediary. You can inform the insurance company or financial intermediary that you wish to continue receiving paper copies of your shareholder reports by contacting your insurance company or financial intermediary. Your election to receive reports in paper will apply to all funds held in your account with your insurance company or financial intermediary.
BDS-ANN
MFS® Corporate Bond Portfolio
CONTENTS
The report is prepared for the general information of contract owners. It is authorized for distribution to prospective investors only when preceded or accompanied by a current prospectus.
NOT FDIC INSURED• MAY LOSE VALUE• NO BANK OR CREDIT UNION GUARANTEE• NOT A DEPOSIT• NOT INSURED BY ANY FEDERAL GOVERNMENT AGENCY OR NCUA/NCUSIF
MFS Corporate Bond Portfolio
LETTER FROM THE EXECUTIVE CHAIRMAN

Dear Contract Owners:
Higher interest rates, international trade friction, and geopolitical uncertainty surrounding issues such as Brexit have contributed to an uptick in market volatility in recent quarters — a departure from thelow-volatility environment that prevailed for much of the past several years. Against this more challenging backdrop, equity markets in the United States outperformed most international markets on a relative basis in 2018, though broad market returns were modestly negative on an absolute basis. Global economic growth has become less synchronized over the past few quarters, with Europe, China, and some emerging markets having shown signs of significantly slowing growth. While U.S. growth has remained above average, the pace of that growth slowed in the second half of 2018.
Slowing global growth and tighter financial conditions have clouded the outlook for U.S. monetary policy, with the chairman of the U.S. Federal Reserve acknowledging that policy rates are close to levels that the Fed deems neutral for the U.S. economy. This suggests that the predictable pattern of quarterly rate increases is behind us. At the same time, markets must contend with a shift from years of quantitative easing toward a cycle of quantitative tightening now that the European Central Bank has halted asset purchases. U.S. tax reforms adopted in late 2017 have been welcomed by equity markets while emerging market economies have recently had to contend with tighter financial conditions as a result of firmer U.S. interest rates and a stronger dollar. With the Republicans losing control of the U.S. House of Representatives, further meaningful U.S. fiscal stimulus appears less likely over the remainder of this presidential term. A partial U.S. government shutdown, beginning in late 2018, also added to political uncertainty. Globally, inflation remains largely subdued thanks in part to falling oil prices, but tight labor markets and moderate global demand have investors on the lookout for its potential reappearance. Increased U.S. protectionism is also a growing concern, as investors fear trade disputes could dampen business sentiment, leading to even slower global growth. While there has been progress on this front — a NAFTA replacement has been agreed upon between the U.S., Mexico, and Canada; the free trade pact with Korea has been updated; and a negotiating framework with the European Union has been agreed upon — tensions over trade with China remain quite high, though the two sides have recently returned to the negotiating table.
As a global investment manager with nearly a century of expertise, MFS® firmly believes active risk management offers downside mitigation and may help improve investment outcomes. We built our active investment platform with this belief in mind. Ourlong-term perspective influences nearly every aspect of our business, ensuring our investment decisions align with the investing time horizons of our clients.
Respectfully,

Robert J. Manning
Executive Chairman
MFS Investment Management
February 15, 2019
The opinions expressed in this letter are subject to change and may not be relied upon for investment advice. No forecasts can be guaranteed.
1
MFS Corporate Bond Portfolio
PORTFOLIO COMPOSITION
Portfolio structure (i)

| | | | |
| Fixed income sectors (i) | | | | |
| Investment Grade Corporates | | | 81.0% | |
| High Yield Corporates | | | 10.3% | |
| U.S. Treasury Securities | | | 6.9% | |
| Mortgage-Backed Securities | | | 0.6% | |
| Emerging Markets Bonds | | | 0.4% | |
| Commercial Mortgage-Backed Securities | | | 0.1% | |
| Asset-Backed Securities | | | 0.1% | |
| | | | |
| Composition including fixed income credit quality (a)(i) | |
| AA | | | 1.5% | |
| A | | | 20.7% | |
| BBB | | | 59.2% | |
| BB | | | 10.3% | |
| CC | | | 0.1% | |
| C (o) | | | 0.0% | |
| D | | | 0.1% | |
| U.S. Government | | | 6.9% | |
| Federal Agencies | | | 0.6% | |
| Cash & Cash Equivalents | | | 0.6% | |
| |
| Portfolio facts (i) | | | | |
| Average Duration (d) | | | 7.1 | |
| Average Effective Maturity (m) | | | 10.7 yrs. | |
| (a) | | For all securities other than those specifically described below, ratings are assigned to underlying securities utilizing ratings from Moody’s, Fitch, and Standard & Poor’s rating agencies and applying the following hierarchy: If all three agencies provide a rating, the middle rating (after dropping the highest and lowest ratings) is assigned; if two of the three agencies rate a security, the lower of the two is assigned. Ratings are shown in the S&P and Fitch scale (e.g., AAA). Securities rated BBB or higher are considered investment grade. All ratings are subject to change. U.S. Government includes securities issued by the U.S. Department of the Treasury. Federal Agencies includes rated and unrated U.S. Agency fixed-income securities, U.S. Agency mortgage-backed securities, and collateralized mortgage obligations of U.S. Agency mortgage-backed securities. The fund may or may not have held all of these instruments on this date. The fund is not rated by these agencies. |
| (d) | | Duration is a measure of how much a bond’s price is likely to fluctuate with general changes in interest rates, e.g., if rates rise 1.00%, a bond with a 5-year duration is likely to lose about 5.00% of its value due to the interest rate move. |
| (i) | | For purposes of this presentation, the components include the value of securities, and reflect the impact of the equivalent exposure of derivative positions, if any. These amounts may be negative from time to time. Equivalent exposure is a calculated amount that translates the derivative position into a reasonable approximation of the amount of the underlying asset that the portfolio would have to hold at a given point in time to have the same price sensitivity that results from the portfolio’s ownership of the derivative contract. When dealing with derivatives, equivalent exposure is a more representative measure of the potential impact of a position on portfolio performance than value. The bond component will include any accrued interest amounts. |
| (m) | | In determining each instrument’s effective maturity for purposes of calculating the fund’s dollar-weighted average effective maturity, MFS uses the instrument’s stated maturity or, if applicable, an earlier date on which MFS believes it is probable that a maturity-shortening device (such as a put,pre-refunding or prepayment) will cause the instrument to be repaid. Such an earlier date can be substantially shorter than the instrument’s stated maturity. |
Where the fund holds convertible bonds, they are treated as part of the equity portion of the portfolio.
Cash & Cash Equivalents includes any cash, investments in money market funds, short-term securities, and other assets less liabilities. Please see the Statement of Assets and Liabilities for additional information related to the fund’s cash position and other assets and liabilities.
Percentages are based on net assets as of December 31, 2018.
The portfolio is actively managed and current holdings may be different.
2
MFS Corporate Bond Portfolio
MANAGEMENT REVIEW
Summary of Results
For the twelve months ended December 31, 2018, Initial Class shares of the MFS Corporate Bond Portfolio (“fund”) provided a total return of –3.00%, while Service Class shares of the fund provided a total return of –3.31%. These compare with a return of –2.11% over the same period for the fund’s benchmark, the Bloomberg Barclays U.S. Credit Bond Index.
Market Environment
During the reporting period, the US Federal Reserve raised interest rates by 100 basis points, bringing the total number of rate hikes to nine since the central bank began to normalize monetary policy in late 2015. Economic growth rates in the US, Eurozone and Japan remained above trend, despite a slowing in global growth, particularly toward the end of the period. Inflation remained contained, particularly outside the US. Late in the period, the European Central Bank halted its asset purchase program but issued forward guidance that it does not expect to raise interest rates at least until after the summer of 2019. The Bank of England (once) and the Bank of Canada (three times) each raised rates during the period. The European political backdrop became a bit more volatile, late in the period, spurred by concerns over cohesion in the Eurozone after the election of an anti-establishment, Eurosceptic coalition government in Italy and widespread protests over stagnant wage growth in France.
Bond yields rose in the US during most of the period, but remained low by historical standards and slipped from their highs, late in the period, as market volatility increased. Yields in many developed markets fell. Outside of emerging markets, where spreads and currencies came under pressure, credit spreads remained quite tight until the end of the period, when thinner liquidity, lower oil prices and concerns over high degrees of corporate leverage emerged. Growing concern over increasing global trade friction appeared to have weighed on business sentiment during the period’s second half, especially outside the US. Tighter financial conditions from rising US rates and a strong dollar, combined with trade uncertainty, helped expose structural weaknesses in several emerging markets in the second half of the period.
Volatility increased, at the end of the period, amid signs of slowing global economic growth and increasing trade tensions, which prompted a market setback shortly after US markets set record highs in September. It was the second such equity market decline during the reporting period. The correction came despite a third consecutive quarter of strong growth in US earnings per share. Strong earnings growth, combined with the market decline, brought US equity valuations down from elevated levels, earlier in the period, to multiples more in line with long-term averages. While the US economy held up better than most, global economic growth became less synchronized during the period, with Europe and China showing signs of a slowdown and some emerging markets coming under stress.
Detractors from Performance
During the reporting period, the fund’s bond selection and greater exposure to “BBB” rated (r) securities,out-of-benchmark exposure to “BB” rated bonds, and lesser exposure to “AA” rated securities, detracted from performance relative to the Bloomberg Barclays U.S. Credit Bond Index. Additionally, a lesser exposure to both theREITS andsovereignsectors hindered relative returns. Security selection in both theconsumer cyclicalsandbankingsectors also hampered relative performance.
Contributors to Performance
The fund’s cash and/or cash equivalents positions during the period supported relative performance. Anout-of-benchmark exposure to theU.S. Treasurysector, and an underweight allocation to thetechnologysector,also helped relative results. Additionally, a greater exposure to the consumer non–cyclicalssector benefited relative returns. Security selection within theelectric utilitiessector further supported the fund’s relative performance.
Respectfully,
Portfolio Manager(s)
Alexander Mackey and Robert Persons
| (r) | Bonds rated “BBB”, “Baa”, or higher are considered investment grade; bonds rated “BB”, “Ba”, or below are considerednon-investment grade. The source for bond quality ratings is Moody’s Investors Service, Standard & Poor’s and Fitch, Inc. and are applied using the following hierarchy: If all three agencies provide a rating, the middle rating (after dropping the highest and lowest ratings) is assigned; if two of the three agencies rate a security, the lower of the two is assigned. Ratings are shown in the S&P and Fitch scale (e.g., AAA). For securities which are not rated by any of the three agencies, the security is considered Not Rated. |
Note to Shareholders: Effective June 30, 2018, Richard Hawkins is no longer a Portfolio Manager of the Fund.
The views expressed in this report are those of the portfolio manager(s) only through the end of the period of the report as stated on the cover and do not necessarily reflect the views of MFS or any other person in the MFS organization. These views are subject to change at any time based on market or other conditions, and MFS disclaims any responsibility to update such views. These views may not be relied upon as investment advice or an indication of trading intent on behalf of any MFS portfolio. References to specific securities are not recommendations of such securities, and may not be representative of any MFS portfolio’s current or future investments.
3
MFS Corporate Bond Portfolio
PERFORMANCE SUMMARY THROUGH 12/31/18
The following chart illustrates the historical performance of the fund in comparison to its benchmark(s). Benchmarks are unmanaged and may not be invested in directly. Benchmark returns do not reflect any fees or expenses. The performance of other share classes will be greater than or less than that of the class depicted below. (See Notes to Performance Summary.)
Performance data shown represents past performance and is no guarantee of future results. Investment return and principal value fluctuate so your units, when sold, may be worth more or less than the original cost; current performance may be lower or higher than quoted. The performance shown does not reflect the deduction of taxes, if any, that a contract holder would pay on fund distributions or the redemption of contract units. The returns for the fund shown also do not reflect the deduction of expenses associated with variable products, such as mortality and expense risk charges, separate account charges, and sales charges imposed by the insurance company separate accounts. Such expenses would reduce the overall returns shown.
Growth of a Hypothetical $10,000 Investment
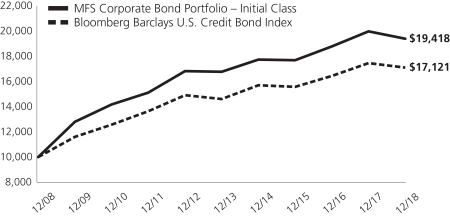
Total Returns through 12/31/18
Average annual total returns
| | | | | | | | | | | | |
| | | Share Class | | Class Inception Date | | 1-yr | | 5-yr | | 10-yr | | |
| | | Initial Class | | 5/06/98 | | (3.00)% | | 2.95% | | 6.86% | | |
| | | Service Class | | 8/24/01 | | (3.31)% | | 2.68% | | 6.59% | | |
| | | | |
| Comparative benchmark(s) | | | | | | | | |
| | | Bloomberg Barclays U.S. Credit Bond Index (f) | | (2.11)% | | 3.22% | | 5.52% | | |
| (f) | Source: FactSet Research Systems Inc. |
Benchmark Definition(s)
Bloomberg Barclays U.S. Credit Bond Index – a market capitalization-weighted index that measures the performance of publicly issued, SEC-registered, U.S. corporate and specified foreign debentures and secured notes that meet specified maturity, liquidity, and quality requirements.
It is not possible to invest directly in an index.
Notes to Performance Summary
Average annual total return represents the average annual change in value for each share class for the periods presented.
Performance results reflect any applicable expense subsidies and waivers in effect during the periods shown. Without such subsidies and waivers the fund’s performance results would be less favorable. Please see the prospectus and financial statements for complete details. All results are historical and assume the reinvestment of any dividends and capital gains distributions.
Performance results do not include adjustments made for financial reporting purposes in accordance with U.S. generally accepted accounting principles and may differ from amounts reported in the financial highlights.
From time to time the fund may receive proceeds from litigation settlements, without which performance would be lower.
4
MFS Corporate Bond Portfolio
EXPENSE TABLE
Fund Expenses Borne by the Contract Holders during the Period,
July 1, 2018 through December 31, 2018
As a contract holder of the fund, you incur ongoing costs, including management fees; distribution and/or service(12b-1) fees; and other fund expenses. This example is intended to help you understand your ongoing costs (in dollars) of investing in the fund and to compare these costs with the ongoing costs of investing in other mutual funds.
The example is based on an investment of $1,000 invested at the beginning of the period and held for the entire period July 1, 2018 through December 31, 2018.
Actual Expenses
The first line for each share class in the following table provides information about actual account values and actual expenses. You may use the information in this line, together with the amount you invested, to estimate the expenses that you paid over the period. Simply divide your account value by $1,000 (for example, an $8,600 account value divided by $1,000 = 8.6), then multiply the result by the number in the first line under the heading entitled “Expenses Paid During Period” to estimate the expenses you paid on your account during this period.
Hypothetical Example for Comparison Purposes
The second line for each share class in the following table provides information about hypothetical account values and hypothetical expenses based on the fund’s actual expense ratio and an assumed rate of return of 5% per year before expenses, which is not the fund’s actual return. The hypothetical account values and expenses may not be used to estimate the actual ending account balance or expenses you paid for the period. You may use this information to compare the ongoing costs of investing in the fund and other funds. To do so, compare this 5% hypothetical example with the 5% hypothetical examples that appear in the shareholder reports of the other funds.
Please note that the expenses shown in the table are meant to highlight the fund’s ongoing costs only and do not take into account the fees and expenses imposed under the variable contracts through which your investment in the fund is made. Therefore, the second line for each share class in the table is useful in comparing ongoing costs associated with an investment in vehicles (such as the fund) which fund benefits under variable annuity and variable life insurance contracts and to qualified pension and retirement plans only, and will not help you determine the relative total costs of investing in the fund through variable annuity and variable life insurance contracts. If the fees and expenses imposed under the variable contracts were included, your costs would have been higher.
| | | | | | | | | | | | | | | | | | |
| Share Class | | | | Annualized
Expense Ratio | | | Beginning
Account Value
7/01/18 | | | Ending
Account Value
12/31/18 | | | Expenses Paid
During Period (p)
7/01/18-12/31/18 | |
| Initial Class | | Actual | | | 0.63% | | | | $1,000.00 | | | | $1,005.43 | | | | $3.18 | |
| | Hypothetical (h) | | | 0.63% | | | | $1,000.00 | | | | $1,022.03 | | | | $3.21 | |
| Service Class | | Actual | | | 0.88% | | | | $1,000.00 | | | | $1,003.59 | | | | $4.44 | |
| | Hypothetical (h) | | | 0.88% | | | | $1,000.00 | | | | $1,020.77 | | | | $4.48 | |
| (h) | 5% class return per year before expenses. |
| (p) | “Expenses Paid During Period” are equal to each class’s annualized expense ratio, as shown above, multiplied by the average account value over the period, multiplied by 184/365 (to reflect theone-half year period). |
5
MFS Corporate Bond Portfolio
PORTFOLIO OF INVESTMENTS – 12/31/18
The Portfolio of Investments is a complete list of all securities owned by your fund. It is categorized by broad-based asset classes.
| | | | | | | | |
| | |
| Issuer | | Shares/Par | | | Value ($) | |
| BONDS – 98.3% | | | | | | | | |
| Aerospace – 2.7% | | | | | | | | |
| Huntington Ingalls Industries, Inc., 3.483%, 12/01/2027 | | $ | 630,000 | | | $ | 586,801 | |
| L3 Technologies, Inc., 3.85%, 6/15/2023 | | | 1,083,000 | | | | 1,084,618 | |
| Lockheed Martin Corp., 3.55%, 1/15/2026 | | | 964,000 | | | | 957,030 | |
| Northrop Grumman Corp., 2.55%, 10/15/2022 | | | 1,737,000 | | | | 1,682,376 | |
| Northrop Grumman Corp., 2.93%, 1/15/2025 | | | 1,488,000 | | | | 1,412,544 | |
| | | | | | | | |
| | | | | | $ | 5,723,369 | |
| | | | | | | | |
| Apparel Manufacturers – 0.7% | | | | | | | | |
| Coach, Inc., 4.125%, 7/15/2027 | | $ | 1,518,000 | | | $ | 1,421,163 | |
| | | | | | | | |
| Asset-Backed & Securitized – 0.2% | | | | | | | | |
| Bayview Financial Revolving Mortgage Loan Trust, FLR, 4.105% (LIBOR - 1mo. + 1.6%), 12/28/2040 (z) | | $ | 143,749 | | | $ | 132,769 | |
| Greenwich Capital Commercial Funding Corp., 5.666%, 7/10/2038 | | | 96,097 | | | | 96,339 | |
| JPMorgan Chase Commercial Mortgage Securities Corp., 5.781%, 7/15/2042 (n)(q) | | | 200,293 | | | | 136,677 | |
| Lehman Brothers Commercial Conduit Mortgage Trust, 0.954%, 2/18/2030 (i) | | | 27,981 | | | | 0 | |
| | | | | | | | |
| | | | | | $ | 365,785 | |
| | | | | | | | |
| Automotive – 2.2% | | | | | | | | |
| General Motors Co., 5.15%, 4/01/2038 | | $ | 606,000 | | | $ | 518,244 | |
| General Motors Co., 6.25%, 10/02/2043 | | | 1,257,000 | | | | 1,179,505 | |
| General Motors Financial Co., Inc., 4.35%, 1/17/2027 | | | 472,000 | | | | 434,671 | |
| Lear Corp., 3.8%, 9/15/2027 | | | 1,276,000 | | | | 1,166,237 | |
| ZF North America Capital, Inc., 4.75%, 4/29/2025 (n) | | | 1,426,000 | | | | 1,327,686 | |
| | | | | | | | |
| | | | | | $ | 4,626,343 | |
| | | | | | | | |
| Broadcasting – 1.0% | | | | | | | | |
| Netflix, Inc., 4.875%, 4/15/2028 | | $ | 392,000 | | | $ | 357,700 | |
| Time Warner, Inc., 3.8%, 2/15/2027 | | | 1,054,000 | | | | 989,503 | |
| Time Warner, Inc., 5.35%, 12/15/2043 | | | 685,000 | | | | 661,048 | |
| | | | | | | | |
| | | | | | $ | 2,008,251 | |
| | | | | | | | |
| Brokerage & Asset Managers – 2.3% | | | | | | | | |
| Charles Schwab Corp., 3.85%, 5/21/2025 | | $ | 1,140,000 | | | $ | 1,163,325 | |
| E*TRADE Financial Corp., 2.95%, 8/24/2022 | | | 858,000 | | | | 832,349 | |
| Intercontinental Exchange, Inc., 2.75%, 12/01/2020 | | | 652,000 | | | | 647,711 | |
| Intercontinental Exchange, Inc., 3.75%, 12/01/2025 | | | 1,070,000 | | | | 1,075,184 | |
| TD Ameritrade Holding Corp., 3.3%, 4/01/2027 | | | 1,080,000 | | | | 1,033,551 | |
| | | | | | | | |
| | | | | | $ | 4,752,120 | |
| | | | | | | | |
| | | | | | | | |
| | |
| Issuer | | Shares/Par | | | Value ($) | |
| BONDS – continued | | | | | | | | |
| Building – 2.4% | | | | | | | | |
| CRH America Finance, Inc., 4.5%, 4/04/2048 (n) | | $ | 896,000 | | | $ | 797,511 | |
| Martin Marietta Materials, Inc., 4.25%, 7/02/2024 | | | 850,000 | | | | 860,207 | |
| Martin Marietta Materials, Inc., 3.45%, 6/01/2027 | | | 504,000 | | | | 465,785 | |
| Martin Marietta Materials, Inc., 3.5%, 12/15/2027 | | | 747,000 | | | | 681,462 | |
| Masco Corp., 4.45%, 4/01/2025 | | | 560,000 | | | | 561,269 | |
| Masco Corp., 4.375%, 4/01/2026 | | | 476,000 | | | | 476,283 | |
| Standard Industries, Inc., 4.75%, 1/15/2028 (n) | | | 1,346,000 | | | | 1,130,640 | |
| | | | | | | | |
| | | | | | $ | 4,973,157 | |
| | | | | | | | |
| Business Services – 2.0% | | | | | | | | |
| Cisco Systems, Inc., 2.2%, 2/28/2021 | | $ | 1,428,000 | | | $ | 1,409,029 | |
| Equinix, Inc., 5.75%, 1/01/2025 | | | 969,000 | | | | 976,267 | |
| Fidelity National Information Services, Inc., 3.5%, 4/15/2023 | | | 220,000 | | | | 217,457 | |
| Fidelity National Information Services, Inc., 5%, 10/15/2025 | | | 216,000 | | | | 224,786 | |
| MSCI, Inc., 5.75%, 8/15/2025 (n) | | | 1,464,000 | | | | 1,474,980 | |
| | | | | | | | |
| | | | | | $ | 4,302,519 | |
| | | | | | | | |
| Cable TV – 3.7% | | | | | | | | |
| Charter Communications Operating LLC/Charter Communications Operating Capital Corp., 6.384%, 10/23/2035 | | $ | 505,000 | | | $ | 518,821 | |
| Cox Communications, Inc., 3.5%, 8/15/2027 (n) | | | 803,000 | | | | 740,754 | |
| Cox Communications, Inc., 4.6%, 8/15/2047 (n) | | | 332,000 | | | | 299,059 | |
| NBCUniversal Enterprise, Inc., 1.974%, 4/15/2019 (n) | | | 578,000 | | | | 576,162 | |
| Sirius XM Radio, Inc., 5.375%, 4/15/2025 (n) | | | 170,000 | | | | 161,075 | |
| Sirius XM Radio, Inc., 5.375%, 7/15/2026 (n) | | | 353,000 | | | | 330,055 | |
| Sirius XM Radio, Inc., 5%, 8/01/2027 (n) | | | 1,541,000 | | | | 1,408,089 | |
| Time Warner Cable, Inc., 8.25%, 4/01/2019 | | | 850,000 | | | | 859,541 | |
| Time Warner Cable, Inc., 5%, 2/01/2020 | | | 354,000 | | | | 358,924 | |
| Time Warner Cable, Inc., 4.5%, 9/15/2042 | | | 955,000 | | | | 768,632 | |
| Time Warner Entertainment Co. LP, 8.375%, 7/15/2033 | | | 266,000 | | | | 324,514 | |
| Videotron Ltd., 5%, 7/15/2022 | | | 1,555,000 | | | | 1,547,225 | |
| | | | | | | | |
| | | | | | $ | 7,892,851 | |
| | | | | | | | |
| Chemicals – 1.5% | | | | | | | | |
| LyondellBasell Industries N.V., 5%, 4/15/2019 | | $ | 457,000 | | | $ | 457,498 | |
| LyondellBasell Industries N.V., 6%, 11/15/2021 | | | 1,256,000 | | | | 1,327,562 | |
6
MFS Corporate Bond Portfolio
Portfolio of Investments – continued
| | | | | | | | |
| | |
| Issuer | | Shares/Par | | | Value ($) | |
| BONDS – continued | | | | | | | | |
| Chemicals – continued | | | | | | | | |
| Sasol Chemicals (USA) LLC, 5.875%, 3/27/2024 | | $ | 849,000 | | | $ | 847,152 | |
| Sherwin-Williams Co., 4.5%, 6/01/2047 | | | 500,000 | | | | 451,491 | |
| | | | | | | | |
| | | | | | $ | 3,083,703 | |
| | | | | | | | |
| Computer Software – 0.4% | | | | | | | | |
| VeriSign, Inc., 4.625%, 5/01/2023 | | $ | 763,000 | | | $ | 751,555 | |
| | | | | | | | |
| Computer Software – Systems – 0.3% | | | | | |
| Apple, Inc., 4.375%, 5/13/2045 | | $ | 383,000 | | | $ | 389,502 | |
| Apple, Inc., 4.25%, 2/09/2047 | | | 319,000 | | | | 318,346 | |
| | | | | | | | |
| | | | | | $ | 707,848 | |
| | | | | | | | |
| Conglomerates – 0.9% | | | | | | | | |
| Roper Technologies, Inc., 4.2%, 9/15/2028 | | $ | 681,000 | | | $ | 674,632 | |
| United Technologies Corp., 4.625%, 11/16/2048 | | | 517,000 | | | | 499,962 | |
| Wabtec Corp., 4.7%, 9/15/2028 | | | 657,000 | | | | 616,540 | |
| | | | | | | | |
| | | | | | $ | 1,791,134 | |
| | | | | | | | |
| Consumer Products – 0.8% | | | | | | | | |
| Reckitt Benckiser Treasury Services PLC, 3%, 6/26/2027 (n) | | $ | 1,876,000 | | | $ | 1,744,195 | |
| | | | | | | | |
| Consumer Services – 2.8% | | | | | | | | |
| Priceline Group, Inc., 3.65%, 3/15/2025 | | $ | 283,000 | | | $ | 275,709 | |
| Priceline Group, Inc., 3.6%, 6/01/2026 | | | 1,761,000 | | | | 1,711,754 | |
| Priceline Group, Inc., 3.55%, 3/15/2028 | | | 486,000 | | | | 455,268 | |
| Service Corp. International, 5.375%, 5/15/2024 | | | 2,004,000 | | | | 1,983,960 | |
| Visa, Inc., 4.15%, 12/14/2035 | | | 1,413,000 | | | | 1,462,883 | |
| | | | | | | | |
| | | | | | $ | 5,889,574 | |
| | | | | | | | |
| Containers – 1.0% | | | | | | | | |
| Ball Corp., 4%, 11/15/2023 | | $ | 1,009,000 | | | $ | 981,253 | |
| Ball Corp., 5.25%, 7/01/2025 | | | 1,030,000 | | | | 1,027,425 | |
| | | | | | | | |
| | | | | | $ | 2,008,678 | |
| | | | | | | | |
| Electrical Equipment – 1.1% | | | | | | | | |
| Arrow Electronics, Inc., 3.5%, 4/01/2022 | | $ | 478,000 | | | $ | 471,554 | |
| Arrow Electronics, Inc., 3.875%, 1/12/2028 | | | 1,979,000 | | | | 1,803,754 | |
| | | | | | | | |
| | | | | | $ | 2,275,308 | |
| | | | | | | | |
| Electronics – 1.0% | | | | | | | | |
| Broadcom Corp./Broadcom Cayman | | | | | | | | |
| Finance Ltd., 3.875%, 1/15/2027 | | $ | 2,157,000 | | | $ | 1,936,327 | |
| Tyco Electronics Group S.A., 3.5%, 2/03/2022 | | | 252,000 | | | | 252,219 | |
| | | | | | | | |
| | | | | | $ | 2,188,546 | |
| | | | | | | | |
| Energy – Independent – 0.4% | | | | | | | | |
| Diamondback Energy, Inc., 4.75%, 11/01/2024 (n) | | $ | 576,000 | | | $ | 555,840 | |
| Diamondback Energy, Inc., 5.375%, 5/31/2025 | | | 218,000 | | | | 212,550 | |
| | | | | | | | |
| | | | | | $ | 768,390 | |
| | | | | | | | |
| | | | | | | | |
| | |
| Issuer | | Shares/Par | | | Value ($) | |
| BONDS – continued | | | | | | | | |
| Energy – Integrated – 0.9% | | | | | | | | |
| Eni S.p.A., 4.75%, 9/12/2028 (n) | | $ | 761,000 | | | $ | 744,354 | |
| Shell International Finance B.V., 3.75%, 9/12/2046 | | | 1,300,000 | | | | 1,210,466 | |
| | | | | | | | |
| | | | | | $ | 1,954,820 | |
| | | | | | | | |
| Financial Institutions – 1.2% | | | | | | | | |
| AerCap Ireland Capital Ltd., 4.625%, 10/30/2020 | | $ | 227,000 | | | $ | 228,541 | |
| AerCap Ireland Capital Ltd., 3.65%, 7/21/2027 | | | 1,426,000 | | | | 1,235,880 | |
| International Lease Finance Corp., 5.875%, 8/15/2022 | | | 1,000,000 | | | | 1,047,405 | |
| | | | | | | | |
| | | | | | $ | 2,511,826 | |
| | | | | | | | |
| Food & Beverages – 4.6% | | | | | | | | |
| Anheuser-Busch InBev Worldwide, Inc., 3.75%, 1/15/2022 | | $ | 3,348,000 | | | $ | 3,350,324 | |
| Anheuser-Busch InBev Worldwide, Inc., 4.375%, 4/15/2038 | | | 527,000 | | | | 470,708 | |
| Conagra Brands, Inc., 5.3%, 11/01/2038 | | | 592,000 | | | | 559,996 | |
| Conagra Brands, Inc., 5.4%, 11/01/2048 | | | 791,000 | | | | 729,400 | |
| Constellation Brands, Inc., 4.25%, 5/01/2023 | | | 1,605,000 | | | | 1,618,202 | |
| Kraft Heinz Foods Co., 5%, 7/15/2035 | | | 290,000 | | | | 272,630 | |
| Kraft Heinz Foods Co., 6.5%, 2/09/2040 | | | 1,459,000 | | | | 1,551,829 | |
| Tyson Foods, Inc., 4.5%, 6/15/2022 | | | 598,000 | | | | 610,764 | |
| Wm. Wrigley Jr. Co., 2.9%, 10/21/2019 (n) | | | 505,000 | | | | 504,253 | |
| | | | | | | | |
| | | | | | $ | 9,668,106 | |
| | | | | | | | |
| Forest & Paper Products – 0.4% | | | | | | | | |
| Georgia-Pacific LLC, 5.4%, 11/01/2020 (n) | | $ | 806,000 | | | $ | 834,998 | |
| | | | | | | | |
| Gaming & Lodging – 1.8% | | | | | | | | |
| GLP Capital LP/GLP Financing II, Inc., 5.75%, 6/01/2028 | | $ | 1,365,000 | | | $ | 1,378,650 | |
| GLP Capital LP/GLP Financing II, Inc., 5.3%, 1/15/2029 | | | 319,000 | | | | 311,992 | |
| Hilton Domestic Operating Co., Inc., 5.125%, 5/01/2026 (n) | | | 474,000 | | | | 455,040 | |
| Marriott International, Inc., 4%, 4/15/2028 | | | 1,749,000 | | | | 1,682,350 | |
| | | | | | | | |
| | | | | | $ | 3,828,032 | |
| | | | | | | | |
| Insurance – 1.1% | | | | | | | | |
| American International Group, Inc., 4.7%, 7/10/2035 | | $ | 1,010,000 | | | $ | 960,291 | |
| American International Group, Inc., 4.5%, 7/16/2044 | | | 917,000 | | | | 818,796 | |
| Unum Group, 4%, 3/15/2024 | | | 637,000 | | | | 632,219 | |
| | | | | | | | |
| | | | | | $ | 2,411,306 | |
| | | | | | | | |
| Insurance – Health – 2.5% | | | | | | | | |
| Aetna, Inc., 2.8%, 6/15/2023 | | $ | 508,000 | | | $ | 483,082 | |
| Centene Corp., 5.375%, 6/01/2026 (n) | | | 766,000 | | | | 744,935 | |
| Halfmoon Parent, Inc., 4.125%, 11/15/2025 (n) | | | 945,000 | | | | 944,108 | |
| UnitedHealth Group, Inc., 2.7%, 7/15/2020 | | | 1,350,000 | | | | 1,344,956 | |
7
MFS Corporate Bond Portfolio
Portfolio of Investments – continued
| | | | | | | | |
| | |
| Issuer | | Shares/Par | | | Value ($) | |
| BONDS – continued | | | | | | | | |
| Insurance – Health – continued | | | | | | | | |
| UnitedHealth Group, Inc., 4.625%, 7/15/2035 | | $ | 1,690,000 | | | $ | 1,795,679 | |
| | | | | | | | |
| | | | | | $ | 5,312,760 | |
| | | | | | | | |
| Insurance – Property & Casualty – 3.0% | |
| Berkshire Hathaway, Inc., 2.75%, 3/15/2023 | | $ | 828,000 | | | $ | 812,779 | |
| Chubb INA Holdings, Inc., 2.3%, 11/03/2020 | | | 343,000 | | | | 338,096 | |
| CNA Financial Corp., 5.875%, 8/15/2020 | | | 1,570,000 | | | | 1,628,430 | |
| Liberty Mutual Group, Inc., 4.85%, 8/01/2044 (n) | | | 951,000 | | | | 924,640 | |
| Marsh & McLennan Cos., Inc., 4.8%, 7/15/2021 | | | 900,000 | | | | 927,483 | |
| Marsh & McLennan Cos., Inc., 3.5%, 6/03/2024 | | | 779,000 | | | | 767,285 | |
| Marsh & McLennan Cos., Inc., 4.35%, 1/30/2047 | | | 471,000 | | | | 439,842 | |
| Swiss Re Ltd., 4.25%, 12/06/2042 (n) | | | 468,000 | | | | 456,627 | |
| | | | | | | | |
| | | | | | $ | 6,295,182 | |
| | | | | | | | |
| Machinery & Tools – 0.6% | | | | | | | | |
| CNH Industrial Capital LLC, 4.2%, 1/15/2024 | | $ | 515,000 | | | $ | 508,919 | |
| CNH Industrial Capital LLC, 3.85%, 11/15/2027 | | | 905,000 | | | | 823,631 | |
| | | | | | | | |
| | | | | | $ | 1,332,550 | |
| | | | | | | | |
| Major Banks – 12.3% | | | | | | | | |
| Bank of America Corp., 3.124% to 1/20/2022, FLR (LIBOR - 3mo. + 1.16%) to 1/20/2023 | | $ | 1,232,000 | | | $ | 1,211,214 | |
| Bank of America Corp., 3.004%, 12/20/2023 | | | 739,000 | | | | 717,463 | |
| Bank of America Corp., 4.125%, 1/22/2024 | | | 1,917,000 | | | | 1,942,991 | |
| Bank of America Corp., 4.2%, 8/26/2024 | | | 1,434,000 | | | | 1,422,135 | |
| Bank of America Corp., 3.419% to 12/20/2027, FLR (LIBOR - 3mo. + 1.04%) to 12/20/2028 | | | 351,000 | | | | 328,081 | |
| Bank of America Corp., 6.1% to 3/17/2025, FLR (LIBOR - 3mo. + 3.898%) to 12/29/2049 | | | 1,420,000 | | | | 1,398,700 | |
| Bank of America Corp., 5.875% to 3/15/2028, FLR (LIBOR - 3mo. + 2.931%) to 12/31/2059 | | | 936,000 | | | | 852,153 | |
| Goldman Sachs Group, Inc., 3.85%, 1/26/2027 | | | 608,000 | | | | 572,219 | |
| HSBC Holdings PLC, 4.375%, 11/23/2026 | | | 941,000 | | | | 911,470 | |
| HSBC Holdings PLC, 6% to 5/22/2027, | | | | | | | | |
| FLR (ICE Swap Rate - 5yr. + 3.746%) to 11/22/2065 | | | 611,000 | | | | 550,193 | |
| JPMorgan Chase & Co., 4.25%, 10/15/2020 | | | 442,000 | | | | 449,881 | |
| JPMorgan Chase & Co., 4.5%, 1/24/2022 | | | 790,000 | | | | 813,970 | |
| JPMorgan Chase & Co., 3.25%, 9/23/2022 | | | 2,397,000 | | | | 2,377,842 | |
| JPMorgan Chase & Co., 3.125%, 1/23/2025 | | | 688,000 | | | | 655,741 | |
| JPMorgan Chase & Co., 3.964% to 11/15/2047, FLR (LIBOR - 3mo. + 1.38%) to 11/15/2048 | | | 1,500,000 | | | | 1,329,660 | |
| JPMorgan Chase & Co., 3.897% to 1/23/2048, FLR (LIBOR - 3mo. + 1.22%) to 1/23/2049 | | | 1,111,000 | | | | 975,844 | |
| | | | | | | | |
| | |
| Issuer | | Shares/Par | | | Value ($) | |
| BONDS – continued | | | | | | | | |
| Major Banks – continued | | | | | | | | |
| JPMorgan Chase & Co., 6.75% to 2/01/2024, FLR (LIBOR - 3mo. + 3.78%) to 1/29/2049 | | $ | 1,221,000 | | | $ | 1,261,598 | |
| Morgan Stanley, 5.5%, 7/28/2021 | | | 1,245,000 | | | | 1,303,745 | |
| PNC Bank N.A., 2.6%, 7/21/2020 | | | 1,585,000 | | | | 1,570,838 | |
| Sumitomo Mitsui Financial Group, Inc., 3.102%, 1/17/2023 | | | 1,861,000 | | | | 1,825,435 | |
| UBS Group Funding (Switzerland) AG, 3.491%, 5/23/2023 (n) | | | 1,293,000 | | | | 1,260,898 | |
| UBS Group Funding (Switzerland) AG, 4.253%, 3/23/2028 (n) | | | 414,000 | | | | 408,440 | |
| Wachovia Corp., 6.605%, 10/01/2025 | | | 1,270,000 | | | | 1,403,292 | |
| Wells Fargo & Co., 4.1%, 6/03/2026 | | | 476,000 | | | | 465,059 | |
| | | | | | | | |
| | | | | | $ | 26,008,862 | |
| | | | | | | | |
| Medical & Health Technology & Services – 4.6% | | | | | |
| Becton, Dickinson and Co., 3.734%, 12/15/2024 | | $ | 161,000 | | | $ | 155,513 | |
| Becton, Dickinson and Co., 4.685%, 12/15/2044 | | | 1,083,000 | | | | 1,014,953 | |
| Becton, Dickinson and Co., 4.669%, 6/06/2047 | | | 955,000 | | | | 899,443 | |
| HCA, Inc., 4.75%, 5/01/2023 | | | 910,000 | | | | 896,350 | |
| HCA, Inc., 5.25%, 6/15/2026 | | | 884,000 | | | | 877,370 | |
| Laboratory Corp. of America Holdings, 3.25%, 9/01/2024 | | | 917,000 | | | | 877,567 | |
| Laboratory Corp. of America Holdings, 4.7%, 2/01/2045 | | | 900,000 | | | | 838,927 | |
| Life Technologies Corp., 6%, 3/01/2020 | | | 2,172,000 | | | | 2,232,531 | |
| Thermo Fisher Scientific, Inc., 2.95%, 9/19/2026 | | | 555,000 | | | | 512,451 | |
| Thermo Fisher Scientific, Inc., 4.1%, 8/15/2047 | | | 1,544,000 | | | | 1,430,991 | |
| | | | | | | | |
| | | | | | $ | 9,736,096 | |
| | | | | | | | |
| Medical Equipment – 2.6% | | | | | | | | |
| Abbott Laboratories, 2.9%, 11/30/2021 | | $ | 2,291,000 | | | $ | 2,268,220 | |
| Abbott Laboratories, 4.75%, 11/30/2036 | | | 836,000 | | | | 872,922 | |
| Medtronic, Inc., 3.5%, 3/15/2025 | | | 1,061,000 | | | | 1,057,266 | |
| Medtronic, Inc., 4.375%, 3/15/2035 | | | 381,000 | | | | 390,483 | |
| Teleflex, Inc., 4.625%, 11/15/2027 | | | 125,000 | | | | 115,937 | |
| Zimmer Biomet Holdings, Inc., FLR, 3.554% (LIBOR - 3mo. + 0.75%), 3/19/2021 | | | 774,000 | | | | 766,752 | |
| | | | | | | | |
| | | | | | $ | 5,471,580 | |
| | | | | | | | |
| Metals & Mining – 1.5% | | | | | | | | |
| Glencore Funding LLC, 4.125%, 5/30/2023 (n) | | $ | 863,000 | | | $ | 847,455 | |
| Glencore Funding LLC, 4%, 4/16/2025 (n) | | | 536,000 | | | | 504,596 | |
| Glencore Funding LLC, 4%, 3/27/2027 (n) | | | 1,389,000 | | | | 1,266,026 | |
| Glencore Funding LLC, 3.875%, 10/27/2027 (n) | | | 559,000 | | | | 499,735 | |
| | | | | | | | |
| | | | | | $ | 3,117,812 | |
| | | | | | | | |
8
MFS Corporate Bond Portfolio
Portfolio of Investments – continued
| | | | | | | | |
| | |
| Issuer | | Shares/Par | | | Value ($) | |
| BONDS – continued | | | | | | | | |
| Midstream – 3.8% | | | | | | | | |
| APT Pipelines Ltd., 5%, 3/23/2035 (n) | | $ | 1,375,000 | | | $ | 1,385,452 | |
| Dominion Gas Holdings LLC, 2.8%, 11/15/2020 | | | 975,000 | | | | 960,404 | |
| Kinder Morgan Energy Partners LP, 6.85%, 2/15/2020 | | | 370,000 | | | | 383,100 | |
| MPLX LP, 4.5%, 4/15/2038 | | | 744,000 | | | | 650,476 | |
| Sabine Pass Liquefaction LLC, 5.625%, 4/15/2023 | | | 1,467,000 | | | | 1,545,519 | |
| Sabine Pass Liquefaction LLC, 5.625%, 3/01/2025 | | | 133,000 | | | | 138,169 | |
| Sabine Pass Liquefaction LLC, 5.875%, 6/30/2026 | | | 289,000 | | | | 306,132 | |
| Sabine Pass Liquefaction LLC, 5%, 3/15/2027 | | | 542,000 | | | | 544,080 | |
| Sabine Pass Liquefaction LLC, 4.2%, 3/15/2028 | | | 1,021,000 | | | | 977,180 | |
| Tallgrass Energy LP, 4.75%, 10/01/2023 (n) | | | 1,184,000 | | | | 1,142,560 | |
| | | | | | | | |
| | | | | | $ | 8,033,072 | |
| | | | | | | | |
| Mortgage – Backed – 0.6% | | | | | | | | |
| Freddie Mac, 3.136%, 10/25/2024 | | $ | 807,000 | | | $ | 812,258 | |
| Freddie Mac, 3.244%, 8/25/2027 | | | 69,000 | | | | 68,731 | |
| Freddie Mac, 3.286%, 11/25/2027 | | | 397,000 | | | | 395,833 | |
| | | | | | | | |
| | | | | | $ | 1,276,822 | |
| | | | | | | | |
| Natural Gas – Distribution – 2.3% | | | | | | | | |
| NiSource Finance Corp., 3.85%, 2/15/2023 | | $ | 1,106,000 | | | $ | 1,109,344 | |
| NiSource Finance Corp., 4.8%, 2/15/2044 | | | 761,000 | | | | 737,704 | |
| NiSource, Inc., 5.65%, 2/01/2045 | | | 475,000 | | | | 517,775 | |
| Sempra Energy, 3.25%, 6/15/2027 | | | 2,779,000 | | | | 2,554,638 | |
| | | | | | | | |
| | | | | | $ | 4,919,461 | |
| | | | | | | | |
| Network & Telecom – 1.2% | | | | | | | | |
| AT&T, Inc., 2.45%, 6/30/2020 | | $ | 619,000 | | | $ | 610,848 | |
| AT&T, Inc., 4.75%, 5/15/2046 | | | 1,136,000 | | | | 1,011,064 | |
| AT&T, Inc., 5.15%, 11/15/2046 | | | 445,000 | | | | 414,053 | |
| AT&T, Inc., 5.65%, 2/15/2047 | | | 452,000 | | | | 451,944 | |
| | | | | | | | |
| | | | | | $ | 2,487,909 | |
| | | | | | | | |
| Oils – 2.7% | | | | | | | | |
| Marathon Petroleum Corp., 3.4%, 12/15/2020 | | $ | 1,105,000 | | | $ | 1,104,439 | |
| Marathon Petroleum Corp., 4.75%, 9/15/2044 | | | 910,000 | | | | 803,276 | |
| Marathon Petroleum Corp., 4.5%, 4/01/2048 (n) | | | 883,000 | | | | 742,149 | |
| Valero Energy Corp., 3.4%, 9/15/2026 | | | 1,601,000 | | | | 1,467,102 | |
| Valero Energy Corp., 4.9%, 3/15/2045 | | | 1,783,000 | | | | 1,677,999 | |
| | | | | | | | |
| | | | | | $ | 5,794,965 | |
| | | | | | | | |
| Other Banks & Diversified Financials – 1.5% | |
| Capital One Financial Corp., 3.75%, 4/24/2024 | | $ | 796,000 | | | $ | 776,290 | |
| Discover Bank, 7%, 4/15/2020 | | | 1,097,000 | | | | 1,141,924 | |
| Groupe BPCE S.A., 4.5%, 3/15/2025 (n) | | | 760,000 | | | | 735,797 | |
| Macquarie Bank Ltd., 6.125% to 3/08/2027, FLR (Swap Rate – 5yr. + 3.703%) to 12/31/2165 (n) | | | 444,000 | | | | 379,065 | |
| | | | | | | | |
| | |
| Issuer | | Shares/Par | | | Value ($) | |
| BONDS – continued | | | | | | | | |
| Other Banks & Diversified Financials – continued | |
| SunTrust Banks, Inc., 3.3%, 5/15/2026 | | $ | 200,000 | | | $ | 189,611 | |
| | | | | | | | |
| | | | | | $ | 3,222,687 | |
| | | | | | | | |
| Pharmaceuticals – 0.8% | | | | | | | | |
| Bayer U.S. Finance LLC, 3.875%, 12/15/2023 (n) | | $ | 501,000 | | | $ | 491,878 | |
| Elanco Animal Health, Inc., 4.9%, 8/28/2028 (n) | | | 1,272,000 | | | | 1,295,115 | |
| | | | | | | | |
| | | | | | $ | 1,786,993 | |
| | | | | | | | |
| Pollution Control – 1.1% | | | | | | | | |
| Republic Services, Inc., 5.25%, 11/15/2021 | | $ | 1,160,000 | | | $ | 1,227,911 | |
| Republic Services, Inc., 3.95%, 5/15/2028 | | | 1,100,000 | | | | 1,101,380 | |
| | | | | | | | |
| | | | | | $ | 2,329,291 | |
| | | | | | | | |
| Precious Metals & Minerals – 0.4% | | | | | | | | |
| Teck Resources Ltd., 6%, 8/15/2040 | | $ | 222,000 | | | $ | 206,460 | |
| Teck Resources Ltd., 6.25%, 7/15/2041 | | | 667,000 | | | | 631,983 | |
| | | | | | | | |
| | | | | | $ | 838,443 | |
| | | | | | | | |
| Railroad & Shipping – 0.4% | | | | | | | | |
| Canadian Pacific Railway Co., 7.25%, 5/15/2019 | | $ | 424,000 | | | $ | 429,997 | |
| Canadian Pacific Railway Co., 4.5%, 1/15/2022 | | | 400,000 | | | | 412,121 | |
| | | | | | | | |
| | | | | | $ | 842,118 | |
| | | | | | | | |
| Restaurants – 0.5% | | | | | | | | |
| Starbucks Corp., 4%, 11/15/2028 | | $ | 984,000 | | | $ | 972,502 | |
| | | | | | | | |
| Retailers – 0.8% | | | | | | | | |
| Best Buy Co., Inc., 5.5%, 3/15/2021 | | $ | 31,000 | | | $ | 31,964 | |
| Dollar Tree, Inc., 4%, 5/15/2025 | | | 874,000 | | | | 840,588 | |
| Home Depot, Inc., 4.875%, 2/15/2044 | | | 760,000 | | | | 812,213 | |
| | | | | | | | |
| | | | | | $ | 1,684,765 | |
| | | | | | | | |
| Specialty Chemicals – 0.3% | | | | | | | | |
| Ecolab, Inc., 4.35%, 12/08/2021 | | $ | 656,000 | | | $ | 673,939 | |
| | | | | | | | |
| Telecommunications – Wireless – 3.9% | |
| American Tower Corp., REIT, 3.5%, 1/31/2023 | | $ | 371,000 | | | $ | 364,588 | |
| American Tower Corp., REIT, 3%, 6/15/2023 | | | 1,049,000 | | | | 1,009,205 | |
| American Tower Corp., REIT, 4%, 6/01/2025 | | | 1,000,000 | | | | 981,479 | |
| American Tower Corp., REIT, 3.6%, 1/15/2028 | | | 1,133,000 | | | | 1,059,230 | |
| Crown Castle International Corp., 5.25%, 1/15/2023 | | | 470,000 | | | | 488,033 | |
| Crown Castle International Corp., 3.15%, 7/15/2023 | | | 878,000 | | | | 843,955 | |
| Crown Castle International Corp., 4.45%, 2/15/2026 | | | 338,000 | | | | 336,673 | |
| Crown Castle International Corp., 3.7%, 6/15/2026 | | | 533,000 | | | | 508,712 | |
| SBA Tower Trust, 2.898%, 10/15/2044 (n) | | | 1,081,000 | | | | 1,074,646 | |
| T-Mobile USA, Inc., 6%, 4/15/2024 | | | 1,640,000 | | | | 1,640,000 | |
| | | | | | | | |
| | | | | | $ | 8,306,521 | |
| | | | | | | | |
9
MFS Corporate Bond Portfolio
Portfolio of Investments – continued
| | | | | | | | |
| Issuer | | Shares/Par | | | Value ($) | |
| BONDS – continued | | | | | | | | |
| Tobacco – 0.4% | | | | | | | | |
| Reynolds American, Inc., 8.125%, 6/23/2019 | | $ | 733,000 | | | $ | 747,786 | |
| Reynolds American, Inc., 3.25%, 6/12/2020 | | | 165,000 | | | | 163,962 | |
| | | | | | | | |
| | | | | | $ | 911,748 | |
| | | | | | | | |
| Transportation – Services – 0.5% | | | | | | | | |
| ERAC USA Finance LLC, 3.85%, 11/15/2024 (n) | | $ | 272,000 | | | $ | 270,672 | |
| ERAC USA Finance LLC, 7%, 10/15/2037 (n) | | | 421,000 | | | | 523,916 | |
| ERAC USA Finance LLC, 4.5%, 2/15/2045 (n) | | | 201,000 | | | | 189,346 | |
| | | | | | | | |
| | | | | | $ | 983,934 | |
| | | | | | | | |
| U.S. Treasury Obligations – 6.9% | | | | | | | | |
| U.S. Treasury Bonds, 3.5%, 2/15/2039 | | $ | 9,952,000 | | | $ | 10,900,232 | |
| U.S. Treasury Bonds, 3%, 2/15/2048 | | | 3,579,700 | | | | 3,566,768 | |
| | | | | | | | |
| | | | | | $ | 14,467,000 | |
| | | | | | | | |
| Utilities – Electric Power – 5.7% | | | | | | | | |
| Berkshire Hathaway Energy, 4.5%, 2/01/2045 | | $ | 597,000 | | | $ | 596,914 | |
| Duke Energy Corp., 3.75%, 9/01/2046 | | | 1,059,000 | | | | 916,880 | |
| EDP Finance B.V., 5.25%, 1/14/2021 (n) | | | 728,000 | | | | 739,860 | |
| Emera U.S. Finance LP, 2.7%, 6/15/2021 | | | 330,000 | | | | 321,472 | |
| Emera U.S. Finance LP, 3.55%, 6/15/2026 | | | 378,000 | | | | 358,633 | |
| Enel Finance International N.V., 2.75%, 4/06/2023 (n) | | | 1,974,000 | | | | 1,821,045 | |
| | | | | | | | |
| Issuer | | Shares/Par | | | Value ($) | |
| BONDS – continued | | | | | | | | |
| Utilities – Electric Power – continued | | | | | | | | |
| Enel Finance International N.V., 3.625%, 5/25/2027 (n) | | $ | 471,000 | | | $ | 415,720 | |
| Enel Finance International N.V., 4.75%, 5/25/2047 (n) | | | 460,000 | | | | 391,065 | |
| Eversource Energy, 2.9%, 10/01/2024 | | | 991,000 | | | | 949,664 | |
| Exelon Corp., 3.497%, 6/01/2022 | | | 1,163,000 | | | | 1,136,424 | |
| FirstEnergy Corp., 3.9%, 7/15/2027 | | | 707,000 | | | | 685,138 | |
| PPL Capital Funding, Inc., 5%, 3/15/2044 | | | 590,000 | | | | 602,163 | |
| PPL WEM Holdings PLC, 5.375%, 5/01/2021 (n) | | | 1,057,000 | | | | 1,091,386 | |
| Public Service Enterprise Group, 2%, 11/15/2021 | | | 1,555,000 | | | | 1,493,206 | |
| Southern Co., 2.95%, 7/01/2023 | | | 440,000 | | | | 425,094 | |
| | | | | | | | |
| | | | | | $ | 11,944,664 | |
| | | | | | | | |
Total Bonds
(Identified Cost, $212,932,673) | | | $ | 207,235,253 | |
| | | | | | | | |
| |
| INVESTMENT COMPANIES (h) – 1.4% | | | | | |
| Money Market Funds – 1.4% | | | | | | | | |
| MFS Institutional Money Market Portfolio, 2.4% (v) (Identified Cost, $3,006,691) | | | 3,007,091 | | | $ | 3,006,790 | |
| | | | | | | | |
OTHER ASSETS, LESS
LIABILITIES – 0.3% | | | | | | | 634,166 | |
| | | | | | | | |
| NET ASSETS – 100.0% | | | | | | $ | 210,876,209 | |
| | | | | | | | |
| (h) | | An affiliated issuer, which may be considered one in which the fund owns 5% or more of the outstanding voting securities, or a company which is under common control. At period end, the aggregate values of the fund’s investments in affiliated issuers and in unaffiliated issuers were $3,006,790 and $207,235,253, respectively. |
| (i) | | Interest only security for which the fund receives interest on notional principal (Par amount). Par amount shown is the notional principal and does not reflect the cost of the security. |
| (n) | | Securities exempt from registration under Rule 144A of the Securities Act of 1933. These securities may be sold in the ordinary course of business in transactions exempt from registration, normally to qualified institutional buyers. At period end, the aggregate value of these securities was $33,768,500, representing 16.0% of net assets. |
| (q) | | Interest received was less than stated coupon rate. |
| (v) | | Affiliated issuer that is available only to investment companies managed by MFS. The rate quoted for the MFS Institutional Money Market Portfolio is the annualizedseven-day yield of the fund at period end. |
| (z) | | Restricted securities are not registered under the Securities Act of 1933 and are subject to legal restrictions on resale. These securities generally may be resold in transactions exempt from registration or to the public if the securities are subsequently registered. Disposal of these securities may involve time-consuming negotiations and prompt sale at an acceptable price may be difficult. The fund holds the following restricted securities: |
| | | | | | | | | | |
| Restricted Securities | | Acquisition
Date | | Cost | | | Value | |
| Bayview Financial Revolving Mortgage Loan Trust, FLR, 4.105% (LIBOR - 1mo. + 1.6%), 12/28/2040 | | 3/01/06 | | | $143,749 | | | | $132,769 | |
| % of Net assets | | | | | | | | | 0.1% | |
The following abbreviations are used in this report and are defined:
| FLR | | Floating Rate. Interest rate resets periodically based on the parenthetically disclosed reference rate plus a spread (if any). Theperiod-end rate reported may not be the current rate. All reference rates are USD unless otherwise noted. |
| ICE | | Intercontinental Exchange |
| LIBOR | | London Interbank Offered Rate |
| PLC | | Public Limited Company |
| REIT | | Real Estate Investment Trust |
See Notes to Financial Statements
10
MFS Corporate Bond Portfolio
FINANCIAL STATEMENTS | STATEMENT OF ASSETS AND LIABILITIES
This statement represents your fund’s balance sheet, which details the assets and liabilities comprising the total value of the fund.
| | | | |
At 12/31/18 | | | | |
| |
Assets | | | | |
Investments in unaffiliated issuers, at value (identified cost, $212,932,673) | | | $207,235,253 | |
Investments in affiliated issuers, at value (identified cost, $3,006,691) | | | 3,006,790 | |
Cash | | | 3,265 | |
Receivables for | | | | |
Interest | | | 2,437,479 | |
Other assets | | | 1,688 | |
Total assets | | | $212,684,475 | |
| |
Liabilities | | | | |
Payables for | | | | |
Fund shares reacquired | | | $1,730,642 | |
Payable to affiliates | | | | |
Investment adviser | | | 4,565 | |
Shareholder servicing costs | | | 65 | |
Distribution and/or service fees | | | 4,265 | |
Payable for independent Trustees’ compensation | | | 4 | |
Accrued expenses and other liabilities | | | 68,725 | |
Total liabilities | | | $1,808,266 | |
Net assets | | | $210,876,209 | |
| |
Net assets consist of | | | | |
Paid-in capital | | | $210,830,755 | |
Total distributable earnings (loss) | | | 45,454 | |
Net assets | | | $210,876,209 | |
Shares of beneficial interest outstanding | | | 19,703,150 | |
| | | | | | | | | | | | |
| | | |
| | | Net assets | | | Shares
outstanding | | | Net asset value
per share | |
Initial Class | | | $56,506,376 | | | | 5,228,524 | | | | $10.81 | |
Service Class | | | 154,369,833 | | | | 14,474,626 | | | | 10.66 | |
See Notes to Financial Statements
11
MFS Corporate Bond Portfolio
FINANCIAL STATEMENTS | STATEMENT OF OPERATIONS
This statement describes how much your fund earned in investment income and accrued in expenses. It also describes any gains and/or losses generated by fund operations.
| | | | |
Year ended 12/31/18 | | | | |
| |
Net investment income (loss) | | | | |
Income | | | | |
Interest | | | $9,544,131 | |
Dividends from affiliated issuers | | | 127,014 | |
Other | | | 8,571 | |
Total investment income | | | $9,679,716 | |
Expenses | | | | |
Management fee | | | $1,428,880 | |
Distribution and/or service fees | | | 443,285 | |
Shareholder servicing costs | | | 7,652 | |
Administrative services fee | | | 44,071 | |
Independent Trustees’ compensation | | | 7,130 | |
Custodian fee | | | 15,920 | |
Shareholder communications | | | 18,025 | |
Audit and tax fees | | | 74,045 | |
Legal fees | | | 2,083 | |
Miscellaneous | | | 26,091 | |
Total expenses | | | $2,067,182 | |
Reduction of expenses by investment adviser | | | (122,329 | ) |
Net expenses | | | $1,944,853 | |
Net investment income (loss) | | | $7,734,863 | |
| |
Realized and unrealized gain (loss) | | | | |
Realized gain (loss) (identified cost basis) | | | | |
Unaffiliated issuers | | | $(981,553 | ) |
Affiliated issuers | | | (522 | ) |
Net realized gain (loss) | | | $(982,075 | ) |
Change in unrealized appreciation or depreciation | | | | |
Unaffiliated issuers | | | $(15,069,903 | ) |
Affiliated issuers | | | 99 | |
Net unrealized gain (loss) | | | $(15,069,804 | ) |
Net realized and unrealized gain (loss) | | | $(16,051,879 | ) |
Change in net assets from operations | | | $(8,317,016 | ) |
See Notes to Financial Statements
12
MFS Corporate Bond Portfolio
FINANCIAL STATEMENTS | STATEMENTS OF CHANGES IN NET ASSETS
These statements describe the increases and/or decreases in net assets resulting from operations, any distributions, and any shareholder transactions.
| | | | | | | | |
| | | Year ended | |
| | | 12/31/18 | | | 12/31/17 | |
Change in net assets | | | | | | | | |
| | |
From operations | | | | | | | | |
Net investment income (loss) | | | $7,734,863 | | | | $8,250,457 | |
Net realized gain (loss) | | | (982,075 | ) | | | 2,604,444 | |
Net unrealized gain (loss) | | | (15,069,804 | ) | | | 4,667,028 | |
Change in net assets from operations | | | $(8,317,016 | ) | | | $15,521,929 | |
Total distributions to shareholders (a) | | | $(9,639,419 | ) | | | $(9,218,117 | ) |
Change in net assets from fund share transactions | | | $(30,948,965 | ) | | | $(1,820,793 | ) |
Total change in net assets | | | $(48,905,400 | ) | | | $4,483,019 | |
| | |
Net assets | | | | | | | | |
At beginning of period | | | 259,781,609 | | | | 255,298,590 | |
At end of period (b) | | | $210,876,209 | | | | $259,781,609 | |
| (a) | Distributions from net investment income and from net realized gain are no longer required to be separately disclosed. See Note 2. For the year ended December 31, 2017, distributions from net investment income were $9,218,117. |
| (b) | Parenthetical disclosure of undistributed net investment income is no longer required. See Note 2. For the year ended December 31, 2017, end of period net assets included undistributed net investment income of $8,641,907. |
See Notes to Financial Statements
13
MFS Corporate Bond Portfolio
FINANCIAL STATEMENTS | FINANCIAL HIGHLIGHTS
The financial highlights table is intended to help you understand the fund’s financial performance for the past 5 years. Certain information reflects financial results for a single fund share. The total returns in the table represent the rate that an investor would have earned (or lost) on an investment in the fund share class (assuming reinvestment of all distributions) held for the entire period.
| | | | | | | | | | | | | | | | | | | | |
| Initial Class | | Year ended | |
| | | | | |
| | | 12/31/18 | | | 12/31/17 | | | 12/31/16 | | | 12/31/15 | | | 12/31/14 | |
| | | | | |
Net asset value, beginning of period | | | $11.64 | | | | $11.36 | | | | $11.16 | | | | $11.76 | | | | $11.58 | |
| | | | | |
| Income (loss) from investment operations | | | | | | | | | | | | | | | | | | | | |
Net investment income (loss) (d) | | | $0.38 | | | | $0.39 | | | | $0.41 | (c) | | | $0.42 | | | | $0.43 | |
Net realized and unrealized gain (loss) | | | (0.72 | ) | | | 0.33 | | | | 0.31 | | | | (0.46 | ) | | | 0.24 | |
Total from investment operations | | | $(0.34 | ) | | | $0.72 | | | | $0.72 | | | | $(0.04 | ) | | | $0.67 | |
| | | | | |
| Less distributions declared to shareholders | | | | | | | | | | | | | | | | | | | | |
From net investment income | | | $(0.44 | ) | | | $(0.44 | ) | | | $(0.50 | ) | | | $(0.48 | ) | | | $(0.46 | ) |
From net realized gain | | | (0.05 | ) | | | — | | | | (0.02 | ) | | | (0.08 | ) | | | (0.03 | ) |
Total distributions declared to shareholders | | | $(0.49 | ) | | | $(0.44 | ) | | | $(0.52 | ) | | | $(0.56 | ) | | | $(0.49 | ) |
Net asset value, end of period (x) | | | $10.81 | | | | $11.64 | | | | $11.36 | | | | $11.16 | | | | $11.76 | |
Total return (%) (k)(r)(s)(x) | | | (3.00 | ) | | | 6.39 | | | | 6.28 | (c) | | | (0.31 | ) | | | 5.78 | |
|
Ratios (%) (to average net assets)
and Supplemental data: | |
Expenses before expense reductions (f) | | | 0.68 | | | | 0.68 | | | | 0.65 | (c) | | | 0.68 | | | | 0.67 | |
Expenses after expense reductions (f) | | | 0.63 | | | | 0.63 | | | | 0.60 | (c) | | | 0.63 | | | | 0.65 | |
Net investment income (loss) | | | 3.44 | | | | 3.37 | | | | 3.52 | (c) | | | 3.64 | | | | 3.59 | |
Portfolio turnover | | | 32 | | | | 36 | | | | 31 | | | | 26 | | | | 36 | |
Net assets at end of period (000 omitted) | | | $56,506 | | | | $65,445 | | | | $66,858 | | | | $70,980 | | | | $79,042 | |
| |
| Service Class | | Year ended | |
| | | | | |
| | | 12/31/18 | | | 12/31/17 | | | 12/31/16 | | | 12/31/15 | | | 12/31/14 | |
| | | | | |
Net asset value, beginning of period | | | $11.49 | | | | $11.22 | | | | $11.03 | | | | $11.63 | | | | $11.45 | |
| | | | | |
| Income (loss) from investment operations | | | | | | | | | | | | | | | | | | | | |
Net investment income (loss) (d) | | | $0.35 | | | | $0.36 | | | | $0.37 | (c) | | | $0.39 | | | | $0.39 | |
Net realized and unrealized gain (loss) | | | (0.72 | ) | | | 0.32 | | | | 0.30 | | | | (0.46 | ) | | | 0.25 | |
Total from investment operations | | | $(0.37 | ) | | | $0.68 | | | | $0.67 | | | | $(0.07 | ) | | | $0.64 | |
| | | | | |
| Less distributions declared to shareholders | | | | | | | | | | | | | | | | | | | | |
From net investment income | | | $(0.41 | ) | | | $(0.41 | ) | | | $(0.46 | ) | | | $(0.45 | ) | | | $(0.43 | ) |
From net realized gain | | | (0.05 | ) | | | — | | | | (0.02 | ) | | | (0.08 | ) | | | (0.03 | ) |
Total distributions declared to shareholders | | | $(0.46 | ) | | | $(0.41 | ) | | | $(0.48 | ) | | | $(0.53 | ) | | | $(0.46 | ) |
Net asset value, end of period (x) | | | $10.66 | | | | $11.49 | | | | $11.22 | | | | $11.03 | | | | $11.63 | |
Total return (%) (k)(r)(s)(x) | | | (3.31 | ) | | | 6.11 | | | | 5.98 | (c) | | | (0.58 | ) | | | 5.59 | |
|
Ratios (%) (to average net assets)
and Supplemental data: | |
Expenses before expense reductions (f) | | | 0.93 | | | | 0.93 | | | | 0.90 | (c) | | | 0.93 | | | | 0.92 | |
Expenses after expense reductions (f) | | | 0.88 | | | | 0.88 | | | | 0.85 | (c) | | | 0.88 | | | | 0.90 | |
Net investment income (loss) | | | 3.18 | | | | 3.12 | | | | 3.27 | (c) | | | 3.39 | | | | 3.34 | |
Portfolio turnover | | | 32 | | | | 36 | | | | 31 | | | | 26 | | | | 36 | |
Net assets at end of period (000 omitted) | | | $154,370 | | | | $194,337 | | | | $188,440 | | | | $189,946 | | | | $211,332 | |
See Notes to Financial Statements
14
MFS Corporate Bond Portfolio
Financial Highlights – continued
| (c) | Amount reflects aone-time reimbursement of expenses by the custodian (or former custodian) without which net investment income and performance would be lower and expenses would be higher. |
| (d) | Per share data is based on average shares outstanding. |
| (f) | Ratios do not reflect reductions from fees paid indirectly, if applicable. |
| (k) | The total return does not reflect expenses that apply to separate accounts. Inclusion of these charges would reduce the total return figures for all periods shown. |
| (r) | Certain expenses have been reduced without which performance would have been lower. |
| (s) | From time to time the fund may receive proceeds from litigation settlements, without which performance would be lower. |
| (x) | The net asset values and total returns have been calculated on net assets which include adjustments made in accordance with U.S. generally accepted accounting principles required at period end for financial reporting purposes. |
See Notes to Financial Statements
15
MFS Corporate Bond Portfolio
NOTES TO FINANCIAL STATEMENTS
| (1) | | Business and Organization |
MFS Corporate Bond Portfolio (the fund) is a diversified series of MFS Variable Insurance Trust II (the trust). The trust is organized as a Massachusetts business trust and is registered under the Investment Company Act of 1940, as amended, as anopen-end management investment company. The shareholders of each series of the trust are separate accounts of insurance companies, which offer variable annuity and/or life insurance products, and qualified retirement and pension plans.
The fund is an investment company and accordingly follows the investment company accounting and reporting guidance of the Financial Accounting Standards Board (FASB) Accounting Standards Codification Topic 946 Financial Services – Investment Companies.
| (2) | | Significant Accounting Policies |
General – The preparation of financial statements in conformity with U.S. generally accepted accounting principles requires management to make estimates and assumptions that affect the reported amounts of assets and liabilities, and disclosure of contingent assets and liabilities at the date of the financial statements and the reported amounts of increases and decreases in net assets from operations during the reporting period. Actual results could differ from those estimates. In the preparation of these financial statements, management has evaluated subsequent events occurring after the date of the fund’s Statement of Assets and Liabilities through the date that the financial statements were issued. The fund invests in foreign securities. Investments in foreign securities are vulnerable to the effects of changes in the relative values of the local currency and the U.S. dollar and to the effects of changes in each country’s market, economic, industrial, political, regulatory, geopolitical, and other conditions.
In March 2017, the FASB issued Accounting Standards Update2017-08, Receivables – Nonrefundable Fees and Other Costs (Subtopic310-20) – Premium Amortization on Purchased Callable Debt Securities (“ASU2017-08”). For entities that hold callable debt securities at a premium, ASU2017-08 requires that the premium be amortized to the earliest call date. ASU2017-08 will be effective for fiscal years beginning after December 15, 2018, and interim periods within those fiscal years. Management has evaluated the potential impacts of ASU2017-08 and believes that adoption of ASU2017-08 will not have a material effect on the fund’s overall financial position or its overall results of operations.
In August 2018, the FASB issued Accounting Standards Update2018-13, Fair Value Measurement (Topic 820) – Disclosure Framework – Changes to the Disclosure Requirements for Fair Value Measurement (“ASU2018-13”) which introduces new fair value disclosure requirements as well as eliminates and modifies certain existing fair value disclosure requirements. ASU2018-13 would be effective for fiscal years beginning after December 15, 2019, and interim periods within those fiscal years; however, management has elected to early adopt ASU2018-13 effective with the current reporting period. The impact of the fund’s adoption was limited to changes in the fund’s financial statement disclosures regarding fair value, primarily those disclosures related to transfers between levels of the fair value hierarchy.
In August 2018, the Securities and Exchange Commission (SEC) released its Final Rule on Disclosure Update and Simplification (the “Final Rule”) which is intended to simplify an issuer’s disclosure compliance efforts by removing redundant or outdated disclosure requirements without significantly altering the mix of information provided to investors. Effective with the current reporting period, the fund adopted the Final Rule with the impacts being that the fund is no longer required to present the components of distributable earnings on the Statement of Assets and Liabilities or the sources of distributions to shareholders and the amount of undistributed net investment income on the Statements of Changes in Net Assets.
Balance Sheet Offsetting – The fund’s accounting policy with respect to balance sheet offsetting is that, absent an event of default by the counterparty or a termination of the agreement, the International Swaps and Derivatives Association (ISDA) Master Agreement, or similar agreement, does not result in an offset of reported amounts of financial assets and financial liabilities in the Statement of Assets and Liabilities across transactions between the fund and the applicable counterparty. The fund’s right to setoff may be restricted or prohibited by the bankruptcy or insolvency laws of the particular jurisdiction to which a specific master netting agreement counterparty is subject. Balance sheet offsetting disclosures, to the extent applicable to the fund, have been included in the fund’s Significant Accounting Policies note under the captions for each of the fund’sin-scope financial instruments and transactions.
Investment Valuations – Debt instruments and floating rate loans, including restricted debt instruments, are generally valued at an evaluated or composite bid as provided by a third-party pricing service. Short-term instruments with a maturity at issuance of 60 days or less may be valued at amortized cost, which approximates market value.Open-end investment companies are generally valued at net asset value per share. Securities and other assets generally valued on the basis of information from a third-party pricing service may also be valued at a broker/dealer bid quotation. In determining values, third-party pricing services can utilize both transaction data and market information such as yield, quality, coupon rate, maturity, type of issue, trading characteristics, and other market data. The values of foreign securities and other assets and liabilities expressed in foreign currencies are converted to U.S. dollars using the mean of bid and asked prices for rates provided by a third-party pricing service.
16
MFS Corporate Bond Portfolio
Notes to Financial Statements – continued
The Board of Trustees has delegated primary responsibility for determining or causing to be determined the value of the fund’s investments (including any fair valuation) to the adviser pursuant to valuation policies and procedures approved by the Board. If the adviser determines that reliable market quotations are not readily available, investments are valued at fair value as determined in good faith by the adviser in accordance with such procedures under the oversight of the Board of Trustees. Under the fund’s valuation policies and procedures, market quotations are not considered to be readily available for most types of debt instruments and floating rate loans and many types of derivatives. These investments are generally valued at fair value based on information from third-party pricing services. In addition, investments may be valued at fair value if the adviser determines that an investment’s value has been materially affected by events occurring after the close of the exchange or market on which the investment is principally traded (such as foreign exchange or market) and prior to the determination of the fund’s net asset value, or after the halting of trading of a specific security where trading does not resume prior to the close of the exchange or market on which the security is principally traded. The adviser generally relies on third-party pricing services or other information (such as the correlation with price movements of similar securities in the same or other markets; the type, cost and investment characteristics of the security; the business and financial condition of the issuer; and trading and other market data) to assist in determining whether to fair value and at what value to fair value an investment. The value of an investment for purposes of calculating the fund’s net asset value can differ depending on the source and method used to determine value. When fair valuation is used, the value of an investment used to determine the fund’s net asset value may differ from quoted or published prices for the same investment. There can be no assurance that the fund could obtain the fair value assigned to an investment if it were to sell the investment at the same time at which the fund determines its net asset value per share.
Various inputs are used in determining the value of the fund’s assets or liabilities. These inputs are categorized into three broad levels. In certain cases, the inputs used to measure fair value may fall into different levels of the fair value hierarchy. In such cases, an investment’s level within the fair value hierarchy is based on the lowest level of input that is significant to the fair value measurement. The fund’s assessment of the significance of a particular input to the fair value measurement in its entirety requires judgment, and considers factors specific to the investment. Level 1 includes unadjusted quoted prices in active markets for identical assets or liabilities. Level 2 includes other significant observable market-based inputs (including quoted prices for similar securities, interest rates, prepayment speed, and credit risk). Level 3 includes unobservable inputs, which may include the adviser’s own assumptions in determining the fair value of investments. The following is a summary of the levels used as of December 31, 2018 in valuing the fund’s assets or liabilities:
| | | | | | | | | | | | | | | | |
| Financial Instruments | | Level 1 | | | Level 2 | | | Level 3 | | | Total | |
| U.S. Treasury Bonds & U.S. Government Agency & Equivalents | | | $— | | | | $14,467,000 | | | | $— | | | | $14,467,000 | |
| U.S. Corporate Bonds | | | — | | | | 163,824,209 | | | | — | | | | 163,824,209 | |
| Residential Mortgage-Backed Securities | | | — | | | | 1,276,822 | | | | — | | | | 1,276,822 | |
| Commercial Mortgage-Backed Securities | | | — | | | | 233,016 | | | | — | | | | 233,016 | |
| Asset-Backed Securities (including CDOs) | | | — | | | | 132,769 | | | | — | | | | 132,769 | |
| Foreign Bonds | | | — | | | | 27,301,437 | | | | — | | | | 27,301,437 | |
| Mutual Funds | | | 3,006,790 | | | | — | | | | — | | | | 3,006,790 | |
| Total | | | $3,006,790 | | | | $207,235,253 | | | | $— | | | | $210,242,043 | |
For further information regarding security characteristics, see the Portfolio of Investments.
Indemnifications – Under the fund’s organizational documents, its officers and Trustees may be indemnified against certain liabilities and expenses arising out of the performance of their duties to the fund. Additionally, in the normal course of business, the fund enters into agreements with service providers that may contain indemnification clauses. The fund’s maximum exposure under these agreements is unknown as this would involve future claims that may be made against the fund that have not yet occurred.
Investment Transactions and Income – Investment transactions are recorded on the trade date. Interest income is recorded on the accrual basis. All premium and discount is amortized or accreted for financial statement purposes in accordance with U.S. generally accepted accounting principles. Interest payments received in additional securities are recorded on theex-interest date in an amount equal to the value of the security on such date.
The fund may receive proceeds from litigation settlements. Any proceeds received from litigation involving portfolio holdings are reflected in the Statement of Operations in realized gain/loss if the security has been disposed of by the fund or in unrealized gain/loss if the security is still held by the fund. Any other proceeds from litigation not related to portfolio holdings are reflected as other income in the Statement of Operations.
Tax Matters and Distributions – The fund intends to qualify as a regulated investment company, as defined under Subchapter M of the Internal Revenue Code, and to distribute all of its taxable income, including realized capital gains. As a result, no provision for federal income tax is required. The fund’s federal tax returns, when filed, will remain subject to examination by the Internal Revenue Service for a three year period. Management has analyzed the fund’s tax positions taken on federal and state tax returns for all open
17
MFS Corporate Bond Portfolio
Notes to Financial Statements – continued
tax years and does not believe that there are any uncertain tax positions that require recognition of a tax liability. Foreign taxes, if any, have been accrued by the fund in the accompanying financial statements in accordance with the applicable foreign tax law. Foreign income taxes may be withheld by certain countries in which the fund invests. Additionally, capital gains realized by the fund on securities issued in or by certain foreign countries may be subject to capital gains tax imposed by those countries.
Distributions to shareholders are recorded on theex-dividend date. Income and capital gain distributions are determined in accordance with income tax regulations, which may differ from U.S. generally accepted accounting principles. Certain capital accounts in the financial statements are periodically adjusted for permanent differences in order to reflect their tax character. These adjustments have no impact on net assets or net asset value per share. Temporary differences which arise from recognizing certain items of income, expense, gain or loss in different periods for financial statement and tax purposes will reverse at some time in the future. Distributions in excess of net investment income or net realized gains are temporary overdistributions for financial statement purposes resulting from differences in the recognition or classification of income or distributions for financial statement and tax purposes.
Book/tax differences primarily relate to amortization and accretion of debt securities.
The tax character of distributions declared to shareholders for the last two fiscal years is as follows:
| | | | | | | | |
| | | Year ended
12/31/18 | | | Year ended
12/31/17 | |
| Ordinary income (including any short-term capital gains) | | | $9,320,203 | | | | $9,218,117 | |
| Long-term capital gains | | | 319,216 | | | | — | |
| Total distributions | | | $9,639,419 | | | | $9,218,117 | |
The federal tax cost and the tax basis components of distributable earnings were as follows:
| | | | |
| As of 12/31/18 | | | | |
| |
| Cost of investments | | | $217,189,456 | |
| Gross appreciation | | | 1,411,152 | |
| Gross depreciation | | | (8,358,565 | ) |
| Net unrealized appreciation (depreciation) | | | $(6,947,413 | ) |
| |
| Undistributed ordinary income | | | 8,023,326 | |
| Capital loss carryforwards | | | (1,030,459 | ) |
As of December 31, 2018, the fund had capital loss carryforwards available to offset future realized gains. These net capital losses may be carried forward indefinitely and their character is retained as short-term and/or long-term losses. Such losses are characterized as follows:
| | | | |
| Short-Term | | | $(934,200 | ) |
| Long-Term | | | (96,259 | ) |
| Total | | | $(1,030,459 | ) |
Multiple Classes of Shares of Beneficial Interest – The fund offers multiple classes of shares, which differ in their respective distribution and/or service fees. The fund’s income, realized and unrealized gain (loss), and common expenses are allocated to shareholders based on the daily net assets of each class. Dividends are declared separately for each class. Differences in per share dividend rates are generally due to differences in separate class expenses. The fund’s distributions declared to shareholders as reported in the Statements of Changes in Net Assets are presented by class as follows:
| | | | | | | | | | | | | | | | |
| | | From net investment
income | | | From net realized
gain | |
| | | | |
| | | Year ended
12/31/18 | | | Year ended
12/31/17 | | | Year ended
12/31/18 | | | Year ended
12/31/17 | |
| Initial Class | | | $2,333,444 | | | | $2,456,713 | | | | $245,139 | | | | $— | |
| Service Class | | | 6,343,746 | | | | 6,761,404 | | | | 717,090 | | | | — | |
| Total | | | $8,677,190 | | | | $9,218,117 | | | | $962,229 | | | | $— | |
| (3) | | Transactions with Affiliates |
Investment Adviser– The fund has an investment advisory agreement with MFS to provide overall investment management and related administrative services and facilities to the fund. The management fee is computed daily and paid monthly at the following annual rates based on the fund’s average daily net assets:
| | | | |
| Up to $1 billion | | | 0.60% | |
| In excess of $1 billion | | | 0.50% | |
18
MFS Corporate Bond Portfolio
Notes to Financial Statements – continued
MFS has agreed in writing to reduce its management fee by a specified amount if certain MFS mutual fund assets exceed thresholds agreed to by MFS and the fund’s Board of Trustees. For the year ended December 31, 2018, this management fee reduction amounted to $22,667, which is included in the reduction of total expenses in the Statement of Operations. The management fee incurred for the year ended December 31, 2018 was equivalent to an annual effective rate of 0.59% of the fund’s average daily net assets.
The investment adviser has agreed in writing to pay a portion of the fund’s total annual operating expenses, excluding interest, taxes, extraordinary expenses, brokerage and transaction costs, and investment-related expenses, such that total annual operating expenses do not exceed 0.63% of average daily net assets for the Initial Class shares and 0.88% of average daily net assets for the Service Class shares. This written agreement will continue until modified by the fund’s Board of Trustees, but such agreement will continue at least until April 30, 2020. For the year ended December 31, 2018, this reduction amounted to $99,662, which is included in the reduction of total expenses in the Statement of Operations.
Distributor– MFS Fund Distributors, Inc. (MFD), a wholly-owned subsidiary of MFS, is the distributor of shares of the fund. The Trustees have adopted a distribution plan for the Service Class shares pursuant to Rule12b-1 under the Investment Company Act of 1940.
The fund’s distribution plan provides that the fund will pay MFD distribution and/or service fees equal to 0.25% per annum of its average daily net assets attributable to Service Class shares as partial consideration for services performed and expenses incurred by MFD and financial intermediaries (including participating insurance companies that invest in the fund to fund variable annuity and variable life insurance contracts, sponsors of qualified retirement and pension plans that invest in the fund, and affiliates of these participating insurance companies and plan sponsors) in connection with the sale and distribution of the Service Class shares. MFD may subsequently pay all, or a portion, of the distribution and/or service fees to financial intermediaries.
Shareholder Servicing Agent– MFS Service Center, Inc. (MFSC), a wholly-owned subsidiary of MFS, receives a fee from the fund for its services as shareholder servicing agent. For the year ended December 31, 2018, the fee was $7,355, which equated to 0.0031% annually of the fund’s average daily net assets. MFSC also receives payment from the fund forout-of-pocket expenses paid by MFSC on behalf of the fund. For the year ended December 31, 2018, these costs amounted to $297.
Administrator– MFS provides certain financial, legal, shareholder communications, compliance, and other administrative services to the fund. Under an administrative services agreement, the fund reimburses MFS the costs incurred to provide these services. The fund is charged an annual fixed amount of $17,500 plus a fee based on average daily net assets. The administrative services fee incurred for the year ended December 31, 2018 was equivalent to an annual effective rate of 0.0185% of the fund’s average daily net assets.
Trustees’ and Officers’ Compensation– The fund pays compensation to independent Trustees in the form of a retainer, attendance fees, and additional compensation to Board and Committee chairpersons. The fund does not pay compensation directly to Trustees or officers of the fund who are also officers of the investment adviser, all of whom receive remuneration for their services to the fund from MFS. Certain officers and Trustees of the fund are officers or directors of MFS, MFD, and MFSC.
Other– This fund and certain other funds managed by MFS (the funds) have entered into a service agreement (the ISO Agreement) which provides for payment of fees solely by the funds to Tarantino LLC in return for the provision of services of an Independent Senior Officer (ISO) for the funds. Frank L. Tarantino serves as the ISO and is an officer of the funds and the sole member of Tarantino LLC. The funds can terminate the ISO Agreement with Tarantino LLC at any time under the terms of the ISO Agreement. For the year ended December 31, 2018, the fee paid by the fund under this agreement was $406 and is included in “Miscellaneous” expense in the Statement of Operations. MFS has agreed to bear all expenses associated with office space, other administrative support, and supplies provided to the ISO.
The fund invests in the MFS Institutional Money Market Portfolio which is managed by MFS and seeks current income consistent with preservation of capital and liquidity. This money market fund does not pay a management fee to MFS.
For the year ended December 31, 2018, purchases and sales of investments, other than short-term obligations, were as follows:
| | | | | | | | |
| | | Purchases | | | Sales | |
| U.S. Government securities | | | $15,372,094 | | | | $5,776,858 | |
| Non-U.S. Government securities | | | $57,292,054 | | | | $89,333,987 | |
19
MFS Corporate Bond Portfolio
Notes to Financial Statements – continued
| (5) | | Shares of Beneficial Interest |
The fund’s Declaration of Trust permits the Trustees to issue an unlimited number of full and fractional shares of beneficial interest. Transactions in fund shares were as follows:
| | | | | | | | | | | | | | | | |
| | | Year ended 12/31/18 | | | Year ended 12/31/17 | |
| | | Shares | | | Amount | | | Shares | | | Amount | |
| Shares sold | | | | | | | | | | | | | | | | |
Initial Class | | | 126,159 | | | | $1,417,456 | | | | 282,268 | | | | $3,276,802 | |
Service Class | | | 1,113,987 | | | | 12,293,052 | | | | 1,975,574 | | | | 22,523,964 | |
| | | 1,240,146 | | | | $13,710,508 | | | | 2,257,842 | | | | $25,800,766 | |
| Shares issued to shareholders in reinvestment of distributions | | | | | | | | | | | | | | | | |
Initial Class | | | 236,784 | | | | $2,578,583 | | | | 213,071 | | | | $2,456,713 | |
Service Class | | | 656,822 | | | | 7,060,836 | | | | 593,626 | | | | 6,761,404 | |
| | | 893,606 | | | | $9,639,419 | | | | 806,697 | | | | $9,218,117 | |
| Shares reacquired | | | | | | | | | | | | | | | | |
Initial Class | | | (756,941 | ) | | | $(8,379,096 | ) | | | (756,051 | ) | | | $(8,767,249 | ) |
Service Class | | | (4,210,235 | ) | | | (45,919,796 | ) | | | (2,445,256 | ) | | | (28,072,427 | ) |
| | | (4,967,176 | ) | | | $(54,298,892 | ) | | | (3,201,307 | ) | | | $(36,839,676 | ) |
| Net change | | | | | | | | | | | | | | | | |
Initial Class | | | (393,998 | ) | | | $(4,383,057 | ) | | | (260,712 | ) | | | $(3,033,734 | ) |
Service Class | | | (2,439,426 | ) | | | (26,565,908 | ) | | | 123,944 | | | | 1,212,941 | |
| | | (2,833,424 | ) | | | $(30,948,965 | ) | | | (136,768 | ) | | | $(1,820,793 | ) |
The fund and certain other funds managed by MFS participate in a $1.25 billion unsecured committed line of credit, subject to a $1 billion sublimit, provided by a syndication of banks under a credit agreement. Borrowings may be made for temporary financing needs. Interest is charged to each fund, based on its borrowings, generally at a rate equal to the higher of the Overnight Bank Funding rate or daily one month LIBOR plus an agreed upon spread. A commitment fee, based on the average daily, unused portion of the committed line of credit, is allocated among the participating funds. In addition, the fund and other funds managed by MFS have established unsecured uncommitted borrowing arrangements with certain banks for temporary financing needs. Interest is charged to each fund, based on its borrowings, at a rate equal to the Overnight Bank Funding rate plus an agreed upon spread. For the year ended December 31, 2018, the fund’s commitment fee and interest expense were $1,385 and $0, respectively, and are included in “Miscellaneous” expense in the Statement of Operations.
| (7) | | Investments in Affiliated Issuers |
An affiliated issuer may be considered one in which the fund owns 5% or more of the outstanding voting securities, or a company which is under common control. For the purposes of this report, the fund assumes the following to be affiliated issuers:
| | | | | | | | | | | | | | | | | | |
| Affiliated Issuers | | | | Beginning
Shares/Par
Amount | | | Acquisitions
Shares/Par
Amount | | | Dispositions
Shares/Par
Amount | | | Ending
Shares/Par
Amount | |
| MFS Institutional Money Market Portfolio | | | | | 11,301,365 | | | | 69,478,254 | | | | (77,772,528 | ) | | | 3,007,091 | |
| | | | | |
| Affiliated Issuers | | Realized
Gain (Loss) | | Change in
Unrealized
Appreciation/
Depreciation | | | Capital Gain
Distributions | | | Dividend
Income | | | Ending
Value | |
| MFS Institutional Money Market Portfolio | | $(522) | | | $99 | | | | $— | | | | $127,014 | | | | $3,006,790 | |
20
MFS Corporate Bond Portfolio
REPORT OF INDEPENDENT REGISTERED PUBLIC ACCOUNTING FIRM
To the Board of Trustees of MFS Variable Insurance Trust II and the Shareholders of
MFS Corporate Bond Portfolio:
Opinion on the Financial Statements and Financial Highlights
We have audited the accompanying statement of assets and liabilities of MFS Corporate Bond Portfolio (the “Fund”), including the portfolio of investments, as of December 31, 2018, the related statement of operations for the year then ended, the statements of changes in net assets for each of the two years in the period then ended, the financial highlights for each of the five years in the period then ended, and the related notes. In our opinion, the financial statements and financial highlights present fairly, in all material respects, the financial position of the Fund as of December 31, 2018, and the results of its operations for the year then ended, the changes in its net assets for each of the two years in the period then ended, and the financial highlights for each of the five years in the period then ended, in conformity with accounting principles generally accepted in the United States of America.
Basis for Opinion
These financial statements and financial highlights are the responsibility of the Fund’s management. Our responsibility is to express an opinion on the Fund’s financial statements and financial highlights based on our audits. We are a public accounting firm registered with the Public Company Accounting Oversight Board (United States) (PCAOB) and are required to be independent with respect to the Fund in accordance with the U.S. federal securities laws and the applicable rules and regulations of the Securities and Exchange Commission and the PCAOB.
We conducted our audits in accordance with the standards of the PCAOB. Those standards require that we plan and perform the audit to obtain reasonable assurance about whether the financial statements and financial highlights are free of material misstatement, whether due to error or fraud. The Fund is not required to have, nor were we engaged to perform, an audit of its internal control over financial reporting. As part of our audits we are required to obtain an understanding of internal control over financial reporting but not for the purpose of expressing an opinion on the effectiveness of the Fund’s internal control over financial reporting. Accordingly, we express no such opinion.
Our audits included performing procedures to assess the risks of material misstatement of the financial statements and financial highlights, whether due to error or fraud, and performing procedures that respond to those risks. Such procedures included examining, on a test basis, evidence regarding the amounts and disclosures in the financial statements and financial highlights. Our audits also included evaluating the accounting principles used and significant estimates made by management, as well as evaluating the overall presentation of the financial statements and financial highlights. Our procedures included confirmation of securities owned as of December 31, 2018, by correspondence with the custodian. We believe that our audits provide a reasonable basis for our opinion.
DELOITTE & TOUCHE LLP
Boston, Massachusetts
February 15, 2019
We have served as the auditor of one or more of the MFS investment companies since 1924.
21
MFS Corporate Bond Portfolio
TRUSTEES AND OFFICERS – IDENTIFICATION AND BACKGROUND
The Trustees and Officers of the Trust, as of February 1, 2019, are listed below, together with their principal occupations during the past five years. (Their titles may have varied during that period.) The address of each Trustee and Officer is 111 Huntington Avenue, Boston, Massachusetts 02199-7618.
| | | | | | | | | | |
Name, Age | | Position(s)
Held with Fund | | Trustee/Officer
Since (h) | | Number of MFS Funds overseen by the Trustee | | Principal Occupations
During the Past Five Years | | Other Directorships During the Past Five Years (j) |
| INTERESTED TRUSTEES |
Robert J. Manning (k) (age 55) | | Trustee | | February 2004 | | 135 | | Massachusetts Financial Services Company, Executive Chairman (since January 2017); Director; Chairman of the Board; Chief Executive Officer (until 2015);Co-Chief Executive Officer(2015-2016) | | N/A |
| | | | | |
Robin A. Stelmach (k) (age 57) | | Trustee | | January 2014 | | 135 | | Massachusetts Financial Services Company, Vice Chair (since January 2017); Chief Operating Officer and Executive Vice President (until January 2017) | | N/A |
|
| INDEPENDENT TRUSTEES |
John P. Kavanaugh (age 64) | | Trustee and Chair of Trustees | | January 2009 | | 135 | | Private investor | | N/A |
| | | | | |
Steven E. Buller (age 67) | | Trustee | | February 2014 | | 135 | | Financial Accounting Standards Advisory Council, Chairman(2014-2015); Public Company Accounting Oversight Board, Standing Advisory Group, Member (until 2014); BlackRock, Inc. (investment management), Managing Director (until 2014), BlackRock Finco UK (investment management), Director (until 2014) | | N/A |
| | | | | |
John A. Caroselli (age 64) | | Trustee | | March 2017 | | 135 | | JC Global Advisors, LLC (management consulting), President (since 2015); First Capital Corporation (commercial finance), Executive Vice President (until 2015) | | N/A |
| | | | | |
Maureen R. Goldfarb (age 63) | | Trustee | | January 2009 | | 135 | | Private investor | | N/A |
| | | | | |
Michael Hegarty (age 74) | | Trustee | | December 2004 | | 135 | | Private investor | | Rouse Properties Inc., Director (until 2016); Capmark Financial Group Inc., Director (until 2015) |
| | | | | |
Peter D. Jones (age 63) | | Trustee | | January 2019 | | 135 | | Franklin Templeton Distributors, Inc. (investment management), President (until 2015); Franklin Templeton Institutional, LLC (investment management), Chairman (until 2015) | | N/A |
| | | | | |
James W. Kilman, Jr. (age 57) | | Trustee | | January 2019 | | 135 | | KielStrand Capital LLC (family office and merchant bank), Chief Executive Officer (since 2016); Morgan Stanley & Co. (financial services), Vice Chairman of Investment Banking,Co-Head of Diversified Financials Coverage – Financial Institutions Investment Banking Group (until 2016) | | alpha-En Corporation, Director (since 2016) |
22
MFS Corporate Bond Portfolio
Trustees and Officers – continued
| | | | | | | | | | |
Name, Age | | Position(s)
Held with Fund | | Trustee/Officer
Since (h) | | Number of MFS Funds overseen by the Trustee | | Principal Occupations
During the Past Five Years | | Other Directorships During the Past Five Years (j) |
Clarence Otis, Jr. (age 62) | | Trustee | | March 2017 | | 135 | | Darden Restaurants, Inc., Chief Executive Officer (until 2014) | | VF Corporation, Director; Verizon Communications, Inc., Director; The Travelers Companies, Director; Federal Reserve Bank of Atlanta, Director (until 2015) |
| | | | | |
Maryanne L. Roepke (age 62) | | Trustee | | May 2014 | | 135 | | American Century Investments (investment management), Senior Vice President and Chief Compliance Officer (until 2014) | | N/A |
| | | | | |
Laurie J. Thomsen
(age 61) | | Trustee | | March 2005 | | 135 | | Private investor | | The Travelers Companies, Director; Dycom Industries, Inc., Director (since 2015) |
| | | | | | | | |
Name, Age | | Position(s)
Held with Fund | | Trustee/Officer
Since (h) | | Number of MFS Funds for which the Person is an Officer | | Principal Occupations During the Past Five Years |
| OFFICERS | | | | | | |
Christopher R. Bohane (k)
(age 45) | | Assistant Secretary and Assistant Clerk | | July 2005 | | 135 | | Massachusetts Financial Services Company, Vice President and Assistant General Counsel |
| | | | |
Kino Clark (k) (age 50) | | Assistant Treasurer | | January 2012 | | 135 | | Massachusetts Financial Services Company, Vice President |
| | | | |
John W. Clark, Jr. (k) (age 51) | | Assistant Treasurer | | April 2017 | | 135 | | Massachusetts Financial Services Company, Vice President (since March 2017); Deutsche Bank (financial services), Department Head – Treasurer’s Office (until February 2017) |
| | | | |
Thomas H. Connors (k) (age 59) | | Assistant Secretary and Assistant Clerk | | September 2012 | | 135 | | Massachusetts Financial Services Company, Vice President and Senior Counsel |
| | | | |
Ethan D. Corey (k)
(age 55) | | Assistant
Secretary and Assistant Clerk | | July 2005 | | 135 | | Massachusetts Financial Services Company, Senior Vice President and Associate General Counsel |
| | | | |
David L. DiLorenzo (k)
(age 50) | | President | | July 2005 | | 135 | | Massachusetts Financial Services Company, Senior Vice President |
| | | | |
Heidi W. Hardin (k) (age 51) | | Secretary and Clerk | | April 2017 | | 135 | | Massachusetts Financial Services Company, Executive Vice President and General Counsel (since March 2017); Harris Associates (investment management), General Counsel (from September 2015 to January 2017); Janus Capital Management LLC (investment management), Senior Vice President and General Counsel (until September 2015) |
| | | | |
Brian E. Langenfeld (k) (age 45) | | Assistant
Secretary and Assistant Clerk | | June 2006 | | 135 | | Massachusetts Financial Services Company, Vice President and Senior Counsel |
| | | | |
Amanda S. Mooradian (k) (age 39) | | Assistant
Secretary and Assistant Clerk | | September 2018 | | 135 | | Massachusetts Financial Services Company, Assistant Vice President and Counsel |
| | | | |
Susan A. Pereira (k)
(age 48) | | Assistant
Secretary and Assistant Clerk | | July 2005 | | 135 | | Massachusetts Financial Services Company, Vice President and Senior Counsel |
| | | | |
Kasey L. Phillips (k) (age 48) | | Assistant Treasurer | | September 2012 | | 135 | | Massachusetts Financial Services Company, Vice President |
| | | | |
Matthew A. Stowe (k) (age 44) | | Assistant Secretary and Assistant Clerk | | October 2014 | | 135 | | Massachusetts Financial Services Company, Vice President and Assistant General Counsel |
23
MFS Corporate Bond Portfolio
Trustees and Officers – continued
| | | | | | | | |
Name, Age | | Position(s)
Held with Fund | | Trustee/Officer
Since (h) | | Number of MFS Funds for which the Person is an Officer | | Principal Occupations During the Past Five Years |
Frank L. Tarantino
(age 74) | | Independent
Senior Officer | | June 2004 | | 135 | | Tarantino LLC (provider of compliance services), Principal |
| | | | |
Richard S. Weitzel (k)
(age 48) | | Assistant Secretary and Assistant Clerk | | October 2007 | | 135 | | Massachusetts Financial Services Company, Senior Vice President and Associate General Counsel |
| | | | |
Martin J. Wolin (k) (age 51) | | Chief Compliance Officer | | July 2015 | | 135 | | Massachusetts Financial Services Company, Senior Vice President and Chief Compliance Officer (since July 2015); Mercer (financial service provider), Chief Risk and Compliance Officer, North America and Latin America (until June 2015) |
| | | | |
James O. Yost (k)
(age 58) | | Treasurer | | September 1990 | | 135 | | Massachusetts Financial Services Company, Senior Vice President |
| (h) | Date first appointed to serve as Trustee/officer of an MFS Fund. Each Trustee has served continuously since appointment unless indicated otherwise. For the period from December 15, 2004 until February 22, 2005, Mr. Manning served as Advisory Trustee. From January 2012 through December 2016, Messrs. DiLorenzo and Yost served as Treasurer and Deputy Treasurer of the Funds, respectively. |
| (j) | Directorships or trusteeships of companies required to report to the Securities and Exchange Commission (i.e., “public companies”). |
| (k) | “Interested person” of the Trust within the meaning of the Investment Company Act of 1940 (referred to as the 1940 Act), which is the principal federal law governing investment companies like the fund, as a result of a position with MFS. The address of MFS is 111 Huntington Avenue, Boston, Massachusetts 02199-7618. |
Each Trustee has been elected by shareholders and each Trustee and officer holds office until his or her successor is chosen and qualified or until his or her earlier death, resignation, retirement or removal. The Trust does not hold annual meetings for the purpose of electing Trustees, and Trustees are not elected for fixed terms. Under the terms of the Board’s retirement policy, an Independent Trustee shall retire at the end of the calendar year in which he or she reaches the earlier of 75 years of age or 15 years of service on the Board (or, in the case of any Independent Trustee who joined the Board prior to 2015, 20 years of service on the Board).
Messrs. Buller, Hegarty, Kilman and Otis and Ms. Roepke are members of the Trust’s Audit Committee.
Each of the Interested Trustees and certain Officers hold comparable officer positions with certain affiliates of MFS.
The Statement of Additional Information for a Fund includes further information about the Trustees and is available without charge upon request by calling1-800-225-2606.
| | |
Investment Adviser Massachusetts Financial Services Company 111 Huntington Avenue Boston, MA 02199-7618 | | Custodian State Street Bank and Trust Company 1 Lincoln Street Boston, MA 02111-2900 |
Distributor MFS Fund Distributors, Inc. 111 Huntington Avenue Boston, MA 02199-7618 | | Independent Registered Public Accounting Firm Deloitte & Touche LLP 200 Berkeley Street Boston, MA 02116 |
Portfolio Manager(s) Alexander Mackey Robert Persons | | |
24
MFS Corporate Bond Portfolio
BOARD REVIEW OF INVESTMENT ADVISORY AGREEMENT
The Investment Company Act of 1940 requires that both the full Board of Trustees and a majority of thenon-interested (“independent”) Trustees, voting separately, annually approve the continuation of the Fund’s investment advisory agreement with MFS. The Trustees consider matters bearing on the Fund and its advisory arrangements at their meetings throughout the year, including a review of performance data at each regular meeting. In addition, the independent Trustees met several times over the course of three months beginning in May and ending in July, 2018 (“contract review meetings”) for the specific purpose of considering whether to approve the continuation of the investment advisory agreement for the Fund and the other investment companies that the Board oversees (the “MFS Funds”). The independent Trustees were assisted in their evaluation of the Fund’s investment advisory agreement by independent legal counsel, from whom they received separate legal advice and with whom they met separately from MFS during various contract review meetings. The independent Trustees were also assisted in this process by the MFS Funds’ Independent Senior Officer, a senior officer appointed by and reporting to the independent Trustees.
In connection with their deliberations regarding the continuation of the investment advisory agreement, the Trustees, including the independent Trustees, considered such information and factors as they believed, in light of the legal advice furnished to them and their own business judgment, to be relevant. The investment advisory agreement for the Fund was considered separately, although the Trustees also took into account the common interests of all MFS Funds in their review. As described below, the Trustees considered the nature, quality, and extent of the various investment advisory, administrative, and shareholder services performed by MFS under the existing investment advisory agreement and other arrangements with the Fund.
In connection with their contract review meetings, the Trustees received and relied upon materials that included, among other items: (i) information provided by Broadridge Financial Solutions, Inc. (“Broadridge”), an independent third party, on the investment performance of the Fund for various time periods ended December 31, 2017 and the investment performance of a group of funds with substantially similar investment classifications/objectives (the “Broadridge performance universe”), (ii) information provided by Broadridge on the Fund’s advisory fees and other expenses and the advisory fees and other expenses of comparable funds identified by Broadridge (the “Broadridge expense group”), (iii) information provided by MFS on the advisory fees of portfolios of other clients of MFS, including institutional separate accounts and other clients, (iv) information as to whether and to what extent applicable expense waivers, reimbursements or fee “breakpoints” are observed for the Fund, (v) information regarding MFS’ financial results and financial condition, including MFS’ and certain of its affiliates’ estimated profitability from services performed for the Fund and the MFS Funds as a whole, and compared to MFS’ institutional business, (vi) MFS’ views regarding the outlook for the mutual fund industry and the strategic business plans of MFS, (vii) descriptions of various functions performed by MFS for the Funds, such as compliance monitoring and portfolio trading practices, and (viii) information regarding the overall organization of MFS, including information about MFS’ senior management and other personnel providing investment advisory, administrative and other services to the Fund and the other MFS Funds. The comparative performance, fee and expense information prepared and provided by Broadridge was not independently verified and the independent Trustees did not independently verify any information provided to them by MFS.
The Trustees’ conclusion as to the continuation of the investment advisory agreement was based on a comprehensive consideration of all information provided to the Trustees and not the result of any single factor. Some of the factors that figured particularly in the Trustees’ deliberations are described below, although individual Trustees may have evaluated the information presented differently from one another, giving different weights to various factors. It is also important to recognize that the fee arrangements for the Fund and other MFS Funds are the result of years of review and discussion between the independent Trustees and MFS, that certain aspects of such arrangements may receive greater scrutiny in some years than in others, and that the Trustees’ conclusions may be based, in part, on their consideration of these same arrangements during the course of the year and in prior years.
Based on information provided by Broadridge and MFS, the Trustees reviewed the Fund’s total return investment performance as well as the Broadridge performance universe over various time periods. The Trustees placed particular emphasis on the total return performance of the Fund’s Initial Class shares in comparison to the performance of funds in its Broadridge performance universe over the three-year period ended December 31, 2017, which the Trustees believed was a long enough period to reflect differing market conditions. The total return performance of the Fund’s Initial Class shares was in the 1st quintile relative to the other funds in the universe for this three-year period (the 1st quintile being the best performers and the 5th quintile being the worst performers). The total return performance of the Fund’s Initial Class shares was in the 1st quintile for theone-year period and the 2nd quintile for the five-year period ended December 31, 2017 relative to the Broadridge performance universe. Because of the passage of time, these performance results may differ from the performance results for more recent periods, including those shown elsewhere in this report.
In the course of their deliberations, the Trustees took into account information provided by MFS in connection with the contract review meetings, as well as during investment review meetings conducted with portfolio management personnel during the course of the year regarding the Fund’s performance. After reviewing these and related factors, the Trustees concluded, within the context of their overall conclusions regarding the investment advisory agreement, that they were satisfied with MFS’ responses and efforts relating to investment performance.
25
MFS Corporate Bond Portfolio
Board Review of Investment Advisory Agreement – continued
In assessing the reasonableness of the Fund’s advisory fee, the Trustees considered, among other information, the Fund’s advisory fee and the total expense ratio of the Fund’s Initial Class shares as a percentage of average daily net assets and the advisory fee and total expense ratios of peer groups of funds based on information provided by Broadridge. The Trustees considered that MFS currently observes an expense limitation for the Fund, which may not be changed without the Trustees’ approval. The Trustees also considered that, according to the data provided by Broadridge (which takes into account any fee reductions or expense limitations that were in effect during the Fund’s last fiscal year), the Fund’s effective advisory fee rate and total expense ratio were each approximately at the Broadridge expense group median.
The Trustees also considered the advisory fees charged by MFS to any institutional separate accounts advised by MFS (“separate accounts”) and unaffiliated investment companies for which MFS serves as subadviser (“subadvised funds”) that have comparable investment strategies to the Fund, if any. In comparing these fees, the Trustees considered information provided by MFS as to the generally broader scope of services provided by MFS to the Fund, as well as the more extensive regulatory burdens imposed on MFS in managing the Fund, in comparison to separate accounts and subadvised funds. The Trustees also considered the higher demands placed on MFS’ investment personnel and trading infrastructure as a result of the daily cashin-flows andout-flows of the Fund in comparison to separate accounts.
The Trustees also considered whether the Fund may benefit from any economies of scale in the management of the Fund in the event of growth in assets of the Fund and/or growth in assets of the MFS Funds as a whole. They noted that the Fund’s advisory fee rate schedule is subject to a contractual breakpoint that reduces the Fund’s advisory fee rate on average daily net assets over $1 billion. The Trustees also noted that MFS has agreed in writing to waive a portion of the management fees of certain MFS Funds, including the Fund, if the total combined assets of certain funds within the MFS Funds’ complex increase above agreed upon thresholds (the “group fee waiver”), enabling the Fund’s shareholders to share in the benefits from any economies of scale at the complex level. The group fee waiver is reviewed and renewed annually between the Board and MFS. The Trustees concluded that the breakpoint and the group fee waiver were sufficient to allow the Fund to benefit from economies of scale as its assets and overall complex assets grow.
The Trustees also considered information prepared by MFS relating to MFS’ costs and profits with respect to the Fund, the MFS Funds considered as a group, and other investment companies and accounts advised by MFS, as well as MFS’ methodologies used to determine and allocate its costs to the MFS Funds, the Fund and other accounts and products for purposes of estimating profitability.
After reviewing these and other factors described herein, the Trustees concluded, within the context of their overall conclusions regarding the investment advisory agreement, that the advisory fees charged to the Fund represent reasonable compensation in light of the services being provided by MFS to the Fund.
In addition, the Trustees considered MFS’ resources and related efforts to continue to retain, attract and motivate capable personnel to serve the Fund. The Trustees also considered current and developing conditions in the financial services industry, including the presence of large and well-capitalized companies which are spending, and appear to be prepared to continue to spend, substantial sums to engage personnel and to provide services to competing investment companies. In this regard, the Trustees also considered the financial resources of MFS and its ultimate parent, Sun Life Financial Inc. The Trustees also considered the advantages and possible disadvantages to the Fund of having an adviser that also serves other investment companies as well as other accounts.
The Trustees also considered the nature, quality, cost, and extent of administrative, transfer agency, and distribution services provided to the Fund by MFS and its affiliates under agreements and plans other than the investment advisory agreement, including any12b-1 fees the Fund pays to MFS Fund Distributors, Inc., an affiliate of MFS. The Trustees also considered the nature, extent and quality of certain other services MFS performs or arranges for on the Fund’s behalf, which may include securities lending programs, directed expense payment programs, class action recovery programs, and MFS’ interaction with third-party service providers, principally custodians andsub-custodians. The Trustees concluded that the variousnon-advisory services provided by MFS and its affiliates on behalf of the Fund were satisfactory.
The Trustees consideredso-called“fall-out benefits” to MFS such as reputational value derived from serving as investment manager to the MFS Funds. The Trustees also considered that, effective January 3, 2018, MFS had discontinued its historic practice of obtaining investment research from portfolio brokerage commissions paid by certain MFS Funds and would thereafter voluntarily reimburse a Fund, if applicable, for the costs of external research acquired through the use of the Fund’s portfolio brokerage commissions.
Based on their evaluation of factors that they deemed to be material, including those factors described above, the Board of Trustees, including the independent Trustees, concluded that the Fund’s investment advisory agreement with MFS should be continued for an additionalone-year period, commencing August 1, 2018.
26
MFS Corporate Bond Portfolio
PROXY VOTING POLICIES AND INFORMATION
MFS votes proxies on behalf of the fund pursuant to proxy voting policies and procedures that are available without charge, upon request, by calling 1-800-225-2606, by visitingmfs.com/proxyvoting, or by visiting the SEC’s Web site athttp://www.sec.gov.
Information regarding how the fund voted proxies relating to portfolio securities during the most recent twelve-month period ended June 30 is available by August 31 of each year without charge by visitingmfs.com/proxyvoting, or by visiting the SEC’s Web site athttp://www.sec.gov.
QUARTERLY PORTFOLIO DISCLOSURE
The fund files a complete schedule of portfolio holdings with the SEC for the first and third quarters of each fiscal year on Form N-Q. The fund’s Form N-Q is available on the SEC’s website athttp://www.sec.gov.A shareholder can obtain the portfolio holdings report for the first and third quarters of the fund’s fiscal year atmfs.com/vit2 by choosing the fund’s name and then selecting the “Resources” tab and clicking on “Prospectus and Reports”.
FURTHER INFORMATION
From time to time, MFS may post important information about the fund or the MFS funds on the MFS web site (mfs.com). This information is available athttps://www.mfs.com/en-us/what-we-do/announcements.htmlor atmfs.com/vit2 by choosing the fund’s name.
INFORMATION ABOUT FUND CONTRACTS AND LEGAL CLAIMS
The fund has entered into contractual arrangements with an investment adviser, administrator, distributor, shareholder servicing agent, 529 program manager (if applicable), and custodian who each provide services to the fund. Unless expressly stated otherwise, shareholders are not parties to, or intended beneficiaries of these contractual arrangements, and these contractual arrangements are not intended to create any shareholder right to enforce them against the service providers or to seek any remedy under them against the service providers, either directly or on behalf of the fund.
Under the Trust’s By-Laws and Declaration of Trust, any claims asserted against or on behalf of the MFS Funds, including claims against Trustees and Officers, must be brought in state and federal courts located within the Commonwealth of Massachusetts.
FEDERAL TAX INFORMATION (unaudited)
The following information is provided pursuant to provisions of the Internal Revenue Code.
The fund designates $352,000 as capital gain dividends paid during the fiscal year.
27
rev. 3/16
| | | | |
| | | |
| FACTS | | WHAT DOES MFS DO WITH YOUR
PERSONAL INFORMATION? | |  |
| | |
| Why? | | Financial companies choose how they share your personal information. Federal law gives consumers the right to limit some but not all sharing. Federal law also requires us to tell you how we collect, share, and protect your personal information. Please read this notice carefully to understand what we do. |
| | |
| What? | | The types of personal information we collect and share depend on the product or service you have with us. This information can include: • Social Security number and account balances • Account transactions and transaction history • Checking account information and wire transfer instructions When you areno longer our customer, we continue to share your information as described in this notice. |
| | |
| How? | | All financial companies need to share customers’ personal information to run their everyday business. In the section below, we list the reasons financial companies can share their customers’ personal information; the reasons MFS chooses to share; and whether you can limit this sharing. |
| | | | |
Reasons we can share your
personal information | | Does MFS share? | | Can you limit this
sharing? |
For our everyday business purposes – such as to process your transactions, maintain your account(s), respond to court orders and legal investigations, or report to credit bureaus | | Yes | | No |
For our marketing purposes – to offer our products and services to you | | No | | We don’t share |
| For joint marketing with other financial companies | | No | | We don’t share |
For our affiliates’ everyday business purposes – information about your transactions and experiences | | No | | We don’t share |
For our affiliates’ everyday business purposes – information about your creditworthiness | | No | | We don’t share |
| For nonaffiliates to market to you | | No | | We don’t share |
| | |
| | |
| Questions? | | Call800-225-2606 or go tomfs.com. |
28
| | |
| Who we are |
| Who is providing this notice? | | MFS Funds, MFS Investment Management, MFS Institutional Advisors, Inc., and MFS Heritage Trust Company. |
| | |
| What we do |
| How does MFS protect my personal information? | | To protect your personal information from unauthorized access and use, we use security measures that comply with federal law. These measures include procedural, electronic, and physical safeguards for the protection of the personal information we collect about you. |
How does MFS
collect my personal information? | | We collect your personal information, for example, when you • open an account or provide account information • direct us to buy securities or direct us to sell your securities • make a wire transfer We also collect your personal information from others, such as credit bureaus, affiliates, or other companies. |
| Why can’t I limit all sharing? | | Federal law gives you the right to limit only • sharing for affiliates’ everyday business purposes – information about your creditworthiness • affiliates from using your information to market to you • sharing for nonaffiliates to market to you State laws and individual companies may give you additional rights to limit sharing. |
| | |
| Definitions |
| Affiliates | | Companies related by common ownership or control. They can be financial and nonfinancial companies. • MFS does not share personal information with affiliates, except for everyday business purposes as described on page one of this notice. |
| Nonaffiliates | | Companies not related by common ownership or control. They can be financial and nonfinancial companies. • MFS does not share with nonaffiliates so they can market to you. |
| Joint marketing | | A formal agreement between nonaffiliated financial companies that together market financial products or services to you. • MFS doesn’t jointly market. |
| | |
| Other important information |
| If you own an MFS product or receive an MFS service in the name of a third party such as a bank or broker-dealer, their privacy policy may apply to you instead of ours. |
29
Annual Report
December 31, 2018

MFS® Core Equity Portfolio

MFS® Variable Insurance Trust II
Beginning on January 1, 2021, as permitted by regulations adopted by the U.S. Securities and Exchange Commission, the insurance company that offers your contract may determine that it will no longer send you paper copies of the fund’s annual and semiannual shareholder reports unless you specifically request paper copies from the insurance company or from your financial intermediary. Instead, the shareholder reports will be made available on a Web site (insurancefunds.mfs.com or other Web site of which you will be notified), and the insurance company will notify you by mail each time a report is posted and provide you with a Web site link to access the report. Instructions for requesting paper copies will be provided by your insurance company or financial intermediary.
If you already elected to receive shareholder reports by email, you will not be affected by this change and you need not take any action. If your insurance company or financial intermediary offers electronic delivery, you may elect to receive shareholder reports and other communications from the insurance company or financial intermediary by email by following the instructions provided by the insurance company or financial intermediary.
Beginning on January 1, 2019, you may elect to receive all future reports in paper free of charge from the insurance company or financial intermediary. You can inform the insurance company or financial intermediary that you wish to continue receiving paper copies of your shareholder reports by contacting your insurance company or financial intermediary. Your election to receive reports in paper will apply to all funds held in your account with your insurance company or financial intermediary.
RGS-ANN
MFS® Core Equity Portfolio
CONTENTS
The report is prepared for the general information of contract owners. It is authorized for distribution to prospective investors only when preceded or accompanied by a current prospectus.
NOT FDIC INSURED• MAY LOSE VALUE• NO BANK OR CREDIT UNION GUARANTEE• NOT A DEPOSIT• NOT INSURED BY ANY FEDERAL GOVERNMENT AGENCY OR NCUA/NCUSIF
MFS Core Equity Portfolio
LETTER FROM THE EXECUTIVE CHAIRMAN

Dear Contract Owners:
Higher interest rates, international trade friction, and geopolitical uncertainty surrounding issues such as Brexit have contributed to an uptick in market volatility in recent quarters — a departure from thelow-volatility environment that prevailed for much of the past several years. Against this more challenging backdrop, equity markets in the United States outperformed most international markets on a relative basis in 2018, though broad market returns were modestly negative on an absolute basis. Global economic growth has become less synchronized over the past few quarters, with Europe, China, and some emerging markets having shown signs of significantly slowing growth. While U.S. growth has remained above average, the pace of that growth slowed in the second half of 2018.
Slowing global growth and tighter financial conditions have clouded the outlook for U.S. monetary policy, with the chairman of the U.S. Federal Reserve acknowledging that policy rates are close to levels that the Fed deems neutral for the U.S. economy. This suggests that the predictable pattern of quarterly rate increases is behind us. At the same time, markets must contend with a shift from years of quantitative easing toward a cycle of quantitative tightening now that the European Central Bank has halted asset purchases. U.S. tax reforms adopted in late 2017 have been welcomed by equity markets while emerging market economies have recently had to contend with tighter financial conditions as a result of firmer U.S. interest rates and a stronger dollar. With the Republicans losing control of the U.S. House of Representatives, further meaningful U.S. fiscal stimulus appears less likely over the remainder of this presidential term. A partial U.S. government shutdown, beginning in late 2018, also added to political uncertainty. Globally, inflation remains largely subdued thanks in part to falling oil prices, but tight labor markets and moderate global demand have investors on the lookout for its potential reappearance. Increased U.S. protectionism is also a growing concern, as investors fear trade disputes could dampen business sentiment, leading to even slower global growth. While there has been progress on this front — a NAFTA replacement has been agreed upon between the U.S., Mexico, and Canada; the free trade pact with Korea has been updated; and a negotiating framework with the European Union has been agreed upon — tensions over trade with China remain quite high, though the two sides have recently returned to the negotiating table.
As a global investment manager with nearly a century of expertise, MFS® firmly believes active risk management offers downside mitigation and may help improve investment outcomes. We built our active investment platform with this belief in mind. Ourlong-term perspective influences nearly every aspect of our business, ensuring our investment decisions align with the investing time horizons of our clients.
Respectfully,

Robert J. Manning
Executive Chairman
MFS Investment Management
February 15, 2019
The opinions expressed in this letter are subject to change and may not be relied upon for investment advice. No forecasts can be guaranteed.
1
MFS Core Equity Portfolio
PORTFOLIO COMPOSITION
Portfolio structure
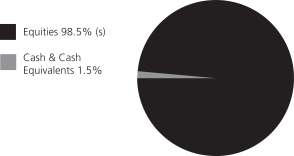
| | | | | | |
| Top ten holdings | | | | |
| Amazon.com, Inc. | | | 2.9% | |
| Alphabet, Inc., “A” | | | 2.8% | |
| Microsoft Corp. | | | 2.4% | |
| American Tower Corp., REIT | | | 2.3% | |
| Johnson & Johnson | | | 2.2% | |
| Pfizer, Inc. | | | 2.1% | |
| Chevron Corp. | | | 2.0% | |
| Analog Devices, Inc. | | | 2.0% | |
| Aon PLC | | | 1.9% | |
| Facebook, Inc., “A” | | | 1.8% | |
| | | | |
| Global equity sectors (k) | | | | |
| Technology | | | 23.6% | |
| Financial Services | | | 17.8% | |
| Health Care | | | 15.0% | |
| Capital Goods | | | 13.5% | |
| Consumer Cyclicals | | | 11.4% | |
| Energy | | | 8.4% | |
| Consumer Staples | | | 5.2% | |
| Telecommunications/Cable Television (s) | | | 3.6% | |
| (k) | The sectors set forth above and the associated portfolio composition are based on MFS’ own custom sector classification methodology. |
| (s) | Includes securities sold short. |
Cash & Cash Equivalents includes any cash, investments in money market funds, short-term securities, and other assets less liabilities. Please see the Statement of Assets and Liabilities for additional information related to the fund’s cash position and other assets and liabilities.
Percentages are based on net assets as of December 31, 2018.
The portfolio is actively managed and current holdings may be different.
2
MFS Core Equity Portfolio
MANAGEMENT REVIEW
Summary of Results
For the twelve months ended December 31, 2018, Initial Class shares of the MFS Core Equity Portfolio (“fund”) provided a total return of –3.83%, while Service Class shares of the fund provided a total return of –4.07%. These compare with a return of –5.24% over the same period for the fund’s benchmark, the Russell 3000® Index.
Market Environment
During the reporting period, the US Federal Reserve raised interest rates by 100 basis points, bringing the total number of rate hikes to nine since the central bank began to normalize monetary policy in late 2015. Economic growth rates in the US, Eurozone and Japan remained above trend, despite a slowing in global growth, particularly toward the end of the period. Inflation remained contained, particularly outside the US. Late in the period, the European Central Bank halted its asset purchase program but issued forward guidance that it does not expect to raise interest rates at least until after the summer of 2019. The Bank of England (once) and the Bank of Canada (three times) each raised rates during the period. The European political backdrop became a bit more volatile, late in the period, spurred by concerns over cohesion in the eurozone after the election of an anti-establishment, Eurosceptic coalition government in Italy and widespread protests over stagnant wage growth in France.
Bond yields rose in the US during most of the period, but remained low by historical standards and slipped from their highs, late in the period, as market volatility increased. Yields in many developed markets fell. Outside of emerging markets, where spreads and currencies came under pressure, credit spreads remained quite tight until the end of the period, when thinner liquidity, lower oil prices and concerns over high degrees of corporate leverage emerged. Growing concern over increasing global trade friction appeared to have weighed on business sentiment during the period’s second half, especially outside the US. Tighter financial conditions from rising US rates and a strong dollar, combined with trade uncertainty, helped expose structural weaknesses in several emerging markets in the second half of the period.
Volatility increased, at the end of the period, amid signs of slowing global economic growth and increasing trade tensions, which prompted a market setback shortly after US markets set record highs in September. It was the second such equity market decline during the reporting period. The correction came despite a third consecutive quarter of strong growth in US earnings per share. Strong earnings growth, combined with the market decline, brought US equity valuations down from elevated levels, earlier in the period, to multiples more in line with long-term averages. While the US economy held up better than most, global economic growth became less synchronized during the period, with Europe and China showing signs of a slowdown and some emerging markets coming under stress.
Contributors to Performance
Security selection within both thecapital goods andtelecommunications/cable television sectors was a primary factor that contributed to the fund’s performance relative to the Russell 3000® Index. Within thecapital goods sector, not holding shares of poor-performing diversified industrial conglomerate General Electric helped relative results. Shares of General Electric struggled as impairment charges related to the company’s insurance reserves, weakness in its power division and poor free cash flow generation led the company’s management to slash its dividend and lower its forward earnings guidance. Within thetelecommunications/cable television sector, the fund’s overweight position in broadcast and communication tower management firm American Tower benefited relative returns. Shares of American Tower outpaced the benchmark, notably late in the period, as the company reported strong growth in domestic property revenue and raised its earnings outlook for the upcoming year.
Elsewhere, the fund’s overweight positions in customer information software manager Salesforce.com, software company Adobe Systems, pharmaceutical giant Pfizer, real estate investment trust Medical Properties Trust, risk management and human capital consulting services provider Aon and animal health products manufacturer Zoetis supported relative returns. An underweight position in poor-performing diversified financial services firm Wells Fargo (h) also helped relative results.
Detractors from Performance
The combination of stock selection and a modest overweight position in theconsumer staples sector held back relative performance during the reporting period. Notably, the timing of the fund’s overweight position in beauty products company Coty (h) hindered relative returns. Shares of Coty fell as on-going execution challenges, including a difficult retail environment and disruptions in the company’s supply chain, weighed on corporate profits.
Stocks in other sectors that detracted from relative performance included overweight positions in financial services firm Citigroup, computer graphics processors maker NVIDIA, onshore oil and gas drilling services provider Patterson-UTI Energy, regional banking firm Bank OZK, specialty retailer L Brands and social media company Facebook. Shares of Facebook declined over the reporting period as data privacy concerns, in the wake of the Cambridge Analytica scandal, appeared to have weighed on investor sentiment. The company also faced new privacy regulatory challenges, such as the European Data Protection Regulation (GDPR), which hurt its
3
MFS Core Equity Portfolio
Management Review – continued
advertising sales. Not holding shares of pharmaceutical company Merck & Co., an underweight position in strong-performing software giant Microsoft, and the timing of the fund’s underweight position in streaming media service Netflix also weakened relative results.
Respectfully,
Portfolio Manager(s)
Joseph MacDougall
| (h) | Security was not held in the portfolio at period end. |
The views expressed in this report are those of the portfolio manager(s) only through the end of the period of the report as stated on the cover and do not necessarily reflect the views of MFS or any other person in the MFS organization. These views are subject to change at any time based on market or other conditions, and MFS disclaims any responsibility to update such views. These views may not be relied upon as investment advice or an indication of trading intent on behalf of any MFS portfolio. References to specific securities are not recommendations of such securities, and may not be representative of any MFS portfolio’s current or future investments.
4
MFS Core Equity Portfolio
PERFORMANCE SUMMARY THROUGH 12/31/18
The following chart illustrates the historical performance of the fund in comparison to its benchmark(s). Benchmarks are unmanaged and may not be invested in directly. Benchmark returns do not reflect any fees or expenses. The performance of other share classes will be greater than or less than that of the class depicted below. (See Notes to Performance Summary.)
Performance data shown represents past performance and is no guarantee of future results. Investment return and principal value fluctuate so your units, when sold, may be worth more or less than the original cost; current performance may be lower or higher than quoted. The performance shown does not reflect the deduction of taxes, if any, that a contract holder would pay on fund distributions or the redemption of contract units. The returns for the fund shown also do not reflect the deduction of expenses associated with variable products, such as mortality and expense risk charges, separate account charges, and sales charges imposed by the insurance company separate accounts. Such expenses would reduce the overall returns shown.
Growth of a Hypothetical $10,000 Investment
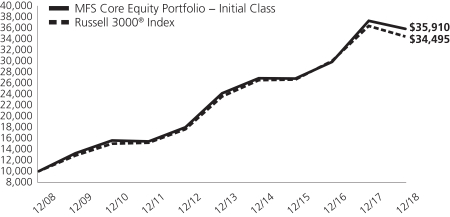
Total Returns through 12/31/18
Average annual total returns
| | | | | | | | | | | | |
| | | Share Class | | Class Inception Date | | 1-yr | | 5-yr | | 10-yr | | |
| | | Initial Class | | 5/12/97 | | (3.83)% | | 8.24% | | 13.64% | | |
| | | Service Class | | 8/24/01 | | (4.07)% | | 7.97% | | 13.36% | | |
| | | | |
| Comparative benchmark(s) | | | | | | | | |
| | | Russell 3000® Index (f) | | (5.24)% | | 7.91% | | 13.18% | | |
| (f) | Source: FactSet Research Systems Inc. |
Benchmark Definition(s)
Russell 3000® Index – constructed to provide a comprehensive barometer for the 3,000 largest U.S. companies based on total market capitalization, which represents approximately 98% of the investable U.S. equity market. The Russell 3000® Index is a trademark/service mark of the Frank Russell Company. Russell® is a trademark of the Frank Russell Company.
It is not possible to invest directly in an index.
Notes to Performance Summary
Average annual total return represents the average annual change in value for each share class for the periods presented.
Performance results reflect any applicable expense subsidies and waivers in effect during the periods shown. Without such subsidies and waivers the fund’s performance results would be less favorable. Please see the prospectus and financial statements for complete details. All results are historical and assume the reinvestment of any dividends and capital gains distributions.
Performance results do not include adjustments made for financial reporting purposes in accordance with U.S. generally accepted accounting principles and may differ from amounts reported in the financial highlights.
From time to time the fund may receive proceeds from litigation settlements, without which performance would be lower.
5
MFS Core Equity Portfolio
EXPENSE TABLE
Fund Expenses Borne by the Contract Holders during the Period,
July 1, 2018 through December 31, 2018
As a contract holder of the fund, you incur ongoing costs, including management fees; distribution and/or service(12b-1) fees; and other fund expenses. This example is intended to help you understand your ongoing costs (in dollars) of investing in the fund and to compare these costs with the ongoing costs of investing in other mutual funds.
The example is based on an investment of $1,000 invested at the beginning of the period and held for the entire period
July 1, 2018 through December 31, 2018.
Actual Expenses
The first line for each share class in the following table provides information about actual account values and actual expenses. You may use the information in this line, together with the amount you invested, to estimate the expenses that you paid over the period. Simply divide your account value by $1,000 (for example, an $8,600 account value divided by $1,000 = 8.6), then multiply the result by the number in the first line under the heading entitled “Expenses Paid During Period” to estimate the expenses you paid on your
account during this period.
Hypothetical Example for Comparison Purposes
The second line for each share class in the following table provides information about hypothetical account values and hypothetical expenses based on the fund’s actual expense ratio and an assumed rate of return of 5% per year before expenses, which is not the fund’s actual return. The hypothetical account values and expenses may not be used to estimate the actual ending account balance or expenses you paid for the period. You may use this information to compare the ongoing costs of investing in the fund and other funds. To do so, compare this 5% hypothetical example with the 5% hypothetical examples that appear in the shareholder reports of the other funds.
Please note that the expenses shown in the table are meant to highlight the fund’s ongoing costs only and do not take into account the fees and expenses imposed under the variable contracts through which your investment in the fund is made. Therefore, the second line for each share class in the table is useful in comparing ongoing costs associated with an investment in vehicles (such as the fund) which fund benefits under variable annuity and variable life insurance contracts and to qualified pension and retirement plans only, and will not help you determine the relative total costs of investing in the fund through variable annuity and variable life insurance contracts. If the fees and expenses imposed under the variable contracts were included, your costs would have been
higher.
| | | | | | | | | | | | | | | | | | |
| Share Class | | | | Annualized
Expense Ratio | | | Beginning
Account Value
7/01/18 | | | Ending
Account Value
12/31/18 | | | Expenses Paid
During Period (p)
7/01/18-12/31/18 | |
| Initial Class | | Actual | | | 0.86% | | | | $1,000.00 | | | | $923.95 | | | | $4.17 | |
| | Hypothetical (h) | | | 0.86% | | | | $1,000.00 | | | | $1,020.87 | | | | $4.38 | |
| Service Class | | Actual | | | 1.11% | | | | $1,000.00 | | | | $922.73 | | | | $5.38 | |
| | Hypothetical (h) | | | 1.11% | | | | $1,000.00 | | | | $1,019.61 | | | | $5.65 | |
| (h) | 5% class return per year before expenses. |
| (p) | “Expenses Paid During Period” are equal to each class’s annualized expense ratio, as shown above, multiplied by the average account value over the period, multiplied by 184/365 (to reflect theone-half year period). |
Notes to Expense Table
Expense ratios include 0.02% of investment related expenses from short sales (See Note 2 of the Notes to Financial Statements) that are outside of the expense limitation arrangement (See Note 3 of the Notes to Financial Statements).
6
MFS Core Equity Portfolio
PORTFOLIO OF INVESTMENTS – 12/31/18
The Portfolio of Investments is a complete list of all securities owned by your fund. It is categorized by broad-based asset classes.
| | | | | | | | |
| Issuer | | Shares/Par | | | Value ($) | |
| COMMON STOCKS – 98.8% | | | | | | | | |
| Aerospace – 3.4% | | | | | | | | |
| Boeing Co. | | | 4,575 | | | $ | 1,475,438 | |
| CACI International, Inc., “A” (a) | | | 2,040 | | | | 293,821 | |
| Curtiss-Wright Corp. | | | 3,635 | | | | 371,206 | |
| FLIR Systems, Inc. | | | 3,162 | | | | 137,674 | |
| Honeywell International, Inc. | | | 12,471 | | | | 1,647,669 | |
| Northrop Grumman Corp. | | | 5,646 | | | | 1,382,705 | |
| United Technologies Corp. | | | 10,182 | | | | 1,084,179 | |
| | | | | | | | |
| | | | | | $ | 6,392,692 | |
| | | | | | | | |
| Alcoholic Beverages – 0.3% | | | | | | | | |
| Constellation Brands, Inc., “A” | | | 3,404 | | | $ | 547,431 | |
| | | | | | | | |
| Apparel Manufacturers – 0.7% | | | | | | | | |
| NIKE, Inc., “B” | | | 13,079 | | | $ | 969,677 | |
| Skechers USA, Inc., “A” (a) | | | 15,881 | | | | 363,516 | |
| | | | | | | | |
| | | | | | $ | 1,333,193 | |
| | | | | | | | |
| Automotive – 0.6% | | | | | | | | |
| Copart, Inc. (a) | | | 8,207 | | | $ | 392,131 | |
| Lear Corp. | | | 4,057 | | | | 498,443 | |
| Stoneridge, Inc. (a) | | | 10,633 | | | | 262,103 | |
| | | | | | | | |
| | | | | | $ | 1,152,677 | |
| | | | | | | | |
| Biotechnology – 1.1% | | | | | | | | |
| Biogen, Inc. (a) | | | 5,259 | | | $ | 1,582,538 | |
| Illumina, Inc. (a) | | | 1,312 | | | | 393,508 | |
| | | | | | | | |
| | | | | | $ | 1,976,046 | |
| | | | | | | | |
| Broadcasting – 0.2% | | | | | | | | |
| Netflix, Inc. (a) | | | 1,187 | | | $ | 317,712 | |
| | | | | | | | |
| Brokerage & Asset Managers – 2.2% | | | | | | | | |
| Blackstone Group LP | | | 28,067 | | | $ | 836,677 | |
| HealthEquity, Inc. (a) | | | 3,467 | | | | 206,806 | |
| Invesco Ltd. | | | 20,170 | | | | 337,646 | |
| TD Ameritrade Holding Corp. | | | 37,659 | | | | 1,843,785 | |
| TMX Group Ltd. | | | 15,803 | | | | 818,742 | |
| | | | | | | | |
| | | | | | $ | 4,043,656 | |
| | | | | | | | |
| Business Services – 3.3% | | | | | | | | |
| Amdocs Ltd. | | | 7,651 | | | $ | 448,196 | |
| Cognizant Technology Solutions Corp., “A” | | | 13,223 | | | | 839,396 | |
| DXC Technology Co. | | | 10,574 | | | | 562,219 | |
| Equinix, Inc., REIT | | | 1,487 | | | | 524,257 | |
| Fidelity National Information Services, Inc. | | | 9,625 | | | | 987,044 | |
| First Data Corp. (a) | | | 18,937 | | | | 320,225 | |
| Global Payments, Inc. | | | 7,687 | | | | 792,760 | |
| Grand Canyon Education, Inc. (a) | | | 2,871 | | | | 276,018 | |
| Total System Services, Inc. | | | 5,546 | | | | 450,834 | |
| Verisk Analytics, Inc., “A” (a) | | | 8,223 | | | | 896,636 | |
| | | | | | | | |
| | | | | | $ | 6,097,585 | |
| | | | | | | | |
| Cable TV – 0.9% | | | | | | | | |
| Altice USA, Inc. | | | 32,894 | | | $ | 543,409 | |
| Comcast Corp., “A” | | | 34,390 | | | | 1,170,979 | |
| | | | | | | | |
| | | | | | $ | 1,714,388 | |
| | | | | | | | |
| | | | | | | | |
| Issuer | | Shares/Par | | | Value ($) | |
| COMMON STOCKS – continued | | | | | |
| Chemicals – 2.3% | | | | | | | | |
| CF Industries Holdings, Inc. | | | 13,895 | | | $ | 604,571 | |
| DowDuPont, Inc. | | | 21,731 | | | | 1,162,174 | |
| Eastman Chemical Co. | | | 4,456 | | | | 325,778 | |
| FMC Corp. | | | 6,189 | | | | 457,738 | |
| Ingevity Corp. (a) | | | 4,630 | | | | 387,485 | |
| PPG Industries, Inc. | | | 12,868 | | | | 1,315,496 | |
| | | | | | | | |
| | | | | | $ | 4,253,242 | |
| | | | | | | | |
| Computer Software – 6.3% | | | | | | | | |
| 8x8, Inc. (a) | | | 43,732 | | | $ | 788,925 | |
| Adobe Systems, Inc. (a) | | | 9,713 | | | | 2,197,469 | |
| Autodesk, Inc. (a) | | | 4,382 | | | | 563,569 | |
| Cadence Design Systems, Inc. (a) | | | 15,147 | | | | 658,592 | |
| Microsoft Corp. | | | 44,110 | | | | 4,480,253 | |
| Salesforce.com, Inc. (a) | | | 22,499 | | | | 3,081,688 | |
| | | | | | | | |
| | | | | | $ | 11,770,496 | |
| | | | | | | | |
| Computer Software – Systems – 1.4% | | | | | |
| Apple, Inc. | | | 10,696 | | | $ | 1,687,187 | |
| Pluralsight, Inc., “A” (a) | | | 17,748 | | | | 417,966 | |
| Rapid7, Inc. (a) | | | 18,145 | | | | 565,398 | |
| | | | | | | | |
| | | | | | $ | 2,670,551 | |
| | | | | | | | |
| Construction – 0.8% | | | | | | | | |
| Toll Brothers, Inc. | | | 19,913 | | | $ | 655,735 | |
| Vulcan Materials Co. | | | 8,760 | | | | 865,488 | |
| | | | | | | | |
| | | | | | $ | 1,521,223 | |
| | | | | | | | |
| Consumer Products – 1.6% | | | | | | | | |
| Colgate-Palmolive Co. | | | 14,176 | | | $ | 843,756 | |
| Kimberly-Clark Corp. | | | 6,488 | | | | 739,243 | |
| Newell Brands, Inc. | | | 25,333 | | | | 470,940 | |
| Procter & Gamble Co. | | | 10,320 | | | | 948,614 | |
| | | | | | | | |
| | | | | | $ | 3,002,553 | |
| | | | | | | | |
| Consumer Services – 1.3% | | | | | | | | |
| Bookings Holdings, Inc. (a) | | | 1,138 | | | $ | 1,960,114 | |
| Bright Horizons Family Solutions, Inc. (a) | | | 3,554 | | | | 396,093 | |
| | | | | | | | |
| | | | | | $ | 2,356,207 | |
| | | | | | | | |
| Containers – 0.5% | | | | | | | | |
| Berry Global Group, Inc. (a) | | | 14,950 | | | $ | 710,574 | |
| Sealed Air Corp. | | | 8,661 | | | | 301,749 | |
| | | | | | | | |
| | | | | | $ | 1,012,323 | |
| | | | | | | | |
| Electrical Equipment – 2.2% | | | | | | | | |
| AMETEK, Inc. | | | 20,314 | | | $ | 1,375,258 | |
| Fortive Corp. | | | 7,077 | | | | 478,830 | |
| HD Supply Holdings, Inc. (a) | | | 14,530 | | | | 545,165 | |
| Resideo Technologies, Inc. (a) | | | 2,078 | | | | 42,703 | |
| Sensata Technologies Holding PLC (a) | | | 16,522 | | | | 740,846 | |
| TE Connectivity Ltd. | | | 7,447 | | | | 563,217 | |
| WESCO International, Inc. (a) | | | 5,410 | | | | 259,680 | |
| | | | | | | | |
| | | | | | $ | 4,005,699 | |
| | | | | | | | |
7
MFS Core Equity Portfolio
Portfolio of Investments – continued
| | | | | | | | |
| Issuer | | Shares/Par | | | Value ($) | |
| COMMON STOCKS – continued | | | | | |
| Electronics – 5.6% | | | | | | | | |
| Analog Devices, Inc. | | | 42,870 | | | $ | 3,679,532 | |
| IPG Photonics Corp. (a) | | | 1,310 | | | | 148,410 | |
| Lam Research Corp. | | | 1,243 | | | | 169,259 | |
| Marvell Technology Group Ltd. | | | 74,143 | | | | 1,200,375 | |
| Mellanox Technologies Ltd. (a) | | | 2,670 | | | | 246,655 | |
| Monolithic Power Systems, Inc. | | | 1,464 | | | | 170,190 | |
| NVIDIA Corp. | | | 11,344 | | | | 1,514,424 | |
| Silicon Laboratories, Inc. (a) | | | 3,516 | | | | 277,096 | |
| Texas Instruments, Inc. | | | 31,120 | | | | 2,940,840 | |
| | | | | | | | |
| | | | | | $ | 10,346,781 | |
| | | | | | | | |
| Energy – Independent – 1.9% | | | | | | | | |
| Concho Resources, Inc. (a) | | | 4,893 | | | $ | 502,952 | |
| Diamondback Energy, Inc. | | | 1,901 | | | | 176,223 | |
| EOG Resources, Inc. | | | 14,102 | | | | 1,229,835 | |
| Hess Corp. | | | 13,173 | | | | 533,507 | |
| Marathon Petroleum Corp. | | | 15,714 | | | | 927,283 | |
| Parsley Energy, Inc., “A” (a) | | | 8,632 | | | | 137,939 | |
| | | | | | | | |
| | | | | | $ | 3,507,739 | |
| | | | | | | | |
| Energy – Integrated – 2.0% | | | | | | | | |
| Chevron Corp. (s) | | | 33,893 | | | $ | 3,687,220 | |
| | | | | | | | |
| Engineering – Construction – 0.2% | | | | | | | | |
| KBR, Inc. | | | 19,160 | | | $ | 290,849 | |
| | | | | | | | |
| Entertainment – 0.3% | | | | | | | | |
| Six Flags Entertainment Corp. | | | 9,513 | | | $ | 529,208 | |
| | | | | | | | |
| Food & Beverages – 2.6% | | | | | | | | |
| Archer Daniels Midland Co. | | | 9,548 | | | $ | 391,182 | |
| Coca-Cola Co. | | | 19,412 | | | | 919,158 | |
| Hostess Brands, Inc. (a) | | | 16,396 | | | | 179,372 | |
| J.M. Smucker Co. | | | 3,729 | | | | 348,624 | |
| Mondelez International, Inc. | | | 28,129 | | | | 1,126,004 | |
| PepsiCo, Inc. | | | 17,673 | | | | 1,952,513 | |
| | | | | | | | |
| | | | | | $ | 4,916,853 | |
| | | | | | | | |
| Gaming & Lodging – 0.8% | | | | | | | | |
| Hilton Worldwide Holdings, Inc. | | | 17,154 | | | $ | 1,231,657 | |
| Marriott International, Inc., “A” | | | 3,001 | | | | 325,789 | |
| | | | | | | | |
| | | | | | $ | 1,557,446 | |
| | | | | | | | |
| General Merchandise – 0.4% | | | | | | | | |
| Dollar Tree, Inc. (a) | | | 7,314 | | | $ | 660,601 | |
| | | | | | | | |
| Health Maintenance Organizations – 1.9% | | | | | |
| Cigna Corp. | | | 10,600 | | | $ | 2,013,152 | |
| Humana Inc. | | | 5,105 | | | | 1,462,480 | |
| | | | | | | | |
| | | | | | $ | 3,475,632 | |
| | | | | | | | |
| Insurance – 4.3% | | | | | | | | |
| Aon PLC | | | 24,387 | | | $ | 3,544,894 | |
| Assurant, Inc. | | | 7,668 | | | | 685,826 | |
| Athene Holding Ltd. (a) | | | 9,442 | | | | 376,075 | |
| Chubb Ltd. | | | 13,973 | | | | 1,805,032 | |
| Everest Re Group Ltd. | | | 1,823 | | | | 396,977 | |
| Hartford Financial Services Group, Inc. | | | 28,800 | | | | 1,280,160 | |
| | | | | | | | |
| | | | | | $ | 8,088,964 | |
| | | | | | | | |
| | | | | | | | |
| Issuer | | Shares/Par | | | Value ($) | |
| COMMON STOCKS – continued | | | | | |
| Internet – 5.7% | | | | | | | | |
| Alphabet, Inc., “A” (a)(s) | | | 4,956 | | | $ | 5,178,822 | |
| Facebook, Inc., “A” (a) | | | 25,773 | | | | 3,378,583 | |
| LogMeIn, Inc. | | | 11,114 | | | | 906,569 | |
| MINDBODY, Inc., “A” (a) | | | 30,856 | | | | 1,123,158 | |
| | | | | | | | |
| | | | | | $ | 10,587,132 | |
| | | | | | | | |
| Leisure & Toys – 0.8% | | | | | | | | |
| Brunswick Corp. | | | 5,008 | | | $ | 232,621 | |
| Electronic Arts, Inc. (a) | | | 12,647 | | | | 997,975 | |
| Take-Two Interactive Software, Inc. (a) | | | 2,870 | | | | 295,438 | |
| | | | | | | | |
| | | | | | $ | 1,526,034 | |
| | | | | | | | |
| Machinery & Tools – 1.4% | | | | | | | | |
| Flowserve Corp. | | | 11,931 | | | $ | 453,617 | |
| Illinois Tool Works, Inc. | | | 5,404 | | | | 684,633 | |
| ITT, Inc. | | | 8,860 | | | | 427,672 | |
| Roper Technologies, Inc. | | | 3,820 | | | | 1,018,106 | |
| | | | | | | | |
| | | | | | $ | 2,584,028 | |
| | | | | | | | |
| Major Banks – 1.9% | | | | | | | | |
| Goldman Sachs Group, Inc. | | | 11,401 | | | $ | 1,904,537 | |
| PNC Financial Services Group, Inc. | | | 9,314 | | | | 1,088,900 | |
| State Street Corp. | | | 9,703 | | | | 611,968 | |
| | | | | | | | |
| | | | | | $ | 3,605,405 | |
| | | | | | | | |
| Medical & Health Technology & Services – 1.5% | | | | | |
| Guardant Health, Inc. (a) | | | 3,891 | | | $ | 146,263 | |
| HCA Healthcare, Inc. | | | 7,659 | | | | 953,162 | |
| ICON PLC (a) | | | 3,276 | | | | 423,292 | |
| McKesson Corp. | | | 6,506 | | | | 718,718 | |
| Walgreens Boots Alliance, Inc. | | | 8,534 | | | | 583,128 | |
| | | | | | | | |
| | | | | | $ | 2,824,563 | |
| | | | | | | | |
| Medical Equipment – 3.7% | | | | | | | | |
| Abiomed, Inc. (a) | | | 735 | | | $ | 238,904 | |
| Boston Scientific Corp. (a) | | | 31,832 | | | | 1,124,943 | |
| Danaher Corp. | | | 6,620 | | | | 682,654 | |
| Medtronic PLC | | | 27,135 | | | | 2,468,200 | |
| PerkinElmer, Inc. | | | 10,834 | | | | 851,011 | |
| Senseonics Holdings, Inc. (a)(l) | | | 29,409 | | | | 76,169 | |
| STERIS PLC | | | 11,268 | | | | 1,203,986 | |
| West Pharmaceutical Services, Inc. | | | 2,027 | | | | 198,707 | |
| | | | | | | | |
| | | | | | $ | 6,844,574 | |
| | | | | | | | |
| Metals & Mining – 0.2% | | | | | | | | |
| Teck Resources Ltd., “B” | | | 14,168 | | | $ | 305,179 | |
| | | | | | | | |
| Natural Gas – Pipeline – 0.5% | | | | | | | | |
| Enterprise Products Partners LP | | | 20,462 | | | $ | 503,160 | |
| Equitrans Midstream Corp. (a) | | | 17,831 | | | | 356,977 | |
| | | | | | | | |
| | | | | | $ | 860,137 | |
| | | | | | | | |
| Network & Telecom – 1.3% | | | | | | | | |
| Cisco Systems, Inc. | | | 50,938 | | | $ | 2,207,143 | |
| Interxion Holding N.V. (a) | | | 4,992 | | | | 270,367 | |
| | | | | | | | |
| | | | | | $ | 2,477,510 | |
| | | | | | | | |
8
MFS Core Equity Portfolio
Portfolio of Investments – continued
| | | | | | | | |
| | |
| Issuer | | Shares/Par | | | Value ($) | |
| COMMON STOCKS – continued | | | | | | | | |
| Oil Services – 0.6% | | | | | | | | |
| Apergy Corp. (a) | | | 8,651 | | | $ | 234,269 | |
| Cactus, Inc., “A” (a) | | | 10,206 | | | | 279,746 | |
| Core Laboratories N.V. | | | 2,332 | | | | 139,127 | |
| Patterson-UTI Energy, Inc. | | | 31,506 | | | | 326,087 | |
| Schlumberger Ltd. | | | 5,095 | | | | 183,828 | |
| | | | | | | | |
| | | | | | $ | 1,163,057 | |
| | | | | | | | |
| Other Banks & Diversified Financials – 6.3% | | | | | |
| Bank OZK | | | 25,194 | | | $ | 575,179 | |
| BB&T Corp. | | | 27,103 | | | | 1,174,102 | |
| Citigroup, Inc. (s) | | | 45,321 | | | | 2,359,411 | |
| EuroDekania Ltd. (u) | | | 151,350 | | | | 18,858 | |
| Mastercard, Inc., “A” | | | 16,769 | | | | 3,163,472 | |
| Prosperity Bancshares, Inc. | | | 3,576 | | | | 222,785 | |
| Signature Bank | | | 11,882 | | | | 1,221,589 | |
| U.S. Bancorp | | | 51,049 | | | | 2,332,939 | |
| Wintrust Financial Corp. | | | 8,873 | | | | 589,966 | |
| | | | | | | | |
| | | | | | $ | 11,658,301 | |
| | | | | | | | |
| Pharmaceuticals – 6.9% | | | | | | | | |
| Bristol-Myers Squibb Co. | | | 31,696 | | | $ | 1,647,558 | |
| Elanco Animal Health, Inc. (a) | | | 33,821 | | | | 1,066,376 | |
| Johnson & Johnson | | | 32,376 | | | | 4,178,123 | |
| Pfizer, Inc. | | | 88,123 | | | | 3,846,569 | |
| Zoetis, Inc. | | | 24,856 | | | | 2,126,182 | |
| | | | | | | | |
| | | | | | $ | 12,864,808 | |
| | | | | | | | |
| Pollution Control – 0.4% | | | | | | | | |
| Evoqua Water Technologies LLC (a) | | | 26,408 | | | $ | 253,517 | |
| Waste Connections, Inc. | | | 6,678 | | | | 495,841 | |
| | | | | | | | |
| | | | | | $ | 749,358 | |
| | | | | | | | |
| Railroad & Shipping – 1.3% | | | | | | | | |
| Canadian Pacific Railway Ltd. | | | 7,375 | | | $ | 1,309,948 | |
| Kansas City Southern Co. | | | 12,311 | | | | 1,175,085 | |
| | | | | | | | |
| | | | | | $ | 2,485,033 | |
| | | | | | | | |
| Real Estate – 3.1% | | | | | | | | |
| Industrial Logistics Properties Trust, REIT | | | 40,996 | | | $ | 806,391 | |
| Life Storage, Inc., REIT | | | 2,850 | | | | 265,022 | |
| Medical Properties Trust, Inc., REIT | | | 142,167 | | | | 2,286,045 | |
| Store Capital Corp., REIT | | | 35,024 | | | | 991,529 | |
| Sun Communities, Inc., REIT | | | 4,476 | | | | 455,254 | |
| W.P. Carey, Inc., REIT | | | 15,070 | | | | 984,674 | |
| | | | | | | | |
| | | | | | $ | 5,788,915 | |
| | | | | | | | |
| Restaurants – 1.6% | | | | | | | | |
| Aramark | | | 16,637 | | | $ | 481,974 | |
| Starbucks Corp. | | | 29,986 | | | | 1,931,098 | |
| U.S. Foods Holding Corp. (a) | | | 16,359 | | | | 517,599 | |
| | | | | | | | |
| | | | | | $ | 2,930,671 | |
| | | | | | | | |
| Specialty Chemicals – 0.1% | | | | | | | | |
| Univar, Inc. (a) | | | 14,672 | | | $ | 260,281 | |
| | | | | | | | |
| Specialty Stores – 5.4% | | | | | | | | |
| Amazon.com, Inc. (a) | | | 3,577 | | | $ | 5,372,547 | |
| Costco Wholesale Corp. | | | 6,751 | | | | 1,375,246 | |
| | | | | | | | |
| | |
| Issuer | | Shares/Par | | | Value ($) | |
| COMMON STOCKS – continued | | | | | | | | |
| Specialty Stores – continued | | | | | | | | |
| L Brands, Inc. | | | 15,187 | | | $ | 389,850 | |
| TJX Cos., Inc. | | | 28,254 | | | | 1,264,084 | |
| Tractor Supply Co. | | | 12,384 | | | | 1,033,321 | |
| Urban Outfitters, Inc. (a) | | | 19,042 | | | | 632,195 | |
| | | | | | | | |
| | | | | | $ | 10,067,243 | |
| | | | | | | | |
| Telecommunications – Wireless – 2.3% | | | | | |
| American Tower Corp., REIT | | | 27,659 | | | $ | 4,375,377 | |
| | | | | | | | |
| Telephone Services – 0.7% | | | | | | | | |
| Verizon Communications, Inc. | | | 22,288 | | | $ | 1,253,031 | |
| | | | | | | | |
| Tobacco – 0.7% | | | | | | | | |
| Philip Morris International, Inc. | �� | | 18,284 | | | $ | 1,220,640 | |
| | | | | | | | |
| Utilities – Electric Power – 3.3% | | | | | | | | |
| American Electric Power Co., Inc. | | | 11,496 | | | $ | 859,211 | |
| Avangrid, Inc. | | | 8,766 | | | | 439,089 | |
| CenterPoint Energy, Inc. | | | 20,025 | | | | 565,306 | |
| CMS Energy Corp. | | | 14,979 | | | | 743,707 | |
| Evergy, Inc. | | | 11,540 | | | | 655,126 | |
| Exelon Corp. | | | 22,081 | | | | 995,853 | |
| NextEra Energy, Inc. | | | 6,957 | | | | 1,209,266 | |
| Xcel Energy, Inc. | | | 15,159 | | | | 746,884 | |
| | | | | | | | |
| | | | | | $ | 6,214,442 | |
| | | | | | | | |
Total Common Stocks
(Identified Cost, $158,771,202) | | | | | | $ | 183,874,686 | |
| | | | | | | | |
|
| CONVERTABLE PREFERRED STOCKS – 0.1% | |
| Natural Gas – Distribution – 0.1% | | | | | | | | |
| South Jersey Industries, Inc., 7.25% (Identified Cost, $210,150) | | | 4,203 | | | $ | 195,229 | |
| | | | | | | | |
| |
| INVESTMENT COMPANIES (h) – 1.5% | | | | | |
| Money Market Funds – 1.5% | | | | | | | | |
| MFS Institutional Money Market Portfolio, 2.4% (v) (Identified Cost, $2,863,869) | | | 2,864,156 | | | $ | 2,863,869 | |
| | | | | | | | |
|
| COLLATERAL FOR SECURITIES LOANED – 0.0% | |
| State Street Navigator Securities Lending Government Money Market Portfolio, 2.29% (j) (Identified Cost, $102) | | | 102 | | | $ | 102 | |
| | | | | | | | |
| |
| SECURITIES SOLD SHORT – (0.4)% | | | | | |
| Telecommunications – Wireless – (0.4)% | | | | | |
| Crown Castle International Corp., REIT (Proceeds Received, $578,274) | | | (6,970 | ) | | $ | (757,151 | ) |
| | | | | | | | |
OTHER ASSETS, LESS
LIABILITIES – 0.0% | | | | | | | 9,640 | |
| | | | | | | | |
| NET ASSETS – 100.0% | | | | | | $ | 186,186,375 | |
| | | | | | | | |
| (a) | | Non-income producing security. |
| (h) | | An affiliated issuer, which may be considered one in which the fund owns 5% or more of the outstanding voting securities, or a company which is under common control. At period end, the aggregate values of the fund’s investments in affiliated issuers and in unaffiliated issuers were $2,863,869 and $184,070,017, respectively. |
9
MFS Core Equity Portfolio
Portfolio of Investments – continued
| (j) | | The rate quoted is the annualizedseven-day yield of the fund at period end. |
| (l) | | A portion of this security is on loan. See Note 2 for additional information. |
| (s) | | Security or a portion of the security was pledged to cover collateral requirements for securities sold short. |
| (u) | | The security was valued using significant unobservable inputs and is considered level 3 under the fair value hierarchy. For further information about the fund’s level 3 holdings, please see Note 2 in the Notes to Financial Statements. |
| (v) | | Affiliated issuer that is available only to investment companies managed by MFS. The rate quoted for the MFS Institutional Money Market Portfolio is the annualizedseven-day yield of the fund at period end. |
The following abbreviations are used in this report and are defined:
| PLC | | Public Limited Company |
| REIT | | Real Estate Investment Trust |
At December 31, 2018, the fund had cash collateral of $5,007 and other liquid securities with an aggregate value of $1,440,751 to cover any collateral or margin obligations for securities sold short. Restricted cash and/or deposits with brokers in the Statement of Assets and Liabilities are comprised of cash collateral.
See Notes to Financial Statements
10
MFS Core Equity Portfolio
FINANCIAL STATEMENTS | STATEMENT OF ASSETS AND LIABILITIES
This statement represents your fund’s balance sheet, which details the assets and liabilities comprising the total value of the fund.
| | | | |
At 12/31/18 | | | | |
| |
Assets | | | | |
Investments in unaffiliated issuers, at value, including $23,074 of securities on loan (identified cost, $158,981,454) | | | $184,070,017 | |
Investments in affiliated issuers, at value (identified cost, $2,863,869) | | | 2,863,869 | |
Deposits with brokers for | | | | |
Securities sold short | | | 5,007 | |
Receivables for | | | | |
Fund shares sold | | | 36,789 | |
Interest and dividends | | | 264,520 | |
Other assets | | | 1,581 | |
Total assets | | | $187,241,783 | |
| |
Liabilities | | | | |
Payable to custodian | | | $483 | |
Payables for | | | | |
Securities sold short, at value (proceeds received, $578,274) | | | 757,151 | |
Investments purchased | | | 27,653 | |
Fund shares reacquired | | | 187,999 | |
Collateral for securities loaned, at value (c) | | | 102 | |
Payable to affiliates | | | | |
Investment adviser | | | 15,352 | |
Shareholder servicing costs | | | 122 | |
Distribution and/or service fees | | | 1,121 | |
Payable for independent Trustees’ compensation | | | 8 | |
Accrued expenses and other liabilities | | | 65,417 | |
Total liabilities | | | $1,055,408 | |
Net assets | | | $186,186,375 | |
| |
Net assets consist of | | | | |
Paid-in capital | | | $133,548,866 | |
Total distributable earnings (loss) | | | 52,637,509 | |
Net assets | | | $186,186,375 | |
Shares of beneficial interest outstanding | | | 8,610,514 | |
| | | | | | | | | | | | |
| | | |
| | | Net assets | | | Shares
outstanding | | | Net asset value
per share | |
Initial Class | | | $144,991,368 | | | | 6,689,005 | | | | $21.68 | |
Service Class | | | 41,195,007 | | | | 1,921,509 | | | | 21.44 | |
| (c) | Non-cash collateral is not included. |
See Notes to Financial Statements
11
MFS Core Equity Portfolio
FINANCIAL STATEMENTS | STATEMENT OF OPERATIONS
This statement describes how much your fund earned in investment income and accrued in expenses. It also describes any gains and/or losses generated by fund operations.
| | | | |
| Year ended 12/31/18 | | | | |
| |
Net investment income (loss) | | | | |
Income | | | | |
Dividends | | | $3,440,199 | |
Dividends from affiliated issuers | | | 32,863 | |
Other | | | 23,540 | |
Income on securities loaned | | | 3,592 | |
Foreign taxes withheld | | | (7,307 | ) |
Total investment income | | | $3,492,887 | |
Expenses | | | | |
Management fee | | | $1,593,535 | |
Distribution and/or service fees | | | 113,253 | |
Shareholder servicing costs | | | 15,011 | |
Administrative services fee | | | 40,405 | |
Independent Trustees’ compensation | | | 7,084 | |
Custodian fee | | | 12,845 | |
Shareholder communications | | | 34,981 | |
Audit and tax fees | | | 55,869 | |
Legal fees | | | 1,909 | |
Dividend and interest expense on securities sold short | | | 49,601 | |
Miscellaneous | | | 26,964 | |
Total expenses | | | $1,951,457 | |
Reduction of expenses by investment adviser | | | (20,236 | ) |
Net expenses | | | $1,931,221 | |
Net investment income (loss) | | | $1,561,666 | |
| |
Realized and unrealized gain (loss) | | | | |
Realized gain (loss) (identified cost basis) | | | | |
Unaffiliated issuers | | | $26,562,529 | |
Affiliated issuers | | | (94 | ) |
Foreign currency | | | (418 | ) |
Net realized gain (loss) | | | $26,562,017 | |
Change in unrealized appreciation or depreciation | | | | |
Unaffiliated issuers | | | $(34,659,218 | ) |
Securities sold short | | | 16,590 | |
Translation of assets and liabilities in foreign currencies | | | (8 | ) |
Net unrealized gain (loss) | | | $(34,642,636 | ) |
Net realized and unrealized gain (loss) | | | $(8,080,619 | ) |
Change in net assets from operations | | | $(6,518,953 | ) |
See Notes to Financial Statements
12
MFS Core Equity Portfolio
FINANCIAL STATEMENTS | STATEMENTS OF CHANGES IN NET ASSETS
These statements describe the increases and/or decreases in net assets resulting from operations, any distributions, and any shareholder transactions.
| | | | | | | | |
| | | Year ended | |
| | | 12/31/18 | | | 12/31/17 | |
Change in net assets | | | | | | | | |
| | |
From operations | | | | | | | | |
Net investment income (loss) | | | $1,561,666 | | | | $1,381,451 | |
Net realized gain (loss) | | | 26,562,017 | | | | 22,187,860 | |
Net unrealized gain (loss) | | | (34,642,636 | ) | | | 22,538,765 | |
Change in net assets from operations | | | $(6,518,953 | ) | | | $46,108,076 | |
Total distributions to shareholders (a) | | | $(23,497,053 | ) | | | $(13,943,084 | ) |
Change in net assets from fund share transactions | | | $(1,288,330 | ) | | | $(13,597,982 | ) |
Total change in net assets | | | $(31,304,336 | ) | | | $18,567,010 | |
| | |
Net assets | | | | | | | | |
At beginning of period | | | 217,490,711 | | | | 198,923,701 | |
At end of period (b) | | | $186,186,375 | | | | $217,490,711 | |
| (a) | Distributions from net investment income and from net realized gain are no longer required to be separately disclosed. See Note 2. For the year ended December 31, 2017, distributions from net investment income and from net realized gain were $1,852,020 and $12,091,064, respectively. |
| (b) | Parenthetical disclosure of undistributed net investment income is no longer required. See Note 2. For the year ended December 31, 2017, end of period net assets included undistributed net investment income of $1,381,318. |
See Notes to Financial Statements
13
MFS Core Equity Portfolio
FINANCIAL STATEMENTS | FINANCIAL HIGHLIGHTS
The financial highlights table is intended to help you understand the fund’s financial performance for the past 5 years. Certain information reflects financial results for a single fund share. The total returns in the table represent the rate that an investor would have earned (or lost) on an investment in the fund share class (assuming reinvestment of all distributions) held for the entire period.
| | | | | | | | | | | | | | | | | | | | |
| Initial Class | | Year ended | |
| | | | | |
| | | 12/31/18 | | | 12/31/17 | | | 12/31/16 | | | 12/31/15 | | | 12/31/14 | |
| | | | | |
Net asset value, beginning of period | | | $25.21 | | | | $21.67 | | | | $21.28 | | | | $23.40 | | | | $21.49 | |
| | | | | |
| Income (loss) from investment operations | | | | | | | | | | | | | | | | | | | | |
Net investment income (loss) (d) | | | $0.20 | | | | $0.17 | | | | $0.21 | (c) | | | $0.17 | | | | $0.16 | |
Net realized and unrealized gain (loss) | | | (0.78 | ) | | | 5.04 | | | | 2.16 | | | | (0.35 | ) | | | 2.27 | |
Total from investment operations | | | $(0.58 | ) | | | $5.21 | | | | $2.37 | | | | $(0.18 | ) | | | $2.43 | |
| | | | | |
| Less distributions declared to shareholders | | | | | | | | | | | | | | | | | | | | |
From net investment income | | | $(0.18 | ) | | | $(0.23 | ) | | | $(0.17 | ) | | | $(0.13 | ) | | | $(0.18 | ) |
From net realized gain | | | (2.77 | ) | | | (1.44 | ) | | | (1.81 | ) | | | (1.81 | ) | | | (0.34 | ) |
Total distributions declared to shareholders | | | $(2.95 | ) | | | $(1.67 | ) | | | $(1.98 | ) | | | $(1.94 | ) | | | $(0.52 | ) |
Net asset value, end of period (x) | | | $21.68 | | | | $25.21 | | | | $21.67 | | | | $21.28 | | | | $23.40 | |
Total return (%) (k)(r)(s)(x) | | | (3.83 | ) | | | 24.82 | | | | 11.38 | (c) | | | (0.21 | ) | | | 11.38 | |
| | | | | |
Ratios (%) (to average net assets)
and Supplemental data: | | | | | | | | | | | | | | | | | | | | |
Expenses before expense reductions (f) | | | 0.87 | | | | 0.87 | | | | 0.84 | (c) | | | 0.86 | | | | 0.85 | |
Expenses after expense reductions (f) | | | 0.86 | | | | 0.86 | | | | 0.82 | (c) | | | 0.85 | | | | 0.84 | |
Net investment income (loss) | | | 0.79 | | | | 0.72 | | | | 1.00 | (c) | | | 0.75 | | | | 0.74 | |
Portfolio turnover | | | 40 | | | | 39 | | | | 60 | | | | 50 | | | | 48 | |
Net assets at end of period (000 omitted) | | | $144,991 | | | | $171,038 | | | | $156,040 | | | | $156,450 | | | | $115,826 | |
| | | | | |
| Supplemental Ratios (%): | | | | | | | | | | | | | | | | | | | | |
Ratio of expenses to average net assets after expense reductions excluding short sale expenses and interest expense and fees (f) | | | 0.83 | | | | 0.84 | | | | 0.80 | (c) | | | 0.84 | | | | 0.84 | |
See Notes to Financial Statements
14
MFS Core Equity Portfolio
Financial Highlights – continued
| | | | | | | | | | | | | | | | | | | | |
| Service Class | | Year ended | |
| | | | | |
| | | 12/31/18 | | | 12/31/17 | | | 12/31/16 | | | 12/31/15 | | | 12/31/14 | |
| | | | | |
Net asset value, beginning of period | | | $24.96 | | | | $21.47 | | | | $21.10 | | | | $23.20 | | | | $21.32 | |
| | | | | |
| Income (loss) from investment operations | | | | | | | | | | | | | | | | | | | | |
Net investment income (loss) (d) | | | $0.14 | | | | $0.11 | | | | $0.16 | (c) | | | $0.11 | | | | $0.11 | |
Net realized and unrealized gain (loss) | | | (0.78 | ) | | | 4.99 | | | | 2.13 | | | | (0.33 | ) | | | 2.24 | |
Total from investment operations | | | $(0.64 | ) | | | $5.10 | | | | $2.29 | | | | $(0.22 | ) | | | $2.35 | |
| | | | | |
| Less distributions declared to shareholders | | | | | | | | | | | | | | | | | | | | |
From net investment income | | | $(0.11 | ) | | | $(0.17 | ) | | | $(0.11 | ) | | | $(0.07 | ) | | | $(0.13 | ) |
From net realized gain | | | (2.77 | ) | | | (1.44 | ) | | | (1.81 | ) | | | (1.81 | ) | | | (0.34 | ) |
Total distributions declared to shareholders | | | $(2.88 | ) | | | $(1.61 | ) | | | $(1.92 | ) | | | $(1.88 | ) | | | $(0.47 | ) |
Net asset value, end of period (x) | | | $21.44 | | | | $24.96 | | | | $21.47 | | | | $21.10 | | | | $23.20 | |
Total return (%) (k)(r)(s)(x) | | | (4.07 | ) | | | 24.50 | | | | 11.07 | (c) | | | (0.40 | ) | | | 11.07 | |
| | | | | |
Ratios (%) (to average net assets)
and Supplemental data: | | | | | | | | | | | | | | | | | | | | |
Expenses before expense reductions (f) | | | 1.12 | | | | 1.12 | | | | 1.09 | (c) | | | 1.11 | | | | 1.10 | |
Expenses after expense reductions (f) | | | 1.11 | | | | 1.11 | | | | 1.07 | (c) | | | 1.10 | | | | 1.09 | |
Net investment income (loss) | | | 0.54 | | | | 0.47 | | | | 0.75 | (c) | | | 0.50 | | | | 0.49 | |
Portfolio turnover | | | 40 | | | | 39 | | | | 60 | | | | 50 | | | | 48 | |
Net assets at end of period (000 omitted) | | | $41,195 | | | | $46,453 | | | | $42,883 | | | | $47,083 | | | | $48,813 | |
| | | | | |
| Supplemental Ratios (%): | | | | | | | | | | | | | | | | | | | | |
Ratio of expenses to average net assets after expense reductions excluding short sale expenses and interest expense and fees (f) | | | 1.08 | | | | 1.09 | | | | 1.06 | (c) | | | 1.09 | | | | 1.09 | |
| (c) | Amount reflects aone-time reimbursement of expenses by the custodian (or former custodian) without which net investment income and performance would be lower and expenses would be higher. |
| (d) | Per share data is based on average shares outstanding. |
| (f) | Ratios do not reflect reductions from fees paid indirectly, if applicable. |
| (k) | The total return does not reflect expenses that apply to separate accounts. Inclusion of these charges would reduce the total return figures for all periods shown. |
| (r) | Certain expenses have been reduced without which performance would have been lower. |
| (s) | From time to time the fund may receive proceeds from litigation settlements, without which performance would be lower. Excluding the effect of the proceeds received from anon-recurring litigation settlement against Household International, Inc., the total return for the year ended December 31, 2017 would have been lower by approximately 0.78%. |
| (x) | The net asset values and total returns have been calculated on net assets which include adjustments made in accordance with U.S. generally accepted accounting principles required at period end for financial reporting purposes. |
See Notes to Financial Statements
15
MFS Core Equity Portfolio
NOTES TO FINANCIAL STATEMENTS
| (1) | | Business and Organization |
MFS Core Equity Portfolio (the fund) is a diversified series of MFS Variable Insurance Trust II (the trust). The trust is organized as a Massachusetts business trust and is registered under the Investment Company Act of 1940, as amended, as anopen-end management investment company. The shareholders of each series of the trust are separate accounts of insurance companies, which offer variable annuity and/or life insurance products, and qualified retirement and pension plans.
The fund is an investment company and accordingly follows the investment company accounting and reporting guidance of the Financial Accounting Standards Board (FASB) Accounting Standards Codification Topic 946 Financial Services – Investment Companies.
| (2) | | Significant Accounting Policies |
General– The preparation of financial statements in conformity with U.S. generally accepted accounting principles requires management to make estimates and assumptions that affect the reported amounts of assets and liabilities, and disclosure of contingent assets and liabilities at the date of the financial statements and the reported amounts of increases and decreases in net assets from operations during the reporting period. Actual results could differ from those estimates. In the preparation of these financial statements, management has evaluated subsequent events occurring after the date of the fund’s Statement of Assets and Liabilities through the date that the financial statements were issued.
In August 2018, the FASB issued Accounting Standards Update2018-13, Fair Value Measurement (Topic 820) – Disclosure Framework – Changes to the Disclosure Requirements for Fair Value Measurement (“ASU2018-13”) which introduces new fair value disclosure requirements as well as eliminates and modifies certain existing fair value disclosure requirements. ASU2018-13 would be effective for fiscal years beginning after December 15, 2019, and interim periods within those fiscal years; however, management has elected to early adopt ASU2018-13 effective with the current reporting period. The impact of the fund’s adoption was limited to changes in the fund’s financial statement disclosures regarding fair value, primarily those disclosures related to transfers between levels of the fair value hierarchy.
In August 2018, the Securities and Exchange Commission (SEC) released its Final Rule on Disclosure Update and Simplification (the “Final Rule”) which is intended to simplify an issuer’s disclosure compliance efforts by removing redundant or outdated disclosure requirements without significantly altering the mix of information provided to investors. Effective with the current reporting period, the fund adopted the Final Rule with the impacts being that the fund is no longer required to present the components of distributable earnings on the Statement of Assets and Liabilities or the sources of distributions to shareholders and the amount of undistributed net investment income on the Statements of Changes in Net Assets.
Balance Sheet Offsetting– The fund’s accounting policy with respect to balance sheet offsetting is that, absent an event of default by the counterparty or a termination of the agreement, the International Swaps and Derivatives Association (ISDA) Master Agreement, or similar agreement, does not result in an offset of reported amounts of financial assets and financial liabilities in the Statement of Assets and Liabilities across transactions between the fund and the applicable counterparty. The fund’s right to setoff may be restricted or prohibited by the bankruptcy or insolvency laws of the particular jurisdiction to which a specific master netting agreement counterparty is subject. Balance sheet offsetting disclosures, to the extent applicable to the fund, have been included in the fund’s Significant Accounting Policies note under the captions for each of the fund’sin-scope financial instruments and transactions.
Investment Valuations– Equity securities, including restricted equity securities and equity securities sold short, are generally valued at the last sale or official closing price on their primary market or exchange as provided by a third-party pricing service. Equity securities, for which there were no sales reported that day, are generally valued at the last quoted daily bid quotation on their primary market or exchange as provided by a third-party pricing service. Equity securities sold short, for which there were no sales reported for that day, are generally valued at the last quoted daily ask quotation on their primary market or exchange as provided by a third-party pricing service. Short-term instruments with a maturity at issuance of 60 days or less may be valued at amortized cost, which approximates market value. Exchange-traded options are generally valued at the last sale or official closing price on their primary exchange as provided by a third-party pricing service. Exchange-traded options for which there were no sales reported that day are generally valued at the last daily bid quotation on their primary exchange as provided by a third-party pricing service. Options not traded on an exchange are generally valued at a broker/dealer bid quotation. Foreign currency options are generally valued at valuations provided by a third-party pricing service.Open-end investment companies are generally valued at net asset value per share. Securities and other assets generally valued on the basis of information from a third-party pricing service may also be valued at a broker/dealer bid quotation. In determining values, third-party pricing services can utilize both transaction data and market information such as yield, quality, coupon rate, maturity, type of issue, trading characteristics, and other market data. The values of foreign securities and other assets and liabilities expressed in foreign currencies are converted to U.S. dollars using the mean of bid and asked prices for rates provided by a third-party pricing service.
16
MFS Core Equity Portfolio
Notes to Financial Statements – continued
The Board of Trustees has delegated primary responsibility for determining or causing to be determined the value of the fund’s investments (including any fair valuation) to the adviser pursuant to valuation policies and procedures approved by the Board. If the adviser determines that reliable market quotations are not readily available, investments are valued at fair value as determined in good faith by the adviser in accordance with such procedures under the oversight of the Board of Trustees. Under the fund’s valuation policies and procedures, market quotations are not considered to be readily available for most types of debt instruments and floating rate loans and many types of derivatives. These investments are generally valued at fair value based on information from third-party pricing services. In addition, investments may be valued at fair value if the adviser determines that an investment’s value has been materially affected by events occurring after the close of the exchange or market on which the investment is principally traded (such as foreign exchange or market) and prior to the determination of the fund’s net asset value, or after the halting of trading of a specific security where trading does not resume prior to the close of the exchange or market on which the security is principally traded. Events that occur on a frequent basis after foreign markets close (such as developments in foreign markets and significant movements in the U.S. markets) and prior to the determination of the fund’s net asset value may be deemed to have a material effect on the value of securities traded in foreign markets. Accordingly, the fund’s foreign equity securities may often be valued at fair value. The adviser generally relies on third-party pricing services or other information (such as the correlation with price movements of similar securities in the same or other markets; the type, cost and investment characteristics of the security; the business and financial condition of the issuer; and trading and other market data) to assist in determining whether to fair value and at what value to fair value an investment. The value of an investment for purposes of calculating the fund’s net asset value can differ depending on the source and method used to determine value. When fair valuation is used, the value of an investment used to determine the fund’s net asset value may differ from quoted or published prices for the same investment. There can be no assurance that the fund could obtain the fair value assigned to an investment if it were to sell the investment at the same time at which the fund determines its net asset value per share.
Various inputs are used in determining the value of the fund’s assets or liabilities. These inputs are categorized into three broad levels. In certain cases, the inputs used to measure fair value may fall into different levels of the fair value hierarchy. In such cases, an investment’s level within the fair value hierarchy is based on the lowest level of input that is significant to the fair value measurement. The fund’s assessment of the significance of a particular input to the fair value measurement in its entirety requires judgment, and considers factors specific to the investment. Level 1 includes unadjusted quoted prices in active markets for identical assets or liabilities. Level 2 includes other significant observable market-based inputs (including quoted prices for similar securities, interest rates, prepayment speed, and credit risk). Level 3 includes unobservable inputs, which may include the adviser’s own assumptions in determining the fair value of investments. The following is a summary of the levels used as of December 31, 2018 in valuing the fund’s assets or liabilities:
| | | | | | | | | | | | | | | | |
| Financial Instruments | | Level 1 | | | Level 2 | | | Level 3 | | | Total | |
| Equity Securities: | | | | | | | | | | | | | | | | |
United States | | | $180,655,752 | | | | $195,229 | | | | $— | | | | $180,850,981 | |
Canada | | | 2,929,709 | | | | — | | | | — | | | | 2,929,709 | |
Netherlands | | | 270,367 | | | | — | | | | — | | | | 270,367 | |
Cayman Islands | | | — | | | | — | | | | 18,858 | | | | 18,858 | |
| Mutual Funds | | | 2,863,971 | | | | — | | | | — | | | | 2,863,971 | |
| Total | | | $186,719,799 | | | | $195,229 | | | | $18,858 | | | | $186,933,886 | |
| Short Sales | | | $(757,151 | ) | | | $— | | | | $— | | | | $(757,151 | ) |
For further information regarding security characteristics, see the Portfolio of Investments.
The following is a reconciliation of level 3 assets for which significant unobservable inputs were used to determine fair value. The table presents the activity of level 3 securities held at the beginning and the end of the period.
| | | | |
| |
| | | Equity Securities | |
| Balance as of 12/31/17 | | | $17,706 | |
Change in unrealized appreciation or depreciation | | | 1,152 | |
| Balance as of 12/31/18 | | | $18,858 | |
The net change in unrealized appreciation or depreciation from investments held as level 3 at December 31, 2018 is $1,152. At December 31, 2018, the fund held one level 3 security.
Foreign Currency Translation– Purchases and sales of foreign investments, income, and expenses are converted into U.S. dollars based upon currency exchange rates prevailing on the respective dates of such transactions or on the reporting date for foreign denominated receivables and payables. Gains and losses attributable to foreign currency exchange rates on sales of securities are recorded for financial statement purposes as net realized gains and losses on investments. Gains and losses attributable to foreign exchange rate movements on receivables, payables, income and expenses are recorded for financial statement purposes as foreign currency transaction gains and losses. That portion of both realized and unrealized gains and losses on investments that results from fluctuations in foreign currency exchange rates is not separately disclosed.
17
MFS Core Equity Portfolio
Notes to Financial Statements – continued
Derivatives– The fund uses derivatives primarily to increase or decrease exposure to a particular market or segment of the market, or security, to increase or decrease interest rate or currency exposure, or as alternatives to direct investments. Derivatives are used for hedging ornon-hedging purposes. While hedging can reduce or eliminate losses, it can also reduce or eliminate gains. When the fund uses derivatives as an investment to increase market exposure, or for hedging purposes, gains and losses from derivative instruments may be substantially greater than the derivative’s original cost.
The derivative instruments used by the fund during the period were purchased options. Depending on the type of derivative, the fund may exit a derivative position by entering into an offsetting transaction with a counterparty or exchange, negotiating an agreement with the derivative counterparty, or novating the position to a third party. At December 31, 2018, the fund did not have any outstanding derivative instruments.
The following table presents, by major type of derivative contract, the realized gain (loss) on derivatives held by the fund for the year ended December 31, 2018 as reported in the Statement of Operations:
| | | | |
| Risk | | Unaffiliated Issuers
(Purchased Options) | |
| Equity | | | $(89,406 | ) |
The following table presents, by major type of derivative contract, the change in unrealized appreciation or depreciation on derivatives held by the fund for the year ended December 31, 2018 as reported in the Statement of Operations:
| | | | |
| Risk | | Unaffiliated Issuers
(Purchased Options) | |
| Equity | | | $88,673 | |
Derivative counterparty credit risk is managed through formal evaluation of the creditworthiness of all potential counterparties. On certain, but not all, uncleared derivatives, the fund attempts to reduce its exposure to counterparty credit risk whenever possible by entering into an ISDA Master Agreement on a bilateral basis. The ISDA Master Agreement gives each party to the agreement the right to terminate all transactions traded under such agreement if there is a specified deterioration in the credit quality of the other party. Upon an event of default or a termination of the ISDA Master Agreement, thenon-defaulting party has the right to close out all transactions traded under such agreement and to net amounts owed under each agreement to one net amount payable by one party to the other. This right to close out and net payments across all transactions traded under the ISDA Master Agreement could result in a reduction of the fund’s credit risk to such counterparty equal to any amounts payable by the fund under the applicable transactions, if any.
Collateral and margin requirements differ by type of derivative. For cleared derivatives (e.g., futures contracts, cleared swaps, and exchange-traded options), margin requirements are set by the clearing broker and the clearing house and collateral, in the form of cash or securities, is posted by the fund directly with the clearing broker. Collateral terms are counterparty agreement specific for uncleared derivatives (e.g., forward foreign currency exchange contracts, uncleared swap agreements, and uncleared options) and collateral, in the form of cash and securities, is held in segregated accounts with the fund’s custodian in connection with these agreements. For derivatives traded under an ISDA Master Agreement, which contains a collateral support annex, the collateral requirements are netted across all transactions traded under such counterparty-specific agreement and an amount is posted from one party to the other to collateralize such obligations. Cash that has been segregated or delivered to cover the fund’s collateral or margin obligations under derivative contracts, if any, will be reported separately in the Statement of Assets and Liabilities as restricted cash for uncleared derivatives and/or deposits with brokers for cleared derivatives. Securities pledged as collateral or margin for the same purpose, if any, are noted in the Portfolio of Investments. The fund may be required to make payments of interest on uncovered collateral or margin obligations with the broker. Any such payments are included in “Miscellaneous” expense in the Statement of Operations.
Purchased Options– The fund purchased call options for a premium. Purchased call options entitle the holder to buy a specified number of shares or units of a particular security, currency or index at a specified price at a specified date or within a specified period of time. Purchasing call options may hedge against an anticipated increase in the dollar cost of securities or currency to be acquired or increase the fund’s exposure to an underlying instrument.
The premium paid is initially recorded as an investment in the Statement of Assets and Liabilities. That investment is subsequentlymarked-to-market daily with the difference between the premium paid and the market value of the purchased option being recorded as unrealized appreciation or depreciation. Premiums paid for purchased call options which have expired are treated as realized losses on investments in the Statement of Operations. Upon the exercise or closing of a purchased call option, the premium paid is added to the cost of the security or financial instrument purchased.
Whether or not the option is exercised, the fund’s maximum risk of loss from purchasing an option is the amount of premium paid. All option contracts involve credit risk if the counterparty to the option contract fails to perform. For uncleared options, this risk is
18
MFS Core Equity Portfolio
Notes to Financial Statements – continued
mitigated in cases where there is an ISDA Master Agreement between the fund and the counterparty providing for netting as described above and, where applicable, by the posting of collateral by the counterparty to the fund to cover the fund’s exposure to the counterparty under such ISDA Master Agreement.
Short Sales– The fund entered into short sales whereby it sells a security it does not own in anticipation of a decline in the value of that security. The fund will realize a gain if the security price decreases and a loss if the security price increases between the date of the short sale and the date on which the fund replaces the borrowed security. Losses from short sales can exceed the proceeds of the security sold; and they can also exceed the potential loss from an ordinary buy and sell transaction. The amount of any premium, dividends, or interest the fund may be required to pay in connection with a short sale will be recognized as a fund expense. During the year ended December 31, 2018, this expense amounted to $49,601. The fund segregates cash or marketable securities in an amount that, when combined with the amount of proceeds from the short sale deposited with the broker, at least equals the current market value of the security sold short.
Security Loans– Under its Securities Lending Agency Agreement with the fund, State Street Bank and Trust Company, as lending agent, loans the securities of the fund to certain qualified institutions (the “Borrowers”) approved by the fund. Security loans can be terminated at the discretion of either the lending agent or the fund and the related securities must be returned within the earlier of the standard trade settlement period for such securities or within three business days. The loans are collateralized by cash and/or U.S. Treasury and federal agency obligations in an amount typically at least equal to the market value of the securities loaned. On loans collateralized by cash, the cash collateral is invested in a money market fund. The market value of the loaned securities is determined at the close of business of the fund and any additional required collateral is delivered to the fund on the next business day. The lending agent provides the fund with indemnification against Borrower default. In the event of Borrower default, the lending agent will, for the benefit of the fund, either purchase securities identical to those loaned or, when such purchase is commercially impracticable, pay the fund the market value of the loaned securities. In return, the lending agent assumes the fund’s rights to the related collateral. If the collateral value is less than the cost to purchase identical securities, the lending agent is responsible for the shortfall, but only to the extent that such shortfall is not due to a decline in collateral value resulting from collateral reinvestment for which the fund bears the risk of loss. At period end, the fund had investment securities on loan, all of which were classified as equity securities in the fund’s Portfolio of Investments, with a fair value of $23,074. The fair value of the fund’s investment securities on loan and a related liability of $102 for cash collateral received on securities loaned are both presented gross in the Statement of Assets and Liabilities. Additionally, these loans were collateralized by U.S. Treasury Obligations of $24,192 held by the lending agent. The collateral on securities loaned exceeded the value of securities on loan at period end. The liability for cash collateral for securities loaned is carried at fair value, which is categorized as level 2 within the fair value hierarchy. A portion of the income generated upon investment of the collateral is remitted to the Borrowers, and the remainder is allocated between the fund and the lending agent. On loans collateralized by U.S. Treasury and/or federal agency obligations, a fee is received from the Borrower, and is allocated between the fund and the lending agent. Income from securities lending is separately reported in the Statement of Operations. The dividend and interest income earned on the securities loaned is accounted for in the same manner as other dividend and interest income.
Indemnifications– Under the fund’s organizational documents, its officers and Trustees may be indemnified against certain liabilities and expenses arising out of the performance of their duties to the fund. Additionally, in the normal course of business, the fund enters into agreements with service providers that may contain indemnification clauses. The fund’s maximum exposure under these agreements is unknown as this would involve future claims that may be made against the fund that have not yet occurred.
Investment Transactions and Income– Investment transactions are recorded on the trade date. Dividends received in cash are recorded on theex-dividend date. Certain dividends from foreign securities will be recorded when the fund is informed of the dividend if such information is obtained subsequent to theex-dividend date. Dividend payments received in additional securities are recorded on theex-dividend date in an amount equal to the value of the security on such date.
The fund may receive proceeds from litigation settlements. Any proceeds received from litigation involving portfolio holdings are reflected in the Statement of Operations in realized gain/loss if the security has been disposed of by the fund or in unrealized gain/loss if the security is still held by the fund. Any other proceeds from litigation not related to portfolio holdings are reflected as other income in the Statement of Operations.
Tax Matters and Distributions– The fund intends to qualify as a regulated investment company, as defined under Subchapter M of the Internal Revenue Code, and to distribute all of its taxable income, including realized capital gains. As a result, no provision for federal income tax is required. The fund’s federal tax returns, when filed, will remain subject to examination by the Internal Revenue Service for a three year period. Management has analyzed the fund’s tax positions taken on federal and state tax returns for all open tax years and does not believe that there are any uncertain tax positions that require recognition of a tax liability. Foreign taxes, if any, have been accrued by the fund in the accompanying financial statements in accordance with the applicable foreign tax law. Foreign income taxes may be withheld by certain countries in which the fund invests. Additionally, capital gains realized by the fund on securities issued in or by certain foreign countries may be subject to capital gains tax imposed by those countries.
19
MFS Core Equity Portfolio
Notes to Financial Statements – continued
Distributions to shareholders are recorded on theex-dividend date. Income and capital gain distributions are determined in accordance with income tax regulations, which may differ from U.S. generally accepted accounting principles. Certain capital accounts in the financial statements are periodically adjusted for permanent differences in order to reflect their tax character. These adjustments have no impact on net assets or net asset value per share. Temporary differences which arise from recognizing certain items of income, expense, gain or loss in different periods for financial statement and tax purposes will reverse at some time in the future. Distributions in excess of net investment income or net realized gains are temporary overdistributions for financial statement purposes resulting from differences in the recognition or classification of income or distributions for financial statement and tax purposes.
Book/tax differences primarily relate to wash sale loss deferrals.
The tax character of distributions declared to shareholders for the last two fiscal years is as follows:
| | | | | | | | |
| | | Year ended
12/31/18 | | | Year ended
12/31/17 | |
| Ordinary income (including any short-term capital gains) | | | $6,671,036 | | | | $1,852,020 | |
| Long-term capital gains | | | 16,826,017 | | | | 12,091,064 | |
| Total distributions | | | $23,497,053 | | | | $13,943,084 | |
The federal tax cost and the tax basis components of distributable earnings were as follows:
| | | | |
| As of 12/31/18 | | | | |
| |
| Cost of investments | | | $161,797,068 | |
| Gross appreciation | | | 36,920,867 | |
| Gross depreciation | | | (12,541,200 | ) |
| Net unrealized appreciation (depreciation) | | | $24,379,667 | |
| |
| Undistributed ordinary income | | | 3,005,783 | |
| Undistributed long-term capital gain | | | 25,156,626 | |
| Other temporary differences | | | 95,433 | |
Multiple Classes of Shares of Beneficial Interest– The fund offers multiple classes of shares, which differ in their respective distribution and/or service fees. The fund’s income, realized and unrealized gain (loss), and common expenses are allocated to shareholders based on the daily net assets of each class. Dividends are declared separately for each class. Differences in per share dividend rates are generally due to differences in separate class expenses. The fund’s distributions declared to shareholders as reported in the Statements of Changes in Net Assets are presented by class as follows:
| | | | | | | | | | | | | | | | |
| | | From net investment
income | | | From net realized
gain | |
| | | | |
| | | Year ended
12/31/18 | | | Year ended
12/31/17 | | | Year ended
12/31/18 | | | Year ended
12/31/17 | |
| Initial Class | | | $1,128,747 | | | | $1,539,604 | | | | $17,409,241 | | | | $9,485,664 | |
| Service Class | | | 196,254 | | | | 312,416 | | | | 4,762,811 | | | | 2,605,400 | |
| Total | | | $1,325,001 | | | | $1,852,020 | | | | $22,172,052 | | | | $12,091,064 | |
| (3) | | Transactions with Affiliates |
Investment Adviser– The fund has an investment advisory agreement with MFS to provide overall investment management and related administrative services and facilities to the fund. The management fee is computed daily and paid monthly at the following annual rates based on the fund’s average daily net assets:
| | | | |
| Up to $1 billion | | | 0.75% | |
| In excess of $1 bllion and up to $2.5 billion | | | 0.65% | |
| In excess of $2.5 billion | | | 0.60% | |
MFS has agreed in writing to reduce its management fee by a specified amount if certain MFS mutual fund assets exceed thresholds agreed to by MFS and the fund’s Board of Trustees. For the year ended December 31, 2018, this management fee reduction amounted to $20,236, which is included in the reduction of total expenses in the Statement of Operations. The management fee incurred for the year ended December 31, 2018 was equivalent to an annual effective rate of 0.74% of the fund’s average daily net assets.
The investment adviser has agreed in writing to pay a portion of the fund’s total annual operating expenses, excluding interest, taxes, extraordinary expenses, brokerage and transaction costs, and investment-related expenses (such as short sale dividend and interest expenses incurred in connection with the fund’s investment activity), such that total annual operating expenses do not exceed 0.84% of average daily net assets for the Initial Class shares and 1.09% of average daily net assets for the Service
20
MFS Core Equity Portfolio
Notes to Financial Statements – continued
Class shares. This written agreement will continue until modified by the fund’s Board of Trustees, but such agreement will continue at least until April 30, 2020. For the year ended December 31, 2018, the fund’s actual operating expenses did not exceed the limit and therefore, the investment adviser did not pay any portion of the fund’s expenses related to this agreement.
Distributor– MFS Fund Distributors, Inc. (MFD), a wholly-owned subsidiary of MFS, is the distributor of shares of the fund. The Trustees have adopted a distribution plan for the Service Class shares pursuant to Rule12b-1 under the Investment Company Act of 1940.
The fund’s distribution plan provides that the fund will pay MFD distribution and/or service fees equal to 0.25% per annum of its average daily net assets attributable to Service Class shares as partial consideration for services performed and expenses incurred by MFD and financial intermediaries (including participating insurance companies that invest in the fund to fund variable annuity and variable life insurance contracts, sponsors of qualified retirement and pension plans that invest in the fund, and affiliates of these participating insurance companies and plan sponsors) in connection with the sale and distribution of the Service Class shares. MFD may subsequently pay all, or a portion, of the distribution and/or service fees to financial intermediaries.
Shareholder Servicing Agent– MFS Service Center, Inc. (MFSC), a wholly-owned subsidiary of MFS, receives a fee from the fund for its services as shareholder servicing agent. For the year ended December 31, 2018, the fee was $14,450, which equated to 0.0068% annually of the fund’s average daily net assets. MFSC also receives payment from the fund forout-of-pocket expenses paid by MFSC on behalf of the fund. For the year ended December 31, 2018, these costs amounted to $561.
Administrator– MFS provides certain financial, legal, shareholder communications, compliance, and other administrative services to the fund. Under an administrative services agreement, the fund reimburses MFS the costs incurred to provide these services. The fund is charged an annual fixed amount of $17,500 plus a fee based on average daily net assets. The administrative services fee incurred for the year ended December 31, 2018 was equivalent to an annual effective rate of 0.0190% of the fund’s average daily net assets.
Trustees’ and Officers’ Compensation– The fund pays compensation to independent Trustees in the form of a retainer, attendance fees, and additional compensation to Board and Committee chairpersons. The fund does not pay compensation directly to Trustees or officers of the fund who are also officers of the investment adviser, all of whom receive remuneration for their services to the fund from MFS. Certain officers and Trustees of the fund are officers or directors of MFS, MFD, and MFSC.
Other– This fund and certain other funds managed by MFS (the funds) have entered into a service agreement (the ISO Agreement) which provides for payment of fees solely by the funds to Tarantino LLC in return for the provision of services of an Independent Senior Officer (ISO) for the funds. Frank L. Tarantino serves as the ISO and is an officer of the funds and the sole member of Tarantino LLC. The funds can terminate the ISO Agreement with Tarantino LLC at any time under the terms of the ISO Agreement. For the year ended December 31, 2018, the fee paid by the fund under this agreement was $361 and is included in “Miscellaneous” expense in the Statement of Operations. MFS has agreed to bear all expenses associated with office space, other administrative support, and supplies provided to the ISO.
The fund invests in the MFS Institutional Money Market Portfolio which is managed by MFS and seeks current income consistent with preservation of capital and liquidity. This money market fund does not pay a management fee to MFS.
The fund is permitted to engage in purchase and sale transactions with funds and accounts for which MFS serves as investment adviser orsub-adviser (“cross-trades”) pursuant to a policy adopted by the Board of Trustees. This policy has been designed to ensure that cross-trades conducted by the fund comply with Rule17a-7 under the Investment Company Act of 1940. During the year ended December 31, 2018, the fund engaged in sale transactions pursuant to this policy, which amounted to $523,064, respectively. The sales transactions resulted in net realized gains (losses) of $338,551.
Effective on or about January 3, 2018, the adviser has voluntarily undertaken to reimburse the fund from its own resources on a quarterly basis for the cost of investment research embedded in the cost of the fund’s securities trades. This agreement may be rescinded at any time. For the period on or about January 3, 2018 to December 31, 2018, this reimbursement amounted to $11,875, which is included in “Other” income in the Statement of Operations.
For the year ended December 31, 2018, purchases and sales of investments, other than purchased option transactions, short sales, and short-term obligations, aggregated $85,297,408 and $109,623,671, respectively.
21
MFS Core Equity Portfolio
Notes to Financial Statements – continued
| (5) | | Shares of Beneficial Interest |
The fund’s Declaration of Trust permits the Trustees to issue an unlimited number of full and fractional shares of beneficial interest. Transactions in fund shares were as follows:
| | | | | | | | | | | | | | | | |
| | | Year ended 12/31/18 | | | Year ended 12/31/17 | |
| | | | |
| | | Shares | | | Amount | | | Shares | | | Amount | |
| Shares sold | | | | | | | | | | | | | | | | |
Initial Class | | | 194,535 | | | | $4,980,452 | | | | 186,500 | | | | $4,399,901 | |
Service Class | | | 265,699 | | | | 6,551,910 | | | | 170,109 | | | | 3,967,561 | |
| | | 460,234 | | | | $11,532,362 | | | | 356,609 | | | | $8,367,462 | |
| | | | |
| Shares issued to shareholders in reinvestment of distributions | | | | | | | | | | | | | | | | |
Initial Class | | | 743,602 | | | | $18,537,988 | | | | 481,874 | | | | $11,025,268 | |
Service Class | | | 200,935 | | | | 4,959,065 | | | | 128,708 | | | | 2,917,816 | |
| | | 944,537 | | | | $23,497,053 | | | | 610,582 | | | | $13,943,084 | |
| | | | |
| Shares reacquired | | | | | | | | | | | | | | | | |
Initial Class | | | (1,034,631 | ) | | | $(26,088,919 | ) | | | (1,084,690 | ) | | | $(25,642,366 | ) |
Service Class | | | (406,173 | ) | | | (10,228,826 | ) | | | (435,248 | ) | | | (10,266,162 | ) |
| | | (1,440,804 | ) | | | $(36,317,745 | ) | | | (1,519,938 | ) | | | $(35,908,528 | ) |
| | | | |
| Net change | | | | | | | | | | | | | | | | |
Initial Class | | | (96,494 | ) | | | $(2,570,479 | ) | | | (416,316 | ) | | | $(10,217,197 | ) |
Service Class | | | 60,461 | | | | 1,282,149 | | | | (136,431 | ) | | | (3,380,785 | ) |
| | | (36,033 | ) | | | $(1,288,330 | ) | | | (552,747 | ) | | | $(13,597,982 | ) |
The fund and certain other funds managed by MFS participate in a $1.25 billion unsecured committed line of credit, subject to a $1 billion sublimit, provided by a syndication of banks under a credit agreement. Borrowings may be made for temporary financing needs. Interest is charged to each fund, based on its borrowings, generally at a rate equal to the higher of the Overnight Bank Funding rate or daily one month LIBOR plus an agreed upon spread. A commitment fee, based on the average daily, unused portion of the committed line of credit, is allocated among the participating funds. In addition, the fund and other funds managed by MFS have established unsecured uncommitted borrowing arrangements with certain banks for temporary financing needs. Interest is charged to each fund, based on its borrowings, at a rate equal to the Overnight Bank Funding rate plus an agreed upon spread. For the year ended December 31, 2018, the fund’s commitment fee and interest expense were $1,246 and $0, respectively, and are included in “Miscellaneous” expense in the Statement of Operations.
| (7) | | Investments in Affiliated Issuers |
An affiliated issuer may be considered one in which the fund owns 5% or more of the outstanding voting securities, or a company which is under common control. For the purposes of this report, the fund assumes the following to be affiliated issuers:
| | | | | | | | | | | | | | | | |
| Affiliated Issuers | | | | Beginning
Shares/Par
Amount | | Acquisitions
Shares/Par
Amount | | | Dispositions
Shares/Par
Amount | | | Ending
Shares/Par
Amount | |
| | | | | |
| MFS Institutional Money Market Portfolio | | | | 1,613,843 | | | 41,567,552 | | | | (40,317,239 | ) | | | 2,864,156 | |
| | | | | |
| Affiliated Issuers | | Realized
Gain (Loss) | | Change in
Unrealized
Appreciation/
Depreciation | | Capital Gain
Distributions | | | Dividend
Income | | | Ending
Value | |
| | | | | |
| MFS Institutional Money Market Portfolio | | $(94) | | $— | | | $— | | | | $32,863 | | | | $2,863,869 | |
22
MFS Core Equity Portfolio
REPORT OF INDEPENDENT REGISTERED PUBLIC ACCOUNTING FIRM
To the Board of Trustees of MFS Variable Insurance Trust II and the Shareholders of
MFS Core Equity Portfolio:
Opinion on the Financial Statements and Financial Highlights
We have audited the accompanying statement of assets and liabilities of MFS Core Equity Portfolio (the “Fund”), including the portfolio of investments, as of December 31, 2018, the related statement of operations for the year then ended, the statements of changes in net assets for each of the two years in the period then ended, the financial highlights for each of the five years in the period then ended, and the related notes. In our opinion, the financial statements and financial highlights present fairly, in all material respects, the financial position of the Fund as of December 31, 2018, and the results of its operations for the year then ended, the changes in its net assets for each of the two years in the period then ended, and the financial highlights for each of the five years in the period then ended, in conformity with accounting principles generally accepted in the United States of America.
Basis for Opinion
These financial statements and financial highlights are the responsibility of the Fund’s management. Our responsibility is to express an opinion on the Fund’s financial statements and financial highlights based on our audits. We are a public accounting firm registered with the Public Company Accounting Oversight Board (United States) (PCAOB) and are required to be independent with respect to the Fund in accordance with the U.S. federal securities laws and the applicable rules and regulations of the Securities and Exchange Commission and the PCAOB.
We conducted our audits in accordance with the standards of the PCAOB. Those standards require that we plan and perform the audit to obtain reasonable assurance about whether the financial statements and financial highlights are free of material misstatement, whether due to error or fraud. The Fund is not required to have, nor were we engaged to perform, an audit of its internal control over financial reporting. As part of our audits we are required to obtain an understanding of internal control over financial reporting but not for the purpose of expressing an opinion on the effectiveness of the Fund’s internal control over financial reporting. Accordingly, we express no such opinion.
Our audits included performing procedures to assess the risks of material misstatement of the financial statements and financial highlights, whether due to error or fraud, and performing procedures that respond to those risks. Such procedures included examining, on a test basis, evidence regarding the amounts and disclosures in the financial statements and financial highlights. Our audits also included evaluating the accounting principles used and significant estimates made by management, as well as evaluating the overall presentation of the financial statements and financial highlights. Our procedures included confirmation of securities owned as of December 31, 2018, by correspondence with the custodian and brokers; when replies were not received from brokers, we performed other auditing procedures. We believe that our audits provide a reasonable basis for our opinion.
DELOITTE & TOUCHE LLP
Boston, Massachusetts
February 15, 2019
We have served as the auditor of one or more of the MFS investment companies since 1924.
23
MFS Core Equity Portfolio
TRUSTEES AND OFFICERS – IDENTIFICATION AND BACKGROUND
The Trustees and Officers of the Trust, as of February 1, 2019, are listed below, together with their principal occupations during the past five years. (Their titles may have varied during that period.) The address of each Trustee and Officer is 111 Huntington Avenue, Boston, Massachusetts 02199-7618.
| | | | | | | | | | |
Name, Age | | Position(s)
Held with Fund | | Trustee/Officer
Since (h) | | Number of MFS Funds overseen by the Trustee | | Principal Occupations
During the Past Five Years | | Other Directorships During the Past Five Years (j) |
| INTERESTED TRUSTEES |
Robert J. Manning (k) (age 55) | | Trustee | | February 2004 | | 135 | | Massachusetts Financial Services Company, Executive Chairman (since January 2017); Director; Chairman of the Board; Chief Executive Officer (until 2015);Co-Chief Executive Officer(2015-2016) | | N/A |
| | | | | |
Robin A. Stelmach (k) (age 57) | | Trustee | | January 2014 | | 135 | | Massachusetts Financial Services Company, Vice Chair (since January 2017); Chief Operating Officer and Executive Vice President (until January 2017) | | N/A |
|
| INDEPENDENT TRUSTEES |
John P. Kavanaugh (age 64) | | Trustee and Chair of Trustees | | January 2009 | | 135 | | Private investor | | N/A |
| | | | | |
Steven E. Buller (age 67) | | Trustee | | February 2014 | | 135 | | Financial Accounting Standards Advisory Council, Chairman(2014-2015); Public Company Accounting Oversight Board, Standing Advisory Group, Member (until 2014); BlackRock, Inc. (investment management), Managing Director (until 2014), BlackRock Finco UK (investment management), Director (until 2014) | | N/A |
| | | | | |
John A. Caroselli (age 64) | | Trustee | | March 2017 | | 135 | | JC Global Advisors, LLC (management consulting), President (since 2015); First Capital Corporation (commercial finance), Executive Vice President (until 2015) | | N/A |
| | | | | |
Maureen R. Goldfarb (age 63) | | Trustee | | January 2009 | | 135 | | Private investor | | N/A |
| | | | | |
Michael Hegarty (age 74) | | Trustee | | December 2004 | | 135 | | Private investor | | Rouse Properties Inc., Director (until 2016); Capmark Financial Group Inc., Director (until 2015) |
| | | | | |
Peter D. Jones (age 63) | | Trustee | | January 2019 | | 135 | | Franklin Templeton Distributors, Inc. (investment management), President (until 2015); Franklin Templeton Institutional, LLC (investment management), Chairman (until 2015) | | N/A |
| | | | | |
James W. Kilman, Jr. (age 57) | | Trustee | | January 2019 | | 135 | | KielStrand Capital LLC (family office and merchant bank), Chief Executive Officer (since 2016); Morgan Stanley & Co. (financial services), Vice Chairman of Investment Banking,Co-Head of Diversified Financials Coverage – Financial Institutions Investment Banking Group (until 2016) | | alpha-En Corporation, Director (since 2016) |
24
MFS Core Equity Portfolio
Trustees and Officers – continued
| | | | | | | | | | |
Name, Age | | Position(s)
Held with Fund | | Trustee/Officer
Since (h) | | Number of MFS Funds overseen by the Trustee | | Principal Occupations
During the Past Five Years | | Other Directorships During the Past Five Years (j) |
Clarence Otis, Jr. (age 62) | | Trustee | | March 2017 | | 135 | | Darden Restaurants, Inc., Chief Executive Officer (until 2014) | | VF Corporation, Director; Verizon Communications, Inc., Director; The Travelers Companies, Director; Federal Reserve Bank of Atlanta, Director (until 2015) |
| | | | | |
Maryanne L. Roepke (age 62) | | Trustee | | May 2014 | | 135 | | American Century Investments (investment management), Senior Vice President and Chief Compliance Officer (until 2014) | | N/A |
| | | | | |
Laurie J. Thomsen
(age 61) | | Trustee | | March 2005 | | 135 | | Private investor | | The Travelers Companies, Director; Dycom Industries, Inc., Director (since 2015) |
| | | | | | | | |
Name, Age | | Position(s)
Held with Fund | | Trustee/Officer
Since (h) | | Number of MFS Funds for which the Person is an Officer | | Principal Occupations During the Past Five Years |
| OFFICERS | | | | | | |
Christopher R. Bohane (k)
(age 45) | | Assistant Secretary and Assistant Clerk | | July 2005 | | 135 | | Massachusetts Financial Services Company, Vice President and Assistant General Counsel |
| | | | |
Kino Clark (k) (age 50) | | Assistant Treasurer | | January 2012 | | 135 | | Massachusetts Financial Services Company, Vice President |
| | | | |
John W. Clark, Jr. (k) (age 51) | | Assistant Treasurer | | April 2017 | | 135 | | Massachusetts Financial Services Company, Vice President (since March 2017); Deutsche Bank (financial services), Department Head – Treasurer’s Office (until February 2017) |
| | | | |
Thomas H. Connors (k) (age 59) | | Assistant Secretary and Assistant Clerk | | September 2012 | | 135 | | Massachusetts Financial Services Company, Vice President and Senior Counsel |
| | | | |
Ethan D. Corey (k)
(age 55) | | Assistant
Secretary and Assistant Clerk | | July 2005 | | 135 | | Massachusetts Financial Services Company, Senior Vice President and Associate General Counsel |
| | | | |
David L. DiLorenzo (k)
(age 50) | | President | | July 2005 | | 135 | | Massachusetts Financial Services Company, Senior Vice President |
| | | | |
Heidi W. Hardin (k) (age 51) | | Secretary and Clerk | | April 2017 | | 135 | | Massachusetts Financial Services Company, Executive Vice President and General Counsel (since March 2017); Harris Associates (investment management), General Counsel (from September 2015 to January 2017); Janus Capital Management LLC (investment management), Senior Vice President and General Counsel (until September 2015) |
| | | | |
Brian E. Langenfeld (k) (age 45) | | Assistant
Secretary and Assistant Clerk | | June 2006 | | 135 | | Massachusetts Financial Services Company, Vice President and Senior Counsel |
| | | | |
Amanda S. Mooradian (k) (age 39) | | Assistant
Secretary and Assistant Clerk | | September 2018 | | 135 | | Massachusetts Financial Services Company, Assistant Vice President and Counsel |
| | | | |
Susan A. Pereira (k)
(age 48) | | Assistant
Secretary and Assistant Clerk | | July 2005 | | 135 | | Massachusetts Financial Services Company, Vice President and Senior Counsel |
| | | | |
Kasey L. Phillips (k) (age 48) | | Assistant Treasurer | | September 2012 | | 135 | | Massachusetts Financial Services Company, Vice President |
| | | | |
Matthew A. Stowe (k) (age 44) | | Assistant Secretary and Assistant Clerk | | October 2014 | | 135 | | Massachusetts Financial Services Company, Vice President and Assistant General Counsel |
25
MFS Core Equity Portfolio
Trustees and Officers – continued
| | | | | | | | |
Name, Age | | Position(s)
Held with Fund | | Trustee/Officer
Since (h) | | Number of MFS Funds for which the Person is an Officer | | Principal Occupations During the Past Five Years |
Frank L. Tarantino
(age 74) | | Independent
Senior Officer | | June 2004 | | 135 | | Tarantino LLC (provider of compliance services), Principal |
| | | | |
Richard S. Weitzel (k)
(age 48) | | Assistant Secretary and Assistant Clerk | | October 2007 | | 135 | | Massachusetts Financial Services Company, Senior Vice President and Associate General Counsel |
| | | | |
Martin J. Wolin (k) (age 51) | | Chief Compliance Officer | | July 2015 | | 135 | | Massachusetts Financial Services Company, Senior Vice President and Chief Compliance Officer (since July 2015); Mercer (financial service provider), Chief Risk and Compliance Officer, North America and Latin America (until June 2015) |
| | | | |
James O. Yost (k)
(age 58) | | Treasurer | | September 1990 | | 135 | | Massachusetts Financial Services Company, Senior Vice President |
| (h) | Date first appointed to serve as Trustee/officer of an MFS Fund. Each Trustee has served continuously since appointment unless indicated otherwise. For the period from December 15, 2004 until February 22, 2005, Mr. Manning served as Advisory Trustee. From January 2012 through December 2016, Messrs. DiLorenzo and Yost served as Treasurer and Deputy Treasurer of the Funds, respectively. |
| (j) | Directorships or trusteeships of companies required to report to the Securities and Exchange Commission (i.e., “public companies”). |
| (k) | “Interested person” of the Trust within the meaning of the Investment Company Act of 1940 (referred to as the 1940 Act), which is the principal federal law governing investment companies like the fund, as a result of a position with MFS. The address of MFS is 111 Huntington Avenue, Boston, Massachusetts 02199-7618. |
Each Trustee has been elected by shareholders and each Trustee and officer holds office until his or her successor is chosen and qualified or until his or her earlier death, resignation, retirement or removal. The Trust does not hold annual meetings for the purpose of electing Trustees, and Trustees are not elected for fixed terms. Under the terms of the Board’s retirement policy, an Independent Trustee shall retire at the end of the calendar year in which he or she reaches the earlier of 75 years of age or 15 years of service on the Board (or, in the case of any Independent Trustee who joined the Board prior to 2015, 20 years of service on the Board).
Messrs. Buller, Hegarty, Kilman and Otis and Ms. Roepke are members of the Trust’s Audit Committee.
Each of the Interested Trustees and certain Officers hold comparable officer positions with certain affiliates of MFS.
The Statement of Additional Information for a Fund includes further information about the Trustees and is available without charge upon request by calling1-800-225-2606.
| | |
Investment Adviser Massachusetts Financial Services Company 111 Huntington Avenue Boston, MA 02199-7618 | | Custodian State Street Bank and Trust Company 1 Lincoln Street Boston, MA 02111-2900 |
Distributor MFS Fund Distributors, Inc. 111 Huntington Avenue Boston, MA 02199-7618 | | Independent Registered Public Accounting Firm Deloitte & Touche LLP 200 Berkeley Street Boston, MA 02116 |
Portfolio Manager(s) Joseph MacDougall | | |
26
MFS Core Equity Portfolio
BOARD REVIEW OF INVESTMENT ADVISORY AGREEMENT
The Investment Company Act of 1940 requires that both the full Board of Trustees and a majority of thenon-interested (“independent”) Trustees, voting separately, annually approve the continuation of the Fund’s investment advisory agreement with MFS. The Trustees consider matters bearing on the Fund and its advisory arrangements at their meetings throughout the year, including a review of performance data at each regular meeting. In addition, the independent Trustees met several times over the course of three months beginning in May and ending in July, 2018 (“contract review meetings”) for the specific purpose of considering whether to approve the continuation of the investment advisory agreement for the Fund and the other investment companies that the Board oversees (the “MFS Funds”). The independent Trustees were assisted in their evaluation of the Fund’s investment advisory agreement by independent legal counsel, from whom they received separate legal advice and with whom they met separately from MFS during various contract review meetings. The independent Trustees were also assisted in this process by the MFS Funds’ Independent Senior Officer, a senior officer appointed by and reporting to the independent Trustees.
In connection with their deliberations regarding the continuation of the investment advisory agreement, the Trustees, including the independent Trustees, considered such information and factors as they believed, in light of the legal advice furnished to them and their own business judgment, to be relevant. The investment advisory agreement for the Fund was considered separately, although the Trustees also took into account the common interests of all MFS Funds in their review. As described below, the Trustees considered the nature, quality, and extent of the various investment advisory, administrative, and shareholder services performed by MFS under the existing investment advisory agreement and other arrangements with the Fund.
In connection with their contract review meetings, the Trustees received and relied upon materials that included, among other items: (i) information provided by Broadridge Financial Solutions, Inc. (“Broadridge”), an independent third party, on the investment performance of the Fund for various time periods ended December 31, 2017 and the investment performance of a group of funds with substantially similar investment classifications/objectives (the “Broadridge performance universe”), (ii) information provided by Broadridge on the Fund’s advisory fees and other expenses and the advisory fees and other expenses of comparable funds identified by Broadridge (the “Broadridge expense group”), (iii) information provided by MFS on the advisory fees of portfolios of other clients of MFS, including institutional separate accounts and other clients, (iv) information as to whether and to what extent applicable expense waivers, reimbursements or fee “breakpoints” are observed for the Fund, (v) information regarding MFS’ financial results and financial condition, including MFS’ and certain of its affiliates’ estimated profitability from services performed for the Fund and the MFS Funds as a whole, and compared to MFS’ institutional business, (vi) MFS’ views regarding the outlook for the mutual fund industry and the strategic business plans of MFS, (vii) descriptions of various functions performed by MFS for the Funds, such as compliance monitoring and portfolio trading practices, and (viii) information regarding the overall organization of MFS, including information about MFS’ senior management and other personnel providing investment advisory, administrative and other services to the Fund and the other MFS Funds. The comparative performance, fee and expense information prepared and provided by Broadridge was not independently verified and the independent Trustees did not independently verify any information provided to them by MFS.
The Trustees’ conclusion as to the continuation of the investment advisory agreement was based on a comprehensive consideration of all information provided to the Trustees and not the result of any single factor. Some of the factors that figured particularly in the Trustees’ deliberations are described below, although individual Trustees may have evaluated the information presented differently from one another, giving different weights to various factors. It is also important to recognize that the fee arrangements for the Fund and other MFS Funds are the result of years of review and discussion between the independent Trustees and MFS, that certain aspects of such arrangements may receive greater scrutiny in some years than in others, and that the Trustees’ conclusions may be based, in part, on their consideration of these same arrangements during the course of the year and in prior years.
Based on information provided by Broadridge and MFS, the Trustees reviewed the Fund’s total return investment performance as well as the Broadridge performance universe over various time periods. The Trustees placed particular emphasis on the total return performance of the Fund’s Initial Class shares in comparison to the performance of funds in its Broadridge performance universe over the three-year period ended December 31, 2017, which the Trustees believed was a long enough period to reflect differing market conditions. The total return performance of the Fund’s Initial Class shares was in the 1st quintile relative to the other funds in the universe for this three-year period (the 1st quintile being the best performers and the 5th quintile being the worst performers). The total return performance of the Fund’s Initial Class shares was in the 1st quintile for each of theone- and five-year periods ended December 31, 2017 relative to the Broadridge performance universe. Because of the passage of time, these performance results may differ from the performance results for more recent periods, including those shown elsewhere in this report.
In the course of their deliberations, the Trustees took into account information provided by MFS in connection with the contract review meetings, as well as during investment review meetings conducted with portfolio management personnel during the course of the year regarding the Fund’s performance. After reviewing these and related factors, the Trustees concluded, within the context of their overall conclusions regarding the investment advisory agreement, that they were satisfied with MFS’ responses and efforts relating to investment performance.
27
MFS Core Equity Portfolio
Board Review of Investment Advisory Agreement – continued
In assessing the reasonableness of the Fund’s advisory fee, the Trustees considered, among other information, the Fund’s advisory fee and the total expense ratio of the Fund’s Initial Class shares as a percentage of average daily net assets and the advisory fee and total expense ratios of peer groups of funds based on information provided by Broadridge. The Trustees considered that MFS currently observes an expense limitation for the Fund, which may not be changed without the Trustees’ approval. The Trustees also considered that, according to the data provided by Broadridge (which takes into account any fee reductions or expense limitations that were in effect during the Fund’s last fiscal year), the Fund’s effective advisory fee rate was approximately at the Broadridge expense group median and the Fund’s total expense ratio was higher than the Broadridge expense group median.
The Trustees also considered the advisory fees charged by MFS to any institutional separate accounts advised by MFS (“separate accounts”) and unaffiliated investment companies for which MFS serves as subadviser (“subadvised funds”) that have comparable investment strategies to the Fund, if any. In comparing these fees, the Trustees considered information provided by MFS as to the generally broader scope of services provided by MFS to the Fund, as well as the more extensive regulatory burdens imposed on MFS in managing the Fund, in comparison to separate accounts and subadvised funds. The Trustees also considered the higher demands placed on MFS’ investment personnel and trading infrastructure as a result of the daily cashin-flows andout-flows of the Fund in comparison to separate accounts.
The Trustees also considered whether the Fund may benefit from any economies of scale in the management of the Fund in the event of growth in assets of the Fund and/or growth in assets of the MFS Funds as a whole. They noted that the Fund’s advisory fee rate schedule is subject to contractual breakpoints that reduce the Fund’s advisory fee rate on average daily net assets over $1 billion and $2.5 billion. The Trustees also noted that MFS has agreed in writing to waive a portion of the management fees of certain MFS Funds, including the Fund, if the total combined assets of certain funds within the MFS Funds’ complex increase above agreed upon thresholds (the “group fee waiver”), enabling the Fund’s shareholders to share in the benefits from any economies of scale at the complex level. The group fee waiver is reviewed and renewed annually between the Board and MFS. The Trustees concluded that the breakpoints and the group fee waiver were sufficient to allow the Fund to benefit from economies of scale as its assets and overall complex assets grow.
The Trustees also considered information prepared by MFS relating to MFS’ costs and profits with respect to the Fund, the MFS Funds considered as a group, and other investment companies and accounts advised by MFS, as well as MFS’ methodologies used to determine and allocate its costs to the MFS Funds, the Fund and other accounts and products for purposes of estimating profitability.
After reviewing these and other factors described herein, the Trustees concluded, within the context of their overall conclusions regarding the investment advisory agreement, that the advisory fees charged to the Fund represent reasonable compensation in light of the services being provided by MFS to the Fund.
In addition, the Trustees considered MFS’ resources and related efforts to continue to retain, attract and motivate capable personnel to serve the Fund. The Trustees also considered current and developing conditions in the financial services industry, including the presence of large and well-capitalized companies which are spending, and appear to be prepared to continue to spend, substantial sums to engage personnel and to provide services to competing investment companies. In this regard, the Trustees also considered the financial resources of MFS and its ultimate parent, Sun Life Financial Inc. The Trustees also considered the advantages and possible disadvantages to the Fund of having an adviser that also serves other investment companies as well as other accounts.
The Trustees also considered the nature, quality, cost, and extent of administrative, transfer agency, and distribution services provided to the Fund by MFS and its affiliates under agreements and plans other than the investment advisory agreement, including any12b-1 fees the Fund pays to MFS Fund Distributors, Inc., an affiliate of MFS. The Trustees also considered the nature, extent and quality of certain other services MFS performs or arranges for on the Fund’s behalf, which may include securities lending programs, directed expense payment programs, class action recovery programs, and MFS’ interaction with third-party service providers, principally custodians andsub-custodians. The Trustees concluded that the variousnon-advisory services provided by MFS and its affiliates on behalf of the Fund were satisfactory.
The Trustees consideredso-called“fall-out benefits” to MFS such as reputational value derived from serving as investment manager to the MFS Funds. The Trustees also considered that, effective January 3, 2018, MFS had discontinued its historic practice of obtaining investment research from portfolio brokerage commissions paid by certain MFS Funds and would thereafter voluntarily reimburse a Fund, if applicable, for the costs of external research acquired through the use of the Fund’s portfolio brokerage commissions.
Based on their evaluation of factors that they deemed to be material, including those factors described above, the Board of Trustees, including the independent Trustees, concluded that the Fund’s investment advisory agreement with MFS should be continued for an additionalone-year period, commencing August 1, 2018.
28
MFS Core Equity Portfolio
PROXY VOTING POLICIES AND INFORMATION
MFS votes proxies on behalf of the fund pursuant to proxy voting policies and procedures that are available without charge, upon request, by calling 1-800-225-2606, by visitingmfs.com/proxyvoting, or by visiting the SEC’s Web site athttp://www.sec.gov.
Information regarding how the fund voted proxies relating to portfolio securities during the most recent twelve-month period ended June 30 is available by August 31 of each year without charge by visitingmfs.com/proxyvoting, or by visiting the SEC’s Web site athttp://www.sec.gov.
QUARTERLY PORTFOLIO DISCLOSURE
The fund files a complete schedule of portfolio holdings with the SEC for the first and third quarters of each fiscal year on Form N-Q. The fund’s Form N-Q is available on the SEC’s website athttp://www.sec.gov. A shareholder can obtain the portfolio holdings report for the first and third quarters of the fund’s fiscal year atmfs.com/vit2 by choosing the fund’s name and then selecting the “Resources” tab and clicking on “Prospectus and Reports”.
FURTHER INFORMATION
From time to time, MFS may post important information about the fund or the MFS funds on the MFS web site (mfs.com). This information is available athttps://www.mfs.com/en-us/what-we-do/announcements.htmlor atmfs.com/vit2 by choosing the fund’s name.
INFORMATION ABOUT FUND CONTRACTS AND LEGAL CLAIMS
The fund has entered into contractual arrangements with an investment adviser, administrator, distributor, shareholder servicing agent, 529 program manager (if applicable), and custodian who each provide services to the fund. Unless expressly stated otherwise, shareholders are not parties to, or intended beneficiaries of these contractual arrangements, and these contractual arrangements are not intended to create any shareholder right to enforce them against the service providers or to seek any remedy under them against the service providers, either directly or on behalf of the fund.
Under the Trust’s By-Laws and Declaration of Trust, any claims asserted against or on behalf of the MFS Funds, including claims against Trustees and Officers, must be brought in state and federal courts located within the Commonwealth of Massachusetts.
FEDERAL TAX INFORMATION (unaudited)
The following information is provided pursuant to provisions of the Internal Revenue Code.
The fund designates $18,509,000 as capital gain dividends paid during the fiscal year.
For corporate shareholders, 36.66% of the ordinary income dividends paid during the fiscal year qualify for the corporate dividends received deduction.
29
rev. 3/16
| | | | |
| | | |
| FACTS | | WHAT DOES MFS DO WITH YOUR
PERSONAL INFORMATION? | |  |
| | |
| Why? | | Financial companies choose how they share your personal information. Federal law gives consumers the right to limit some but not all sharing. Federal law also requires us to tell you how we collect, share, and protect your personal information. Please read this notice carefully to understand what we do. |
| | |
| What? | | The types of personal information we collect and share depend on the product or service you have with us. This information can include: • Social Security number and account balances • Account transactions and transaction history • Checking account information and wire transfer instructions When you areno longer our customer, we continue to share your information as described in this notice. |
| | |
| How? | | All financial companies need to share customers’ personal information to run their everyday business. In the section below, we list the reasons financial companies can share their customers’ personal information; the reasons MFS chooses to share; and whether you can limit this sharing. |
| | | | |
Reasons we can share your
personal information | | Does MFS share? | | Can you limit this
sharing? |
For our everyday business purposes – such as to process your transactions, maintain your account(s), respond to court orders and legal investigations, or report to credit bureaus | | Yes | | No |
For our marketing purposes – to offer our products and services to you | | No | | We don’t share |
| For joint marketing with other financial companies | | No | | We don’t share |
For our affiliates’ everyday business purposes – information about your transactions and experiences | | No | | We don’t share |
For our affiliates’ everyday business purposes – information about your creditworthiness | | No | | We don’t share |
| For nonaffiliates to market to you | | No | | We don’t share |
| | |
| | |
| Questions? | | Call800-225-2606 or go tomfs.com. |
30
| | |
| Who we are |
| Who is providing this notice? | | MFS Funds, MFS Investment Management, MFS Institutional Advisors, Inc., and MFS Heritage Trust Company. |
| | |
| What we do |
| How does MFS protect my personal information? | | To protect your personal information from unauthorized access and use, we use security measures that comply with federal law. These measures include procedural, electronic, and physical safeguards for the protection of the personal information we collect about you. |
How does MFS
collect my personal information? | | We collect your personal information, for example, when you • open an account or provide account information • direct us to buy securities or direct us to sell your securities • make a wire transfer We also collect your personal information from others, such as credit bureaus, affiliates, or other companies. |
| Why can’t I limit all sharing? | | Federal law gives you the right to limit only • sharing for affiliates’ everyday business purposes – information about your creditworthiness • affiliates from using your information to market to you • sharing for nonaffiliates to market to you State laws and individual companies may give you additional rights to limit sharing. |
| | |
| Definitions |
| Affiliates | | Companies related by common ownership or control. They can be financial and nonfinancial companies. • MFS does not share personal information with affiliates, except for everyday business purposes as described on page one of this notice. |
| Nonaffiliates | | Companies not related by common ownership or control. They can be financial and nonfinancial companies. • MFS does not share with nonaffiliates so they can market to you. |
| Joint marketing | | A formal agreement between nonaffiliated financial companies that together market financial products or services to you. • MFS doesn’t jointly market. |
| | |
| Other important information |
| If you own an MFS product or receive an MFS service in the name of a third party such as a bank or broker-dealer, their privacy policy may apply to you instead of ours. |
31
Annual Report
December 31, 2018

MFS® Emerging Markets Equity Portfolio

MFS® Variable Insurance Trust II
Beginning on January 1, 2021, as permitted by regulations adopted by the U.S. Securities and Exchange Commission, the insurance company that offers your contract may determine that it will no longer send you paper copies of the fund’s annual and semiannual shareholder reports unless you specifically request paper copies from the insurance company or from your financial intermediary. Instead, the shareholder reports will be made available on a Web site (insurancefunds.mfs.com or other Web site of which you will be notified), and the insurance company will notify you by mail each time a report is posted and provide you with a Web site link to access the report. Instructions for requesting paper copies will be provided by your insurance company or financial intermediary.
If you already elected to receive shareholder reports by email, you will not be affected by this change and you need not take any action. If your insurance company or financial intermediary offers electronic delivery, you may elect to receive shareholder reports and other communications from the insurance company or financial intermediary by email by following the instructions provided by the insurance company or financial intermediary.
Beginning on January 1, 2019, you may elect to receive all future reports in paper free of charge from the insurance company or financial intermediary. You can inform the insurance company or financial intermediary that you wish to continue receiving paper copies of your shareholder reports by contacting your insurance company or financial intermediary. Your election to receive reports in paper will apply to all funds held in your account with your insurance company or financial intermediary.
FCE-ANN
MFS® Emerging Markets Equity Portfolio
CONTENTS
The report is prepared for the general information of contract owners. It is authorized for distribution to prospective investors only when preceded or accompanied by a current prospectus.
NOT FDIC INSURED• MAY LOSE VALUE• NO BANK OR CREDIT UNION GUARANTEE• NOT A DEPOSIT• NOT INSURED BY ANY FEDERAL GOVERNMENT AGENCY OR NCUA/NCUSIF
MFS Emerging Markets Equity Portfolio
LETTER FROM THE EXECUTIVE CHAIRMAN

Dear Contract Owners:
Higher interest rates, international trade friction, and geopolitical uncertainty surrounding issues such as Brexit have contributed to an uptick in market volatility in recent quarters — a departure from thelow-volatility environment that prevailed for much of the past several years. Against this more challenging backdrop, equity markets in the United States outperformed most international markets on a relative basis in 2018, though broad market returns were modestly negative on an absolute basis. Global economic growth has become less synchronized over the past few quarters, with Europe, China, and some emerging markets having shown signs of significantly slowing growth. While U.S. growth has remained above average, the pace of that growth slowed in the second half of 2018.
Slowing global growth and tighter financial conditions have clouded the outlook for U.S. monetary policy, with the chairman of the U.S. Federal Reserve acknowledging that policy rates are close to levels that the Fed deems neutral for the U.S. economy. This suggests that the predictable pattern of quarterly rate increases is behind us. At the same time, markets must contend with a shift from years of quantitative easing toward a cycle of quantitative tightening now that the European Central Bank has halted asset purchases. U.S. tax reforms adopted in late 2017 have been welcomed by equity markets while emerging market economies have recently had to contend with tighter financial conditions as a result of firmer U.S. interest rates and a stronger dollar. With the Republicans losing control of the U.S. House of Representatives, further meaningful U.S. fiscal stimulus appears less likely over the remainder of this presidential term. A partial U.S. government shutdown, beginning in late 2018, also added to political uncertainty. Globally, inflation remains largely subdued thanks in part to falling oil prices, but tight labor markets and moderate global demand have investors on the lookout for its potential reappearance. Increased U.S. protectionism is also a growing concern, as investors fear trade disputes could dampen business sentiment, leading to even slower global growth. While there has been progress on this front — a NAFTA replacement has been agreed upon between the U.S., Mexico, and Canada; the free trade pact with Korea has been updated; and a negotiating framework with the European Union has been agreed upon — tensions over trade with China remain quite high, though the two sides have recently returned to the negotiating table.
As a global investment manager with nearly a century of expertise, MFS® firmly believes active risk management offers downside mitigation and may help improve investment outcomes. We built our active investment platform with this belief in mind. Ourlong-term perspective influences nearly every aspect of our business, ensuring our investment decisions align with the investing time horizons of our clients.
Respectfully,

Robert J. Manning
Executive Chairman
MFS Investment Management
February 15, 2019
The opinions expressed in this letter are subject to change and may not be relied upon for investment advice. No forecasts can be guaranteed.
1
MFS Emerging Markets Equity Portfolio
PORTFOLIO COMPOSITION
Portfolio structure

| | | | |
| Top ten holdings | | | | |
| Taiwan Semiconductor Manufacturing Co. Ltd. | | | 5.4% | |
| Samsung Electronics Co. Ltd. | | | 4.3% | |
| Tencent Holdings Ltd. | | | 3.9% | |
| Housing Development Finance Corp. Ltd. | | | 3.4% | |
| Alibaba Group Holding Ltd., ADR | | | 3.3% | |
| Baidu, Inc., ADR | | | 2.8% | |
| Banco Bradesco S.A., ADR | | | 2.6% | |
| AIA Group Ltd. | | | 2.4% | |
| LUKOIL PJSC, ADR | | | 2.4% | |
| Yum China Holdings, Inc. | | | 2.2% | |
| |
| GICS equity sectors | | | | |
| Financials | | | 26.8% | |
| Information Technology | | | 15.8% | |
| Consumer Discretionary | | | 14.8% | |
| Consumer Staples | | | 11.8% | |
| Communication Services | | | 11.3% | |
| Industrials | | | 7.2% | |
| Materials | | | 4.9% | |
| Energy | | | 3.8% | |
| Real Estate | | | 1.7% | |
| Utilities | | | 0.8% | |
| Health Care | | | 0.5% | |
| | | | |
| Issuer country weightings (x) | | | | |
| China | | | 22.4% | |
| South Korea | | | 11.0% | |
| Brazil | | | 9.6% | |
| India | | | 9.0% | |
| Hong Kong | | | 7.5% | |
| Taiwan | | | 7.5% | |
| South Africa | | | 5.2% | |
| Indonesia | | | 4.8% | |
| Mexico | | | 4.3% | |
| Other Countries | | | 18.7% | |
| |
| Currency exposure weightings (y) | | | | |
| Hong Kong Dollar | | | 18.0% | |
| South Korean Won | | | 11.0% | |
| Brazilian Real | | | 9.6% | |
| Chinese Renminbi | | | 8.7% | |
| United States Dollar | | | 8.3% | |
| Indian Rupee | | | 7.8% | |
| Taiwan Dollar | | | 7.5% | |
| South African Rand | | | 5.2% | |
| Indonesian Rupiah | | | 4.8% | |
| Other Currencies | | | 19.1% | |
| (x) | Represents the portfolio’s exposure to issuer countries as a percentage of the portfolio’s net assets. For purposes of this presentation, United States (included in Other Countries) includes Cash & Cash Equivalents. |
| (y) | Represents the portfolio’s exposure to a particular currency as a percentage of a portfolio’s net assets. For purposes of this presentation, United States Dollar includes Cash & Cash Equivalents. |
Cash & Cash Equivalents includes any cash, investments in money market funds, short-term securities, and other assets less liabilities. Please see the Statement of Assets and Liabilities for additional information related to the fund’s cash position and other assets and liabilities.
The Global Industry Classification Standard (GICS®) was developed by and/or is the exclusive property of MSCI, Inc. and S&P Global Market Intelligence Inc. (“S&P Global Market Intelligence”). GICS is a service mark of MSCI and S&P Global Market Intelligence and has been licensed for use by MFS.
Percentages are based on net assets as of December 31, 2018.
The portfolio is actively managed and current holdings may be different.
2
MFS Emerging Markets Equity Portfolio
MANAGEMENT REVIEW
Summary of Results
For the twelve months ended December 31, 2018, Initial Class shares of the MFS Emerging Markets Equity Portfolio (“fund”) provided a total return of –13.94%, while Service Class shares of the fund provided a total return of –14.13%. These compare with a return of –14.58% over the same period for the fund’s benchmark, the MSCI Emerging Markets Index (net div).
Market Environment
During the reporting period, the US Federal Reserve raised interest rates by 100 basis points, bringing the total number of rate hikes to nine since the central bank began to normalize monetary policy in late 2015. Economic growth rates in the US, Eurozone and Japan remained above trend, despite a slowing in global growth, particularly toward the end of the period. Inflation remained contained, particularly outside the US. Late in the period, the European Central Bank halted its asset purchase program but issued forward guidance that it does not expect to raise interest rates at least until after the summer of 2019. The Bank of England (once) and the Bank of Canada (three times) each raised rates during the period. The European political backdrop became a bit more volatile, late in the period, spurred by concerns over cohesion in the eurozone after the election of an anti-establishment, Eurosceptic coalition government in Italy and widespread protests over stagnant wage growth in France.
Bond yields rose in the US during most of the period, but remained low by historical standards and slipped from their highs, late in the period, as market volatility increased. Yields in many developed markets fell. Outside of emerging markets, where spreads and currencies came under pressure, credit spreads remained quite tight until the end of the period, when thinner liquidity, lower oil prices and concerns over high degrees of corporate leverage emerged. Growing concern over increasing global trade friction appeared to have weighed on business sentiment during the period’s second half, especially outside the US. Tighter financial conditions from rising US rates and a strong dollar, combined with trade uncertainty, helped expose structural weaknesses in several emerging markets in the second half of the period.
Volatility increased, at the end of the period, amid signs of slowing global economic growth and increasing trade tensions, which prompted a market setback shortly after US markets set record highs in September. It was the second such equity market decline during the reporting period. The correction came despite a third consecutive quarter of strong growth in US earnings per share. Strong earnings growth, combined with the market decline, brought US equity valuations down from elevated levels, earlier in the period, to multiples more in line with long-term averages. While the US economy held up better than most, global economic growth became less synchronized during the period, with Europe and China showing signs of a slowdown and some emerging markets coming under stress.
Contributors to Performance
Security selection in thefinancials,information technology andmaterials sectors was a primary factor that contributed to performance relative to the MSCI Emerging Markets Index. Within thefinancials sector, the fund’s overweight positions in financial services company Housing Development Finance Corp. (India), banking firm Banco Bradesco (Brazil) and financial management firm E.Sun Financial Holding (Taiwan), as well as holding shares of insurance company AIA Group (b) (Hong Kong), boosted relative returns. The stock price of Housing Development Finance Corp. rose as strong loan growth and lower operating expenses translated into strong earnings results for the firm. Within theinformation technology sector, holding shares of enterprise software solutions provider Linx (b) (Brazil) aided relative results. Shares of Linx climbed, towards the latter part of the reporting period, after the company announced it will be going into the fintech payments business with the launch of its new division Linx Pay. Within thematerials sector, an overweight position in pulp and paper producer Fibria Celulose (h) (Brazil) helped relative performance.
Stocks in other sectors that further supported relative returns included overweight positions in integrated oil company LUKOIL PJSC (Russia) and snack manufacturer Orion (South Korea), as well as the timing of the fund’s ownership in shares of human resource services provider 51job (China). Holding shares of international school operator China Maple Leaf Educational Systems (b)(h) (Hong Kong) also aided relative results.
During the reporting period, the fund’s relative currency exposure, resulting primarily from differences between the fund’s and the benchmark’s exposures to holdings of securities denominated in foreign currencies, was another contributor to relative performance. All of MFS’ investment decisions are driven by the fundamentals of each individual opportunity and as such, it is common for our funds to have different currency exposures than the benchmark.
Detractors from Performance
The combination of an underweight position and stock selection in both theenergy andutilities sectors weighed on relative performance during the reporting period. Within theenergy sector, the timing of the fund’s ownership in shares of oil and gas exploration and production company Petroleo Brasileiro (Brazil) and an overweight position in fuel and chemicals distributor Ultrapar Participacoes (h) (Brazil) hindered relative returns. Early in the period, shares of Petroleo Brasileiro came under pressure due to a trucker strike in Brazil, which ultimately led to a heavy cut in the company’s diesel prices and the resignation of its CEO. Later in the
3
MFS Emerging Markets Equity Portfolio
Management Review – continued
period, the stock advanced after the company announced it would sell its offshore Gulf of Mexico assets in a deal valued at $1.1 billion. Although an underweight position and stock selection in theutilities sector hurt relative results, there were no individual stocks within this sector that were among the fund’s top relative detractors during the reporting period.
Security selection within thecommunications services sector also weakened relative returns, led by the fund’s overweight position in internet search provider Baidu (China). Shares of Baidu lagged the benchmark over the reporting period as concerns over a trade war between the United States and China and new regulations on gaming ande-finance, combined with disappointing guidance from the company’s management, appeared to have weighed on investor sentiment.
Elsewhere, overweight positions in education services provider Kroton Educacional (Brazil), travel service provider Ctrip.com International (China), casino and gaming company Genting Berhad (Malaysia), water purifiers and air filters maker Coway (h) (South Korea), food producer BRF (Brazil) and Chinese instant food manufacturer Tingyi (Cayman Islands) Holding Corporation further held back relative returns. Lastly, holding shares of electronic products manufacturer and supplier VTech Holdings (b) (Hong Kong) also detracted from relative results.
Respectfully,
Portfolio Manager(s)
Jose Luis Garcia, Robert Lau, and Harry Purcell
| (b) | Security is not a benchmark constituent. |
| (h) | Security was not held in the portfolio at period end. |
The views expressed in this report are those of the portfolio manager(s) only through the end of the period of the report as stated on the cover and do not necessarily reflect the views of MFS or any other person in the MFS organization. These views are subject to change at any time based on market or other conditions, and MFS disclaims any responsibility to update such views. These views may not be relied upon as investment advice or an indication of trading intent on behalf of any MFS portfolio. References to specific securities are not recommendations of such securities, and may not be representative of any MFS portfolio’s current or future investments.
4
MFS Emerging Markets Equity Portfolio
PERFORMANCE SUMMARY THROUGH 12/31/18
The following chart illustrates the historical performance of the fund in comparison to its benchmark(s). Benchmarks are unmanaged and may not be invested in directly. Benchmark returns do not reflect any fees or expenses. The performance of other share classes will be greater than or less than that of the class depicted below. (See Notes to Performance Summary.)
Performance data shown represents past performance and is no guarantee of future results. Investment return and principal value fluctuate so your units, when sold, may be worth more or less than the original cost; current performance may be lower or higher than quoted. The performance shown does not reflect the deduction of taxes, if any, that a contract holder would pay on fund distributions or the redemption of contract units. The returns for the fund shown also do not reflect the deduction of expenses associated with variable products, such as mortality and expense risk charges, separate account charges, and sales charges imposed by the insurance company separate accounts. Such expenses would reduce the overall returns shown.
Growth of a Hypothetical $10,000 Investment
Total Returns through 12/31/18
Average annual total returns
| | | | | | | | | | | | |
| | | Share Class | | Class Inception Date | | 1-yr | | 5-yr | | 10-yr | | |
| | | Initial Class | | 6/05/96 | | (13.94)% | | 1.08% | | 7.30% | | |
| | | Service Class | | 8/24/01 | | (14.13)% | | 0.83% | | 7.03% | | |
| | | | |
| Comparative benchmark(s) | | | | | | | | |
| | | MSCI Emerging Markets Index (net div) (f) | | (14.58)% | | 1.65% | | 8.02% | | |
| (f) | Source: FactSet Research Systems Inc. |
Benchmark Definition(s)
MSCI Emerging Markets Index (net div) – a market capitalization-weighted index that is designed to measure equity market performance in the global emerging markets.
It is not possible to invest directly in an index.
Notes to Performance Summary
Average annual total return represents the average annual change in value for each share class for the periods presented.
Performance results reflect any applicable expense subsidies and waivers in effect during the periods shown. Without such subsidies and waivers the fund’s performance results would be less favorable. Please see the prospectus and financial statements for complete details. All results are historical and assume the reinvestment of any dividends and capital gains distributions.
Performance results do not include adjustments made for financial reporting purposes in accordance with U.S. generally accepted accounting principles and may differ from amounts reported in the financial highlights.
From time to time the fund may receive proceeds from litigation settlements, without which performance would be lower.
5
MFS Emerging Markets Equity Portfolio
EXPENSE TABLE
Fund Expenses Borne by the Contract Holders during the Period,
July 1, 2018 through December 31, 2018
As a contract holder of the fund, you incur ongoing costs, including management fees; distribution and/or service(12b-1) fees; and other fund expenses. This example is intended to help you understand your ongoing costs (in dollars) of investing in the fund and to compare these costs with the ongoing costs of investing in other mutual funds.
The example is based on an investment of $1,000 invested at the beginning of the period and held for the entire period July 1, 2018 through December 31, 2018.
Actual Expenses
The first line for each share class in the following table provides information about actual account values and actual expenses. You may use the information in this line, together with the amount you invested, to estimate the expenses that you paid over the period. Simply divide your account value by $1,000 (for example, an $8,600 account value divided by $1,000 = 8.6), then multiply the result by the number in the first line under the heading entitled “Expenses Paid During Period” to estimate the expenses you paid on your account during this period.
Hypothetical Example for Comparison Purposes
The second line for each share class in the following table provides information about hypothetical account values and hypothetical expenses based on the fund’s actual expense ratio and an assumed rate of return of 5% per year before expenses, which is not the fund’s actual return. The hypothetical account values and expenses may not be used to estimate the actual ending account balance or expenses you paid for the period. You may use this information to compare the ongoing costs of investing in the fund and other funds. To do so, compare this 5% hypothetical example with the 5% hypothetical examples that appear in the shareholder reports of the other funds.
Please note that the expenses shown in the table are meant to highlight the fund’s ongoing costs only and do not take into account the fees and expenses imposed under the variable contracts through which your investment in the fund is made. Therefore, the second line for each share class in the table is useful in comparing ongoing costs associated with an investment in vehicles (such as the fund) which fund benefits under variable annuity and variable life insurance contracts and to qualified pension and retirement plans only, and will not help you determine the relative total costs of investing in the fund through variable annuity and variable life insurance contracts. If the fees and expenses imposed under the variable contracts were included, your costs would have been higher.
| | | | | | | | | | | | | | | | | | |
| Share Class | | | | Annualized
Expense Ratio | | | Beginning
Account Value
7/01/18 | | | Ending Account Value
12/31/18 | | | Expenses Paid
During Period (p)
7/01/18-12/31/18 | |
| Initial Class | | Actual | | | 1.34% | | | | $1,000.00 | | | | $888.51 | | | | $6.38 | |
| | Hypothetical (h) | | | 1.34% | | | | $1,000.00 | | | | $1,018.45 | | | | $6.82 | |
| Service Class | | Actual | | | 1.59% | | | | $1,000.00 | | | | $887.51 | | | | $7.56 | |
| | Hypothetical (h) | | | 1.59% | | | | $1,000.00 | | | | $1,017.19 | | | | $8.08 | |
| (h) | 5% class return per year before expenses. |
| (p) | “Expenses Paid During Period” are equal to each class’s annualized expense ratio, as shown above, multiplied by the average account value over the period, multiplied by 184/365 (to reflect theone-half year period). |
Notes to Expense Table
Changes to the fund’s fee arrangements occurred during the six month period. Had these fee changes been in effect throughout the entire six month period, the annualized expense ratios, the actual expenses paid during the period, and the hypothetical expenses paid during the period would have been approximately 1.33%, $6.33, and $6.77 for Initial Class and 1.58%, $7.52, and $8.03 for Service Class, respectively. For further information about the fund’s fee arrangements and changes to those fee arrangements, please see Note 3 in the Notes to Financial Statements.
6
MFS Emerging Markets Equity Portfolio
PORTFOLIO OF INVESTMENTS – 12/31/18
The Portfolio of Investments is a complete list of all securities owned by your fund. It is categorized by broad-based asset classes.
| | | | | | | | |
| | |
| Issuer | | Shares/Par | | | Value ($) | |
| COMMON STOCKS – 99.4% | | | | | | | | |
| Airlines – 0.9% | | | | | | | | |
| Grupo Aeroportuario del Sureste S.A. de C.V., | | | | | | | | |
| ADR (l) | | | 2,819 | | | $ | 424,541 | |
| | | | | | | | |
| Alcoholic Beverages – 3.3% | | | | | | | | |
| AmBev S.A., ADR | | | 153,850 | | | $ | 603,092 | |
| China Resources Beer Holdings Co. Ltd. | | | 250,000 | | | | 873,188 | |
| | | | | | | | |
| | | | | | $ | 1,476,280 | |
| | | | | | | | |
| Apparel Manufacturers – 0.6% | | | | | | | | |
| Stella International Holdings | | | 215,500 | | | $ | 255,666 | |
| | | | | | | | |
| Automotive – 2.1% | | | | | | | | |
| Mahindra & Mahindra Ltd. | | | 39,171 | | | $ | 451,015 | |
| PT Astra International Tbk | | | 879,200 | | | | 506,114 | |
| | | | | | | | |
| | | | | | $ | 957,129 | |
| | | | | | | | |
| Brokerage & Asset Managers – 0.4% | | | | | | | | |
| B3 Brasil Bolsa Balcao S.A. | | | 26,200 | | | $ | 181,235 | |
| | | | | | | | |
| Business Services – 1.6% | | | | | | | | |
| Cognizant Technology Solutions Corp., “A” | | | 10,199 | | | $ | 647,433 | |
| Motus Holdings Ltd. (a) | | | 10,759 | | | | 65,814 | |
| RP-SG Business Process Services Ltd. (a) | | | 5,444 | | | | 3,780 | |
| | | | | | | | |
| | | | | | $ | 717,027 | |
| | | | | | | | |
| Cable TV – 1.7% | | | | | | | | |
| Naspers Ltd. | | | 3,755 | | | $ | 754,855 | |
| | | | | | | | |
| Computer Software – Systems – 2.6% | | | | | | | | |
| Globant S.A. (a) | | | 1,321 | | | $ | 74,399 | |
| Linx S.A. | | | 75,100 | | | | 631,687 | |
| Luxoft Holding, Inc. (a) | | | 14,572 | | | | 443,280 | |
| | | | | | | | |
| | | | | | $ | 1,149,366 | |
| | | | | | | | |
| Construction – 2.6% | | | | | | | | |
| PT Indocement Tunggal Prakarsa Tbk | | | 415,500 | | | $ | 533,100 | |
| Techtronic Industries Co. Ltd. | | | 117,500 | | | | 624,226 | |
| | | | | | | | |
| | | | | | $ | 1,157,326 | |
| | | | | | | | |
| Consumer Products – 0.6% | | | | | | | | |
| Dabur India Ltd. | | | 41,852 | | | $ | 258,162 | |
| | | | | | | | |
| Consumer Services – 3.8% | | | | | | | | |
| 51job, Inc., ADR (a) | | | 8,760 | | | $ | 546,974 | |
| Ctrip.com International Ltd., ADR (a) | | | 21,115 | | | | 571,372 | |
| Kroton Educacional S.A. | | | 27,900 | | | | 63,852 | |
| MakeMyTrip Ltd. (a) | | | 22,043 | | | | 536,306 | |
| | | | | | | | |
| | | | | | $ | 1,718,504 | |
| | | | | | | | |
| Containers – 0.6% | | | | | | | | |
| Lock & Lock Co. Ltd. (a) | | | 15,500 | | | $ | 286,563 | |
| | | | | | | | |
| Electrical Equipment – 2.0% | | | | | | | | |
| Bharat Heavy Electricals Ltd. | | | 359,985 | | | $ | 376,923 | |
| LS Industrial Systems Co. Ltd. (a) | | | 12,258 | | | | 536,835 | |
| | | | | | | | |
| | | | | | $ | 913,758 | |
| | | | | | | | |
| | | | | | | | |
| | |
| Issuer | | Shares/Par | | | Value ($) | |
| COMMON STOCKS – continued | |
| Electronics – 10.7% | | | | | | | | |
| Samsung Electronics Co. Ltd. | | | 56,034 | | | $ | 1,938,814 | |
| Silicon Motion Technology Corp., ADR | | | 13,177 | | | | 454,607 | |
| Taiwan Semiconductor Manufacturing Co. Ltd. | | | 329,258 | | | | 2,415,580 | |
| | | | | | | | |
| | | | | | $ | 4,809,001 | |
| | | | | | | | |
| Energy – Integrated – 3.4% | | | | | | | | |
| LUKOIL PJSC, ADR | | | 15,068 | | | $ | 1,077,061 | |
| Petroleo Brasileiro S.A., ADR | | | 35,552 | | | | 462,531 | |
| | | | | | | | |
| | | | | | $ | 1,539,592 | |
| | | | | | | | |
| Food & Beverages – 5.3% | | | | | | | | |
| AVI Ltd. | | | 81,459 | | | $ | 575,634 | |
| BRF S.A. (a) | | | 32,054 | | | | 182,648 | |
| Fomento Economico Mexicano S.A.B. de C.V., ADR | | | 2,912 | | | | 250,578 | |
| Orion Corp. (a) | | | 6,945 | | | | 746,908 | |
| Tingyi (Cayman Islands) Holding Corp. | | | 468,000 | | | | 625,155 | |
| | | | | | | | |
| | | | | | $ | 2,380,923 | |
| | | | | | | | |
| Food & Drug Stores – 1.0% | | | | | | | | |
| Dairy Farm International Holdings Ltd. | | | 51,100 | | | $ | 462,455 | |
| | | | | | | | |
| Forest & Paper Products – 0.9% | | | | | | | | |
| Suzano Papel e Celulose | | | 39,500 | | | $ | 388,095 | |
| | | | | | | | |
| Gaming & Lodging – 1.3% | | | | | | | | |
| Genting Berhad | | | 386,000 | | | $ | 569,776 | |
| | | | | | | | |
| General Merchandise – 0.9% | | | | | | | | |
| S.A.C.I. Falabella | | | 24,108 | | | $ | 176,802 | |
| Walmart de Mexico S.A.B. de C.V. | | | 82,294 | | | | 209,255 | |
| | | | | | | | |
| | | | | | $ | 386,057 | |
| | | | | | | | |
| Insurance – 3.0% | | | | | | | | |
| AIA Group Ltd. | | | 131,000 | | | $ | 1,087,415 | |
| Samsung Fire & Marine Insurance Co. Ltd. (a) | | | 979 | | | | 236,020 | |
| | | | | | | | |
| | | | | | $ | 1,323,435 | |
| | | | | | | | |
| Internet – 11.5% | | | | | | | | |
| Alibaba Group Holding Ltd., ADR (a) | | | 10,907 | | | $ | 1,495,022 | |
| Baidu, Inc., ADR (a) | | | 8,008 | | | | 1,270,069 | |
| NAVER Corp. (a) | | | 5,920 | | | | 645,030 | |
| Tencent Holdings Ltd. | | | 43,600 | | | | 1,748,343 | |
| | | | | | | | |
| | | | | | $ | 5,158,464 | |
| | | | | | | | |
| Machinery & Tools – 2.0% | | | | | | | | |
| Doosan Bobcat, Inc. | | | 19,159 | | | $ | 539,436 | |
| Haitian International Holdings Ltd. | | | 189,000 | | | | 364,459 | |
| | | | | | | | |
| | | | | | $ | 903,895 | |
| | | | | | | | |
| Major Banks – 8.6% | | | | | | | | |
| ABSA Group Ltd. | | | 80,796 | | | $ | 908,734 | |
| Banco Bradesco S.A., ADR | | | 118,083 | | | | 1,167,841 | |
| China Construction Bank | | | 1,130,670 | | | | 932,779 | |
| Industrial & Commercial Bank of China, “H” | | | 863,000 | | | | 616,074 | |
7
MFS Emerging Markets Equity Portfolio
Portfolio of Investments – continued
| | | | | | | | |
| | |
| Issuer | | Shares/Par | | | Value ($) | |
| COMMON STOCKS – continued | |
| Major Banks – continued | | | | | | | | |
| Nova Ljubljanska Banka d.d., GDR (a)(z) | | | 14,565 | | | $ | 217,109 | |
| | | | | | | | |
| | | | | | $ | 3,842,537 | |
| | | | | | | | |
| Metals & Mining – 1.4% | | | | | | | | |
| Grupo Mexico S.A.B. de C.V., “B” | | | 70,298 | | | $ | 144,662 | |
| Vale S.A., ADR | | | 35,518 | | | | 468,482 | |
| | | | | | | | |
| | | | | | $ | 613,144 | |
| | | | | | | | |
| Network & Telecom – 1.1% | | | | | | | | |
| VTech Holdings Ltd. | | | 56,900 | | | $ | 470,867 | |
| | | | | | | | |
| Oil Services – 0.4% | | | | | | | | |
| Lamprell PLC (a) | | | 247,900 | | | $ | 191,164 | |
| | | | | | | | |
| Other Banks & Diversified Financials – 15.0% | | | | | |
| Banco Macro S.A., ADR | | | 3,110 | | | $ | 137,524 | |
| Credicorp Ltd. | | | 1,421 | | | | 314,993 | |
| E.Sun Financial Holding Co. Ltd. | | | 739,714 | | | | 483,725 | |
| Grupo Financiero Inbursa S.A. de C.V. | | | 251,803 | | | | 362,487 | |
| Housing Development Finance Corp. Ltd. | | | 53,996 | | | | 1,522,352 | |
| Kasikornbank Co. Ltd. | | | 105,400 | | | | 597,245 | |
| Komercni Banka A.S. | | | 11,355 | | | | 428,190 | |
| Metropolitan Bank & Trust Co. | | | 535,686 | | | | 824,642 | |
| PT Bank Central Asia Tbk | | | 173,400 | | | | 313,519 | |
| Public Bank Berhad | | | 84,300 | | | | 505,086 | |
| Sberbank of Russia | | | 164,585 | | | | 440,075 | |
| Shriram Transport Finance Co. Ltd. | | | 31,349 | | | | 556,774 | |
| Union National Bank | | | 186,120 | | | | 237,644 | |
| | | | | | | | |
| | | | | | $ | 6,724,256 | |
| | | | | | | | |
| Pharmaceuticals – 0.5% | | | | | | | | |
| Genomma Lab Internacional S.A., “B” (a) | | | 394,140 | | | $ | 234,056 | |
| | | | | | | | |
| Railroad & Shipping – 0.7% | | | | | | | | |
| GMexico Transportes S.A.B. de C.V | | | 245,400 | | | $ | 320,053 | |
| | | | | | | | |
| Real Estate – 1.7% | | | | | | | | |
| Aldar Properties PJSC | | | 363,861 | | | $ | 158,495 | |
| Hang Lung Properties Ltd. | | | 245,000 | | | | 466,816 | |
| Multiplan Empreendimentos Imobiliarios S.A. | | | 24,521 | | | | 154,431 | |
| | | | | | | | |
| | | | | | $ | 779,742 | |
| | | | | | | | |
| Restaurants – 2.2% | | | | | | | | |
| Yum China Holdings, Inc. | | | 29,911 | | | $ | 1,002,916 | |
| | | | | | | | |
| | | | | | | | |
| | |
| Issuer | | Shares/Par | | | Value ($) | |
| COMMON STOCKS – continued | |
| Retailers – 0.1% | | | | | | | | |
| RP-SG Retail Ltd. (a) | | | 16,334 | | | $ | 34,011 | |
| | | | | | | | |
| Specialty Chemicals – 1.3% | | | | | | | | |
| Astra Argo Lestari | | | 280,200 | | | $ | 230,415 | |
| PTT Global Chemical PLC | | | 166,800 | | | | 365,003 | |
| | | | | | | | |
| | | | | | $ | 595,418 | |
| | | | | | | | |
| Specialty Stores – 0.7% | | | | | | | | |
| Dufry AG | | | 3,345 | | | $ | 317,687 | |
| | | | | | | | |
| Telecommunications – Wireless – 0.3% | | | | | |
| Mobile TeleSystems PJSC, ADR | | | 20,085 | | | $ | 140,595 | |
| | | | | | | | |
| Telephone Services – 1.2% | | | | | | | | |
| Hellenic Telecommunications Organization S.A. | | | 22,844 | | | $ | 249,172 | |
| PT XL Axiata Tbk (a) | | | 2,112,200 | | | | 290,831 | |
| | | | | | | | |
| | | | | | $ | 540,003 | |
| | | | | | | | |
| Tobacco – 0.6% | | | | | | | | |
| PT Hanjaya Mandala Sampoerna Tbk | | | 1,052,550 | | | $ | 271,555 | |
| | | | | | | | |
| Trucking – 0.1% | | | | | | | | |
| Imperial Logistics Ltd | | | 10,759 | | | $ | 50,851 | |
| | | | | | | | |
| Utilities – Electric Power – 0.7% | | | | | | | | |
| CESC Ltd. | | | 31,733 | | | $ | 303,785 | |
| | | | | | | | |
Total Common Stocks
(Identified Cost, $35,713,909) | | | | | | $ | 44,604,745 | |
| | | | | | | | |
| |
| INVESTMENT COMPANIES (h) – 0.8% | | | | | |
| Money Market Funds – 0.8% | | | | | | | | |
| MFS Institutional Money Market Portfolio, 2.4% (v) (Identified Cost, $364,116) | | | 364,152 | | | $ | 364,115 | |
| | | | | | | | |
|
| COLLATERAL FOR SECURITIES LOANED – 0.1% | |
| State Street Navigator Securities Lending | | | | | | | | |
| Government Money Market Portfolio, 2.29% (j) (Identified Cost, $47,722) | | | 47,722 | | | $ | 47,722 | |
| | | | | | | | |
OTHER ASSETS, LESS
LIABILITIES – (0.3)% | | | | | | | (156,133 | ) |
| | | | | | | | |
| NET ASSETS – 100.0% | | | | | | $ | 44,860,449 | |
| | | | | | | | |
| (a) | | Non-income producing security. |
| (h) | | An affiliated issuer, which may be considered one in which the fund owns 5% or more of the outstanding voting securities, or a company which is under common control. At period end, the aggregate values of the fund’s investments in affiliated issuers and in unaffiliated issuers were $364,115 and $44,652,467, respectively. |
| (j) | | The rate quoted is the annualizedseven-day yield of the fund at period end. |
| (l) | | A portion of this security is on loan. See Note 2 for additional information. |
| (v) | | Affiliated issuer that is available only to investment companies managed by MFS. The rate quoted for the MFS Institutional Money Market Portfolio is the annualizedseven-day yield of the fund at period end. |
8
MFS Emerging Markets Equity Portfolio
Portfolio of Investments – continued
| (z) | | Restricted securities are not registered under the Securities Act of 1933 and are subject to legal restrictions on resale. These securities generally may be resold in transactions exempt from registration or to the public if the securities are subsequently registered. Disposal of these securities may involvetime-consuming negotiations and prompt sale at an acceptable price may be difficult. The fund holds the following restricted securities: |
| | | | | | | | | | |
| Restricted Securities | | Acquisition
Date | | Cost | | | Value | |
| | | |
| Nova Ljubljanska Banka d.d., GDR | | 11/9/18 | | | $170,128 | | | | $217,109 | |
| | | |
| % of Net assets | | | | | | | | | 0.5% | |
The following abbreviations are used in this report and are defined:
| ADR | | American Depositary Receipt |
| GDR | | Global Depositary Receipt |
| PJSC | | Public Joint Stock Company |
| PLC | | Public Limited Company |
See Notes to Financial Statements
9
MFS Emerging Markets Equity Portfolio
FINANCIAL STATEMENTS | STATEMENT OF ASSETS AND LIABILITIES
This statement represents your fund’s balance sheet, which details the assets and liabilities comprising the total value of the fund.
| | | | |
At 12/31/18 | | | | |
Assets | | | | |
Investments in unaffiliated issuers, at value, including $45,632 of securities on loan (identified cost, $35,761,631) | | | $44,652,467 | |
Investments in affiliated issuers, at value (identified cost, $364,116) | | | 364,115 | |
Foreign currency, at value (identified cost, $27) | | | 27 | |
Receivables for | | | | |
Investments sold | | | 81,647 | |
Fund shares sold | | | 540 | |
Interest and dividends | | | 58,150 | |
Receivable from investment adviser | | | 12,088 | |
Other assets | | | 645 | |
Total assets | | | $45,169,679 | |
Liabilities | | | | |
Payables for | | | | |
Investments purchased | | | $773 | |
Fund shares reacquired | | | 135,986 | |
Collateral for securities loaned, at value | | | 47,722 | |
Payable to affiliates | | | | |
Shareholder servicing costs | | | 48 | |
Distribution and/or service fees | | | 653 | |
Payable for independent Trustees’ compensation | | | 3 | |
Deferred country tax expense payable | | | 25,440 | |
Accrued expenses and other liabilities | | | 98,605 | |
Total liabilities | | | $309,230 | |
Net assets | | | $44,860,449 | |
Net assets consist of | | | | |
Paid-in capital | | | $35,184,638 | |
Total distributable earnings (loss) | | | 9,675,811 | |
Net assets | | | $44,860,449 | |
Shares of beneficial interest outstanding | | | 3,065,868 | |
| | | | | | | | | | | | |
| | | Net assets | | | Shares
outstanding | | | Net asset value
per share | |
Initial Class | | | $20,886,959 | | | | 1,415,905 | | | | $14.75 | |
Service Class | | | 23,973,490 | | | | 1,649,963 | | | | 14.53 | |
See Notes to Financial Statements
10
MFS Emerging Markets Equity Portfolio
FINANCIAL STATEMENTS | STATEMENT OF OPERATIONS
This statement describes how much your fund earned in investment income and accrued in expenses. It also describes any gains and/or losses generated by fund operations.
| | | | |
| Year ended 12/31/18 | | | | |
Net investment income (loss) | | | | |
Income | | | | |
Dividends | | | $1,184,862 | |
Dividends from affiliated issuers | | | 10,580 | |
Other | | | 7,889 | |
Income on securities loaned | | | 758 | |
Interest | | | 36 | |
Foreign taxes withheld | | | (121,976 | ) |
Total investment income | | | $1,082,149 | |
Expenses | | | | |
Management fee | | | $562,101 | |
Distribution and/or service fees | | | 70,266 | |
Shareholder servicing costs | | | 6,090 | |
Administrative services fee | | | 18,165 | |
Independent Trustees’ compensation | | | 2,102 | |
Custodian fee | | | 106,573 | |
Shareholder communications | | | 10,254 | |
Audit and tax fees | | | 79,070 | |
Legal fees | | | 526 | |
Miscellaneous | | | 19,438 | |
Total expenses | | | $874,585 | |
Reduction of expenses by investment adviser | | | (68,838 | ) |
Net expenses | | | $805,747 | |
Net investment income (loss) | | | $276,402 | |
Realized and unrealized gain (loss) | | | | |
Realized gain (loss) (identified cost basis) | | | | |
Unaffiliated issuers (net of $4,814 country tax) | | | $2,607,840 | |
Affiliated issuers | | | 25 | |
Foreign currency | | | (27,988 | ) |
Net realized gain (loss) | | | $2,579,877 | |
Change in unrealized appreciation or depreciation | | | | |
Unaffiliated issuers (net of $76,380 decrease in deferred country tax) | | | $(10,326,676 | ) |
Affiliated issuers | | | (1 | ) |
Translation of assets and liabilities in foreign currencies | | | 558 | |
Net unrealized gain (loss) | | | $(10,326,119 | ) |
Net realized and unrealized gain (loss) | | | $(7,746,242 | ) |
Change in net assets from operations | | | $(7,469,840 | ) |
See Notes to Financial Statements
11
MFS Emerging Markets Equity Portfolio
FINANCIAL STATEMENTS | STATEMENTS OF CHANGES IN NET ASSETS
These statements describe the increases and/or decreases in net assets resulting from operations, any distributions, and any shareholder transactions.
| | | | | | | | |
| | | Year ended | |
| | | 12/31/18 | | | 12/31/17 | |
Change in net assets | | | | | | | | |
From operations | | | | | | | | |
Net investment income (loss) | | | $276,402 | | | | $150,338 | |
Net realized gain (loss) | | | 2,579,877 | | | | 2,939,088 | |
Net unrealized gain (loss) | | | (10,326,119 | ) | | | 13,593,419 | |
Change in net assets from operations | | | $(7,469,840 | ) | | | $16,682,845 | |
Total distributions to shareholders (a) | | | $(118,016 | ) | | | $(514,014 | ) |
Change in net assets from fund share transactions | | | $(5,242,859 | ) | | | $(5,389,683 | ) |
Total change in net assets | | | $(12,830,715 | ) | | | $10,779,148 | |
Net assets | | | | | | | | |
At beginning of period | | | 57,691,164 | | | | 46,912,016 | |
At end of period (b) | | | $44,860,449 | | | | $57,691,164 | |
| (a) | Distributions from net investment income and from net realized gain are no longer required to be separately disclosed. See Note 2. For the year ended December 31, 2017, distributions from net investment income were $514,014. |
| (b) | Parenthetical disclosure of undistributed net investment income is no longer required. See Note 2. For the year ended December 31, 2017, end of period net assets included undistributed net investment income of $112,554. |
See Notes to Financial Statements
12
MFS Emerging Markets Equity Portfolio
FINANCIAL STATEMENTS | FINANCIAL HIGHLIGHTS
The financial highlights table is intended to help you understand the fund’s financial performance for the past 5 years. Certain information reflects financial results for a single fund share. The total returns in the table represent the rate that an investor would have earned (or lost) on an investment in the fund share class (assuming reinvestment of all distributions) held for the entire period.
| | | | | | | | | | | | | | | | | | | | |
| Initial Class | | Year ended | |
| | | | | |
| | | 12/31/18 | | | 12/31/17 | | | 12/31/16 | | | 12/31/15 | | | 12/31/14 | |
| | | | | |
Net asset value, beginning of period | | | $17.19 | | | | $12.59 | | | | $11.59 | | | | $13.46 | | | | $14.51 | |
| | | | | |
| Income (loss) from investment operations | | | | | | | | | | | | | | | | | | | | |
Net investment income (loss) (d) | | | $0.11 | | | | $0.06 | | | | $0.15 | (c) | | | $0.10 | | | | $0.13 | |
Net realized and unrealized gain (loss) | | | (2.49 | ) | | | 4.71 | | | | 0.93 | | | | (1.84 | ) | | | (1.08 | ) |
Total from investment operations | | | $(2.38 | ) | | | $4.77 | | | | $1.08 | | | | $(1.74 | ) | | | $(0.95 | ) |
| | | | | |
| Less distributions declared to shareholders | | | | | | | | | | | | | | | | | | | | |
From net investment income | | | $(0.06 | ) | | | $(0.17 | ) | | | $(0.08 | ) | | | $(0.13 | ) | | | $(0.10 | ) |
Net asset value, end of period (x) | | | $14.75 | | | | $17.19 | | | | $12.59 | | | | $11.59 | | | | $13.46 | |
Total return (%) (k)(r)(s)(x) | | | (13.89 | ) | | | 37.98 | | | | 9.28 | (c) | | | (12.89 | ) | | | (6.66 | ) |
| | | | | |
Ratios (%) (to average net assets)
and Supplemental data: | | | | | | | | | | | | | | | | | | | | |
Expenses before expense reductions (f) | | | 1.50 | | | | 1.53 | | | | 1.34 | (c) | | | 1.65 | | | | 1.48 | |
Expenses after expense reductions (f) | | | 1.37 | | | | 1.40 | | | | 1.13 | (c) | | | 1.40 | | | | 1.40 | |
Net investment income (loss) | | | 0.65 | | | | 0.41 | | | | 1.29 | (c) | | | 0.74 | | | | 0.89 | |
Portfolio turnover | | | 31 | | | | 27 | | | | 47 | | | | 51 | | | | 49 | |
Net assets at end of period (000 omitted) | | | $20,887 | | | | $28,026 | | | | $22,605 | | | | $25,665 | | | | $33,752 | |
| |
| Service Class | | Year ended | |
| | | | | |
| | | 12/31/18 | | | 12/31/17 | | | 12/31/16 | | | 12/31/15 | | | 12/31/14 | |
| | | | | |
Net asset value, beginning of period | | | $16.94 | | | | $12.41 | | | | $11.42 | | | | $13.24 | | | | $14.29 | |
| | | | | |
| Income (loss) from investment operations | | | | | | | | | | | | | | | | | | | | |
Net investment income (loss) (d) | | | $0.07 | | | | $0.02 | | | | $0.12 | (c) | | | $0.06 | | | | $0.10 | |
Net realized and unrealized gain (loss) | | | (2.46 | ) | | | 4.64 | | | | 0.91 | | | | (1.80 | ) | | | (1.09 | ) |
Total from investment operations | | | $(2.39 | ) | | | $4.66 | | | | $1.03 | | | | $(1.74 | ) | | | $(0.99 | ) |
| | | | | |
| Less distributions declared to shareholders | | | | | | | | | | | | | | | | | | | | |
From net investment income | | | $(0.02 | ) | | | $(0.13 | ) | | | $(0.04 | ) | | | $(0.08 | ) | | | $(0.06 | ) |
Net asset value, end of period (x) | | | $14.53 | | | | $16.94 | | | | $12.41 | | | | $11.42 | | | | $13.24 | |
Total return (%) (k)(r)(s)(x) | | | (14.13 | ) | | | 37.66 | | | | 9.04 | (c) | | | (13.08 | ) | | | (6.99 | ) |
| | | | | |
Ratios (%) (to average net assets)
and Supplemental data: | | | | | | | | | | | | | | | | | | | | |
Expenses before expense reductions (f) | | | 1.75 | | | | 1.78 | | | | 1.58 | (c) | | | 1.90 | | | | 1.73 | |
Expenses after expense reductions (f) | | | 1.62 | | | | 1.65 | | | | 1.37 | (c) | | | 1.65 | | | | 1.65 | |
Net investment income (loss) | | | 0.40 | | | | 0.16 | | | | 1.02 | (c) | | | 0.46 | | | | 0.70 | |
Portfolio turnover | | | 31 | | | | 27 | | | | 47 | | | | 51 | | | | 49 | |
Net assets at end of period (000 omitted) | | | $23,973 | | | | $29,665 | | | | $24,307 | | | | $25,678 | | | | $31,419 | |
See Notes to Financial Statements
13
MFS Emerging Markets Equity Portfolio
Financial Highlights – continued
| (c) | Amount reflects aone-time reimbursement of expenses by the custodian (or former custodian) without which net investment income and performance would be lower and expenses would be higher. |
| (d) | Per share data is based on average shares outstanding. |
| (f) | Ratios do not reflect reductions from fees paid indirectly, if applicable. |
| (k) | The total return does not reflect expenses that apply to separate accounts. Inclusion of these charges would reduce the total return figures for all periods shown. |
| (r) | Certain expenses have been reduced without which performance would have been lower. |
| (s) | From time to time the fund may receive proceeds from litigation settlements, without which performance would be lower. |
| (x) | The net asset values and total returns have been calculated on net assets which include adjustments made in accordance with U.S. generally accepted accounting principles required at period end for financial reporting purposes. |
See Notes to Financial Statements
14
MFS Emerging Markets Equity Portfolio
NOTES TO FINANCIAL STATEMENTS
| (1) | | Business and Organization |
MFS Emerging Markets Equity Portfolio (the fund) is a diversified series of MFS Variable Insurance Trust II (the trust). The trust is organized as a Massachusetts business trust and is registered under the Investment Company Act of 1940, as amended, as anopen-end management investment company. The shareholders of each series of the trust are separate accounts of insurance companies, which offer variable annuity and/or life insurance products, and qualified retirement and pension plans.
The fund is an investment company and accordingly follows the investment company accounting and reporting guidance of the Financial Accounting Standards Board (FASB) Accounting Standards Codification Topic 946 Financial Services – Investment Companies.
| (2) | | Significant Accounting Policies |
General– The preparation of financial statements in conformity with U.S. generally accepted accounting principles requires management to make estimates and assumptions that affect the reported amounts of assets and liabilities, and disclosure of contingent assets and liabilities at the date of the financial statements and the reported amounts of increases and decreases in net assets from operations during the reporting period. Actual results could differ from those estimates. In the preparation of these financial statements, management has evaluated subsequent events occurring after the date of the fund’s Statement of Assets and Liabilities through the date that the financial statements were issued. The fund invests in foreign securities, including securities of emerging market issuers. Investments in foreign securities are vulnerable to the effects of changes in the relative values of the local currency and the U.S. dollar and to the effects of changes in each country’s market, economic, industrial, political, regulatory, geopolitical, and other conditions. Investments in emerging markets can involve additional and greater risks than the risks associated with investments in developed foreign markets. Emerging markets can have less developed markets, greater custody and operational risk, less developed legal, regulatory, and accounting systems, and greater political, social, and economic instability than developed markets.
In August 2018, the FASB issued Accounting Standards Update2018-13, Fair Value Measurement (Topic 820) – Disclosure Framework – Changes to the Disclosure Requirements for Fair Value Measurement (“ASU2018-13”) which introduces new fair value disclosure requirements as well as eliminates and modifies certain existing fair value disclosure requirements. ASU2018-13 would be effective for fiscal years beginning after December 15, 2019, and interim periods within those fiscal years; however, management has elected to early adopt ASU2018-13 effective with the current reporting period. The impact of the fund’s adoption was limited to changes in the fund’s financial statement disclosures regarding fair value, primarily those disclosures related to transfers between levels of the fair value hierarchy.
In August 2018, the Securities and Exchange Commission (SEC) released its Final Rule on Disclosure Update and Simplification (the “Final Rule”) which is intended to simplify an issuer’s disclosure compliance efforts by removing redundant or outdated disclosure requirements without significantly altering the mix of information provided to investors. Effective with the current reporting period, the fund adopted the Final Rule with the impacts being that the fund is no longer required to present the components of distributable earnings on the Statement of Assets and Liabilities or the sources of distributions to shareholders and the amount of undistributed net investment income on the Statements of Changes in Net Assets.
Balance Sheet Offsetting– The fund’s accounting policy with respect to balance sheet offsetting is that, absent an event of default by the counterparty or a termination of the agreement, the International Swaps and Derivatives Association (ISDA) Master Agreement, or similar agreement, does not result in an offset of reported amounts of financial assets and financial liabilities in the Statement of Assets and Liabilities across transactions between the fund and the applicable counterparty. The fund’s right to setoff may be restricted or prohibited by the bankruptcy or insolvency laws of the particular jurisdiction to which a specific master netting agreement counterparty is subject. Balance sheet offsetting disclosures, to the extent applicable to the fund, have been included in the fund’s Significant Accounting Policies note under the captions for each of the fund’sin-scope financial instruments and transactions.
Investment Valuations– Equity securities, including restricted equity securities, are generally valued at the last sale or official closing price on their primary market or exchange as provided by a third-party pricing service. Equity securities, for which there were no sales reported that day, are generally valued at the last quoted daily bid quotation on their primary market or exchange as provided by a third-party pricing service. Short-term instruments with a maturity at issuance of 60 days or less may be valued at amortized cost, which approximates market value.Open-end investment companies are generally valued at net asset value per share. Securities and other assets generally valued on the basis of information from a third-party pricing service may also be valued at a broker/dealer bid quotation. In determining values, third-party pricing services can utilize both transaction data and market information such as yield, quality, coupon rate, maturity, type of issue, trading characteristics, and other market data. The values of foreign securities and other assets and liabilities expressed in foreign currencies are converted to U.S. dollars using the mean of bid and asked prices for rates provided by a third-party pricing service.
15
MFS Emerging Markets Equity Portfolio
Notes to Financial Statements – continued
The Board of Trustees has delegated primary responsibility for determining or causing to be determined the value of the fund’s investments (including any fair valuation) to the adviser pursuant to valuation policies and procedures approved by the Board. If the adviser determines that reliable market quotations are not readily available, investments are valued at fair value as determined in good faith by the adviser in accordance with such procedures under the oversight of the Board of Trustees. Under the fund’s valuation policies and procedures, market quotations are not considered to be readily available for most types of debt instruments and floating rate loans and many types of derivatives. These investments are generally valued at fair value based on information from third-party pricing services. In addition, investments may be valued at fair value if the adviser determines that an investment’s value has been materially affected by events occurring after the close of the exchange or market on which the investment is principally traded (such as foreign exchange or market) and prior to the determination of the fund’s net asset value, or after the halting of trading of a specific security where trading does not resume prior to the close of the exchange or market on which the security is principally traded. Events that occur on a frequent basis after foreign markets close (such as developments in foreign markets and significant movements in the U.S. markets) and prior to the determination of the fund’s net asset value may be deemed to have a material effect on the value of securities traded in foreign markets. Accordingly, the fund’s foreign equity securities may often be valued at fair value. The adviser generally relies on third-party pricing services or other information (such as the correlation with price movements of similar securities in the same or other markets; the type, cost and investment characteristics of the security; the business and financial condition of the issuer; and trading and other market data) to assist in determining whether to fair value and at what value to fair value an investment. The value of an investment for purposes of calculating the fund’s net asset value can differ depending on the source and method used to determine value. When fair valuation is used, the value of an investment used to determine the fund’s net asset value may differ from quoted or published prices for the same investment. There can be no assurance that the fund could obtain the fair value assigned to an investment if it were to sell the investment at the same time at which the fund determines its net asset value per share.
Various inputs are used in determining the value of the fund’s assets or liabilities. These inputs are categorized into three broad levels. In certain cases, the inputs used to measure fair value may fall into different levels of the fair value hierarchy. In such cases, an investment’s level within the fair value hierarchy is based on the lowest level of input that is significant to the fair value measurement. The fund’s assessment of the significance of a particular input to the fair value measurement in its entirety requires judgment, and considers factors specific to the investment. Level 1 includes unadjusted quoted prices in active markets for identical assets or liabilities. Level 2 includes other significant observable market-based inputs (including quoted prices for similar securities, interest rates, prepayment speed, and credit risk). Level 3 includes unobservable inputs, which may include the adviser’s own assumptions in determining the fair value of investments. The following is a summary of the levels used as of December 31, 2018 in valuing the fund’s assets or liabilities:
| | | | | | | | | | | | | | | | |
| Financial Instruments | | Level 1 | | | Level 2 | | | Level 3 | | | Total | |
| Equity Securities: | | | | | | | | | | | | | | | | |
China | | | $10,046,354 | | | | $— | | | | $— | | | | $10,046,354 | |
South Korea | | | 982,928 | | | | 3,946,678 | | | | — | | | | 4,929,606 | |
Brazil | | | 3,966,816 | | | | 337,079 | | | | — | | | | 4,303,895 | |
India | | | 4,005,317 | | | | 37,792 | | | | — | | | | 4,043,109 | |
Hong Kong | | | 3,367,444 | | | | — | | | | — | | | | 3,367,444 | |
Taiwan | | | 3,353,911 | | | | — | | | | — | | | | 3,353,911 | |
South Africa | | | 2,355,887 | | | | — | | | | — | | | | 2,355,887 | |
Indonesia | | | 1,639,420 | | | | 506,114 | | | | — | | | | 2,145,534 | |
Mexico | | | 1,945,632 | | | | — | | | | — | | | | 1,945,632 | |
Other Countries | | | 6,773,500 | | | | 1,339,873 | | | | — | | | | 8,113,373 | |
| Mutual Funds | | | 411,837 | | | | — | | | | — | | | | 411,837 | |
| Total | | | $38,849,046 | | | | $6,167,536 | | | | $— | | | | $45,016,582 | |
For further information regarding security characteristics, see the Portfolio of Investments.
Foreign Currency Translation– Purchases and sales of foreign investments, income, and expenses are converted into U.S. dollars based upon currency exchange rates prevailing on the respective dates of such transactions or on the reporting date for foreign denominated receivables and payables. Gains and losses attributable to foreign currency exchange rates on sales of securities are recorded for financial statement purposes as net realized gains and losses on investments. Gains and losses attributable to foreign exchange rate movements on receivables, payables, income and expenses are recorded for financial statement purposes as foreign currency transaction gains and losses. That portion of both realized and unrealized gains and losses on investments that results from fluctuations in foreign currency exchange rates is not separately disclosed.
Security Loans– Under its Securities Lending Agency Agreement with the fund, State Street Bank and Trust Company, as lending agent, loans the securities of the fund to certain qualified institutions (the “Borrowers”) approved by the fund. Security loans can be terminated at the discretion of either the lending agent or the fund and the related securities must be returned within the earlier of
16
MFS Emerging Markets Equity Portfolio
Notes to Financial Statements – continued
the standard trade settlement period for such securities or within three business days. The loans are collateralized by cash and/or U.S. Treasury and federal agency obligations in an amount typically at least equal to the market value of the securities loaned. On loans collateralized by cash, the cash collateral is invested in a money market fund. The market value of the loaned securities is determined at the close of business of the fund and any additional required collateral is delivered to the fund on the next business day. The lending agent provides the fund with indemnification against Borrower default. In the event of Borrower default, the lending agent will, for the benefit of the fund, either purchase securities identical to those loaned or, when such purchase is commercially impracticable, pay the fund the market value of the loaned securities. In return, the lending agent assumes the fund’s rights to the related collateral. If the collateral value is less than the cost to purchase identical securities, the lending agent is responsible for the shortfall, but only to the extent that such shortfall is not due to a decline in collateral value resulting from collateral reinvestment for which the fund bears the risk of loss. At period end, the fund had investment securities on loan, all of which were classified as equity securities in the fund’s Portfolio of Investments, with a fair value of $45,632. The fair value of the fund’s investment securities on loan and a related liability of $47,722 for cash collateral received on securities loaned are both presented gross in the Statement of Assets and Liabilities. The collateral on securities loaned exceeded the value of securities on loan at period end. The liability for cash collateral for securities loaned is carried at fair value, which is categorized as level 2 within the fair value hierarchy. A portion of the income generated upon investment of the collateral is remitted to the Borrowers, and the remainder is allocated between the fund and the lending agent. On loans collateralized by U.S. Treasury and/or federal agency obligations, a fee is received from the Borrower, and is allocated between the fund and the lending agent. Income from securities lending is separately reported in the Statement of Operations. The dividend and interest income earned on the securities loaned is accounted for in the same manner as other dividend and interest income.
Indemnifications– Under the fund’s organizational documents, its officers and Trustees may be indemnified against certain liabilities and expenses arising out of the performance of their duties to the fund. Additionally, in the normal course of business, the fund enters into agreements with service providers that may contain indemnification clauses. The fund’s maximum exposure under these agreements is unknown as this would involve future claims that may be made against the fund that have not yet occurred.
Investment Transactions and Income– Investment transactions are recorded on the trade date. Interest income is recorded on the accrual basis. Dividends received in cash are recorded on theex-dividend date. Certain dividends from foreign securities will be recorded when the fund is informed of the dividend if such information is obtained subsequent to theex-dividend date. Dividend and interest payments received in additional securities are recorded on theex-dividend orex-interest date in an amount equal to the value of the security on such date.
The fund may receive proceeds from litigation settlements. Any proceeds received from litigation involving portfolio holdings are reflected in the Statement of Operations in realized gain/loss if the security has been disposed of by the fund or in unrealized gain/loss if the security is still held by the fund. Any other proceeds from litigation not related to portfolio holdings are reflected as other income in the Statement of Operations.
Tax Matters and Distributions– The fund intends to qualify as a regulated investment company, as defined under Subchapter M of the Internal Revenue Code, and to distribute all of its taxable income, including realized capital gains. As a result, no provision for federal income tax is required. The fund’s federal tax returns, when filed, will remain subject to examination by the Internal Revenue Service for a three year period. Management has analyzed the fund’s tax positions taken on federal and state tax returns for all open tax years and does not believe that there are any uncertain tax positions that require recognition of a tax liability. Foreign taxes, if any, have been accrued by the fund in the accompanying financial statements in accordance with the applicable foreign tax law. Foreign income taxes may be withheld by certain countries in which the fund invests. Additionally, capital gains realized by the fund on securities issued in or by certain foreign countries may be subject to capital gains tax imposed by those countries.
Distributions to shareholders are recorded on theex-dividend date. Income and capital gain distributions are determined in accordance with income tax regulations, which may differ from U.S. generally accepted accounting principles. Certain capital accounts in the financial statements are periodically adjusted for permanent differences in order to reflect their tax character. These adjustments have no impact on net assets or net asset value per share. Temporary differences which arise from recognizing certain items of income, expense, gain or loss in different periods for financial statement and tax purposes will reverse at some time in the future. Distributions in excess of net investment income or net realized gains are temporary overdistributions for financial statement purposes resulting from differences in the recognition or classification of income or distributions for financial statement and tax purposes.
Book/tax differences primarily relate to wash sale loss deferrals and foreign taxes.
The tax character of distributions declared to shareholders for the last two fiscal years is as follows:
| | | | | | | | |
| | | Year ended
12/31/18 | | | Year ended
12/31/17 | |
| Ordinary income (including any short-term capital gains) | | | $118,016 | | | | $514,014 | |
17
MFS Emerging Markets Equity Portfolio
Notes to Financial Statements – continued
The federal tax cost and the tax basis components of distributable earnings were as follows:
| | | | |
| As of 12/31/18 | | | | |
| |
| Cost of investments | | | $36,968,885 | |
| Gross appreciation | | | 11,001,173 | |
| Gross depreciation | | | (2,953,476 | ) |
| Net unrealized appreciation (depreciation) | | | $8,047,697 | |
| |
| Undistributed ordinary income | | | 230,717 | |
| Undistributed long-term capital gain | | | 1,420,887 | |
| Other temporary differences | | | (23,490 | ) |
Multiple Classes of Shares of Beneficial Interest– The fund offers multiple classes of shares, which differ in their respective distribution and/or service fees. The fund’s income, realized and unrealized gain (loss), and common expenses are allocated to shareholders based on the daily net assets of each class. Dividends are declared separately for each class. Differences in per share dividend rates are generally due to differences in separate class expenses. The fund’s distributions declared to shareholders as reported in the Statements of Changes in Net Assets are presented by class as follows:
| | | | | | | | |
| | | From net investment
income | |
| | |
| | | Year ended
12/31/18 | | | Year ended
12/31/17 | |
| Initial Class | | | $87,265 | | | | $275,094 | |
| Service Class | | | 30,751 | | | | 238,920 | |
| Total | | | $118,016 | | | | $514,014 | |
| (3) | | Transactions with Affiliates |
Investment Adviser– The fund has an investment advisory agreement with MFS to provide overall investment management and related administrative services and facilities to the fund. The management fee is computed daily and paid monthly at the following annual rates based on the fund’s average daily net assets:
| | | | |
| Up to $500 million | | | 1.05% | |
| In excess of $500 million | | | 1.00% | |
MFS has agreed in writing to reduce its management fee by a specified amount if certain MFS mutual fund assets exceed thresholds agreed to by MFS and the fund’s Board of Trustees. For the year ended December 31, 2018, this management fee reduction amounted to $5,085, which is included in the reduction of total expenses in the Statement of Operations. The management fee incurred for the year ended December 31, 2018 was equivalent to an annual effective rate of 1.04% of the fund’s average daily net assets.
For the period from January 1, 2018 through July 31, 2018, the investment adviser had agreed in writing to pay a portion of the fund’s total annual operating expenses, excluding interest, taxes, extraordinary expenses, brokerage and transaction costs, and investment-related expenses, such that total annual operating expenses did not exceed 1.40% of average daily net assets for the Initial Class shares and 1.65% of average daily net assets for the Service Class shares. This written agreement terminated on July 31, 2018. For the period from January 1, 2018 through July 31, 2018, this reduction amounted to $6,399, which is included in the reduction of total expenses in the Statement of Operations. Effective August 1, 2018, the investment adviser has agreed in writing to pay a portion of the fund’s total annual operating expenses, excluding interest, taxes, extraordinary expenses, brokerage and transaction costs, and investment-related expenses, such that total annual operating expenses do not exceed 1.33% of average daily net assets for the Initial Class shares and 1.58% of average daily net assets for the Service Class shares. This written agreement will continue until modified by the fund’s Board of Trustees, but such agreement will continue at least until April 30, 2020. For the period from August 1, 2018 through December 31, 2018, this reduction amounted to $57,354, which is included in the reduction of total expenses in the Statement of Operations.
Distributor– MFS Fund Distributors, Inc. (MFD), a wholly-owned subsidiary of MFS, is the distributor of shares of the fund. The Trustees have adopted a distribution plan for the Service Class shares pursuant to Rule12b-1 under the Investment Company Act of 1940.
The fund’s distribution plan provides that the fund will pay MFD distribution and/or service fees equal to 0.25% per annum of its average daily net assets attributable to Service Class shares as partial consideration for services performed and expenses incurred by MFD and financial intermediaries (including participating insurance companies that invest in the fund to fund variable annuity and variable life insurance contracts, sponsors of qualified retirement and pension plans that invest in the fund, and affiliates of these participating insurance companies and plan sponsors) in connection with the sale and distribution of the Service Class shares. MFD may subsequently pay all, or a portion, of the distribution and/or service fees to financial intermediaries.
18
MFS Emerging Markets Equity Portfolio
Notes to Financial Statements – continued
Shareholder Servicing Agent– MFS Service Center, Inc. (MFSC), a wholly-owned subsidiary of MFS, receives a fee from the fund for its services as shareholder servicing agent. For the year ended December 31, 2018, the fee was $5,819, which equated to 0.0109% annually of the fund’s average daily net assets. MFSC also receives payment from the fund forout-of-pocket expenses paid by MFSC on behalf of the fund. For the year ended December 31, 2018, these costs amounted to $271.
Administrator– MFS provides certain financial, legal, shareholder communications, compliance, and other administrative services to the fund. Under an administrative services agreement, the fund reimburses MFS the costs incurred to provide these services. The fund is charged an annual fixed amount of $17,500 plus a fee based on average daily net assets. The administrative services fee incurred for the year ended December 31, 2018 was equivalent to an annual effective rate of 0.0339% of the fund’s average daily net assets.
Trustees’ and Officers’ Compensation – The fund pays compensation to independent Trustees in the form of a retainer, attendance fees, and additional compensation to Board and Committee chairpersons. The fund does not pay compensation directly to Trustees or officers of the fund who are also officers of the investment adviser, all of whom receive remuneration for their services to the fund from MFS. Certain officers and Trustees of the fund are officers or directors of MFS, MFD, and MFSC.
Other – This fund and certain other funds managed by MFS (the funds) have entered into a service agreement (the ISO Agreement) which provides for payment of fees solely by the funds to Tarantino LLC in return for the provision of services of an Independent Senior Officer (ISO) for the funds. Frank L. Tarantino serves as the ISO and is an officer of the funds and the sole member of Tarantino LLC. The funds can terminate the ISO Agreement with Tarantino LLC at any time under the terms of the ISO Agreement. For the year ended December 31, 2018, the fee paid by the fund under this agreement was $92 and is included in “Miscellaneous” expense in the Statement of Operations. MFS has agreed to bear all expenses associated with office space, other administrative support, and supplies provided to the ISO.
The fund invests in the MFS Institutional Money Market Portfolio which is managed by MFS and seeks current income consistent with preservation of capital and liquidity. This money market fund does not pay a management fee to MFS.
The fund is permitted to engage in purchase and sale transactions with funds and accounts for which MFS serves as investment adviser orsub-adviser (“cross-trades”) pursuant to a policy adopted by the Board of Trustees. This policy has been designed to ensure that cross-trades conducted by the fund comply with Rule17a-7 under the Investment Company Act of 1940. During the year ended December 31, 2018, the fund engaged in purchase and sale transactions pursuant to this policy, which amounted to $33,674 and $62,507, respectively. The sales transactions resulted in net realized gains (losses) of $(1,766).
Effective on or about January 3, 2018, the adviser has voluntarily undertaken to reimburse the fund from its own resources on a quarterly basis for the cost of investment research embedded in the cost of the fund’s securities trades. This agreement may be rescinded at any time. For the period on or about January 3, 2018 to December 31, 2018, this reimbursement amounted to $7,869, which is included in “Other” income in the Statement of Operations.
For the year ended December 31, 2018, purchases and sales of investments, other than short-term obligations, aggregated $16,393,244 and $21,413,460, respectively.
| (5) | | Shares of Beneficial Interest |
The fund’s Declaration of Trust permits the Trustees to issue an unlimited number of full and fractional shares of beneficial interest. Transactions in fund shares were as follows:
| | | | | | | | | | | | | | | | |
| | | Year ended 12/31/18 | | | Year ended 12/31/17 | |
| | | | |
| | | Shares | | | Amount | | | Shares | | | Amount | |
| Shares sold | | | | | | | | | | | | | | | | |
Initial Class | | | 59,189 | | | | $1,002,780 | | | | 143,495 | | | | $2,218,204 | |
Service Class | | | 398,376 | | | | 6,530,385 | | | | 310,949 | | | | 4,666,469 | |
| | | 457,565 | | | | $7,533,165 | | | | 454,444 | | | | $6,884,673 | |
| | | | |
| Shares issued to shareholders in reinvestment of distributions | | | | | | | | | | | | | | | | |
Initial Class | | | 5,241 | | | | $87,265 | | | | 17,302 | | | | $275,094 | |
Service Class | | | 1,874 | | | | 30,751 | | | | 15,237 | | | | 238,920 | |
| | | 7,115 | | | | $118,016 | | | | 32,539 | | | | $514,014 | |
| | | | |
| Shares reacquired | | | | | | | | | | | | | | | | |
Initial Class | | | (278,563 | ) | | | $(4,678,515 | ) | | | (325,734 | ) | | | $(4,881,282 | ) |
Service Class | | | (501,945 | ) | | | (8,215,525 | ) | | | (533,229 | ) | | | (7,907,088 | ) |
| | | (780,508 | ) | | | $(12,894,040 | ) | | | (858,963 | ) | | | $(12,788,370 | ) |
19
MFS Emerging Markets Equity Portfolio
Notes to Financial Statements – continued
| | | | | | | | | | | | | | | | |
| | | Year ended 12/31/18 | | | Year ended 12/31/17 | |
| | | | |
| | | Shares | | | Amount | | | Shares | | | Amount | |
| Net change | | | | | | | | | | | | | | | | |
Initial Class | | | (214,133 | ) | | | $(3,588,470 | ) | | | (164,937 | ) | | | $(2,387,984 | ) |
Service Class | | | (101,695 | ) | | | (1,654,389 | ) | | | (207,043 | ) | | | (3,001,699 | ) |
| | | (315,828 | ) | | | $(5,242,859 | ) | | | (371,980 | ) | | | $(5,389,683 | ) |
The fund is one of several mutual funds in which certain MFS funds may invest. The MFS funds do not invest in the underlying funds for the purpose of exercising management or control. At the end of the period, the MFS Growth Allocation Portfolio was the owner of record of approximately 8% of the value of outstanding voting shares of the fund.
The fund and certain other funds managed by MFS participate in a $1.25 billion unsecured committed line of credit, subject to a $1 billion sublimit, provided by a syndication of banks under a credit agreement. Borrowings may be made for temporary financing needs. Interest is charged to each fund, based on its borrowings, generally at a rate equal to the higher of the Overnight Bank Funding rate or daily one month LIBOR plus an agreed upon spread. A commitment fee, based on the average daily, unused portion of the committed line of credit, is allocated among the participating funds. In addition, the fund and other funds managed by MFS have established unsecured uncommitted borrowing arrangements with certain banks for temporary financing needs. Interest is charged to each fund, based on its borrowings, at a rate equal to the Overnight Bank Funding rate plus an agreed upon spread. For the year ended December 31, 2018, the fund’s commitment fee and interest expense were $316 and $0, respectively, and are included in “Miscellaneous” expense in the Statement of Operations.
| (7) | | Investments in Affiliated Issuers |
An affiliated issuer may be considered one in which the fund owns 5% or more of the outstanding voting securities, or a company which is under common control. For the purposes of this report, the fund assumes the following to be affiliated issuers:
| | | | | | | | | | | | | | | | | | |
| Affiliated Issuers | | | | Beginning
Shares/Par
Amount | | | Acquisitions
Shares/Par
Amount | | | Dispositions
Shares/Par
Amount | | | Ending
Shares/Par
Amount | |
| | | | | |
| MFS Institutional Money Market Portfolio | | | | | 439,940 | | | | 13,716,922 | | | | (13,792,710 | ) | | | 364,152 | |
| | | | | |
| Affiliated Issuers | | Realized
Gain (Loss) | | Change in
Unrealized
Appreciation/
Depreciation | | | Capital Gain
Distributions | | | Dividend
Income | | | Ending
Value | |
| | | | | |
| MFS Institutional Money Market Portfolio | | $25 | | | $(1 | ) | | | $— | | | | $10,580 | | | | $364,115 | |
20
MFS Emerging Markets Equity Portfolio
REPORT OF INDEPENDENT REGISTERED PUBLIC ACCOUNTING FIRM
To the Board of Trustees of MFS Variable Insurance Trust II and the Shareholders of
MFS Emerging Markets Equity Portfolio:
Opinion on the Financial Statements and Financial Highlights
We have audited the accompanying statement of assets and liabilities of MFS Emerging Markets Equity Portfolio (the “Fund”), including the portfolio of investments, as of December 31, 2018, the related statement of operations for the year then ended, the statements of changes in net assets for each of the two years in the period then ended, the financial highlights for each of the five years in the period then ended, and the related notes. In our opinion, the financial statements and financial highlights present fairly, in all material respects, the financial position of the Fund as of December 31, 2018, and the results of its operations for the year then ended, the changes in its net assets for each of the two years in the period then ended, and the financial highlights for each of the five years in the period then ended, in conformity with accounting principles generally accepted in the United States of America.
Basis for Opinion
These financial statements and financial highlights are the responsibility of the Fund’s management. Our responsibility is to express an opinion on the Fund’s financial statements and financial highlights based on our audits. We are a public accounting firm registered with the Public Company Accounting Oversight Board (United States) (PCAOB) and are required to be independent with respect to the Fund in accordance with the U.S. federal securities laws and the applicable rules and regulations of the Securities and Exchange Commission and the PCAOB.
We conducted our audits in accordance with the standards of the PCAOB. Those standards require that we plan and perform the audit to obtain reasonable assurance about whether the financial statements and financial highlights are free of material misstatement, whether due to error or fraud. The Fund is not required to have, nor were we engaged to perform, an audit of its internal control over financial reporting. As part of our audits we are required to obtain an understanding of internal control over financial reporting but not for the purpose of expressing an opinion on the effectiveness of the Fund’s internal control over financial reporting. Accordingly, we express no such opinion.
Our audits included performing procedures to assess the risks of material misstatement of the financial statements and financial highlights, whether due to error or fraud, and performing procedures that respond to those risks. Such procedures included examining, on a test basis, evidence regarding the amounts and disclosures in the financial statements and financial highlights. Our audits also included evaluating the accounting principles used and significant estimates made by management, as well as evaluating the overall presentation of the financial statements and financial highlights. Our procedures included confirmation of securities owned as of December 31, 2018, by correspondence with the custodian and brokers; when replies were not received from brokers, we performed other auditing procedures. We believe that our audits provide a reasonable basis for our opinion.
DELOITTE & TOUCHE LLP
Boston, Massachusetts
February 15, 2019
We have served as the auditor of one or more of the MFS investment companies since 1924.
21
MFS Emerging Markets Equity Portfolio
TRUSTEES AND OFFICERS – IDENTIFICATION AND BACKGROUND
The Trustees and Officers of the Trust, as of February 1, 2019, are listed below, together with their principal occupations during the past five years. (Their titles may have varied during that period.) The address of each Trustee and Officer is 111 Huntington Avenue, Boston, Massachusetts 02199-7618.
| | | | | | | | | | |
Name, Age | | Position(s)
Held with Fund | | Trustee/Officer
Since (h) | | Number of MFS Funds overseen by the Trustee | | Principal Occupations
During the Past Five Years | | Other Directorships During the Past Five Years (j) |
| INTERESTED TRUSTEES |
Robert J. Manning (k) (age 55) | | Trustee | | February 2004 | | 135 | | Massachusetts Financial Services Company, Executive Chairman (since January 2017); Director; Chairman of the Board; Chief Executive Officer (until 2015);Co-Chief Executive Officer(2015-2016) | | N/A |
| | | | | |
Robin A. Stelmach (k) (age 57) | | Trustee | | January 2014 | | 135 | | Massachusetts Financial Services Company, Vice Chair (since January 2017); Chief Operating Officer and Executive Vice President (until January 2017) | | N/A |
|
| INDEPENDENT TRUSTEES |
John P. Kavanaugh (age 64) | | Trustee and Chair of Trustees | | January 2009 | | 135 | | Private investor | | N/A |
| | | | | |
Steven E. Buller (age 67) | | Trustee | | February 2014 | | 135 | | Financial Accounting Standards Advisory Council, Chairman(2014-2015); Public Company Accounting Oversight Board, Standing Advisory Group, Member (until 2014); BlackRock, Inc. (investment management), Managing Director (until 2014), BlackRock Finco UK (investment management), Director (until 2014) | | N/A |
| | | | | |
John A. Caroselli (age 64) | | Trustee | | March 2017 | | 135 | | JC Global Advisors, LLC (management consulting), President (since 2015); First Capital Corporation (commercial finance), Executive Vice President (until 2015) | | N/A |
| | | | | |
Maureen R. Goldfarb (age 63) | | Trustee | | January 2009 | | 135 | | Private investor | | N/A |
| | | | | |
Michael Hegarty (age 74) | | Trustee | | December 2004 | | 135 | | Private investor | | Rouse Properties Inc., Director (until 2016); Capmark Financial Group Inc., Director (until 2015) |
| | | | | |
Peter D. Jones (age 63) | | Trustee | | January 2019 | | 135 | | Franklin Templeton Distributors, Inc. (investment management), President (until 2015); Franklin Templeton Institutional, LLC (investment management), Chairman (until 2015) | | N/A |
| | | | | |
James W. Kilman, Jr. (age 57) | | Trustee | | January 2019 | | 135 | | KielStrand Capital LLC (family office and merchant bank), Chief Executive Officer (since 2016); Morgan Stanley & Co. (financial services), Vice Chairman of Investment Banking,Co-Head of Diversified Financials Coverage – Financial Institutions Investment Banking Group (until 2016) | | alpha-En Corporation, Director (since 2016) |
22
MFS Emerging Markets Equity Portfolio
Trustees and Officers – continued
| | | | | | | | | | |
Name, Age | | Position(s)
Held with Fund | | Trustee/Officer
Since (h) | | Number of MFS Funds overseen by the Trustee | | Principal Occupations
During the Past Five Years | | Other Directorships During the Past Five Years (j) |
Clarence Otis, Jr. (age 62) | | Trustee | | March 2017 | | 135 | | Darden Restaurants, Inc., Chief Executive Officer (until 2014) | | VF Corporation, Director; Verizon Communications, Inc., Director; The Travelers Companies, Director; Federal Reserve Bank of Atlanta, Director (until 2015) |
| | | | | |
Maryanne L. Roepke (age 62) | | Trustee | | May 2014 | | 135 | | American Century Investments (investment management), Senior Vice President and Chief Compliance Officer (until 2014) | | N/A |
| | | | | |
Laurie J. Thomsen
(age 61) | | Trustee | | March 2005 | | 135 | | Private investor | | The Travelers Companies, Director; Dycom Industries, Inc., Director (since 2015) |
| | | | | | | | |
Name, Age | | Position(s)
Held with Fund | | Trustee/Officer
Since (h) | | Number of MFS Funds for which the Person is an Officer | | Principal Occupations During the Past Five Years |
| OFFICERS | | | | | | |
Christopher R. Bohane (k)
(age 45) | | Assistant Secretary and Assistant Clerk | | July 2005 | | 135 | | Massachusetts Financial Services Company, Vice President and Assistant General Counsel |
| | | | |
Kino Clark (k) (age 50) | | Assistant Treasurer | | January 2012 | | 135 | | Massachusetts Financial Services Company, Vice President |
| | | | |
John W. Clark, Jr. (k) (age 51) | | Assistant Treasurer | | April 2017 | | 135 | | Massachusetts Financial Services Company, Vice President (since March 2017); Deutsche Bank (financial services), Department Head – Treasurer’s Office (until February 2017) |
| | | | |
Thomas H. Connors (k) (age 59) | | Assistant Secretary and Assistant Clerk | | September 2012 | | 135 | | Massachusetts Financial Services Company, Vice President and Senior Counsel |
| | | | |
Ethan D. Corey (k)
(age 55) | | Assistant
Secretary and Assistant Clerk | | July 2005 | | 135 | | Massachusetts Financial Services Company, Senior Vice President and Associate General Counsel |
| | | | |
David L. DiLorenzo (k)
(age 50) | | President | | July 2005 | | 135 | | Massachusetts Financial Services Company, Senior Vice President |
| | | | |
Heidi W. Hardin (k) (age 51) | | Secretary and Clerk | | April 2017 | | 135 | | Massachusetts Financial Services Company, Executive Vice President and General Counsel (since March 2017); Harris Associates (investment management), General Counsel (from September 2015 to January 2017); Janus Capital Management LLC (investment management), Senior Vice President and General Counsel (until September 2015) |
| | | | |
Brian E. Langenfeld (k) (age 45) | | Assistant
Secretary and Assistant Clerk | | June 2006 | | 135 | | Massachusetts Financial Services Company, Vice President and Senior Counsel |
| | | | |
Amanda S. Mooradian (k) (age 39) | | Assistant
Secretary and Assistant Clerk | | September 2018 | | 135 | | Massachusetts Financial Services Company, Assistant Vice President and Counsel |
| | | | |
Susan A. Pereira (k)
(age 48) | | Assistant
Secretary and Assistant Clerk | | July 2005 | | 135 | | Massachusetts Financial Services Company, Vice President and Senior Counsel |
| | | | |
Kasey L. Phillips (k) (age 48) | | Assistant Treasurer | | September 2012 | | 135 | | Massachusetts Financial Services Company, Vice President |
| | | | |
Matthew A. Stowe (k) (age 44) | | Assistant Secretary and Assistant Clerk | | October 2014 | | 135 | | Massachusetts Financial Services Company, Vice President and Assistant General Counsel |
23
MFS Emerging Markets Equity Portfolio
Trustees and Officers – continued
| | | | | | | | |
Name, Age | | Position(s)
Held with Fund | | Trustee/Officer
Since (h) | | Number of MFS Funds for which the Person is an Officer | | Principal Occupations During the Past Five Years |
Frank L. Tarantino
(age 74) | | Independent
Senior Officer | | June 2004 | | 135 | | Tarantino LLC (provider of compliance services), Principal |
| | | | |
Richard S. Weitzel (k)
(age 48) | | Assistant Secretary and Assistant Clerk | | October 2007 | | 135 | | Massachusetts Financial Services Company, Senior Vice President and Associate General Counsel |
| | | | |
Martin J. Wolin (k) (age 51) | | Chief Compliance Officer | | July 2015 | | 135 | | Massachusetts Financial Services Company, Senior Vice President and Chief Compliance Officer (since July 2015); Mercer (financial service provider), Chief Risk and Compliance Officer, North America and Latin America (until June 2015) |
| | | | |
James O. Yost (k)
(age 58) | | Treasurer | | September 1990 | | 135 | | Massachusetts Financial Services Company, Senior Vice President |
| (h) | Date first appointed to serve as Trustee/officer of an MFS Fund. Each Trustee has served continuously since appointment unless indicated otherwise. For the period from December 15, 2004 until February 22, 2005, Mr. Manning served as Advisory Trustee. From January 2012 through December 2016, Messrs. DiLorenzo and Yost served as Treasurer and Deputy Treasurer of the Funds, respectively. |
| (j) | Directorships or trusteeships of companies required to report to the Securities and Exchange Commission (i.e., “public companies”). |
| (k) | “Interested person” of the Trust within the meaning of the Investment Company Act of 1940 (referred to as the 1940 Act), which is the principal federal law governing investment companies like the fund, as a result of a position with MFS. The address of MFS is 111 Huntington Avenue, Boston, Massachusetts 02199-7618. |
Each Trustee has been elected by shareholders and each Trustee and officer holds office until his or her successor is chosen and qualified or until his or her earlier death, resignation, retirement or removal. The Trust does not hold annual meetings for the purpose of electing Trustees, and Trustees are not elected for fixed terms. Under the terms of the Board’s retirement policy, an Independent Trustee shall retire at the end of the calendar year in which he or she reaches the earlier of 75 years of age or 15 years of service on the Board (or, in the case of any Independent Trustee who joined the Board prior to 2015, 20 years of service on the Board).
Messrs. Buller, Hegarty, Kilman and Otis and Ms. Roepke are members of the Trust’s Audit Committee.
Each of the Interested Trustees and certain Officers hold comparable officer positions with certain affiliates of MFS.
The Statement of Additional Information for a Fund includes further information about the Trustees and is available without charge upon request by calling1-800-225-2606.
| | |
Investment Adviser Massachusetts Financial Services Company 111 Huntington Avenue Boston, MA 02199-7618 | | Custodian State Street Bank and Trust Company 1 Lincoln Street Boston, MA 02111-2900 |
Distributor MFS Fund Distributors, Inc. 111 Huntington Avenue Boston, MA 02199-7618 | | Independent Registered Public Accounting Firm Deloitte & Touche LLP 200 Berkeley Street Boston, MA 02116 |
Portfolio Manager(s) Jose Luis Garcia Robert Lau Harry Purcell | | |
24
MFS Emerging Markets Equity Portfolio
BOARD REVIEW OF INVESTMENT ADVISORY AGREEMENT
The Investment Company Act of 1940 requires that both the full Board of Trustees and a majority of thenon-interested (“independent”) Trustees, voting separately, annually approve the continuation of the Fund’s investment advisory agreement with MFS. The Trustees consider matters bearing on the Fund and its advisory arrangements at their meetings throughout the year, including a review of performance data at each regular meeting. In addition, the independent Trustees met several times over the course of three months beginning in May and ending in July, 2018 (“contract review meetings”) for the specific purpose of considering whether to approve the continuation of the investment advisory agreement for the Fund and the other investment companies that the Board oversees (the “MFS Funds”). The independent Trustees were assisted in their evaluation of the Fund’s investment advisory agreement by independent legal counsel, from whom they received separate legal advice and with whom they met separately from MFS during various contract review meetings. The independent Trustees were also assisted in this process by the MFS Funds’ Independent Senior Officer, a senior officer appointed by and reporting to the independent Trustees.
In connection with their deliberations regarding the continuation of the investment advisory agreement, the Trustees, including the independent Trustees, considered such information and factors as they believed, in light of the legal advice furnished to them and their own business judgment, to be relevant. The investment advisory agreement for the Fund was considered separately, although the Trustees also took into account the common interests of all MFS Funds in their review. As described below, the Trustees considered the nature, quality, and extent of the various investment advisory, administrative, and shareholder services performed by MFS under the existing investment advisory agreement and other arrangements with the Fund.
In connection with their contract review meetings, the Trustees received and relied upon materials that included, among other items: (i) information provided by Broadridge Financial Solutions, Inc. (“Broadridge”), an independent third party, on the investment performance of the Fund for various time periods ended December 31, 2017 and the investment performance of a group of funds with substantially similar investment classifications/objectives (the “Broadridge performance universe”), (ii) information provided by Broadridge on the Fund’s advisory fees and other expenses and the advisory fees and other expenses of comparable funds identified by Broadridge (the “Broadridge expense group”), (iii) information provided by MFS on the advisory fees of portfolios of other clients of MFS, including institutional separate accounts and other clients, (iv) information as to whether and to what extent applicable expense waivers, reimbursements or fee “breakpoints” are observed for the Fund, (v) information regarding MFS’ financial results and financial condition, including MFS’ and certain of its affiliates’ estimated profitability from services performed for the Fund and the MFS Funds as a whole, and compared to MFS’ institutional business, (vi) MFS’ views regarding the outlook for the mutual fund industry and the strategic business plans of MFS, (vii) descriptions of various functions performed by MFS for the Funds, such as compliance monitoring and portfolio trading practices, and (viii) information regarding the overall organization of MFS, including information about MFS’ senior management and other personnel providing investment advisory, administrative and other services to the Fund and the other MFS Funds. The comparative performance, fee and expense information prepared and provided by Broadridge was not independently verified and the independent Trustees did not independently verify any information provided to them by MFS.
The Trustees’ conclusion as to the continuation of the investment advisory agreement was based on a comprehensive consideration of all information provided to the Trustees and not the result of any single factor. Some of the factors that figured particularly in the Trustees’ deliberations are described below, although individual Trustees may have evaluated the information presented differently from one another, giving different weights to various factors. It is also important to recognize that the fee arrangements for the Fund and other MFS Funds are the result of years of review and discussion between the independent Trustees and MFS, that certain aspects of such arrangements may receive greater scrutiny in some years than in others, and that the Trustees’ conclusions may be based, in part, on their consideration of these same arrangements during the course of the year and in prior years.
Based on information provided by Broadridge and MFS, the Trustees reviewed the Fund’s total return investment performance as well as the Broadridge performance universe over various time periods. The Trustees placed particular emphasis on the total return performance of the Fund’s Initial Class shares in comparison to the performance of funds in its Broadridge performance universe over the three-year period ended December 31, 2017, which the Trustees believed was a long enough period to reflect differing market conditions. The total return performance of the Fund’s Initial Class shares was in the 3rd quintile relative to the other funds in the universe for this three-year period (the 1st quintile being the best performers and the 5th quintile being the worst performers). The total return performance of the Fund’s Initial Class shares was in the 3rd quintile for theone-year period and the 4th quintile for the five-year period ended December 31, 2017 relative to the Broadridge performance universe. Because of the passage of time, these performance results may differ from the performance results for more recent periods, including those shown elsewhere in this report.
In the course of their deliberations, the Trustees took into account information provided by MFS in connection with the contract review meetings, as well as during investment review meetings conducted with portfolio management personnel during the course of the year regarding the Fund’s performance. After reviewing these and related factors, the Trustees concluded, within the context of their overall conclusions regarding the investment advisory agreement, that they were satisfied with MFS’ responses and efforts relating to investment performance.
25
MFS Emerging Markets Equity Portfolio
Board Review of Investment Advisory Agreement – continued
In assessing the reasonableness of the Fund’s advisory fee, the Trustees considered, among other information, the Fund’s advisory fee and the total expense ratio of the Fund’s Initial Class shares as a percentage of average daily net assets and the advisory fee and total expense ratios of peer groups of funds based on information provided by Broadridge. The Trustees considered that MFS currently observes an expense limitation for the Fund, which may not be changed without the Trustees’ approval. The Trustees also considered that, according to the data provided by Broadridge (which takes into account any fee reductions or expense limitations that were in effect during the Fund’s last fiscal year), the Fund’s effective advisory fee rate was approximately at the Broadridge expense group median and the Fund’s total expense ratio was higher than the Broadridge expense group median. The Trustees also noted that MFS has agreed to further reduce such expense limitation for the Fund effective August 1, 2018, which may not be changed without the Trustees’ approval.
The Trustees also considered the advisory fees charged by MFS to any institutional separate accounts advised by MFS (“separate accounts”) and unaffiliated investment companies for which MFS serves as subadviser (“subadvised funds”) that have comparable investment strategies to the Fund, if any. In comparing these fees, the Trustees considered information provided by MFS as to the generally broader scope of services provided by MFS to the Fund, as well as the more extensive regulatory burdens imposed on MFS in managing the Fund, in comparison to separate accounts and subadvised funds. The Trustees also considered the higher demands placed on MFS’ investment personnel and trading infrastructure as a result of the daily cashin-flows andout-flows of the Fund in comparison to separate accounts.
The Trustees also considered whether the Fund may benefit from any economies of scale in the management of the Fund in the event of growth in assets of the Fund and/or growth in assets of the MFS Funds as a whole. They noted that the Fund’s advisory fee rate schedule is subject to a contractual breakpoint that reduces the Fund’s advisory fee rate on average daily net assets over $500 million. The Trustees also noted that MFS has agreed in writing to waive a portion of the management fees of certain MFS Funds, including the Fund, if the total combined assets of certain funds within the MFS Funds’ complex increase above agreed upon thresholds (the “group fee waiver”), enabling the Fund’s shareholders to share in the benefits from any economies of scale at the complex level. The group fee waiver is reviewed and renewed annually between the Board and MFS. The Trustees concluded that the breakpoint and the group fee waiver were sufficient to allow the Fund to benefit from economies of scale as its assets and overall complex assets grow.
The Trustees also considered information prepared by MFS relating to MFS’ costs and profits with respect to the Fund, the MFS Funds considered as a group, and other investment companies and accounts advised by MFS, as well as MFS’ methodologies used to determine and allocate its costs to the MFS Funds, the Fund and other accounts and products for purposes of estimating profitability.
After reviewing these and other factors described herein, the Trustees concluded, within the context of their overall conclusions regarding the investment advisory agreement, that the advisory fees charged to the Fund represent reasonable compensation in light of the services being provided by MFS to the Fund.
In addition, the Trustees considered MFS’ resources and related efforts to continue to retain, attract and motivate capable personnel to serve the Fund. The Trustees also considered current and developing conditions in the financial services industry, including the presence of large and well-capitalized companies which are spending, and appear to be prepared to continue to spend, substantial sums to engage personnel and to provide services to competing investment companies. In this regard, the Trustees also considered the financial resources of MFS and its ultimate parent, Sun Life Financial Inc. The Trustees also considered the advantages and possible disadvantages to the Fund of having an adviser that also serves other investment companies as well as other accounts.
The Trustees also considered the nature, quality, cost, and extent of administrative, transfer agency, and distribution services provided to the Fund by MFS and its affiliates under agreements and plans other than the investment advisory agreement, including any12b-1 fees the Fund pays to MFS Fund Distributors, Inc., an affiliate of MFS. The Trustees also considered the nature, extent and quality of certain other services MFS performs or arranges for on the Fund’s behalf, which may include securities lending programs, directed expense payment programs, class action recovery programs, and MFS’ interaction with third-party service providers, principally custodians andsub-custodians. The Trustees concluded that the variousnon-advisory services provided by MFS and its affiliates on behalf of the Fund were satisfactory.
The Trustees consideredso-called“fall-out benefits” to MFS such as reputational value derived from serving as investment manager to the MFS Funds. The Trustees also considered that, effective January 3, 2018, MFS had discontinued its historic practice of obtaining investment research from portfolio brokerage commissions paid by certain MFS Funds and would thereafter voluntarily reimburse a Fund, if applicable, for the costs of external research acquired through the use of the Fund’s portfolio brokerage commissions.
Based on their evaluation of factors that they deemed to be material, including those factors described above, the Board of Trustees, including the independent Trustees, concluded that the Fund’s investment advisory agreement with MFS should be continued for an additionalone-year period, commencing August 1, 2018.
26
MFS Emerging Markets Equity Portfolio
PROXY VOTING POLICIES AND INFORMATION
MFS votes proxies on behalf of the fund pursuant to proxy voting policies and procedures that are available without charge, upon request, by calling 1-800-225-2606, by visitingmfs.com/proxyvoting, or by visiting the SEC’s Web site athttp://www.sec.gov.
Information regarding how the fund voted proxies relating to portfolio securities during the most recent twelve-month period ended June 30 is available by August 31 of each year without charge by visitingmfs.com/proxyvoting, or by visiting the SEC’s Web site athttp://www.sec.gov.
QUARTERLY PORTFOLIO DISCLOSURE
The fund files a complete schedule of portfolio holdings with the SEC for the first and third quarters of each fiscal year on Form N-Q. The fund’s Form N-Q is available on the SEC’s website athttp://www.sec.gov. A shareholder can obtain the portfolio holdings report for the first and third quarters of the fund’s fiscal year atmfs.com/vit2 by choosing the fund’s name and then selecting the “Resources” tab and clicking on “Prospectus and Reports”.
FURTHER INFORMATION
From time to time, MFS may post important information about the fund or the MFS funds on the MFS web site (mfs.com). This information is available athttps://www.mfs.com/en-us/what-we-do/announcements.htmlor atmfs.com/vit2 by choosing the fund’s name.
INFORMATION ABOUT FUND CONTRACTS AND LEGAL CLAIMS
The fund has entered into contractual arrangements with an investment adviser, administrator, distributor, shareholder servicing agent, 529 program manager (if applicable), and custodian who each provide services to the fund. Unless expressly stated otherwise, shareholders are not parties to, or intended beneficiaries of these contractual arrangements, and these contractual arrangements are not intended to create any shareholder right to enforce them against the service providers or to seek any remedy under them against the service providers, either directly or on behalf of the fund.
Under the Trust’s By-Laws and Declaration of Trust, any claims asserted against or on behalf of the MFS Funds, including claims against Trustees and Officers, must be brought in state and federal courts located within the Commonwealth of Massachusetts.
FEDERAL TAX INFORMATION (unaudited)
The following information is provided pursuant to provisions of the Internal Revenue Code.
For corporate shareholders, 4.07% of the ordinary income dividends paid during the fiscal year qualify for the corporate dividends received deduction.
Income derived from foreign sources was $1,160,965. The fund intends to pass through foreign tax credits of $127,969 for the fiscal year.
27
rev. 3/16
| | | | |
| | | |
| FACTS | | WHAT DOES MFS DO WITH YOUR
PERSONAL INFORMATION? | |  |
| | |
| Why? | | Financial companies choose how they share your personal information. Federal law gives consumers the right to limit some but not all sharing. Federal law also requires us to tell you how we collect, share, and protect your personal information. Please read this notice carefully to understand what we do. |
| | |
| What? | | The types of personal information we collect and share depend on the product or service you have with us. This information can include: • Social Security number and account balances • Account transactions and transaction history • Checking account information and wire transfer instructions When you areno longer our customer, we continue to share your information as described in this notice. |
| | |
| How? | | All financial companies need to share customers’ personal information to run their everyday business. In the section below, we list the reasons financial companies can share their customers’ personal information; the reasons MFS chooses to share; and whether you can limit this sharing. |
| | | | |
Reasons we can share your
personal information | | Does MFS share? | | Can you limit this
sharing? |
For our everyday business purposes – such as to process your transactions, maintain your account(s), respond to court orders and legal investigations, or report to credit bureaus | | Yes | | No |
For our marketing purposes – to offer our products and services to you | | No | | We don’t share |
| For joint marketing with other financial companies | | No | | We don’t share |
For our affiliates’ everyday business purposes – information about your transactions and experiences | | No | | We don’t share |
For our affiliates’ everyday business purposes – information about your creditworthiness | | No | | We don’t share |
| For nonaffiliates to market to you | | No | | We don’t share |
| | |
| | |
| Questions? | | Call800-225-2606 or go tomfs.com. |
28
| | |
| Who we are |
| Who is providing this notice? | | MFS Funds, MFS Investment Management, MFS Institutional Advisors, Inc., and MFS Heritage Trust Company. |
| | |
| What we do |
| How does MFS protect my personal information? | | To protect your personal information from unauthorized access and use, we use security measures that comply with federal law. These measures include procedural, electronic, and physical safeguards for the protection of the personal information we collect about you. |
How does MFS
collect my personal information? | | We collect your personal information, for example, when you • open an account or provide account information • direct us to buy securities or direct us to sell your securities • make a wire transfer We also collect your personal information from others, such as credit bureaus, affiliates, or other companies. |
| Why can’t I limit all sharing? | | Federal law gives you the right to limit only • sharing for affiliates’ everyday business purposes – information about your creditworthiness • affiliates from using your information to market to you • sharing for nonaffiliates to market to you State laws and individual companies may give you additional rights to limit sharing. |
| | |
| Definitions |
| Affiliates | | Companies related by common ownership or control. They can be financial and nonfinancial companies. • MFS does not share personal information with affiliates, except for everyday business purposes as described on page one of this notice. |
| Nonaffiliates | | Companies not related by common ownership or control. They can be financial and nonfinancial companies. • MFS does not share with nonaffiliates so they can market to you. |
| Joint marketing | | A formal agreement between nonaffiliated financial companies that together market financial products or services to you. • MFS doesn’t jointly market. |
| | |
| Other important information |
| If you own an MFS product or receive an MFS service in the name of a third party such as a bank or broker-dealer, their privacy policy may apply to you instead of ours. |
29
Annual Report
December 31, 2018

MFS® Global Governments Portfolio

MFS® Variable Insurance Trust II
Beginning on January 1, 2021, as permitted by regulations adopted by the U.S. Securities and Exchange Commission, the insurance company that offers your contract may determine that it will no longer send you paper copies of the fund’s annual and semiannual shareholder reports unless you specifically request paper copies from the insurance company or from your financial intermediary. Instead, the shareholder reports will be made available on a Web site (insurancefunds.mfs.com or other Web site of which you will be notified), and the insurance company will notify you by mail each time a report is posted and provide you with a Web site link to access the report. Instructions for requesting paper copies will be provided by your insurance company or financial intermediary.
If you already elected to receive shareholder reports by email, you will not be affected by this change and you need not take any action. If your insurance company or financial intermediary offers electronic delivery, you may elect to receive shareholder reports and other communications from the insurance company or financial intermediary by email by following the instructions provided by the insurance company or financial intermediary.
Beginning on January 1, 2019, you may elect to receive all future reports in paper free of charge from the insurance company or financial intermediary. You can inform the insurance company or financial intermediary that you wish to continue receiving paper copies of your shareholder reports by contacting your insurance company or financial intermediary. Your election to receive reports in paper will apply to all funds held in your account with your insurance company or financial intermediary.
WGS-ANN
MFS® Global Governments Portfolio
CONTENTS
The report is prepared for the general information of contract owners. It is authorized for distribution to prospective investors only when preceded or accompanied by a current prospectus.
NOT FDIC INSURED• MAY LOSE VALUE• NO BANK OR CREDIT UNION GUARANTEE• NOT A DEPOSIT• NOT INSURED BY ANY FEDERAL GOVERNMENT AGENCY OR NCUA/NCUSIF
MFS Global Governments Portfolio
LETTER FROM THE EXECUTIVE CHAIRMAN

Dear Contract Owners:
Higher interest rates, international trade friction, and geopolitical uncertainty surrounding issues such as Brexit have contributed to an uptick in market volatility in recent quarters — a departure from thelow-volatility environment that prevailed for much of the past several years. Against this more challenging backdrop, equity markets in the United States outperformed most international markets on a relative basis in 2018, though broad market returns were modestly negative on an absolute basis. Global economic growth has become less synchronized over the past few quarters, with Europe, China, and some emerging markets having shown signs of significantly slowing growth. While U.S. growth has remained above average, the pace of that growth slowed in the second half of 2018.
Slowing global growth and tighter financial conditions have clouded the outlook for U.S. monetary policy, with the chairman of the U.S. Federal Reserve acknowledging that policy rates are close to levels that the Fed deems neutral for the U.S. economy. This suggests that the predictable pattern of quarterly rate increases is behind us. At the same time, markets must contend with a shift from years of quantitative easing toward a cycle of quantitative tightening now that the European Central Bank has halted asset purchases. U.S. tax reforms adopted in late 2017 have been welcomed by equity markets while emerging market economies have recently had to contend with tighter financial conditions as a result of firmer U.S. interest rates and a stronger dollar. With the Republicans losing control of the U.S. House of Representatives, further meaningful U.S. fiscal stimulus appears less likely over the remainder of this presidential term. A partial U.S. government shutdown, beginning in late 2018, also added to political uncertainty. Globally, inflation remains largely subdued thanks in part to falling oil prices, but tight labor markets and moderate global demand have investors on the lookout for its potential reappearance. Increased U.S. protectionism is also a growing concern, as investors fear trade disputes could dampen business sentiment, leading to even slower global growth. While there has been progress on this front — a NAFTA replacement has been agreed upon between the U.S., Mexico, and Canada; the free trade pact with Korea has been updated; and a negotiating framework with the European Union has been agreed upon — tensions over trade with China remain quite high, though the two sides have recently returned to the negotiating table.
As a global investment manager with nearly a century of expertise, MFS® firmly believes active risk management offers downside mitigation and may help improve investment outcomes. We built our active investment platform with this belief in mind. Ourlong-term perspective influences nearly every aspect of our business, ensuring our investment decisions align with the investing time horizons of our clients.
Respectfully,

Robert J. Manning
Executive Chairman
MFS Investment Management
February 15, 2019
The opinions expressed in this letter are subject to change and may not be relied upon for investment advice. No forecasts can be guaranteed.
1
MFS Global Governments Portfolio
PORTFOLIO COMPOSITION
Portfolio structure (i)

| | | | |
| Fixed income sectors (i) | | | | |
| Non-U.S. Government Bonds | | | 48.9% | |
| U.S. Treasury Securities | | | 47.7% | |
| Emerging Markets Bonds | | | 2.0% | |
| Mortgage-Backed Securities | | | 0.6% | |
| U.S. Government Agencies | | | 0.5% | |
| Commercial Mortgage-Backed Securities (o) | | | 0.0% | |
|
| Composition including fixed income credit quality (a)(i) | |
| AAA | | | 9.4% | |
| AA | | | 6.9% | |
| A | | | 12.3% | |
| BBB | | | 18.9% | |
| BB (o) | | | 0.0% | |
| B | | | 2.0% | |
| C (o) | | | 0.0% | |
| U.S. Government | | | 47.8% | |
| Federal Agencies | | | 1.1% | |
| Not Rated | | | 1.3% | |
| Cash & Cash Equivalents | | | 0.3% | |
| Other (o) | | | 0.0% | |
| | | | |
| Portfolio facts (i) | | | | |
| Average Duration (d) | | | 8.7 | |
| Average Effective Maturity (m) | | | 10.6 yrs. | |
| |
| Issuer country weightings (i)(x) | | | | |
| United States | | | 49.1% | |
| Japan | | | 12.3% | |
| Italy | | | 10.9% | |
| Portugal | | | 7.5% | |
| United Kingdom | | | 5.6% | |
| Germany | | | 4.3% | |
| Canada | | | 2.4% | |
| Greece | | | 2.0% | |
| Spain | | | 1.7% | |
| Other Countries | | | 4.2% | |
| |
| Currency exposure weightings (i)(y) | | | | |
| United States Dollar | | | 40.3% | |
| Euro | | | 29.1% | |
| Japanese Yen | | | 21.0% | |
| British Pound Sterling | | | 7.0% | |
| Norwegian Krone | | | 1.5% | |
| Australian Dollar | | | 1.2% | |
| Danish Krone | | | 0.5% | |
| Canadian Dollar | | | (0.4)% | |
| New Zealand Dollar | | | (0.5)% | |
| Other Currencies | | | 0.3% | |
| (a) | | For all securities other than those specifically described below, ratings are assigned to underlying securities utilizing ratings from Moody’s, Fitch, and Standard & Poor’s rating agencies and applying the following hierarchy: If all three agencies provide a rating, the middle rating (after dropping the highest and lowest ratings) is assigned; if two of the three agencies rate a security, the lower of the two is assigned. Ratings are shown in the S&P and Fitch scale (e.g., AAA). Securities rated BBB or higher are considered investment grade. All ratings are subject to change. U.S. Government includes securities issued by the U.S. Department of the Treasury. Federal Agencies includes rated and unrated U.S. Agency fixed-income securities, U.S. Agency mortgage-backed securities, and collateralized mortgage obligations of U.S. Agency mortgage-backed securities. Not Rated includes fixed income securities and fixed income derivatives, which have not been rated by any rating agency. The fund may or may not have held all of these instruments on this date. The fund is not rated by these agencies. |
| (d) | | Duration is a measure of how much a bond’s price is likely to fluctuate with general changes in interest rates, e.g., if rates rise 1.00%, a bond with a 5-year duration is likely to lose about 5.00% of its value due to the interest rate move. |
| (i) | | For purposes of this presentation, the components include the value of securities, and reflect the impact of the equivalent exposure of derivative positions, if any. These amounts may be negative from time to time. Equivalent exposure is a calculated amount that translates the derivative position into a reasonable approximation of the amount of the underlying asset that the portfolio would have to hold at a given point in time to have the same price sensitivity that results from the portfolio’s ownership of the derivative contract. When dealing with derivatives, equivalent exposure is a more representative measure of the potential impact of a position on portfolio performance than value. The bond component will include any accrued interest amounts. |
| (m) | | In determining each instrument’s effective maturity for purposes of calculating the fund’s dollar-weighted average effective maturity, MFS uses the instrument’s stated maturity or, if applicable, an earlier date on which MFS believes it is probable that a maturity-shortening device (such as a put,pre-refunding or prepayment) will cause the instrument to be repaid. Such an earlier date can be substantially shorter than the instrument’s stated maturity. |
2
MFS Global Governments Portfolio
Portfolio Composition – continued
| (x) | | Represents the portfolio’s exposure to issuer countries as a percentage of a portfolio’s net assets. For purposes of this presentation, United States includes Cash & Cash Equivalents and Other. |
| (y) | | Represents the portfolio’s exposure to a particular currency as a percentage of a portfolio’s net assets. For purposes of this presentation, United States Dollar includes Cash & Cash Equivalents and Other. |
Where the fund holds convertible bonds, they are treated as part of the equity portion of the portfolio.
Cash & Cash Equivalents includes any cash, investments in money market funds, short-term securities, and other assets less liabilities. Please see the Statement of Assets and Liabilities for additional information related to the fund’s cash position and other assets and liabilities.
Other includes equivalent exposure from currency derivatives and/or any offsets to derivative positions.
Percentages are based on net assets as of December 31, 2018.
The portfolio is actively managed and current holdings may be different.
3
MFS Global Governments Portfolio
MANAGEMENT REVIEW
Summary of Results
For the twelve months ended December 31, 2018, Initial Class shares of the MFS Global Governments Portfolio (“fund”) provided a total return of –1.11%, while Service Class shares of the fund provided a total return of –1.32%. These compare with a return of –0.66% for the fund’s benchmark, the JPMorgan Global Government Bond Index (Unhedged).
Market Environment
During the reporting period, the US Federal Reserve raised interest rates by 100 basis points, bringing the total number of rate hikes to nine since the central bank began to normalize monetary policy in late 2015. Economic growth rates in the US, Eurozone and Japan remained above trend, despite a slowing in global growth, particularly toward the end of the period. Inflation remained contained, particularly outside the US. Late in the period, the European Central Bank halted its asset purchase program but issued forward guidance that it does not expect to raise interest rates at least until after the summer of 2019. The Bank of England (once) and the Bank of Canada (three times) each raised rates during the period. The European political backdrop became a bit more volatile, late in the period, spurred by concerns over cohesion in the eurozone after the election of an anti-establishment, Eurosceptic coalition government in Italy and widespread protests over stagnant wage growth in France.
Bond yields rose in the US during most of the period, but remained low by historical standards and slipped from their highs, late in the period, as market volatility increased. Yields in many developed markets fell. Outside of emerging markets, where spreads and currencies came under pressure, credit spreads remained quite tight until the end of the period, when thinner liquidity, lower oil prices and concerns over high degrees of corporate leverage emerged. Growing concern over increasing global trade friction appeared to have weighed on business sentiment during the period’s second half, especially outside the US. Tighter financial conditions from rising US rates and a strong dollar, combined with trade uncertainty, helped expose structural weaknesses in several emerging markets in the second half of the period.
Volatility increased, at the end of the period, amid signs of slowing global economic growth and increasing trade tensions, which prompted a market setback shortly after US markets set record highs in September. It was the second such equity market decline during the reporting period. The correction came despite a third consecutive quarter of strong growth in US earnings per share. Strong earnings growth, combined with the market decline, brought US equity valuations down from elevated levels, earlier in the period, to multiples more in line with long-term averages. While the US economy held up better than most, global economic growth became less synchronized during the period, with Europe and China showing signs of a slowdown and some emerging markets coming under stress.
Factors Affecting Performance
During the reporting period, the fund’s currency exposure was a key detractor from performance relative to the JPMorgan Global Government Bond Index (Unhedged), most notably its overweight exposures to the Japanese yen and Norwegian krone and underweight exposure to the Australian dollar. Security selection within both Spanish and French-issued debt also weakened relative returns.
On the positive side, the fund’s shorter duration (d) exposure to the United States yield curve (y), where interest rates generally rose, and its longer duration exposure to both the New Zealand and Canada yield curves, where interest rates generally declined, positively impacted relative returns. From an asset allocation perspective, the fund’sout-of-benchmark exposure to Portuguese bonds and overweight exposure to Italian bonds helped relative performance as Portuguese and Italian bond returns outpaced the benchmark. An underweight exposure to French bonds, which underperformed the benchmark during the reporting period, also benefited the fund’s relative returns.
Respectfully,
Portfolio Manager(s)
Matt Ryan and Erik Weisman
| (d) | Duration is a measure of how much a bond’s price is likely to fluctuate with general changes in interest rates, e.g., if rates rise 1.00%, a bond with a 5-year duration is likely to lose about 5.00% of its value. |
| (y) | A yield curve graphically depicts the yields of different maturity bonds of the same credit quality and type; a normal yield curve is upward sloping, with short-term rates lower than long-term rates. |
The views expressed in this report are those of the portfolio manager(s) only through the end of the period of the report as stated on the cover and do not necessarily reflect the views of MFS or any other person in the MFS organization. These views are subject to change at any time based on market or other conditions, and MFS disclaims any responsibility to update such views. These views may not be relied upon as investment advice or an indication of trading intent on behalf of any MFS portfolio. References to specific securities are not recommendations of such securities, and may not be representative of any MFS portfolio’s current or future investments.
4
MFS Global Governments Portfolio
PERFORMANCE SUMMARY THROUGH 12/31/18
The following chart illustrates the historical performance of the fund in comparison to its benchmark(s). Benchmarks are unmanaged and may not be invested in directly. Benchmark returns do not reflect any fees or expenses. The performance of other share classes will be greater than or less than that of the class depicted below. (See Notes to Performance Summary.)
Performance data shown represents past performance and is no guarantee of future results. Investment return and principal value fluctuate so your units, when sold, may be worth more or less than the original cost; current performance may be lower or higher than quoted. The performance shown does not reflect the deduction of taxes, if any, that a contract holder would pay on fund distributions or the redemption of contract units. The returns for the fund shown also do not reflect the deduction of expenses associated with variable products, such as mortality and expense risk charges, separate account charges, and sales charges imposed by the insurance company separate accounts. Such expenses would reduce the overall returns shown.
Growth of a Hypothetical $10,000 Investment
Total Returns through 12/31/18
Average annual total returns
| | | | | | | | | | | | |
| | | Share Class | | Class Inception Date | | 1-yr | | 5-yr | | 10-yr | | |
| | | Initial Class | | 5/16/88 | | (1.11)% | | 0.59% | | 1.26% | | |
| | | Service Class | | 8/24/01 | | (1.32)% | | 0.34% | | 1.01% | | |
| | | | |
Comparative benchmark(s) | | | | | | | | |
| | | JPMorgan Global Government Bond Index (Unhedged) (f) | | (0.66)% | | 1.11% | | 1.74% | | |
| (f) | Source: FactSet Research Systems Inc. |
Benchmark Definition(s)
JPMorgan Global Government Bond Index (Unhedged) – measures developed government bond markets around the world.
It is not possible to invest directly in an index.
Notes to Performance Summary
Average annual total return represents the average annual change in value for each share class for the periods presented.
Performance results reflect any applicable expense subsidies and waivers in effect during the periods shown. Without such subsidies and waivers the fund’s performance results would be less favorable. Please see the prospectus and financial statements for complete details. All results are historical and assume the reinvestment of any dividends and capital gains distributions.
Performance results do not include adjustments made for financial reporting purposes in accordance with U.S. generally accepted accounting principles and may differ from amounts reported in the financial highlights.
From time to time the fund may receive proceeds from litigation settlements, without which performance would be lower.
5
MFS Global Governments Portfolio
EXPENSE TABLE
Fund Expenses Borne by the Contract Holders during the Period,
July 1, 2018 through December 31, 2018
As a contract holder of the fund, you incur ongoing costs, including management fees; distribution and/or service(12b-1) fees; and other fund expenses. This example is intended to help you understand your ongoing costs (in dollars) of investing in the fund and to compare these costs with the ongoing costs of investing in other mutual funds.
The example is based on an investment of $1,000 invested at the beginning of the period and held for the entire period July 1, 2018 through December 31, 2018.
Actual Expenses
The first line for each share class in the following table provides information about actual account values and actual expenses. You may use the information in this line, together with the amount you invested, to estimate the expenses that you paid over the period. Simply divide your account value by $1,000 (for example, an $8,600 account value divided by $1,000 = 8.6), then multiply the result by the number in the first line under the heading entitled “Expenses Paid During Period” to estimate the expenses you paid on your account during this period.
Hypothetical Example for Comparison Purposes
The second line for each share class in the following table provides information about hypothetical account values and hypothetical expenses based on the fund’s actual expense ratio and an assumed rate of return of 5% per year before expenses, which is not the fund’s actual return. The hypothetical account values and expenses may not be used to estimate the actual ending account balance or expenses you paid for the period. You may use this information to compare the ongoing costs of investing in the fund and other funds. To do so, compare this 5% hypothetical example with the 5% hypothetical examples that appear in the shareholder reports of the other funds.
Please note that the expenses shown in the table are meant to highlight the fund’s ongoing costs only and do not take into account the fees and expenses imposed under the variable contracts through which your investment in the fund is made. Therefore, the second line for each share class in the table is useful in comparing ongoing costs associated with an investment in vehicles (such as the fund) which fund benefits under variable annuity and variable life insurance contracts and to qualified pension and retirement plans only, and will not help you determine the relative total costs of investing in the fund through variable annuity and variable life insurance contracts. If the fees and expenses imposed under the variable contracts were included, your costs would have been higher.
| | | | | | | | | | | | | | | | | | |
| Share Class | | | | Annualized
Expense Ratio | | | Beginning
Account Value
7/01/18 | | | Ending
Account Value
12/31/18 | | | Expenses Paid
During Period (p)
7/01/18-12/31/18 | |
| Initial Class | | Actual | | | 0.87% | | | | $1,000.00 | | | | $1,001.26 | | | | $4.39 | |
| | Hypothetical (h) | | | 0.87% | | | | $1,000.00 | | | | $1,020.82 | | | | $4.43 | |
| Service Class | | Actual | | | 1.12% | | | | $1,000.00 | | | | $1,000.36 | | | | $5.65 | |
| | Hypothetical (h) | | | 1.12% | | | | $1,000.00 | | | | $1,019.56 | | | | $5.70 | |
| (h) | 5% class return per year before expenses. |
| (p) | “Expenses Paid During Period” are equal to each class’s annualized expense ratio, as shown above, multiplied by the average account value over the period, multiplied by 184/365 (to reflect theone-half year period). |
6
MFS Global Governments Portfolio
PORTFOLIO OF INVESTMENTS – 12/31/18
The Portfolio of Investments is a complete list of all securities owned by your fund. It is categorized by broad-based asset classes.
| | | | | | | | |
| | |
| Issuer | | Shares/Par | | | Value ($) | |
| BONDS – 99.0% | | | | | | | | |
| Foreign Bonds – 50.4% | | | | | | | | |
| Australia – 1.2% | | | | | | | | |
| Commonwealth of Australia, 2.75%, 11/21/2028 | | AUD | 1,940,000 | | | $ | 1,417,033 | |
| Commonwealth of Australia, 3%, 3/21/2047 | | | 250,000 | | | | 182,183 | |
| | | | | | | | |
| | | | | | $ | 1,599,216 | |
| | | | | | | | |
| Canada – 2.4% | | | | | | | | |
| Government of Canada, 2.5%, 6/01/2024 | | CAD | 663,000 | | | $ | 500,446 | |
| Government of Canada, 1.5%, 6/01/2026 | | | 310,000 | | | | 220,236 | |
| Government of Canada, 2%, 6/01/2028 | | | 2,800,000 | | | | 2,056,724 | |
| Government of Canada, 4%, 6/01/2041 | | | 500,000 | | | | 483,054 | |
| Government of Canada, 2.75%, 12/01/2048 | | | 50,000 | | | | 41,166 | |
| | | | | | | | |
| | | | | | $ | 3,301,626 | |
| | | | | | | | |
| Denmark – 0.3% | | | | | | | | |
| Kingdom of Denmark, 4.5%, 11/15/2039 | | DKK | 1,500,000 | | | $ | 400,333 | |
| | | | | | | | |
| France – 1.2% | | | | | | | | |
| Republic of France, 4.5%, 4/25/2041 | | EUR | 259,000 | | | $ | 474,819 | |
| Republic of France, 3.25%, 5/25/2045 | | | 405,000 | | | | 637,903 | |
| Republic of France, 4%, 4/25/2055 | | | 210,000 | | | | 387,624 | |
| Republic of France, 1.75%, 5/25/2066 | | | 150,000 | | | | 165,955 | |
| | | | | | | | |
| | | | | | $ | 1,666,301 | |
| | | | | | | | |
| Germany – 4.3% | | | | | | | | |
| Federal Republic of Germany, 0.5%, 2/15/2026 | | EUR | 400,000 | | | $ | 476,370 | |
| Federal Republic of Germany, 0.5%, 2/15/2028 | | | 4,250,000 | | | | 5,011,935 | |
| Federal Republic of Germany, 2.5%, 7/04/2044 | | | 135,000 | | | | 214,781 | |
| Federal Republic of Germany, 2.5%, 8/15/2046 | | | 65,000 | | | | 104,842 | |
| | | | | | | | |
| | | | | | $ | 5,807,928 | |
| | | | | | | | |
| Greece – 2.0% | | | | | | | | |
| Hellenic Republic, 4.375%, 8/01/2022 | | EUR | 1,157,000 | | | $ | 1,378,925 | |
| Hellenic Republic, 3.375%, 2/15/2025 | | | 1,200,000 | | | | 1,327,900 | |
| | | | | | | | |
| | | | | | $ | 2,706,825 | |
| | | | | | | | |
| Italy – 10.8% | | | | | | | | |
| Republic of Italy, 3.75%, 3/01/2021 | | EUR | 4,299,000 | | | $ | 5,243,194 | |
| Republic of Italy, 5.5%, 9/01/2022 | | | 2,195,000 | | | | 2,881,264 | |
| | | | | | | | |
| | |
| Issuer | | Shares/Par | | | Value ($) | |
| BONDS – continued | | | | | |
| Foreign Bonds – continued | | | | | | | | |
| Italy – continued | | | | | | | | |
| Republic of Italy, 1.6%, 6/01/2026 | | EUR | 2,400,000 | | | $ | 2,623,341 | |
| Republic of Italy, 2%, 2/01/2028 | | | 1,300,000 | | | | 1,424,611 | |
| Republic of Italy, 1.65%, 3/01/2032 | | | 1,400,000 | | | | 1,388,603 | |
| Republic of Italy, 5%, 9/01/2040 | | | 368,000 | | | | 517,159 | |
| Republic of Italy, 3.25%, 9/01/2046 | | | 500,000 | | | | 557,580 | |
| | | | | | | | |
| | | | | | $ | 14,635,752 | |
| | | | | | | | |
| Japan – 12.3% | | | | | | | | |
| Government of Japan, 1.7%, 9/20/2032 | | JPY | 355,000,000 | | | $ | 3,889,146 | |
| Government of Japan, 1.5%, 3/20/2034 | | | 591,000,000 | | | | 6,357,651 | |
| Government of Japan, 2.4%, 3/20/2037 | | | 352,600,000 | | | | 4,314,456 | |
| Government of Japan, 1.8%, 3/20/2043 | | | 23,000,000 | | | | 265,562 | |
| Government of Japan, 0.8%, 6/20/2047 | | | 125,000,000 | | | | 1,167,317 | |
| Government of Japan, 2%, 3/20/2052 | | | 53,900,000 | | | | 667,680 | |
| | | | | | | | |
| | | | | | $ | 16,661,812 | |
| | | | | | | | |
| Norway – 1.2% | | | | | | | | |
| Government of Norway, 2%, 4/26/2028 | | NOK | 14,000,000 | | | $ | 1,651,211 | |
| | | | | | | | |
| Portugal – 7.3% | | | | | | | | |
| Republic of Portugal, 4.95%, 10/25/2023 | | EUR | 1,380,000 | | | $ | 1,918,030 | |
| Republic of Portugal, 2.875%, 10/15/2025 | | | 2,700,000 | | | | 3,442,164 | |
| Republic of Portugal, 4.125%, 4/14/2027 | | | 2,300,000 | | | | 3,163,076 | |
| Republic of Portugal, 3.875%, 2/15/2030 | | | 800,000 | | | | 1,089,551 | |
| Republic of Portugal, 4.1%, 4/15/2037 | | | 250,000 | | | | 348,079 | |
| | | | | | | | |
| | | | | | $ | 9,960,900 | |
| | | | | | | | |
| Spain – 1.6% | | | | | | | | |
| Kingdom of Spain, 5.75%, 7/30/2032 | | EUR | 166,000 | | | $ | 281,050 | |
| Kingdom of Spain, 4.7%, 7/30/2041 | | | 870,000 | | | | 1,407,106 | |
| Kingdom of Spain, 5.15%, 10/31/2044 | | | 300,000 | | | | 518,870 | |
| | | | | | | | |
| | | | | | $ | 2,207,026 | |
| | | | | | | | |
| Sweden – 0.2% | | | | | | | | |
| Kingdom of Sweden, 1%, 11/12/2026 | | SEK | 3,000,000 | | | $ | 356,733 | |
| | | | | | | | |
| United Kingdom – 5.6% | | | | | | | | |
| United Kingdom Treasury, 4.25%, 12/07/2027 | | GBP | 1,883,000 | | | $ | 3,026,451 | |
| United Kingdom Treasury, 4.25%, 6/07/2032 | | | 71,000 | | | | 120,419 | |
| United Kingdom Treasury, 4.25%, 3/07/2036 | | | 438,000 | | | | 770,669 | |
| United Kingdom Treasury, 4.25%, 12/07/2040 | | | 127,000 | | | | 233,738 | |
| United Kingdom Treasury, 3.25%, 1/22/2044 | | | 1,080,000 | | | | 1,759,501 | |
| United Kingdom Treasury, 3.75%, 7/22/2052 | | | 489,000 | | | | 933,710 | |
7
MFS Global Governments Portfolio
Portfolio of Investments – continued
| | | | | | | | |
| | |
| Issuer | | Shares/Par | | | Value ($) | |
| BONDS – continued | | | | | |
| Foreign Bonds – continued | | | | | |
| United Kingdom – continued | |
| United Kingdom Treasury, 4%, 1/22/2060 | | GBP | 205,000 | | | $ | 434,862 | |
| United Kingdom Treasury, 3.5%, 7/22/2068 | | | 150,000 | | | | 302,381 | |
| | | | | | | | |
| | | | | | $ | 7,581,731 | |
| | | | | | | | |
| Total Foreign Bonds | | | | | | $ | 68,537,394 | |
| | | | | | | | |
| | |
| U.S. Bonds – 48.6% | | | | | | | | |
| Asset-Backed & Securitized – 0.0% | |
| Commercial Mortgage Asset Trust, 1.238%, 1/17/2032 (i)(z) | | $ | 9,213 | | | $ | 3 | |
| | | | | | | | |
| Mortgage-Backed – 0.6% | | | | | | | | |
| Fannie Mae, 5.18%, 3/01/2019 | | $ | 55,561 | | | $ | 55,490 | |
| Freddie Mac, 5.085%, 3/25/2019 | | | 35,812 | | | | 35,783 | |
| Freddie Mac, 3.32%, 2/25/2023 | | | 5,000 | | | | 5,070 | |
| Freddie Mac, 3.243%, 4/25/2027 | | | 400,000 | | | | 399,337 | |
| Freddie Mac, 3.117%, 6/25/2027 | | | 322,320 | | | | 318,763 | |
| | | | | | | | |
| | | | | | $ | 814,443 | |
| | | | | | | | |
| U.S. Government Agencies and Equivalents – 0.5% | |
| Small Business Administration, 4.57%, 6/01/2025 | | $ | 4,475 | | | $ | 4,596 | |
| Small Business Administration, 5.09%, 10/01/2025 | | | 3,821 | | | | 3,947 | |
| Small Business Administration, 5.21%, 1/01/2026 | | | 59,445 | | | | 61,572 | |
| Small Business Administration, 2.22%, 3/01/2033 | | | 576,163 | | | | 561,002 | |
| | | | | | | | |
| | | | | | $ | 631,117 | |
| | | | | | | | |
| U.S. Treasury Obligations – 47.5% | | | | | |
| U.S. Treasury Bonds, 2.25%, 2/15/2027 | | $ | 3,987,000 | | | $ | 3,874,329 | |
| U.S. Treasury Bonds, 4.5%, 8/15/2039 | | | 3,028,400 | | | | 3,779,049 | |
| | | | | | | | |
| | |
| Issuer | | Shares/Par | | | Value ($) | |
| BONDS – continued | | | | | |
| U.S. Bonds – continued | | | | | |
| U.S. Treasury Obligations – continued | | | | | |
| U.S. Treasury Bonds, 2.75%, 11/15/2042 | | $ | 2,261,000 | | | $ | 2,165,678 | |
| U.S. Treasury Bonds, 3.625%, 2/15/2044 | | | 4,974,000 | | | | 5,519,435 | |
| U.S. Treasury Bonds, 3%, 5/15/2047 | | | 1,743,000 | | | | 1,738,591 | |
| U.S. Treasury Notes, 0.875%, 5/15/2019 | | | 4,800,000 | | | | 4,771,688 | |
| U.S. Treasury Notes, 3.5%, 5/15/2020 | | | 10,355,000 | | | | 10,483,451 | |
| U.S. Treasury Notes, 1.375%, 5/31/2021 | | | 4,680,400 | | | | 4,559,360 | |
| U.S. Treasury Notes, 1.75%, 5/15/2022 | | | 6,253,000 | | | | 6,106,132 | |
| U.S. Treasury Notes, 1.375%, 8/31/2023 | | | 1,689,000 | | | | 1,605,495 | |
| U.S. Treasury Notes, 2.75%, 2/15/2024 | | | 4,290,000 | | | | 4,335,695 | |
| U.S. Treasury Notes, 2.25%, 11/15/2025 | | | 7,224,000 | | | | 7,067,737 | |
| U.S. Treasury Notes, 1.5%, 8/15/2026 | | | 6,720,000 | | | | 6,203,321 | |
| U.S. Treasury Notes, 2.875%, 5/15/2028 | | | 2,272,100 | | | | 2,308,640 | |
| | | | | | | | |
| | | | | | $ | 64,518,601 | |
| | | | | | | | |
| Total U.S. Bonds | | | | | | $ | 65,964,164 | |
| | | | | | | | |
Total Bonds
(Identified Cost, $132,549,856) | | | | | | $ | 134,501,558 | |
| | | | | | | | |
| |
| INVESTMENT COMPANIES (h) – 0.7% | | | | | |
| Money Market Funds – 0.7% | | | | | | | | |
| MFS Institutional Money Market Portfolio, 2.4% (v) (Identified Cost, $902,816) | | | 902,832 | | | $ | 902,742 | |
| | | | | | | | |
OTHER ASSETS,
LESS LIABILITIES – 0.3% | | | | | | | 429,292 | |
| | | | | | | | |
| NET ASSETS – 100.0% | | | | | | $ | 135,833,592 | |
| | | | | | | | |
| (h) | | An affiliated issuer, which may be considered one in which the fund owns 5% or more of the outstanding voting securities, or a company which is under common control. At period end, the aggregate values of the fund’s investments in affiliated issuers and in unaffiliated issuers were $902,742 and $134,501,558, respectively. |
| (i) | | Interest only security for which the fund receives interest on notional principal (Par amount). Par amount shown is the notional principal and does not reflect the cost of the security. |
| (v) | | Affiliated issuer that is available only to investment companies managed by MFS. The rate quoted for the MFS Institutional Money Market Portfolio is the annualizedseven-day yield of the fund at period end. |
| (z) | | Restricted securities are not registered under the Securities Act of 1933 and are subject to legal restrictions on resale. These securities generally may be resold in transactions exempt from registration or to the public if the securities are subsequently registered. Disposal of these securities may involvetime-consuming negotiations and prompt sale at an acceptable price may be difficult. The fund holds the following restricted securities: |
| | | | | | | | | | |
| Restricted Securities | | Acquisition
Date | | Cost | | | Value | |
| | | |
| Commercial Mortgage Asset Trust, 1.238%, 1/17/2032 | | 8/25/03-12/02/11 | | | $3 | | | | $3 | |
| | | |
| % of Net assets | | | | | | | | | 0.0% | |
The following abbreviations are used in this report and are defined:
| PLC | | Public Limited Company |
8
MFS Global Governments Portfolio
Portfolio of Investments – continued
Abbreviations indicate amounts shown in currencies other than the U.S. dollar. All amounts are stated in U.S. dollars unless otherwise indicated. A list of abbreviations is shown below:
Derivative Contracts at 12/31/18
Forward Foreign Currency Exchange Contracts
| | | | | | | | | | | | | | | | | | | | |
Currency Purchased | | Currency Sold | | Counterparty | | Settlement Date | | | Unrealized
Appreciation
(Depreciation) | |
| Asset Derivatives | | | | | | | | | | | | |
| USD | | | 826,890 | | | | | AUD | | 1,157,066 | | Brown Brothers Harriman | | | 1/11/2019 | | | | $11,768 | |
| USD | | | 676,140 | | | | | AUD | | 942,000 | | Citibank N.A. | | | 1/11/2019 | | | | 12,526 | |
| USD | | | 1,907,788 | | | | | AUD | | 2,669,841 | | Deutsche Bank AG | | | 1/11/2019 | | | | 26,955 | |
| USD | | | 709,986 | | | | | AUD | | 995,000 | | Goldman Sachs International | | | 1/11/2019 | | | | 9,035 | |
| USD | | | 830,074 | | | | | AUD | | 1,164,140 | | JPMorgan Chase Bank N.A. | | | 1/11/2019 | | | | 9,968 | |
| USD | | | 1,461,465 | | | | | AUD | | 2,067,000 | | Morgan Stanley Capital Services, Inc. | | | 1/11/2019 | | | | 5,317 | |
| USD | | | 2,823,272 | | | | | CAD | | 3,724,000 | | Goldman Sachs International | | | 1/11/2019 | | | | 94,792 | |
| USD | | | 1,334,113 | | | | | CAD | | 1,768,991 | | JPMorgan Chase Bank N.A. | | | 1/11/2019 | | | | 38,019 | |
| USD | | | 397,024 | | | | | CAD | | 532,000 | | Morgan Stanley Capital Services, Inc. | | | 1/11/2019 | | | | 7,241 | |
| USD | | | 735,826 | | | | | CAD | | 977,264 | | UBS AG | | | 1/11/2019 | | | | 19,810 | |
| USD | | | 5,118 | | | | | CHF | | 5,000 | | Goldman Sachs International | | | 1/11/2019 | | | | 27 | |
| USD | | | 343,503 | | | | | CLP | | 232,036,000 | | Barclays Bank PLC | | | 1/07/2019 | | | | 9,151 | |
| USD | | | 2,615 | | | | | CLP | | 1,813,000 | | Barclays Bank PLC | | | 4/03/2019 | | | | 1 | |
| USD | | | 11,924 | | | | | EUR | | 10,223 | | Brown Brothers Harriman | | | 1/11/2019 | | | | 203 | |
| USD | | | 836,804 | | | | | EUR | | 720,000 | | Citibank N.A. | | | 1/11/2019 | | | | 11,320 | |
| USD | | | 1,243,860 | | | | | EUR | | 1,084,206 | | Deutsche Bank AG | | | 1/11/2019 | | | | 813 | |
| USD | | | 5,308,798 | | | | | EUR | | 4,545,244 | | Goldman Sachs International | | | 1/11/2019 | | | | 97,651 | |
| USD | | | 1,474,646 | | | | | EUR | | 1,278,000 | | Morgan Stanley Capital Services, Inc. | | | 1/11/2019 | | | | 9,412 | |
| USD | | | 1,622,419 | | | | | GBP | | 1,266,026 | | State Street Bank Corp. | | | 1/11/2019 | | | | 8,105 | |
| USD | | | 26,386 | | | | | GBP | | 20,000 | | Barclays Bank PLC | | | 1/11/2019 | | | | 884 | |
| USD | | | 199,963 | | | | | GBP | | 155,000 | | Citibank N.A. | | | 1/11/2019 | | | | 2,322 | |
| USD | | | 3,111,982 | | | | | NOK | | 25,866,949 | | Goldman Sachs International | | | 1/11/2019 | | | | 119,256 | |
| USD | | | 1,419,907 | | | | | NOK | | 11,740,000 | | JPMorgan Chase Bank N.A. | | | 1/11/2019 | | | | 61,626 | |
| USD | | | 1,434,871 | | | | | NZD | | 2,104,000 | | Citibank N.A. | | | 1/11/2019 | | | | 22,477 | |
| USD | | | 2,376,375 | | | | | NZD | | 3,505,000 | | Goldman Sachs International | | | 1/11/2019 | | | | 23,504 | |
| USD | | | 311,988 | | | | | ZAR | | 4,487,000 | | UBS AG | | | 1/11/2019 | | | | 396 | |
| CLP | | | 1,813,000 | | | | | USD | | 2,612 | | Barclays Bank PLC | | | 1/07/2019 | | | | 0 | |
| EUR | | | 3,250,657 | | | | | USD | | 3,712,793 | | State Street Bank Corp. | | | 1/11/2019 | | | | 14,104 | |
| EUR | | | 145,000 | | | | | USD | | 165,680 | | Deutsche Bank AG | | | 1/11/2019 | | | | 564 | |
| EUR | | | 4,131,227 | | | | | USD | | 4,706,865 | | Goldman Sachs International | | | 1/11/2019 | | | | 29,609 | |
| INR | | | 48,165,000 | | | | | USD | | 677,255 | | JPMorgan Chase Bank N.A. | | | 2/28/2019 | | | | 8,354 | |
| JPY | | | 542,680,725 | | | | | USD | | 4,858,669 | | Brown Brothers Harriman | | | 1/11/2019 | | | | 94,168 | |
| JPY | | | 25,088,000 | | | | | USD | | 222,767 | | Deutsche Bank AG | | | 1/11/2019 | | | | 6,201 | |
| JPY | | | 1,230,166,970 | | | | | USD | | 11,060,514 | | JPMorgan Chase Bank N.A. | | | 1/11/2019 | | | | 166,743 | |
| JPY | | | 54,703,000 | | | | | USD | | 496,479 | | Morgan Stanley Capital Services, Inc. | | | 1/11/2019 | | | | 2,774 | |
| NOK | | | 5,962,000 | | | | | USD | | 681,200 | | Citibank N.A. | | | 1/11/2019 | | | | 8,585 | |
| NZD | | | 4,951,876 | | | | | USD | | 3,268,539 | | Citibank N.A. | | | 1/11/2019 | | | | 55,606 | |
9
MFS Global Governments Portfolio
Portfolio of Investments – continued
Forward Foreign Currency Exchange Contracts - continued
| | | | | | | | | | | | | | | | | | | | |
Currency Purchased | | Currency Sold | | Counterparty | | Settlement Date | | | Unrealized
Appreciation
(Depreciation) | |
| Asset Derivatives – continued | | | | | | | | | | | | |
| NZD | | | 2,127,000 | | | | | USD | | 1,410,117 | | Goldman Sachs International | | | 1/11/2019 | | | | $17,716 | |
| SEK | | | 12,680,000 | | | | | USD | | 1,412,470 | | Brown Brothers Harriman | | | 1/11/2019 | | | | 19,203 | |
| SEK | | | 13,674,290 | | | | | USD | | 1,540,138 | | JPMorgan Chase Bank N.A. | | | 1/11/2019 | | | | 3,798 | |
| | | | | | | | | | | | | | | | | | | | |
| | | | | | | | | | | | | | | | | | | $1,030,004 | |
| | | | | | | | | | | | | | | | | | | | |
| Liability Derivatives | | | | | | | | | | | | |
| AUD | | | 1,999,000 | | | | | USD | | 1,451,686 | | State Street Bank Corp. | | | 1/11/2019 | | | | $(43,443 | ) |
| AUD | | | 3,379,838 | | | | | USD | | 2,442,735 | | Citibank N.A. | | | 1/11/2019 | | | | (61,726 | ) |
| AUD | | | 2,607,986 | | | | | USD | | 1,900,559 | | Deutsche Bank AG | | | 1/11/2019 | | | | (63,301 | ) |
| AUD | | | 994,000 | | | | | USD | | 724,405 | | Goldman Sachs International | | | 1/11/2019 | | | | (24,158 | ) |
| CAD | | | 924,000 | | | | | USD | | 714,547 | | Brown Brothers Harriman | | | 1/11/2019 | | | | (37,556 | ) |
| CAD | | | 868,603 | | | | | USD | | 667,668 | | Merrill Lynch International | | | 1/11/2019 | | | | (31,265 | ) |
| CLP | | | 230,223,000 | | | | | USD | | 342,314 | | Barclays Bank PLC | | | 1/07/2019 | | | | (10,575 | ) |
| DKK | | | 2,102,556 | | | | | USD | | 329,426 | | Citibank N.A. | | | 1/11/2019 | | | | (6,547 | ) |
| EUR | | | 2,193,829 | | | | | USD | | 2,517,213 | | Citibank N.A. | | | 1/11/2019 | | | | (1,975 | ) |
| EUR | | | 520,385 | | | | | USD | | 599,438 | | Goldman Sachs International | | | 1/11/2019 | | | | (2,814 | ) |
| EUR | | | 1,203,649 | | | | | USD | | 1,390,135 | | UBS AG | | | 1/11/2019 | | | | (10,145 | ) |
| GBP | | | 482,000 | | | | | USD | | 615,980 | | State Street Bank Corp. | | | 1/11/2019 | | | | (1,381 | ) |
| GBP | | | 516,000 | | | | | USD | | 674,248 | | Brown Brothers Harriman | | | 1/11/2019 | | | | (16,295 | ) |
| GBP | | | 120,000 | | | | | USD | | 155,788 | | Citibank N.A. | | | 1/11/2019 | | | | (2,775 | ) |
| GBP | | | 1,274,976 | | | | | USD | | 1,685,079 | | Deutsche Bank AG | | | 1/11/2019 | | | | (59,353 | ) |
| GBP | | | 111,836 | | | | | USD | | 144,019 | | Morgan Stanley Capital Services, Inc. | | | 1/11/2019 | | | | (1,417 | ) |
| GBP | | | 534,000 | | | | | USD | | 681,999 | | NatWest Markets PLC | | | 1/11/2019 | | | | (1,094 | ) |
| MXN | | | 74,144 | | | | | USD | | 3,894 | | Goldman Sachs International | | | 1/11/2019 | | | | (125 | ) |
| NOK | | | 11,667,000 | | | | | USD | | 1,426,738 | | Brown Brothers Harriman | | | 1/11/2019 | | | | (76,902 | ) |
| NOK | | | 23,429,184 | | | | | USD | | 2,885,514 | | Goldman Sachs International | | | 1/11/2019 | | | | (174,831 | ) |
| NZD | | | 1,459,000 | | | | | USD | | 1,003,125 | | Deutsche Bank AG | | | 1/11/2019 | | | | (23,713 | ) |
| ZAR | | | 4,685,000 | | | | | USD | | 339,836 | | Citibank N.A. | | | 1/11/2019 | | | | (14,495 | ) |
| USD | | | 109,085 | | | | | DKK | | 716,000 | | JPMorgan Chase Bank N.A. | | | 1/11/2019 | | | | (867 | ) |
| USD | | | 354,533 | | | | | EUR | | 310,000 | | State Street Bank Corp. | | | 1/11/2019 | | | | (884 | ) |
| USD | | | 191,062 | | | | | EUR | | 168,000 | | Brown Brothers Harriman | | | 1/11/2019 | | | | (1,551 | ) |
| USD | | | 448,324 | | | | | EUR | | 395,000 | | Citibank N.A. | | | 1/11/2019 | | | | (4,546 | ) |
| USD | | | 478,244 | | | | | EUR | | 418,000 | | Deutsche Bank AG | | | 1/11/2019 | | | | (994 | ) |
| USD | | | 774,985 | | | | | EUR | | 676,811 | | JPMorgan Chase Bank N.A. | | | 3/18/2019 | | | | (5,338 | ) |
| USD | | | 94,986 | | | | | GBP | | 75,000 | | Goldman Sachs International | | | 1/11/2019 | �� | | | (646 | ) |
| USD | | | 120,833 | | | | | GBP | | 96,000 | | Morgan Stanley Capital Services, Inc. | | | 1/11/2019 | | | | (1,577 | ) |
| USD | | | 651,389 | | | | | INR | | 47,696,000 | | JPMorgan Chase Bank N.A. | | | 2/28/2019 | | | | (27,544 | ) |
| USD | | | 2,096,296 | | | | | JPY | | 236,410,000 | | State Street Bank Corp. | | | 1/11/2019 | | | | (61,327 | ) |
| USD | | | 1,123,101 | | | | | JPY | | 126,634,000 | | Citibank N.A. | | | 1/11/2019 | | | | (32,638 | ) |
| USD | | | 1,492,451 | | | | | JPY | | 168,010,000 | | Deutsche Bank AG | | | 1/11/2019 | | | | (40,911 | ) |
| USD | | | 138,236 | | | | | JPY | | 15,529,000 | | Goldman Sachs International | | | 1/11/2019 | | | | (3,492 | ) |
| USD | | | 96,251 | | | | | JPY | | 10,868,000 | | NatWest Markets PLC | | | 1/11/2019 | | | | (2,937 | ) |
| USD | | | 2,589,653 | | | | | NZD | | 3,954,792 | | NatWest Markets PLC | | | 1/11/2019 | | | | (65,159 | ) |
| USD | | | 2,758,869 | | | | | SEK | | 24,951,000 | | Deutsche Bank AG | | | 1/11/2019 | | | | (58,298 | ) |
| USD | | | 55,129 | | | | | SEK | | 499,000 | | Goldman Sachs International | | | 1/11/2019 | | | | (1,212 | ) |
| USD | | | 18,303 | | | | | ZAR | | 267,347 | | Deutsche Bank AG | | | 1/11/2019 | | | | (262 | ) |
| | | | | | | | | | | | | | | | | | | | |
| | | | | | | | | | | | | | | | | | | $(976,069 | ) |
| | | | | | | | | | | | | | | | | | | | |
At December 31, 2018, the fund had cash collateral of $50,000 to cover any collateral or margin obligations for certain derivative contracts. Restricted cash and/or deposits with brokers in the Statement of Assets and Liabilities are comprised of cash collateral.
See Notes to Financial Statements
10
MFS Global Governments Portfolio
FINANCIAL STATEMENTS | STATEMENT OF ASSETS AND LIABILITIES
This statement represents your fund’s balance sheet, which details the assets and liabilities comprising the total value of the fund.
| | | | |
At 12/31/18 | | | | |
| |
Assets | | | | |
Investments in unaffiliated issuers, at value (identified cost, $132,549,856) | | | $134,501,558 | |
Investments in affiliated issuers, at value (identified cost, $902,816) | | | 902,742 | |
Restricted cash for | | | | |
Forward foreign currency exchange contracts | | | 50,000 | |
Receivables for | | | | |
Forward foreign currency exchange contracts | | | 1,030,004 | |
Fund shares sold | | | 2 | |
Interest | | | 968,268 | |
Other assets | | | 1,219 | |
Total assets | | | $137,453,793 | |
| |
Liabilities | | | | |
Payables for | | | | |
Forward foreign currency exchange contracts | | | $976,069 | |
Fund shares reacquired | | | 572,266 | |
Payable to affiliates | | | | |
Investment adviser | | | 11,295 | |
Shareholder servicing costs | | | 16 | |
Distribution and/or service fees | | | 23 | |
Payable for independent Trustees’ compensation | | | 1 | |
Accrued expenses and other liabilities | | | 60,531 | |
Total liabilities | | | $1,620,201 | |
Net assets | | | $135,833,592 | |
| |
Net assets consist of | | | | |
Paid-in capital | | | $139,719,570 | |
Total distributable earnings (loss) | | | (3,885,978 | ) |
Net assets | | | $135,833,592 | |
Shares of beneficial interest outstanding | | | 13,134,874 | |
| | | | | | | | | | | | |
| | | |
| | | Net assets | | | Shares
outstanding | | | Net asset value
per share | |
Initial Class | | | $135,007,880 | | | | 13,053,453 | | | | $10.34 | |
Service Class | | | 825,712 | | | | 81,421 | | | | 10.14 | |
See Notes to Financial Statements
11
MFS Global Governments Portfolio
FINANCIAL STATEMENTS | STATEMENT OF OPERATIONS
This statement describes how much your fund earned in investment income and accrued in expenses. It also describes any gains and/or losses generated by fund operations.
| | | | |
Year ended 12/31/18 | | | | |
| |
Net investment income (loss) | | | | |
Income | | | | |
Interest | | | $2,738,301 | |
Dividends from affiliated issuers | | | 91,241 | |
Other | | | 622 | |
Total investment income | | | $2,830,164 | |
Expenses | | | | |
Management fee | | | $1,112,865 | |
Distribution and/or service fees | | | 2,289 | |
Shareholder servicing costs | | | 2,032 | |
Administrative services fee | | | 31,406 | |
Independent Trustees’ compensation | | | 3,614 | |
Custodian fee | | | 30,789 | |
Shareholder communications | | | 7,381 | |
Audit and tax fees | | | 72,197 | |
Legal fees | | | 1,293 | |
Miscellaneous | | | 26,538 | |
Total expenses | | | $1,290,404 | |
Reduction of expenses by investment adviser | | | (14,117 | ) |
Net expenses | | | $1,276,287 | |
Net investment income (loss) | | | $1,553,877 | |
| |
Realized and unrealized gain (loss) | | | | |
Realized gain (loss) (identified cost basis) | | | | |
Unaffiliated issuers | | | $1,173,119 | |
Affiliated issuers | | | (297 | ) |
Futures contracts | | | (130,063 | ) |
Swap agreements | | | (16,412 | ) |
Forward foreign currency exchange contracts | | | (224,812 | ) |
Foreign currency | | | 12,799 | |
Net realized gain (loss) | | | $814,334 | |
Change in unrealized appreciation or depreciation | | | | |
Unaffiliated issuers | | | $(4,299,196 | ) |
Affiliated issuers | | | 407 | |
Forward foreign currency exchange contracts | | | 269,945 | |
Translation of assets and liabilities in foreign currencies | | | (22,281 | ) |
Net unrealized gain (loss) | | | $(4,051,125 | ) |
Net realized and unrealized gain (loss) | | | $(3,236,791 | ) |
Change in net assets from operations | | | $(1,682,914 | ) |
See Notes to Financial Statements
12
MFS Global Governments Portfolio
FINANCIAL STATEMENTS | STATEMENTS OF CHANGES IN NET ASSETS
These statements describe the increases and/or decreases in net assets resulting from operations, any distributions, and any shareholder transactions.
| | | | | | | | |
| | | Year ended | |
| | | 12/31/18 | | | 12/31/17 | |
Change in net assets | | | | | | | | |
| | |
From operations | | | | | | | | |
Net investment income (loss) | | | $1,553,877 | | | | $1,256,274 | |
Net realized gain (loss) | | | 814,334 | | | | (1,355,824 | ) |
Net unrealized gain (loss) | | | (4,051,125 | ) | | | 11,272,878 | |
Change in net assets from operations | | | $(1,682,914 | ) | | | $11,173,328 | |
Total distributions to shareholders | | | $(1,441,037 | ) | | | $— | |
Change in net assets from fund share transactions | | | $(21,728,577 | ) | | | $(14,270,685 | ) |
Total change in net assets | | | $(24,852,528 | ) | | | $(3,097,357 | ) |
| | |
Net assets | | | | | | | | |
At beginning of period | | | 160,686,120 | | | | 163,783,477 | |
At end of period (b) | | | $135,833,592 | | | | $160,686,120 | |
| (b) | Parenthetical disclosure of undistributed net investment income is no longer required. See Note 2. For the year ended December 31, 2017, end of period net assets included undistributed net investment income of $1,233,221. |
See Notes to Financial Statements
13
MFS Global Governments Portfolio
FINANCIAL STATEMENTS | FINANCIAL HIGHLIGHTS
The financial highlights table is intended to help you understand the fund’s financial performance for the past 5 years. Certain information reflects financial results for a single fund share. The total returns in the table represent the rate that an investor would have earned (or lost) on an investment in the fund share class (assuming reinvestment of all distributions) held for the entire period.
| | | | | | | | | | | | | | | | | | | | |
| Initial Class | | Year ended | |
| | | | | |
| | | 12/31/18 | | | 12/31/17 | | | 12/31/16 | | | 12/31/15 | | | 12/31/14 | |
| | | | | |
Net asset value, beginning of period | | | $10.56 | | | | $9.87 | | | | $9.84 | | | | $10.47 | | | | $10.45 | |
| | | | | |
| Income (loss) from investment operations | | | | | | | | | | | | | | | | | | | | |
Net investment income (loss) (d) | | | $0.11 | | | | $0.08 | | | | $0.07 | (c) | | | $0.09 | | | | $0.11 | |
Net realized and unrealized gain (loss) | | | (0.23 | ) | | | 0.61 | | | | (0.04 | )(g) | | | (0.47 | ) | | | (0.03 | ) |
Total from investment operations | | | $(0.12 | ) | | | $0.69 | | | | $0.03 | | | | $(0.38 | ) | | | $0.08 | |
| | | | | |
| Less distributions declared to shareholders | | | | | | | | | | | | | | | | | | | | |
From net investment income | | | $(0.10 | ) | | | $— | | | | $— | | | | $(0.25 | ) | | | $(0.06 | ) |
Net asset value, end of period (x) | | | $10.34 | | | | $10.56 | | | | $9.87 | | | | $9.84 | | | | $10.47 | |
Total return (%) (k)(r)(s)(x) | | | (1.11 | ) | | | 6.99 | | | | 0.30 | (c) | | | (3.66 | ) | | | 0.73 | |
| | | | | |
Ratios (%) (to average net assets)
and Supplemental data: | | | | | | | | | | | | | | | | | | | | |
Expenses before expense reductions (f) | | | 0.87 | | | | 0.86 | | | | 0.83 | (c) | | | 0.85 | | | | 0.84 | |
Expenses after expense reductions (f) | | | 0.86 | | | | 0.85 | | | | 0.82 | (c) | | | 0.84 | | | | 0.83 | |
Net investment income (loss) | | | 1.05 | | | | 0.77 | | | | 0.66 | (c) | | | 0.92 | | | | 1.07 | |
Portfolio turnover | | | 79 | | | | 67 | | | | 75 | | | | 94 | | | | 31 | |
Net assets at end of period (000 omitted) | | | $135,008 | | | | $159,652 | | | | $162,211 | | | | $182,978 | | | | $209,945 | |
| |
| Service Class | | Year ended | |
| | | | | |
| | | 12/31/18 | | | 12/31/17 | | | 12/31/16 | | | 12/31/15 | | | 12/31/14 | |
| | | | | |
Net asset value, beginning of period | | | $10.34 | | | | $9.69 | | | | $9.69 | | | | $10.31 | | | | $10.28 | |
| | | | | |
| Income (loss) from investment operations | | | | | | | | | | | | | | | | | | | | |
Net investment income (loss) (d) | | | $0.08 | | | | $0.05 | | | | $0.04 | (c) | | | $0.07 | | | | $0.09 | |
Net realized and unrealized gain (loss) | | | (0.22 | ) | | | 0.60 | | | | (0.04 | )(g) | | | (0.46 | ) | | | (0.04 | ) |
Total from investment operations | | | $(0.14 | ) | | | $0.65 | | | | $0.00 | (w) | | | $(0.39 | ) | | | $0.05 | |
| | | | | |
| Less distributions declared to shareholders | | | | | | | | | | | | | | | | | | | | |
From net investment income | | | $(0.06 | ) | | | $— | | | | $— | | | | $(0.23 | ) | | | $(0.02 | ) |
Net asset value, end of period (x) | | | $10.14 | | | | $10.34 | | | | $9.69 | | | | $9.69 | | | | $10.31 | |
Total return (%) (k)(r)(s)(x) | | | (1.32 | ) | | | 6.71 | | | | 0.00 | (c)(w) | | | (3.86 | ) | | | 0.49 | |
| | | | | |
Ratios (%) (to average net assets)
and Supplemental data: | | | | | | | | | | | | | | | | | | | | |
Expenses before expense reductions (f) | | | 1.12 | | | | 1.11 | | | | 1.08 | (c) | | | 1.10 | | | | 1.09 | |
Expenses after expense reductions (f) | | | 1.11 | | | | 1.10 | | | | 1.07 | (c) | | | 1.09 | | | | 1.08 | |
Net investment income (loss) | | | 0.80 | | | | 0.52 | | | | 0.41 | (c) | | | 0.67 | | | | 0.81 | |
Portfolio turnover | | | 79 | | | | 67 | | | | 75 | | | | 94 | | | | 31 | |
Net assets at end of period (000 omitted) | | | $826 | | | | $1,034 | | | | $1,572 | | | | $1,586 | | | | $1,809 | |
See Notes to Financial Statements
14
MFS Global Governments Portfolio
Financial Highlights – continued
| (c) | | Amount reflects aone-time reimbursement of expenses by the custodian (or former custodian) without which net investment income and performance would be lower and expenses would be higher. |
| (d) | | Per share data is based on average shares outstanding. |
| (f) | | Ratios do not reflect reductions from fees paid indirectly, if applicable. |
| (g) | | The per share amount varies from the net realized and unrealized gain/loss for the period because of the timing of sales of fund shares and the per share amount of realized and unrealized gains and losses at such time. |
| (k) | | The total return does not reflect expenses that apply to separate accounts. Inclusion of these charges would reduce the total return figures for all periods shown. |
| (r) | | Certain expenses have been reduced without which performance would have been lower. |
| (s) | | From time to time the fund may receive proceeds from litigation settlements, without which performance would be lower. |
| (w) | | Per share amount was less than $0.01 and total return or ratio was less than 0.01%, as applicable. |
| (x) | | The net asset values and total returns have been calculated on net assets which include adjustments made in accordance with U.S. generally accepted accounting principles required at period end for financial reporting purposes. |
See Notes to Financial Statements
15
MFS Global Governments Portfolio
NOTES TO FINANCIAL STATEMENTS
| (1) | | Business and Organization |
MFS Global Governments Portfolio (the fund) is anon-diversified series of MFS Variable Insurance Trust II (the trust). The trust is organized as a Massachusetts business trust and is registered under the Investment Company Act of 1940, as amended, as anopen-end management investment company. The shareholders of each series of the trust are separate accounts of insurance companies, which offer variable annuity and/or life insurance products, and qualified retirement and pension plans.
The fund is an investment company and accordingly follows the investment company accounting and reporting guidance of the Financial Accounting Standards Board (FASB) Accounting Standards Codification Topic 946 Financial Services – Investment Companies.
| (2) | | Significant Accounting Policies |
General– The preparation of financial statements in conformity with U.S. generally accepted accounting principles requires management to make estimates and assumptions that affect the reported amounts of assets and liabilities, and disclosure of contingent assets and liabilities at the date of the financial statements and the reported amounts of increases and decreases in net assets from operations during the reporting period. Actual results could differ from those estimates. In the preparation of these financial statements, management has evaluated subsequent events occurring after the date of the fund’s Statement of Assets and Liabilities through the date that the financial statements were issued. The fund invests in foreign securities. Investments in foreign securities are vulnerable to the effects of changes in the relative values of the local currency and the U.S. dollar and to the effects of changes in each country’s market, economic, industrial, political, regulatory, geopolitical, and other conditions.
In March 2017, the FASB issued Accounting Standards Update2017-08, Receivables – Nonrefundable Fees and Other Costs (Subtopic310-20) – Premium Amortization on Purchased Callable Debt Securities (“ASU2017-08”). For entities that hold callable debt securities at a premium, ASU2017-08 requires that the premium be amortized to the earliest call date. ASU2017-08 will be effective for fiscal years beginning after December 15, 2018, and interim periods within those fiscal years. Management has evaluated the potential impacts of ASU2017-08 and believes that adoption of ASU2017-08 will not have a material effect on the fund’s overall financial position or its overall results of operations.
In August 2018, the FASB issued Accounting Standards Update2018-13, Fair Value Measurement (Topic 820) – Disclosure Framework – Changes to the Disclosure Requirements for Fair Value Measurement (“ASU2018-13”) which introduces new fair value disclosure requirements as well as eliminates and modifies certain existing fair value disclosure requirements. ASU2018-13 would be effective for fiscal years beginning after December 15, 2019, and interim periods within those fiscal years; however, management has elected to early adopt ASU2018-13 effective with the current reporting period. The impact of the fund’s adoption was limited to changes in the fund’s financial statement disclosures regarding fair value, primarily those disclosures related to transfers between levels of the fair value hierarchy.
In August 2018, the Securities and Exchange Commission (SEC) released its Final Rule on Disclosure Update and Simplification (the “Final Rule”) which is intended to simplify an issuer’s disclosure compliance efforts by removing redundant or outdated disclosure requirements without significantly altering the mix of information provided to investors. Effective with the current reporting period, the fund adopted the Final Rule with the impacts being that the fund is no longer required to present the components of distributable earnings on the Statement of Assets and Liabilities or the sources of distributions to shareholders and the amount of undistributed net investment income on the Statements of Changes in Net Assets.
Balance Sheet Offsetting– The fund’s accounting policy with respect to balance sheet offsetting is that, absent an event of default by the counterparty or a termination of the agreement, the International Swaps and Derivatives Association (ISDA) Master Agreement, or similar agreement, does not result in an offset of reported amounts of financial assets and financial liabilities in the Statement of Assets and Liabilities across transactions between the fund and the applicable counterparty. The fund’s right to setoff may be restricted or prohibited by the bankruptcy or insolvency laws of the particular jurisdiction to which a specific master netting agreement counterparty is subject. Balance sheet offsetting disclosures, to the extent applicable to the fund, have been included in the fund’s Significant Accounting Policies note under the captions for each of the fund’sin-scope financial instruments and transactions.
Investment Valuations– Debt instruments and floating rate loans, including restricted debt instruments, are generally valued at an evaluated or composite bid as provided by a third-party pricing service. Short-term instruments with a maturity at issuance of 60 days or less may be valued at amortized cost, which approximates market value. Futures contracts are generally valued at last posted settlement price on their primary exchange as provided by a third-party pricing service. Futures contracts for which there were no trades that day for a particular position are generally valued at the closing bid quotation on their primary exchange as provided by a third-party pricing service. Forward foreign currency exchange contracts are generally valued at the mean of bid and asked prices for the time period interpolated from rates provided by a third-party pricing service for proximate time periods. Swap agreements are generally valued at valuations provided by a third-party pricing service, which for cleared swaps includes an evaluation of any trading activity at the clearinghouses.Open-end investment companies are generally valued at net asset value per share. Securities and other
16
MFS Global Governments Portfolio
Notes to Financial Statements – continued
assets generally valued on the basis of information from a third-party pricing service may also be valued at a broker/dealer bid quotation. In determining values, third-party pricing services can utilize both transaction data and market information such as yield, quality, coupon rate, maturity, type of issue, trading characteristics, and other market data. The values of foreign securities and other assets and liabilities expressed in foreign currencies are converted to U.S. dollars using the mean of bid and asked prices for rates provided by a third-party pricing service.
The Board of Trustees has delegated primary responsibility for determining or causing to be determined the value of the fund’s investments (including any fair valuation) to the adviser pursuant to valuation policies and procedures approved by the Board. If the adviser determines that reliable market quotations are not readily available, investments are valued at fair value as determined in good faith by the adviser in accordance with such procedures under the oversight of the Board of Trustees. Under the fund’s valuation policies and procedures, market quotations are not considered to be readily available for most types of debt instruments and floating rate loans and many types of derivatives. These investments are generally valued at fair value based on information from third-party pricing services. In addition, investments may be valued at fair value if the adviser determines that an investment’s value has been materially affected by events occurring after the close of the exchange or market on which the investment is principally traded (such as foreign exchange or market) and prior to the determination of the fund’s net asset value, or after the halting of trading of a specific security where trading does not resume prior to the close of the exchange or market on which the security is principally traded. The adviser generally relies on third-party pricing services or other information (such as the correlation with price movements of similar securities in the same or other markets; the type, cost and investment characteristics of the security; the business and financial condition of the issuer; and trading and other market data) to assist in determining whether to fair value and at what value to fair value an investment. The value of an investment for purposes of calculating the fund’s net asset value can differ depending on the source and method used to determine value. When fair valuation is used, the value of an investment used to determine the fund’s net asset value may differ from quoted or published prices for the same investment. There can be no assurance that the fund could obtain the fair value assigned to an investment if it were to sell the investment at the same time at which the fund determines its net asset value per share.
Various inputs are used in determining the value of the fund’s assets or liabilities. These inputs are categorized into three broad levels. In certain cases, the inputs used to measure fair value may fall into different levels of the fair value hierarchy. In such cases, an investment’s level within the fair value hierarchy is based on the lowest level of input that is significant to the fair value measurement. The fund’s assessment of the significance of a particular input to the fair value measurement in its entirety requires judgment, and considers factors specific to the investment. Level 1 includes unadjusted quoted prices in active markets for identical assets or liabilities. Level 2 includes other significant observable market-based inputs (including quoted prices for similar securities, interest rates, prepayment speed, and credit risk). Level 3 includes unobservable inputs, which may include the adviser’s own assumptions in determining the fair value of investments. Other financial instruments are derivative instruments, such as forward foreign currency exchange contracts. The following is a summary of the levels used as of December 31, 2018 in valuing the fund’s assets or liabilities:
| | | | | | | | | | | | | | | | |
| Financial Instruments | | Level 1 | | | Level 2 | | | Level 3 | | | Total | |
| U.S. Treasury Bonds & U.S. Government Agency & Equivalents | | | $— | | | | $65,149,718 | | | | $— | | | | $65,149,718 | |
| Non-U.S. Sovereign Debt | | | — | | | | 68,537,394 | | | | — | | | | 68,537,394 | |
| Residential Mortgage-Backed Securities | | | — | | | | 814,443 | | | | — | | | | 814,443 | |
| Commercial Mortgage-Backed Securities | | | — | | | | 3 | | | | — | | | | 3 | |
| Mutual Funds | | | 902,742 | | | | — | | | | — | | | | 902,742 | |
| Total | | | $902,742 | | | | $134,501,558 | | | | $— | | | | $135,404,300 | |
| | | | |
| Other Financial Instruments | | | | | | | | | | | | |
| Forward Foreign Currency Exchange Contracts – Assets | | | $— | | | | $1,030,004 | | | | $— | | | | $1,030,004 | |
| Forward Foreign Currency Exchange Contracts – Liabilities | | | — | | | | (976,069 | ) | | | — | | | | (976,069 | ) |
For further information regarding security characteristics, see the Portfolio of Investments.
Foreign Currency Translation– Purchases and sales of foreign investments, income, and expenses are converted into U.S. dollars based upon currency exchange rates prevailing on the respective dates of such transactions or on the reporting date for foreign denominated receivables and payables. Gains and losses attributable to foreign currency exchange rates on sales of securities are recorded for financial statement purposes as net realized gains and losses on investments. Gains and losses attributable to foreign exchange rate movements on receivables, payables, income and expenses are recorded for financial statement purposes as foreign currency transaction gains and losses. That portion of both realized and unrealized gains and losses on investments that results from fluctuations in foreign currency exchange rates is not separately disclosed.
17
MFS Global Governments Portfolio
Notes to Financial Statements – continued
Derivatives– The fund uses derivatives primarily to increase or decrease exposure to a particular market or segment of the market, or security, to increase or decrease interest rate or currency exposure, or as alternatives to direct investments. Derivatives are used for hedging ornon-hedging purposes. While hedging can reduce or eliminate losses, it can also reduce or eliminate gains. When the fund uses derivatives as an investment to increase market exposure, or for hedging purposes, gains and losses from derivative instruments may be substantially greater than the derivative’s original cost.
The derivative instruments used by the fund during the period were futures contracts, forward foreign currency exchange contracts, and swap agreements. Depending on the type of derivative, the fund may exit a derivative position by entering into an offsetting transaction with a counterparty or exchange, negotiating an agreement with the derivative counterparty, or novating the position to a third party. The fund’s period end derivatives, as presented in the Portfolio of Investments and the associated Derivative Contract tables, generally are indicative of the volume of its derivative activity during the period.
The following table presents, by major type of derivative contract, the fair value, on a gross basis, of the asset and liability components of derivatives held by the fund at December 31, 2018 as reported in the Statement of Assets and Liabilities:
| | | | | | | | | | |
| | | | | Fair Value | |
| Risk | | Derivative Contracts | | Asset Derivatives | | | Liability Derivatives | |
| Foreign Exchange | | Forward Foreign Currency Exchange Contracts | | | $1,030,004 | | | | $(976,069 | ) |
The following table presents, by major type of derivative contract, the realized gain (loss) on derivatives held by the fund for the year ended December 31, 2018 as reported in the Statement of Operations:
| | | | | | | | | | | | |
| Risk | | Futures Contracts | | | Swap Agreements | | | Forward Foreign Currency Exchange Contracts | |
| Interest Rate | | | $(130,063 | ) | | | $(16,412 | ) | | | $— | |
| Foreign Exchange | | | — | | | | — | | | | (224,812 | ) |
| Total | | | $(130,063 | ) | | | $(16,412 | ) | | | $(224,812 | ) |
The following table presents, by major type of derivative contract, the change in unrealized appreciation or depreciation on derivatives held by the fund for the year ended December 31, 2018 as reported in the Statement of Operations:
| | | | |
| Risk | | Forward Foreign Currency
Exchange Contracts | |
| Foreign Exchange | | | $269,945 | |
Derivative counterparty credit risk is managed through formal evaluation of the creditworthiness of all potential counterparties. On certain, but not all, uncleared derivatives, the fund attempts to reduce its exposure to counterparty credit risk whenever possible by entering into an ISDA Master Agreement on a bilateral basis. The ISDA Master Agreement gives each party to the agreement the right to terminate all transactions traded under such agreement if there is a specified deterioration in the credit quality of the other party. Upon an event of default or a termination of the ISDA Master Agreement, thenon-defaulting party has the right to close out all transactions traded under such agreement and to net amounts owed under each agreement to one net amount payable by one party to the other. This right to close out and net payments across all transactions traded under the ISDA Master Agreement could result in a reduction of the fund’s credit risk to such counterparty equal to any amounts payable by the fund under the applicable transactions, if any.
Collateral and margin requirements differ by type of derivative. For cleared derivatives (e.g., futures contracts, cleared swaps, and exchange-traded options), margin requirements are set by the clearing broker and the clearing house and collateral, in the form of cash or securities, is posted by the fund directly with the clearing broker. Collateral terms are counterparty agreement specific for uncleared derivatives (e.g., forward foreign currency exchange contracts, uncleared swap agreements, and uncleared options) and collateral, in the form of cash and securities, is held in segregated accounts with the fund’s custodian in connection with these agreements. For derivatives traded under an ISDA Master Agreement, which contains a collateral support annex, the collateral requirements are netted across all transactions traded under such counterparty-specific agreement and an amount is posted from one party to the other to collateralize such obligations. Cash that has been segregated or delivered to cover the fund’s collateral or margin obligations under derivative contracts, if any, will be reported separately in the Statement of Assets and Liabilities as restricted cash for uncleared derivatives and/or deposits with brokers for cleared derivatives. Securities pledged as collateral or margin for the same purpose, if any, are noted in the Portfolio of Investments. The fund may be required to make payments of interest on uncovered collateral or margin obligations with the broker. Any such payments are included in “Miscellaneous” expense in the Statement of Operations.
18
MFS Global Governments Portfolio
Notes to Financial Statements – continued
Futures Contracts – The fund entered into futures contracts which may be used to hedge against or obtain broad market exposure, interest rate exposure, currency exposure, or to manage duration. A futures contract represents a commitment for the future purchase or sale of an asset at a specified price on a specified date.
Upon entering into a futures contract, the fund is required to deposit with the broker, either in cash or securities, an initial margin in an amount equal to a specified percentage of the notional amount of the contract. Subsequent payments (variation margin) are made or received by the fund each day, depending on the daily fluctuations in the value of the contract, and are recorded for financial statement purposes as unrealized gain or loss by the fund until the contract is closed or expires at which point the gain or loss on futures contracts is realized.
The fund bears the risk of interest rates, exchange rates or securities prices moving unexpectedly, in which case, the fund may not achieve the anticipated benefits of the futures contracts and may realize a loss. While futures contracts may present less counterparty risk to the fund since the contracts are exchange traded and the exchange’s clearinghouse guarantees payments to the broker, there is still counterparty credit risk due to the insolvency of the broker. The fund’s maximum risk of loss due to counterparty credit risk is equal to the margin posted by the fund to the broker plus any gains or minus any losses on the outstanding futures contracts.
Forward Foreign Currency Exchange Contracts– The fund entered into forward foreign currency exchange contracts for the purchase or sale of a specific foreign currency at a fixed price on a future date. These contracts may be used to hedge the fund’s currency risk or fornon-hedging purposes. For hedging purposes, the fund may enter into contracts to deliver or receive foreign currency that the fund will receive from or use in its normal investment activities. The fund may also use contracts to hedge against declines in the value of foreign currency denominated securities due to unfavorable exchange rate movements. Fornon-hedging purposes, the fund may enter into contracts with the intent of changing the relative exposure of the fund’s portfolio of securities to different currencies to take advantage of anticipated exchange rate changes.
Forward foreign currency exchange contracts are adjusted by the daily exchange rate of the underlying currency and any unrealized gains or losses are recorded as a receivable or payable for forward foreign currency exchange contracts until the contract settlement date. On contract settlement date, any gain or loss on the contract is recorded as realized gains or losses on forward foreign currency exchange contracts.
Risks may arise upon entering into these contracts from unanticipated movements in the value of the contract and from the potential inability of counterparties to meet the terms of their contracts. Generally, the fund’s maximum risk due to counterparty credit risk is the unrealized gain on the contract due to the use of Continuous Linked Settlement, a multicurrency cash settlement system for the centralized settlement of foreign transactions. This risk is mitigated in cases where there is an ISDA Master Agreement between the fund and the counterparty providing for netting as described above and, where applicable, by the posting of collateral by the counterparty to the fund to cover the fund’s exposure to the counterparty under such ISDA Master Agreement.
Swap Agreements– During the period the fund entered into swap agreements. Swap agreements generally involve a periodic exchange of cash payments on a net basis, at specified intervals or upon the occurrence of specified events, between the fund and a counterparty. Certain swap agreements may be entered into as a bilateral contract (“uncleared swaps”) while others are required to be centrally cleared (“cleared swaps”). In a cleared swap transaction, the ultimate counterparty to the transaction is a clearinghouse (the “clearinghouse”). The contract is transferred and accepted by the clearinghouse immediately following execution of the swap contract with an executing broker. Thereafter, throughout the term of the cleared swap, the fund interfaces indirectly with the clearinghouse through a clearing broker and has counterparty risk to the clearing broker as well.
Amounts paid or received at the inception of uncleared swap agreements are presented parenthetically as premiums paid or received and reflected in the value of the uncleared swap in the Statement of Assets and Liabilities. Those premiums are amortized using the effective interest method over the term of the agreement as realized gain or loss on swap agreements in the Statement of Operations. The value of the uncleared swap agreements, which is adjusted daily and includes any related interest accruals to be paid or received by the fund, is recorded in the Statement of Assets and Liabilities as “Uncleared swaps, at value”. The daily change in the value of uncleared swaps, including any related interest accruals to be paid or received, is recorded as unrealized appreciation or depreciation on swap agreements in the Statement of Operations. For cleared swaps, the daily change in valuation is recorded as a receivable or payable for variation margin in the Statement of Assets and Liabilities and reflected in unrealized appreciation or depreciation on swap agreements in the Statement of Operations. The periodic exchange of net cash payments, at specified intervals or upon the occurrence of specified events as stipulated by the agreement, is recorded as realized gain or loss on swap agreements in the Statement of Operations. A liquidation payment received or made upon early termination is recorded as a realized gain or loss on swap agreements in the Statement of Operations.
Risks related to swap agreements include the possible lack of a liquid market, unfavorable market and interest rate movements of the underlying instrument and the failure of the counterparty to perform under the terms of the agreements. The fund’s maximum risk of loss from counterparty credit risk is the discounted net value of the cash flows to be received from/paid to the counterparty over the contract’s remaining life, to the extent that the amount is positive. To address counterparty risk, uncleared swap
19
MFS Global Governments Portfolio
Notes to Financial Statements – continued
agreements are limited to only highly-rated counterparties. Risk is further reduced by having an ISDA Master Agreement between the fund and the counterparty providing for netting as described above and, where applicable, by the posting of collateral by the counterparty to the fund to cover the fund’s exposure to the counterparty under such ISDA Master Agreement. The fund’s counterparty risk due to cleared swaps is mitigated by the fact that the clearinghouse is the true counterparty to the transaction and the regulatory requirement safeguards in the event of a clearing broker bankruptcy.
The fund entered into inflation swap agreements in order to manage its exposure to inflation risk. Inflation swap agreements involve the periodic exchange of cash flows, between the fund and a counterparty, based on the difference between two rates applied to a notional principal amount. The two rates exchanged are generally a fixed rate and a floating rate based on an inflation index.
Indemnifications– Under the fund’s organizational documents, its officers and Trustees may be indemnified against certain liabilities and expenses arising out of the performance of their duties to the fund. Additionally, in the normal course of business, the fund enters into agreements with service providers that may contain indemnification clauses. The fund’s maximum exposure under these agreements is unknown as this would involve future claims that may be made against the fund that have not yet occurred.
Investment Transactions and Income– Investment transactions are recorded on the trade date. Interest income is recorded on the accrual basis. All premium and discount is amortized or accreted for financial statement purposes in accordance with U.S. generally accepted accounting principles. Interest payments received in additional securities are recorded on theex-interest date in an amount equal to the value of the security on such date.
The fund may receive proceeds from litigation settlements. Any proceeds received from litigation involving portfolio holdings are reflected in the Statement of Operations in realized gain/loss if the security has been disposed of by the fund or in unrealized gain/loss if the security is still held by the fund. Any other proceeds from litigation not related to portfolio holdings are reflected as other income in the Statement of Operations.
Tax Matters and Distributions– The fund intends to qualify as a regulated investment company, as defined under Subchapter M of the Internal Revenue Code, and to distribute all of its taxable income, including realized capital gains. As a result, no provision for federal income tax is required. The fund’s federal tax returns, when filed, will remain subject to examination by the Internal Revenue Service for a three year period. Management has analyzed the fund’s tax positions taken on federal and state tax returns for all open tax years and does not believe that there are any uncertain tax positions that require recognition of a tax liability. Foreign taxes, if any, have been accrued by the fund in the accompanying financial statements in accordance with the applicable foreign tax law. Foreign income taxes may be withheld by certain countries in which the fund invests. Additionally, capital gains realized by the fund on securities issued in or by certain foreign countries may be subject to capital gains tax imposed by those countries.
Distributions to shareholders are recorded on theex-dividend date. Income and capital gain distributions are determined in accordance with income tax regulations, which may differ from U.S. generally accepted accounting principles. Certain capital accounts in the financial statements are periodically adjusted for permanent differences in order to reflect their tax character. These adjustments have no impact on net assets or net asset value per share. Temporary differences which arise from recognizing certain items of income, expense, gain or loss in different periods for financial statement and tax purposes will reverse at some time in the future. Distributions in excess of net investment income or net realized gains are temporary overdistributions for financial statement purposes resulting from differences in the recognition or classification of income or distributions for financial statement and tax purposes.
Book/tax differences primarily relate to amortization and accretion of debt securities, wash sale loss deferrals, and straddle loss deferrals.
The tax character of distributions declared to shareholders for the last two fiscal years is as follows:
| | | | | | | | |
| | | Year ended
12/31/18 | | | Year ended
12/31/17 | |
| Ordinary income (including any short-term capital gains) | | | $1,441,037 | | | | $— | |
The federal tax cost and the tax basis components of distributable earnings were as follows:
| | | | |
| As of 12/31/18 | | | | |
| |
| Cost of investments | | | $135,483,355 | |
| Gross appreciation | | | 2,234,229 | |
| Gross depreciation | | | (2,259,349 | ) |
| Net unrealized appreciation (depreciation) | | | $(25,120 | ) |
| |
| Undistributed ordinary income | | | 3,198,236 | |
| Capital loss carryforwards | | | (7,056,379 | ) |
| Other temporary differences | | | (2,715 | ) |
20
MFS Global Governments Portfolio
Notes to Financial Statements – continued
As of December 31, 2018, the fund had capital loss carryforwards available to offset future realized gains. These net capital losses may be carried forward indefinitely and their character is retained as short-term and/or long-term losses. Such losses are characterized as follows:
| | | | |
| Short-Term | | | $(4,014,241 | ) |
| Long-Term | | | (3,042,138 | ) |
| Total | | | $(7,056,379 | ) |
Multiple Classes of Shares of Beneficial Interest– The fund offers multiple classes of shares, which differ in their respective distribution and/or service fees. The fund’s income, realized and unrealized gain (loss), and common expenses are allocated to shareholders based on the daily net assets of each class. Dividends are declared separately for each class. Differences in per share dividend rates are generally due to differences in separate class expenses. The fund’s distributions declared to shareholders as reported in the Statements of Changes in Net Assets are presented by class as follows:
| | | | | | | | |
| | | From net investment
income | |
| | |
| | | Year ended
12/31/18 | | | Year ended
12/31/17 | |
| Initial Class | | | $1,435,695 | | | | $— | |
| Service Class | | | 5,342 | | | | — | |
| Total | | | $1,441,037 | | | | $— | |
| (3) | | Transactions with Affiliates |
Investment Adviser– The fund has an investment advisory agreement with MFS to provide overall investment management and related administrative services and facilities to the fund. The management fee is computed daily and paid monthly at the following annual rates based on the fund’s average daily net assets:
| | | | |
| Up to $300 million | | | 0.75% | |
| In excess of $300 million and up to $1 billion | | | 0.675% | |
| In excess of $1 billion | | | 0.625% | |
MFS has agreed in writing to reduce its management fee by a specified amount if certain MFS mutual fund assets exceed thresholds agreed to by MFS and the fund’s Board of Trustees. For the year ended December 31, 2018, this management fee reduction amounted to $14,117, which is included in the reduction of total expenses in the Statement of Operations. The management fee incurred for the year ended December 31, 2018 was equivalent to an annual effective rate of 0.74% of the fund’s average daily net assets.
The investment adviser has agreed in writing to pay a portion of the fund’s total annual operating expenses, excluding interest, taxes, extraordinary expenses, brokerage and transaction costs, and investment-related expenses, such that total annual operating expenses do not exceed 1.00% of average daily net assets for the Initial Class shares and 1.25% of average daily net assets for the Service Class shares. This written agreement will continue until modified by the fund’s Board of Trustees, but such agreement will continue at least until April 30, 2020. For the year ended December 31, 2018, the fund’s actual operating expenses did not exceed the limit and therefore, the investment adviser did not pay any portion of the fund’s expenses related to this agreement.
Distributor– MFS Fund Distributors, Inc. (MFD), a wholly-owned subsidiary of MFS, is the distributor of shares of the fund. The Trustees have adopted a distribution plan for the Service Class shares pursuant to Rule12b-1 under the Investment Company Act of 1940.
The fund’s distribution plan provides that the fund will pay MFD distribution and/or service fees equal to 0.25% per annum of its average daily net assets attributable to Service Class shares as partial consideration for services performed and expenses incurred by MFD and financial intermediaries (including participating insurance companies that invest in the fund to fund variable annuity and variable life insurance contracts, sponsors of qualified retirement and pension plans that invest in the fund, and affiliates of these participating insurance companies and plan sponsors) in connection with the sale and distribution of the Service Class shares. MFD may subsequently pay all, or a portion, of the distribution and/or service fees to financial intermediaries.
Shareholder Servicing Agent– MFS Service Center, Inc. (MFSC), a wholly-owned subsidiary of MFS, receives a fee from the fund for its services as shareholder servicing agent. For the year ended December 31, 2018, the fee was $1,872, which equated to 0.0013% annually of the fund’s average daily net assets. MFSC also receives payment from the fund forout-of-pocket expenses paid by MFSC on behalf of the fund. For the year ended December 31, 2018, these costs amounted to $160.
Administrator– MFS provides certain financial, legal, shareholder communications, compliance, and other administrative services to the fund. Under an administrative services agreement, the fund reimburses MFS the costs incurred to provide these services. The
21
MFS Global Governments Portfolio
Notes to Financial Statements – continued
fund is charged an annual fixed amount of $17,500 plus a fee based on average daily net assets. The administrative services fee incurred for the year ended December 31, 2018 was equivalent to an annual effective rate of 0.0212% of the fund’s average daily net assets.
Trustees’ and Officers’ Compensation– The fund pays compensation to independent Trustees in the form of a retainer, attendance fees, and additional compensation to Board and Committee chairpersons. The fund does not pay compensation directly to Trustees or officers of the fund who are also officers of the investment adviser, all of whom receive remuneration for their services to the fund from MFS. Certain officers and Trustees of the fund are officers or directors of MFS, MFD, and MFSC.
Other– This fund and certain other funds managed by MFS (the funds) have entered into a service agreement (the ISO Agreement) which provides for payment of fees solely by the funds to Tarantino LLC in return for the provision of services of an Independent Senior Officer (ISO) for the funds. Frank L. Tarantino serves as the ISO and is an officer of the funds and the sole member of Tarantino LLC. The funds can terminate the ISO Agreement with Tarantino LLC at any time under the terms of the ISO Agreement. For the year ended December 31, 2018, the fee paid by the fund under this agreement was $248 and is included in “Miscellaneous” expense in the Statement of Operations. MFS has agreed to bear all expenses associated with office space, other administrative support, and supplies provided to the ISO.
The fund invests in the MFS Institutional Money Market Portfolio which is managed by MFS and seeks current income consistent with preservation of capital and liquidity. This money market fund does not pay a management fee to MFS.
For the year ended December 31, 2018, purchases and sales of investments, other than short-term obligations, were as follows:
| | | | | | | | |
| | | Purchases | | | Sales | |
| U.S. Government securities | | | $41,513,087 | | | | $30,725,877 | |
| Non-U.S. Government securities | | | $70,904,210 | | | | $90,558,713 | |
| (5) | | Shares of Beneficial Interest |
The fund’s Declaration of Trust permits the Trustees to issue an unlimited number of full and fractional shares of beneficial interest. Transactions in fund shares were as follows:
| | | | | | | | | | | | | | | | |
| | | Year ended 12/31/18 | | | Year ended 12/31/17 | |
| | | | |
| | | Shares | | | Amount | | | Shares | | | Amount | |
| Shares sold | | | | | | | | | | | | | | | | |
Initial Class | | | 70,831 | | | | $740,148 | | | | 218,274 | | | | $2,232,217 | |
Service Class | | | 13,882 | | | | 144,462 | | | | 16,354 | | | | 161,407 | |
| | | 84,713 | | | | $884,610 | | | | 234,628 | | | | $2,393,624 | |
| | | | |
| Shares issued to shareholders in reinvestment of distributions | | | | | | | | | | | | | | | | |
Initial Class | | | 140,068 | | | | $1,435,695 | | | | — | | | | $— | |
Service Class | | | 531 | | | | 5,342 | | | | — | | | | — | |
| | | 140,599 | | | | $1,441,037 | | | | — | | | | $— | |
| | | | |
| Shares reacquired | | | | | | | | | | | | | | | | |
Initial Class | | | (2,278,906 | ) | | | $(23,714,753 | ) | | | (1,530,744 | ) | | | $(15,870,105 | ) |
Service Class | | | (32,954 | ) | | | (339,471 | ) | | | (78,628 | ) | | | (794,204 | ) |
| | | (2,311,860 | ) | | | $(24,054,224 | ) | | | (1,609,372 | ) | | | $(16,664,309 | ) |
| | | | |
| Net change | | | | | | | | | | | | | | | | |
Initial Class | | | (2,068,007 | ) | | | $(21,538,910 | ) | | | (1,312,470 | ) | | | $(13,637,888 | ) |
Service Class | | | (18,541 | ) | | | (189,667 | ) | | | (62,274 | ) | | | (632,797 | ) |
| | | (2,086,548 | ) | | | $(21,728,577 | ) | | | (1,374,744 | ) | | | $(14,270,685 | ) |
The fund is one of several mutual funds in which certain MFS funds may invest. The MFS funds do not invest in the underlying funds for the purpose of exercising management or control. At the end of the period, the MFS Moderate Allocation Portfolio, the MFS Conservative Allocation Portfolio, and the MFS Growth Allocation Portfolio were the owners of record of approximately 53%, 27%, and 10%, respectively, of the value of outstanding voting shares of the fund.
The fund and certain other funds managed by MFS participate in a $1.25 billion unsecured committed line of credit, subject to a $1 billion sublimit, provided by a syndication of banks under a credit agreement. Borrowings may be made for temporary financing needs. Interest is charged to each fund, based on its borrowings, generally at a rate equal to the higher of the Overnight Bank Funding rate or daily one month LIBOR plus an agreed upon spread. A commitment fee, based on the average daily, unused portion of the committed line of credit, is allocated among the participating funds. In addition, the fund and other funds managed by MFS
22
MFS Global Governments Portfolio
Notes to Financial Statements – continued
have established unsecured uncommitted borrowing arrangements with certain banks for temporary financing needs. Interest is charged to each fund, based on its borrowings, at a rate equal to the Overnight Bank Funding rate plus an agreed upon spread. For the year ended December 31, 2018, the fund’s commitment fee and interest expense were $860 and $0, respectively, and are included in “Miscellaneous” expense in the Statement of Operations.
| (7) | | Investments in Affiliated Issuers |
An affiliated issuer may be considered one in which the fund owns 5% or more of the outstanding voting securities, or a company which is under common control. For the purposes of this report, the fund assumes the following to be affiliated issuers:
| | | | | | | | | | | | | | | | | | |
| Affiliated Issuers | | | | Beginning
Shares/Par
Amount | | | Acquisitions
Shares/Par
Amount | | | Dispositions
Shares/Par
Amount | | | Ending
Shares/Par
Amount | |
| | | | | |
| MFS Institutional Money Market Portfolio | | | | | 11,035,474 | | | | 75,575,371 | | | | (85,708,013 | ) | | | 902,832 | |
| | | | | |
| Affiliated Issuers | | Realized
Gain (Loss) | | Change in
Unrealized
Appreciation/
Depreciation | | | Capital Gain
Distributions | | | Dividend
Income | | | Ending
Value | |
| | | | | |
| MFS Institutional Money Market Portfolio | | $(297) | | | $407 | | | | $— | | | | $91,241 | | | | $902,742 | |
23
MFS Global Governments Portfolio
REPORT OF INDEPENDENT REGISTERED PUBLIC ACCOUNTING FIRM
To the Board of Trustees of MFS Variable Insurance Trust II and the Shareholders of
MFS Global Governments Portfolio:
Opinion on the Financial Statements and Financial Highlights
We have audited the accompanying statement of assets and liabilities of MFS Global Governments Portfolio (the “Fund”), including the portfolio of investments, as of December 31, 2018, the related statement of operations for the year then ended, the statements of changes in net assets for each of the two years in the period then ended, the financial highlights for each of the five years in the period then ended, and the related notes. In our opinion, the financial statements and financial highlights present fairly, in all material respects, the financial position of the Fund as of December 31, 2018, and the results of its operations for the year then ended, the changes in its net assets for each of the two years in the period then ended, and the financial highlights for each of the five years in the period then ended, in conformity with accounting principles generally accepted in the United States of America.
Basis for Opinion
These financial statements and financial highlights are the responsibility of the Fund’s management. Our responsibility is to express an opinion on the Fund’s financial statements and financial highlights based on our audits. We are a public accounting firm registered with the Public Company Accounting Oversight Board (United States) (PCAOB) and are required to be independent with respect to the Fund in accordance with the U.S. federal securities laws and the applicable rules and regulations of the Securities and Exchange Commission and the PCAOB.
We conducted our audits in accordance with the standards of the PCAOB. Those standards require that we plan and perform the audit to obtain reasonable assurance about whether the financial statements and financial highlights are free of material misstatement, whether due to error or fraud. The Fund is not required to have, nor were we engaged to perform, an audit of its internal control over financial reporting. As part of our audits we are required to obtain an understanding of internal control over financial reporting but not for the purpose of expressing an opinion on the effectiveness of the Fund’s internal control over financial reporting. Accordingly, we express no such opinion.
Our audits included performing procedures to assess the risks of material misstatement of the financial statements and financial highlights, whether due to error or fraud, and performing procedures that respond to those risks. Such procedures included examining, on a test basis, evidence regarding the amounts and disclosures in the financial statements and financial highlights. Our audits also included evaluating the accounting principles used and significant estimates made by management, as well as evaluating the overall presentation of the financial statements and financial highlights. Our procedures included confirmation of securities owned as of December 31, 2018, by correspondence with the custodian and brokers. We believe that our audits provide a reasonable basis for our opinion.
DELOITTE & TOUCHE LLP
Boston, Massachusetts
February 15, 2019
We have served as the auditor of one or more of the MFS investment companies since 1924.
24
MFS Global Governments Portfolio
TRUSTEES AND OFFICERS – IDENTIFICATION AND BACKGROUND
The Trustees and Officers of the Trust, as of February 1, 2019, are listed below, together with their principal occupations during the past five years. (Their titles may have varied during that period.) The address of each Trustee and Officer is 111 Huntington Avenue, Boston, Massachusetts 02199-7618.
| | | | | | | | | | |
Name, Age | | Position(s)
Held with Fund | | Trustee/Officer
Since (h) | | Number of MFS Funds overseen by the Trustee | | Principal Occupations
During the Past Five Years | | Other Directorships During the Past Five Years (j) |
| INTERESTED TRUSTEES |
Robert J. Manning (k) (age 55) | | Trustee | | February 2004 | | 135 | | Massachusetts Financial Services Company, Executive Chairman (since January 2017); Director; Chairman of the Board; Chief Executive Officer (until 2015);Co-Chief Executive Officer(2015-2016) | | N/A |
| | | | | |
Robin A. Stelmach (k) (age 57) | | Trustee | | January 2014 | | 135 | | Massachusetts Financial Services Company, Vice Chair (since January 2017); Chief Operating Officer and Executive Vice President (until January 2017) | | N/A |
|
| INDEPENDENT TRUSTEES |
John P. Kavanaugh (age 64) | | Trustee and Chair of Trustees | | January 2009 | | 135 | | Private investor | | N/A |
| | | | | |
Steven E. Buller (age 67) | | Trustee | | February 2014 | | 135 | | Financial Accounting Standards Advisory Council, Chairman(2014-2015); Public Company Accounting Oversight Board, Standing Advisory Group, Member (until 2014); BlackRock, Inc. (investment management), Managing Director (until 2014), BlackRock Finco UK (investment management), Director (until 2014) | | N/A |
| | | | | |
John A. Caroselli (age 64) | | Trustee | | March 2017 | | 135 | | JC Global Advisors, LLC (management consulting), President (since 2015); First Capital Corporation (commercial finance), Executive Vice President (until 2015) | | N/A |
| | | | | |
Maureen R. Goldfarb (age 63) | | Trustee | | January 2009 | | 135 | | Private investor | | N/A |
| | | | | |
Michael Hegarty (age 74) | | Trustee | | December 2004 | | 135 | | Private investor | | Rouse Properties Inc., Director (until 2016); Capmark Financial Group Inc., Director (until 2015) |
| | | | | |
Peter D. Jones (age 63) | | Trustee | | January 2019 | | 135 | | Franklin Templeton Distributors, Inc. (investment management), President (until 2015); Franklin Templeton Institutional, LLC (investment management), Chairman (until 2015) | | N/A |
| | | | | |
James W. Kilman, Jr. (age 57) | | Trustee | | January 2019 | | 135 | | KielStrand Capital LLC (family office and merchant bank), Chief Executive Officer (since 2016); Morgan Stanley & Co. (financial services), Vice Chairman of Investment Banking,Co-Head of Diversified Financials Coverage – Financial Institutions Investment Banking Group (until 2016) | | alpha-En Corporation, Director (since 2016) |
25
MFS Global Governments Portfolio
Trustees and Officers – continued
| | | | | | | | | | |
Name, Age | | Position(s)
Held with Fund | | Trustee/Officer
Since (h) | | Number of MFS Funds overseen by the Trustee | | Principal Occupations
During the Past Five Years | | Other Directorships During the Past Five Years (j) |
Clarence Otis, Jr. (age 62) | | Trustee | | March 2017 | | 135 | | Darden Restaurants, Inc., Chief Executive Officer (until 2014) | | VF Corporation, Director; Verizon Communications, Inc., Director; The Travelers Companies, Director; Federal Reserve Bank of Atlanta, Director (until 2015) |
| | | | | |
Maryanne L. Roepke (age 62) | | Trustee | | May 2014 | | 135 | | American Century Investments (investment management), Senior Vice President and Chief Compliance Officer (until 2014) | | N/A |
| | | | | |
Laurie J. Thomsen
(age 61) | | Trustee | | March 2005 | | 135 | | Private investor | | The Travelers Companies, Director; Dycom Industries, Inc., Director (since 2015) |
| | | | | | | | |
Name, Age | | Position(s)
Held with Fund | | Trustee/Officer
Since (h) | | Number of MFS Funds for which the Person is an Officer | | Principal Occupations During the Past Five Years |
| OFFICERS | | | | | | |
Christopher R. Bohane (k)
(age 45) | | Assistant Secretary and Assistant Clerk | | July 2005 | | 135 | | Massachusetts Financial Services Company, Vice President and Assistant General Counsel |
| | | | |
Kino Clark (k) (age 50) | | Assistant Treasurer | | January 2012 | | 135 | | Massachusetts Financial Services Company, Vice President |
| | | | |
John W. Clark, Jr. (k) (age 51) | | Assistant Treasurer | | April 2017 | | 135 | | Massachusetts Financial Services Company, Vice President (since March 2017); Deutsche Bank (financial services), Department Head – Treasurer’s Office (until February 2017) |
| | | | |
Thomas H. Connors (k) (age 59) | | Assistant Secretary and Assistant Clerk | | September 2012 | | 135 | | Massachusetts Financial Services Company, Vice President and Senior Counsel |
| | | | |
Ethan D. Corey (k)
(age 55) | | Assistant
Secretary and Assistant Clerk | | July 2005 | | 135 | | Massachusetts Financial Services Company, Senior Vice President and Associate General Counsel |
| | | | |
David L. DiLorenzo (k)
(age 50) | | President | | July 2005 | | 135 | | Massachusetts Financial Services Company, Senior Vice President |
| | | | |
Heidi W. Hardin (k) (age 51) | | Secretary and Clerk | | April 2017 | | 135 | | Massachusetts Financial Services Company, Executive Vice President and General Counsel (since March 2017); Harris Associates (investment management), General Counsel (from September 2015 to January 2017); Janus Capital Management LLC (investment management), Senior Vice President and General Counsel (until September 2015) |
| | | | |
Brian E. Langenfeld (k) (age 45) | | Assistant
Secretary and Assistant Clerk | | June 2006 | | 135 | | Massachusetts Financial Services Company, Vice President and Senior Counsel |
| | | | |
Amanda S. Mooradian (k) (age 39) | | Assistant
Secretary and Assistant Clerk | | September 2018 | | 135 | | Massachusetts Financial Services Company, Assistant Vice President and Counsel |
| | | | |
Susan A. Pereira (k)
(age 48) | | Assistant
Secretary and Assistant Clerk | | July 2005 | | 135 | | Massachusetts Financial Services Company, Vice President and Senior Counsel |
| | | | |
Kasey L. Phillips (k) (age 48) | | Assistant Treasurer | | September 2012 | | 135 | | Massachusetts Financial Services Company, Vice President |
| | | | |
Matthew A. Stowe (k) (age 44) | | Assistant Secretary and Assistant Clerk | | October 2014 | | 135 | | Massachusetts Financial Services Company, Vice President and Assistant General Counsel |
26
MFS Global Governments Portfolio
Trustees and Officers – continued
| | | | | | | | |
Name, Age | | Position(s)
Held with Fund | | Trustee/Officer
Since (h) | | Number of MFS Funds for which the Person is an Officer | | Principal Occupations During the Past Five Years |
Frank L. Tarantino
(age 74) | | Independent
Senior Officer | | June 2004 | | 135 | | Tarantino LLC (provider of compliance services), Principal |
| | | | |
Richard S. Weitzel (k)
(age 48) | | Assistant Secretary and Assistant Clerk | | October 2007 | | 135 | | Massachusetts Financial Services Company, Senior Vice President and Associate General Counsel |
| | | | |
Martin J. Wolin (k) (age 51) | | Chief Compliance Officer | | July 2015 | | 135 | | Massachusetts Financial Services Company, Senior Vice President and Chief Compliance Officer (since July 2015); Mercer (financial service provider), Chief Risk and Compliance Officer, North America and Latin America (until June 2015) |
| | | | |
James O. Yost (k)
(age 58) | | Treasurer | | September 1990 | | 135 | | Massachusetts Financial Services Company, Senior Vice President |
| (h) | Date first appointed to serve as Trustee/officer of an MFS Fund. Each Trustee has served continuously since appointment unless indicated otherwise. For the period from December 15, 2004 until February 22, 2005, Mr. Manning served as Advisory Trustee. From January 2012 through December 2016, Messrs. DiLorenzo and Yost served as Treasurer and Deputy Treasurer of the Funds, respectively. |
| (j) | Directorships or trusteeships of companies required to report to the Securities and Exchange Commission (i.e., “public companies”). |
| (k) | “Interested person” of the Trust within the meaning of the Investment Company Act of 1940 (referred to as the 1940 Act), which is the principal federal law governing investment companies like the fund, as a result of a position with MFS. The address of MFS is 111 Huntington Avenue, Boston, Massachusetts 02199-7618. |
Each Trustee has been elected by shareholders and each Trustee and officer holds office until his or her successor is chosen and qualified or until his or her earlier death, resignation, retirement or removal. The Trust does not hold annual meetings for the purpose of electing Trustees, and Trustees are not elected for fixed terms. Under the terms of the Board’s retirement policy, an Independent Trustee shall retire at the end of the calendar year in which he or she reaches the earlier of 75 years of age or 15 years of service on the Board (or, in the case of any Independent Trustee who joined the Board prior to 2015, 20 years of service on the Board).
Messrs. Buller, Hegarty, Kilman and Otis and Ms. Roepke are members of the Trust’s Audit Committee.
Each of the Interested Trustees and certain Officers hold comparable officer positions with certain affiliates of MFS.
The Statement of Additional Information for a Fund includes further information about the Trustees and is available without charge upon request by calling1-800-225-2606.
| | |
Investment Adviser Massachusetts Financial Services Company 111 Huntington Avenue Boston, MA 02199-7618 | | Custodian State Street Bank and Trust Company 1 Lincoln Street Boston, MA 02111-2900 |
| |
Distributor MFS Fund Distributors, Inc. 111 Huntington Avenue Boston, MA 02199-7618 | | Independent Registered Public Accounting Firm Deloitte & Touche LLP 200 Berkeley Street Boston, MA 02116 |
| |
Portfolio Manager(s) Matt Ryan Erik Weisman | | |
27
MFS Global Governments Portfolio
BOARD REVIEW OF INVESTMENT ADVISORY AGREEMENT
The Investment Company Act of 1940 requires that both the full Board of Trustees and a majority of thenon-interested (“independent”) Trustees, voting separately, annually approve the continuation of the Fund’s investment advisory agreement with MFS. The Trustees consider matters bearing on the Fund and its advisory arrangements at their meetings throughout the year, including a review of performance data at each regular meeting. In addition, the independent Trustees met several times over the course of three months beginning in May and ending in July, 2018 (“contract review meetings”) for the specific purpose of considering whether to approve the continuation of the investment advisory agreement for the Fund and the other investment companies that the Board oversees (the “MFS Funds”). The independent Trustees were assisted in their evaluation of the Fund’s investment advisory agreement by independent legal counsel, from whom they received separate legal advice and with whom they met separately from MFS during various contract review meetings. The independent Trustees were also assisted in this process by the MFS Funds’ Independent Senior Officer, a senior officer appointed by and reporting to the independent Trustees.
In connection with their deliberations regarding the continuation of the investment advisory agreement, the Trustees, including the independent Trustees, considered such information and factors as they believed, in light of the legal advice furnished to them and their own business judgment, to be relevant. The investment advisory agreement for the Fund was considered separately, although the Trustees also took into account the common interests of all MFS Funds in their review. As described below, the Trustees considered the nature, quality, and extent of the various investment advisory, administrative, and shareholder services performed by MFS under the existing investment advisory agreement and other arrangements with the Fund.
In connection with their contract review meetings, the Trustees received and relied upon materials that included, among other items: (i) information provided by Broadridge Financial Solutions, Inc. (“Broadridge”), an independent third party, on the investment performance of the Fund for various time periods ended December 31, 2017 and the investment performance of a group of funds with substantially similar investment classifications/objectives (the “Broadridge performance universe”), (ii) information provided by Broadridge on the Fund’s advisory fees and other expenses and the advisory fees and other expenses of comparable funds identified by Broadridge (the “Broadridge expense group”), (iii) information provided by MFS on the advisory fees of portfolios of other clients of MFS, including institutional separate accounts and other clients, (iv) information as to whether and to what extent applicable expense waivers, reimbursements or fee “breakpoints” are observed for the Fund, (v) information regarding MFS’ financial results and financial condition, including MFS’ and certain of its affiliates’ estimated profitability from services performed for the Fund and the MFS Funds as a whole, and compared to MFS’ institutional business, (vi) MFS’ views regarding the outlook for the mutual fund industry and the strategic business plans of MFS, (vii) descriptions of various functions performed by MFS for the Funds, such as compliance monitoring and portfolio trading practices, and (viii) information regarding the overall organization of MFS, including information about MFS’ senior management and other personnel providing investment advisory, administrative and other services to the Fund and the other MFS Funds. The comparative performance, fee and expense information prepared and provided by Broadridge was not independently verified and the independent Trustees did not independently verify any information provided to them by MFS.
The Trustees’ conclusion as to the continuation of the investment advisory agreement was based on a comprehensive consideration of all information provided to the Trustees and not the result of any single factor. Some of the factors that figured particularly in the Trustees’ deliberations are described below, although individual Trustees may have evaluated the information presented differently from one another, giving different weights to various factors. It is also important to recognize that the fee arrangements for the Fund and other MFS Funds are the result of years of review and discussion between the independent Trustees and MFS, that certain aspects of such arrangements may receive greater scrutiny in some years than in others, and that the Trustees’ conclusions may be based, in part, on their consideration of these same arrangements during the course of the year and in prior years.
Based on information provided by Broadridge and MFS, the Trustees reviewed the Fund’s total return investment performance as well as the Broadridge performance universe over various time periods. The Trustees placed particular emphasis on the total return performance of the Fund’s Initial Class shares in comparison to the performance of funds in its Broadridge performance universe over the three-year period ended December 31, 2017, which the Trustees believed was a long enough period to reflect differing market conditions. The total return performance of the Fund’s Initial Class shares was in the 4th quintile relative to the other funds in the universe for this three-year period (the 1st quintile being the best performers and the 5th quintile being the worst performers). The total return performance of the Fund’s Initial Class shares was in the 2nd quintile for theone-year period and the 5th quintile for the five-year period ended December 31, 2017 relative to the Broadridge performance universe. Because of the passage of time, these performance results may differ from the performance results for more recent periods, including those shown elsewhere in this report.
The Trustees expressed continued concern to MFS about the substandard investment performance of the Fund. In the course of their deliberations, the Trustees took into account information provided by MFS in connection with the contract review meetings, as well as during investment review meetings conducted with portfolio management personnel during the course of the year, as to MFS’ efforts to improve the Fund’s performance. In addition, the Trustees requested that they receive a separate update on the Fund’s performance at each of their regular meetings. After reviewing these and related factors, the Trustees concluded, within the context
28
MFS Global Governments Portfolio
Board Review of Investment Advisory Agreement – continued
of their overall conclusions regarding the investment advisory agreement, that MFS’ responses and efforts and plans to improve investment performance were sufficient to support approval of the continuance of the investment advisory agreement for an additionalone-year period, but that they would continue to closely monitor the performance of the Fund.
In assessing the reasonableness of the Fund’s advisory fee, the Trustees considered, among other information, the Fund’s advisory fee and the total expense ratio of the Fund’s Initial Class shares as a percentage of average daily net assets and the advisory fee and total expense ratios of peer groups of funds based on information provided by Broadridge. The Trustees considered that MFS currently observes an expense limitation for the Fund, which may not be changed without the Trustees’ approval. The Trustees also considered that, according to the data provided by Broadridge (which takes into account any fee reductions or expense limitations that were in effect during the Fund’s last fiscal year), the Fund’s effective advisory fee rate was higher than the Broadridge expense group median and the Fund’s total expense ratio was approximately at the Broadridge expense group median.
The Trustees also considered the advisory fees charged by MFS to any institutional separate accounts advised by MFS (“separate accounts”) and unaffiliated investment companies for which MFS serves as subadviser (“subadvised funds”) that have comparable investment strategies to the Fund, if any. In comparing these fees, the Trustees considered information provided by MFS as to the generally broader scope of services provided by MFS to the Fund, as well as the more extensive regulatory burdens imposed on MFS in managing the Fund, in comparison to separate accounts and subadvised funds. The Trustees also considered the higher demands placed on MFS’ investment personnel and trading infrastructure as a result of the daily cashin-flows andout-flows of the Fund in comparison to separate accounts.
The Trustees also considered whether the Fund may benefit from any economies of scale in the management of the Fund in the event of growth in assets of the Fund and/or growth in assets of the MFS Funds as a whole. They noted that the Fund’s advisory fee rate schedule is subject to contractual breakpoints that reduce the Fund’s advisory fee rate on average daily net assets over $300 million and $1 billion. The Trustees also noted that MFS has agreed in writing to waive a portion of the management fees of certain MFS Funds, including the Fund, if the total combined assets of certain funds within the MFS Funds’ complex increase above agreed upon thresholds (the “group fee waiver”), enabling the Fund’s shareholders to share in the benefits from any economies of scale at the complex level. The group fee waiver is reviewed and renewed annually between the Board and MFS. The Trustees concluded that the breakpoints and the group fee waiver were sufficient to allow the Fund to benefit from economies of scale as its assets and overall complex assets grow.
The Trustees also considered information prepared by MFS relating to MFS’ costs and profits with respect to the Fund, the MFS Funds considered as a group, and other investment companies and accounts advised by MFS, as well as MFS’ methodologies used to determine and allocate its costs to the MFS Funds, the Fund and other accounts and products for purposes of estimating profitability.
After reviewing these and other factors described herein, the Trustees concluded, within the context of their overall conclusions regarding the investment advisory agreement, that the advisory fees charged to the Fund represent reasonable compensation in light of the services being provided by MFS to the Fund.
In addition, the Trustees considered MFS’ resources and related efforts to continue to retain, attract and motivate capable personnel to serve the Fund. The Trustees also considered current and developing conditions in the financial services industry, including the presence of large and well-capitalized companies which are spending, and appear to be prepared to continue to spend, substantial sums to engage personnel and to provide services to competing investment companies. In this regard, the Trustees also considered the financial resources of MFS and its ultimate parent, Sun Life Financial Inc. The Trustees also considered the advantages and possible disadvantages to the Fund of having an adviser that also serves other investment companies as well as other accounts.
The Trustees also considered the nature, quality, cost, and extent of administrative, transfer agency, and distribution services provided to the Fund by MFS and its affiliates under agreements and plans other than the investment advisory agreement, including any12b-1 fees the Fund pays to MFS Fund Distributors, Inc., an affiliate of MFS. The Trustees also considered the nature, extent and quality of certain other services MFS performs or arranges for on the Fund’s behalf, which may include securities lending programs, directed expense payment programs, class action recovery programs, and MFS’ interaction with third-party service providers, principally custodians andsub-custodians. The Trustees concluded that the variousnon-advisory services provided by MFS and its affiliates on behalf of the Fund were satisfactory.
The Trustees consideredso-called“fall-out benefits” to MFS such as reputational value derived from serving as investment manager to the MFS Funds. The Trustees also considered that, effective January 3, 2018, MFS had discontinued its historic practice of obtaining investment research from portfolio brokerage commissions paid by certain MFS Funds and would thereafter voluntarily reimburse a Fund, if applicable, for the costs of external research acquired through the use of the Fund’s portfolio brokerage commissions.
Based on their evaluation of factors that they deemed to be material, including those factors described above, the Board of Trustees, including the independent Trustees, concluded that the Fund’s investment advisory agreement with MFS should be continued for an additionalone-year period, commencing August 1, 2018.
29
MFS Global Governments Portfolio
PROXY VOTING POLICIES AND INFORMATION
MFS votes proxies on behalf of the fund pursuant to proxy voting policies and procedures that are available without charge, upon request, by calling 1-800-225-2606, by visitingmfs.com/proxyvoting, or by visiting the SEC’s Web site athttp://www.sec.gov.
Information regarding how the fund voted proxies relating to portfolio securities during the most recent twelve-month period ended June 30 is available by August 31 of each year without charge by visitingmfs.com/proxyvoting, or by visiting the SEC’s Web site athttp://www.sec.gov.
QUARTERLY PORTFOLIO DISCLOSURE
The fund files a complete schedule of portfolio holdings with the SEC for the first and third quarters of each fiscal year on Form N-Q. The fund’s Form N-Q is available on the SEC’s website athttp://www.sec.gov.A shareholder can obtain the portfolio holdings report for the first and third quarters of the fund’s fiscal year atmfs.com/vit2 by choosing the fund’s name and then selecting the “Resources” tab and clicking on “Prospectus and Reports”.
FURTHER INFORMATION
From time to time, MFS may post important information about the fund or the MFS funds on the MFS web site (mfs.com). This information is available athttps://www.mfs.com/en-us/what-we-do/announcements.htmlor atmfs.com/vit2 by choosing the fund’s name.
INFORMATION ABOUT FUND CONTRACTS AND LEGAL CLAIMS
The fund has entered into contractual arrangements with an investment adviser, administrator, distributor, shareholder servicing agent, 529 program manager (if applicable), and custodian who each provide services to the fund. Unless expressly stated otherwise, shareholders are not parties to, or intended beneficiaries of these contractual arrangements, and these contractual arrangements are not intended to create any shareholder right to enforce them against the service providers or to seek any remedy under them against the service providers, either directly or on behalf of the fund.
Under the Trust’s By-Laws and Declaration of Trust, any claims asserted against or on behalf of the MFS Funds, including claims against Trustees and Officers, must be brought in state and federal courts located within the Commonwealth of Massachusetts.
30
rev. 3/16
| | | | |
| | | |
| FACTS | | WHAT DOES MFS DO WITH YOUR
PERSONAL INFORMATION? | |  |
| | |
| Why? | | Financial companies choose how they share your personal information. Federal law gives consumers the right to limit some but not all sharing. Federal law also requires us to tell you how we collect, share, and protect your personal information. Please read this notice carefully to understand what we do. |
| | |
| What? | | The types of personal information we collect and share depend on the product or service you have with us. This information can include: • Social Security number and account balances • Account transactions and transaction history • Checking account information and wire transfer instructions When you areno longer our customer, we continue to share your information as described in this notice. |
| | |
| How? | | All financial companies need to share customers’ personal information to run their everyday business. In the section below, we list the reasons financial companies can share their customers’ personal information; the reasons MFS chooses to share; and whether you can limit this sharing. |
| | | | |
Reasons we can share your
personal information | | Does MFS share? | | Can you limit this
sharing? |
For our everyday business purposes – such as to process your transactions, maintain your account(s), respond to court orders and legal investigations, or report to credit bureaus | | Yes | | No |
For our marketing purposes – to offer our products and services to you | | No | | We don’t share |
| For joint marketing with other financial companies | | No | | We don’t share |
For our affiliates’ everyday business purposes – information about your transactions and experiences | | No | | We don’t share |
For our affiliates’ everyday business purposes – information about your creditworthiness | | No | | We don’t share |
| For nonaffiliates to market to you | | No | | We don’t share |
| | |
| | |
| Questions? | | Call800-225-2606 or go tomfs.com. |
31
| | |
| Who we are |
| Who is providing this notice? | | MFS Funds, MFS Investment Management, MFS Institutional Advisors, Inc., and MFS Heritage Trust Company. |
| | |
| What we do |
| How does MFS protect my personal information? | | To protect your personal information from unauthorized access and use, we use security measures that comply with federal law. These measures include procedural, electronic, and physical safeguards for the protection of the personal information we collect about you. |
How does MFS
collect my personal information? | | We collect your personal information, for example, when you • open an account or provide account information • direct us to buy securities or direct us to sell your securities • make a wire transfer We also collect your personal information from others, such as credit bureaus, affiliates, or other companies. |
| Why can’t I limit all sharing? | | Federal law gives you the right to limit only • sharing for affiliates’ everyday business purposes – information about your creditworthiness • affiliates from using your information to market to you • sharing for nonaffiliates to market to you State laws and individual companies may give you additional rights to limit sharing. |
| | |
| Definitions |
| Affiliates | | Companies related by common ownership or control. They can be financial and nonfinancial companies. • MFS does not share personal information with affiliates, except for everyday business purposes as described on page one of this notice. |
| Nonaffiliates | | Companies not related by common ownership or control. They can be financial and nonfinancial companies. • MFS does not share with nonaffiliates so they can market to you. |
| Joint marketing | | A formal agreement between nonaffiliated financial companies that together market financial products or services to you. • MFS doesn’t jointly market. |
| | |
| Other important information |
| If you own an MFS product or receive an MFS service in the name of a third party such as a bank or broker-dealer, their privacy policy may apply to you instead of ours. |
32
Annual Report
December 31, 2018

MFS® Global Growth Portfolio

MFS® Variable Insurance Trust II
Beginning on January 1, 2021, as permitted by regulations adopted by the U.S. Securities and Exchange Commission, the insurance company that offers your contract may determine that it will no longer send you paper copies of the fund’s annual and semiannual shareholder reports unless you specifically request paper copies from the insurance company or from your financial intermediary. Instead, the shareholder reports will be made available on a Web site (insurancefunds.mfs.com or other Web site of which you will be notified), and the insurance company will notify you by mail each time a report is posted and provide you with a Web site link to access the report. Instructions for requesting paper copies will be provided by your insurance company or financial intermediary.
If you already elected to receive shareholder reports by email, you will not be affected by this change and you need not take any action. If your insurance company or financial intermediary offers electronic delivery, you may elect to receive shareholder reports and other communications from the insurance company or financial intermediary by email by following the instructions provided by the insurance company or finanacial intermediary.
Beginning on January 1, 2019, you may elect to receive all future reports in paper free of charge from the insurance company or financial intermediary. You can inform the insurance company or financial intermediary that you wish to continue receiving paper copies of your shareholder reports by contacting your insurance company or financial intermediary. Your election to receive reports in paper will apply to all funds held in your account with your insurance company or financial intermediary.
WGO-ANN
MFS® Global Growth Portfolio
CONTENTS
The report is prepared for the general information of contract owners. It is authorized for distribution to prospective investors only when preceded or accompanied by a current prospectus.
NOT FDIC INSURED• MAY LOSE VALUE• NO BANK OR CREDIT UNION GUARANTEE• NOT A DEPOSIT• NOT INSURED BY ANY FEDERAL GOVERNMENT AGENCY OR NCUA/NCUSIF
MFS Global Growth Portfolio
LETTER FROM THE EXECUTIVE CHAIRMAN

Dear Contract Owners:
Higher interest rates, international trade friction, and geopolitical uncertainty surrounding issues such as Brexit have contributed to an uptick in market volatility in recent quarters — a departure from thelow-volatility environment that prevailed for much of the past several years. Against this more challenging backdrop, equity markets in the United States outperformed most international markets on a relative basis in 2018, though broad market returns were modestly negative on an absolute basis. Global economic growth has become less synchronized over the past few quarters, with Europe, China, and some emerging markets having shown signs of significantly slowing growth. While U.S. growth has remained above average, the pace of that growth slowed in the second half of 2018.
Slowing global growth and tighter financial conditions have clouded the outlook for U.S. monetary policy, with the chairman of the U.S. Federal Reserve acknowledging that policy rates are close to levels that the Fed deems neutral for the U.S. economy. This suggests that the predictable pattern of quarterly rate increases is behind us. At the same time, markets must contend with a shift from years of quantitative easing toward a cycle of quantitative tightening now that the European Central Bank has halted asset purchases. U.S. tax reforms adopted in late 2017 have been welcomed by equity markets while emerging market economies have recently had to contend with tighter financial conditions as a result of firmer U.S. interest rates and a stronger dollar. With the Republicans losing control of the U.S. House of Representatives, further meaningful U.S. fiscal stimulus appears less likely over the remainder of this presidential term. A partial U.S. government shutdown, beginning in late 2018, also added to political uncertainty. Globally, inflation remains largely subdued thanks in part to falling oil prices, but tight labor markets and moderate global demand have investors on the lookout for its potential reappearance. Increased U.S. protectionism is also a growing concern, as investors fear trade disputes could dampen business sentiment, leading to even slower global growth. While there has been progress on this front — a NAFTA replacement has been agreed upon between the U.S., Mexico, and Canada; the free trade pact with Korea has been updated; and a negotiating framework with the European Union has been agreed upon — tensions over trade with China remain quite high, though the two sides have recently returned to the negotiating table.
As a global investment manager with nearly a century of expertise, MFS® firmly believes active risk management offers downside mitigation and may help improve investment outcomes. We built our active investment platform with this belief in mind. Ourlong-term perspective influences nearly every aspect of our business, ensuring our investment decisions align with the investing time horizons of our clients.
Respectfully,

Robert J. Manning
Executive Chairman
MFS Investment Management
February 15, 2019
The opinions expressed in this letter are subject to change and may not be relied upon for investment advice. No forecasts can be guaranteed.
1
MFS Global Growth Portfolio
PORTFOLIO COMPOSITION
Portfolio structure

| | | | |
| Top ten holdings | | | | |
| Alphabet, Inc., “A” | | | 3.8% | |
| Microsoft Corp. | | | 2.9% | |
| Taiwan Semiconductor Manufacturing Co. Ltd., ADR | | | 2.1% | |
| Nestle S.A. | | | 2.0% | |
| Accenture PLC, “A” | | | 2.0% | |
| Aon PLC | | | 2.0% | |
| Experian PLC | | | 1.9% | |
| Bayer AG | | | 1.9% | |
| LVMH Moet Hennessy Louis Vuitton SE | | | 1.8% | |
| Comcast Corp., “A” | | | 1.8% | |
| |
| GICS equity sectors | | | | |
| Information Technology | | | 21.1% | |
| Consumer Discretionary | | | 14.8% | |
| Industrials | | | 13.9% | |
| Consumer Staples | | | 13.2% | |
| Health Care | | | 10.3% | |
| Communication Services | | | 9.2% | |
| Financials | | | 8.8% | |
| Materials | | | 7.7% | |
| Energy | | | 0.4% | |
| | | | |
| Issuer country weightings (x) | | | | |
| United States | | | 57.5% | |
| United Kingdom | | | 7.9% | |
| Switzerland | | | 5.7% | |
| France | | | 5.3% | |
| Japan | | | 4.5% | |
| Germany | | | 4.4% | |
| China | | | 2.3% | |
| Taiwan | | | 2.0% | |
| India | | | 2.0% | |
| Other Countries | | | 8.4% | |
| |
| Currency exposure weightings (y) | | | | |
| United States Dollar | | | 58.5% | |
| Euro | | | 10.7% | |
| British Pound Sterling | | | 9.3% | |
| Swiss Franc | | | 5.7% | |
| Japanese Yen | | | 4.5% | |
| Chinese Renminbi | | | 2.3% | |
| Taiwan Dollar | | | 2.0% | |
| Indian Rupee | | | 2.0% | |
| South Korean Won | | | 1.8% | |
| Other Currencies | | | 3.2% | |
| (x) | Represents the portfolio’s exposure to issuer countries as a percentage of a portfolio’s net assets. For purposes of this presentation, United States includes Cash & Cash Equivalents. |
| (y) | Represents the portfolio’s exposure to a particular currency as a percentage of a portfolio’s net assets. For purposes of this presentation, United States Dollar includes Cash & Cash Equivalents. |
Cash & Cash Equivalents includes any cash, investments in money market funds, short-term securities, and other assets less liabilities. Please see the Statement of Assets and Liabilities for additional information related to the fund’s cash position and other assets and liabilities.
The Global Industry Classification Standard (GICS®) was developed by and/or is the exclusive property of MSCI, Inc. and S&P Global Market Intelligence Inc. (“S&P Global Market Intelligence”). GICS is a service mark of MSCI and S&P Global Market Intelligence and has been licensed for use by MFS.
Percentages are based on net assets as of December 31, 2018.
The portfolio is actively managed and current holdings may be different.
2
MFS Global Growth Portfolio
MANAGEMENT REVIEW
Summary of Results
For the twelve months ended December 31, 2018, Initial Class shares of the MFS Global Growth Portfolio (“fund”) provided a total return of –4.83%, while Service Class shares of the fund provided a total return of –5.06%. These returns compare with a return of –8.13% over the same period for the fund’s benchmark, the MSCI All Country World Growth Index (net div).
Market Environment
During the reporting period, the US Federal Reserve raised interest rates by 100 basis points, bringing the total number of rate hikes to nine since the central bank began to normalize monetary policy in late 2015. Economic growth rates in the US, Eurozone and Japan remained above trend, despite a slowing in global growth, particularly toward the end of the period. Inflation remained contained, particularly outside the US. Late in the period, the European Central Bank halted its asset purchase program but issued forward guidance that it does not expect to raise interest rates at least until after the summer of 2019. The Bank of England (once) and the Bank of Canada (three times) each raised rates during the period. The European political backdrop became a bit more volatile, late in the period, spurred by concerns over cohesion in the eurozone after the election of an anti-establishment, Eurosceptic coalition government in Italy and widespread protests over stagnant wage growth in France.
Bond yields rose in the US during most of the period, but remained low by historical standards and slipped from their highs, late in the period, as market volatility increased. Yields in many developed markets fell. Outside of emerging markets, where spreads and currencies came under pressure, credit spreads remained quite tight until the end of the period, when thinner liquidity, lower oil prices and concerns over high degrees of corporate leverage emerged. Growing concern over increasing global trade friction appeared to have weighed on business sentiment during the period’s second half, especially outside the US. Tighter financial conditions from rising US rates and a strong dollar, combined with trade uncertainty, helped expose structural weaknesses in several emerging markets in the second half of the period.
Volatility increased, at the end of the period, amid signs of slowing global economic growth and increasing trade tensions, which prompted a market setback shortly after US markets set record highs in September. It was the second such equity market decline during the reporting period. The correction came despite a third consecutive quarter of strong growth in US earnings per share. Strong earnings growth, combined with the market decline, brought US equity valuations down from elevated levels, earlier in the period, to multiples more in line with long-term averages. While the US economy held up better than most, global economic growth became less synchronized during the period, with Europe and China showing signs of a slowdown and some emerging markets coming under stress.
Contributors to Performance
Security selection in both thematerialsandindustrialssectors contributed to performance relative to the MSCI All Country World Growth Index. Within thematerials sector, the timing of the fund’s ownership in shares of paint and coating manufacturer Kansai Paint Co. (Japan) bolstered relative returns. Within theindustrialssector, overweight positions in analytics and risk assessment services provider Verisk Analytics and credit risk services provider Experian (United Kingdom) supported relative results. The stock price of Verisk Analytics advanced as the company reported improved revenue growth and a significant benefit from US tax reform.
Security selection in theinformation technologysector also aided relative returns. However, there were no stocks within this sector that were among the fund’s top relative contributors over the reporting period.
Elsewhere, the timing of the fund’s ownership in shares of medical device company Abbott Laboratories benefited relative performance. Shares of Abbott Laboratories benefited from solid organic growth results, owing to strong performance in the company’s Diabetes Care, Diagnostics, Nutrition and Medical Devices segments. Additionally, overweight positions in athletic shoes and apparel manufacturer NIKE, retail chain operator TJX Cos., coffee and tea company Starbucks, life sciences supply company Thermo Fisher Scientific and insurance broker Aon supported relative results. Not owning shares of social networking firm Facebook further contributed to relative returns.
Detractors from Performance
Security selection and, to a lesser extent, an overweight position in theconsumer staplessector detracted from relative performance. Within this sector, the fund’s holdings of beauty products company Coty (b)(h), and overweight positions in drugstore retailer Sundrug Co. (Japan) and beverage manufacturer Ambev (Brazil) weakened relative returns. The stock price of Coty declined due to a difficult retail environment, along with disruptions in its supply chain. The share price also came under pressure after the firm providedfiscal-year 2019 earnings per share guidance that was below consensus estimates.
Other top relative detractors during the period included not owning shares ofe-commerce and cloud services giant Amazon.com and the timing of the fund’s ownership in shares of pharmaceutical company Bayer (Germany). The stock price of Amazon.com appreciated during the period as the company delivered solid earnings results, driven by strong performance in its Amazon Web
3
MFS Global Growth Portfolio
Management Review – continued
Services (AWS), Cloud services and advertising segments.In addition, the fund’s overweight positions in international betting and gaming company Paddy Power Betfair (Ireland), private banking services provider Julius Baer Group (Switzerland), dollar store operator Dollarama, Chinese-language internet search provider Baidu (China) and video game maker Electronic Arts negatively impacted relative results.
Respectfully,
Portfolio Manager(s)
David Antonelli, Jeffrey Constantino, and Joseph Skorski
Note to Shareholders: Effective May 1, 2018, Joseph Skorski became a Portfolio Manager of the Fund.
| (b) | Security is not a benchmark constituent. |
| (h) | Security was not held in the portfolio at period end. |
The views expressed in this report are those of the portfolio manager(s) only through the end of the period of the report as stated on the cover and do not necessarily reflect the views of MFS or any other person in the MFS organization. These views are subject to change at any time based on market or other conditions, and MFS disclaims any responsibility to update such views. These views may not be relied upon as investment advice or an indication of trading intent on behalf of any MFS portfolio. References to specific securities are not recommendations of such securities, and may not be representative of any MFS portfolio’s current or future investments.
4
MFS Global Growth Portfolio
PERFORMANCE SUMMARY THROUGH 12/31/18
The following chart illustrates the historical performance of the fund in comparison to its benchmark(s). Benchmarks are unmanaged and may not be invested in directly. Benchmark returns do not reflect any fees or expenses. The performance of other share classes will be greater than or less than that of the class depicted below. (See Notes to Performance Summary.)
Performance data shown represents past performance and is no guarantee of future results. Investment return and principal value fluctuate so your units, when sold, may be worth more or less than the original cost; current performance may be lower or higher than quoted. The performance shown does not reflect the deduction of taxes, if any, that a contract holder would pay on fund distributions or the redemption of contract units. The returns for the fund shown also do not reflect the deduction of expenses associated with variable products, such as mortality and expense risk charges, separate account charges, and sales charges imposed by the insurance company separate accounts. Such expenses would reduce the overall returns shown.
Growth of a Hypothetical $10,000 Investment
Total Returns through 12/31/18
Average annual total returns
| | | | | | | | | | | | |
| | | Share Class | | Class Inception Date | | 1-yr | | 5-yr | | 10-yr | | |
| | | Initial Class | | 11/16/93 | | (4.83)% | | 6.50% | | 11.27% | | |
| | | Service Class | | 8/24/01 | | (5.06)% | | 6.23% | | 10.99% | | |
| | | | |
| Comparative benchmark(s) | | | | | | | | |
| | | MSCI All Country World Growth Index (net div) (f) | | (8.13)% | | 5.72% | | 10.78% | | |
| (f) | Source: FactSet Research Systems Inc. |
Benchmark Definition(s)
MSCI All Country World Growth Index (net div) – a market capitalization-weighted index that is designed to measure equity market performance for growth securities in the global developed and emerging markets.
It is not possible to invest directly in an index.
Notes to Performance Summary
Average annual total return represents the average annual change in value for each share class for the periods presented.
Performance results reflect any applicable expense subsidies and waivers in effect during the periods shown. Without such subsidies and waivers the fund’s performance results would be less favorable. Please see the prospectus and financial statements for complete details. All results are historical and assume the reinvestment of any dividends and capital gains distributions.
Performance results do not include adjustments made for financial reporting purposes in accordance with U.S. generally accepted accounting principles and may differ from amounts reported in the financial highlights.
From time to time the fund may receive proceeds from litigation settlements, without which performance would be lower.
5
MFS Global Growth Portfolio
EXPENSE TABLE
Fund Expenses Borne by the Contract Holders during the Period,
July 1, 2018 through December 31, 2018
As a contract holder of the fund, you incur ongoing costs, including management fees; distribution and/or service(12b-1) fees; and other fund expenses. This example is intended to help you understand your ongoing costs (in dollars) of investing in the fund and to compare these costs with the ongoing costs of investing in other mutual funds.
The example is based on an investment of $1,000 invested at the beginning of the period and held for the entire period July 1, 2018 through December 31, 2018.
Actual Expenses
The first line for each share class in the following table provides information about actual account values and actual expenses. You may use the information in this line, together with the amount you invested, to estimate the expenses that you paid over the period. Simply divide your account value by $1,000 (for example, an $8,600 account value divided by $1,000 = 8.6), then multiply the result by the number in the first line under the heading entitled “Expenses Paid During Period” to estimate the expenses you paid on your account during this period.
Hypothetical Example for Comparison Purposes
The second line for each share class in the following table provides information about hypothetical account values and hypothetical expenses based on the fund’s actual expense ratio and an assumed rate of return of 5% per year before expenses, which is not the fund’s actual return. The hypothetical account values and expenses may not be used to estimate the actual ending account balance or expenses you paid for the period. You may use this information to compare the ongoing costs of investing in the fund and other funds. To do so, compare this 5% hypothetical example with the 5% hypothetical examples that appear in the shareholder reports of the other funds.
Please note that the expenses shown in the table are meant to highlight the fund’s ongoing costs only and do not take into account the fees and expenses imposed under the variable contracts through which your investment in the fund is made. Therefore, the second line for each share class in the table is useful in comparing ongoing costs associated with an investment in vehicles (such as the fund) which fund benefits under variable annuity and variable life insurance contracts and to qualified pension and retirement plans only, and will not help you determine the relative total costs of investing in the fund through variable annuity and variable life insurance contracts. If the fees and expenses imposed under the variable contracts were included, your costs would have been higher.
| | | | | | | | | | | | | | | | | | |
| Share Class | | | | Annualized
Expense Ratio | | | Beginning
Account Value
7/01/18 | | | Ending Account Value
12/31/18 | | | Expenses Paid
During Period (p)
7/01/18-12/31/18 | |
| Initial Class | | Actual | | | 1.00% | | | | $1,000.00 | | | | $922.49 | | | | $4.85 | |
| | Hypothetical (h) | | | 1.00% | | | | $1,000.00 | | | | $1,020.16 | | | | $5.09 | |
| Service Class | | Actual | | | 1.25% | | | | $1,000.00 | | | | $921.51 | | | | $6.05 | |
| | Hypothetical (h) | | | 1.25% | | | | $1,000.00 | | | | $1,018.90 | | | | $6.36 | |
| (h) | 5% class return per year before expenses. |
| (p) | “Expenses Paid During Period” are equal to each class’s annualized expense ratio, as shown above, multiplied by the average account value over the period, multiplied by 184/365 (to reflect theone-half year period). |
6
MFS Global Growth Portfolio
PORTFOLIO OF INVESTMENTS – 12/31/18
The Portfolio of Investments is a complete list of all securities owned by your fund. It is categorized by broad-based asset classes.
| | | | | | | | |
| | |
| Issuer | | Shares/Par | | | Value ($) | |
| COMMON STOCKS – 99.4% | | | | | | | | |
| Aerospace – 2.0% | | | | | |
| Rolls-Royce Holdings PLC | | | 31,192 | | | $ | 329,986 | |
| United Technologies Corp. | | | 5,524 | | | | 588,195 | |
| | | | | | | | |
| | | | | | $ | 918,181 | |
| | | | | | | | |
| Airlines – 1.1% | | | | | |
| Aena S.A. | | | 3,141 | | | $ | 488,537 | |
| | | | | | | | |
| Alcoholic Beverages – 3.0% | | | | | |
| Ambev S.A., ADR | | | 105,539 | | | $ | 413,713 | |
| Diageo PLC | | | 11,029 | | | | 392,909 | |
| Pernod Ricard S.A. | | | 3,419 | | | | 561,351 | |
| | | | | | | | |
| | | | | | $ | 1,367,973 | |
| | | | | | | | |
| Apparel Manufacturers – 6.3% | | | | | |
| Adidas AG | | | 3,193 | | | $ | 667,288 | |
| Burberry Group PLC | | | 11,137 | | | | 246,358 | |
| Compagnie Financiere Richemont S.A. | | | 2,270 | | | | 145,887 | |
| LVMH Moet Hennessy Louis Vuitton SE | | | 2,739 | | | | 810,286 | |
| NIKE, Inc., “B” | | | 8,994 | | | | 666,815 | |
| VF Corp. | | | 4,881 | | | | 348,211 | |
| | | | | | | | |
| | | | | | $ | 2,884,845 | |
| | | | | | | | |
| Broadcasting – 0.4% | | | | | |
| Walt Disney Co. | | | 1,633 | | | $ | 179,058 | |
| | | | | | | | |
| Brokerage & Asset Managers – 2.2% | | | | | |
| Blackstone Group LP | | | 23,587 | | | $ | 703,128 | |
| Charles Schwab Corp. | | | 7,267 | | | | 301,799 | |
| | | | | | | | |
| | | | | | $ | 1,004,927 | |
| | | | | | | | |
| Business Services – 11.7% | | | | | |
| Accenture PLC, “A” | | | 6,428 | | | $ | 906,412 | |
| Brenntag AG | | | 6,934 | | | | 299,512 | |
| Cognizant Technology Solutions Corp., “A” | | | 10,461 | | | | 664,064 | |
| Compass Group PLC | | | 14,193 | | | | 298,492 | |
| Experian PLC | | | 36,270 | | | | 880,676 | |
| Fidelity National Information Services, Inc. | | | 7,053 | | | | 723,285 | |
| Fiserv, Inc. (a) | | | 9,753 | | | | 716,748 | |
| Intertek Group PLC | | | 3,665 | | | | 224,228 | |
| Verisk Analytics, Inc., “A” (a) | | | 5,842 | | | | 637,012 | |
| | | | | | | | |
| | | | | | $ | 5,350,429 | |
| | | | | | | | |
| Cable TV – 1.8% | | | | | |
| Comcast Corp., “A” | | | 23,511 | | | $ | 800,550 | |
| | | | | | | | |
| Chemicals – 1.4% | | | | | |
| PPG Industries, Inc. | | | 6,297 | | | $ | 643,742 | |
| | | | | | | | |
| Computer Software – 3.3% | | | | | |
| Dassault Systems S.A. | | | 1,458 | | | $ | 173,231 | |
| Microsoft Corp. | | | 13,126 | | | | 1,333,208 | |
| | | | | | | | |
| | | | | | $ | 1,506,439 | |
| | | | | | | | |
| Computer Software – Systems – 1.2% | | | | | |
| Apple, Inc. | | | 3,606 | | | $ | 568,810 | |
| | | | | | | | |
| | | | | | | | |
| | |
| Issuer | | Shares/Par | | | Value ($) | |
| COMMON STOCKS – continued | | | | | |
| Construction – 1.2% | | | | | |
| Sherwin-Williams Co. | | | 1,371 | | | $ | 539,434 | |
| | | | | | | | |
| Consumer Products – 5.4% | | | | | |
| Colgate-Palmolive Co. | | | 7,358 | | | $ | 437,948 | |
| Estee Lauder Cos., Inc., “A” | | | 4,291 | | | | 558,259 | |
| KOSE Corp. | | | 1,200 | | | | 190,313 | |
| L’Oréal | | | 2,189 | | | | 504,619 | |
| Reckitt Benckiser Group PLC | | | 9,925 | | | | 760,669 | |
| | | | | | | | |
| | | | | | $ | 2,451,808 | |
| | | | | | | | |
| Electrical Equipment – 3.1% | | | | | |
| Amphenol Corp., “A” | | | 5,989 | | | $ | 485,229 | |
| Fortive Corp. | | | 6,313 | | | | 427,137 | |
| Mettler-Toledo International, Inc. (a) | | | 898 | | | | 507,891 | |
| | | | | | | | |
| | | | | | $ | 1,420,257 | |
| | | | | | | | |
| Electronics – 6.2% | | | | | |
| Analog Devices, Inc. | | | 8,961 | | | $ | 769,123 | |
| Samsung Electronics Co. Ltd. | | | 10,414 | | | | 360,331 | |
| Taiwan Semiconductor Manufacturing Co. Ltd., ADR | | | 25,544 | | | | 942,829 | |
| Texas Instruments, Inc. | | | 7,873 | | | | 743,999 | |
| | | | | | | | |
| | | | | | $ | 2,816,282 | |
| | | | | | | | |
| Food & Beverages – 3.7% | | | | | |
| Chr. Hansen Holding A.S. | | | 1,394 | | | $ | 123,346 | |
| Danone S.A. | | | 5,199 | | | | 366,400 | |
| Nestle S.A. | | | 11,459 | | | | 931,626 | |
| PepsiCo, Inc. | | | 2,546 | | | | 281,282 | |
| | | | | | | | |
| | | | | | $ | 1,702,654 | |
| | | | | | | | |
| Food & Drug Stores – 1.4% | | | | | |
| Sundrug Co. Ltd. | | | 20,800 | | | $ | 618,707 | |
| | | | | | | | |
| Gaming & Lodging – 1.4% | | | | | |
| Paddy Power Betfair PLC | | | 7,873 | | | $ | 642,235 | |
| | | | | | | | |
| General Merchandise – 2.0% | | | | | |
| Dollarama, Inc. | | | 26,158 | | | $ | 622,143 | |
| Lojas Renner S.A. | | | 28,669 | | | | 313,634 | |
| | | | | | | | |
| | | | | | $ | 935,777 | |
| | | | | | | | |
| Insurance – 2.0% | | | | | |
| Aon PLC | | | 6,228 | | | $ | 905,302 | |
| | | | | | | | |
| Internet – 7.0% | | | | | |
| Alibaba Group Holding Ltd., ADR (a) | | | 4,479 | | | $ | 613,937 | |
| Alphabet, Inc., “A” (a) | | | 1,648 | | | | 1,722,094 | |
| Baidu, Inc., ADR (a) | | | 2,748 | | | | 435,833 | |
| NAVER Corp. (a) | | | 4,111 | | | | 447,925 | |
| | | | | | | | |
| | | | | | $ | 3,219,789 | |
| | | | | | | | |
| Leisure & Toys – 1.4% | | | | | |
| Electronic Arts, Inc. (a) | | | 8,055 | | | $ | 635,620 | |
| | | | | | | | |
7
MFS Global Growth Portfolio
Portfolio of Investments – continued
| | | | | | | | |
| | |
| Issuer | | Shares/Par | | | Value ($) | |
| COMMON STOCKS – continued | | | | | |
| Machinery & Tools – 3.6% | | | | | |
| Daikin Industries Ltd. | | | 5,800 | | | $ | 610,340 | |
| Nordson Corp. | | | 6,521 | | | | 778,281 | |
| Schindler Holding AG | | | 1,213 | | | | 240,990 | |
| | | | | | | | |
| | | | | | $ | 1,629,611 | |
| | | | | | | | |
| Medical Equipment – 5.6% | | | | | |
| Abbott Laboratories | | | 8,902 | | | $ | 643,882 | |
| Cooper Cos., Inc. | | | 604 | | | | 153,718 | |
| Danaher Corp. | | | 3,786 | | | | 390,412 | |
| Thermo Fisher Scientific, Inc. | | | 3,322 | | | | 743,430 | |
| Waters Corp. (a) | | | 3,332 | | | | 628,582 | |
| | | | | | | | |
| | | | | | $ | 2,560,024 | |
| | | | | | | | |
| Oil Services – 0.4% | | | | | |
| Schlumberger Ltd. | | | 5,333 | | | $ | 192,415 | |
| | | | | | | | |
| Other Banks & Diversified Financials – 5.9% | | | | | |
| Credicorp Ltd. | | | 1,917 | | | $ | 424,941 | |
| HDFC Bank Ltd. | | | 24,129 | | | | 733,288 | |
| Julius Baer Group Ltd. | | | 8,192 | | | | 292,731 | |
| Mastercard, Inc., “A” | | | 2,556 | | | | 482,190 | |
| Visa, Inc., “A” | | | 5,670 | | | | 748,100 | |
| | | | | | | | |
| | | | | | $ | 2,681,250 | |
| | | | | | | | |
| Pharmaceuticals – 3.6% | | | | | |
| Bayer AG | | | 12,232 | | | $ | 848,737 | |
| Elanco Animal Health, Inc. (a) | | | 528 | | | | 16,648 | |
| Roche Holding AG | | | 2,338 | | | | 578,127 | |
| Zoetis, Inc. | | | 2,504 | | | | 214,192 | |
| | | | | | | | |
| | | | | | $ | 1,657,704 | |
| | | | | | | | |
| Printing & Publishing – 1.4% | | | | | |
| Moody’s Corp. | | | 4,635 | | | $ | 649,085 | |
| | | | | | | | |
| Railroad & Shipping – 1.9% | | | | | |
| Adani Ports and Special Economic Zone Ltd. | | | 30,124 | | | $ | 167,286 | |
| Union Pacific Corp. | | | 4,982 | | | | 688,662 | |
| | | | | | | | |
| | | | | | $ | 855,948 | |
| | | | | | | | |
| Restaurants – 1.6% | | | | | |
| Starbucks Corp. | | | 11,255 | | | $ | 724,822 | |
| | | | | | | | |
| | | | | | | | |
| | |
| Issuer | | Shares/Par | | | Value ($) | |
| COMMON STOCKS – continued | | | | | |
| Specialty Chemicals – 4.8% | | | | | |
| Croda International PLC | | | 7,694 | | | $ | 459,447 | |
| Ecolab, Inc. | | | 3,563 | | | | 525,008 | |
| Kansai Paint Co. Ltd. | | | 32,400 | | | | 621,825 | |
| Sika AG | | | 3,260 | | | | 414,325 | |
| Symrise AG | | | 2,443 | | | | 180,540 | |
| | | | | | | | |
| | | | | | $ | 2,201,145 | |
| | | | | | | | |
| Specialty Stores – 1.4% | | | | | |
| TJX Cos., Inc. | | | 14,718 | | | $ | 658,483 | |
| | | | | | | | |
Total Common Stocks
(Identified Cost, $32,363,464) | | | | | | $ | 45,411,843 | |
| | | | | | | | |
| |
| INVESTMENT COMPANIES (h) – 0.7% | | | | | |
| Money Market Funds – 0.7% | | | | | |
| MFS Institutional Money Market Portfolio, 2.4% (v) (Identified Cost, $298,797) | | | 298,826 | | | $ | 298,797 | |
| | | | | | | | |
OTHER ASSETS, LESS
LIABILITIES – (0.1)% | | | | | | | (37,425 | ) |
| | | | | | | | |
| NET ASSETS – 100.0% | | | | | | $ | 45,673,215 | |
| | | | | | | | |
| (a) | | Non-income producing security. |
| (h) | | An affiliated issuer, which may be considered one in which the fund owns 5% or more of the outstanding voting securities, or a company which is under common control. At period end, the aggregate values of the fund’s investments in affiliated issuers and in unaffiliated issuers were $298,797 and $45,411,843, respectively. |
| (v) | | Affiliated issuer that is available only to investment companies managed by MFS. The rate quoted for the MFS Institutional Money Market Portfolio is the annualizedseven-day yield of the fund at period end. |
The following abbreviations are used in this report and are defined:
| ADR | | American Depositary Receipt |
| PLC | | Public Limited Company |
See Notes to Financial Statements
8
MFS Global Growth Portfolio
FINANCIAL STATEMENTS | STATEMENT OF ASSETS AND LIABILITIES
This statement represents your fund’s balance sheet, which details the assets and liabilities comprising the total value of the fund.
| | | | |
At 12/31/18 | | | | |
| |
Assets | | | | |
Investments in unaffiliated issuers, at value (identified cost, $32,363,464) | | | $45,411,843 | |
Investments in affiliated issuers, at value (identified cost, $298,797) | | | 298,797 | |
Receivables for | | | | |
Investments sold | | | 1,915 | |
Interest and dividends | | | 77,894 | |
Receivable from investment adviser | | | 5,177 | |
Other assets | | | 667 | |
Total assets | | | $45,796,293 | |
| |
Liabilities | | | | |
Payables for | | | | |
Fund shares reacquired | | | $61,341 | |
Payable to affiliates | | | | |
Shareholder servicing costs | | | 13 | |
Distribution and/or service fees | | | 48 | |
Payable for independent Trustees’ compensation | | | 3 | |
Deferred country tax expense payable | | | 3,864 | |
Accrued expenses and other liabilities | | | 57,809 | |
Total liabilities | | | $123,078 | |
Net assets | | | $45,673,215 | |
| |
Net assets consist of | | | | |
Paid-in capital | | | $27,171,749 | |
Total distributable earnings (loss) | | | 18,501,466 | |
Net assets | | | $45,673,215 | |
Shares of beneficial interest outstanding | | | 1,925,970 | |
| | | | | | | | | | | | |
| | | |
| | | Net assets | | | Shares
outstanding | | | Net asset value
per share | |
Initial Class | | | $43,918,876 | | | | 1,851,788 | | | | $23.72 | |
Service Class | | | 1,754,339 | | | | 74,182 | | | | 23.65 | |
See Notes to Financial Statements
9
MFS Global Growth Portfolio
FINANCIAL STATEMENTS | STATEMENT OF OPERATIONS
This statement describes how much your fund earned in investment income and accrued in expenses. It also describes any gains and/or losses generated by fund operations.
| | | | |
Year ended 12/31/18 | | | | |
| |
Net investment income (loss) | | | | |
Income | | | | |
Dividends | | | $886,016 | |
Dividends from affiliated issuers | | | 7,740 | |
Other | | | 3,148 | |
Income on securities loaned | | | 1,677 | |
Foreign taxes withheld | | | (45,493 | ) |
Total investment income | | | $853,088 | |
Expenses | | | | |
Management fee | | | $490,872 | |
Distribution and/or service fees | | | 5,706 | |
Shareholder servicing costs | | | 1,761 | |
Administrative services fee | | | 18,203 | |
Independent Trustees’ compensation | | | 2,104 | |
Custodian fee | | | 24,973 | |
Shareholder communications | | | 8,915 | |
Audit and tax fees | | | 74,375 | |
Legal fees | | | 526 | |
Miscellaneous | | | 18,807 | |
Total expenses | | | $646,242 | |
Reduction of expenses by investment adviser | | | (95,002 | ) |
Net expenses | | | $551,240 | |
Net investment income (loss) | | | $301,848 | |
| |
Realized and unrealized gain (loss) | | | | |
Realized gain (loss) (identified cost basis) | | | | |
Unaffiliated issuers (net of $252 country tax) | | | $5,302,666 | |
Affiliated issuers | | | (95 | ) |
Foreign currency | | | (4,754 | ) |
Net realized gain (loss) | | | $5,297,817 | |
Change in unrealized appreciation or depreciation | | | | |
Unaffiliated issuers (net of $4,769 decrease in deferred country tax) | | | $(7,697,894 | ) |
Translation of assets and liabilities in foreign currencies | | | (640 | ) |
Net unrealized gain (loss) | | | $(7,698,534 | ) |
Net realized and unrealized gain (loss) | | | $(2,400,717 | ) |
Change in net assets from operations | | | $(2,098,869 | ) |
See Notes to Financial Statements
10
MFS Global Growth Portfolio
FINANCIAL STATEMENTS | STATEMENTS OF CHANGES IN NET ASSETS
These statements describe the increases and/or decreases in net assets resulting from operations, any distributions, and any shareholder transactions.
| | | | | | | | |
| | | Year ended | |
| | | 12/31/18 | | | 12/31/17 | |
Change in net assets | | | | | | | | |
| | |
From operations | | | | | | | | |
Net investment income (loss) | | | $301,848 | | | | $291,982 | |
Net realized gain (loss) | | | 5,297,817 | | | | 3,022,903 | |
Net unrealized gain (loss) | | | (7,698,534 | ) | | | 11,530,112 | |
Change in net assets from operations | | | $(2,098,869 | ) | | | $14,844,997 | |
Total distributions to shareholders (a) | | | $(3,336,024 | ) | | | $(2,400,071 | ) |
Change in net assets from fund share transactions | | | $(6,308,369 | ) | | | $(3,564,898 | ) |
Total change in net assets | | | $(11,743,262 | ) | | | $8,880,028 | |
| | |
Net assets | | | | | | | | |
At beginning of period | | | 57,416,477 | | | | 48,536,449 | |
At end of period (b) | | | $45,673,215 | | | | $57,416,477 | |
| (a) | Distributions from net investment income and from net realized gain are no longer required to be separately disclosed. See Note 2. For the year ended December 31, 2017, distributions from net investment income and from net realized gain were $575,035 and $1,825,036, respectively. |
| (b) | Parenthetical disclosure of undistributed net investment income is no longer required. See Note 2. For the year ended December 31, 2017, end of period net assets included undistributed net investment income of $288,725. |
See Notes to Financial Statements
11
MFS Global Growth Portfolio
FINANCIAL STATEMENTS | FINANCIAL HIGHLIGHTS
The financial highlights table is intended to help you understand the fund’s financial performance for the past 5 years. Certain information reflects financial results for a single fund share. The total returns in the table represent the rate that an investor would have earned (or lost) on an investment in the fund share class (assuming reinvestment of all distributions) held for the entire period.
| | | | | | | | | | | | | | | | | | | | |
| Initial Class | | Year ended | |
| | | | | |
| | | 12/31/18 | | | 12/31/17 | | | 12/31/16 | | | 12/31/15 | | | 12/31/14 | |
| | | | | |
Net asset value, beginning of period | | | $26.53 | | | | $21.00 | | | | $20.88 | | | | $22.45 | | | | $21.63 | |
| | | | | |
| Income (loss) from investment operations | | | | | | | | | | | | | | | | | | | | |
Net investment income (loss) (d) | | | $0.15 | | | | $0.13 | | | | $0.25 | (c) | | | $0.12 | | | | $0.20 | |
Net realized and unrealized gain (loss) | | | (1.23 | ) | | | 6.51 | | | | 1.08 | | | | (0.53 | ) | | | 0.73 | |
Total from investment operations | | | $(1.08 | ) | | | $6.64 | | | | $1.33 | | | | $(0.41 | ) | | | $0.93 | |
| | | | | |
| Less distributions declared to shareholders | | | | | | | | | | | | | | | | | | | | |
From net investment income | | | $(0.14 | ) | | | $(0.27 | ) | | | $(0.13 | ) | | | $(0.22 | ) | | | $(0.11 | ) |
From net realized gain | | | (1.59 | ) | | | (0.84 | ) | | | (1.08 | ) | | | (0.94 | ) | | | — | |
Total distributions declared to shareholders | | | $(1.73 | ) | | | $(1.11 | ) | | | $(1.21 | ) | | | $(1.16 | ) | | | $(0.11 | ) |
Net asset value, end of period (x) | | | $23.72 | | | | $26.53 | | | | $21.00 | | | | $20.88 | | | | $22.45 | |
Total return (%) (k)(r)(s)(x) | | | (4.83 | ) | | | 32.14 | | | | 6.07 | (c) | | | (1.54 | ) | | | 4.32 | |
| | | | | |
Ratios (%) (to average net assets)
and Supplemental data: | | | | | | | | | | | | | | | | | | | | |
Expenses before expense reductions (f) | | | 1.17 | | | | 1.17 | | | | 0.72 | (c) | | | 1.17 | | | | 1.20 | |
Expenses after expense reductions (f) | | | 1.00 | | | | 1.00 | | | | 0.55 | (c) | | | 1.01 | | | | 1.12 | |
Net investment income (loss) | | | 0.56 | | | | 0.55 | | | | 1.18 | (c) | | | 0.52 | | | | 0.91 | |
Portfolio turnover | | | 22 | | | | 21 | | | | 25 | | | | 26 | | | | 25 | |
Net assets at end of period (000 omitted) | | | $43,919 | | | | $54,886 | | | | $46,182 | | | | $48,932 | | | | $55,050 | |
| |
| Service Class | | Year ended | |
| | | | | |
| | | 12/31/18 | | | 12/31/17 | | | 12/31/16 | | | 12/31/15 | | | 12/31/14 | |
| | | | | |
Net asset value, beginning of period | | | $26.44 | | | | $20.94 | | | | $20.82 | | | | $22.38 | | | | $21.55 | |
| | | | | |
| Income (loss) from investment operations | | | | | | | | | | | | | | | | | | | | |
Net investment income (loss) (d) | | | $0.09 | | | | $0.07 | | | | $0.20 | (c) | | | $0.06 | | | | $0.14 | |
Net realized and unrealized gain (loss) | | | (1.24 | ) | | | 6.48 | | | | 1.08 | | | | (0.53 | ) | | | 0.73 | |
Total from investment operations | | | $(1.15 | ) | | | $6.55 | | | | $1.28 | | | | $(0.47 | ) | | | $0.87 | |
| | | | | |
| Less distributions declared to shareholders | | | | | | | | | | | | | | | | | | | | |
From net investment income | | | $(0.05 | ) | | | $(0.21 | ) | | | $(0.08 | ) | | | $(0.15 | ) | | | $(0.04 | ) |
From net realized gain | | | (1.59 | ) | | | (0.84 | ) | | | (1.08 | ) | | | (0.94 | ) | | | — | |
Total distributions declared to shareholders | | | $(1.64 | ) | | | $(1.05 | ) | | | $(1.16 | ) | | | $(1.09 | ) | | | $(0.04 | ) |
Net asset value, end of period (x) | | | $23.65 | | | | $26.44 | | | | $20.94 | | | | $20.82 | | | | $22.38 | |
Total return (%) (k)(r)(s)(x) | | | (5.06 | ) | | | 31.77 | | | | 5.85 | (c) | | | (1.82 | ) | | | 4.05 | |
| | | | | |
Ratios (%) (to average net assets)
and Supplemental data: | | | | | | | | | | | | | | | | | | | | |
Expenses before expense reductions (f) | | | 1.42 | | | | 1.42 | | | | 0.94 | (c) | | | 1.42 | | | | 1.45 | |
Expenses after expense reductions (f) | | | 1.25 | | | | 1.25 | | | | 0.77 | (c) | | | 1.26 | | | | 1.37 | |
Net investment income (loss) | | | 0.34 | | | | 0.31 | | | | 0.94 | (c) | | | 0.27 | | | | 0.63 | |
Portfolio turnover | | | 22 | | | | 21 | | | | 25 | | | | 26 | | | | 25 | |
Net assets at end of period (000 omitted) | | | $1,754 | | | | $2,530 | | | | $2,355 | | | | $2,031 | | | | $2,372 | |
See Notes to Financial Statements
12
MFS Global Growth Portfolio
Financial Highlights – continued
| (c) | Amount reflects aone-time reimbursement of expenses by the custodian (or former custodian) without which net investment income and performance would be lower and expenses would be higher. Excluding the effect of the reimbursement of expenses, the total return for the year ended December 31, 2016 would have been approximately 0.55% lower. |
| (d) | Per share data is based on average shares outstanding. |
| (f) | Ratios do not reflect reductions from fees paid indirectly, if applicable. |
| (k) | The total return does not reflect expenses that apply to separate accounts. Inclusion of these charges would reduce the total return figures for all periods shown. |
| (r) | Certain expenses have been reduced without which performance would have been lower. |
| (s) | From time to time the fund may receive proceeds from litigation settlements, without which performance would be lower. |
| (x) | The net asset values and total returns have been calculated on net assets which include adjustments made in accordance with U.S. generally accepted accounting principles required at period end for financial reporting purposes. |
See Notes to Financial Statements
13
MFS Global Growth Portfolio
NOTES TO FINANCIAL STATEMENTS
| (1) | | Business and Organization |
MFS Global Growth Portfolio (the fund) is a diversified series of MFS Variable Insurance Trust II (the trust). The trust is organized as a Massachusetts business trust and is registered under the Investment Company Act of 1940, as amended, as anopen-end management investment company. The shareholders of each series of the trust are separate accounts of insurance companies, which offer variable annuity and/or life insurance products, and qualified retirement and pension plans.
The fund is an investment company and accordingly follows the investment company accounting and reporting guidance of the Financial Accounting Standards Board (FASB) Accounting Standards Codification Topic 946 Financial Services – Investment Companies.
| (2) | | Significant Accounting Policies |
General– The preparation of financial statements in conformity with U.S. generally accepted accounting principles requires management to make estimates and assumptions that affect the reported amounts of assets and liabilities, and disclosure of contingent assets and liabilities at the date of the financial statements and the reported amounts of increases and decreases in net assets from operations during the reporting period. Actual results could differ from those estimates. In the preparation of these financial statements, management has evaluated subsequent events occurring after the date of the fund’s Statement of Assets and Liabilities through the date that the financial statements were issued. The fund invests in foreign securities, including securities of emerging market issuers. Investments in foreign securities are vulnerable to the effects of changes in the relative values of the local currency and the U.S. dollar and to the effects of changes in each country’s market, economic, industrial, political, regulatory, geopolitical, and other conditions. Investments in emerging markets can involve additional and greater risks than the risks associated with investments in developed foreign markets. Emerging markets can have less developed markets, greater custody and operational risk, less developed legal, regulatory, and accounting systems, and greater political, social, and economic instability than developed markets.
In August 2018, the FASB issued Accounting Standards Update2018-13, Fair Value Measurement (Topic 820) – Disclosure Framework – Changes to the Disclosure Requirements for Fair Value Measurement (“ASU2018-13”) which introduces new fair value disclosure requirements as well as eliminates and modifies certain existing fair value disclosure requirements. ASU2018-13 would be effective for fiscal years beginning after December 15, 2019, and interim periods within those fiscal years; however, management has elected to early adopt ASU2018-13 effective with the current reporting period. The impact of the fund’s adoption was limited to changes in the fund’s financial statement disclosures regarding fair value, primarily those disclosures related to transfers between levels of the fair value hierarchy.
In August 2018, the Securities and Exchange Commission (SEC) released its Final Rule on Disclosure Update and Simplification (the “Final Rule”) which is intended to simplify an issuer’s disclosure compliance efforts by removing redundant or outdated disclosure requirements without significantly altering the mix of information provided to investors. Effective with the current reporting period, the fund adopted the Final Rule with the impacts being that the fund is no longer required to present the components of distributable earnings on the Statement of Assets and Liabilities or the sources of distributions to shareholders and the amount of undistributed net investment income on the Statements of Changes in Net Assets.
Balance Sheet Offsetting– The fund’s accounting policy with respect to balance sheet offsetting is that, absent an event of default by the counterparty or a termination of the agreement, the International Swaps and Derivatives Association (ISDA) Master Agreement, or similar agreement, does not result in an offset of reported amounts of financial assets and financial liabilities in the Statement of Assets and Liabilities across transactions between the fund and the applicable counterparty. The fund’s right to setoff may be restricted or prohibited by the bankruptcy or insolvency laws of the particular jurisdiction to which a specific master netting agreement counterparty is subject. Balance sheet offsetting disclosures, to the extent applicable to the fund, have been included in the fund’s Significant Accounting Policies note under the captions for each of the fund’sin-scope financial instruments and transactions.
Investment Valuations– Equity securities, including restricted equity securities, are generally valued at the last sale or official closing price on their primary market or exchange as provided by a third-party pricing service. Equity securities, for which there were no sales reported that day, are generally valued at the last quoted daily bid quotation on their primary market or exchange as provided by a third-party pricing service. Short-term instruments with a maturity at issuance of 60 days or less may be valued at amortized cost, which approximates market value.Open-end investment companies are generally valued at net asset value per share. Securities and other assets generally valued on the basis of information from a third-party pricing service may also be valued at a broker/dealer bid quotation. In determining values, third-party pricing services can utilize both transaction data and market information such as yield, quality, coupon rate, maturity, type of issue, trading characteristics, and other market data. The values of foreign securities and other assets and liabilities expressed in foreign currencies are converted to U.S. dollars using the mean of bid and asked prices for rates provided by a third-party pricing service.
14
MFS Global Growth Portfolio
Notes to Financial Statements – continued
The Board of Trustees has delegated primary responsibility for determining or causing to be determined the value of the fund’s investments (including any fair valuation) to the adviser pursuant to valuation policies and procedures approved by the Board. If the adviser determines that reliable market quotations are not readily available, investments are valued at fair value as determined in good faith by the adviser in accordance with such procedures under the oversight of the Board of Trustees. Under the fund’s valuation policies and procedures, market quotations are not considered to be readily available for most types of debt instruments and floating rate loans and many types of derivatives. These investments are generally valued at fair value based on information from third-party pricing services. In addition, investments may be valued at fair value if the adviser determines that an investment’s value has been materially affected by events occurring after the close of the exchange or market on which the investment is principally traded (such as foreign exchange or market) and prior to the determination of the fund’s net asset value, or after the halting of trading of a specific security where trading does not resume prior to the close of the exchange or market on which the security is principally traded. Events that occur on a frequent basis after foreign markets close (such as developments in foreign markets and significant movements in the U.S. markets) and prior to the determination of the fund’s net asset value may be deemed to have a material effect on the value of securities traded in foreign markets. Accordingly, the fund’s foreign equity securities may often be valued at fair value. The adviser generally relies on third-party pricing services or other information (such as the correlation with price movements of similar securities in the same or other markets; the type, cost and investment characteristics of the security; the business and financial condition of the issuer; and trading and other market data) to assist in determining whether to fair value and at what value to fair value an investment. The value of an investment for purposes of calculating the fund’s net asset value can differ depending on the source and method used to determine value. When fair valuation is used, the value of an investment used to determine the fund’s net asset value may differ from quoted or published prices for the same investment. There can be no assurance that the fund could obtain the fair value assigned to an investment if it were to sell the investment at the same time at which the fund determines its net asset value per share.
Various inputs are used in determining the value of the fund’s assets or liabilities. These inputs are categorized into three broad levels. In certain cases, the inputs used to measure fair value may fall into different levels of the fair value hierarchy. In such cases, an investment’s level within the fair value hierarchy is based on the lowest level of input that is significant to the fair value measurement. The fund’s assessment of the significance of a particular input to the fair value measurement in its entirety requires judgment, and considers factors specific to the investment. Level 1 includes unadjusted quoted prices in active markets for identical assets or liabilities. Level 2 includes other significant observable market-based inputs (including quoted prices for similar securities, interest rates, prepayment speed, and credit risk). Level 3 includes unobservable inputs, which may include the adviser’s own assumptions in determining the fair value of investments. The following is a summary of the levels used as of December 31, 2018 in valuing the fund’s assets or liabilities:
| | | | | | | | | | | | | | | | |
| Financial Instruments | | Level 1 | | | Level 2 | | | Level 3 | | | Total | |
| Equity Securities: | | | | | | | | | | | | | | | | |
United States | | | $26,032,266 | | | | $— | | | | $— | | | | $26,032,266 | |
United Kingdom | | | 3,592,764 | | | | — | | | | — | | | | 3,592,764 | |
Switzerland | | | — | | | | 2,603,686 | | | | — | | | | 2,603,686 | |
France | | | 2,415,887 | | | | — | | | | — | | | | 2,415,887 | |
Japan | | | — | | | | 2,041,185 | | | | — | | | | 2,041,185 | |
Germany | | | 1,996,077 | | | | — | | | | — | | | | 1,996,077 | |
China | | | 1,049,769 | | | | — | | | | — | | | | 1,049,769 | |
Taiwan | | | 942,829 | | | | — | | | | — | | | | 942,829 | |
India | | | 900,574 | | | | — | | | | — | | | | 900,574 | |
Other Countries | | | 3,028,549 | | | | 808,257 | | | | — | | | | 3,836,806 | |
| Mutual Funds | | | 298,797 | | | | — | | | | — | | | | 298,797 | |
| Total | | | $40,257,512 | | | | $5,453,128 | | | | $— | | | | $45,710,640 | |
For further information regarding security characteristics, see the Portfolio of Investments.
Foreign Currency Translation– Purchases and sales of foreign investments, income, and expenses are converted into U.S. dollars based upon currency exchange rates prevailing on the respective dates of such transactions or on the reporting date for foreign denominated receivables and payables. Gains and losses attributable to foreign currency exchange rates on sales of securities are recorded for financial statement purposes as net realized gains and losses on investments. Gains and losses attributable to foreign exchange rate movements on receivables, payables, income and expenses are recorded for financial statement purposes as foreign currency transaction gains and losses. That portion of both realized and unrealized gains and losses on investments that results from fluctuations in foreign currency exchange rates is not separately disclosed.
Security Loans– Under its Securities Lending Agency Agreement with the fund, State Street Bank and Trust Company, as lending agent, loans the securities of the fund to certain qualified institutions (the “Borrowers”) approved by the fund. Security loans can be terminated at the discretion of either the lending agent or the fund and the related securities must be returned within the earlier of
15
MFS Global Growth Portfolio
Notes to Financial Statements – continued
the standard trade settlement period for such securities or within three business days. The loans are collateralized by cash and/or U.S. Treasury and federal agency obligations in an amount typically at least equal to the market value of the securities loaned. On loans collateralized by cash, the cash collateral is invested in a money market fund. The market value of the loaned securities is determined at the close of business of the fund and any additional required collateral is delivered to the fund on the next business day. The lending agent provides the fund with indemnification against Borrower default. In the event of Borrower default, the lending agent will, for the benefit of the fund, either purchase securities identical to those loaned or, when such purchase is commercially impracticable, pay the fund the market value of the loaned securities. In return, the lending agent assumes the fund’s rights to the related collateral. If the collateral value is less than the cost to purchase identical securities, the lending agent is responsible for the shortfall, but only to the extent that such shortfall is not due to a decline in collateral value resulting from collateral reinvestment for which the fund bears the risk of loss. A portion of the income generated upon investment of the collateral is remitted to the Borrowers, and the remainder is allocated between the fund and the lending agent. On loans collateralized by U.S. Treasury and/or federal agency obligations, a fee is received from the Borrower, and is allocated between the fund and the lending agent. Income from securities lending is separately reported in the Statement of Operations. The dividend and interest income earned on the securities loaned is accounted for in the same manner as other dividend and interest income. At December 31, 2018, there were no securities on loan or collateral outstanding.
Indemnifications– Under the fund’s organizational documents, its officers and Trustees may be indemnified against certain liabilities and expenses arising out of the performance of their duties to the fund. Additionally, in the normal course of business, the fund enters into agreements with service providers that may contain indemnification clauses. The fund’s maximum exposure under these agreements is unknown as this would involve future claims that may be made against the fund that have not yet occurred.
Investment Transactions and Income– Investment transactions are recorded on the trade date. Interest income is recorded on the accrual basis. Dividends received in cash are recorded on theex-dividend date. Certain dividends from foreign securities will be recorded when the fund is informed of the dividend if such information is obtained subsequent to theex-dividend date. Dividend payments received in additional securities are recorded on theex-dividend date in an amount equal to the value of the security on such date.
The fund may receive proceeds from litigation settlements. Any proceeds received from litigation involving portfolio holdings are reflected in the Statement of Operations in realized gain/loss if the security has been disposed of by the fund or in unrealized gain/loss if the security is still held by the fund. Any other proceeds from litigation not related to portfolio holdings are reflected as other income in the Statement of Operations.
Tax Matters and Distributions– The fund intends to qualify as a regulated investment company, as defined under Subchapter M of the Internal Revenue Code, and to distribute all of its taxable income, including realized capital gains. As a result, no provision for federal income tax is required. The fund’s federal tax returns, when filed, will remain subject to examination by the Internal Revenue Service for a three year period. Management has analyzed the fund’s tax positions taken on federal and state tax returns for all open tax years and does not believe that there are any uncertain tax positions that require recognition of a tax liability. Foreign taxes, if any, have been accrued by the fund in the accompanying financial statements in accordance with the applicable foreign tax law. Foreign income taxes may be withheld by certain countries in which the fund invests. Additionally, capital gains realized by the fund on securities issued in or by certain foreign countries may be subject to capital gains tax imposed by those countries.
Distributions to shareholders are recorded on theex-dividend date. Income and capital gain distributions are determined in accordance with income tax regulations, which may differ from U.S. generally accepted accounting principles. Certain capital accounts in the financial statements are periodically adjusted for permanent differences in order to reflect their tax character. These adjustments have no impact on net assets or net asset value per share. Temporary differences which arise from recognizing certain items of income, expense, gain or loss in different periods for financial statement and tax purposes will reverse at some time in the future. Distributions in excess of net investment income or net realized gains are temporary overdistributions for financial statement purposes resulting from differences in the recognition or classification of income or distributions for financial statement and tax purposes.
Book/tax differences primarily relate to wash sale loss deferrals.
The tax character of distributions declared to shareholders for the last two fiscal years is as follows:
| | | | | | | | |
| | | Year ended | | | Year ended | |
| | | 12/31/18 | | | 12/31/17 | |
| Ordinary income (including any short-term capital gains) | | | $701,022 | | | | $717,053 | |
| Long-term capital gains | | | 2,635,002 | | | | 1,683,018 | |
| Total distributions | | | $3,336,024 | | | | $2,400,071 | |
16
MFS Global Growth Portfolio
Notes to Financial Statements – continued
The federal tax cost and the tax basis components of distributable earnings were as follows:
| | | | |
| As of 12/31/18 | | | | |
| |
| Cost of investments | | | $32,843,664 | |
| Gross appreciation | | | 14,451,599 | |
| Gross depreciation | | | (1,584,623 | ) |
| Net unrealized appreciation (depreciation) | | | $12,866,976 | |
| |
| Undistributed ordinary income | | | 633,777 | |
| Undistributed long-term capital gain | | | 5,000,726 | |
| Other temporary differences | | | (13 | ) |
Multiple Classes of Shares of Beneficial Interest– The fund offers multiple classes of shares, which differ in their respective distribution and/or service fees. The fund’s income, realized and unrealized gain (loss), and common expenses are allocated to shareholders based on the daily net assets of each class. Dividends are declared separately for each class. Differences in per share dividend rates are generally due to differences in separate class expenses. The fund’s distributions declared to shareholders as reported in the Statements of Changes in Net Assets are presented by class as follows:
| | | | | | | | | | | | | | | | |
| | | From net investment
income | | | From net realized
gain | |
| | | | |
| | | Year ended
12/31/18 | | | Year ended
12/31/17 | | | Year ended
12/31/18 | | | Year ended
12/31/17 | |
| Initial Class | | | $258,094 | | | | $554,963 | | | | $2,958,456 | | | | $1,744,112 | |
| Service Class | | | 3,919 | | | | 20,072 | | | | 115,555 | | | | 80,924 | |
| Total | | | $262,013 | | | | $575,035 | | | | $3,074,011 | | | | $1,825,036 | |
| (3) | | Transactions with Affiliates |
Investment Adviser– The fund has an investment advisory agreement with MFS to provide overall investment management and related administrative services and facilities to the fund. The management fee is computed daily and paid monthly at the following annual rates based on the fund’s average daily net assets:
| | | | |
| Up to $1 billion | | | 0.90% | |
| In excess of $1 billion and up to $2 billion | | | 0.75% | |
| In excess of $2 billion | | | 0.65% | |
MFS has agreed in writing to reduce its management fee by a specified amount if certain MFS mutual fund assets exceed thresholds agreed to by MFS and the fund’s Board of Trustees. For the year ended December 31, 2018, this management fee reduction amounted to $5,188, which is included in the reduction of total expenses in the Statement of Operations. The management fee incurred for the year ended December 31, 2018 was equivalent to an annual effective rate of 0.89% of the fund’s average daily net assets.
The investment adviser has agreed in writing to pay a portion of the fund’s total annual operating expenses, excluding interest, taxes, extraordinary expenses, brokerage and transaction costs, and investment-related expenses, such that total annual operating expenses do not exceed 1.00% of average daily net assets for the Initial Class shares and 1.25% of average daily net assets for the Service Class shares. This written agreement will continue until modified by the fund’s Board of Trustees, but such agreement will continue at least until April 30, 2020. For the year ended December 31, 2018, this reduction amounted to $89,814, which is included in the reduction of total expenses in the Statement of Operations.
Distributor– MFS Fund Distributors, Inc. (MFD), a wholly-owned subsidiary of MFS, is the distributor of shares of the fund. The Trustees have adopted a distribution plan for the Service Class shares pursuant to Rule12b-1 under the Investment Company Act of 1940.
The fund’s distribution plan provides that the fund will pay MFD distribution and/or service fees equal to 0.25% per annum of its average daily net assets attributable to Service Class shares as partial consideration for services performed and expenses incurred by MFD and financial intermediaries (including participating insurance companies that invest in the fund to fund variable annuity and variable life insurance contracts, sponsors of qualified retirement and pension plans that invest in the fund, and affiliates of these participating insurance companies and plan sponsors) in connection with the sale and distribution of the Service Class shares. MFD may subsequently pay all, or a portion, of the distribution and/or service fees to financial intermediaries.
Shareholder Servicing Agent– MFS Service Center, Inc. (MFSC), a wholly-owned subsidiary of MFS, receives a fee from the fund for its services as shareholder servicing agent. For the year ended December 31, 2018, the fee was $1,623, which equated to 0.0030% annually of the fund’s average daily net assets. MFSC also receives payment from the fund forout-of-pocket expenses paid by MFSC on behalf of the fund. For the year ended December 31, 2018, these costs amounted to $138.
17
MFS Global Growth Portfolio
Notes to Financial Statements – continued
Administrator– MFS provides certain financial, legal, shareholder communications, compliance, and other administrative services to the fund. Under an administrative services agreement, the fund reimburses MFS the costs incurred to provide these services. The fund is charged an annual fixed amount of $17,500 plus a fee based on average daily net assets. The administrative services fee incurred for the year ended December 31, 2018 was equivalent to an annual effective rate of 0.0334% of the fund’s average daily net assets.
Trustees’ and Officers’ Compensation– The fund pays compensation to independent Trustees in the form of a retainer, attendance fees, and additional compensation to Board and Committee chairpersons. The fund does not pay compensation directly to Trustees or officers of the fund who are also officers of the investment adviser, all of whom receive remuneration for their services to the fund from MFS. Certain officers and Trustees of the fund are officers or directors of MFS, MFD, and MFSC.
Other– This fund and certain other funds managed by MFS (the funds) have entered into a service agreement (the ISO Agreement) which provides for payment of fees solely by the funds to Tarantino LLC in return for the provision of services of an Independent Senior Officer (ISO) for the funds. Frank L. Tarantino serves as the ISO and is an officer of the funds and the sole member of Tarantino LLC. The funds can terminate the ISO Agreement with Tarantino LLC at any time under the terms of the ISO Agreement. For the year ended December 31, 2018, the fee paid by the fund under this agreement was $100 and is included in “Miscellaneous” expense in the Statement of Operations. MFS has agreed to bear all expenses associated with office space, other administrative support, and supplies provided to the ISO.
The fund invests in the MFS Institutional Money Market Portfolio which is managed by MFS and seeks current income consistent with preservation of capital and liquidity. This money market fund does not pay a management fee to MFS.
The fund is permitted to engage in purchase and sale transactions with funds and accounts for which MFS serves as investment adviser orsub-adviser (“cross-trades”) pursuant to a policy adopted by the Board of Trustees. This policy has been designed to ensure that cross-trades conducted by the fund comply with Rule17a-7 under the Investment Company Act of 1940. During the year ended December 31, 2018, the fund engaged in sale transactions pursuant to this policy, which amounted to $22,415. The sales transactions resulted in net realized gains (losses) of $(1,793).
Effective on or about January 3, 2018, the adviser has voluntarily undertaken to reimburse the fund from its own resources on a quarterly basis for the cost of investment research embedded in the cost of the fund’s securities trades. This agreement may be rescinded at any time. For the period on or about January 3, 2018 to December 31, 2018, this reimbursement amounted to $3,128, which is included in “Other” income in the Statement of Operations.
For the year ended December 31, 2018, purchases and sales of investments, other than short-term obligations, aggregated $11,669,025 and $20,890,333, respectively.
| (5) | | Shares of Beneficial Interest |
The fund’s Declaration of Trust permits the Trustees to issue an unlimited number of full and fractional shares of beneficial interest. Transactions in fund shares were as follows:
| | | | | | | | | | | | | | | | |
| | | Year ended 12/31/18 | | | Year ended 12/31/17 | |
| | | | |
| | | Shares | | | Amount | | | Shares | | | Amount | |
| Shares sold | | | | | | | | | | | | | | | | |
Initial Class | | | 33,609 | | | | $889,691 | | | | 97,291 | | | | $2,411,672 | |
Service Class | | | 5,546 | | | | 148,393 | | | | 4,256 | | | | 102,294 | |
| | | 39,155 | | | | $1,038,084 | | | | 101,547 | | | | $2,513,966 | |
| | | | |
| Shares issued to shareholders in reinvestment of distributions | | | | | | | | | | | | | | | | |
Initial Class | | | 119,842 | | | | $3,216,550 | | | | 95,003 | | | | $2,299,075 | |
Service Class | | | 4,460 | | | | 119,474 | | | | 4,184 | | | | 100,996 | |
| | �� | 124,302 | | | | $3,336,024 | | | | 99,187 | | | | $2,400,071 | |
| | | | |
| Shares reacquired | | | | | | | | | | | | | | | | |
Initial Class | | | (370,676 | ) | | | $(9,821,213 | ) | | | (322,462 | ) | | | $(7,873,956 | ) |
Service Class | | | (31,503 | ) | | | (861,264 | ) | | | (25,227 | ) | | | (604,979 | ) |
| | | (402,179 | ) | | | $(10,682,477 | ) | | | (347,689 | ) | | | $(8,478,935 | ) |
| | | | |
| Net change | | | | | | | | | | | | | | | | |
Initial Class | | | (217,225 | ) | | | $(5,714,972 | ) | | | (130,168 | ) | | | $(3,163,209 | ) |
Service Class | | | (21,497 | ) | | | (593,397 | ) | | | (16,787 | ) | | | (401,689 | ) |
| | | (238,722 | ) | | | $(6,308,369 | ) | | | (146,955 | ) | | | $(3,564,898 | ) |
18
MFS Global Growth Portfolio
Notes to Financial Statements – continued
The fund and certain other funds managed by MFS participate in a $1.25 billion unsecured committed line of credit, subject to a $1 billion sublimit, provided by a syndication of banks under a credit agreement. Borrowings may be made for temporary financing needs. Interest is charged to each fund, based on its borrowings, generally at a rate equal to the higher of the Overnight Bank Funding rate or daily one month LIBOR plus an agreed upon spread. A commitment fee, based on the average daily, unused portion of the committed line of credit, is allocated among the participating funds. In addition, the fund and other funds managed by MFS have established unsecured uncommitted borrowing arrangements with certain banks for temporary financing needs. Interest is charged to each fund, based on its borrowings, at a rate equal to the Overnight Bank Funding rate plus an agreed upon spread. For the year ended December 31, 2018, the fund’s commitment fee and interest expense were $323 and $0, respectively, and are included in “Miscellaneous” expense in the Statement of Operations.
| (7) | | Investments in Affiliated Issuers |
An affiliated issuer may be considered one in which the fund owns 5% or more of the outstanding voting securities, or a company which is under common control. For the purposes of this report, the fund assumes the following to be affiliated issuers:
| | | | | | | | | | | | | | | | | | |
| Affiliated Issuers | | | | Beginning
Shares/Par
Amount | | | Acquisitions
Shares/Par
Amount | | | Dispositions
Shares/Par
Amount | | | Ending
Shares/Par
Amount | |
| MFS Institutional Money Market Portfolio | | | | | 480,970 | | | | 10,912,719 | | | | (11,094,863 | ) | | | 298,826 | |
| | | | | |
| Affiliated Issuers | | Realized
Gain (Loss) | | Change in
Unrealized
Appreciation/
Depreciation | | | Capital Gain
Distributions | | | Dividend
Income | | | Ending
Value | |
| MFS Institutional Money Market Portfolio | | $(95) | | | $— | | | | $— | | | | $7,740 | | | | $298,797 | |
19
MFS Global Growth Portfolio
REPORT OF INDEPENDENT REGISTERED PUBLIC ACCOUNTING FIRM
To the Board of Trustees of MFS Variable Insurance Trust II and the Shareholders of MFS Global Growth Portfolio:
Opinion on the Financial Statements and Financial Highlights
We have audited the accompanying statement of assets and liabilities of MFS Global Growth Portfolio (the “Fund”), including the portfolio of investments, as of December 31, 2018, the related statement of operations for the year then ended, the statements of changes in net assets for each of the two years in the period then ended, the financial highlights for each of the five years in the period then ended, and the related notes. In our opinion, the financial statements and financial highlights present fairly, in all material respects, the financial position of the Fund as of December 31, 2018, and the results of its operations for the year then ended, the changes in its net assets for each of the two years in the period then ended, and the financial highlights for each of the five years in the period then ended, in conformity with accounting principles generally accepted in the United States of America.
Basis for Opinion
These financial statements and financial highlights are the responsibility of the Fund’s management. Our responsibility is to express an opinion on the Fund’s financial statements and financial highlights based on our audits. We are a public accounting firm registered with the Public Company Accounting Oversight Board (United States) (PCAOB) and are required to be independent with respect to the Fund in accordance with the U.S. federal securities laws and the applicable rules and regulations of the Securities and Exchange Commission and the PCAOB.
We conducted our audits in accordance with the standards of the PCAOB. Those standards require that we plan and perform the audit to obtain reasonable assurance about whether the financial statements and financial highlights are free of material misstatement, whether due to error or fraud. The Fund is not required to have, nor were we engaged to perform, an audit of its internal control over financial reporting. As part of our audits we are required to obtain an understanding of internal control over financial reporting but not for the purpose of expressing an opinion on the effectiveness of the Fund’s internal control over financial reporting. Accordingly, we express no such opinion.
Our audits included performing procedures to assess the risks of material misstatement of the financial statements and financial highlights, whether due to error or fraud, and performing procedures that respond to those risks. Such procedures included examining, on a test basis, evidence regarding the amounts and disclosures in the financial statements and financial highlights. Our audits also included evaluating the accounting principles used and significant estimates made by management, as well as evaluating the overall presentation of the financial statements and financial highlights. Our procedures included confirmation of securities owned as of December 31, 2018, by correspondence with the custodian. We believe that our audits provide a reasonable basis for our opinion.
DELOITTE & TOUCHE LLP
Boston, Massachusetts
February 15, 2019
We have served as the auditor of one or more of the MFS investment companies since 1924.
20
MFS Global Growth Portfolio
TRUSTEES AND OFFICERS – IDENTIFICATION AND BACKGROUND
The Trustees and Officers of the Trust, as of February 1, 2019, are listed below, together with their principal occupations during the past five years. (Their titles may have varied during that period.) The address of each Trustee and Officer is 111 Huntington Avenue, Boston, Massachusetts 02199-7618.
| | | | | | | | | | |
Name, Age | | Position(s)
Held with Fund | | Trustee/Officer
Since (h) | | Number of MFS Funds overseen by the Trustee | | Principal Occupations
During the Past Five Years | | Other Directorships During the Past Five Years (j) |
| INTERESTED TRUSTEES |
Robert J. Manning (k) (age 55) | | Trustee | | February 2004 | | 135 | | Massachusetts Financial Services Company, Executive Chairman (since January 2017); Director; Chairman of the Board; Chief Executive Officer (until 2015);Co-Chief Executive Officer(2015-2016) | | N/A |
| | | | | |
Robin A. Stelmach (k) (age 57) | | Trustee | | January 2014 | | 135 | | Massachusetts Financial Services Company, Vice Chair (since January 2017); Chief Operating Officer and Executive Vice President (until January 2017) | | N/A |
|
| INDEPENDENT TRUSTEES |
John P. Kavanaugh (age 64) | | Trustee and Chair of Trustees | | January 2009 | | 135 | | Private investor | | N/A |
| | | | | |
Steven E. Buller (age 67) | | Trustee | | February 2014 | | 135 | | Financial Accounting Standards Advisory Council, Chairman(2014-2015); Public Company Accounting Oversight Board, Standing Advisory Group, Member (until 2014); BlackRock, Inc. (investment management), Managing Director (until 2014), BlackRock Finco UK (investment management), Director (until 2014) | | N/A |
| | | | | |
John A. Caroselli (age 64) | | Trustee | | March 2017 | | 135 | | JC Global Advisors, LLC (management consulting), President (since 2015); First Capital Corporation (commercial finance), Executive Vice President (until 2015) | | N/A |
| | | | | |
Maureen R. Goldfarb (age 63) | | Trustee | | January 2009 | | 135 | | Private investor | | N/A |
| | | | | |
Michael Hegarty (age 74) | | Trustee | | December 2004 | | 135 | | Private investor | | Rouse Properties Inc., Director (until 2016); Capmark Financial Group Inc., Director (until 2015) |
| | | | | |
Peter D. Jones (age 63) | | Trustee | | January 2019 | | 135 | | Franklin Templeton Distributors, Inc. (investment management), President (until 2015); Franklin Templeton Institutional, LLC (investment management), Chairman (until 2015) | | N/A |
| | | | | |
James W. Kilman, Jr. (age 57) | | Trustee | | January 2019 | | 135 | | KielStrand Capital LLC (family office and merchant bank), Chief Executive Officer (since 2016); Morgan Stanley & Co. (financial services), Vice Chairman of Investment Banking,Co-Head of Diversified Financials Coverage – Financial Institutions Investment Banking Group (until 2016) | | alpha-En Corporation, Director (since 2016) |
21
MFS Global Growth Portfolio
Trustees and Officers – continued
| | | | | | | | | | |
Name, Age | | Position(s)
Held with Fund | | Trustee/Officer
Since (h) | | Number of MFS Funds overseen by the Trustee | | Principal Occupations
During the Past Five Years | | Other Directorships During the Past Five Years (j) |
Clarence Otis, Jr. (age 62) | | Trustee | | March 2017 | | 135 | | Darden Restaurants, Inc., Chief Executive Officer (until 2014) | | VF Corporation, Director; Verizon Communications, Inc., Director; The Travelers Companies, Director; Federal Reserve Bank of Atlanta, Director (until 2015) |
| | | | | |
Maryanne L. Roepke (age 62) | | Trustee | | May 2014 | | 135 | | American Century Investments (investment management), Senior Vice President and Chief Compliance Officer (until 2014) | | N/A |
| | | | | |
Laurie J. Thomsen
(age 61) | | Trustee | | March 2005 | | 135 | | Private investor | | The Travelers Companies, Director; Dycom Industries, Inc., Director (since 2015) |
| | | | | | | | |
Name, Age | | Position(s)
Held with Fund | | Trustee/Officer
Since (h) | | Number of MFS Funds for which the Person is an Officer | | Principal Occupations During the Past Five Years |
| OFFICERS | | | | | | |
Christopher R. Bohane (k)
(age 45) | | Assistant Secretary and Assistant Clerk | | July 2005 | | 135 | | Massachusetts Financial Services Company, Vice President and Assistant General Counsel |
| | | | |
Kino Clark (k) (age 50) | | Assistant Treasurer | | January 2012 | | 135 | | Massachusetts Financial Services Company, Vice President |
| | | | |
John W. Clark, Jr. (k) (age 51) | | Assistant Treasurer | | April 2017 | | 135 | | Massachusetts Financial Services Company, Vice President (since March 2017); Deutsche Bank (financial services), Department Head – Treasurer’s Office (until February 2017) |
| | | | |
Thomas H. Connors (k) (age 59) | | Assistant Secretary and Assistant Clerk | | September 2012 | | 135 | | Massachusetts Financial Services Company, Vice President and Senior Counsel |
| | | | |
Ethan D. Corey (k)
(age 55) | | Assistant
Secretary and Assistant Clerk | | July 2005 | | 135 | | Massachusetts Financial Services Company, Senior Vice President and Associate General Counsel |
| | | | |
David L. DiLorenzo (k)
(age 50) | | President | | July 2005 | | 135 | | Massachusetts Financial Services Company, Senior Vice President |
| | | | |
Heidi W. Hardin (k) (age 51) | | Secretary and Clerk | | April 2017 | | 135 | | Massachusetts Financial Services Company, Executive Vice President and General Counsel (since March 2017); Harris Associates (investment management), General Counsel (from September 2015 to January 2017); Janus Capital Management LLC (investment management), Senior Vice President and General Counsel (until September 2015) |
| | | | |
Brian E. Langenfeld (k) (age 45) | | Assistant
Secretary and Assistant Clerk | | June 2006 | | 135 | | Massachusetts Financial Services Company, Vice President and Senior Counsel |
| | | | |
Amanda S. Mooradian (k) (age 39) | | Assistant
Secretary and Assistant Clerk | | September 2018 | | 135 | | Massachusetts Financial Services Company, Assistant Vice President and Counsel |
| | | | |
Susan A. Pereira (k)
(age 48) | | Assistant
Secretary and Assistant Clerk | | July 2005 | | 135 | | Massachusetts Financial Services Company, Vice President and Senior Counsel |
| | | | |
Kasey L. Phillips (k) (age 48) | | Assistant Treasurer | | September 2012 | | 135 | | Massachusetts Financial Services Company, Vice President |
| | | | |
Matthew A. Stowe (k) (age 44) | | Assistant Secretary and Assistant Clerk | | October 2014 | | 135 | | Massachusetts Financial Services Company, Vice President and Assistant General Counsel |
22
MFS Global Growth Portfolio
Trustees and Officers – continued
| | | | | | | | |
Name, Age | | Position(s)
Held with Fund | | Trustee/Officer
Since (h) | | Number of MFS Funds for which the Person is an Officer | | Principal Occupations During the Past Five Years |
Frank L. Tarantino
(age 74) | | Independent
Senior Officer | | June 2004 | | 135 | | Tarantino LLC (provider of compliance services), Principal |
| | | | |
Richard S. Weitzel (k)
(age 48) | | Assistant Secretary and Assistant Clerk | | October 2007 | | 135 | | Massachusetts Financial Services Company, Senior Vice President and Associate General Counsel |
| | | | |
Martin J. Wolin (k) (age 51) | | Chief Compliance Officer | | July 2015 | | 135 | | Massachusetts Financial Services Company, Senior Vice President and Chief Compliance Officer (since July 2015); Mercer (financial service provider), Chief Risk and Compliance Officer, North America and Latin America (until June 2015) |
| | | | |
James O. Yost (k)
(age 58) | | Treasurer | | September 1990 | | 135 | | Massachusetts Financial Services Company, Senior Vice President |
| (h) | Date first appointed to serve as Trustee/officer of an MFS Fund. Each Trustee has served continuously since appointment unless indicated otherwise. For the period from December 15, 2004 until February 22, 2005, Mr. Manning served as Advisory Trustee. From January 2012 through December 2016, Messrs. DiLorenzo and Yost served as Treasurer and Deputy Treasurer of the Funds, respectively. |
| (j) | Directorships or trusteeships of companies required to report to the Securities and Exchange Commission (i.e., “public companies”). |
| (k) | “Interested person” of the Trust within the meaning of the Investment Company Act of 1940 (referred to as the 1940 Act), which is the principal federal law governing investment companies like the fund, as a result of a position with MFS. The address of MFS is 111 Huntington Avenue, Boston, Massachusetts 02199-7618. |
Each Trustee has been elected by shareholders and each Trustee and officer holds office until his or her successor is chosen and qualified or until his or her earlier death, resignation, retirement or removal. The Trust does not hold annual meetings for the purpose of electing Trustees, and Trustees are not elected for fixed terms. Under the terms of the Board’s retirement policy, an Independent Trustee shall retire at the end of the calendar year in which he or she reaches the earlier of 75 years of age or 15 years of service on the Board (or, in the case of any Independent Trustee who joined the Board prior to 2015, 20 years of service on the Board).
Messrs. Buller, Hegarty, Kilman and Otis and Ms. Roepke are members of the Trust’s Audit Committee.
Each of the Interested Trustees and certain Officers hold comparable officer positions with certain affiliates of MFS.
The Statement of Additional Information for a Fund includes further information about the Trustees and is available without charge upon request by calling1-800-225-2606.
| | |
Investment Adviser Massachusetts Financial Services Company 111 Huntington Avenue Boston, MA 02199-7618 | | Custodian State Street Bank and Trust Company 1 Lincoln Street Boston, MA 02111-2900 |
| |
Distributor MFS Fund Distributors, Inc. 111 Huntington Avenue Boston, MA 02199-7618 | | Independent Registered Public Accounting Firm Deloitte & Touche LLP 200 Berkeley Street Boston, MA 02116 |
| |
Portfolio Manager(s) David Antonelli Jeffrey Constantino Joseph Skorski | | |
23
MFS Global Growth Portfolio
BOARD REVIEW OF INVESTMENT ADVISORY AGREEMENT
The Investment Company Act of 1940 requires that both the full Board of Trustees and a majority of thenon-interested (“independent”) Trustees, voting separately, annually approve the continuation of the Fund’s investment advisory agreement with MFS. The Trustees consider matters bearing on the Fund and its advisory arrangements at their meetings throughout the year, including a review of performance data at each regular meeting. In addition, the independent Trustees met several times over the course of three months beginning in May and ending in July, 2018 (“contract review meetings”) for the specific purpose of considering whether to approve the continuation of the investment advisory agreement for the Fund and the other investment companies that the Board oversees (the “MFS Funds”). The independent Trustees were assisted in their evaluation of the Fund’s investment advisory agreement by independent legal counsel, from whom they received separate legal advice and with whom they met separately from MFS during various contract review meetings. The independent Trustees were also assisted in this process by the MFS Funds’ Independent Senior Officer, a senior officer appointed by and reporting to the independent Trustees.
In connection with their deliberations regarding the continuation of the investment advisory agreement, the Trustees, including the independent Trustees, considered such information and factors as they believed, in light of the legal advice furnished to them and their own business judgment, to be relevant. The investment advisory agreement for the Fund was considered separately, although the Trustees also took into account the common interests of all MFS Funds in their review. As described below, the Trustees considered the nature, quality, and extent of the various investment advisory, administrative, and shareholder services performed by MFS under the existing investment advisory agreement and other arrangements with the Fund.
In connection with their contract review meetings, the Trustees received and relied upon materials that included, among other items: (i) information provided by Broadridge Financial Solutions, Inc. (“Broadridge”), an independent third party, on the investment performance of the Fund for various time periods ended December 31, 2017 and the investment performance of a group of funds with substantially similar investment classifications/objectives (the “Broadridge performance universe”), (ii) information provided by Broadridge on the Fund’s advisory fees and other expenses and the advisory fees and other expenses of comparable funds identified by Broadridge (the “Broadridge expense group”), (iii) information provided by MFS on the advisory fees of portfolios of other clients of MFS, including institutional separate accounts and other clients, (iv) information as to whether and to what extent applicable expense waivers, reimbursements or fee “breakpoints” are observed for the Fund, (v) information regarding MFS’ financial results and financial condition, including MFS’ and certain of its affiliates’ estimated profitability from services performed for the Fund and the MFS Funds as a whole, and compared to MFS’ institutional business, (vi) MFS’ views regarding the outlook for the mutual fund industry and the strategic business plans of MFS, (vii) descriptions of various functions performed by MFS for the Funds, such as compliance monitoring and portfolio trading practices, and (viii) information regarding the overall organization of MFS, including information about MFS’ senior management and other personnel providing investment advisory, administrative and other services to the Fund and the other MFS Funds. The comparative performance, fee and expense information prepared and provided by Broadridge was not independently verified and the independent Trustees did not independently verify any information provided to them by MFS.
The Trustees’ conclusion as to the continuation of the investment advisory agreement was based on a comprehensive consideration of all information provided to the Trustees and not the result of any single factor. Some of the factors that figured particularly in the Trustees’ deliberations are described below, although individual Trustees may have evaluated the information presented differently from one another, giving different weights to various factors. It is also important to recognize that the fee arrangements for the Fund and other MFS Funds are the result of years of review and discussion between the independent Trustees and MFS, that certain aspects of such arrangements may receive greater scrutiny in some years than in others, and that the Trustees’ conclusions may be based, in part, on their consideration of these same arrangements during the course of the year and in prior years.
Based on information provided by Broadridge and MFS, the Trustees reviewed the Fund’s total return investment performance as well as the Broadridge performance universe over various time periods. The Trustees placed particular emphasis on the total return performance of the Fund’s Initial Class shares in comparison to the performance of funds in its Broadridge performance universe over the three-year period ended December 31, 2017, which the Trustees believed was a long enough period to reflect differing market conditions. The total return performance of the Fund’s Initial Class shares was in the 3rd quintile relative to the other funds in the universe for this three-year period (the 1st quintile being the best performers and the 5th quintile being the worst performers). The total return performance of the Fund’s Initial Class shares was in the 1st quintile for theone-year period and the 4th quintile for the five-year period ended December 31, 2017 relative to the Broadridge performance universe. Because of the passage of time, these performance results may differ from the performance results for more recent periods, including those shown elsewhere in this report.
In the course of their deliberations, the Trustees took into account information provided by MFS in connection with the contract review meetings, as well as during investment review meetings conducted with portfolio management personnel during the course of the year regarding the Fund’s performance. After reviewing these and related factors, the Trustees concluded, within the context of their overall conclusions regarding the investment advisory agreement, that they were satisfied with MFS’ responses and efforts relating to investment performance.
24
MFS Global Growth Portfolio
Board Review of Investment Advisory Agreement – continued
In assessing the reasonableness of the Fund’s advisory fee, the Trustees considered, among other information, the Fund’s advisory fee and the total expense ratio of the Fund’s Initial Class shares as a percentage of average daily net assets and the advisory fee and total expense ratios of peer groups of funds based on information provided by Broadridge. The Trustees considered that MFS currently observes an expense limitation for the Fund, which may not be changed without the Trustees’ approval. The Trustees also considered that, according to the data provided by Broadridge (which takes into account any fee reductions or expense limitations that were in effect during the Fund’s last fiscal year), the Fund’s effective advisory fee rate was higher than the Broadridge expense group median and the Fund’s total expense ratio was approximately at the Broadridge expense group median.
The Trustees also considered the advisory fees charged by MFS to any institutional separate accounts advised by MFS (“separate accounts”) and unaffiliated investment companies for which MFS serves as subadviser (“subadvised funds”) that have comparable investment strategies to the Fund, if any. In comparing these fees, the Trustees considered information provided by MFS as to the generally broader scope of services provided by MFS to the Fund, as well as the more extensive regulatory burdens imposed on MFS in managing the Fund, in comparison to separate accounts and subadvised funds. The Trustees also considered the higher demands placed on MFS’ investment personnel and trading infrastructure as a result of the daily cashin-flows andout-flows of the Fund in comparison to separate accounts.
The Trustees also considered whether the Fund may benefit from any economies of scale in the management of the Fund in the event of growth in assets of the Fund and/or growth in assets of the MFS Funds as a whole. They noted that the Fund’s advisory fee rate schedule is subject to contractual breakpoints that reduce the Fund’s advisory fee rate on average daily net assets over $1 billion and $2 billion. The Trustees also noted that MFS has agreed in writing to waive a portion of the management fees of certain MFS Funds, including the Fund, if the total combined assets of certain funds within the MFS Funds’ complex increase above agreed upon thresholds (the “group fee waiver”), enabling the Fund’s shareholders to share in the benefits from any economies of scale at the complex level. The group fee waiver is reviewed and renewed annually between the Board and MFS. The Trustees concluded that the breakpoints and the group fee waiver were sufficient to allow the Fund to benefit from economies of scale as its assets and overall complex assets grow.
The Trustees also considered information prepared by MFS relating to MFS’ costs and profits with respect to the Fund, the MFS Funds considered as a group, and other investment companies and accounts advised by MFS, as well as MFS’ methodologies used to determine and allocate its costs to the MFS Funds, the Fund and other accounts and products for purposes of estimating profitability.
After reviewing these and other factors described herein, the Trustees concluded, within the context of their overall conclusions regarding the investment advisory agreement, that the advisory fees charged to the Fund represent reasonable compensation in light of the services being provided by MFS to the Fund.
In addition, the Trustees considered MFS’ resources and related efforts to continue to retain, attract and motivate capable personnel to serve the Fund. The Trustees also considered current and developing conditions in the financial services industry, including the presence of large and well-capitalized companies which are spending, and appear to be prepared to continue to spend, substantial sums to engage personnel and to provide services to competing investment companies. In this regard, the Trustees also considered the financial resources of MFS and its ultimate parent, Sun Life Financial Inc. The Trustees also considered the advantages and possible disadvantages to the Fund of having an adviser that also serves other investment companies as well as other accounts.
The Trustees also considered the nature, quality, cost, and extent of administrative, transfer agency, and distribution services provided to the Fund by MFS and its affiliates under agreements and plans other than the investment advisory agreement, including any12b-1 fees the Fund pays to MFS Fund Distributors, Inc., an affiliate of MFS. The Trustees also considered the nature, extent and quality of certain other services MFS performs or arranges for on the Fund’s behalf, which may include securities lending programs, directed expense payment programs, class action recovery programs, and MFS’ interaction with third-party service providers, principally custodians andsub-custodians. The Trustees concluded that the variousnon-advisory services provided by MFS and its affiliates on behalf of the Fund were satisfactory.
The Trustees consideredso-called“fall-out benefits” to MFS such as reputational value derived from serving as investment manager to the MFS Funds. The Trustees also considered that, effective January 3, 2018, MFS had discontinued its historic practice of obtaining investment research from portfolio brokerage commissions paid by certain MFS Funds and would thereafter voluntarily reimburse a Fund, if applicable, for the costs of external research acquired through the use of the Fund’s portfolio brokerage commissions.
Based on their evaluation of factors that they deemed to be material, including those factors described above, the Board of Trustees, including the independent Trustees, concluded that the Fund’s investment advisory agreement with MFS should be continued for an additionalone-year period, commencing August 1, 2018.
25
MFS Global Growth Portfolio
PROXY VOTING POLICIES AND INFORMATION
MFS votes proxies on behalf of the fund pursuant to proxy voting policies and procedures that are available without charge, upon request, by calling 1-800-225-2606, by visitingmfs.com/proxyvoting, or by visiting the SEC’s Web site athttp://www.sec.gov.
Information regarding how the fund voted proxies relating to portfolio securities during the most recent twelve-month period ended June 30 is available by August 31 of each year without charge by visitingmfs.com/proxyvoting, or by visiting the SEC’s Web site athttp://www.sec.gov.
QUARTERLY PORTFOLIO DISCLOSURE
The fund files a complete schedule of portfolio holdings with the SEC for the first and third quarters of each fiscal year on Form N-Q. The fund’s Form N-Q is available on the SEC’s website athttp://www.sec.gov.A shareholder can obtain the portfolio holdings report for the first and third quarters of the fund’s fiscal year atmfs.com/vit2 by choosing the fund’s name and then selecting the “Resources” tab and clicking on “Prospectus and Reports”.
FURTHER INFORMATION
From time to time, MFS may post important information about the fund or the MFS funds on the MFS web site (mfs.com). This information is available athttps://www.mfs.com/en-us/what-we-do/announcements.htmlor atmfs.com/vit2 by choosing the fund’s name.
INFORMATION ABOUT FUND CONTRACTS AND LEGAL CLAIMS
The fund has entered into contractual arrangements with an investment adviser, administrator, distributor, shareholder servicing agent, 529 program manager (if applicable), and custodian who each provide services to the fund. Unless expressly stated otherwise, shareholders are not parties to, or intended beneficiaries of these contractual arrangements, and these contractual arrangements are not intended to create any shareholder right to enforce them against the service providers or to seek any remedy under them against the service providers, either directly or on behalf of the fund.
Under the Trust’s By-Laws and Declaration of Trust, any claims asserted against or on behalf of the MFS Funds, including claims against Trustees and Officers, must be brought in state and federal courts located within the Commonwealth of Massachusetts.
FEDERAL TAX INFORMATION (unaudited)
The following information is provided pursuant to provisions of the Internal Revenue Code.
The fund designates $2,899,000 as capital gain dividends paid during the fiscal year.
For corporate shareholders, 46.70% of the ordinary income dividends paid during the fiscal year qualify for the corporate dividends received deduction.
26
rev. 3/16
| | | | |
| FACTS | | WHAT DOES MFS DO WITH YOUR
PERSONAL INFORMATION? | |  |
| | |
| Why? | | Financial companies choose how they share your personal information. Federal law gives consumers the right to limit some but not all sharing. Federal law also requires us to tell you how we collect, share, and protect your personal information. Please read this notice carefully to understand what we do. |
| | |
| What? | | The types of personal information we collect and share depend on the product or service you have with us. This information can include: • Social Security number and account balances • Account transactions and transaction history • Checking account information and wire transfer instructions When you areno longer our customer, we continue to share your information as described in this notice. |
| | |
| How? | | All financial companies need to share customers’ personal information to run their everyday business. In the section below, we list the reasons financial companies can share their customers’ personal information; the reasons MFS chooses to share; and whether you can limit this sharing. |
| | | | |
Reasons we can share your
personal information | | Does MFS share? | | Can you limit this
sharing? |
For our everyday business purposes – such as to process your transactions, maintain your account(s), respond to court orders and legal investigations, or report to credit bureaus | | Yes | | No |
For our marketing purposes – to offer our products and services to you | | No | | We don’t share |
| For joint marketing with other financial companies | | No | | We don’t share |
For our affiliates’ everyday business purposes – information about your transactions and experiences | | No | | We don’t share |
For our affiliates’ everyday business purposes – information about your creditworthiness | | No | | We don’t share |
| For nonaffiliates to market to you | | No | | We don’t share |
| | |
| Questions? | | Call800-225-2606 or go tomfs.com. |
27
| | |
| Who we are |
| Who is providing this notice? | | MFS Funds, MFS Investment Management, MFS Institutional Advisors, Inc., and MFS Heritage Trust Company. |
| | |
| What we do |
| How does MFS protect my personal information? | | To protect your personal information from unauthorized access and use, we use security measures that comply with federal law. These measures include procedural, electronic, and physical safeguards for the protection of the personal information we collect about you. |
How does MFS
collect my personal information? | | We collect your personal information, for example, when you • open an account or provide account information • direct us to buy securities or direct us to sell your securities • make a wire transfer We also collect your personal information from others, such as credit bureaus, affiliates, or other companies. |
| Why can’t I limit all sharing? | | Federal law gives you the right to limit only • sharing for affiliates’ everyday business purposes – information about your creditworthiness • affiliates from using your information to market to you • sharing for nonaffiliates to market to you State laws and individual companies may give you additional rights to limit sharing. |
| | |
| Definitions |
| Affiliates | | Companies related by common ownership or control. They can be financial and nonfinancial companies. • MFS does not share personal information with affiliates, except for everyday business purposes as described on page one of this notice. |
| Nonaffiliates | | Companies not related by common ownership or control. They can be financial and nonfinancial companies. • MFS does not share with nonaffiliates so they can market to you. |
| Joint marketing | | A formal agreement between nonaffiliated financial companies that together market financial products or services to you. • MFS doesn’t jointly market. |
| | |
| Other important information |
| If you own an MFS product or receive an MFS service in the name of a third party such as a bank or broker-dealer, their privacy policy may apply to you instead of ours. |
28
Annual Report
December 31, 2018

MFS® Global Research Portfolio

MFS® Variable Insurance Trust II
Beginning on January 1, 2021, as permitted by regulations adopted by the U.S. Securities and Exchange Commission, the insurance company that offers your contract may determine that it will no longer send you paper copies of the fund’s annual and semiannual shareholder reports unless you specifically request paper copies from the insurance company or from your financial intermediary. Instead, the shareholder reports will be made available on a Web site (insurancefunds.mfs.com or other Web site of which you will be notified), and the insurance company will notify you by mail each time a report is posted and provide you with a Web site link to access the report. Instructions for requesting paper copies will be provided by your insurance company or financial intermediary.
If you already elected to receive shareholder reports by email, you will not be affected by this change and you need not take any action. If your insurance company or financial intermediary offers electronic delivery, you may elect to receive shareholder reports and other communications from the insurance company or financial intermediary by email by following the instructions provided by the insurance company or financial intermediary.
Beginning on January 1, 2019, you may elect to receive all future reports in paper free of charge from the insurance company or financial intermediary. You can inform the insurance company or financial intermediary that you wish to continue receiving paper copies of your shareholder reports by contacting your insurance company or financial intermediary. Your election to receive reports in paper will apply to all funds held in your account with your insurance company or financial intermediary.
RES-ANN
MFS® Global Research Portfolio
CONTENTS
The report is prepared for the general information of contract owners. It is authorized for distribution to prospective investors only when preceded or accompanied by a current prospectus.
NOT FDIC INSURED• MAY LOSE VALUE• NO BANK OR CREDIT UNION GUARANTEE• NOT A DEPOSIT• NOT INSURED BY ANY FEDERAL GOVERNMENT AGENCY OR NCUA/NCUSIF
MFS Global Research Portfolio
LETTER FROM THE EXECUTIVE CHAIRMAN

Dear Contract Owners:
Higher interest rates, international trade friction, and geopolitical uncertainty surrounding issues such as Brexit have contributed to an uptick in market volatility in recent quarters — a departure from thelow-volatility environment that prevailed for much of the past several years. Against this more challenging backdrop, equity markets in the United States outperformed most international markets on a relative basis in 2018, though broad market returns were modestly negative on an absolute basis. Global economic growth has become less synchronized over the past few quarters, with Europe, China, and some emerging markets having shown signs of significantly slowing growth. While U.S. growth has remained above average, the pace of that growth slowed in the second half of 2018.
Slowing global growth and tighter financial conditions have clouded the outlook for U.S. monetary policy, with the chairman of the U.S. Federal Reserve acknowledging that policy rates are close to levels that the Fed deems neutral for the U.S. economy. This suggests that the predictable pattern of quarterly rate increases is behind us. At the same time, markets must contend with a shift from years of quantitative easing toward a cycle of quantitative tightening now that the European Central Bank has halted asset purchases. U.S. tax reforms adopted in late 2017 have been welcomed by equity markets while emerging market economies have recently had to contend with tighter financial conditions as a result of firmer U.S. interest rates and a stronger dollar. With the Republicans losing control of the U.S. House of Representatives, further meaningful U.S. fiscal stimulus appears less likely over the remainder of this presidential term. A partial U.S. government shutdown, beginning in late 2018, also added to political uncertainty. Globally, inflation remains largely subdued thanks in part to falling oil prices, but tight labor markets and moderate global demand have investors on the lookout for its potential reappearance. Increased U.S. protectionism is also a growing concern, as investors fear trade disputes could dampen business sentiment, leading to even slower global growth. While there has been progress on this front — a NAFTA replacement has been agreed upon between the U.S., Mexico, and Canada; the free trade pact with Korea has been updated; and a negotiating framework with the European Union has been agreed upon — tensions over trade with China remain quite high, though the two sides have recently returned to the negotiating table.
As a global investment manager with nearly a century of expertise, MFS® firmly believes active risk management offers downside mitigation and may help improve investment outcomes. We built our active investment platform with this belief in mind. Ourlong-term perspective influences nearly every aspect of our business, ensuring our investment decisions align with the investing time horizons of our clients.
Respectfully,

Robert J. Manning
Executive Chairman
MFS Investment Management
February 15, 2019
The opinions expressed in this letter are subject to change and may not be relied upon for investment advice. No forecasts can be guaranteed.
1
MFS Global Research Portfolio
PORTFOLIO COMPOSITION
Portfolio structure

| | | | |
| Top ten holdings | | | | |
| Microsoft Corp. | | | 2.5% | |
| Amazon.com, Inc. | | | 2.1% | |
| Alphabet, Inc., “A” | | | 1.9% | |
| Salesforce.com, Inc. | | | 1.4% | |
| AIA Group Ltd. | | | 1.4% | |
| Facebook, Inc., “A” | | | 1.4% | |
| HDFC Bank Ltd. | | | 1.4% | |
| Medtronic PLC | | | 1.3% | |
| Honeywell International, Inc. | | | 1.3% | |
| Aon PLC | | | 1.3% | |
| |
| Global equity sectors (k) | | | | |
| Financial Services | | | 20.3% | |
| Technology | | | 19.5% | |
| Capital Goods | | | 16.9% | |
| Health Care | | | 11.9% | |
| Consumer Cyclicals | | | 10.8% | |
| Energy | | | 9.1% | |
| Consumer Staples | | | 6.6% | |
| Telecommunications/Cable Television | | | 4.3% | |
| | | | |
| Issuer country weightings (x) | | | | |
| United States | | | 60.4% | |
| United Kingdom | | | 5.1% | |
| Switzerland | | | 4.9% | |
| Japan | | | 4.5% | |
| France | | | 4.5% | |
| Canada | | | 3.1% | |
| Hong Kong | | | 2.6% | |
| Germany | | | 2.3% | |
| China | | | 2.0% | |
| Other Countries | | | 10.6% | |
| |
| Currency exposure weightings (y) | | | | |
| United States Dollar | | | 62.3% | |
| Euro | | | 11.8% | |
| Swiss Franc | | | 4.9% | |
| British Pound Sterling | | | 4.8% | |
| Japanese Yen | | | 4.5% | |
| Hong Kong Dollar | | | 3.6% | |
| Canadian Dollar | | | 2.6% | |
| Taiwan Dollar | | | 1.4% | |
| Indian Rupee | | | 1.4% | |
| Other Currencies | | | 2.7% | |
| (k) | The sectors set forth above and the associated portfolio composition are based on MFS’ own custom sector classification methodology. |
| (x) | Represents the portfolio’s exposure to issuer countries as a percentage of a portfolio’s net assets. For purposes of this presentation, United States includes Cash & Cash Equivalents. |
| (y) | Represents the portfolio’s exposure to a particular currency as a percentage of a portfolio’s net assets. For purposes of this presentation, United States Dollar includes Cash & Cash Equivalents. |
Cash & Cash Equivalents includes any cash, investments in money market funds, short-term securities, and other assets less liabilities. Please see the Statement of Assets and Liabilities for additional information related to the fund’s cash position and other assets and liabilities.
Percentages are based on net assets as of December 31, 2018.
The portfolio is actively managed and current holdings may be different.
2
MFS Global Research Portfolio
MANAGEMENT REVIEW
Summary of Results
For the twelve months ended December 31, 2018, Initial Class shares of the MFS Global Research Portfolio (“fund”) provided a total return of –8.83%, while Service Class shares of the fund provided a total return of –9.06%. These compare with a return of –9.42% over the same period for the fund’s benchmark, the MSCI All Country World Index (net div).
Market Environment
During the reporting period, the US Federal Reserve raised interest rates by 100 basis points, bringing the total number of rate hikes to nine since the central bank began to normalize monetary policy in late 2015. Economic growth rates in the US, Eurozone and Japan remained above trend, despite a slowing in global growth, particularly toward the end of the period. Inflation remained contained, particularly outside the US. Late in the period, the European Central Bank halted its asset purchase program but issued forward guidance that it does not expect to raise interest rates at least until after the summer of 2019. The Bank of England (once) and the Bank of Canada (three times) each raised rates during the period. The European political backdrop became a bit more volatile, late in the period, spurred by concerns over cohesion in the eurozone after the election of an anti-establishment, Eurosceptic coalition government in Italy and widespread protests over stagnant wage growth in France.
Bond yields rose in the US during most of the period, but remained low by historical standards and slipped from their highs, late in the period, as market volatility increased. Yields in many developed markets fell. Outside of emerging markets, where spreads and currencies came under pressure, credit spreads remained quite tight until the end of the period, when thinner liquidity, lower oil prices and concerns over high degrees of corporate leverage emerged. Growing concern over increasing global trade friction appeared to have weighed on business sentiment during the period’s second half, especially outside the US. Tighter financial conditions from rising US rates and a strong dollar, combined with trade uncertainty, helped expose structural weaknesses in several emerging markets in the second half of the period.
Volatility increased, at the end of the period, amid signs of slowing global economic growth and increasing trade tensions, which prompted a market setback shortly after US markets set record highs in September. It was the second such equity market decline during the reporting period. The correction came despite a third consecutive quarter of strong growth in US earnings per share. Strong earnings growth, combined with the market decline, brought US equity valuations down from elevated levels, earlier in the period, to multiples more in line with long-term averages. While the US economy held up better than most, global economic growth became less synchronized during the period, with Europe and China showing signs of a slowdown and some emerging markets coming under stress.
Contributors to Performance
Stock selection in both thetechnologyandcapital goodssectors was a primary contributor to performance relative to the MSCI All Country World Index. Within thetechnology sector, the fund’s overweight positions in customer information software manager Salesforce.com, digital marketing and media solutions provider Adobe Systems and global banking and payment technologies provider Fidelity National Information Services supported relative returns. The stock price of Adobe Systems appreciated as the company delivered strong earnings results, driven by perpetual Acrobat revenues and healthy revenue growth in the company’s Creative Cloud, Document Cloud and Experience Cloud services divisions. Within thecapital goods sector, there were no individual stocks that were among the portfolio’s largest relative contributors during the reporting period.
Elsewhere, the fund’s overweight positions in athletic shoes and apparel manufacturer NIKE, medical device maker Medtronic, risk management and human capital consulting services provider Aon,e-commerce and cloud services giant Amazon.com and financial services company Credicorp (Peru) helped relative performance. Shares of Medtronic advanced during the period, driven by strong growth across all regions and business segments. Management also increased organic revenue growth guidance for 2019, which further supported the stock. Additionally, the fund’s position in shares of real estate investment trust Store Capital (b) and banking and financial services provider HDFC Bank (b) (India) bolstered relative results.
During the reporting period, the fund’s relative currency exposure, resulting primarily from differences between the fund’s and the benchmark’s exposures to holdings of securities denominated in foreign currencies, contributed to relative performance. All of MFS’ investment decisions are driven by the fundamentals of each individual opportunity and, as such, it is common for our portfolios to have different currency exposures than the benchmark.
Detractors from Performance
Stock selection in both thehealth careandconsumer staplessectors detracted from relative performance. Within thehealth caresector, the fund’s overweight position in shares of pharmaceutical company Bayer AG (Germany), and not owning shares of pharmaceutical company Merck, weakened relative returns. The stock price of Bayer depreciated after a court awarded damages to an individual who claimed to have contractedNon-Hodgkin’s Lymphoma cancer from glyphosate herbicide, which was discovered and branded as Roundup by Monsanto, whom Bayer acquired in 2018. The stock traded significantly lower after the news, as
3
MFS Global Research Portfolio
Management Review – continued
investors appeared to have been concerned that more lawsuits would be filed against Bayer. Within theconsumer staples sector, the fund’s overweight position in beauty products company Coty (h) hindered relative results.
Elsewhere, the fund’s overweight positions in information technology company DXC Technology, global banking group BNP Paribas (France), private banking services provider Julius Baer Group (Switzerland), industrial process technology manufacturer GEA Group (Germany), diversified financial services firm Citigroup, investment management and banking firm UBS (Switzerland) and general merchandise retailer Sundrug (Japan) were also among the top relative detractors during the reporting period. The stock price of DXC Technology declined late in the period after the company missed, then lowered, its revenue expectations, driven by execution challenges in its Digital business and foreign exchange headwinds.
Respectfully,
Portfolio Manager(s)
James Keating and Joseph MacDougall
| (b) | Security is not a benchmark constituent. |
| (h) | Security was not held in the portfolio at period end. |
Note to Shareholders: Effective November 6, 2018, Ben Kottler is no longer a Portfolio Manager of the Fund.
The views expressed in this report are those of the portfolio manager(s) only through the end of the period of the report as stated on the cover and do not necessarily reflect the views of MFS or any other person in the MFS organization. These views are subject to change at any time based on market or other conditions, and MFS disclaims any responsibility to update such views. These views may not be relied upon as investment advice or an indication of trading intent on behalf of any MFS portfolio. References to specific securities are not recommendations of such securities, and may not be representative of any MFS portfolio’s current or future investments.
4
MFS Global Research Portfolio
PERFORMANCE SUMMARY THROUGH 12/31/18
The following chart illustrates the historical performance of the fund in comparison to its benchmark(s). Benchmarks are unmanaged and may not be invested in directly. Benchmark returns do not reflect any fees or expenses. The performance of other share classes will be greater than or less than that of the class depicted below. (See Notes to Performance Summary.)
Performance data shown represents past performance and is no guarantee of future results. Investment return and principal value fluctuate so your units, when sold, may be worth more or less than the original cost; current performance may be lower or higher than quoted. The performance shown does not reflect the deduction of taxes, if any, that a contract holder would pay on fund distributions or the redemption of contract units. The returns for the fund shown also do not reflect the deduction of expenses associated with variable products, such as mortality and expense risk charges, separate account charges, and sales charges imposed by the insurance company separate accounts. Such expenses would reduce the overall returns shown.
Growth of a Hypothetical $10,000 Investment
Total Returns through 12/31/18
Average annual total returns
| | | | | | | | | | | | |
| | | Share Class | | Class Inception Date | | 1-yr | | 5-yr | | 10-yr | | |
| | | Initial Class | | 11/07/94 | | (8.83)% | | 4.15% | | 9.47% | | |
| | | Service Class | | 8/24/01 | | (9.06)% | | 3.89% | | 9.19% | | |
| | | | |
| Comparative benchmark(s) | | | | | | | | |
| | | MSCI All Country World Index (net div) (f) | | (9.42)% | | 4.26% | | 9.46% | | |
| (f) | Source: FactSet Research Systems Inc. |
Benchmark Definition(s)
MSCI All Country World Index (net div) – a market capitalization-weighted index that is designed to measure equity market performance in the global developed and emerging markets.
It is not possible to invest directly in an index.
Notes to Performance Summary
Average annual total return represents the average annual change in value for each share class for the periods presented.
Performance results reflect any applicable expense subsidies and waivers in effect during the periods shown. Without such subsidies and waivers the fund’s performance results would be less favorable. Please see the prospectus and financial statements for complete details. All results are historical and assume the reinvestment of any dividends and capital gains distributions.
Performance results do not include adjustments made for financial reporting purposes in accordance with U.S. generally accepted accounting principles and may differ from amounts reported in the financial highlights.
From time to time the fund may receive proceeds from litigation settlements, without which performance would be lower.
5
MFS Global Research Portfolio
EXPENSE TABLE
Fund Expenses Borne by the Contract Holders during the Period, July 1, 2018 through December 31, 2018
As a contract holder of the fund, you incur ongoing costs, including management fees; distribution and/or service(12b-1) fees; and other fund expenses. This example is intended to help you understand your ongoing costs (in dollars) of investing in the fund and to compare these costs with the ongoing costs of investing in other mutual funds.
The example is based on an investment of $1,000 invested at the beginning of the period and held for the entire period July 1, 2018 through December 31, 2018.
Actual Expenses
The first line for each share class in the following table provides information about actual account values and actual expenses. You may use the information in this line, together with the amount you invested, to estimate the expenses that you paid over the period. Simply divide your account value by $1,000 (for example, an $8,600 account value divided by $1,000 = 8.6), then multiply the result by the number in the first line under the heading entitled “Expenses Paid During Period” to estimate the expenses you paid on your account during this period.
Hypothetical Example for Comparison Purposes
The second line for each share class in the following table provides information about hypothetical account values and hypothetical expenses based on the fund’s actual expense ratio and an assumed rate of return of 5% per year before expenses, which is not the fund’s actual return. The hypothetical account values and expenses may not be used to estimate the actual ending account balance or expenses you paid for the period. You may use this information to compare the ongoing costs of investing in the fund and other funds. To do so, compare this 5% hypothetical example with the 5% hypothetical examples that appear in the shareholder reports of the other funds.
Please note that the expenses shown in the table are meant to highlight the fund’s ongoing costs only and do not take into account the fees and expenses imposed under the variable contracts through which your investment in the fund is made. Therefore, the second line for each share class in the table is useful in comparing ongoing costs associated with an investment in vehicles (such as the fund) which fund benefits under variable annuity and variable life insurance contracts and to qualified pension and retirement plans only, and will not help you determine the relative total costs of investing in the fund through variable annuity and variable life insurance contracts. If the fees and expenses imposed under the variable contracts were included, your costs would have been higher.
| | | | | | | | | | | | | | | | | | |
| Share Class | | | | Annualized
Expense Ratio | | | Beginning
Account Value
7/01/18 | | | Ending
Account Value
12/31/18 | | | Expenses Paid
During Period (p)
7/01/18-12/31/18 | |
| Initial Class | | Actual | | | 0.86% | | | | $1,000.00 | | | | $898.99 | | | | $4.12 | |
| | Hypothetical (h) | | | 0.86% | | | | $1,000.00 | | | | $1,020.87 | | | | $4.38 | |
| Service Class | | Actual | | | 1.11% | | | | $1,000.00 | | | | $897.75 | | | | $5.31 | |
| | Hypothetical (h) | | | 1.11% | | | | $1,000.00 | | | | $1,019.61 | | | | $5.65 | |
| (h) | 5% class return per year before expenses. |
| (p) | “Expenses Paid During Period” are equal to each class’s annualized expense ratio, as shown above, multiplied by the average account value over the period, multiplied by 184/365 (to reflect theone-half year period). |
Notes to Expense Table
Changes to the fund’s fee arrangements occurred during the six month period. Had these fee changes been in effect throughout the entire six month period, the annualized expense ratios, the actual expenses paid during the period, and the hypothetical expenses paid during the period would have been approximately 0.85%, $4.07, and $4.33 for Initial Class and 1.10%, $5.26, and $5.60 for Service Class, respectively. For further information about the fund’s fee arrangements and changes to those fee arrangements, please see Note 3 in the Notes to Financial Statements.
6
MFS Global Research Portfolio
PORTFOLIO OF INVESTMENTS – 12/31/18
The Portfolio of Investments is a complete list of all securities owned by your fund. It is categorized by broad-based asset classes.
| | | | | | | | |
| | |
| Issuer | | Shares/Par | | | Value ($) | |
| COMMON STOCKS – 99.4% | | | | | | | | |
| Aerospace – 3.0% | | | | | |
| Honeywell International, Inc. | | | 8,312 | | | $ | 1,098,182 | |
| Northrop Grumman Corp. | | | 3,089 | | | | 756,496 | |
| United Technologies Corp. | | | 5,588 | | | | 595,010 | |
| | | | | | | | |
| | | | | | $ | 2,449,688 | |
| | | | | | | | |
| Alcoholic Beverages – 1.5% | | | | | |
| AmBev S.A., ADR | | | 72,593 | | | $ | 284,565 | |
| China Resources Beer Holdings Co. Ltd. | | | 116,000 | | | | 405,159 | |
| Constellation Brands, Inc., “A” | | | 2,207 | | | | 354,930 | |
| Thai Beverage PLC | | | 484,400 | | | | 216,797 | |
| | | | | | | | |
| | | | | | $ | 1,261,451 | |
| | | | | | | | |
| Apparel Manufacturers – 1.9% | | | | | |
| LVMH Moet Hennessy Louis Vuitton SE | | | 2,428 | | | $ | 718,281 | |
| NIKE, Inc., “B” | | | 11,920 | | | | 883,749 | |
| | | | | | | | |
| | | | | | $ | 1,602,030 | |
| | | | | | | | |
| Biotechnology – 0.7% | | | | | |
| Biogen, Inc. (a) | | | 1,814 | | | $ | 545,869 | |
| | | | | | | | |
| Brokerage & Asset Managers – 2.6% | | | | | |
| Blackstone Group LP | | | 20,878 | | | $ | 622,373 | |
| NASDAQ, Inc. | | | 5,436 | | | | 443,415 | |
| TD Ameritrade Holding Corp. | | | 12,768 | | | | 625,121 | |
| TMX Group Ltd. | | | 9,578 | | | | 496,229 | |
| | | | | | | | |
| | | | | | $ | 2,187,138 | |
| | | | | | | | |
| Business Services – 5.2% | | | | | |
| Accenture PLC, “A” | | | 4,071 | | | $ | 574,052 | |
| Cognizant Technology Solutions Corp., “A” | | | 9,513 | | | | 603,885 | |
| DXC Technology Co. | | | 12,387 | | | | 658,617 | |
| Fidelity National Information Services, Inc. | | | 9,664 | | | | 991,043 | |
| Fiserv, Inc. (a) | | | 9,290 | | | | 682,722 | |
| Global Payments, Inc. | | | 8,051 | | | | 830,300 | |
| | | | | | | | |
| | | | | | $ | 4,340,619 | |
| | | | | | | | |
| Cable TV – 1.0% | | | | | |
| Comcast Corp., “A” | | | 23,447 | | | $ | 798,370 | |
| | | | | | | | |
| Chemicals – 1.9% | | | | | |
| DowDuPont, Inc. | | | 15,093 | | | $ | 807,174 | |
| PPG Industries, Inc. | | | 7,670 | | | | 784,104 | |
| | | | | | | | |
| | | | | | $ | 1,591,278 | |
| | | | | | | | |
| Computer Software – 5.1% | | | | | |
| Adobe Systems, Inc. (a) | | | 4,498 | | | $ | 1,017,628 | |
| Microsoft Corp. | | | 20,228 | | | | 2,054,558 | |
| Salesforce.com, Inc. (a) | | | 8,633 | | | | 1,182,462 | |
| | | | | | | | |
| | | | | | $ | 4,254,648 | |
| | | | | | | | |
| Computer Software – Systems – 0.6% | | | | | |
| Constellation Software, Inc. | | | 823 | | | $ | 526,800 | |
| | | | | | | | |
| Construction – 2.2% | | | | | |
| Sherwin-Williams Co. | | | 1,930 | | | $ | 759,378 | |
| Techtronic Industries Co. Ltd. | | | 71,500 | | | | 379,848 | |
| | | | | | | | |
| | |
| Issuer | | Shares/Par | | | Value ($) | |
| COMMON STOCKS – continued | | | | | |
| Construction – continued | | | | | |
| Toll Brothers, Inc. | | | 8,027 | | | $ | 264,329 | |
| Vulcan Materials Co. | | | 4,466 | | | | 441,241 | |
| | | | | | | | |
| | | | | | $ | 1,844,796 | |
| | | | | | | | |
| Consumer Products – 1.2% | | | | | |
| Kao Corp. | | | 4,800 | | | $ | 353,884 | |
| L’Oréal | | | 1,144 | | | | 263,721 | |
| Reckitt Benckiser Group PLC | | | 5,355 | | | | 410,416 | |
| | | | | | | | |
| | | | | | $ | 1,028,021 | |
| | | | | | | | |
| Consumer Services – 0.9% | | | | | |
| Bookings Holdings, Inc. (a) | | | 407 | | | $ | 701,025 | |
| | | | | | | | |
| Containers – 0.6% | | | | | |
| Berry Global Group, Inc. (a) | | | 10,276 | | | $ | 488,418 | |
| | | | | | | | |
| Electrical Equipment – 2.0% | | | | | |
| HD Supply Holdings, Inc. (a) | | | 11,744 | | | $ | 440,635 | |
| Resideo Technologies, Inc. (a) | | | 1,385 | | | | 28,462 | |
| Schneider Electric S.A. | | | 11,578 | | | | 792,215 | |
| TE Connectivity Ltd. | | | 5,595 | | | | 423,150 | |
| | | | | | | | |
| | | | | | $ | 1,684,462 | |
| | | | | | | | |
| Electronics – 2.7% | | | | | |
| Analog Devices, Inc. | | | 8,519 | | | $ | 731,186 | |
| NVIDIA Corp. | | | 2,655 | | | | 354,442 | |
| Taiwan Semiconductor Manufacturing Co. Ltd. | | | 121,000 | | | | 887,709 | |
| Taiwan Semiconductor Manufacturing Co. Ltd., ADR | | | 7,634 | | | | 281,771 | |
| | | | | | | | |
| | | | | | $ | 2,255,108 | |
| | | | | | | | |
| Energy – Independent – 2.0% | | | | | |
| EOG Resources, Inc. | | | 8,499 | | | $ | 741,198 | |
| Marathon Petroleum Corp. | | | 7,903 | | | | 466,356 | |
| Oil Search Ltd. | | | 93,048 | | | | 469,254 | |
| | | | | | | | |
| | | | | | $ | 1,676,808 | |
| | | | | | | | |
| Energy – Integrated – 1.9% | | | | | |
| BP PLC | | | 138,148 | | | $ | 873,286 | |
| Suncor Energy, Inc. | | | 25,220 | | | | 704,394 | |
| | | | | | | | |
| | | | | | $ | 1,577,680 | |
| | | | | | | | |
| Food & Beverages – 3.1% | | | | | |
| Danone S.A. | | | 5,977 | | | $ | 421,230 | |
| Mondelez International, Inc. | | | 14,341 | | | | 574,070 | |
| Nestle S.A. | | | 10,598 | | | | 861,626 | |
| PepsiCo, Inc. | | | 6,265 | | | | 692,157 | |
| | | | | | | | |
| | | | | | $ | 2,549,083 | |
| | | | | | | | |
| Food & Drug Stores – 1.0% | | | | | |
| Sundrug Co. Ltd. | | | 15,900 | | | $ | 472,954 | |
| Tesco PLC | | | 148,958 | | | | 360,927 | |
| | | | | | | | |
| | | | | | $ | 833,881 | |
| | | | | | | | |
7
MFS Global Research Portfolio
Portfolio of Investments – continued
| | | | | | | | |
| Issuer | | Shares/Par | | | Value ($) | |
| COMMON STOCKS – continued | | | | | |
| Gaming & Lodging – 0.8% | | | | | |
| Hilton Worldwide Holdings, Inc. | | | 4,843 | | | $ | 347,727 | |
| Paddy Power Betfair PLC | | | 3,790 | | | | 309,167 | |
| | | | | | | | |
| | | | | | $ | 656,894 | |
| | | | | | | | |
| Health Maintenance Organizations – 0.6% | | | | | |
| Cigna Corp. | | | 2,446 | | | $ | 464,544 | |
| | | | | | | | |
| Insurance – 3.6% | | | | | |
| AIA Group Ltd. | | | 141,000 | | | $ | 1,170,424 | |
| Aon PLC | | | 7,223 | | | | 1,049,935 | |
| Chubb Ltd. | | | 5,788 | | | | 747,694 | |
| | | | | | | | |
| | | | | | $ | 2,968,053 | |
| | | | | | | | |
| Internet – 4.5% | | | | | |
| Alphabet, Inc., “A” (a)(s) | | | 1,536 | | | $ | 1,605,059 | |
| Alphabet, Inc., “C” (a) | | | 211 | | | | 218,514 | |
| Baidu, Inc., ADR (a) | | | 2,084 | | | | 330,522 | |
| Facebook, Inc., “A” (a)(s) | | | 8,882 | | | | 1,164,341 | |
| LogMeIn, Inc. | | | 5,407 | | | | 441,049 | |
| | | | | | | | |
| | | | | | $ | 3,759,485 | |
| | | | | | | | |
| Leisure & Toys – 0.7% | | | | | |
| Electronic Arts, Inc. (a) | | | 7,206 | | | $ | 568,625 | |
| | | | | | | | |
| Machinery & Tools – 2.8% | | | | | |
| Flowserve Corp. | | | 9,989 | | | $ | 379,782 | |
| GEA Group AG | | | 12,889 | | | | 332,270 | |
| Kubota Corp. | | | 31,700 | | | | 446,362 | |
| Roper Technologies, Inc. | | | 2,742 | | | | 730,798 | |
| Schindler Holding AG | | | 1,943 | | | | 386,020 | |
| | | | | | | | |
| | | | | | $ | 2,275,232 | |
| | | | | | | | |
| Major Banks – 2.8% | | | | | |
| Barclays PLC | | | 234,091 | | | $ | 449,110 | |
| BNP Paribas | | | 17,998 | | | | 814,022 | |
| Mitsubishi UFJ Financial Group, Inc. | | | 80,800 | | | | 398,436 | |
| UBS AG | | | 55,540 | | | | 693,304 | |
| | | | | | | | |
| | | | | | $ | 2,354,872 | |
| | | | | | | | |
| Medical & Health Technology & Services – 0.9% | | | | | |
| ICON PLC (a) | | | 5,434 | | | $ | 702,127 | |
| | | | | | | | |
| Medical Equipment – 4.6% | | | | | |
| Boston Scientific Corp. (a) | | | 14,074 | | | $ | 497,375 | |
| Danaher Corp. | | | 8,072 | | | | 832,385 | |
| EssilorLuxottica | | | 5,321 | | | | 673,362 | |
| Medtronic PLC | | | 12,141 | | | | 1,104,345 | |
| PerkinElmer, Inc. | | | 8,710 | | | | 684,171 | |
| | | | | | | | |
| | | | | | $ | 3,791,638 | |
| | | | | | | | |
| Metals & Mining – 0.8% | | | | | |
| Rio Tinto Ltd. | | | 13,572 | | | $ | 645,248 | |
| | | | | | | | |
| Natural Gas – Distribution – 0.5% | | | | | |
| China Resources Gas Group Ltd. | | | 112,000 | | | $ | 443,394 | |
| | | | | | | | |
| Natural Gas – Pipeline – 1.0% | | | | | |
| Enbridge, Inc. | | | 13,087 | | | $ | 406,548 | |
| Enterprise Products Partners LP | | | 18,133 | | | | 445,891 | |
| | | | | | | | |
| | | | | | $ | 852,439 | |
| | | | | | | | |
| | | | | | | | |
| Issuer | | Shares/Par | | | Value ($) | |
| COMMON STOCKS – continued | | | | | |
| Network & Telecom – 1.3% | | | | | |
| Cisco Systems, Inc. | | | 23,956 | | | $ | 1,038,014 | |
| | | | | | | | |
| Oil Services – 0.4% | | | | | |
| Schlumberger Ltd. | | | 9,066 | | | $ | 327,101 | |
| | | | | | | | |
| Other Banks & Diversified Financials – 9.3% | | | | | |
| Aeon Credit Service Co. Ltd. | | | 31,100 | | | $ | 558,673 | |
| Citigroup, Inc. (s) | | | 20,056 | | | | 1,044,115 | |
| Credicorp Ltd. | | | 4,246 | | | | 941,211 | |
| HDFC Bank Ltd. | | | 37,470 | | | | 1,138,725 | |
| Intesa Sanpaolo S.p.A. | | | 340,803 | | | | 755,313 | |
| Julius Baer Group Ltd. | | | 12,600 | | | | 450,246 | |
| KBC Groep N.V. | | | 12,149 | | | | 788,969 | |
| Mastercard, Inc., “A” | | | 5,420 | | | | 1,022,483 | |
| U.S. Bancorp | | | 22,158 | | | | 1,012,621 | |
| | | | | | | | |
| | | | | | $ | 7,712,356 | |
| | | | | | | | |
| Pharmaceuticals – 5.2% | | | | | |
| Bayer AG | | | 10,254 | | | $ | 711,490 | |
| Elanco Animal Health, Inc. (a) | | | 10,079 | | | | 317,791 | |
| Johnson & Johnson | | | 7,414 | | | | 956,777 | |
| Roche Holding AG | | | 3,933 | | | | 972,529 | |
| Santen Pharmaceutical Co. Ltd. | | | 49,500 | | | | 708,393 | |
| Zoetis, Inc. | | | 7,716 | | | | 660,027 | |
| | | | | | | | |
| | | | | | $ | 4,327,007 | |
| | | | | | | | |
| Printing & Publishing – 0.6% | | | | | |
| RELX Group PLC | | | 24,337 | | | $ | 501,077 | |
| | | | | | | | |
| Railroad & Shipping – 1.0% | | | | | |
| Canadian Pacific Railway Ltd. | | | 2,556 | | | $ | 453,997 | |
| DP World Ltd. | | | 22,956 | | | | 392,547 | |
| | | | | | | | |
| | | | | | $ | 846,544 | |
| | | | | | | | |
| Real Estate – 1.9% | | | | | |
| LEG Immobilien AG | | | 8,102 | | | $ | 845,855 | |
| Store Capital Corp., REIT | | | 26,301 | | | | 744,581 | |
| | | | | | | | |
| | | | | | $ | 1,590,436 | |
| | | | | | | | |
| Restaurants – 1.5% | | | | | |
| Starbucks Corp. | | | 10,974 | | | $ | 706,726 | |
| Yum China Holdings, Inc. | | | 14,770 | | | | 495,238 | |
| | | | | | | | |
| | | | | | $ | 1,201,964 | |
| | | | | | | | |
| Specialty Chemicals – 2.6% | | | | | |
| Akzo Nobel N.V. | | | 6,121 | | | $ | 493,725 | |
| Croda International PLC | | | 7,633 | | | | 455,804 | |
| Linde PLC | | | 4,745 | | | | 753,238 | |
| Sika AG | | | 3,424 | | | | 435,168 | |
| | | | | | | | |
| | | | | | $ | 2,137,935 | |
| | | | | | | | |
| Specialty Stores – 3.5% | | | | | |
| Amazon.com, Inc. (a) | | | 1,180 | | | $ | 1,772,325 | |
| Costco Wholesale Corp. | | | 2,838 | | | | 578,129 | |
| Dufry AG | | | 2,618 | | | | 248,641 | |
| Just Eat PLC (a) | | | 39,624 | | | | 296,362 | |
| | | | | | | | |
| | | | | | $ | 2,895,457 | |
| | | | | | | | |
8
MFS Global Research Portfolio
Portfolio of Investments – continued
| | | | | | | | |
| | |
| Issuer | | Shares/Par | | | Value ($) | |
| COMMON STOCKS – continued | | | | | |
| Telecommunications – Wireless – 2.8% | | | | | |
| Advanced Info Service PLC | | | 116,500 | | | $ | 617,207 | |
| American Tower Corp., REIT | | | 3,922 | | | | 620,421 | |
| KDDI Corp. | | | 34,200 | | | | 814,989 | |
| Tele2 AB, “B” | | | 22,557 | | | | 288,230 | |
| | | | | | | | |
| | | | | | $ | 2,340,847 | |
| | | | | | | | |
| Telephone Services – 0.5% | | | | | |
| Hellenic Telecommunications Organization S.A. | | | 36,967 | | | $ | 403,219 | |
| | | | | | | | |
| Tobacco – 0.8% | | | | | |
| British American Tobacco PLC | | | 6,137 | | | $ | 195,555 | |
| Philip Morris International, Inc. | | | 6,451 | | | | 430,669 | |
| | | | | | | | |
| | | | | | $ | 626,224 | |
| | | | | | | | |
| Utilities – Electric Power – 3.3% | | | | | |
| CLP Holdings Ltd. | | | 56,000 | | | $ | 632,910 | |
| CMS Energy Corp. | | | 18,399 | | | | 913,510 | |
| Iberdrola S.A. | | | 63,782 | | | | 512,863 | |
| NextEra Energy, Inc. | | | 3,689 | | | | 641,222 | |
| | | | | | | | |
| | | | | | $ | 2,700,505 | |
| | | | | | | | |
Total Common Stocks
(Identified Cost, $76,229,035) | | | | | | $ | 82,328,410 | |
| | | | | | | | |
| |
| INVESTMENT COMPANIES (h) – 0.6% | | | | | |
| Money Market Funds – 0.6% | | | | | |
| MFS Institutional Money Market Portfolio, 2.4% (v) (Identified Cost, $503,435) | | | 503,451 | | | $ | 503,401 | |
| | | | | | | | |
OTHER ASSETS, LESS
LIABILITIES – 0.0% | | | | | | | 32,353 | |
| | | | | | | | |
| NET ASSETS – 100.0% | | | | | | $ | 82,864,164 | |
| | | | | | | | |
| (a) | | Non-income producing security. |
| (h) | | An affiliated issuer, which may be considered one in which the fund owns 5% or more of the outstanding voting securities, or a company which is under common control. At period end, the aggregate values of the fund’s investments in affiliated issuers and in unaffiliated issuers were $503,401 and $82,328,410, respectively. |
| (s) | | Security or a portion of the security was pledged to cover collateral requirements for certain derivative transactions. |
| (v) | | Affiliated issuer that is available only to investment companies managed by MFS. The rate quoted for the MFS Institutional Money Market Portfolio is the annualizedseven-day yield of the fund at period end. |
The following abbreviations are used in this report and are defined:
| ADR | | American Depositary Receipt |
| PLC | | Public Limited Company |
| REIT | | Real Estate Investment Trust |
At December 31, 2018, the fund had cash collateral of $2,538 and other liquid securities with an aggregate value of $569,848 to cover any collateral or margin obligations for certain derivative contracts. Restricted cash and deposits with brokers in the Statement of Assets and Liabilities are comprised of cash collateral.
See Notes to Financial Statements
9
MFS Global Research Portfolio
FINANCIAL STATEMENTS | STATEMENT OF ASSETS AND LIABILITIES
This statement represents your fund’s balance sheet, which details the assets and liabilities comprising the total value of the fund.
| | | | |
At 12/31/18 | | | | |
| |
Assets | | | | |
Investments in unaffiliated issuers, at value (identified cost, $76,229,035) | | | $82,328,410 | |
Investments in affiliated issuers, at value (identified cost, $503,435) | | | 503,401 | |
Deposits with brokers | | | 2,538 | |
Receivables for | | | | |
Fund shares sold | | | 11,967 | |
Interest and dividends | | | 148,389 | |
Receivable from investment adviser | | | 2,296 | |
Other assets | | | 901 | |
Total assets | | | $82,997,902 | |
| |
Liabilities | | | | |
Payables for | | | | |
Investments purchased | | | $12,426 | |
Fund shares reacquired | | | 53,912 | |
Payable to affiliates | | | | |
Shareholder servicing costs | | | 18 | |
Distribution and/or service fees | | | 150 | |
Payable for independent Trustees’ compensation | | | 5 | |
Deferred country tax expense payable | | | 3,573 | |
Accrued expenses and other liabilities | | | 63,654 | |
Total liabilities | | | $133,738 | |
Net assets | | | $82,864,164 | |
| |
Net assets consist of | | | | |
Paid-in capital | | | $68,169,587 | |
Total distributable earnings (loss) | | | 14,694,577 | |
Net assets | | | $82,864,164 | |
Shares of beneficial interest outstanding | | | 3,070,144 | |
| | | | | | | | | | | | |
| | | |
| | | Net assets | | | Shares
outstanding | | | Net asset value
per share | |
Initial Class | | | $77,345,093 | | | | 2,864,908 | | | | $27.00 | |
Service Class | | | 5,519,071 | | | | 205,236 | | | | 26.89 | |
See Notes to Financial Statements
10
MFS Global Research Portfolio
FINANCIAL STATEMENTS | STATEMENT OF OPERATIONS
This statement describes how much your fund earned in investment income and accrued in expenses. It also describes any gains and/or losses generated by fund operations.
| | | | |
Year ended 12/31/18 | | | | |
| |
Net investment income (loss) | | | | |
Income | | | | |
Dividends | | | $1,954,542 | |
Dividends from affiliated issuers | | | 10,426 | |
Income on securities loaned | | | 4,170 | |
Other | | | 387 | |
Interest | | | 74 | |
Foreign taxes withheld | | | (104,414 | ) |
Total investment income | | | $1,865,185 | |
Expenses | | | | |
Management fee | | | $740,138 | |
Distribution and/or service fees | | | 16,748 | |
Shareholder servicing costs | | | 2,362 | |
Administrative services fee | | | 24,415 | |
Independent Trustees’ compensation | | | 3,532 | |
Custodian fee | | | 40,041 | |
Shareholder communications | | | 15,185 | |
Audit and tax fees | | | 62,781 | |
Legal fees | | | 900 | |
Miscellaneous | | | 25,003 | |
Total expenses | | | $931,105 | |
Reduction of expenses by investment adviser | | | (44,548 | ) |
Net expenses | | | $886,557 | |
Net investment income (loss) | | | $978,628 | |
| |
Realized and unrealized gain (loss) | | | | |
Realized gain (loss) (identified cost basis) | | | | |
Unaffiliated issuers (net of $1,690 country tax) | | | $7,597,818 | |
Affiliated issuers | | | (74 | ) |
Foreign currency | | | (6,462 | ) |
Net realized gain (loss) | | | $7,591,282 | |
Change in unrealized appreciation or depreciation | | | | |
Unaffiliated issuers (net of $6,534 decrease in deferred country tax) | | | $(16,335,567 | ) |
Affiliated issuers | | | (1 | ) |
Translation of assets and liabilities in foreign currencies | | | (1,354 | ) |
Net unrealized gain (loss) | | | $(16,336,922 | ) |
Net realized and unrealized gain (loss) | | | $(8,745,640 | ) |
Change in net assets from operations | | | $(7,767,012 | ) |
See Notes to Financial Statements
11
MFS Global Research Portfolio
FINANCIAL STATEMENTS | STATEMENTS OF CHANGES IN NET ASSETS
These statements describe the increases and/or decreases in net assets resulting from operations, any distributions, and any shareholder transactions.
| | | | | | | | |
| | | Year ended | |
| | | 12/31/18 | | | 12/31/17 | |
Change in net assets | | | | | | | | |
| | |
From operations | | | | | | | | |
Net investment income (loss) | | | $978,628 | | | | $993,059 | |
Net realized gain (loss) | | | 7,591,282 | | | | 8,681,235 | |
Net unrealized gain (loss) | | | (16,336,922 | ) | | | 13,816,166 | |
Change in net assets from operations | | | $(7,767,012 | ) | | | $23,490,460 | |
Total distributions to shareholders (a) | | | $(6,655,034 | ) | | | $(1,601,030 | ) |
Change in net assets from fund share transactions | | | $(8,459,434 | ) | | | $(14,840,181 | ) |
Total change in net assets | | | $(22,881,480 | ) | | | $7,049,249 | |
| | |
Net assets | | | | | | | | |
At beginning of period | | | 105,745,644 | | | | 98,696,395 | |
At end of period (b) | | | $82,864,164 | | | | $105,745,644 | |
| (a) | Distributions from net investment income and from net realized gain are no longer required to be separately disclosed. See Note 2. For the year ended December 31, 2017, distributions from net investment income were $1,601,030. |
| (b) | Parenthetical disclosure of undistributed net investment income is no longer required. See Note 2. For the year ended December 31, 2017, end of period net assets included undistributed net investment income of $995,382. |
See Notes to Financial Statements
12
MFS Global Research Portfolio
FINANCIAL STATEMENTS | FINANCIAL HIGHLIGHTS
The financial highlights table is intended to help you understand the fund’s financial performance for the past 5 years. Certain information reflects financial results for a single fund share. The total returns in the table represent the rate that an investor would have earned (or lost) on an investment in the fund share class (assuming reinvestment of all distributions) held for the entire period.
| | | | | | | | | | | | | | | | | | | | |
| Initial Class | | Year ended | |
| | | | | |
| | | 12/31/18 | | | 12/31/17 | | | 12/31/16 | | | 12/31/15 | | | 12/31/14 | |
| | | | | |
Net asset value, beginning of period | | | $31.74 | | | | $25.69 | | | | $24.63 | | | | $25.18 | | | | $24.85 | |
| | | | | |
| Income (loss) from investment operations | | | | | | | | | | | | | | | | | | | | |
Net investment income (loss) (d) | | | $0.32 | | | | $0.28 | | | | $0.41 | (c) | | | $0.25 | | | | $0.29 | |
Net realized and unrealized gain (loss) | | | (2.82 | ) | | | 6.24 | | | | 0.93 | | | | (0.47 | ) | | | 0.31 | |
Total from investment operations | | | $(2.50 | ) | | | $6.52 | | | | $1.34 | | | | $(0.22 | ) | | | $0.60 | |
| | | | | |
| Less distributions declared to shareholders | | | | | | | | | | | | | | | | | | | | |
From net investment income | | | $(0.33 | ) | | | $(0.47 | ) | | | $(0.28 | ) | | | $(0.33 | ) | | | $(0.27 | ) |
From net realized gain | | | (1.91 | ) | | | — | | | | — | | | | — | | | | — | |
Total distributions declared to shareholders | | | $(2.24 | ) | | | $(0.47 | ) | | | $(0.28 | ) | | | $(0.33 | ) | | | $(0.27 | ) |
Net asset value, end of period (x) | | | $27.00 | | | | $31.74 | | | | $25.69 | | | | $24.63 | | | | $25.18 | |
Total return (%) (k)(r)(s)(x) | | | (8.83 | ) | | | 25.51 | | | | 5.44 | (c) | | | (0.81 | ) | | | 2.40 | |
| | | | | |
Ratios (%) (to average net assets)
and Supplemental data: | | | | | | | | | | | | | | | | | | | | |
Expenses before expense reductions (f) | | | 0.93 | | | | 0.92 | | | | 0.78 | (c) | | | 0.92 | | | | 0.92 | |
Expenses after expense reductions (f) | | | 0.88 | | | | 0.92 | | | | 0.77 | (c) | | | 0.91 | | | | 0.91 | |
Net investment income (loss) | | | 1.01 | | | | 0.97 | | | | 1.64 | (c) | | | 0.98 | | | | 1.15 | |
Portfolio turnover | | | 22 | | | | 33 | | | | 40 | | | | 40 | | | | 37 | |
Net assets at end of period (000 omitted) | | | $77,345 | | | | $98,434 | | | | $91,281 | | | | $98,321 | | | | $113,018 | |
Ratio of expenses to average net assets after expense reductions excluding short sale expenses (f) | | | N/A | | | | N/A | | | | N/A | | | | N/A | | | | 0.91 | |
| |
| Service Class | | Year ended | |
| | | | | |
| | | 12/31/18 | | | 12/31/17 | | | 12/31/16 | | | 12/31/15 | | | 12/31/14 | |
| | | | | |
Net asset value, beginning of period | | | $31.61 | | | | $25.59 | | | | $24.52 | | | | $25.06 | | | | $24.72 | |
| | | | | |
| Income (loss) from investment operations | | | | | | | | | | | | | | | | | | | | |
Net investment income (loss) (d) | | | $0.24 | | | | $0.21 | | | | $0.34 | (c) | | | $0.19 | | | | $0.23 | |
Net realized and unrealized gain (loss) | | | (2.82 | ) | | | 6.20 | | | | 0.94 | | | | (0.47 | ) | | | 0.31 | |
Total from investment operations | | | $(2.58 | ) | | | $6.41 | | | | $1.28 | | | | $(0.28 | ) | | | $0.54 | |
| | | | | |
| Less distributions declared to shareholders | | | | | | | | | | | | | | | | | | | | |
From net investment income | | | $(0.23 | ) | | | $(0.39 | ) | | | $(0.21 | ) | | | $(0.26 | ) | | | $(0.20 | ) |
From net realized gain | | | (1.91 | ) | | | — | | | | — | | | | — | | | | — | |
Total distributions declared to shareholders | | | $(2.14 | ) | | | $(0.39 | ) | | | $(0.21 | ) | | | $(0.26 | ) | | | $(0.20 | ) |
Net asset value, end of period (x) | | | $26.89 | | | | $31.61 | | | | $25.59 | | | | $24.52 | | | | $25.06 | |
Total return (%) (k)(r)(s)(x) | | | (9.06 | ) | | | 25.17 | | | | 5.21 | (c) | | | (1.09 | ) | | | 2.15 | |
| | | | | |
Ratios (%) (to average net assets)
and Supplemental data: | | | | | | | | | | | | | | | | | | | | |
Expenses before expense reductions (f) | | | 1.18 | | | | 1.17 | | | | 1.03 | (c) | | | 1.17 | | | | 1.17 | |
Expenses after expense reductions (f) | | | 1.13 | | | | 1.17 | | | | 1.02 | (c) | | | 1.16 | | | | 1.16 | |
Net investment income (loss) | | | 0.76 | | | | 0.73 | | | | 1.39 | (c) | | | 0.74 | | | | 0.90 | |
Portfolio turnover | | | 22 | | | | 33 | | | | 40 | | | | 40 | | | | 37 | |
Net assets at end of period (000 omitted) | | | $5,519 | | | | $7,312 | | | | $7,415 | | | | $8,151 | | | | $9,551 | |
Ratio of expenses to average net assets after expense reductions excluding short sale expenses (f) | | | N/A | | | | N/A | | | | N/A | | | | N/A | | | | 1.16 | |
See Notes to Financial Statements
13
MFS Global Research Portfolio
Financial Highlights – continued
| (c) | Amount reflects aone-time reimbursement of expenses by the custodian (or former custodian) without which net investment income and performance would be lower and expenses would be higher. |
| (d) | Per share data is based on average shares outstanding. |
| (f) | Ratios do not reflect reductions from fees paid indirectly, if applicable. |
| (k) | The total return does not reflect expenses that apply to separate accounts. Inclusion of these charges would reduce the total return figures for all periods shown. |
| (r) | Certain expenses have been reduced without which performance would have been lower. |
| (s) | From time to time the fund may receive proceeds from litigation settlements, without which performance would be lower. |
| (x) | The net asset values and total returns have been calculated on net assets which include adjustments made in accordance with U.S. generally accepted accounting principles required at period end for financial reporting purposes. |
See Notes to Financial Statements
14
MFS Global Research Portfolio
NOTES TO FINANCIAL STATEMENTS
| (1) | | Business and Organization |
MFS Global Research Portfolio (the fund) is a diversified series of MFS Variable Insurance Trust II (the trust). The trust is organized as a Massachusetts business trust and is registered under the Investment Company Act of 1940, as amended, as anopen-end management investment company. The shareholders of each series of the trust are separate accounts of insurance companies, which offer variable annuity and/or life insurance products, and qualified retirement and pension plans.
The fund is an investment company and accordingly follows the investment company accounting and reporting guidance of the Financial Accounting Standards Board (FASB) Accounting Standards Codification Topic 946 Financial Services – Investment Companies.
| (2) | | Significant Accounting Policies |
General– The preparation of financial statements in conformity with U.S. generally accepted accounting principles requires management to make estimates and assumptions that affect the reported amounts of assets and liabilities, and disclosure of contingent assets and liabilities at the date of the financial statements and the reported amounts of increases and decreases in net assets from operations during the reporting period. Actual results could differ from those estimates. In the preparation of these financial statements, management has evaluated subsequent events occurring after the date of the fund’s Statement of Assets and Liabilities through the date that the financial statements were issued. The fund invests in foreign securities. Investments in foreign securities are vulnerable to the effects of changes in the relative values of the local currency and the U.S. dollar and to the effects of changes in each country’s market, economic, industrial, political, regulatory, geopolitical, and other conditions.
In August 2018, the FASB issued Accounting Standards Update2018-13, Fair Value Measurement (Topic 820) – Disclosure Framework – Changes to the Disclosure Requirements for Fair Value Measurement (“ASU2018-13”) which introduces new fair value disclosure requirements as well as eliminates and modifies certain existing fair value disclosure requirements.ASU 2018-13 would be effective for fiscal years beginning after December 15, 2019, and interim periods within those fiscal years; however, management has elected to early adopt ASU2018-13 effective with the current reporting period. The impact of the fund’s adoption was limited to changes in the fund’s financial statement disclosures regarding fair value, primarily those disclosures related to transfers between levels of the fair value hierarchy.
In August 2018, the Securities and Exchange Commission (SEC) released its Final Rule on Disclosure Update and Simplification (the “Final Rule”) which is intended to simplify an issuer’s disclosure compliance efforts by removing redundant or outdated disclosure requirements without significantly altering the mix of information provided to investors. Effective with the current reporting period, the fund adopted the Final Rule with the impacts being that the fund is no longer required to present the components of distributable earnings on the Statement of Assets and Liabilities or the sources of distributions to shareholders and the amount of undistributed net investment income on the Statements of Changes in Net Assets.
Balance Sheet Offsetting– The fund’s accounting policy with respect to balance sheet offsetting is that, absent an event of default by the counterparty or a termination of the agreement, the International Swaps and Derivatives Association (ISDA) Master Agreement, or similar agreement, does not result in an offset of reported amounts of financial assets and financial liabilities in the Statement of Assets and Liabilities across transactions between the fund and the applicable counterparty. The fund’s right to setoff may be restricted or prohibited by the bankruptcy or insolvency laws of the particular jurisdiction to which a specific master netting agreement counterparty is subject. Balance sheet offsetting disclosures, to the extent applicable to the fund, have been included in the fund’s Significant Accounting Policies note under the captions for each of the fund’sin-scope financial instruments and transactions.
Investment Valuations– Equity securities, including restricted equity securities, are generally valued at the last sale or official closing price on their primary market or exchange as provided by a third-party pricing service. Equity securities, for which there were no sales reported that day, are generally valued at the last quoted daily bid quotation on their primary market or exchange as provided by a third-party pricing service. Short-term instruments with a maturity at issuance of 60 days or less may be valued at amortized cost, which approximates market value.Open-end investment companies are generally valued at net asset value per share. Securities and other assets generally valued on the basis of information from a third-party pricing service may also be valued at a broker/dealer bid quotation. In determining values, third-party pricing services can utilize both transaction data and market information such as yield, quality, coupon rate, maturity, type of issue, trading characteristics, and other market data. The values of foreign securities and other assets and liabilities expressed in foreign currencies are converted to U.S. dollars using the mean of bid and asked prices for rates provided by a third-party pricing service.
The Board of Trustees has delegated primary responsibility for determining or causing to be determined the value of the fund’s investments (including any fair valuation) to the adviser pursuant to valuation policies and procedures approved by the Board. If the adviser determines that reliable market quotations are not readily available, investments are valued at fair value as determined in good faith by the adviser in accordance with such procedures under the oversight of the Board of Trustees. Under the fund’s valuation policies and procedures, market quotations are not considered to be readily available for most types of debt instruments
15
MFS Global Research Portfolio
Notes to Financial Statements – continued
and floating rate loans and many types of derivatives. These investments are generally valued at fair value based on information from third-party pricing services. In addition, investments may be valued at fair value if the adviser determines that an investment’s value has been materially affected by events occurring after the close of the exchange or market on which the investment is principally traded (such as foreign exchange or market) and prior to the determination of the fund’s net asset value, or after the halting of trading of a specific security where trading does not resume prior to the close of the exchange or market on which the security is principally traded. Events that occur on a frequent basis after foreign markets close (such as developments in foreign markets and significant movements in the U.S. markets) and prior to the determination of the fund’s net asset value may be deemed to have a material effect on the value of securities traded in foreign markets. Accordingly, the fund’s foreign equity securities may often be valued at fair value. The adviser generally relies on third-party pricing services or other information (such as the correlation with price movements of similar securities in the same or other markets; the type, cost and investment characteristics of the security; the business and financial condition of the issuer; and trading and other market data) to assist in determining whether to fair value and at what value to fair value an investment. The value of an investment for purposes of calculating the fund’s net asset value can differ depending on the source and method used to determine value. When fair valuation is used, the value of an investment used to determine the fund’s net asset value may differ from quoted or published prices for the same investment. There can be no assurance that the fund could obtain the fair value assigned to an investment if it were to sell the investment at the same time at which the fund determines its net asset value per share.
Various inputs are used in determining the value of the fund’s assets or liabilities. These inputs are categorized into three broad levels. In certain cases, the inputs used to measure fair value may fall into different levels of the fair value hierarchy. In such cases, an investment’s level within the fair value hierarchy is based on the lowest level of input that is significant to the fair value measurement. The fund’s assessment of the significance of a particular input to the fair value measurement in its entirety requires judgment, and considers factors specific to the investment. Level 1 includes unadjusted quoted prices in active markets for identical assets or liabilities. Level 2 includes other significant observable market-based inputs (including quoted prices for similar securities, interest rates, prepayment speed, and credit risk). Level 3 includes unobservable inputs, which may include the adviser’s own assumptions in determining the fair value of investments. The following is a summary of the levels used as of December 31, 2018 in valuing the fund’s assets or liabilities:
| | | | | | | | | | | | | | | | |
| Financial Instruments | | Level 1 | | | Level 2 | | | Level 3 | | | Total | |
| Equity Securities: | | | | | | | | | | | | | | | | |
United States | | | $49,540,217 | | | | $— | | | | $— | | | | $49,540,217 | |
United Kingdom | | | 4,187,786 | | | | — | | | | — | | | | 4,187,786 | |
Switzerland | | | — | | | | 4,047,534 | | | | — | | | | 4,047,534 | |
Japan | | | — | | | | 3,753,691 | | | | — | | | | 3,753,691 | |
France | | | 3,682,831 | | | | — | | | | — | | | | 3,682,831 | |
Canada | | | 2,587,968 | | | | — | | | | — | | | | 2,587,968 | |
Hong Kong | | | 2,183,181 | | | | — | | | | — | | | | 2,183,181 | |
Germany | | | 1,889,615 | | | | — | | | | — | | | | 1,889,615 | |
China | | | 1,674,314 | | | | — | | | | — | | | | 1,674,314 | |
Other Countries | | | 7,120,522 | | | | 1,660,751 | | | | — | | | | 8,781,273 | |
| Mutual Funds | | | 503,401 | | | | — | | | | — | | | | 503,401 | |
| Total | | | $73,369,835 | | | | $9,461,976 | | | | $— | | | | $82,831,811 | |
For further information regarding security characteristics, see the Portfolio of Investments.
Foreign Currency Translation– Purchases and sales of foreign investments, income, and expenses are converted into U.S. dollars based upon currency exchange rates prevailing on the respective dates of such transactions or on the reporting date for foreign denominated receivables and payables. Gains and losses attributable to foreign currency exchange rates on sales of securities are recorded for financial statement purposes as net realized gains and losses on investments. Gains and losses attributable to foreign exchange rate movements on receivables, payables, income and expenses are recorded for financial statement purposes as foreign currency transaction gains and losses. That portion of both realized and unrealized gains and losses on investments that results from fluctuations in foreign currency exchange rates is not separately disclosed.
Security Loans– Under its Securities Lending Agency Agreement with the fund, State Street Bank and Trust Company, as lending agent, loans the securities of the fund to certain qualified institutions (the “Borrowers”) approved by the fund. Security loans can be terminated at the discretion of either the lending agent or the fund and the related securities must be returned within the earlier of the standard trade settlement period for such securities or within three business days. The loans are collateralized by cash and/or U.S. Treasury and federal agency obligations in an amount typically at least equal to the market value of the securities loaned. On loans collateralized by cash, the cash collateral is invested in a money market fund. The market value of the loaned securities is determined at the close of business of the fund and any additional required collateral is delivered to the fund on the next business day. The lending agent provides the fund with indemnification against Borrower default. In the event of Borrower default, the
16
MFS Global Research Portfolio
Notes to Financial Statements – continued
lending agent will, for the benefit of the fund, either purchase securities identical to those loaned or, when such purchase is commercially impracticable, pay the fund the market value of the loaned securities. In return, the lending agent assumes the fund’s rights to the related collateral. If the collateral value is less than the cost to purchase identical securities, the lending agent is responsible for the shortfall, but only to the extent that such shortfall is not due to a decline in collateral value resulting from collateral reinvestment for which the fund bears the risk of loss. A portion of the income generated upon investment of the collateral is remitted to the Borrowers, and the remainder is allocated between the fund and the lending agent. On loans collateralized by U.S. Treasury and/or federal agency obligations, a fee is received from the Borrower, and is allocated between the fund and the lending agent. Income from securities lending is separately reported in the Statement of Operations. The dividend and interest income earned on the securities loaned is accounted for in the same manner as other dividend and interest income. At December 31, 2018, there were no securities on loan or collateral outstanding.
Indemnifications– Under the fund’s organizational documents, its officers and Trustees may be indemnified against certain liabilities and expenses arising out of the performance of their duties to the fund. Additionally, in the normal course of business, the fund enters into agreements with service providers that may contain indemnification clauses. The fund’s maximum exposure under these agreements is unknown as this would involve future claims that may be made against the fund that have not yet occurred.
Investment Transactions and Income– Investment transactions are recorded on the trade date. Interest income is recorded on the accrual basis. Dividends received in cash are recorded on theex-dividend date. Certain dividends from foreign securities will be recorded when the fund is informed of the dividend if such information is obtained subsequent to theex-dividend date. Dividend and interest payments received in additional securities are recorded on theex-dividend orex-interest date in an amount equal to the value of the security on such date.
The fund may receive proceeds from litigation settlements. Any proceeds received from litigation involving portfolio holdings are reflected in the Statement of Operations in realized gain/loss if the security has been disposed of by the fund or in unrealized gain/loss if the security is still held by the fund. Any other proceeds from litigation not related to portfolio holdings are reflected as other income in the Statement of Operations.
Tax Matters and Distributions– The fund intends to qualify as a regulated investment company, as defined under Subchapter M of the Internal Revenue Code, and to distribute all of its taxable income, including realized capital gains. As a result, no provision for federal income tax is required. The fund’s federal tax returns, when filed, will remain subject to examination by the Internal Revenue Service for a three year period. Management has analyzed the fund’s tax positions taken on federal and state tax returns for all open tax years and does not believe that there are any uncertain tax positions that require recognition of a tax liability. Foreign taxes, if any, have been accrued by the fund in the accompanying financial statements in accordance with the applicable foreign tax law. Foreign income taxes may be withheld by certain countries in which the fund invests. Additionally, capital gains realized by the fund on securities issued in or by certain foreign countries may be subject to capital gains tax imposed by those countries.
Distributions to shareholders are recorded on theex-dividend date. Income and capital gain distributions are determined in accordance with income tax regulations, which may differ from U.S. generally accepted accounting principles. Certain capital accounts in the financial statements are periodically adjusted for permanent differences in order to reflect their tax character. These adjustments have no impact on net assets or net asset value per share. Temporary differences which arise from recognizing certain items of income, expense, gain or loss in different periods for financial statement and tax purposes will reverse at some time in the future. Distributions in excess of net investment income or net realized gains are temporary overdistributions for financial statement purposes resulting from differences in the recognition or classification of income or distributions for financial statement and tax purposes.
Book/tax differences primarily relate to partnership adjustments.
The tax character of distributions declared to shareholders for the last two fiscal years is as follows:
| | | | | | | | |
| | | Year ended
12/31/18 | | | Year ended
12/31/17 | |
| Ordinary income (including any short-term capital gains) | | | $952,020 | | | | $1,601,030 | |
| Long-term capital gains | | | 5,703,014 | | | | — | |
| Total distributions | | | $6,655,034 | | | | $1,601,030 | |
17
MFS Global Research Portfolio
Notes to Financial Statements – continued
The federal tax cost and the tax basis components of distributable earnings were as follows:
| | | | |
| As of 12/31/18 | | | | |
| |
| Cost of investments | | | $76,833,691 | |
| Gross appreciation | | | 13,696,434 | |
| Gross depreciation | | | (7,698,314 | ) |
| Net unrealized appreciation (depreciation) | | | $5,998,120 | |
| |
| Undistributed ordinary income | | | 1,132,643 | |
| Undistributed long-term capital gain | | | 7,435,745 | |
| Other temporary differences | | | 128,069 | |
Multiple Classes of Shares of Beneficial Interest– The fund offers multiple classes of shares, which differ in their respective distribution and/or service fees. The fund’s income, realized and unrealized gain (loss), and common expenses are allocated to shareholders based on the daily net assets of each class. Dividends are declared separately for each class. Differences in per share dividend rates are generally due to differences in separate class expenses. The fund’s distributions declared to shareholders as reported in the Statements of Changes in Net Assets are presented by class as follows:
| | | | | | | | | | | | | | | | |
| | | From net investment
income | | | From net realized
gain | |
| | | | |
| | | Year ended
12/31/18 | | | Year ended
12/31/17 | | | Year ended
12/31/18 | | | Year ended
12/31/17 | |
| Initial Class | | | $905,232 | | | | $1,502,165 | | | | $5,317,564 | | | | $— | |
| Service Class | | | 46,788 | | | | 98,865 | | | | 385,450 | | | | — | |
| Total | | | $952,020 | | | | $1,601,030 | | | | $5,703,014 | | | | $— | |
| (3) | | Transactions with Affiliates |
Investment Adviser– The fund has an investment advisory agreement with MFS to provide overall investment management and related administrative services and facilities to the fund. The management fee is computed daily and paid monthly at the following annual rates based on the fund’s average daily net assets:
| | | | |
| Up to $300 million | | | 0.75% | |
| In excess of $300 million | | | 0.675% | |
MFS has agreed in writing to reduce its management fee by a specified amount if certain MFS mutual fund assets exceed thresholds agreed to by MFS and the fund’s Board of Trustees. For the year ended December 31, 2018, this management fee reduction amounted to $9,386, which is included in the reduction of total expenses in the Statement of Operations. The management fee incurred for the year ended December 31, 2018 was equivalent to an annual effective rate of 0.74% of the fund’s average daily net assets.
Effective August 1, 2018, the investment adviser has agreed in writing to pay a portion of the fund’s total annual operating expenses, excluding interest, taxes, extraordinary expenses, brokerage and transaction costs, and investment-related expenses, such that total annual operating expenses do not exceed 0.85% of average daily net assets for the Initial Class shares and 1.10% of average daily net assets for the Service Class shares. This written agreement will continue until modified by the fund’s Board of Trustees, but such agreement will continue at least until April 30, 2020. For the period from August 1, 2018 through December 31, 2018, this reduction amounted to $35,162, which is included in the reduction of total expenses in the Statement of Operations.
Distributor– MFS Fund Distributors, Inc. (MFD), a wholly-owned subsidiary of MFS, is the distributor of shares of the fund. The Trustees have adopted a distribution plan for the Service Class shares pursuant to Rule12b-1 under the Investment Company Act of 1940.
The fund’s distribution plan provides that the fund will pay MFD distribution and/or service fees equal to 0.25% per annum of its average daily net assets attributable to Service Class shares as partial consideration for services performed and expenses incurred by MFD and financial intermediaries (including participating insurance companies that invest in the fund to fund variable annuity and variable life insurance contracts, sponsors of qualified retirement and pension plans that invest in the fund, and affiliates of these participating insurance companies and plan sponsors) in connection with the sale and distribution of the Service Class shares. MFD may subsequently pay all, or a portion, of the distribution and/or service fees to financial intermediaries.
Shareholder Servicing Agent– MFS Service Center, Inc. (MFSC), a wholly-owned subsidiary of MFS, receives a fee from the fund for its services as shareholder servicing agent. For the year ended December 31, 2018, the fee was $2,246, which equated to 0.0023% annually of the fund’s average daily net assets. MFSC also receives payment from the fund forout-of-pocket expenses paid by MFSC on behalf of the fund. For the year ended December 31, 2018, these costs amounted to $116.
18
MFS Global Research Portfolio
Notes to Financial Statements – continued
Administrator– MFS provides certain financial, legal, shareholder communications, compliance, and other administrative services to the fund. Under an administrative services agreement, the fund reimburses MFS the costs incurred to provide these services. The fund is charged an annual fixed amount of $17,500 plus a fee based on average daily net assets. The administrative services fee incurred for the year ended December 31, 2018 was equivalent to an annual effective rate of 0.0248% of the fund’s average daily net assets.
Trustees’ and Officers’ Compensation– The fund pays compensation to independent Trustees in the form of a retainer, attendance fees, and additional compensation to Board and Committee chairpersons. The fund does not pay compensation directly to Trustees or officers of the fund who are also officers of the investment adviser, all of whom receive remuneration for their services to the fund from MFS. Certain officers and Trustees of the fund are officers or directors of MFS, MFD, and MFSC.
Other– This fund and certain other funds managed by MFS (the funds) have entered into a service agreement (the ISO Agreement) which provides for payment of fees solely by the funds to Tarantino LLC in return for the provision of services of an Independent Senior Officer (ISO) for the funds. Frank L. Tarantino serves as the ISO and is an officer of the funds and the sole member of Tarantino LLC. The funds can terminate the ISO Agreement with Tarantino LLC at any time under the terms of the ISO Agreement. For the year ended December 31, 2018, the fee paid by the fund under this agreement was $168 and is included in “Miscellaneous” expense in the Statement of Operations. MFS has agreed to bear all expenses associated with office space, other administrative support, and supplies provided to the ISO.
The fund invests in the MFS Institutional Money Market Portfolio which is managed by MFS and seeks current income consistent with preservation of capital and liquidity. This money market fund does not pay a management fee to MFS.
The fund is permitted to engage in purchase and sale transactions with funds and accounts for which MFS serves as investment adviser orsub-adviser (“cross-trades”) pursuant to a policy adopted by the Board of Trustees. This policy has been designed to ensure that cross-trades conducted by the fund comply with Rule17a-7 under the Investment Company Act of 1940. During the year ended December 31, 2018, the fund engaged in purchase and sale transactions pursuant to this policy, which amounted to $124,156 and $751,091, respectively. The sales transactions resulted in net realized gains (losses) of $181,875.
For the year ended December 31, 2018, purchases and sales of investments, other than short-term obligations, aggregated $21,261,188 and $35,211,085, respectively.
| (5) | | Shares of Beneficial Interest |
The fund’s Declaration of Trust permits the Trustees to issue an unlimited number of full and fractional shares of beneficial interest. Transactions in fund shares were as follows:
| | | | | | | | | | | | | | | | |
| | | Year ended 12/31/18 | | | Year ended 12/31/17 | |
| | | Shares | | | Amount | | | Shares | | | Amount | |
| Shares sold | | | | | | | | | | | | | | | | |
Initial Class | | | 21,167 | | | | $662,568 | | | | 26,267 | | | | $775,526 | |
Service Class | | | 13,000 | | | | 400,637 | | | | 7,463 | | | | 214,891 | |
| | | 34,167 | | | | $1,063,205 | | | | 33,730 | | | | $990,417 | |
| Shares issued to shareholders in reinvestment of distributions | | | | | | | | | | | | | | | | |
Initial Class | | | 199,449 | | | | $6,222,796 | | | | 51,146 | | | | $1,502,165 | |
Service Class | | | 13,898 | | | | 432,238 | | | | 3,377 | | | | 98,865 | |
| | | 213,347 | | | | $6,655,034 | | | | 54,523 | | | | $1,601,030 | |
| Shares reacquired | | | | | | | | | | | | | | | | |
Initial Class | | | (457,412 | ) | | | $(14,510,661 | ) | | | (528,496 | ) | | | $(15,420,190 | ) |
Service Class | | | (52,984 | ) | | | (1,667,012 | ) | | | (69,314 | ) | | | (2,011,438 | ) |
| | | (510,396 | ) | | | $(16,177,673 | ) | | | (597,810 | ) | | | $(17,431,628 | ) |
| Net change | | | | | | | | | | | | | | | | |
Initial Class | | | (236,796 | ) | | | $(7,625,297 | ) | | | (451,083 | ) | | | $(13,142,499 | ) |
Service Class | | | (26,086 | ) | | | (834,137 | ) | | | (58,474 | ) | | | (1,697,682 | ) |
| | | (262,882 | ) | | | $(8,459,434 | ) | | | (509,557 | ) | | | $(14,840,181 | ) |
The fund and certain other funds managed by MFS participate in a $1.25 billion unsecured committed line of credit, subject to a $1 billion sublimit, provided by a syndication of banks under a credit agreement. Borrowings may be made for temporary financing needs. Interest is charged to each fund, based on its borrowings, generally at a rate equal to the higher of the Overnight Bank Funding rate or daily one month LIBOR plus an agreed upon spread. A commitment fee, based on the average daily, unused portion
19
MFS Global Research Portfolio
Notes to Financial Statements – continued
of the committed line of credit, is allocated among the participating funds. In addition, the fund and other funds managed by MFS have established unsecured uncommitted borrowing arrangements with certain banks for temporary financing needs. Interest is charged to each fund, based on its borrowings, at a rate equal to the Overnight Bank Funding rate plus an agreed upon spread. For the year ended December 31, 2018, the fund’s commitment fee and interest expense were $573 and $0, respectively, and are included in “Miscellaneous” expense in the Statement of Operations.
| (7) | | Investments in Affiliated Issuers |
An affiliated issuer may be considered one in which the fund owns 5% or more of the outstanding voting securities, or a company which is under common control. For the purposes of this report, the fund assumes the following to be affiliated issuers:
| | | | | | | | | | | | | | | | | | |
| Affiliated Issuers | | | | Beginning
Shares/Par
Amount | | | Acquisitions
Shares/Par
Amount | | | Dispositions
Shares/Par
Amount | | | Ending
Shares/Par
Amount | |
| MFS Institutional Money Market Portfolio | | | | | 477,596 | | | | 16,614,705 | | | | (16,588,850 | ) | | | 503,451 | |
| | | | | |
| Affiliated Issuers | | Realized
Gain (Loss) | | Change in
Unrealized
Appreciation/
Depreciation | | | Capital Gain
Distributions | | | Dividend
Income | | | Ending
Value | |
| MFS Institutional Money Market Portfolio | | $(74) | | | $(1 | ) | | | $— | | | | $10,426 | | | | $503,401 | |
20
MFS Global Research Portfolio
REPORT OF INDEPENDENT REGISTERED PUBLIC ACCOUNTING FIRM
To the Board of Trustees of MFS Variable Insurance Trust II and the Shareholders of MFS Global Research Portfolio:
Opinion on the Financial Statements and Financial Highlights
We have audited the accompanying statement of assets and liabilities of MFS Global Research Portfolio (the “Fund”), including the portfolio of investments, as of December 31, 2018, the related statement of operations for the year then ended, the statements of changes in net assets for each of the two years in the period then ended, the financial highlights for each of the five years in the period then ended, and the related notes. In our opinion, the financial statements and financial highlights present fairly, in all material respects, the financial position of the Fund as of December 31, 2018, and the results of its operations for the year then ended, the changes in its net assets for each of the two years in the period then ended, and the financial highlights for each of the five years in the period then ended, in conformity with accounting principles generally accepted in the United States of America.
Basis for Opinion
These financial statements and financial highlights are the responsibility of the Fund’s management. Our responsibility is to express an opinion on the Fund’s financial statements and financial highlights based on our audits. We are a public accounting firm registered with the Public Company Accounting Oversight Board (United States) (PCAOB) and are required to be independent with respect to the Fund in accordance with the U.S. federal securities laws and the applicable rules and regulations of the Securities and Exchange Commission and the PCAOB.
We conducted our audits in accordance with the standards of the PCAOB. Those standards require that we plan and perform the audit to obtain reasonable assurance about whether the financial statements and financial highlights are free of material misstatement, whether due to error or fraud. The Fund is not required to have, nor were we engaged to perform, an audit of its internal control over financial reporting. As part of our audits we are required to obtain an understanding of internal control over financial reporting but not for the purpose of expressing an opinion on the effectiveness of the Fund’s internal control over financial reporting. Accordingly, we express no such opinion.
Our audits included performing procedures to assess the risks of material misstatement of the financial statements and financial highlights, whether due to error or fraud, and performing procedures that respond to those risks. Such procedures included examining, on a test basis, evidence regarding the amounts and disclosures in the financial statements and financial highlights. Our audits also included evaluating the accounting principles used and significant estimates made by management, as well as evaluating the overall presentation of the financial statements and financial highlights. Our procedures included confirmation of securities owned as of December 31, 2018, by correspondence with the custodian and brokers; when replies were not received from brokers, we performed other auditing procedures. We believe that our audits provide a reasonable basis for our opinion.
DELOITTE & TOUCHE LLP
Boston, Massachusetts
February 15, 2019
We have served as the auditor of one or more of the MFS investment companies since 1924.
21
MFS Global Research Portfolio
TRUSTEES AND OFFICERS – IDENTIFICATION AND BACKGROUND
The Trustees and Officers of the Trust, as of February 1, 2019, are listed below, together with their principal occupations during the past five years. (Their titles may have varied during that period.) The address of each Trustee and Officer is 111 Huntington Avenue, Boston, Massachusetts 02199-7618.
| | | | | | | | | | |
Name, Age | | Position(s)
Held with Fund | | Trustee/Officer
Since (h) | | Number of MFS Funds overseen by the Trustee | | Principal Occupations
During the Past Five Years | | Other Directorships During the Past Five Years (j) |
| INTERESTED TRUSTEES |
Robert J. Manning (k) (age 55) | | Trustee | | February 2004 | | 135 | | Massachusetts Financial Services Company, Executive Chairman (since January 2017); Director; Chairman of the Board; Chief Executive Officer (until 2015);Co-Chief Executive Officer(2015-2016) | | N/A |
| | | | | |
Robin A. Stelmach (k) (age 57) | | Trustee | | January 2014 | | 135 | | Massachusetts Financial Services Company, Vice Chair (since January 2017); Chief Operating Officer and Executive Vice President (until January 2017) | | N/A |
|
| INDEPENDENT TRUSTEES |
John P. Kavanaugh (age 64) | | Trustee and Chair of Trustees | | January 2009 | | 135 | | Private investor | | N/A |
| | | | | |
Steven E. Buller (age 67) | | Trustee | | February 2014 | | 135 | | Financial Accounting Standards Advisory Council, Chairman(2014-2015); Public Company Accounting Oversight Board, Standing Advisory Group, Member (until 2014); BlackRock, Inc. (investment management), Managing Director (until 2014), BlackRock Finco UK (investment management), Director (until 2014) | | N/A |
| | | | | |
John A. Caroselli (age 64) | | Trustee | | March 2017 | | 135 | | JC Global Advisors, LLC (management consulting), President (since 2015); First Capital Corporation (commercial finance), Executive Vice President (until 2015) | | N/A |
| | | | | |
Maureen R. Goldfarb (age 63) | | Trustee | | January 2009 | | 135 | | Private investor | | N/A |
| | | | | |
Michael Hegarty (age 74) | | Trustee | | December 2004 | | 135 | | Private investor | | Rouse Properties Inc., Director (until 2016); Capmark Financial Group Inc., Director (until 2015) |
| | | | | |
Peter D. Jones (age 63) | | Trustee | | January 2019 | | 135 | | Franklin Templeton Distributors, Inc. (investment management), President (until 2015); Franklin Templeton Institutional, LLC (investment management), Chairman (until 2015) | | N/A |
| | | | | |
James W. Kilman, Jr. (age 57) | | Trustee | | January 2019 | | 135 | | KielStrand Capital LLC (family office and merchant bank), Chief Executive Officer (since 2016); Morgan Stanley & Co. (financial services), Vice Chairman of Investment Banking,Co-Head of Diversified Financials Coverage – Financial Institutions Investment Banking Group (until 2016) | | alpha-En Corporation, Director (since 2016) |
22
MFS Global Research Portfolio
Trustees and Officers – continued
| | | | | | | | | | |
Name, Age | | Position(s)
Held with Fund | | Trustee/Officer
Since (h) | | Number of MFS Funds overseen by the Trustee | | Principal Occupations
During the Past Five Years | | Other Directorships During the Past Five Years (j) |
Clarence Otis, Jr. (age 62) | | Trustee | | March 2017 | | 135 | | Darden Restaurants, Inc., Chief Executive Officer (until 2014) | | VF Corporation, Director; Verizon Communications, Inc., Director; The Travelers Companies, Director; Federal Reserve Bank of Atlanta, Director (until 2015) |
| | | | | |
Maryanne L. Roepke (age 62) | | Trustee | | May 2014 | | 135 | | American Century Investments (investment management), Senior Vice President and Chief Compliance Officer (until 2014) | | N/A |
| | | | | |
Laurie J. Thomsen
(age 61) | | Trustee | | March 2005 | | 135 | | Private investor | | The Travelers Companies, Director; Dycom Industries, Inc., Director (since 2015) |
| | | | | | | | |
Name, Age | | Position(s)
Held with Fund | | Trustee/Officer
Since (h) | | Number of MFS Funds for which the Person is an Officer | | Principal Occupations During the Past Five Years |
| OFFICERS | | | | | | |
Christopher R. Bohane (k)
(age 45) | | Assistant Secretary and Assistant Clerk | | July 2005 | | 135 | | Massachusetts Financial Services Company, Vice President and Assistant General Counsel |
| | | | |
Kino Clark (k) (age 50) | | Assistant Treasurer | | January 2012 | | 135 | | Massachusetts Financial Services Company, Vice President |
| | | | |
John W. Clark, Jr. (k) (age 51) | | Assistant Treasurer | | April 2017 | | 135 | | Massachusetts Financial Services Company, Vice President (since March 2017); Deutsche Bank (financial services), Department Head – Treasurer’s Office (until February 2017) |
| | | | |
Thomas H. Connors (k) (age 59) | | Assistant Secretary and Assistant Clerk | | September 2012 | | 135 | | Massachusetts Financial Services Company, Vice President and Senior Counsel |
| | | | |
Ethan D. Corey (k)
(age 55) | | Assistant
Secretary and Assistant Clerk | | July 2005 | | 135 | | Massachusetts Financial Services Company, Senior Vice President and Associate General Counsel |
| | | | |
David L. DiLorenzo (k)
(age 50) | | President | | July 2005 | | 135 | | Massachusetts Financial Services Company, Senior Vice President |
| | | | |
Heidi W. Hardin (k) (age 51) | | Secretary and Clerk | | April 2017 | | 135 | | Massachusetts Financial Services Company, Executive Vice President and General Counsel (since March 2017); Harris Associates (investment management), General Counsel (from September 2015 to January 2017); Janus Capital Management LLC (investment management), Senior Vice President and General Counsel (until September 2015) |
| | | | |
Brian E. Langenfeld (k) (age 45) | | Assistant
Secretary and Assistant Clerk | | June 2006 | | 135 | | Massachusetts Financial Services Company, Vice President and Senior Counsel |
| | | | |
Amanda S. Mooradian (k) (age 39) | | Assistant
Secretary and Assistant Clerk | | September 2018 | | 135 | | Massachusetts Financial Services Company, Assistant Vice President and Counsel |
| | | | |
Susan A. Pereira (k)
(age 48) | | Assistant
Secretary and Assistant Clerk | | July 2005 | | 135 | | Massachusetts Financial Services Company, Vice President and Senior Counsel |
| | | | |
Kasey L. Phillips (k) (age 48) | | Assistant Treasurer | | September 2012 | | 135 | | Massachusetts Financial Services Company, Vice President |
| | | | |
Matthew A. Stowe (k) (age 44) | | Assistant Secretary and Assistant Clerk | | October 2014 | | 135 | | Massachusetts Financial Services Company, Vice President and Assistant General Counsel |
23
MFS Global Research Portfolio
Trustees and Officers – continued
| | | | | | | | |
Name, Age | | Position(s)
Held with Fund | | Trustee/Officer
Since (h) | | Number of MFS Funds for which the Person is an Officer | | Principal Occupations During the Past Five Years |
Frank L. Tarantino
(age 74) | | Independent
Senior Officer | | June 2004 | | 135 | | Tarantino LLC (provider of compliance services), Principal |
| | | | |
Richard S. Weitzel (k)
(age 48) | | Assistant Secretary and Assistant Clerk | | October 2007 | | 135 | | Massachusetts Financial Services Company, Senior Vice President and Associate General Counsel |
| | | | |
Martin J. Wolin (k) (age 51) | | Chief Compliance Officer | | July 2015 | | 135 | | Massachusetts Financial Services Company, Senior Vice President and Chief Compliance Officer (since July 2015); Mercer (financial service provider), Chief Risk and Compliance Officer, North America and Latin America (until June 2015) |
| | | | |
James O. Yost (k)
(age 58) | | Treasurer | | September 1990 | | 135 | | Massachusetts Financial Services Company, Senior Vice President |
| (h) | Date first appointed to serve as Trustee/officer of an MFS Fund. Each Trustee has served continuously since appointment unless indicated otherwise. For the period from December 15, 2004 until February 22, 2005, Mr. Manning served as Advisory Trustee. From January 2012 through December 2016, Messrs. DiLorenzo and Yost served as Treasurer and Deputy Treasurer of the Funds, respectively. |
| (j) | Directorships or trusteeships of companies required to report to the Securities and Exchange Commission (i.e., “public companies”). |
| (k) | “Interested person” of the Trust within the meaning of the Investment Company Act of 1940 (referred to as the 1940 Act), which is the principal federal law governing investment companies like the fund, as a result of a position with MFS. The address of MFS is 111 Huntington Avenue, Boston, Massachusetts 02199-7618. |
Each Trustee has been elected by shareholders and each Trustee and officer holds office until his or her successor is chosen and qualified or until his or her earlier death, resignation, retirement or removal. The Trust does not hold annual meetings for the purpose of electing Trustees, and Trustees are not elected for fixed terms. Under the terms of the Board’s retirement policy, an Independent Trustee shall retire at the end of the calendar year in which he or she reaches the earlier of 75 years of age or 15 years of service on the Board (or, in the case of any Independent Trustee who joined the Board prior to 2015, 20 years of service on the Board).
Messrs. Buller, Hegarty, Kilman and Otis and Ms. Roepke are members of the Trust’s Audit Committee.
Each of the Interested Trustees and certain Officers hold comparable officer positions with certain affiliates of MFS.
The Statement of Additional Information for a Fund includes further information about the Trustees and is available without charge upon request by calling1-800-225-2606.
| | |
Investment Adviser Massachusetts Financial Services Company 111 Huntington Avenue Boston, MA 02199-7618 | | Custodian State Street Bank and Trust Company 1 Lincoln Street Boston, MA 02111-2900 |
Distributor MFS Fund Distributors, Inc. 111 Huntington Avenue Boston, MA 02199-7618 | | Independent Registered Public Accounting Firm Deloitte & Touche LLP 200 Berkeley Street Boston, MA 02116 |
Portfolio Manager(s) James Keating Joseph MacDougall | | |
24
MFS Global Research Portfolio
BOARD REVIEW OF INVESTMENT ADVISORY AGREEMENT
The Investment Company Act of 1940 requires that both the full Board of Trustees and a majority of thenon-interested (“independent”) Trustees, voting separately, annually approve the continuation of the Fund’s investment advisory agreement with MFS. The Trustees consider matters bearing on the Fund and its advisory arrangements at their meetings throughout the year, including a review of performance data at each regular meeting. In addition, the independent Trustees met several times over the course of three months beginning in May and ending in July, 2018 (“contract review meetings”) for the specific purpose of considering whether to approve the continuation of the investment advisory agreement for the Fund and the other investment companies that the Board oversees (the “MFS Funds”). The independent Trustees were assisted in their evaluation of the Fund’s investment advisory agreement by independent legal counsel, from whom they received separate legal advice and with whom they met separately from MFS during various contract review meetings. The independent Trustees were also assisted in this process by the MFS Funds’ Independent Senior Officer, a senior officer appointed by and reporting to the independent Trustees.
In connection with their deliberations regarding the continuation of the investment advisory agreement, the Trustees, including the independent Trustees, considered such information and factors as they believed, in light of the legal advice furnished to them and their own business judgment, to be relevant. The investment advisory agreement for the Fund was considered separately, although the Trustees also took into account the common interests of all MFS Funds in their review. As described below, the Trustees considered the nature, quality, and extent of the various investment advisory, administrative, and shareholder services performed by MFS under the existing investment advisory agreement and other arrangements with the Fund.
In connection with their contract review meetings, the Trustees received and relied upon materials that included, among other items: (i) information provided by Broadridge Financial Solutions, Inc. (“Broadridge”), an independent third party, on the investment performance of the Fund for various time periods ended December 31, 2017 and the investment performance of a group of funds with substantially similar investment classifications/objectives (the “Broadridge performance universe”), (ii) information provided by Broadridge on the Fund’s advisory fees and other expenses and the advisory fees and other expenses of comparable funds identified by Broadridge (the “Broadridge expense group”), (iii) information provided by MFS on the advisory fees of portfolios of other clients of MFS, including institutional separate accounts and other clients, (iv) information as to whether and to what extent applicable expense waivers, reimbursements or fee “breakpoints” are observed for the Fund, (v) information regarding MFS’ financial results and financial condition, including MFS’ and certain of its affiliates’ estimated profitability from services performed for the Fund and the MFS Funds as a whole, and compared to MFS’ institutional business, (vi) MFS’ views regarding the outlook for the mutual fund industry and the strategic business plans of MFS, (vii) descriptions of various functions performed by MFS for the Funds, such as compliance monitoring and portfolio trading practices, and (viii) information regarding the overall organization of MFS, including information about MFS’ senior management and other personnel providing investment advisory, administrative and other services to the Fund and the other MFS Funds. The comparative performance, fee and expense information prepared and provided by Broadridge was not independently verified and the independent Trustees did not independently verify any information provided to them by MFS.
The Trustees’ conclusion as to the continuation of the investment advisory agreement was based on a comprehensive consideration of all information provided to the Trustees and not the result of any single factor. Some of the factors that figured particularly in the Trustees’ deliberations are described below, although individual Trustees may have evaluated the information presented differently from one another, giving different weights to various factors. It is also important to recognize that the fee arrangements for the Fund and other MFS Funds are the result of years of review and discussion between the independent Trustees and MFS, that certain aspects of such arrangements may receive greater scrutiny in some years than in others, and that the Trustees’ conclusions may be based, in part, on their consideration of these same arrangements during the course of the year and in prior years.
Based on information provided by Broadridge and MFS, the Trustees reviewed the Fund’s total return investment performance as well as the Broadridge performance universe over various time periods. The Trustees placed particular emphasis on the total return performance of the Fund’s Initial Class shares in comparison to the performance of funds in its Broadridge performance universe over the three-year period ended December 31, 2017, which the Trustees believed was a long enough period to reflect differing market conditions. The total return performance of the Fund’s Initial Class shares was in the 5th quintile relative to the other funds in the universe for this three-year period (the 1st quintile being the best performers and the 5th quintile being the worst performers). The total return performance of the Fund’s Initial Class shares was in the 5th quintile for each of theone- and five-year periods ended December 31, 2017 relative to the Broadridge performance universe. Because of the passage of time, these performance results may differ from the performance results for more recent periods, including those shown elsewhere in this report.
The Trustees expressed continued concern to MFS about the substandard investment performance of the Fund. In the course of their deliberations, the Trustees took into account information provided by MFS in connection with the contract review meetings, as well as during investment review meetings conducted with portfolio management personnel during the course of the year, as to MFS’ efforts to improve the Fund’s performance. In addition, the Trustees requested that they receive a separate update on the Fund’s performance at each of their regular meetings. After reviewing these and related factors, the Trustees concluded, within the context of their overall conclusions regarding the investment advisory agreement, that MFS’ responses and efforts and plans to improve
25
MFS Global Research Portfolio
Board Review of Investment Advisory Agreement – continued
investment performance were sufficient to support approval of the continuance of the investment advisory agreement for an additionalone-year period, but that they would continue to closely monitor the performance of the Fund.
In assessing the reasonableness of the Fund’s advisory fee, the Trustees considered, among other information, the Fund’s advisory fee and the total expense ratio of the Fund’s Initial Class shares as a percentage of average daily net assets and the advisory fee and total expense ratios of peer groups of funds based on information provided by Broadridge. The Trustees considered that, according to the data provided by Broadridge (which takes into account any fee reductions or expense limitations that were in effect during the Fund’s last fiscal year), the Fund’s effective advisory fee rate and total expense ratio were each higher than the Broadridge expense group median. The Trustees also noted that MFS has agreed to implement an expense limitation for the Fund effective August 1, 2018, which may not be changed without the Trustees’ approval.
The Trustees also considered the advisory fees charged by MFS to any institutional separate accounts advised by MFS (“separate accounts”) and unaffiliated investment companies for which MFS serves as subadviser (“subadvised funds”) that have comparable investment strategies to the Fund, if any. In comparing these fees, the Trustees considered information provided by MFS as to the generally broader scope of services provided by MFS to the Fund, as well as the more extensive regulatory burdens imposed on MFS in managing the Fund, in comparison to separate accounts and subadvised funds. The Trustees also considered the higher demands placed on MFS’ investment personnel and trading infrastructure as a result of the daily cashin-flows andout-flows of the Fund in comparison to separate accounts.
The Trustees also considered whether the Fund may benefit from any economies of scale in the management of the Fund in the event of growth in assets of the Fund and/or growth in assets of the MFS Funds as a whole. They noted that the Fund’s advisory fee rate schedule is subject to a contractual breakpoint that reduces the Fund’s advisory fee rate on average daily net assets over $300 million. The Trustees also noted that MFS has agreed in writing to waive a portion of the management fees of certain MFS Funds, including the Fund, if the total combined assets of certain funds within the MFS Funds’ complex increase above agreed upon thresholds (the “group fee waiver”), enabling the Fund’s shareholders to share in the benefits from any economies of scale at the complex level. The group fee waiver is reviewed and renewed annually between the Board and MFS. The Trustees concluded that the breakpoint and the group fee waiver were sufficient to allow the Fund to benefit from economies of scale as its assets and overall complex assets grow.
The Trustees also considered information prepared by MFS relating to MFS’ costs and profits with respect to the Fund, the MFS Funds considered as a group, and other investment companies and accounts advised by MFS, as well as MFS’ methodologies used to determine and allocate its costs to the MFS Funds, the Fund and other accounts and products for purposes of estimating profitability.
After reviewing these and other factors described herein, the Trustees concluded, within the context of their overall conclusions regarding the investment advisory agreement, that the advisory fees charged to the Fund represent reasonable compensation in light of the services being provided by MFS to the Fund.
In addition, the Trustees considered MFS’ resources and related efforts to continue to retain, attract and motivate capable personnel to serve the Fund. The Trustees also considered current and developing conditions in the financial services industry, including the presence of large and well-capitalized companies which are spending, and appear to be prepared to continue to spend, substantial sums to engage personnel and to provide services to competing investment companies. In this regard, the Trustees also considered the financial resources of MFS and its ultimate parent, Sun Life Financial Inc. The Trustees also considered the advantages and possible disadvantages to the Fund of having an adviser that also serves other investment companies as well as other accounts.
The Trustees also considered the nature, quality, cost, and extent of administrative, transfer agency, and distribution services provided to the Fund by MFS and its affiliates under agreements and plans other than the investment advisory agreement, including any12b-1 fees the Fund pays to MFS Fund Distributors, Inc., an affiliate of MFS. The Trustees also considered the nature, extent and quality of certain other services MFS performs or arranges for on the Fund’s behalf, which may include securities lending programs, directed expense payment programs, class action recovery programs, and MFS’ interaction with third-party service providers, principally custodians andsub-custodians. The Trustees concluded that the variousnon-advisory services provided by MFS and its affiliates on behalf of the Fund were satisfactory.
The Trustees consideredso-called“fall-out benefits” to MFS such as reputational value derived from serving as investment manager to the MFS Funds. The Trustees also considered that, effective January 3, 2018, MFS had discontinued its historic practice of obtaining investment research from portfolio brokerage commissions paid by certain MFS Funds and would thereafter voluntarily reimburse a Fund, if applicable, for the costs of external research acquired through the use of the Fund’s portfolio brokerage commissions.
Based on their evaluation of factors that they deemed to be material, including those factors described above, the Board of Trustees, including the independent Trustees, concluded that the Fund’s investment advisory agreement with MFS should be continued for an additionalone-year period, commencing August 1, 2018.
26
MFS Global Research Portfolio
PROXY VOTING POLICIES AND INFORMATION
MFS votes proxies on behalf of the fund pursuant to proxy voting policies and procedures that are available without charge, upon request, by calling 1-800-225-2606, by visitingmfs.com/proxyvoting, or by visiting the SEC’s Web site athttp://www.sec.gov.
Information regarding how the fund voted proxies relating to portfolio securities during the most recent twelve-month period ended June 30 is available by August 31 of each year without charge by visitingmfs.com/proxyvoting, or by visiting the SEC’s Web site athttp://www.sec.gov.
QUARTERLY PORTFOLIO DISCLOSURE
The fund files a complete schedule of portfolio holdings with the SEC for the first and third quarters of each fiscal year on Form N-Q. The fund’s Form N-Q is available on the SEC’s website athttp://www.sec.gov. A shareholder can obtain the portfolio holdings report for the first and third quarters of the fund’s fiscal year atmfs.com/vit2 by choosing the fund’s name and then selecting the “Resources” tab and clicking on “Prospectus and Reports”.
FURTHER INFORMATION
From time to time, MFS may post important information about the fund or the MFS funds on the MFS web site (mfs.com). This information is available athttps://www.mfs.com/en-us/what-we-do/announcements.htmlor atmfs.com/vit2 by choosing the fund’s name.
INFORMATION ABOUT FUND CONTRACTS AND LEGAL CLAIMS
The fund has entered into contractual arrangements with an investment adviser, administrator, distributor, shareholder servicing agent, 529 program manager (if applicable), and custodian who each provide services to the fund. Unless expressly stated otherwise, shareholders are not parties to, or intended beneficiaries of these contractual arrangements, and these contractual arrangements are not intended to create any shareholder right to enforce them against the service providers or to seek any remedy under them against the service providers, either directly or on behalf of the fund.
Under the Trust’s By-Laws and Declaration of Trust, any claims asserted against or on behalf of the MFS Funds, including claims against Trustees and Officers, must be brought in state and federal courts located within the Commonwealth of Massachusetts.
FEDERAL TAX INFORMATION (unaudited)
The following information is provided pursuant to provisions of the Internal Revenue Code.
The fund designates $6,274,000 as capital gain dividends paid during the fiscal year.
For corporate shareholders, 70.98% of the ordinary income dividends paid during the fiscal year qualify for the corporate dividends received deduction.
27
rev. 3/16
| | | | |
| | | |
| FACTS | | WHAT DOES MFS DO WITH YOUR
PERSONAL INFORMATION? | |  |
| | |
| Why? | | Financial companies choose how they share your personal information. Federal law gives consumers the right to limit some but not all sharing. Federal law also requires us to tell you how we collect, share, and protect your personal information. Please read this notice carefully to understand what we do. |
| | |
| What? | | The types of personal information we collect and share depend on the product or service you have with us. This information can include: • Social Security number and account balances • Account transactions and transaction history • Checking account information and wire transfer instructions When you areno longer our customer, we continue to share your information as described in this notice. |
| | |
| How? | | All financial companies need to share customers’ personal information to run their everyday business. In the section below, we list the reasons financial companies can share their customers’ personal information; the reasons MFS chooses to share; and whether you can limit this sharing. |
| | | | |
Reasons we can share your
personal information | | Does MFS share? | | Can you limit this
sharing? |
For our everyday business purposes – such as to process your transactions, maintain your account(s), respond to court orders and legal investigations, or report to credit bureaus | | Yes | | No |
For our marketing purposes – to offer our products and services to you | | No | | We don’t share |
| For joint marketing with other financial companies | | No | | We don’t share |
For our affiliates’ everyday business purposes – information about your transactions and experiences | | No | | We don’t share |
For our affiliates’ everyday business purposes – information about your creditworthiness | | No | | We don’t share |
| For nonaffiliates to market to you | | No | | We don’t share |
| | |
| | |
| Questions? | | Call800-225-2606 or go tomfs.com. |
28
| | |
| Who we are |
| Who is providing this notice? | | MFS Funds, MFS Investment Management, MFS Institutional Advisors, Inc., and MFS Heritage Trust Company. |
| | |
| What we do |
| How does MFS protect my personal information? | | To protect your personal information from unauthorized access and use, we use security measures that comply with federal law. These measures include procedural, electronic, and physical safeguards for the protection of the personal information we collect about you. |
How does MFS
collect my personal information? | | We collect your personal information, for example, when you • open an account or provide account information • direct us to buy securities or direct us to sell your securities • make a wire transfer We also collect your personal information from others, such as credit bureaus, affiliates, or other companies. |
| Why can’t I limit all sharing? | | Federal law gives you the right to limit only • sharing for affiliates’ everyday business purposes – information about your creditworthiness • affiliates from using your information to market to you • sharing for nonaffiliates to market to you State laws and individual companies may give you additional rights to limit sharing. |
| | |
| Definitions |
| Affiliates | | Companies related by common ownership or control. They can be financial and nonfinancial companies. • MFS does not share personal information with affiliates, except for everyday business purposes as described on page one of this notice. |
| Nonaffiliates | | Companies not related by common ownership or control. They can be financial and nonfinancial companies. • MFS does not share with nonaffiliates so they can market to you. |
| Joint marketing | | A formal agreement between nonaffiliated financial companies that together market financial products or services to you. • MFS doesn’t jointly market. |
| | |
| Other important information |
| If you own an MFS product or receive an MFS service in the name of a third party such as a bank or broker-dealer, their privacy policy may apply to you instead of ours. |
29
Annual Report
December 31, 2018

MFS® Global Tactical Allocation Portfolio

MFS® Variable Insurance Trust II
Beginning on January 1, 2021, as permitted by regulations adopted by the U.S. Securities and Exchange Commission, the insurance company that offers your contract may determine that it will no longer send you paper copies of the fund’s annual and semiannual shareholder reports unless you specifically request paper copies from the insurance company or from your financial intermediary. Instead, the shareholder reports will be made available on a Web site (insurancefunds.mfs.com or other Web site of which you will be notified), and the insurance company will notify you by mail each time a report is posted and provide you with a Web site link to access the report. Instructions for requesting paper copies will be provided by your insurance company or financial intermediary.
If you already elected to receive shareholder reports by email, you will not be affected by this change and you need not take any action. If your insurance company or financial intermediary offers electronic delivery, you may elect to receive shareholder reports and other communications from the insurance company or financial intermediary by email by following the instructions provided by the insurance company or financial intermediary.
Beginning on January 1, 2019, you may elect to receive all future reports in paper free of charge from the insurance company or financial intermediary. You can inform the insurance company or financial intermediary that you wish to continue receiving paper copies of your shareholder reports by contacting your insurance company or financial intermediary. Your election to receive reports in paper will apply to all funds held in your account with your insurance company or financial intermediary.
WTS-ANN
MFS® Global Tactical Allocation Portfolio
CONTENTS
The report is prepared for the general information of contract owners. It is authorized for distribution to prospective investors only when preceded or accompanied by a current prospectus.
NOT FDIC INSURED• MAY LOSE VALUE• NO BANK OR CREDIT UNION GUARANTEE• NOT A DEPOSIT• NOT INSURED BY ANY FEDERAL GOVERNMENT AGENCY OR NCUA/NCUSIF
MFS Global Tactical Allocation Portfolio
LETTER FROM THE EXECUTIVE CHAIRMAN

Dear Contract Owners:
Higher interest rates, international trade friction, and geopolitical uncertainty surrounding issues such as Brexit have contributed to an uptick in market volatility in recent quarters — a departure from thelow-volatility environment that prevailed for much of the past several years. Against this more challenging backdrop, equity markets in the United States outperformed most international markets on a relative basis in 2018, though broad market returns were modestly negative on an absolute basis. Global economic growth has become less synchronized over the past few quarters, with Europe, China, and some emerging markets having shown signs of significantly slowing growth. While U.S. growth has remained above average, the pace of that growth slowed in the second half of 2018.
Slowing global growth and tighter financial conditions have clouded the outlook for U.S. monetary policy, with the chairman of the U.S. Federal Reserve acknowledging that policy rates are close to levels that the Fed deems neutral for the U.S. economy. This suggests that the predictable pattern of quarterly rate increases is behind us. At the same time, markets must contend with a shift from years of quantitative easing toward a cycle of quantitative tightening now that the European Central Bank has halted asset purchases. U.S. tax reforms adopted in late 2017 have been welcomed by equity markets while emerging market economies have recently had to contend with tighter financial conditions as a result of firmer U.S. interest rates and a stronger dollar. With the Republicans losing control of the U.S. House of Representatives, further meaningful U.S. fiscal stimulus appears less likely over the remainder of this presidential term. A partial U.S. government shutdown, beginning in late 2018, also added to political uncertainty. Globally, inflation remains largely subdued thanks in part to falling oil prices, but tight labor markets and moderate global demand have investors on the lookout for its potential reappearance. Increased U.S. protectionism is also a growing concern, as investors fear trade disputes could dampen business sentiment, leading to even slower global growth. While there has been progress on this front — a NAFTA replacement has been agreed upon between the U.S., Mexico, and Canada; the free trade pact with Korea has been updated; and a negotiating framework with the European Union has been agreed upon — tensions over trade with China remain quite high, though the two sides have recently returned to the negotiating table.
As a global investment manager with nearly a century of expertise, MFS® firmly believes active risk management offers downside mitigation and may help improve investment outcomes. We built our active investment platform with this belief in mind. Ourlong-term perspective influences nearly every aspect of our business, ensuring our investment decisions align with the investing time horizons of our clients.
Respectfully,

Robert J. Manning
Executive Chairman
MFS Investment Management
February 15, 2019
The opinions expressed in this letter are subject to change and may not be relied upon for investment advice. No forecasts can be guaranteed.
1
MFS Global Tactical Allocation Portfolio
PORTFOLIO COMPOSITION
Portfolio Structure
| | | | | | | | | | | | | | | | | | |
| | | | | | | | Tactical Overlay (b) | | | | |
| | | | | Active Security Selection (a) | | | Long | | | Short | | | Net Market
Exposure (c) | |
| Fixed Income | | U.S. | | | 27.3% | | | | 13.4% | | | | (8.3)% | | | | 32.4% | |
| | Europeex-U.K. | | | 11.0% | | | | 3.0% | | | | 0.0% | | | | 14.0% | |
| | Asia/Pacificex-Japan | | | 1.4% | | | | 7.7% | | | | 0.0% | | | | 9.1% | |
| | Japan | | | 5.1% | | | | 0.0% | | | | (1.2)% | | | | 3.9% | |
| | Emerging Markets | | | 3.7% | | | | 0.0% | | | | 0.0% | | | | 3.7% | |
| | United Kingdom | | | 2.8% | | | | 0.0% | | | | (0.4)% | | | | 2.4% | |
| | Supranational | | | 0.8% | | | | 0.0% | | | | 0.0% | | | | 0.8% | |
| | North Americaex-U.S. | | | 4.6% | | | | 0.0% | | | | (10.2)% | | | | (5.6)% | |
| | | Total | | | 56.7% | | | | 24.1% | | | | (20.1)% | | | | 60.7% | |
| Equity | | U.S. Large Cap | | | 15.7% | | | | 0.0% | | | | (2.0)% | | | | 13.7% | |
| | Europeex-U.K. | | | 6.3% | | | | 8.8% | | | | (4.4)% | | | | 10.7% | |
| | United Kingdom | | | 2.2% | | | | 4.1% | | | | 0.0% | | | | 6.3% | |
| | Emerging Markets | | | 1.7% | | | | 8.4% | | | | (5.4)% | | | | 4.7% | |
| | Asia/Pacificex-Japan | | | 0.4% | | | | 2.7% | | | | (0.1)% | | | | 3.0% | |
| | Japan | | | 2.3% | | | | 0.0% | | | | (1.9)% | | | | 0.4% | |
| | North Americaex-U.S. | | | 1.2% | | | | 0.0% | | | | (1.7)% | | | | (0.5)% | |
| | U.S. Small/Mid Cap | | | 1.1% | | | | 0.0% | | | | (3.6)% | | | | (2.5)% | |
| | | Total | | | 30.9% | | | | 24.0% | | | | (19.1)% | | | | 35.8% | |
| Real Estate-related | | Non-U.S. | | | 0.8% | | | | 0.0% | | | | 0.0% | | | | 0.8% | |
| | U.S. | | | 0.4% | | | | 0.0% | | | | 0.0% | | | | 0.4% | |
| | | Total | | | 1.2% | | | | 0.0% | | | | 0.0% | | | | 1.2% | |
Fixed Income
(inflation-adjusted) | | U.S. | | | 0.7% | | | | 0.0% | | | | 0.0% | | | | 0.7% | |
| | | Total | | | 0.7% | | | | 0.0% | | | | 0.0% | | | | 0.7% | |
| Cash | | Cash & Cash Equivalents (d) | | | | | | | | | | | | | | | 4.8% | |
| | Other (e) | | | | | | | | | | | | | | | (3.2)% | |
| | | Total | | | | | | | | | | | | | | | 1.6% | |
| | Total Net Exposure Summary | | | | | | | | | | | | | | | 100.0% | |
| | | | | | | | |
| Strategic Allocation Targets & Net Exposure Ranges | | | | | | | | |
| Asset Class | | | Target (w) | | | | Ranges (z) | |
| Equities | | | 35% | | | | 0 to 70% | |
| Fixed Income, Cash and Cash Equivalents | | | 65% | | | | 30 to 100% | |
| | | | |
| Top ten holdings (c) | | | | |
| U.S. Treasury Note 5 yr Future – MAR 2019 | | | 11.2% | |
| Australian Treasury Bond 10 yr Future – MAR 2019 | | | 7.7% | |
| U.S. Treasury Note 2 yr Future – MAR 2019 | | | 4.2% | |
| FTSE 100 Index Future – MAR 2019 | | | 4.1% | |
| OMX Index Future – JAN 2019 | | | 4.0% | |
| MSCI Taiwan Index Future – JAN 2019 | | | 3.2% | |
| Government of Japan, 0.5%, 6/20/2038 | | | 2.8% | |
| BIST 30 Index Future – FEB 2019 | | | 2.8% | |
| U.S. Treasury Note 10 yr Future – MAR 2019 | | | (7.9)% | |
| Canadian Treasury Bond 10 yr Future – MAR 2019 | | | (10.2)% | |
2
MFS Global Tactical Allocation Portfolio
Portfolio Composition – continued
| (a) | | Represents the actively managed portion of the portfolio and for purposes of this presentation, components include the value of securities, less any securities sold short. The bond component will include any accrued interest amounts. This also reflects the equivalent exposure of certain derivative positions. These amounts may be negative from time to time. |
| (b) | | Represents the tactical overlay portion of the portfolio which is how the fund manages its exposure to markets and currencies through the use of derivative positions. Percentages reflect the equivalent exposure of those derivative positions. |
| (c) | | For purposes of this presentation, the components include the value of securities, less any securities sold short, and reflect the impact of the equivalent exposure of all derivative positions. These amounts may be negative from time to time. The bond component will include any accrued interest amounts. |
| (d) | | Cash & Cash Equivalents includes any cash, investments in money market funds, short term securities, and other assets less liabilities. Please see the Statement of Assets and Liabilities for additional information related to the fund’s cash position and other assets and liabilities. |
| (e) | | Other includes currency derivatives and/or the offsetting of the leverage produced by the fund’s derivative positions, including payables and/or receivables of the finance leg of interest rate swaps and the unrealized gain or loss in connection with forward currency exchange contracts. |
| (w) | | The strategic asset class allocations have been selected for investment over longer time periods. The actual strategic asset class weightings can deviate due to market movements and cash flows. |
| (z) | | The fund’s net exposures to the asset classes referenced will normally fall within these ranges after taking into account the tactical overlay. |
Equivalent exposure is a calculated amount that translates the derivative position into a reasonable approximation of the amount of the underlying asset that the portfolio would have to hold at a given point in time to have the same price sensitivity that results from the portfolio’s ownership of the derivative contract. When dealing with derivatives, equivalent exposure is a more representative measure of the potential impact of a position on portfolio performance than value. The value of derivatives may be different.
Where the fund holds convertible bonds, they are treated as part of the equity portion of the portfolio.
Percentages are based on net assets as of December 31, 2018.
The portfolio is actively managed and current holdings may be different.
3
MFS Global Tactical Allocation Portfolio
MANAGEMENT REVIEW
Summary of Results
For the twelve months ended December 31, 2018, Initial Class shares of the MFS Global Tactical Allocation Portfolio (“fund”) provided a total return of –4.50%, while Service Class shares of the fund provided a total return of –4.80%. These compare with a return of –1.20% over the same period for the fund’s benchmark, the Bloomberg Barclays Global Aggregate Bond Index. The fund’s other benchmarks, the MSCI World Index (net div) and the MFS Global Tactical Allocation Blended Index (“Blended Index”), generated total returns of –8.71% and –2.11%, respectively. The Blended Index reflects the blended returns of equity and fixed income indices, with percentage allocations to each index designed to resemble the strategic allocations of the fund. The market indices and related percentage allocations used to compile the Blended Index are set forth in the Performance Summary.
The fund’s investment objective is to seek total return. MFS seeks to achieve the fund’s objective by generating returns from a combination of (1) individual security selection of a combination of debt instruments and equity securities and (2) a tactical asset allocation overlay primarily using derivative instruments to manage the fund’s exposure to asset classes (e.g. equity and fixed income), markets (e.g. U.S. and foreign countries), and currencies (e.g. U.S. dollar and Japanese yen). Derivatives include futures, forward contracts, options, structured securities and swaps.
Market Environment
During the reporting period, the US Federal Reserve raised interest rates by 100 basis points, bringing the total number of rate hikes to nine since the central bank began to normalize monetary policy in late 2015. Economic growth rates in the US, Eurozone and Japan remained above trend, despite a slowing in global growth, particularly toward the end of the period. Inflation remained contained, particularly outside the US. Late in the period, the European Central Bank halted its asset purchase program but issued forward guidance that it does not expect to raise interest rates at least until after the summer of 2019. The Bank of England (once) and the Bank of Canada (three times) each raised rates during the period. The European political backdrop became a bit more volatile, late in the period, spurred by concerns over cohesion in the eurozone after the election of an anti-establishment, Eurosceptic coalition government in Italy and widespread protests over stagnant wage growth in France.
Bond yields rose in the US during most of the period, but remained low by historical standards and slipped from their highs, late in the period, as market volatility increased. Yields in many developed markets fell. Outside of emerging markets, where spreads and currencies came under pressure, credit spreads remained quite tight until the end of the period, when thinner liquidity, lower oil prices and concerns over high degrees of corporate leverage emerged. Growing concern over increasing global trade friction appeared to have weighed on business sentiment during the period’s second half, especially outside the US. Tighter financial conditions from rising US rates and a strong dollar, combined with trade uncertainty, helped expose structural weaknesses in several emerging markets in the second half of the period.
Volatility increased, at the end of the period, amid signs of slowing global economic growth and increasing trade tensions, which prompted a market setback shortly after US markets set record highs in September. It was the second such equity market decline during the reporting period. The correction came despite a third consecutive quarter of strong growth in US earnings per share. Strong earnings growth, combined with the market decline, brought US equity valuations down from elevated levels, earlier in the period, to multiples more in line with long-term averages. While the US economy held up better than most, global economic growth became less synchronized during the period, with Europe and China showing signs of a slowdown and some emerging markets coming under stress.
Detractors from Performance
Within the equity portion of the fund, stock selection in theconsumer staples,information technology andconsumer discretionary sectors held back performance relative to the MSCI World Index. Within theconsumer staples sector, overweight positions in tobacco company Philip Morris International and global food company General Mills, as well as the timing of the fund’s ownership in shares of household products maker Procter & Gamble (h), weakened relative results. Within theinformation technology sector, not holding shares of strong-performing software giant Microsoft hindered relative returns. Within theconsumer discretionary sector, not holding shares of internet retailer Amazon.com dampened relative performance as the stock outpaced the benchmark over the reporting period.
Stocks in other sectors that weighed on relative results included the fund’s overweight positions in pharmaceutical company Bayer (Germany), oil field services company Schlumberger, investment management and banking firm UBS (Switzerland) and telecommunications company Vodafone Group (United Kingdom). The timing of the fund’s ownership in shares of pharmaceutical firm Merck & Co. (h) also held back relative performance.
Within the fixed income portion of the fund, currency hedging detracted from performance relative to the Bloomberg Barclays Global Aggregate Bond Index. The fund’s asset allocation decisions also weakened relative returns. Specifically, from a quality perspective, an underweight exposure to “AAA” and “A” rated (r) bonds weighed on relative results. From a sector perspective, the fund’s overweight exposures to thefinancials, utilities andindustrials sectors hindered relative returns.
4
MFS Global Tactical Allocation Portfolio
Management Review – continued
The fund’s tactical overlay detracted from absolute performance, led by its allocation to both Asia Pacific and Emerging Markets equities, via equity index futures, particularly, its long exposures to Hong Kong and Turkey and short exposure to India. A short exposure to the Canadian fixed income market, via fixed income index futures, also slightly weighed on relative returns. Lastly, from a currency perspective, the fund’s long exposure to the Norwegian krone dampened relative results.
Contributors to Performance
Within the equity portion of the fund, stock selection in thematerials,industrials andfinancials sectors strengthened relative performance. Although security selection in thematerials sector supported relative returns, there were no individual stocks within this sector that were among the fund’s top relative contributors during the reporting period. Within theindustrials sector, not owning shares of poor-performing industrial conglomerate General Electric helped relative results. Within thefinancials sector, an overweight position in risk management and human capital consulting services provider Aon benefited relative performance as the stock outpaced the benchmark.
Elsewhere, the fund’s overweight positions in pharmaceutical giant Pfizer, pharmaceutical and medical products maker Abbott Laboratories, utility services provider Exelon, seafood company Mowi (h) (Norway), office and consumer paper products manufacturer Kimberly-Clark, medical device maker Medtronic and pharmaceutical company Eli Lilly supported relative returns. Not holding shares of poor-performing social media company Facebook also helped relative results as the stock lagged the benchmark during the reporting period.
Within the fixed income portion of the fund, yield curve (y) positioning, notably the fund’s shorter duration (d) exposure in the US, where interest rates generally rose, supported relative returns. Additionally, the fund’s active currency positioning was a modestly positive contributor during the reporting period.
Within the fund’s tactical overlay, the fund’s allocation to Brazilian equity markets had the largest positive impact on relative returns. The fund’s allocation to Europeex-UK and North American equity markets also helped absolute returns, most notably, its short exposure to German and Spanish equity markets, and to US small-capitalization stocks. Long exposures to the fixed income markets of Germany and Australia, as well as yield curve positioning within the U.S., further strengthened results. From a currency perspective, short exposures to both the euro and Swiss franc benefited the fund’s performance.
Respectfully,
Portfolio Manager(s)
Nevin Chitkara, Pilar Gomez-Bravo, Steven Gorham, Vipin Narula, Ben Nastou, Robert Persons, Jonathan Sage, Natalie Shapiro, Robert Spector, and Erik Weisman
| (d) | Duration is a measure of how much a bond’s price is likely to fluctuate with general changes in interest rates, e.g., if rates rise 1.00%, a bond with a 5-year duration is likely to lose about 5.00% of its value. |
| (h) | Security was not held in the portfolio at period end. |
| (r) | Bonds rated “BBB”, “Baa”, or higher are considered investment grade; bonds rated “BB”, “Ba”, or below are considerednon-investment grade. The sources for bond quality ratings are Moody’s Investors Service, Standard & Poor’s and Fitch, Inc. and are applied using the following hierarchy: If all three agencies provide a rating, the middle rating (after dropping the highest and lowest ratings) is assigned; if two of the three agencies rate a security, the lower of the two is assigned. Ratings are shown in the S&P and Fitch scale (e.g., AAA). For securities which are not rated by any of the three agencies, the security is considered Not Rated. |
| (y) | A yield curve graphically depicts the yields of different maturity bonds of the same credit quality and type; a normal yield curve is upward sloping, with short-term rates lower than long-term rates. |
Note to Shareholders: Effective June 30, 2018, Pablo De La Mata, Richard Hawkins, and Benjamin Stone are no longer Portfolio Managers of the Fund. Effective February 1, 2019, Andrew Li became a Portfolio Manager of the Fund.
The views expressed in this report are those of the portfolio manager(s) only through the end of the period of the report as stated on the cover and do not necessarily reflect the views of MFS or any other person in the MFS organization. These views are subject to change at any time based on market or other conditions, and MFS disclaims any responsibility to update such views. These views may not be relied upon as investment advice or an indication of trading intent on behalf of any MFS portfolio. References to specific securities are not recommendations of such securities, and may not be representative of any MFS portfolio’s current or future investments.
5
MFS Global Tactical Allocation Portfolio
PERFORMANCE SUMMARY THROUGH 12/31/18
The following chart illustrates the historical performance of the fund in comparison to its benchmark(s). Benchmarks are unmanaged and may not be invested in directly. Benchmark returns do not reflect any fees or expenses. The performance of other share classes will be greater than or less than that of the class depicted below. (See Notes to Performance Summary.)
Performance data shown represents past performance and is no guarantee of future results. Investment return and principal value fluctuate so your units, when sold, may be worth more or less than the original cost; current performance may be lower or higher than quoted. The performance shown does not reflect the deduction of taxes, if any, that a contract holder would pay on fund distributions or the redemption of contract units. The returns for the fund shown also do not reflect the deduction of expenses associated with variable products, such as mortality and expense risk charges, separate account charges, and sales charges imposed by the insurance company separate accounts. Such expenses would reduce the overall returns shown.
Growth of a Hypothetical $10,000 Investment
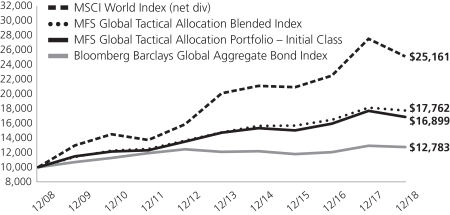
Total Returns through 12/31/18
Average annual total returns
| | | | | | | | | | | | |
| | | Share Class | | Class Inception Date | | 1-yr | | 5-yr | | 10-yr | | |
| | | Initial Class | | 11/07/94 | | (4.50)% | | 2.81% | | 5.39% | | |
| | | Service Class | | 8/24/01 | | (4.80)% | | 2.55% | | 5.11% | | |
| | | | |
| Comparative benchmark(s) | | | | | | | | |
| | | Bloomberg Barclays Global Aggregate Bond Index (f) | | (1.20)% | | 1.08% | | 2.49% | | |
| | | MFS Global Tactical Allocation Blended Index (f)(w) | | (2.11)% | | 3.72% | | 5.91% | | |
| | | Bloomberg Barclays Global Aggregate Bond Index Hedged (f) | | 1.76% | | 3.44% | | 3.78% | | |
| | | MSCI World Index (net div) (f) | | (8.71)% | | 4.56% | | 9.67% | | |
| (f) | | Source: FactSet Research Systems Inc. |
| (w) | | As of December, 31, 2018, MFS Global Tactical Allocation Blended Index was comprised of 35% MSCI World Index (net div), 54% Bloomberg Barclays Global Aggregate Bond Index Hedged, and 11% Bloomberg Barclays Global Aggregate Bond Index. |
Benchmark Definition(s)
Bloomberg Barclays Global Aggregate Bond Index – provides a broad-based measure of the global investment-grade fixed income markets. The three major components of this index are the U.S. Aggregate, the Pan-European Aggregate, and the Asian-Pacific Aggregate Indices. The index also includes Eurodollar and Euro-Yen corporate bonds, Canadian government, agency and corporate securities, and USD investment grade 144A securities.
Bloomberg Barclays Global Aggregate Bond Index Hedged – provides a broad-based measure of the currency-hedged performance of global investment-grade fixed income markets. The three major components of this index are the U.S. Aggregate, thePan-European Aggregate, and the Asian-Pacific Aggregate Indices. The index also includes Eurodollar and Euro-Yen corporate bonds, Canadian government, agency and corporate securities, and USD investment grade 144A securities.
MSCI World Index (net div) – a market capitalization-weighted index that is designed to measure equity market performance in the global developed markets.
6
MFS Global Tactical Allocation Portfolio
Performance Summary – continued
It is not possible to invest directly in an index.
Notes to Performance Summary
Average annual total return represents the average annual change in value for each share class for the periods presented.
Performance results reflect any applicable expense subsidies and waivers in effect during the periods shown. Without such subsidies and waivers the fund’s performance results would be less favorable. Please see the prospectus and financial statements for complete details. All results are historical and assume the reinvestment of any dividends and capital gains distributions.
Performance results do not include adjustments made for financial reporting purposes in accordance with U.S. generally accepted accounting principles and may differ from amounts reported in the financial highlights.
Performance information prior to February 8, 2010 reflects time periods when the fund (i) had a policy of investing between 40% and 75% of its assets in equity securities and at least 25% of its assets in fixed income senior securities and (ii) did not employ a tactical asset allocation overlay. The fund’s investment policies and strategies changed effective February 8, 2010.
From time to time the fund may receive proceeds from litigation settlements, without which performance would be lower.
7
MFS Global Tactical Allocation Portfolio
EXPENSE TABLE
Fund Expenses Borne by the Contract Holders during the Period,
July 1, 2018 through December 31, 2018
As a contract holder of the fund, you incur ongoing costs, including management fees; distribution and/or service(12b-1) fees; and other fund expenses. This example is intended to help you understand your ongoing costs (in dollars) of investing in the fund and to compare these costs with the ongoing costs of investing in other mutual funds.
The example is based on an investment of $1,000 invested at the beginning of the period and held for the entire period July 1, 2018 through December 31, 2018.
Actual Expenses
The first line for each share class in the following table provides information about actual account values and actual expenses. You may use the information in this line, together with the amount you invested, to estimate the expenses that you paid over the period. Simply divide your account value by $1,000 (for example, an $8,600 account value divided by $1,000 = 8.6), then multiply the result by the number in the first line under the heading entitled “Expenses Paid During Period” to estimate the expenses you paid on your account during this period.
Hypothetical Example for Comparison Purposes
The second line for each share class in the following table provides information about hypothetical account values and hypothetical expenses based on the fund’s actual expense ratio and an assumed rate of return of 5% per year before expenses, which is not the fund’s actual return. The hypothetical account values and expenses may not be used to estimate the actual ending account balance or expenses you paid for the period. You may use this information to compare the ongoing costs of investing in the fund and other funds. To do so, compare this 5% hypothetical example with the 5% hypothetical examples that appear in the shareholder reports of the other funds.
Please note that the expenses shown in the table are meant to highlight the fund’s ongoing costs only and do not take into account the fees and expenses imposed under the variable contracts through which your investment in the fund is made. Therefore, the second line for each share class in the table is useful in comparing ongoing costs associated with an investment in vehicles (such as the fund) which fund benefits under variable annuity and variable life insurance contracts and to qualified pension and retirement plans only, and will not help you determine the relative total costs of investing in the fund through variable annuity and variable life insurance contracts. If the fees and expenses imposed under the variable contracts were included, your costs would have been higher.
| | | | | | | | | | | | | | | | | | |
| Share Class | | | | Annualized
Expense Ratio | | | Beginning
Account Value
7/01/18 | | | Ending
Account Value
12/31/18 | | | Expenses Paid
During Period (p)
7/01/18-12/31/18 | |
| Initial Class | | Actual | | | 0.81% | | | | $1,000.00 | | | | $981.16 | | | | $4.04 | |
| | Hypothetical (h) | | | 0.81% | | | | $1,000.00 | | | | $1,021.12 | | | | $4.13 | |
| Service Class | | Actual | | | 1.06% | | | | $1,000.00 | | | | $979.81 | | | | $5.29 | |
| | Hypothetical (h) | | | 1.06% | | | | $1,000.00 | | | | $1,019.86 | | | | $5.40 | |
| (h) | 5% class return per year before expenses. |
| (p) | “Expenses Paid During Period” are equal to each class’s annualized expense ratio, as shown above, multiplied by the average account value over the period, multiplied by 184/365 (to reflect theone-half year period). |
Notes to Expense Table
Expense ratios include 0.03% of interest expense on uncovered collateral or margin obligations with the broker (See Note 2 of the Notes to Financial Statements) that are outside of the expense limitation arrangement (See Note 3 of the Notes to Financial Statements).
8
MFS Global Tactical Allocation Portfolio
PORTFOLIO OF INVESTMENTS – 12/31/18
The Portfolio of Investments is a complete list of all securities owned by your fund. It is categorized by broad-based asset classes.
| | | | | | | | |
| | |
| Issuer | | Shares/Par | | | Value ($) | |
| BONDS – 63.4% | | | | | |
| Aerospace – 0.3% | | | | | |
| Huntington Ingalls Industries, Inc., 3.483%, 12/01/2027 | | $ | 370,000 | | | $ | 344,629 | |
| L3 Technologies, Inc., 3.85%, 6/15/2023 | | | 555,000 | | | | 555,829 | |
| Lockheed Martin Corp., 3.55%, 1/15/2026 | | | 749,000 | | | | 743,585 | |
| Rolls-Royce Holdings PLC, 0.875%, 5/09/2024 | | EUR | 400,000 | | | | 443,000 | |
| | | | | | | | |
| | | | | | $ | 2,087,043 | |
| | | | | | | | |
| Apparel Manufacturers – 0.1% | | | | | | | | |
| Coach, Inc., 4.125%, 7/15/2027 | | $ | 493,000 | | | $ | 461,550 | |
| | | | | | | | |
| Asset-Backed & Securitized – 2.9% | | | | | |
| Chesapeake Funding II LLC,2016-1A, “A2”, FLR, 3.605% (LIBOR - 1mo. + 1.15%), 3/15/2028 (n) | | $ | 451,928 | | | $ | 452,778 | |
| Chesapeake Funding II LLC,2016-2A, “A2”, FLR, 3.455% (LIBOR - 1mo. + 1%), 6/15/2028 (z) | | | 469,764 | | | | 470,944 | |
| CPS Auto Trust,2016-D, “B”, 2.11%, 3/15/2021 (n) | | | 813,126 | | | | 810,737 | |
| Dryden Senior Loan Fund,2013-26A, “AR”, CLO, FLR, 3.336% (LIBOR - 3mo. + 0.9%), 4/15/2029 (z) | | | 1,292,000 | | | | 1,275,881 | |
| Dryden Senior Loan Fund,2018-55A, “A1”, CLO, FLR, 3.456% (LIBOR - 3mo. + 1.02%), 4/15/2031 (n) | | | 2,040,000 | | | | 2,010,465 | |
| Flatiron CLO Ltd.,2013-1A, “A2R”, FLR, 4.098% (LIBOR - 3mo. + 1.65%), 1/17/2026 (n) | | | 1,991,841 | | | | 1,989,823 | |
| Fort Cre LLC,2018-1A, “A1”, FLR, 3.829% (LIBOR - 1mo. + 1.2%), 10/21/2023 (n) | | | 584,500 | | | | 581,444 | |
| JPMBB Commercial Mortgage Securities Trust,2014-C26, 3.494%, 1/15/2048 | | | 2,570,000 | | | | 2,572,813 | |
| Kref Ltd.,2018-FL1, “A”, FLR, 3.402% (LIBOR - 1mo. + 1.1%), 6/15/2036 (z) | | | 773,500 | | | | 773,486 | |
| Magnetite CLO Ltd.,2012-7A, “A1R2”, FLR, 3.236% (LIBOR - 3mo. + 0.8%), 1/15/2028 (n) | | | 1,398,000 | | | | 1,371,857 | |
| Morgan Stanley Capital I Trust,2017-H1, “A5”, 3.53%, 6/15/2050 | | | 659,762 | | | | 652,578 | |
| Octagon Investment Partners XVII Ltd.,2013-1A, “BR2”, FLR, 3.889% (LIBOR - 3mo. + 1.4%), 1/25/2031 (n) | | | 2,275,000 | | | | 2,183,500 | |
| Wells Fargo Commercial Mortgage Trust,2015-C28, “A4”, 3.54%, 5/15/2048 | | | 2,271,943 | | | | 2,274,389 | |
| | | | | | | | |
| | | | | | $ | 17,420,695 | |
| | | | | | | | |
| | | | | | | | |
| | |
| Issuer | | Shares/Par | | | Value ($) | |
| BONDS – continued | | | | | |
| Automotive – 0.7% | | | | | | | | |
| Ferrari N.V., 1.5%, 3/16/2023 | | EUR | 1,100,000 | | | $ | 1,260,158 | |
| General Motors Co., 6.75%, 4/01/2046 | | $ | 312,000 | | | | 302,364 | |
| General Motors Financial Co., Inc., 4.35%, 1/17/2027 | | | 565,000 | | | | 520,316 | |
| Lear Corp., 3.8%, 9/15/2027 | | | 416,000 | | | | 380,215 | |
| Volkswagen Bank GmbH, 0.75%, 6/15/2023 | | EUR | 550,000 | | | | 607,242 | |
| Volkswagen Financial Services AG, 0.875%, 4/12/2023 | | | 500,000 | | | | 556,682 | |
| Volkswagen International Finance N.V., 2.7% to 12/14/2022, FLR (EUR Swap Rate - 5yr. + 2.54%) to 12/14/2027, FLR (EUR Swap Rate - 5yr. + 2.79%) to 12/14/2042, FLR (EUR Swap Rate - 5yr. + 3.54%) to 12/31/2099 | | | 400,000 | | | | 432,062 | |
| Volkswagen International Finance N.V., 3.375% to 6/27/2024, FLR (EUR Swap Rate - 6yr. + 2.97%) to 6/27/2028, FLR (EUR Swap Rate - 6yr. + 2.22%) to 6/27/2044, FLR (EUR Swap Rate - 6yr. + 3.97%) to 12/31/2099 | | | 400,000 | | | | 428,510 | |
| | | | | | | | |
| | | | | | $ | 4,487,549 | |
| | | | | | | | |
| Banks & Diversified Financials (Covered Bonds) – 0.1% | |
| CaixaBank S.A., 1.125%, 1/12/2023 | | EUR | 500,000 | | | $ | 560,921 | |
| | | | | | | | |
| Broadcasting – 0.3% | | | | | | | | |
| RELX Finance B.V., 1%, 3/22/2024 | | EUR | 350,000 | | | $ | 397,676 | |
| SES S.A., 1.625%, 3/22/2026 | | | 500,000 | | | | 552,435 | |
| WPP Finance, 2.875%, 9/14/2046 | | GBP | 440,000 | | | | 421,065 | |
| WPP Finance 2016 Co., 1.375%, 3/20/2025 | | EUR | 330,000 | | | | 365,926 | |
| | | | | | | | |
| | | | | | $ | 1,737,102 | |
| | | | | | | | |
| Brokerage & Asset Managers – 0.5% | | | | | |
| Charles Schwab Corp., 3.85%, 5/21/2025 | | $ | 596,000 | | | $ | 608,195 | |
| E*TRADE Financial Corp., 2.95%, 8/24/2022 | | | 499,000 | | | | 484,082 | |
| Euroclear Investments S.A., 2.625% to 4/11/2028, FLR (EUR Swap Rate - 5yr. + 2.625%) to 4/11/2048 | | EUR | 300,000 | | | | 335,132 | |
| Intercontinental Exchange, Inc., 3.75%, 12/01/2025 | | $ | 831,000 | | | | 835,026 | |
| TD Ameritrade Holding Corp., 2.95%, 4/01/2022 | | | 676,000 | | | | 668,717 | |
| | | | | | | | |
| | | | | | $ | 2,931,152 | |
| | | | | | | | |
| Building – 0.2% | | | | | |
| Martin Marietta Materials, Inc., 4.25%, 7/02/2024 | | $ | 367,000 | | | $ | 371,407 | |
9
MFS Global Tactical Allocation Portfolio
Portfolio of Investments – continued
| | | | | | | | |
| | |
| Issuer | | Shares/Par | | | Value ($) | |
| BONDS – continued | | | | | |
| Building – continued | | | | | |
| Martin Marietta Materials, Inc., 3.45%, 6/01/2027 | | $ | 339,000 | | | $ | 313,296 | |
| Martin Marietta Materials, Inc., 3.5%, 12/15/2027 | | | 446,000 | | | | 406,870 | |
| | | | | | | | |
| | | | | | $ | 1,091,573 | |
| | | | | | | | |
| Business Services – 0.2% | | | | | |
| Fidelity National Information Services, Inc., 3.875%, 6/05/2024 | | $ | 179,000 | | | $ | 178,788 | |
| Fidelity National Information Services, Inc., 5%, 10/15/2025 | | | 108,000 | | | | 112,393 | |
| Fidelity National Information Services, Inc., 3%, 8/15/2026 | | | 758,000 | | | | 697,700 | |
| | | | | | | | |
| | | | | | $ | 988,881 | |
| | | | | | | | |
| Cable TV – 0.3% | | | | | |
| Charter Communications Operating LLC/Charter Communications Operating Capital Corp., 6.384%, 10/23/2035 | | $ | 332,000 | | | $ | 341,087 | |
| Cox Communications, Inc., 3.25%, 12/15/2022 (n) | | | 498,000 | | | | 486,475 | |
| Shaw Communications, Inc., 5.65%, 10/01/2019 | | CAD | 674,000 | | | | 504,335 | |
| Sky PLC, 2.5%, 9/15/2026 | | EUR | 550,000 | | | | 668,767 | |
| | | | | | | | |
| | | | | | $ | 2,000,664 | |
| | | | | | | | |
| Chemicals – 0.3% | | | | | |
| Air Liquide Finance Co., 2.25%, 9/27/2023 (n) | | $ | 727,000 | | | $ | 693,234 | |
| International Flavors & Fragrances, Inc., 1.8%, 9/25/2026 | | EUR | 240,000 | | | | 274,256 | |
| Sasol Chemicals (USA) LLC, 5.875%, 3/27/2024 | | $ | 694,000 | | | | 692,490 | |
| | | | | | | | |
| | | | | | $ | 1,659,980 | |
| | | | | | | | |
| Computer Software – 0.2% | | | | | |
| Microsoft Corp., 4.1%, 2/06/2037 | | $ | 824,000 | | | $ | 847,152 | |
| Ubisoft Entertainment S.A., 1.289%, 1/30/2023 | | EUR | 300,000 | | | | 340,413 | |
| | | | | | | | |
| | | | | | $ | 1,187,565 | |
| | | | | | | | |
| Computer Software – Systems – 0.2% | | | | | |
| Apple, Inc., 4.5%, 2/23/2036 | | $ | 900,000 | | | $ | 954,325 | |
| Apple, Inc., 3.6%, 7/31/2042 | | GBP | 200,000 | | | | 288,713 | |
| Apple, Inc., 4.25%, 2/09/2047 | | $ | 225,000 | | | | 224,539 | |
| | | | | | | | |
| | | | | | $ | 1,467,577 | |
| | | | | | | | |
| Conglomerates – 0.2% | | | | | |
| Smiths Group PLC, 2%, 2/23/2027 | | EUR | 300,000 | | | $ | 338,786 | |
| United Technologies Corp., 4.45%, 11/16/2038 | | $ | 504,000 | | | | 489,448 | |
| United Technologies Corp., 4.625%, 11/16/2048 | | | 190,000 | | | | 183,738 | |
| Wabtec Corp., 4.7%, 9/15/2028 | | | 355,000 | | | | 333,138 | |
| | | | | | | | |
| | | | | | $ | 1,345,110 | |
| | | | | | | | |
| | | | | | | | |
| | |
| Issuer | | Shares/Par | | | Value ($) | |
| BONDS – continued | | | | | |
| Consumer Products – 0.4% | | | | | |
| JAB Holdings B.V., 2%, 5/18/2028 | | EUR | 600,000 | | | $ | 676,805 | |
| JAB Holdings B.V., 2.5%, 6/25/2029 | | | 600,000 | | | | 695,474 | |
| Reckitt Benckiser Treasury Services PLC, 3.625%, 9/21/2023 (n) | | $ | 577,000 | | | | 580,680 | |
| Reckitt Benckiser Treasury Services PLC, 3%, 6/26/2027 (n) | | | 425,000 | | | | 395,140 | |
| | | | | | | | |
| | | | | | $ | 2,348,099 | |
| | | | | | | | |
| Consumer Services – 0.5% | | | | | |
| Bookings Holdings, Inc., 1.8%, 3/03/2027 | | EUR | 600,000 | | | $ | 689,739 | |
| G4S International Finance PLC, 1.5%, 1/09/2023 | | | 400,000 | | | | 456,908 | |
| ManpowerGroup, 1.75%, 6/22/2026 | | | 400,000 | | | | 458,600 | |
| Priceline Group, Inc., 3.55%, 3/15/2028 | | $ | 356,000 | | | | 333,489 | |
| Visa, Inc., 4.15%, 12/14/2035 | | | 585,000 | | | | 605,652 | |
| Visa, Inc., 3.65%, 9/15/2047 | | | 390,000 | | | | 367,710 | |
| | | | | | | | |
| | | | | | $ | 2,912,098 | |
| | | | | | | | |
| Electronics – 0.2% | | | | | | | | |
| ASML Holding N.V., 1.375%, 7/07/2026 | | EUR | 800,000 | | | $ | 923,338 | |
| Broadcom Corp./Broadcom Cayman Finance Ltd., 3.875%, 1/15/2027 | | $ | 471,000 | | | | 422,814 | |
| | | | | | | | |
| | | | | | $ | 1,346,152 | |
| | | | | | | | |
| Emerging Market Quasi-Sovereign – 1.1% | | | | | |
| CNPC General Capital Ltd., 3.4%, 4/16/2023 (n) | | $ | 2,183,000 | | | $ | 2,160,376 | |
| Office Cherifien des Phosphates, 6.875%, 4/25/2044 (n) | | | 1,570,000 | | | | 1,629,660 | |
| Petroleos Mexicanos, 1.875%, 4/21/2022 | | EUR | 250,000 | | | | 269,944 | |
| PT Pertamina Persero, 6%, 5/03/2042 (n) | | $ | 2,084,000 | | | | 2,073,939 | |
| PT Perusahaan Listrik Negara, 2.875%, 10/25/2025 (n) | | EUR | 400,000 | | | | 454,840 | |
| | | | | | | | |
| | | | | | $ | 6,588,759 | |
| | | | | | | | |
| Emerging Market Sovereign – 1.1% | | | | | |
| Republic of Hungary, 5.375%, 2/21/2023 | | $ | 1,972,000 | | | $ | 2,087,855 | |
| Republic of Indonesia, 2.875%, 7/08/2021 (n) | | EUR | 500,000 | | | | 602,091 | |
| Republic of Indonesia, 8.25%, 5/15/2029 | | IDR | 42,896,000,000 | | | | 3,048,692 | |
| United Mexican States, 4.6%, 2/10/2048 | | $ | 829,000 | | | | 735,737 | |
| | | | | | | | |
| | | | | | $ | 6,474,375 | |
| | | | | | | | |
| Energy – Independent – 0.3% | | | | | |
| Tengizchevroil Finance Co. International Ltd., 4%, 8/15/2026 (n) | | $ | 2,260,000 | | | $ | 2,084,353 | |
| | | | | | | | |
| Energy – Integrated – 0.1% | | | | | | | | |
| Eni S.p.A., 4%, 9/12/2023 (n) | | $ | 322,000 | | | $ | 317,042 | |
| | | | | | | | |
10
MFS Global Tactical Allocation Portfolio
Portfolio of Investments – continued
| | | | | | | | |
| | |
| Issuer | | Shares/Par | | | Value ($) | |
| BONDS – continued | | | | | |
| Financial Institutions – 0.2% | | | | | | | | |
| AerCap Ireland Capital Ltd., 3.65%, 7/21/2027 | | $ | 973,000 | | | $ | 843,276 | |
| EXOR N.V., 1.75%, 1/18/2028 | | EUR | 450,000 | | | | 487,344 | |
| | | | | | | | |
| | | | | | $ | 1,330,620 | |
| | | | | | | | |
| Food & Beverages – 0.3% | | | | | | | | |
| Anheuser-Busch InBev N.V., 1.5%, 4/18/2030 | | EUR | 400,000 | | | $ | 429,595 | |
| Anheuser-Busch InBev Worldwide, Inc., 3.75%, 1/15/2022 | | $ | 342,000 | | | | 342,237 | |
| Anheuser-Busch InBev Worldwide, Inc., 4.375%, 4/15/2038 | | | 201,000 | | | | 179,530 | |
| Constellation Brands, Inc., 4.4%, 11/15/2025 | | | 586,000 | | | | 587,424 | |
| Kraft Heinz Foods Co., 5.2%, 7/15/2045 | | | 77,000 | | | | 70,447 | |
| Kraft Heinz Foods Co., 4.375%, 6/01/2046 | | | 230,000 | | | | 189,726 | |
| | | | | | | | |
| | | | | | $ | 1,798,959 | |
| | | | | | | | |
| Gaming & Lodging – 0.1% | | | | | | | | |
| InterContinental Hotels Group PLC, 3.75%, 8/14/2025 | | GBP | 260,000 | | | $ | 344,067 | |
| | | | | | | | |
| Industrial – 0.1% | | | | | | | | |
| Grainger PLC, 3.375%, 4/24/2028 | | GBP | 280,000 | | | $ | 350,573 | |
| Investor AB, 1.5%, 9/12/2030 | | EUR | 400,000 | | | | 462,551 | |
| | | | | | | | |
| | | | | | $ | 813,124 | |
| | | | | | | | |
| Insurance – 0.3% | | | | | |
| American International Group, Inc., 1.875%, 6/21/2027 | | EUR | 480,000 | | | $ | 522,820 | |
| Argentum Zurich Insurance, 3.5%, 10/01/2046 | | | 400,000 | | | | 472,477 | |
| NN Group N.V., 4.625%, 4/08/2044 | | | 500,000 | | | | 601,483 | |
| | | | | | | | |
| | | | | | $ | 1,596,780 | |
| | | | | | | | |
| Insurance – Health – 0.2% | | | | | | | | |
| Aetna, Inc., 2.8%, 6/15/2023 | | $ | 850,000 | | | $ | 808,307 | |
| Halfmoon Parent, Inc., 4.125%, 11/15/2025 (n) | | | 510,000 | | | | 509,518 | |
| | | | | | | | |
| | | | | | $ | 1,317,825 | |
| | | | | | | | |
| Insurance – Property & Casualty – 0.7% | | | | | |
| Berkshire Hathaway, Inc., 2.75%, 3/15/2023 | | $ | 636,000 | | | $ | 624,308 | |
| Berkshire Hathaway, Inc., 4.5%, 2/11/2043 | | | 400,000 | | | | 416,161 | |
| Chubb INA Holdings, Inc., 2.3%, 11/03/2020 | | | 267,000 | | | | 263,183 | |
| Chubb INA Holdings, Inc., 2.5%, 3/15/2038 | | EUR | 320,000 | | | | 360,682 | |
| Hiscox Ltd., 6.125%, 11/24/2045 | | GBP | 300,000 | | | | 391,940 | |
| Liberty Mutual Group, Inc., 4.25%, 6/15/2023 | | $ | 839,000 | | | | 845,842 | |
| Marsh & McLennan Cos., Inc., 4.35%, 1/30/2047 | | | 359,000 | | | | 335,251 | |
| | | | | | | | |
| | |
| Issuer | | Shares/Par | | | Value ($) | |
| BONDS – continued | | | | | |
| Insurance – Property & Casualty – continued | | | | | |
| QBE Capital Funding III Ltd., 7.5%, 5/24/2041 | | GBP | 400,000 | | | $ | 543,770 | |
| XLIT Ltd., 3.25% to 6/29/2027, FLR (EURIBOR - 3mo. + 2.9%) to 6/29/2047 | | EUR | 610,000 | | | | 675,755 | |
| | | | | | | | |
| | | | | | $ | 4,456,892 | |
| | | | | | | | |
| International Market Quasi-Sovereign – 0.6% | | | | | |
| Bank of Iceland, 1.75%, 9/07/2020 | | EUR | 400,000 | | | $ | 466,226 | |
| Landsbanki Islands HF, 1.125% to 1/19/2023, FLR (EUR Swap Rate - 1yr. + 0.75%) to 1/19/2024 | | | 350,000 | | | | 391,316 | |
| Temasek Financial I Ltd., 2.375%, 1/23/2023 (n) | | $ | 2,880,000 | | | | 2,788,884 | |
| | | | | | | | |
| | | | | | $ | 3,646,426 | |
| | | | | | | | |
| International Market Sovereign – 21.2% | | | | | |
| Bundesrepublik Deutschland, 0.25%, 8/15/2028 | | EUR | 1,965,000 | | | $ | 2,252,943 | |
| Commonwealth of Australia, 2.75%, 11/21/2028 | | AUD | 4,570,000 | | | | 3,338,061 | |
| Federal Republic of Germany, 2.5%, 7/04/2044 | | EUR | 4,480,000 | | | | 7,127,534 | |
| Federal Republic of Germany, 2.5%, 8/15/2046 | | | 1,203,000 | | | | 1,940,384 | |
| Government of Canada, 1.5%, 6/01/2023 | | CAD | 12,250,000 | | | | 8,826,335 | |
| Government of Canada, 1.5%, 6/01/2026 | | | 12,026,000 | | | | 8,543,728 | |
| Government of Canada, 5.75%, 6/01/2033 | | | 5,894,000 | | | | 6,283,767 | |
| Government of Japan, 1.7%, 9/20/2032 | | JPY | 745,300,000 | | | | 8,165,015 | |
| Government of Japan, 2.4%, 3/20/2037 | | | 330,350,000 | | | | 4,042,203 | |
| Government of Japan, 0.5%, 6/20/2038 | | | 1,861,300,000 | | | | 16,982,739 | |
| Government of Norway, 2%, 4/26/2028 | | NOK | 38,495,000 | | | | 4,540,242 | |
| Kingdom of Spain, 2.75%, 10/31/2024 | | EUR | 1,296,000 | | | | 1,662,765 | |
| Kingdom of Spain, 5.15%, 10/31/2028 | | | 6,861,000 | | | | 10,539,290 | |
| Republic of Italy, 5.5%, 9/01/2022 | | | 3,777,000 | | | | 4,957,874 | |
| Republic of Italy, 2.5%, 12/01/2024 | | | 9,459,000 | | | | 11,110,712 | |
| Republic of Italy, 2%, 2/01/2028 | | | 1,048,000 | | | | 1,148,456 | |
| Republic of Italy, 1.65%, 3/01/2032 | | | 3,811,000 | | | | 3,779,976 | |
| Republic of Portugal, 2.875%, 10/15/2025 | | | 4,020,000 | | | | 5,125,000 | |
| Republic of Portugal, 2.125%, 10/17/2028 | | | 7,662,000 | | | | 9,091,081 | |
| Republic of Portugal, 4.1%, 4/15/2037 | | | 715,000 | | | | 995,505 | |
| United Kingdom Treasury, 3.25%, 1/22/2044 | | GBP | 2,497,000 | | | | 4,068,032 | |
11
MFS Global Tactical Allocation Portfolio
Portfolio of Investments – continued
| | | | | | | | |
| | |
| Issuer | | Shares/Par | | | Value ($) | |
| BONDS – continued | | | | | |
| International Market Sovereign – continued | | | | | |
| United Kingdom Treasury, 3.75%, 7/22/2052 | | GBP | 1,659,000 | | | $ | 3,167,739 | |
| United Kingdom Treasury, 4%, 1/22/2060 | | | 344,000 | | | | 729,720 | |
| | | | | | | | |
| | | | | | $ | 128,419,101 | |
| | | | | | | | |
| Local Authorities – 0.2% | | | | | | | | |
| Province of Alberta, 4.5%, 12/01/2040 | | CAD | 665,000 | | | $ | 578,353 | |
| Province of British Columbia, 2.3%, 6/18/2026 | | | 965,000 | | | | 690,535 | |
| | | | | | | | |
| | | | | | $ | 1,268,888 | |
| | | | | | | | |
| Major Banks – 3.0% | | | | | | | | |
| Bank of America Corp., 2.625%, 4/19/2021 | | $ | 972,000 | | | $ | 958,745 | |
| Bank of America Corp., 3.004%, 12/20/2023 | | | 745,000 | | | | 723,288 | |
| Bank of America Corp., 3.5%, 4/19/2026 | | | 1,274,000 | | | | 1,227,028 | |
| Bank of America Corp., 3.248%, 10/21/2027 | | | 1,280,000 | | | | 1,183,677 | |
| Bank of New York Mellon Corp., 2.95%, 1/29/2023 | | | 1,051,000 | | | | 1,034,400 | |
| Barclays Bank PLC, 6%, 1/14/2021 | | EUR | 548,000 | | | | 675,862 | |
| Credit Agricole S.A., 7.375%, 12/18/2023 | | GBP | 300,000 | | | | 468,870 | |
| Credit Suisse Group AG, 6.5%, 8/08/2023 (n) | | $ | 1,265,000 | | | | 1,318,762 | |
| Credit Suisse Group AG, 1.25% to 7/17/2024, FLR (EUR Swap Rate - 1yr. + 0.75%) to 7/17/2025 | | EUR | 400,000 | | | | 447,814 | |
| Goldman Sachs Group, Inc., 5.75%, 1/24/2022 | | $ | 1,486,000 | | | | 1,555,828 | |
| HSBC Holdings PLC, 4.375%, 11/23/2026 | | | 743,000 | | | | 719,683 | |
| JPMorgan Chase & Co., 2.95%, 10/01/2026 | | | 1,647,000 | | | | 1,521,861 | |
| JPMorgan Chase & Co., 3.54% to 5/01/2027, FLR (LIBOR - 3mo. + 1.38%) to 5/01/2028 | | | 745,000 | | | | 710,760 | |
| Morgan Stanley, 5.5%, 7/28/2021 | | | 850,000 | | | | 890,107 | |
| Morgan Stanley, 3.95%, 4/23/2027 | | | 636,000 | | | | 599,944 | |
| Nationwide Building Society, 1.5% to 3/08/2025, FLR (EURIBOR - 3mo. + 0.93%) to 3/08/2026 | | EUR | 200,000 | | | | 217,459 | |
| Royal Bank of Scotland Group PLC, 3.875%, 9/12/2023 | | $ | 433,000 | | | | 415,085 | |
| Sumitomo Mitsui Financial Group, Inc., 3.544%, 1/17/2028 | | | 1,096,000 | | | | 1,065,207 | |
| Svenska Handelsbanken AB, 5.25% to 3/01/2021, FLR (Swap Rate - 5yr. + 3.335%) to 12/29/2049 | | | 606,000 | | | | 583,275 | |
| UBS Group Funding (Jersey) Ltd., 1.5%, 11/30/2024 | | EUR | 500,000 | | | | 576,128 | |
| | | | | | | | |
| | |
| Issuer | | Shares/Par | | | Value ($) | |
| BONDS – continued | | | | | |
| Major Banks – continued | | | | | | | | |
| UBS Group Funding (Switzerland) AG, 2.859% to 8/15/2022, FLR (LIBOR - 3mo. + 0.954%) to 8/15/2023 (n) | | $ | 1,179,000 | | | $ | 1,133,887 | |
| | | | | | | | |
| | | | | | $ | 18,027,670 | |
| | | | | | | | |
| Medical & Health Technology & Services – 0.7% | | | | | |
| Becton, Dickinson and Co., 1.401%, 5/24/2023 | | EUR | 700,000 | | | $ | 807,485 | |
| Becton, Dickinson and Co., 3.734%, 12/15/2024 | | $ | 619,000 | | | | 597,904 | |
| Laboratory Corp. of America Holdings, 3.2%, 2/01/2022 | | | 1,025,000 | | | | 1,017,197 | |
| Laboratory Corp. of America Holdings, 4.7%, 2/01/2045 | | | 141,000 | | | | 131,432 | |
| Northwell Healthcare, Inc., 3.979%, 11/01/2046 | | | 101,000 | | | | 92,139 | |
| Northwell Healthcare, Inc., 4.26%, 11/01/2047 | | | 754,000 | | | | 717,612 | |
| Thermo Fisher Scientific, Inc., 2.95%, 9/19/2026 | | | 394,000 | | | | 363,794 | |
| Thermo Fisher Scientific, Inc., 3.2%, 8/15/2027 | | | 800,000 | | | | 743,921 | |
| | | | | | | | |
| | | | | | $ | 4,471,484 | |
| | | | | | | | |
| Medical Equipment – 0.1% | | | | | | | | |
| Abbott Laboratories, 4.9%, 11/30/2046 | | $ | 593,000 | | | $ | 623,331 | |
| | | | | | | | |
| Metals & Mining – 0.1% | | | | | |
| Cameco Corp., 5.67%, 9/02/2019 | | CAD | 679,000 | | | $ | 505,395 | |
| | | | | | | | |
| Midstream – 0.5% | | | | | | | | |
| APT Pipelines Ltd., 5%, 3/23/2035 (n) | | $ | 705,000 | | | $ | 710,359 | |
| MPLX LP, 4.5%, 4/15/2038 | | | 449,000 | | | | 392,559 | |
| ONEOK, Inc., 4.95%, 7/13/2047 | | | 1,191,000 | | | | 1,101,672 | |
| Sabine Pass Liquefaction LLC, 4.2%, 3/15/2028 | | | 890,000 | | | | 851,802 | |
| | | | | | | | |
| | | | | | $ | 3,056,392 | |
| | | | | | | | |
| Mortgage-Backed – 8.9% | | | | | | | | |
| Fannie Mae, 4.6%, 9/01/2019 | | $ | 560,726 | | | $ | 565,679 | |
| Fannie Mae, 4.45%, 10/01/2019 | | | 387,962 | | | | 391,768 | |
| Fannie Mae,5%, 12/01/2020 - 8/01/2040 | | | 2,261,506 | | | | 2,404,212 | |
Fannie Mae,
4.5%, 7/01/2023 - 2/01/2046 | | | 7,929,107 | | | | 8,298,569 | |
| Fannie Mae, 4%,3/01/2025 - 2/01/2041 | | | 4,123,611 | | | | 4,241,944 | |
Fannie Mae,
5.5%, 11/01/2036 - 4/01/2037 | | | 177,394 | | | | 191,091 | |
| Fannie Mae, 6%,9/01/2037 - 6/01/2038 | | | 304,517 | | | | 331,345 | |
Fannie Mae,
3.5%, 5/01/2043 - 1/01/2047 | | | 3,743,177 | | | | 3,764,505 | |
| Freddie Mac, 5.085%, 3/25/2019 | | | 24,985 | | | | 24,965 | |
12
MFS Global Tactical Allocation Portfolio
Portfolio of Investments – continued
| | | | | | | | |
| | |
| Issuer | | Shares/Par | | | Value ($) | |
| BONDS – continued | | | | | |
| Mortgage-Backed – continued | | | | | | | | |
| Freddie Mac, 4.186%, 8/25/2019 | | $ | 650,000 | | | $ | 651,774 | |
| Freddie Mac, 2.757%, 5/25/2020 | | | 11,549 | | | | 11,524 | |
| Freddie Mac, 3.32%, 7/25/2020 | | | 56,119 | | | | 56,012 | |
| Freddie Mac, 3.064%, 8/25/2024 | | | 2,767,003 | | | | 2,774,773 | |
| Freddie Mac, 4%, 7/01/2025 | | | 134,717 | | | | 138,190 | |
| Freddie Mac, 3.224%, 3/25/2027 | | | 4,000,000 | | | | 3,992,283 | |
| Freddie Mac, 3.243%, 4/25/2027 | | | 2,270,000 | | | | 2,266,238 | |
| Freddie Mac, 3.117%, 6/25/2027 | | | 1,036,027 | | | | 1,024,593 | |
| Freddie Mac, 3.194%, 7/25/2027 | | | 6,520,000 | | | | 6,476,557 | |
| Freddie Mac, 3.244%, 8/25/2027 | | | 2,367,000 | | | | 2,357,783 | |
| Freddie Mac, 3.187%, 9/25/2027 | | | 5,222,000 | | | | 5,173,622 | |
| Freddie Mac, 3.286%, 11/25/2027 | | | 1,303,000 | | | | 1,299,168 | |
| Freddie Mac, 3.35%, 1/25/2028 | | | 2,001,000 | | | | 2,004,361 | |
Freddie Mac,
5.5%, 5/01/2034 - 7/01/2037 | | | 47,324 | | | | 50,778 | |
Freddie Mac,
5%, 10/01/2036 - 7/01/2041 | | | 847,934 | | | | 900,868 | |
Freddie Mac,
4.5%, 12/01/2039 -5/01/2042 | | | 1,484,437 | | | | 1,554,710 | |
| Freddie Mac, 3.5%, 1/01/2047 | | | 1,483,806 | | | | 1,487,099 | |
| Ginnie Mae, 5%, 5/15/2040 | | | 133,783 | | | | 140,044 | |
| Ginnie Mae, 3.5%, 6/20/2043 | | | 1,219,534 | | | | 1,234,197 | |
| | | | | | | | |
| | | | | | $ | 53,808,652 | |
| | | | | | | | |
| Municipals – 0.1% | | | | | |
| Commonwealth of Puerto Rico, Public Improvement,“C-7”, NATL, 6%, 7/01/2027 | | $ | 55,000 | | | $ | 56,855 | |
| Oklahoma Development Finance Authority, Health System Rev. (OU Medicine Project), “C”, 4.65%, 8/15/2030 | | | 572,000 | | | | 609,884 | |
| Puerto Rico Electric Power Authority Rev., “PP”, NATL, 5%, 7/01/2022 | | | 245,000 | | | | 246,548 | |
| | | | | | | | |
| | | | | | $ | 913,287 | |
| | | | | | | | |
| Natural Gas – Distribution – 0.2% | | | | | |
| GNL Quintero S.A., 4.634%, 7/31/2029 (n) | | $ | 1,420,000 | | | $ | 1,370,300 | |
| | | | | | | | |
| Network & Telecom – 0.6% | | | | | | | | |
| AT&T, Inc., 4.75%, 5/15/2046 | | $ | 602,000 | | | $ | 535,793 | |
| British Telecommunications PLC, 3.125%, 11/21/2031 | | GBP | 250,000 | | | | 305,352 | |
| Deutsche Telekom International Finance B.V., 1.5%, 4/03/2028 | | EUR | 500,000 | | | | 567,051 | |
| Empresa Nacional de Telecomunicaciones S.A., 4.75%, 8/01/2026 (n) | | $ | 2,129,000 | | | | 2,000,737 | |
| | | | | | | | |
| | | | | | $ | 3,408,933 | |
| | | | | | | | |
| Oil Services – 0.1% | | | | | | | | |
| Schlumberger Ltd., 2.65%, 11/20/2022 (n) | | $ | 780,000 | | | $ | 756,946 | |
| | | | | | | | |
| | | | | | | | |
| | |
| Issuer | | Shares/Par | | | Value ($) | |
| BONDS – continued | | | | | |
| Oils – 0.3% | | | | | | | | |
| Marathon Petroleum Corp., 3.625%, 9/15/2024 | | $ | 500,000 | | | $ | 486,485 | |
| Neste Oyj, 1.5%, 6/07/2024 | | EUR | 500,000 | | | | 579,102 | |
| Phillips 66, 4.875%, 11/15/2044 | | $ | 795,000 | | | | 774,076 | |
| | | | | | | | |
| | | | | | $ | 1,839,663 | |
| | | | | | | | |
| Other Banks & Diversified Financials – 0.7% | | | | | |
| Belfius Bank S.A., 3.125%, 5/11/2026 | | EUR | 300,000 | | | $ | 351,844 | |
| BPCE S.A., 0.625%, 9/26/2023 | | | 300,000 | | | | 342,392 | |
| BPCE S.A., 5.25%, 4/16/2029 | | GBP | 400,000 | | | | 573,109 | |
| Deutsche Bank AG, 1.875%, 2/28/2020 | | | 200,000 | | | | 251,400 | |
| Groupe BPCE S.A., 4.5%, 3/15/2025 (n) | | $ | 384,000 | | | | 371,771 | |
| Intesa Sanpaolo S.p.A., 5.25%, 1/28/2022 | | GBP | 450,000 | | | | 599,989 | |
| Intesa Sanpaolo S.p.A., 2.125%, 8/30/2023 | | EUR | 400,000 | | | | 460,000 | |
| KBC Group N.V., 0.875%, 6/27/2023 | | | 200,000 | | | | 228,644 | |
| Macquarie Group Ltd., 1.25% to 3/05/2024, FLR (EURIBOR - 3mo. + 0.83%) to 3/05/2025 | | | 300,000 | | | | 332,165 | |
| UniCredit S.p.A., 1%, 1/18/2023 | | | 800,000 | | | | 857,223 | |
| | | | | | | | |
| | | | | | $ | 4,368,537 | |
| | | | | | | | |
| Pharmaceuticals – 0.3% | | | | | |
| Allergan Funding SCS, 2.625%, 11/15/2028 | | EUR | 320,000 | | | $ | 370,930 | |
| Bayer Capital Corp. B.V., 1.5%, 6/26/2026 | | | 500,000 | | | | 556,404 | |
| Takeda Pharmaceutical Co. Ltd., 1.125%, 11/21/2022 (z) | | | 370,000 | | | | 426,652 | |
| Takeda Pharmaceutical Co. Ltd., 2.25%, 11/21/2026 (z) | | | 450,000 | | | | 526,198 | |
| | | | | | | | |
| | | | | | $ | 1,880,184 | |
| | | | | | | | |
| Pollution Control – 0.1% | | | | | | | | |
| Republic Services, Inc., 3.95%, 5/15/2028 | | $ | 637,000 | | | $ | 637,799 | |
| | | | | | | | |
| Real Estate – Apartment – 0.1% | | | | | |
| Grand City Properties S.A., 1.375%, 8/03/2026 | | EUR | 700,000 | | | $ | 743,070 | |
| | | | | | | | |
| Real Estate – Office – 0.2% | | | | | | | | |
| Merlin Properties SOCIMI S.A., REIT, 2.225%, 4/25/2023 | | EUR | 600,000 | | | $ | 706,590 | |
| Merlin Properties SOCIMI S.A., REIT, 1.875%, 11/02/2026 | | | 350,000 | | | | 381,969 | |
| | | | | | | | |
| | | | | | $ | 1,088,559 | |
| | | | | | | | |
| Retailers – 0.4% | | | | | | | | |
| Best Buy Co., Inc., 5.5%, 3/15/2021 | | $ | 1,107,000 | | | $ | 1,141,423 | |
| Home Depot, Inc., 2.625%, 6/01/2022 | | | 695,000 | | | | 687,679 | |
| Home Depot, Inc., 3%, 4/01/2026 | | | 830,000 | | | | 802,783 | |
| | | | | | | | |
| | | | | | $ | 2,631,885 | |
| | | | | | | | |
13
MFS Global Tactical Allocation Portfolio
Portfolio of Investments – continued
| | | | | | | | |
| | |
| Issuer | | Shares/Par | | | Value ($) | |
| BONDS – continued | | | | | |
| Specialty Stores – 0.1% | | | | | | | | |
| Richemont International S.A., 1.5%, 3/26/2030 | | EUR | 400,000 | | | $ | 454,939 | |
| | | | | | | | |
| Supermarkets – 0.1% | | | | | | | | |
| Esselunga S.p.A., 0.875%, 10/25/2023 | | EUR | 350,000 | | | $ | 394,241 | |
| Loblaw Cos. Ltd., 4.86%, 9/12/2023 | | CAD | 680,000 | | | | 526,208 | |
| | | | | | | | |
| | | | | | $ | 920,449 | |
| | | | | | | | |
| Supranational – 0.8% | | | | | | | | |
| European Stability Mechanism, 0.75%, 3/15/2027 | | EUR | 3,450,000 | | | $ | 4,013,710 | |
| International Bank for Reconstruction and Development, 2.8%, 1/13/2021 | | AUD | 420,000 | | | | 299,110 | |
| International Bank for Reconstruction and Development, 4.25%, 6/24/2025 | | | 465,000 | | | | 359,306 | |
| | | | | | | | |
| | | | | | $ | 4,672,126 | |
| | | | | | | | |
| Telecommunications – Wireless – 0.5% | | | | | |
| American Tower Corp., REIT, 4.7%, 3/15/2022 | | $ | 327,000 | | | $ | 335,827 | |
| American Tower Corp., REIT, 3.5%, 1/31/2023 | | | 812,000 | | | | 797,967 | |
| Crown Castle International Corp., 2.25%, 9/01/2021 | | | 1,072,000 | | | | 1,036,387 | |
| Crown Castle International Corp., 3.7%, 6/15/2026 | | | 425,000 | | | | 405,634 | |
| SBA Tower Trust, 2.898%, 10/15/2044 (n) | | | 349,000 | | | | 346,949 | |
| | | | | | | | |
| | | | | | $ | 2,922,764 | |
| | | | | | | | |
| Telephone Services – 0.1% | | | | | |
| TELUS Corp., 5.05%, 7/23/2020 | | CAD | 687,000 | | | $ | 520,468 | |
| | | | | | | | |
| Tobacco – 0.1% | | | | | |
| B.A.T. International Finance PLC, 0.875%, 10/13/2023 | | EUR | 500,000 | | | $ | 556,677 | |
| Imperial Brands Finance PLC, 1.375%, 1/27/2025 | | | 300,000 | | | | 328,716 | |
| | | | | | | | |
| | | | | | $ | 885,393 | |
| | | | | | | | |
| Transportation – Services – 0.5% | | | | | |
| Autostrade per l’Italia S.p.A., 6.25%, 6/09/2022 | | GBP | 250,000 | | | $ | 333,896 | |
| Compagnie Financial et Indus Unternehmensanleihe, 0.75%, 9/09/2028 | | EUR | 500,000 | | | | 534,741 | |
| ERAC USA Finance LLC, 7%, 10/15/2037 (n) | | $ | 574,000 | | | | 714,317 | |
| Heathrow Funding Ltd., 1.875%, 7/12/2032 | | EUR | 300,000 | | | | 326,614 | |
| Heathrow Funding Ltd., 4.625%, 10/31/2046 | | GBP | 225,000 | | | | 339,110 | |
| Transurban Finance Co., 1.75%, 3/29/2028 | | EUR | 500,000 | | | | 559,564 | |
| | | | | | | | |
| | | | | | $ | 2,808,242 | |
| | | | | | | | |
| | | | | | | | |
| | |
| Issuer | | Shares/Par | | | Value ($) | |
| BONDS – continued | | | | | |
| U.S. Government Agencies and Equivalents – 0.2% | |
| Small Business Administration, 5.09%, 10/01/2025 | | $ | 4,941 | | | $ | 5,105 | |
| Small Business Administration, 5.21%, 1/01/2026 | | | 185,766 | | | | 192,411 | |
| Small Business Administration, 5.31%, 5/01/2027 | | | 54,759 | | | | 57,493 | |
| Small Business Administration, 2.22%, 3/01/2033 | | | 1,276,267 | | | | 1,242,685 | |
| | | | | | | | |
| | | | | | $ | 1,497,694 | |
| | | | | | | | |
| U.S. Treasury Obligations – 8.5% | | | | | |
| U.S. Treasury Bonds, 3.5%, 2/15/2039 | | $ | 1,383,000 | | | $ | 1,514,773 | |
| U.S. Treasury Bonds, 4.5%, 8/15/2039 | | | 2,370,000 | | | | 2,957,451 | |
| U.S. Treasury Bonds, 3.625%, 2/15/2044 (f) | | | 6,649,000 | | | | 7,378,111 | |
| U.S. Treasury Bonds, 3%, 5/15/2047 | | | 3,948,000 | | | | 3,938,014 | |
| U.S. Treasury Bonds, TIPS, 0.25%, 1/15/2025 | | | 4,163,523 | | | | 3,987,247 | |
| U.S. Treasury Notes, 2.125%, 9/30/2024 (f) | | | 11,651,700 | | | | 11,386,544 | |
| U.S. Treasury Notes, 2%, 11/15/2026 (f) | | | 8,430,000 | | | | 8,052,801 | |
| U.S. Treasury Notes, 2.75%, 2/15/2028 (f) | | | 6,654,000 | | | | 6,693,285 | |
| U.S. Treasury Notes, 2.875%, 5/15/2028 | | | 5,770,000 | | | | 5,862,794 | |
| | | | | | | | |
| | | | | | $ | 51,771,020 | |
| | | | | | | | |
| Utilities – Electric Power – 2.0% | | | | | |
| Duke Energy Corp., 2.65%, 9/01/2026 | | $ | 995,000 | | | $ | 906,333 | |
| Duke Energy Florida LLC, 3.2%, 1/15/2027 | | | 842,000 | | | | 815,334 | |
| Emera U.S. Finance LP, 2.7%, 6/15/2021 | | | 376,000 | | | | 366,283 | |
| Emera U.S. Finance LP, 3.55%, 6/15/2026 | | | 430,000 | | | | 407,969 | |
| Enel Finance International N.V., 5.625%, 8/14/2024 | | GBP | 200,000 | | | | 288,328 | |
| Enel Finance International N.V., 1.125%, 9/16/2026 | | EUR | 300,000 | | | | 324,617 | |
| Enel Finance International N.V., 3.5%, 4/06/2028 (z) | | $ | 414,000 | | | | 355,127 | |
| Enel Finance International N.V., 4.75%, 5/25/2047 (n) | | | 343,000 | | | | 291,598 | |
| Enersis Americas S.A., 4%, 10/25/2026 | | | 1,891,000 | | | | 1,761,580 | |
| Engie Energia Chile S.A., 4.5%, 1/29/2025 (n) | | | 1,180,000 | | | | 1,137,527 | |
| Exelon Corp., 3.497%, 6/01/2022 | | | 406,000 | | | | 396,722 | |
| Innogy Finance B.V., 1.625%, 5/30/2026 | | EUR | 380,000 | | | | 443,541 | |
| Innogy Finance B.V., 4.75%, 1/31/2034 | | GBP | 300,000 | | | | 437,131 | |
14
MFS Global Tactical Allocation Portfolio
Portfolio of Investments – continued
| | | | | | | | |
| | |
| Issuer | | Shares/Par | | | Value ($) | |
| BONDS – continued | | | | | |
| Utilities – Electric Power – Services – continued | | | | | |
| NextEra Energy Capital Holdings, Inc., 3.55%, 5/01/2027 | | $ | 992,000 | | | $ | 947,138 | |
| PPL Capital Funding, Inc., 5%, 3/15/2044 | | | 473,000 | | | | 482,751 | |
| PPL WEM Holdings PLC, 5.375%, 5/01/2021 (n) | | | 280,000 | | | | 289,109 | |
| Public Service Enterprise Group, 2%, 11/15/2021 | | | 1,215,000 | | | | 1,166,718 | |
| Virginia Electric & Power Co., 3.5%, 3/15/2027 | | | 1,200,000 | | | | 1,182,438 | |
| | | | | | | | |
| | | | | | $ | 12,000,244 | |
| | | | | | | | |
Total Bonds
(Identified Cost, $388,133,124) | | | $ | 385,076,348 | |
| | | | | | | | |
| |
| COMMON STOCKS – 31.2% | | | | | |
| Aerospace – 1.1% | | | | | |
| Boeing Co. | | | 3,387 | | | $ | 1,092,308 | |
| Honeywell International, Inc. | | | 17,167 | | | | 2,268,104 | |
| Lockheed Martin Corp. | | | 7,771 | | | | 2,034,759 | |
| Northrop Grumman Corp. | | | 1,356 | | | | 332,084 | |
| United Technologies Corp. | | | 8,326 | | | | 886,552 | |
| | | | | | | | |
| | | | | | $ | 6,613,807 | |
| | | | | | | | |
| Airlines – 0.2% | | | | | | | | |
| Aena S.A. | | | 2,415 | | | $ | 375,618 | |
| Air Canada (a) | | | 58,544 | | | | 1,113,245 | |
| | | | | | | | |
| | | | | | $ | 1,488,863 | |
| | | | | | | | |
| Alcoholic Beverages – 0.7% | | | | | | | | |
| Heineken N.V. | | | 18,464 | | | $ | 1,633,176 | |
| Molson Coors Brewing Co. | | | 8,096 | | | | 454,671 | |
| Pernod Ricard S.A. | | | 12,109 | | | | 1,988,127 | |
| | | | | | | | |
| | | | | | $ | 4,075,974 | |
| | | | | | | | |
| Apparel Manufacturers – 0.1% | | | | | |
| Compagnie Financiere Richemont S.A. | | | 11,955 | | | $ | 768,317 | |
| | | | | | | | |
| Automotive – 0.4% | | | | | | | | |
| Aptiv PLC | | | 11,084 | | | $ | 682,442 | |
| Magna International, Inc. | | | 27,201 | | | | 1,234,725 | |
| USS Co. Ltd. | | | 32,400 | | | | 540,750 | |
| | | | | | | | |
| | | | | | $ | 2,457,917 | |
| | | | | | | | |
| Biotechnology – 0.1% | | | | | | | | |
| Biogen, Inc. (a) | | | 2,515 | | | $ | 756,814 | |
| | | | | | | | |
| Broadcasting – 0.4% | | | | | | | | |
| Omnicom Group, Inc. | | | 22,425 | | | $ | 1,642,407 | |
| Publicis Groupe S.A. | | | 11,495 | | | | 659,573 | |
| | | | | | | | |
| | | | | | $ | 2,301,980 | |
| | | | | | | | |
| Brokerage & Asset Managers – 0.3% | | | | | |
| ASX Ltd. | | | 3,837 | | | $ | 161,993 | |
| BlackRock, Inc. | | | 3,131 | | | | 1,229,920 | |
| TMX Group Ltd. | | | 9,697 | | | | 502,394 | |
| | | | | | | | |
| | | | | | $ | 1,894,307 | |
| | | | | | | | |
| | | | | | | | |
| | |
| Issuer | | Shares/Par | | | Value ($) | |
| COMMON STOCKS – continued | | | | | |
| Business Services – 2.5% | | | | | | | | |
| Accenture PLC, “A” | | | 19,779 | | | $ | 2,789,037 | |
| Bunzl PLC | | | 25,190 | | | | 760,619 | |
| CGI Group, Inc., “A” (a) | | | 9,910 | | | | 606,127 | |
| Cognizant Technology Solutions Corp., “A” | | | 14,014 | | | | 889,609 | |
| Compass Group PLC | | | 93,267 | | | | 1,961,489 | |
| DXC Technology Co. | | | 16,827 | | | | 894,692 | |
| Equifax, Inc. | | | 8,374 | | | | 779,871 | |
| Experian PLC | | | 38,242 | | | | 928,559 | |
| Fidelity National Information Services, Inc. | | | 8,310 | | | | 852,190 | |
| Fiserv, Inc. (a) | | | 11,335 | | | | 833,009 | |
| Nomura Research Institute Ltd. | | | 21,100 | | | | 775,632 | |
| Secom Co. Ltd. | | | 18,400 | | | | 1,519,165 | |
| SGS S.A. | | | 237 | | | | 533,962 | |
| Thomson Reuters Corp. | | | 17,843 | | | | 861,995 | |
| | | | | | | | |
| | | | | | $ | 14,985,956 | |
| | | | | | | | |
| Cable TV – 0.4% | | | | | | | | |
| Comcast Corp., “A” | | | 75,588 | | | $ | 2,573,771 | |
| | | | | | | | |
| Chemicals – 1.0% | | | | | | | | |
| 3M Co. | | | 9,782 | | | $ | 1,863,862 | |
| CF Industries Holdings, Inc. | | | 6,345 | | | | 276,071 | |
| Givaudan S.A. | | | 728 | | | | 1,688,538 | |
| LyondellBasell Industries N.V., “A” | | | 2,788 | | | | 231,850 | |
| PPG Industries, Inc. | | | 19,324 | | | | 1,975,492 | |
| | | | | | | | |
| | | | | | $ | 6,035,813 | |
| | | | | | | | |
| Computer Software – 0.2% | | | | | | | | |
| Adobe Systems, Inc. (a) | | | 2,179 | | | $ | 492,977 | |
| Cadence Design Systems, Inc. (a) | | | 16,440 | | | | 714,811 | |
| | | | | | | | |
| | | | | | $ | 1,207,788 | |
| | | | | | | | |
| Computer Software – Systems – 0.3% | | | | | |
| Amadeus IT Group S.A. | | | 18,248 | | | $ | 1,272,021 | |
| Hitachi Ltd. | | | 20,900 | | | | 555,560 | |
| | | | | | | | |
| | | | | | $ | 1,827,581 | |
| | | | | | | | |
| Construction – 0.4% | | | | | | | | |
| Persimmon PLC | | | 15,598 | | | $ | 383,707 | |
| Sherwin-Williams Co. | | | 2,886 | | | | 1,135,526 | |
| Stanley Black & Decker, Inc. | | | 9,773 | | | | 1,170,219 | |
| | | | | | | | |
| | | | | | $ | 2,689,452 | |
| | | | | | | | |
| Consumer Products – 1.0% | | | | | | | | |
| Colgate-Palmolive Co. | | | 11,527 | | | $ | 686,087 | |
| Kao Corp. | | | 19,200 | | | | 1,415,537 | |
| Kimberly-Clark Corp. | | | 17,984 | | | | 2,049,097 | |
| Reckitt Benckiser Group PLC | | | 22,869 | | | | 1,752,719 | |
| | | | | | | | |
| | | | | | $ | 5,903,440 | |
| | | | | | | | |
| Containers – 0.1% | | | | | | | | |
| Amcor Ltd. | | | 55,757 | | | $ | 520,360 | |
| | | | | | | | |
| Electrical Equipment – 1.1% | | | | | | | | |
| Johnson Controls International PLC | | | 41,484 | | | $ | 1,230,001 | |
| Legrand S.A. | | | 13,864 | | | | 783,114 | |
15
MFS Global Tactical Allocation Portfolio
Portfolio of Investments – continued
| | | | | | | | |
| | |
| Issuer | | Shares/Par | | | Value ($) | |
| COMMON STOCKS – continued | | | | | |
| OMRON Corp. | | | 20,200 | | | $ | 728,071 | |
| Schneider Electric S.A. | | | 48,463 | | | | 3,316,041 | |
| Spectris PLC | | | 15,069 | | | | 437,726 | |
| | | | | | | | |
| | | | | | $ | 6,494,953 | |
| | | | | | | | |
| Electronics – 1.7% | | | | | | | | |
| Analog Devices, Inc. | | | 12,862 | | | $ | 1,103,945 | |
| Halma PLC | | | 42,532 | | | | 739,442 | |
| Hoya Corp. | | | 11,900 | | | | 727,355 | |
| Kyocera Corp. | | | 12,400 | | | | 616,641 | |
| Samsung Electronics Co. Ltd. | | | 18,981 | | | | 656,755 | |
| Taiwan Semiconductor | | | | | | | | |
| Manufacturing Co. Ltd., ADR | | | 117,914 | | | | 4,352,206 | |
| Texas Instruments, Inc. | | | 25,026 | | | | 2,364,957 | |
| | | | | | | | |
| | | | | | $ | 10,561,301 | |
| | | | | | | | |
| Energy – Independent – 0.5% | | | | | | | | |
| Marathon Petroleum Corp. | | | 27,874 | | | $ | 1,644,845 | |
| Occidental Petroleum Corp. | | | 9,008 | | | | 552,911 | |
| Phillips 66 | | | 9,877 | | | | 850,903 | |
| | | | | | | | |
| | | | | | $ | 3,048,659 | |
| | | | | | | | |
| Energy – Integrated – 0.9% | | | | | | | | |
| BP PLC | | | 88,047 | | | $ | 556,578 | |
| Chevron Corp. | | | 7,098 | | | | 772,191 | |
| China Petroleum & Chemical Corp. | | | 630,000 | | | | 449,741 | |
| Exxon Mobil Corp. | | | 23,319 | | | | 1,590,123 | |
| Galp Energia SGPS S.A., “B” | | | 43,337 | | | | 684,968 | |
| LUKOIL PJSC, ADR | | | 11,270 | | | | 805,580 | |
| Suncor Energy, Inc. | | | 23,482 | | | | 655,852 | |
| | | | | | | | |
| | | | | | $ | 5,515,033 | |
| | | | | | | | |
| Food & Beverages – 1.3% | | | | | | | | |
| Danone S.A. | | | 19,386 | | | $ | 1,366,230 | |
| General Mills, Inc. | | | 30,317 | | | | 1,180,544 | |
| J.M. Smucker Co. | | | 4,101 | | | | 383,402 | |
| Marine Harvest | | | 43,879 | | | | 923,698 | |
| Nestle S.A. | | | 41,030 | | | | 3,335,774 | |
| Tyson Foods, Inc., “A” | | | 11,142 | | | | 594,983 | |
| | | | | | | | |
| | | | | | $ | 7,784,631 | |
| | | | | | | | |
| Food & Drug Stores – 0.1% | | | | | | | | |
| Wesfarmers Ltd. | | | 36,695 | | | $ | 832,762 | |
| | | | | | | | |
| Health Maintenance Organizations – 0.2% | | | | | |
| Cigna Corp. | | | 6,589 | | | $ | 1,251,383 | |
| | | | | | | | |
| Insurance – 1.9% | | | | | | | | |
| Aon PLC | | | 19,039 | | | $ | 2,767,509 | |
| AXA | | | 28,802 | | | | 622,312 | |
| Chubb Ltd. | | | 12,519 | | | | 1,617,205 | |
| Hiscox Ltd. | | | 30,747 | | | | 635,272 | |
| MetLife, Inc. | | | 34,421 | | | | 1,413,326 | |
| Prudential Financial, Inc. | | | 7,288 | | | | 594,336 | |
| Samsung Fire & Marine Insurance | | | | | | | | |
| Co. Ltd. (a) | | | 407 | | | | 98,121 | |
| Travelers Cos., Inc. | | | 15,055 | | | | 1,802,836 | |
| Zurich Insurance Group AG | | | 6,893 | | | | 2,059,557 | |
| | | | | | | | |
| | | | | | $ | 11,610,474 | |
| | | | | | | | |
| | | | | | | | |
| | |
| Issuer | | Shares/Par | | | Value ($) | |
| COMMON STOCKS – continued | | | | | |
| Machinery & Tools – 0.5% | | | | | | | | |
| Eaton Corp. PLC | | | 21,435 | | | $ | 1,471,727 | |
| Illinois Tool Works, Inc. | | | 11,700 | | | | 1,482,273 | |
| | | | | | | | |
| | | | | | $ | 2,954,000 | |
| | | | | | | | |
| Major Banks – 2.3% | | | | | | | | |
| ABSA Group Ltd. | | | 41,494 | | | $ | 466,694 | |
| Bank of New York Mellon Corp. | | | 27,108 | | | | 1,275,974 | |
| China Construction Bank | | | 1,556,000 | | | | 1,283,668 | |
| Goldman Sachs Group, Inc. | | | 4,625 | | | | 772,606 | |
| JPMorgan Chase & Co. | | | 33,931 | | | | 3,312,344 | |
| PNC Financial Services Group, Inc. | | | 6,494 | | | | 759,214 | |
| Royal Bank of Canada | | | 11,741 | | | | 804,493 | |
| State Street Corp. | | | 19,307 | | | | 1,217,692 | |
| Svenska Handelsbanken AB, “A” | | | 16,303 | | | | 180,600 | |
| UBS AG | | | 140,659 | | | | 1,755,841 | |
| Wells Fargo & Co. | | | 50,154 | | | | 2,311,096 | |
| | | | | | | | |
| | | | | | $ | 14,140,222 | |
| | | | | | | | |
| Medical & Health Technology & Services – 0.4% | | | | | |
| HCA Healthcare, Inc. | | | 11,247 | | | $ | 1,399,689 | |
| McKesson Corp. | | | 2,714 | | | | 299,816 | |
| Sonic Healthcare Ltd. | | | 34,102 | | | | 531,077 | |
| Walgreens Boots Alliance, Inc. | | | 4,095 | | | | 279,811 | |
| | | | | | | | |
| | | | | | $ | 2,510,393 | |
| | | | | | | | |
| Medical Equipment – 1.0% | | | | | | | | |
| Abbott Laboratories | | | 26,870 | | | $ | 1,943,507 | |
| Danaher Corp. | | | 11,922 | | | | 1,229,397 | |
| Medtronic PLC | | | 23,220 | | | | 2,112,091 | |
| Thermo Fisher Scientific, Inc. | | | 3,248 | | | | 726,870 | |
| | | | | | | | |
| | | | | | $ | 6,011,865 | |
| | | | | | | | |
| Natural Gas – Distribution – 0.1% | | | | | | | | |
| ENGIE | | | 42,655 | | | $ | 612,121 | |
| | | | | | | | |
| Natural Gas – Pipeline – 0.1% | | | | | | | | |
| Enterprise Products Partners LP | | | 29,334 | | | $ | 721,323 | |
| | | | | | | | |
| Network & Telecom – 0.1% | | | | | | | | |
| Cisco Systems, Inc. | | | 17,435 | | | $ | 755,459 | |
| | | | | | | | |
| Oil Services – 0.2% | | | | | | | | |
| Schlumberger Ltd. | | | 26,627 | | | $ | 960,702 | |
| | | | | | | | |
| Other Banks & Diversified Financials – 0.9% | | | | | |
| Agricultural Bank of China Ltd., “H” | | | 467,000 | | | $ | 204,560 | |
| American Express Co. | | | 6,355 | | | | 605,759 | |
| Citigroup, Inc. | | | 21,498 | | | | 1,119,186 | |
| DBS Group Holdings Ltd. | | | 14,900 | | | | 258,983 | |
| ING Groep N.V. | | | 52,285 | | | | 563,711 | |
| KBC Groep N.V. | | | 11,421 | | | | 741,692 | |
| Komercni Banka A.S. | | | 2,542 | | | | 95,857 | |
| ORIX Corp. | | | 17,500 | | | | 254,268 | |
| Sberbank of Russia, ADR | | | 17,301 | | | | 189,619 | |
| U.S. Bancorp | | | 33,048 | | | | 1,510,294 | |
| | | | | | | | |
| | | | | | $ | 5,543,929 | |
| | | | | | | | |
16
MFS Global Tactical Allocation Portfolio
Portfolio of Investments – continued
| | | | | | | | |
| | |
| Issuer | | Shares/Par | | | Value ($) | |
| COMMON STOCKS – continued | | | | | |
| Pharmaceuticals – 3.1% | | | | | | | | |
| Bayer AG | | | 29,866 | | | $ | 2,072,300 | |
| Bristol-Myers Squibb Co. | | | 29,348 | | | | 1,525,509 | |
| Eli Lilly & Co. | | | 5,726 | | | | 662,613 | |
| Johnson & Johnson | | | 27,387 | | | | 3,534,292 | |
| Novartis AG | | | 32,516 | | | | 2,784,943 | |
| Pfizer, Inc. | | | 81,915 | | | | 3,575,590 | |
| Roche Holding AG | | | 15,601 | | | | 3,857,725 | |
| Santen Pharmaceutical Co. Ltd. | | | 61,800 | | | | 884,418 | |
| | | | | | | | |
| | | | | | $ | 18,897,390 | |
| | | | | | | | |
| Printing & Publishing – 0.3% | | | | | | | | |
| Moody’s Corp. | | | 7,865 | | | $ | 1,101,414 | |
| RELX Group PLC | | | 48,263 | | | | 993,693 | |
| | | | | | | | |
| | | | | | $ | 2,095,107 | |
| | | | | | | | |
| Railroad & Shipping – 0.2% | | | | | | | | |
| Canadian National Railway Co. | | | 5,172 | | | $ | 383,297 | |
| Union Pacific Corp. | | | 3,655 | | | | 505,231 | |
| | | | | | | | |
| | | | | | $ | 888,528 | |
| | | | | | | | |
| Real Estate – 0.8% | | | | | | | | |
| CK Asset Holdings Ltd. | | | 68,000 | | | $ | 497,593 | |
| Deutsche Wohnen SE | | | 37,144 | | | | 1,702,309 | |
| Grand City Properties S.A. | | | 18,755 | | | | 407,207 | |
| Medical Properties Trust, Inc., REIT | | | 54,313 | | | | 873,353 | |
| Public Storage, Inc., REIT | | | 1,573 | | | | 318,391 | |
| Store Capital Corp., REIT | | | 9,171 | | | | 259,631 | |
| Unibail-Rodamco-Westfield, REIT | | | 3,010 | | | | 466,955 | |
| | | | | | | | |
| | | | | | $ | 4,525,439 | |
| | | | | | | | |
| Restaurants – 0.2% | | | | | | | | |
| Greggs PLC | | | 19,822 | | | $ | 319,856 | |
| Starbucks Corp. | | | 13,034 | | | | 839,390 | |
| | | | | | | | |
| | | | | | $ | 1,159,246 | |
| | | | | | | | |
| Specialty Chemicals – 0.4% | | | | | | | | |
| Akzo Nobel N.V. | | | 15,053 | | | $ | 1,214,187 | |
| PTT Global Chemical PLC | | | 484,200 | | | | 1,059,559 | |
| | | | | | | | |
| | | | | | $ | 2,273,746 | |
| | | | | | | | |
| Specialty Stores – 0.1% | | | | | | | | |
| Dufry AG | | | 4,359 | | | $ | 413,990 | |
| | | | | | | | |
| Telecommunications – Wireless – 0.9% | | | | | |
| KDDI Corp. | | | 156,400 | | | $ | 3,727,024 | |
| SK Telecom Co. Ltd. | | | 1,935 | | | | 467,362 | |
| Vodafone Group PLC | | | 571,719 | | | | 1,114,202 | |
| | | | | | | | |
| | | | | | $ | 5,308,588 | |
| | | | | | | | |
| Telephone Services – 0.2% | | | | | | | | |
| Telus Corp. | | | 19,320 | | | $ | 640,368 | |
| TELUS Corp. | | | 6,799 | | | | 225,319 | |
| Verizon Communications, Inc. | | | 10,028 | | | | 563,774 | |
| | | | | | | | |
| | | | | | $ | 1,429,461 | |
| | | | | | | | |
| Tobacco – 1.4% | | | | | | | | |
| Altria Group, Inc. | | | 32,413 | | | $ | 1,600,878 | |
| British American Tobacco PLC | | | 9,923 | | | | 316,196 | |
| | | | | | | | |
| | |
| Issuer | | Shares/Par | | | Value ($) | |
| COMMON STOCKS – continued | | | | | |
| Tobacco – continued | | | | | | | | |
| Imperial Tobacco Group PLC | | | 26,407 | | | $ | 800,059 | |
| Japan Tobacco, Inc. | | | 88,300 | | | | 2,094,910 | |
| Philip Morris International, Inc. | | | 57,814 | | | | 3,859,663 | |
| | | | | | | | |
| | | | | | $ | 8,671,706 | |
| | | | | | | | |
| Trucking – 0.1% | | | | | | | | |
| United Parcel Service, Inc., “B” | | | 6,348 | | | $ | 619,121 | |
| | | | | | | | |
| Utilities – Electric Power – 1.0% | | | | | | | | |
| Duke Energy Corp. | | | 19,218 | | | $ | 1,658,513 | |
| E.ON AG | | | 31,345 | | | | 309,826 | |
| Exelon Corp. | | | 39,321 | | | | 1,773,377 | |
| SSE PLC | | | 113,788 | | | | 1,568,545 | |
| Xcel Energy, Inc. | | | 11,371 | | | | 560,249 | |
| | | | | | | | |
| | | | | | $ | 5,870,510 | |
| | | | | | | | |
Total Common Stocks
(Identified Cost, $139,886,905) | | | | | | $ | 189,564,182 | |
| | | | | | | | |
| | |
| PREFERRED STOCKS – 0.3% | | | | | | | | |
| Consumer Products – 0.3% | | | | | | | | |
Henkel AG & Co. KGaA
(Identified Cost, $766,078) | | | 15,334 | | | $ | 1,676,075 | |
| | | | | | | | |
|
| CONVERTIBLE PREFERRED STOCKS – 0.1% | |
| Utilities – Electric Power – 0.1% | | | | | | | | |
| CenterPoint Energy, Inc., 7% | | | 5,479 | | | $ | 275,977 | |
| NextEra Energy, Inc., 6.123% | | | 3,325 | | | | 191,653 | |
| | | | | | | | |
Total Convertible Preferred Stocks
(Identified Cost, $464,069) | | | $ | 467,630 | |
| | | | | | | | |
| |
| INVESTMENT COMPANIES (h) – 4.1% | | | | | |
| Money Market Funds – 4.1% | | | | | | | | |
MFS Institutional Money Market Portfolio, 2.4% (v)
(Identified Cost, $24,746,477) | | | 24,749,202 | | | $ | 24,746,728 | |
| | | | | | | | |
| | | | | | | | | | | | | | | | |
| | | | | |
Underlying/
Expiration
Date/Exercise
Price | | Put/
Call | | Counter-
party | | Notional
Amount | | | Par
Amount/
Number of
Contracts | | | | |
| | | | | | | | | | | | | | | | |
| PURCHASED OPTIONS – 0.1% | | | | | | | | | |
| Market Index Securities – 0.1% | | | | | | | | | |
| Russell 2000 Index – June 2019 @ $1,180 (Premiums Paid, $472,720) | | Put | | Goldman Sachs International | | $ | 33,713,970 | | | | 250 | | | $ | 840,250 | |
| | | | | | | | | | | | | | | | |
OTHER ASSETS, LESS
LIABILITIES – 0.8% | | | | | | | | 4,623,469 | |
| | | | | | | | | | | | | | | | |
| NET ASSETS – 100.0% | | | | | | | $ | 606,994,682 | |
| | | | | | | | | | | | | | | | |
17
MFS Global Tactical Allocation Portfolio
Portfolio of Investments – continued
| (a) | | Non-income producing security. |
| (f) | | All or a portion of the security has been segregated as collateral for open futures contracts. |
| (h) | | An affiliated issuer, which may be considered one in which the fund owns 5% or more of the outstanding voting securities, or a company which is under common control. At period end, the aggregate values of the fund’s investments in affiliated issuers and in unaffiliated issuers were $24,746,728 and $577,624,485, respectively. |
| (n) | | Securities exempt from registration under Rule 144A of the Securities Act of 1933. These securities may be sold in the ordinary course of business in transactions exempt from registration, normally to qualified institutional buyers. At period end, the aggregate value of these securities was $34,619,098, representing 5.7% of net assets. |
| (v) | | Affiliated issuer that is available only to investment companies managed by MFS. The rate quoted for the MFS Institutional Money Market Portfolio is the annualizedseven-day yield of the fund at period end. |
| (z) | | Restricted securities are not registered under the Securities Act of 1933 and are subject to legal restrictions on resale. These securities generally may be resold in transactions exempt from registration or to the public if the securities are subsequently registered. Disposal of these securities may involve time-consuming negotiations and prompt sale at an acceptable price may be difficult. The fund holds the following restricted securities: |
| | | | | | | | | | |
| Restricted Securities | | Acquisition
Date | | Cost | | | Value | |
| | | |
| Chesapeake Funding II LLC,2016-2A, “A2”, FLR, 3.455% (LIBOR - 1mo. + 1%), 6/15/2028 | | 6/14/16 | | | $469,764 | | | | $470,944 | |
| | | |
| Dryden Senior Loan Fund,2013-26A, “AR”, CLO, FLR, 3.336% (LIBOR - 3mo. + 0.9%), 4/15/2029 | | 4/09/18 | | | 1,292,000 | | | | 1,275,881 | |
| | | |
| Enel Finance International N.V., 3.5%, 4/06/2028 | | 10/02/18 | | | 364,248 | | | | 355,127 | |
| | | |
| Kref Ltd.,2018-FL1, “A”, FLR, 3.402% (LIBOR - 1mo. + 1.1%), 6/15/2036 | | 11/07/18 | | | 773,500 | | | | 773,486 | |
| | | |
| Takeda Pharmaceutical Co. Ltd., 1.125%, 11/21/2022 | | 11/15/18 | | | 417,758 | | | | 426,652 | |
| | | |
| Takeda Pharmaceutical Co. Ltd., 2.25%, 11/21/2026 | | 11/15/18 | | | 509,313 | | | | 526,198 | |
| | | |
| Total Restricted Securities | | | | | | | | | $3,828,288 | |
| | | |
| % of Net assets | | | | | | | | | 0.6% | |
The following abbreviations are used in this report and are defined:
| ADR | | American Depositary Receipt |
| CLO | | Collateralized Loan Obligation |
| EURIBOR | | Euro Interbank Offered Rate |
| FLR | | Floating Rate. Interest rate resets periodically based on the parenthetically disclosed reference rate plus a spread (if any). Theperiod-end rate reported may not be the current rate. All reference rates are USD unless otherwise noted. |
| LIBOR | | London Interbank Offered Rate |
| NATL | | National Public Finance Guarantee Corp. |
| PJSC | | Public Joint Stock Company |
| PLC | | Public Limited Company |
| REIT | | Real Estate Investment Trust |
| TIPS | | Treasury Inflation Protected Security |
Abbreviations indicate amounts shown in currencies other than the U.S. dollar. All amounts are stated in U.S. dollars unless otherwise indicated. A list of abbreviations is shown below:
18
MFS Global Tactical Allocation Portfolio
Portfolio of Investments – continued
Derivative Contracts at 12/31/18
Forward Foreign Currency Exchange Contracts
| | | | | | | | | | | | | | | | | | | | |
| Currency Purchased | | Currency Sold | | Counterparty | | Settlement Date | | | Unrealized
Appreciation
(Depreciation) | |
| Asset Derivatives | | | | | | | | | | | | |
| CHF | | | 978,676 | | | | | USD | | 986,000 | | JPMorgan Chase Bank N.A. | | | 2/14/2019 | | | | $13,528 | |
| EUR | | | 807,525 | | | | | USD | | 918,582 | | Brown Brothers Harriman | | | 1/11/2019 | | | | 7,251 | |
| EUR | | | 3,512,000 | | | | | USD | | 4,014,392 | | Deutsche Bank AG | | | 1/11/2019 | | | | 12,136 | |
| EUR | | | 9,904,192 | | | | | USD | | 11,262,343 | | Goldman Sachs International | | | 1/11/2019 | | | | 92,867 | |
| EUR | | | 838,278 | | | | | USD | | 951,821 | | JPMorgan Chase Bank N.A. | | | 1/11/2019 | | | | 9,269 | |
| EUR | | | 3,286,762 | | | | | USD | | 3,732,000 | | JPMorgan Chase Bank N.A. | | | 2/14/2019 | | | | 47,017 | |
| EUR | | | 6,001,208 | | | | | USD | | 6,871,701 | | JPMorgan Chase Bank N.A. | | | 3/18/2019 | | | | 47,329 | |
| EUR | | | 313,977 | | | | | USD | | 357,430 | | NatWest Markets PLC | | | 1/11/2019 | | | | 2,546 | |
| GBP | | | 157,884 | | | | | USD | | 200,181 | | Brown Brothers Harriman | | | 1/11/2019 | | | | 1,138 | |
| GBP | | | 353,208 | | | | | USD | | 442,073 | | Goldman Sachs International | | | 1/11/2019 | | | | 8,304 | |
| GBP | | | 1,408,000 | | | | | USD | | 1,771,754 | | UBS AG | | | 1/11/2019 | | | | 23,591 | |
| IDR | | | 16,905,864,000 | | | | | USD | | 1,093,381 | | JPMorgan Chase Bank N.A. | | | 2/04/2019 | | | | 78,399 | |
| JPY | | | 4,043,951,700 | | | | | USD | | 36,359,442 | | JPMorgan Chase Bank N.A. | | | 1/11/2019 | | | | 548,139 | |
| JPY | | | 555,079,441 | | | | | USD | | 4,902,000 | | JPMorgan Chase Bank N.A. | | | 2/14/2019 | | | | 177,622 | |
| JPY | | | 448,216,000 | | | | | USD | | 4,004,743 | | Merrill Lynch International | | | 1/11/2019 | | | | 85,951 | |
| JPY | | | 90,017,480 | | | | | USD | | 808,961 | | Morgan Stanley Capital Services, Inc. | | | 1/11/2019 | | | | 12,594 | |
| JPY | | | 459,793,034 | | | | | USD | | 4,127,402 | | UBS AG | | | 1/11/2019 | | | | 68,951 | |
| KRW | | | 5,862,467,000 | | | | | USD | | 5,185,867 | | JPMorgan Chase Bank N.A. | | | 1/15/2019 | | | | 69,996 | |
| NZD | | | 3,105,000 | | | | | USD | | 2,040,432 | | Goldman Sachs International | | | 1/11/2019 | | | | 43,923 | |
| NZD | | | 558,211 | | | | | USD | | 365,524 | | NatWest Markets PLC | | | 1/11/2019 | | | | 9,197 | |
| PHP | | | 157,364,000 | | | | | USD | | 2,982,073 | | JPMorgan Chase Bank N.A. | | | 1/22/2019 | | | | 5,219 | |
| SEK | | | 18,151,000 | | | | | USD | | 2,002,582 | | Deutsche Bank AG | | | 1/11/2019 | | | | 46,811 | |
| SEK | | | 12,128,213 | | | | | USD | | 1,341,000 | | Goldman Sachs International | | | 2/14/2019 | | | | 32,052 | |
| SEK | | | 16,153,522 | | | | | USD | | 1,817,468 | | JPMorgan Chase Bank N.A. | | | 1/11/2019 | | | | 6,393 | |
| SEK | | | 36,427,000 | | | | | USD | | 4,101,686 | | Merrill Lynch International | | | 1/11/2019 | | | | 11,211 | |
| SGD | | | 1,350,000 | | | | | USD | | 982,954 | | JPMorgan Chase Bank N.A. | | | 1/11/2019 | | | | 7,732 | |
| THB | | | 42,550,650 | | | | | USD | | 1,289,804 | | JPMorgan Chase Bank N.A. | | | 2/13/2019 | | | | 15,906 | |
| USD | | | 6,150,004 | | | | | AUD | | 8,606,580 | | Deutsche Bank AG | | | 1/11/2019 | | | | 86,893 | |
| USD | | | 3,500,214 | | | | | AUD | | 4,784,292 | | Goldman Sachs International | | | 1/11/2019 | | | | 129,805 | |
| USD | | | 5,121,412 | | | | | AUD | | 7,163,455 | | JPMorgan Chase Bank N.A. | | | 1/11/2019 | | | | 74,946 | |
| USD | | | 6,305,538 | | | | | AUD | | 8,742,404 | | JPMorgan Chase Bank N.A. | | | 2/14/2019 | | | | 142,869 | |
| USD | | | 280,623 | | | | | CAD | | 364,000 | | Citibank N.A. | | | 1/11/2019 | | | | 13,929 | |
| USD | | | 3,465,850 | | | | | CAD | | 4,512,776 | | Citibank N.A. | | | 1/14/2019 | | | | 159,212 | |
| USD | | | 3,977,073 | | | | | CAD | | 5,295,925 | | Deutsche Bank AG | | | 1/11/2019 | | | | 96,885 | |
| USD | | | 827,685 | | | | | CAD | | 1,102,000 | | Goldman Sachs International | | | 1/11/2019 | | | | 20,278 | |
| USD | | | 4,199,349 | | | | | CAD | | 5,533,300 | | JPMorgan Chase Bank N.A. | | | 1/11/2019 | | | | 145,242 | |
| USD | | | 3,766,000 | | | | | CAD | | 5,021,935 | | JPMorgan Chase Bank N.A. | | | 2/14/2019 | | | | 83,572 | |
| USD | | | 10,198,859 | | | | | CAD | | 13,379,320 | | Merrill Lynch International | | | 1/11/2019 | | | | 396,177 | |
| USD | | | 1,963,741 | | | | | CAD | | 2,631,000 | | NatWest Markets PLC | | | 1/11/2019 | | | | 36,075 | |
| USD | | | 5,553,194 | | | | | CAD | | 7,325,834 | | UBS AG | | | 1/11/2019 | | | | 185,745 | |
| USD | | | 613,351 | | | | | COP | | 1,971,005,000 | | Barclays Bank PLC | | | 1/28/2019 | | | | 7,191 | |
| USD | | | 1,364,055 | | | | | COP | | 4,381,633,000 | | Goldman Sachs International | | | 1/28/2019 | | | | 16,534 | |
| USD | | | 1,410,922 | | | | | EUR | | 1,223,167 | | Deutsche Bank AG | | | 1/11/2019 | | | | 8,554 | |
| USD | | | 14,132,665 | | | | | EUR | | 12,101,942 | | Goldman Sachs International | | | 1/11/2019 | | | | 257,722 | |
| USD | | | 2,630,184 | | | | | EUR | | 2,264,057 | | Goldman Sachs International | | | 1/14/2019 | | | | 33,780 | |
19
MFS Global Tactical Allocation Portfolio
Portfolio of Investments – continued
Forward Foreign Currency Exchange Contracts - continued
| | | | | | | | | | | | | | | | | | | | | | |
| Currency Purchased | | | Currency Sold | | Counterparty | | Settlement Date | | | Unrealized
Appreciation
(Depreciation) | |
| Asset Derivatives – continued | | | | | | | | | | | | |
| USD | | | 937,818 | | | | | | | EUR | | 817,943 | | JPMorgan Chase Bank N.A. | | | 1/11/2019 | | | | $41 | |
| USD | | | 2,254,012 | | | | | | | EUR | | 1,940,000 | | UBS AG | | | 1/11/2019 | | | | 29,792 | |
| USD | | | 1,095,070 | | | | | | | GBP | | 835,286 | | Citibank N.A. | | | 1/11/2019 | | | | 29,995 | |
| USD | | | 2,431,009 | | | | | | | GBP | | 1,839,367 | | Deutsche Bank AG | | | 1/11/2019 | | | | 85,626 | |
| USD | | | 6,022,000 | | | | | | | GBP | | 4,703,864 | | JPMorgan Chase Bank N.A. | | | 2/14/2019 | | | | 14,067 | |
| USD | | | 687,344 | | | | | | | ILS | | 2,517,156 | | JPMorgan Chase Bank N.A. | | | 2/14/2019 | | | | 11,907 | |
| USD | | | 8,315,221 | | | | | | | NOK | | 69,814,988 | | Goldman Sachs International | | | 1/11/2019 | | | | 237,845 | |
| USD | | | 24,580,000 | | | | | | | NOK | | 211,130,844 | | Goldman Sachs International | | | 2/14/2019 | | | | 115,013 | |
| USD | | | 4,350,751 | | | | | | | NOK | | 37,364,532 | | JPMorgan Chase Bank N.A. | | | 1/11/2019 | | | | 27,790 | |
| USD | | | 2,023,494 | | | | | | | NZD | | 2,950,000 | | Citibank N.A. | | | 1/11/2019 | | | | 43,188 | |
| USD | | | 4,929,531 | | | | | | | NZD | | 7,244,000 | | Goldman Sachs International | | | 1/11/2019 | | | | 66,706 | |
| USD | | | 31,159,161 | | | | | | | NZD | | 46,105,028 | | Goldman Sachs International | | | 2/14/2019 | | | | 190,352 | |
| | | | | | | | | | | | | | | | | | | | | | |
| | | | | | | | | | | | | | | | | | | | | $4,232,803 | |
| | | | | | | | | | | | | | | | | | | | | | |
| Liability Derivatives | | | | | | | | | | | | | | | | | | | |
| AUD | | | 4,555,013 | | | | | | | USD | | 3,315,336 | | Citibank N.A. | | | 1/11/2019 | | | | $(106,449 | ) |
| AUD | | | 6,344,165 | | | | | | | USD | | 4,623,285 | | Deutsche Bank AG | | | 1/11/2019 | | | | (153,987 | ) |
| AUD | | | 2,490,665 | | | | | | | USD | | 1,775,937 | | JPMorgan Chase Bank N.A. | | | 1/11/2019 | | | | (21,329 | ) |
| AUD | | | 20,132,669 | | | | | | | USD | | 14,562,000 | | JPMorgan Chase Bank N.A. | | | 2/14/2019 | | | | (370,140 | ) |
| AUD | | | 5,500,000 | | | | | | | USD | | 4,024,074 | | Merrill Lynch International | | | 1/11/2019 | | | | (149,468 | ) |
| AUD | | | 614,520 | | | | | | | USD | | 443,292 | | UBS AG | | | 1/11/2019 | | | | (10,378 | ) |
| CAD | | | 4,243,632 | | | | | | | USD | | 3,267,148 | | JPMorgan Chase Bank N.A. | | | 1/11/2019 | | | | (157,948 | ) |
| CAD | | | 11,620,192 | | | | | | | USD | | 8,796,245 | | JPMorgan Chase Bank N.A. | | | 2/14/2019 | | | | (275,521 | ) |
| CHF | | | 2,483,000 | | | | | | | USD | | 2,541,430 | | Goldman Sachs International | | | 1/11/2019 | | | | (13,560 | ) |
| COP | | | 3,411,854,000 | | | | | | | USD | | 1,072,236 | | Barclays Bank PLC | | | 1/28/2019 | | | | (22,958 | ) |
| COP | | | 2,940,785,000 | | | | | | | USD | | 924,921 | | Goldman Sachs International | | | 1/28/2019 | | | | (20,515 | ) |
| CZK | | | 9,851,000 | | | | | | | USD | | 445,289 | | JPMorgan Chase Bank N.A. | | | 1/11/2019 | | | | (6,609 | ) |
| DKK | | | 8,011,079 | | | | | | | USD | | 1,255,165 | | Citibank N.A. | | | 1/11/2019 | | | | (24,944 | ) |
| EUR | | | 1,020,763 | | | | | | | USD | | 1,171,967 | | Citibank N.A. | | | 1/11/2019 | | | | (1,658 | ) |
| EUR | | | 1,100,124 | | | | | | | USD | | 1,269,322 | | Deutsche Bank AG | | | 1/11/2019 | | | | (8,024 | ) |
| EUR | | | 2,383,290 | | | | | | | USD | | 2,740,793 | | JPMorgan Chase Bank N.A. | | | 1/11/2019 | | | | (8,338 | ) |
| EUR | | | 2,170,615 | | | | | | | USD | | 2,506,631 | | UBS AG | | | 1/11/2019 | | | | (18,009 | ) |
| GBP | | | 205,338 | | | | | | | USD | | 271,290 | | Brown Brothers Harriman | | | 1/11/2019 | | | | (9,463 | ) |
| GBP | | | 1,459,000 | | | | | | | USD | | 1,876,414 | | Citibank N.A. | | | 1/11/2019 | | | | (16,039 | ) |
| GBP | | | 1,985,000 | | | | | | | USD | | 2,583,007 | | Goldman Sachs International | | | 1/11/2019 | | | | (51,928 | ) |
| GBP | | | 2,343,618 | | | | | | | USD | | 3,052,138 | | JPMorgan Chase Bank N.A. | | | 2/14/2019 | | | | (58,791 | ) |
| GBP | | | 1,080,000 | | | | | | | USD | | 1,405,279 | | UBS AG | | | 1/11/2019 | | | | (28,168 | ) |
| ILS | | | 1,799,000 | | | | | | | USD | | 498,772 | | Barclays Bank PLC | | | 1/11/2019 | | | | (17,359 | ) |
| MXN | | | 23,425,560 | | | | | | | USD | | 1,230,283 | | Goldman Sachs International | | | 1/11/2019 | | | | (39,456 | ) |
| NOK | | | 104,790,284 | | | | | | | USD | | 12,874,334 | | Goldman Sachs International | | | 1/11/2019 | | | | (750,424 | ) |
| NOK | | | 139,673,121 | | | | | | | USD | | 16,541,305 | | Goldman Sachs International | | | 2/14/2019 | | | | (356,549 | ) |
| NZD | | | 27,129,879 | | | | | | | USD | | 18,450,000 | | Goldman Sachs International | | | 2/14/2019 | | | | (226,824 | ) |
| NZD | | | 4,335,000 | | | | | | | USD | | 3,007,377 | | Merrill Lynch International | | | 1/11/2019 | | | | (97,335 | ) |
| PLN | | | 3,697,931 | | | | | | | USD | | 996,800 | | Barclays Bank PLC | | | 1/11/2019 | | | | (8,583 | ) |
| RUB | | | 42,540,000 | | | | | | | USD | | 636,788 | | JPMorgan Chase Bank N.A. | | | 3/06/2019 | | | | (30,839 | ) |
| USD | | | 25,465,957 | | | | | | | CHF | | 25,463,869 | | JPMorgan Chase Bank N.A. | | | 2/14/2019 | | | | (540,443 | ) |
| USD | | | 243,958 | | | | | | | DKK | | 1,592,000 | | Barclays Bank PLC | | | 1/11/2019 | | | | (517 | ) |
| USD | | | 1,131,302 | | | | | | | DKK | | 7,422,872 | | JPMorgan Chase Bank N.A. | | | 2/14/2019 | | | | (12,024 | ) |
| USD | | | 607,409 | | | | | | | EUR | | 530,000 | | Barclays Bank PLC | | | 1/11/2019 | | | | (239 | ) |
| USD | | | 2,130,655 | | | | | | | EUR | | 1,874,784 | | Citibank N.A. | | | 1/11/2019 | | | | (18,795 | ) |
| USD | | | 2,431,860 | | | | | | | EUR | | 2,132,000 | | Deutsche Bank AG | | | 1/11/2019 | | | | (12,490 | ) |
| USD | | | 481,685 | | | | | | | EUR | | 423,000 | | Deutsche Bank AG | | | 1/14/2019 | | | | (3,409 | ) |
| USD | | | 1,892,662 | | | | | | | EUR | | 1,657,251 | | Goldman Sachs International | | | 1/11/2019 | | | | (7,385 | ) |
| USD | | | 74,568,841 | | | | | | | EUR | | 65,591,294 | | Goldman Sachs International | | | 2/14/2019 | | | | (845,993 | ) |
| USD | | | 36,522,122 | | | | | | | EUR | | 32,133,575 | | JPMorgan Chase Bank N.A. | | | 2/14/2019 | | | | (424,065 | ) |
| USD | | | 1,073,305 | | | | | | | EUR | | 936,193 | | UBS AG | | | 1/11/2019 | | | | (46 | ) |
| USD | | | 97,651 | | | | | | | GBP | | 77,801 | | JPMorgan Chase Bank N.A. | | | 1/11/2019 | | | | (1,553 | ) |
20
MFS Global Tactical Allocation Portfolio
Portfolio of Investments – continued
Forward Foreign Currency Exchange Contracts - continued
| | | | | | | | | | | | | | | | | | | | |
| Currency Purchased | | Currency Sold | | Counterparty | | Settlement Date | | | Unrealized
Appreciation
(Depreciation) | |
| Liability Derivatives – continued | | | | | | | | | | |
| USD | | | 1,144,608 | | | | | IDR | | 16,905,864,000 | | JPMorgan Chase Bank N.A. | | | 2/04/2019 | | | | $(27,172 | ) |
| USD | | | 1,929,693 | | | | | JPY | | 217,953,912 | | Citibank N.A. | | | 1/11/2019 | | | | (59,487 | ) |
| USD | | | 932,489 | | | | | JPY | | 104,369,000 | | Goldman Sachs International | | | 1/11/2019 | | | | (20,046 | ) |
| USD | | | 37,847,426 | | | | | JPY | | 4,277,762,159 | | JPMorgan Chase Bank N.A. | | | 2/14/2019 | | | | (1,299,069 | ) |
| USD | | | 831,394 | | | | | JPY | | 93,696,000 | | NatWest Markets PLC | | | 1/11/2019 | | | | (23,733 | ) |
| USD | | | 4,875,223 | | | | | KRW | | 5,511,639,330 | | JPMorgan Chase Bank N.A. | | | 1/15/2019 | | | | (66,113 | ) |
| USD | | | 2,102,970 | | | | | SEK | | 19,091,000 | | Citibank N.A. | | | 1/11/2019 | | | | (52,556 | ) |
| USD | | | 12,404,365 | | | | | SEK | | 111,618,010 | | Goldman Sachs International | | | 2/14/2019 | | | | (232,070 | ) |
| USD | | | 899,211 | | | | | SGD | | 1,238,213 | | JPMorgan Chase Bank N.A. | | | 2/14/2019 | | | | (10,098 | ) |
| USD | | | 237,586 | | | | | SGD | | 327,000 | | Morgan Stanley Capital Services, Inc. | | | 1/11/2019 | | | | (2,380 | ) |
| USD | | | 63,661 | | | | | ZAR | | 929,865 | | Deutsche Bank AG | | | 1/11/2019 | | | | (912 | ) |
| | | | | | | | | | | | | | | | | | | | |
| | | | | | | | | | | | | | | | | | | $(6,722,188 | ) |
| | | | | | | | | | | | | | | | | | | | |
Futures Contracts
| | | | | | | | | | | | | | | | | | | | | | |
| Description | | Long/
Short | | | Currency | | | Contracts | | Notional
Amount | | | Expiration
Date | | | Value/
Unrealized
Appreciation
(Depreciation) | |
| Asset Derivatives | | | | | | | | | | | | | | | | | | | | | | |
| Equity Futures | | | | | | | | | | | | | | | | | | | | | | |
| AEX 25 Index | | | Short | | | | EUR | | | 130 | | | $14,528,931 | | | | January - 2019 | | | | $383,228 | |
| DAX Index | | | Short | | | | EUR | | | 40 | | | 12,100,835 | | | | March - 2019 | | | | 221,579 | |
| Hang Seng China Enterprises Index | | | Long | | | | HKD | | | 63 | | | 4,063,763 | | | | January - 2019 | | | | 8,850 | |
| Hang Seng Index | | | Long | | | | HKD | | | 48 | | | 7,924,092 | | | | January - 2019 | | | | 98,354 | |
| IBOV Index | | | Short | | | | BRL | | | 134 | | | 3,060,486 | | | | February - 2019 | | | | 15,524 | |
| KOSPI 200 Index | | | Short | | | | KRW | | | 95 | | | 5,564,910 | | | | March - 2019 | | | | 11,805 | |
| MSCI Taiwan Index | | | Long | | | | USD | | | 548 | | | 19,695,120 | | | | January - 2019 | | | | 285,552 | |
| Russell 2000 Index | | | Short | | | | USD | | | 220 | | | 14,839,000 | | | | March - 2019 | | | | 1,216,488 | |
| S&P 500 Index | | | Short | | | | USD | | | 96 | | | 12,024,960 | | | | March - 2019 | | | | 480,375 | |
| S&P/TSX 60 Index | | | Short | | | | CAD | | | 80 | | | 10,047,466 | | | | March - 2019 | | | | 300,705 | |
| Topix Index | | | Short | | | | JPY | | | 87 | | | 11,739,639 | | | | March - 2019 | | | | 845,495 | |
| | | | | | | | | | | | | | | | | | | | | | |
| | | | | | | | | | | | | | | | | | | | | $3,867,955 | |
| | | | | | | | | | | | | | | | | | | | | | |
| Interest Rate Futures | | | | | | | | | | | | | | | | | | | | | | |
| Australian Treasury Bond 10 yr | | | Long | | | | AUD | | | 499 | | | $46,631,348 | | | | March - 2019 | | | | $576,200 | |
| German Euro-Bund 10 yr | | | Long | | | | EUR | | | 70 | | | 13,116,313 | | | | March - 2019 | | | | 88,061 | |
| U.S. Treasury Note 2 yr | | | Long | | | | USD | | | 119 | | | 25,265,188 | | | | March - 2019 | | | | 174,361 | |
| U.S. Treasury Note 5 yr | | | Long | | | | USD | | | 595 | | | 68,239,062 | | | | March - 2019 | | | | 1,151,047 | |
| | | | | | | | | | | | | | | | | | | | | | |
| | | | | | | | | | | | | | | | | | | | | $1,989,669 | |
| | | | | | | | | | | | | | | | | | | | | | |
| | | | | | | | | | | | | | | | | | | | | $5,857,624 | |
| | | | | | | | | | | | | | | | | | | | | | |
| Liability Derivatives | | | | | | | | | | | | | | | | | | | | | | |
| Equity Futures | | | | | | | | | | | | | | | | | | | | | | |
| BIST 30 Index | | | Long | | | | TRY | | | 7,569 | | | $16,879,192 | | | | February - 2019 | | | | $(119,121 | ) |
| CAC 40 Index | | | Long | | | | EUR | | | 273 | | | 14,790,259 | | | | January - 2019 | | | | (236,844 | ) |
| FTSE 100 Index | | | Long | | | | GBP | | | 293 | | | 24,868,551 | | | | March - 2019 | | | | (618,633 | ) |
| FTSE/JSE Index | | | Short | | | | ZAR | | | 460 | | | 15,045,477 | | | | March - 2019 | | | | (577,363 | ) |
| FTSE/MIB Index | | | Long | | | | EUR | | | 74 | | | 7,721,688 | | | | March - 2019 | | | | (222,987 | ) |
| IBEX Index | | | Long | | | | EUR | | | 68 | | | 6,635,756 | | | | January - 2019 | | | | (160,341 | ) |
| Mexican Bolsa Index | | | Long | | | | MXN | | | 493 | | | 10,480,773 | | | | March - 2019 | | | | (753 | ) |
| MSCI Singapore Index | | | Short | | | | SGD | | | 27 | | | 676,907 | | | | January - 2019 | | | | (3,665 | ) |
| NIFTY Index | | | Short | | | | USD | | | 417 | | | 9,109,365 | | | | January - 2019 | | | | (32,563 | ) |
| OMX Index | | | Long | | | | SEK | | | 1,531 | | | 24,396,782 | | | | January - 2019 | | | | (783,563 | ) |
| S&P/ASX 200 Index | | | Long | | | | AUD | | | 88 | | | 8,617,157 | | | | March - 2019 | | | | (26,591 | ) |
| | | | | | | | | | | | | | | | | | | | | | |
| | | | | | | | | | | | | | | | | | | | | $(2,782,424 | ) |
| | | | | | | | | | | | | | | | | | | | | | |
21
MFS Global Tactical Allocation Portfolio
Portfolio of Investments – continued
Futures Contracts - continued
| | | | | | | | | | | | | | | | | | | | | | |
| Description | | Long/
Short | | | Currency | | | Contracts | | Notional
Amount | | | Expiration
Date | | | Value/
Unrealized
Appreciation
(Depreciation) | |
| Liability Derivatives – continued | | | | | | | | | | | | | | | | | | | | | | |
| Interest Rate Futures | | | | | | | | | | | | | | | | | | | | | | |
| Canadian Treasury Bond 10 yr | | | Short | | | | CAD | | | 617 | | | $61,812,987 | | | | March - 2019 | | | | $(1,990,381 | ) |
| German Euro Buxl 30 yr | | | Short | | | | EUR | | | 20 | | | 4,138,906 | | | | March - 2019 | | | | (74,749 | ) |
| German Euro-Bobl 5 yr | | | Short | | | | EUR | | | 103 | | | 15,638,979 | | | | March - 2019 | | | | (29,948 | ) |
| Japan Government Bond 10 yr | | | Short | | | | JPY | | | 5 | | | 6,955,887 | | | | March - 2019 | | | | (30,633 | ) |
| Long Gilt 10 yr | | | Short | | | | GBP | | | 17 | | | 2,668,872 | | | | March - 2019 | | | | (21,290 | ) |
| U.S. Treasury Bond 30 yr | | | Short | | | | USD | | | 10 | | | 1,460,000 | | | | March - 2019 | | | | (67,849 | ) |
| U.S. Treasury Note 10 yr | | | Short | | | | USD | | | 392 | | | 47,830,125 | | | | March - 2019 | | | | (1,184,092 | ) |
| U.S. Treasury Ultra Bond 30 yr | | | Short | | | | USD | | | 105 | | | 16,868,906 | | | | March - 2019 | | | | (886,264 | ) |
| U.S. Treasury Ultra Note 10 yr | | | Short | | | | USD | | | 62 | | | 8,064,844 | | | | March - 2019 | | | | (259,366 | ) |
| | | | | | | | | | | | | | | | | | | | | | |
| | | | | | | | | | | | | | | | | | | | | $(4,544,572 | ) |
| | | | | | | | | | | | | | | | | | | | | | |
| | | | | | | | | | | | | | | | | | | | | $(7,326,996 | ) |
| | | | | | | | | | | | | | | | | | | | | | |
At December 31, 2018, the fund had cash collateral of $2,953,044 and other liquid securities with an aggregate value of $18,331,128 to cover any collateral or margin obligations for certain derivative contracts. Restricted cash and/or deposits with brokers in the Statement of Assets and Liabilities are comprised of cash collateral.
See Notes to Financial Statements
22
MFS Global Tactical Allocation Portfolio
FINANCIAL STATEMENTS | STATEMENT OF ASSETS AND LIABILITIES
This statement represents your fund’s balance sheet, which details the assets and liabilities comprising the total value of the fund.
| | | | |
At 12/31/18 | | | | |
| |
Assets | | | | |
Investments in unaffiliated issuers, at value (identified cost, $529,722,896) | | | $577,624,485 | |
Investments in affiliated issuers, at value (identified cost, $24,746,477) | | | 24,746,728 | |
Cash | | | 932,618 | |
Foreign currency, at value (identified cost, $13,890) | | | 13,993 | |
Restricted cash for | | | | |
Forward foreign currency exchange contracts | | | 2,353,000 | |
Deposits with brokers for | | | | |
Futures contracts | | | 600,044 | |
Receivables for | | | | |
Forward foreign currency exchange contracts | | | 4,232,803 | |
Net daily variation margin on open futures contracts | | | 337,077 | |
Investments sold | | | 595,809 | |
Interest and dividends | | | 3,450,158 | |
Other assets | | | 3,925 | |
Total assets | | | $614,890,640 | |
| |
Liabilities | | | | |
Payables for | | | | |
Forward foreign currency exchange contracts | | | $6,722,188 | |
Investments purchased | | | 13,392 | |
Fund shares reacquired | | | 918,148 | |
Payable to affiliates | | | | |
Investment adviser | | | 47,375 | |
Shareholder servicing costs | | | 119 | |
Distribution and/or service fees | | | 15,268 | |
Payable for independent Trustees’ compensation | | | 11 | |
Deferred country tax expense payable | | | 24,859 | |
Accrued expenses and other liabilities | | | 154,598 | |
Total liabilities | | | $7,895,958 | |
Net assets | | | $606,994,682 | |
| |
Net assets consist of | | | | |
Paid-in capital | | | $538,384,218 | |
Total distributable earnings (loss) | | | 68,610,464 | |
Net assets | | | $606,994,682 | |
Shares of beneficial interest outstanding | | | 42,328,556 | |
| | | | | | | | | | | | |
| | | |
| | | Net assets | | | Shares
outstanding | | | Net asset value
per share | |
Initial Class | | | $47,516,873 | | | | 3,260,141 | | | | $14.58 | |
Service Class | | | 559,477,809 | | | | 39,068,415 | | | | 14.32 | |
See Notes to Financial Statements
23
MFS Global Tactical Allocation Portfolio
FINANCIAL STATEMENTS | STATEMENT OF OPERATIONS
This statement describes how much your fund earned in investment income and accrued in expenses. It also describes any gains and/or losses generated by fund operations.
| | | | |
Year ended 12/31/18 | | | | |
| |
Net investment income (loss) | | | | |
Income | | | | |
Interest | | | $11,103,176 | |
Dividends | | | 7,007,613 | |
Dividends from affiliated issuers | | | 453,817 | |
Income on securities loaned | | | 22,092 | |
Other | | | 3,601 | |
Foreign taxes withheld | | | (381,086 | ) |
Total investment income | | | $18,209,213 | |
Expenses | | | | |
Management fee | | | $4,887,426 | |
Distribution and/or service fees | | | 1,596,387 | |
Shareholder servicing costs | | | 14,167 | |
Administrative services fee | | | 108,042 | |
Independent Trustees’ compensation | | | 12,557 | |
Custodian fee | | | 110,082 | |
Shareholder communications | | | 45,722 | |
Audit and tax fees | | | 88,641 | |
Legal fees | | | 5,945 | |
Miscellaneous | | | 340,658 | |
Total expenses | | | $7,209,627 | |
Reduction of expenses by investment adviser | | | (65,682 | ) |
Net expenses | | | $7,143,945 | |
Net investment income (loss) | | | $11,065,268 | |
| |
Realized and unrealized gain (loss) | | | | |
Realized gain (loss) (identified cost basis) | | | | |
Unaffiliated issuers (net of $23,810 country tax) | | | $22,856,336 | |
Affiliated issuers | | | (476 | ) |
Futures contracts | | | (4,517,236 | ) |
Forward foreign currency exchange contracts | | | 5,099,627 | |
Foreign currency | | | (240,620 | ) |
Net realized gain (loss) | | | $23,197,631 | |
Change in unrealized appreciation or depreciation | | | | |
Unaffiliated issuers (net of $47,477 decrease in deferred country tax) | | | $(68,223,598 | ) |
Affiliated issuers | | | 251 | |
Futures contracts | | | (1,837,150 | ) |
Forward foreign currency exchange contracts | | | 3,325,312 | |
Translation of assets and liabilities in foreign currencies | | | (136,575 | ) |
Net unrealized gain (loss) | | | $(66,871,760 | ) |
Net realized and unrealized gain (loss) | | | $(43,674,129 | ) |
Change in net assets from operations | | | $(32,608,861 | ) |
See Notes to Financial Statements
24
MFS Global Tactical Allocation Portfolio
FINANCIAL STATEMENTS | STATEMENTS OF CHANGES IN NET ASSETS
These statements describe the increases and/or decreases in net assets resulting from operations, any distributions, and any shareholder transactions.
| | | | | | | | |
| | | Year ended | |
| | | 12/31/18 | | | 12/31/17 | |
Change in net assets | | | | | | | | |
| | |
From operations | | | | | | | | |
Net investment income (loss) | | | $11,065,268 | | | | $11,049,781 | |
Net realized gain (loss) | | | 23,197,631 | | | | 24,717,280 | |
Net unrealized gain (loss) | | | (66,871,760 | ) | | | 43,454,716 | |
Change in net assets from operations | | | $(32,608,861 | ) | | | $79,221,777 | |
Total distributions to shareholders (a) | | | $(33,921,546 | ) | | | $(24,775,424 | ) |
Change in net assets from fund share transactions | | | $(89,026,534 | ) | | | $(83,723,186 | ) |
Total change in net assets | | | $(155,556,941 | ) | | | $(29,276,833 | ) |
| | |
Net assets | | | | | | | | |
At beginning of period | | | 762,551,623 | | | | 791,828,456 | |
At end of period (b) | | | $606,994,682 | | | | $762,551,623 | |
| (a) | Distributions from net investment income and from net realized gain are no longer required to be separately disclosed. See Note 2. For the year ended December 31, 2017, distributions from net investment income and from net realized gain were $22,895,168 and $1,880,256, respectively. |
| (b) | Parenthetical disclosure of undistributed net investment income is no longer required. See Note 2. For the year ended December 31, 2017, end of period net assets included undistributed net investment income of $702,927. |
See Notes to Financial Statements
25
MFS Global Tactical Allocation Portfolio
FINANCIAL STATEMENTS | FINANCIAL HIGHLIGHTS
The financial highlights table is intended to help you understand the fund’s financial performance for the past 5 years. Certain information reflects financial results for a single fund share. The total returns in the table represent the rate that an investor would have earned (or lost) on an investment in the fund share class (assuming reinvestment of all distributions) held for the entire period.
| | | | | | | | | | | | | | | | | | | | |
| Initial Class | | Year ended | |
| | | | | |
| | | 12/31/18 | | | 12/31/17 | | | 12/31/16 | | | 12/31/15 | | | 12/31/14 | |
| | | | | |
Net asset value, beginning of period | | | $16.11 | | | | $15.04 | | | | $14.92 | | | | $16.43 | | | | $16.20 | |
| | | | | |
| Income (loss) from investment operations | | | | | | | | | | | | | | | | | | | | |
Net investment income (loss) (d) | | | $0.29 | | | | $0.26 | | | | $0.29 | (c) | | | $0.29 | | | | $0.37 | |
Net realized and unrealized gain (loss) | | | (0.99 | ) | | | 1.36 | | | | 0.67 | | | | (0.66 | ) | | | 0.36 | |
Total from investment operations | | | $(0.70 | ) | | | $1.62 | | | | $0.96 | | | | $(0.37 | ) | | | $0.73 | |
| | | | | |
| Less distributions declared to shareholders | | | | | | | | | | | | | | | | | | | | |
From net investment income | | | $(0.13 | ) | | | $(0.51 | ) | | | $— | | | | $(0.87 | ) | | | $(0.48 | ) |
From net realized gain | | | (0.70 | ) | | | (0.04 | ) | | | (0.84 | ) | | | (0.27 | ) | | | (0.02 | ) |
Total distributions declared to shareholders | | | $(0.83 | ) | | | $(0.55 | ) | | | $(0.84 | ) | | | $(1.14 | ) | | | $(0.50 | ) |
Net asset value, end of period (x) | | | $14.58 | | | | $16.11 | | | | $15.04 | | | | $14.92 | | | | $16.43 | |
Total return (%) (k)(r)(s)(x) | | | (4.50 | ) | | | 10.83 | | | | 6.24 | (c) | | | (2.23 | ) | | | 4.46 | |
| | | | | |
Ratios (%) (to average net assets)
and Supplemental data: | | | | | | | | | | | | | | | | | | | | |
Expenses before expense reductions (f) | | | 0.81 | | | | 0.81 | | | | 0.79 | (c) | | | 0.76 | | | | 0.76 | |
Expenses after expense reductions (f) | | | 0.80 | | | | 0.80 | | | | 0.78 | (c) | | | 0.75 | | | | 0.75 | |
Net investment income (loss) | | | 1.83 | | | | 1.64 | | | | 1.88 | (c) | | | 1.80 | | | | 2.23 | |
Portfolio turnover | | | 86 | | | | 35 | | | | 38 | | | | 57 | | | | 32 | |
Net assets at end of period (000 omitted) | | | $47,517 | | | | $56,096 | | | | $58,053 | | | | $63,253 | | | | $76,670 | |
| |
| Service Class | | Year ended | |
| | | | | |
| | | 12/31/18 | | | 12/31/17 | | | 12/31/16 | | | 12/31/15 | | | 12/31/14 | |
Net asset value, beginning of period | | | $15.84 | | | | $14.79 | | | | $14.72 | | | | $16.22 | | | | $15.99 | |
| | | | | |
| Income (loss) from investment operations | | | | | | | | | | | | | | | | | | | | |
Net investment income (loss) (d) | | | $0.24 | | | | $0.22 | | | | $0.25 | (c) | | | $0.25 | | | | $0.33 | |
Net realized and unrealized gain (loss) | | | (0.98 | ) | | | 1.34 | | | | 0.66 | | | | (0.66 | ) | | | 0.35 | |
Total from investment operations | | | $(0.74 | ) | | | $1.56 | | | | $0.91 | | | | $(0.41 | ) | | | $0.68 | |
| | | | | |
| Less distributions declared to shareholders | | | | | | | | | | | | | | | | | | | | |
From net investment income | | | $(0.08 | ) | | | $(0.47 | ) | | | $— | | | | $(0.82 | ) | | | $(0.43 | ) |
From net realized gain | | | (0.70 | ) | | | (0.04 | ) | | | (0.84 | ) | | | (0.27 | ) | | | (0.02 | ) |
Total distributions declared to shareholders | | | $(0.78 | ) | | | $(0.51 | ) | | | $(0.84 | ) | | | $(1.09 | ) | | | $(0.45 | ) |
Net asset value, end of period (x) | | | $14.32 | | | | $15.84 | | | | $14.79 | | | | $14.72 | | | | $16.22 | |
Total return (%) (k)(r)(s)(x) | | | (4.80 | ) | | | 10.58 | | | | 5.98 | (c) | | | (2.49 | ) | | | 4.25 | |
| | | | | |
Ratios (%) (to average net assets)
and Supplemental data: | | | | | | | | | | | | | | | | | | | | |
Expenses before expense reductions (f) | | | 1.06 | | | | 1.06 | | | | 1.04 | (c) | | | 1.01 | | | | 1.01 | |
Expenses after expense reductions (f) | | | 1.05 | | | | 1.05 | | | | 1.03 | (c) | | | 1.00 | | | | 1.00 | |
Net investment income (loss) | | | 1.58 | | | | 1.39 | | | | 1.63 | (c) | | | 1.55 | | | | 2.00 | |
Portfolio turnover | | | 86 | | | | 35 | | | | 38 | | | | 57 | | | | 32 | |
Net assets at end of period (000 omitted) | | | $559,478 | | | | $706,456 | | | | $733,775 | | | | $773,721 | | | | $912,616 | |
See Notes to Financial Statements
26
MFS Global Tactical Allocation Portfolio
Financial Highlights – continued
| (c) | Amount reflects aone-time reimbursement of expenses by the custodian (or former custodian) without which net investment income and performance would be lower and expenses would be higher. |
| (d) | Per share data is based on average shares outstanding. |
| (f) | Ratios do not reflect reductions from fees paid indirectly, if applicable. |
| (k) | The total return does not reflect expenses that apply to separate accounts. Inclusion of these charges would reduce the total return figures for all periods shown. |
| (r) | Certain expenses have been reduced without which performance would have been lower. |
| (s) | From time to time the fund may receive proceeds from litigation settlements, without which performance would be lower. |
| (x) | The net asset values and total returns have been calculated on net assets which include adjustments made in accordance with U.S. generally accepted accounting principles required at period end for financial reporting purposes. |
See Notes to Financial Statements
27
MFS Global Tactical Allocation Portfolio
NOTES TO FINANCIAL STATEMENTS
| (1) | | Business and Organization |
MFS Global Tactical Allocation Portfolio (the fund) is a diversified series of MFS Variable Insurance Trust II (the trust). The trust is organized as a Massachusetts business trust and is registered under the Investment Company Act of 1940, as amended, as anopen-end management investment company. The shareholders of each series of the trust are separate accounts of insurance companies, which offer variable annuity and/or life insurance products, and qualified retirement and pension plans.
The fund is an investment company and accordingly follows the investment company accounting and reporting guidance of the Financial Accounting Standards Board (FASB) Accounting Standards Codification Topic 946 Financial Services – Investment Companies.
| (2) | | Significant Accounting Policies |
General– The preparation of financial statements in conformity with U.S. generally accepted accounting principles requires management to make estimates and assumptions that affect the reported amounts of assets and liabilities, and disclosure of contingent assets and liabilities at the date of the financial statements and the reported amounts of increases and decreases in net assets from operations during the reporting period. Actual results could differ from those estimates. In the preparation of these financial statements, management has evaluated subsequent events occurring after the date of the fund’s Statement of Assets and Liabilities through the date that the financial statements were issued. The fund invests in derivatives as part of its principal investment strategy. Derivatives can be highly volatile and involve risks in addition to the risks of the underlying indicators on which the derivative is based. Derivatives can involve leverage. The fund invests in foreign securities. Investments in foreign securities are vulnerable to the effects of changes in the relative values of the local currency and the U.S. dollar and to the effects of changes in each country’s market, economic, industrial, political, regulatory, geopolitical, and other conditions.
In March 2017, the FASB issued Accounting Standards Update2017-08, Receivables – Nonrefundable Fees and Other Costs (Subtopic310-20) – Premium Amortization on Purchased Callable Debt Securities (“ASU2017-08”). For entities that hold callable debt securities at a premium, ASU2017-08 requires that the premium be amortized to the earliest call date. ASU2017-08 will be effective for fiscal years beginning after December 15, 2018, and interim periods within those fiscal years. Management has evaluated the potential impacts of ASU2017-08 and believes that adoption of ASU2017-08 will not have a material effect on the fund’s overall financial position or its overall results of operations.
In August 2018, the FASB issued Accounting Standards Update2018-13, Fair Value Measurement (Topic 820) – Disclosure Framework – Changes to the Disclosure Requirements for Fair Value Measurement (“ASU2018-13”) which introduces new fair value disclosure requirements as well as eliminates and modifies certain existing fair value disclosure requirements. ASU2018-13 would be effective for fiscal years beginning after December 15, 2019, and interim periods within those fiscal years; however, management has elected to early adopt ASU2018-13 effective with the current reporting period. The impact of the fund’s adoption was limited to changes in the fund’s financial statement disclosures regarding fair value, primarily those disclosures related to transfers between levels of the fair value hierarchy.
In August 2018, the Securities and Exchange Commission (SEC) released its Final Rule on Disclosure Update and Simplification (the “Final Rule”) which is intended to simplify an issuer’s disclosure compliance efforts by removing redundant or outdated disclosure requirements without significantly altering the mix of information provided to investors. Effective with the current reporting period, the fund adopted the Final Rule with the impacts being that the fund is no longer required to present the components of distributable earnings on the Statement of Assets and Liabilities or the sources of distributions to shareholders and the amount of undistributed net investment income on the Statements of Changes in Net Assets.
Balance Sheet Offsetting– The fund’s accounting policy with respect to balance sheet offsetting is that, absent an event of default by the counterparty or a termination of the agreement, the International Swaps and Derivatives Association (ISDA) Master Agreement, or similar agreement, does not result in an offset of reported amounts of financial assets and financial liabilities in the Statement of Assets and Liabilities across transactions between the fund and the applicable counterparty. The fund’s right to setoff may be restricted or prohibited by the bankruptcy or insolvency laws of the particular jurisdiction to which a specific master netting agreement counterparty is subject. Balance sheet offsetting disclosures, to the extent applicable to the fund, have been included in the fund’s Significant Accounting Policies note under the captions for each of the fund’sin-scope financial instruments and transactions.
Investment Valuations– Equity securities, including restricted equity securities, are generally valued at the last sale or official closing price on their primary market or exchange as provided by a third-party pricing service. Equity securities, for which there were no sales reported that day, are generally valued at the last quoted daily bid quotation on their primary market or exchange as provided by a third-party pricing service. Debt instruments and floating rate loans, including restricted debt instruments, are generally valued at an evaluated or composite bid as provided by a third-party pricing service. Short-term instruments with a maturity at issuance of 60 days or less may be valued at amortized cost, which approximates market value. Exchange-traded options are generally valued at the last sale or official closing price on their primary exchange as provided by a third-party pricing service.
28
MFS Global Tactical Allocation Portfolio
Notes to Financial Statements – continued
Exchange-traded options for which there were no sales reported that day are generally valued at the last daily bid quotation on their primary exchange as provided by a third-party pricing service. Options not traded on an exchange are generally valued at a broker/dealer bid quotation. Foreign currency options are generally valued at valuations provided by a third-party pricing service. Futures contracts are generally valued at last posted settlement price on their primary exchange as provided by a third-party pricing service. Futures contracts for which there were no trades that day for a particular position are generally valued at the closing bid quotation on their primary exchange as provided by a third-party pricing service. Forward foreign currency exchange contracts are generally valued at the mean of bid and asked prices for the time period interpolated from rates provided by a third-party pricing service for proximate time periods.Open-end investment companies are generally valued at net asset value per share. Securities and other assets generally valued on the basis of information from a third-party pricing service may also be valued at a broker/dealer bid quotation. In determining values, third-party pricing services can utilize both transaction data and market information such as yield, quality, coupon rate, maturity, type of issue, trading characteristics, and other market data. The values of foreign securities and other assets and liabilities expressed in foreign currencies are converted to U.S. dollars using the mean of bid and asked prices for rates provided by a third-party pricing service.
The Board of Trustees has delegated primary responsibility for determining or causing to be determined the value of the fund’s investments (including any fair valuation) to the adviser pursuant to valuation policies and procedures approved by the Board. If the adviser determines that reliable market quotations are not readily available, investments are valued at fair value as determined in good faith by the adviser in accordance with such procedures under the oversight of the Board of Trustees. Under the fund’s valuation policies and procedures, market quotations are not considered to be readily available for most types of debt instruments and floating rate loans and many types of derivatives. These investments are generally valued at fair value based on information from third-party pricing services. In addition, investments may be valued at fair value if the adviser determines that an investment’s value has been materially affected by events occurring after the close of the exchange or market on which the investment is principally traded (such as foreign exchange or market) and prior to the determination of the fund’s net asset value, or after the halting of trading of a specific security where trading does not resume prior to the close of the exchange or market on which the security is principally traded. Events that occur on a frequent basis after foreign markets close (such as developments in foreign markets and significant movements in the U.S. markets) and prior to the determination of the fund’s net asset value may be deemed to have a material effect on the value of securities traded in foreign markets. Accordingly, the fund’s foreign equity securities may often be valued at fair value. The adviser generally relies on third-party pricing services or other information (such as the correlation with price movements of similar securities in the same or other markets; the type, cost and investment characteristics of the security; the business and financial condition of the issuer; and trading and other market data) to assist in determining whether to fair value and at what value to fair value an investment. The value of an investment for purposes of calculating the fund’s net asset value can differ depending on the source and method used to determine value. When fair valuation is used, the value of an investment used to determine the fund’s net asset value may differ from quoted or published prices for the same investment. There can be no assurance that the fund could obtain the fair value assigned to an investment if it were to sell the investment at the same time at which the fund determines its net asset value per share.
Various inputs are used in determining the value of the fund’s assets or liabilities. These inputs are categorized into three broad levels. In certain cases, the inputs used to measure fair value may fall into different levels of the fair value hierarchy. In such cases, an investment’s level within the fair value hierarchy is based on the lowest level of input that is significant to the fair value measurement. The fund’s assessment of the significance of a particular input to the fair value measurement in its entirety requires judgment, and considers factors specific to the investment. Level 1 includes unadjusted quoted prices in active markets for identical assets or liabilities. Level 2 includes other significant observable market-based inputs (including quoted prices for similar securities, interest rates, prepayment speed, and credit risk). Level 3 includes unobservable inputs, which may include the adviser’s own
29
MFS Global Tactical Allocation Portfolio
Notes to Financial Statements – continued
assumptions in determining the fair value of investments. Other financial instruments are derivative instruments, such as futures contracts and forward foreign currency exchange contracts. The following is a summary of the levels used as of December 31, 2018 in valuing the fund’s assets or liabilities:
| | | | | | | | | | | | | | | | |
| Financial Instruments | | Level 1 | | | Level 2 | | | Level 3 | | | Total | |
| Equity Securities: | | | | | | | | | | | | | | | | |
United States | | | $104,709,331 | | | | $— | | | | $— | | | | $104,709,331 | |
Switzerland | | | — | | | | 17,198,647 | | | | — | | | | 17,198,647 | |
Japan | | | — | | | | 13,839,331 | | | | — | | | | 13,839,331 | |
United Kingdom | | | 13,268,662 | | | | — | | | | — | | | | 13,268,662 | |
France | | | 9,814,473 | | | | — | | | | — | | | | 9,814,473 | |
Canada | | | 7,027,815 | | | | — | | | | — | | | | 7,027,815 | |
Germany | | | 6,167,718 | | | | — | | | | — | | | | 6,167,718 | |
Taiwan | | | 4,352,206 | | | | — | | | | — | | | | 4,352,206 | |
Netherlands | | | 3,411,073 | | | | — | | | | — | | | | 3,411,073 | |
Other Countries | | | 9,938,268 | | | | 2,820,613 | | | | — | | | | 12,758,881 | |
| U.S. Treasury Bonds & U.S. Government Agency & Equivalents | | | — | | | | 53,268,714 | | | | — | | | | 53,268,714 | |
| Non-U.S. Sovereign Debt | | | — | | | | 149,800,787 | | | | — | | | | 149,800,787 | |
| Municipal Bonds | | | — | | | | 913,287 | | | | — | | | | 913,287 | |
| U.S. Corporate Bonds | | | — | | | | 55,881,052 | | | | — | | | | 55,881,052 | |
| Residential Mortgage-Backed Securities | | | — | | | | 53,808,652 | | | | — | | | | 53,808,652 | |
| Commercial Mortgage-Backed Securities | | | — | | | | 6,854,710 | | | | — | | | | 6,854,710 | |
| Asset-Backed Securities (including CDOs) | | | — | | | | 10,565,985 | | | | — | | | | 10,565,985 | |
| Foreign Bonds | | | — | | | | 53,983,161 | | | | — | | | | 53,983,161 | |
| Mutual Funds | | | 24,746,728 | | | | — | | | | — | | | | 24,746,728 | |
| Total | | | $183,436,274 | | | | $418,934,939 | | | | $— | | | | $602,371,213 | |
| | | | |
| Other Financial Instruments | | | | | | | | | | | | |
| Futures Contracts – Assets | | | $5,000,324 | | | | $857,300 | | | | $— | | | | $5,857,624 | |
| Futures Contracts – Liabilities | | | (6,320,446 | ) | | | (1,006,550 | ) | | | — | | | | (7,326,996 | ) |
| Forward Foreign Currency Exchange Contracts – Assets | | | — | | | | 4,232,803 | | | | — | | | | 4,232,803 | |
| Forward Foreign Currency Exchange Contracts – Liabilities | | | — | | | | (6,722,188 | ) | | | — | | | | (6,722,188 | ) |
For further information regarding security characteristics, see the Portfolio of Investments.
Inflation-Adjusted Debt Securities– The fund invests in inflation-adjusted debt securities issued by the U.S. Treasury. The principal value of these debt securities is adjusted through income according to changes in the Consumer Price Index. These debt securities typically pay a fixed rate of interest, but this fixed rate is applied to the inflation-adjusted principal amount. The principal paid at maturity of the debt security is typically equal to the inflation-adjusted principal amount, or the security’s original par value, whichever is greater. Other types of inflation-adjusted securities may use other methods to adjust for other measures of inflation.
Foreign Currency Translation– Purchases and sales of foreign investments, income, and expenses are converted into U.S. dollars based upon currency exchange rates prevailing on the respective dates of such transactions or on the reporting date for foreign denominated receivables and payables. Gains and losses attributable to foreign currency exchange rates on sales of securities are recorded for financial statement purposes as net realized gains and losses on investments. Gains and losses attributable to foreign exchange rate movements on receivables, payables, income and expenses are recorded for financial statement purposes as foreign currency transaction gains and losses. That portion of both realized and unrealized gains and losses on investments that results from fluctuations in foreign currency exchange rates is not separately disclosed.
Derivatives– The fund uses derivatives in an attempt to adjust exposure to markets, asset classes, and currencies based on the adviser’s assessment of the relative attractiveness of such markets, asset classes, and currencies. Derivatives are used to increase or decrease the fund’s exposure to markets, asset classes, or currencies resulting from the fund’s individual security selections, and to expose the fund to markets, asset classes, or currencies in which the fund’s individual security selection has resulted in little or no exposure. Derivatives are used for hedging ornon-hedging purposes. While hedging can reduce or eliminate losses, it can also reduce or eliminate gains. When the fund uses derivatives as an investment to increase or decrease market exposure, or for hedging purposes, gains and losses from derivative instruments may be substantially greater than the derivative’s original cost.
The derivative instruments used by the fund during the period were purchased options, futures contracts, and forward foreign currency exchange contracts. Depending on the type of derivative, the fund may exit a derivative position by entering into an
30
MFS Global Tactical Allocation Portfolio
Notes to Financial Statements – continued
offsetting transaction with a counterparty or exchange, negotiating an agreement with the derivative counterparty, or novating the position to a third party. The fund may be unable to promptly close out a futures position in instances where the daily fluctuation in the price for that type of future exceeds the daily limit set by the exchange. The fund’s period end derivatives, as presented in the Portfolio of Investments and the associated Derivative Contract tables, generally are indicative of the volume of its derivative activity during the period.
The following table presents, by major type of derivative contract, the fair value, on a gross basis, of the asset and liability components of derivatives held by the fund at December 31, 2018 as reported in the Statement of Assets and Liabilities:
| | | | | | | | | | |
| | | | | Fair Value (a) | |
| Risk | | Derivative Contracts | | Asset Derivatives | | | Liability Derivatives | |
| Interest Rate | | Interest Rate Futures | | | $1,989,669 | | | | $(4,544,572 | ) |
| Foreign Exchange | | Forward Foreign Currency Exchange Contracts | | | 4,232,803 | | | | (6,722,188 | ) |
| Equity | | Equity Futures | | | 3,867,955 | | | | (2,782,424 | ) |
| Equity | | Purchased Equity Options | | | 840,250 | | | | — | |
| Total | | | | | $10,930,677 | | | | $(14,049,184 | ) |
| (a) | The value of purchased options outstanding is included in investments in unaffiliated issuers, at value, within the fund’s Statement of Assets and Liabilities. Values presented in this table for futures contracts correspond to the values reported in the fund’s Portfolio of Investments. Only the current day net variation margin for futures contracts is separately reported within the fund’s Statement of Assets and Liabilities. |
The following table presents, by major type of derivative contract, the realized gain (loss) on derivatives held by the fund for the year ended December 31, 2018 as reported in the Statement of Operations:
| | | | | | | | | | | | |
| Risk | | Futures Contracts | | | Forward Foreign
Currency Exchange
Contracts | | | Unaffiliated Issuers
(Purchased Options) | |
| Interest Rate | | | $5,466,068 | | | | $— | | | | $— | |
| Foreign Exchange | | | — | | | | 5,099,627 | | | | — | |
| Equity | | | (9,983,304 | ) | | | — | | | | (115,088 | ) |
| Total | | | $(4,517,236 | ) | | | $5,099,627 | | | | $(115,088 | ) |
The following table presents, by major type of derivative contract, the change in unrealized appreciation or depreciation on derivatives held by the fund for the year ended December 31, 2018 as reported in the Statement of Operations:
| | | | | | | | | | | | |
| Risk | | Futures Contracts | | | Forward Foreign
Currency Exchange
Contracts | | | Unaffiliated Issuers
(Purchased Options) | |
| Interest Rate | | | $(2,895,821 | ) | | | $— | | | | $— | |
| Foreign Exchange | | | — | | | | 3,325,312 | | | | — | |
| Equity | | | 1,058,671 | | | | — | | | | 376,051 | |
| Total | | | $(1,837,150 | ) | | | $3,325,312 | | | | $376,051 | |
Derivative counterparty credit risk is managed through formal evaluation of the creditworthiness of all potential counterparties. On certain, but not all, uncleared derivatives, the fund attempts to reduce its exposure to counterparty credit risk whenever possible by entering into an ISDA Master Agreement on a bilateral basis. The ISDA Master Agreement gives each party to the agreement the right to terminate all transactions traded under such agreement if there is a specified deterioration in the credit quality of the other party. Upon an event of default or a termination of the ISDA Master Agreement, thenon-defaulting party has the right to close out all transactions traded under such agreement and to net amounts owed under each agreement to one net amount payable by one party to the other. This right to close out and net payments across all transactions traded under the ISDA Master Agreement could result in a reduction of the fund’s credit risk to such counterparty equal to any amounts payable by the fund under the applicable transactions, if any.
Collateral and margin requirements differ by type of derivative. For cleared derivatives (e.g., futures contracts, cleared swaps, and exchange-traded options), margin requirements are set by the clearing broker and the clearing house and collateral, in the form of cash or securities, is posted by the fund directly with the clearing broker. Collateral terms are counterparty agreement specific for uncleared derivatives (e.g., forward foreign currency exchange contracts, uncleared swap agreements, and uncleared options) and collateral, in the form of cash and securities, is held in segregated accounts with the fund’s custodian in connection with these agreements. For derivatives traded under an ISDA Master Agreement, which contains a collateral support annex, the collateral requirements are netted across all transactions traded under such counterparty-specific agreement and an amount is posted from
one party to the other to collateralize such obligations. Cash that has been segregated or delivered to cover the fund’s collateral or
31
MFS Global Tactical Allocation Portfolio
Notes to Financial Statements – continued
margin obligations under derivative contracts, if any, will be reported separately in the Statement of Assets and Liabilities as restricted cash for uncleared derivatives and/or deposits with brokers for cleared derivatives. Securities pledged as collateral or margin for the same purpose, if any, are noted in the Portfolio of Investments. The fund may be required to make payments of interest on uncovered collateral or margin obligations with the broker. Any such payments are included in “Miscellaneous” expense in the Statement of Operations.
The following table presents the fund’s derivative assets and liabilities (by type) on a gross basis as of December 31, 2018:
| | | | | | | | |
| Gross Amounts of: | | Derivative Assets | | | Derivative Liabilities | |
| Future Contracts (a) | | | $337,077 | | | | $— | |
| Forward Foreign Currency Exchange Contracts | | | 4,232,803 | | | | (6,722,188 | ) |
| Purchased Options | | | 840,250 | | | | — | |
| Total Gross Amount of Derivative Assets and Liabilities Presented in the Statement of Assets & Liabilities | | | $5,410,130 | | | | $(6,722,188 | ) |
Less: Derivatives Assets and Liabilities Not Subject to a Master Netting Agreement or Similar Arrangement | | | 1,533,224 | | | | (80,335 | ) |
| Total Gross Amount of Derivative Assets and Liabilities Subject to a Master Netting Agreement or Similar Arrangement | | | $3,876,906 | | | | $(6,641,853 | ) |
| (a) | The amount presented here represents the fund’s current day net variation margin for futures contracts. This amount, which is recognized within the fund’s Statement of Assets and Liabilities, differs from the fair value of the futures contracts which is presented in the tables that follow the fund’s Portfolio of Investments. |
The following table presents (by counterparty) the fund’s derivative assets net of amounts available for offset under Master Netting Agreements (or similar arrangements) and net of the related collateral held by the fund at December 31, 2018:
| | | | | | | | | | | | | | | | | | | | |
| | | | | | Amounts Not Offset in the
Statement of Assets & Liabilities | | | | |
| | | | | |
| | | Gross Amount of
Derivative Assets Subject
to a Master Netting
Agreement (or Similar
Arrangement) by
Counterparty | | | Financial
Instruments
Available
for Offset | | | Financial
Instruments
Collateral
Received (b) | | | Cash Collateral
Received (b) | | | Net Amount of
Derivative Assets by
Counterparty | |
| Barclays Bank PLC | | | $7,191 | | | | $(7,191 | ) | | | $— | | | | $— | | | | $— | |
| Brown Brothers Harriman | | | 8,389 | | | | (8,389 | ) | | | — | | | | — | | | | — | |
| Citibank N.A. | | | 246,324 | | | | (246,324 | ) | | | — | | | | — | | | | — | |
| Deutsche Bank AG | | | 336,904 | | | | (178,821 | ) | | | — | | | | — | | | | 158,083 | |
| Goldman Sachs International | | | 1,245,182 | | | | (1,245,182 | ) | | | — | | | | — | | | | — | |
| JPMorgan Chase Bank N.A. | | | 1,526,983 | | | | (1,526,983 | ) | | | — | | | | — | | | | — | |
| Merrill Lynch International | | | 493,339 | | | | (246,803 | ) | | | — | | | | — | | | | 246,536 | |
| Morgan Stanley Capital Services, Inc. | | | 12,594 | | | | (2,380 | ) | | | — | | | | — | | | | 10,214 | |
| Total | | | $3,876,906 | | | | $(3,462,073 | ) | | | $— | | | | $— | | | | $414,833 | |
The following table presents (by counterparty) the fund’s derivative liabilities net of amounts available for offset under Master Netting Agreements (or similar arrangements) and net of the related collateral pledged by the fund at December 31, 2018:
| | | | | | | | | | | | | | | | | | | | |
| | | | | | Amounts Not Offset in the
Statement of Assets & Liabilities | | | | |
| | | | | |
| | | Gross Amounts of
Derivative Liabilities Subject
to a Master Netting
Agreement (or Similar
Arrangement) by
Counterparty | | | Financial
Instruments
Available
for Offset | | | Financial
Instruments
Collateral
Pledged (b) | | | Cash Collateral
Pledged (b) | | | Net Amount of
Derivative Liabilities by
Counterparty | |
| Barclays Bank PLC | | | $(49,656 | ) | | | $7,191 | | | | $— | | | | $— | | | | $(42,465 | ) |
| Brown Brothers Harriman | | | (9,463 | ) | | | 8,389 | | | | — | | | | — | | | | (1,074 | ) |
| Citibank N.A. | | | (279,929 | ) | | | 246,324 | | | | — | | | | — | | | | (33,605 | ) |
| Deutsche Bank AG | | | (178,821 | ) | | | 178,821 | | | | — | | | | — | | | | — | |
| Goldman Sachs International | | | (2,564,750 | ) | | | 1,245,182 | | | | — | | | | 810,000 | | | | (509,568 | ) |
| JPMorgan Chase Bank N.A. | | | (3,310,051 | ) | | | 1,526,983 | | | | — | | | | 1,543,000 | | | | (240,068 | ) |
| Merrill Lynch International | | | (246,803 | ) | | | 246,803 | | | | — | | | | — | | | | — | |
| Morgan Stanley Capital Services, Inc. | | | (2,380 | ) | | | 2,380 | | | | — | | | | — | | | | — | |
| Total | | | $(6,641,853 | ) | | | $3,462,073 | | | | $— | | | | $2,353,000 | | | | $(826,780 | ) |
| (b) | The amount presented here may be less than the total amount of collateral (received)/pledged as the excess collateral (received)/pledged is not shown for purposes of this presentation. |
32
MFS Global Tactical Allocation Portfolio
Notes to Financial Statements – continued
Purchased Options– The fund purchased put options for a premium. Purchased put options entitle the holder to sell a specified number of shares or units of a particular security, currency or index at a specified price at a specified date or within a specified period of time. Purchasing put options may hedge against an anticipated decline in the value of portfolio securities or currency or decrease the fund’s exposure to an underlying instrument.
The premium paid is initially recorded as an investment in the Statement of Assets and Liabilities. That investment is subsequentlymarked-to-market daily with the difference between the premium paid and the market value of the purchased option being recorded as unrealized appreciation or depreciation. Premiums paid for purchased put options which have expired are treated as realized losses on investments in the Statement of Operations. Upon the exercise or closing of a purchased put option, the premium paid is offset against the proceeds on the sale of the underlying security or financial instrument in order to determine the realized gain or loss on investments.
Whether or not the option is exercised, the fund’s maximum risk of loss from purchasing an option is the amount of premium paid. All option contracts involve credit risk if the counterparty to the option contract fails to perform. For uncleared options, this risk is mitigated in cases where there is an ISDA Master Agreement between the fund and the counterparty providing for netting as described above and, where applicable, by the posting of collateral by the counterparty to the fund to cover the fund’s exposure to the counterparty under such ISDA Master Agreement.
Futures Contracts– The fund entered into futures contracts which may be used to hedge against or obtain broad market exposure, interest rate exposure, currency exposure, or to manage duration. A futures contract represents a commitment for the future purchase or sale of an asset at a specified price on a specified date.
Upon entering into a futures contract, the fund is required to deposit with the broker, either in cash or securities, an initial margin in an amount equal to a specified percentage of the notional amount of the contract. Subsequent payments (variation margin) are made or received by the fund each day, depending on the daily fluctuations in the value of the contract, and are recorded for financial statement purposes as unrealized gain or loss by the fund until the contract is closed or expires at which point the gain or loss on futures contracts is realized.
The fund bears the risk of interest rates, exchange rates or securities prices moving unexpectedly, in which case, the fund may not achieve the anticipated benefits of the futures contracts and may realize a loss. While futures contracts may present less counterparty risk to the fund since the contracts are exchange traded and the exchange’s clearinghouse guarantees payments to the broker, there is still counterparty credit risk due to the insolvency of the broker. The fund’s maximum risk of loss due to counterparty credit risk is equal to the margin posted by the fund to the broker plus any gains or minus any losses on the outstanding futures contracts.
Forward Foreign Currency Exchange Contracts– The fund entered into forward foreign currency exchange contracts for the purchase or sale of a specific foreign currency at a fixed price on a future date. These contracts may be used to hedge the fund’s currency risk or fornon-hedging purposes. For hedging purposes, the fund may enter into contracts to deliver or receive foreign currency that the fund will receive from or use in its normal investment activities. The fund may also use contracts to hedge against declines in the value of foreign currency denominated securities due to unfavorable exchange rate movements. Fornon-hedging purposes, the fund may enter into contracts with the intent of changing the relative exposure of the fund’s portfolio of securities to different currencies to take advantage of anticipated exchange rate changes.
Forward foreign currency exchange contracts are adjusted by the daily exchange rate of the underlying currency and any unrealized gains or losses are recorded as a receivable or payable for forward foreign currency exchange contracts until the contract settlement date. On contract settlement date, any gain or loss on the contract is recorded as realized gains or losses on forward foreign currency exchange contracts.
Risks may arise upon entering into these contracts from unanticipated movements in the value of the contract and from the potential inability of counterparties to meet the terms of their contracts. Generally, the fund’s maximum risk due to counterparty credit risk is the unrealized gain on the contract due to the use of Continuous Linked Settlement, a multicurrency cash settlement system for the centralized settlement of foreign transactions. This risk is mitigated in cases where there is an ISDA Master Agreement between the fund and the counterparty providing for netting as described above and, where applicable, by the posting of collateral by the counterparty to the fund to cover the fund’s exposure to the counterparty under such ISDA Master Agreement.
Security Loans– Under its Securities Lending Agency Agreement with the fund, State Street Bank and Trust Company, as lending agent, loans the securities of the fund to certain qualified institutions (the “Borrowers”) approved by the fund. Security loans can be terminated at the discretion of either the lending agent or the fund and the related securities must be returned within the earlier of the standard trade settlement period for such securities or within three business days. The loans are collateralized by cash and/or U.S. Treasury and federal agency obligations in an amount typically at least equal to the market value of the securities loaned. On loans collateralized by cash, the cash collateral is invested in a money market fund. The market value of the loaned securities is determined at the close of business of the fund and any additional required collateral is delivered to the fund on the next business day.
33
MFS Global Tactical Allocation Portfolio
Notes to Financial Statements – continued
The lending agent provides the fund with indemnification against Borrower default. In the event of Borrower default, the lending agent will, for the benefit of the fund, either purchase securities identical to those loaned or, when such purchase is commercially impracticable, pay the fund the market value of the loaned securities. In return, the lending agent assumes the fund’s rights to the related collateral. If the collateral value is less than the cost to purchase identical securities, the lending agent is responsible for the shortfall, but only to the extent that such shortfall is not due to a decline in collateral value resulting from collateral reinvestment for which the fund bears the risk of loss. A portion of the income generated upon investment of the collateral is remitted to the Borrowers, and the remainder is allocated between the fund and the lending agent. On loans collateralized by U.S. Treasury and/or federal agency obligations, a fee is received from the Borrower, and is allocated between the fund and the lending agent. Income from securities lending is separately reported in the Statement of Operations. The dividend and interest income earned on the securities loaned is accounted for in the same manner as other dividend and interest income. At December 31, 2018, there were no securities on loan or collateral outstanding.
Indemnifications– Under the fund’s organizational documents, its officers and Trustees may be indemnified against certain liabilities and expenses arising out of the performance of their duties to the fund. Additionally, in the normal course of business, the fund enters into agreements with service providers that may contain indemnification clauses. The fund’s maximum exposure under these agreements is unknown as this would involve future claims that may be made against the fund that have not yet occurred.
Investment Transactions and Income– Investment transactions are recorded on the trade date. Interest income is recorded on the accrual basis. All premium and discount is amortized or accreted for financial statement purposes in accordance with U.S. generally accepted accounting principles. Inflation-indexed bonds are fixed-income securities whose principal value is periodically adjusted upward or downward based on the rate of inflation. Interest is accrued based on the principal value, which is adjusted for inflation. Any increase or decrease in the principal amount of an inflation-indexed bond is generally recorded as an increase or decrease in interest income, respectively, even though the adjusted principal is not received until maturity. Dividends received in cash are recorded on theex-dividend date. Certain dividends from foreign securities will be recorded when the fund is informed of the dividend if such information is obtained subsequent to theex-dividend date. Dividend and interest payments received in additional securities are recorded on theex-dividend orex-interest date in an amount equal to the value of the security on such date.
The fund may receive proceeds from litigation settlements. Any proceeds received from litigation involving portfolio holdings are reflected in the Statement of Operations in realized gain/loss if the security has been disposed of by the fund or in unrealized gain/loss if the security is still held by the fund. Any other proceeds from litigation not related to portfolio holdings are reflected as other income in the Statement of Operations.
The fund invests a significant portion of its assets in asset-backed and/or mortgage-backed securities. For these securities, the value of the debt instrument also depends on the credit quality and adequacy of the underlying assets or collateral as well as whether there is a security interest in the underlying assets or collateral. Enforcing rights, if any, against the underlying assets or collateral may be difficult. U.S. Government securities not supported as to the payment of principal or interest by the U.S. Treasury, such as those issued by Fannie Mae, Freddie Mac, and the Federal Home Loan Banks, are subject to greater credit risk than are U.S. Government securities supported by the U.S. Treasury, such as those issued by Ginnie Mae.
The fund purchased or sold debt securities on a when-issued or delayed delivery basis, or in a “To Be Announced” (TBA) or “forward commitment” transaction with delivery or payment to occur at a later date beyond the normal settlement period. At the time a fund enters into a commitment to purchase or sell a security, the transaction is recorded and the value of the security acquired is reflected in the fund’s net asset value. The price of such security and the date that the security will be delivered and paid for are fixed at the time the transaction is negotiated. The value of the security may vary with market fluctuations. No interest accrues to the fund until payment takes place. At the time that a fund enters into this type of transaction, the fund is required to have sufficient cash and/or liquid securities to cover its commitments. Losses may arise due to changes in the value of the underlying securities or if the counterparty does not perform under the contract’s terms, or if the issuer does not issue the securities due to political, economic or other factors. Additionally, losses may arise due to declines in the value of the securities prior to settlement date.
To mitigate the counterparty credit risk on TBA securities and other types of forward settling mortgage-backed securities, the fund whenever possible enters into a Master Securities Forward Transaction Agreement (“MSFTA”) on a bilateral basis with each of the counterparties with whom it undertakes a significant volume of transactions. The MSFTA gives each party to the agreement the right to terminate all transactions traded under such agreement if there is a specified deterioration in the credit quality of the other party. Upon an event of default or a termination of the MSFTA, thenon-defaulting party has the right to close out all transactions traded under such agreement and to net amounts owed under each transaction to one net amount payable by one party to the other. This right to close out and net payments across all transactions traded under the MSFTA could result in a reduction of the fund’s credit risk to such counterparty equal to any amounts payable by the fund under the applicable transactions, if any.
For mortgage-backed securities traded under a MSFTA, the collateral and margining requirements are contract specific. Collateral amounts across all transactions traded under such agreement are netted and one amount is posted from one party to the other to
34
MFS Global Tactical Allocation Portfolio
Notes to Financial Statements – continued
collateralize such obligations. Cash that has been pledged to cover the fund’s collateral or margin obligations under a MSFTA, if any, will be reported separately on the Statement of Assets and Liabilities as restricted cash. Securities pledged as collateral or margin for the same purpose, if any, are noted in the Portfolio of Investments.
Tax Matters and Distributions– The fund intends to qualify as a regulated investment company, as defined under Subchapter M of the Internal Revenue Code, and to distribute all of its taxable income, including realized capital gains. As a result, no provision for federal income tax is required. The fund’s federal tax returns, when filed, will remain subject to examination by the Internal Revenue Service for a three year period. Management has analyzed the fund’s tax positions taken on federal and state tax returns for all open tax years and does not believe that there are any uncertain tax positions that require recognition of a tax liability. Foreign taxes, if any, have been accrued by the fund in the accompanying financial statements in accordance with the applicable foreign tax law. Foreign income taxes may be withheld by certain countries in which the fund invests. Additionally, capital gains realized by the fund on securities issued in or by certain foreign countries may be subject to capital gains tax imposed by those countries.
Distributions to shareholders are recorded on theex-dividend date. Income and capital gain distributions are determined in accordance with income tax regulations, which may differ from U.S. generally accepted accounting principles. Certain capital accounts in the financial statements are periodically adjusted for permanent differences in order to reflect their tax character. These adjustments have no impact on net assets or net asset value per share. Temporary differences which arise from recognizing certain items of income, expense, gain or loss in different periods for financial statement and tax purposes will reverse at some time in the future. Distributions in excess of net investment income or net realized gains are temporary overdistributions for financial statement purposes resulting from differences in the recognition or classification of income or distributions for financial statement and tax purposes.
Book/tax differences primarily relate to amortization and accretion of debt securities, wash sale loss deferrals, straddle loss deferrals, and derivative transactions.
The tax character of distributions declared to shareholders for the last two fiscal years is as follows:
| | | | | | | | |
| | | Year ended | | | Year ended | |
| | | 12/31/18 | | | 12/31/17 | |
| Ordinary income (including any short-term capital gains) | | | $16,001,318 | | | | $22,895,168 | |
| Long-term capital gains | | | 17,920,228 | | | | 1,880,256 | |
| Total distributions | | | $33,921,546 | | | | $24,775,424 | |
The federal tax cost and the tax basis components of distributable earnings were as follows:
| | | | |
| As of 12/31/18 | | | | |
| |
| Cost of investments | | | $558,676,457 | |
| Gross appreciation | | | 56,848,434 | |
| Gross depreciation | | | (17,112,435 | ) |
| Net unrealized appreciation (depreciation) | | | $39,735,999 | |
| |
| Undistributed ordinary income | | | 15,597,284 | |
| Undistributed long-term capital gain | | | 13,215,190 | |
| Other temporary differences | | | 61,991 | |
Multiple Classes of Shares of Beneficial Interest– The fund offers multiple classes of shares, which differ in their respective distribution and/or service fees. The fund’s income, realized and unrealized gain (loss), and common expenses are allocated to shareholders based on the daily net assets of each class. Dividends are declared separately for each class. Differences in per share dividend rates are generally due to differences in separate class expenses. The fund’s distributions declared to shareholders as reported in the Statements of Changes in Net Assets are presented by class as follows:
| | | | | | | | | | | | | | | | |
| | | From net investment
income | | | From net realized
gain | |
| | | | |
| | | Year ended
12/31/18 | | | Year ended
12/31/17 | | | Year ended
12/31/18 | | | Year ended
12/31/17 | |
| Initial Class | | | $407,616 | | | | $1,774,948 | | | | $2,268,848 | | | | $134,500 | |
| Service Class | | | 3,217,529 | | | | 21,120,220 | | | | 28,027,553 | | | | 1,745,756 | |
| Total | | | $3,625,145 | | | | $22,895,168 | | | | $30,296,401 | | | | $1,880,256 | |
35
MFS Global Tactical Allocation Portfolio
Notes to Financial Statements – continued
| (3) | | Transactions with Affiliates |
Investment Adviser– The fund has an investment advisory agreement with MFS to provide overall investment management and related administrative services and facilities to the fund. The management fee is computed daily and paid monthly at the following annual rates based on the fund’s average daily net assets:
| | | | |
| Up to $300 million | | | 0.75% | |
| In excess of $300 million and up to $2.5 billion | | | 0.675% | |
| In excess of $2.5 billion | | | 0.65% | |
MFS has agreed in writing to reduce its management fee by a specified amount if certain MFS mutual fund assets exceed thresholds agreed to by MFS and the fund’s Board of Trustees. For the year ended December 31, 2018, this management fee reduction amounted to $65,682, which is included in the reduction of total expenses in the Statement of Operations. The management fee incurred for the year ended December 31, 2018 was equivalent to an annual effective rate of 0.70% of the fund’s average daily net assets.
The investment adviser has agreed in writing to pay a portion of the fund’s total annual operating expenses, excluding interest, taxes, extraordinary expenses, brokerage and transaction costs, and investment-related expenses, such that total annual operating expenses do not exceed 0.90% of average daily net assets for the Initial Class shares and 1.15% of average daily net assets for the Service Class shares. This written agreement will continue until modified by the fund’s Board of Trustees, but such agreement will continue at least until April 30, 2020. For the year ended December 31, 2018, the fund’s actual operating expenses did not exceed the limit and therefore, the investment adviser did not pay any portion of the fund’s expenses related to this agreement.
Distributor– MFS Fund Distributors, Inc. (MFD), a wholly-owned subsidiary of MFS, is the distributor of shares of the fund. The Trustees have adopted a distribution plan for the Service Class shares pursuant to Rule12b-1 under the Investment Company Act of 1940.
The fund’s distribution plan provides that the fund will pay MFD distribution and/or service fees equal to 0.25% per annum of its average daily net assets attributable to Service Class shares as partial consideration for services performed and expenses incurred by MFD and financial intermediaries (including participating insurance companies that invest in the fund to fund variable annuity and variable life insurance contracts, sponsors of qualified retirement and pension plans that invest in the fund, and affiliates of these participating insurance companies and plan sponsors) in connection with the sale and distribution of the Service Class shares. MFD may subsequently pay all, or a portion, of the distribution and/or service fees to financial intermediaries.
Shareholder Servicing Agent– MFS Service Center, Inc. (MFSC), a wholly-owned subsidiary of MFS, receives a fee from the fund for its services as shareholder servicing agent. For the year ended December 31, 2018, the fee was $13,916, which equated to 0.0020% annually of the fund’s average daily net assets. MFSC also receives payment from the fund forout-of-pocket expenses paid by MFSC on behalf of the fund. For the year ended December 31, 2018, these costs amounted to $251.
Administrator– MFS provides certain financial, legal, shareholder communications, compliance, and other administrative services to the fund. Under an administrative services agreement, the fund reimburses MFS the costs incurred to provide these services. The fund is charged an annual fixed amount of $17,500 plus a fee based on average daily net assets. The administrative services fee incurred for the year ended December 31, 2018 was equivalent to an annual effective rate of 0.0156% of the fund’s average daily net assets.
Trustees’ and Officers’ Compensation– The fund pays compensation to independent Trustees in the form of a retainer, attendance fees, and additional compensation to Board and Committee chairpersons. The fund does not pay compensation directly to Trustees or officers of the fund who are also officers of the investment adviser, all of whom receive remuneration for their services to the fund from MFS. Certain officers and Trustees of the fund are officers or directors of MFS, MFD, and MFSC.
Other– This fund and certain other funds managed by MFS (the funds) have entered into a service agreement (the ISO Agreement) which provides for payment of fees solely by the funds to Tarantino LLC in return for the provision of services of an Independent Senior Officer (ISO) for the funds. Frank L. Tarantino serves as the ISO and is an officer of the funds and the sole member of Tarantino LLC. The funds can terminate the ISO Agreement with Tarantino LLC at any time under the terms of the ISO Agreement. For the year ended December 31, 2018, the fee paid by the fund under this agreement was $1,102 and is included in “Miscellaneous” expense in the Statement of Operations. MFS has agreed to bear all expenses associated with office space, other administrative support, and supplies provided to the ISO.
The fund invests in the MFS Institutional Money Market Portfolio which is managed by MFS and seeks current income consistent with preservation of capital and liquidity. This money market fund does not pay a management fee to MFS.
The fund is permitted to engage in purchase and sale transactions with funds and accounts for which MFS serves as investment adviser orsub-adviser (“cross-trades”) pursuant to a policy adopted by the Board of Trustees. This policy has been designed to
36
MFS Global Tactical Allocation Portfolio
Notes to Financial Statements – continued
ensure that cross-trades conducted by the fund comply with Rule17a-7 under the Investment Company Act of 1940. During the year ended December 31, 2018, the fund engaged in sale transactions pursuant to this policy, which amounted to $253,464. The sales transactions resulted in net realized gains (losses) of $52,902.
For the year ended December 31, 2018, purchases and sales of investments, other than purchased option transactions andshort-term obligations, were as follows:
| | | | | | | | |
| | | Purchases | | | Sales | |
| U.S. Government securities | | | $188,601,615 | | | | $160,075,267 | |
| Non-U.S. Government securities | | | $372,744,864 | | | | $462,046,428 | |
| (5) | | Shares of Beneficial Interest |
The fund’s Declaration of Trust permits the Trustees to issue an unlimited number of full and fractional shares of beneficial interest. Transactions in fund shares were as follows:
| | | | | | | | | | | | | | | | |
| | | Year ended 12/31/18 | | | Year ended 12/31/17 | |
| | | | |
| | | Shares | | | Amount | | | Shares | | | Amount | |
| Shares sold | | | | | | | | | | | | | | | | |
Initial Class | | | 80,272 | | | | $1,254,421 | | | | 284,704 | | | | $4,549,890 | |
Service Class | | | 437,166 | | | | 6,748,306 | | | | 760,671 | | | | 11,756,151 | |
| | | 517,438 | | | | $8,002,727 | | | | 1,045,375 | | | | $16,306,041 | |
| | | | |
| Shares issued to shareholders in reinvestment of distributions | | | | | | | | | | | | | | | | |
Initial Class | | | 177,720 | | | | $2,676,464 | | | | 120,394 | | | | $1,909,448 | |
Service Class | | | 2,109,729 | | | | 31,245,082 | | | | 1,465,768 | | | | 22,865,976 | |
| | | 2,287,449 | | | | $33,921,546 | | | | 1,586,162 | | | | $24,775,424 | |
| | | | |
| Shares reacquired | | | | | | | | | | | | | | | | |
Initial Class | | | (479,270 | ) | | | $(7,461,633 | ) | | | (782,642 | ) | | | $(12,462,762 | ) |
Service Class | | | (8,081,155 | ) | | | (123,489,174 | ) | | | (7,223,234 | ) | | | (112,341,889 | ) |
| | | (8,560,425 | ) | | | $(130,950,807 | ) | | | (8,005,876 | ) | | | $(124,804,651 | ) |
| | | | |
| Net change | | | | | | | | | | | | | | | | |
Initial Class | | | (221,278 | ) | | | $(3,530,748 | ) | | | (377,544 | ) | | | $(6,003,424 | ) |
Service Class | | | (5,534,260 | ) | | | (85,495,786 | ) | | | (4,996,795 | ) | | | (77,719,762 | ) |
| | | (5,755,538 | ) | | | $(89,026,534 | ) | | | (5,374,339 | ) | | | $(83,723,186 | ) |
The fund and certain other funds managed by MFS participate in a $1.25 billion unsecured committed line of credit, subject to a $1 billion sublimit, provided by a syndication of banks under a credit agreement. Borrowings may be made for temporary financing needs. Interest is charged to each fund, based on its borrowings, generally at a rate equal to the higher of the Overnight Bank Funding rate or daily one month LIBOR plus an agreed upon spread. A commitment fee, based on the average daily, unused portion of the committed line of credit, is allocated among the participating funds. In addition, the fund and other funds managed by MFS have established unsecured uncommitted borrowing arrangements with certain banks for temporary financing needs. Interest is charged to each fund, based on its borrowings, at a rate equal to the Overnight Bank Funding rate plus an agreed upon spread. For the year ended December 31, 2018, the fund’s commitment fee and interest expense were $4,044 and $0, respectively, and are included in “Miscellaneous” expense in the Statement of Operations.
| (7) | | Investments in Affiliated Issuers |
An affiliated issuer may be considered one in which the fund owns 5% or more of the outstanding voting securities, or a company which is under common control. For the purposes of this report, the fund assumes the following to be affiliated issuers:
| | | | | | | | | | | | | | | | | | |
| Affiliated Issuers | | | | Beginning
Shares/Par
Amount | | | Acquisitions
Shares/Par
Amount | | | Dispositions
Shares/Par
Amount | | | Ending
Shares/Par
Amount | |
| | | | | |
| MFS Institutional Money Market Portfolio | | | �� | | 71,788,272 | | | | 293,502,840 | | | | (340,541,910 | ) | | | 24,749,202 | |
| | | | | |
| Affiliated Issuers | | Realized
Gain (Loss) | | Change in
Unrealized
Appreciation/
Depreciation | | | Capital Gain
Distributions | | | Dividend
Income | | | Ending
Value | |
| | | | | |
| MFS Institutional Money Market Portfolio | | $(476) | | | $251 | | | | $— | | | | $453,817 | | | | $24,746,728 | |
37
MFS Global Tactical Allocation Portfolio
REPORT OF INDEPENDENT REGISTERED PUBLIC ACCOUNTING FIRM
To the Board of Trustees of MFS Variable Insurance Trust II and the Shareholders of
MFS Global Tactical Allocation Portfolio:
Opinion on the Financial Statements and Financial Highlights
We have audited the accompanying statement of assets and liabilities of MFS Global Tactical Allocation Portfolio (the “Fund”), including the portfolio of investments, as of December 31, 2018, the related statement of operations for the year then ended, the statements of changes in net assets for each of the two years in the period then ended, the financial highlights for each of the five years in the period then ended, and the related notes. In our opinion, the financial statements and financial highlights present fairly, in all material respects, the financial position of the Fund as of December 31, 2018, and the results of its operations for the year then ended, the changes in its net assets for each of the two years in the period then ended, and the financial highlights for each of the five years in the period then ended, in conformity with accounting principles generally accepted in the United States of America.
Basis for Opinion
These financial statements and financial highlights are the responsibility of the Fund’s management. Our responsibility is to express an opinion on the Fund’s financial statements and financial highlights based on our audits. We are a public accounting firm registered with the Public Company Accounting Oversight Board (United States) (PCAOB) and are required to be independent with respect to the Fund in accordance with the U.S. federal securities laws and the applicable rules and regulations of the Securities and Exchange Commission and the PCAOB.
We conducted our audits in accordance with the standards of the PCAOB. Those standards require that we plan and perform the audit to obtain reasonable assurance about whether the financial statements and financial highlights are free of material misstatement, whether due to error or fraud. The Fund is not required to have, nor were we engaged to perform, an audit of its internal control over financial reporting. As part of our audits we are required to obtain an understanding of internal control over financial reporting but not for the purpose of expressing an opinion on the effectiveness of the Fund’s internal control over financial reporting. Accordingly, we express no such opinion.
Our audits included performing procedures to assess the risks of material misstatement of the financial statements and financial highlights, whether due to error or fraud, and performing procedures that respond to those risks. Such procedures included examining, on a test basis, evidence regarding the amounts and disclosures in the financial statements and financial highlights. Our audits also included evaluating the accounting principles used and significant estimates made by management, as well as evaluating the overall presentation of the financial statements and financial highlights. Our procedures included confirmation of securities owned as of December 31, 2018, by correspondence with the custodian and brokers; when replies were not received from brokers, we performed other auditing procedures. We believe that our audits provide a reasonable basis for our opinion.
DELOITTE & TOUCHE LLP
Boston, Massachusetts
February 15, 2019
We have served as the auditor of one or more of the MFS investment companies since 1924.
38
MFS Global Tactical Allocation Portfolio
TRUSTEES AND OFFICERS – IDENTIFICATION AND BACKGROUND
The Trustees and Officers of the Trust, as of February 1, 2019, are listed below, together with their principal occupations during the past five years. (Their titles may have varied during that period.) The address of each Trustee and Officer is 111 Huntington Avenue, Boston, Massachusetts 02199-7618.
| | | | | | | | | | |
Name, Age | | Position(s)
Held with Fund | | Trustee/Officer
Since (h) | | Number of MFS Funds overseen by the Trustee | | Principal Occupations
During the Past Five Years | | Other Directorships During the Past Five Years (j) |
| INTERESTED TRUSTEES |
Robert J. Manning (k) (age 55) | | Trustee | | February 2004 | | 135 | | Massachusetts Financial Services Company, Executive Chairman (since January 2017); Director; Chairman of the Board; Chief Executive Officer (until 2015);Co-Chief Executive Officer(2015-2016) | | N/A |
| | | | | |
Robin A. Stelmach (k) (age 57) | | Trustee | | January 2014 | | 135 | | Massachusetts Financial Services Company, Vice Chair (since January 2017); Chief Operating Officer and Executive Vice President (until January 2017) | | N/A |
|
| INDEPENDENT TRUSTEES |
John P. Kavanaugh (age 64) | | Trustee and Chair of Trustees | | January 2009 | | 135 | | Private investor | | N/A |
| | | | | |
Steven E. Buller (age 67) | | Trustee | | February 2014 | | 135 | | Financial Accounting Standards Advisory Council, Chairman(2014-2015); Public Company Accounting Oversight Board, Standing Advisory Group, Member (until 2014); BlackRock, Inc. (investment management), Managing Director (until 2014), BlackRock Finco UK (investment management), Director (until 2014) | | N/A |
| | | | | |
John A. Caroselli (age 64) | | Trustee | | March 2017 | | 135 | | JC Global Advisors, LLC (management consulting), President (since 2015); First Capital Corporation (commercial finance), Executive Vice President (until 2015) | | N/A |
| | | | | |
Maureen R. Goldfarb (age 63) | | Trustee | | January 2009 | | 135 | | Private investor | | N/A |
| | | | | |
Michael Hegarty (age 74) | | Trustee | | December 2004 | | 135 | | Private investor | | Rouse Properties Inc., Director (until 2016); Capmark Financial Group Inc., Director (until 2015) |
| | | | | |
Peter D. Jones (age 63) | | Trustee | | January 2019 | | 135 | | Franklin Templeton Distributors, Inc. (investment management), President (until 2015); Franklin Templeton Institutional, LLC (investment management), Chairman (until 2015) | | N/A |
| | | | | |
James W. Kilman, Jr. (age 57) | | Trustee | | January 2019 | | 135 | | KielStrand Capital LLC (family office and merchant bank), Chief Executive Officer (since 2016); Morgan Stanley & Co. (financial services), Vice Chairman of Investment Banking,Co-Head of Diversified Financials Coverage – Financial Institutions Investment Banking Group (until 2016) | | alpha-En Corporation, Director (since 2016) |
39
MFS Global Tactical Allocation Portfolio
Trustees and Officers – continued
| | | | | | | | | | |
Name, Age | | Position(s)
Held with Fund | | Trustee/Officer
Since (h) | | Number of MFS Funds overseen by the Trustee | | Principal Occupations
During the Past Five Years | | Other Directorships During the Past Five Years (j) |
Clarence Otis, Jr. (age 62) | | Trustee | | March 2017 | | 135 | | Darden Restaurants, Inc., Chief Executive Officer (until 2014) | | VF Corporation, Director; Verizon Communications, Inc., Director; The Travelers Companies, Director; Federal Reserve Bank of Atlanta, Director (until 2015) |
| | | | | |
Maryanne L. Roepke (age 62) | | Trustee | | May 2014 | | 135 | | American Century Investments (investment management), Senior Vice President and Chief Compliance Officer (until 2014) | | N/A |
| | | | | |
Laurie J. Thomsen
(age 61) | | Trustee | | March 2005 | | 135 | | Private investor | | The Travelers Companies, Director; Dycom Industries, Inc., Director (since 2015) |
| | | | | | | | |
Name, Age | | Position(s)
Held with Fund | | Trustee/Officer
Since (h) | | Number of MFS Funds for which the Person is an Officer | | Principal Occupations During the Past Five Years |
| OFFICERS | | | | | | |
Christopher R. Bohane (k)
(age 45) | | Assistant Secretary and Assistant Clerk | | July 2005 | | 135 | | Massachusetts Financial Services Company, Vice President and Assistant General Counsel |
| | | | |
Kino Clark (k) (age 50) | | Assistant Treasurer | | January 2012 | | 135 | | Massachusetts Financial Services Company, Vice President |
| | | | |
John W. Clark, Jr. (k) (age 51) | | Assistant Treasurer | | April 2017 | | 135 | | Massachusetts Financial Services Company, Vice President (since March 2017); Deutsche Bank (financial services), Department Head – Treasurer’s Office (until February 2017) |
| | | | |
Thomas H. Connors (k) (age 59) | | Assistant Secretary and Assistant Clerk | | September 2012 | | 135 | | Massachusetts Financial Services Company, Vice President and Senior Counsel |
| | | | |
Ethan D. Corey (k)
(age 55) | | Assistant
Secretary and Assistant Clerk | | July 2005 | | 135 | | Massachusetts Financial Services Company, Senior Vice President and Associate General Counsel |
| | | | |
David L. DiLorenzo (k)
(age 50) | | President | | July 2005 | | 135 | | Massachusetts Financial Services Company, Senior Vice President |
| | | | |
Heidi W. Hardin (k) (age 51) | | Secretary and Clerk | | April 2017 | | 135 | | Massachusetts Financial Services Company, Executive Vice President and General Counsel (since March 2017); Harris Associates (investment management), General Counsel (from September 2015 to January 2017); Janus Capital Management LLC (investment management), Senior Vice President and General Counsel (until September 2015) |
| | | | |
Brian E. Langenfeld (k) (age 45) | | Assistant
Secretary and Assistant Clerk | | June 2006 | | 135 | | Massachusetts Financial Services Company, Vice President and Senior Counsel |
| | | | |
Amanda S. Mooradian (k) (age 39) | | Assistant
Secretary and Assistant Clerk | | September 2018 | | 135 | | Massachusetts Financial Services Company, Assistant Vice President and Counsel |
| | | | |
Susan A. Pereira (k)
(age 48) | | Assistant
Secretary and Assistant Clerk | | July 2005 | | 135 | | Massachusetts Financial Services Company, Vice President and Senior Counsel |
| | | | |
Kasey L. Phillips (k) (age 48) | | Assistant Treasurer | | September 2012 | | 135 | | Massachusetts Financial Services Company, Vice President |
| | | | |
Matthew A. Stowe (k) (age 44) | | Assistant Secretary and Assistant Clerk | | October 2014 | | 135 | | Massachusetts Financial Services Company, Vice President and Assistant General Counsel |
40
MFS Global Tactical Allocation Portfolio
Trustees and Officers – continued
| | | | | | | | |
Name, Age | | Position(s)
Held with Fund | | Trustee/Officer
Since (h) | | Number of MFS Funds for which the Person is an Officer | | Principal Occupations During the Past Five Years |
Frank L. Tarantino
(age 74) | | Independent
Senior Officer | | June 2004 | | 135 | | Tarantino LLC (provider of compliance services), Principal |
| | | | |
Richard S. Weitzel (k)
(age 48) | | Assistant Secretary and Assistant Clerk | | October 2007 | | 135 | | Massachusetts Financial Services Company, Senior Vice President and Associate General Counsel |
| | | | |
Martin J. Wolin (k) (age 51) | | Chief Compliance Officer | | July 2015 | | 135 | | Massachusetts Financial Services Company, Senior Vice President and Chief Compliance Officer (since July 2015); Mercer (financial service provider), Chief Risk and Compliance Officer, North America and Latin America (until June 2015) |
| | | | |
James O. Yost (k)
(age 58) | | Treasurer | | September 1990 | | 135 | | Massachusetts Financial Services Company, Senior Vice President |
| (h) | Date first appointed to serve as Trustee/officer of an MFS Fund. Each Trustee has served continuously since appointment unless indicated otherwise. For the period from December 15, 2004 until February 22, 2005, Mr. Manning served as Advisory Trustee. From January 2012 through December 2016, Messrs. DiLorenzo and Yost served as Treasurer and Deputy Treasurer of the Funds, respectively. |
| (j) | Directorships or trusteeships of companies required to report to the Securities and Exchange Commission (i.e., “public companies”). |
| (k) | “Interested person” of the Trust within the meaning of the Investment Company Act of 1940 (referred to as the 1940 Act), which is the principal federal law governing investment companies like the fund, as a result of a position with MFS. The address of MFS is 111 Huntington Avenue, Boston, Massachusetts 02199-7618. |
Each Trustee has been elected by shareholders and each Trustee and officer holds office until his or her successor is chosen and qualified or until his or her earlier death, resignation, retirement or removal. The Trust does not hold annual meetings for the purpose of electing Trustees, and Trustees are not elected for fixed terms. Under the terms of the Board’s retirement policy, an Independent Trustee shall retire at the end of the calendar year in which he or she reaches the earlier of 75 years of age or 15 years of service on the Board (or, in the case of any Independent Trustee who joined the Board prior to 2015, 20 years of service on the Board).
Messrs. Buller, Hegarty, Kilman and Otis and Ms. Roepke are members of the Trust’s Audit Committee.
Each of the Interested Trustees and certain Officers hold comparable officer positions with certain affiliates of MFS.
The Statement of Additional Information for a Fund includes further information about the Trustees and is available without charge upon request by calling1-800-225-2606.
| | |
Investment Adviser Massachusetts Financial Services Company 111 Huntington Avenue Boston, MA 02199-7618 | | Custodian State Street Bank and Trust Company 1 Lincoln Street Boston, MA 02111-2900 |
Distributor MFS Fund Distributors, Inc. 111 Huntington Avenue Boston, MA 02199-7618 | | Independent Registered Public Accounting Firm Deloitte & Touche LLP 200 Berkeley Street Boston, MA 02116 |
Portfolio Manager(s) Nevin Chitkara Pilar Gomez-Bravo Steven Gorham Vipin Narula Ben Nastou Robert Persons Jonathan Sage Natalie Shapiro Robert Spector Erik Weisman | | |
41
MFS Global Tactical Allocation Portfolio
BOARD REVIEW OF INVESTMENT ADVISORY AGREEMENT
The Investment Company Act of 1940 requires that both the full Board of Trustees and a majority of thenon-interested (“independent”) Trustees, voting separately, annually approve the continuation of the Fund’s investment advisory agreement with MFS. The Trustees consider matters bearing on the Fund and its advisory arrangements at their meetings throughout the year, including a review of performance data at each regular meeting. In addition, the independent Trustees met several times over the course of three months beginning in May and ending in July, 2018 (“contract review meetings”) for the specific purpose of considering whether to approve the continuation of the investment advisory agreement for the Fund and the other investment companies that the Board oversees (the “MFS Funds”). The independent Trustees were assisted in their evaluation of the Fund’s investment advisory agreement by independent legal counsel, from whom they received separate legal advice and with whom they met separately from MFS during various contract review meetings. The independent Trustees were also assisted in this process by the MFS Funds’ Independent Senior Officer, a senior officer appointed by and reporting to the independent Trustees.
In connection with their deliberations regarding the continuation of the investment advisory agreement, the Trustees, including the independent Trustees, considered such information and factors as they believed, in light of the legal advice furnished to them and their own business judgment, to be relevant. The investment advisory agreement for the Fund was considered separately, although the Trustees also took into account the common interests of all MFS Funds in their review. As described below, the Trustees considered the nature, quality, and extent of the various investment advisory, administrative, and shareholder services performed by MFS under the existing investment advisory agreement and other arrangements with the Fund.
In connection with their contract review meetings, the Trustees received and relied upon materials that included, among other items: (i) information provided by Broadridge Financial Solutions, Inc. (“Broadridge”), an independent third party, on the investment performance of the Fund for various time periods ended December 31, 2017 and the investment performance of a group of funds with substantially similar investment classifications/objectives (the “Broadridge performance universe”), (ii) information provided by Broadridge on the Fund’s advisory fees and other expenses and the advisory fees and other expenses of comparable funds identified by Broadridge (the “Broadridge expense group”), (iii) information provided by MFS on the advisory fees of portfolios of other clients of MFS, including institutional separate accounts and other clients, (iv) information as to whether and to what extent applicable expense waivers, reimbursements or fee “breakpoints” are observed for the Fund, (v) information regarding MFS’ financial results and financial condition, including MFS’ and certain of its affiliates’ estimated profitability from services performed for the Fund and the MFS Funds as a whole, and compared to MFS’ institutional business, (vi) MFS’ views regarding the outlook for the mutual fund industry and the strategic business plans of MFS, (vii) descriptions of various functions performed by MFS for the Funds, such as compliance monitoring and portfolio trading practices, and (viii) information regarding the overall organization of MFS, including information about MFS’ senior management and other personnel providing investment advisory, administrative and other services to the Fund and the other MFS Funds. The comparative performance, fee and expense information prepared and provided by Broadridge was not independently verified and the independent Trustees did not independently verify any information provided to them by MFS.
The Trustees’ conclusion as to the continuation of the investment advisory agreement was based on a comprehensive consideration of all information provided to the Trustees and not the result of any single factor. Some of the factors that figured particularly in the Trustees’ deliberations are described below, although individual Trustees may have evaluated the information presented differently from one another, giving different weights to various factors. It is also important to recognize that the fee arrangements for the Fund and other MFS Funds are the result of years of review and discussion between the independent Trustees and MFS, that certain aspects of such arrangements may receive greater scrutiny in some years than in others, and that the Trustees’ conclusions may be based, in part, on their consideration of these same arrangements during the course of the year and in prior years.
Based on information provided by Broadridge and MFS, the Trustees reviewed the Fund’s total return investment performance as well as the Broadridge performance universe over various time periods. The Trustees placed particular emphasis on the total return performance of the Fund’s Initial Class shares in comparison to the performance of funds in its Broadridge performance universe over the three-year period ended December 31, 2017, which the Trustees believed was a long enough period to reflect differing market conditions. The total return performance of the Fund’s Initial Class shares was in the 2nd quintile relative to the other funds in the universe for this three-year period (the 1st quintile being the best performers and the 5th quintile being the worst performers). The total return performance of the Fund’s Initial Class shares was in the 1st quintile for theone-year period and the 2nd quintile for the five-year period ended December 31, 2017 relative to the Broadridge performance universe. Because of the passage of time, these performance results may differ from the performance results for more recent periods, including those shown elsewhere in this report.
In the course of their deliberations, the Trustees took into account information provided by MFS in connection with the contract review meetings, as well as during investment review meetings conducted with portfolio management personnel during the course of the year regarding the Fund’s performance. After reviewing these and related factors, the Trustees concluded, within the context of their overall conclusions regarding the investment advisory agreement, that they were satisfied with MFS’ responses and efforts relating to investment performance.
42
MFS Global Tactical Allocation Portfolio
Board Review of Investment Advisory Agreement – continued
In assessing the reasonableness of the Fund’s advisory fee, the Trustees considered, among other information, the Fund’s advisory fee and the total expense ratio of the Fund’s Initial Class shares as a percentage of average daily net assets and the advisory fee and total expense ratios of peer groups of funds based on information provided by Broadridge. The Trustees considered that MFS currently observes an expense limitation for the Fund, which may not be changed without the Trustees’ approval. The Trustees also considered that, according to the data provided by Broadridge (which takes into account any fee reductions or expense limitations that were in effect during the Fund’s last fiscal year), the Fund’s effective advisory fee rate and total expense ratio were each approximately at the Broadridge expense group median.
The Trustees also considered the advisory fees charged by MFS to any institutional separate accounts advised by MFS (“separate accounts”) and unaffiliated investment companies for which MFS serves as subadviser (“subadvised funds”) that have comparable investment strategies to the Fund, if any. In comparing these fees, the Trustees considered information provided by MFS as to the generally broader scope of services provided by MFS to the Fund, as well as the more extensive regulatory burdens imposed on MFS in managing the Fund, in comparison to separate accounts and subadvised funds. The Trustees also considered the higher demands placed on MFS’ investment personnel and trading infrastructure as a result of the daily cashin-flows andout-flows of the Fund in comparison to separate accounts.
The Trustees also considered whether the Fund may benefit from any economies of scale in the management of the Fund in the event of growth in assets of the Fund and/or growth in assets of the MFS Funds as a whole. They noted that the Fund’s advisory fee rate schedule is subject to contractual breakpoints that reduce the Fund’s advisory fee rate on average daily net assets over $300 million and $2.5 billion. The Trustees also noted that MFS has agreed in writing to waive a portion of the management fees of certain MFS Funds, including the Fund, if the total combined assets of certain funds within the MFS Funds’ complex increase above agreed upon thresholds (the “group fee waiver”), enabling the Fund’s shareholders to share in the benefits from any economies of scale at the complex level. The group fee waiver is reviewed and renewed annually between the Board and MFS. The Trustees concluded that the breakpoints and the group fee waiver were sufficient to allow the Fund to benefit from economies of scale as its assets and overall complex assets grow.
The Trustees also considered information prepared by MFS relating to MFS’ costs and profits with respect to the Fund, the MFS Funds considered as a group, and other investment companies and accounts advised by MFS, as well as MFS’ methodologies used to determine and allocate its costs to the MFS Funds, the Fund and other accounts and products for purposes of estimating profitability.
After reviewing these and other factors described herein, the Trustees concluded, within the context of their overall conclusions regarding the investment advisory agreement, that the advisory fees charged to the Fund represent reasonable compensation in light of the services being provided by MFS to the Fund.
In addition, the Trustees considered MFS’ resources and related efforts to continue to retain, attract and motivate capable personnel to serve the Fund. The Trustees also considered current and developing conditions in the financial services industry, including the presence of large and well-capitalized companies which are spending, and appear to be prepared to continue to spend, substantial sums to engage personnel and to provide services to competing investment companies. In this regard, the Trustees also considered the financial resources of MFS and its ultimate parent, Sun Life Financial Inc. The Trustees also considered the advantages and possible disadvantages to the Fund of having an adviser that also serves other investment companies as well as other accounts.
The Trustees also considered the nature, quality, cost, and extent of administrative, transfer agency, and distribution services provided to the Fund by MFS and its affiliates under agreements and plans other than the investment advisory agreement, including any12b-1 fees the Fund pays to MFS Fund Distributors, Inc., an affiliate of MFS. The Trustees also considered the nature, extent and quality of certain other services MFS performs or arranges for on the Fund’s behalf, which may include securities lending programs, directed expense payment programs, class action recovery programs, and MFS’ interaction with third-party service providers, principally custodians andsub-custodians. The Trustees concluded that the variousnon-advisory services provided by MFS and its affiliates on behalf of the Fund were satisfactory.
The Trustees consideredso-called“fall-out benefits” to MFS such as reputational value derived from serving as investment manager to the MFS Funds. The Trustees also considered that, effective January 3, 2018, MFS had discontinued its historic practice of obtaining investment research from portfolio brokerage commissions paid by certain MFS Funds and would thereafter voluntarily reimburse a Fund, if applicable, for the costs of external research acquired through the use of the Fund’s portfolio brokerage commissions.
Based on their evaluation of factors that they deemed to be material, including those factors described above, the Board of Trustees, including the independent Trustees, concluded that the Fund’s investment advisory agreement with MFS should be continued for an additionalone-year period, commencing August 1, 2018.
43
MFS Global Tactical Allocation Portfolio
PROXY VOTING POLICIES AND INFORMATION
MFS votes proxies on behalf of the fund pursuant to proxy voting policies and procedures that are available without charge, upon request, by calling 1-800-225-2606, by visitingmfs.com/proxyvoting, or by visiting the SEC’s Web site athttp://www.sec.gov.
Information regarding how the fund voted proxies relating to portfolio securities during the most recent twelve-month period ended June 30 is available by August 31 of each year without charge by visitingmfs.com/proxyvoting, or by visiting the SEC’s Web site athttp://www.sec.gov.
QUARTERLY PORTFOLIO DISCLOSURE
The fund files a complete schedule of portfolio holdings with the SEC for the first and third quarters of each fiscal year on Form N-Q. The fund’s Form N-Q is available on the SEC’s website athttp://www.sec.gov.A shareholder can obtain the portfolio holdings report for the first and third quarters of the fund’s fiscal year atmfs.com/vit2 by choosing the fund’s name and then selecting the “Resources” tab and clicking on “Prospectus and Reports”.
FURTHER INFORMATION
From time to time, MFS may post important information about the fund or the MFS funds on the MFS web site (mfs.com). This information is available athttps://www.mfs.com/en-us/what-we-do/announcements.htmlor atmfs.com/vit2 by choosing the fund’s name.
INFORMATION ABOUT FUND CONTRACTS AND LEGAL CLAIMS
The fund has entered into contractual arrangements with an investment adviser, administrator, distributor, shareholder servicing agent, 529 program manager (if applicable), and custodian who each provide services to the fund. Unless expressly stated otherwise, shareholders are not parties to, or intended beneficiaries of these contractual arrangements, and these contractual arrangements are not intended to create any shareholder right to enforce them against the service providers or to seek any remedy under them against the service providers, either directly or on behalf of the fund.
Under the Trust’s By-Laws and Declaration of Trust, any claims asserted against or on behalf of the MFS Funds, including claims against Trustees and Officers, must be brought in state and federal courts located within the Commonwealth of Massachusetts.
FEDERAL TAX INFORMATION (unaudited)
The following information is provided pursuant to provisions of the Internal Revenue Code.
The fund designates $19,713,000 as capital gain dividends paid during the fiscal year.
For corporate shareholders, 19.64% of the ordinary income dividends paid during the fiscal year qualify for the corporate dividends received deduction.
44
rev. 3/16
| | | | |
| | | |
| FACTS | | WHAT DOES MFS DO WITH YOUR
PERSONAL INFORMATION? | |  |
| | |
| Why? | | Financial companies choose how they share your personal information. Federal law gives consumers the right to limit some but not all sharing. Federal law also requires us to tell you how we collect, share, and protect your personal information. Please read this notice carefully to understand what we do. |
| | |
| What? | | The types of personal information we collect and share depend on the product or service you have with us. This information can include: • Social Security number and account balances • Account transactions and transaction history • Checking account information and wire transfer instructions When you areno longer our customer, we continue to share your information as described in this notice. |
| | |
| How? | | All financial companies need to share customers’ personal information to run their everyday business. In the section below, we list the reasons financial companies can share their customers’ personal information; the reasons MFS chooses to share; and whether you can limit this sharing. |
| | | | |
Reasons we can share your
personal information | | Does MFS share? | | Can you limit this
sharing? |
For our everyday business purposes – such as to process your transactions, maintain your account(s), respond to court orders and legal investigations, or report to credit bureaus | | Yes | | No |
For our marketing purposes – to offer our products and services to you | | No | | We don’t share |
| For joint marketing with other financial companies | | No | | We don’t share |
For our affiliates’ everyday business purposes – information about your transactions and experiences | | No | | We don’t share |
For our affiliates’ everyday business purposes – information about your creditworthiness | | No | | We don’t share |
| For nonaffiliates to market to you | | No | | We don’t share |
| | |
| | |
| Questions? | | Call800-225-2606 or go tomfs.com. |
45
| | |
| Who we are |
| Who is providing this notice? | | MFS Funds, MFS Investment Management, MFS Institutional Advisors, Inc., and MFS Heritage Trust Company. |
| | |
| What we do |
| How does MFS protect my personal information? | | To protect your personal information from unauthorized access and use, we use security measures that comply with federal law. These measures include procedural, electronic, and physical safeguards for the protection of the personal information we collect about you. |
How does MFS
collect my personal information? | | We collect your personal information, for example, when you • open an account or provide account information • direct us to buy securities or direct us to sell your securities • make a wire transfer We also collect your personal information from others, such as credit bureaus, affiliates, or other companies. |
| Why can’t I limit all sharing? | | Federal law gives you the right to limit only • sharing for affiliates’ everyday business purposes – information about your creditworthiness • affiliates from using your information to market to you • sharing for nonaffiliates to market to you State laws and individual companies may give you additional rights to limit sharing. |
| | |
| Definitions |
| Affiliates | | Companies related by common ownership or control. They can be financial and nonfinancial companies. • MFS does not share personal information with affiliates, except for everyday business purposes as described on page one of this notice. |
| Nonaffiliates | | Companies not related by common ownership or control. They can be financial and nonfinancial companies. • MFS does not share with nonaffiliates so they can market to you. |
| Joint marketing | | A formal agreement between nonaffiliated financial companies that together market financial products or services to you. • MFS doesn’t jointly market. |
| | |
| Other important information |
| If you own an MFS product or receive an MFS service in the name of a third party such as a bank or broker-dealer, their privacy policy may apply to you instead of ours. |
46
Annual Report
December 31, 2018

MFS® Government Securities Portfolio

MFS® Variable Insurance Trust II
Beginning on January 1, 2021, as permitted by regulations adopted by the U.S. Securities and Exchange Commission, the insurance company that offers your contract may determine that it will no longer send you paper copies of the fund’s annual and semiannual shareholder reports unless you specifically request paper copies from the insurance company or from your financial intermediary. Instead, the shareholder reports will be made available on a Web site (insurancefunds.mfs.com or other Web site of which you will be notified), and the insurance company will notify you by mail each time a report is posted and provide you with a Web site link to access the report. Instructions for requesting paper copies will be provided by your insurance company or financial intermediary.
If you already elected to receive shareholder reports by email, you will not be affected by this change and you need not take any action. If your insurance company or financial intermediary offers electronic delivery, you may elect to receive shareholder reports and other communications from the insurance company or financial intermediary by email by following the instructions provided by the insurance company or financial intermediary.
Beginning on January 1, 2019, you may elect to receive all future reports in paper free of charge from the insurance company or financial intermediary. You can inform the insurance company or financial intermediary that you wish to continue receiving paper copies of your shareholder reports by contacting your insurance company or financial intermediary. Your election to receive reports in paper will apply to all funds held in your account with your insurance company or financial intermediary.
GSS-ANN
MFS® Government Securities Portfolio
CONTENTS
The report is prepared for the general information of contract owners. It is authorized for distribution to prospective investors only when preceded or accompanied by a current prospectus.
NOT FDIC INSURED• MAY LOSE VALUE• NO BANK OR CREDIT UNION GUARANTEE• NOT A DEPOSIT• NOT INSURED BY ANY FEDERAL GOVERNMENT AGENCY OR NCUA/NCUSIF
MFS Government Securities Portfolio
LETTER FROM THE EXECUTIVE CHAIRMAN

Dear Contract Owners:
Higher interest rates, international trade friction, and geopolitical uncertainty surrounding issues such as Brexit have contributed to an uptick in market volatility in recent quarters — a departure from thelow-volatility environment that prevailed for much of the past several years. Against this more challenging backdrop, equity markets in the United States outperformed most international markets on a relative basis in 2018, though broad market returns were modestly negative on an absolute basis. Global economic growth has become less synchronized over the past few quarters, with Europe, China, and some emerging markets having shown signs of significantly slowing growth. While U.S. growth has remained above average, the pace of that growth slowed in the second half of 2018.
Slowing global growth and tighter financial conditions have clouded the outlook for U.S. monetary policy, with the chairman of the U.S. Federal Reserve acknowledging that policy rates are close to levels that the Fed deems neutral for the U.S. economy. This suggests that the predictable pattern of quarterly rate increases is behind us. At the same time, markets must contend with a shift from years of quantitative easing toward a cycle of quantitative tightening now that the European Central Bank has halted asset purchases. U.S. tax reforms adopted in late 2017 have been welcomed by equity markets while emerging market economies have recently had to contend with tighter financial conditions as a result of firmer U.S. interest rates and a stronger dollar. With the Republicans losing control of the U.S. House of Representatives, further meaningful U.S. fiscal stimulus appears less likely over the remainder of this presidential term. A partial U.S. government shutdown, beginning in late 2018, also added to political uncertainty. Globally, inflation remains largely subdued thanks in part to falling oil prices, but tight labor markets and moderate global demand have investors on the lookout for its potential reappearance. Increased U.S. protectionism is also a growing concern, as investors fear trade disputes could dampen business sentiment, leading to even slower global growth. While there has been progress on this front — a NAFTA replacement has been agreed upon between the U.S., Mexico, and Canada; the free trade pact with Korea has been updated; and a negotiating framework with the European Union has been agreed upon — tensions over trade with China remain quite high, though the two sides have recently returned to the negotiating table.
As a global investment manager with nearly a century of expertise, MFS® firmly believes active risk management offers downside mitigation and may help improve investment outcomes. We built our active investment platform with this belief in mind. Ourlong-term perspective influences nearly every aspect of our business, ensuring our investment decisions align with the investing time horizons of our clients.
Respectfully,

Robert J. Manning
Executive Chairman
MFS Investment Management
February 15, 2019
The opinions expressed in this letter are subject to change and may not be relied upon for investment advice. No forecasts can be guaranteed.
1
MFS Government Securities Portfolio
PORTFOLIO COMPOSITION
Portfolio structure (i)
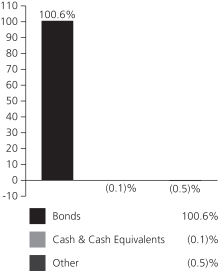
| | | | |
| Fixed income sectors (i) | | | | |
| Mortgage-Backed Securities | | | 58.4% | |
| U.S. Treasury Securities | | | 22.0% | |
| U.S. Government Agencies | | | 9.5% | |
| Investment Grade Corporates | | | 3.8% | |
| Commercial Mortgage-Backed Securities | | | 2.1% | |
| Collateralized Debt Obligations | | | 2.0% | |
| Municipal Bonds | | | 1.9% | |
| Asset-Backed Securities | | | 0.6% | |
| Non-U.S. Government Bonds | | | 0.3% | |
| | | | |
| Composition including fixed income credit quality (a)(i) | |
| AAA | | | 4.2% | |
| AA | | | 2.2% | |
| A | | | 2.7% | |
| BBB | | | 1.6% | |
| U.S. Government | | | 21.5% | |
| Federal Agencies | | | 67.9% | |
| Not Rated | | | 0.5% | |
| Cash & Cash Equivalents | | | (0.1)% | |
| Other | | | (0.5)% | |
| |
| Portfolio facts (i) | | | | |
| Average Duration (d) | | | 5.7 | |
| Average Effective Maturity (m) | | | 8.0 yrs. | |
| (a) | | For all securities other than those specifically described below, ratings are assigned to underlying securities utilizing ratings from Moody’s, Fitch, and Standard & Poor’s rating agencies and applying the following hierarchy: If all three agencies provide a rating, the middle rating (after dropping the highest and lowest ratings) is assigned; if two of the three agencies rate a security, the lower of the two is assigned. Ratings are shown in the S&P and Fitch scale (e.g., AAA). Securities rated BBB or higher are considered investment grade. All ratings are subject to change. U.S. Government includes securities issued by the U.S. Department of the Treasury. Federal Agencies includes rated and unrated U.S. Agency fixed-income securities, U.S. Agency mortgage-backed securities, and collateralized mortgage obligations of U.S. Agency mortgage-backed securities. Not Rated includes fixed income securities and fixed income derivatives, which have not been rated by any rating agency. The fund may or may not have held all of these instruments on this date. The fund is not rated by these agencies. |
| (d) | | Duration is a measure of how much a bond’s price is likely to fluctuate with general changes in interest rates, e.g., if rates rise 1.00%, a bond with a 5-year duration is likely to lose about 5.00% of its value due to the interest rate move. |
| (i) | | For purposes of this presentation, the components include the value of securities, and reflect the impact of the equivalent exposure of derivative positions, if any. These amounts may be negative from time to time. Equivalent exposure is a calculated amount that translates the derivative position into a reasonable approximation of the amount of the underlying asset that the portfolio would have to hold at a given point in time to have the same price sensitivity that results from the portfolio’s ownership of the derivative contract. When dealing with derivatives, equivalent exposure is a more representative measure of the potential impact of a position on portfolio performance than value. The bond component will include any accrued interest amounts. |
| (m) | | In determining each instrument’s effective maturity for purposes of calculating the fund’s dollar-weighted average effective maturity, MFS uses the instrument’s stated maturity or, if applicable, an earlier date on which MFS believes it is probable that a maturity-shortening device (such as a put,pre-refunding or prepayment) will cause the instrument to be repaid. Such an earlier date can be substantially shorter than the instrument’s stated maturity. |
Where the fund holds convertible bonds, they are treated as part of the equity portion of the portfolio.
Cash & Cash Equivalents includes any cash, investments in money market funds, short-term securities, and other assets less liabilities. Please see the Statement of Assets and Liabilities for additional information related to the fund’s cash position and other assets and liabilities.
2
MFS Government Securities Portfolio
Portfolio Composition – continued
From time to time Cash & Cash Equivalents may be negative due to timing of cash receipts and disbursements.
Other includes equivalent exposure from currency derivatives and/or any offsets to derivative positions and may be negative.
Percentages are based on net assets as of December 31, 2018.
The portfolio is actively managed and current holdings may be different.
3
MFS Government Securities Portfolio
MANAGEMENT REVIEW
Summary of Results
For the twelve months ended December 31, 2018, Initial Class shares of the MFS Government Securities Portfolio (“fund”) provided a total return of 0.47%, while Service Class shares of the fund provided a total return of 0.17%. These compare with a return of 0.93% over the same period for the fund’s benchmark, the Bloomberg Barclays U.S. Government/Mortgage Bond Index.
Market Environment
During the reporting period, the US Federal Reserve raised interest rates by 100 basis points, bringing the total number of rate hikes to nine since the central bank began to normalize monetary policy in late 2015. Economic growth rates in the US, Eurozone and Japan remained above trend, despite a slowing in global growth, particularly toward the end of the period. Inflation remained contained, particularly outside the US. Late in the period, the European Central Bank halted its asset purchase program but issued forward guidance that it does not expect to raise interest rates at least until after the summer of 2019. The Bank of England (once) and the Bank of Canada (three times) each raised rates during the period. The European political backdrop became a bit more volatile, late in the period, spurred by concerns over cohesion in the Eurozone after the election of an anti-establishment, Eurosceptic coalition government in Italy and widespread protests over stagnant wage growth in France.
Bond yields rose in the US during most of the period, but remained low by historical standards and slipped from their highs, late in the period, as market volatility increased. Yields in many developed markets fell. Outside of emerging markets, where spreads and currencies came under pressure, credit spreads remained quite tight until the end of the period, when thinner liquidity, lower oil prices and concerns over high degrees of corporate leverage emerged. Growing concern over increasing global trade friction appeared to have weighed on business sentiment during the period’s second half, especially outside the US. Tighter financial conditions from rising US rates and a strong dollar, combined with trade uncertainty, helped expose structural weaknesses in several emerging markets in the second half of the period.
Volatility increased, at the end of the period, amid signs of slowing global economic growth and increasing trade tensions, which prompted a market setback shortly after US markets set record highs in September. It was the second such equity market decline during the reporting period. The correction came despite a third consecutive quarter of strong growth in US earnings per share. Strong earnings growth, combined with the market decline, brought US equity valuations down from elevated levels, earlier in the period, to multiples more in line with long-term averages. While the US economy held up better than most, global economic growth became less synchronized during the period, with Europe and China showing signs of a slowdown and some emerging markets coming under stress.
Factors Affecting Performance
Relative to the Bloomberg Barclays U.S. Government/Mortgage Bond Index, the fund’snon-benchmark exposure to both thecommercial mortgage-backed securities (CMBS) andcorporatebond sectors was a detractor from performance as general credit spread widening led these sectors to underperform.
Conversely, the fund’s shorter duration (d) stance aided relative returns as interest rates generally rose throughout the reporting period. Additionally, security selection within themortgage-backed securities (MBS) Agency Fixed Ratesector benefited relative results.
Respectfully,
Portfolio Manager(s)
Geoffrey Schechter and Jake Stone
| (d) | Duration is a measure of how much a bond’s price is likely to fluctuate with general changes in interest rates, e.g., if rates rise 1.00%, a bond with a 5-year duration is likely to lose about 5.00% of its value. |
Note to Shareholders: Effective September 1, 2018, Jake Stone became a Portfolio Manager of the Fund.
The views expressed in this report are those of the portfolio manager(s) only through the end of the period of the report as stated on the cover and do not necessarily reflect the views of MFS or any other person in the MFS organization. These views are subject to change at any time based on market or other conditions, and MFS disclaims any responsibility to update such views. These views may not be relied upon as investment advice or an indication of trading intent on behalf of any MFS portfolio. References to specific securities are not recommendations of such securities, and may not be representative of any MFS portfolio’s current or future investments.
4
MFS Government Securities Portfolio
PERFORMANCE SUMMARY THROUGH 12/31/18
The following chart illustrates the historical performance of the fund in comparison to its benchmark(s). Benchmarks are unmanaged and may not be invested in directly. Benchmark returns do not reflect any fees or expenses. The performance of other share classes will be greater than or less than that of the class depicted below. (See Notes to Performance Summary.)
Performance data shown represents past performance and is no guarantee of future results. Investment return and principal value fluctuate so your units, when sold, may be worth more or less than the original cost; current performance may be lower or higher than quoted. The performance shown does not reflect the deduction of taxes, if any, that a contract holder would pay on fund distributions or the redemption of contract units. The returns for the fund shown also do not reflect the deduction of expenses associated with variable products, such as mortality and expense risk charges, separate account charges, and sales charges imposed by the insurance company separate accounts. Such expenses would reduce the overall returns shown.
Growth of a Hypothetical $10,000 Investment
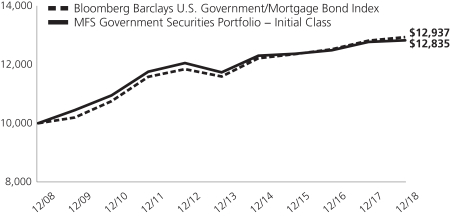
Total Returns through 12/31/18
Average annual total returns
| | | | | | | | | | | | |
| | | Share Class | | Class Inception Date | | 1-yr | | 5-yr | | 10-yr | | |
| | | Initial Class | | 6/12/85 | | 0.47% | | 1.80% | | 2.53% | | |
| | | Service Class | | 8/24/01 | | 0.17% | | 1.55% | | 2.26% | | |
| | | | |
| Comparative benchmark(s) | | | | | | | | |
| | | Bloomberg Barclays U.S. Government/Mortgage Bond Index (f) | | 0.93% | | 2.22% | | 2.61% | | |
| (f) | Source: FactSet Research Systems Inc. |
Benchmark Definition(s)
Bloomberg Barclays U.S. Government/Mortgage Bond Index – measures debt issued by the U.S. Government, and its agencies, as well as mortgage-backed pass-through securities of Ginnie Mae (GNMA), Fannie Mae (FNMA), and Freddie Mac (FHLMC).
It is not possible to invest directly in an index.
Notes to Performance Summary
Average annual total return represents the average annual change in value for each share class for the periods presented.
Performance results reflect any applicable expense subsidies and waivers in effect during the periods shown. Without such subsidies and waivers the fund’s performance results would be less favorable. Please see the prospectus and financial statements for complete details. All results are historical and assume the reinvestment of any dividends and capital gains distributions.
Performance results do not include adjustments made for financial reporting purposes in accordance with U.S. generally accepted accounting principles and may differ from amounts reported in the financial highlights.
From time to time the fund may receive proceeds from litigation settlements, without which performance would be lower.
5
MFS Government Securities Portfolio
EXPENSE TABLE
Fund Expenses Borne by the Contract Holders during the Period,
July 1, 2018 through December 31, 2018
As a contract holder of the fund, you incur ongoing costs, including management fees; distribution and/or service(12b-1) fees; and other fund expenses. This example is intended to help you understand your ongoing costs (in dollars) of investing in the fund and to compare these costs with the ongoing costs of investing in other mutual funds.
The example is based on an investment of $1,000 invested at the beginning of the period and held for the entire period July 1, 2018 through December 31, 2018.
Actual Expenses
The first line for each share class in the following table provides information about actual account values and actual expenses. You may use the information in this line, together with the amount you invested, to estimate the expenses that you paid over the period. Simply divide your account value by $1,000 (for example, an $8,600 account value divided by $1,000 = 8.6), then multiply the result by the number in the first line under the heading entitled “Expenses Paid During Period” to estimate the expenses you paid on your account during this period.
Hypothetical Example for Comparison Purposes
The second line for each share class in the following table provides information about hypothetical account values and hypothetical expenses based on the fund’s actual expense ratio and an assumed rate of return of 5% per year before expenses, which is not the fund’s actual return. The hypothetical account values and expenses may not be used to estimate the actual ending account balance or expenses you paid for the period. You may use this information to compare the ongoing costs of investing in the fund and other funds. To do so, compare this 5% hypothetical example with the 5% hypothetical examples that appear in the shareholder reports of the other funds.
Please note that the expenses shown in the table are meant to highlight the fund’s ongoing costs only and do not take into account the fees and expenses imposed under the variable contracts through which your investment in the fund is made. Therefore, the second line for each share class in the table is useful in comparing ongoing costs associated with an investment in vehicles (such as the fund) which fund benefits under variable annuity and variable life insurance contracts and to qualified pension and retirement plans only, and will not help you determine the relative total costs of investing in the fund through variable annuity and variable life insurance contracts. If the fees and expenses imposed under the variable contracts were included, your costs would have been higher.
| | | | | | | | | | | | | | | | | | |
| Share Class | | | | Annualized
Expense Ratio | | | Beginning
Account Value
7/01/18 | | | Ending
Account Value
12/31/18 | | | Expenses Paid
During Period (p)
7/01/18-12/31/18 | |
| Initial Class | | Actual | | | 0.58% | | | | $1,000.00 | | | | $1,016.17 | | | | $2.95 | |
| | Hypothetical (h) | | | 0.58% | | | | $1,000.00 | | | | $1,022.28 | | | | $2.96 | |
| Service Class | | Actual | | | 0.83% | | | | $1,000.00 | | | | $1,014.05 | | | | $4.21 | |
| | Hypothetical (h) | | | 0.83% | | | | $1,000.00 | | | | $1,021.02 | | | | $4.23 | |
| (h) | 5% class return per year before expenses. |
| (p) | “Expenses Paid During Period” are equal to each class’s annualized expense ratio, as shown above, multiplied by the average account value over the period, multiplied by 184/365 (to reflect theone-half year period). |
6
MFS Government Securities Portfolio
PORTFOLIO OF INVESTMENTS – 12/31/18
The Portfolio of Investments is a complete list of all securities owned by your fund. It is categorized by broad-based asset classes.
| | | | | | | | |
| | |
| Issuer | | Shares/Par | | | Value ($) | |
| BONDS – 99.6% | | | | | | | | |
| Asset-Backed & Securitized – 4.7% | | | | | | | | |
| A Voce CLO Ltd.,2014-1A, “A1R”, FLR, 3.596% (LIBOR - 3mo. + 1.16%), 7/15/2026 (n) | | $ | 2,195,423 | | | $ | 2,194,305 | |
| Chesapeake Funding II LLC,2018-1A, “A1”, 3.04%, 4/15/2030 (z) | | | 1,144,932 | | | | 1,144,157 | |
| Chesapeake Funding II LLC,2018-3A, “A1”, 3.39%, 1/15/2031 (z) | | | 1,700,000 | | | | 1,699,677 | |
| Commercial Mortgage Trust,2015-DC1, “A5”, 3.35%, 2/10/2048 | | | 1,536,000 | | | | 1,523,966 | |
| Commercial Mortgage Trust, 2017-COR2, “A3”, 3.51%, 9/10/2050 | | | 1,414,455 | | | | 1,390,035 | |
| CSAIL Commercial Mortgage Trust,2015-C2, “A4”, 3.504%, 6/15/2057 | | | 144,366 | | | | 144,321 | |
| Dryden Senior Loan Fund,2018-55A, “A1”, CLO, FLR, 3.456% (LIBOR - 3mo. + 1.02%), 4/15/2031 (n) | | | 1,537,212 | | | | 1,514,956 | |
| GS Mortgage Securities Trust, 2015-GC30, “A4”, 3.382%, 5/10/2050 | | | 1,965,000 | | | | 1,950,625 | |
| Loomis, Sayles & Co., CLO, “A2”, FLR, 3.836% (LIBOR - 3mo. + 1.4%), 4/15/2028 (n) | | | 1,489,774 | | | | 1,454,465 | |
| Madison Park Funding Ltd.,2014-13A, “BR2”, FLR, 3.949% (LIBOR - 3mo. + 1.5%), 4/19/2030 (n) | | | 1,572,067 | | | | 1,526,266 | |
| Morgan Stanley Bank of America Merrill Lynch Trust,2017-C34, “A4”, 3.536%, 11/15/2052 | | | 415,862 | | | | 410,096 | |
| Morgan Stanley Capital I Trust,2018-H4, “XA”, 0.868%, 12/15/2051 (i) | | | 6,278,789 | | | | 410,595 | |
| Symphony CLO Ltd.,2016-17A, “BR”, FLR, 3.636% (LIBOR - 3mo. + 1.2%), 4/15/2028 (n) | | | 1,332,260 | | | | 1,298,013 | |
| TICP CLO Ltd., FLR, 3.309% (LIBOR - 3mo. + 0.8%), 4/20/2028 (n) | | | 1,261,352 | | | | 1,243,026 | |
| UBS Commercial Mortgage Trust,2017-C1, “A4”, 3.544%, 11/15/2050 | | | 968,000 | | | | 958,882 | |
| Wells Fargo Commercial Mortgage Trust,2015-C28, “A4”, 3.54%, 5/15/2048 | | | 1,937,516 | | | | 1,939,602 | |
| Wells Fargo Commercial Mortgage Trust, 2015-NXS1, “A5”, 3.148%, 5/15/2048 | | | 918,829 | | | | 902,291 | |
| Wells Fargo Commercial Mortgage Trust,2018-C48, “XA” , 0.957%, 1/15/2052 (i)(z) | | | 3,757,641 | | | | 274,263 | |
| West CLO Ltd.2013-1A, “A1AR”, FLR, 3.749% (LIBOR - 3mo. + 1.16%), 11/07/2025 (n) | | | 452,640 | | | | 452,417 | |
| | | | | | | | |
| | | | | | $ | 22,431,958 | |
| | | | | | | | |
| Business Services – 0.3% | | | | | | | | |
| Cisco Systems, Inc., 2.6%, 2/28/2023 | | $ | 1,271,000 | | | $ | 1,245,725 | |
| | | | | | | | |
| Chemicals – 0.3% | | | | | | | | |
| Sherwin Williams Co., 2.75%, 6/01/2022 | | $ | 1,673,000 | | | $ | 1,619,402 | |
| | | | | | | | |
| | | | | | | | |
| | |
| Issuer | | Shares/Par | | | Value ($) | |
| BONDS – continued | | | | | | | | |
| Computer Software – 0.1% | | | | | | | | |
| Microsoft Corp., 3.125%, 11/03/2025 | | $ | 541,000 | | | $ | 535,329 | |
| | | | | | | | |
| Computer Software – Systems – 0.3% | |
| Apple, Inc., 3.25%, 2/23/2026 | | $ | 1,696,000 | | | $ | 1,656,329 | |
| | | | | | | | |
| Conglomerates – 0.2% | | | | | | | | |
| United Technologies Corp., 3.95%, 8/16/2025 | | $ | 764,000 | | | $ | 758,426 | |
| | | | | | | | |
| Consumer Products – 0.3% | | | | | | | | |
| Reckitt Benckiser Treasury Services PLC, 2.75%, 6/26/2024 (n) | | $ | 1,311,000 | | | $ | 1,238,955 | |
| | | | | | | | |
| Food & Beverages – 0.2% | | | | | | | | |
| Anheuser-Busch InBev Finance, Inc., 2.65%, 2/01/2021 | | $ | 977,000 | | | $ | 960,299 | |
| | | | | | | | |
| Local Authorities – 0.2% | | | | | | | | |
| Philadelphia, PA, School District Rev., | | | | | | | | |
| “A”, AGM, 5.995%, 9/01/2030 | | $ | 960,000 | | | $ | 1,132,579 | |
| | | | | | | | |
| Major Banks – 0.1% | | | | | | | | |
| UBS Group Funding (Switzerland) AG, 3.491%, 5/23/2023 (n) | | $ | 565,000 | | | $ | 550,972 | |
| | | | | | | | |
| Medical & Health Technology & Services – 0.4% | |
| Montefiore Obligated Group, 5.246%, 11/01/2048 | | $ | 2,012,000 | | | $ | 2,106,186 | |
| | | | | | | | |
| Mortgage-Backed – 58.3% | | | | | | | | |
| Fannie Mae, 5.6%, 1/01/2019 | | $ | 326,393 | | | $ | 325,674 | |
| Fannie Mae, 5%, 4/01/2019 - 3/01/2041 | | | 5,271,287 | | | | 5,589,255 | |
| Fannie Mae, 5.5%, 5/01/2019 - 3/01/2038 | | | 7,332,328 | | | | 7,891,742 | |
| Fannie Mae, 4.5%, 6/01/2019 - 6/01/2044 | | | 15,614,683 | | | | 16,339,283 | |
| Fannie Mae, 4.785%, 8/01/2019 | | | 1,294,696 | | | | 1,305,646 | |
| Fannie Mae, 5.05%, 8/01/2019 | | | 289,246 | | | | 291,594 | |
| Fannie Mae, 4.67%, 9/01/2019 | | | 495,388 | | | | 500,357 | |
| Fannie Mae, 1.99%, 10/01/2019 | | | 917,079 | | | | 915,175 | |
| Fannie Mae, 4.14%, 8/01/2020 | | | 412,101 | | | | 419,823 | |
| Fannie Mae, 6%, 2/01/2021 - 7/01/2037 | | | 911,588 | | | | 991,005 | |
| Fannie Mae, 2.56%, 10/01/2021 | | | 226,970 | | | | 225,206 | |
| Fannie Mae, 2.67%, 3/01/2022 | | | 435,781 | | | | 433,300 | |
| Fannie Mae, 2.152%, 1/25/2023 | | | 1,600,000 | | | | 1,561,095 | |
| Fannie Mae, 2.73%, 4/01/2023 | | | 492,730 | | | | 490,001 | |
| Fannie Mae, 2.41%, 5/01/2023 | | | 621,837 | | | | 613,701 | |
| Fannie Mae, 2.55%, 5/01/2023 | | | 535,054 | | | | 530,981 | |
| Fannie Mae, 2.59%, 5/01/2023 | | | 341,234 | | | | 339,166 | |
| Fannie Mae, 3.5%, 5/25/2025 - 1/01/2047 | | | 25,719,862 | | | | 25,836,995 | |
| Fannie Mae, 2.28%, 11/01/2026 | | | 262,018 | | | | 249,090 | |
| Fannie Mae, 2.597%, 12/25/2026 | | | 1,032,000 | | | | 982,084 | |
| Fannie Mae, 3.043%, 3/25/2028 | | | 1,276,000 | | | | 1,241,151 | |
| Fannie Mae, 3.23%, 1/01/2029 | | | 873,383 | | | | 861,946 | |
| Fannie Mae, 6.5%, 9/01/2031 - 10/01/2037 | | | 756,507 | | | | 849,801 | |
| Fannie Mae, 3%, 12/01/2031 - 11/01/2046 | | | 14,095,680 | | | | 13,904,908 | |
| Fannie Mae, 4%, 9/01/2040 - 2/01/2045 | | | 34,948,618 | | | | 35,930,899 | |
| Fannie Mae, 2%, 5/25/2044 | | | 753,904 | | | | 727,140 | |
| Fannie Mae, TBA, 2.5%, 1/17/2034 | | | 875,000 | | | | 854,553 | |
7
MFS Government Securities Portfolio
Portfolio of Investments – continued
| | | | | | | | |
| | |
| Issuer | | Shares/Par | | | Value ($) | |
| BONDS – continued | | | | | | | | |
| Mortgage-Backed – continued | | | | | | | | |
| Fannie Mae, TBA, 3%, 1/17/2034 | | $ | 3,600,000 | | | $ | 3,592,272 | |
| Fannie Mae, TBA, 3.5%, 1/17/2034 | | | 3,075,000 | | | | 3,112,507 | |
| Freddie Mac, 2.086%, 3/25/2019 | | | 1,288,712 | | | | 1,285,380 | |
| Freddie Mac, 1.883%, 5/25/2019 | | | 3,438,049 | | | | 3,425,570 | |
| Freddie Mac, 6%, 8/01/2019 - 10/01/2038 | | | 2,502,907 | | | | 2,714,449 | |
| Freddie Mac, 2.456%, 8/25/2019 | | | 1,236,312 | | | | 1,231,934 | |
| Freddie Mac, 4.186%, 8/25/2019 | | | 814,000 | | | | 816,221 | |
| Freddie Mac, 1.869%, 11/25/2019 | | | 2,573,177 | | | | 2,551,603 | |
| Freddie Mac, 4.251%, 1/25/2020 | | | 1,449,000 | | | | 1,461,929 | |
| Freddie Mac, 2.313%, 3/25/2020 | | | 1,473,554 | | | | 1,462,799 | |
| Freddie Mac, 4.224%, 3/25/2020 | | | 1,854,785 | | | | 1,877,796 | |
| Freddie Mac, 5%, 4/01/2020 - 6/01/2040 | | | 1,000,683 | | | | 1,057,773 | |
| Freddie Mac, 3.808%, 8/25/2020 | | | 999,000 | | | | 1,008,632 | |
| Freddie Mac, 3.034%, 10/25/2020 | | | 1,318,347 | | | | 1,317,759 | |
| Freddie Mac, 2.455%, 3/25/2022 | | | 1,066,892 | | | | 1,057,873 | |
| Freddie Mac, 5.5%, 5/01/2022 - 6/01/2041 | | | 1,773,218 | | | | 1,913,727 | |
| Freddie Mac, 2.716%, 6/25/2022 | | | 1,616,064 | | | | 1,605,176 | |
| Freddie Mac,4.5%, 11/01/2022 - 5/01/2042 | | | 2,754,463 | | | | 2,878,452 | |
| Freddie Mac, 2.51%, 11/25/2022 | | | 2,326,000 | | | | 2,291,160 | |
| Freddie Mac, 3.32%, 2/25/2023 | | | 1,993,000 | | | | 2,020,938 | |
| Freddie Mac, 3.25%, 4/25/2023 | | | 3,500,000 | | | | 3,539,250 | |
| Freddie Mac,3.3%, 4/25/2023 - 10/25/2026 | | | 4,406,044 | | | | 4,444,075 | |
| Freddie Mac, 3.06%, 7/25/2023 | | | 1,286,000 | | | | 1,291,212 | |
| Freddie Mac, 0.881%, 4/25/2024 (i) | | | 16,676,689 | | | | 631,113 | |
| Freddie Mac, 0.618%, 7/25/2024 (i) | | | 17,843,369 | | | | 500,856 | |
| Freddie Mac, 3.064%, 8/25/2024 | | | 1,703,107 | | | | 1,707,889 | |
| Freddie Mac, 2.67%, 12/25/2024 | | | 3,924,000 | | | | 3,844,736 | |
| Freddie Mac, 2.811%, 1/25/2025 | | | 3,025,000 | | | | 2,983,818 | |
| Freddie Mac, 3.329%, 5/25/2025 | | | 3,082,000 | | | | 3,123,916 | |
| Freddie Mac, 4%, 7/01/2025 - 4/01/2044 | | | 2,594,741 | | | | 2,659,891 | |
| Freddie Mac, 3.01%, 7/25/2025 | | | 904,000 | | | | 899,194 | |
| Freddie Mac, 2.745%, 1/25/2026 | | | 2,656,000 | | | | 2,591,058 | |
| Freddie Mac, 3.224%, 3/25/2027 | | | 2,380,000 | | | | 2,375,408 | |
| Freddie Mac, 3.243%, 4/25/2027 | | | 2,062,000 | | | | 2,058,583 | |
| Freddie Mac, 3.117%, 6/25/2027 | | | 1,490,000 | | | | 1,473,556 | |
| Freddie Mac, 0.578%, 7/25/2027 (i) | | | 30,010,367 | | | | 1,261,351 | |
| Freddie Mac, 3.194%, 7/25/2027 | | | 2,152,000 | | | | 2,137,661 | |
| Freddie Mac, 0.436%, 8/25/2027 (i) | | | 25,147,000 | | | | 803,615 | |
| Freddie Mac, 3.187%, 9/25/2027 | | | 4,857,000 | | | | 4,812,004 | |
| Freddie Mac, 3.286%, 11/25/2027 | | | 2,115,000 | | | | 2,108,780 | |
| Freddie Mac, 3.444%, 12/25/2027 | | | 722,000 | | | | 728,497 | |
| Freddie Mac, 0.29%, 1/25/2028 (i) | | | 42,816,064 | | | | 1,046,442 | |
| Freddie Mac, 0.302%, 1/25/2028 (i) | | | 17,629,911 | | | | 444,757 | |
| Freddie Mac, 0.134%, 2/25/2028 (i) | | | 49,882,900 | | | | 662,545 | |
| Freddie Mac, 0.119%, 4/25/2028 (i) | | | 32,061,154 | | | | 398,921 | |
| Freddie Mac, 3.85%, 5/25/2028 | | | 1,423,000 | | | | 1,479,728 | |
| Freddie Mac, 6.5%, 8/01/2032 - 5/01/2037 | | | 465,659 | | | | 525,764 | |
| Freddie Mac,3.5%, 11/01/2037 - 1/01/2047 | | | 29,615,095 | | | | 29,777,690 | |
| Freddie Mac, 3%, 1/01/2038 - 11/01/2046 | | | 17,432,704 | | | | 17,102,111 | |
| Ginnie Mae, 5.5%, 7/15/2033 - 1/20/2042 | | | 1,661,134 | | | | 1,791,103 | |
| Ginnie Mae, 4.5%, 8/15/2039 - 9/20/2041 | | | 3,886,420 | | | | 4,075,188 | |
| Ginnie Mae, 4%, 10/15/2039 - 4/20/2041 | | | 811,117 | | | | 836,080 | |
| | | | | | | | |
| | |
| Issuer | | Shares/Par | | | Value ($) | |
| BONDS – continued | | | | | | | | |
| Mortgage-Backed – continued | | | | | | | | |
| Ginnie Mae, 3.5%, 12/15/2041 - 6/20/2043 | | $ | 5,364,214 | | | $ | 5,427,234 | |
| Ginnie Mae, 3%, 11/20/2047 - 2/20/2048 | | | 11,126,467 | | | | 10,950,783 | |
| Ginnie Mae, 6.158%, 4/20/2058 | | | 38,428 | | | | 40,282 | |
| Ginnie Mae, 0.659%, 2/16/2059 (i) | | | 2,319,533 | | | | 140,476 | |
| Ginnie Mae, TBA, 3.5%, 1/23/2049 | | | 1,400,000 | | | | 1,409,548 | |
| | | | | | | | |
| | | | | | $ | 280,970,636 | |
| | | | | | | | |
| Municipals – 1.7% | | | | | | | | |
| New Jersey Economic Development Authority State Pension Funding Rev., Capital Appreciation, “B”, 0%, 2/15/2023 | | $ | 4,114,000 | | | $ | 3,520,926 | |
| State of California (Build America Bonds), 7.6%, 11/01/2040 | | | 1,935,000 | | | | 2,817,766 | |
| University of California Rev. (Build America Bonds), 5.77%, 5/15/2043 | | | 1,345,000 | | | | 1,618,318 | |
| | | | | | | | |
| | | | | | $ | 7,957,010 | |
| | | | | | | | |
| Other Banks & Diversified Financials – 0.6% | |
| Banque Federative du Credit Mutuel S.A., 2.5%, 4/13/2021 (n) | | $ | 1,492,000 | | | $ | 1,463,747 | |
| ING Groep N.V., 3.15%, 3/29/2022 | | | 1,606,000 | | | | 1,579,010 | |
| | | | | | | | |
| | | | | | $ | 3,042,757 | |
| | | | | | | | |
| Restaurants – 0.3% | | | | | | | | |
| Starbucks Corp., 3.8%, 8/15/2025 | | $ | 1,651,000 | | | $ | 1,633,445 | |
| | | | | | | | |
| Supranational – 0.3% | | | | | | | | |
| Inter-American Development Bank, 4.375%, 1/24/2044 | | $ | 1,093,000 | | | $ | 1,293,775 | |
| | | | | | | | |
| Tobacco – 0.3% | | | | | | | | |
| B.A.T Capital Corp., 2.764%, 8/15/2022 | | $ | 1,283,000 | | | $ | 1,211,890 | |
| | | | | | | | |
| U.S. Government Agencies and Equivalents – 9.4% | |
| AID-Tunisia, 2.452%, 7/24/2021 | | $ | 1,444,000 | | | $ | 1,432,428 | |
| AID-Ukraine, 1.844%, 5/16/2019 | | | 2,527,000 | | | | 2,520,162 | |
| AID-Ukraine, 1.847%, 5/29/2020 | | | 1,135,000 | | | | 1,122,913 | |
| Federal Home Loan Bank, 2.375%, 3/30/2020 | | | 5,500,000 | | | | 5,487,289 | |
| Federal Home Loan Bank, 2.625%, 12/10/2021 | | | 4,800,000 | | | | 4,812,744 | |
| Federal Home Loan Bank, 3%, 12/10/2021 | | | 20,500,000 | | | | 20,709,305 | |
| Hashemite Kingdom of Jordan, 1.945%, 6/23/2019 | | | 2,205,000 | | | | 2,196,380 | |
| Private Export Funding Corp., 2.25%, 3/15/2020 | | | 594,000 | | | | 591,055 | |
| Private Export Funding Corp., 2.3%, 9/15/2020 | | | 770,000 | | | | 764,026 | |
| Small Business Administration, 6.35%, 4/01/2021 | | | 34,826 | | | | 35,596 | |
| Small Business Administration, 6.34%, 5/01/2021 | | | 45,770 | | | | 46,689 | |
| Small Business Administration, 6.44%, 6/01/2021 | | | 80,111 | | | | 82,262 | |
| Small Business Administration, 6.625%, 7/01/2021 | | | 95,269 | | | | 97,357 | |
| Small Business Administration, 6.07%, 3/01/2022 | | | 80,128 | | | | 82,205 | |
8
MFS Government Securities Portfolio
Portfolio of Investments – continued
| | | | | | | | |
| | |
| Issuer | | Shares/Par | | | Value ($) | |
| BONDS – continued | | | | | | | | |
| U.S. Government Agencies and Equivalents – continued | |
| Small Business Administration, 4.98%, 11/01/2023 | | $ | 105,108 | | | $ | 108,826 | |
| Small Business Administration, 4.77%, 4/01/2024 | | | 261,695 | | | | 269,265 | |
| Small Business Administration, 5.52%, 6/01/2024 | | | 111,818 | | | | 116,358 | |
| Small Business Administration, 4.99%, 9/01/2024 | | | 20,928 | | | | 21,650 | |
| Small Business Administration, 5.11%, 4/01/2025 | | | 163,845 | | | | 169,431 | |
| Small Business Administration, 2.21%, 2/01/2033 | | | 834,734 | | | | 812,711 | |
| Small Business Administration, 2.22%, 3/01/2033 | | | 1,454,364 | | | | 1,416,096 | |
| Small Business Administration, 3.15%, 7/01/2033 | | | 1,350,126 | | | | 1,379,962 | |
| Small Business Administration, 3.16%, 8/01/2033 | | | 736,964 | | | | 753,336 | |
| Small Business Administration, 3.62%, 9/01/2033 | | | 484,497 | | | | 500,492 | |
| | | | | | | | |
| | | | | | $ | 45,528,538 | |
| | | | | | | | |
| U.S. Treasury Obligations – 21.3% | | | | | | | | |
| U.S. Treasury Bonds, 7.875%, 2/15/2021 | | $ | 177,000 | | | $ | 196,446 | |
| U.S. Treasury Bonds, 6.25%, 8/15/2023 | | | 2,891,000 | | | | 3,358,009 | |
| U.S. Treasury Bonds, 6%, 2/15/2026 | | | 2,699,000 | | | | 3,294,376 | |
| U.S. Treasury Bonds, 6.75%, 8/15/2026 | | | 1,862,000 | | | | 2,395,004 | |
| U.S. Treasury Bonds, 6.375%, 8/15/2027 | | | 326,000 | | | | 419,169 | |
| | | | | | | | |
| | |
| Issuer | | Shares/Par | | | Value ($) | |
| BONDS – continued | | | | | | | | |
| U.S. Treasury Obligations – continued | | | | | |
| U.S. Treasury Bonds, 4.5%, 8/15/2039 | | $ | 1,287,500 | | | $ | 1,606,632 | |
| U.S. Treasury Bonds, 3.125%, 2/15/2043 | | | 8,176,700 | | | | 8,355,195 | |
| U.S. Treasury Bonds, 2.875%, 5/15/2043 | | | 13,519,500 | | | | 13,221,538 | |
| U.S. Treasury Bonds, 2.5%, 2/15/2045 | | | 21,059,000 | | | | 19,120,548 | |
| U.S. Treasury Bonds, 2.875%, 11/15/2046 | | | 2,917,000 | | | | 2,841,332 | |
| U.S. Treasury Notes, 1.75%, 11/30/2021 | | | 4,800,000 | | | | 4,702,977 | |
| U.S. Treasury Notes, 1.75%, 5/15/2022 | | | 6,594,000 | | | | 6,439,123 | |
| U.S. Treasury Notes, 2.5%, 8/15/2023 (f) | | | 25,869,000 | | | | 25,860,355 | |
| U.S. Treasury Notes, 2.5%, 5/15/2024 | | | 5,385,000 | | | | 5,375,052 | |
| U.S. Treasury Notes, 2.875%, 7/31/2025 | | | 5,161,000 | | | | 5,253,004 | |
| U.S. Treasury Notes, 2%, 8/15/2025 | | | 438,000 | | | | 422,405 | |
| | | | | | | | |
| | | | | | $ | 102,861,165 | |
| | | | | | | | |
| Utilities – Electric Power – 0.3% | | | | | | | | |
| Enel Finance International N.V., 2.875%, 5/25/2022 (n) | | $ | 1,518,000 | | | $ | 1,430,201 | |
| | | | | | | | |
Total Bonds
(Identified Cost, $483,835,927) | | | $ | 480,165,577 | |
| | | | | | | | |
| |
| INVESTMENT COMPANIES (h) – 0.0% | | | | | |
| Money Market Funds – 0.0% | | | | | | | | |
| MFS Institutional Money Market Portfolio, 2.4% (v) (Identified Cost, $26,672) | | | 26,675 | | | $ | 26,672 | |
| | | | | | | | |
OTHER ASSETS, LESS
LIABILITIES – 0.4% | | | | | | | 2,133,702 | |
| | | | | | | | |
| NET ASSETS – 100.0% | | | | | | $ | 482,325,951 | |
| | | | | | | | |
| (f) | | All or a portion of the security has been segregated as collateral for open futures contracts. |
| (h) | | An affiliated issuer, which may be considered one in which the fund owns 5% or more of the outstanding voting securities, or a company which is under common control. At period end, the aggregate values of the fund’s investments in affiliated issuers and in unaffiliated issuers were $26,672 and $480,165,577, respectively. |
| (i) | | Interest only security for which the fund receives interest on notional principal (Par amount). Par amount shown is the notional principal and does not reflect the cost of the security. |
| (n) | | Securities exempt from registration under Rule 144A of the Securities Act of 1933. These securities may be sold in the ordinary course of business in transactions exempt from registration, normally to qualified institutional buyers. At period end, the aggregate value of these securities was $14,367,323, representing 3.0% of net assets. |
| (v) | | Affiliated issuer that is available only to investment companies managed by MFS. The rate quoted for the MFS Institutional Money Market Portfolio is the annualizedseven-day yield of the fund at period end. |
| (z) | | Restricted securities are not registered under the Securities Act of 1933 and are subject to legal restrictions on resale. These securities generally may be resold in transactions exempt from registration or to the public if the securities are subsequently registered. Disposal of these securities may involve time-consuming negotiations and prompt sale at an acceptable price may be difficult. The fund holds the following restricted securities: |
| | | | | | | | | | |
| Restricted Securities | | Acquisition
Date | | Cost | | | Value | |
| | | |
| Chesapeake Funding II LLC,2018-1A, “A1”, 3.04%, 4/15/2030 | | 12/19/18 | | | $1,141,363 | | | | $1,144,157 | |
| | | |
| Chesapeake Funding II LLC,2018-3A, “A1”, 3.39%, 1/15/2031 | | 12/04/18 | | | 1,699,678 | | | | 1,699,677 | |
| | | |
| Wells Fargo Commercial Mortgage Trust,2018-C48, “XA”, 0.957%, 1/15/2052 | | 12/10/18 | | | 273,733 | | | | 274,263 | |
| | | |
| Total Restricted Securities | | | | | | | | | $3,118,097 | |
| | | |
| % of Net assets | | | | | | | | | 0.6% | |
The following abbreviations are used in this report and are defined:
| AGM | | Assured Guaranty Municipal |
| CLO | | Collateralized Loan Obligation |
9
MFS Government Securities Portfolio
Portfolio of Investments – continued
| FLR | | Floating Rate. Interest rate resets periodically based on the parenthetically disclosed reference rate plus a spread (if any). Theperiod-end rate reported may not be the current rate. All reference rates are USD unless otherwise noted. |
| LIBOR | | London Interbank Offered Rate |
| PLC | | Public Limited Company |
Derivative Contracts at 12/31/18
Futures Contracts
| | | | | | | | | | | | | | | | | | | | | | |
| Description | | Long/
Short | | | Currency | | | Contracts | | Notional
Amount | | | Expiration
Date | | | Value/
Unrealized
Appreciation
(Depreciation) | |
| Asset Derivatives | | | | | | | | | | | | | | | | | | | | | | |
| Interest Rate Futures | | | | | | | | | | | | | | | | | | | | | | |
| U.S. Treasury Note 2 yr | | | Long | | | | USD | | | 35 | | | $7,430,938 | | | | March - 2019 | | | | $48,001 | |
| | | | | | | | | | | | | | | | | | | | | | |
| Liability Derivatives | | | | | | | | | | | | | | | | | | | | | | |
| Interest Rate Futures | | | | | | | | | | | | | | | | | | | | | | |
| U.S. Treasury Bond 30 yr | | | Short | | | | USD | | | 34 | | | $4,964,000 | | | | March - 2019 | | | | $(170,656 | ) |
| | | | | | | | | | | | | | | | | | | | | | |
At December 31, 2018, the fund had liquid securities with an aggregate value of $92,969 to cover any collateral or margin obligations for certain derivative contracts.
See Notes to Financial Statements
10
MFS Government Securities Portfolio
FINANCIAL STATEMENTS | STATEMENT OF ASSETS AND LIABILITIES
This statement represents your fund’s balance sheet, which details the assets and liabilities comprising the total value of the fund.
| | | | |
At 12/31/18 | | | | |
Assets | | | | |
Investments in unaffiliated issuers, at value (identified cost, $483,835,927) | | | $480,165,577 | |
Investments in affiliated issuers, at value (identified cost, $26,672) | | | 26,672 | |
Cash | | | 344 | |
Receivables for | | | | |
Investments sold | | | 9,867,855 | |
Fund shares sold | | | 9,907 | |
Interest | | | 2,369,988 | |
Other assets | | | 3,283 | |
Total assets | | | $492,443,626 | |
Liabilities | | | | |
Payables for | | | | |
Net daily variation margin on open futures contracts | | | $11,028 | |
TBA purchase commitments | | | 8,916,191 | |
Fund shares reacquired | | | 1,071,054 | |
Payable to affiliates | | | | |
Investment adviser | | | 24,331 | |
Shareholder servicing costs | | | 69 | |
Distribution and/or service fees | | | 4,700 | |
Payable for independent Trustees’ compensation | | | 19 | |
Accrued expenses and other liabilities | | | 90,283 | |
Total liabilities | | | $10,117,675 | |
Net assets | | | $482,325,951 | |
Net assets consist of | | | | |
Paid-in capital | | | $502,216,321 | |
Total distributable earnings (loss) | | | (19,890,370 | ) |
Net assets | | | $482,325,951 | |
Shares of beneficial interest outstanding | | | 40,161,615 | |
| | | | | | | | | | | | |
| | | Net assets | | | Shares
outstanding | | | Net asset value
per share | |
Initial Class | | | $310,387,496 | | | | 25,789,435 | | | | $12.04 | |
Service Class | | | 171,938,455 | | | | 14,372,180 | | | | 11.96 | |
See Notes to Financial Statements
11
MFS Government Securities Portfolio
FINANCIAL STATEMENTS | STATEMENT OF OPERATIONS
This statement describes how much your fund earned in investment income and accrued in expenses. It also describes any gains and/or losses generated by fund operations.
| | | | |
Year ended 12/31/18 | | | | |
Net investment income (loss) | | | | |
Income | | | | |
Interest | | | $15,927,390 | |
Dividends from affiliated issuers | | | 190,927 | |
Other | | | 10,119 | |
Total investment income | | | $16,128,436 | |
Expenses | | | | |
Management fee | | | $2,918,442 | |
Distribution and/or service fees | | | 484,883 | |
Shareholder servicing costs | | | 8,340 | |
Administrative services fee | | | 85,326 | |
Independent Trustees’ compensation | | | 12,279 | |
Custodian fee | | | 30,328 | |
Shareholder communications | | | 34,161 | |
Audit and tax fees | | | 62,354 | |
Legal fees | | | 4,571 | |
Miscellaneous | | | 40,235 | |
Total expenses | | | $3,680,919 | |
Reduction of expenses by investment adviser | | | (75,095 | ) |
Net expenses | | | $3,605,824 | |
Net investment income (loss) | | | $12,522,612 | |
Realized and unrealized gain (loss) | | | | |
Realized gain (loss) (identified cost basis) | | | | |
Unaffiliated issuers | | | $(2,255,292 | ) |
Affiliated issuers | | | (2,069 | ) |
Futures contracts | | | 11,977 | |
Net realized gain (loss) | | | $(2,245,384 | ) |
Change in unrealized appreciation or depreciation | | | | |
Unaffiliated issuers | | | $(9,625,169 | ) |
Affiliated issuers | | | 327 | |
Futures contracts | | | (78,651 | ) |
Net unrealized gain (loss) | | | $(9,703,493 | ) |
Net realized and unrealized gain (loss) | | | $(11,948,877 | ) |
Change in net assets from operations | | | $573,735 | |
See Notes to Financial Statements
12
MFS Government Securities Portfolio
FINANCIAL STATEMENTS | STATEMENTS OF CHANGES IN NET ASSETS
These statements describe the increases and/or decreases in net assets resulting from operations, any distributions, and any shareholder transactions.
| | | | | | | | |
| | | Year ended | |
| | | 12/31/18 | | | 12/31/17 | |
Change in net assets | | | | | | | | |
| | |
From operations | | | | | | | | |
Net investment income (loss) | | | $12,522,612 | | | | $14,129,796 | |
Net realized gain (loss) | | | (2,245,384 | ) | | | (673,000 | ) |
Net unrealized gain (loss) | | | (9,703,493 | ) | | | (599,914 | ) |
Change in net assets from operations | | | $573,735 | | | | $12,856,882 | |
Total distributions to shareholders (a) | | | $(16,541,275 | ) | | | $(17,852,246 | ) |
Change in net assets from fund share transactions | | | $(78,202,132 | ) | | | $(43,797,662 | ) |
Total change in net assets | | | $(94,169,672 | ) | | | $(48,793,026 | ) |
| | |
Net assets | | | | | | | | |
At beginning of period | | | 576,495,623 | | | | 625,288,649 | |
At end of period (b) | | | $482,325,951 | | | | $576,495,623 | |
| (a) | Distributions from net investment income and from net realized gain are no longer required to be separately disclosed. See Note 2. For the year ended December 31, 2017, distributions from net investment income were $17,852,246. |
| (b) | Parenthetical disclosure of undistributed net investment income is no longer required. See Note 2. For the year ended December 31, 2017, end of period net assets included undistributed net investment income of $16,539,111. |
See Notes to Financial Statements
13
MFS Government Securities Portfolio
FINANCIAL STATEMENTS | FINANCIAL HIGHLIGHTS
The financial highlights table is intended to help you understand the fund’s financial performance for the past 5 years. Certain information reflects financial results for a single fund share. The total returns in the table represent the rate that an investor would have earned (or lost) on an investment in the fund share class (assuming reinvestment of all distributions) held for the entire period.
| | | | | | | | | | | | | | | | | | | | |
| Initial Class | | Year ended | |
| | | 12/31/18 | | | 12/31/17 | | | 12/31/16 | | | 12/31/15 | | | 12/31/14 | |
Net asset value, beginning of period | | | $12.39 | | | | $12.51 | | | | $12.72 | | | | $13.02 | | | | $12.73 | |
| Income (loss) from investment operations | | | | | | | | | | | | | | | | | | | | |
Net investment income (loss) (d) | | | $0.30 | | | | $0.31 | | | | $0.31 | (c) | | | $0.27 | | | | $0.26 | |
Net realized and unrealized gain (loss) | | | (0.25 | ) | | | (0.03 | ) | | | (0.17 | ) | | | (0.21 | ) | | | 0.35 | |
Total from investment operations | | | $0.05 | | | | $0.28 | | | | $0.14 | | | | $0.06 | | | | $0.61 | |
| Less distributions declared to shareholders | | | | | | | | | | | | | | | | | | | | |
From net investment income | | | $(0.40 | ) | | | $(0.40 | ) | | | $(0.35 | ) | | | $(0.36 | ) | | | $(0.32 | ) |
Net asset value, end of period (x) | | | $12.04 | | | | $12.39 | | | | $12.51 | | | | $12.72 | | | | $13.02 | |
Total return (%) (k)(r)(s)(x) | | | 0.47 | | | | 2.22 | | | | 1.04 | (c) | | | 0.47 | | | | 4.86 | |
Ratios (%) (to average net assets)
and Supplemental data: | | | | | | | | | | | | | | | | | | | | |
Expenses before expense reductions (f) | | | 0.60 | | | | 0.60 | | | | 0.57 | (c) | | | 0.60 | | | | 0.60 | |
Expenses after expense reductions (f) | | | 0.59 | | | | 0.60 | | | | 0.56 | (c) | | | 0.59 | | | | 0.59 | |
Net investment income (loss) | | | 2.45 | | | | 2.45 | | | | 2.40 | (c) | | | 2.09 | | | | 2.04 | |
Portfolio turnover | | | 35 | | | | 24 | | | | 48 | | | | 81 | | | | 61 | |
Net assets at end of period (000 omitted) | | | $310,387 | | | | $364,445 | | | | $388,457 | | | | $424,025 | | | | $484,573 | |
| |
| Service Class | | Year ended | |
| | | 12/31/18 | | | 12/31/17 | | | 12/31/16 | | | 12/31/15 | | | 12/31/14 | |
Net asset value, beginning of period | | | $12.31 | | | | $12.42 | | | | $12.64 | | | | $12.93 | | | | $12.63 | |
| Income (loss) from investment operations | | | | | | | | | | | | | | | | | | | | |
Net investment income (loss) (d) | | | $0.26 | | | | $0.27 | | | | $0.28 | (c) | | | $0.24 | | | | $0.23 | |
Net realized and unrealized gain (loss) | | | (0.24 | ) | | | (0.02 | ) | | | (0.18 | ) | | | (0.21 | ) | | | 0.36 | |
Total from investment operations | | | $0.02 | | | | $0.25 | | | | $0.10 | | | | $0.03 | | | | $0.59 | |
| Less distributions declared to shareholders | | | | | | | | | | | | | | | | | | | | |
From net investment income | | | $(0.37 | ) | | | $(0.36 | ) | | | $(0.32 | ) | | | $(0.32 | ) | | | $(0.29 | ) |
Net asset value, end of period (x) | | | $11.96 | | | | $12.31 | | | | $12.42 | | | | $12.64 | | | | $12.93 | |
Total return (%) (k)(r)(s)(x) | | | 0.17 | | | | 2.03 | | | | 0.68 | (c) | | | 0.26 | | | | 4.67 | |
Ratios (%) (to average net assets)
and Supplemental data: | | | | | | | | | | | | | | | | | | | | |
Expenses before expense reductions (f) | | | 0.85 | | | | 0.85 | | | | 0.82 | (c) | | | 0.85 | | | | 0.85 | |
Expenses after expense reductions (f) | | | 0.84 | | | | 0.85 | | | | 0.81 | (c) | | | 0.84 | | | | 0.84 | |
Net investment income (loss) | | | 2.20 | | | | 2.20 | | | | 2.15 | (c) | | | 1.84 | | | | 1.79 | |
Portfolio turnover | | | 35 | | | | 24 | | | | 48 | | | | 81 | | | | 61 | |
Net assets at end of period (000 omitted) | | | $171,938 | | | | $212,050 | | | | $236,831 | | | | $256,958 | | | | $299,520 | |
See Notes to Financial Statements
14
MFS Government Securities Portfolio
Financial Highlights – continued
| (c) | Amount reflects aone-time reimbursement of expenses by the custodian (or former custodian) without which net investment income and performance would be lower and expenses would be higher. |
| (d) | Per share data is based on average shares outstanding. |
| (f) | Ratios do not reflect reductions from fees paid indirectly, if applicable. |
| (k) | The total return does not reflect expenses that apply to separate accounts. Inclusion of these charges would reduce the total return figures for all periods shown. |
| (r) | Certain expenses have been reduced without which performance would have been lower. |
| (s) | From time to time the fund may receive proceeds from litigation settlements, without which performance would be lower. |
| (x) | The net asset values and total returns have been calculated on net assets which include adjustments made in accordance with U.S. generally accepted accounting principles required at period end for financial reporting purposes. |
See Notes to Financial Statements
15
MFS Government Securities Portfolio
NOTES TO FINANCIAL STATEMENTS
| (1) | | Business and Organization |
MFS Government Securities Portfolio (the fund) is a diversified series of MFS Variable Insurance Trust II (the trust). The trust is organized as a Massachusetts business trust and is registered under the Investment Company Act of 1940, as amended, as anopen-end management investment company. The shareholders of each series of the trust are separate accounts of insurance companies, which offer variable annuity and/or life insurance products, and qualified retirement and pension plans.
The fund is an investment company and accordingly follows the investment company accounting and reporting guidance of the Financial Accounting Standards Board (FASB) Accounting Standards Codification Topic 946 Financial Services – Investment Companies.
| (2) | | Significant Accounting Policies |
General– The preparation of financial statements in conformity with U.S. generally accepted accounting principles requires management to make estimates and assumptions that affect the reported amounts of assets and liabilities, and disclosure of contingent assets and liabilities at the date of the financial statements and the reported amounts of increases and decreases in net assets from operations during the reporting period. Actual results could differ from those estimates. In the preparation of these financial statements, management has evaluated subsequent events occurring after the date of the fund’s Statement of Assets and Liabilities through the date that the financial statements were issued.
In March 2017, the FASB issued Accounting Standards Update2017-08, Receivables – Nonrefundable Fees and Other Costs (Subtopic310-20) – Premium Amortization on Purchased Callable Debt Securities (“ASU2017-08”). For entities that hold callable debt securities at a premium, ASU2017-08 requires that the premium be amortized to the earliest call date. ASU2017-08 will be effective for fiscal years beginning after December 15, 2018, and interim periods within those fiscal years. Management has evaluated the potential impacts of ASU2017-08 and believes that adoption of ASU2017-08 will not have a material effect on the fund’s overall financial position or its overall results of operations.
In August 2018, the FASB issued Accounting Standards Update2018-13, Fair Value Measurement (Topic 820) – Disclosure Framework – Changes to the Disclosure Requirements for Fair Value Measurement (“ASU2018-13”) which introduces new fair value disclosure requirements as well as eliminates and modifies certain existing fair value disclosure requirements. ASU2018-13 would be effective for fiscal years beginning after December 15, 2019, and interim periods within those fiscal years; however, management has elected to early adopt ASU2018-13 effective with the current reporting period. The impact of the fund’s adoption was limited to changes in the fund’s financial statement disclosures regarding fair value, primarily those disclosures related to transfers between levels of the fair value hierarchy.
In August 2018, the Securities and Exchange Commission (SEC) released its Final Rule on Disclosure Update and Simplification (the “Final Rule”) which is intended to simplify an issuer’s disclosure compliance efforts by removing redundant or outdated disclosure requirements without significantly altering the mix of information provided to investors. Effective with the current reporting period, the fund adopted the Final Rule with the impacts being that the fund is no longer required to present the components of distributable earnings on the Statement of Assets and Liabilities or the sources of distributions to shareholders and the amount of undistributed net investment income on the Statements of Changes in Net Assets.
Balance Sheet Offsetting– The fund’s accounting policy with respect to balance sheet offsetting is that, absent an event of default by the counterparty or a termination of the agreement, the International Swaps and Derivatives Association (ISDA) Master Agreement, or similar agreement, does not result in an offset of reported amounts of financial assets and financial liabilities in the Statement of Assets and Liabilities across transactions between the fund and the applicable counterparty. The fund’s right to setoff may be restricted or prohibited by the bankruptcy or insolvency laws of the particular jurisdiction to which a specific master netting agreement counterparty is subject. Balance sheet offsetting disclosures, to the extent applicable to the fund, have been included in the fund’s Significant Accounting Policies note under the captions for each of the fund’sin-scope financial instruments and transactions.
Investment Valuations– Debt instruments and floating rate loans, including restricted debt instruments, are generally valued at an evaluated or composite bid as provided by a third-party pricing service. Short-term instruments with a maturity at issuance of 60 days or less may be valued at amortized cost, which approximates market value. Futures contracts are generally valued at last posted settlement price on their primary exchange as provided by a third-party pricing service. Futures contracts for which there were no trades that day for a particular position are generally valued at the closing bid quotation on their primary exchange as provided by a third-party pricing service.Open-end investment companies are generally valued at net asset value per share. Securities and other assets generally valued on the basis of information from a third-party pricing service may also be valued at a broker/dealer bid quotation. In determining values, third-party pricing services can utilize both transaction data and market information such as yield, quality, coupon rate, maturity, type of issue, trading characteristics, and other market data.
The Board of Trustees has delegated primary responsibility for determining or causing to be determined the value of the fund’s investments (including any fair valuation) to the adviser pursuant to valuation policies and procedures approved by the Board. If the
16
MFS Government Securities Portfolio
Notes to Financial Statements – continued
adviser determines that reliable market quotations are not readily available, investments are valued at fair value as determined in good faith by the adviser in accordance with such procedures under the oversight of the Board of Trustees. Under the fund’s valuation policies and procedures, market quotations are not considered to be readily available for most types of debt instruments and floating rate loans and many types of derivatives. These investments are generally valued at fair value based on information from third-party pricing services. In addition, investments may be valued at fair value if the adviser determines that an investment’s value has been materially affected by events occurring after the close of the exchange or market on which the investment is principally traded (such as foreign exchange or market) and prior to the determination of the fund’s net asset value, or after the halting of trading of a specific security where trading does not resume prior to the close of the exchange or market on which the security is principally traded. The adviser generally relies on third-party pricing services or other information (such as the correlation with price movements of similar securities in the same or other markets; the type, cost and investment characteristics of the security; the business and financial condition of the issuer; and trading and other market data) to assist in determining whether to fair value and at what value to fair value an investment. The value of an investment for purposes of calculating the fund’s net asset value can differ depending on the source and method used to determine value. When fair valuation is used, the value of an investment used to determine the fund’s net asset value may differ from quoted or published prices for the same investment. There can be no assurance that the fund could obtain the fair value assigned to an investment if it were to sell the investment at the same time at which the fund determines its net asset value per share.
Various inputs are used in determining the value of the fund’s assets or liabilities. These inputs are categorized into three broad levels. In certain cases, the inputs used to measure fair value may fall into different levels of the fair value hierarchy. In such cases, an investment’s level within the fair value hierarchy is based on the lowest level of input that is significant to the fair value measurement. The fund’s assessment of the significance of a particular input to the fair value measurement in its entirety requires judgment, and considers factors specific to the investment. Level 1 includes unadjusted quoted prices in active markets for identical assets or liabilities. Level 2 includes other significant observable market-based inputs (including quoted prices for similar securities, interest rates, prepayment speed, and credit risk). Level 3 includes unobservable inputs, which may include the adviser’s own assumptions in determining the fair value of investments. Other financial instruments are derivative instruments, such as futures contracts. The following is a summary of the levels used as of December 31, 2018 in valuing the fund’s assets or liabilities:
| | | | | | | | | | | | | | | | |
| Financial Instruments | | Level 1 | | | Level 2 | | | Level 3 | | | Total | |
| U.S. Treasury Bonds & U.S. Government Agency & Equivalents | | | $— | | | | $148,389,703 | | | | $— | | | | $148,389,703 | |
| Non-U.S. Sovereign Debt | | | — | | | | 1,293,775 | | | | — | | | | 1,293,775 | |
| Municipal Bonds | | | — | | | | 9,089,589 | | | | — | | | | 9,089,589 | |
| U.S. Corporate Bonds | | | — | | | | 10,515,140 | | | | — | | | | 10,515,140 | |
| Residential Mortgage-Backed Securities | | | — | | | | 280,970,636 | | | | — | | | | 280,970,636 | |
| Commercial Mortgage-Backed Securities | | | — | | | | 9,904,676 | | | | — | | | | 9,904,676 | |
| Asset-Backed Securities (including CDOs) | | | — | | | | 12,527,282 | | | | — | | | | 12,527,282 | |
| Foreign Bonds | | | — | | | | 7,474,776 | | | | — | | | | 7,474,776 | |
| Mutual Funds | | | 26,672 | | | | — | | | | — | | | | 26,672 | |
| Total | | | $26,672 | | | | $480,165,577 | | | | $— | | | | $480,192,249 | |
| | | | |
| Other Financial Instruments | | | | | | | | | | | | |
| Futures Contracts – Assets | | | $48,001 | | | | $— | | | | $— | | | | $48,001 | |
| Futures Contracts – Liabilities | | | (170,656 | ) | | | — | | | | — | | | | (170,656 | ) |
For further information regarding security characteristics, see the Portfolio of Investments.
Derivatives– The fund uses derivatives primarily to increase or decrease exposure to a particular market or segment of the market, or security, to increase or decrease interest rate or currency exposure, or as alternatives to direct investments. Derivatives are used for hedging ornon-hedging purposes. While hedging can reduce or eliminate losses, it can also reduce or eliminate gains. When the fund uses derivatives as an investment to increase market exposure, or for hedging purposes, gains and losses from derivative instruments may be substantially greater than the derivative’s original cost.
The derivative instruments used by the fund during the period were futures contracts. Depending on the type of derivative, the fund may exit a derivative position by entering into an offsetting transaction with a counterparty or exchange, negotiating an agreement with the derivative counterparty, or novating the position to a third party. The fund may be unable to promptly close out a futures position in instances where the daily fluctuation in the price for that type of future exceeds the daily limit set by the exchange. The fund’s period end derivatives, as presented in the Portfolio of Investments and the associated Derivative Contract tables, generally are indicative of the volume of its derivative activity during the period.
17
MFS Government Securities Portfolio
Notes to Financial Statements – continued
The following table presents, by major type of derivative contract, the fair value, on a gross basis, of the asset and liability components of derivatives held by the fund at December 31, 2018 as reported in the Statement of Assets and Liabilities:
| | | | | | | | | | |
| | | | | Fair Value (a) | |
| Risk | | Derivative Contracts | | Asset Derivatives | | | Liability Derivatives | |
| Interest Rate | | Interest Rate Futures | | | $48,001 | | | | $(170,656 | ) |
| (a) | Values presented in this table for futures contracts correspond to the values reported in the fund’s Portfolio of Investments. Only the current day net variation margin for futures contracts is separately reported within the fund’s Statement of Assets and Liabilities. |
The following table presents, by major type of derivative contract, the realized gain (loss) on derivatives held by the fund for the year ended December 31, 2018 as reported in the Statement of Operations:
| | | | |
| Risk | | Futures Contracts | |
| Interest Rate | | | $11,977 | |
The following table presents, by major type of derivative contract, the change in unrealized appreciation or depreciation on derivatives held by the fund for the year ended December 31, 2018 as reported in the Statement of Operations:
| | | | |
| Risk | | Futures Contracts | |
| Interest Rate | | | $(78,651 | ) |
Derivative counterparty credit risk is managed through formal evaluation of the creditworthiness of all potential counterparties. On certain, but not all, uncleared derivatives, the fund attempts to reduce its exposure to counterparty credit risk whenever possible by entering into an ISDA Master Agreement on a bilateral basis. The ISDA Master Agreement gives each party to the agreement the right to terminate all transactions traded under such agreement if there is a specified deterioration in the credit quality of the other party. Upon an event of default or a termination of the ISDA Master Agreement, thenon-defaulting party has the right to close out all transactions traded under such agreement and to net amounts owed under each agreement to one net amount payable by one party to the other. This right to close out and net payments across all transactions traded under the ISDA Master Agreement could result in a reduction of the fund’s credit risk to such counterparty equal to any amounts payable by the fund under the applicable transactions, if any.
Collateral and margin requirements differ by type of derivative. For cleared derivatives (e.g., futures contracts, cleared swaps, and exchange-traded options), margin requirements are set by the clearing broker and the clearing house and collateral, in the form of cash or securities, is posted by the fund directly with the clearing broker. Collateral terms are counterparty agreement specific for uncleared derivatives (e.g., forward foreign currency exchange contracts, uncleared swap agreements, and uncleared options) and collateral, in the form of cash and securities, is held in segregated accounts with the fund’s custodian in connection with these agreements. For derivatives traded under an ISDA Master Agreement, which contains a collateral support annex, the collateral requirements are netted across all transactions traded under such counterparty-specific agreement and an amount is posted from one party to the other to collateralize such obligations. Cash that has been segregated or delivered to cover the fund’s collateral or margin obligations under derivative contracts, if any, will be reported separately in the Statement of Assets and Liabilities as restricted cash for uncleared derivatives and/or deposits with brokers for cleared derivatives. Securities pledged as collateral or margin for the same purpose, if any, are noted in the Portfolio of Investments. The fund may be required to make payments of interest on uncovered collateral or margin obligations with the broker. Any such payments are included in “Miscellaneous” expense in the Statement of Operations.
Futures Contracts– The fund entered into futures contracts which may be used to hedge against or obtain broad market exposure, interest rate exposure, or to manage duration. A futures contract represents a commitment for the future purchase or sale of an asset at a specified price on a specified date.
Upon entering into a futures contract, the fund is required to deposit with the broker, either in cash or securities, an initial margin in an amount equal to a specified percentage of the notional amount of the contract. Subsequent payments (variation margin) are made or received by the fund each day, depending on the daily fluctuations in the value of the contract, and are recorded for financial statement purposes as unrealized gain or loss by the fund until the contract is closed or expires at which point the gain or loss on futures contracts is realized.
The fund bears the risk of interest rates or securities prices moving unexpectedly, in which case, the fund may not achieve the anticipated benefits of the futures contracts and may realize a loss. While futures contracts may present less counterparty risk to the fund since the contracts are exchange traded and the exchange’s clearinghouse guarantees payments to the broker, there is still counterparty credit risk due to the insolvency of the broker. The fund’s maximum risk of loss due to counterparty credit risk is equal to the margin posted by the fund to the broker plus any gains or minus any losses on the outstanding futures contracts.
Dollar Roll Transactions– The fund enters into dollar roll transactions, with respect to mortgage-backed securities issued by Ginnie Mae, Fannie Mae, and Freddie Mac, in which the fund sells mortgage-backed securities to financial institutions and simultaneously
18
MFS Government Securities Portfolio
Notes to Financial Statements – continued
agrees to purchase similar (same issuer, type and coupon) securities at a later date at an agreed-upon price. During the period between the sale and repurchase in a dollar roll transaction the fund will not be entitled to receive interest and principal payments on the securities sold but is compensated by interest earned on the proceeds of the initial sale and by a lower purchase price on the securities to be repurchased which enhances the fund’s total return. The fund accounts for dollar roll transactions as purchases and sales and realizes gains and losses on these transactions.
Indemnifications– Under the fund’s organizational documents, its officers and Trustees may be indemnified against certain liabilities and expenses arising out of the performance of their duties to the fund. Additionally, in the normal course of business, the fund enters into agreements with service providers that may contain indemnification clauses. The fund’s maximum exposure under these agreements is unknown as this would involve future claims that may be made against the fund that have not yet occurred.
Investment Transactions and Income– Investment transactions are recorded on the trade date. Interest income is recorded on the accrual basis. All premium and discount is amortized or accreted for financial statement purposes in accordance with U.S. generally accepted accounting principles. Some securities may be purchased on a “when-issued” or “forward delivery” basis, which means that the securities will be delivered to the fund at a future date, usually beyond customary settlement time. Interest payments received in additional securities are recorded on theex-interest date in an amount equal to the value of the security on such date.
The fund may receive proceeds from litigation settlements. Any proceeds received from litigation involving portfolio holdings are reflected in the Statement of Operations in realized gain/loss if the security has been disposed of by the fund or in unrealized gain/loss if the security is still held by the fund. Any other proceeds from litigation not related to portfolio holdings are reflected as other income in the Statement of Operations.
The fund invests a significant portion of its assets in asset-backed and/or mortgage-backed securities. For these securities, the value of the debt instrument also depends on the credit quality and adequacy of the underlying assets or collateral as well as whether there is a security interest in the underlying assets or collateral. Enforcing rights, if any, against the underlying assets or collateral may be difficult. U.S. Government securities not supported as to the payment of principal or interest by the U.S. Treasury, such as those issued by Fannie Mae, Freddie Mac, and the Federal Home Loan Banks, are subject to greater credit risk than are U.S. Government securities supported by the U.S. Treasury, such as those issued by Ginnie Mae.
The fund purchased or sold debt securities on a when-issued or delayed delivery basis, or in a “To Be Announced” (TBA) or “forward commitment” transaction with delivery or payment to occur at a later date beyond the normal settlement period. At the time a fund enters into a commitment to purchase or sell a security, the transaction is recorded and the value of the security acquired is reflected in the fund’s net asset value. The price of such security and the date that the security will be delivered and paid for are fixed at the time the transaction is negotiated. The value of the security may vary with market fluctuations. TBA securities resulting from these transactions are included in the Portfolio of Investments. TBA purchase commitments are held at carrying amount, which approximates fair value and are categorized as level 2 within the fair value hierarchy. No interest accrues to the fund until payment takes place. At the time that a fund enters into this type of transaction, the fund is required to have sufficient cash and/or liquid securities to cover its commitments. Losses may arise due to changes in the value of the underlying securities or if the counterparty does not perform under the contract’s terms, or if the issuer does not issue the securities due to political, economic or other factors. Additionally, losses may arise due to declines in the value of the securities prior to settlement date.
To mitigate the counterparty credit risk on TBA securities and other types of forward settling mortgage-backed securities, the fund whenever possible enters into a Master Securities Forward Transaction Agreement (“MSFTA”) on a bilateral basis with each of the counterparties with whom it undertakes a significant volume of transactions. The MSFTA gives each party to the agreement the right to terminate all transactions traded under such agreement if there is a specified deterioration in the credit quality of the other party. Upon an event of default or a termination of the MSFTA, thenon-defaulting party has the right to close out all transactions traded under such agreement and to net amounts owed under each transaction to one net amount payable by one party to the other. This right to close out and net payments across all transactions traded under the MSFTA could result in a reduction of the fund’s credit risk to such counterparty equal to any amounts payable by the fund under the applicable transactions, if any.
For mortgage-backed securities traded under a MSFTA, the collateral and margining requirements are contract specific. Collateral amounts across all transactions traded under such agreement are netted and one amount is posted from one party to the other to collateralize such obligations. Cash that has been pledged to cover the fund’s collateral or margin obligations under a MSFTA, if any, will be reported separately on the Statement of Assets and Liabilities as restricted cash. Securities pledged as collateral or margin for the same purpose, if any, are noted in the Portfolio of Investments.
Tax Matters and Distributions– The fund intends to qualify as a regulated investment company, as defined under Subchapter M of the Internal Revenue Code, and to distribute all of its taxable income, including realized capital gains. As a result, no provision for federal income tax is required. The fund’s federal tax returns, when filed, will remain subject to examination by the Internal Revenue Service for a three year period. Management has analyzed the fund’s tax positions taken on federal and state tax returns for all open tax years and does not believe that there are any uncertain tax positions that require recognition of a tax liability. Foreign taxes, if
19
MFS Government Securities Portfolio
Notes to Financial Statements – continued
any, have been accrued by the fund in the accompanying financial statements in accordance with the applicable foreign tax law. Foreign income taxes may be withheld by certain countries in which the fund invests. Additionally, capital gains realized by the fund on securities issued in or by certain foreign countries may be subject to capital gains tax imposed by those countries.
Distributions to shareholders are recorded on theex-dividend date. Income and capital gain distributions are determined in accordance with income tax regulations, which may differ from U.S. generally accepted accounting principles. Certain capital accounts in the financial statements are periodically adjusted for permanent differences in order to reflect their tax character. These adjustments have no impact on net assets or net asset value per share. Temporary differences which arise from recognizing certain items of income, expense, gain or loss in different periods for financial statement and tax purposes will reverse at some time in the future. Distributions in excess of net investment income or net realized gains are temporary overdistributions for financial statement purposes resulting from differences in the recognition or classification of income or distributions for financial statement and tax purposes.
Book/tax differences primarily relate to amortization and accretion of debt securities and wash sale loss deferrals.
The tax character of distributions declared to shareholders for the last two fiscal years is as follows:
| | | | | | | | |
| | | Year ended
12/31/18 | | | Year ended
12/31/17 | |
| Ordinary income (including any short-term capital gains) | | | $16,541,275 | | | | $17,852,246 | |
The federal tax cost and the tax basis components of distributable earnings were as follows:
| | | | |
| As of 12/31/18 | | | | |
| |
| Cost of investments | | | $487,353,481 | |
| Gross appreciation | | | 6,560,323 | |
| Gross depreciation | | | (13,844,210 | ) |
| Net unrealized appreciation (depreciation) | | | $(7,283,887 | ) |
| |
| Undistributed ordinary income | | | 13,608,126 | |
| Capital loss carryforwards | | | (26,214,609 | ) |
As of December 31, 2018, the fund had capital loss carryforwards available to offset future realized gains. These net capital losses may be carried forward indefinitely and their character is retained as short-term and/or long-term losses. Such losses are characterized as follows:
| | | | |
| Short-Term | | | $(6,565,848 | ) |
| Long-Term | | | (19,648,761 | ) |
| Total | | | $(26,214,609 | ) |
Multiple Classes of Shares of Beneficial Interest– The fund offers multiple classes of shares, which differ in their respective distribution and/or service fees. The fund’s income, realized and unrealized gain (loss), and common expenses are allocated to shareholders based on the daily net assets of each class. Dividends are declared separately for each class. Differences in per share dividend rates are generally due to differences in separate class expenses. The fund’s distributions declared to shareholders as reported in the Statements of Changes in Net Assets are presented by class as follows:
| | | | | | | | |
| | | From net investment
income | |
| | | Year ended
12/31/18 | | | Year ended
12/31/17 | |
| Initial Class | | | $10,880,020 | | | | $11,609,362 | |
| Service Class | | | 5,661,255 | | | | 6,242,884 | |
| Total | | | $16,541,275 | | | | $17,852,246 | |
| (3) | | Transactions with Affiliates |
Investment Adviser– The fund has an investment advisory agreement with MFS to provide overall investment management and related administrative services and facilities to the fund. The management fee is computed daily and paid monthly at the following annual rates based on the fund’s average daily net assets:
| | | | |
| Up to $1 billion | | | 0.55% | |
| In excess of $1 billion | | | 0.50% | |
MFS has agreed in writing to reduce its management fee by a specified amount if certain MFS mutual fund assets exceed thresholds agreed to by MFS and the fund’s Board of Trustees. For the year ended December 31, 2018, this management fee reduction amounted to $50,502, which is included in the reduction of total expenses in the Statement of Operations. The management fee incurred for the year ended December 31, 2018 was equivalent to an annual effective rate of 0.54% of the fund’s average daily net assets.
20
MFS Government Securities Portfolio
Notes to Financial Statements – continued
For the period from January 1, 2018 through July 31, 2018, the investment adviser had agreed in writing to pay a portion of the fund’s total annual operating expenses, excluding interest, taxes, extraordinary expenses, brokerage and transaction costs, andinvestment-related expenses, such that total annual operating expenses did not exceed 0.61% of average daily net assets for the Initial Class shares and 0.86% of average daily net assets for the Service Class shares. This written agreement terminated on July 31, 2018. For the period from January 1, 2018 through July 31, 2018, the fund’s actual operating expenses did not exceed the limit and therefore, the investment adviser did not pay any portion of the fund’s expenses related to this agreement. Effective August 1, 2018, the investment adviser has agreed in writing to pay a portion of the fund’s total annual operating expenses, excluding interest, taxes, extraordinary expenses, brokerage and transaction costs, and investment-related expenses, such that total annual operating expenses do not exceed 0.58% of average daily net assets for the Initial Class shares and 0.83% of average daily net assets for the Service Class shares. This written agreement will continue until modified by the fund’s Board of Trustees, but such agreement will continue at least until April 30, 2020. For the period from August 1, 2018 through December 31, 2018, this reduction amounted to $24,593, which is included in the reduction of total expenses in the Statement of Operations.
Distributor– MFS Fund Distributors, Inc. (MFD), a wholly-owned subsidiary of MFS, is the distributor of shares of the fund. The Trustees have adopted a distribution plan for the Service Class shares pursuant to Rule12b-1 under the Investment Company Act of 1940.
The fund’s distribution plan provides that the fund will pay MFD distribution and/or service fees equal to 0.25% per annum of its average daily net assets attributable to Service Class shares as partial consideration for services performed and expenses incurred by MFD and financial intermediaries (including participating insurance companies that invest in the fund to fund variable annuity and variable life insurance contracts, sponsors of qualified retirement and pension plans that invest in the fund, and affiliates of these participating insurance companies and plan sponsors) in connection with the sale and distribution of the Service Class shares. MFD may subsequently pay all, or a portion, of the distribution and/or service fees to financial intermediaries.
Shareholder Servicing Agent– MFS Service Center, Inc. (MFSC), a wholly-owned subsidiary of MFS, receives a fee from the fund for its services as shareholder servicing agent. For the year ended December 31, 2018, the fee was $7,935, which equated to 0.0015% annually of the fund’s average daily net assets. MFSC also receives payment from the fund forout-of-pocket expenses paid by MFSC on behalf of the fund. For the year ended December 31, 2018, these costs amounted to $405.
Administrator– MFS provides certain financial, legal, shareholder communications, compliance, and other administrative services to the fund. Under an administrative services agreement, the fund reimburses MFS the costs incurred to provide these services. The fund is charged an annual fixed amount of $17,500 plus a fee based on average daily net assets. The administrative services fee incurred for the year ended December 31, 2018 was equivalent to an annual effective rate of 0.0161% of the fund’s average daily net assets.
Trustees’ and Officers’ Compensation– The fund pays compensation to independent Trustees in the form of a retainer, attendance fees, and additional compensation to Board and Committee chairpersons. The fund does not pay compensation directly to Trustees or officers of the fund who are also officers of the investment adviser, all of whom receive remuneration for their services to the fund from MFS. Certain officers and Trustees of the fund are officers or directors of MFS, MFD, and MFSC.
Other– This fund and certain other funds managed by MFS (the funds) have entered into a service agreement (the ISO Agreement) which provides for payment of fees solely by the funds to Tarantino LLC in return for the provision of services of an Independent Senior Officer (ISO) for the funds. Frank L. Tarantino serves as the ISO and is an officer of the funds and the sole member of Tarantino LLC. The funds can terminate the ISO Agreement with Tarantino LLC at any time under the terms of the ISO Agreement. For the year ended December 31, 2018, the fee paid by the fund under this agreement was $904 and is included in “Miscellaneous” expense in the Statement of Operations. MFS has agreed to bear all expenses associated with office space, other administrative support, and supplies provided to the ISO.
The fund invests in the MFS Institutional Money Market Portfolio which is managed by MFS and seeks current income consistent with preservation of capital and liquidity. This money market fund does not pay a management fee to MFS.
For the year ended December 31, 2018, purchases and sales of investments, other than short-term obligations, were as follows:
| | | | | | | | |
| | | Purchases | | | Sales | |
| U.S. Government securities | | | $128,706,492 | | | | $176,646,547 | |
| Non-U.S. Government securities | | | $53,018,161 | | | | $48,651,480 | |
21
MFS Government Securities Portfolio
Notes to Financial Statements – continued
| (5) | | Shares of Beneficial Interest |
The fund’s Declaration of Trust permits the Trustees to issue an unlimited number of full and fractional shares of beneficial interest. Transactions in fund shares were as follows:
| | | | | | | | | | | | | | | | |
| | | Year ended 12/31/18 | | | Year ended 12/31/17 | |
| | | | |
| | | Shares | | | Amount | | | Shares | | | Amount | |
| Shares sold | | | | | | | | | | | | | | | | |
Initial Class | | | 420,018 | | | | $5,061,750 | | | | 808,666 | | | | $10,123,347 | |
Service Class | | | 642,376 | | | | 7,707,935 | | | | 1,401,695 | | | | 17,378,499 | |
| | | 1,062,394 | | | | $12,769,685 | | | | 2,210,361 | | | | $27,501,846 | |
| | | | |
| Shares issued to shareholders in reinvestment of distributions | | | | | | | | | | | | | | | | |
Initial Class | | | 916,598 | | | | $10,880,020 | | | | 933,228 | | | | $11,609,362 | |
Service Class | | | 479,361 | | | | 5,661,255 | | | | 504,679 | | | | 6,242,884 | |
| | | 1,395,959 | | | | $16,541,275 | | | | 1,437,907 | | | | $17,852,246 | |
| | | | |
| Shares reacquired | | | | | | | | | | | | | | | | |
Initial Class | | | (4,972,729 | ) | | | $(59,818,993 | ) | | | (3,378,602 | ) | | | $(42,475,081 | ) |
Service Class | | | (3,978,973 | ) | | | (47,694,099 | ) | | | (3,738,170 | ) | | | (46,676,673 | ) |
| | | (8,951,702 | ) | | | $(107,513,092 | ) | | | (7,116,772 | ) | | | $(89,151,754 | ) |
| | | | |
| Net change | | | | | | | | | | | | | | | | |
Initial Class | | | (3,636,113 | ) | | | $(43,877,223 | ) | | | (1,636,708 | ) | | | $(20,742,372 | ) |
Service Class | | | (2,857,236 | ) | | | (34,324,909 | ) | | | (1,831,796 | ) | | | (23,055,290 | ) |
| | | (6,493,349 | ) | | | $(78,202,132 | ) | | | (3,468,504 | ) | | | $(43,797,662 | ) |
The fund is one of several mutual funds in which certain MFS funds may invest. The MFS funds do not invest in the underlying funds for the purpose of exercising management or control. At the end of the period, the MFS Moderate Allocation Portfolio and the MFS Conservative Allocation Portfolio were the owners of record of approximately 29% and 10%, respectively, of the value of outstanding voting shares of the fund.
The fund and certain other funds managed by MFS participate in a $1.25 billion unsecured committed line of credit, subject to a $1 billion sublimit, provided by a syndication of banks under a credit agreement. Borrowings may be made for temporary financing needs. Interest is charged to each fund, based on its borrowings, generally at a rate equal to the higher of the Overnight Bank Funding rate or daily one month LIBOR plus an agreed upon spread. A commitment fee, based on the average daily, unused portion of the committed line of credit, is allocated among the participating funds. In addition, the fund and other funds managed by MFS have established unsecured uncommitted borrowing arrangements with certain banks for temporary financing needs. Interest is charged to each fund, based on its borrowings, at a rate equal to the Overnight Bank Funding rate plus an agreed upon spread. For the year ended December 31, 2018, the fund’s commitment fee and interest expense were $3,073 and $0, respectively, and are included in “Miscellaneous” expense in the Statement of Operations.
| (7) | | Investments in Affiliated Issuers |
An affiliated issuer may be considered one in which the fund owns 5% or more of the outstanding voting securities, or a company which is under common control. For the purposes of this report, the fund assumes the following to be affiliated issuers:
| | | | | | | | | | | | | | | | | | |
| Affiliated Issuers | | | | Beginning
Shares/Par
Amount | | | Acquisitions
Shares/Par
Amount | | | Dispositions
Shares/Par
Amount | | | Ending Shares/Par
Amount | |
| | | | | |
| MFS Institutional Money Market Portfolio | | | | | 36,877,651 | | | | 128,104,631 | | | | (164,955,607 | ) | | | 26,675 | |
| | | | | |
| Affiliated Issuers | | Realized
Gain (Loss) | | Change in
Unrealized
Appreciation/
Depreciation | | | Capital Gain
Distributions | | | Dividend
Income | | | Ending
Value | |
| | | | | |
| MFS Institutional Money Market Portfolio | | $(2,069) | | | $327 | | | | $— | | | | $190,927 | | | | $26,672 | |
22
MFS Government Securities Portfolio
REPORT OF INDEPENDENT REGISTERED PUBLIC ACCOUNTING FIRM
To the Board of Trustees of MFS Variable Insurance Trust II and the Shareholders of
MFS Government Securities Portfolio:
Opinion on the Financial Statements and Financial Highlights
We have audited the accompanying statement of assets and liabilities of MFS Government Securities Portfolio (the “Fund”), including the portfolio of investments, as of December 31, 2018, the related statement of operations for the year then ended, the statements of changes in net assets for each of the two years in the period then ended, the financial highlights for each of the five years in the period then ended, and the related notes. In our opinion, the financial statements and financial highlights present fairly, in all material respects, the financial position of the Fund as of December 31, 2018, and the results of its operations for the year then ended, the changes in its net assets for each of the two years in the period then ended, and the financial highlights for each of the five years in the period then ended, in conformity with accounting principles generally accepted in the United States of America.
Basis for Opinion
These financial statements and financial highlights are the responsibility of the Fund’s management. Our responsibility is to express an opinion on the Fund’s financial statements and financial highlights based on our audits. We are a public accounting firm registered with the Public Company Accounting Oversight Board (United States) (PCAOB) and are required to be independent with respect to the Fund in accordance with the U.S. federal securities laws and the applicable rules and regulations of the Securities and Exchange Commission and the PCAOB.
We conducted our audits in accordance with the standards of the PCAOB. Those standards require that we plan and perform the audit to obtain reasonable assurance about whether the financial statements and financial highlights are free of material misstatement, whether due to error or fraud. The Fund is not required to have, nor were we engaged to perform, an audit of its internal control over financial reporting. As part of our audits we are required to obtain an understanding of internal control over financial reporting but not for the purpose of expressing an opinion on the effectiveness of the Fund’s internal control over financial reporting. Accordingly, we express no such opinion.
Our audits included performing procedures to assess the risks of material misstatement of the financial statements and financial highlights, whether due to error or fraud, and performing procedures that respond to those risks. Such procedures included examining, on a test basis, evidence regarding the amounts and disclosures in the financial statements and financial highlights. Our audits also included evaluating the accounting principles used and significant estimates made by management, as well as evaluating the overall presentation of the financial statements and financial highlights. Our procedures included confirmation of securities owned as of December 31, 2018, by correspondence with the custodian and brokers; when replies were not received from brokers, we performed other auditing procedures. We believe that our audits provide a reasonable basis for our opinion.
DELOITTE & TOUCHE LLP
Boston, Massachusetts
February 15, 2019
We have served as the auditor of one or more of the MFS investment companies since 1924.
23
MFS Government Securities Portfolio
TRUSTEES AND OFFICERS – IDENTIFICATION AND BACKGROUND
The Trustees and Officers of the Trust, as of February 1, 2019, are listed below, together with their principal occupations during the past five years. (Their titles may have varied during that period.) The address of each Trustee and Officer is 111 Huntington Avenue, Boston, Massachusetts 02199-7618.
| | | | | | | | | | |
Name, Age | | Position(s)
Held with Fund | | Trustee/Officer
Since (h) | | Number of MFS Funds overseen by the Trustee | | Principal Occupations
During the Past Five Years | | Other Directorships During the Past Five Years (j) |
| INTERESTED TRUSTEES |
Robert J. Manning (k) (age 55) | | Trustee | | February 2004 | | 135 | | Massachusetts Financial Services Company, Executive Chairman (since January 2017); Director; Chairman of the Board; Chief Executive Officer (until 2015);Co-Chief Executive Officer(2015-2016) | | N/A |
| | | | | |
Robin A. Stelmach (k) (age 57) | | Trustee | | January 2014 | | 135 | | Massachusetts Financial Services Company, Vice Chair (since January 2017); Chief Operating Officer and Executive Vice President (until January 2017) | | N/A |
|
| INDEPENDENT TRUSTEES |
John P. Kavanaugh (age 64) | | Trustee and Chair of Trustees | | January 2009 | | 135 | | Private investor | | N/A |
| | | | | |
Steven E. Buller (age 67) | | Trustee | | February 2014 | | 135 | | Financial Accounting Standards Advisory Council, Chairman(2014-2015); Public Company Accounting Oversight Board, Standing Advisory Group, Member (until 2014); BlackRock, Inc. (investment management), Managing Director (until 2014), BlackRock Finco UK (investment management), Director (until 2014) | | N/A |
| | | | | |
John A. Caroselli (age 64) | | Trustee | | March 2017 | | 135 | | JC Global Advisors, LLC (management consulting), President (since 2015); First Capital Corporation (commercial finance), Executive Vice President (until 2015) | | N/A |
| | | | | |
Maureen R. Goldfarb (age 63) | | Trustee | | January 2009 | | 135 | | Private investor | | N/A |
| | | | | |
Michael Hegarty (age 74) | | Trustee | | December 2004 | | 135 | | Private investor | | Rouse Properties Inc., Director (until 2016); Capmark Financial Group Inc., Director (until 2015) |
| | | | | |
Peter D. Jones (age 63) | | Trustee | | January 2019 | | 135 | | Franklin Templeton Distributors, Inc. (investment management), President (until 2015); Franklin Templeton Institutional, LLC (investment management), Chairman (until 2015) | | N/A |
| | | | | |
James W. Kilman, Jr. (age 57) | | Trustee | | January 2019 | | 135 | | KielStrand Capital LLC (family office and merchant bank), Chief Executive Officer (since 2016); Morgan Stanley & Co. (financial services), Vice Chairman of Investment Banking,Co-Head of Diversified Financials Coverage – Financial Institutions Investment Banking Group (until 2016) | | alpha-En Corporation, Director (since 2016) |
24
MFS Government Securities Portfolio
Trustees and Officers – continued
| | | | | | | | | | |
Name, Age | | Position(s)
Held with Fund | | Trustee/Officer
Since (h) | | Number of MFS Funds overseen by the Trustee | | Principal Occupations
During the Past Five Years | | Other Directorships During the Past Five Years (j) |
Clarence Otis, Jr. (age 62) | | Trustee | | March 2017 | | 135 | | Darden Restaurants, Inc., Chief Executive Officer (until 2014) | | VF Corporation, Director; Verizon Communications, Inc., Director; The Travelers Companies, Director; Federal Reserve Bank of Atlanta, Director (until 2015) |
| | | | | |
Maryanne L. Roepke (age 62) | | Trustee | | May 2014 | | 135 | | American Century Investments (investment management), Senior Vice President and Chief Compliance Officer (until 2014) | | N/A |
| | | | | |
Laurie J. Thomsen
(age 61) | | Trustee | | March 2005 | | 135 | | Private investor | | The Travelers Companies, Director; Dycom Industries, Inc., Director (since 2015) |
| | | | | | | | |
Name, Age | | Position(s)
Held with Fund | | Trustee/Officer
Since (h) | | Number of MFS Funds for which the Person is an Officer | | Principal Occupations During the Past Five Years |
| OFFICERS | | | | | | |
Christopher R. Bohane (k)
(age 45) | | Assistant Secretary and Assistant Clerk | | July 2005 | | 135 | | Massachusetts Financial Services Company, Vice President and Assistant General Counsel |
| | | | |
Kino Clark (k) (age 50) | | Assistant Treasurer | | January 2012 | | 135 | | Massachusetts Financial Services Company, Vice President |
| | | | |
John W. Clark, Jr. (k) (age 51) | | Assistant Treasurer | | April 2017 | | 135 | | Massachusetts Financial Services Company, Vice President (since March 2017); Deutsche Bank (financial services), Department Head – Treasurer’s Office (until February 2017) |
| | | | |
Thomas H. Connors (k) (age 59) | | Assistant Secretary and Assistant Clerk | | September 2012 | | 135 | | Massachusetts Financial Services Company, Vice President and Senior Counsel |
| | | | |
Ethan D. Corey (k)
(age 55) | | Assistant
Secretary and Assistant Clerk | | July 2005 | | 135 | | Massachusetts Financial Services Company, Senior Vice President and Associate General Counsel |
| | | | |
David L. DiLorenzo (k)
(age 50) | | President | | July 2005 | | 135 | | Massachusetts Financial Services Company, Senior Vice President |
| | | | |
Heidi W. Hardin (k) (age 51) | | Secretary and Clerk | | April 2017 | | 135 | | Massachusetts Financial Services Company, Executive Vice President and General Counsel (since March 2017); Harris Associates (investment management), General Counsel (from September 2015 to January 2017); Janus Capital Management LLC (investment management), Senior Vice President and General Counsel (until September 2015) |
| | | | |
Brian E. Langenfeld (k) (age 45) | | Assistant
Secretary and Assistant Clerk | | June 2006 | | 135 | | Massachusetts Financial Services Company, Vice President and Senior Counsel |
| | | | |
Amanda S. Mooradian (k) (age 39) | | Assistant
Secretary and Assistant Clerk | | September 2018 | | 135 | | Massachusetts Financial Services Company, Assistant Vice President and Counsel |
| | | | |
Susan A. Pereira (k)
(age 48) | | Assistant
Secretary and Assistant Clerk | | July 2005 | | 135 | | Massachusetts Financial Services Company, Vice President and Senior Counsel |
| | | | |
Kasey L. Phillips (k) (age 48) | | Assistant Treasurer | | September 2012 | | 135 | | Massachusetts Financial Services Company, Vice President |
| | | | |
Matthew A. Stowe (k) (age 44) | | Assistant Secretary and Assistant Clerk | | October 2014 | | 135 | | Massachusetts Financial Services Company, Vice President and Assistant General Counsel |
25
MFS Government Securities Portfolio
Trustees and Officers – continued
| | | | | | | | |
Name, Age | | Position(s)
Held with Fund | | Trustee/Officer
Since (h) | | Number of MFS Funds for which the Person is an Officer | | Principal Occupations During the Past Five Years |
Frank L. Tarantino
(age 74) | | Independent
Senior Officer | | June 2004 | | 135 | | Tarantino LLC (provider of compliance services), Principal |
| | | | |
Richard S. Weitzel (k)
(age 48) | | Assistant Secretary and Assistant Clerk | | October 2007 | | 135 | | Massachusetts Financial Services Company, Senior Vice President and Associate General Counsel |
| | | | |
Martin J. Wolin (k) (age 51) | | Chief Compliance Officer | | July 2015 | | 135 | | Massachusetts Financial Services Company, Senior Vice President and Chief Compliance Officer (since July 2015); Mercer (financial service provider), Chief Risk and Compliance Officer, North America and Latin America (until June 2015) |
| | | | |
James O. Yost (k)
(age 58) | | Treasurer | | September 1990 | | 135 | | Massachusetts Financial Services Company, Senior Vice President |
| (h) | Date first appointed to serve as Trustee/officer of an MFS Fund. Each Trustee has served continuously since appointment unless indicated otherwise. For the period from December 15, 2004 until February 22, 2005, Mr. Manning served as Advisory Trustee. From January 2012 through December 2016, Messrs. DiLorenzo and Yost served as Treasurer and Deputy Treasurer of the Funds, respectively. |
| (j) | Directorships or trusteeships of companies required to report to the Securities and Exchange Commission (i.e., “public companies”). |
| (k) | “Interested person” of the Trust within the meaning of the Investment Company Act of 1940 (referred to as the 1940 Act), which is the principal federal law governing investment companies like the fund, as a result of a position with MFS. The address of MFS is 111 Huntington Avenue, Boston, Massachusetts 02199-7618. |
Each Trustee has been elected by shareholders and each Trustee and officer holds office until his or her successor is chosen and qualified or until his or her earlier death, resignation, retirement or removal. The Trust does not hold annual meetings for the purpose of electing Trustees, and Trustees are not elected for fixed terms. Under the terms of the Board’s retirement policy, an Independent Trustee shall retire at the end of the calendar year in which he or she reaches the earlier of 75 years of age or 15 years of service on the Board (or, in the case of any Independent Trustee who joined the Board prior to 2015, 20 years of service on the Board).
Messrs. Buller, Hegarty, Kilman and Otis and Ms. Roepke are members of the Trust’s Audit Committee.
Each of the Interested Trustees and certain Officers hold comparable officer positions with certain affiliates of MFS.
The Statement of Additional Information for a Fund includes further information about the Trustees and is available without charge upon request by calling1-800-225-2606.
| | |
Investment Adviser Massachusetts Financial Services Company 111 Huntington Avenue Boston, MA 02199-7618 | | Custodian State Street Bank and Trust Company 1 Lincoln Street Boston, MA 02111-2900 |
Distributor MFS Fund Distributors, Inc. 111 Huntington Avenue Boston, MA 02199-7618 | | Independent Registered Public Accounting Firm Deloitte & Touche LLP 200 Berkeley Street Boston, MA 02116 |
Portfolio Manager(s) Geoffrey Schechter Jake Stone | | |
26
MFS Government Securities Portfolio
BOARD REVIEW OF INVESTMENT ADVISORY AGREEMENT
The Investment Company Act of 1940 requires that both the full Board of Trustees and a majority of thenon-interested (“independent”) Trustees, voting separately, annually approve the continuation of the Fund’s investment advisory agreement with MFS. The Trustees consider matters bearing on the Fund and its advisory arrangements at their meetings throughout the year, including a review of performance data at each regular meeting. In addition, the independent Trustees met several times over the course of three months beginning in May and ending in July, 2018 (“contract review meetings”) for the specific purpose of considering whether to approve the continuation of the investment advisory agreement for the Fund and the other investment companies that the Board oversees (the “MFS Funds”). The independent Trustees were assisted in their evaluation of the Fund’s investment advisory agreement by independent legal counsel, from whom they received separate legal advice and with whom they met separately from MFS during various contract review meetings. The independent Trustees were also assisted in this process by the MFS Funds’ Independent Senior Officer, a senior officer appointed by and reporting to the independent Trustees.
In connection with their deliberations regarding the continuation of the investment advisory agreement, the Trustees, including the independent Trustees, considered such information and factors as they believed, in light of the legal advice furnished to them and their own business judgment, to be relevant. The investment advisory agreement for the Fund was considered separately, although the Trustees also took into account the common interests of all MFS Funds in their review. As described below, the Trustees considered the nature, quality, and extent of the various investment advisory, administrative, and shareholder services performed by MFS under the existing investment advisory agreement and other arrangements with the Fund.
In connection with their contract review meetings, the Trustees received and relied upon materials that included, among other items: (i) information provided by Broadridge Financial Solutions, Inc. (“Broadridge”), an independent third party, on the investment performance of the Fund for various time periods ended December 31, 2017 and the investment performance of a group of funds with substantially similar investment classifications/objectives (the “Broadridge performance universe”), (ii) information provided by Broadridge on the Fund’s advisory fees and other expenses and the advisory fees and other expenses of comparable funds identified by Broadridge (the “Broadridge expense group”), (iii) information provided by MFS on the advisory fees of portfolios of other clients of MFS, including institutional separate accounts and other clients, (iv) information as to whether and to what extent applicable expense waivers, reimbursements or fee “breakpoints” are observed for the Fund, (v) information regarding MFS’ financial results and financial condition, including MFS’ and certain of its affiliates’ estimated profitability from services performed for the Fund and the MFS Funds as a whole, and compared to MFS’ institutional business, (vi) MFS’ views regarding the outlook for the mutual fund industry and the strategic business plans of MFS, (vii) descriptions of various functions performed by MFS for the Funds, such as compliance monitoring and portfolio trading practices, and (viii) information regarding the overall organization of MFS, including information about MFS’ senior management and other personnel providing investment advisory, administrative and other services to the Fund and the other MFS Funds. The comparative performance, fee and expense information prepared and provided by Broadridge was not independently verified and the independent Trustees did not independently verify any information provided to them by MFS.
The Trustees’ conclusion as to the continuation of the investment advisory agreement was based on a comprehensive consideration of all information provided to the Trustees and not the result of any single factor. Some of the factors that figured particularly in the Trustees’ deliberations are described below, although individual Trustees may have evaluated the information presented differently from one another, giving different weights to various factors. It is also important to recognize that the fee arrangements for the Fund and other MFS Funds are the result of years of review and discussion between the independent Trustees and MFS, that certain aspects of such arrangements may receive greater scrutiny in some years than in others, and that the Trustees’ conclusions may be based, in part, on their consideration of these same arrangements during the course of the year and in prior years.
Based on information provided by Broadridge and MFS, the Trustees reviewed the Fund’s total return investment performance as well as the Broadridge performance universe over various time periods. The Trustees placed particular emphasis on the total return performance of the Fund’s Initial Class shares in comparison to the performance of funds in its Broadridge performance universe over the three-year period ended December 31, 2017, which the Trustees believed was a long enough period to reflect differing market conditions. The total return performance of the Fund’s Initial Class shares was in the 2nd quintile relative to the other funds in the universe for this three-year period (the 1st quintile being the best performers and the 5th quintile being the worst performers). The total return performance of the Fund’s Initial Class shares was in the 2nd quintile for each of theone- and five-year periods ended December 31, 2017 relative to the Broadridge performance universe. Because of the passage of time, these performance results may differ from the performance results for more recent periods, including those shown elsewhere in this report.
In the course of their deliberations, the Trustees took into account information provided by MFS in connection with the contract review meetings, as well as during investment review meetings conducted with portfolio management personnel during the course of the year regarding the Fund’s performance. After reviewing these and related factors, the Trustees concluded, within the context of their overall conclusions regarding the investment advisory agreement, that they were satisfied with MFS’ responses and efforts relating to investment performance.
27
MFS Government Securities Portfolio
Board Review of Investment Advisory Agreement – continued
In assessing the reasonableness of the Fund’s advisory fee, the Trustees considered, among other information, the Fund’s advisory fee and the total expense ratio of the Fund’s Initial Class shares as a percentage of average daily net assets and the advisory fee and total expense ratios of peer groups of funds based on information provided by Broadridge. The Trustees considered that MFS currently observes an expense limitation for the Fund, which may not be changed without the Trustees’ approval. The Trustees also considered that, according to the data provided by Broadridge (which takes into account any fee reductions or expense limitations that were in effect during the Fund’s last fiscal year), the Fund’s effective advisory fee rate was higher than the Broadridge expense group median and the Fund’s total expense ratio was approximately at the Broadridge expense group median. The Trustees also noted that MFS has agreed to further reduce such expense limitation for the Fund effective August 1, 2018, which may not be changed without the Trustees’ approval.
The Trustees also considered the advisory fees charged by MFS to any institutional separate accounts advised by MFS (“separate accounts”) and unaffiliated investment companies for which MFS serves as subadviser (“subadvised funds”) that have comparable investment strategies to the Fund, if any. In comparing these fees, the Trustees considered information provided by MFS as to the generally broader scope of services provided by MFS to the Fund, as well as the more extensive regulatory burdens imposed on MFS in managing the Fund, in comparison to separate accounts and subadvised funds. The Trustees also considered the higher demands placed on MFS’ investment personnel and trading infrastructure as a result of the daily cashin-flows andout-flows of the Fund in comparison to separate accounts.
The Trustees also considered whether the Fund may benefit from any economies of scale in the management of the Fund in the event of growth in assets of the Fund and/or growth in assets of the MFS Funds as a whole. They noted that the Fund’s advisory fee rate schedule is subject to a contractual breakpoint that reduces the Fund’s advisory fee rate on average daily net assets over $1 billion. The Trustees also noted that MFS has agreed in writing to waive a portion of the management fees of certain MFS Funds, including the Fund, if the total combined assets of certain funds within the MFS Funds’ complex increase above agreed upon thresholds (the “group fee waiver”), enabling the Fund’s shareholders to share in the benefits from any economies of scale at the complex level. The group fee waiver is reviewed and renewed annually between the Board and MFS. The Trustees concluded that the breakpoint and the group fee waiver were sufficient to allow the Fund to benefit from economies of scale as its assets and overall complex assets grow.
The Trustees also considered information prepared by MFS relating to MFS’ costs and profits with respect to the Fund, the MFS Funds considered as a group, and other investment companies and accounts advised by MFS, as well as MFS’ methodologies used to determine and allocate its costs to the MFS Funds, the Fund and other accounts and products for purposes of estimating profitability.
After reviewing these and other factors described herein, the Trustees concluded, within the context of their overall conclusions regarding the investment advisory agreement, that the advisory fees charged to the Fund represent reasonable compensation in light of the services being provided by MFS to the Fund.
In addition, the Trustees considered MFS’ resources and related efforts to continue to retain, attract and motivate capable personnel to serve the Fund. The Trustees also considered current and developing conditions in the financial services industry, including the presence of large and well-capitalized companies which are spending, and appear to be prepared to continue to spend, substantial sums to engage personnel and to provide services to competing investment companies. In this regard, the Trustees also considered the financial resources of MFS and its ultimate parent, Sun Life Financial Inc. The Trustees also considered the advantages and possible disadvantages to the Fund of having an adviser that also serves other investment companies as well as other accounts.
The Trustees also considered the nature, quality, cost, and extent of administrative, transfer agency, and distribution services provided to the Fund by MFS and its affiliates under agreements and plans other than the investment advisory agreement, including any12b-1 fees the Fund pays to MFS Fund Distributors, Inc., an affiliate of MFS. The Trustees also considered the nature, extent and quality of certain other services MFS performs or arranges for on the Fund’s behalf, which may include securities lending programs, directed expense payment programs, class action recovery programs, and MFS’ interaction with third-party service providers, principally custodians andsub-custodians. The Trustees concluded that the variousnon-advisory services provided by MFS and its affiliates on behalf of the Fund were satisfactory.
The Trustees consideredso-called“fall-out benefits” to MFS such as reputational value derived from serving as investment manager to the MFS Funds. The Trustees also considered that, effective January 3, 2018, MFS had discontinued its historic practice of obtaining investment research from portfolio brokerage commissions paid by certain MFS Funds and would thereafter voluntarily reimburse a Fund, if applicable, for the costs of external research acquired through the use of the Fund’s portfolio brokerage commissions.
Based on their evaluation of factors that they deemed to be material, including those factors described above, the Board of Trustees, including the independent Trustees, concluded that the Fund’s investment advisory agreement with MFS should be continued for an additionalone-year period, commencing August 1, 2018.
28
MFS Government Securities Portfolio
PROXY VOTING POLICIES AND INFORMATION
MFS votes proxies on behalf of the fund pursuant to proxy voting policies and procedures that are available without charge, upon request, by calling 1-800-225-2606, by visitingmfs.com/proxyvoting, or by visiting the SEC’s Web site athttp://www.sec.gov.
Information regarding how the fund voted proxies relating to portfolio securities during the most recent twelve-month period ended June 30 is available by August 31 of each year without charge by visitingmfs.com/proxyvoting, or by visiting the SEC’s Web site athttp://www.sec.gov.
QUARTERLY PORTFOLIO DISCLOSURE
The fund files a complete schedule of portfolio holdings with the SEC for the first and third quarters of each fiscal year on Form N-Q. The fund’s Form N-Q is available on the SEC’s website athttp://www.sec.gov. A shareholder can obtain the portfolio holdings report for the first and third quarters of the fund’s fiscal year atmfs.com/vit2 by choosing the fund’s name and then selecting the “Resources” tab and clicking on “Prospectus and Reports”.
FURTHER INFORMATION
From time to time, MFS may post important information about the fund or the MFS funds on the MFS web site (mfs.com). This information is available athttps://www.mfs.com/en-us/what-we-do/announcements.htmlor atmfs.com/vit2 by choosing the fund’s name.
INFORMATION ABOUT FUND CONTRACTS AND LEGAL CLAIMS
The fund has entered into contractual arrangements with an investment adviser, administrator, distributor, shareholder servicing agent, 529 program manager (if applicable), and custodian who each provide services to the fund. Unless expressly stated otherwise, shareholders are not parties to, or intended beneficiaries of these contractual arrangements, and these contractual arrangements are not intended to create any shareholder right to enforce them against the service providers or to seek any remedy under them against the service providers, either directly or on behalf of the fund.
Under the Trust’s By-Laws and Declaration of Trust, any claims asserted against or on behalf of the MFS Funds, including claims against Trustees and Officers, must be brought in state and federal courts located within the Commonwealth of Massachusetts.
29
rev. 3/16
| | | | |
| | | |
| FACTS | | WHAT DOES MFS DO WITH YOUR
PERSONAL INFORMATION? | |  |
| | |
| Why? | | Financial companies choose how they share your personal information. Federal law gives consumers the right to limit some but not all sharing. Federal law also requires us to tell you how we collect, share, and protect your personal information. Please read this notice carefully to understand what we do. |
| | |
| What? | | The types of personal information we collect and share depend on the product or service you have with us. This information can include: • Social Security number and account balances • Account transactions and transaction history • Checking account information and wire transfer instructions When you areno longer our customer, we continue to share your information as described in this notice. |
| | |
| How? | | All financial companies need to share customers’ personal information to run their everyday business. In the section below, we list the reasons financial companies can share their customers’ personal information; the reasons MFS chooses to share; and whether you can limit this sharing. |
| | | | |
Reasons we can share your
personal information | | Does MFS share? | | Can you limit this
sharing? |
For our everyday business purposes – such as to process your transactions, maintain your account(s), respond to court orders and legal investigations, or report to credit bureaus | | Yes | | No |
For our marketing purposes – to offer our products and services to you | | No | | We don’t share |
| For joint marketing with other financial companies | | No | | We don’t share |
For our affiliates’ everyday business purposes – information about your transactions and experiences | | No | | We don’t share |
For our affiliates’ everyday business purposes – information about your creditworthiness | | No | | We don’t share |
| For nonaffiliates to market to you | | No | | We don’t share |
| | |
| | |
| Questions? | | Call800-225-2606 or go tomfs.com. |
30
| | |
| Who we are |
| Who is providing this notice? | | MFS Funds, MFS Investment Management, MFS Institutional Advisors, Inc., and MFS Heritage Trust Company. |
| | |
| What we do |
| How does MFS protect my personal information? | | To protect your personal information from unauthorized access and use, we use security measures that comply with federal law. These measures include procedural, electronic, and physical safeguards for the protection of the personal information we collect about you. |
How does MFS
collect my personal information? | | We collect your personal information, for example, when you • open an account or provide account information • direct us to buy securities or direct us to sell your securities • make a wire transfer We also collect your personal information from others, such as credit bureaus, affiliates, or other companies. |
| Why can’t I limit all sharing? | | Federal law gives you the right to limit only • sharing for affiliates’ everyday business purposes – information about your creditworthiness • affiliates from using your information to market to you • sharing for nonaffiliates to market to you State laws and individual companies may give you additional rights to limit sharing. |
| | |
| Definitions |
| Affiliates | | Companies related by common ownership or control. They can be financial and nonfinancial companies. • MFS does not share personal information with affiliates, except for everyday business purposes as described on page one of this notice. |
| Nonaffiliates | | Companies not related by common ownership or control. They can be financial and nonfinancial companies. • MFS does not share with nonaffiliates so they can market to you. |
| Joint marketing | | A formal agreement between nonaffiliated financial companies that together market financial products or services to you. • MFS doesn’t jointly market. |
| | |
| Other important information |
| If you own an MFS product or receive an MFS service in the name of a third party such as a bank or broker-dealer, their privacy policy may apply to you instead of ours. |
31
Annual Report
December 31, 2018

MFS® High Yield Portfolio

MFS® Variable Insurance Trust II
Beginning on January 1, 2021, as permitted by regulations adopted by the U.S. Securities and Exchange Commission, the insurance company that offers your contract may determine that it will no longer send you paper copies of the fund’s annual and semiannual shareholder reports unless you specifically request paper copies from the insurance company or from your financial intermediary. Instead, the shareholder reports will be made available on a Web site (insurancefunds.mfs.com or other Web site of which you will be notified), and the insurance company will notify you by mail each time a report is posted and provide you with a Web site link to access the report. Instructions for requesting paper copies will be provided by your insurance company or financial intermediary.
If you already elected to receive shareholder reports by email, you will not be affected by this change and you need not take any action. If your insurance company or financial intermediary offers electronic delivery, you may elect to receive shareholder reports and other communications from the insurance company or financial intermediary by email by following the instructions provided by the insurance company or financial intermediary.
Beginning on January 1, 2019, you may elect to receive all future reports in paper free of charge from the insurance company or financial intermediary. You can inform the insurance company or financial intermediary that you wish to continue receiving paper copies of your shareholder reports by contacting your insurance company or financial intermediary. Your election to receive reports in paper will apply to all funds held in your account with your insurance company or financial intermediary.
HYS-ANN
MFS® High Yield Portfolio
CONTENTS
The report is prepared for the general information of contract owners. It is authorized for distribution to prospective investors only when preceded or accompanied by a current prospectus.
NOT FDIC INSURED• MAY LOSE VALUE• NO BANK OR CREDIT UNION GUARANTEE• NOT A DEPOSIT• NOT INSURED BY ANY FEDERAL GOVERNMENT AGENCY OR NCUA/NCUSIF
MFS High Yield Portfolio
LETTER FROM THE EXECUTIVE CHAIRMAN

Dear Contract Owners:
Higher interest rates, international trade friction, and geopolitical uncertainty surrounding issues such as Brexit have contributed to an uptick in market volatility in recent quarters — a departure from thelow-volatility environment that prevailed for much of the past several years. Against this more challenging backdrop, equity markets in the United States outperformed most international markets on a relative basis in 2018, though broad market returns were modestly negative on an absolute basis. Global economic growth has become less synchronized over the past few quarters, with Europe, China, and some emerging markets having shown signs of significantly slowing growth. While U.S. growth has remained above average, the pace of that growth slowed in the second half of 2018.
Slowing global growth and tighter financial conditions have clouded the outlook for U.S. monetary policy, with the chairman of the U.S. Federal Reserve acknowledging that policy rates are close to levels that the Fed deems neutral for the U.S. economy. This suggests that the predictable pattern of quarterly rate increases is behind us. At the same time, markets must contend with a shift from years of quantitative easing toward a cycle of quantitative tightening now that the European Central Bank has halted asset purchases. U.S. tax reforms adopted in late 2017 have been welcomed by equity markets while emerging market economies have recently had to contend with tighter financial conditions as a result of firmer U.S. interest rates and a stronger dollar. With the Republicans losing control of the U.S. House of Representatives, further meaningful U.S. fiscal stimulus appears less likely over the remainder of this presidential term. A partial U.S. government shutdown, beginning in late 2018, also added to political uncertainty. Globally, inflation remains largely subdued thanks in part to falling oil prices, but tight labor markets and moderate global demand have investors on the lookout for its potential reappearance. Increased U.S. protectionism is also a growing concern, as investors fear trade disputes could dampen business sentiment, leading to even slower global growth. While there has been progress on this front — a NAFTA replacement has been agreed upon between the U.S., Mexico, and Canada; the free trade pact with Korea has been updated; and a negotiating framework with the European Union has been agreed upon — tensions over trade with China remain quite high, though the two sides have recently returned to the negotiating table.
As a global investment manager with nearly a century of expertise, MFS® firmly believes active risk management offers downside mitigation and may help improve investment outcomes. We built our active investment platform with this belief in mind. Ourlong-term perspective influences nearly every aspect of our business, ensuring our investment decisions align with the investing time horizons of our clients.
Respectfully,

Robert J. Manning
Executive Chairman
MFS Investment Management
February 15, 2019
The opinions expressed in this letter are subject to change and may not be relied upon for investment advice. No forecasts can be guaranteed.
1
MFS High Yield Portfolio
PORTFOLIO COMPOSITION
Portfolio structure (i)
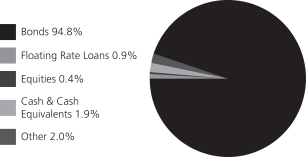
| | | | |
| Top five industries (i) | | | | |
| Cable TV | | | 8.5% | |
| Midstream | | | 5.8% | |
| Medical & Health Technology & Services | | | 5.6% | |
| Energy-Independent | | | 5.4% | |
| Containers | | | 5.2% | |
| | | | |
| Composition including fixed income credit quality (a)(i) | |
| BBB | | | 1.7% | |
| BB | | | 52.3% | |
| B | | | 34.1% | |
| CCC | | | 9.0% | |
| CC | | | 0.3% | |
| C (o) | | | 0.0% | |
| Not Rated | | | (1.7)% | |
| Non-Fixed Income | | | 0.4% | |
| Cash & Cash Equivalents | | | 1.9% | |
| Other | | | 2.0% | |
| |
| Portfolio facts (i) | | | | |
| Average Duration (d) | | | 4.4 | |
| Average Effective Maturity (m) | | | 6.4 yrs. | |
| (a) | | For all securities other than those specifically described below, ratings are assigned to underlying securities utilizing ratings from Moody’s, Fitch, and Standard & Poor’s rating agencies and applying the following hierarchy: If all three agencies provide a rating, the middle rating (after dropping the highest and lowest ratings) is assigned; if two of the three agencies rate a security, the lower of the two is assigned. Ratings are shown in the S&P and Fitch scale (e.g., AAA). Securities rated BBB or higher are considered investment grade. All ratings are subject to change. Not Rated includes fixed income securities and fixed income derivatives, which have not been rated by any rating agency.Non-Fixed Income includes any equity securities (including convertible bonds and equity derivatives) and/or commodity-linked derivatives. The fund may or may not have held all of these instruments on this date. The fund is not rated by these agencies. |
| (d) | | Duration is a measure of how much a bond’s price is likely to fluctuate with general changes in interest rates, e.g., if rates rise 1.00%, a bond with a5-year duration is likely to lose about 5.00% of its value due to the interest rate move. |
| (i) | | For purposes of this presentation, the components include the value of securities, and reflect the impact of the equivalent exposure of derivative positions, if any. These amounts may be negative from time to time. Equivalent exposure is a calculated amount that translates the derivative position into a reasonable approximation of the amount of the underlying asset that the portfolio would have to hold at a given point in time to have the same price sensitivity that results from the portfolio’s ownership of the derivative contract. When dealing with derivatives, equivalent exposure is a more representative measure of the potential impact of a position on portfolio performance than value. The bond component will include any accrued interest amounts. |
| (m) | | In determining each instrument’s effective maturity for purposes of calculating the fund’s dollar-weighted average effective maturity, MFS uses the instrument’s stated maturity or, if applicable, an earlier date on which MFS believes it is probable that a maturity-shortening device (such as a put,pre-refunding or prepayment) will cause the instrument to be repaid. Such an earlier date can be substantially shorter than the instrument’s stated maturity. |
Where the fund holds convertible bonds, they are treated as part of the equity portion of the portfolio.
Cash & Cash Equivalents includes any cash, investments in money market funds, short-term securities, and other assets less liabilities. Please see the Statement of Assets and Liabilities for additional information related to the fund’s cash position and other assets and liabilities.
Other includes equivalent exposure from currency derivatives and/or any offsets to derivative positions.
Percentages are based on net assets as of December 31, 2018.
The portfolio is actively managed and current holdings may be different.
2
MFS High Yield Portfolio
MANAGEMENT REVIEW
Summary of Results
For the twelve months ended December 31, 2018, Initial Class shares of the MFS High Yield Portfolio (“fund”) provided a total return of –3.08%, while Service Class shares of the fund provided a total return of –3.24%. These compare with a return of –2.08% over the same period for the fund’s benchmark, the Bloomberg Barclays U.S. High-Yield Corporate Bond 2% Issuer Capped Index.
Market Environment
During the reporting period, the US Federal Reserve raised interest rates by 100 basis points, bringing the total number of rate hikes to nine since the central bank began to normalize monetary policy in late 2015. Economic growth rates in the US, Eurozone and Japan remained above trend, despite a slowing in global growth, particularly toward the end of the period. Inflation remained contained, particularly outside the US. Late in the period, the European Central Bank halted its asset purchase program but issued forward guidance that it does not expect to raise interest rates at least until after the summer of 2019. The Bank of England (once) and the Bank of Canada (three times) each raised rates during the period. The European political backdrop became a bit more volatile, late in the period, spurred by concerns over cohesion in the eurozone after the election of an anti-establishment, Eurosceptic coalition government in Italy and widespread protests over stagnant wage growth in France.
Bond yields rose in the US during most of the period, but remained low by historical standards and slipped from their highs, late in the period, as market volatility increased. Yields in many developed markets fell. Outside of emerging markets, where spreads and currencies came under pressure, credit spreads remained quite tight until the end of the period, when thinner liquidity, lower oil prices and concerns over high degrees of corporate leverage emerged. Growing concern over increasing global trade friction appeared to have weighed on business sentiment during the period’s second half, especially outside the US. Tighter financial conditions from rising US rates and a strong dollar, combined with trade uncertainty, helped expose structural weaknesses in several emerging markets in the second half of the period.
Volatility increased, at the end of the period, amid signs of slowing global economic growth and increasing trade tensions, which prompted a market setback shortly after US markets set record highs in September. It was the second such equity market decline during the reporting period. The correction came despite a third consecutive quarter of strong growth in US earnings per share. Strong earnings growth, combined with the market decline, brought US equity valuations down from elevated levels, earlier in the period, to multiples more in line with long-term averages. While the US economy held up better than most, global economic growth became less synchronized during the period, with Europe and China showing signs of a slowdown and some emerging markets coming under stress.
Detractors from Performance
Relative to the Bloomberg Barclays U.S. High-Yield Corporate Bond 2% Issuer Capped Index, the fund’s security selection detracted from performance over the reporting period. From a quality perspective, selection inB-rated (r) bonds, particularly in thecommunications,energy,consumernon-cyclicalsandelectric sectors, weighed on relative performance.
Top individual detractors for the reporting period included overweight exposures to independent exploration and production companies Alta Mesa Resources (energy) and Sanchez Energy (energy) and mobile telecommunication services provider Digicel Group (communications).
Contributors to Performance
During the reporting period, the fund’s asset allocation decisions supported relative performance, led by an underweight exposure to the poor-performingenergy sector. From a quality perspective, the fund’s underweight exposure toCCC-rated bonds helped relative results.
The fund’s yield curve (y) positioning, particularly the fund’s lesser exposure to shifts in the short end (centered around maturities of two or less years) of the yield curve was another area of relative strength as short-term interest rates generally increased more than long-term rates throughout the period.
Top individual contributors for the reporting period included overweight positions in hotel operator Ryman Hospitality Properties (consumer cyclicals), aircraft leasing company Park Aerospace Holdings (finance), midstream energy asset manager Tallgrass Energy Partners (energy) and diamond producer Northwest Acquisitions (basic industry).
Respectfully,
Portfolio Manager(s)
David Cole and Michael Skatrud
3
MFS High Yield Portfolio
Management Review – continued
| (r) | Bonds rated “BBB”, “Baa”, or higher are considered investment grade; bonds rated “BB”, “Ba”, or below are considerednon-investment grade. The sources for bond quality ratings are Moody’s Investors Service, Standard & Poor’s and Fitch, Inc. and are applied using the following hierarchy: If all three agencies provide a rating, the middle rating (after dropping the highest and lowest ratings) is assigned; if two of the three agencies rate a security, the lower of the two is assigned. Ratings are shown in the S&P and Fitch scale (e.g., AAA). For securities which are not rated by any of the three agencies, the security is considered Not Rated. |
| (y) | A yield curve graphically depicts the yields of different maturity bonds of the same credit quality and type; a normal yield curve is upward sloping, with short-term rates lower than long-term rates. |
Note to Shareholders: Effective March 1, 2018, Michael Skatrud became a Portfolio Manager of the Fund. Effective September 1, 2018, William Adams is no longer a Portfolio Manager of the Fund.
The views expressed in this report are those of the portfolio manager(s) only through the end of the period of the report as stated on the cover and do not necessarily reflect the views of MFS or any other person in the MFS organization. These views are subject to change at any time based on market or other conditions, and MFS disclaims any responsibility to update such views. These views may not be relied upon as investment advice or an indication of trading intent on behalf of any MFS portfolio. References to specific securities are not recommendations of such securities, and may not be representative of any MFS portfolio’s current or future investments.
4
MFS High Yield Portfolio
PERFORMANCE SUMMARY THROUGH 12/31/18
The following chart illustrates the historical performance of the fund in comparison to its benchmark(s). Benchmarks are unmanaged and may not be invested in directly. Benchmark returns do not reflect any fees or expenses. The performance of other share classes will be greater than or less than that of the class depicted below. (See Notes to Performance Summary.)
Performance data shown represents past performance and is no guarantee of future results. Investment return and principal value fluctuate so your units, when sold, may be worth more or less than the original cost; current performance may be lower or higher than quoted. The performance shown does not reflect the deduction of taxes, if any, that a contract holder would pay on fund distributions or the redemption of contract units. The returns for the fund shown also do not reflect the deduction of expenses associated with variable products, such as mortality and expense risk charges, separate account charges, and sales charges imposed by the insurance company separate accounts. Such expenses would reduce the overall returns shown.
Growth of a Hypothetical $10,000 Investment
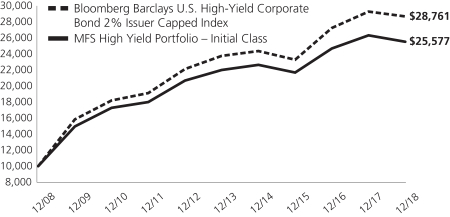
Total Returns through 12/31/18
Average annual total returns
| | | | | | | | | | | | |
| | | Share Class | | Class Inception Date | | 1-yr | | 5-yr | | 10-yr | | |
| | | Initial Class | | 6/12/85 | | (3.08)% | | 2.99% | | 9.85% | | |
| | | Service Class | | 8/24/01 | | (3.24)% | | 2.76% | | 9.58% | | |
| | | | |
| Comparative benchmark(s) | | | | | | | | |
| | | Bloomberg Barclays U.S. High-Yield Corporate Bond 2% Issuer Capped Index (f) | | (2.08)% | | 3.84% | | 11.14% | | |
| (f) | Source: FactSet Research Systems Inc. |
Benchmark Definition(s)
Bloomberg Barclays U.S. High-Yield Corporate Bond 2% Issuer Capped Index – a component of the Bloomberg Barclays U.S.High-Yield Corporate Bond Index, which measures performance of non-investment grade, fixed rate debt. The index limits the maximum exposure to any one issuer to 2%.
It is not possible to invest directly in an index.
Notes to Performance Summary
Average annual total return represents the average annual change in value for each share class for the periods presented.
Performance results reflect any applicable expense subsidies and waivers in effect during the periods shown. Without such subsidies and waivers the fund’s performance results would be less favorable. Please see the prospectus and financial statements for complete details. All results are historical and assume the reinvestment of any dividends and capital gains distributions.
Performance results do not include adjustments made for financial reporting purposes in accordance with U.S. generally accepted accounting principles and may differ from amounts reported in the financial highlights.
From time to time the fund may receive proceeds from litigation settlements, without which performance would be lower.
5
MFS High Yield Portfolio
EXPENSE TABLE
Fund Expenses Borne by the Contract Holders during the Period,
July 1, 2018 through December 31, 2018
As a contract holder of the fund, you incur ongoing costs, including management fees; distribution and/or service(12b-1) fees; and other fund expenses. This example is intended to help you understand your ongoing costs (in dollars) of investing in the fund and to compare these costs with the ongoing costs of investing in other mutual funds.
The example is based on an investment of $1,000 invested at the beginning of the period and held for the entire period July 1, 2018 through December 31, 2018.
Actual Expenses
The first line for each share class in the following table provides information about actual account values and actual expenses. You may use the information in this line, together with the amount you invested, to estimate the expenses that you paid over the period. Simply divide your account value by $1,000 (for example, an $8,600 account value divided by $1,000 = 8.6), then multiply the result by the number in the first line under the heading entitled “Expenses Paid During Period” to estimate the expenses you paid on your account during this period.
Hypothetical Example for Comparison Purposes
The second line for each share class in the following table provides information about hypothetical account values and hypothetical expenses based on the fund’s actual expense ratio and an assumed rate of return of 5% per year before expenses, which is not the fund’s actual return. The hypothetical account values and expenses may not be used to estimate the actual ending account balance or expenses you paid for the period. You may use this information to compare the ongoing costs of investing in the fund and other funds. To do so, compare this 5% hypothetical example with the 5% hypothetical examples that appear in the shareholder reports of the other funds.
Please note that the expenses shown in the table are meant to highlight the fund’s ongoing costs only and do not take into account the fees and expenses imposed under the variable contracts through which your investment in the fund is made. Therefore, the second line for each share class in the table is useful in comparing ongoing costs associated with an investment in vehicles (such as the fund) which fund benefits under variable annuity and variable life insurance contracts and to qualified pension and retirement plans only, and will not help you determine the relative total costs of investing in the fund through variable annuity and variable life insurance contracts. If the fees and expenses imposed under the variable contracts were included, your costs would have been higher.
| | | | | | | | | | | | | | | | | | |
| Share Class | | | | Annualized
Expense Ratio | | | Beginning
Account Value
7/01/18 | | | Ending
Account Value
12/31/18 | | | Expenses Paid
During Period (p)
7/01/18-12/31/18 | |
| Initial Class | | Actual | | | 0.72% | | | | $1,000.00 | | | | $981.12 | | | | $3.60 | |
| | Hypothetical (h) | | | 0.72% | | | | $1,000.00 | | | | $1,021.58 | | | | $3.67 | |
| Service Class | | Actual | | | 0.97% | | | | $1,000.00 | | | | $979.63 | | | | $4.84 | |
| | Hypothetical (h) | | | 0.97% | | | | $1,000.00 | | | | $1,020.32 | | | | $4.94 | |
| (h) | 5% class return per year before expenses. |
| (p) | “Expenses Paid During Period” are equal to each class’s annualized expense ratio, as shown above, multiplied by the average account value over the period, multiplied by 184/365 (to reflect theone-half year period). |
6
MFS High Yield Portfolio
PORTFOLIO OF INVESTMENTS – 12/31/18
The Portfolio of Investments is a complete list of all securities owned by your fund. It is categorized by broad-based asset classes.
| | | | | | | | |
| | |
| Issuer | | Shares/Par | | | Value ($) | |
| BONDS – 95.2% | | | | | | | | |
| Aerospace – 1.6% | | | | | |
| Bombardier, Inc., 7.5%, 3/15/2025 (n) | | $ | 460,000 | | | $ | 433,550 | |
| DAE Funding LLC, 5.75%, 11/15/2023 (n) | | | 1,200,000 | | | | 1,188,000 | |
| DAE Funding LLC, 5%, 8/01/2024 (n) | | | 2,415,000 | | | | 2,336,512 | |
| TransDigm, Inc., 6.5%, 7/15/2024 | | | 1,155,000 | | | | 1,123,238 | |
| TransDigm, Inc., 6.375%, 6/15/2026 | | | 700,000 | | | | 651,000 | |
| | | | | | | | |
| | | | | | $ | 5,732,300 | |
| | | | | | | | |
| Asset - Backed & Securitized – 0.0% | | | | | |
| CWCapital Cobalt Ltd., CDO, “F”, FLR, 3.808% (0% cash or 3.634% PIK), (LIBOR – 3mo. + 1.3%), 4/26/2050 (a)(p)(z) | | $ | 1,190,169 | | | $ | 119 | |
| | | | | | | | |
| Automotive – 1.3% | | | | | |
Allison Transmission, Inc.,
5%, 10/01/2024 (n) | | $ | 3,009,000 | | | $ | 2,888,640 | |
IHO Verwaltungs GmbH,
4.75%, (4.75% cash or 5.5% PIK) 9/15/2026 (n)(p) | | | 1,945,000 | | | | 1,693,259 | |
Jaguar Land Rover Automotive PLC,
4.5%, 10/01/2027 (n) | | | 445,000 | | | | 331,525 | |
| | | | | | | | |
| | | | | | $ | 4,913,424 | |
| | | | | | | | |
| Broadcasting – 2.9% | | | | | |
| Liberty Media Corp. - Liberty Formula One, 8.5%, 7/15/2029 | | $ | 1,535,000 | | | $ | 1,542,675 | |
| Liberty Media Corp. - Liberty Formula One, 8.25%, 2/01/2030 | | | 530,000 | | | | 516,750 | |
| Match Group, Inc., 6.375%, 6/01/2024 | | | 1,750,000 | | | | 1,780,625 | |
| Netflix, Inc., 5.875%, 2/15/2025 | | | 1,475,000 | | | | 1,487,906 | |
| Netflix, Inc., 4.875%, 4/15/2028 | | | 450,000 | | | | 410,625 | |
| Netflix, Inc., 5.875%, 11/15/2028 (n) | | | 1,975,000 | | | | 1,924,499 | |
| Netflix, Inc., 4.625%, 5/15/2029 (n) | | EUR | 715,000 | | | | 802,925 | |
| WMG Acquisition Corp., 5%, 8/01/2023 (n) | | $ | 525,000 | | | | 510,563 | |
WMG Acquisition Corp.,
4.875%, 11/01/2024 (n) | | | 1,595,000 | | | | 1,511,263 | |
| WMG Acquisition Corp., 5.5%, 4/15/2026 (n) | | | 300,000 | | | | 286,500 | |
| | | | | | | | |
| | | | | | $ | 10,774,331 | |
| | | | | | | | |
| Building – 4.1% | | | | | |
| ABC Supply Co., Inc., 5.75%, 12/15/2023 (n) | | $ | 2,080,000 | | | $ | 2,059,200 | |
| ABC Supply Co., Inc., 5.875%, 5/15/2026 (n) | | | 1,305,000 | | | | 1,242,608 | |
Beacon Escrow Corp.,
4.875%, 11/01/2025 (n) | | | 1,760,000 | | | | 1,546,600 | |
| James Hardie International Finance Ltd., 4.75%, 1/15/2025 (n) | | | 310,000 | | | | 282,100 | |
James Hardie International Finance Ltd.,
5%, 1/15/2028 (n) | | | 1,420,000 | | | | 1,214,100 | |
| NCI Building Systems, Inc., 8%, 4/15/2026 (z) | | | 345,000 | | | | 315,675 | |
| | | | | | | | |
| | |
| Issuer | | Shares/Par | | | Value ($) | |
| BONDS – continued | | | | | | | | |
| Building – continued | | | | | |
| New Enterprise Stone & Lime Co., Inc., 10.125%, 4/01/2022 (n) | | $ | 1,710,000 | | | $ | 1,667,250 | |
New Enterprise Stone & Lime Co., Inc.,
6.25%, 3/15/2026 (n) | | | 997,000 | | | | 907,270 | |
| PriSo Acquisition Corp., 9%, 5/15/2023 (n) | | | 714,000 | | | | 722,925 | |
Standard Industries, Inc.,
5.375%, 11/15/2024 (n) | | | 1,730,000 | | | | 1,624,037 | |
| Standard Industries, Inc., 6%, 10/15/2025 (n) | | | 1,265,000 | | | | 1,213,262 | |
| Summit Materials LLC/Summit Materials Finance Co., 6.125%, 7/15/2023 | | | 1,850,000 | | | | 1,831,500 | |
| Summit Materials LLC/Summit | | | | | | | | |
| Materials Finance Co., 5.125%, 6/01/2025 (n) | | | 450,000 | | | | 409,500 | |
| | | | | | | | |
| | | | | | $ | 15,036,027 | |
| | | | | | | | |
| Business Services – 4.6% | | | | | |
| Alliance Data Systems Corp., 5.875%, 11/01/2021 (n) | | $ | 540,000 | | | $ | 539,244 | |
| Ascend Learning LLC, 6.875%, 8/01/2025 (n) | | | 1,270,000 | | | | 1,216,025 | |
| CDK Global, Inc., 4.875%, 6/01/2027 | | | 2,155,000 | | | | 1,998,762 | |
| Equinix, Inc., 5.375%, 4/01/2023 | | | 1,145,000 | | | | 1,139,275 | |
| Equinix, Inc., 5.75%, 1/01/2025 | | | 1,000,000 | | | | 1,007,500 | |
| Equinix, Inc., 5.875%, 1/15/2026 | | | 1,045,000 | | | | 1,052,838 | |
Financial & Risk U.S. Holdings, Inc.,
8.25%, 11/15/2026 (n) | | | 1,635,000 | | | | 1,493,981 | |
| First Data Corp., 5%, 1/15/2024 (n) | | | 3,085,000 | | | | 2,969,312 | |
| MSCI, Inc., 4.75%, 8/01/2026 (n) | | | 1,615,000 | | | | 1,530,213 | |
| Travelport Worldwide Ltd., 6%, 3/15/2026 (n) | | | 960,000 | | | | 969,600 | |
Vantiv LLC/Vantiv Issuer Corp.,
4.375%, 11/15/2025 (n) | | | 1,975,000 | | | | 1,806,908 | |
| Verscend Escrow Corp., 9.75%, 8/15/2026 (n) | | | 1,005,000 | | | | 944,700 | |
| | | | | | | | |
| | | | | | $ | 16,668,358 | |
| | | | | | | | |
| Cable TV – 8.2% | | | | | |
| Altice Financing S.A., 6.625%, 2/15/2023 (n) | | $ | 665,000 | | | $ | 638,400 | |
| Altice Financing S.A., 7.5%, 5/15/2026 (n) | | | 200,000 | | | | 182,500 | |
| CCO Holdings LLC/CCO Holdings Capital Corp., 5.75%, 1/15/2024 | | | 2,750,000 | | | | 2,736,250 | |
| CCO Holdings LLC/CCO Holdings Capital Corp., 5.375%, 5/01/2025 (n) | | | 815,000 | | | | 781,381 | |
| CCO Holdings LLC/CCO Holdings Capital Corp., 5.75%, 2/15/2026 (n) | | | 3,110,000 | | | | 3,047,800 | |
| CCO Holdings LLC/CCO Holdings Capital Corp., 5.875%, 5/01/2027 (n) | | | 1,595,000 | | | | 1,547,150 | |
| CSC Holdings LLC, 5.5%, 5/15/2026 (z) | | | 1,340,000 | | | | 1,262,950 | |
| CSC Holdings LLC, 5.5%, 4/15/2027 (n) | | | 2,960,000 | | | | 2,752,800 | |
| CSC Holdings LLC, 7.5%, 4/01/2028 (z) | | | 875,000 | | | | 872,813 | |
7
MFS High Yield Portfolio
Portfolio of Investments – continued
| | | | | | | | |
| | |
| Issuer | | Shares/Par | | | Value ($) | |
| BONDS – continued | | | | | |
| Cable TV – continued | | | | | |
| DISH DBS Corp., 5.875%, 11/15/2024 | | $ | 750,000 | | | $ | 603,750 | |
Intelsat Connect Finance,
9.5%, 2/15/2023 (n) | | | 530,000 | | | | 455,800 | |
Intelsat Jackson Holdings S.A.,
5.5%, 8/01/2023 | | | 1,605,000 | | | | 1,396,350 | |
| Sirius XM Radio, Inc., 4.625%, 5/15/2023 (n) | | | 770,000 | | | | 737,275 | |
| Sirius XM Radio, Inc., 6%, 7/15/2024 (n) | | | 1,605,000 | | | | 1,609,012 | |
| Sirius XM Radio, Inc., 5.375%, 4/15/2025 (n) | | | 745,000 | | | | 705,888 | |
Telenet Finance Luxembourg S.A.,
5.5%, 3/01/2028 (n) | | | 2,600,000 | | | | 2,353,000 | |
Unitymedia KabelBW GmbH,
6.125%, 1/15/2025 (n) | | | 1,865,000 | | | | 1,874,138 | |
| Videotron Ltd., 5.375%, 6/15/2024 (n) | | | 455,000 | | | | 450,450 | |
| Videotron Ltd., 5.125%, 4/15/2027 (n) | | | 2,660,000 | | | | 2,513,700 | |
Virgin Media Finance PLC,
5.75%, 1/15/2025 (n) | | | 200,000 | | | | 188,006 | |
Virgin Media Secured Finance PLC,
5.25%, 1/15/2026 (n) | | | 1,655,000 | | | | 1,516,394 | |
Ziggo Bond Finance B.V.,
5.875%, 1/15/2025 (n) | | | 2,080,000 | | | | 1,877,200 | |
| | | | | | | | |
| | | | | | $ | 30,103,007 | |
| | | | | | | | |
| Chemicals – 2.8% | | | | | |
Axalta Coating Systems Co.,
4.875%, 8/15/2024 (n) | | $ | 2,225,000 | | | $ | 2,102,625 | |
Consolidated Energy Finance S.A.,
6.875%, 6/15/2025 (n) | | | 1,235,000 | | | | 1,175,979 | |
| OCI N.V., 6.625%, 4/15/2023 (n) | | | 2,065,000 | | | | 2,028,863 | |
| PolyOne Corp., 5.25%, 3/15/2023 | | | 1,565,000 | | | | 1,510,225 | |
| SPCM S.A., 4.875%, 9/15/2025 (n) | | | 2,445,000 | | | | 2,127,150 | |
Starfruit Finance Co./Starfruit U.S. Holding Co. LLC,
6.5%, 10/01/2026 (n) | | EUR | 925,000 | | | | 977,947 | |
| Starfruit Finco B.V./Starfruit US Holdco LLC, 6.5%, 10/01/2026 | | | 325,000 | | | | 343,603 | |
| | | | | | | | |
| | | | | | $ | 10,266,392 | |
| | | | | | | | |
| Computer Software – 0.7% | | | | | |
| Diamond 1 Finance Corp./Diamond 2 Finance Corp., 5.875%, 6/15/2021 (n) | | $ | 1,485,000 | | | $ | 1,483,343 | |
| Diamond 1 Finance Corp./Diamond 2 Finance Corp., 6.02%, 6/15/2026 (n) | | | 935,000 | | | | 939,653 | |
| | | | | | | | |
| | | | | | $ | 2,422,996 | |
| | | | | | | | |
| Computer Software – Systems – 1.7% | | | | | |
| CDW LLC/CDW Finance Corp., 5.5%, 12/01/2024 | | $ | 370,000 | | | $ | 365,375 | |
| CDW LLC/CDW Finance Corp., 5%, 9/01/2025 | | | 510,000 | | | | 488,325 | |
| Fair Isaac Corp., 5.25%, 5/15/2026 (n) | | | 1,730,000 | | | | 1,673,775 | |
JDA Software Group, Inc.,
7.375%, 10/15/2024 (n) | | | 1,205,000 | | | | 1,214,037 | |
| Sabre GLBL, Inc., 5.375%, 4/15/2023 (n) | | | 2,410,000 | | | | 2,397,950 | |
| | | | | | | | |
| | | | | | $ | 6,139,462 | |
| | | | | | | | |
| | | | | | | | |
| | |
| Issuer | | Shares/Par | | | Value ($) | |
| BONDS – continued | | | | | |
| Conglomerates – 3.8% | | | | | |
| Amsted Industries Co., 5%, 3/15/2022 (n) | | $ | 2,500,000 | | | $ | 2,431,250 | |
BWX Technologies, Inc.,
5.375%, 7/15/2026 (n) | | | 1,760,000 | | | | 1,693,472 | |
| EnerSys, 5%, 4/30/2023 (n) | | | 3,100,000 | | | | 3,022,500 | |
| Entegris, Inc., 4.625%, 2/10/2026 (n) | | | 2,505,000 | | | | 2,304,600 | |
| Gates Global LLC, 6%, 7/15/2022 (n) | | | 872,000 | | | | 854,560 | |
Stevens Holding Co., Inc.,
6.125%, 10/01/2026 (n) | | | 1,625,000 | | | | 1,600,625 | |
| TriMas Corp., 4.875%, 10/15/2025 (n) | | | 2,095,000 | | | | 1,932,637 | |
| | | | | | | | |
| | | | | | $ | 13,839,644 | |
| | | | | | | | |
| Construction – 1.1% | | | | | |
| Empresas ICA S.A.B. de C.V., 8.9%, 2/04/2021 (a)(d) | | $ | 930,000 | | | $ | 152,287 | |
Empresas ICA S.A.B. de C.V.,
8.875%, 5/29/2024 (a)(d)(n) | | | 807,000 | | | | 138,199 | |
| Mattamy Group Corp., 6.5%, 10/01/2025 (n) | | | 1,940,000 | | | | 1,736,300 | |
Toll Brothers Finance Corp.,
4.875%, 11/15/2025 | | | 590,000 | | | | 551,650 | |
| Toll Brothers Finance Corp., 4.35%, 2/15/2028 | | | 1,720,000 | | | | 1,470,600 | |
| | | | | | | | |
| | | | | | $ | 4,049,036 | |
| | | | | | | | |
| Consumer Products – 1.1% | | | | | |
| Coty, Inc., 6.5%, 4/15/2026 (n) | | $ | 895,000 | | | $ | 769,700 | |
Energizer Gamma Acquisition, Inc.,
6.375%, 7/15/2026 (n) | | | 1,610,000 | | | | 1,477,175 | |
| Spectrum Brands, Inc., 5.75%, 7/15/2025 | | | 1,880,000 | | | | 1,785,436 | |
| | | | | | | | |
| | | | | | $ | 4,032,311 | |
| | | | | | | | |
| Consumer Services – 1.8% | | | | | |
| Cimpress N.V., 7%, 6/15/2026 (n) | | $ | 1,380,000 | | | $ | 1,324,800 | |
| Frontdoor, Inc., 6.75%, 8/15/2026 (n) | | | 1,405,000 | | | | 1,334,750 | |
Matthews International Corp.,
5.25%, 12/01/2025 (n) | | | 1,430,000 | | | | 1,329,900 | |
| NVA Holdings, Inc., 6.875%, 4/01/2026 (n) | | | 1,190,000 | | | | 1,065,050 | |
ServiceMaster Co. LLC,
5.125%, 11/15/2024 (n) | | | 1,810,000 | | | | 1,710,450 | |
| | | | | | | | |
| | | | | | $ | 6,764,950 | |
| | | | | | | | |
| Containers – 5.2% | | | | | |
| ARD Finance S.A., 6.625%, 9/15/2023 | | EUR | 510,000 | | | $ | 557,570 | |
| ARD Finance S.A., 7.125%, 9/15/2023 | | $ | 1,075,000 | | | | 964,813 | |
| ARD Securities Finance, 8.75%, (8.75% cash or 8.75% PIK) 1/31/2023 (n)(p) | | | 870,000 | | | | 702,797 | |
| Berry Global Group, Inc., 5.5%, 5/15/2022 | | | 2,200,000 | | | | 2,189,000 | |
| Berry Global Group, Inc., 6%, 10/15/2022 | | | 500,000 | | | | 505,000 | |
| BWAY Holding Co., Inc., 7.25%, 4/15/2025 (z) | | | 345,000 | | | | 309,638 | |
| Crown American LLC, 4.5%, 1/15/2023 | | | 1,442,000 | | | | 1,407,752 | |
| Crown Americas LLC/Crown Americas Capital Corp., 4.75%, 2/01/2026 (n) | | | 775,000 | | | | 735,281 | |
| Crown Americas LLC/Crown Americas Capital Corp. V, 4.25%, 9/30/2026 | | | 1,080,000 | | | | 969,300 | |
8
MFS High Yield Portfolio
Portfolio of Investments – continued
| | | | | | | | |
| | |
| Issuer | | Shares/Par | | | Value ($) | |
| BONDS – continued | | | | | |
| Containers – continued | | | | | |
Flex Acquisition Co., Inc.,
6.875%, 1/15/2025 (n) | | $ | 1,475,000 | | | $ | 1,312,750 | |
| Multi-Color Corp., 6.125%, 12/01/2022 (n) | | | 2,124,000 | | | | 2,108,070 | |
| Reynolds Group, 5.75%, 10/15/2020 | | | 741,367 | | | | 739,514 | |
| Reynolds Group, 5.125%, 7/15/2023 (n) | | | 1,260,000 | | | | 1,200,150 | |
| Sealed Air Corp., 4.875%, 12/01/2022 (n) | | | 1,875,000 | | | | 1,856,250 | |
| Sealed Air Corp., 5.125%, 12/01/2024 (n) | | | 365,000 | | | | 358,156 | |
| Sealed Air Corp., 5.5%, 9/15/2025 (n) | | | 420,000 | | | | 414,750 | |
| Silgan Holdings, Inc., 4.75%, 3/15/2025 | | | 1,385,000 | | | | 1,291,512 | |
| W/S Packaging Group, Inc., 9%, 4/15/2023 (n) | | | 1,230,000 | | | | 1,223,850 | |
| | | | | | | | |
| | | | | | $ | 18,846,153 | |
| | | | | | | | |
| Electrical Equipment – 0.7% | | | | | |
CommScope Technologies LLC,
5%, 3/15/2027 (n) | | $ | 3,170,000 | | | $ | 2,567,700 | |
| | | | | | | | |
| Electronics – 1.2% | | | | | |
| Qorvo, Inc., 5.5%, 7/15/2026 (n) | | $ | 1,535,000 | | | $ | 1,465,925 | |
Sensata Technologies B.V.,
5.625%, 11/01/2024 (n) | | | 835,000 | | | | 822,475 | |
Sensata Technologies B.V.,
5%, 10/01/2025 (n) | | | 2,080,000 | | | | 1,955,200 | |
| | | | | | | | |
| | | | | | $ | 4,243,600 | |
| | | | | | | | |
| Energy – Independent – 5.3% | | | | | |
| Alta Mesa Holdings LP/Alta Mesa | | | | | | | | |
| Finance Services Corp., 7.875%, 12/15/2024 | | $ | 2,565,000 | | | $ | 1,590,300 | |
| Callon Petroleum Co., 6.375%, 7/01/2026 | | | 1,745,000 | | | | 1,622,850 | |
| Carrizo Oil & Gas, Inc., 6.25%, 4/15/2023 | | | 790,000 | | | | 730,750 | |
| CrownRock LP/CrownRock Finance, Inc., 5.625%, 10/15/2025 (n) | | | 2,165,000 | | | | 1,948,500 | |
Diamondback Energy, Inc.,
5.375%, 5/31/2025 | | | 2,735,000 | | | | 2,666,625 | |
| Gulfport Energy Corp., 6%, 10/15/2024 | | | 1,295,000 | | | | 1,146,075 | |
Indigo Natural Resources LLC,
6.875%, 2/15/2026 (n) | | | 1,130,000 | | | | 971,800 | |
Magnolia Oil & Gas Operating LLC/Magnolia Oil & Gas Finance Corp.,
6%, 8/01/2026 (n) | | | 1,690,000 | | | | 1,630,850 | |
| Oasis Petroleum, Inc., 6.25%, 5/01/2026 (n) | | | 1,385,000 | | | | 1,163,400 | |
| Parsley Energy LLC/Parsley Finance Corp., 5.25%, 8/15/2025 (n) | | | 430,000 | | | | 389,150 | |
| Parsley Energy LLC/Parsley Finance Corp., 5.625%, 10/15/2027 (n) | | | 2,560,000 | | | | 2,326,400 | |
| QEP Resources, Inc., 5.25%, 5/01/2023 | | | 1,055,000 | | | | 933,675 | |
| Sanchez Energy Corp., 6.125%, 1/15/2023 | | | 1,180,000 | | | | 212,400 | |
| SM Energy Co., 6.75%, 9/15/2026 | | | 2,390,000 | | | | 2,139,050 | |
| | | | | | | | |
| | | | | | $ | 19,471,825 | |
| | | | | | | | |
| Entertainment – 1.3% | | | | | |
Live Nation Entertainment, Inc.,
5.625%, 3/15/2026 (n) | | $ | 1,795,000 | | | $ | 1,754,612 | |
Six Flags Entertainment Corp.,
4.875%, 7/31/2024 (n) | | | 3,320,000 | | | | 3,129,100 | |
| | | | | | | | |
| | | | | | $ | 4,883,712 | |
| | | | | | | | |
| | | | | | | | |
| | |
| Issuer | | Shares/Par | | | Value ($) | |
| BONDS – continued | | | | | |
| Financial Institutions – 1.2% | | | | | |
| Avolon Holdings Funding Ltd., 5.125%, 10/01/2023 | | $ | 1,085,000 | | | $ | 1,036,175 | |
Park Aerospace Holdings Ltd.,
5.5%, 2/15/2024 (n) | | | 2,710,000 | | | | 2,615,150 | |
| Wand Merger Corp., 8.125%, 7/15/2023 (n) | | | 830,000 | | | | 809,250 | |
| | | | | | | | |
| | | | | | $ | 4,460,575 | |
| | | | | | | | |
| Food & Beverages – 3.4% | | | | | |
| Aramark Services, Inc., 4.75%, 6/01/2026 | | $ | 1,620,000 | | | $ | 1,522,800 | |
| Aramark Services, Inc., 5%, 2/01/2028 (n) | | | 1,135,000 | | | | 1,058,388 | |
| Cott Holdings, Inc., 5.5%, 4/01/2025 (n) | | | 2,090,000 | | | | 1,969,825 | |
JBS USA LLC/JBS USA Finance, Inc.,
6.75%, 2/15/2028 (n) | | | 530,000 | | | | 516,750 | |
| JBS USA Lux S.A./JBS USA Finance, Inc., 5.875%, 7/15/2024 (n) | | | 1,835,000 | | | | 1,798,300 | |
Lamb Weston Holdings, Inc.,
4.625%, 11/01/2024 (n) | | | 1,175,000 | | | | 1,142,687 | |
Lamb Weston Holdings, Inc.,
4.875%, 11/01/2026 (n) | | | 750,000 | | | | 720,000 | |
| Pilgrim’s Pride Corp., 5.875%, 9/30/2027 (n) | | | 1,990,000 | | | | 1,805,925 | |
U.S. Foods Holding Corp.,
5.875%, 6/15/2024 (n) | | | 2,015,000 | | | | 1,959,587 | |
| | | | | | | | |
| | | | | | $ | 12,494,262 | |
| | | | | | | | |
| Gaming & Lodging – 4.4% | | | | | |
| CCM Merger, Inc., 6%, 3/15/2022 (n) | | $ | 1,420,000 | | | $ | 1,440,945 | |
GLP Capital LP/GLP Financing II, Inc.,
5.375%, 11/01/2023 | | | 925,000 | | | | 937,673 | |
GLP Capital LP/GLP Financing II, Inc.,
5.25%, 6/01/2025 | | | 1,245,000 | | | | 1,236,185 | |
GLP Capital LP/GLP Financing II, Inc.,
5.375%, 4/15/2026 | | | 260,000 | | | | 257,143 | |
Hilton Domestic Operating Co., Inc.,
5.125%, 5/01/2026 (n) | | | 1,555,000 | | | | 1,492,800 | |
| Hilton Worldwide Finance LLC, 4.625%, 4/01/2025 | | | 1,995,000 | | | | 1,890,262 | |
Marriot Ownership Resorts, Inc.,
5.625%, 4/15/2023 (z) | | | 1,225,000 | | | | 1,212,750 | |
MGM Resorts International,
6.625%, 12/15/2021 | | | 765,000 | | | | 784,125 | |
| MGM Resorts International, 6%, 3/15/2023 | | | 800,000 | | | | 804,000 | |
| MGM Resorts International, 5.75%, 6/15/2025 | | | 1,695,000 | | | | 1,635,675 | |
Ryman Hospitality Properties, Inc., REIT,
5%, 4/15/2021 | | | 1,940,000 | | | | 1,925,450 | |
Ryman Hospitality Properties, Inc., REIT,
5%, 4/15/2023 | | | 920,000 | | | | 897,000 | |
Wyndham Hotels Group, LLC,
5.375%, 4/15/2026 (n) | | | 1,660,000 | | | | 1,593,600 | |
| | | | | | | | |
| | | | | | $ | 16,107,608 | |
| | | | | | | | |
| Industrial – 0.9% | | | | | |
| Cleaver Brooks, Inc., 7.875%, 3/01/2023 (n) | | $ | 1,405,000 | | | $ | 1,355,825 | |
9
MFS High Yield Portfolio
Portfolio of Investments – continued
| | | | | | | | |
| | |
| Issuer | | Shares/Par | | | Value ($) | |
| BONDS – continued | | | | | |
| Industrial – continued | | | | | |
KAR Auction Services, Inc.,
5.125%, 6/01/2025 (n) | | $ | 2,215,000 | | | $ | 1,999,038 | |
| | | | | | | | |
| | | | | | $ | 3,354,863 | |
| | | | | | | | |
| Insurance – Health – 0.8% | | | | | |
| Centene Corp., 6.125%, 2/15/2024 | | $ | 950,000 | | | $ | 972,563 | |
| Centene Corp., 5.375%, 6/01/2026 (n) | | | 2,130,000 | | | | 2,071,425 | |
| | | | | | | | |
| | | | | | $ | 3,043,988 | |
| | | | | | | | |
| Insurance – Property & Casualty – 0.7% | | | | | |
| AssuredPartners Inc., 7%, 8/15/2025 (n) | | $ | 1,580,000 | | | $ | 1,424,022 | |
| Hub International Ltd., 7%, 5/01/2026 (n) | | | 1,385,000 | | | | 1,256,888 | |
| | | | | | | | |
| | | | | | $ | 2,680,910 | |
| | | | | | | | |
| Machinery & Tools – 0.5% | | | | | |
| Ashtead Capital, Inc., 5.625%, 10/01/2024 (n) | | $ | 1,730,000 | | | $ | 1,747,300 | |
| | | | | | | | |
| Major Banks – 0.6% | | | | | |
| UBS Group AG, 6.875% to 8/07/2025, FLR (Swap Rate – 5yr. + 4.59%) to 12/29/2049 | | $ | 2,245,000 | | | $ | 2,155,200 | |
| | | | | | | | |
| Medical & Health Technology & Services – 5.2% | | | | | |
| Avantor, Inc., 9%, 10/01/2025 (n) | | $ | 1,250,000 | | | $ | 1,250,000 | |
| DaVita, Inc., 5%, 5/01/2025 | | | 1,045,000 | | | | 948,338 | |
| Encompass Health Corp., 5.75%, 9/15/2025 | | | 695,000 | | | | 677,625 | |
| HCA, Inc., 7.5%, 2/15/2022 | | | 2,030,000 | | | | 2,156,875 | |
| HCA, Inc., 5%, 3/15/2024 | | | 1,430,000 | | | | 1,415,700 | |
| HCA, Inc., 5.375%, 2/01/2025 | | | 2,060,000 | | | | 2,008,500 | |
| HCA, Inc., 5.875%, 2/15/2026 | | | 1,205,000 | | | | 1,198,975 | |
| HealthSouth Corp., 5.125%, 3/15/2023 | | | 1,575,000 | | | | 1,543,500 | |
| HealthSouth Corp., 5.75%, 11/01/2024 | | | 500,000 | | | | 495,000 | |
| Heartland Dental, LLC, 8.5%, 5/01/2026 (n) | | | 1,310,000 | | | | 1,179,000 | |
| Polaris, 8.5%, (8.5% cash or 8.5% PIK) 12/01/2022 (n)(p) | | | 930,000 | | | | 848,272 | |
Quintiles IMS Holdings, Inc.,
5%, 10/15/2026 (n) | | | 1,415,000 | | | | 1,351,325 | |
Regional Care/LifePoint Health, Inc.,
9.75%, 12/01/2026 (n) | | | 1,445,000 | | | | 1,369,137 | |
| Tenet Healthcare Corp., 6.75%, 6/15/2023 | | | 1,430,000 | | | | 1,342,412 | |
West Street Merger Sub, Inc.,
6.375%, 9/01/2025 (n) | | | 1,405,000 | | | | 1,243,425 | |
| | | | | | | | |
| | | | | | $ | 19,028,084 | |
| | | | | | | | |
| Medical Equipment – 0.8% | | | | | |
| Teleflex, Inc., 5.25%, 6/15/2024 | | $ | 1,360,000 | | | $ | 1,353,200 | |
| Teleflex, Inc., 4.875%, 6/01/2026 | | | 785,000 | | | | 749,675 | |
| Teleflex, Inc., 4.625%, 11/15/2027 | | | 910,000 | | | | 844,025 | |
| | | | | | | | |
| | | | | | $ | 2,946,900 | |
| | | | | | | | |
| Metals & Mining – 4.1% | | | | | |
| Baffinland Iron Mines | | | | | | | | |
Corp./Baffinland Iron Mines LP,
8.75%, 7/15/2026 (n) | | $ | 1,330,000 | | | $ | 1,195,098 | |
| | | | | | | | |
| | |
| Issuer | | Shares/Par | | | Value ($) | |
| BONDS – continued | | | | | |
| Metals & Mining – continued | | | | | |
First Quantum Minerals Ltd.,
7.25%, 4/01/2023 (n) | | $ | 720,000 | | | $ | 633,600 | |
| Freeport-McMoRan Copper & Gold, Inc., 5.4%, 11/14/2034 | | | 1,905,000 | | | | 1,500,188 | |
| Freeport-McMoRan, Inc., 6.875%, 2/15/2023 | | | 2,954,000 | | | | 3,046,312 | |
| Kaiser Aluminum Corp., 5.875%, 5/15/2024 | | | 1,820,000 | | | | 1,779,050 | |
| Northwest Acquisitions ULC/Dominion Finco, Inc., 7.125%, 11/01/2022 (n) | | | 2,040,000 | | | | 2,016,601 | |
| Novelis Corp., 5.875%, 9/30/2026 (n) | | | 2,545,000 | | | | 2,252,325 | |
Petra Diamonds U.S. Treasury PLC,
7.25%, 5/01/2022 (n) | | | 1,520,000 | | | | 1,406,000 | |
| TMS International Corp., 7.25%, 8/15/2025 (n) | | | 1,250,000 | | | | 1,168,750 | |
| | | | | | | | |
| | | | | | $ | 14,997,924 | |
| | | | | | | | |
| Midstream – 5.7% | | | | | |
| Blue Racer Midstream LLC/Blue Racer Finance Corp., 6.125%, 11/15/2022 (n) | | $ | 1,040,000 | | | $ | 1,003,600 | |
| Blue Racer Midstream LLC/Blue | | | | | | | | |
| Racer Finance Corp., 6.625%, 7/15/2026 (n) | | | 1,590,000 | | | | 1,478,700 | |
| Cheniere Energy, Inc., 5.875%, 3/31/2025 | | | 1,835,000 | | | | 1,825,825 | |
| DCP Midstream Operating LP, 4.95%, 4/01/2022 | | | 772,000 | | | | 764,280 | |
| DCP Midstream Operating LP, 3.875%, 3/15/2023 | | | 1,480,000 | | | | 1,387,500 | |
DCP Midstream Operating LP,
5.375%, 7/15/2025 (n) | | | 1,045,000 | | | | 1,021,487 | |
| DCP Midstream Operating LP, 5.6%, 4/01/2044 | | | 815,000 | | | | 704,975 | |
| Energy Transfer Equity LP, 5.875%, 1/15/2024 | | | 1,935,000 | | | | 1,975,403 | |
EnLink Midstream Partners LP,
4.4%, 4/01/2024 | | | 1,800,000 | | | | 1,696,173 | |
| Tallgrass Energy Partners LP, 5.5%, 1/15/2028 (n) | | | 3,530,000 | | | | 3,388,800 | |
Targa Resources Partners LP/Targa Resources Finance Corp.,
5.25%, 5/01/2023 | | | 1,445,000 | | | | 1,416,100 | |
| Targa Resources Partners LP/Targa Resources Finance Corp., 5.125%, 2/01/2025 (n) | | | 745,000 | | | | 698,438 | |
| Targa Resources Partners LP/Targa Resources Finance Corp., 5.375%, 2/01/2027 | | | 3,515,000 | | | | 3,295,312 | |
| | | | | | | | |
| | | | | | $ | 20,656,593 | |
| | | | | | | | |
| Network & Telecom – 0.8% | | | | | |
Zayo Group LLC/Zayo Capital, Inc.,
6.375%, 5/15/2025 | | $ | 1,060,000 | | | $ | 985,800 | |
Zayo Group LLC/Zayo Capital, Inc.,
5.75%, 1/15/2027 (n) | | | 2,035,000 | | | | 1,816,238 | |
| | | | | | | | |
| | | | | | $ | 2,802,038 | |
| | | | | | | | |
10
MFS High Yield Portfolio
Portfolio of Investments – continued
| | | | | | | | |
| | |
| Issuer | | Shares/Par | | | Value ($) | |
| BONDS – continued | | | | | |
| Oil Services – 0.9% | | | | | |
| Apergy Corp., 6.375%, 5/01/2026 | | $ | 1,735,000 | | | $ | 1,682,950 | |
Diamond Offshore Drill Co.,
7.875%, 8/15/2025 | | | 745,000 | | | | 618,350 | |
| Diamond Offshore Drill Co., 5.7%, 10/15/2039 | | | 1,740,000 | | | | 1,061,400 | |
| | | | | | | | |
| | | | | | $ | 3,362,700 | |
| | | | | | | | |
| Oils – 0.6% | | | | | |
| Parkland Fuel Corp., 6%, 4/01/2026 (n) | | $ | 2,525,000 | | | $ | 2,367,188 | |
| | | | | | | | |
| Pharmaceuticals – 1.2% | | | | | |
Endo Finance LLC/Endo Finco, Inc.,
5.375%, 1/15/2023 (n) | | $ | 570,000 | | | $ | 433,200 | |
| Mallinckrodt International Finance S.A., 5.75%, 8/01/2022 (n) | | | 805,000 | | | | 692,300 | |
| Valeant Pharmaceuticals International, Inc., 5.5%, 3/01/2023 (n) | | | 1,605,000 | | | | 1,463,262 | |
| Valeant Pharmaceuticals International, Inc., 6.125%, 4/15/2025 (n) | | | 1,880,000 | | | | 1,640,300 | |
| | | | | | | | |
| | | | | | $ | 4,229,062 | |
| | | | | | | | |
| Precious Metals & Minerals – 0.4% | | | | | |
| Teck Resources Ltd., 6%, 8/15/2040 | | $ | 225,000 | | | $ | 209,250 | |
| Teck Resources Ltd., 6.25%, 7/15/2041 | | | 1,405,000 | | | | 1,331,238 | |
| | | | | | | | |
| | | | | | $ | 1,540,488 | |
| | | | | | | | |
| Printing & Publishing – 0.5% | | | | | |
| Nielsen Co. Lux S.A.R.L., 5%, 2/01/2025 (n) | | $ | 220,000 | | | $ | 205,700 | |
| Nielsen Finance LLC, 5%, 4/15/2022 (n) | | | 1,600,000 | | | | 1,528,000 | |
| | | | | | | | |
| | | | | | $ | 1,733,700 | |
| | | | | | | | |
| Real Estate – Healthcare – 1.0% | | | | | |
| MPT Operating Partnership LP/MPT Financial Co., REIT, 5.25%, 8/01/2026 | | $ | 1,765,000 | | | $ | 1,663,512 | |
| MPT Operating Partnership LP/MPT Financial Co., REIT, 5%, 10/15/2027 | | | 2,215,000 | | | | 2,025,341 | |
| | | | | | | | |
| | | | | | $ | 3,688,853 | |
| | | | | | | | |
| Real Estate – Other – 0.9% | | | | | |
| CyrusOne LP/CyrusOne Finance Corp., REIT, 5%, 3/15/2024 | | $ | 2,285,000 | | | $ | 2,239,300 | |
| CyrusOne LP/CyrusOne Finance Corp., REIT, 5.375%, 3/15/2027 | | | 1,000,000 | | | | 970,000 | |
| | | | | | | | |
| | | | | | $ | 3,209,300 | |
| | | | | | | | |
| Restaurants – 0.7% | | | | | |
| Golden Nugget, Inc., 6.75%, 10/15/2024 (n) | | $ | 775,000 | | | $ | 730,438 | |
| KFC Holding Co./Pizza Hut Holdings LLC/Taco Bell of America LLC, 5.25%, 6/01/2026 (n) | | | 1,895,000 | | | | 1,833,469 | |
| | | | | | | | |
| | | | | | $ | 2,563,907 | |
| | | | | | | | |
| Retailers – 0.8% | | | | | |
DriveTime Automotive Group, Inc./DT Acceptance Corp.,
8%, 6/01/2021 (n) | | $ | 915,000 | | | $ | 915,128 | |
| Hanesbrands, Inc., 4.625%, 5/15/2024 (n) | | | 440,000 | | | | 412,500 | |
| | | | | | | | |
| | |
| Issuer | | Shares/Par | | | Value ($) | |
| BONDS – continued | | | | | |
| Retailers – continued | | | | | |
| Hanesbrands, Inc., 4.875%, 5/15/2026 (n) | | $ | 1,720,000 | | | $ | 1,550,150 | |
| | | | | | | | |
| | | | | | $ | 2,877,778 | |
| | | | | | | | |
| Specialty Chemicals – 0.7% | | | | | |
| Univar USA, Inc., 6.75%, 7/15/2023 (n) | | $ | 2,420,000 | | | $ | 2,395,800 | |
| | | | | | | | |
| Specialty Stores – 0.3% | | | | | |
| Penske Automotive Group Co., 5.375%, 12/01/2024 | | $ | 300,000 | | | $ | 280,875 | |
Penske Automotive Group Co.,
5.5%, 5/15/2026 | | | 935,000 | | | | 869,550 | |
| | | | | | | | |
| | | | | | $ | 1,150,425 | |
| | | | | | | | |
| Supermarkets – 0.4% | | | | | |
| Albertsons Cos. LLC/Safeway Co., 6.625%, 6/15/2024 | | $ | 1,570,000 | | | $ | 1,456,175 | |
| | | | | | | | |
| Telecommunications – Wireless – 4.9% | | | | | |
| Altice France S.A., 6.25%, 5/15/2024 (n) | | $ | 500,000 | | | $ | 466,250 | |
| Altice France S.A., 8.125%, 2/01/2027 (n) | | | 1,285,000 | | | | 1,211,113 | |
| Altice Luxembourg S.A., 7.75%, 5/15/2022 (n) | | | 750,000 | | | | 682,500 | |
Altice Luxembourg S.A.,
7.625%, 2/15/2025 (n) | | | 1,450,000 | | | | 1,083,875 | |
| Digicel Group Ltd., 6.75%, 3/01/2023 (n) | | | 1,991,000 | | | | 1,575,379 | |
| SBA Communications Corp., 4%, 10/01/2022 | | | 2,125,000 | | | | 2,024,063 | |
SBA Communications Corp.,
4.875%, 9/01/2024 | | | 800,000 | | | | 752,000 | |
| SFR Group S.A., 7.375%, 5/01/2026 (n) | | | 440,000 | | | | 403,700 | |
| Sprint Corp., 7.875%, 9/15/2023 | | | 925,000 | | | | 949,281 | |
| Sprint Corp., 7.125%, 6/15/2024 | | | 2,675,000 | | | | 2,651,085 | |
| Sprint Nextel Corp., 6%, 11/15/2022 | | | 2,080,000 | | | | 2,041,166 | |
| T-Mobile USA, Inc., 6.5%, 1/15/2024 | | | 630,000 | | | | 647,438 | |
| T-Mobile USA, Inc., 5.125%, 4/15/2025 | | | 1,190,000 | | | | 1,155,788 | |
| T-Mobile USA, Inc., 6.5%, 1/15/2026 | | | 1,380,000 | | | | 1,407,600 | |
| T-Mobile USA, Inc., 5.375%, 4/15/2027 | | | 910,000 | | | | 878,150 | |
| | | | | | | | |
| | | | | | $ | 17,929,388 | |
| | | | | | | | |
| Telephone Services – 0.7% | | | | | |
| Level 3 Financing, Inc., 5.375%, 1/15/2024 | | $ | 715,000 | | | $ | 681,038 | |
| Level 3 Financing, Inc., 5.375%, 5/01/2025 | | | 1,840,000 | | | | 1,725,000 | |
| | | | | | | | |
| | | | | | $ | 2,406,038 | |
| | | | | | | | |
| Transportation – Services – 0.3% | |
| Navios South American Logistics, Inc./Navios Logistics Finance (U.S.), Inc., 7.25%, 5/01/2022 | | $ | 535,000 | | | $ | 484,175 | |
Syncreon Group BV/Syncre,
8.625%, 11/01/2021 (n) | | | 748,000 | | | | 635,800 | |
| | | | | | | | |
| | | | | | $ | 1,119,975 | |
| | | | | | | | |
| Utilities – Electric Power – 2.4% | |
Clearway Energy Operating LLC,
5.75%, 10/15/2025 (n) | | $ | 1,960,000 | | | $ | 1,871,800 | |
11
MFS High Yield Portfolio
Portfolio of Investments – continued
| | | | | | | | |
| | |
| Issuer | | Shares/Par | | | Value ($) | |
| BONDS – continued | | | | | |
| Utilities – Electric Power – continued | | | | | |
| Covanta Holding Corp., 5.875%, 3/01/2024 | | $ | 1,305,000 | | | $ | 1,226,700 | |
| Covanta Holding Corp., 5.875%, 7/01/2025 | | | 995,000 | | | | 915,400 | |
| Covanta Holding Corp., 6%, 1/01/2027 | | | 1,480,000 | | | | 1,324,600 | |
| Drax Finco PLC, 6.625%, 11/01/2025 (n) | | | 1,480,000 | | | | 1,454,100 | |
NextEra Energy Operating Co.,
4.25%, 9/15/2024 (n) | | | 1,960,000 | | | | 1,813,000 | |
| | | | | | | | |
| | | | | | $ | 8,605,600 | |
| | | | | | | | |
Total Bonds
(Identified Cost, $375,208,424) | | | | | | $ | 347,867,969 | |
| | | | | | | | |
|
| FLOATING RATE LOANS (r) – 0.9% | |
| Broadcasting – 0.1% | |
| Warner Music Group, Term Loan F, 4.896%, 11/01/2023 | | $ | 319,000 | | | $ | 306,340 | |
| | | | | | | | |
| Conglomerates – 0.1% | |
| Gates Global LLC, Term Loan B2, 5.427%, 4/01/2024 | | $ | 379,041 | | | $ | 359,378 | |
| | | | | | | | |
| Consumer Products – 0.1% | |
| Spectrum Brands, Inc., Term Loan B, 4.322%, 6/23/2022 | | $ | 470,330 | | | $ | 457,102 | |
| | | | | | | | |
| Entertainment – 0.1% | |
| Live Nation Entertainment, Inc., Term Loan B3, 4.148%, 10/31/2023 | | $ | 490,751 | | | $ | 479,096 | |
| | | | | | | | |
| Food & Beverages – 0.1% | |
U.S. Foods, Inc., Term Loan B,
4.788%, 6/27/2023 | | $ | 318,184 | | | $ | 300,949 | |
| | | | | | | | |
| Medical & Health Technology & Services – 0.3% | |
DaVita, Inc., Term Loan B,
5.042%, 6/24/2021 | | $ | 965,938 | | | $ | 953,260 | |
| | | | | | | | |
| Oil Services – 0.1% | |
Apergy Corp., Term Loan B,
5.118%, 5/09/2025 | | $ | 460,861 | | | $ | 433,209 | |
| | | | | | | | |
Total Floating Rate Loans
(Identified Cost, $3,355,770) | | | $ | 3,289,334 | |
| | | | | | | | |
| | | | | | | | | | | | |
| | | |
| Issuer | | | | | Shares/Par | | | Value ($) | |
| COMMON STOCKS – 0.3% | |
| Oil Services – 0.3% | |
LTRI Holdings LP (a)(u)
(Identified Cost, $401,400) | | | | | | | 1,115 | | | $ | 991,703 | |
| | | | | | | | | | | | |
| |
| CONVERTIBLE BONDS – 0.1% | | | | | |
| Cable TV – 0.1% | | | | | |
DISH Network Corp., 3.375%, 8/15/2026
(Identified Cost, $513,453) | | | $ | 570,000 | | | $ | 460,284 | |
| | | | | | | | | | | | |
| | | | | | | | | | | | | | | | |
| | | | |
| | | Strike
Price | | | First
Exercise | | | | | | | |
| WARRANTS – 0.0% | | | | | | | | | | | | | | | | |
| Forest & Paper Products – 0.0% | | | | | | | | | | | | | |
Appvion Holdings Corp. - Tranche A
(1 share for 1 warrant) | | | $27.17 | | | | 8/24/18 | | | | 670 | | | $ | 6,030 | |
Appvion Holdings Corp. - Tranche B
(1 share for 1 warrant) | | | 31.25 | | | | 8/24/18 | | | | 670 | | | | 5,025 | |
| | | | | | | | | | | | | | | | |
Total Warrants
(Identified Cost, $0) | | | | | | | | | | | | | | $ | 11,055 | |
| | | | | | | | | | | | | | | | |
| | |
| INVESTMENT COMPANIES (h) – 2.6% | | | | | | | | | |
| Money Market Funds – 2.6% | | | | | | | | | |
| MFS Institutional Money Market Portfolio, 2.4% (v) (Identified Cost, $9,626,610) | | | | 9,626,612 | | | | | | | $ | 9,625,650 | |
| | | | | | | | | | | | | | | | |
OTHER ASSETS, LESS
LIABILITIES – 0.9% | | | | | | | | | | | | | | | 3,129,816 | |
| | | | | | | | | | | | | | | | |
| NET ASSETS – 100.0% | | | | | | | $ | 365,375,811 | |
| | | | | | | | | | | | | | | | |
| (a) | | Non-income producing security. |
| (h) | | An affiliated issuer, which may be considered one in which the fund owns 5% or more of the outstanding voting securities, or a company which is under common control. At period end, the aggregate values of the fund’s investments in affiliated issuers and in unaffiliated issuers were $9,625,650 and $352,620,345, respectively. |
| (n) | | Securities exempt from registration under Rule 144A of the Securities Act of 1933. These securities may be sold in the ordinary course of business in transactions exempt from registration, normally to qualified institutional buyers. At period end, the aggregate value of these securities was $213,844,874, representing 58.5% of net assets. |
| (p) | | Payment-in-kind (PIK) security for which interest income may be received in additional securities and/or cash. |
| (r) | | The remaining maturities of floating rate loans may be less than the stated maturities shown as a result of contractual or optional prepayments by the borrower. Such prepayments cannot be predicted with certainty. These loans may be subject to restrictions on resale. The interest rate shown represents the weighted average of the floating interest rates on settled contracts within the loan facility at period end, unless otherwise indicated. The floating interest rates on settled contracts are determined periodically by reference to a base lending rate and a spread. |
| (u) | | The security was valued using significant unobservable inputs and is considered level 3 under the fair value hierarchy. For further information about the fund’s level 3 holdings, please see Note 2 in the Notes to Financial Statements. |
| (v) | | Affiliated issuer that is available only to investment companies managed by MFS. The rate quoted for the MFS Institutional Money Market Portfolio is the annualizedseven-day yield of the fund at period end. |
12
MFS High Yield Portfolio
Portfolio of Investments – continued
| (z) | | Restricted securities are not registered under the Securities Act of 1933 and are subject to legal restrictions on resale. These securities generally may be resold in transactions exempt from registration or to the public if the securities are subsequently registered. Disposal of these securities may involve time-consuming negotiations and prompt sale at an acceptable price may be difficult. The fund holds the following restricted securities: |
| | | | | | | | | | |
| Restricted Securities | | Acquisition
Date | | Cost | | | Value | |
| | | |
| BWAY Holding Co., Inc., 7.25%, 4/15/2025 | | 12/07/18 | | | $316,965 | | | | $309,638 | |
| | | |
| CSC Holdings LLC, 5.5%, 5/15/2026 | | 1/13/17-6/12/17 | | | 1,392,233 | | | | 1,262,950 | |
| | | |
| CSC Holdings LLC, 7.5%, 4/01/2028 | | 6/07/18-6/11/18 | | | 891,275 | | | | 872,813 | |
| | | |
| CWCapital Cobalt Ltd., CDO, “F”, FLR, 3.808% (0% cash or 3.634% PIK), (LIBOR - 3 mo. + 1.3%), 4/26/2050 | | 4/12/06 | | | 1,083,402 | | | | 119 | |
| | | |
| Marriot Ownership Resorts, Inc., 5.625%, 4/15/2023 | | 8/30/18 | | | 1,225,963 | | | | 1,212,750 | |
| | | |
| NCI Building Systems, Inc., 8%, 4/15/2026 | | 12/10/18 | | | 328,702 | | | | 315,675 | |
| | | |
| Total Restricted Securities | | | | | | | | | $3,973,945 | |
| | | |
| % of Net assets | | | | | | | | | 1.1% | |
The following abbreviations are used in this report and are defined:
| CDO | | Collateralized Debt Obligation |
| FLR | | Floating Rate. Interest rate resets periodically based on the parenthetically disclosed reference rate plus a spread (if any). Theperiod-end rate reported may not be the current rate. All reference rates are USD unless otherwise noted. |
| LIBOR | | London Interbank Offered Rate |
| PLC | | Public Limited Company |
| REIT | | Real Estate Investment Trust |
Abbreviations indicate amounts shown in currencies other than the U.S. dollar. All amounts are stated in U.S. dollars unless otherwise indicated. A list of abbreviations is shown below:
Derivative Contracts at 12/31/18
Forward Foreign Currency Exchange Contracts
| | | | | | | | | | | | | | | | | | | | |
| Currency Purchased | | Currency Sold | | Counterparty | | Settlement Date | | | Unrealized
Appreciation
(Depreciation) | |
| Asset Derivatives | | | | | | | | | | | | |
| USD | | | 478,614 | | | | | EUR | | 416,999 | | Citibank N.A. | | | 1/11/2019 | | | | $523 | |
| USD | | | 1,778,845 | | | | | EUR | | 1,530,580 | | Goldman Sachs International | | | 1/11/2019 | | | | 24,026 | |
| USD | | | 171,099 | | | | | EUR | | 147,282 | | Goldman Sachs International | | | 1/14/2019 | | | | 2,198 | |
| | | | | | | | | | | | | | | | | | | | |
| | | | | | | | | | | | | | | | | | | $26,747 | |
| | | | | | | | | | | | | | | | | | | | |
| Liability Derivatives | | | | | | | | | | | | |
| USD | | | 360,134 | | | | | EUR | | 316,591 | | Barclays Bank PLC | | | 1/11/2019 | | | | $(2,839 | ) |
| USD | | | 116,872 | | | | | EUR | | 101,938 | | Brown Brothers Harriman | | | 1/11/2019 | | | | (1 | ) |
| | | | | | | | | | | | | | | | | | | | |
| | | | | | | | | | | | | | | | | | | $(2,840 | ) |
| | | | | | | | | | | | | | | | | | | | |
Futures Contracts
| | | | | | | | | | | | | | | | | | | | | | |
| Description | | Long/
Short | | | Currency | | | Contracts | | Notional
Amount | | | Expiration
Date | | | Value/ Unrealized
Appreciation
(Depreciation) | |
| Liability Derivatives | | | | | | | | | | | | | | | | | | | | | | |
| Interest Rate Futures | | | | | | | | | | | | | | | | | | | | | | |
| German Euro-Bobl 5 yr | | | Short | | | | EUR | | | 6 | | | $911,008 | | | | March - 2019 | | | | $(2,145 | ) |
| U.S. Treasury Note 10 yr | | | Short | | | | USD | | | 51 | | | 6,222,797 | | | | March - 2019 | | | | (153,982 | ) |
| | | | | | | | | | | | | | | | | | | | | | |
| | | | | | | | | | | | | | | | | | | | | $(156,127 | ) |
| | | | | | | | | | | | | | | | | | | | | | |
At December 31, 2018, the fund had cash collateral of $61,509 to cover any collateral or margin obligations for certain derivative contracts. Restricted cash and/or deposits with brokers in the Statement of Assets and Liabilities are comprised of cash collateral.
See Notes to Financial Statements
13
MFS High Yield Portfolio
FINANCIAL STATEMENTS | STATEMENT OF ASSETS AND LIABILITIES
This statement represents your fund’s balance sheet, which details the assets and liabilities comprising the total value of the fund.
| | | | |
At 12/31/18 | | | | |
| |
Assets | | | | |
Investments in unaffiliated issuers, at value (identified cost, $379,479,047) | | | $352,620,345 | |
Investments in affiliated issuers, at value (identified cost, $9,626,610) | | | 9,625,650 | |
Cash | | | 9,851 | |
Deposits with brokers for | | | | |
Futures contracts | | | 61,509 | |
Receivables for | | | | |
Forward foreign currency exchange contracts | | | 26,747 | |
Fund shares sold | | | 40,182 | |
Interest | | | 5,802,766 | |
Other assets | | | 2,612 | |
Total assets | | | $368,189,662 | |
| |
Liabilities | | | | |
Payables for | | | | |
Forward foreign currency exchange contracts | | | $2,840 | |
Net daily variation margin on open futures contracts | | | 19,911 | |
Investments purchased | | | 1,920,942 | |
Fund shares reacquired | | | 742,991 | |
Payable to affiliates | | | | |
Investment adviser | | | 13,888 | |
Shareholder servicing costs | | | 116 | |
Distribution and/or service fees | | | 1,232 | |
Payable for independent Trustees’ compensation | | | 14 | |
Accrued expenses and other liabilities | | | 111,917 | |
Total liabilities | | | $2,813,851 | |
Net assets | | | $365,375,811 | |
| |
Net assets consist of | | | | |
Paid-in capital | | | $410,794,285 | |
Total distributable earnings (loss) | | | (45,418,474 | ) |
Net assets | | | $365,375,811 | |
Shares of beneficial interest outstanding | | | 69,295,772 | |
| | | | | | | | | | | | |
| | | |
| | | Net assets | | | Shares
outstanding | | | Net asset value
per share | |
Initial Class | | | $320,380,370 | | | | 60,671,948 | | | | $5.28 | |
Service Class | | | 44,995,441 | | | | 8,623,824 | | | | 5.22 | |
See Notes to Financial Statements
14
MFS High Yield Portfolio
FINANCIAL STATEMENTS | STATEMENT OF OPERATIONS
This statement describes how much your fund earned in investment income and accrued in expenses. It also describes any gains and/or losses generated by fund operations.
| | | | |
Year ended 12/31/18 | | | | |
| |
Net investment income (loss) | | | | |
Income | | | | |
Interest | | | $22,928,209 | |
Dividends from affiliated issuers | | | 202,953 | |
Other | | | 59,781 | |
Total investment income | | | $23,190,943 | |
Expenses | | | | |
Management fee | | | $2,882,354 | |
Distribution and/or service fees | | | 132,464 | |
Shareholder servicing costs | | | 14,107 | |
Administrative services fee | | | 68,550 | |
Independent Trustees’ compensation | | | 7,418 | |
Custodian fee | | | 26,481 | |
Shareholder communications | | | 45,960 | |
Audit and tax fees | | | 78,321 | |
Legal fees | | | 13,319 | |
Miscellaneous | | | 44,559 | |
Total expenses | | | $3,313,533 | |
Reduction of expenses by investment adviser | | | (214,311 | ) |
Net expenses | | | $3,099,222 | |
Net investment income (loss) | | | $20,091,721 | |
| |
Realized and unrealized gain (loss) | | | | |
Realized gain (loss) (identified cost basis) | | | | |
Unaffiliated issuers | | | $(4,275,313 | ) |
Affiliated issuers | | | (784 | ) |
Futures contracts | | | 409,201 | |
Forward foreign currency exchange contracts | | | 77,350 | |
Foreign currency | | | 1,013 | |
Net realized gain (loss) | | | $(3,788,533 | ) |
Change in unrealized appreciation or depreciation | | | | |
Unaffiliated issuers | | | $(28,025,278 | ) |
Affiliated issuers | | | (55 | ) |
Futures contracts | | | (223,361 | ) |
Forward foreign currency exchange contracts | | | 23,907 | |
Translation of assets and liabilities in foreign currencies | | | 250 | |
Net unrealized gain (loss) | | | $(28,224,537 | ) |
Net realized and unrealized gain (loss) | | | $(32,013,070 | ) |
Change in net assets from operations | | | $(11,921,349 | ) |
See Notes to Financial Statements
15
MFS High Yield Portfolio
FINANCIAL STATEMENTS | STATEMENTS OF CHANGES IN NET ASSETS
These statements describe the increases and/or decreases in net assets resulting from operations, any distributions, and any shareholder transactions.
| | | | | | | | |
| | | Year ended | |
| | | 12/31/18 | | | 12/31/17 | |
Change in net assets | | | | | | | | |
From operations | | | | | | | | |
Net investment income (loss) | | | $20,091,721 | | | | $21,876,775 | |
Net realized gain (loss) | | | (3,788,533 | ) | | | 812,597 | |
Net unrealized gain (loss) | | | (28,224,537 | ) | | | 6,671,003 | |
Change in net assets from operations | | | $(11,921,349 | ) | | | $29,360,375 | |
Total distributions to shareholders (a) | | | $(22,864,139 | ) | | | $(29,244,080 | ) |
Change in net assets from fund share transactions | | | $(42,731,313 | ) | | | $(30,530,978 | ) |
Total change in net assets | | | $(77,516,801 | ) | | | $(30,414,683 | ) |
Net assets | | | | | | | | |
At beginning of period | | | 442,892,612 | | | | 473,307,295 | |
At end of period (b) | | | $365,375,811 | | | | $442,892,612 | |
| (a) | Distributions from net investment income and from net realized gain are no longer required to be separately disclosed. See Note 2. For the year ended December 31, 2017, distributions from net investment income were $29,244,080. |
| (b) | Parenthetical disclosure of undistributed net investment income is no longer required. See Note 2. For the year ended December 31, 2017, end of period net assets included undistributed net investment income of $22,430,017. |
See Notes to Financial Statements
16
MFS High Yield Portfolio
FINANCIAL STATEMENTS | FINANCIAL HIGHLIGHTS
The financial highlights table is intended to help you understand the fund’s financial performance for the past 5 years. Certain information reflects financial results for a single fund share. The total returns in the table represent the rate that an investor would have earned (or lost) on an investment in the fund share class (assuming reinvestment of all distributions) held for the entire period.
| | | | | | | | | | | | | | | | | | | | |
| Initial Class | | Year ended | |
| | | 12/31/18 | | | 12/31/17 | | | 12/31/16 | | | 12/31/15 | | | 12/31/14 | |
Net asset value, beginning of period | | | $5.77 | | | | $5.78 | | | | $5.43 | | | | $6.11 | | | | $6.28 | |
| Income (loss) from investment operations | | | | | | | | | | | | | | | | | | | | |
Net investment income (loss) (d) | | | $0.28 | | | | $0.28 | | | | $0.32 | (c) | | | $0.33 | | | | $0.35 | |
Net realized and unrealized gain (loss) | | | (0.45 | ) | | | 0.10 | | | | 0.42 | | | | (0.57 | ) | | | (0.17 | ) |
Total from investment operations | | | $(0.17 | ) | | | $0.38 | | | | $0.74 | | | | $(0.24 | ) | | | $0.18 | |
| Less distributions declared to shareholders | | | | | | | | | | | | | | | | | | | | |
From net investment income | | | $(0.32 | ) | | | $(0.39 | ) | | | $(0.39 | ) | | | $(0.44 | ) | | | $(0.35 | ) |
Net asset value, end of period (x) | | | $5.28 | | | | $5.77 | | | | $5.78 | | | | $5.43 | | | | $6.11 | |
Total return (%) (k)(r)(s)(x) | | | (3.08 | ) | | | 6.69 | | | | 13.82 | (c) | | | (4.22 | ) | | | 2.81 | |
Ratios (%) (to average net assets)
and Supplemental data: | | | | | | | | | | | | | | | | | | | | |
Expenses before expense reductions (f) | | | 0.77 | | | | 0.78 | | | | 0.76 | (c) | | | 0.77 | | | | 0.77 | |
Expenses after expense reductions (f) | | | 0.72 | | | | 0.72 | | | | 0.70 | (c) | | | 0.72 | | | | 0.74 | |
Net investment income (loss) | | | 4.91 | | | | 4.78 | | | | 5.60 | (c) | | | 5.43 | | | | 5.44 | |
Portfolio turnover | | | 40 | | | | 49 | | | | 41 | | | | 33 | | | | 43 | |
Net assets at end of period (000 omitted) | | | $320,380 | | | | $384,393 | | | | $404,118 | | | | $419,474 | | | | $514,089 | |
| |
| Service Class | | Year ended | |
| | | 12/31/18 | | | 12/31/17 | | | 12/31/16 | | | 12/31/15 | | | 12/31/14 | |
Net asset value, beginning of period | | | $5.70 | | | | $5.72 | | | | $5.37 | | | | $6.04 | | | | $6.21 | |
| Income (loss) from investment operations | | | | | | | | | | | | | | | | | | | | |
Net investment income (loss) (d) | | | $0.26 | | | | $0.26 | | | | $0.30 | (c) | | | $0.31 | | | | $0.33 | |
Net realized and unrealized gain (loss) | | | (0.43 | ) | | | 0.10 | | | | 0.43 | | | | (0.56 | ) | | | (0.16 | ) |
Total from investment operations | | | $(0.17 | ) | | | $0.36 | | | | $0.73 | | | | $(0.25 | ) | | | $0.17 | |
| Less distributions declared to shareholders | | | | | | | | | | | | | | | | | | | | |
From net investment income | | | $(0.31 | ) | | | $(0.38 | ) | | | $(0.38 | ) | | | $(0.42 | ) | | | $(0.34 | ) |
Net asset value, end of period (x) | | | $5.22 | | | | $5.70 | | | | $5.72 | | | | $5.37 | | | | $6.04 | |
Total return (%) (k)(r)(s)(x) | | | (3.24 | ) | | | 6.31 | | | | 13.64 | (c) | | | (4.42 | ) | | | 2.53 | |
Ratios (%) (to average net assets)
and Supplemental data: | | | | | | | | | | | | | | | | | | | | |
Expenses before expense reductions (f) | | | 1.02 | | | | 1.03 | | | | 1.02 | (c) | | | 1.02 | | | | 1.02 | |
Expenses after expense reductions (f) | | | 0.97 | | | | 0.97 | | | | 0.95 | (c) | | | 0.97 | | | | 0.99 | |
Net investment income (loss) | | | 4.66 | | | | 4.54 | | | | 5.36 | (c) | | | 5.18 | | | | 5.19 | |
Portfolio turnover | | | 40 | | | | 49 | | | | 41 | | | | 33 | | | | 43 | |
Net assets at end of period (000 omitted) | | | $44,995 | | | | $58,499 | | | | $69,189 | | | | $71,421 | | | | $84,272 | |
| (c) | Amount reflects aone-time reimbursement of expenses by the custodian (or former custodian) without which net investment income and performance would be lower and expenses would be higher. |
| (d) | Per share data is based on average shares outstanding. |
| (f) | Ratios do not reflect reductions from fees paid indirectly, if applicable. |
| (k) | The total return does not reflect expenses that apply to separate accounts. Inclusion of these charges would reduce the total return figures for all periods shown. |
| (r) | Certain expenses have been reduced without which performance would have been lower. |
| (s) | From time to time the fund may receive proceeds from litigation settlements, without which performance would be lower. |
| (x) | The net asset values and total returns have been calculated on net assets which include adjustments made in accordance with U.S. generally accepted accounting principles required at period end for financial reporting purposes. |
See Notes to Financial Statements
17
MFS High Yield Portfolio
NOTES TO FINANCIAL STATEMENTS
| (1) | | Business and Organization |
MFS High Yield Portfolio (the fund) is a diversified series of MFS Variable Insurance Trust II (the trust). The trust is organized as a Massachusetts business trust and is registered under the Investment Company Act of 1940, as amended, as anopen-end management investment company. The shareholders of each series of the trust are separate accounts of insurance companies, which offer variable annuity and/or life insurance products, and qualified retirement and pension plans.
The fund is an investment company and accordingly follows the investment company accounting and reporting guidance of the Financial Accounting Standards Board (FASB) Accounting Standards Codification Topic 946 Financial Services – Investment Companies.
| (2) | | Significant Accounting Policies |
General– The preparation of financial statements in conformity with U.S. generally accepted accounting principles requires management to make estimates and assumptions that affect the reported amounts of assets and liabilities, and disclosure of contingent assets and liabilities at the date of the financial statements and the reported amounts of increases and decreases in net assets from operations during the reporting period. Actual results could differ from those estimates. In the preparation of these financial statements, management has evaluated subsequent events occurring after the date of the fund’s Statement of Assets and Liabilities through the date that the financial statements were issued. The fund invests in high-yield securities rated below investment grade. Investments in below investment grade quality securities can involve a substantially greater risk of default or can already be in default, and their values can decline significantly. Below investment grade quality securities tend to be more sensitive to adverse news about the issuer, or the market or economy in general, than higher quality debt instruments. The fund invests in foreign securities. Investments in foreign securities are vulnerable to the effects of changes in the relative values of the local currency and the U.S. dollar and to the effects of changes in each country’s market, economic, industrial, political, regulatory, geopolitical, and other conditions.
In March 2017, the FASB issued Accounting Standards Update2017-08, Receivables – Nonrefundable Fees and Other Costs (Subtopic310-20) – Premium Amortization on Purchased Callable Debt Securities (“ASU2017-08”). For entities that hold callable debt securities at a premium, ASU2017-08 requires that the premium be amortized to the earliest call date. ASU2017-08 will be effective for fiscal years beginning after December 15, 2018, and interim periods within those fiscal years. Management has evaluated the potential impacts of ASU2017-08 and believes that adoption of ASU2017-08 will not have a material effect on the fund’s overall financial position or its overall results of operations.
In August 2018, the FASB issued Accounting Standards Update2018-13, Fair Value Measurement (Topic 820) – Disclosure Framework – Changes to the Disclosure Requirements for Fair Value Measurement (“ASU2018-13”) which introduces new fair value disclosure requirements as well as eliminates and modifies certain existing fair value disclosure requirements. ASU2018-13 would be effective for fiscal years beginning after December 15, 2019, and interim periods within those fiscal years; however, management has elected to early adopt ASU2018-13 effective with the current reporting period. The impact of the fund’s adoption was limited to changes in the fund’s financial statement disclosures regarding fair value, primarily those disclosures related to transfers between levels of the fair value hierarchy.
In August 2018, the Securities and Exchange Commission (SEC) released its Final Rule on Disclosure Update and Simplification (the “Final Rule”) which is intended to simplify an issuer’s disclosure compliance efforts by removing redundant or outdated disclosure requirements without significantly altering the mix of information provided to investors. Effective with the current reporting period, the fund adopted the Final Rule with the impacts being that the fund is no longer required to present the components of distributable earnings on the Statement of Assets and Liabilities or the sources of distributions to shareholders and the amount of undistributed net investment income on the Statements of Changes in Net Assets.
Balance Sheet Offsetting– The fund’s accounting policy with respect to balance sheet offsetting is that, absent an event of default by the counterparty or a termination of the agreement, the International Swaps and Derivatives Association (ISDA) Master Agreement, or similar agreement, does not result in an offset of reported amounts of financial assets and financial liabilities in the Statement of Assets and Liabilities across transactions between the fund and the applicable counterparty. The fund’s right to setoff may be restricted or prohibited by the bankruptcy or insolvency laws of the particular jurisdiction to which a specific master netting agreement counterparty is subject. Balance sheet offsetting disclosures, to the extent applicable to the fund, have been included in the fund’s Significant Accounting Policies note under the captions for each of the fund’sin-scope financial instruments and transactions.
Investment Valuations– Equity securities, including restricted equity securities, are generally valued at the last sale or official closing price on their primary market or exchange as provided by a third-party pricing service. Equity securities, for which there were no sales reported that day, are generally valued at the last quoted daily bid quotation on their primary market or exchange as provided by a third-party pricing service. Debt instruments and floating rate loans, including restricted debt instruments, are generally valued at an evaluated or composite bid as provided by a third-party pricing service. Short-term instruments with a maturity at
18
MFS High Yield Portfolio
Notes to Financial Statements – continued
issuance of 60 days or less may be valued at amortized cost, which approximates market value. Futures contracts are generally valued at last posted settlement price on their primary exchange as provided by a third-party pricing service. Futures contracts for which there were no trades that day for a particular position are generally valued at the closing bid quotation on their primary exchange as provided by a third-party pricing service. Forward foreign currency exchange contracts are generally valued at the mean of bid and asked prices for the time period interpolated from rates provided by a third-party pricing service for proximate time periods.Open-end investment companies are generally valued at net asset value per share. Securities and other assets generally valued on the basis of information from a third-party pricing service may also be valued at a broker/dealer bid quotation. In determining values, third-party pricing services can utilize both transaction data and market information such as yield, quality, coupon rate, maturity, type of issue, trading characteristics, and other market data. The values of foreign securities and other assets and liabilities expressed in foreign currencies are converted to U.S. dollars using the mean of bid and asked prices for rates provided by a third-party pricing service.
The Board of Trustees has delegated primary responsibility for determining or causing to be determined the value of the fund’s investments (including any fair valuation) to the adviser pursuant to valuation policies and procedures approved by the Board. If the adviser determines that reliable market quotations are not readily available, investments are valued at fair value as determined in good faith by the adviser in accordance with such procedures under the oversight of the Board of Trustees. Under the fund’s valuation policies and procedures, market quotations are not considered to be readily available for most types of debt instruments and floating rate loans and many types of derivatives. These investments are generally valued at fair value based on information from third-party pricing services. In addition, investments may be valued at fair value if the adviser determines that an investment’s value has been materially affected by events occurring after the close of the exchange or market on which the investment is principally traded (such as foreign exchange or market) and prior to the determination of the fund’s net asset value, or after the halting of trading of a specific security where trading does not resume prior to the close of the exchange or market on which the security is principally traded. The adviser generally relies on third-party pricing services or other information (such as the correlation with price movements of similar securities in the same or other markets; the type, cost and investment characteristics of the security; the business and financial condition of the issuer; and trading and other market data) to assist in determining whether to fair value and at what value to fair value an investment. The value of an investment for purposes of calculating the fund’s net asset value can differ depending on the source and method used to determine value. When fair valuation is used, the value of an investment used to determine the fund’s net asset value may differ from quoted or published prices for the same investment. There can be no assurance that the fund could obtain the fair value assigned to an investment if it were to sell the investment at the same time at which the fund determines its net asset value per share.
Various inputs are used in determining the value of the fund’s assets or liabilities. These inputs are categorized into three broad levels. In certain cases, the inputs used to measure fair value may fall into different levels of the fair value hierarchy. In such cases, an investment’s level within the fair value hierarchy is based on the lowest level of input that is significant to the fair value measurement. The fund’s assessment of the significance of a particular input to the fair value measurement in its entirety requires judgment, and considers factors specific to the investment. Level 1 includes unadjusted quoted prices in active markets for identical assets or liabilities. Level 2 includes other significant observable market-based inputs (including quoted prices for similar securities, interest rates, prepayment speed, and credit risk). Level 3 includes unobservable inputs, which may include the adviser’s own assumptions in determining the fair value of investments. Other financial instruments are derivative instruments, such as futures contracts and forward foreign currency exchange contracts. The following is a summary of the levels used as of December 31, 2018 in valuing the fund’s assets or liabilities:
| | | | | | | | | | | | | | | | |
| Financial Instruments | | Level 1 | | | Level 2 | | | Level 3 | | | Total | |
| Equity Securities | | | $— | | | | $11,055 | | | | $991,703 | | | | $1,002,758 | |
| U.S. Corporate Bonds | | | — | | | | 285,264,490 | | | | — | | | | 285,264,490 | |
| Asset-Backed Securities (including CDOs) | | | — | | | | 119 | | | | — | | | | 119 | |
| Foreign Bonds | | | — | | | | 63,063,644 | | | | — | | | | 63,063,644 | |
| Floating Rate Loans | | | — | | | | 3,289,334 | | | | — | | | | 3,289,334 | |
| Mutual Funds | | | 9,625,650 | | | | — | | | | — | | | | 9,625,650 | |
| Total | | | $9,625,650 | | | | $351,628,642 | | | | $991,703 | | | | $362,245,995 | |
| | | | |
| Other Financial Instruments | | | | | | | | | | | | |
| Futures Contracts – Liabilities | | | $(156,127 | ) | | | $— | | | | $— | | | | $(156,127 | ) |
| Forward Foreign Currency Exchange Contracts – Assets | | | — | | | | 26,747 | | | | — | | | | 26,747 | |
| Forward Foreign Currency Exchange Contracts – Liabilities | | | — | | | | (2,840 | ) | | | — | | | | (2,840 | ) |
For further information regarding security characteristics, see the Portfolio of Investments.
19
MFS High Yield Portfolio
Notes to Financial Statements – continued
The following is a reconciliation of level 3 assets for which significant unobservable inputs were used to determine fair value. The table presents the activity of level 3 securities held at the beginning and the end of the period.
| | | | |
| |
| | | Equity
Securities | |
| Balance as of 12/31/17 | | | $991,703 | |
Change in unrealized appreciation or depreciation | | | 0 | |
| Balance as of 12/31/18 | | | $991,703 | |
The net change in unrealized appreciation or depreciation from investments held as level 3 at December 31, 2018 is $0. At December 31, 2018, the fund held one level 3 security.
Foreign Currency Translation– Purchases and sales of foreign investments, income, and expenses are converted into U.S. dollars based upon currency exchange rates prevailing on the respective dates of such transactions or on the reporting date for foreign denominated receivables and payables. Gains and losses attributable to foreign currency exchange rates on sales of securities are recorded for financial statement purposes as net realized gains and losses on investments. Gains and losses attributable to foreign exchange rate movements on receivables, payables, income and expenses are recorded for financial statement purposes as foreign currency transaction gains and losses. That portion of both realized and unrealized gains and losses on investments that results from fluctuations in foreign currency exchange rates is not separately disclosed.
Derivatives– The fund uses derivatives primarily to increase or decrease exposure to a particular market or segment of the market, or security, to increase or decrease interest rate or currency exposure, or as alternatives to direct investments. Derivatives are used for hedging ornon-hedging purposes. While hedging can reduce or eliminate losses, it can also reduce or eliminate gains. When the fund uses derivatives as an investment to increase market exposure, or for hedging purposes, gains and losses from derivative instruments may be substantially greater than the derivative’s original cost.
The derivative instruments used by the fund during the period were futures contracts and forward foreign currency exchange contracts. Depending on the type of derivative, the fund may exit a derivative position by entering into an offsetting transaction with a counterparty or exchange, negotiating an agreement with the derivative counterparty, or novating the position to a third party. The fund may be unable to promptly close out a futures position in instances where the daily fluctuation in the price for that type of future exceeds the daily limit set by the exchange. The fund’s period end derivatives, as presented in the Portfolio of Investments and the associated Derivative Contract tables, generally are indicative of the volume of its derivative activity during the period.
The following table presents, by major type of derivative contract, the fair value, on a gross basis, of the asset and liability components of derivatives held by the fund at December 31, 2018 as reported in the Statement of Assets and Liabilities:
| | | | | | | | | | |
| | | | | Fair Value (a) | |
| Risk | | Derivative Contracts | | Asset Derivatives | | | Liability Derivatives | |
| Interest Rate | | Interest Rate Futures | | | $— | | | | $(156,127 | ) |
| Foreign Exchange | | Forward Foreign Currency Exchange Contracts | | | 26,747 | | | | (2,840 | ) |
| Total | | | | | $26,747 | | | | $(158,967 | ) |
| (a) | Values presented in this table for futures contracts correspond to the values reported in the fund’s Portfolio of Investments. Only the current day net variation margin for futures contracts is separately reported within the fund’s Statement of Assets and Liabilities. |
The following table presents, by major type of derivative contract, the realized gain (loss) on derivatives held by the fund for the year ended December 31, 2018 as reported in the Statement of Operations:
| | | | | | | | |
| Risk | | Futures Contracts | | | Forward
Foreign Currency
Exchange Contracts | |
| Interest Rate | | | $409,201 | | | | $— | |
| Foreign Exchange | | | — | | | | 77,350 | |
| Total | | | $409,201 | | | | $77,350 | |
The following table presents, by major type of derivative contract, the change in unrealized appreciation or depreciation on derivatives held by the fund for the year ended December 31, 2018 as reported in the Statement of Operations:
| | | | | | | | |
| Risk | | Futures Contracts | | | Forward
Foreign Currency
Exchange Contracts | |
| Interest Rate | | | $(223,361 | ) | | | $— | |
| Foreign Exchange | | | — | | | | 23,907 | |
| Total | | | $(223,361 | ) | | | $23,907 | |
20
MFS High Yield Portfolio
Notes to Financial Statements – continued
Derivative counterparty credit risk is managed through formal evaluation of the creditworthiness of all potential counterparties. On certain, but not all, uncleared derivatives, the fund attempts to reduce its exposure to counterparty credit risk whenever possible by entering into an ISDA Master Agreement on a bilateral basis. The ISDA Master Agreement gives each party to the agreement the right to terminate all transactions traded under such agreement if there is a specified deterioration in the credit quality of the other party. Upon an event of default or a termination of the ISDA Master Agreement, thenon-defaulting party has the right to close out all transactions traded under such agreement and to net amounts owed under each agreement to one net amount payable by one party to the other. This right to close out and net payments across all transactions traded under the ISDA Master Agreement could result in a reduction of the fund’s credit risk to such counterparty equal to any amounts payable by the fund under the applicable transactions, if any.
Collateral and margin requirements differ by type of derivative. For cleared derivatives (e.g., futures contracts, cleared swaps, and exchange-traded options), margin requirements are set by the clearing broker and the clearing house and collateral, in the form of cash or securities, is posted by the fund directly with the clearing broker. Collateral terms are counterparty agreement specific for uncleared derivatives (e.g., forward foreign currency exchange contracts, uncleared swap agreements, and uncleared options) and collateral, in the form of cash and securities, is held in segregated accounts with the fund’s custodian in connection with these agreements. For derivatives traded under an ISDA Master Agreement, which contains a collateral support annex, the collateral requirements are netted across all transactions traded under such counterparty-specific agreement and an amount is posted from one party to the other to collateralize such obligations. Cash that has been segregated or delivered to cover the fund’s collateral or margin obligations under derivative contracts, if any, will be reported separately in the Statement of Assets and Liabilities as restricted cash for uncleared derivatives and/or deposits with brokers for cleared derivatives. Securities pledged as collateral or margin for the same purpose, if any, are noted in the Portfolio of Investments. The fund may be required to make payments of interest on uncovered collateral or margin obligations with the broker. Any such payments are included in “Miscellaneous” expense in the Statement of Operations.
Futures Contracts– The fund entered into futures contracts which may be used to hedge against or obtain broad market exposure, interest rate exposure, currency exposure, or to manage duration. A futures contract represents a commitment for the future purchase or sale of an asset at a specified price on a specified date.
Upon entering into a futures contract, the fund is required to deposit with the broker, either in cash or securities, an initial margin in an amount equal to a specified percentage of the notional amount of the contract. Subsequent payments (variation margin) are made or received by the fund each day, depending on the daily fluctuations in the value of the contract, and are recorded for financial statement purposes as unrealized gain or loss by the fund until the contract is closed or expires at which point the gain or loss on futures contracts is realized.
The fund bears the risk of interest rates, exchange rates or securities prices moving unexpectedly, in which case, the fund may not achieve the anticipated benefits of the futures contracts and may realize a loss. While futures contracts may present less counterparty risk to the fund since the contracts are exchange traded and the exchange’s clearinghouse guarantees payments to the broker, there is still counterparty credit risk due to the insolvency of the broker. The fund’s maximum risk of loss due to counterparty credit risk is equal to the margin posted by the fund to the broker plus any gains or minus any losses on the outstanding futures contracts.
Forward Foreign Currency Exchange Contracts– The fund entered into forward foreign currency exchange contracts for the purchase or sale of a specific foreign currency at a fixed price on a future date. These contracts may be used to hedge the fund’s currency risk or fornon-hedging purposes. For hedging purposes, the fund may enter into contracts to deliver or receive foreign currency that the fund will receive from or use in its normal investment activities. The fund may also use contracts to hedge against declines in the value of foreign currency denominated securities due to unfavorable exchange rate movements. Fornon-hedging purposes, the fund may enter into contracts with the intent of changing the relative exposure of the fund’s portfolio of securities to different currencies to take advantage of anticipated exchange rate changes.
Forward foreign currency exchange contracts are adjusted by the daily exchange rate of the underlying currency and any unrealized gains or losses are recorded as a receivable or payable for forward foreign currency exchange contracts until the contract settlement date. On contract settlement date, any gain or loss on the contract is recorded as realized gains or losses on forward foreign currency exchange contracts.
Risks may arise upon entering into these contracts from unanticipated movements in the value of the contract and from the potential inability of counterparties to meet the terms of their contracts. Generally, the fund’s maximum risk due to counterparty credit risk is the unrealized gain on the contract due to the use of Continuous Linked Settlement, a multicurrency cash settlement system for the centralized settlement of foreign transactions. This risk is mitigated in cases where there is an ISDA Master Agreement between the fund and the counterparty providing for netting as described above and, where applicable, by the posting of collateral by the counterparty to the fund to cover the fund’s exposure to the counterparty under such ISDA Master Agreement.
21
MFS High Yield Portfolio
Notes to Financial Statements – continued
Loans and Other Direct Debt Instruments– The fund invests in loans and loan participations or other receivables. These investments may include standby financing commitments, including revolving credit facilities, which contractually obligate the fund to supply additional cash to the borrower on demand. The fund generally provides this financial support in order to preserve its existing investment or to obtain a more senior secured interest in the assets of the borrower. Loan participations involve a risk of insolvency of the lending bank or other financial intermediary.
Indemnifications– Under the fund’s organizational documents, its officers and Trustees may be indemnified against certain liabilities and expenses arising out of the performance of their duties to the fund. Additionally, in the normal course of business, the fund enters into agreements with service providers that may contain indemnification clauses. The fund’s maximum exposure under these agreements is unknown as this would involve future claims that may be made against the fund that have not yet occurred.
Investment Transactions and Income– Investment transactions are recorded on the trade date. Interest income is recorded on the accrual basis. All premium and discount is amortized or accreted for financial statement purposes in accordance with U.S. generally accepted accounting principles. The fund earns certain fees in connection with its floating rate loan purchasing activities. These fees are in addition to interest payments earned and may include amendment fees, commitment fees, facility fees, consent fees, and prepayment fees. Commitment fees are recorded on an accrual basis as income in the accompanying financial statements. Dividends received in cash are recorded on theex-dividend date. Certain dividends from foreign securities will be recorded when the fund is informed of the dividend if such information is obtained subsequent to theex-dividend date. Dividend and interest payments received in additional securities are recorded on theex-dividend orex-interest date in an amount equal to the value of the security on such date. Debt obligations may be placed onnon-accrual status or set to accrue at a rate of interest less than the contractual coupon when the collection of all or a portion of interest has become doubtful. Interest income for those debt obligations may be further reduced by thewrite-off of the related interest receivables when deemed uncollectible.
The fund may receive proceeds from litigation settlements. Any proceeds received from litigation involving portfolio holdings are reflected in the Statement of Operations in realized gain/loss if the security has been disposed of by the fund or in unrealized gain/loss if the security is still held by the fund. Any other proceeds from litigation not related to portfolio holdings are reflected as other income in the Statement of Operations.
Legal fees and other related expenses incurred to preserve and protect the value of a security owned are added to the cost of the security; other legal fees are expensed. Capital infusions made directly to the security issuer, which are generallynon-recurring, incurred to protect or enhance the value of high-yield debt securities, are reported as additions to the cost basis of the security. Costs that are incurred to negotiate the terms or conditions of capital infusions or that are expected to result in a plan of reorganization are reported as realized losses. Ongoing costs incurred to protect or enhance an investment, or costs incurred to pursue other claims or legal actions, are expensed.
Tax Matters and Distributions– The fund intends to qualify as a regulated investment company, as defined under Subchapter M of the Internal Revenue Code, and to distribute all of its taxable income, including realized capital gains. As a result, no provision for federal income tax is required. The fund’s federal tax returns, when filed, will remain subject to examination by the Internal Revenue Service for a three year period. Management has analyzed the fund’s tax positions taken on federal and state tax returns for all open tax years and does not believe that there are any uncertain tax positions that require recognition of a tax liability. Foreign taxes, if any, have been accrued by the fund in the accompanying financial statements in accordance with the applicable foreign tax law. Foreign income taxes may be withheld by certain countries in which the fund invests. Additionally, capital gains realized by the fund on securities issued in or by certain foreign countries may be subject to capital gains tax imposed by those countries.
Distributions to shareholders are recorded on theex-dividend date. Income and capital gain distributions are determined in accordance with income tax regulations, which may differ from U.S. generally accepted accounting principles. Certain capital accounts in the financial statements are periodically adjusted for permanent differences in order to reflect their tax character. These adjustments have no impact on net assets or net asset value per share. Temporary differences which arise from recognizing certain items of income, expense, gain or loss in different periods for financial statement and tax purposes will reverse at some time in the future. Distributions in excess of net investment income or net realized gains are temporary overdistributions for financial statement purposes resulting from differences in the recognition or classification of income or distributions for financial statement and tax purposes.
Book/tax differences primarily relate to amortization and accretion of debt securities.
The tax character of distributions declared to shareholders for the last two fiscal years is as follows:
| | | | | | | | |
| | | Year ended
12/31/18 | | | Year ended
12/31/17 | |
| Ordinary income (including any short-term capital gains) | | | $22,864,139 | | | | $29,244,080 | |
22
MFS High Yield Portfolio
Notes to Financial Statements – continued
The federal tax cost and the tax basis components of distributable earnings were as follows:
| | | | |
| As of 12/31/18 | | | | |
| |
| Cost of investments | | | $390,406,438 | |
| Gross appreciation | | | 1,728,195 | |
| Gross depreciation | | | (30,020,858 | ) |
| Net unrealized appreciation (depreciation) | | | $(28,292,663 | ) |
| |
| Undistributed ordinary income | | | 20,864,558 | |
| Capital loss carryforwards | | | (37,990,618 | ) |
| Other temporary differences | | | 249 | |
As of December 31, 2018, the fund had capital loss carryforwards available to offset future realized gains. These net capital losses may be carried forward indefinitely and their character is retained as short-term and/or long-term losses. Such losses are characterized as follows:
| | | | |
| Short-Term | | | $(1,274,958 | ) |
| Long-Term | | | (36,715,660 | ) |
| Total | | | $(37,990,618 | ) |
Multiple Classes of Shares of Beneficial Interest– The fund offers multiple classes of shares, which differ in their respective distribution and/or service fees. The fund’s income, realized and unrealized gain (loss), and common expenses are allocated to shareholders based on the daily net assets of each class. Dividends are declared separately for each class. Differences in per share dividend rates are generally due to differences in separate class expenses. The fund’s distributions declared to shareholders as reported in the Statements of Changes in Net Assets are presented by class as follows:
| | | | | | | | |
| | | From net investment
income | |
| | |
| | | Year ended
12/31/18 | | | Year ended
12/31/17 | |
| Initial Class | | | $20,085,625 | | | | $25,150,910 | |
| Service Class | | | 2,778,514 | | | | 4,093,170 | |
| Total | | | $22,864,139 | | | | $29,244,080 | |
| (3) | | Transactions with Affiliates |
Investment Adviser– The fund has an investment advisory agreement with MFS to provide overall investment management and related administrative services and facilities to the fund. The management fee is computed daily and paid monthly at the following annual rates based on the fund’s average daily net assets:
| | | | |
| Up to $1 billion | | | 0.70% | |
| In excess of $1 billion | | | 0.65% | |
MFS has agreed in writing to reduce its management fee by a specified amount if certain MFS mutual fund assets exceed thresholds agreed to by MFS and the fund’s Board of Trustees. For the year ended December 31, 2018, this management fee reduction amounted to $39,194, which is included in the reduction of total expenses in the Statement of Operations. The management fee incurred for the year ended December 31, 2018 was equivalent to an annual effective rate of 0.69% of the fund’s average daily net assets.
The investment adviser has agreed in writing to pay a portion of the fund’s total annual operating expenses, excluding interest, taxes, extraordinary expenses, brokerage and transaction costs, and investment-related expenses, such that total annual operating expenses do not exceed 0.72% of average daily net assets for the Initial Class shares and 0.97% of average daily net assets for the Service Class shares. This written agreement will continue until modified by the fund’s Board of Trustees, but such agreement will continue at least until April 30, 2020. For the year ended December 31, 2018, this reduction amounted to $175,117, which is included in the reduction of total expenses in the Statement of Operations.
Distributor– MFS Fund Distributors, Inc. (MFD), a wholly-owned subsidiary of MFS, is the distributor of shares of the fund. The Trustees have adopted a distribution plan for the Service Class shares pursuant to Rule12b-1 under the Investment Company Act of 1940.
The fund’s distribution plan provides that the fund will pay MFD distribution and/or service fees equal to 0.25% per annum of its average daily net assets attributable to Service Class shares as partial consideration for services performed and expenses incurred by MFD and financial intermediaries (including participating insurance companies that invest in the fund to fund variable annuity and variable life insurance contracts, sponsors of qualified retirement and pension plans that invest in the fund, and affiliates of these
23
MFS High Yield Portfolio
Notes to Financial Statements – continued
participating insurance companies and plan sponsors) in connection with the sale and distribution of the Service Class shares. MFD may subsequently pay all, or a portion, of the distribution and/or service fees to financial intermediaries.
Shareholder Servicing Agent– MFS Service Center, Inc. (MFSC), a wholly-owned subsidiary of MFS, receives a fee from the fund for its services as shareholder servicing agent. For the year ended December 31, 2018, the fee was $13,270, which equated to 0.0032% annually of the fund’s average daily net assets. MFSC also receives payment from the fund forout-of-pocket expenses paid by MFSC on behalf of the fund. For the year ended December 31, 2018, these costs amounted to $837.
Administrator– MFS provides certain financial, legal, shareholder communications, compliance, and other administrative services to the fund. Under an administrative services agreement, the fund reimburses MFS the costs incurred to provide these services. The fund is charged an annual fixed amount of $17,500 plus a fee based on average daily net assets. The administrative services fee incurred for the year ended December 31, 2018 was equivalent to an annual effective rate of 0.0167% of the fund’s average daily net assets.
Trustees’ and Officers’ Compensation– The fund pays compensation to independent Trustees in the form of a retainer, attendance fees, and additional compensation to Board and Committee chairpersons. The fund does not pay compensation directly to Trustees or officers of the fund who are also officers of the investment adviser, all of whom receive remuneration for their services to the fund from MFS. Certain officers and Trustees of the fund are officers or directors of MFS, MFD, and MFSC.
Other– This fund and certain other funds managed by MFS (the funds) have entered into a service agreement (the ISO Agreement) which provides for payment of fees solely by the funds to Tarantino LLC in return for the provision of services of an Independent Senior Officer (ISO) for the funds. Frank L. Tarantino serves as the ISO and is an officer of the funds and the sole member of Tarantino LLC. The funds can terminate the ISO Agreement with Tarantino LLC at any time under the terms of the ISO Agreement. For the year ended December 31, 2018, the fee paid by the fund under this agreement was $702 and is included in “Miscellaneous” expense in the Statement of Operations. MFS has agreed to bear all expenses associated with office space, other administrative support, and supplies provided to the ISO.
The fund invests in the MFS Institutional Money Market Portfolio which is managed by MFS and seeks current income consistent with preservation of capital and liquidity. This money market fund does not pay a management fee to MFS.
For the year ended December 31, 2018, purchases and sales of investments, other than short-term obligations, aggregated $160,017,348 and $201,104,411, respectively.
| (5) | | Shares of Beneficial Interest |
The fund’s Declaration of Trust permits the Trustees to issue an unlimited number of full and fractional shares of beneficial interest. Transactions in fund shares were as follows:
| | | | | | | | | | | | | | | | |
| | | Year ended 12/31/18 | | | Year ended 12/31/17 | |
| | | Shares | | | Amount | | | Shares | | | Amount | |
| Shares sold | | | | | | | | | | | | | | | | |
Initial Class | | | 2,683,377 | | | | $15,262,881 | | | | 3,789,799 | | | | $22,219,006 | |
Service Class | | | 318,476 | | | | 1,796,833 | | | | 1,361,172 | | | | 8,035,087 | |
| | | 3,001,853 | | | | $17,059,714 | | | | 5,150,971 | | | | $30,254,093 | |
| Shares issued to shareholders in reinvestment of distributions | | | | | | | | | | | | | | | | |
Initial Class | | | 3,658,584 | | | | $20,085,625 | | | | 4,412,440 | | | | $25,150,910 | |
Service Class | | | 511,697 | | | | 2,778,514 | | | | 727,028 | | | | 4,093,170 | |
| | | 4,170,281 | | | | $22,864,139 | | | | 5,139,468 | | | | $29,244,080 | |
| Shares reacquired | | | | | | | | | | | | | | | | |
Initial Class | | | (12,326,049 | ) | | | $(68,941,144 | ) | | | (11,406,776 | ) | | | $(67,327,394 | ) |
Service Class | | | (2,472,313 | ) | | | (13,714,022 | ) | | | (3,919,122 | ) | | | (22,701,757 | ) |
| | | (14,798,362 | ) | | | $(82,655,166 | ) | | | (15,325,898 | ) | | | $(90,029,151 | ) |
| Net change | | | | | | | | | | | | | | | | |
Initial Class | | | (5,984,088 | ) | | | $(33,592,638 | ) | | | (3,204,537 | ) | | | $(19,957,478 | ) |
Service Class | | | (1,642,140 | ) | | | (9,138,675 | ) | | | (1,830,922 | ) | | | (10,573,500 | ) |
| | | (7,626,228 | ) | | | $(42,731,313 | ) | | | (5,035,459 | ) | | | $(30,530,978 | ) |
The fund is one of several mutual funds in which certain MFS funds may invest. The MFS funds do not invest in the underlying funds for the purpose of exercising management or control. At the end of the period, the MFS Moderate Allocation Portfolio, the MFS Conservative Allocation Portfolio, and the MFS Growth Allocation Portfolio were the owners of record of approximately 19%, 6%, and 5%, respectively, of the value of outstanding voting shares of the fund.
24
MFS High Yield Portfolio
Notes to Financial Statements – continued
The fund and certain other funds managed by MFS participate in a $1.25 billion unsecured committed line of credit, subject to a $1 billion sublimit, provided by a syndication of banks under a credit agreement. Borrowings may be made for temporary financing needs. Interest is charged to each fund, based on its borrowings, generally at a rate equal to the higher of the Overnight Bank Funding rate or daily one month LIBOR plus an agreed upon spread. A commitment fee, based on the average daily, unused portion of the committed line of credit, is allocated among the participating funds. In addition, the fund and other funds managed by MFS have established unsecured uncommitted borrowing arrangements with certain banks for temporary financing needs. Interest is charged to each fund, based on its borrowings, at a rate equal to the Overnight Bank Funding rate plus an agreed upon spread. For the year ended December 31, 2018, the fund’s commitment fee and interest expense were $2,385 and $0, respectively, and are included in “Miscellaneous” expense in the Statement of Operations.
| (7) | | Investments in Affiliated Issuers |
An affiliated issuer may be considered one in which the fund owns 5% or more of the outstanding voting securities, or a company which is under common control. For the purposes of this report, the fund assumes the following to be affiliated issuers:
| | | | | | | | | | | | | | | | | | |
| Affiliated Issuers | | | | Beginning
Shares/Par
Amount | | | Acquisitions
Shares/Par
Amount | | | Dispositions
Shares/Par
Amount | | | Ending
Shares/Par
Amount | |
| | | | | |
| MFS Institutional Money Market Portfolio | | | | | 10,426,974 | | | | 101,596,054 | | | | (102,396,416 | ) | | | 9,626,612 | |
| | | | | |
| Affiliated Issuers | | Realized
Gain (Loss) | | Change in
Unrealized
Appreciation/
Depreciation | | | Capital Gain
Distributions | | | Dividend
Income | | | Ending
Value | |
| | | | | |
| MFS Institutional Money Market Portfolio | | $(784) | | | $(55 | ) | | | $— | | | | $202,953 | | | | $9,625,650 | |
In May 2015, the Motors Liquidation Company Avoidance Action Trust (hereafter, “AAT”) served upon the fund a complaint in an adversary proceeding in the U.S. Bankruptcy Court for the Southern District of New York, captionedMotors Liquidation Company Avoidance Action Trust v. JPMorgan Chase Bank, N.A., et al.(No.09-00504 (REG)). The complaint, which was originally filed in 2009 but not served on the fund until 2015, names as defendants over 500 entities (including the fund) that held an interest in a $1.5 billion General Motors (GM) term loan in 2009, when GM filed for bankruptcy. The AAT alleges that the fund and the other term loan lenders were improperly treated as secured lenders with respect to the term loan shortly before and immediately after GM’s bankruptcy, receiving full principal and interest payments under the loan. The AAT alleges that the fund and other term loan lenders should have been treated as unsecured (or partially unsecured) creditors because the main lien securing the collateral was allegedly not perfected at the time of GM’s bankruptcy due to an erroneous filing in October 2008 that terminated the financing statement perfecting the lien. The AAT seeks to claw back payments made to the fund and the other term loan lenders after, and during the 90 days before, GM’s June 2009 bankruptcy petition. During that time period, the fund received term loan payments of approximately $3,720,000. The fund cannot predict the outcome of this proceeding. Among other things, it is unclear whether the AAT’s claims will succeed; what the fund would be entitled to as an unsecured (or partially unsecured) creditor, given the existence of other collateral not impacted by the erroneous October 2008 filing; whether third parties responsible for the erroneous October 2008 filing would bear some or all of any liability; and the degree to which the fund may be entitled to indemnification from a third party for any amount required to be disgorged. The fund has and will continue to incur legal expenses associated with the defense of this action and in related claims against third parties.
25
MFS High Yield Portfolio
REPORT OF INDEPENDENT REGISTERED PUBLIC ACCOUNTING FIRM
To the Board of Trustees of MFS Variable Insurance Trust II and the Shareholders of
MFS High Yield Portfolio:
Opinion on the Financial Statements and Financial Highlights
We have audited the accompanying statement of assets and liabilities of MFS High Yield Portfolio (the “Fund”), including the portfolio of investments, as of December 31, 2018, the related statement of operations for the year then ended, the statements of changes in net assets for each of the two years in the period then ended, the financial highlights for each of the five years in the period then ended, and the related notes. In our opinion, the financial statements and financial highlights present fairly, in all material respects, the financial position of the Fund as of December 31, 2018, and the results of its operations for the year then ended, the changes in its net assets for each of the two years in the period then ended, and the financial highlights for each of the five years in the period then ended, in conformity with accounting principles generally accepted in the United States of America.
Basis for Opinion
These financial statements and financial highlights are the responsibility of the Fund’s management. Our responsibility is to express an opinion on the Fund’s financial statements and financial highlights based on our audits. We are a public accounting firm registered with the Public Company Accounting Oversight Board (United States) (PCAOB) and are required to be independent with respect to the Fund in accordance with the U.S. federal securities laws and the applicable rules and regulations of the Securities and Exchange Commission and the PCAOB.
We conducted our audits in accordance with the standards of the PCAOB. Those standards require that we plan and perform the audit to obtain reasonable assurance about whether the financial statements and financial highlights are free of material misstatement, whether due to error or fraud. The Fund is not required to have, nor were we engaged to perform, an audit of its internal control over financial reporting. As part of our audits we are required to obtain an understanding of internal control over financial reporting but not for the purpose of expressing an opinion on the effectiveness of the Fund’s internal control over financial reporting. Accordingly, we express no such opinion.
Our audits included performing procedures to assess the risks of material misstatement of the financial statements and financial highlights, whether due to error or fraud, and performing procedures that respond to those risks. Such procedures included examining, on a test basis, evidence regarding the amounts and disclosures in the financial statements and financial highlights. Our audits also included evaluating the accounting principles used and significant estimates made by management, as well as evaluating the overall presentation of the financial statements and financial highlights. Our procedures included confirmation of securities owned as of December 31, 2018, by correspondence with the custodian, brokers and agent banks; when replies were not received from brokers, we performed other auditing procedures. We believe that our audits provide a reasonable basis for our opinion.
DELOITTE & TOUCHE LLP
Boston, Massachusetts
February 15, 2019
We have served as the auditor of one or more of the MFS investment companies since 1924.
26
MFS High Yield Portfolio
TRUSTEES AND OFFICERS – IDENTIFICATION AND BACKGROUND
The Trustees and Officers of the Trust, as of February 1, 2019, are listed below, together with their principal occupations during the past five years. (Their titles may have varied during that period.) The address of each Trustee and Officer is 111 Huntington Avenue, Boston, Massachusetts 02199-7618.
| | | | | | | | | | |
Name, Age | | Position(s)
Held with Fund | | Trustee/Officer
Since (h) | | Number of MFS Funds overseen by the Trustee | | Principal Occupations
During the Past Five Years | | Other Directorships During the Past Five Years (j) |
| INTERESTED TRUSTEES |
Robert J. Manning (k) (age 55) | | Trustee | | February 2004 | | 135 | | Massachusetts Financial Services Company, Executive Chairman (since January 2017); Director; Chairman of the Board; Chief Executive Officer (until 2015);Co-Chief Executive Officer(2015-2016) | | N/A |
| | | | | |
Robin A. Stelmach (k) (age 57) | | Trustee | | January 2014 | | 135 | | Massachusetts Financial Services Company, Vice Chair (since January 2017); Chief Operating Officer and Executive Vice President (until January 2017) | | N/A |
|
| INDEPENDENT TRUSTEES |
John P. Kavanaugh (age 64) | | Trustee and Chair of Trustees | | January 2009 | | 135 | | Private investor | | N/A |
| | | | | |
Steven E. Buller (age 67) | | Trustee | | February 2014 | | 135 | | Financial Accounting Standards Advisory Council, Chairman(2014-2015); Public Company Accounting Oversight Board, Standing Advisory Group, Member (until 2014); BlackRock, Inc. (investment management), Managing Director (until 2014), BlackRock Finco UK (investment management), Director (until 2014) | | N/A |
| | | | | |
John A. Caroselli (age 64) | | Trustee | | March 2017 | | 135 | | JC Global Advisors, LLC (management consulting), President (since 2015); First Capital Corporation (commercial finance), Executive Vice President (until 2015) | | N/A |
| | | | | |
Maureen R. Goldfarb (age 63) | | Trustee | | January 2009 | | 135 | | Private investor | | N/A |
| | | | | |
Michael Hegarty (age 74) | | Trustee | | December 2004 | | 135 | | Private investor | | Rouse Properties Inc., Director (until 2016); Capmark Financial Group Inc., Director (until 2015) |
| | | | | |
Peter D. Jones (age 63) | | Trustee | | January 2019 | | 135 | | Franklin Templeton Distributors, Inc. (investment management), President (until 2015); Franklin Templeton Institutional, LLC (investment management), Chairman (until 2015) | | N/A |
| | | | | |
James W. Kilman, Jr. (age 57) | | Trustee | | January 2019 | | 135 | | KielStrand Capital LLC (family office and merchant bank), Chief Executive Officer (since 2016); Morgan Stanley & Co. (financial services), Vice Chairman of Investment Banking,Co-Head of Diversified Financials Coverage – Financial Institutions Investment Banking Group (until 2016) | | alpha-En Corporation, Director (since 2016) |
27
MFS High Yield Portfolio
Trustees and Officers – continued
| | | | | | | | | | |
Name, Age | | Position(s)
Held with Fund | | Trustee/Officer
Since (h) | | Number of MFS Funds overseen by the Trustee | | Principal Occupations
During the Past Five Years | | Other Directorships During the Past Five Years (j) |
Clarence Otis, Jr. (age 62) | | Trustee | | March 2017 | | 135 | | Darden Restaurants, Inc., Chief Executive Officer (until 2014) | | VF Corporation, Director; Verizon Communications, Inc., Director; The Travelers Companies, Director; Federal Reserve Bank of Atlanta, Director (until 2015) |
| | | | | |
Maryanne L. Roepke (age 62) | | Trustee | | May 2014 | | 135 | | American Century Investments (investment management), Senior Vice President and Chief Compliance Officer (until 2014) | | N/A |
| | | | | |
Laurie J. Thomsen
(age 61) | | Trustee | | March 2005 | | 135 | | Private investor | | The Travelers Companies, Director; Dycom Industries, Inc., Director (since 2015) |
| | | | | | | | |
Name, Age | | Position(s)
Held with Fund | | Trustee/Officer
Since (h) | | Number of MFS Funds for which the Person is an Officer | | Principal Occupations During the Past Five Years |
| OFFICERS | | | | | | |
Christopher R. Bohane (k)
(age 45) | | Assistant Secretary and Assistant Clerk | | July 2005 | | 135 | | Massachusetts Financial Services Company, Vice President and Assistant General Counsel |
| | | | |
Kino Clark (k) (age 50) | | Assistant Treasurer | | January 2012 | | 135 | | Massachusetts Financial Services Company, Vice President |
| | | | |
John W. Clark, Jr. (k) (age 51) | | Assistant Treasurer | | April 2017 | | 135 | | Massachusetts Financial Services Company, Vice President (since March 2017); Deutsche Bank (financial services), Department Head – Treasurer’s Office (until February 2017) |
| | | | |
Thomas H. Connors (k) (age 59) | | Assistant Secretary and Assistant Clerk | | September 2012 | | 135 | | Massachusetts Financial Services Company, Vice President and Senior Counsel |
| | | | |
Ethan D. Corey (k)
(age 55) | | Assistant
Secretary and Assistant Clerk | | July 2005 | | 135 | | Massachusetts Financial Services Company, Senior Vice President and Associate General Counsel |
| | | | |
David L. DiLorenzo (k)
(age 50) | | President | | July 2005 | | 135 | | Massachusetts Financial Services Company, Senior Vice President |
| | | | |
Heidi W. Hardin (k) (age 51) | | Secretary and Clerk | | April 2017 | | 135 | | Massachusetts Financial Services Company, Executive Vice President and General Counsel (since March 2017); Harris Associates (investment management), General Counsel (from September 2015 to January 2017); Janus Capital Management LLC (investment management), Senior Vice President and General Counsel (until September 2015) |
| | | | |
Brian E. Langenfeld (k) (age 45) | | Assistant
Secretary and Assistant Clerk | | June 2006 | | 135 | | Massachusetts Financial Services Company, Vice President and Senior Counsel |
| | | | |
Amanda S. Mooradian (k) (age 39) | | Assistant
Secretary and Assistant Clerk | | September 2018 | | 135 | | Massachusetts Financial Services Company, Assistant Vice President and Counsel |
| | | | |
Susan A. Pereira (k)
(age 48) | | Assistant
Secretary and Assistant Clerk | | July 2005 | | 135 | | Massachusetts Financial Services Company, Vice President and Senior Counsel |
| | | | |
Kasey L. Phillips (k) (age 48) | | Assistant Treasurer | | September 2012 | | 135 | | Massachusetts Financial Services Company, Vice President |
| | | | |
Matthew A. Stowe (k) (age 44) | | Assistant Secretary and Assistant Clerk | | October 2014 | | 135 | | Massachusetts Financial Services Company, Vice President and Assistant General Counsel |
28
MFS High Yield Portfolio
Trustees and Officers – continued
| | | | | | | | |
Name, Age | | Position(s)
Held with Fund | | Trustee/Officer
Since (h) | | Number of MFS Funds for which the Person is an Officer | | Principal Occupations During the Past Five Years |
Frank L. Tarantino
(age 74) | | Independent
Senior Officer | | June 2004 | | 135 | | Tarantino LLC (provider of compliance services), Principal |
| | | | |
Richard S. Weitzel (k)
(age 48) | | Assistant Secretary and Assistant Clerk | | October 2007 | | 135 | | Massachusetts Financial Services Company, Senior Vice President and Associate General Counsel |
| | | | |
Martin J. Wolin (k) (age 51) | | Chief Compliance Officer | | July 2015 | | 135 | | Massachusetts Financial Services Company, Senior Vice President and Chief Compliance Officer (since July 2015); Mercer (financial service provider), Chief Risk and Compliance Officer, North America and Latin America (until June 2015) |
| | | | |
James O. Yost (k)
(age 58) | | Treasurer | | September 1990 | | 135 | | Massachusetts Financial Services Company, Senior Vice President |
| (h) | Date first appointed to serve as Trustee/officer of an MFS Fund. Each Trustee has served continuously since appointment unless indicated otherwise. For the period from December 15, 2004 until February 22, 2005, Mr. Manning served as Advisory Trustee. From January 2012 through December 2016, Messrs. DiLorenzo and Yost served as Treasurer and Deputy Treasurer of the Funds, respectively. |
| (j) | Directorships or trusteeships of companies required to report to the Securities and Exchange Commission (i.e., “public companies”). |
| (k) | “Interested person” of the Trust within the meaning of the Investment Company Act of 1940 (referred to as the 1940 Act), which is the principal federal law governing investment companies like the fund, as a result of a position with MFS. The address of MFS is 111 Huntington Avenue, Boston, Massachusetts 02199-7618. |
Each Trustee has been elected by shareholders and each Trustee and officer holds office until his or her successor is chosen and qualified or until his or her earlier death, resignation, retirement or removal. The Trust does not hold annual meetings for the purpose of electing Trustees, and Trustees are not elected for fixed terms. Under the terms of the Board’s retirement policy, an Independent Trustee shall retire at the end of the calendar year in which he or she reaches the earlier of 75 years of age or 15 years of service on the Board (or, in the case of any Independent Trustee who joined the Board prior to 2015, 20 years of service on the Board).
Messrs. Buller, Hegarty, Kilman and Otis and Ms. Roepke are members of the Trust’s Audit Committee.
Each of the Interested Trustees and certain Officers hold comparable officer positions with certain affiliates of MFS.
The Statement of Additional Information for a Fund includes further information about the Trustees and is available without charge upon request by calling1-800-225-2606.
| | |
Investment Adviser Massachusetts Financial Services Company 111 Huntington Avenue Boston, MA 02199-7618 | | Custodian State Street Bank and Trust Company 1 Lincoln Street Boston, MA 02111-2900 |
Distributor MFS Fund Distributors, Inc. 111 Huntington Avenue Boston, MA 02199-7618 | | Independent Registered Public Accounting Firm Deloitte & Touche LLP 200 Berkeley Street Boston, MA 02116 |
Portfolio Manager(s) David Cole Michael Skatrud | | |
29
MFS High Yield Portfolio
BOARD REVIEW OF INVESTMENT ADVISORY AGREEMENT
The Investment Company Act of 1940 requires that both the full Board of Trustees and a majority of thenon-interested (“independent”) Trustees, voting separately, annually approve the continuation of the Fund’s investment advisory agreement with MFS. The Trustees consider matters bearing on the Fund and its advisory arrangements at their meetings throughout the year, including a review of performance data at each regular meeting. In addition, the independent Trustees met several times over the course of three months beginning in May and ending in July, 2018 (“contract review meetings”) for the specific purpose of considering whether to approve the continuation of the investment advisory agreement for the Fund and the other investment companies that the Board oversees (the “MFS Funds”). The independent Trustees were assisted in their evaluation of the Fund’s investment advisory agreement by independent legal counsel, from whom they received separate legal advice and with whom they met separately from MFS during various contract review meetings. The independent Trustees were also assisted in this process by the MFS Funds’ Independent Senior Officer, a senior officer appointed by and reporting to the independent Trustees.
In connection with their deliberations regarding the continuation of the investment advisory agreement, the Trustees, including the independent Trustees, considered such information and factors as they believed, in light of the legal advice furnished to them and their own business judgment, to be relevant. The investment advisory agreement for the Fund was considered separately, although the Trustees also took into account the common interests of all MFS Funds in their review. As described below, the Trustees considered the nature, quality, and extent of the various investment advisory, administrative, and shareholder services performed by MFS under the existing investment advisory agreement and other arrangements with the Fund.
In connection with their contract review meetings, the Trustees received and relied upon materials that included, among other items: (i) information provided by Broadridge Financial Solutions, Inc. (“Broadridge”), an independent third party, on the investment performance of the Fund for various time periods ended December 31, 2017 and the investment performance of a group of funds with substantially similar investment classifications/objectives (the “Broadridge performance universe”), (ii) information provided by Broadridge on the Fund’s advisory fees and other expenses and the advisory fees and other expenses of comparable funds identified by Broadridge (the “Broadridge expense group”), (iii) information provided by MFS on the advisory fees of portfolios of other clients of MFS, including institutional separate accounts and other clients, (iv) information as to whether and to what extent applicable expense waivers, reimbursements or fee “breakpoints” are observed for the Fund, (v) information regarding MFS’ financial results and financial condition, including MFS’ and certain of its affiliates’ estimated profitability from services performed for the Fund and the MFS Funds as a whole, and compared to MFS’ institutional business, (vi) MFS’ views regarding the outlook for the mutual fund industry and the strategic business plans of MFS, (vii) descriptions of various functions performed by MFS for the Funds, such as compliance monitoring and portfolio trading practices, and (viii) information regarding the overall organization of MFS, including information about MFS’ senior management and other personnel providing investment advisory, administrative and other services to the Fund and the other MFS Funds. The comparative performance, fee and expense information prepared and provided by Broadridge was not independently verified and the independent Trustees did not independently verify any information provided to them by MFS.
The Trustees’ conclusion as to the continuation of the investment advisory agreement was based on a comprehensive consideration of all information provided to the Trustees and not the result of any single factor. Some of the factors that figured particularly in the Trustees’ deliberations are described below, although individual Trustees may have evaluated the information presented differently from one another, giving different weights to various factors. It is also important to recognize that the fee arrangements for the Fund and other MFS Funds are the result of years of review and discussion between the independent Trustees and MFS, that certain aspects of such arrangements may receive greater scrutiny in some years than in others, and that the Trustees’ conclusions may be based, in part, on their consideration of these same arrangements during the course of the year and in prior years.
Based on information provided by Broadridge and MFS, the Trustees reviewed the Fund’s total return investment performance as well as the Broadridge performance universe over various time periods. The Trustees placed particular emphasis on the total return performance of the Fund’s Initial Class shares in comparison to the performance of funds in its Broadridge performance universe over the three-year period ended December 31, 2017, which the Trustees believed was a long enough period to reflect differing market conditions. The total return performance of the Fund’s Initial Class shares was in the 3rd quintile relative to the other funds in the universe for this three-year period (the 1st quintile being the best performers and the 5th quintile being the worst performers). The total return performance of the Fund’s Initial Class shares was in the 3rd quintile for each of theone- and five-year periods ended December 31, 2017 relative to the Broadridge performance universe. Because of the passage of time, these performance results may differ from the performance results for more recent periods, including those shown elsewhere in this report.
In the course of their deliberations, the Trustees took into account information provided by MFS in connection with the contract review meetings, as well as during investment review meetings conducted with portfolio management personnel during the course of the year regarding the Fund’s performance. After reviewing these and related factors, the Trustees concluded, within the context of their overall conclusions regarding the investment advisory agreement, that they were satisfied with MFS’ responses and efforts relating to investment performance.
30
MFS High Yield Portfolio
Board Review of Investment Advisory Agreement – continued
In assessing the reasonableness of the Fund’s advisory fee, the Trustees considered, among other information, the Fund’s advisory fee and the total expense ratio of the Fund’s Initial Class shares as a percentage of average daily net assets and the advisory fee and total expense ratios of peer groups of funds based on information provided by Broadridge. The Trustees considered that MFS currently observes an expense limitation for the Fund, which may not be changed without the Trustees’ approval. The Trustees also considered that, according to the data provided by Broadridge (which takes into account any fee reductions or expense limitations that were in effect during the Fund’s last fiscal year), the Fund’s effective advisory fee rate was higher than the Broadridge expense group median and the Fund’s total expense ratio was approximately at the Broadridge expense group median.
The Trustees also considered the advisory fees charged by MFS to any institutional separate accounts advised by MFS (“separate accounts”) and unaffiliated investment companies for which MFS serves as subadviser (“subadvised funds”) that have comparable investment strategies to the Fund, if any. In comparing these fees, the Trustees considered information provided by MFS as to the generally broader scope of services provided by MFS to the Fund, as well as the more extensive regulatory burdens imposed on MFS in managing the Fund, in comparison to separate accounts and subadvised funds. The Trustees also considered the higher demands placed on MFS’ investment personnel and trading infrastructure as a result of the daily cashin-flows andout-flows of the Fund in comparison to separate accounts.
The Trustees also considered whether the Fund may benefit from any economies of scale in the management of the Fund in the event of growth in assets of the Fund and/or growth in assets of the MFS Funds as a whole. They noted that the Fund’s advisory fee rate schedule is subject to a contractual breakpoint that reduces the Fund’s advisory fee rate on average daily net assets over $1 billion. The Trustees also noted that MFS has agreed in writing to waive a portion of the management fees of certain MFS Funds, including the Fund, if the total combined assets of certain funds within the MFS Funds’ complex increase above agreed upon thresholds (the “group fee waiver”), enabling the Fund’s shareholders to share in the benefits from any economies of scale at the complex level. The group fee waiver is reviewed and renewed annually between the Board and MFS. The Trustees concluded that the breakpoint and the group fee waiver were sufficient to allow the Fund to benefit from economies of scale as its assets and overall complex assets grow.
The Trustees also considered information prepared by MFS relating to MFS’ costs and profits with respect to the Fund, the MFS Funds considered as a group, and other investment companies and accounts advised by MFS, as well as MFS’ methodologies used to determine and allocate its costs to the MFS Funds, the Fund and other accounts and products for purposes of estimating profitability.
After reviewing these and other factors described herein, the Trustees concluded, within the context of their overall conclusions regarding the investment advisory agreement, that the advisory fees charged to the Fund represent reasonable compensation in light of the services being provided by MFS to the Fund.
In addition, the Trustees considered MFS’ resources and related efforts to continue to retain, attract and motivate capable personnel to serve the Fund. The Trustees also considered current and developing conditions in the financial services industry, including the presence of large and well-capitalized companies which are spending, and appear to be prepared to continue to spend, substantial sums to engage personnel and to provide services to competing investment companies. In this regard, the Trustees also considered the financial resources of MFS and its ultimate parent, Sun Life Financial Inc. The Trustees also considered the advantages and possible disadvantages to the Fund of having an adviser that also serves other investment companies as well as other accounts.
The Trustees also considered the nature, quality, cost, and extent of administrative, transfer agency, and distribution services provided to the Fund by MFS and its affiliates under agreements and plans other than the investment advisory agreement, including any12b-1 fees the Fund pays to MFS Fund Distributors, Inc., an affiliate of MFS. The Trustees also considered the nature, extent and quality of certain other services MFS performs or arranges for on the Fund’s behalf, which may include securities lending programs, directed expense payment programs, class action recovery programs, and MFS’ interaction with third-party service providers, principally custodians andsub-custodians. The Trustees concluded that the variousnon-advisory services provided by MFS and its affiliates on behalf of the Fund were satisfactory.
The Trustees consideredso-called“fall-out benefits” to MFS such as reputational value derived from serving as investment manager to the MFS Funds. The Trustees also considered that, effective January 3, 2018, MFS had discontinued its historic practice of obtaining investment research from portfolio brokerage commissions paid by certain MFS Funds and would thereafter voluntarily reimburse a Fund, if applicable, for the costs of external research acquired through the use of the Fund’s portfolio brokerage commissions.
Based on their evaluation of factors that they deemed to be material, including those factors described above, the Board of Trustees, including the independent Trustees, concluded that the Fund’s investment advisory agreement with MFS should be continued for an additionalone-year period, commencing August 1, 2018.
31
MFS High Yield Portfolio
PROXY VOTING POLICIES AND INFORMATION
MFS votes proxies on behalf of the fund pursuant to proxy voting policies and procedures that are available without charge, upon request, by calling 1-800-225-2606, by visitingmfs.com/proxyvoting, or by visiting the SEC’s Web site athttp://www.sec.gov.
Information regarding how the fund voted proxies relating to portfolio securities during the most recent twelve-month period ended June 30 is available by August 31 of each year without charge by visitingmfs.com/proxyvoting, or by visiting the SEC’s Web site athttp://www.sec.gov.
QUARTERLY PORTFOLIO DISCLOSURE
The fund files a complete schedule of portfolio holdings with the SEC for the first and third quarters of each fiscal year on Form N-Q. The fund’s Form N-Q is available on the SEC’s website athttp://www.sec.gov.A shareholder can obtain the portfolio holdings report for the first and third quarters of the fund’s fiscal year atmfs.com/vit2 by choosing the fund’s name and then selecting the “Resources” tab and clicking on “Prospectus and Reports”.
FURTHER INFORMATION
From time to time, MFS may post important information about the fund or the MFS funds on the MFS web site (mfs.com). This information is available athttps://www.mfs.com/en-us/what-we-do/announcements.htmlor atmfs.com/vit2 by choosing the fund’s name.
INFORMATION ABOUT FUND CONTRACTS AND LEGAL CLAIMS
The fund has entered into contractual arrangements with an investment adviser, administrator, distributor, shareholder servicing agent, 529 program manager (if applicable), and custodian who each provide services to the fund. Unless expressly stated otherwise, shareholders are not parties to, or intended beneficiaries of these contractual arrangements, and these contractual arrangements are not intended to create any shareholder right to enforce them against the service providers or to seek any remedy under them against the service providers, either directly or on behalf of the fund.
Under the Trust’s By-Laws and Declaration of Trust, any claims asserted against or on behalf of the MFS Funds, including claims against Trustees and Officers, must be brought in state and federal courts located within the Commonwealth of Massachusetts.
32
rev. 3/16
| | | | |
| | | |
| FACTS | | WHAT DOES MFS DO WITH YOUR
PERSONAL INFORMATION? | |  |
| | |
| Why? | | Financial companies choose how they share your personal information. Federal law gives consumers the right to limit some but not all sharing. Federal law also requires us to tell you how we collect, share, and protect your personal information. Please read this notice carefully to understand what we do. |
| | |
| What? | | The types of personal information we collect and share depend on the product or service you have with us. This information can include: • Social Security number and account balances • Account transactions and transaction history • Checking account information and wire transfer instructions When you areno longer our customer, we continue to share your information as described in this notice. |
| | |
| How? | | All financial companies need to share customers’ personal information to run their everyday business. In the section below, we list the reasons financial companies can share their customers’ personal information; the reasons MFS chooses to share; and whether you can limit this sharing. |
| | | | |
Reasons we can share your
personal information | | Does MFS share? | | Can you limit this
sharing? |
For our everyday business purposes – such as to process your transactions, maintain your account(s), respond to court orders and legal investigations, or report to credit bureaus | | Yes | | No |
For our marketing purposes – to offer our products and services to you | | No | | We don’t share |
| For joint marketing with other financial companies | | No | | We don’t share |
For our affiliates’ everyday business purposes – information about your transactions and experiences | | No | | We don’t share |
For our affiliates’ everyday business purposes – information about your creditworthiness | | No | | We don’t share |
| For nonaffiliates to market to you | | No | | We don’t share |
| | |
| | |
| Questions? | | Call800-225-2606 or go tomfs.com. |
33
| | |
| Who we are |
| Who is providing this notice? | | MFS Funds, MFS Investment Management, MFS Institutional Advisors, Inc., and MFS Heritage Trust Company. |
| | |
| What we do |
| How does MFS protect my personal information? | | To protect your personal information from unauthorized access and use, we use security measures that comply with federal law. These measures include procedural, electronic, and physical safeguards for the protection of the personal information we collect about you. |
How does MFS
collect my personal information? | | We collect your personal information, for example, when you • open an account or provide account information • direct us to buy securities or direct us to sell your securities • make a wire transfer We also collect your personal information from others, such as credit bureaus, affiliates, or other companies. |
| Why can’t I limit all sharing? | | Federal law gives you the right to limit only • sharing for affiliates’ everyday business purposes – information about your creditworthiness • affiliates from using your information to market to you • sharing for nonaffiliates to market to you State laws and individual companies may give you additional rights to limit sharing. |
| | |
| Definitions |
| Affiliates | | Companies related by common ownership or control. They can be financial and nonfinancial companies. • MFS does not share personal information with affiliates, except for everyday business purposes as described on page one of this notice. |
| Nonaffiliates | | Companies not related by common ownership or control. They can be financial and nonfinancial companies. • MFS does not share with nonaffiliates so they can market to you. |
| Joint marketing | | A formal agreement between nonaffiliated financial companies that together market financial products or services to you. • MFS doesn’t jointly market. |
| | |
| Other important information |
| If you own an MFS product or receive an MFS service in the name of a third party such as a bank or broker-dealer, their privacy policy may apply to you instead of ours. |
34
Annual Report
December 31, 2018

MFS® International Growth Portfolio

MFS® Variable Insurance Trust II
Beginning on January 1, 2021, as permitted by regulations adopted by the U.S. Securities and Exchange Commission, the insurance company that offers your contract may determine that it will no longer send you paper copies of the fund’s annual and semiannual shareholder reports unless you specifically request paper copies from the insurance company or from your financial intermediary. Instead, the shareholder reports will be made available on a Web site (insurancefunds.mfs.com or other Web site of which you will be notified), and the insurance company will notify you by mail each time a report is posted and provide you with a Web site link to access the report. Instructions for requesting paper copies will be provided by your insurance company or financial intermediary.
If you already elected to receive shareholder reports by email, you will not be affected by this change and you need not take any action. If your insurance company or financial intermediary offers electronic delivery, you may elect to receive shareholder reports and other communications from the insurance company or financial intermediary by email by following the instructions provided by the insurance company or financial intermediary.
Beginning on January 1, 2019, you may elect to receive all future reports in paper free of charge from the insurance company or financial intermediary. You can inform the insurance company or financial intermediary that you wish to continue receiving paper copies of your shareholder reports by contacting your insurance company or financial intermediary. Your election to receive reports in paper will apply to all funds held in your account with your insurance company or financial intermediary.
FCI-ANN
MFS® International Growth Portfolio
CONTENTS
The report is prepared for the general information of contract owners. It is authorized for distribution to prospective investors only when preceded or accompanied by a current prospectus.
NOT FDIC INSURED• MAY LOSE VALUE• NO BANK OR CREDIT UNION GUARANTEE• NOT A DEPOSIT• NOT INSURED BY ANY FEDERAL GOVERNMENT AGENCY OR NCUA/NCUSIF
MFS International Growth Portfolio
LETTER FROM THE EXECUTIVE CHAIRMAN

Dear Contract Owners:
Higher interest rates, international trade friction, and geopolitical uncertainty surrounding issues such as Brexit have contributed to an uptick in market volatility in recent quarters — a departure from thelow-volatility environment that prevailed for much of the past several years. Against this more challenging backdrop, equity markets in the United States outperformed most international markets on a relative basis in 2018, though broad market returns were modestly negative on an absolute basis. Global economic growth has become less synchronized over the past few quarters, with Europe, China, and some emerging markets having shown signs of significantly slowing growth. While U.S. growth has remained above average, the pace of that growth slowed in the second half of 2018.
Slowing global growth and tighter financial conditions have clouded the outlook for U.S. monetary policy, with the chairman of the U.S. Federal Reserve acknowledging that policy rates are close to levels that the Fed deems neutral for the U.S. economy. This suggests that the predictable pattern of quarterly rate increases is behind us. At the same time, markets must contend with a shift from years of quantitative easing toward a cycle of quantitative tightening now that the European Central Bank has halted asset purchases. U.S. tax reforms adopted in late 2017 have been welcomed by equity markets while emerging market economies have recently had to contend with tighter financial conditions as a result of firmer U.S. interest rates and a stronger dollar. With the Republicans losing control of the U.S. House of Representatives, further meaningful U.S. fiscal stimulus appears less likely over the remainder of this presidential term. A partial U.S. government shutdown, beginning in late 2018, also added to political uncertainty. Globally, inflation remains largely subdued thanks in part to falling oil prices, but tight labor markets and moderate global demand have investors on the lookout for its potential reappearance. Increased U.S. protectionism is also a growing concern, as investors fear trade disputes could dampen business sentiment, leading to even slower global growth. While there has been progress on this front — a NAFTA replacement has been agreed upon between the U.S., Mexico, and Canada; the free trade pact with Korea has been updated; and a negotiating framework with the European Union has been agreed upon — tensions over trade with China remain quite high, though the two sides have recently returned to the negotiating table.
As a global investment manager with nearly a century of expertise, MFS® firmly believes active risk management offers downside mitigation and may help improve investment outcomes. We built our active investment platform with this belief in mind. Ourlong-term perspective influences nearly every aspect of our business, ensuring our investment decisions align with the investing time horizons of our clients.
Respectfully,

Robert J. Manning
Executive Chairman
MFS Investment Management
February 15, 2019
The opinions expressed in this letter are subject to change and may not be relied upon for investment advice. No forecasts can be guaranteed.
1
MFS International Growth Portfolio
PORTFOLIO COMPOSITION
Portfolio structure

| | | | |
| Top ten holdings | |
| Nestle S.A. | | | 4.5% | |
| Roche Holding AG | | | 4.1% | |
| AIA Group Ltd. | | | 3.3% | |
| Taiwan Semiconductor Manufacturing Co. Ltd., ADR | | | 3.2% | |
| SAP AG | | | 3.1% | |
| L’Oréal | | | 2.6% | |
| LVMH Moet Hennessy Louis Vuitton SE | | | 2.6% | |
| Pernod Ricard S.A. | | | 2.5% | |
| Danone S.A. | | | 2.4% | |
| Novartis AG | | | 2.4% | |
|
| GICS equity sectors | |
| Consumer Staples | | | 21.5% | |
| Information Technology | | | 13.7% | |
| Industrials | | | 13.4% | |
| Health Care | | | 13.2% | |
| Financials | | | 12.1% | |
| Consumer Discretionary | | | 10.4% | |
| Materials | | | 8.2% | |
| Communication Services | | | 4.4% | |
| Energy | | | 1.8% | |
| Utilities | | | 0.5% | |
| | | | |
| Issuer country weightings (x) | |
| France | | | 17.8% | |
| Switzerland | �� | | 13.7% | |
| United Kingdom | | | 11.3% | |
| Germany | | | 9.5% | |
| Japan | | | 8.8% | |
| United States | | | 5.9% | |
| China | | | 5.0% | |
| India | | | 4.1% | |
| Canada | | | 3.9% | |
| Other Countries | | | 20.0% | |
|
| Currency exposure weightings (y) | |
| Euro | | | 33.0% | |
| Swiss Franc | | | 13.7% | |
| British Pound Sterling | | | 12.0% | |
| Japanese Yen | | | 8.8% | |
| United States Dollar | | | 7.5% | |
| Hong Kong Dollar | | | 4.5% | |
| Indian Rupee | | | 4.1% | |
| Taiwan Dollar | | | 3.7% | |
| Chinese Renminbi | | | 2.8% | |
| Other Currencies | | | 9.9% | |
| (x) | Represents the portfolio’s exposure to issuer countries as a percentage of a portfolio’s net assets. For purposes of this presentation, United States includes Cash & Cash Equivalents. |
| (y) | Represents the portfolio’s exposure to a particular currency as a percentage of a portfolio’s net assets. For purposes of this presentation, United States Dollar includes Cash & Cash Equivalents. |
Cash & Cash Equivalents includes any cash, investments in money market funds, short-term securities, and other assets less liabilities. Please see the Statement of Assets and Liabilities for additional information related to the fund’s cash position and other assets and liabilities.
The Global Industry Classification Standard (GICS®) was developed by and/or is the exclusive property of MSCI, Inc. and S&P Global Market Intelligence Inc. (“S&P Global Market Intelligence”). GICS is a service mark of MSCI and S&P Global Market Intelligence and has been licensed for use by MFS.
Percentages are based on net assets as of December 31, 2018.
The portfolio is actively managed and current holdings may be different.
2
MFS International Growth Portfolio
MANAGEMENT REVIEW
Summary of Results
For the twelve months ended December 31, 2018, Initial Class shares of the MFS International Growth Portfolio (“fund”) provided a total return of –9.02%, while Service Class shares of the fund provided a total return of –9.30%. These compare with a return of –14.43% over the same period for the fund’s benchmark, the MSCI All Country World(ex-US) Growth Index (net div).
Market Environment
During the reporting period, the US Federal Reserve raised interest rates by 100 basis points, bringing the total number of rate hikes to nine since the central bank began to normalize monetary policy in late 2015. Economic growth rates in the US, Eurozone and Japan remained above trend, despite a slowing in global growth, particularly toward the end of the period. Inflation remained contained, particularly outside the US. Late in the period, the European Central Bank halted its asset purchase program but issued forward guidance that it does not expect to raise interest rates at least until after the summer of 2019. The Bank of England (once) and the Bank of Canada (three times) each raised rates during the period. The European political backdrop became a bit more volatile, late in the period, spurred by concerns over cohesion in the eurozone after the election of an anti-establishment, Eurosceptic coalition government in Italy and widespread protests over stagnant wage growth in France.
Bond yields rose in the US during most of the period, but remained low by historical standards and slipped from their highs, late in the period, as market volatility increased. Yields in many developed markets fell. Outside of emerging markets, where spreads and currencies came under pressure, credit spreads remained quite tight until the end of the period, when thinner liquidity, lower oil prices and concerns over high degrees of corporate leverage emerged. Growing concern over increasing global trade friction appeared to have weighed on business sentiment during the period’s second half, especially outside the US. Tighter financial conditions from rising US rates and a strong dollar, combined with trade uncertainty, helped expose structural weaknesses in several emerging markets in the second half of the period.
Volatility increased, at the end of the period, amid signs of slowing global economic growth and increasing trade tensions, which prompted a market setback shortly after US markets set record highs in September. It was the second such equity market decline during the reporting period. The correction came despite a third consecutive quarter of strong growth in US earnings per share. Strong earnings growth, combined with the market decline, brought US equity valuations down from elevated levels, earlier in the period, to multiples more in line with long-term averages. While the US economy held up better than most, global economic growth became less synchronized during the period, with Europe and China showing signs of a slowdown and some emerging markets coming under stress.
Contributors to Performance
Stock selection in theconsumer discretionary sector contributed to performance relative to the MSCI All Country World(ex-US) Growth Index. Within this sector, the fund’s overweight position in apparel and accessories retailer Kering (France) aided relative results.
Stock selection in both theinformation technologyandmaterialssectors also benefited relative returns. Within theinformation technology sector, the fund’s holdings of management consulting firm Accenture (b), and an overweight position in software solutions and consulting services firm Dassault Systems (h) (France), bolstered relative performance. Within the materials sector, an overweight position in industrial gas supplier Linde (Germany) strengthened relative returns. The stock price of Linde advanced as management reported solid results during the period driven, in part, by higher-than-expected sales growth within the company’s engineering and gas divisions.
A combination of stock selection and an overweight allocation to theconsumer staplessector positively impacted relative results. The fund’s overweight positions in personal and household products company L’Oréal (France) and wine and alcoholic beverage producer Pernod Ricard (France) boosted relative performance.
Other top relative contributors during the period included the fund’s overweight positions in medical products and equipment manufacturer Terumo (Japan) and pharmaceutical and diagnostic company Roche Holding (Switzerland). The stock price of Terumo appreciated as the company reported solid earnings results which reflected strong growth in overseas sales and profits, driven by its cardiac & vascular business. Additionally, the timing of the fund’s ownership in shares of pharmaceutical company Novartis AG (Switzerland), and holding shares of Indian banking firm HDFC Bank (b), helped relative returns.
Detractors from Performance
Stock selection in thecommunication services sector detracted from the fund’s relative performance. Within this sector, an overweight position in internet search company Baidu (China), and holding shares of advertising and marketing firm WPP (b) (United Kingdom), weakened relative returns. The stock price of Baidu traded lower as investors appeared to be concerned over the intensifying trade war dispute between the US and China, as well as the possibility of Google re-entering the Chinese market.
3
MFS International Growth Portfolio
Management Review – continued
Stock selection within theindustrialssector also held back relative results, led by the fund’s overweight positions in industrial process technology manufacturer GEA Group (Germany), building products supplier Toto (Japan) and cable manufacturer and installer Prysmian (Italy).
Elsewhere, the timing of the fund’s ownership in shares of healthcare and agricultural products producer Bayer AG (Germany) negatively impacted relative performance. The stock price of Bayer depreciated after a court awarded damages to an individual who claimed to have contractedNon-Hodgkin’s Lymphoma cancer from glyphosate herbicide, which was discovered and branded as Roundup by Monsanto, whom Bayer acquired in 2018. The stock traded significantly lower after the news, as investors appeared to have been concerned that more lawsuits would be filed against Bayer. In addition, the fund’s overweight positions in global healthcare group Fresenius Medical Care AG & Co. KGaA (Germany), private banking services provider Julius Baer Group (Switzerland) and pharmaceutical and general merchandise retailer Sundrug (Japan), and holding shares of investment management and banking firm UBS (b) (Switzerland), further weighed on relative results.
Respectfully,
Portfolio Manager(s)
David Antonelli, Matthew Barrett, and Kevin Dwan
| (b) | Security is not a benchmark constituent. |
| (h) | Security was not held in the portfolio at period end. |
The views expressed in this report are those of the portfolio manager(s) only through the end of the period of the report as stated on the cover and do not necessarily reflect the views of MFS or any other person in the MFS organization. These views are subject to change at any time based on market or other conditions, and MFS disclaims any responsibility to update such views. These views may not be relied upon as investment advice or an indication of trading intent on behalf of any MFS portfolio. References to specific securities are not recommendations of such securities, and may not be representative of any MFS portfolio’s current or future investments.
4
MFS International Growth Portfolio
PERFORMANCE SUMMARY THROUGH 12/31/18
The following chart illustrates the historical performance of the fund in comparison to its benchmark(s). Benchmarks are unmanaged and may not be invested in directly. Benchmark returns do not reflect any fees or expenses. The performance of other share classes will be greater than or less than that of the class depicted below. (See Notes to Performance Summary.)
Performance data shown represents past performance and is no guarantee of future results. Investment return and principal value fluctuate so your units, when sold, may be worth more or less than the original cost; current performance may be lower or higher than quoted. The performance shown does not reflect the deduction of taxes, if any, that a contract holder would pay on fund distributions or the redemption of contract units. The returns for the fund shown also do not reflect the deduction of expenses associated with variable products, such as mortality and expense risk charges, separate account charges, and sales charges imposed by the insurance company separate accounts. Such expenses would reduce the overall returns shown.
Growth of a Hypothetical $10,000 Investment
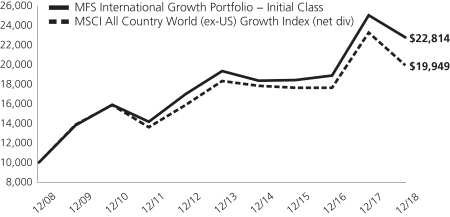
Total Returns through 12/31/18
Average annual total returns
| | | | | | | | | | | | |
| | | Share Class | | Class Inception Date | | 1-yr | | 5-yr | | 10-yr | | |
| | | Initial Class | | 6/03/96 | | (9.02)% | | 3.35% | | 8.60% | | |
| | | Service Class | | 8/24/01 | | (9.30)% | | 3.08% | | 8.32% | | |
| | | | |
| Comparative benchmark(s) | | | | | | | | |
| | | MSCI All Country World(ex-US) Growth Index (net div) (f) | | (14.43)% | | 1.69% | | 7.15% | | |
| (f) | Source: FactSet Research Systems Inc. |
Benchmark Definition(s)
MSCI All Country World (ex-US) Growth Index (net div) – a market capitalization-weighted index that is designed to measure equity market performance for growth securities in the global developed and emerging markets, excluding the U.S.
It is not possible to invest directly in an index.
Notes to Performance Summary
Average annual total return represents the average annual change in value for each share class for the periods presented.
Performance results reflect any applicable expense subsidies and waivers in effect during the periods shown. Without such subsidies and waivers the fund’s performance results would be less favorable. Please see the prospectus and financial statements for complete details. All results are historical and assume the reinvestment of any dividends and capital gains distributions.
Performance results do not include adjustments made for financial reporting purposes in accordance with U.S. generally accepted accounting principles and may differ from amounts reported in the financial highlights.
From time to time the fund may receive proceeds from litigation settlements, without which performance would be lower.
5
MFS International Growth Portfolio
EXPENSE TABLE
Fund Expenses Borne by the Contract Holders during the Period,
July 1, 2018 through December 31, 2018
As a contract holder of the fund, you incur ongoing costs, including management fees; distribution and/or service(12b-1) fees; and other fund expenses. This example is intended to help you understand your ongoing costs (in dollars) of investing in the fund and to compare these costs with the ongoing costs of investing in other mutual funds.
The example is based on an investment of $1,000 invested at the beginning of the period and held for the entire period July 1, 2018 through December 31, 2018.
Actual Expenses
The first line for each share class in the following table provides information about actual account values and actual expenses. You may use the information in this line, together with the amount you invested, to estimate the expenses that you paid over the period. Simply divide your account value by $1,000 (for example, an $8,600 account value divided by $1,000 = 8.6), then multiply the result by the number in the first line under the heading entitled “Expenses Paid During Period” to estimate the expenses you paid on your account during this period.
Hypothetical Example for Comparison Purposes
The second line for each share class in the following table provides information about hypothetical account values and hypothetical expenses based on the fund’s actual expense ratio and an assumed rate of return of 5% per year before expenses, which is not the fund’s actual return. The hypothetical account values and expenses may not be used to estimate the actual ending account balance or expenses you paid for the period. You may use this information to compare the ongoing costs of investing in the fund and other funds. To do so, compare this 5% hypothetical example with the 5% hypothetical examples that appear in the shareholder reports of the other funds.
Please note that the expenses shown in the table are meant to highlight the fund’s ongoing costs only and do not take into account the fees and expenses imposed under the variable contracts through which your investment in the fund is made. Therefore, the second line for each share class in the table is useful in comparing ongoing costs associated with an investment in vehicles (such as the fund) which fund benefits under variable annuity and variable life insurance contracts and to qualified pension and retirement plans only, and will not help you determine the relative total costs of investing in the fund through variable annuity and variable life insurance contracts. If the fees and expenses imposed under the variable contracts were included, your costs would have been higher.
| | | | | | | | | | | | | | | | | | |
| Share Class | | | | Annualized Expense Ratio | | | Beginning Account Value 7/01/18 | | | Ending Account Value 12/31/18 | | | Expenses Paid During Period (p)
7/01/18-12/31/18 | |
| Initial Class | | Actual | | | 0.91% | | | | $1,000.00 | | | | $899.93 | | | | $4.36 | |
| | Hypothetical (h) | | | 0.91% | | | | $1,000.00 | | | | $1,020.62 | | | | $4.63 | |
| Service Class | | Actual | | | 1.16% | | | | $1,000.00 | | | | $898.80 | | | | $5.55 | |
| | Hypothetical (h) | | | 1.16% | | | | $1,000.00 | | | | $1,019.36 | | | | $5.90 | |
| (h) | 5% class return per year before expenses. |
| (p) | “Expenses Paid During Period” are equal to each class’s annualized expense ratio, as shown above, multiplied by the average account value over the period, multiplied by 184/365 (to reflect theone-half year period). |
Notes to Expense Table
Changes to the fund’s fee arrangements occurred during the six month period. Had these fee changes been in effect throughout the entire six month period, the annualized expense ratios, the actual expenses paid during the period, and the hypothetical expenses paid during the period would have been approximately 0.88%, $4.21, and $4.48 for Initial Class and 1.13%, $5.41, and $5.75 for Service Class, respectively. For further information about the fund’s fee arrangements and changes to those fee arrangements, please see Note 3 in the Notes to Financial Statements.
6
MFS International Growth Portfolio
PORTFOLIO OF INVESTMENTS – 12/31/18
The Portfolio of Investments is a complete list of all securities owned by your fund. It is categorized by broad-based asset classes.
| | | | | | | | |
| | |
| Issuer | | Shares/Par | | | Value ($) | |
| COMMON STOCKS – 99.2% | | | | | | | | |
| Aerospace – 1.5% | | | | | | | | |
| Rolls-Royce Holdings PLC | | | 188,347 | | | $ | 1,992,556 | |
| | | | | | | | |
| Alcoholic Beverages – 5.8% | | | | | | | | |
| Ambev S.A., ADR | | | 159,272 | | | $ | 624,346 | |
| China Resources Beer Holdings Co. Ltd. | | | 288,000 | | | | 1,005,913 | |
| Diageo PLC | | | 79,058 | | | | 2,816,446 | |
| Pernod Ricard S.A. | | | 19,918 | | | | 3,270,256 | |
| | | | | | | | |
| | | | | | $ | 7,716,961 | |
| | | | | | | | |
| Apparel Manufacturers – 4.5% | | | | | | | | |
| Burberry Group PLC | | | 41,162 | | | $ | 910,532 | |
| Kering S.A. | | | 3,492 | | | | 1,646,794 | |
| LVMH Moet Hennessy Louis Vuitton SE | | | 11,532 | | | | 3,411,541 | |
| | | | | | | | |
| | | | | | $ | 5,968,867 | |
| | | | | | | | |
| Broadcasting – 1.4% | | | | | | | | |
| Publicis Groupe S.A. | | | 15,739 | | | $ | 903,090 | |
| WPP PLC | | | 90,409 | | | | 975,582 | |
| | | | | | | | |
| | | | | | $ | 1,878,672 | |
| | | | | | | | |
| Business Services – 5.8% | | | | | | | | |
| Accenture PLC, “A” | | | 13,096 | | | $ | 1,846,667 | |
| Brenntag AG | | | 21,696 | | | | 937,153 | |
| Compass Group PLC | | | 58,886 | | | | 1,238,425 | |
| Experian PLC | | | 78,128 | | | | 1,897,036 | |
| Infosys Technologies Ltd., ADR | | | 109,640 | | | | 1,043,773 | |
| Intertek Group PLC | | | 12,910 | | | | 789,844 | |
| | | | | | | | |
| | | | | | $ | 7,752,898 | |
| | | | | | | | |
| Computer Software – 3.9% | | | | | | | | |
| OBIC Co. Ltd. | | | 12,500 | | | $ | 956,635 | |
| SAP AG | | | 41,915 | | | | 4,174,735 | |
| | | | | | | | |
| | | | | | $ | 5,131,370 | |
| | | | | | | | |
| Computer Software – Systems – 3.4% | | | | | |
| Amadeus IT Group S.A. | | | 19,996 | | | $ | 1,393,869 | |
| Hitachi Ltd. | | | 63,000 | | | | 1,674,654 | |
| Luxoft Holding, Inc. (a) | | | 12,965 | | | | 394,395 | |
| NICE Systems Ltd., ADR (a) | | | 9,370 | | | | 1,013,928 | |
| | | | | | | | |
| | | | | | $ | 4,476,846 | |
| | | | | | | | |
| Construction – 0.7% | | | | | | | | |
| Toto Ltd. | | | 28,000 | | | $ | 962,490 | |
| | | | | | | | |
| Consumer Products – 5.9% | | | | | | | | |
| Kao Corp. | | | 20,500 | | | $ | 1,511,381 | |
| L’Oréal | | | 14,999 | | | | 3,457,642 | |
| Reckitt Benckiser Group PLC | | | 37,461 | | | | 2,871,074 | |
| | | | | | | | |
| | | | | | $ | 7,840,097 | |
| | | | | | | | |
| Consumer Services – 0.3% | | | | | | | | |
| 51job, Inc., ADR (a) | | | 6,168 | | | $ | 385,130 | |
| | | | | | | | |
| Containers – 1.0% | | | | | | | | |
| Brambles Ltd. | | | 184,980 | | | $ | 1,322,450 | |
| | | | | | | | |
| | | | | | | | |
| | |
| Issuer | | Shares/Par | | | Value ($) | |
| COMMON STOCKS – continued | | | | | |
| Electrical Equipment – 3.5% | | | | | | | | |
| Legrand S.A. | | | 10,896 | | | $ | 615,466 | |
| Mettler-Toledo International, Inc. (a) | | | 1,347 | | | | 761,836 | |
| Prysmian S.p.A. | | | 46,514 | | | | 901,901 | |
| Schneider Electric S.A. | | | 35,519 | | | | 2,430,358 | |
| | | | | | | | |
| | | | | | $ | 4,709,561 | |
| | | | | | | | |
| Electronics – 4.3% | | | | | | | | |
| MediaTek, Inc. | | | 88,000 | | | $ | 657,058 | |
| Mellanox Technologies Ltd. (a) | | | 9,668 | | | | 893,130 | |
| Taiwan Semiconductor Manufacturing Co. Ltd., ADR | | | 114,214 | | | | 4,215,639 | |
| | | | | | | | |
| | | | | | $ | 5,765,827 | |
| | | | | | | | |
| Energy – Independent – 1.2% | | | | | | | | |
| Caltex Australia Ltd. | | | 29,206 | | | $ | 524,155 | |
| Oil Search Ltd. | | | 219,787 | | | | 1,108,418 | |
| | | | | | | | |
| | | | | | $ | 1,632,573 | |
| | | | | | | | |
| Energy – Integrated – 0.5% | | | | | | | | |
| Suncor Energy, Inc. | | | 25,307 | | | $ | 706,824 | |
| | | | | | | | |
| Food & Beverages – 6.9% | | | | | | | | |
| Danone S.A. | | | 44,885 | | | $ | 3,163,273 | |
| Nestle S.A. | | | 74,170 | | | | 6,030,084 | |
| | | | | | | | |
| | | | | | $ | 9,193,357 | |
| | | | | | | | |
| Food & Drug Stores – 0.9% | | | | | | | | |
| Sundrug Co. Ltd. | | | 40,900 | | | $ | 1,216,591 | |
| | | | | | | | |
| Gaming & Lodging – 0.7% | | | | | | | | |
| Paddy Power Betfair PLC | | | 11,866 | | | $ | 967,962 | |
| | | | | | | | |
| Insurance – 3.3% | | | | | | | | |
| AIA Group Ltd. | | | 528,400 | | | $ | 4,386,182 | |
| | | | | | | | |
| Internet – 3.3% | | | | | | | | |
| Alibaba Group Holding Ltd., ADR (a) | | | 5,964 | | | $ | 817,485 | |
| Baidu, Inc., ADR (a) | | | 16,327 | | | | 2,589,462 | |
| NAVER Corp. (a) | | | 9,239 | | | | 1,006,661 | |
| | | | | | | | |
| | | | | | $ | 4,413,608 | |
| | | | | | | | |
| Leisure & Toys – 0.6% | | | | | | | | |
| BANDAI NAMCO Holdings, Inc. | | | 18,600 | | | $ | 829,875 | |
| | | | | | | | |
| Machinery & Tools – 1.8% | | | | | | | | |
| GEA Group AG | | | 43,460 | | | $ | 1,120,371 | |
| Ritchie Bros. Auctioneers, Inc. | | | 39,877 | | | | 1,304,503 | |
| | | | | | | | |
| | | | | | $ | 2,424,874 | |
| | | | | | | | |
| Major Banks – 1.4% | | | | | | | | |
| UBS AG | | | 146,210 | | | $ | 1,825,134 | |
| | | | | | | | |
| Medical & Health Technology & Services – 1.1% | |
| Fresenius Medical Care AG & Co. KGaA | | | 22,902 | | | $ | 1,486,231 | |
| | | | | | | | |
| Medical Equipment – 4.3% | | | | | | | | |
| EssilorLuxottica | | | 20,744 | | | $ | 2,625,113 | |
| QIAGEN N.V. (a) | | | 42,659 | | | | 1,450,655 | |
7
MFS International Growth Portfolio
Portfolio of Investments – continued
| | | | | | | | |
| | |
| Issuer | | Shares/Par | | | Value ($) | |
| COMMON STOCKS – continued | | | | | |
| Medical Equipment – continued | | | | | | | | |
| Terumo Corp. | | | 29,900 | | | $ | 1,679,765 | |
| | | | | | | | |
| | | | | | $ | 5,755,533 | |
| | | | | | | | |
| Metals & Mining – 0.3% | | | | | | | | |
| Grupo Mexico S.A.B. de C.V., “B” | | | 162,874 | | | $ | 335,167 | |
| | | | | | | | |
| Natural Gas – Distribution – 0.5% | | | | | | | | |
| China Resources Gas Group Ltd. | | | 158,000 | | | $ | 625,503 | |
| | | | | | | | |
| Other Banks & Diversified Financials – 7.4% | | | | | |
| Aeon Credit Service Co. Ltd. | | | 61,900 | | | $ | 1,111,957 | |
| Credicorp Ltd. | | | 4,231 | | | | 937,886 | |
| DBS Group Holdings Ltd. | | | 108,700 | | | | 1,889,360 | |
| Element Fleet Management Corp. | | | 72,884 | | | | 368,904 | |
| Grupo Financiero Banorte S.A. de C.V. | | | 234,975 | | | | 1,145,237 | |
| Grupo Financiero Inbursa S.A. de C.V. | | | 189,463 | | | | 272,745 | |
| HDFC Bank Ltd. | | | 95,216 | | | | 2,893,644 | |
| Julius Baer Group Ltd. | | | 25,220 | | | | 901,206 | |
| Komercni Banka A.S. | | | 10,451 | | | | 394,101 | |
| | | | | | | | |
| | | | | | $ | 9,915,040 | |
| | | | | | | | |
| Pharmaceuticals – 9.2% | | | | | | | | |
| Bayer AG | | | 35,040 | | | $ | 2,431,307 | |
| Novartis AG | | | 36,599 | | | | 3,134,645 | |
| Novo Nordisk A.S., “B” | | | 25,412 | | | | 1,168,131 | |
| Roche Holding AG | | | 22,268 | | | | 5,506,303 | |
| | | | | | | | |
| | | | | | $ | 12,240,386 | |
| | | | | | | | |
| Railroad & Shipping – 2.4% | | | | | | | | |
| Adani Ports and Special Economic Zone Ltd. | | | 51,738 | | | $ | 287,314 | |
| Canadian National Railway Co. | | | 38,427 | | | | 2,847,825 | |
| | | | | | | | |
| | | | | | $ | 3,135,139 | |
| | | | | | | | |
| Restaurants – 0.9% | | | | | | | | |
| Yum China Holdings, Inc. | | | 35,043 | | | $ | 1,174,992 | |
| | | | | | | | |
| Specialty Chemicals – 8.0% | | | | | | | | |
| Akzo Nobel N.V. | | | 29,058 | | | $ | 2,343,841 | |
| Croda International PLC | | | 21,384 | | | | 1,276,945 | |
| L’Air Liquide S.A. | | | 17,231 | | | | 2,141,065 | |
| Linde PLC | | | 18,343 | | | | 2,911,834 | |
| Sika AG | | | 6,529 | | | | 829,793 | |
| Symrise AG | | | 14,959 | | | | 1,105,483 | |
| | | | | | | | |
| | | | | | $ | 10,608,961 | |
| | | | | | | | |
| | | | | | | | |
| | |
| Issuer | | Shares/Par | | | Value ($) | |
| COMMON STOCKS – continued | | | | | |
| Specialty Stores – 0.2% | | | | | | | | |
| Just Eat PLC (a) | | | 29,256 | | | $ | 218,816 | |
| | | | | | | | |
| Telecommunications – Wireless – 0.3% | | | | | |
| SoftBank Corp. | | | 5,200 | | | $ | 342,757 | |
| | | | | | | | |
| Tobacco – 2.0% | | | | | | | | |
| ITC Ltd. | | | 316,826 | | | $ | 1,278,150 | |
| Japan Tobacco, Inc. | | | 60,600 | | | | 1,437,730 | |
| | | | | | | | |
| | | | | | $ | 2,715,880 | |
| | | | | | | | |
Total Common Stocks
(Identified Cost, $98,324,033) | | | | | | $ | 132,055,110 | |
| | | | | | | | |
| |
| INVESTMENT COMPANIES (h) – 0.3% | | | | | |
| Money Market Funds – 0.3% | | | | | | | | |
| MFS Institutional Money Market Portfolio, 2.4% (v) (Identified Cost, $468,227) | | | 468,274 | | | $ | 468,227 | |
| | | | | | | | |
OTHER ASSETS, LESS
LIABILITIES – 0.5% | | | | | | | 628,757 | |
| | | | | | | | |
| NET ASSETS – 100.0% | | | | | | $ | 133,152,094 | |
| | | | | | | | |
| (a) | | Non-income producing security. |
| (h) | | An affiliated issuer, which may be considered one in which the fund owns 5% or more of the outstanding voting securities, or a company which is under common control. At period end, the aggregate values of the fund’s investments in affiliated issuers and in unaffiliated issuers were $468,227 and $132,055,110, respectively. |
| (v) | | Affiliated issuer that is available only to investment companies managed by MFS. The rate quoted for the MFS Institutional Money Market Portfolio is the annualizedseven-day yield of the fund at period end. |
The following abbreviations are used in this report and are defined:
| ADR | | American Depositary Receipt |
| PLC | | Public Limited Company |
See Notes to Financial Statements
8
MFS International Growth Portfolio
FINANCIAL STATEMENTS | STATEMENT OF ASSETS AND LIABILITIES
This statement represents your fund’s balance sheet, which details the assets and liabilities comprising the total value of the fund.
| | | | |
At 12/31/18 | | | | |
| |
Assets | | | | |
Investments in unaffiliated issuers, at value (identified cost, $98,324,033) | | | $132,055,110 | |
Investments in affiliated issuers, at value (identified cost, $468,227) | | | 468,227 | |
Foreign currency, at value (identified cost, $12,525) | | | 12,623 | |
Receivables for | | | | |
Investments sold | | | 122,786 | |
Fund shares sold | | | 56,814 | |
Interest and dividends | | | 559,285 | |
Receivable from investment adviser | | | 9,013 | |
Other assets | | | 1,290 | |
Total assets | | | $133,285,148 | |
| |
Liabilities | | | | |
Payables for | | | | |
Investments purchased | | | $27,510 | |
Fund shares reacquired | | | 24,963 | |
Payable to affiliates | | | | |
Shareholder servicing costs | | | 45 | |
Distribution and/or service fees | | | 736 | |
Payable for independent Trustees’ compensation | | | 2 | |
Deferred country tax expense payable | | | 1,044 | |
Accrued expenses and other liabilities | | | 78,754 | |
Total liabilities | | | $133,054 | |
Net assets | | | $133,152,094 | |
| |
Net assets consist of | | | | |
Paid-in capital | | | $83,691,887 | |
Total distributable earnings (loss) | | | 49,460,207 | |
Net assets | | | $133,152,094 | |
Shares of beneficial interest outstanding | | | 10,442,727 | |
| | | | | | | | | | | | |
| | | |
| | | Net assets | | | Shares
outstanding | | | Net asset value
per share | |
Initial Class | | | $105,918,997 | | | | 8,290,481 | | | | $12.78 | |
Service Class | | | 27,233,097 | | | | 2,152,246 | | | | 12.65 | |
See Notes to Financial Statements
9
MFS International Growth Portfolio
FINANCIAL STATEMENTS | STATEMENT OF OPERATIONS
This statement describes how much your fund earned in investment income and accrued in expenses. It also describes any gains and/or losses generated by fund operations.
| | | | |
Year ended 12/31/18 | | | | |
| |
Net investment income (loss) | | | | |
Income | | | | |
Dividends | | | $3,224,788 | |
Non-cash dividends | | | 255,437 | |
Income on securities loaned | | | 22,411 | |
Dividends from affiliated issuers | | | 17,039 | |
Other | | | 720 | |
Foreign taxes withheld | | | (314,119 | ) |
Total investment income | | | $3,206,276 | |
Expenses | | | | |
Management fee | | | $1,358,138 | |
Distribution and/or service fees | | | 73,404 | |
Shareholder servicing costs | | | 5,138 | |
Administrative services fee | | | 31,766 | |
Independent Trustees’ compensation | | | 3,622 | |
Custodian fee | | | 71,397 | |
Shareholder communications | | | 10,312 | |
Audit and tax fees | | | 75,286 | |
Legal fees | | | 1,354 | |
Miscellaneous | | | 22,229 | |
Total expenses | | | $1,652,646 | |
Reduction of expenses by investment adviser | | | (115,366 | ) |
Net expenses | | | $1,537,280 | |
Net investment income (loss) | | | $1,668,996 | |
| |
Realized and unrealized gain (loss) | | | | |
Realized gain (loss) (identified cost basis) | | | | |
Unaffiliated issuers | | | $15,719,307 | |
Affiliated issuers | | | (202 | ) |
Foreign currency | | | (21,495 | ) |
Net realized gain (loss) | | | $15,697,610 | |
Change in unrealized appreciation or depreciation | | | | |
Unaffiliated issuers (net of $8,366 decrease in deferred country tax) | | | $(30,582,945 | ) |
Translation of assets and liabilities in foreign currencies | | | (1,554 | ) |
Net unrealized gain (loss) | | | $(30,584,499 | ) |
Net realized and unrealized gain (loss) | | | $(14,886,889 | ) |
Change in net assets from operations | | | $(13,217,893 | ) |
See Notes to Financial Statements
10
MFS International Growth Portfolio
FINANCIAL STATEMENTS | STATEMENTS OF CHANGES IN NET ASSETS
These statements describe the increases and/or decreases in net assets resulting from operations, any distributions, and any shareholder transactions.
| | | | | | | | |
| | | Year ended | |
| | | 12/31/18 | | | 12/31/17 | |
Change in net assets | | | | | | | | |
From operations | | | | | | | | |
Net investment income (loss) | | | $1,668,996 | | | | $1,451,186 | |
Net realized gain (loss) | | | 15,697,610 | | | | 13,256,650 | |
Net unrealized gain (loss) | | | (30,584,499 | ) | | | 29,774,389 | |
Change in net assets from operations | | | $(13,217,893 | ) | | | $44,482,225 | |
Total distributions to shareholders (a) | | | $(14,569,147 | ) | | | $(5,685,201 | ) |
Change in net assets from fund share transactions | | | $804,364 | | | | $(30,606,861 | ) |
Total change in net assets | | | $(26,982,676 | ) | | | $8,190,163 | |
Net assets | | | | | | | | |
At beginning of period | | | 160,134,770 | | | | 151,944,607 | |
At end of period (b) | | | $133,152,094 | | | | $160,134,770 | |
| (a) | Distributions from net investment income and from net realized gain are no longer required to be separately disclosed. See Note 2. For the year ended December 31, 2017, distributions from net investment income and from net realized gain were $2,027,014 and $3,658,187, respectively. |
| (b) | Parenthetical disclosure of undistributed net investment income is no longer required. See Note 2. For the year ended December 31, 2017, end of period net assets included undistributed net investment income of $1,447,800. |
See Notes to Financial Statements
11
MFS International Growth Portfolio
FINANCIAL STATEMENTS | FINANCIAL HIGHLIGHTS
The financial highlights table is intended to help you understand the fund’s financial performance for the past 5 years. Certain information reflects financial results for a single fund share. The total returns in the table represent the rate that an investor would have earned (or lost) on an investment in the fund share class (assuming reinvestment of all distributions) held for the entire period.
| | | | | | | | | | | | | | | | | | | | |
| Initial Class | | Year ended | |
| | | 12/31/18 | | | 12/31/17 | | | 12/31/16 | | | 12/31/15 | | | 12/31/14 | |
Net asset value, beginning of period | | | $15.50 | | | | $12.13 | | | | $12.57 | | | | $13.29 | | | | $14.77 | |
| Income (loss) from investment operations | | | | | | | | | | | | | | | | | | | | |
Net investment income (loss) (d) | | | $0.17 | | | | $0.14 | | | | $0.17 | (c) | | | $0.13 | | | | $0.21 | |
Net realized and unrealized gain (loss) | | | (1.38 | ) | | | 3.77 | | | | 0.19 | | | | (0.11 | )(g) | | | (0.90 | ) |
Total from investment operations | | | $(1.21 | ) | | | $3.91 | | | | $0.36 | | | | $0.02 | | | | $(0.69 | ) |
| Less distributions declared to shareholders | | | | | | | | | | | | | | | | | | | | |
From net investment income | | | $(0.16 | ) | | | $(0.20 | ) | | | $(0.15 | ) | | | $(0.22 | ) | | | $(0.13 | ) |
From net realized gain | | | (1.35 | ) | | | (0.34 | ) | | | (0.65 | ) | | | (0.52 | ) | | | (0.66 | ) |
Total distributions declared to shareholders | | | $(1.51 | ) | | | $(0.54 | ) | | | $(0.80 | ) | | | $(0.74 | ) | | | $(0.79 | ) |
Net asset value, end of period (x) | | | $12.78 | | | | $15.50 | | | | $12.13 | | | | $12.57 | | | | $13.29 | |
Total return (%) (k)(r)(s)(x) | | | (9.02 | ) | | | 32.64 | | | | 2.49 | (c) | | | 0.32 | | | | (4.98 | ) |
Ratios (%) (to average net assets)
and Supplemental data: | | | | | | | | | | | | | | | | | | | | |
Expenses before expense reductions (f) | | | 1.05 | | | | 1.05 | | | | 0.91 | (c) | | | 1.03 | | | | 1.02 | |
Expenses after expense reductions (f) | | | 0.97 | | | | 1.05 | | | | 0.91 | (c) | | | 1.03 | | | | 1.01 | |
Net investment income (loss) | | | 1.16 | | | | 0.96 | | | | 1.33 | (c) | | | 0.99 | | | | 1.44 | |
Portfolio turnover | | | 18 | | | | 10 | | | | 15 | | | | 22 | | | | 22 | |
Net assets at end of period (000 omitted) | | | $105,919 | | | | $130,591 | | | | $126,668 | | | | $138,482 | | | | $164,724 | |
| |
| Service Class | | Year ended | |
| | | 12/31/18 | | | 12/31/17 | | | 12/31/16 | | | 12/31/15 | | | 12/31/14 | |
Net asset value, beginning of period | | | $15.37 | | | | $12.03 | | | | $12.48 | | | | $13.19 | | | | $14.66 | |
| Income (loss) from investment operations | | | | | | | | | | | | | | | | | | | | |
Net investment income (loss) (d) | | | $0.13 | | | | $0.10 | | | | $0.13 | (c) | | | $0.10 | | | | $0.17 | |
Net realized and unrealized gain (loss) | | | (1.38 | ) | | | 3.74 | | | | 0.18 | | | | (0.11 | )(g) | | | (0.88 | ) |
Total from investment operations | | | $(1.25 | ) | | | $3.84 | | | | $0.31 | | | | $(0.01 | ) | | | $(0.71 | ) |
| Less distributions declared to shareholders | | | | | | | | | | | | | | | | | | | | |
From net investment income | | | $(0.12 | ) | | | $(0.16 | ) | | | $(0.11 | ) | | | $(0.18 | ) | | | $(0.10 | ) |
From net realized gain | | | (1.35 | ) | | | (0.34 | ) | | | (0.65 | ) | | | (0.52 | ) | | | (0.66 | ) |
Total distributions declared to shareholders | | | $(1.47 | ) | | | $(0.50 | ) | | | $(0.76 | ) | | | $(0.70 | ) | | | $(0.76 | ) |
Net asset value, end of period (x) | | | $12.65 | | | | $15.37 | | | | $12.03 | | | | $12.48 | | | | $13.19 | |
Total return (%) (k)(r)(s)(x) | | | (9.30 | ) | | | 32.35 | | | | 2.15 | (c) | | | 0.10 | | | | (5.19 | ) |
Ratios (%) (to average net assets)
and Supplemental data: | | | | | | | | | | | | | | | | | | | | |
Expenses before expense reductions (f) | | | 1.30 | | | | 1.30 | | | | 1.16 | (c) | | | 1.28 | | | | 1.27 | |
Expenses after expense reductions (f) | | | 1.22 | | | | 1.30 | | | | 1.16 | (c) | | | 1.28 | | | | 1.26 | |
Net investment income (loss) | | | 0.87 | | | | 0.70 | | | | 1.08 | (c) | | | 0.72 | | | | 1.19 | |
Portfolio turnover | | | 18 | | | | 10 | | | | 15 | | | | 22 | | | | 22 | |
Net assets at end of period (000 omitted) | | | $27,233 | | | | $29,544 | | | | $25,277 | | | | $26,144 | | | | $30,365 | |
See Notes to Financial Statements
12
MFS International Growth Portfolio
Financial Highlights – continued
| (c) | Amount reflects aone-time reimbursement of expenses by the custodian (or former custodian) without which net investment income and performance would be lower and expenses would be higher. |
| (d) | Per share data is based on average shares outstanding. |
| (f) | Ratios do not reflect reductions from fees paid indirectly, if applicable. |
| (g) | The per share amount varies from the net realized and unrealized gain/loss for the period because of the timing of sales of fund shares and the per share amount of realized and unrealized gains and losses at such time. |
| (k) | The total return does not reflect expenses that apply to separate accounts. Inclusion of these charges would reduce the total return figures for all periods shown. |
| (r) | Certain expenses have been reduced without which performance would have been lower. |
| (s) | From time to time the fund may receive proceeds from litigation settlements, without which performance would be lower. |
| (x) | The net asset values and total returns have been calculated on net assets which include adjustments made in accordance with U.S. generally accepted accounting principles required at period end for financial reporting purposes. |
See Notes to Financial Statements
13
MFS International Growth Portfolio
NOTES TO FINANCIAL STATEMENTS
| (1) | | Business and Organization |
MFS International Growth Portfolio (the fund) is a diversified series of MFS Variable Insurance Trust II (the trust). The trust is organized as a Massachusetts business trust and is registered under the Investment Company Act of 1940, as amended, as anopen-end management investment company. The shareholders of each series of the trust are separate accounts of insurance companies, which offer variable annuity and/or life insurance products, and qualified retirement and pension plans.
The fund is an investment company and accordingly follows the investment company accounting and reporting guidance of the Financial Accounting Standards Board (FASB) Accounting Standards Codification Topic 946 Financial Services – Investment Companies.
| (2) | | Significant Accounting Policies |
General – The preparation of financial statements in conformity with U.S. generally accepted accounting principles requires management to make estimates and assumptions that affect the reported amounts of assets and liabilities, and disclosure of contingent assets and liabilities at the date of the financial statements and the reported amounts of increases and decreases in net assets from operations during the reporting period. Actual results could differ from those estimates. In the preparation of these financial statements, management has evaluated subsequent events occurring after the date of the fund’s Statement of Assets and Liabilities through the date that the financial statements were issued. The fund invests in foreign securities, including securities of emerging market issuers. Investments in foreign securities are vulnerable to the effects of changes in the relative values of the local currency and the U.S. dollar and to the effects of changes in each country’s market, economic, industrial, political, regulatory, geopolitical, and other conditions. Investments in emerging markets can involve additional and greater risks than the risks associated with investments in developed foreign markets. Emerging markets can have less developed markets, greater custody and operational risk, less developed legal, regulatory, and accounting systems, and greater political, social, and economic instability than developed markets.
In August 2018, the FASB issued Accounting Standards Update2018-13, Fair Value Measurement (Topic 820) – Disclosure Framework – Changes to the Disclosure Requirements for Fair Value Measurement (“ASU2018-13”) which introduces new fair value disclosure requirements as well as eliminates and modifies certain existing fair value disclosure requirements. ASU2018-13 would be effective for fiscal years beginning after December 15, 2019, and interim periods within those fiscal years; however, management has elected to early adopt ASU2018-13 effective with the current reporting period. The impact of the fund’s adoption was limited to changes in the fund’s financial statement disclosures regarding fair value, primarily those disclosures related to transfers between levels of the fair value hierarchy.
In August 2018, the Securities and Exchange Commission (SEC) released its Final Rule on Disclosure Update and Simplification (the “Final Rule”) which is intended to simplify an issuer’s disclosure compliance efforts by removing redundant or outdated disclosure requirements without significantly altering the mix of information provided to investors. Effective with the current reporting period, the fund adopted the Final Rule with the impacts being that the fund is no longer required to present the components of distributable earnings on the Statement of Assets and Liabilities or the sources of distributions to shareholders and the amount of undistributed net investment income on the Statements of Changes in Net Assets.
Balance Sheet Offsetting – The fund’s accounting policy with respect to balance sheet offsetting is that, absent an event of default by the counterparty or a termination of the agreement, the International Swaps and Derivatives Association (ISDA) Master Agreement, or similar agreement, does not result in an offset of reported amounts of financial assets and financial liabilities in the Statement of Assets and Liabilities across transactions between the fund and the applicable counterparty. The fund’s right to setoff may be restricted or prohibited by the bankruptcy or insolvency laws of the particular jurisdiction to which a specific master netting agreement counterparty is subject. Balance sheet offsetting disclosures, to the extent applicable to the fund, have been included in the fund’s Significant Accounting Policies note under the captions for each of the fund’sin-scope financial instruments and transactions.
Investment Valuations – Equity securities, including restricted equity securities, are generally valued at the last sale or official closing price on their primary market or exchange as provided by a third-party pricing service. Equity securities, for which there were no sales reported that day, are generally valued at the last quoted daily bid quotation on their primary market or exchange as provided by a third-party pricing service. Short-term instruments with a maturity at issuance of 60 days or less may be valued at amortized cost, which approximates market value.Open-end investment companies are generally valued at net asset value per share. Securities and other assets generally valued on the basis of information from a third-party pricing service may also be valued at a broker/dealer bid quotation. In determining values, third-party pricing services can utilize both transaction data and market information such as yield, quality, coupon rate, maturity, type of issue, trading characteristics, and other market data. The values of foreign securities and other assets and liabilities expressed in foreign currencies are converted to U.S. dollars using the mean of bid and asked prices for rates provided by a third-party pricing service.
14
MFS International Growth Portfolio
Notes to Financial Statements – continued
The Board of Trustees has delegated primary responsibility for determining or causing to be determined the value of the fund’s investments (including any fair valuation) to the adviser pursuant to valuation policies and procedures approved by the Board. If the adviser determines that reliable market quotations are not readily available, investments are valued at fair value as determined in good faith by the adviser in accordance with such procedures under the oversight of the Board of Trustees. Under the fund’s valuation policies and procedures, market quotations are not considered to be readily available for most types of debt instruments and floating rate loans and many types of derivatives. These investments are generally valued at fair value based on information from third-party pricing services. In addition, investments may be valued at fair value if the adviser determines that an investment’s value has been materially affected by events occurring after the close of the exchange or market on which the investment is principally traded (such as foreign exchange or market) and prior to the determination of the fund’s net asset value, or after the halting of trading of a specific security where trading does not resume prior to the close of the exchange or market on which the security is principally traded. Events that occur on a frequent basis after foreign markets close (such as developments in foreign markets and significant movements in the U.S. markets) and prior to the determination of the fund’s net asset value may be deemed to have a material effect on the value of securities traded in foreign markets. Accordingly, the fund’s foreign equity securities may often be valued at fair value. The adviser generally relies on third-party pricing services or other information (such as the correlation with price movements of similar securities in the same or other markets; the type, cost and investment characteristics of the security; the business and financial condition of the issuer; and trading and other market data) to assist in determining whether to fair value and at what value to fair value an investment. The value of an investment for purposes of calculating the fund’s net asset value can differ depending on the source and method used to determine value. When fair valuation is used, the value of an investment used to determine the fund’s net asset value may differ from quoted or published prices for the same investment. There can be no assurance that the fund could obtain the fair value assigned to an investment if it were to sell the investment at the same time at which the fund determines its net asset value per share.
Various inputs are used in determining the value of the fund’s assets or liabilities. These inputs are categorized into three broad levels. In certain cases, the inputs used to measure fair value may fall into different levels of the fair value hierarchy. In such cases, an investment’s level within the fair value hierarchy is based on the lowest level of input that is significant to the fair value measurement. The fund’s assessment of the significance of a particular input to the fair value measurement in its entirety requires judgment, and considers factors specific to the investment. Level 1 includes unadjusted quoted prices in active markets for identical assets or liabilities. Level 2 includes other significant observable market-based inputs (including quoted prices for similar securities, interest rates, prepayment speed, and credit risk). Level 3 includes unobservable inputs, which may include the adviser’s own assumptions in determining the fair value of investments. The following is a summary of the levels used as of December 31, 2018 in valuing the fund’s assets or liabilities:
| | | | | | | | | | | | | | | | |
| Financial Instruments | | Level 1 | | | Level 2 | | | Level 3 | | | Total | |
| Equity Securities: | | | | | | | | | | | | | | | | |
France | | | $23,664,597 | | | | $— | | | | $— | | | | $23,664,597 | |
Switzerland | | | — | | | | 18,227,164 | | | | — | | | | 18,227,164 | |
United Kingdom | | | 14,987,257 | | | | — | | | | — | | | | 14,987,257 | |
Germany | | | 12,705,936 | | | | — | | | | — | | | | 12,705,936 | |
Japan | | | — | | | | 11,723,835 | | | | — | | | | 11,723,835 | |
United States | | | 6,807,863 | | | | — | | | | — | | | | 6,807,863 | |
China | | | 6,598,485 | | | | — | | | | — | | | | 6,598,485 | |
India | | | 5,502,881 | | | | — | | | | — | | | | 5,502,881 | |
Canada | | | 5,228,056 | | | | — | | | | — | | | | 5,228,056 | |
Other Countries | | | 23,532,343 | | | | 3,076,693 | | | | — | | | | 26,609,036 | |
| Mutual Funds | | | 468,227 | | | | — | | | | — | | | | 468,227 | |
| Total | | | $99,495,645 | | | | $33,027,692 | | | | $— | | | | $132,523,337 | |
For further information regarding security characteristics, see the Portfolio of Investments.
Foreign Currency Translation – Purchases and sales of foreign investments, income, and expenses are converted into U.S. dollars based upon currency exchange rates prevailing on the respective dates of such transactions or on the reporting date for foreign denominated receivables and payables. Gains and losses attributable to foreign currency exchange rates on sales of securities are recorded for financial statement purposes as net realized gains and losses on investments. Gains and losses attributable to foreign exchange rate movements on receivables, payables, income and expenses are recorded for financial statement purposes as foreign currency transaction gains and losses. That portion of both realized and unrealized gains and losses on investments that results from fluctuations in foreign currency exchange rates is not separately disclosed.
Security Loans – Under its Securities Lending Agency Agreement with the fund, State Street Bank and Trust Company, as lending agent, loans the securities of the fund to certain qualified institutions (the “Borrowers”) approved by the fund. Security loans can be terminated at the discretion of either the lending agent or the fund and the related securities must be returned within the earlier of
15
MFS International Growth Portfolio
Notes to Financial Statements – continued
the standard trade settlement period for such securities or within three business days. The loans are collateralized by cash and/or U.S. Treasury and federal agency obligations in an amount typically at least equal to the market value of the securities loaned. On loans collateralized by cash, the cash collateral is invested in a money market fund. The market value of the loaned securities is determined at the close of business of the fund and any additional required collateral is delivered to the fund on the next business day. The lending agent provides the fund with indemnification against Borrower default. In the event of Borrower default, the lending agent will, for the benefit of the fund, either purchase securities identical to those loaned or, when such purchase is commercially impracticable, pay the fund the market value of the loaned securities. In return, the lending agent assumes the fund’s rights to the related collateral. If the collateral value is less than the cost to purchase identical securities, the lending agent is responsible for the shortfall, but only to the extent that such shortfall is not due to a decline in collateral value resulting from collateral reinvestment for which the fund bears the risk of loss. A portion of the income generated upon investment of the collateral is remitted to the Borrowers, and the remainder is allocated between the fund and the lending agent. On loans collateralized by U.S. Treasury and/or federal agency obligations, a fee is received from the Borrower, and is allocated between the fund and the lending agent. Income from securities lending is separately reported in the Statement of Operations. The dividend and interest income earned on the securities loaned is accounted for in the same manner as other dividend and interest income. At December 31, 2018, there were no securities on loan or collateral outstanding.
Indemnifications – Under the fund’s organizational documents, its officers and Trustees may be indemnified against certain liabilities and expenses arising out of the performance of their duties to the fund. Additionally, in the normal course of business, the fund enters into agreements with service providers that may contain indemnification clauses. The fund’s maximum exposure under these agreements is unknown as this would involve future claims that may be made against the fund that have not yet occurred.
Investment Transactions and Income – Investment transactions are recorded on the trade date. Dividends received in cash are recorded on theex-dividend date. Certain dividends from foreign securities will be recorded when the fund is informed of the dividend if such information is obtained subsequent to theex-dividend date. Dividend payments received in additional securities are recorded on theex-dividend date in an amount equal to the value of the security on such date.
The fund may receive proceeds from litigation settlements. Any proceeds received from litigation involving portfolio holdings are reflected in the Statement of Operations in realized gain/loss if the security has been disposed of by the fund or in unrealized gain/loss if the security is still held by the fund. Any other proceeds from litigation not related to portfolio holdings are reflected as other income in the Statement of Operations.
Tax Matters and Distributions – The fund intends to qualify as a regulated investment company, as defined under Subchapter M of the Internal Revenue Code, and to distribute all of its taxable income, including realized capital gains. As a result, no provision for federal income tax is required. The fund’s federal tax returns, when filed, will remain subject to examination by the Internal Revenue Service for a three year period. Management has analyzed the fund’s tax positions taken on federal and state tax returns for all open tax years and does not believe that there are any uncertain tax positions that require recognition of a tax liability. Foreign taxes, if any, have been accrued by the fund in the accompanying financial statements in accordance with the applicable foreign tax law. Foreign income taxes may be withheld by certain countries in which the fund invests. Additionally, capital gains realized by the fund on securities issued in or by certain foreign countries may be subject to capital gains tax imposed by those countries.
Distributions to shareholders are recorded on theex-dividend date. Income and capital gain distributions are determined in accordance with income tax regulations, which may differ from U.S. generally accepted accounting principles. Certain capital accounts in the financial statements are periodically adjusted for permanent differences in order to reflect their tax character. These adjustments have no impact on net assets or net asset value per share. Temporary differences which arise from recognizing certain items of income, expense, gain or loss in different periods for financial statement and tax purposes will reverse at some time in the future. Distributions in excess of net investment income or net realized gains are temporary overdistributions for financial statement purposes resulting from differences in the recognition or classification of income or distributions for financial statement and tax purposes.
Book/tax differences primarily relate to wash sale loss deferrals.
The tax character of distributions declared to shareholders for the last two fiscal years is as follows:
| | | | | | | | |
| | | Year ended | | | Year ended | |
| | | 12/31/18 | | | 12/31/17 | |
| Ordinary income (including any short-term capital gains) | | | $2,194,070 | | | | $2,624,100 | |
| Long-term capital gains | | | 12,375,077 | | | | 3,061,101 | |
| Total distributions | | | $14,569,147 | | | | $5,685,201 | |
16
MFS International Growth Portfolio
Notes to Financial Statements – continued
The federal tax cost and the tax basis components of distributable earnings were as follows:
| | | | |
| As of 12/31/18 | | | | |
| |
| Cost of investments | | | $100,109,178 | |
| Gross appreciation | | | 39,556,776 | |
| Gross depreciation | | | (7,142,617 | ) |
| Net unrealized appreciation (depreciation) | | | $32,414,159 | |
| |
| Undistributed ordinary income | | | 1,866,096 | |
| Undistributed long-term capital gain | | | 15,187,168 | |
| Other temporary differences | | | (7,216 | ) |
Multiple Classes of Shares of Beneficial Interest – The fund offers multiple classes of shares, which differ in their respective distribution and/or service fees. The fund’s income, realized and unrealized gain (loss), and common expenses are allocated to shareholders based on the daily net assets of each class. Dividends are declared separately for each class. Differences in per share dividend rates are generally due to differences in separate class expenses. The fund’s distributions declared to shareholders as reported in the Statements of Changes in Net Assets are presented by class as follows:
| | | | | | | | | | | | | | | | |
| | | From net investment
income | | | From net realized
gain | |
| | | | |
| | | Year ended
12/31/18 | | | Year ended
12/31/17 | | | Year ended
12/31/18 | | | Year ended
12/31/17 | |
| Initial Class | | | $1,206,626 | | | | $1,717,623 | | | | $10,382,224 | | | | $3,003,332 | |
| Service Class | | | 248,418 | | | | 309,391 | | | | 2,731,879 | | | | 654,855 | |
| Total | | | $1,455,044 | | | | $2,027,014 | | | | $13,114,103 | | | | $3,658,187 | |
| (3) | | Transactions with Affiliates |
Investment Adviser – The fund has an investment advisory agreement with MFS to provide overall investment management and related administrative services and facilities to the fund. The management fee is computed daily and paid monthly at the following annual rates based on the fund’s average daily net assets:
| | | | |
| Up to $1 billion | | | 0.90% | |
| In excess of $1 billion and up to $2 billion | | | 0.80% | |
| In excess of $2 billion | | | 0.70% | |
MFS has agreed in writing to reduce its management fee by a specified amount if certain MFS mutual fund assets exceed thresholds agreed to by MFS and the fund’s Board of Trustees. For the year ended December 31, 2018, this management fee reduction amounted to $14,360, which is included in the reduction of total expenses in the Statement of Operations. The management fee incurred for the year ended December 31, 2018 was equivalent to an annual effective rate of 0.89% of the fund’s average daily net assets.
Effective August 1, 2018, the investment adviser has agreed in writing to pay a portion of the fund’s total annual operating expenses, excluding interest, taxes, extraordinary expenses, brokerage and transaction costs, and investment-related expenses, such that total annual operating expenses do not exceed 0.88% of average daily net assets for the Initial Class shares and 1.13% of average daily net assets for the Service Class shares. This written agreement will continue until modified by the fund’s Board of Trustees, but such agreement will continue at least until April 30, 2020. For the period August 1, 2018 through December 31, 2018, this reduction amounted to $101,006, which is included in the reduction of total expenses in the Statement of Operations.
Distributor – MFS Fund Distributors, Inc. (MFD), a wholly-owned subsidiary of MFS, is the distributor of shares of the fund. The Trustees have adopted a distribution plan for the Service Class shares pursuant to Rule12b-1 under the Investment Company Act of 1940.
The fund’s distribution plan provides that the fund will pay MFD distribution and/or service fees equal to 0.25% per annum of its average daily net assets attributable to Service Class shares as partial consideration for services performed and expenses incurred by MFD and financial intermediaries (including participating insurance companies that invest in the fund to fund variable annuity and variable life insurance contracts, sponsors of qualified retirement and pension plans that invest in the fund, and affiliates of these participating insurance companies and plan sponsors) in connection with the sale and distribution of the Service Class shares. MFD may subsequently pay all, or a portion, of the distribution and/or service fees to financial intermediaries.
Shareholder Servicing Agent – MFS Service Center, Inc. (MFSC), a wholly-owned subsidiary of MFS, receives a fee from the fund for its services as shareholder servicing agent. For the year ended December 31, 2018, the fee was $4,844, which equated to 0.0032% annually of the fund’s average daily net assets. MFSC also receives payment from the fund forout-of-pocket expenses paid by MFSC on behalf of the fund. For the year ended December 31, 2018, these costs amounted to $294.
17
MFS International Growth Portfolio
Notes to Financial Statements – continued
Administrator– MFS provides certain financial, legal, shareholder communications, compliance, and other administrative services to the fund. Under an administrative services agreement, the fund reimburses MFS the costs incurred to provide these services. The fund is charged an annual fixed amount of $17,500 plus a fee based on average daily net assets. The administrative services fee incurred for the year ended December 31, 2018 was equivalent to an annual effective rate of 0.0211% of the fund’s average daily net assets.
Trustees’ and Officers’ Compensation– The fund pays compensation to independent Trustees in the form of a retainer, attendance fees, and additional compensation to Board and Committee chairpersons. The fund does not pay compensation directly to Trustees or officers of the fund who are also officers of the investment adviser, all of whom receive remuneration for their services to the fund from MFS. Certain officers and Trustees of the fund are officers or directors of MFS, MFD, and MFSC.
Other– This fund and certain other funds managed by MFS (the funds) have entered into a service agreement (the ISO Agreement) which provides for payment of fees solely by the funds to Tarantino LLC in return for the provision of services of an Independent Senior Officer (ISO) for the funds. Frank L. Tarantino serves as the ISO and is an officer of the funds and the sole member of Tarantino LLC. The funds can terminate the ISO Agreement with Tarantino LLC at any time under the terms of the ISO Agreement. For the year ended December 31, 2018, the fee paid by the fund under this agreement was $257 and is included in “Miscellaneous” expense in the Statement of Operations. MFS has agreed to bear all expenses associated with office space, other administrative support, and supplies provided to the ISO.
The fund invests in the MFS Institutional Money Market Portfolio which is managed by MFS and seeks current income consistent with preservation of capital and liquidity. This money market fund does not pay a management fee to MFS.
The fund is permitted to engage in purchase and sale transactions with funds and accounts for which MFS serves as investment adviser orsub-adviser (“cross-trades”) pursuant to a policy adopted by the Board of Trustees. This policy has been designed to ensure that cross-trades conducted by the fund comply with Rule17a-7 under the Investment Company Act of 1940. During the year ended December 31, 2018, the fund engaged in purchase and sale transactions pursuant to this policy, which amounted to $246,886 and $59,782, respectively. The sales transactions resulted in net realized gains (losses) of $16,890.
For the year ended December 31, 2018, purchases and sales of investments, other than short-term obligations, aggregated $27,403,371 and $39,790,724, respectively.
| (5) | | Shares of Beneficial Interest |
The fund’s Declaration of Trust permits the Trustees to issue an unlimited number of full and fractional shares of beneficial interest. Transactions in fund shares were as follows:
| | | | | | | | | | | | | | | | |
| | | Year ended 12/31/18 | | | Year ended 12/31/17 | |
| | | Shares | | | Amount | | | Shares | | | Amount | |
| Shares sold | | | | | | | | | | | | | | | | |
Initial Class | | | 214,354 | | | | $3,094,484 | | | | 139,977 | | | | $1,972,502 | |
Service Class | | | 512,468 | | | | 7,721,161 | | | | 227,489 | | | | 3,210,047 | |
| | | 726,822 | | | | $10,815,645 | | | | 367,466 | | | | $5,182,549 | |
| Shares issued to shareholders in reinvestment of distributions | | | | | | | | | | | | | | | | |
Initial Class | | | 792,671 | | | | $11,588,850 | | | | 331,528 | | | | $4,720,955 | |
Service Class | | | 205,680 | | | | 2,980,297 | | | | 68,241 | | | | 964,246 | |
| | | 998,351 | | | | $14,569,147 | | | | 399,769 | | | | $5,685,201 | |
| Shares reacquired | | | | | | | | | | | | | | | | |
Initial Class | | | (1,142,698 | ) | | | $(17,486,023 | ) | | | (2,487,693 | ) | | | $(34,870,112 | ) |
Service Class | | | (488,312 | ) | | | (7,094,405 | ) | | | (473,779 | ) | | | (6,604,499 | ) |
| | | (1,631,010 | ) | | | $(24,580,428 | ) | | | (2,961,472 | ) | | | $(41,474,611 | ) |
| Net change | | | | | | | | | | | | | | | | |
Initial Class | | | (135,673 | ) | | | $(2,802,689 | ) | | | (2,016,188 | ) | | | $(28,176,655 | ) |
Service Class | | | 229,836 | | | | 3,607,053 | | | | (178,049 | ) | | | (2,430,206 | ) |
| | | 94,163 | | | | $804,364 | | | | (2,194,237 | ) | | | $(30,606,861 | ) |
The fund is one of several mutual funds in which certain MFS funds may invest. The MFS funds do not invest in the underlying funds for the purpose of exercising management or control. At the end of the period, the MFS Moderate Allocation Portfolio, the MFS Growth Allocation Portfolio, and the MFS Conservative Allocation Portfolio were the owners of record of approximately 31%, 13%, and 7%, respectively, of the value of outstanding voting shares of the fund.
18
MFS International Growth Portfolio
Notes to Financial Statements – continued
The fund and certain other funds managed by MFS participate in a $1.25 billion unsecured committed line of credit, subject to a $1 billion sublimit, provided by a syndication of banks under a credit agreement. Borrowings may be made for temporary financing needs. Interest is charged to each fund, based on its borrowings, generally at a rate equal to the higher of the Overnight Bank Funding rate or daily one month LIBOR plus an agreed upon spread. A commitment fee, based on the average daily, unused portion of the committed line of credit, is allocated among the participating funds. In addition, the fund and other funds managed by MFS have established unsecured uncommitted borrowing arrangements with certain banks for temporary financing needs. Interest is charged to each fund, based on its borrowings, at a rate equal to the Overnight Bank Funding rate plus an agreed upon spread. For the year ended December 31, 2018, the fund’s commitment fee and interest expense were $880 and $0, respectively, and are included in “Miscellaneous” expense in the Statement of Operations.
| (7) | | Investments in Affiliated Issuers |
An affiliated issuer may be considered one in which the fund owns 5% or more of the outstanding voting securities, or a company which is under common control. For the purposes of this report, the fund assumes the following to be affiliated issuers:
| | | | | | | | | | | | | | | | | | |
| Affiliated Issuers | | | | Beginning
Shares/Par
Amount | | | Acquisitions
Shares/Par
Amount | | | Dispositions
Shares/Par
Amount | | | Ending
Shares/Par
Amount | |
| | | | | |
| MFS Institutional Money Market Portfolio | | | | | 956,706 | | | | 24,059,576 | | | | (24,548,008 | ) | | | 468,274 | |
| | | | | |
| Affiliated Issuers | | Realized
Gain (Loss) | | Change in
Unrealized
Appreciation/
Depreciation | | | Capital Gain
Distributions | | | Dividend
Income | | | Ending
Value | |
| | | | | |
| MFS Institutional Money Market Portfolio | | $(202) | | | $— | | | | $— | | | | $17,039 | | | | $468,227 | |
19
MFS International Growth Portfolio
REPORT OF INDEPENDENT REGISTERED PUBLIC ACCOUNTING FIRM
To the Board of Trustees of MFS Variable Insurance Trust II and the Shareholders of MFS International Growth Portfolio:
Opinion on the Financial Statements and Financial Highlights
We have audited the accompanying statement of assets and liabilities of MFS International Growth Portfolio (the “Fund”), including the portfolio of investments, as of December 31, 2018, the related statement of operations for the year then ended, the statements of changes in net assets for each of the two years in the period then ended, the financial highlights for each of the five years in the period then ended, and the related notes. In our opinion, the financial statements and financial highlights present fairly, in all material respects, the financial position of the Fund as of December 31, 2018, and the results of its operations for the year then ended, the changes in its net assets for each of the two years in the period then ended, and the financial highlights for each of the five years in the period then ended, in conformity with accounting principles generally accepted in the United States of America.
Basis for Opinion
These financial statements and financial highlights are the responsibility of the Fund’s management. Our responsibility is to express an opinion on the Fund’s financial statements and financial highlights based on our audits. We are a public accounting firm registered with the Public Company Accounting Oversight Board (United States) (PCAOB) and are required to be independent with respect to the Fund in accordance with the U.S. federal securities laws and the applicable rules and regulations of the Securities and Exchange Commission and the PCAOB.
We conducted our audits in accordance with the standards of the PCAOB. Those standards require that we plan and perform the audit to obtain reasonable assurance about whether the financial statements and financial highlights are free of material misstatement, whether due to error or fraud. The Fund is not required to have, nor were we engaged to perform, an audit of its internal control over financial reporting. As part of our audits we are required to obtain an understanding of internal control over financial reporting but not for the purpose of expressing an opinion on the effectiveness of the Fund’s internal control over financial reporting. Accordingly, we express no such opinion.
Our audits included performing procedures to assess the risks of material misstatement of the financial statements and financial highlights, whether due to error or fraud, and performing procedures that respond to those risks. Such procedures included examining, on a test basis, evidence regarding the amounts and disclosures in the financial statements and financial highlights. Our audits also included evaluating the accounting principles used and significant estimates made by management, as well as evaluating the overall presentation of the financial statements and financial highlights. Our procedures included confirmation of securities owned as of December 31, 2018, by correspondence with the custodian and brokers; when replies were not received from brokers, we performed other auditing procedures. We believe that our audits provide a reasonable basis for our opinion.
DELOITTE & TOUCHE LLP
Boston, Massachusetts
February 15, 2019
We have served as the auditor of one or more of the MFS investment companies since 1924.
20
MFS International Growth Portfolio
TRUSTEES AND OFFICERS – IDENTIFICATION AND BACKGROUND
The Trustees and Officers of the Trust, as of February 1, 2019, are listed below, together with their principal occupations during the past five years. (Their titles may have varied during that period.) The address of each Trustee and Officer is 111 Huntington Avenue, Boston, Massachusetts 02199-7618.
| | | | | | | | | | |
Name, Age | | Position(s)
Held with Fund | | Trustee/Officer
Since (h) | | Number of MFS Funds overseen by the Trustee | | Principal Occupations
During the Past Five Years | | Other Directorships During the Past Five Years (j) |
| INTERESTED TRUSTEES |
Robert J. Manning (k) (age 55) | | Trustee | | February 2004 | | 135 | | Massachusetts Financial Services Company, Executive Chairman (since January 2017); Director; Chairman of the Board; Chief Executive Officer (until 2015);Co-Chief Executive Officer(2015-2016) | | N/A |
| | | | | |
Robin A. Stelmach (k) (age 57) | | Trustee | | January 2014 | | 135 | | Massachusetts Financial Services Company, Vice Chair (since January 2017); Chief Operating Officer and Executive Vice President (until January 2017) | | N/A |
|
| INDEPENDENT TRUSTEES |
John P. Kavanaugh (age 64) | | Trustee and Chair of Trustees | | January 2009 | | 135 | | Private investor | | N/A |
| | | | | |
Steven E. Buller (age 67) | | Trustee | | February 2014 | | 135 | | Financial Accounting Standards Advisory Council, Chairman(2014-2015); Public Company Accounting Oversight Board, Standing Advisory Group, Member (until 2014); BlackRock, Inc. (investment management), Managing Director (until 2014), BlackRock Finco UK (investment management), Director (until 2014) | | N/A |
| | | | | |
John A. Caroselli (age 64) | | Trustee | | March 2017 | | 135 | | JC Global Advisors, LLC (management consulting), President (since 2015); First Capital Corporation (commercial finance), Executive Vice President (until 2015) | | N/A |
| | | | | |
Maureen R. Goldfarb (age 63) | | Trustee | | January 2009 | | 135 | | Private investor | | N/A |
| | | | | |
Michael Hegarty (age 74) | | Trustee | | December 2004 | | 135 | | Private investor | | Rouse Properties Inc., Director (until 2016); Capmark Financial Group Inc., Director (until 2015) |
| | | | | |
Peter D. Jones (age 63) | | Trustee | | January 2019 | | 135 | | Franklin Templeton Distributors, Inc. (investment management), President (until 2015); Franklin Templeton Institutional, LLC (investment management), Chairman (until 2015) | | N/A |
| | | | | |
James W. Kilman, Jr. (age 57) | | Trustee | | January 2019 | | 135 | | KielStrand Capital LLC (family office and merchant bank), Chief Executive Officer (since 2016); Morgan Stanley & Co. (financial services), Vice Chairman of Investment Banking,Co-Head of Diversified Financials Coverage – Financial Institutions Investment Banking Group (until 2016) | | alpha-En Corporation, Director (since 2016) |
21
MFS International Growth Portfolio
Trustees and Officers – continued
| | | | | | | | | | |
Name, Age | | Position(s)
Held with Fund | | Trustee/Officer
Since (h) | | Number of MFS Funds overseen by the Trustee | | Principal Occupations
During the Past Five Years | | Other Directorships During the Past Five Years (j) |
Clarence Otis, Jr. (age 62) | | Trustee | | March 2017 | | 135 | | Darden Restaurants, Inc., Chief Executive Officer (until 2014) | | VF Corporation, Director; Verizon Communications, Inc., Director; The Travelers Companies, Director; Federal Reserve Bank of Atlanta, Director (until 2015) |
| | | | | |
Maryanne L. Roepke (age 62) | | Trustee | | May 2014 | | 135 | | American Century Investments (investment management), Senior Vice President and Chief Compliance Officer (until 2014) | | N/A |
| | | | | |
Laurie J. Thomsen
(age 61) | | Trustee | | March 2005 | | 135 | | Private investor | | The Travelers Companies, Director; Dycom Industries, Inc., Director (since 2015) |
| | | | | | | | |
Name, Age | | Position(s)
Held with Fund | | Trustee/Officer
Since (h) | | Number of MFS Funds for which the Person is an Officer | | Principal Occupations During the Past Five Years |
| OFFICERS | | | | | | |
Christopher R. Bohane (k)
(age 45) | | Assistant Secretary and Assistant Clerk | | July 2005 | | 135 | | Massachusetts Financial Services Company, Vice President and Assistant General Counsel |
| | | | |
Kino Clark (k) (age 50) | | Assistant Treasurer | | January 2012 | | 135 | | Massachusetts Financial Services Company, Vice President |
| | | | |
John W. Clark, Jr. (k) (age 51) | | Assistant Treasurer | | April 2017 | | 135 | | Massachusetts Financial Services Company, Vice President (since March 2017); Deutsche Bank (financial services), Department Head – Treasurer’s Office (until February 2017) |
| | | | |
Thomas H. Connors (k) (age 59) | | Assistant Secretary and Assistant Clerk | | September 2012 | | 135 | | Massachusetts Financial Services Company, Vice President and Senior Counsel |
| | | | |
Ethan D. Corey (k)
(age 55) | | Assistant
Secretary and Assistant Clerk | | July 2005 | | 135 | | Massachusetts Financial Services Company, Senior Vice President and Associate General Counsel |
| | | | |
David L. DiLorenzo (k)
(age 50) | | President | | July 2005 | | 135 | | Massachusetts Financial Services Company, Senior Vice President |
| | | | |
Heidi W. Hardin (k) (age 51) | | Secretary and Clerk | | April 2017 | | 135 | | Massachusetts Financial Services Company, Executive Vice President and General Counsel (since March 2017); Harris Associates (investment management), General Counsel (from September 2015 to January 2017); Janus Capital Management LLC (investment management), Senior Vice President and General Counsel (until September 2015) |
| | | | |
Brian E. Langenfeld (k) (age 45) | | Assistant
Secretary and Assistant Clerk | | June 2006 | | 135 | | Massachusetts Financial Services Company, Vice President and Senior Counsel |
| | | | |
Amanda S. Mooradian (k) (age 39) | | Assistant
Secretary and Assistant Clerk | | September 2018 | | 135 | | Massachusetts Financial Services Company, Assistant Vice President and Counsel |
| | | | |
Susan A. Pereira (k)
(age 48) | | Assistant
Secretary and Assistant Clerk | | July 2005 | | 135 | | Massachusetts Financial Services Company, Vice President and Senior Counsel |
| | | | |
Kasey L. Phillips (k) (age 48) | | Assistant Treasurer | | September 2012 | | 135 | | Massachusetts Financial Services Company, Vice President |
| | | | |
Matthew A. Stowe (k) (age 44) | | Assistant Secretary and Assistant Clerk | | October 2014 | | 135 | | Massachusetts Financial Services Company, Vice President and Assistant General Counsel |
22
MFS International Growth Portfolio
Trustees and Officers – continued
| | | | | | | | |
Name, Age | | Position(s)
Held with Fund | | Trustee/Officer
Since (h) | | Number of MFS Funds for which the Person is an Officer | | Principal Occupations During the Past Five Years |
Frank L. Tarantino
(age 74) | | Independent
Senior Officer | | June 2004 | | 135 | | Tarantino LLC (provider of compliance services), Principal |
| | | | |
Richard S. Weitzel (k)
(age 48) | | Assistant Secretary and Assistant Clerk | | October 2007 | | 135 | | Massachusetts Financial Services Company, Senior Vice President and Associate General Counsel |
| | | | |
Martin J. Wolin (k) (age 51) | | Chief Compliance Officer | | July 2015 | | 135 | | Massachusetts Financial Services Company, Senior Vice President and Chief Compliance Officer (since July 2015); Mercer (financial service provider), Chief Risk and Compliance Officer, North America and Latin America (until June 2015) |
| | | | |
James O. Yost (k)
(age 58) | | Treasurer | | September 1990 | | 135 | | Massachusetts Financial Services Company, Senior Vice President |
| (h) | Date first appointed to serve as Trustee/officer of an MFS Fund. Each Trustee has served continuously since appointment unless indicated otherwise. For the period from December 15, 2004 until February 22, 2005, Mr. Manning served as Advisory Trustee. From January 2012 through December 2016, Messrs. DiLorenzo and Yost served as Treasurer and Deputy Treasurer of the Funds, respectively. |
| (j) | Directorships or trusteeships of companies required to report to the Securities and Exchange Commission (i.e., “public companies”). |
| (k) | “Interested person” of the Trust within the meaning of the Investment Company Act of 1940 (referred to as the 1940 Act), which is the principal federal law governing investment companies like the fund, as a result of a position with MFS. The address of MFS is 111 Huntington Avenue, Boston, Massachusetts 02199-7618. |
Each Trustee has been elected by shareholders and each Trustee and officer holds office until his or her successor is chosen and qualified or until his or her earlier death, resignation, retirement or removal. The Trust does not hold annual meetings for the purpose of electing Trustees, and Trustees are not elected for fixed terms. Under the terms of the Board’s retirement policy, an Independent Trustee shall retire at the end of the calendar year in which he or she reaches the earlier of 75 years of age or 15 years of service on the Board (or, in the case of any Independent Trustee who joined the Board prior to 2015, 20 years of service on the Board).
Messrs. Buller, Hegarty, Kilman and Otis and Ms. Roepke are members of the Trust’s Audit Committee.
Each of the Interested Trustees and certain Officers hold comparable officer positions with certain affiliates of MFS.
The Statement of Additional Information for a Fund includes further information about the Trustees and is available without charge upon request by calling1-800-225-2606.
| | |
Investment Adviser Massachusetts Financial Services Company 111 Huntington Avenue Boston, MA 02199-7618 | | Custodian State Street Bank and Trust Company 1 Lincoln Street Boston, MA 02111-2900 |
Distributor MFS Fund Distributors, Inc. 111 Huntington Avenue Boston, MA 02199-7618 | | Independent Registered Public Accounting Firm Deloitte & Touche LLP 200 Berkeley Street Boston, MA 02116 |
Portfolio Manager(s) David Antonelli Matthew Barrett Kevin Dwan | | |
23
MFS International Growth Portfolio
BOARD REVIEW OF INVESTMENT ADVISORY AGREEMENT
The Investment Company Act of 1940 requires that both the full Board of Trustees and a majority of thenon-interested (“independent”) Trustees, voting separately, annually approve the continuation of the Fund’s investment advisory agreement with MFS. The Trustees consider matters bearing on the Fund and its advisory arrangements at their meetings throughout the year, including a review of performance data at each regular meeting. In addition, the independent Trustees met several times over the course of three months beginning in May and ending in July, 2018 (“contract review meetings”) for the specific purpose of considering whether to approve the continuation of the investment advisory agreement for the Fund and the other investment companies that the Board oversees (the “MFS Funds”). The independent Trustees were assisted in their evaluation of the Fund’s investment advisory agreement by independent legal counsel, from whom they received separate legal advice and with whom they met separately from MFS during various contract review meetings. The independent Trustees were also assisted in this process by the MFS Funds’ Independent Senior Officer, a senior officer appointed by and reporting to the independent Trustees.
In connection with their deliberations regarding the continuation of the investment advisory agreement, the Trustees, including the independent Trustees, considered such information and factors as they believed, in light of the legal advice furnished to them and their own business judgment, to be relevant. The investment advisory agreement for the Fund was considered separately, although the Trustees also took into account the common interests of all MFS Funds in their review. As described below, the Trustees considered the nature, quality, and extent of the various investment advisory, administrative, and shareholder services performed by MFS under the existing investment advisory agreement and other arrangements with the Fund.
In connection with their contract review meetings, the Trustees received and relied upon materials that included, among other items: (i) information provided by Broadridge Financial Solutions, Inc. (“Broadridge”), an independent third party, on the investment performance of the Fund for various time periods ended December 31, 2017 and the investment performance of a group of funds with substantially similar investment classifications/objectives (the “Broadridge performance universe”), (ii) information provided by Broadridge on the Fund’s advisory fees and other expenses and the advisory fees and other expenses of comparable funds identified by Broadridge (the “Broadridge expense group”), (iii) information provided by MFS on the advisory fees of portfolios of other clients of MFS, including institutional separate accounts and other clients, (iv) information as to whether and to what extent applicable expense waivers, reimbursements or fee “breakpoints” are observed for the Fund, (v) information regarding MFS’ financial results and financial condition, including MFS’ and certain of its affiliates’ estimated profitability from services performed for the Fund and the MFS Funds as a whole, and compared to MFS’ institutional business, (vi) MFS’ views regarding the outlook for the mutual fund industry and the strategic business plans of MFS, (vii) descriptions of various functions performed by MFS for the Funds, such as compliance monitoring and portfolio trading practices, and (viii) information regarding the overall organization of MFS, including information about MFS’ senior management and other personnel providing investment advisory, administrative and other services to the Fund and the other MFS Funds. The comparative performance, fee and expense information prepared and provided by Broadridge was not independently verified and the independent Trustees did not independently verify any information provided to them by MFS.
The Trustees’ conclusion as to the continuation of the investment advisory agreement was based on a comprehensive consideration of all information provided to the Trustees and not the result of any single factor. Some of the factors that figured particularly in the Trustees’ deliberations are described below, although individual Trustees may have evaluated the information presented differently from one another, giving different weights to various factors. It is also important to recognize that the fee arrangements for the Fund and other MFS Funds are the result of years of review and discussion between the independent Trustees and MFS, that certain aspects of such arrangements may receive greater scrutiny in some years than in others, and that the Trustees’ conclusions may be based, in part, on their consideration of these same arrangements during the course of the year and in prior years.
Based on information provided by Broadridge and MFS, the Trustees reviewed the Fund’s total return investment performance as well as the Broadridge performance universe over various time periods. The Trustees placed particular emphasis on the total return performance of the Fund’s Initial Class shares in comparison to the performance of funds in its Broadridge performance universe over the three-year period ended December 31, 2017, which the Trustees believed was a long enough period to reflect differing market conditions. The total return performance of the Fund’s Initial Class shares was in the 1st quintile relative to the other funds in the universe for this three-year period (the 1st quintile being the best performers and the 5th quintile being the worst performers). The total return performance of the Fund’s Initial Class shares was in the 1st quintile for each of theone- and five-year periods ended December 31, 2017 relative to the Broadridge performance universe. Because of the passage of time, these performance results may differ from the performance results for more recent periods, including those shown elsewhere in this report.
In the course of their deliberations, the Trustees took into account information provided by MFS in connection with the contract review meetings, as well as during investment review meetings conducted with portfolio management personnel during the course of the year regarding the Fund’s performance. After reviewing these and related factors, the Trustees concluded, within the context of their overall conclusions regarding the investment advisory agreement, that they were satisfied with MFS’ responses and efforts relating to investment performance.
24
MFS International Growth Portfolio
Board Review of Investment Advisory Agreement – continued
In assessing the reasonableness of the Fund’s advisory fee, the Trustees considered, among other information, the Fund’s advisory fee and the total expense ratio of the Fund’s Initial Class shares as a percentage of average daily net assets and the advisory fee and total expense ratios of peer groups of funds based on information provided by Broadridge. The Trustees considered that, according to the data provided by Broadridge (which takes into account any fee reductions or expense limitations that were in effect during the Fund’s last fiscal year), the Fund’s effective advisory fee rate and total expense ratio were each higher than the Broadridge expense group median. The Trustees also noted that MFS has agreed to implement an expense limitation for the Fund effective August 1, 2018, which may not be changed without the Trustee’s approval.
The Trustees also considered the advisory fees charged by MFS to any institutional separate accounts advised by MFS (“separate accounts”) and unaffiliated investment companies for which MFS serves as subadviser (“subadvised funds”) that have comparable investment strategies to the Fund, if any. In comparing these fees, the Trustees considered information provided by MFS as to the generally broader scope of services provided by MFS to the Fund, as well as the more extensive regulatory burdens imposed on MFS in managing the Fund, in comparison to separate accounts and subadvised funds. The Trustees also considered the higher demands placed on MFS’ investment personnel and trading infrastructure as a result of the daily cashin-flows andout-flows of the Fund in comparison to separate accounts.
The Trustees also considered whether the Fund may benefit from any economies of scale in the management of the Fund in the event of growth in assets of the Fund and/or growth in assets of the MFS Funds as a whole. They noted that the Fund’s advisory fee rate schedule is subject to contractual breakpoints that reduce the Fund’s advisory fee rate on average daily net assets over $1 billion and $2 billion. The Trustees also noted that MFS has agreed in writing to waive a portion of the management fees of certain MFS Funds, including the Fund, if the total combined assets of certain funds within the MFS Funds’ complex increase above agreed upon thresholds (the “group fee waiver”), enabling the Fund’s shareholders to share in the benefits from any economies of scale at the complex level. The group fee waiver is reviewed and renewed annually between the Board and MFS. The Trustees concluded that the breakpoints and the group fee waiver were sufficient to allow the Fund to benefit from economies of scale as its assets and overall complex assets grow.
The Trustees also considered information prepared by MFS relating to MFS’ costs and profits with respect to the Fund, the MFS Funds considered as a group, and other investment companies and accounts advised by MFS, as well as MFS’ methodologies used to determine and allocate its costs to the MFS Funds, the Fund and other accounts and products for purposes of estimating profitability.
After reviewing these and other factors described herein, the Trustees concluded, within the context of their overall conclusions regarding the investment advisory agreement, that the advisory fees charged to the Fund represent reasonable compensation in light of the services being provided by MFS to the Fund.
In addition, the Trustees considered MFS’ resources and related efforts to continue to retain, attract and motivate capable personnel to serve the Fund. The Trustees also considered current and developing conditions in the financial services industry, including the presence of large and well-capitalized companies which are spending, and appear to be prepared to continue to spend, substantial sums to engage personnel and to provide services to competing investment companies. In this regard, the Trustees also considered the financial resources of MFS and its ultimate parent, Sun Life Financial Inc. The Trustees also considered the advantages and possible disadvantages to the Fund of having an adviser that also serves other investment companies as well as other accounts.
The Trustees also considered the nature, quality, cost, and extent of administrative, transfer agency, and distribution services provided to the Fund by MFS and its affiliates under agreements and plans other than the investment advisory agreement, including any12b-1 fees the Fund pays to MFS Fund Distributors, Inc., an affiliate of MFS. The Trustees also considered the nature, extent and quality of certain other services MFS performs or arranges for on the Fund’s behalf, which may include securities lending programs, directed expense payment programs, class action recovery programs, and MFS’ interaction with third-party service providers, principally custodians andsub-custodians. The Trustees concluded that the variousnon-advisory services provided by MFS and its affiliates on behalf of the Fund were satisfactory.
The Trustees consideredso-called“fall-out benefits” to MFS such as reputational value derived from serving as investment manager to the MFS Funds. The Trustees also considered that, effective January 3, 2018, MFS had discontinued its historic practice of obtaining investment research from portfolio brokerage commissions paid by certain MFS Funds and would thereafter voluntarily reimburse a Fund, if applicable, for the costs of external research acquired through the use of the Fund’s portfolio brokerage commissions.
Based on their evaluation of factors that they deemed to be material, including those factors described above, the Board of Trustees, including the independent Trustees, concluded that the Fund’s investment advisory agreement with MFS should be continued for an additionalone-year period, commencing August 1, 2018.
25
MFS International Growth Portfolio
PROXY VOTING POLICIES AND INFORMATION
MFS votes proxies on behalf of the fund pursuant to proxy voting policies and procedures that are available without charge, upon request, by calling 1-800-225-2606, by visitingmfs.com/proxyvoting, or by visiting the SEC’s Web site athttp://www.sec.gov.
Information regarding how the fund voted proxies relating to portfolio securities during the most recent twelve-month period ended June 30 is available by August 31 of each year without charge by visitingmfs.com/proxyvoting, or by visiting the SEC’s Web site athttp://www.sec.gov.
QUARTERLY PORTFOLIO DISCLOSURE
The fund files a complete schedule of portfolio holdings with the SEC for the first and third quarters of each fiscal year on Form N-Q. The fund’s Form N-Q is available on the SEC’s website athttp://www.sec.gov.A shareholder can obtain the portfolio holdings report for the first and third quarters of the fund’s fiscal year atmfs.com/vit2 by choosing the fund’s name and then selecting the “Resources” tab and clicking on “Prospectus and Reports”.
FURTHER INFORMATION
From time to time, MFS may post important information about the fund or the MFS funds on the MFS web site (mfs.com). This information is available athttps://www.mfs.com/en-us/what-we-do/announcements.htmlor atmfs.com/vit2 by choosing the fund’s name.
INFORMATION ABOUT FUND CONTRACTS AND LEGAL CLAIMS
The fund has entered into contractual arrangements with an investment adviser, administrator, distributor, shareholder servicing agent, 529 program manager (if applicable), and custodian who each provide services to the fund. Unless expressly stated otherwise, shareholders are not parties to, or intended beneficiaries of these contractual arrangements, and these contractual arrangements are not intended to create any shareholder right to enforce them against the service providers or to seek any remedy under them against the service providers, either directly or on behalf of the fund.
Under the Trust’s By-Laws and Declaration of Trust, any claims asserted against or on behalf of the MFS Funds, including claims against Trustees and Officers, must be brought in state and federal courts located within the Commonwealth of Massachusetts.
FEDERAL TAX INFORMATION (unaudited)
The following information is provided pursuant to provisions of the Internal Revenue Code.
The fund designates $13,613,000 as capital gain dividends paid during the fiscal year.
Income derived from foreign sources was $3,194,813. The fund intends to pass through foreign tax credits of $270,188 for the fiscal year.
26
rev. 3/16
| | | | |
| | | |
| FACTS | | WHAT DOES MFS DO WITH YOUR
PERSONAL INFORMATION? | |  |
| | |
| Why? | | Financial companies choose how they share your personal information. Federal law gives consumers the right to limit some but not all sharing. Federal law also requires us to tell you how we collect, share, and protect your personal information. Please read this notice carefully to understand what we do. |
| | |
| What? | | The types of personal information we collect and share depend on the product or service you have with us. This information can include: • Social Security number and account balances • Account transactions and transaction history • Checking account information and wire transfer instructions When you areno longer our customer, we continue to share your information as described in this notice. |
| | |
| How? | | All financial companies need to share customers’ personal information to run their everyday business. In the section below, we list the reasons financial companies can share their customers’ personal information; the reasons MFS chooses to share; and whether you can limit this sharing. |
| | | | |
Reasons we can share your
personal information | | Does MFS share? | | Can you limit this
sharing? |
For our everyday business purposes – such as to process your transactions, maintain your account(s), respond to court orders and legal investigations, or report to credit bureaus | | Yes | | No |
For our marketing purposes – to offer our products and services to you | | No | | We don’t share |
| For joint marketing with other financial companies | | No | | We don’t share |
For our affiliates’ everyday business purposes – information about your transactions and experiences | | No | | We don’t share |
For our affiliates’ everyday business purposes – information about your creditworthiness | | No | | We don’t share |
| For nonaffiliates to market to you | | No | | We don’t share |
| | |
| | |
| Questions? | | Call800-225-2606 or go tomfs.com. |
27
| | |
| Who we are |
| Who is providing this notice? | | MFS Funds, MFS Investment Management, MFS Institutional Advisors, Inc., and MFS Heritage Trust Company. |
| | |
| What we do |
| How does MFS protect my personal information? | | To protect your personal information from unauthorized access and use, we use security measures that comply with federal law. These measures include procedural, electronic, and physical safeguards for the protection of the personal information we collect about you. |
How does MFS
collect my personal information? | | We collect your personal information, for example, when you • open an account or provide account information • direct us to buy securities or direct us to sell your securities • make a wire transfer We also collect your personal information from others, such as credit bureaus, affiliates, or other companies. |
| Why can’t I limit all sharing? | | Federal law gives you the right to limit only • sharing for affiliates’ everyday business purposes – information about your creditworthiness • affiliates from using your information to market to you • sharing for nonaffiliates to market to you State laws and individual companies may give you additional rights to limit sharing. |
| | |
| Definitions |
| Affiliates | | Companies related by common ownership or control. They can be financial and nonfinancial companies. • MFS does not share personal information with affiliates, except for everyday business purposes as described on page one of this notice. |
| Nonaffiliates | | Companies not related by common ownership or control. They can be financial and nonfinancial companies. • MFS does not share with nonaffiliates so they can market to you. |
| Joint marketing | | A formal agreement between nonaffiliated financial companies that together market financial products or services to you. • MFS doesn’t jointly market. |
| | |
| Other important information |
| If you own an MFS product or receive an MFS service in the name of a third party such as a bank or broker-dealer, their privacy policy may apply to you instead of ours. |
28
Annual Report
December 31, 2018

MFS® International Value Portfolio

MFS® Variable Insurance Trust II
Beginning on January 1, 2021, as permitted by regulations adopted by the U.S. Securities and Exchange Commission, the insurance company that offers your contract may determine that it will no longer send you paper copies of the fund’s annual and semiannual shareholder reports unless you specifically request paper copies from the insurance company or from your financial intermediary. Instead, the shareholder reports will be made available on a Web site (insurancefunds.mfs.com or other Web site of which you will be notified), and the insurance company will notify you by mail each time a report is posted and provide you with a Web site link to access the report. Instructions for requesting paper copies will be provided by your insurance company or financial intermediary.
If you already elected to receive shareholder reports by email, you will not be affected by this change and you need not take any action. If your insurance company or financial intermediary offers electronic delivery, you may elect to receive shareholder reports and other communications from the insurance company or financial intermediary by email by following the instructions provided by the insurance company or financial intermediary.
Beginning on January 1, 2019, you may elect to receive all future reports in paper free of charge from the insurance company or financial intermediary. You can inform the insurance company or financial intermediary that you wish to continue receiving paper copies of your shareholder reports by contacting your insurance company or financial intermediary. Your election to receive reports in paper will apply to all funds held in your account with your insurance company or financial intermediary.
FCG-ANN
MFS® International Value Portfolio
CONTENTS
The report is prepared for the general information of contract owners. It is authorized for distribution to prospective investors only when preceded or accompanied by a current prospectus.
NOT FDIC INSURED• MAY LOSE VALUE• NO BANK OR CREDIT UNION GUARANTEE• NOT A DEPOSIT• NOT INSURED BY ANY FEDERAL GOVERNMENT AGENCY OR NCUA/NCUSIF
MFS International Value Portfolio
LETTER FROM THE EXECUTIVE CHAIRMAN

Dear Contract Owners:
Higher interest rates, international trade friction, and geopolitical uncertainty surrounding issues such as Brexit have contributed to an uptick in market volatility in recent quarters — a departure from thelow-volatility environment that prevailed for much of the past several years. Against this more challenging backdrop, equity markets in the United States outperformed most international markets on a relative basis in 2018, though broad market returns were modestly negative on an absolute basis. Global economic growth has become less synchronized over the past few quarters, with Europe, China, and some emerging markets having shown signs of significantly slowing growth. While U.S. growth has remained above average, the pace of that growth slowed in the second half of 2018.
Slowing global growth and tighter financial conditions have clouded the outlook for U.S. monetary policy, with the chairman of the U.S. Federal Reserve acknowledging that policy rates are close to levels that the Fed deems neutral for the U.S. economy. This suggests that the predictable pattern of quarterly rate increases is behind us. At the same time, markets must contend with a shift from years of quantitative easing toward a cycle of quantitative tightening now that the European Central Bank has halted asset purchases. U.S. tax reforms adopted in late 2017 have been welcomed by equity markets while emerging market economies have recently had to contend with tighter financial conditions as a result of firmer U.S. interest rates and a stronger dollar. With the Republicans losing control of the U.S. House of Representatives, further meaningful U.S. fiscal stimulus appears less likely over the remainder of this presidential term. A partial U.S. government shutdown, beginning in late 2018, also added to political uncertainty. Globally, inflation remains largely subdued thanks in part to falling oil prices, but tight labor markets and moderate global demand have investors on the lookout for its potential reappearance. Increased U.S. protectionism is also a growing concern, as investors fear trade disputes could dampen business sentiment, leading to even slower global growth. While there has been progress on this front — a NAFTA replacement has been agreed upon between the U.S., Mexico, and Canada; the free trade pact with Korea has been updated; and a negotiating framework with the European Union has been agreed upon — tensions over trade with China remain quite high, though the two sides have recently returned to the negotiating table.
As a global investment manager with nearly a century of expertise, MFS® firmly believes active risk management offers downside mitigation and may help improve investment outcomes. We built our active investment platform with this belief in mind. Ourlong-term perspective influences nearly every aspect of our business, ensuring our investment decisions align with the investing time horizons of our clients.
Respectfully,

Robert J. Manning
Executive Chairman
MFS Investment Management
February 15, 2019
The opinions expressed in this letter are subject to change and may not be relied upon for investment advice. No forecasts can be guaranteed.
1
MFS International Value Portfolio
PORTFOLIO COMPOSITION
Portfolio structure
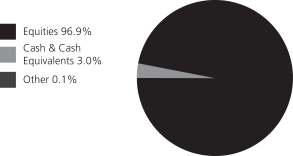
| | | | |
| Top ten holdings | | | | |
| Nestle S.A. | | | 4.6% | |
| Givaudan S.A. | | | 3.2% | |
| Henkel AG & Co. KGaA | | | 2.8% | |
| Pernod Ricard S.A. | | | 2.8% | |
| Cadence Design Systems, Inc. | | | 2.5% | |
| Diageo PLC | | | 2.5% | |
| Reckitt Benckiser Group PLC | | | 2.4% | |
| Kao Corp. | | | 2.3% | |
| Deutsche Wohnen SE | | | 2.3% | |
| Taiwan Semiconductor Manufacturing Co. Ltd., ADR | | | 2.2% | |
| |
| GICS equity sectors | | | | |
| Consumer Staples | | | 31.1% | |
| Information Technology | | | 21.4% | |
| Industrials | | | 17.6% | |
| Financials | | | 5.9% | |
| Materials | | | 5.6% | |
| Real Estate | | | 5.4% | |
| Health Care | | | 4.9% | |
| Consumer Discretionary | | | 3.2% | |
| Communication Services | | | 1.4% | |
| Energy | | | 0.4% | |
| | | | |
| Issuer country weightings (x) | | | | |
| Japan | | | 20.8% | |
| United Kingdom | | | 15.1% | |
| United States | | | 13.6% | |
| Germany | | | 13.1% | |
| Switzerland | | | 12.4% | |
| France | | | 11.5% | |
| Taiwan | | | 2.2% | |
| Spain | | | 2.2% | |
| Ireland | | | 1.7% | |
| Other Countries | | | 7.4% | |
| |
| Currency exposure weightings (y) | | | | |
| Euro | | | 31.0% | |
| United States Dollar | | | 18.3% | |
| Japanese Yen | | | 16.6% | |
| British Pound Sterling | | | 14.4% | |
| Swiss Franc | | | 12.4% | |
| Taiwan Dollar | | | 2.2% | |
| Canadian Dollar | | | 1.6% | |
| Swedish Krona | | | 1.0% | |
| Australian Dollar | | | 0.9% | |
| Other Currencies | | | 1.6% | |
| (x) | Represents the portfolio’s exposure to issuer countries as a percentage of a portfolio’s net assets. For purposes of this presentation, United States includes Cash & Cash Equivalents and Other. |
| (y) | Represents the portfolio’s exposure to a particular currency as a percentage of a portfolio’s net assets. For purposes of this presentation, United States Dollar includes Cash & Cash Equivalents and Other. |
Cash & Cash Equivalents includes any cash, investments in money market funds, short-term securities, and other assets less liabilities. Please see the Statement of Assets and Liabilities for additional information related to the fund’s cash position and other assets and liabilities.
Other includes equivalent exposure from currency derivatives and/or any offsets to derivative positions.
The Global Industry Classification Standard (GICS®) was developed by and/or is the exclusive property of MSCI, Inc. and S&P Global Market Intelligence Inc. (“S&P Global Market Intelligence”). GICS is a service mark of MSCI and S&P Global Market Intelligence and has been licensed for use by MFS.
Percentages are based on net assets as of December 31, 2018.
The portfolio is actively managed and current holdings may be different.
2
MFS International Value Portfolio
MANAGEMENT REVIEW
Summary of Results
For the twelve months ended December 31, 2018, Initial Class shares of the MFS International Value Portfolio (“fund”) provided a total return of –9.49%, while Service Class shares of the fund provided a total return of –9.72%. These compare with a return of –14.78% over the same period for the fund’s benchmark, the MSCI EAFE Value Index (net div).
Market Environment
During the reporting period, the US Federal Reserve raised interest rates by 100 basis points, bringing the total number of rate hikes to nine since the central bank began to normalize monetary policy in late 2015. Economic growth rates in the US, Eurozone and Japan remained above trend, despite a slowing in global growth, particularly toward the end of the period. Inflation remained contained, particularly outside the US. Late in the period, the European Central Bank halted its asset purchase program but issued forward guidance that it does not expect to raise interest rates at least until after the summer of 2019. The Bank of England (once) and the Bank of Canada (three times) each raised rates during the period. The European political backdrop became a bit more volatile, late in the period, spurred by concerns over cohesion in the eurozone after the election of an anti-establishment, Eurosceptic coalition government in Italy and widespread protests over stagnant wage growth in France.
Bond yields rose in the US during most of the period, but remained low by historical standards and slipped from their highs, late in the period, as market volatility increased. Yields in many developed markets fell. Outside of emerging markets, where spreads and currencies came under pressure, credit spreads remained quite tight until the end of the period, when thinner liquidity, lower oil prices and concerns over high degrees of corporate leverage emerged. Growing concern over increasing global trade friction appeared to have weighed on business sentiment during the period’s second half, especially outside the US. Tighter financial conditions from rising US rates and a strong dollar, combined with trade uncertainty, helped expose structural weaknesses in several emerging markets in the second half of the period.
Volatility increased, at the end of the period, amid signs of slowing global economic growth and increasing trade tensions, which prompted a market setback shortly after US markets set record highs in September. It was the second such equity market decline during the reporting period. The correction came despite a third consecutive quarter of strong growth in US earnings per share. Strong earnings growth, combined with the market decline, brought US equity valuations down from elevated levels, earlier in the period, to multiples more in line with long-term averages. While the US economy held up better than most, global economic growth became less synchronized during the period, with Europe and China showing signs of a slowdown and some emerging markets coming under stress.
Contributors to Performance
Security selection in both theconsumer staples andinformation technology sectors lifted performance relative to the MSCE EAFE Value Index. Within theconsumer staples sector, the fund’s holdings of household and industrial products manufacturer Kao (b) (Japan), wine and alcoholic beverage producer Pernod Ricard (b) (France), premium drinks distributer Diageo (b) (United Kingdom) and beverage manufacturer ITO EN (b) (Japan), as well as the fund’s overweight position in global food company Nestle (Switzerland), boosted relative results. The share price of Kao rose during the reporting period, as cost controls and strong sales in the company’s consumer product and beauty segments helped drive solid earnings results. Within theinformation technology sector, the fund’s holdings of integrated circuits and electronic devices developer Cadence Design Systems (b) aided relative returns as the stock price benefited from growth in both the company’s functional verification and semiconductor segments.
An underweight position in the poor-performingfinancials sector further benefited relative performance. There were no individual securities within this sector that were among the fund’s top relative contributors during the reporting period.
Elsewhere, the fund’s positions in flavors and fragrances company Givaudan (b) (Switzerland) and medical electronic equipment manufacturer Nihon Kohden (b) (Japan), and an overweight position in real estate company Deutsche Wohnen (Germany), also helped relative returns.
The fund’s cash and/or cash equivalents position during the period was also a contributor to relative performance. Under normal market conditions, the fund strives to be fully invested and generally holds cash to buy new holdings and to provide liquidity. In a period when equity markets declined, as measured by the fund’s benchmark, holding cash helped performance versus the benchmark, which has no cash position.
During the reporting period, the fund’s relative currency exposure, resulting primarily from differences between the fund’s and the benchmark’s exposures to holdings of securities denominated in foreign currencies, was a positive factor benefiting relative performance. All of MFS’ investment decisions are driven by the fundamentals of each individual opportunity and as such, it is common for our portfolios to have different currency exposures than the benchmark.
3
MFS International Value Portfolio
Management Review – continued
Detractors from Performance
An underweight position and security selection in both theenergy andhealth care sectors were factors that hurt performance relative to the MSCE EAFE Value Index. Within theenergy sector, not holding shares of global energy and petrochemicals company Royal Dutch Shell (United Kingdom) and integrated oil company Total (France) hurt relative returns. Although shares of Royal Dutch Shell traded lower over the reporting period due to higher corporate expenses and a pull back in global energy markets, the stock still outperformed the benchmark, which negatively impacted the fund’s relative performance. Within thehealth care sector, not holding pharmaceutical companies Novartis (Switzerland), GlaxoSmithKline (United Kingdom) and Sanofi (France), as well as holding shares of dental and oral health products manufacturer Dentsply Sirona (b), weighed on relative returns. Dentsply Sirona’s stock price declined over the reporting period, most notably in August, as the company reduced its full year outlook, took a large impairment charge and announced a restructuring program.
Not holding a position in theutilities sector also weakened relative results. There were no individual stocks within this sector that were among the fund’s top relative detractors during the reporting period.
Stocks in other sectors that dampened relative returns included holding shares of mechanical engineering firm GEA Group (b) (Germany), automation equipment manufacturer OMRON (b) (Japan), wiring devices and cable systems manufacturer Legrand (b) (France) and semiconductor and system solutions provider Infineon Technologies (b) (Germany).
Respectfully,
Portfolio Manager(s)
Pablo De La Mata and Benjamin Stone
| (b) | Security is not a benchmark constituent. |
The views expressed in this report are those of the portfolio manager(s) only through the end of the period of the report as stated on the cover and do not necessarily reflect the views of MFS or any other person in the MFS organization. These views are subject to change at any time based on market or other conditions, and MFS disclaims any responsibility to update such views. These views may not be relied upon as investment advice or an indication of trading intent on behalf of any MFS portfolio. References to specific securities are not recommendations of such securities, and may not be representative of any MFS portfolio’s current or future investments.
4
MFS International Value Portfolio
PERFORMANCE SUMMARY THROUGH 12/31/18
The following chart illustrates the historical performance of the fund in comparison to its benchmark(s). Benchmarks are unmanaged and may not be invested in directly. Benchmark returns do not reflect any fees or expenses. The performance of other share classes will be greater than or less than that of the class depicted below. (See Notes to Performance Summary.)
Performance data shown represents past performance and is no guarantee of future results. Investment return and principal value fluctuate so your units, when sold, may be worth more or less than the original cost; current performance may be lower or higher than quoted. The performance shown does not reflect the deduction of taxes, if any, that a contract holder would pay on fund distributions or the redemption of contract units. The returns for the fund shown also do not reflect the deduction of expenses associated with variable products, such as mortality and expense risk charges, separate account charges, and sales charges imposed by the insurance company separate accounts. Such expenses would reduce the overall returns shown.
Growth of a Hypothetical $10,000 Investment
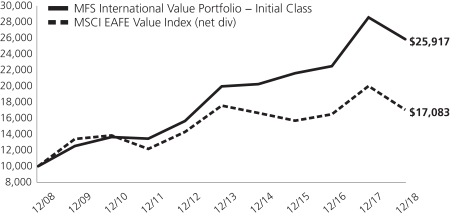
Total Returns through 12/31/18
Average annual total returns
| | | | | | | | | | | | |
| | | Share Class | | Class Inception Date | | 1-yr | | 5-yr | | 10-yr | | |
| | | Initial Class | | 10/02/95 | | (9.49)% | | 5.29% | | 9.99% | | |
| | | Service Class | | 8/24/01 | | (9.72)% | | 5.03% | | 9.72% | | |
| | | |
| Comparative benchmark(s) | | | | | | |
| | | MSCI EAFE Value Index (net div) (f) | | (14.78)% | | (0.61)% | | 5.50% | | |
| (f) | Source: FactSet Research Systems Inc. |
Benchmark Definition(s)
MSCI EAFE (Europe, Australasia, Far East) Value Index (net div) – a market capitalization-weighted index that is designed to measure equity market performance for value securities in the developed markets, excluding the U.S. and Canada.
It is not possible to invest directly in an index.
Notes to Performance Summary
Average annual total return represents the average annual change in value for each share class for the periods presented.
Performance results reflect any applicable expense subsidies and waivers in effect during the periods shown. Without such subsidies and waivers the fund’s performance results would be less favorable. Please see the prospectus and financial statements for complete details. All results are historical and assume the reinvestment of any dividends and capital gains distributions.
Performance results do not include adjustments made for financial reporting purposes in accordance with U.S. generally accepted accounting principles and may differ from amounts reported in the financial highlights.
From time to time the fund may receive proceeds from litigation settlements, without which performance would be lower.
5
MFS International Value Portfolio
EXPENSE TABLE
Fund Expenses Borne by the Contract Holders during the Period,
July 1, 2018 through December 31, 2018
As a contract holder of the fund, you incur ongoing costs, including management fees; distribution and/or service(12b-1) fees; and other fund expenses. This example is intended to help you understand your ongoing costs (in dollars) of investing in the fund and to compare these costs with the ongoing costs of investing in other mutual funds.
The example is based on an investment of $1,000 invested at the beginning of the period and held for the entire period July 1, 2018 through December 31, 2018.
Actual Expenses
The first line for each share class in the following table provides information about actual account values and actual expenses. You may use the information in this line, together with the amount you invested, to estimate the expenses that you paid over the period. Simply divide your account value by $1,000 (for example, an $8,600 account value divided by $1,000 = 8.6), then multiply the result by the number in the first line under the heading entitled “Expenses Paid During Period” to estimate the expenses you paid on your account during this period.
Hypothetical Example for Comparison Purposes
The second line for each share class in the following table provides information about hypothetical account values and hypothetical expenses based on the fund’s actual expense ratio and an assumed rate of return of 5% per year before expenses, which is not the fund’s actual return. The hypothetical account values and expenses may not be used to estimate the actual ending account balance or expenses you paid for the period. You may use this information to compare the ongoing costs of investing in the fund and other funds. To do so, compare this 5% hypothetical example with the 5% hypothetical examples that appear in the shareholder reports of the other funds.
Please note that the expenses shown in the table are meant to highlight the fund’s ongoing costs only and do not take into account the fees and expenses imposed under the variable contracts through which your investment in the fund is made. Therefore, the second line for each share class in the table is useful in comparing ongoing costs associated with an investment in vehicles (such as the fund) which fund benefits under variable annuity and variable life insurance contracts and to qualified pension and retirement plans only, and will not help you determine the relative total costs of investing in the fund through variable annuity and variable life insurance contracts. If the fees and expenses imposed under the variable contracts were included, your costs would have been higher.
| | | | | | | | | | | | | | | | | | |
| Share Class | | | | Annualized
Expense Ratio | | | Beginning
Account Value
7/01/18 | | | Ending Account Value
12/31/18 | | | Expenses Paid
During Period (p)
7/01/18-12/31/18 | |
| Initial Class | | Actual | | | 0.91% | | | | $1,000.00 | | | | $910.27 | | | | $4.38 | |
| | Hypothetical (h) | | | 0.91% | | | | $1,000.00 | | | | $1,020.62 | | | | $4.63 | |
| Service Class | | Actual | | | 1.15% | | | | $1,000.00 | | | | $909.31 | | | | $5.53 | |
| | Hypothetical (h) | | | 1.15% | | | | $1,000.00 | | | | $1,019.41 | | | | $5.85 | |
| (h) | 5% class return per year before expenses. |
| (p) | “Expenses Paid During Period” are equal to each class’s annualized expense ratio, as shown above, multiplied by the average account value over the period, multiplied by 184/365 (to reflect theone-half year period). |
6
MFS International Value Portfolio
PORTFOLIO OF INVESTMENTS – 12/31/18
The Portfolio of Investments is a complete list of all securities owned by your fund. It is categorized by broad-based asset classes.
| | | | | | | | |
| | |
| Issuer | | Shares/Par | | | Value ($) | |
| COMMON STOCKS – 94.1% | | | | | | | | |
| Airlines – 0.5% | | | | | | | | |
| Ryanair Holdings PLC (a) | | | 83,232 | | | $ | 5,937,771 | |
| | | | | | | | |
| Alcoholic Beverages – 6.8% | | | | | | | | |
| Diageo PLC | | | 784,763 | | | $ | 27,957,232 | |
| Heineken N.V. | | | 205,171 | | | | 18,147,759 | |
| Pernod Ricard S.A. | | | 193,607 | | | | 31,787,545 | |
| | | | | | | | |
| | | | | | $ | 77,892,536 | |
| | | | | | | | |
| Apparel Manufacturers – 0.9% | | | | | | | | |
| Compagnie Financiere Richemont S.A. | | | 108,875 | | | $ | 6,997,117 | |
| LVMH Moet Hennessy Louis Vuitton SE | | | 11,044 | | | | 3,267,175 | |
| | | | | | | | |
| | | | | | $ | 10,264,292 | |
| | | | | | | | |
| Automotive – 0.3% | | | | | | | | |
| USS Co. Ltd. | | | 178,000 | | | $ | 2,970,788 | |
| | | | | | | | |
| Brokerage & Asset Managers – 0.4% | | | | | |
| Daiwa Securities Group, Inc. | | | 480,300 | | | $ | 2,449,001 | |
| IG Group Holdings PLC | | | 257,441 | | | | 1,870,365 | |
| | | | | | | | |
| | | | | | $ | 4,319,366 | |
| | | | | | | | |
| Business Services – 9.8% | | | | | | | | |
| Brenntag AG | | | 145,890 | | | $ | 6,301,684 | |
| Bunzl PLC | | | 88,018 | | | | 2,657,727 | |
| Compass Group PLC | | | 1,069,753 | | | | 22,497,864 | |
| Experian PLC | | | 418,479 | | | | 10,161,141 | |
| Intertek Group PLC | | | 183,351 | | | | 11,217,559 | |
| Nomura Research Institute Ltd. | | | 283,100 | | | | 10,406,701 | |
| Rentokil Initial PLC | | | 610,000 | | | | 2,621,750 | |
| Secom Co. Ltd. | | | 185,200 | | | | 15,290,730 | |
| SGS S.A. | | | 6,973 | | | | 15,710,196 | |
| Sohgo Security Services Co. Ltd. | | | 120,900 | | | | 5,692,053 | |
| Thomson Reuters Corp. | | | 183,367 | | | | 8,855,396 | |
| | | | | | | | |
| | | | | | $ | 111,412,801 | |
| | | | | | | | |
| Chemicals – 3.2% | | | | | | | | |
| Givaudan S.A. | | | 15,910 | | | $ | 36,901,968 | |
| | | | | | | | |
| Computer Software – 7.5% | | | | | | | | |
| ANSYS, Inc. (a) | | | 105,042 | | | $ | 15,014,704 | |
| Cadence Design Systems, Inc. (a) | | | 654,979 | | | | 28,478,487 | |
| Check Point Software Technologies Ltd. (a) | | | 65,080 | | | | 6,680,462 | |
| Dassault Systems S.A. | | | 134,269 | | | | 15,953,069 | |
| OBIC Co. Ltd. | | | 142,700 | | | | 10,920,951 | |
| SAP AG | | | 73,726 | | | | 7,343,111 | |
| Wisetech Global Ltd. | | | 103,294 | | | | 1,229,561 | |
| | | | | | | | |
| | | | | | $ | 85,620,345 | |
| | | | | | | | |
| Computer Software – Systems – 2.3% | | | | | |
| Amadeus IT Group S.A. | | | 365,710 | | | $ | 25,492,697 | |
| Descartes Systems Group, Inc. (a) | | | 40,912 | | | | 1,079,739 | |
| | | | | | | | |
| | | | | | $ | 26,572,436 | |
| | | | | | | | |
| | | | | | | | |
| | |
| Issuer | | Shares/Par | | | Value ($) | |
| COMMON STOCKS – continued | |
| Construction – 0.4% | | | | | | | | |
| Geberit AG | | | 11,651 | | | $ | 4,539,210 | |
| | | | | | | | |
| Consumer Products – 9.5% | | | | | | | | |
| Colgate-Palmolive Co. | | | 400,646 | | | $ | 23,846,450 | |
| Kao Corp. | | | 363,100 | | | | 26,769,877 | |
| KOSE Corp. | | | 22,400 | | | | 3,552,507 | |
| L’Oréal | | | 86,996 | | | | 20,054,739 | |
| Reckitt Benckiser Group PLC | | | 361,254 | | | | 27,687,115 | |
| ROHTO Pharmaceutical Co. Ltd. | | | 259,200 | | | | 6,998,272 | |
| | | | | | | | |
| | | | | | $ | 108,908,960 | |
| | | | | | | | |
| Containers – 0.8% | | | | | | | | |
| Brambles Ltd. | | | 1,255,899 | | | $ | 8,978,612 | |
| | | | | | | | |
| Electrical Equipment – 5.9% | | | | | | | | |
| IMI PLC | | | 869,953 | | | $ | 10,467,467 | |
| Legrand S.A. | | | 298,004 | | | | 16,832,893 | |
| OMRON Corp. | | | 260,100 | | | | 9,374,810 | |
| Schneider Electric S.A. | | | 287,604 | | | | 19,679,065 | |
| Spectris PLC | | | 227,113 | | | | 6,597,208 | |
| Yokogawa Electric Corp. | | | 255,500 | | | | 4,382,508 | |
| | | | | | | | |
| | | | | | $ | 67,333,951 | |
| | | | | | | | |
| Electronics – 8.9% | | | | | | | | |
| Analog Devices, Inc. | | | 226,619 | | | $ | 19,450,709 | |
| DISCO Corp. | | | 15,400 | | | | 1,777,395 | |
| Halma PLC | | | 582,994 | | | | 10,135,666 | |
| Hirose Electric Co. Ltd. | | | 102,500 | | | | 10,144,286 | |
| Infineon Technologies AG | | | 682,575 | | | | 13,580,473 | |
| NVIDIA Corp. | | | 6,663 | | | | 889,510 | |
| Samsung Electronics Co. Ltd. | | | 240,455 | | | | 8,319,905 | |
| Taiwan Semiconductor Manufacturing Co. Ltd., ADR | | | 691,416 | | | | 25,520,165 | |
| Texas Instruments, Inc. | | | 118,771 | | | | 11,223,859 | |
| | | | | | | | |
| | | | | | $ | 101,041,968 | |
| | | | | | | | |
| Engineering – Construction – 0.2% | | | | | | | | |
| Wartsila Corp. | | | 135,671 | | | $ | 2,153,094 | |
| | | | | | | | |
| Food & Beverages – 10.7% | | | | | | | | |
| Chocoladefabriken Lindt & Sprungli AG | | | 179 | | | $ | 1,111,948 | |
| Danone S.A. | | | 336,246 | | | | 23,696,958 | |
| Ezaki Glico Co. Ltd. | | | 23,600 | | | | 1,192,023 | |
| ITO EN Ltd. | | | 328,400 | | | | 14,756,352 | |
| Kerry Group PLC | | | 137,369 | | | | 13,614,277 | |
| Nestle S.A. | | | 645,569 | | | | 52,485,307 | |
| Nissan Foods Holdings Co. Ltd. | | | 50,100 | | | | 3,143,879 | |
| Toyo Suisan Kaisha Ltd. | | | 361,300 | | | | 12,608,632 | |
| | | | | | | | |
| | | | | | $ | 122,609,376 | |
| | | | | | | | |
| Insurance – 1.8% | | | | | | | | |
| Fairfax Financial Holdings Ltd. | | | 17,959 | | | $ | 7,905,801 | |
| Hiscox Ltd. | | | 377,441 | | | | 7,798,408 | |
| Jardine Lloyd Thompson Group PLC | | | 189,914 | | | | 4,579,857 | |
| | | | | | | | |
| | | | | | $ | 20,284,066 | |
| | | | | | | | |
7
MFS International Value Portfolio
Portfolio of Investments – continued
| | | | | | | | |
| | |
| Issuer | | Shares/Par | | | Value ($) | |
| COMMON STOCKS – continued | |
| Machinery & Tools – 4.1% | | | | | | | | |
| GEA Group AG | | | 301,268 | | | $ | 7,766,498 | |
| Misumi Group, Inc. | | | 211,100 | | | | 4,405,627 | |
| Nordson Corp. | | | 90,816 | | | | 10,838,890 | |
| Schindler Holding AG | | | 23,545 | | | | 4,677,738 | |
| SMC Corp. | | | 22,700 | | | | 6,780,495 | |
| Spirax Sarco Engineering PLC | | | 157,710 | | | | 12,543,469 | |
| | | | | | | | |
| | | | | | $ | 47,012,717 | |
| | | | | | | | |
| Major Banks – 1.9% | | | | | | | | |
| Svenska Handelsbanken AB, “A” | | | 1,046,027 | | | $ | 11,587,568 | |
| UBS AG | | | 804,160 | | | | 10,038,298 | |
| | | | | | | | |
| | | | | | $ | 21,625,866 | |
| | | | | | | | |
| Medical Equipment – 2.5% | | | | | | | | |
| Dentsply Sirona, Inc. | | | 143,972 | | | $ | 5,357,198 | |
| Nihon Kohden Corp. | | | 374,600 | | | | 12,100,870 | |
| Terumo Corp. | | | 199,500 | | | | 11,207,796 | |
| | | | | | | | |
| | | | | | $ | 28,665,864 | |
| | | | | | | | |
| Oil Services – 0.4% | | | | | | | | |
| Core Laboratories N.V. | | | 67,631 | | | $ | 4,034,865 | |
| | | | | | | | |
| Other Banks & Diversified Financials – 1.8% | | | | | |
| Chiba Bank Ltd. | | | 527,100 | | | $ | 2,922,806 | |
| DnB NOR A.S.A. | | | 256,357 | | | | 4,111,951 | |
| Hachijuni Bank Ltd. | | | 517,200 | | | | 2,110,251 | |
| Julius Baer Group Ltd. | | | 73,227 | | | | 2,616,677 | |
| Jyske Bank A.S. | | | 65,521 | | | | 2,368,271 | |
| Mebuki Financial Group, Inc. | | | 868,600 | | | | 2,292,918 | |
| North Pacific Bank Ltd. | | | 773,700 | | | | 2,059,731 | |
| Sydbank A.S. | | | 86,878 | | | | 2,067,794 | |
| | | | | | | | |
| | | | | | $ | 20,550,399 | |
| | | | | | | | |
| Pharmaceuticals – 3.0% | | | | | | | | |
| Bayer AG | | | 71,349 | | | $ | 4,950,664 | |
| Kobayashi Pharmaceutical Co. Ltd. | | | 201,900 | | | | 13,827,339 | |
| Roche Holding AG | | | 10,528 | | | | 2,603,303 | |
| Santen Pharmaceutical Co. Ltd. | | | 875,900 | | | | 12,534,980 | |
| | | | | | | | |
| | | | | | $ | 33,916,286 | |
| | | | | | | | |
| Printing & Publishing – 0.7% | | | | | | | | |
| RELX Group PLC | | | 366,186 | | | $ | 7,539,448 | |
| | | | | | | | |
| | | | | | | | |
| | |
| Issuer | | Shares/Par | | | Value ($) | |
| COMMON STOCKS – continued | |
| Real Estate – 5.4% | | | | | | | | |
| Deutsche Wohnen SE | | | 561,760 | | | $ | 25,745,453 | |
| LEG Immobilien AG | | | 76,264 | | | | 7,962,016 | |
| TAG Immobilien AG | | | 291,735 | | | | 6,655,023 | |
| Vonovia SE | | | 464,380 | | | | 21,064,383 | |
| | | | | | | | |
| | | | | | $ | 61,426,875 | |
| | | | | | | | |
| Specialty Chemicals – 2.3% | | | | | | | | |
| Croda International PLC | | | 48,048 | | | $ | 2,869,186 | |
| Kansai Paint Co. Ltd. | | | 234,700 | | | | 4,504,396 | |
| Sika AG | | | 32,001 | | | | 4,067,116 | |
| Symrise AG | | | 205,415 | | | | 15,180,344 | |
| | | | | | | | |
| | | | | | $ | 26,621,042 | |
| | | | | | | | |
| Specialty Stores – 0.1% | | | | | | | | |
| Esprit Holdings Ltd. (a) | | | 3,717,120 | | | $ | 740,528 | |
| | | | | | | | |
| Telecommunications – Wireless – 1.4% | | | | | |
| KDDI Corp. | | | 658,600 | | | $ | 15,694,488 | |
| | | | | | | | |
| Tobacco – 0.6% | | | | | | | | |
| British American Tobacco PLC | | | 86,978 | | | $ | 2,771,554 | |
| Japan Tobacco, Inc. | | | 184,600 | | | | 4,379,619 | |
| | | | | | | | |
| | | | | | $ | 7,151,173 | |
| | | | | | | | |
Total Common Stocks
(Identified Cost, $950,445,537) | | | | | | $ | 1,072,721,091 | |
| | | | | | | | |
| | |
| PREFERRED STOCKS – 2.8% | | | | | | | | |
| Consumer Products – 2.8% | | | | | |
Henkel AG & Co. KGaA
(Identified Cost, $36,462,065) | | | 296,052 | | | $ | 32,359,821 | |
| | | | | | | | |
| |
| INVESTMENT COMPANIES (h) – 3.0% | | | | | |
| Money Market Funds – 3.0% | | | | | | | | |
| MFS Institutional Money Market Portfolio, 2.4% (v) (Identified Cost, $34,693,877) | | | 34,699,854 | | | $ | 34,696,385 | |
| | | | | | | | |
OTHER ASSETS, LESS
LIABILITIES – 0.1% | | | | | | | 744,738 | |
| | | | | | | | |
| NET ASSETS – 100.0% | | | | | | $ | 1,140,522,035 | |
| | | | | | | | |
| (a) | | Non-income producing security. |
| (h) | | An affiliated issuer, which may be considered one in which the fund owns 5% or more of the outstanding voting securities, or a company which is under common control. At period end, the aggregate values of the fund’s investments in affiliated issuers and in unaffiliated issuers were $34,696,385 and $1,105,080,912, respectively. |
| (v) | | Affiliated issuer that is available only to investment companies managed by MFS. The rate quoted for the MFS Institutional Money Market Portfolio is the annualizedseven-day yield of the fund at period end. |
The following abbreviations are used in this report and are defined:
| ADR | | American Depositary Receipt |
| PLC | | Public Limited Company |
Abbreviations indicate amounts shown in currencies other than the U.S. dollar. All amounts are stated in U.S. dollars unless otherwise indicated. A list of abbreviations is shown below:
8
MFS International Value Portfolio
Portfolio of Investments – continued
Derivative Contracts at 12/31/18
Forward Foreign Currency Exchange Contracts
| | | | | | | | | | | | | | | | | | | | |
| Currency Purchased | | Currency Sold | | Counterparty | | Settlement Date | | | Unrealized
Appreciation
(Depreciation) | |
| Asset Derivatives | | | | | | | | | | | | |
| JPY | | | 3,458,260,000 | | | | | USD | | 30,969,955 | | BNP Paribas S.A. | | | 2/22/2019 | | | | $696,903 | |
| USD | | | 3,580,098 | | | | | JPY | | 390,183,000 | | Citibank N.A. | | | 2/22/2019 | | | | 7,240 | |
| USD | | | 37,990,084 | | | | | JPY | | 4,135,866,500 | | Goldman Sachs International | | | 2/22/2019 | | | | 118,468 | |
| USD | | | 37,982,932 | | | | | JPY | | 4,135,866,500 | | State Street Bank Corp. | | | 2/22/2019 | | | | 111,316 | |
| | | | | | | | | | | | | | | | | | | | |
| | | | | | | | | | | | | | | | | | | $933,927 | |
| | | | | | | | | | | | | | | | | | | | |
See Notes to Financial Statements
9
MFS International Value Portfolio
FINANCIAL STATEMENTS | STATEMENT OF ASSETS AND LIABILITIES
This statement represents your fund’s balance sheet, which details the assets and liabilities comprising the total value of the fund.
| | | | |
At 12/31/18 | | | | |
| |
Assets | | | | |
Investments in unaffiliated issuers, at value (identified cost, $986,907,602) | | | $1,105,080,912 | |
Investments in affiliated issuers, at value (identified cost, $34,693,877) | | | 34,696,385 | |
Foreign currency, at value (identified cost, $26) | | | 26 | |
Receivables for | | | | |
Forward foreign currency exchange contracts | | | 933,927 | |
Investments sold | | | 1,617 | |
Fund shares sold | | | 448,518 | |
Interest and dividends | | | 3,398,688 | |
Other assets | | | 7,245 | |
Total assets | | | $1,144,567,318 | |
| |
Liabilities | | | | |
Payables for | | | | |
Fund shares reacquired | | | $3,677,350 | |
Payable to affiliates | | | | |
Investment adviser | | | 110,727 | |
Shareholder servicing costs | | | 249 | |
Distribution and/or service fees | | | 23,375 | |
Payable for independent Trustees’ compensation | | | 129 | |
Accrued expenses and other liabilities | | | 233,453 | |
Total liabilities | | | $4,045,283 | |
Net assets | | | $1,140,522,035 | |
| |
Net assets consist of | | | | |
Paid-in capital | | | $969,908,244 | |
Total distributable earnings (loss) | | | 170,613,791 | |
Net assets | | | $1,140,522,035 | |
Shares of beneficial interest outstanding | | | 46,176,524 | |
| | | | | | | | | | | | |
| | | |
| | | Net assets | | | Shares
outstanding | | | Net asset value
per share | |
Initial Class | | | $282,243,818 | | | | 11,282,418 | | | | $25.02 | |
Service Class | | | 858,278,217 | | | | 34,894,106 | | | | 24.60 | |
See Notes to Financial Statements
10
MFS International Value Portfolio
FINANCIAL STATEMENTS | STATEMENT OF OPERATIONS
This statement describes how much your fund earned in investment income and accrued in expenses. It also describes any gains and/or losses generated by fund operations.
| | | | |
| Year ended 12/31/18 | | | | |
| |
Net investment income (loss) | | | | |
Income | | | | |
Dividends | | | $42,016,698 | |
Dividends from affiliated issuers | | | 1,121,219 | |
Income on securities loaned | | | 269,445 | |
Other | | | 417 | |
Interest | | | 414 | |
Foreign taxes withheld | | | (3,729,694 | ) |
Total investment income | | | $39,678,499 | |
Expenses | | | | |
Management fee | | | $16,196,738 | |
Distribution and/or service fees | | | 3,986,359 | |
Shareholder servicing costs | | | 46,219 | |
Administrative services fee | | | 281,129 | |
Independent Trustees’ compensation | | | 32,693 | |
Custodian fee | | | 291,483 | |
Shareholder communications | | | 123,832 | |
Audit and tax fees | | | 61,093 | |
Legal fees | | | 18,866 | |
Miscellaneous | | | 59,578 | |
Total expenses | | | $21,097,990 | |
Reduction of expenses by investment adviser | | | (180,594 | ) |
Net expenses | | | $20,917,396 | |
Net investment income (loss) | | | $18,761,103 | |
| |
Realized and unrealized gain (loss) | | | | |
Realized gain (loss) (identified cost basis) | | | | |
Unaffiliated issuers | | | $328,046,604 | |
Affiliated issuers | | | 1,155 | |
Forward foreign currency exchange contracts | | | 3,648,333 | |
Foreign currency | | | (175,739 | ) |
Net realized gain (loss) | | | $331,520,353 | |
Change in unrealized appreciation or depreciation | | | | |
Unaffiliated issuers | | | $(516,742,275 | ) |
Affiliated issuers | | | 2,508 | |
Forward foreign currency exchange contracts | | | (2,388,452 | ) |
Translation of assets and liabilities in foreign currencies | | | (76,120 | ) |
Net unrealized gain (loss) | | | $(519,204,339 | ) |
Net realized and unrealized gain (loss) | | | $(187,683,986 | ) |
Change in net assets from operations | | | $(168,922,883 | ) |
See Notes to Financial Statements
11
MFS International Value Portfolio
FINANCIAL STATEMENTS | STATEMENTS OF CHANGES IN NET ASSETS
These statements describe the increases and/or decreases in net assets resulting from operations, any distributions, and any shareholder transactions.
| | | | | | | | |
| | | Year ended | |
| | | 12/31/18 | | | 12/31/17 | |
Change in net assets | | | | | | | | |
| | |
From operations | | | | | | | | |
Net investment income (loss) | | | $18,761,103 | | | | $16,554,284 | |
Net realized gain (loss) | | | 331,520,353 | | | | 31,084,074 | |
Net unrealized gain (loss) | | | (519,204,339 | ) | | | 371,334,590 | |
Change in net assets from operations | | | $(168,922,883 | ) | | | $418,972,948 | |
Total distributions to shareholders (a) | | | $(42,976,985 | ) | | | $(25,981,495 | ) |
Change in net assets from fund share transactions | | | $(693,239,677 | ) | | | $140,743,630 | |
Total change in net assets | | | $(905,139,545 | ) | | | $533,735,083 | |
| | |
Net assets | | | | | | | | |
At beginning of period | | | 2,045,661,580 | | | | 1,511,926,497 | |
At end of period (b) | | | $1,140,522,035 | | | | $2,045,661,580 | |
| (a) | Distributions from net investment income and from net realized gain are no longer required to be separately disclosed. See Note 2. For the year ended December 31, 2017, distributions from net investment income and from net realized gain were $24,251,192 and $1,730,303, respectively. |
| (b) | Parenthetical disclosure of undistributed net investment income is no longer required. See Note 2. For the year ended December 31, 2017, end of period net assets included undistributed net investment income of $16,090,375. |
See Notes to Financial Statements
12
MFS International Value Portfolio
FINANCIAL STATEMENTS | FINANCIAL HIGHLIGHTS
The financial highlights table is intended to help you understand the fund’s financial performance for the past 5 years. Certain information reflects financial results for a single fund share. The total returns in the table represent the rate that an investor would have earned (or lost) on an investment in the fund share class (assuming reinvestment of all distributions) held for the entire period.
| | | | | | | | | | | | | | | | | | | | |
| Initial Class | | Year ended | |
| | | | | |
| | | 12/31/18 | | | 12/31/17 | | | 12/31/16 | | | 12/31/15 | | | 12/31/14 | |
| | | | | |
Net asset value, beginning of period | | | $28.25 | | | | $22.57 | | | | $22.46 | | | | $21.73 | | | | $21.86 | |
| | | | | |
| Income (loss) from investment operations | | | | | | | | | | | | | | | | | | | | |
Net investment income (loss) (d) | | | $0.30 | | | | $0.29 | | | | $0.32 | (c) | | | $0.30 | | | | $0.57 | |
Net realized and unrealized gain (loss) | | | (2.91 | ) | | | 5.80 | | | | 0.64 | | | | 1.11 | | | | (0.27 | ) |
Total from investment operations | | | $(2.61 | ) | | | $6.09 | | | | $0.96 | | | | $1.41 | | | | $0.30 | |
| | | | | |
| Less distributions declared to shareholders | | | | | | | | | | | | | | | | | | | | |
From net investment income | | | $(0.31 | ) | | | $(0.39 | ) | | | $(0.32 | ) | | | $(0.45 | ) | | | $(0.43 | ) |
From net realized gain | | | (0.31 | ) | | | (0.02 | ) | | | (0.53 | ) | | | (0.23 | ) | | | — | |
Total distributions declared to shareholders | | | $(0.62 | ) | | | $(0.41 | ) | | | $(0.85 | ) | | | $(0.68 | ) | | | $(0.43 | ) |
Net asset value, end of period (x) | | | $25.02 | | | | $28.25 | | | | $22.57 | | | | $22.46 | | | | $21.73 | |
Total return (%) (k)(r)(s)(x) | | | (9.49 | ) | | | 27.14 | | | | 4.05 | (c) | | | 6.65 | | | | 1.34 | |
| | | | | |
Ratios (%) (to average net assets)
and Supplemental data: | | | | | | | | | | | | | | | | | | | | |
Expenses before expense reductions (f) | | | 0.91 | | | | 0.91 | | | | 0.91 | (c) | | | 0.93 | | | | 0.95 | |
Expenses after expense reductions (f) | | | 0.90 | | | | 0.90 | | | | 0.89 | (c) | | | 0.91 | | | | 0.94 | |
Net investment income (loss) | | | 1.08 | | | | 1.13 | | | | 1.41 | (c) | | | 1.33 | | | | 2.58 | |
Portfolio turnover | | | 16 | | | | 10 | | | | 17 | | | | 24 | | | | 22 | |
Net assets at end of period (000 omitted) | | | $282,244 | | | | $317,415 | | | | $238,192 | | | | $230,349 | | | | $218,258 | |
| |
| Service Class | | Year ended | |
| | | | | |
| | | 12/31/18 | | | 12/31/17 | | | 12/31/16 | | | 12/31/15 | | | 12/31/14 | |
| | | | | |
Net asset value, beginning of period | | | $27.80 | | | | $22.23 | | | | $22.13 | | | | $21.44 | | | | $21.58 | |
| | | | | |
| Income (loss) from investment operations | | | | | | | | | | | | | | | | | | | | |
Net investment income (loss) (d) | | | $0.27 | | | | $0.23 | | | | $0.26 | (c) | | | $0.25 | | | | $0.49 | |
Net realized and unrealized gain (loss) | | | (2.91 | ) | | | 5.70 | | | | 0.63 | | | | 1.07 | | | | (0.24 | ) |
Total from investment operations | | | $(2.64 | ) | | | $5.93 | | | | $0.89 | | | | $1.32 | | | | $0.25 | |
| | | | | |
| Less distributions declared to shareholders | | | | | | | | | | | | | | | | | | | | |
From net investment income | | | $(0.25 | ) | | | $(0.34 | ) | | | $(0.26 | ) | | | $(0.40 | ) | | | $(0.39 | ) |
From net realized gain | | | (0.31 | ) | | | (0.02 | ) | | | (0.53 | ) | | | (0.23 | ) | | | — | |
Total distributions declared to shareholders | | | $(0.56 | ) | | | $(0.36 | ) | | | $(0.79 | ) | | | $(0.63 | ) | | | $(0.39 | ) |
Net asset value, end of period (x) | | | $24.60 | | | | $27.80 | | | | $22.23 | | | | $22.13 | | | | $21.44 | |
Total return (%) (k)(r)(s)(x) | | | (9.72 | ) | | | 26.82 | | | | 3.84 | (c) | | | 6.32 | | | | 1.13 | |
| | | | | |
Ratios (%) (to average net assets)
and Supplemental data: | | | | | | | | | | | | | | | | | | | | |
Expenses before expense reductions (f) | | | 1.15 | | | | 1.16 | | | | 1.16 | (c) | | | 1.18 | | | | 1.20 | |
Expenses after expense reductions (f) | | | 1.14 | | | | 1.15 | | | | 1.14 | (c) | | | 1.16 | | | | 1.19 | |
Net investment income (loss) | | | 0.97 | | | | 0.89 | | | | 1.17 | (c) | | | 1.10 | | | | 2.25 | |
Portfolio turnover | | | 16 | | | | 10 | | | | 17 | | | | 24 | | | | 22 | |
Net assets at end of period (000 omitted) | | | $858,278 | | | | $1,728,247 | | | | $1,273,735 | | | | $1,124,133 | | | | $984,842 | |
See Notes to Financial Statements
13
MFS International Value Portfolio
Financial Highlights – continued
| (c) | Amount reflects aone-time reimbursement of expenses by the custodian (or former custodian) without which net investment income and performance would be lower and expenses would be higher. |
| (d) | Per share data is based on average shares outstanding. |
| (f) | Ratios do not reflect reductions from fees paid indirectly, if applicable. |
| (k) | The total return does not reflect expenses that apply to separate accounts. Inclusion of these charges would reduce the total return figures for all periods shown. |
| (r) | Certain expenses have been reduced without which performance would have been lower. |
| (s) | From time to time the fund may receive proceeds from litigation settlements, without which performance would be lower. |
| (x) | The net asset values and total returns have been calculated on net assets which include adjustments made in accordance with U.S. generally accepted accounting principles required at period end for financial reporting purposes. |
See Notes to Financial Statements
14
MFS International Value Portfolio
NOTES TO FINANCIAL STATEMENTS
| (1) | | Business and Organization |
MFS International Value Portfolio (the fund) is a diversified series of MFS Variable Insurance Trust II (the trust). The trust is organized as a Massachusetts business trust and is registered under the Investment Company Act of 1940, as amended, as anopen-end management investment company. The shareholders of each series of the trust are separate accounts of insurance companies, which offer variable annuity and/or life insurance products, and qualified retirement and pension plans.
The fund is an investment company and accordingly follows the investment company accounting and reporting guidance of the Financial Accounting Standards Board (FASB) Accounting Standards Codification Topic 946 Financial Services – Investment Companies.
| (2) | | Significant Accounting Policies |
General – The preparation of financial statements in conformity with U.S. generally accepted accounting principles requires management to make estimates and assumptions that affect the reported amounts of assets and liabilities, and disclosure of contingent assets and liabilities at the date of the financial statements and the reported amounts of increases and decreases in net assets from operations during the reporting period. Actual results could differ from those estimates. In the preparation of these financial statements, management has evaluated subsequent events occurring after the date of the fund’s Statement of Assets and Liabilities through the date that the financial statements were issued. The fund invests in foreign securities. Investments in foreign securities are vulnerable to the effects of changes in the relative values of the local currency and the U.S. dollar and to the effects of changes in each country’s market, economic, industrial, political, regulatory, geopolitical, and other conditions.
In August 2018, the FASB issued Accounting Standards Update2018-13, Fair Value Measurement (Topic 820) – Disclosure Framework – Changes to the Disclosure Requirements for Fair Value Measurement (“ASU2018-13”) which introduces new fair value disclosure requirements as well as eliminates and modifies certain existing fair value disclosure requirements.ASU 2018-13 would be effective for fiscal years beginning after December 15, 2019, and interim periods within those fiscal years; however, management has elected to early adopt ASU2018-13 effective with the current reporting period. The impact of the fund’s adoption was limited to changes in the fund’s financial statement disclosures regarding fair value, primarily those disclosures related to transfers between levels of the fair value hierarchy.
In August 2018, the Securities and Exchange Commission (SEC) released its Final Rule on Disclosure Update and Simplification (the “Final Rule”) which is intended to simplify an issuer’s disclosure compliance efforts by removing redundant or outdated disclosure requirements without significantly altering the mix of information provided to investors. Effective with the current reporting period, the fund adopted the Final Rule with the impacts being that the fund is no longer required to present the components of distributable earnings on the Statement of Assets and Liabilities or the sources of distributions to shareholders and the amount of undistributed net investment income on the Statements of Changes in Net Assets.
Balance Sheet Offsetting – The fund’s accounting policy with respect to balance sheet offsetting is that, absent an event of default by the counterparty or a termination of the agreement, the International Swaps and Derivatives Association (ISDA) Master Agreement, or similar agreement, does not result in an offset of reported amounts of financial assets and financial liabilities in the Statement of Assets and Liabilities across transactions between the fund and the applicable counterparty. The fund’s right to setoff may be restricted or prohibited by the bankruptcy or insolvency laws of the particular jurisdiction to which a specific master netting agreement counterparty is subject. Balance sheet offsetting disclosures, to the extent applicable to the fund, have been included in the fund’s Significant Accounting Policies note under the captions for each of the fund’sin-scope financial instruments and transactions.
Investment Valuations – Equity securities, including restricted equity securities, are generally valued at the last sale or official closing price on their primary market or exchange as provided by a third-party pricing service. Equity securities, for which there were no sales reported that day, are generally valued at the last quoted daily bid quotation on their primary market or exchange as provided by a third-party pricing service. Short-term instruments with a maturity at issuance of 60 days or less may be valued at amortized cost, which approximates market value. Forward foreign currency exchange contracts are generally valued at the mean of bid and asked prices for the time period interpolated from rates provided by a third-party pricing service for proximate time periods.Open-end investment companies are generally valued at net asset value per share. Securities and other assets generally valued on the basis of information from a third-party pricing service may also be valued at a broker/dealer bid quotation. In determining values, third-party pricing services can utilize both transaction data and market information such as yield, quality, coupon rate, maturity, type of issue, trading characteristics, and other market data. The values of foreign securities and other assets and liabilities expressed in foreign currencies are converted to U.S. dollars using the mean of bid and asked prices for rates provided by a third-party pricing service.
The Board of Trustees has delegated primary responsibility for determining or causing to be determined the value of the fund’s investments (including any fair valuation) to the adviser pursuant to valuation policies and procedures approved by the Board. If the adviser determines that reliable market quotations are not readily available, investments are valued at fair value as determined in
15
MFS International Value Portfolio
Notes to Financial Statements – continued
good faith by the adviser in accordance with such procedures under the oversight of the Board of Trustees. Under the fund’s valuation policies and procedures, market quotations are not considered to be readily available for most types of debt instruments and floating rate loans and many types of derivatives. These investments are generally valued at fair value based on information from third-party pricing services. In addition, investments may be valued at fair value if the adviser determines that an investment’s value has been materially affected by events occurring after the close of the exchange or market on which the investment is principally traded (such as foreign exchange or market) and prior to the determination of the fund’s net asset value, or after the halting of trading of a specific security where trading does not resume prior to the close of the exchange or market on which the security is principally traded. Events that occur on a frequent basis after foreign markets close (such as developments in foreign markets and significant movements in the U.S. markets) and prior to the determination of the fund’s net asset value may be deemed to have a material effect on the value of securities traded in foreign markets. Accordingly, the fund’s foreign equity securities may often be valued at fair value. The adviser generally relies on third-party pricing services or other information (such as the correlation with price movements of similar securities in the same or other markets; the type, cost and investment characteristics of the security; the business and financial condition of the issuer; and trading and other market data) to assist in determining whether to fair value and at what value to fair value an investment. The value of an investment for purposes of calculating the fund’s net asset value can differ depending on the source and method used to determine value. When fair valuation is used, the value of an investment used to determine the fund’s net asset value may differ from quoted or published prices for the same investment. There can be no assurance that the fund could obtain the fair value assigned to an investment if it were to sell the investment at the same time at which the fund determines its net asset value per share.
Various inputs are used in determining the value of the fund’s assets or liabilities. These inputs are categorized into three broad levels. In certain cases, the inputs used to measure fair value may fall into different levels of the fair value hierarchy. In such cases, an investment’s level within the fair value hierarchy is based on the lowest level of input that is significant to the fair value measurement. The fund’s assessment of the significance of a particular input to the fair value measurement in its entirety requires judgment, and considers factors specific to the investment. Level 1 includes unadjusted quoted prices in active markets for identical assets or liabilities. Level 2 includes other significant observable market-based inputs (including quoted prices for similar securities, interest rates, prepayment speed, and credit risk). Level 3 includes unobservable inputs, which may include the adviser’s own assumptions in determining the fair value of investments. Other financial instruments are derivative instruments, such as forward foreign currency exchange contracts. The following is a summary of the levels used as of December 31, 2018 in valuing the fund’s assets or liabilities:
| | | | | | | | | | | | | | | | |
| Financial Instruments | | Level 1 | | | Level 2 | | | Level 3 | | | Total | |
| Equity Securities: | | | | | | | | | | | | | | | | |
Japan | | | $14,756,352 | | | | $222,495,728 | | | | $— | | | | $237,252,080 | |
United Kingdom | | | 171,973,017 | | | | — | | | | — | | | | 171,973,017 | |
Germany | | | 148,909,471 | | | | — | | | | — | | | | 148,909,471 | |
Switzerland | | | — | | | | 141,748,879 | | | | — | | | | 141,748,879 | |
France | | | 131,271,443 | | | | — | | | | — | | | | 131,271,443 | |
United States | | | 119,134,672 | | | | — | | | | — | | | | 119,134,672 | |
Taiwan | | | 25,520,165 | | | | — | | | | — | | | | 25,520,165 | |
Spain | | | 25,492,697 | | | | — | | | | — | | | | 25,492,697 | |
Ireland | | | 19,552,048 | | | | — | | | | — | | | | 19,552,048 | |
Other Countries | | | 55,685,652 | | | | 28,540,788 | | | | — | | | | 84,226,440 | |
| Mutual Funds | | | 34,696,385 | | | | — | | | | — | | | | 34,696,385 | |
| Total | | | $746,991,902 | | | | $392,785,395 | | | | $— | | | | $1,139,777,297 | |
| | | | |
| Other Financial Instruments | | | | | | | | | | | | |
| Forward Foreign Currency | | | | | | | | | | | | | | | | |
| Exchange Contracts – Assets | | | $— | | | | $933,927 | | | | $— | | | | $933,927 | |
For further information regarding security characteristics, see the Portfolio of Investments.
Foreign Currency Translation– Purchases and sales of foreign investments, income, and expenses are converted into U.S. dollars based upon currency exchange rates prevailing on the respective dates of such transactions or on the reporting date for foreign denominated receivables and payables. Gains and losses attributable to foreign currency exchange rates on sales of securities are recorded for financial statement purposes as net realized gains and losses on investments. Gains and losses attributable to foreign exchange rate movements on receivables, payables, income and expenses are recorded for financial statement purposes as foreign currency transaction gains and losses. That portion of both realized and unrealized gains and losses on investments that results from fluctuations in foreign currency exchange rates is not separately disclosed.
16
MFS International Value Portfolio
Notes to Financial Statements – continued
Derivatives – The fund uses derivatives primarily to increase or decrease exposure to a particular market or segment of the market, or security, to increase or decrease interest rate or currency exposure, or as alternatives to direct investments. Derivatives are used for hedging ornon-hedging purposes. While hedging can reduce or eliminate losses, it can also reduce or eliminate gains. When the fund uses derivatives as an investment to increase market exposure, or for hedging purposes, gains and losses from derivative instruments may be substantially greater than the derivative’s original cost.
The derivative instruments used by the fund during the period were forward foreign currency exchange contracts. Depending on the type of derivative, the fund may exit a derivative position by entering into an offsetting transaction with a counterparty or exchange, negotiating an agreement with the derivative counterparty, or novating the position to a third party. The fund’s period end derivatives, as presented in the Portfolio of Investments and the associated Derivative Contract tables, generally are indicative of the volume of its derivative activity during the period.
The following table presents, by major type of derivative contract, the fair value, on a gross basis, of the asset and liability components of derivatives held by the fund at December 31, 2018 as reported in the Statement of Assets and Liabilities:
| | | | | | |
| | | | | Fair Value | |
| Risk | | Derivative Contracts | | Asset Derivatives | |
| Foreign Exchange | | Forward Foreign Currency Exchange Contracts | | | $933,927 | |
The following table presents, by major type of derivative contract, the realized gain (loss) on derivatives held by the fund for the year ended December 31, 2018 as reported in the Statement of Operations:
| | | | |
| Risk | | Forward Foreign
Currency
Exchange
Contracts | |
| Foreign Exchange | | | $3,648,333 | |
The following table presents, by major type of derivative contract, the change in unrealized appreciation or depreciation on derivatives held by the fund for the year ended December 31, 2018 as reported in the Statement of Operations:
| | | | |
| Risk | | Forward Foreign
Currency
Exchange
Contracts | |
| Foreign Exchange | | | $(2,388,452 | ) |
Derivative counterparty credit risk is managed through formal evaluation of the creditworthiness of all potential counterparties. On certain, but not all, uncleared derivatives, the fund attempts to reduce its exposure to counterparty credit risk whenever possible by entering into an ISDA Master Agreement on a bilateral basis. The ISDA Master Agreement gives each party to the agreement the right to terminate all transactions traded under such agreement if there is a specified deterioration in the credit quality of the other party. Upon an event of default or a termination of the ISDA Master Agreement, thenon-defaulting party has the right to close out all transactions traded under such agreement and to net amounts owed under each agreement to one net amount payable by one party to the other. This right to close out and net payments across all transactions traded under the ISDA Master Agreement could result in a reduction of the fund’s credit risk to such counterparty equal to any amounts payable by the fund under the applicable transactions, if any.
Collateral and margin requirements differ by type of derivative. For cleared derivatives (e.g., futures contracts, cleared swaps, and exchange-traded options), margin requirements are set by the clearing broker and the clearing house and collateral, in the form of cash or securities, is posted by the fund directly with the clearing broker. Collateral terms are counterparty agreement specific for uncleared derivatives (e.g., forward foreign currency exchange contracts, uncleared swap agreements, and uncleared options) and collateral, in the form of cash and securities, is held in segregated accounts with the fund’s custodian in connection with these agreements. For derivatives traded under an ISDA Master Agreement, which contains a collateral support annex, the collateral requirements are netted across all transactions traded under such counterparty-specific agreement and an amount is posted from one party to the other to collateralize such obligations. Cash that has been segregated or delivered to cover the fund’s collateral or margin obligations under derivative contracts, if any, will be reported separately in the Statement of Assets and Liabilities as restricted cash for uncleared derivatives and/or deposits with brokers for cleared derivatives. Securities pledged as collateral or margin for the same purpose, if any, are noted in the Portfolio of Investments. The fund may be required to make payments of interest on uncovered collateral or margin obligations with the broker. Any such payments are included in “Miscellaneous” expense in the Statement of Operations.
17
MFS International Value Portfolio
Notes to Financial Statements – continued
Forward Foreign Currency Exchange Contracts – The fund entered into forward foreign currency exchange contracts for the purchase or sale of a specific foreign currency at a fixed price on a future date. These contracts may be used to hedge the fund’s currency risk or fornon-hedging purposes. For hedging purposes, the fund may enter into contracts to deliver or receive foreign currency that the fund will receive from or use in its normal investment activities. The fund may also use contracts to hedge against declines in the value of foreign currency denominated securities due to unfavorable exchange rate movements. Fornon-hedging purposes, the fund may enter into contracts with the intent of changing the relative exposure of the fund’s portfolio of securities to different currencies to take advantage of anticipated exchange rate changes.
Forward foreign currency exchange contracts are adjusted by the daily exchange rate of the underlying currency and any unrealized gains or losses are recorded as a receivable or payable for forward foreign currency exchange contracts until the contract settlement date. On contract settlement date, any gain or loss on the contract is recorded as realized gains or losses on forward foreign currency exchange contracts.
Risks may arise upon entering into these contracts from unanticipated movements in the value of the contract and from the potential inability of counterparties to meet the terms of their contracts. Generally, the fund’s maximum risk due to counterparty credit risk is the unrealized gain on the contract due to the use of Continuous Linked Settlement, a multicurrency cash settlement system for the centralized settlement of foreign transactions. This risk is mitigated in cases where there is an ISDA Master Agreement between the fund and the counterparty providing for netting as described above and, where applicable, by the posting of collateral by the counterparty to the fund to cover the fund’s exposure to the counterparty under such ISDA Master Agreement.
Security Loans – Under its Securities Lending Agency Agreement with the fund, State Street Bank and Trust Company, as lending agent, loans the securities of the fund to certain qualified institutions (the “Borrowers”) approved by the fund. Security loans can be terminated at the discretion of either the lending agent or the fund and the related securities must be returned within the earlier of the standard trade settlement period for such securities or within three business days. The loans are collateralized by cash and/or U.S. Treasury and federal agency obligations in an amount typically at least equal to the market value of the securities loaned. On loans collateralized by cash, the cash collateral is invested in a money market fund. The market value of the loaned securities is determined at the close of business of the fund and any additional required collateral is delivered to the fund on the next business day. The lending agent provides the fund with indemnification against Borrower default. In the event of Borrower default, the lending agent will, for the benefit of the fund, either purchase securities identical to those loaned or, when such purchase is commercially impracticable, pay the fund the market value of the loaned securities. In return, the lending agent assumes the fund’s rights to the related collateral. If the collateral value is less than the cost to purchase identical securities, the lending agent is responsible for the shortfall, but only to the extent that such shortfall is not due to a decline in collateral value resulting from collateral reinvestment for which the fund bears the risk of loss. A portion of the income generated upon investment of the collateral is remitted to the Borrowers, and the remainder is allocated between the fund and the lending agent. On loans collateralized by U.S. Treasury and/or federal agency obligations, a fee is received from the Borrower, and is allocated between the fund and the lending agent. Income from securities lending is separately reported in the Statement of Operations. The dividend and interest income earned on the securities loaned is accounted for in the same manner as other dividend and interest income. At December 31, 2018, there were no securities on loan or collateral outstanding.
Indemnifications – Under the fund’s organizational documents, its officers and Trustees may be indemnified against certain liabilities and expenses arising out of the performance of their duties to the fund. Additionally, in the normal course of business, the fund enters into agreements with service providers that may contain indemnification clauses. The fund’s maximum exposure under these agreements is unknown as this would involve future claims that may be made against the fund that have not yet occurred.
Investment Transactions and Income – Investment transactions are recorded on the trade date. Interest income is recorded on the accrual basis. Dividends received in cash are recorded on theex-dividend date. Certain dividends from foreign securities will be recorded when the fund is informed of the dividend if such information is obtained subsequent to theex-dividend date. Dividend and interest payments received in additional securities are recorded on theex-dividend orex-interest date in an amount equal to the value of the security on such date.
The fund may receive proceeds from litigation settlements. Any proceeds received from litigation involving portfolio holdings are reflected in the Statement of Operations in realized gain/loss if the security has been disposed of by the fund or in unrealized gain/loss if the security is still held by the fund. Any other proceeds from litigation not related to portfolio holdings are reflected as other income in the Statement of Operations.
Tax Matters and Distributions – The fund intends to qualify as a regulated investment company, as defined under Subchapter M of the Internal Revenue Code, and to distribute all of its taxable income, including realized capital gains. As a result, no provision for federal income tax is required. The fund’s federal tax returns, when filed, will remain subject to examination by the Internal Revenue Service for a three year period. Management has analyzed the fund’s tax positions taken on federal and state tax returns for all open tax years and does not believe that there are any uncertain tax positions that require recognition of a tax liability. Foreign taxes, if
18
MFS International Value Portfolio
Notes to Financial Statements – continued
any, have been accrued by the fund in the accompanying financial statements in accordance with the applicable foreign tax law. Foreign income taxes may be withheld by certain countries in which the fund invests. Additionally, capital gains realized by the fund on securities issued in or by certain foreign countries may be subject to capital gains tax imposed by those countries.
Distributions to shareholders are recorded on theex-dividend date. Income and capital gain distributions are determined in accordance with income tax regulations, which may differ from U.S. generally accepted accounting principles. Certain capital accounts in the financial statements are periodically adjusted for permanent differences in order to reflect their tax character. These adjustments have no impact on net assets or net asset value per share. Temporary differences which arise from recognizing certain items of income, expense, gain or loss in different periods for financial statement and tax purposes will reverse at some time in the future. Distributions in excess of net investment income or net realized gains are temporary overdistributions for financial statement purposes resulting from differences in the recognition or classification of income or distributions for financial statement and tax purposes.
Book/tax differences primarily relate to wash sale loss deferrals, derivative transactions, and redemptionsin-kind.
The tax character of distributions declared to shareholders for the last two fiscal years is as follows:
| | | | | | | | |
| | | Year ended | | | Year ended | |
| | | 12/31/18 | | | 12/31/17 | |
| Ordinary income (including any short-term capital gains) | | | $19,511,316 | | | | $25,981,495 | |
| Long-term capital gains | | | 23,465,669 | | | | — | |
| Total distributions | | | $42,976,985 | | | | $25,981,495 | |
The federal tax cost and the tax basis components of distributable earnings were as follows:
| | | | |
| As of 12/31/18 | | | | |
| |
| Cost of investments | | | $1,028,940,198 | |
| Gross appreciation | | | 182,966,391 | |
| Gross depreciation | | | (71,195,365 | ) |
| Net unrealized appreciation (depreciation) | | | $111,771,026 | |
| |
| Undistributed ordinary income | | | 21,215,624 | |
| Undistributed long-term capital gain | | | 37,691,707 | |
| Other temporary differences | | | (64,566 | ) |
Multiple Classes of Shares of Beneficial Interest – The fund offers multiple classes of shares, which differ in their respective distribution and/or service fees. The fund’s income, realized and unrealized gain (loss), and common expenses are allocated to shareholders based on the daily net assets of each class. Dividends are declared separately for each class. Differences in per share dividend rates are generally due to differences in separate class expenses. The fund’s distributions declared to shareholders as reported in the Statements of Changes in Net Assets are presented by class as follows:
| | | | | | | | | | | | | | | | |
| | | From net investment
income | | | From net realized
gain | |
| | | | |
| | | Year ended
12/31/18 | | | Year ended
12/31/17 | | | Year ended
12/31/18 | | | Year ended
12/31/17 | |
| Initial Class | | | $3,352,328 | | | | $4,007,935 | | | | $3,375,683 | | | | $254,388 | |
| Service Class | | | 16,158,988 | | | | 20,243,257 | | | | 20,089,986 | | | | 1,475,915 | |
| Total | | | $19,511,316 | | | | $24,251,192 | | | | $23,465,669 | | | | $1,730,303 | |
| (3) | | Transactions with Affiliates |
Investment Adviser – The fund has an investment advisory agreement with MFS to provide overall investment management and related administrative services and facilities to the fund. The management fee is computed daily and paid monthly at the following annual rates based on the fund’s average daily net assets:
| | | | |
| Up to $1 billion | | | 0.90% | |
| In excess of $1 billion and up to $2 billion | | | 0.80% | |
| In excess of $2 billion | | | 0.70% | |
MFS has agreed in writing to reduce its management fee by a specified amount if certain MFS mutual fund assets exceed thresholds agreed to by MFS and the fund’s Board of Trustees. For the year ended December 31, 2018, this management fee reduction amounted to $180,594, which is included in the reduction of total expenses in the Statement of Operations. The management fee incurred for the year ended December 31, 2018 was equivalent to an annual effective rate of 0.84% of the fund’s average daily net assets.
19
MFS International Value Portfolio
Notes to Financial Statements – continued
The investment adviser has agreed in writing to pay a portion of the fund’s total annual operating expenses, excluding interest, taxes, extraordinary expenses, brokerage and transaction costs, and investment-related expenses, such that total annual operating expenses do not exceed 0.90% of average daily net assets for the Initial Class shares and 1.15% of average daily net assets for the Service Class shares. This written agreement will continue until modified by the fund’s Board of Trustees, but such agreement will continue at least until April 30, 2020. For the year ended December 31, 2018, the fund’s actual operating expenses did not exceed the limit and therefore, the investment adviser did not pay any portion of the fund’s expenses related to this agreement.
Distributor – MFS Fund Distributors, Inc. (MFD), a wholly-owned subsidiary of MFS, is the distributor of shares of the fund. The Trustees have adopted a distribution plan for the Service Class shares pursuant to Rule12b-1 under the Investment Company Act of 1940.
The fund’s distribution plan provides that the fund will pay MFD distribution and/or service fees equal to 0.25% per annum of its average daily net assets attributable to Service Class shares as partial consideration for services performed and expenses incurred by MFD and financial intermediaries (including participating insurance companies that invest in the fund to fund variable annuity and variable life insurance contracts, sponsors of qualified retirement and pension plans that invest in the fund, and affiliates of these participating insurance companies and plan sponsors) in connection with the sale and distribution of the Service Class shares. MFD may subsequently pay all, or a portion, of the distribution and/or service fees to financial intermediaries.
Shareholder Servicing Agent – MFS Service Center, Inc. (MFSC), a wholly-owned subsidiary of MFS, receives a fee from the fund for its services as shareholder servicing agent. For the year ended December 31, 2018, the fee was $44,735, which equated to 0.0024% annually of the fund’s average daily net assets. MFSC also receives payment from the fund forout-of-pocket expenses paid by MFSC on behalf of the fund. For the year ended December 31, 2018, these costs amounted to $1,484.
Administrator – MFS provides certain financial, legal, shareholder communications, compliance, and other administrative services to the fund. Under an administrative services agreement, the fund reimburses MFS the costs incurred to provide these services. The fund is charged an annual fixed amount of $17,500 plus a fee based on average daily net assets. The administrative services fee incurred for the year ended December 31, 2018 was equivalent to an annual effective rate of 0.0148% of the fund’s average daily net assets.
Trustees’ and Officers’ Compensation – The fund pays compensation to independent Trustees in the form of a retainer, attendance fees, and additional compensation to Board and Committee chairpersons. The fund does not pay compensation directly to Trustees or officers of the fund who are also officers of the investment adviser, all of whom receive remuneration for their services to the fund from MFS. Certain officers and Trustees of the fund are officers or directors of MFS, MFD, and MFSC.
Other – This fund and certain other funds managed by MFS (the funds) have entered into a service agreement (the ISO Agreement) which provides for payment of fees solely by the funds to Tarantino LLC in return for the provision of services of an Independent Senior Officer (ISO) for the funds. Frank L. Tarantino serves as the ISO and is an officer of the funds and the sole member of Tarantino LLC. The funds can terminate the ISO Agreement with Tarantino LLC at any time under the terms of the ISO Agreement. For the year ended December 31, 2018, the fee paid by the fund under this agreement was $3,270 and is included in “Miscellaneous” expense in the Statement of Operations. MFS has agreed to bear all expenses associated with office space, other administrative support, and supplies provided to the ISO.
The fund invests in the MFS Institutional Money Market Portfolio which is managed by MFS and seeks current income consistent with preservation of capital and liquidity. This money market fund does not pay a management fee to MFS.
The fund is permitted to engage in purchase and sale transactions with funds and accounts for which MFS serves as investment adviser orsub-adviser (“cross-trades”) pursuant to a policy adopted by the Board of Trustees. This policy has been designed to ensure that cross-trades conducted by the fund comply with Rule17a-7 under the Investment Company Act of 1940. During the year ended December 31, 2018, the fund engaged in purchase and sale transactions pursuant to this policy, which amounted to $270,349 and $2,471,848, respectively. The sales transactions resulted in net realized gains (losses) of $41,342.
For the year ended December 31, 2018, purchases and sales of investments, other thanin-kind transactions and short-term obligations, aggregated $380,188,613 and $295,151,885, respectively.
20
MFS International Value Portfolio
Notes to Financial Statements – continued
| (5) | | Shares of Beneficial Interest |
The fund’s Declaration of Trust permits the Trustees to issue an unlimited number of full and fractional shares of beneficial interest. Transactions in fund shares were as follows:
| | | | | | | | | | | | | | | | |
| | | Year ended 12/31/18 | | | Year ended 12/31/17 | |
| | | | |
| | | Shares | | | Amount | | | Shares | | | Amount | |
| Shares sold | | | | | | | | | | | | | | | | |
Initial Class | | | 1,807,723 | | | | $49,642,877 | | | | 2,886,969 | | | | $74,370,699 | |
Service Class | | | 9,068,135 | | | | 246,748,145 | | | | 10,119,707 | | | | 254,467,286 | |
| | | 10,875,858 | | | | $296,391,022 | | | | 13,006,676 | | | | $328,837,985 | |
| | | | |
| Shares issued to shareholders in reinvestment of distributions | | | | | | | | | | | | | | | | |
Initial Class | | | 227,591 | | | | $6,449,925 | | | | 156,248 | | | | $4,262,323 | |
Service Class | | | 1,299,712 | | | | 36,248,974 | | | | 845,762 | | | | 21,719,172 | |
| | | 1,527,303 | | | | $42,698,899 | | | | 1,002,010 | | | | $25,981,495 | |
| | | | |
| Shares reacquired | | | | | | | | | | | | | | | | |
Initial Class | | | (1,988,524 | ) | | | $(55,464,604 | ) | | | (2,360,709 | ) | | | $(60,630,463 | ) |
Service Class | | | (37,642,907 | ) | | | (976,864,994 | ) | | | (6,099,396 | ) | | | (153,445,387 | ) |
| | | (39,631,431 | ) | | | $(1,032,329,598 | ) | | | (8,460,105 | ) | | | $(214,075,850 | ) |
| | | | |
| Net change | | | | | | | | | | | | | | | | |
Initial Class | | | 46,790 | | | | $628,198 | | | | 682,508 | | | | $18,002,559 | |
Service Class | | | (27,275,060 | ) | | | (693,867,875 | ) | | | 4,866,073 | | | | 122,741,071 | |
| | | (27,228,270 | ) | | | $(693,239,677 | ) | | | 5,548,581 | | | | $140,743,630 | |
The fund is one of several mutual funds in which certain MFS funds may invest. The MFS funds do not invest in the underlying funds for the purpose of exercising management or control. At the end of the period, the MFS Moderate Allocation Portfolio, the MFS Growth Allocation Portfolio, and the MFS Conservative Allocation Portfolio were the owners of record of approximately 4%, 1%, and 1%, respectively, of the value of outstanding voting shares of the fund.
Effective at the close of business on October 16, 2017, the fund is closed to new investors subject to certain exceptions. Please see the fund’s prospectus for details.
The fund and certain other funds managed by MFS participate in a $1.25 billion unsecured committed line of credit, subject to a $1 billion sublimit, provided by a syndication of banks under a credit agreement. Borrowings may be made for temporary financing needs. Interest is charged to each fund, based on its borrowings, generally at a rate equal to the higher of the Overnight Bank Funding rate or daily one month LIBOR plus an agreed upon spread. A commitment fee, based on the average daily, unused portion of the committed line of credit, is allocated among the participating funds. In addition, the fund and other funds managed by MFS have established unsecured uncommitted borrowing arrangements with certain banks for temporary financing needs. Interest is charged to each fund, based on its borrowings, at a rate equal to the Overnight Bank Funding rate plus an agreed upon spread. For the year ended December 31, 2018, the fund’s commitment fee and interest expense were $11,430 and $0, respectively, and are included in “Miscellaneous” expense in the Statement of Operations.
| (7) | | Investments in Affiliated Issuers |
An affiliated issuer may be considered one in which the fund owns 5% or more of the outstanding voting securities, or a company which is under common control. For the purposes of this report, the fund assumes the following to be affiliated issuers:
| | | | | | | | | | | | | | | | | | |
| Affiliated Issuers | | | | Beginning
Shares/Par
Amount | | | Acquisitions
Shares/Par
Amount | | | Dispositions
Shares/Par
Amount | | | Ending
Shares/Par
Amount | |
| | | | | |
| MFS Institutional Money Market Portfolio | | | | | 57,389,567 | | | | 234,077,867 | | | | (256,767,580 | ) | | | 34,699,854 | |
| | | | | |
| Affiliated Issuers | | Realized
Gain (Loss) | | Change in
Unrealized
Appreciation/
Depreciation | | | Capital Gain
Distributions | | | Dividend
Income | | | Ending
Value | |
| | | | | |
| MFS Institutional Money Market Portfolio | | $1,155 | | | $2,508 | | | | $— | | | | $1,121,219 | | | | $34,696,385 | |
On October 19, 2018, the fund recorded a redemptionin-kind of portfolio securities and cash that was valued at $809,828,954. The redeeming shareholder generally receives a pro rata share of the securities held by the fund. The distribution of such securities generated a realized gain of $286,329,253 for the fund, which is included in Net realized gain (loss) in the Statement of Operations. For tax purposes, no gains or losses were recognized.
21
MFS International Value Portfolio
REPORT OF INDEPENDENT REGISTERED PUBLIC ACCOUNTING FIRM
To the Board of Trustees of MFS Variable Insurance Trust II and the Shareholders of
MFS International Value Portfolio:
Opinion on the Financial Statements and Financial Highlights
We have audited the accompanying statement of assets and liabilities of MFS International Value Portfolio (the “Fund”), including the portfolio of investments, as of December 31, 2018, the related statement of operations for the year then ended, the statements of changes in net assets for each of the two years in the period then ended, the financial highlights for each of the five years in the period then ended, and the related notes. In our opinion, the financial statements and financial highlights present fairly, in all material respects, the financial position of the Fund as of December 31, 2018, and the results of its operations for the year then ended, the changes in its net assets for each of the two years in the period then ended, and the financial highlights for each of the five years in the period then ended, in conformity with accounting principles generally accepted in the United States of America.
Basis for Opinion
These financial statements and financial highlights are the responsibility of the Fund’s management. Our responsibility is to express an opinion on the Fund’s financial statements and financial highlights based on our audits. We are a public accounting firm registered with the Public Company Accounting Oversight Board (United States) (PCAOB) and are required to be independent with respect to the Fund in accordance with the U.S. federal securities laws and the applicable rules and regulations of the Securities and Exchange Commission and the PCAOB.
We conducted our audits in accordance with the standards of the PCAOB. Those standards require that we plan and perform the audit to obtain reasonable assurance about whether the financial statements and financial highlights are free of material misstatement, whether due to error or fraud. The Fund is not required to have, nor were we engaged to perform, an audit of its internal control over financial reporting. As part of our audits we are required to obtain an understanding of internal control over financial reporting but not for the purpose of expressing an opinion on the effectiveness of the Fund’s internal control over financial reporting. Accordingly, we express no such opinion.
Our audits included performing procedures to assess the risks of material misstatement of the financial statements and financial highlights, whether due to error or fraud, and performing procedures that respond to those risks. Such procedures included examining, on a test basis, evidence regarding the amounts and disclosures in the financial statements and financial highlights. Our audits also included evaluating the accounting principles used and significant estimates made by management, as well as evaluating the overall presentation of the financial statements and financial highlights. Our procedures included confirmation of securities owned as of December 31, 2018, by correspondence with the custodian and brokers. We believe that our audits provide a reasonable basis for our opinion.
DELOITTE & TOUCHE LLP
Boston, Massachusetts
February 15, 2019
We have served as the auditor of one or more of the MFS investment companies since 1924.
22
MFS International Value Portfolio
TRUSTEES AND OFFICERS – IDENTIFICATION AND BACKGROUND
The Trustees and Officers of the Trust, as of February 1, 2019, are listed below, together with their principal occupations during the past five years. (Their titles may have varied during that period.) The address of each Trustee and Officer is 111 Huntington Avenue, Boston, Massachusetts 02199-7618.
| | | | | | | | | | |
Name, Age | | Position(s)
Held with Fund | | Trustee/Officer
Since (h) | | Number of MFS Funds overseen by the Trustee | | Principal Occupations
During the Past Five Years | | Other Directorships During the Past Five Years (j) |
| INTERESTED TRUSTEES |
Robert J. Manning (k) (age 55) | | Trustee | | February 2004 | | 135 | | Massachusetts Financial Services Company, Executive Chairman (since January 2017); Director; Chairman of the Board; Chief Executive Officer (until 2015);Co-Chief Executive Officer(2015-2016) | | N/A |
| | | | | |
Robin A. Stelmach (k) (age 57) | | Trustee | | January 2014 | | 135 | | Massachusetts Financial Services Company, Vice Chair (since January 2017); Chief Operating Officer and Executive Vice President (until January 2017) | | N/A |
|
| INDEPENDENT TRUSTEES |
John P. Kavanaugh (age 64) | | Trustee and Chair of Trustees | | January 2009 | | 135 | | Private investor | | N/A |
| | | | | |
Steven E. Buller (age 67) | | Trustee | | February 2014 | | 135 | | Financial Accounting Standards Advisory Council, Chairman(2014-2015); Public Company Accounting Oversight Board, Standing Advisory Group, Member (until 2014); BlackRock, Inc. (investment management), Managing Director (until 2014), BlackRock Finco UK (investment management), Director (until 2014) | | N/A |
| | | | | |
John A. Caroselli (age 64) | | Trustee | | March 2017 | | 135 | | JC Global Advisors, LLC (management consulting), President (since 2015); First Capital Corporation (commercial finance), Executive Vice President (until 2015) | | N/A |
| | | | | |
Maureen R. Goldfarb (age 63) | | Trustee | | January 2009 | | 135 | | Private investor | | N/A |
| | | | | |
Michael Hegarty (age 74) | | Trustee | | December 2004 | | 135 | | Private investor | | Rouse Properties Inc., Director (until 2016); Capmark Financial Group Inc., Director (until 2015) |
| | | | | |
Peter D. Jones (age 63) | | Trustee | | January 2019 | | 135 | | Franklin Templeton Distributors, Inc. (investment management), President (until 2015); Franklin Templeton Institutional, LLC (investment management), Chairman (until 2015) | | N/A |
| | | | | |
James W. Kilman, Jr. (age 57) | | Trustee | | January 2019 | | 135 | | KielStrand Capital LLC (family office and merchant bank), Chief Executive Officer (since 2016); Morgan Stanley & Co. (financial services), Vice Chairman of Investment Banking,Co-Head of Diversified Financials Coverage – Financial Institutions Investment Banking Group (until 2016) | | alpha-En Corporation, Director (since 2016) |
23
MFS International Value Portfolio
Trustees and Officers – continued
| | | | | | | | | | |
Name, Age | | Position(s)
Held with Fund | | Trustee/Officer
Since (h) | | Number of MFS Funds overseen by the Trustee | | Principal Occupations
During the Past Five Years | | Other Directorships During the Past Five Years (j) |
Clarence Otis, Jr. (age 62) | | Trustee | | March 2017 | | 135 | | Darden Restaurants, Inc., Chief Executive Officer (until 2014) | | VF Corporation, Director; Verizon Communications, Inc., Director; The Travelers Companies, Director; Federal Reserve Bank of Atlanta, Director (until 2015) |
| | | | | |
Maryanne L. Roepke (age 62) | | Trustee | | May 2014 | | 135 | | American Century Investments (investment management), Senior Vice President and Chief Compliance Officer (until 2014) | | N/A |
| | | | | |
Laurie J. Thomsen
(age 61) | | Trustee | | March 2005 | | 135 | | Private investor | | The Travelers Companies, Director; Dycom Industries, Inc., Director (since 2015) |
| | | | | | | | |
Name, Age | | Position(s)
Held with Fund | | Trustee/Officer
Since (h) | | Number of MFS Funds for which the Person is an Officer | | Principal Occupations During the Past Five Years |
| OFFICERS | | | | | | |
Christopher R. Bohane (k)
(age 45) | | Assistant Secretary and Assistant Clerk | | July 2005 | | 135 | | Massachusetts Financial Services Company, Vice President and Assistant General Counsel |
| | | | |
Kino Clark (k) (age 50) | | Assistant Treasurer | | January 2012 | | 135 | | Massachusetts Financial Services Company, Vice President |
| | | | |
John W. Clark, Jr. (k) (age 51) | | Assistant Treasurer | | April 2017 | | 135 | | Massachusetts Financial Services Company, Vice President (since March 2017); Deutsche Bank (financial services), Department Head – Treasurer’s Office (until February 2017) |
| | | | |
Thomas H. Connors (k) (age 59) | | Assistant Secretary and Assistant Clerk | | September 2012 | | 135 | | Massachusetts Financial Services Company, Vice President and Senior Counsel |
| | | | |
Ethan D. Corey (k)
(age 55) | | Assistant
Secretary and Assistant Clerk | | July 2005 | | 135 | | Massachusetts Financial Services Company, Senior Vice President and Associate General Counsel |
| | | | |
David L. DiLorenzo (k)
(age 50) | | President | | July 2005 | | 135 | | Massachusetts Financial Services Company, Senior Vice President |
| | | | |
Heidi W. Hardin (k) (age 51) | | Secretary and Clerk | | April 2017 | | 135 | | Massachusetts Financial Services Company, Executive Vice President and General Counsel (since March 2017); Harris Associates (investment management), General Counsel (from September 2015 to January 2017); Janus Capital Management LLC (investment management), Senior Vice President and General Counsel (until September 2015) |
| | | | |
Brian E. Langenfeld (k) (age 45) | | Assistant
Secretary and Assistant Clerk | | June 2006 | | 135 | | Massachusetts Financial Services Company, Vice President and Senior Counsel |
| | | | |
Amanda S. Mooradian (k) (age 39) | | Assistant
Secretary and Assistant Clerk | | September 2018 | | 135 | | Massachusetts Financial Services Company, Assistant Vice President and Counsel |
| | | | |
Susan A. Pereira (k)
(age 48) | | Assistant
Secretary and Assistant Clerk | | July 2005 | | 135 | | Massachusetts Financial Services Company, Vice President and Senior Counsel |
| | | | |
Kasey L. Phillips (k) (age 48) | | Assistant Treasurer | | September 2012 | | 135 | | Massachusetts Financial Services Company, Vice President |
| | | | |
Matthew A. Stowe (k) (age 44) | | Assistant Secretary and Assistant Clerk | | October 2014 | | 135 | | Massachusetts Financial Services Company, Vice President and Assistant General Counsel |
24
MFS International Value Portfolio
Trustees and Officers – continued
| | | | | | | | |
Name, Age | | Position(s)
Held with Fund | | Trustee/Officer
Since (h) | | Number of MFS Funds for which the Person is an Officer | | Principal Occupations During the Past Five Years |
Frank L. Tarantino
(age 74) | | Independent
Senior Officer | | June 2004 | | 135 | | Tarantino LLC (provider of compliance services), Principal |
| | | | |
Richard S. Weitzel (k)
(age 48) | | Assistant Secretary and Assistant Clerk | | October 2007 | | 135 | | Massachusetts Financial Services Company, Senior Vice President and Associate General Counsel |
| | | | |
Martin J. Wolin (k) (age 51) | | Chief Compliance Officer | | July 2015 | | 135 | | Massachusetts Financial Services Company, Senior Vice President and Chief Compliance Officer (since July 2015); Mercer (financial service provider), Chief Risk and Compliance Officer, North America and Latin America (until June 2015) |
| | | | |
James O. Yost (k)
(age 58) | | Treasurer | | September 1990 | | 135 | | Massachusetts Financial Services Company, Senior Vice President |
| (h) | Date first appointed to serve as Trustee/officer of an MFS Fund. Each Trustee has served continuously since appointment unless indicated otherwise. For the period from December 15, 2004 until February 22, 2005, Mr. Manning served as Advisory Trustee. From January 2012 through December 2016, Messrs. DiLorenzo and Yost served as Treasurer and Deputy Treasurer of the Funds, respectively. |
| (j) | Directorships or trusteeships of companies required to report to the Securities and Exchange Commission (i.e., “public companies”). |
| (k) | “Interested person” of the Trust within the meaning of the Investment Company Act of 1940 (referred to as the 1940 Act), which is the principal federal law governing investment companies like the fund, as a result of a position with MFS. The address of MFS is 111 Huntington Avenue, Boston, Massachusetts 02199-7618. |
Each Trustee has been elected by shareholders and each Trustee and officer holds office until his or her successor is chosen and qualified or until his or her earlier death, resignation, retirement or removal. The Trust does not hold annual meetings for the purpose of electing Trustees, and Trustees are not elected for fixed terms. Under the terms of the Board’s retirement policy, an Independent Trustee shall retire at the end of the calendar year in which he or she reaches the earlier of 75 years of age or 15 years of service on the Board (or, in the case of any Independent Trustee who joined the Board prior to 2015, 20 years of service on the Board).
Messrs. Buller, Hegarty, Kilman and Otis and Ms. Roepke are members of the Trust’s Audit Committee.
Each of the Interested Trustees and certain Officers hold comparable officer positions with certain affiliates of MFS.
The Statement of Additional Information for a Fund includes further information about the Trustees and is available without charge upon request by calling1-800-225-2606.
| | |
Investment Adviser Massachusetts Financial Services Company 111 Huntington Avenue Boston, MA 02199-7618 | | Custodian State Street Bank and Trust Company 1 Lincoln Street Boston, MA 02111-2900 |
| |
Distributor MFS Fund Distributors, Inc. 111 Huntington Avenue Boston, MA 02199-7618 | | Independent Registered Public Accounting Firm Deloitte & Touche LLP 200 Berkeley Street Boston, MA 02116 |
| |
Portfolio Manager(s) Pablo De La Mata Benjamin Stone | | |
25
MFS International Value Portfolio
BOARD REVIEW OF INVESTMENT ADVISORY AGREEMENT
The Investment Company Act of 1940 requires that both the full Board of Trustees and a majority of thenon-interested (“independent”) Trustees, voting separately, annually approve the continuation of the Fund’s investment advisory agreement with MFS. The Trustees consider matters bearing on the Fund and its advisory arrangements at their meetings throughout the year, including a review of performance data at each regular meeting. In addition, the independent Trustees met several times over the course of three months beginning in May and ending in July, 2018 (“contract review meetings”) for the specific purpose of considering whether to approve the continuation of the investment advisory agreement for the Fund and the other investment companies that the Board oversees (the “MFS Funds”). The independent Trustees were assisted in their evaluation of the Fund’s investment advisory agreement by independent legal counsel, from whom they received separate legal advice and with whom they met separately from MFS during various contract review meetings. The independent Trustees were also assisted in this process by the MFS Funds’ Independent Senior Officer, a senior officer appointed by and reporting to the independent Trustees.
In connection with their deliberations regarding the continuation of the investment advisory agreement, the Trustees, including the independent Trustees, considered such information and factors as they believed, in light of the legal advice furnished to them and their own business judgment, to be relevant. The investment advisory agreement for the Fund was considered separately, although the Trustees also took into account the common interests of all MFS Funds in their review. As described below, the Trustees considered the nature, quality, and extent of the various investment advisory, administrative, and shareholder services performed by MFS under the existing investment advisory agreement and other arrangements with the Fund.
In connection with their contract review meetings, the Trustees received and relied upon materials that included, among other items: (i) information provided by Broadridge Financial Solutions, Inc. (“Broadridge”), an independent third party, on the investment performance of the Fund for various time periods ended December 31, 2017 and the investment performance of a group of funds with substantially similar investment classifications/objectives (the “Broadridge performance universe”), (ii) information provided by Broadridge on the Fund’s advisory fees and other expenses and the advisory fees and other expenses of comparable funds identified by Broadridge (the “Broadridge expense group”), (iii) information provided by MFS on the advisory fees of portfolios of other clients of MFS, including institutional separate accounts and other clients, (iv) information as to whether and to what extent applicable expense waivers, reimbursements or fee “breakpoints” are observed for the Fund, (v) information regarding MFS’ financial results and financial condition, including MFS’ and certain of its affiliates’ estimated profitability from services performed for the Fund and the MFS Funds as a whole, and compared to MFS’ institutional business, (vi) MFS’ views regarding the outlook for the mutual fund industry and the strategic business plans of MFS, (vii) descriptions of various functions performed by MFS for the Funds, such as compliance monitoring and portfolio trading practices, and (viii) information regarding the overall organization of MFS, including information about MFS’ senior management and other personnel providing investment advisory, administrative and other services to the Fund and the other MFS Funds. The comparative performance, fee and expense information prepared and provided by Broadridge was not independently verified and the independent Trustees did not independently verify any information provided to them by MFS.
The Trustees’ conclusion as to the continuation of the investment advisory agreement was based on a comprehensive consideration of all information provided to the Trustees and not the result of any single factor. Some of the factors that figured particularly in the Trustees’ deliberations are described below, although individual Trustees may have evaluated the information presented differently from one another, giving different weights to various factors. It is also important to recognize that the fee arrangements for the Fund and other MFS Funds are the result of years of review and discussion between the independent Trustees and MFS, that certain aspects of such arrangements may receive greater scrutiny in some years than in others, and that the Trustees’ conclusions may be based, in part, on their consideration of these same arrangements during the course of the year and in prior years.
Based on information provided by Broadridge and MFS, the Trustees reviewed the Fund’s total return investment performance as well as the Broadridge performance universe over various time periods. The Trustees placed particular emphasis on the total return performance of the Fund’s Initial Class shares in comparison to the performance of funds in its Broadridge performance universe over the three-year period ended December 31, 2017, which the Trustees believed was a long enough period to reflect differing market conditions. The total return performance of the Fund’s Initial Class shares was in the 1st quintile relative to the other funds in the universe for this three-year period (the 1st quintile being the best performers and the 5th quintile being the worst performers). The total return performance of the Fund’s Initial Class shares was in the 4th quintile for theone-year period and the 1st quintile for the five-year period ended December 31, 2017 relative to the Broadridge performance universe. Because of the passage of time, these performance results may differ from the performance results for more recent periods, including those shown elsewhere in this report.
In the course of their deliberations, the Trustees took into account information provided by MFS in connection with the contract review meetings, as well as during investment review meetings conducted with portfolio management personnel during the course of the year regarding the Fund’s performance. After reviewing these and related factors, the Trustees concluded, within the context of their overall conclusions regarding the investment advisory agreement, that they were satisfied with MFS’ responses and efforts relating to investment performance.
26
MFS International Value Portfolio
Board Review of Investment Advisory Agreement – continued
In assessing the reasonableness of the Fund’s advisory fee, the Trustees considered, among other information, the Fund’s advisory fee and the total expense ratio of the Fund’s Initial Class shares as a percentage of average daily net assets and the advisory fee and total expense ratios of peer groups of funds based on information provided by Broadridge. The Trustees considered that MFS currently observes an expense limitation for the Fund, which may not be changed without the Trustees’ approval. The Trustees also considered that, according to the data provided by Broadridge (which takes into account any fee reductions or expense limitations that were in effect during the Fund’s last fiscal year), the Fund’s effective advisory fee rate and total expense ratio were each higher than the Broadridge expense group median.
The Trustees also considered the advisory fees charged by MFS to any institutional separate accounts advised by MFS (“separate accounts”) and unaffiliated investment companies for which MFS serves as subadviser (“subadvised funds”) that have comparable investment strategies to the Fund, if any. In comparing these fees, the Trustees considered information provided by MFS as to the generally broader scope of services provided by MFS to the Fund, as well as the more extensive regulatory burdens imposed on MFS in managing the Fund, in comparison to separate accounts and subadvised funds. The Trustees also considered the higher demands placed on MFS’ investment personnel and trading infrastructure as a result of the daily cashin-flows andout-flows of the Fund in comparison to separate accounts.
The Trustees also considered whether the Fund may benefit from any economies of scale in the management of the Fund in the event of growth in assets of the Fund and/or growth in assets of the MFS Funds as a whole. They noted that the Fund’s advisory fee rate schedule is subject to contractual breakpoints that reduce the Fund’s advisory fee rate on average daily net assets over $1 billion and $2 billion. The Trustees also noted that MFS has agreed in writing to waive a portion of the management fees of certain MFS Funds, including the Fund, if the total combined assets of certain funds within the MFS Funds’ complex increase above agreed upon thresholds (the “group fee waiver”), enabling the Fund’s shareholders to share in the benefits from any economies of scale at the complex level. The group fee waiver is reviewed and renewed annually between the Board and MFS. The Trustees concluded that the breakpoints and the group fee waiver were sufficient to allow the Fund to benefit from economies of scale as its assets and overall complex assets grow.
The Trustees also considered information prepared by MFS relating to MFS’ costs and profits with respect to the Fund, the MFS Funds considered as a group, and other investment companies and accounts advised by MFS, as well as MFS’ methodologies used to determine and allocate its costs to the MFS Funds, the Fund and other accounts and products for purposes of estimating profitability.
After reviewing these and other factors described herein, the Trustees concluded, within the context of their overall conclusions regarding the investment advisory agreement, that the advisory fees charged to the Fund represent reasonable compensation in light of the services being provided by MFS to the Fund.
In addition, the Trustees considered MFS’ resources and related efforts to continue to retain, attract and motivate capable personnel to serve the Fund. The Trustees also considered current and developing conditions in the financial services industry, including the presence of large and well-capitalized companies which are spending, and appear to be prepared to continue to spend, substantial sums to engage personnel and to provide services to competing investment companies. In this regard, the Trustees also considered the financial resources of MFS and its ultimate parent, Sun Life Financial Inc. The Trustees also considered the advantages and possible disadvantages to the Fund of having an adviser that also serves other investment companies as well as other accounts.
The Trustees also considered the nature, quality, cost, and extent of administrative, transfer agency, and distribution services provided to the Fund by MFS and its affiliates under agreements and plans other than the investment advisory agreement, including any12b-1 fees the Fund pays to MFS Fund Distributors, Inc., an affiliate of MFS. The Trustees also considered the nature, extent and quality of certain other services MFS performs or arranges for on the Fund’s behalf, which may include securities lending programs, directed expense payment programs, class action recovery programs, and MFS’ interaction with third-party service providers, principally custodians andsub-custodians. The Trustees concluded that the variousnon-advisory services provided by MFS and its affiliates on behalf of the Fund were satisfactory.
The Trustees consideredso-called“fall-out benefits” to MFS such as reputational value derived from serving as investment manager to the MFS Funds. The Trustees also considered that, effective January 3, 2018, MFS had discontinued its historic practice of obtaining investment research from portfolio brokerage commissions paid by certain MFS Funds and would thereafter voluntarily reimburse a Fund, if applicable, for the costs of external research acquired through the use of the Fund’s portfolio brokerage commissions.
Based on their evaluation of factors that they deemed to be material, including those factors described above, the Board of Trustees, including the independent Trustees, concluded that the Fund’s investment advisory agreement with MFS should be continued for an additionalone-year period, commencing August 1, 2018.
27
MFS International Value Portfolio
PROXY VOTING POLICIES AND INFORMATION
MFS votes proxies on behalf of the fund pursuant to proxy voting policies and procedures that are available without charge, upon request, by calling 1-800-225-2606, by visitingmfs.com/proxyvoting, or by visiting the SEC’s Web site athttp://www.sec.gov.
Information regarding how the fund voted proxies relating to portfolio securities during the most recent twelve-month period ended June 30 is available by August 31 of each year without charge by visitingmfs.com/proxyvoting, or by visiting the SEC’s Web site athttp://www.sec.gov.
QUARTERLY PORTFOLIO DISCLOSURE
The fund files a complete schedule of portfolio holdings with the SEC for the first and third quarters of each fiscal year on Form N-Q. The fund’s Form N-Q is available on the SEC’s website athttp://www.sec.gov. A shareholder can obtain the portfolio holdings report for the first and third quarters of the fund’s fiscal year atmfs.com/vit2 by choosing the fund’s name and then selecting the “Resources” tab and clicking on “Prospectus and Reports”.
FURTHER INFORMATION
From time to time, MFS may post important information about the fund or the MFS funds on the MFS web site (mfs.com). This information is available athttps://www.mfs.com/en-us/what-we-do/announcements.htmlor atmfs.com/vit2 by choosing the fund’s name.
INFORMATION ABOUT FUND CONTRACTS AND LEGAL CLAIMS
The fund has entered into contractual arrangements with an investment adviser, administrator, distributor, shareholder servicing agent, 529 program manager (if applicable), and custodian who each provide services to the fund. Unless expressly stated otherwise, shareholders are not parties to, or intended beneficiaries of these contractual arrangements, and these contractual arrangements are not intended to create any shareholder right to enforce them against the service providers or to seek any remedy under them against the service providers, either directly or on behalf of the fund.
Under the Trust’s By-Laws and Declaration of Trust, any claims asserted against or on behalf of the MFS Funds, including claims against Trustees and Officers, must be brought in state and federal courts located within the Commonwealth of Massachusetts.
FEDERAL TAX INFORMATION (unaudited)
The following information is provided pursuant to provisions of the Internal Revenue Code.
The fund designates $25,813,000 as capital gain dividends paid during the fiscal year.
For corporate shareholders, 8.99% of the ordinary income dividends paid during the fiscal year qualify for the corporate dividends received deduction.
Income derived from foreign sources was $36,684,656. The fund intends to pass through foreign tax credits of $3,323,163 for the fiscal year.
28
rev. 3/16
| | | | |
| FACTS | | WHAT DOES MFS DO WITH YOUR
PERSONAL INFORMATION? | |  |
| | |
| Why? | | Financial companies choose how they share your personal information. Federal law gives consumers the right to limit some but not all sharing. Federal law also requires us to tell you how we collect, share, and protect your personal information. Please read this notice carefully to understand what we do. |
| | |
| What? | | The types of personal information we collect and share depend on the product or service you have with us. This information can include: • Social Security number and account balances • Account transactions and transaction history • Checking account information and wire transfer instructions When you areno longer our customer, we continue to share your information as described in this notice. |
| | |
| How? | | All financial companies need to share customers’ personal information to run their everyday business. In the section below, we list the reasons financial companies can share their customers’ personal information; the reasons MFS chooses to share; and whether you can limit this sharing. |
| | | | |
Reasons we can share your
personal information | | Does MFS share? | | Can you limit this
sharing? |
For our everyday business purposes – such as to process your transactions, maintain your account(s), respond to court orders and legal investigations, or report to credit bureaus | | Yes | | No |
For our marketing purposes – to offer our products and services to you | | No | | We don’t share |
| For joint marketing with other financial companies | | No | | We don’t share |
For our affiliates’ everyday business purposes – information about your transactions and experiences | | No | | We don’t share |
For our affiliates’ everyday business purposes – information about your creditworthiness | | No | | We don’t share |
| For nonaffiliates to market to you | | No | | We don’t share |
| | |
| Questions? | | Call800-225-2606 or go tomfs.com. |
29
| | |
| Who we are |
| Who is providing this notice? | | MFS Funds, MFS Investment Management, MFS Institutional Advisors, Inc., and MFS Heritage Trust Company. |
| | |
| What we do |
| How does MFS protect my personal information? | | To protect your personal information from unauthorized access and use, we use security measures that comply with federal law. These measures include procedural, electronic, and physical safeguards for the protection of the personal information we collect about you. |
How does MFS
collect my personal information? | | We collect your personal information, for example, when you • open an account or provide account information • direct us to buy securities or direct us to sell your securities • make a wire transfer We also collect your personal information from others, such as credit bureaus, affiliates, or other companies. |
| Why can’t I limit all sharing? | | Federal law gives you the right to limit only • sharing for affiliates’ everyday business purposes – information about your creditworthiness • affiliates from using your information to market to you • sharing for nonaffiliates to market to you State laws and individual companies may give you additional rights to limit sharing. |
| | |
| Definitions |
| Affiliates | | Companies related by common ownership or control. They can be financial and nonfinancial companies. • MFS does not share personal information with affiliates, except for everyday business purposes as described on page one of this notice. |
| Nonaffiliates | | Companies not related by common ownership or control. They can be financial and nonfinancial companies. • MFS does not share with nonaffiliates so they can market to you. |
| Joint marketing | | A formal agreement between nonaffiliated financial companies that together market financial products or services to you. • MFS doesn’t jointly market. |
| | |
| Other important information |
| If you own an MFS product or receive an MFS service in the name of a third party such as a bank or broker-dealer, their privacy policy may apply to you instead of ours. |
30
Annual Report
December 31, 2018

MFS® Massachusetts Investors Growth Stock Portfolio

MFS® Variable Insurance Trust II
Beginning on January 1, 2021, as permitted by regulations adopted by the U.S. Securities and Exchange Commission, the insurance company that offers your contract may determine that it will no longer send you paper copies of the fund’s annual and semiannual shareholder reports unless you specifically request paper copies from the insurance company or from your financial intermediary. Instead, the shareholder reports will be made available on a Web site (insurancefunds.mfs.com or other Web site of which you will be notified), and the insurance company will notify you by mail each time a report is posted and provide you with a Web site link to access the report. Instructions for requesting paper copies will be provided by your insurance company or financial intermediary.
If you already elected to receive shareholder reports by email, you will not be affected by this change and you need not take any action. If your insurance company or financial intermediary offers electronic delivery, you may elect to receive shareholder reports and other communications from the insurance company or financial intermediary by email by following the instructions provided by the insurance company or financial intermediary.
Beginning on January 1, 2019, you may elect to receive all future reports in paper free of charge from the insurance company or financial intermediary. You can inform the insurance company or financial intermediary that you wish to continue receiving paper copies of your shareholder reports by contacting your insurance company or financial intermediary. Your election to receive reports in paper will apply to all funds held in your account with your insurance company or financial intermediary.
MIS-ANN
MFS® Massachusetts Investors Growth Stock Portfolio
CONTENTS
The report is prepared for the general information of contract owners. It is authorized for distribution to prospective investors only when preceded or accompanied by a current prospectus.
NOT FDIC INSURED• MAY LOSE VALUE• NO BANK OR CREDIT UNION GUARANTEE• NOT A DEPOSIT• NOT INSURED BY ANY FEDERAL GOVERNMENT AGENCY OR NCUA/NCUSIF
MFS Massachusetts Investors Growth Stock Portfolio
LETTER FROM THE EXECUTIVE CHAIRMAN

Dear Contract Owners:
Higher interest rates, international trade friction, and geopolitical uncertainty surrounding issues such as Brexit have contributed to an uptick in market volatility in recent quarters — a departure from thelow-volatility environment that prevailed for much of the past several years. Against this more challenging backdrop, equity markets in the United States outperformed most international markets on a relative basis in 2018, though broad market returns were modestly negative on an absolute basis. Global economic growth has become less synchronized over the past few quarters, with Europe, China, and some emerging markets having shown signs of significantly slowing growth. While U.S. growth has remained above average, the pace of that growth slowed in the second half of 2018.
Slowing global growth and tighter financial conditions have clouded the outlook for U.S. monetary policy, with the chairman of the U.S. Federal Reserve acknowledging that policy rates are close to levels that the Fed deems neutral for the U.S. economy. This suggests that the predictable pattern of quarterly rate increases is behind us. At the same time, markets must contend with a shift from years of quantitative easing toward a cycle of quantitative tightening now that the European Central Bank has halted asset purchases. U.S. tax reforms adopted in late 2017 have been welcomed by equity markets while emerging market economies have recently had to contend with tighter financial conditions as a result of firmer U.S. interest rates and a stronger dollar. With the Republicans losing control of the U.S. House of Representatives, further meaningful U.S. fiscal stimulus appears less likely over the remainder of this presidential term. A partial U.S. government shutdown, beginning in late 2018, also added to political uncertainty. Globally, inflation remains largely subdued thanks in part to falling oil prices, but tight labor markets and moderate global demand have investors on the lookout for its potential reappearance. Increased U.S. protectionism is also a growing concern, as investors fear trade disputes could dampen business sentiment, leading to even slower global growth. While there has been progress on this front — a NAFTA replacement has been agreed upon between the U.S., Mexico, and Canada; the free trade pact with Korea has been updated; and a negotiating framework with the European Union has been agreed upon — tensions over trade with China remain quite high, though the two sides have recently returned to the negotiating table.
As a global investment manager with nearly a century of expertise, MFS® firmly believes active risk management offers downside mitigation and may help improve investment outcomes. We built our active investment platform with this belief in mind. Ourlong-term perspective influences nearly every aspect of our business, ensuring our investment decisions align with the investing time horizons of our clients.
Respectfully,

Robert J. Manning
Executive Chairman
MFS Investment Management
February 15, 2019
The opinions expressed in this letter are subject to change and may not be relied upon for investment advice. No forecasts can be guaranteed.
1
MFS Massachusetts Investors Growth Stock Portfolio
PORTFOLIO COMPOSITION
Portfolio structure

| | | | |
| Top ten holdings | | | | |
| Alphabet, Inc., “A” | | | 6.5% | |
| Microsoft Corp. | | | 4.7% | |
| Accenture PLC, “A” | | | 3.4% | |
| Visa, Inc., “A” | | | 3.2% | |
| Texas Instruments, Inc. | | | 2.9% | |
| Aon PLC | | | 2.9% | |
| Comcast Corp., “A” | | | 2.5% | |
| Apple, Inc. | | | 2.5% | |
| Thermo Fisher Scientific, Inc. | | | 2.5% | |
| Starbucks Corp. | | | 2.4% | |
| | | | |
| GICS equity sectors | | | | |
| Information Technology | | | 29.8% | |
| Consumer Discretionary | | | 13.5% | |
| Health Care | | | 12.3% | |
| Communication Services | | | 11.9% | |
| Industrials | | | 10.2% | |
| Financials | | | 8.4% | |
| Consumer Staples | | | 7.9% | |
| Materials | | | 5.1% | |
| Energy | | | 0.1% | |
Cash & Cash Equivalents includes any cash, investments in money market funds, short-term securities, and other assets less liabilities. Please see the Statement of Assets and Liabilities for additional information related to the fund’s cash position and other assets and liabilities.
The Global Industry Classification Standard (GICS®) was developed by and/or is the exclusive property of MSCI, Inc. and S&P Global Market Intelligence Inc. (“S&P Global Market Intelligence”). GICS is a service mark of MSCI and S&P Global Market Intelligence and has been licensed for use by MFS.
Percentages are based on net assets as of December 31, 2018.
The portfolio is actively managed and current holdings may be different.
2
MFS Massachusetts Investors Growth Stock Portfolio
MANAGEMENT REVIEW
Summary of Results
For the twelve months ended December 31, 2018, Initial Class shares of the MFS Massachusetts Investors Growth Stock Portfolio(“fund”) provided a total return of 0.81%, while Service Class shares of the fund provided a total return of 0.58%. These compare with a return of –1.51% over the same period for the fund’s benchmark, the Russell 1000® Growth Index.
Market Environment
During the reporting period, the US Federal Reserve raised interest rates by 100 basis points, bringing the total number of rate hikes to nine since the central bank began to normalize monetary policy in late 2015. Economic growth rates in the US, Eurozone and Japan remained above trend, despite a slowing in global growth, particularly toward the end of the period. Inflation remained contained, particularly outside the US. Late in the period, the European Central Bank halted its asset purchase program but issued forward guidance that it does not expect to raise interest rates at least until after the summer of 2019. The Bank of England (once) and the Bank of Canada (three times) each raised rates during the period. The European political backdrop became a bit more volatile, late in the period, spurred by concerns over cohesion in the eurozone after the election of an anti-establishment, Eurosceptic coalition government in Italy and widespread protests over stagnant wage growth in France.
Bond yields rose in the US during most of the period, but remained low by historical standards and slipped from their highs, late in the period, as market volatility increased. Yields in many developed markets fell. Outside of emerging markets, where spreads and currencies came under pressure, credit spreads remained quite tight until the end of the period, when thinner liquidity, lower oil prices and concerns over high degrees of corporate leverage emerged. Growing concern over increasing global trade friction appeared to have weighed on business sentiment during the period’s second half, especially outside the US. Tighter financial conditions from rising US rates and a strong dollar, combined with trade uncertainty, helped expose structural weaknesses in several emerging markets in the second half of the period.
Volatility increased, at the end of the period, amid signs of slowing global economic growth and increasing trade tensions, which prompted a market setback shortly after US markets set record highs in September. It was the second such equity market decline during the reporting period. The correction came despite a third consecutive quarter of strong growth in US earnings per share. Strong earnings growth, combined with the market decline, brought US equity valuations down from elevated levels, earlier in the period, to multiples more in line with long-term averages. While the US economy held up better than most, global economic growth became less synchronized during the period, with Europe and China showing signs of a slowdown and some emerging markets coming under stress.
Contributors to Performance
Security selection and, to a lesser extent, an underweight allocation to the industrials sector were primary contributors to performance relative to the Russell 1000® Growth Index. Within this sector, the fund’s overweight position in analytics and risk assessment services provider Verisk Analytics bolstered relative results. The stock price of Verisk Analytics advanced as the company reported improved revenue growth and a significant benefit from US tax reform.
Security selection in both thecommunication services andhealth care sectors also benefited relative returns. Within thecommunication services sector, not holding shares of social networking firm Facebook aided relative performance. Within thehealth care sector, the fund’s holding of medical device company Abbott Laboratories (b), and an overweight position in analytical equipment, software and services provider Thermo Fisher Scientific, helped relative results. Shares of Abbott Laboratories benefited from solid organic growth results, owing to strong performance in the company’s Diabetes Care, Diagnostics, Nutrition and Medical Devices segments.
Other top relative contributors during the period included the fund’s overweight positions in coffee and tea company Starbucks, athletic shoes and apparel manufacturer NIKE, retail chain operator TJX Cos. and water, hygiene and energy technologies, and services provider Ecolab. Additionally, not owning shares of computer graphics processors maker NVIDIA and tobacco company Altria Group supported relative performance.
Detractors from Performance
The combination of an overweight position and stock selection in theconsumer staplessector detracted from relative performance. Within this sector, the fund’s holding of beauty products company Coty (b)(h), and an overweight position in consumer products company Colgate-Palmolive, hindered relative results. The stock price of Coty declined due to a difficult retail environment, along with disruptions in its supply chain. The share price also came under pressure after the firm provided fiscal-year 2019 earnings per share guidance that was below consensus estimates.
Elsewhere, not owning shares ofe-commerce and cloud services giant Amazon.com and health insurance and Medicare/Medicaid provider UnitedHealth Group, and the fund’s overweight position in video game maker Electronic Arts, weakened relative returns.
3
MFS Massachusetts Investors Growth Stock Portfolio
Management Review – continued
The stock price of Amazon.com appreciated during the period as the company delivered solid earnings results, driven by strong performance in its Amazon Web Services (AWS), Cloud services and advertising segments. In addition, the fund’s holdings of global industrial manufacturing and engineering company Colfax (b), international betting and gaming company Paddy Power Betfair (b) (Ireland), oilfield services company Schlumberger (b),e-commerce giant Alibaba Group Holding (b) (China), and an underweight position in strong-performing software giant Microsoft, dampened relative results.
During the reporting period, the fund’s relative currency exposure, resulting primarily from differences between the fund’s and the benchmark’s exposures to holdings of securities denominated in foreign currencies, detracted from relative performance. All of MFS’ investment decisions are driven by the fundamentals of each individual opportunity and, as such, it is common for our portfolios to have different currency exposures than the benchmark.
Respectfully,
Portfolio Manager(s)
Jeffrey Constantino
| (b) | Security is not a benchmark constituent. |
| (h) | Security was not held in the portfolio at period end. |
The views expressed in this report are those of the portfolio manager(s) only through the end of the period of the report as stated on the cover and do not necessarily reflect the views of MFS or any other person in the MFS organization. These views are subject to change at any time based on market or other conditions, and MFS disclaims any responsibility to update such views. These views may not be relied upon as investment advice or an indication of trading intent on behalf of any MFS portfolio. References to specific securities are not recommendations of such securities, and may not be representative of any MFS portfolio’s current or future investments.
4
MFS Massachusetts Investors Growth Stock Portfolio
PERFORMANCE SUMMARY THROUGH 12/31/18
The following chart illustrates the historical performance of the fund in comparison to its benchmark(s). Benchmarks are unmanaged and may not be invested in directly. Benchmark returns do not reflect any fees or expenses. The performance of other share classes will be greater than or less than that of the class depicted below. (See Notes to Performance Summary.)
Performance data shown represents past performance and is no guarantee of future results. Investment return and principal value fluctuate so your units, when sold, may be worth more or less than the original cost; current performance may be lower or higher than quoted. The performance shown does not reflect the deduction of taxes, if any, that a contract holder would pay on fund distributions or the redemption of contract units. The returns for the fund shown also do not reflect the deduction of expenses associated with variable products, such as mortality and expense risk charges, separate account charges, and sales charges imposed by the insurance company separate accounts. Such expenses would reduce the overall returns shown.
Growth of a Hypothetical $10,000 Investment
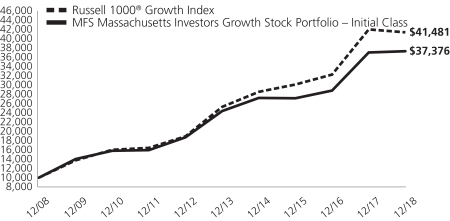
Total Returns through 12/31/18
Average annual total returns
| | | | | | | | | | | | |
| | | Share Class | | Class Inception Date | | 1-yr | | 5-yr | | 10-yr | | |
| | | Initial Class | | 5/06/98 | | 0.81% | | 8.87% | | 14.09% | | |
| | | Service Class | | 8/24/01 | | 0.58% | | 8.62% | | 13.81% | | |
| | | | |
Comparative benchmark(s) | | | | | | | | |
| | | Russell 1000® Growth Index (f) | | (1.51)% | | 10.40% | | 15.29% | | |
| (f) | Source: FactSet Research Systems Inc. |
Benchmark Definition(s)
Russell 1000® Growth Index – constructed to provide a comprehensive barometer for growth securities in the large-cap segment of the U.S. equity universe. Companies in this index generally have higher price-to-book ratios and higher forecasted growth values. The Russell 1000® Growth Index is a trademark/service mark of the Frank Russell Company. Russell® is a trademark of the Frank Russell Company.
It is not possible to invest directly in an index.
Notes to Performance Summary
Average annual total return represents the average annual change in value for each share class for the periods presented.
Performance results reflect any applicable expense subsidies and waivers in effect during the periods shown. Without such subsidies and waivers the fund’s performance results would be less favorable. Please see the prospectus and financial statements for complete details. All results are historical and assume the reinvestment of any dividends and capital gains distributions.
Performance results do not include adjustments made for financial reporting purposes in accordance with U.S. generally accepted accounting principles and may differ from amounts reported in the financial highlights.
From time to time the fund may receive proceeds from litigation settlements, without which performance would be lower.
5
MFS Massachusetts Investors Growth Stock Portfolio
EXPENSE TABLE
Fund Expenses Borne by the Contract Holders during the Period,
July 1, 2018 through December 31, 2018
As a contract holder of the fund, you incur ongoing costs, including management fees; distribution and/or service(12b-1) fees; and other fund expenses. This example is intended to help you understand your ongoing costs (in dollars) of investing in the fund and to compare these costs with the ongoing costs of investing in other mutual funds.
The example is based on an investment of $1,000 invested at the beginning of the period and held for the entire period July 1, 2018 through December 31, 2018.
Actual Expenses
The first line for each share class in the following table provides information about actual account values and actual expenses. You may use the information in this line, together with the amount you invested, to estimate the expenses that you paid over the period. Simply divide your account value by $1,000 (for example, an $8,600 account value divided by $1,000 = 8.6), then multiply the result by the number in the first line under the heading entitled “Expenses Paid During Period” to estimate the expenses you paid on your account during this period.
Hypothetical Example for Comparison Purposes
The second line for each share class in the following table provides information about hypothetical account values and hypothetical expenses based on the fund’s actual expense ratio and an assumed rate of return of 5% per year before expenses, which is not the fund’s actual return. The hypothetical account values and expenses may not be used to estimate the actual ending account balance or expenses you paid for the period. You may use this information to compare the ongoing costs of investing in the fund and other funds. To do so, compare this 5% hypothetical example with the 5% hypothetical examples that appear in the shareholder reports of the other funds.
Please note that the expenses shown in the table are meant to highlight the fund’s ongoing costs only and do not take into account the fees and expenses imposed under the variable contracts through which your investment in the fund is made. Therefore, the second line for each share class in the table is useful in comparing ongoing costs associated with an investment in vehicles (such as the fund) which fund benefits under variable annuity and variable life insurance contracts and to qualified pension and retirement plans only, and will not help you determine the relative total costs of investing in the fund through variable annuity and variable life insurance contracts. If the fees and expenses imposed under the variable contracts were included, your costs would have been higher.
| | | | | | | | | | | | | | | | | | |
| Share Class | | | | Annualized
Expense Ratio | | | Beginning
Account Value
7/01/18 | | | Ending
Account Value
12/31/18 | | | Expenses Paid
During Period (p)
7/01/18-12/31/18 | |
| Initial Class | | Actual | | | 0.79% | | | | $1,000.00 | | | | $955.20 | | | | $3.89 | |
| | Hypothetical (h) | | | 0.79% | | | | $1,000.00 | | | | $1,021.22 | | | | $4.02 | |
| Service Class | | Actual | | | 1.04% | | | | $1,000.00 | | | | $953.87 | | | | $5.12 | |
| | Hypothetical (h) | | | 1.04% | | | | $1,000.00 | | | | $1,019.96 | | | | $5.30 | |
| (h) | 5% class return per year before expenses. |
| (p) | “Expenses Paid During Period” are equal to each class’s annualized expense ratio, as shown above, multiplied by the average account value over the period, multiplied by 184/365 (to reflect theone-half year period). |
6
MFS Massachusetts Investors Growth Stock Portfolio
PORTFOLIO OF INVESTMENTS – 12/31/18
The Portfolio of Investments is a complete list of all securities owned by your fund. It is categorized by broad-based asset classes.
| | | | | | | | |
| | |
| Issuer | | Shares/Par | | | Value ($) | |
| | | | | | | | |
| COMMON STOCKS – 99.2% | | | | | | | | |
| Aerospace – 1.7% | | | | | |
| United Technologies Corp. | | | 128,876 | | | $ | 13,722,717 | |
| | | | | | | | |
| Apparel Manufacturers – 6.2% | | | | | |
| Adidas AG | | | 40,207 | | | $ | 8,402,649 | |
| LVMH Moet Hennessy Louis Vuitton SE | | | 49,873 | | | | 14,754,057 | |
| NIKE, Inc., “B” | | | 239,833 | | | | 17,781,219 | |
| VF Corp. | | | 127,437 | | | | 9,091,356 | |
| | | | | | | | |
| | | | | | $ | 50,029,281 | |
| | | | | | | | |
| Broadcasting – 0.4% | | | | | |
| Walt Disney Co. | | | 31,851 | | | $ | 3,492,462 | |
| | | | | | | | |
| Brokerage & Asset Managers – 3.5% | | | | | |
| Blackstone Group LP | | | 571,597 | | | $ | 17,039,306 | |
| Charles Schwab Corp. | | | 169,264 | | | | 7,029,534 | |
| CME Group, Inc. | | | 24,531 | | | | 4,614,772 | |
| | | | | | | | |
| | | | | | $ | 28,683,612 | |
| | | | | | | | |
| Business Services – 13.1% | | | | | |
| Accenture PLC, “A” | | | 197,872 | | | $ | 27,901,931 | |
| Cognizant Technology Solutions Corp., “A” | | | 246,649 | | | | 15,657,279 | |
| Equifax, Inc. | | | 34,968 | | | | 3,256,570 | |
| Experian Group Ltd. | | | 418,578 | | | | 10,163,545 | |
| Fidelity National Information Services, Inc. | | | 173,835 | | | | 17,826,779 | |
| Fiserv, Inc. (a) | | | 231,566 | | | | 17,017,785 | |
| Verisk Analytics, Inc., “A” (a) | | | 131,633 | | | | 14,353,262 | |
| | | | | | | | |
| | | | | | $ | 106,177,151 | |
| | | | | | | | |
| Cable TV – 2.5% | | | | | |
| Comcast Corp., “A” | | | 602,485 | | | $ | 20,514,614 | |
| | | | | | | | |
| Chemicals – 2.1% | | | | | |
| LyondellBasell Industries N.V., “A” | | | 28,344 | | | $ | 2,357,087 | |
| PPG Industries, Inc. | | | 141,747 | | | | 14,490,796 | |
| | | | | | | | |
| | | | | | $ | 16,847,883 | |
| | | | | | | | |
| Computer Software – 4.7% | | | | | |
| Microsoft Corp. | | | 376,095 | | | $ | 38,199,969 | |
| | | | | | | | |
| Computer Software – Systems – 2.5% | | | | | |
| Apple, Inc. | | | 129,700 | | | $ | 20,458,878 | |
| | | | | | | | |
| Construction – 1.5% | | | | | |
| Sherwin-Williams Co. | | | 31,778 | | | $ | 12,503,372 | |
| | | | | | | | |
| Consumer Products – 6.6% | | | | | |
| Church & Dwight Co., Inc. | | | 107,432 | | | $ | 7,064,728 | |
| Colgate-Palmolive Co. | | | 282,673 | | | | 16,824,697 | |
| Estee Lauder Cos., Inc., “A” | | | 107,793 | | | | 14,023,869 | |
| L’Oréal | | | 23,133 | | | | 5,332,731 | |
| Reckitt Benckiser Group PLC | | | 137,938 | | | | 10,571,801 | |
| | | | | | | | |
| | | | | | $ | 53,817,826 | |
| | | | | | | | |
| Electrical Equipment – 4.2% | | | | | |
| Amphenol Corp., “A” | | | 151,265 | | | $ | 12,255,490 | |
| Fortive Corp. | | | 138,599 | | | | 9,377,608 | |
| Mettler-Toledo International, Inc. (a) | | | 22,823 | | | | 12,908,233 | |
| | | | | | | | |
| | | | | | $ | 34,541,331 | |
| | | | | | | | |
| | | | | | | | |
| | |
| Issuer | | Shares/Par | | | Value ($) | |
| | | | | | | | |
| COMMON STOCKS – continued | | | | | | | | |
| Electronics – 6.3% | | | | | |
| Analog Devices, Inc. | | | 183,939 | | | $ | 15,787,484 | |
| Taiwan Semiconductor Manufacturing Co. Ltd., ADR | | | 299,520 | | | | 11,055,283 | |
| Texas Instruments, Inc. | | | 253,727 | | | | 23,977,202 | |
| | | | | | | | |
| | | | | | $ | 50,819,969 | |
| | | | | | | | |
| Entertainment – 0.5% | | | | | |
| Twenty-First Century Fox, Inc. | | | 83,028 | | | $ | 3,995,307 | |
| | | | | | | | |
| Food & Beverages – 1.3% | | | | | |
| PepsiCo, Inc. | | | 91,961 | | | $ | 10,159,851 | |
| | | | | | | | |
| Gaming & Lodging – 0.8% | | | | | |
| Paddy Power Betfair PLC | | | 78,691 | | | $ | 6,419,170 | |
| | | | | | | | |
| Health Maintenance Organizations – 0.2% | | | | | |
| Cigna Corp. | | | 7,446 | | | $ | 1,414,208 | |
| | | | | | | | |
| Insurance – 2.9% | | | | | |
| Aon PLC | | | 164,000 | | | $ | 23,839,040 | |
| | | | | | | | |
| Internet – 8.1% | | | | | |
| Alibaba Group Holding Ltd., ADR (a) | | | 97,372 | | | $ | 13,346,780 | |
| Alphabet, Inc., “A” (a) | | | 50,369 | | | | 52,633,590 | |
| | | | | | | | |
| | | | | | $ | 65,980,370 | |
| | | | | | | | |
| Leisure & Toys – 2.0% | | | | | |
| Electronic Arts, Inc. (a) | | | 205,871 | | | $ | 16,245,281 | |
| | | | | | | | |
| Machinery & Tools – 2.2% | | | | | |
| Colfax Corp. (a) | | | 64,401 | | | $ | 1,345,981 | |
| Nordson Corp. | | | 139,214 | | | | 16,615,191 | |
| | | | | | | | |
| | | | | | $ | 17,961,172 | |
| | | | | | | | |
| Medical & Health Technology & Services – 0.5% | |
| CVS Health Corp. | | | 65,887 | | | $ | 4,316,916 | |
| | | | | | | | |
| Medical Equipment – 8.4% | | | | | |
| Abbott Laboratories | | | 238,122 | | | $ | 17,223,364 | |
| Cooper Cos., Inc. | | | 18,317 | | | | 4,661,677 | |
| Danaher Corp. | | | 129,219 | | | | 13,325,063 | |
| Thermo Fisher Scientific, Inc. | | | 89,661 | | | | 20,065,235 | |
| Waters Corp. (a) | | | 68,530 | | | | 12,928,185 | |
| | | | | | | | |
| | | | | | $ | 68,203,524 | |
| | | | | | | | |
| Oil Services – 0.1% | | | | | |
| Schlumberger Ltd. | | | 21,692 | | | $ | 782,647 | |
| | | | | | | | |
| Other Banks & Diversified Financials – 5.2% | | | | | |
| Mastercard, Inc., “A” | | | 87,179 | | | $ | 16,446,319 | |
| Visa, Inc., “A” | | | 198,796 | | | | 26,229,144 | |
| | | | | | | | |
| | | | | | $ | 42,675,463 | |
| | | | | | | | |
| Pharmaceuticals – 1.6% | | | | | |
| Elanco Animal Health, Inc. (a) | | | 17,778 | | | $ | 560,541 | |
| Eli Lilly & Co. | | | 48,692 | | | | 5,634,638 | |
| Zoetis, Inc. | | | 78,880 | | | | 6,747,395 | |
| | | | | | | | |
| | | | | | $ | 12,942,574 | |
| | | | | | | | |
7
MFS Massachusetts Investors Growth Stock Portfolio
Portfolio of Investments – continued
| | | | | | | | |
| Issuer | | Shares/Par | | | Value ($) | |
| | | | | | | | |
| COMMON STOCKS – continued | | | | | |
| Printing & Publishing – 1.9% | | | | | |
| Moody’s Corp. | | | 109,690 | | | $ | 15,360,988 | |
| | | | | | | | |
| Railroad & Shipping – 1.8% | | | | | |
| Union Pacific Corp. | | | 103,561 | | | $ | 14,315,237 | |
| | | | | | | | |
| Restaurants – 2.4% | | | | | |
| Starbucks Corp. | | | 308,280 | | | $ | 19,853,232 | |
| | | | | | | | |
| Specialty Chemicals – 1.5% | | | | | |
| Ecolab, Inc. | | | 83,972 | | | $ | 12,373,274 | |
| | | | | | | | |
| Specialty Stores – 2.5% | | | | | |
| AutoZone, Inc. (a) | | | 5,527 | | | $ | 4,633,505 | |
| TJX Cos., Inc. | | | 348,193 | | | | 15,578,155 | |
| | | | | | | | |
| | | | | | $ | 20,211,660 | |
| | | | | | | | |
Total Common Stocks
(Identified Cost, $529,960,039) | | | | | | $ | 806,858,979 | |
| | | | | | | | |
| | | | | | | | |
| Issuer | | Shares/Par | | | Value ($) | |
| | | | | | | | |
| INVESTMENT COMPANIES (h) – 0.8% | | | | | |
| Money Market Funds – 0.8% | | | | | |
| MFS Institutional Money Market Portfolio, 2.4% (v) (Identified Cost, $6,790,527) | | | 6,791,206 | | | $ | 6,790,527 | |
| | | | | | | | |
OTHER ASSETS, LESS
LIABILITIES – 0.0% | | | | | | | 83,841 | |
| | | | | | | | |
| NET ASSETS – 100.0% | | | | | | $ | 813,733,347 | |
| | | | | | | | |
| (a) | | Non-income producing security. |
| (h) | | An affiliated issuer, which may be considered one in which the fund owns 5% or more of the outstanding voting securities, or a company which is under common control. At period end, the aggregate values of the fund’s investments in affiliated issuers and in unaffiliated issuers were $6,790,527 and $806,858,979, respectively. |
| (v) | | Affiliated issuer that is available only to investment companies managed by MFS. The rate quoted for the MFS Institutional Money Market Portfolio is the annualizedseven-day yield of the fund at period end. |
The following abbreviations are used in this report and are defined:
| ADR | | American Depositary Receipt |
| PLC | | Public Limited Company |
See Notes to Financial Statements
8
MFS Massachusetts Investors Growth Stock Portfolio
FINANCIAL STATEMENTS | STATEMENT OF ASSETS AND LIABILITIES
This statement represents your fund’s balance sheet, which details the assets and liabilities comprising the total value of the fund.
| | | | |
At 12/31/18 | | | | |
| |
Assets | | | | |
Investments in unaffiliated issuers, at value (identified cost, $529,960,039) | | | $806,858,979 | |
Investments in affiliated issuers, at value (identified cost, $6,790,527) | | | 6,790,527 | |
Receivables for | | | | |
Fund shares sold | | | 177,531 | |
Interest and dividends | | | 678,050 | |
Other assets | | | 5,122 | |
Total assets | | | $814,510,209 | |
| |
Liabilities | | | | |
Payables for | | | | |
Fund shares reacquired | | | $578,329 | |
Payable to affiliates | | | | |
Investment adviser | | | 66,651 | |
Shareholder servicing costs | | | 248 | |
Distribution and/or service fees | | | 8,705 | |
Payable for independent Trustees’ compensation | | | 2 | |
Accrued expenses and other liabilities | | | 122,927 | |
Total liabilities | | | $776,862 | |
Net assets | | | $813,733,347 | |
| |
Net assets consist of | | | | |
Paid-in capital | | | $461,902,139 | |
Total distributable earnings (loss) | | | 351,831,208 | |
Net assets | | | $813,733,347 | |
Shares of beneficial interest outstanding | | | 46,464,920 | |
| | | | | | | | | | | | |
| | | |
| | | Net assets | | | Shares
outstanding | | | Net asset value
per share | |
Initial Class | | | $493,783,024 | | | | 28,054,691 | | | | $17.60 | |
Service Class | | | 319,950,323 | | | | 18,410,229 | | | | 17.38 | |
See Notes to Financial Statements
9
MFS Massachusetts Investors Growth Stock Portfolio
FINANCIAL STATEMENTS | STATEMENT OF OPERATIONS
This statement describes how much your fund earned in investment income and accrued in expenses. It also describes any gains and/or losses generated by fund operations.
| | | | |
Year ended 12/31/18 | | | | |
| |
Net investment income (loss) | | | | |
Income | | | | |
Dividends | | | $13,235,578 | |
Dividends from affiliated issuers | | | 120,267 | |
Income on securities loaned | | | 57,916 | |
Other | | | 31,285 | |
Foreign taxes withheld | | | (230,974 | ) |
Total investment income | | | $13,214,072 | |
Expenses | | | | |
Management fee | | | $6,894,871 | |
Distribution and/or service fees | | | 905,280 | |
Shareholder servicing costs | | | 30,924 | |
Administrative services fee | | | 139,944 | |
Independent Trustees’ compensation | | | 12,944 | |
Custodian fee | | | 54,873 | |
Shareholder communications | | | 75,655 | |
Audit and tax fees | | | 57,449 | |
Legal fees | | | 8,116 | |
Miscellaneous | | | 38,304 | |
Total expenses | | | $8,218,360 | |
Reduction of expenses by investment adviser | | | (87,534 | ) |
Net expenses | | | $8,130,826 | |
Net investment income (loss) | | | $5,083,246 | |
| |
Realized and unrealized gain (loss) | | | | |
Realized gain (loss) (identified cost basis) | | | | |
Unaffiliated issuers | | | $71,417,732 | |
Affiliated issuers | | | 143 | |
Foreign currency | | | (9,598 | ) |
Net realized gain (loss) | | | $71,408,277 | |
Change in unrealized appreciation or depreciation | | | | |
Unaffiliated issuers | | | $(63,322,978 | ) |
Translation of assets and liabilities in foreign currencies | | | (5,658 | ) |
Net unrealized gain (loss) | | | $(63,328,636 | ) |
Net realized and unrealized gain (loss) | | | $8,079,641 | |
Change in net assets from operations | | | $13,162,887 | |
See Notes to Financial Statements
10
MFS Massachusetts Investors Growth Stock Portfolio
FINANCIAL STATEMENTS | STATEMENTS OF CHANGES IN NET ASSETS
These statements describe the increases and/or decreases in net assets resulting from operations, any distributions, and any shareholder transactions.
| | | | | | | | |
| | | Year ended | |
| | | 12/31/18 | | | 12/31/17 | |
Change in net assets | | | | | | | | |
| | |
From operations | | | | | | | | |
Net investment income (loss) | | | $5,083,246 | | | | $5,035,640 | |
Net realized gain (loss) | | | 71,408,277 | | | | 52,197,235 | |
Net unrealized gain (loss) | | | (63,328,636 | ) | | | 163,752,913 | |
Change in net assets from operations | | | $13,162,887 | | | | $220,985,788 | |
Total distributions to shareholders (a) | | | $(57,933,374 | ) | | | $(50,886,432 | ) |
Change in net assets from fund share transactions | | | $(73,917,493 | ) | | | $(67,274,706 | ) |
Total change in net assets | | | $(118,687,980 | ) | | | $102,824,650 | |
| | |
Net assets | | | | | | | | |
At beginning of period | | | 932,421,327 | | | | 829,596,677 | |
At end of period (b) | | | $813,733,347 | | | | $932,421,327 | |
| (a) | Distributions from net investment income and from net realized gain are no longer required to be separately disclosed. See Note 2. For the year ended December 31, 2017, distributions from net investment income and from net realized gain were $4,930,035 and $45,956,397, respectively. |
| (b) | Parenthetical disclosure of undistributed net investment income is no longer required. See Note 2. For the year ended December 31, 2017, end of period net assets included undistributed net investment income of $5,031,671. |
See Notes to Financial Statements
11
MFS Massachusetts Investors Growth Stock Portfolio
FINANCIAL STATEMENTS | FINANCIAL HIGHLIGHTS
The financial highlights table is intended to help you understand the fund’s financial performance for the past 5 years. Certain information reflects financial results for a single fund share. The total returns in the table represent the rate that an investor would have earned (or lost) on an investment in the fund share class (assuming reinvestment of all distributions) held for the entire period.
| | | | | | | | | | | | | | | | | | | | |
| Initial Class | | Year ended | |
| | | | | |
| | | 12/31/18 | | | 12/31/17 | | | 12/31/16 | | | 12/31/15 | | | 12/31/14 | |
| | | | | |
Net asset value, beginning of period | | | $18.60 | | | | $15.38 | | | | $16.38 | | | | $17.61 | | | | $17.31 | |
| | | | | |
| Income (loss) from investment operations | | | | | | | | | | | | | | | | | | | | |
Net investment income (loss) (d) | | | $0.13 | | | | $0.11 | | | | $0.11 | (c) | | | $0.10 | | | | $0.14 | |
Net realized and unrealized gain (loss) | | | 0.16 | | | | 4.16 | | | | 0.95 | | | | (0.21 | ) | | | 1.77 | |
Total from investment operations | | | $0.29 | | | | $4.27 | | | | $1.06 | | | | $(0.11 | ) | | | $1.91 | |
| | | | | |
| Less distributions declared to shareholders | | | | | | | | | | | | | | | | | | | | |
From net investment income | | | $(0.12 | ) | | | $(0.12 | ) | | | $(0.10 | ) | | | $(0.09 | ) | | | $(0.10 | ) |
From net realized gain | | | (1.17 | ) | | | (0.93 | ) | | | (1.96 | ) | | | (1.03 | ) | | | (1.51 | ) |
Total distributions declared to shareholders | | | $(1.29 | ) | | | $(1.05 | ) | | | $(2.06 | ) | | | $(1.12 | ) | | | $(1.61 | ) |
Net asset value, end of period (x) | | | $17.60 | | | | $18.60 | | | | $15.38 | | | | $16.38 | | | | $17.61 | |
Total return (%) (k)(r)(s)(x) | | | 0.81 | | | | 28.42 | | | | 6.08 | (c) | | | (0.12 | ) | | | 11.51 | |
| | | | | |
Ratios (%) (to average net assets)
and Supplemental data: | | | | | | | | | | | | | | | | | | | | |
Expenses before expense reductions (f) | | | 0.80 | | | | 0.81 | | | | 0.78 | (c) | | | 0.79 | | | | 0.80 | |
Expenses after expense reductions (f) | | | 0.79 | | | | 0.80 | | | | 0.77 | (c) | | | 0.79 | | | | 0.80 | |
Net investment income (loss) | | | 0.65 | | | | 0.66 | | | | 0.70 | (c) | | | 0.56 | | | | 0.81 | |
Portfolio turnover | | | 23 | | | | 21 | | | | 24 | | | | 27 | | | | 23 | |
Net assets at end of period (000 omitted) | | | $493,783 | | | | $562,471 | | | | $500,924 | | | | $537,645 | | | | $542,830 | |
| |
| Service Class | | Year ended | |
| | | | | |
| | | 12/31/18 | | | 12/31/17 | | | 12/31/16 | | | 12/31/15 | | | 12/31/14 | |
| | | | | |
Net asset value, beginning of period | | | $18.38 | | | | $15.21 | | | | $16.22 | | | | $17.48 | | | | $17.19 | |
| | | | | |
| Income (loss) from investment operations | | | | | | | | | | | | | | | | | | | | |
Net investment income (loss) (d) | | | $0.08 | | | | $0.07 | | | | $0.07 | (c) | | | $0.06 | | | | $0.10 | |
Net realized and unrealized gain (loss) | | | 0.16 | | | | 4.10 | | | | 0.94 | | | | (0.21 | ) | | | 1.75 | |
Total from investment operations | | | $0.24 | | | | $4.17 | | | | $1.01 | | | | $(0.15 | ) | | | $1.85 | |
| | | | | |
| Less distributions declared to shareholders | | | | | | | | | | | | | | | | | | | | |
From net investment income | | | $(0.07 | ) | | | $(0.07 | ) | | | $(0.06 | ) | | | $(0.08 | ) | | | $(0.05 | ) |
From net realized gain | | | (1.17 | ) | | | (0.93 | ) | | | (1.96 | ) | | | (1.03 | ) | | | (1.51 | ) |
Total distributions declared to shareholders | | | $(1.24 | ) | | | $(1.00 | ) | | | $(2.02 | ) | | | $(1.11 | ) | | | $(1.56 | ) |
Net asset value, end of period (x) | | | $17.38 | | | | $18.38 | | | | $15.21 | | | | $16.22 | | | | $17.48 | |
Total return (%) (k)(r)(s)(x) | | | 0.58 | | | | 28.10 | | | | 5.84 | (c) | | | (0.33 | ) | | | 11.23 | |
| | | | | |
Ratios (%) (to average net assets)
and Supplemental data: | | | | | | | | | | | | | | | | | | | | |
Expenses before expense reductions (f) | | | 1.05 | | | | 1.06 | | | | 1.03 | (c) | | | 1.04 | | | | 1.05 | |
Expenses after expense reductions (f) | | | 1.04 | | | | 1.05 | | | | 1.02 | (c) | | | 1.03 | | | | 1.05 | |
Net investment income (loss) | | | 0.40 | | | | 0.41 | | | | 0.45 | (c) | | | 0.35 | | | | 0.55 | |
Portfolio turnover | | | 23 | | | | 21 | | | | 24 | | | | 27 | | | | 23 | |
Net assets at end of period (000 omitted) | | | $319,950 | | | | $369,950 | | | | $328,673 | | | | $337,742 | | | | $50,731 | |
See Notes to Financial Statements
12
MFS Massachusetts Investors Growth Stock Portfolio
Financial Highlights – continued
| (c) | Amount reflects aone-time reimbursement of expenses by the custodian (or former custodian) without which net investment income and performance would be lower and expenses would be higher. |
| (d) | Per share data is based on average shares outstanding. |
| (f) | Ratios do not reflect reductions from fees paid indirectly, if applicable. |
| (k) | The total return does not reflect expenses that apply to separate accounts. Inclusion of these charges would reduce the total return figures for all periods shown. |
| (r) | Certain expenses have been reduced without which performance would have been lower. |
| (s) | From time to time the fund may receive proceeds from litigation settlements, without which performance would be lower. |
| (x) | The net asset values and total returns have been calculated on net assets which include adjustments made in accordance with U.S. generally accepted accounting principles required at period end for financial reporting purposes. |
See Notes to Financial Statements
13
MFS Massachusetts Investors Growth Stock Portfolio
NOTES TO FINANCIAL STATEMENTS
| (1) | | Business and Organization |
MFS Massachusetts Investors Growth Stock Portfolio (the fund) is a diversified series of MFS Variable Insurance Trust II (the trust). The trust is organized as a Massachusetts business trust and is registered under the Investment Company Act of 1940, as amended, as anopen-end management investment company. The shareholders of each series of the trust are separate accounts of insurance companies, which offer variable annuity and/or life insurance products, and qualified retirement and pension plans.
The fund is an investment company and accordingly follows the investment company accounting and reporting guidance of the Financial Accounting Standards Board (FASB) Accounting Standards Codification Topic 946 Financial Services – Investment Companies.
| (2) | | Significant Accounting Policies |
General– The preparation of financial statements in conformity with U.S. generally accepted accounting principles requires management to make estimates and assumptions that affect the reported amounts of assets and liabilities, and disclosure of contingent assets and liabilities at the date of the financial statements and the reported amounts of increases and decreases in net assets from operations during the reporting period. Actual results could differ from those estimates. In the preparation of these financial statements, management has evaluated subsequent events occurring after the date of the fund’s Statement of Assets and Liabilities through the date that the financial statements were issued.
In August 2018, the FASB issued Accounting Standards Update2018-13, Fair Value Measurement (Topic 820) – Disclosure Framework – Changes to the Disclosure Requirements for Fair Value Measurement (“ASU2018-13”) which introduces new fair value disclosure requirements as well as eliminates and modifies certain existing fair value disclosure requirements. ASU2018-13 would be effective for fiscal years beginning after December 15, 2019, and interim periods within those fiscal years; however, management has elected to early adopt ASU2018-13 effective with the current reporting period. The impact of the fund’s adoption was limited to changes in the fund’s financial statement disclosures regarding fair value, primarily those disclosures related to transfers between levels of the fair value hierarchy.
In August 2018, the Securities and Exchange Commission (SEC) released its Final Rule on Disclosure Update and Simplification (the “Final Rule”) which is intended to simplify an issuer’s disclosure compliance efforts by removing redundant or outdated disclosure requirements without significantly altering the mix of information provided to investors. Effective with the current reporting period, the fund adopted the Final Rule with the impacts being that the fund is no longer required to present the components of distributable earnings on the Statement of Assets and Liabilities or the sources of distributions to shareholders and the amount of undistributed net investment income on the Statements of Changes in Net Assets.
Balance Sheet Offsetting– The fund’s accounting policy with respect to balance sheet offsetting is that, absent an event of default by the counterparty or a termination of the agreement, the International Swaps and Derivatives Association (ISDA) Master Agreement, or similar agreement, does not result in an offset of reported amounts of financial assets and financial liabilities in the Statement of Assets and Liabilities across transactions between the fund and the applicable counterparty. The fund’s right to setoff may be restricted or prohibited by the bankruptcy or insolvency laws of the particular jurisdiction to which a specific master netting agreement counterparty is subject. Balance sheet offsetting disclosures, to the extent applicable to the fund, have been included in the fund’s Significant Accounting Policies note under the captions for each of the fund’sin-scope financial instruments and transactions.
Investment Valuations– Equity securities, including restricted equity securities, are generally valued at the last sale or official closing price on their primary market or exchange as provided by a third-party pricing service. Equity securities, for which there were no sales reported that day, are generally valued at the last quoted daily bid quotation on their primary market or exchange as provided by a third-party pricing service. Short-term instruments with a maturity at issuance of 60 days or less may be valued at amortized cost, which approximates market value.Open-end investment companies are generally valued at net asset value per share. Securities and other assets generally valued on the basis of information from a third-party pricing service may also be valued at a broker/dealer bid quotation. In determining values, third-party pricing services can utilize both transaction data and market information such as yield, quality, coupon rate, maturity, type of issue, trading characteristics, and other market data. The values of foreign securities and other assets and liabilities expressed in foreign currencies are converted to U.S. dollars using the mean of bid and asked prices for rates provided by a third-party pricing service.
The Board of Trustees has delegated primary responsibility for determining or causing to be determined the value of the fund’s investments (including any fair valuation) to the adviser pursuant to valuation policies and procedures approved by the Board. If the adviser determines that reliable market quotations are not readily available, investments are valued at fair value as determined in good faith by the adviser in accordance with such procedures under the oversight of the Board of Trustees. Under the fund’s valuation policies and procedures, market quotations are not considered to be readily available for most types of debt instruments and floating rate loans and many types of derivatives. These investments are generally valued at fair value based on information from third-party pricing services. In addition, investments may be valued at fair value if the adviser determines that an investment’s value
14
MFS Massachusetts Investors Growth Stock Portfolio
Notes to Financial Statements – continued
has been materially affected by events occurring after the close of the exchange or market on which the investment is principally traded (such as foreign exchange or market) and prior to the determination of the fund’s net asset value, or after the halting of trading of a specific security where trading does not resume prior to the close of the exchange or market on which the security is principally traded. Events that occur on a frequent basis after foreign markets close (such as developments in foreign markets and significant movements in the U.S. markets) and prior to the determination of the fund’s net asset value may be deemed to have a material effect on the value of securities traded in foreign markets. Accordingly, the fund’s foreign equity securities may often be valued at fair value. The adviser generally relies on third-party pricing services or other information (such as the correlation with price movements of similar securities in the same or other markets; the type, cost and investment characteristics of the security; the business and financial condition of the issuer; and trading and other market data) to assist in determining whether to fair value and at what value to fair value an investment. The value of an investment for purposes of calculating the fund’s net asset value can differ depending on the source and method used to determine value. When fair valuation is used, the value of an investment used to determine the fund’s net asset value may differ from quoted or published prices for the same investment. There can be no assurance that the fund could obtain the fair value assigned to an investment if it were to sell the investment at the same time at which the fund determines its net asset value per share.
Various inputs are used in determining the value of the fund’s assets or liabilities. These inputs are categorized into three broad levels. In certain cases, the inputs used to measure fair value may fall into different levels of the fair value hierarchy. In such cases, an investment’s level within the fair value hierarchy is based on the lowest level of input that is significant to the fair value measurement. The fund’s assessment of the significance of a particular input to the fair value measurement in its entirety requires judgment, and considers factors specific to the investment. Level 1 includes unadjusted quoted prices in active markets for identical assets or liabilities. Level 2 includes other significant observable market-based inputs (including quoted prices for similar securities, interest rates, prepayment speed, and credit risk). Level 3 includes unobservable inputs, which may include the adviser’s own assumptions in determining the fair value of investments. The following is a summary of the levels used as of December 31, 2018 in valuing the fund’s assets or liabilities:
| | | | | | | | | | | | | | | | |
| Financial Instruments | | Level 1 | | | Level 2 | | | Level 3 | | | Total | |
| Equity Securities | | | $806,858,979 | | | | $— | | | | $— | | | | $806,858,979 | |
| Mutual Funds | | | 6,790,527 | | | | — | | | | — | | | | 6,790,527 | |
| Total | | | $813,649,506 | | | | $— | | | | $— | | | | $813,649,506 | |
For further information regarding security characteristics, see the Portfolio of Investments.
Foreign Currency Translation– Purchases and sales of foreign investments, income, and expenses are converted into U.S. dollars based upon currency exchange rates prevailing on the respective dates of such transactions or on the reporting date for foreign denominated receivables and payables. Gains and losses attributable to foreign currency exchange rates on sales of securities are recorded for financial statement purposes as net realized gains and losses on investments. Gains and losses attributable to foreign exchange rate movements on receivables, payables, income and expenses are recorded for financial statement purposes as foreign currency transaction gains and losses. That portion of both realized and unrealized gains and losses on investments that results from fluctuations in foreign currency exchange rates is not separately disclosed.
Security Loans– Under its Securities Lending Agency Agreement with the fund, State Street Bank and Trust Company, as lending agent, loans the securities of the fund to certain qualified institutions (the “Borrowers”) approved by the fund. Security loans can be terminated at the discretion of either the lending agent or the fund and the related securities must be returned within the earlier of the standard trade settlement period for such securities or within three business days. The loans are collateralized by cash and/or U.S. Treasury and federal agency obligations in an amount typically at least equal to the market value of the securities loaned. On loans collateralized by cash, the cash collateral is invested in a money market fund. The market value of the loaned securities is determined at the close of business of the fund and any additional required collateral is delivered to the fund on the next business day. The lending agent provides the fund with indemnification against Borrower default. In the event of Borrower default, the lending agent will, for the benefit of the fund, either purchase securities identical to those loaned or, when such purchase is commercially impracticable, pay the fund the market value of the loaned securities. In return, the lending agent assumes the fund’s rights to the related collateral. If the collateral value is less than the cost to purchase identical securities, the lending agent is responsible for the shortfall, but only to the extent that such shortfall is not due to a decline in collateral value resulting from collateral reinvestment for which the fund bears the risk of loss. A portion of the income generated upon investment of the collateral is remitted to the Borrowers, and the remainder is allocated between the fund and the lending agent. On loans collateralized by U.S. Treasury and/or federal agency obligations, a fee is received from the Borrower, and is allocated between the fund and the lending agent. Income from securities lending is separately reported in the Statement of Operations. The dividend and interest income earned on the securities loaned is accounted for in the same manner as other dividend and interest income. At December 31, 2018, there were no securities on loan or collateral outstanding.
15
MFS Massachusetts Investors Growth Stock Portfolio
Notes to Financial Statements – continued
Indemnifications– Under the fund’s organizational documents, its officers and Trustees may be indemnified against certain liabilities and expenses arising out of the performance of their duties to the fund. Additionally, in the normal course of business, the fund enters into agreements with service providers that may contain indemnification clauses. The fund’s maximum exposure under these agreements is unknown as this would involve future claims that may be made against the fund that have not yet occurred.
Investment Transactions and Income– Investment transactions are recorded on the trade date. Interest income is recorded on the accrual basis. Dividends received in cash are recorded on theex-dividend date. Certain dividends from foreign securities will be recorded when the fund is informed of the dividend if such information is obtained subsequent to theex-dividend date. Dividend payments received in additional securities are recorded on theex-dividend date in an amount equal to the value of the security on such date.
The fund may receive proceeds from litigation settlements. Any proceeds received from litigation involving portfolio holdings are reflected in the Statement of Operations in realized gain/loss if the security has been disposed of by the fund or in unrealized gain/loss if the security is still held by the fund. Any other proceeds from litigation not related to portfolio holdings are reflected as other income in the Statement of Operations.
Tax Matters and Distributions– The fund intends to qualify as a regulated investment company, as defined under Subchapter M of the Internal Revenue Code, and to distribute all of its taxable income, including realized capital gains. As a result, no provision for federal income tax is required. The fund’s federal tax returns, when filed, will remain subject to examination by the Internal Revenue Service for a three year period. Management has analyzed the fund’s tax positions taken on federal and state tax returns for all open tax years and does not believe that there are any uncertain tax positions that require recognition of a tax liability. Foreign taxes, if any, have been accrued by the fund in the accompanying financial statements in accordance with the applicable foreign tax law. Foreign income taxes may be withheld by certain countries in which the fund invests. Additionally, capital gains realized by the fund on securities issued in or by certain foreign countries may be subject to capital gains tax imposed by those countries.
Distributions to shareholders are recorded on theex-dividend date. Income and capital gain distributions are determined in accordance with income tax regulations, which may differ from U.S. generally accepted accounting principles. Certain capital accounts in the financial statements are periodically adjusted for permanent differences in order to reflect their tax character. These adjustments have no impact on net assets or net asset value per share. Temporary differences which arise from recognizing certain items of income, expense, gain or loss in different periods for financial statement and tax purposes will reverse at some time in the future. Distributions in excess of net investment income or net realized gains are temporary overdistributions for financial statement purposes resulting from differences in the recognition or classification of income or distributions for financial statement and tax purposes.
Book/tax differences primarily relate to wash sale loss deferrals.
The tax character of distributions declared to shareholders for the last two fiscal years is as follows:
| | | | | | | | |
| | | Year ended
12/31/18 | | | Year ended
12/31/17 | |
| Ordinary income (including any short-term capital gains) | | | $9,646,280 | | | | $7,501,279 | |
| Long-term capital gains | | | 48,287,094 | | | | 43,385,153 | |
| Total distributions | | | $57,933,374 | | | | $50,886,432 | |
The federal tax cost and the tax basis components of distributable earnings were as follows:
| | | | |
| As of 12/31/18 | | | | |
| |
| Cost of investments | | | $539,076,711 | |
| Gross appreciation | | | 291,084,745 | |
| Gross depreciation | | | (16,511,950 | ) |
| Net unrealized appreciation (depreciation) | | | $274,572,795 | |
| |
| Undistributed ordinary income | | | 9,803,031 | |
| Undistributed long-term capital gain | | | 67,455,400 | |
| Other temporary differences | | | (18 | ) |
Multiple Classes of Shares of Beneficial Interest– The fund offers multiple classes of shares, which differ in their respective distribution and/or service fees. The fund’s income, realized and unrealized gain (loss), and common expenses are allocated to shareholders based on the daily net assets of each class. Dividends are declared separately for each class. Differences in per share
16
MFS Massachusetts Investors Growth Stock Portfolio
Notes to Financial Statements – continued
dividend rates are generally due to differences in separate class expenses. The fund’s distributions declared to shareholders as reported in the Statements of Changes in Net Assets are presented by class as follows:
| | | | | | | | | | | | | | | | |
| | | From net investment
income | | | From net realized
gain | |
| | | Year ended
12/31/18 | | | Year ended
12/31/17 | | | Year ended
12/31/18 | | | Year ended
12/31/17 | |
| Initial Class | | | $3,178,874 | | | | $3,459,849 | | | | $32,343,736 | | | | $27,586,603 | |
| Service Class | | | 1,200,214 | | | | 1,470,186 | | | | 21,210,550 | | | | 18,369,794 | |
| Total | | | $4,379,088 | | | | $4,930,035 | | | | $53,554,286 | | | | $45,956,397 | |
| (3) | | Transactions with Affiliates |
Investment Adviser– The fund has an investment advisory agreement with MFS to provide overall investment management and related administrative services and facilities to the fund. The management fee is computed daily and paid monthly at the following annual rates based on the fund’s average daily net assets:
| | | | |
| Up to $1 billion | | | 0.75% | |
| In excess of $1 billion | | | 0.65% | |
MFS has agreed in writing to reduce its management fee by a specified amount if certain MFS mutual fund assets exceed thresholds agreed to by MFS and the fund’s Board of Trustees. For the year ended December 31, 2018, this management fee reduction amounted to $87,534, which is included in the reduction of total expenses in the Statement of Operations. The management fee incurred for the year ended December 31, 2018 was equivalent to an annual effective rate of 0.74% of the fund’s average daily net assets.
The investment adviser has agreed in writing to pay a portion of the fund’s total annual operating expenses, excluding interest, taxes, extraordinary expenses, brokerage and transaction costs, and investment-related expenses, such that total annual operating expenses do not exceed 0.82% of average daily net assets for the Initial Class shares and 1.07% of average daily net assets for the Service Class shares. This written agreement will continue until modified by the fund’s Board of Trustees, but such agreement will continue at least until April 30, 2020. For the year ended December 31, 2018, the fund’s actual operating expenses did not exceed the limit and therefore, the investment adviser did not pay any portion of the fund’s expenses related to this agreement.
Distributor– MFS Fund Distributors, Inc. (MFD), a wholly-owned subsidiary of MFS, is the distributor of shares of the fund. The Trustees have adopted a distribution plan for the Service Class shares pursuant to Rule12b-1 under the Investment Company Act of 1940.
The fund’s distribution plan provides that the fund will pay MFD distribution and/or service fees equal to 0.25% per annum of its average daily net assets attributable to Service Class shares as partial consideration for services performed and expenses incurred by MFD and financial intermediaries (including participating insurance companies that invest in the fund to fund variable annuity and variable life insurance contracts, sponsors of qualified retirement and pension plans that invest in the fund, and affiliates of these participating insurance companies and plan sponsors) in connection with the sale and distribution of the Service Class shares. MFD may subsequently pay all, or a portion, of the distribution and/or service fees to financial intermediaries.
Shareholder Servicing Agent– MFS Service Center, Inc. (MFSC), a wholly-owned subsidiary of MFS, receives a fee from the fund for its services as shareholder servicing agent. For the year ended December 31, 2018, the fee was $29,687, which equated to 0.0032% annually of the fund’s average daily net assets. MFSC also receives payment from the fund forout-of-pocket expenses paid by MFSC on behalf of the fund. For the year ended December 31, 2018, these costs amounted to $1,237.
Administrator– MFS provides certain financial, legal, shareholder communications, compliance, and other administrative services to the fund. Under an administrative services agreement, the fund reimburses MFS the costs incurred to provide these services. The fund is charged an annual fixed amount of $17,500 plus a fee based on average daily net assets. The administrative services fee incurred for the year ended December 31, 2018 was equivalent to an annual effective rate of 0.0152% of the fund’s average daily net assets.
Trustees’ and Officers’ Compensation– The fund pays compensation to independent Trustees in the form of a retainer, attendance fees, and additional compensation to Board and Committee chairpersons. The fund does not pay compensation directly to Trustees or officers of the fund who are also officers of the investment adviser, all of whom receive remuneration for their services to the fund from MFS. Certain officers and Trustees of the fund are officers or directors of MFS, MFD, and MFSC.
Other– This fund and certain other funds managed by MFS (the funds) have entered into a service agreement (the ISO Agreement) which provides for payment of fees solely by the funds to Tarantino LLC in return for the provision of services of an Independent Senior Officer (ISO) for the funds. Frank L. Tarantino serves as the ISO and is an officer of the funds and the sole member of Tarantino LLC. The funds can terminate the ISO Agreement with Tarantino LLC at any time under the terms of the ISO Agreement.
17
MFS Massachusetts Investors Growth Stock Portfolio
Notes to Financial Statements – continued
For the year ended December 31, 2018, the fee paid by the fund under this agreement was $1,565 and is included in “Miscellaneous” expense in the Statement of Operations. MFS has agreed to bear all expenses associated with office space, other administrative support, and supplies provided to the ISO.
The fund invests in the MFS Institutional Money Market Portfolio which is managed by MFS and seeks current income consistent with preservation of capital and liquidity. This money market fund does not pay a management fee to MFS.
The fund is permitted to engage in purchase and sale transactions with funds and accounts for which MFS serves as investment adviser orsub-adviser (“cross-trades”) pursuant to a policy adopted by the Board of Trustees. This policy has been designed to ensure that cross-trades conducted by the fund comply with Rule17a-7 under the Investment Company Act of 1940. During the year ended December 31, 2018, the fund engaged in purchase and sale transactions pursuant to this policy, which amounted to $982,831 and $171,981, respectively. The sales transactions resulted in net realized gains (losses) of $26,499.
Effective on or about January 3, 2018, the adviser has voluntarily undertaken to reimburse the fund from its own resources on a quarterly basis for the cost of investment research embedded in the cost of the fund’s securities trades. This agreement may be rescinded at any time. For the period on or about January 3, 2018 to December 31, 2018, this reimbursement amounted to $31,139, which is included in “Other” income in the Statement of Operations.
For the year ended December 31, 2018, purchases and sales of investments, other than short-term obligations, aggregated $212,873,928 and $339,426,613, respectively.
| (5) | | Shares of Beneficial Interest |
The fund’s Declaration of Trust permits the Trustees to issue an unlimited number of full and fractional shares of beneficial interest. Transactions in fund shares were as follows:
| | | | | | | | | | | | | | | | |
| | | Year ended 12/31/18 | | | Year ended 12/31/17 | |
| | | | |
| | | Shares | | | Amount | | | Shares | | | Amount | |
| Shares sold | | | | | | | | | | | | | | | | |
Initial Class | | | 382,702 | | | | $7,410,077 | | | | 318,747 | | | | $5,421,181 | |
Service Class | | | 772,807 | | | | 14,681,490 | | | | 798,916 | | | | 13,593,897 | |
| | | 1,155,509 | | | | $22,091,567 | | | | 1,117,663 | | | | $19,015,078 | |
| | | | |
| Shares issued to shareholders in reinvestment of distributions | | | | | | | | | | | | | | | | |
Initial Class | | | 1,805,928 | | | | $35,522,610 | | | | 1,841,427 | | | | $31,046,452 | |
Service Class | | | 1,152,817 | | | | 22,410,764 | | | | 1,189,447 | | | | 19,839,980 | |
| | | 2,958,745 | | | | $57,933,374 | | | | 3,030,874 | | | | $50,886,432 | |
| | | | |
| Shares reacquired | | | | | | | | | | | | | | | | |
Initial Class | | | (4,374,590 | ) | | | $(84,354,144 | ) | | | (4,487,162 | ) | | | $(77,760,647 | ) |
Service Class | | | (3,641,613 | ) | | | (69,588,290 | ) | | | (3,468,379 | ) | | | (59,415,569 | ) |
| | | (8,016,203 | ) | | | $(153,942,434 | ) | | | (7,955,541 | ) | | | $(137,176,216 | ) |
| | | | |
| Net change | | | | | | | | | | | | | | | | |
Initial Class | | | (2,185,960 | ) | | | $(41,421,457 | ) | | | (2,326,988 | ) | | | $(41,293,014 | ) |
Service Class | | | (1,715,989 | ) | | | (32,496,036 | ) | | | (1,480,016 | ) | | | (25,981,692 | ) |
| | | (3,901,949 | ) | | | $(73,917,493 | ) | | | (3,807,004 | ) | | | $(67,274,706 | ) |
The fund and certain other funds managed by MFS participate in a $1.25 billion unsecured committed line of credit, subject to a $1 billion sublimit, provided by a syndication of banks under a credit agreement. Borrowings may be made for temporary financing needs. Interest is charged to each fund, based on its borrowings, generally at a rate equal to the higher of the Overnight Bank Funding rate or daily one month LIBOR plus an agreed upon spread. A commitment fee, based on the average daily, unused portion of the committed line of credit, is allocated among the participating funds. In addition, the fund and other funds managed by MFS have established unsecured uncommitted borrowing arrangements with certain banks for temporary financing needs. Interest is charged to each fund, based on its borrowings, at a rate equal to the Overnight Bank Funding rate plus an agreed upon spread. For the year ended December 31, 2018, the fund’s commitment fee and interest expense were $5,388 and $0, respectively, and are included in “Miscellaneous” expense in the Statement of Operations.
18
MFS Massachusetts Investors Growth Stock Portfolio
Notes to Financial Statements – continued
| (7) | | Investments in Affiliated Issuers |
An affiliated issuer may be considered one in which the fund owns 5% or more of the outstanding voting securities, or a company which is under common control. For the purposes of this report, the fund assumes the following to be affiliated issuers:
| | | | | | | | | | | | | | | | | | |
| Affiliated Issuers | | | | Beginning
Shares/Par
Amount | | | Acquisitions
Shares/Par
Amount | | | Dispositions
Shares/Par
Amount | | | Ending
Shares/Par
Amount | |
| | | | | |
| MFS Institutional Money Market Portfolio | | | | | 7,006,794 | | | | 203,223,213 | | | | (203,438,801 | ) | | | 6,791,206 | |
| | | | | |
| Affiliated Issuers | | Realized
Gain (Loss) | | Change in
Unrealized
Appreciation/
Depreciation | | | Capital Gain
Distributions | | | Dividend
Income | | | Ending
Value | |
| | | | | |
| MFS Institutional Money Market Portfolio | | $143 | | | $— | | | | $— | | | | $120,267 | | | | $6,790,527 | |
19
MFS Massachusetts Investors Growth Stock Portfolio
REPORT OF INDEPENDENT REGISTERED PUBLIC ACCOUNTING FIRM
To the Board of Trustees of MFS Variable Insurance Trust II and the Shareholders of MFS Massachusetts Investors Growth Stock Portfolio:
Opinion on the Financial Statements and Financial Highlights
We have audited the accompanying statement of assets and liabilities of MFS Massachusetts Investors Growth Stock Portfolio (the “Fund”), including the portfolio of investments, as of December 31, 2018, the related statement of operations for the year then ended, the statements of changes in net assets for each of the two years in the period then ended, the financial highlights for each of the five years in the period then ended, and the related notes. In our opinion, the financial statements and financial highlights present fairly, in all material respects, the financial position of the Fund as of December 31, 2018, and the results of its operations for the year then ended, the changes in its net assets for each of the two years in the period then ended, and the financial highlights for each of the five years in the period then ended, in conformity with accounting principles generally accepted in the United States of America.
Basis for Opinion
These financial statements and financial highlights are the responsibility of the Fund’s management. Our responsibility is to express an opinion on the Fund’s financial statements and financial highlights based on our audits. We are a public accounting firm registered with the Public Company Accounting Oversight Board (United States) (PCAOB) and are required to be independent with respect to the Fund in accordance with the U.S. federal securities laws and the applicable rules and regulations of the Securities and Exchange Commission and the PCAOB.
We conducted our audits in accordance with the standards of the PCAOB. Those standards require that we plan and perform the audit to obtain reasonable assurance about whether the financial statements and financial highlights are free of material misstatement, whether due to error or fraud. The Fund is not required to have, nor were we engaged to perform, an audit of its internal control over financial reporting. As part of our audits we are required to obtain an understanding of internal control over financial reporting but not for the purpose of expressing an opinion on the effectiveness of the Fund’s internal control over financial reporting. Accordingly, we express no such opinion.
Our audits included performing procedures to assess the risks of material misstatement of the financial statements and financial highlights, whether due to error or fraud, and performing procedures that respond to those risks. Such procedures included examining, on a test basis, evidence regarding the amounts and disclosures in the financial statements and financial highlights. Our audits also included evaluating the accounting principles used and significant estimates made by management, as well as evaluating the overall presentation of the financial statements and financial highlights. Our procedures included confirmation of securities owned as of December 31, 2018, by correspondence with the custodian. We believe that our audits provide a reasonable basis for our opinion.
DELOITTE & TOUCHE LLP
Boston, Massachusetts
February 15, 2019
We have served as the auditor of one or more of the MFS investment companies since 1924.
20
MFS Massachusetts Investors Growth Stock Portfolio
TRUSTEES AND OFFICERS – IDENTIFICATION AND BACKGROUND
The Trustees and Officers of the Trust, as of February 1, 2019, are listed below, together with their principal occupations during the past five years. (Their titles may have varied during that period.) The address of each Trustee and Officer is 111 Huntington Avenue, Boston, Massachusetts 02199-7618.
| | | | | | | | | | |
Name, Age | | Position(s)
Held with Fund | | Trustee/Officer
Since (h) | | Number of MFS Funds overseen by the Trustee | | Principal Occupations
During the Past Five Years | | Other Directorships During the Past Five Years (j) |
| INTERESTED TRUSTEES |
Robert J. Manning (k) (age 55) | | Trustee | | February 2004 | | 135 | | Massachusetts Financial Services Company, Executive Chairman (since January 2017); Director; Chairman of the Board; Chief Executive Officer (until 2015);Co-Chief Executive Officer(2015-2016) | | N/A |
| | | | | |
Robin A. Stelmach (k) (age 57) | | Trustee | | January 2014 | | 135 | | Massachusetts Financial Services Company, Vice Chair (since January 2017); Chief Operating Officer and Executive Vice President (until January 2017) | | N/A |
|
| INDEPENDENT TRUSTEES |
John P. Kavanaugh (age 64) | | Trustee and Chair of Trustees | | January 2009 | | 135 | | Private investor | | N/A |
| | | | | |
Steven E. Buller (age 67) | | Trustee | | February 2014 | | 135 | | Financial Accounting Standards Advisory Council, Chairman(2014-2015); Public Company Accounting Oversight Board, Standing Advisory Group, Member (until 2014); BlackRock, Inc. (investment management), Managing Director (until 2014), BlackRock Finco UK (investment management), Director (until 2014) | | N/A |
| | | | | |
John A. Caroselli (age 64) | | Trustee | | March 2017 | | 135 | | JC Global Advisors, LLC (management consulting), President (since 2015); First Capital Corporation (commercial finance), Executive Vice President (until 2015) | | N/A |
| | | | | |
Maureen R. Goldfarb (age 63) | | Trustee | | January 2009 | | 135 | | Private investor | | N/A |
| | | | | |
Michael Hegarty (age 74) | | Trustee | | December 2004 | | 135 | | Private investor | | Rouse Properties Inc., Director (until 2016); Capmark Financial Group Inc., Director (until 2015) |
| | | | | |
Peter D. Jones (age 63) | | Trustee | | January 2019 | | 135 | | Franklin Templeton Distributors, Inc. (investment management), President (until 2015); Franklin Templeton Institutional, LLC (investment management), Chairman (until 2015) | | N/A |
| | | | | |
James W. Kilman, Jr. (age 57) | | Trustee | | January 2019 | | 135 | | KielStrand Capital LLC (family office and merchant bank), Chief Executive Officer (since 2016); Morgan Stanley & Co. (financial services), Vice Chairman of Investment Banking,Co-Head of Diversified Financials Coverage – Financial Institutions Investment Banking Group (until 2016) | | alpha-En Corporation, Director (since 2016) |
21
MFS Massachusetts Investors Growth Stock Portfolio
Trustees and Officers – continued
| | | | | | | | | | |
Name, Age | | Position(s)
Held with Fund | | Trustee/Officer
Since (h) | | Number of MFS Funds overseen by the Trustee | | Principal Occupations
During the Past Five Years | | Other Directorships During the Past Five Years (j) |
Clarence Otis, Jr. (age 62) | | Trustee | | March 2017 | | 135 | | Darden Restaurants, Inc., Chief Executive Officer (until 2014) | | VF Corporation, Director; Verizon Communications, Inc., Director; The Travelers Companies, Director; Federal Reserve Bank of Atlanta, Director (until 2015) |
| | | | | |
Maryanne L. Roepke (age 62) | | Trustee | | May 2014 | | 135 | | American Century Investments (investment management), Senior Vice President and Chief Compliance Officer (until 2014) | | N/A |
| | | | | |
Laurie J. Thomsen
(age 61) | | Trustee | | March 2005 | | 135 | | Private investor | | The Travelers Companies, Director; Dycom Industries, Inc., Director (since 2015) |
| | | | | | | | |
Name, Age | | Position(s)
Held with Fund | | Trustee/Officer
Since (h) | | Number of MFS Funds for which the Person is an Officer | | Principal Occupations During the Past Five Years |
| OFFICERS | | | | | | |
Christopher R. Bohane (k)
(age 45) | | Assistant Secretary and Assistant Clerk | | July 2005 | | 135 | | Massachusetts Financial Services Company, Vice President and Assistant General Counsel |
| | | | |
Kino Clark (k) (age 50) | | Assistant Treasurer | | January 2012 | | 135 | | Massachusetts Financial Services Company, Vice President |
| | | | |
John W. Clark, Jr. (k) (age 51) | | Assistant Treasurer | | April 2017 | | 135 | | Massachusetts Financial Services Company, Vice President (since March 2017); Deutsche Bank (financial services), Department Head – Treasurer’s Office (until February 2017) |
| | | | |
Thomas H. Connors (k) (age 59) | | Assistant Secretary and Assistant Clerk | | September 2012 | | 135 | | Massachusetts Financial Services Company, Vice President and Senior Counsel |
| | | | |
Ethan D. Corey (k)
(age 55) | | Assistant
Secretary and Assistant Clerk | | July 2005 | | 135 | | Massachusetts Financial Services Company, Senior Vice President and Associate General Counsel |
| | | | |
David L. DiLorenzo (k)
(age 50) | | President | | July 2005 | | 135 | | Massachusetts Financial Services Company, Senior Vice President |
| | | | |
Heidi W. Hardin (k) (age 51) | | Secretary and Clerk | | April 2017 | | 135 | | Massachusetts Financial Services Company, Executive Vice President and General Counsel (since March 2017); Harris Associates (investment management), General Counsel (from September 2015 to January 2017); Janus Capital Management LLC (investment management), Senior Vice President and General Counsel (until September 2015) |
| | | | |
Brian E. Langenfeld (k) (age 45) | | Assistant
Secretary and Assistant Clerk | | June 2006 | | 135 | | Massachusetts Financial Services Company, Vice President and Senior Counsel |
| | | | |
Amanda S. Mooradian (k) (age 39) | | Assistant
Secretary and Assistant Clerk | | September 2018 | | 135 | | Massachusetts Financial Services Company, Assistant Vice President and Counsel |
| | | | |
Susan A. Pereira (k)
(age 48) | | Assistant
Secretary and Assistant Clerk | | July 2005 | | 135 | | Massachusetts Financial Services Company, Vice President and Senior Counsel |
| | | | |
Kasey L. Phillips (k) (age 48) | | Assistant Treasurer | | September 2012 | | 135 | | Massachusetts Financial Services Company, Vice President |
| | | | |
Matthew A. Stowe (k) (age 44) | | Assistant Secretary and Assistant Clerk | | October 2014 | | 135 | | Massachusetts Financial Services Company, Vice President and Assistant General Counsel |
22
MFS Massachusetts Investors Growth Stock Portfolio
Trustees and Officers – continued
| | | | | | | | |
Name, Age | | Position(s)
Held with Fund | | Trustee/Officer
Since (h) | | Number of MFS Funds for which the Person is an Officer | | Principal Occupations During the Past Five Years |
Frank L. Tarantino
(age 74) | | Independent
Senior Officer | | June 2004 | | 135 | | Tarantino LLC (provider of compliance services), Principal |
| | | | |
Richard S. Weitzel (k)
(age 48) | | Assistant Secretary and Assistant Clerk | | October 2007 | | 135 | | Massachusetts Financial Services Company, Senior Vice President and Associate General Counsel |
| | | | |
Martin J. Wolin (k) (age 51) | | Chief Compliance Officer | | July 2015 | | 135 | | Massachusetts Financial Services Company, Senior Vice President and Chief Compliance Officer (since July 2015); Mercer (financial service provider), Chief Risk and Compliance Officer, North America and Latin America (until June 2015) |
| | | | |
James O. Yost (k)
(age 58) | | Treasurer | | September 1990 | | 135 | | Massachusetts Financial Services Company, Senior Vice President |
| (h) | Date first appointed to serve as Trustee/officer of an MFS Fund. Each Trustee has served continuously since appointment unless indicated otherwise. For the period from December 15, 2004 until February 22, 2005, Mr. Manning served as Advisory Trustee. From January 2012 through December 2016, Messrs. DiLorenzo and Yost served as Treasurer and Deputy Treasurer of the Funds, respectively. |
| (j) | Directorships or trusteeships of companies required to report to the Securities and Exchange Commission (i.e., “public companies”). |
| (k) | “Interested person” of the Trust within the meaning of the Investment Company Act of 1940 (referred to as the 1940 Act), which is the principal federal law governing investment companies like the fund, as a result of a position with MFS. The address of MFS is 111 Huntington Avenue, Boston, Massachusetts 02199-7618. |
Each Trustee has been elected by shareholders and each Trustee and officer holds office until his or her successor is chosen and qualified or until his or her earlier death, resignation, retirement or removal. The Trust does not hold annual meetings for the purpose of electing Trustees, and Trustees are not elected for fixed terms. Under the terms of the Board’s retirement policy, an Independent Trustee shall retire at the end of the calendar year in which he or she reaches the earlier of 75 years of age or 15 years of service on the Board (or, in the case of any Independent Trustee who joined the Board prior to 2015, 20 years of service on the Board).
Messrs. Buller, Hegarty, Kilman and Otis and Ms. Roepke are members of the Trust’s Audit Committee.
Each of the Interested Trustees and certain Officers hold comparable officer positions with certain affiliates of MFS.
The Statement of Additional Information for a Fund includes further information about the Trustees and is available without charge upon request by calling1-800-225-2606.
| | |
Investment Adviser Massachusetts Financial Services Company 111 Huntington Avenue Boston, MA 02199-7618 | | Custodian State Street Bank and Trust Company 1 Lincoln Street Boston, MA 02111-2900 |
Distributor MFS Fund Distributors, Inc. 111 Huntington Avenue Boston, MA 02199-7618 | | Independent Registered Public Accounting Firm Deloitte & Touche LLP 200 Berkeley Street Boston, MA 02116 |
Portfolio Manager(s) Jeffrey Constantino | | |
23
MFS Massachusetts Investors Growth Stock Portfolio
BOARD REVIEW OF INVESTMENT ADVISORY AGREEMENT
The Investment Company Act of 1940 requires that both the full Board of Trustees and a majority of thenon-interested (“independent”) Trustees, voting separately, annually approve the continuation of the Fund’s investment advisory agreement with MFS. The Trustees consider matters bearing on the Fund and its advisory arrangements at their meetings throughout the year, including a review of performance data at each regular meeting. In addition, the independent Trustees met several times over the course of three months beginning in May and ending in July, 2018 (“contract review meetings”) for the specific purpose of considering whether to approve the continuation of the investment advisory agreement for the Fund and the other investment companies that the Board oversees (the “MFS Funds”). The independent Trustees were assisted in their evaluation of the Fund’s investment advisory agreement by independent legal counsel, from whom they received separate legal advice and with whom they met separately from MFS during various contract review meetings. The independent Trustees were also assisted in this process by the MFS Funds’ Independent Senior Officer, a senior officer appointed by and reporting to the independent Trustees.
In connection with their deliberations regarding the continuation of the investment advisory agreement, the Trustees, including the independent Trustees, considered such information and factors as they believed, in light of the legal advice furnished to them and their own business judgment, to be relevant. The investment advisory agreement for the Fund was considered separately, although the Trustees also took into account the common interests of all MFS Funds in their review. As described below, the Trustees considered the nature, quality, and extent of the various investment advisory, administrative, and shareholder services performed by MFS under the existing investment advisory agreement and other arrangements with the Fund.
In connection with their contract review meetings, the Trustees received and relied upon materials that included, among other items: (i) information provided by Broadridge Financial Solutions, Inc. (“Broadridge”), an independent third party, on the investment performance of the Fund for various time periods ended December 31, 2017 and the investment performance of a group of funds with substantially similar investment classifications/objectives (the “Broadridge performance universe”), (ii) information provided by Broadridge on the Fund’s advisory fees and other expenses and the advisory fees and other expenses of comparable funds identified by Broadridge (the “Broadridge expense group”), (iii) information provided by MFS on the advisory fees of portfolios of other clients of MFS, including institutional separate accounts and other clients, (iv) information as to whether and to what extent applicable expense waivers, reimbursements or fee “breakpoints” are observed for the Fund, (v) information regarding MFS’ financial results and financial condition, including MFS’ and certain of its affiliates’ estimated profitability from services performed for the Fund and the MFS Funds as a whole, and compared to MFS’ institutional business, (vi) MFS’ views regarding the outlook for the mutual fund industry and the strategic business plans of MFS, (vii) descriptions of various functions performed by MFS for the Funds, such as compliance monitoring and portfolio trading practices, and (viii) information regarding the overall organization of MFS, including information about MFS’ senior management and other personnel providing investment advisory, administrative and other services to the Fund and the other MFS Funds. The comparative performance, fee and expense information prepared and provided by Broadridge was not independently verified and the independent Trustees did not independently verify any information provided to them by MFS.
The Trustees’ conclusion as to the continuation of the investment advisory agreement was based on a comprehensive consideration of all information provided to the Trustees and not the result of any single factor. Some of the factors that figured particularly in the Trustees’ deliberations are described below, although individual Trustees may have evaluated the information presented differently from one another, giving different weights to various factors. It is also important to recognize that the fee arrangements for the Fund and other MFS Funds are the result of years of review and discussion between the independent Trustees and MFS, that certain aspects of such arrangements may receive greater scrutiny in some years than in others, and that the Trustees’ conclusions may be based, in part, on their consideration of these same arrangements during the course of the year and in prior years.
Based on information provided by Broadridge and MFS, the Trustees reviewed the Fund’s total return investment performance as well as the Broadridge performance universe over various time periods. The Trustees placed particular emphasis on the total return performance of the Fund’s Initial Class shares in comparison to the performance of funds in its Broadridge performance universe over the three-year period ended December 31, 2017, which the Trustees believed was a long enough period to reflect differing market conditions. The total return performance of the Fund’s Initial Class shares was in the 5th quintile relative to the other funds in the universe for this three-year period (the 1st quintile being the best performers and the 5th quintile being the worst performers). The total return performance of the Fund’s Initial Class shares was in the 4th quintile for theone-year period and the 5th quintile for the five-year period ended December 31, 2017 relative to the Broadridge performance universe. Because of the passage of time, these performance results may differ from the performance results for more recent periods, including those shown elsewhere in this report.
The Trustees expressed concern to MFS about the substandard investment performance of the Fund and the Fund’s retail counterpart, MFS Massachusetts Investors Growth Stock Fund, which has substantially similar investment strategies and experienced substantially similar investment performance as the Fund. In the course of their deliberations, the Trustees took into account information provided by MFS in connection with the contract review meetings, as well as during investment review meetings conducted with portfolio management personnel during the course of the year as to MFS’ efforts to improve the performance of the
24
MFS Massachusetts Investors Growth Stock Portfolio
Board Review of Investment Advisory Agreement – continued
Fund and the Fund’s retail counterpart. In addition, the Trustees requested that they receive a separate update on the Fund’s retail counterpart at each of their regular meetings. After reviewing these and related factors, the Trustees concluded, within the context of their overall conclusions regarding the investment advisory agreement, that MFS’ responses and efforts and plans to improve investment performance were sufficient to support approval of the continuance of the investment advisory agreement for an additionalone-year period, but that they would continue to closely monitor the performance of the Fund’s retail counterpart.
In assessing the reasonableness of the Fund’s advisory fee, the Trustees considered, among other information, the Fund’s advisory fee and the total expense ratio of the Fund’s Initial Class shares as a percentage of average daily net assets and the advisory fee and total expense ratios of peer groups of funds based on information provided by Broadridge. The Trustees considered that MFS currently observes an expense limitation for the Fund, which may not be changed without the Trustees’ approval. The Trustees also considered that, according to the data provided by Broadridge (which takes into account any fee reductions or expense limitations that were in effect during the Fund’s last fiscal year), the Fund’s effective advisory fee rate was higher than the Broadridge expense group median and the Fund’s total expense ratio was approximately at the Broadridge expense group median.
The Trustees also considered the advisory fees charged by MFS to any institutional separate accounts advised by MFS (“separate accounts”) and unaffiliated investment companies for which MFS serves as subadviser (“subadvised funds”) that have comparable investment strategies to the Fund, if any. In comparing these fees, the Trustees considered information provided by MFS as to the generally broader scope of services provided by MFS to the Fund, as well as the more extensive regulatory burdens imposed on MFS in managing the Fund, in comparison to separate accounts and subadvised funds. The Trustees also considered the higher demands placed on MFS’ investment personnel and trading infrastructure as a result of the daily cashin-flows andout-flows of the Fund in comparison to separate accounts.
The Trustees also considered whether the Fund may benefit from any economies of scale in the management of the Fund in the event of growth in assets of the Fund and/or growth in assets of the MFS Funds as a whole. They noted that the Fund’s advisory fee rate schedule is subject to a contractual breakpoint that reduces the Fund’s advisory fee rate on average daily net assets over $1 billion. The Trustees also noted that MFS has agreed in writing to waive a portion of the management fees of certain MFS Funds, including the Fund, if the total combined assets of certain funds within the MFS Funds’ complex increase above agreed upon thresholds (the “group fee waiver”), enabling the Fund’s shareholders to share in the benefits from any economies of scale at the complex level. The group fee waiver is reviewed and renewed annually between the Board and MFS. The Trustees concluded that the breakpoint and the group fee waiver were sufficient to allow the Fund to benefit from economies of scale as its assets and overall complex assets grow.
The Trustees also considered information prepared by MFS relating to MFS’ costs and profits with respect to the Fund, the MFS Funds considered as a group, and other investment companies and accounts advised by MFS, as well as MFS’ methodologies used to determine and allocate its costs to the MFS Funds, the Fund and other accounts and products for purposes of estimating profitability.
After reviewing these and other factors described herein, the Trustees concluded, within the context of their overall conclusions regarding the investment advisory agreement, that the advisory fees charged to the Fund represent reasonable compensation in light of the services being provided by MFS to the Fund.
In addition, the Trustees considered MFS’ resources and related efforts to continue to retain, attract and motivate capable personnel to serve the Fund. The Trustees also considered current and developing conditions in the financial services industry, including the presence of large and well-capitalized companies which are spending, and appear to be prepared to continue to spend, substantial sums to engage personnel and to provide services to competing investment companies. In this regard, the Trustees also considered the financial resources of MFS and its ultimate parent, Sun Life Financial Inc. The Trustees also considered the advantages and possible disadvantages to the Fund of having an adviser that also serves other investment companies as well as other accounts.
The Trustees also considered the nature, quality, cost, and extent of administrative, transfer agency, and distribution services provided to the Fund by MFS and its affiliates under agreements and plans other than the investment advisory agreement, including any12b-1 fees the Fund pays to MFS Fund Distributors, Inc., an affiliate of MFS. The Trustees also considered the nature, extent and quality of certain other services MFS performs or arranges for on the Fund’s behalf, which may include securities lending programs, directed expense payment programs, class action recovery programs, and MFS’ interaction with third-party service providers, principally custodians andsub-custodians. The Trustees concluded that the variousnon-advisory services provided by MFS and its affiliates on behalf of the Fund were satisfactory.
The Trustees consideredso-called“fall-out benefits” to MFS such as reputational value derived from serving as investment manager to the MFS Funds. The Trustees also considered that, effective January 3, 2018, MFS had discontinued its historic practice of obtaining investment research from portfolio brokerage commissions paid by certain MFS Funds and would thereafter voluntarily reimburse a Fund, if applicable, for the costs of external research acquired through the use of the Fund’s portfolio brokerage commissions.
Based on their evaluation of factors that they deemed to be material, including those factors described above, the Board of Trustees, including the independent Trustees, concluded that the Fund’s investment advisory agreement with MFS should be continued for an additionalone-year period, commencing August 1, 2018.
25
MFS Massachusetts Investors Growth Stock Portfolio
PROXY VOTING POLICIES AND INFORMATION
MFS votes proxies on behalf of the fund pursuant to proxy voting policies and procedures that are available without charge, upon request, by calling 1-800-225-2606, by visitingmfs.com/proxyvoting, or by visiting the SEC’s Web site athttp://www.sec.gov.
Information regarding how the fund voted proxies relating to portfolio securities during the most recent twelve-month period ended June 30 is available by August 31 of each year without charge by visitingmfs.com/proxyvoting, or by visiting the SEC’s Web site athttp://www.sec.gov.
QUARTERLY PORTFOLIO DISCLOSURE
The fund files a complete schedule of portfolio holdings with the SEC for the first and third quarters of each fiscal year on Form N-Q. The fund’s Form N-Q is available on the SEC’s website athttp://www.sec.gov.A shareholder can obtain the portfolio holdings report for the first and third quarters of the fund’s fiscal year atmfs.com/vit2 by choosing the fund’s name and then selecting the “Resources” tab and clicking on “Prospectus and Reports”.
FURTHER INFORMATION
From time to time, MFS may post important information about the fund or the MFS funds on the MFS web site (mfs.com). This information is available athttps://www.mfs.com/en-us/what-we-do/announcements.htmlor atmfs.com/vit2 by choosing the fund’s name.
INFORMATION ABOUT FUND CONTRACTS AND LEGAL CLAIMS
The fund has entered into contractual arrangements with an investment adviser, administrator, distributor, shareholder servicing agent, 529 program manager (if applicable), and custodian who each provide services to the fund. Unless expressly stated otherwise, shareholders are not parties to, or intended beneficiaries of these contractual arrangements, and these contractual arrangements are not intended to create any shareholder right to enforce them against the service providers or to seek any remedy under them against the service providers, either directly or on behalf of the fund.
Under the Trust’s By-Laws and Declaration of Trust, any claims asserted against or on behalf of the MFS Funds, including claims against Trustees and Officers, must be brought in state and federal courts located within the Commonwealth of Massachusetts.
FEDERAL TAX INFORMATION (unaudited)
The following information is provided pursuant to provisions of the Internal Revenue Code.
The fund designates $53,116,000 as capital gain dividends paid during the fiscal year.
For corporate shareholders, 92.38% of the ordinary income dividends paid during the fiscal year qualify for the corporate dividends received deduction.
26
rev. 3/16
| | | | |
| | | |
| FACTS | | WHAT DOES MFS DO WITH YOUR
PERSONAL INFORMATION? | |  |
| | |
| Why? | | Financial companies choose how they share your personal information. Federal law gives consumers the right to limit some but not all sharing. Federal law also requires us to tell you how we collect, share, and protect your personal information. Please read this notice carefully to understand what we do. |
| | |
| What? | | The types of personal information we collect and share depend on the product or service you have with us. This information can include: • Social Security number and account balances • Account transactions and transaction history • Checking account information and wire transfer instructions When you areno longer our customer, we continue to share your information as described in this notice. |
| | |
| How? | | All financial companies need to share customers’ personal information to run their everyday business. In the section below, we list the reasons financial companies can share their customers’ personal information; the reasons MFS chooses to share; and whether you can limit this sharing. |
| | | | |
Reasons we can share your
personal information | | Does MFS share? | | Can you limit this
sharing? |
For our everyday business purposes – such as to process your transactions, maintain your account(s), respond to court orders and legal investigations, or report to credit bureaus | | Yes | | No |
For our marketing purposes – to offer our products and services to you | | No | | We don’t share |
| For joint marketing with other financial companies | | No | | We don’t share |
For our affiliates’ everyday business purposes – information about your transactions and experiences | | No | | We don’t share |
For our affiliates’ everyday business purposes – information about your creditworthiness | | No | | We don’t share |
| For nonaffiliates to market to you | | No | | We don’t share |
| | |
| | |
| Questions? | | Call800-225-2606 or go tomfs.com. |
27
| | |
| Who we are |
| Who is providing this notice? | | MFS Funds, MFS Investment Management, MFS Institutional Advisors, Inc., and MFS Heritage Trust Company. |
| | |
| What we do |
| How does MFS protect my personal information? | | To protect your personal information from unauthorized access and use, we use security measures that comply with federal law. These measures include procedural, electronic, and physical safeguards for the protection of the personal information we collect about you. |
How does MFS
collect my personal information? | | We collect your personal information, for example, when you • open an account or provide account information • direct us to buy securities or direct us to sell your securities • make a wire transfer We also collect your personal information from others, such as credit bureaus, affiliates, or other companies. |
| Why can’t I limit all sharing? | | Federal law gives you the right to limit only • sharing for affiliates’ everyday business purposes – information about your creditworthiness • affiliates from using your information to market to you • sharing for nonaffiliates to market to you State laws and individual companies may give you additional rights to limit sharing. |
| | |
| Definitions |
| Affiliates | | Companies related by common ownership or control. They can be financial and nonfinancial companies. • MFS does not share personal information with affiliates, except for everyday business purposes as described on page one of this notice. |
| Nonaffiliates | | Companies not related by common ownership or control. They can be financial and nonfinancial companies. • MFS does not share with nonaffiliates so they can market to you. |
| Joint marketing | | A formal agreement between nonaffiliated financial companies that together market financial products or services to you. • MFS doesn’t jointly market. |
| | |
| Other important information |
| If you own an MFS product or receive an MFS service in the name of a third party such as a bank or broker-dealer, their privacy policy may apply to you instead of ours. |
28
Annual Report
December 31, 2018

MFS® Research International Portfolio

MFS® Variable Insurance Trust II
Beginning on January 1, 2021, as permitted by regulations adopted by the U.S. Securities and Exchange Commission, the insurance company that offers your contract may determine that it will no longer send you paper copies of the fund’s annual and semiannual shareholder reports unless you specifically request paper copies from the insurance company or from your financial intermediary. Instead, the shareholder reports will be made available on a Web site (insurancefunds.mfs.com or other Web site of which you will be notified), and the insurance company will notify you by mail each time a report is posted and provide you with a Web site link to access the report. Instructions for requesting paper copies will be provided by your insurance company or financial intermediary.
If you already elected to receive shareholder reports by email, you will not be affected by this change and you need not take any action. If your insurance company or financial intermediary offers electronic delivery, you may elect to receive shareholder reports and other communications from the insurance company or financial intermediary by email by following the instructions provided by the insurance company or financial intermediary.
Beginning on January 1, 2019, you may elect to receive all future reports in paper free of charge from the insurance company or financial intermediary. You can inform the insurance company or financial intermediary that you wish to continue receiving paper copies of your shareholder reports by contacting your insurance company or financial intermediary. Your election to receive reports in paper will apply to all funds held in your account with your insurance company or financial intermediary.
RSS-ANN
MFS® Research International Portfolio
CONTENTS
The report is prepared for the general information of contract owners. It is authorized for distribution to prospective investors only when preceded or accompanied by a current prospectus.
NOT FDIC INSURED• MAY LOSE VALUE• NO BANK OR CREDIT UNION GUARANTEE• NOT A DEPOSIT• NOT INSURED BY ANY FEDERAL GOVERNMENT AGENCY OR NCUA/NCUSIF
MFS Research International Portfolio
LETTER FROM THE EXECUTIVE CHAIRMAN

Dear Contract Owners:
Higher interest rates, international trade friction, and geopolitical uncertainty surrounding issues such as Brexit have contributed to an uptick in market volatility in recent quarters — a departure from thelow-volatility environment that prevailed for much of the past several years. Against this more challenging backdrop, equity markets in the United States outperformed most international markets on a relative basis in 2018, though broad market returns were modestly negative on an absolute basis. Global economic growth has become less synchronized over the past few quarters, with Europe, China, and some emerging markets having shown signs of significantly slowing growth. While U.S. growth has remained above average, the pace of that growth slowed in the second half of 2018.
Slowing global growth and tighter financial conditions have clouded the outlook for U.S. monetary policy, with the chairman of the U.S. Federal Reserve acknowledging that policy rates are close to levels that the Fed deems neutral for the U.S. economy. This suggests that the predictable pattern of quarterly rate increases is behind us. At the same time, markets must contend with a shift from years of quantitative easing toward a cycle of quantitative tightening now that the European Central Bank has halted asset purchases. U.S. tax reforms adopted in late 2017 have been welcomed by equity markets while emerging market economies have recently had to contend with tighter financial conditions as a result of firmer U.S. interest rates and a stronger dollar. With the Republicans losing control of the U.S. House of Representatives, further meaningful U.S. fiscal stimulus appears less likely over the remainder of this presidential term. A partial U.S. government shutdown, beginning in late 2018, also added to political uncertainty. Globally, inflation remains largely subdued thanks in part to falling oil prices, but tight labor markets and moderate global demand have investors on the lookout for its potential reappearance. Increased U.S. protectionism is also a growing concern, as investors fear trade disputes could dampen business sentiment, leading to even slower global growth. While there has been progress on this front — a NAFTA replacement has been agreed upon between the U.S., Mexico, and Canada; the free trade pact with Korea has been updated; and a negotiating framework with the European Union has been agreed upon — tensions over trade with China remain quite high, though the two sides have recently returned to the negotiating table.
As a global investment manager with nearly a century of expertise, MFS® firmly believes active risk management offers downside mitigation and may help improve investment outcomes. We built our active investment platform with this belief in mind. Ourlong-term perspective influences nearly every aspect of our business, ensuring our investment decisions align with the investing time horizons of our clients.
Respectfully,

Robert J. Manning
Executive Chairman
MFS Investment Management
February 15, 2019
The opinions expressed in this letter are subject to change and may not be relied upon for investment advice. No forecasts can be guaranteed.
1
MFS Research International Portfolio
PORTFOLIO COMPOSITION
Portfolio structure
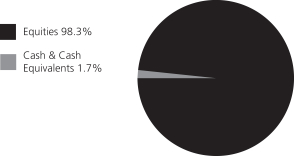
| | | | |
| Top ten holdings | | | | |
| Nestle S.A. | | | 3.0% | |
| Roche Holding AG | | | 2.8% | |
| Linde PLC | | | 2.2% | |
| Schneider Electric S.A. | | | 1.9% | |
| Novo Nordisk A.S., “B” | | | 1.9% | |
| AIA Group Ltd. | | | 1.8% | |
| UBS AG | | | 1.6% | |
| BP PLC | | | 1.6% | |
| Akzo Nobel N.V. | | | 1.6% | |
| Bayer AG | | | 1.5% | |
| |
| Global equity sectors (k) | | | | |
| Capital Goods | | | 22.8% | |
| Financial Services | | | 22.7% | |
| Health Care | | | 11.0% | |
| Technology | | | 10.1% | |
| Consumer Staples | | | 9.8% | |
| Energy | | | 9.5% | |
| Consumer Cyclicals | | | 8.5% | |
| Telecommunications/Cable Television | | | 3.9% | |
| | | | |
| Issuer country weightings (x) | | | | |
| Japan | | | 18.3% | |
| United Kingdom | | | 12.6% | |
| Switzerland | | | 12.5% | |
| France | | | 9.1% | |
| United States | | | 8.8% | |
| Germany | | | 7.6% | |
| Hong Kong | | | 3.7% | |
| Australia | | | 3.2% | |
| Spain | | | 3.0% | |
| Other Countries | | | 21.2% | |
| |
| Currency exposure weightings (y) | | | | |
| Euro | | | 31.0% | |
| Japanese Yen | | | 18.3% | |
| Swiss Franc | | | 12.5% | |
| British Pound Sterling | | | 11.8% | |
| United States Dollar | | | 7.9% | |
| Hong Kong Dollar | | | 4.2% | |
| Australian Dollar | | | 3.2% | |
| Danish Krone | | | 2.2% | |
| Canadian Dollar | | | 2.2% | |
| Other Currencies | | | 6.7% | |
| (k) | The sectors set forth above and the associated portfolio composition are based on MFS’ own custom sector classification methodology. |
| (x) | Represents the portfolio’s exposure to issuer countries as a percentage of a portfolio’s net assets. For purposes of this presentation, United States includes Cash & Cash Equivalents. |
| (y) | Represents the portfolio’s exposure to a particular currency as a percentage of a portfolio’s net assets. For purposes of this presentation, United States Dollar includes Cash & Cash Equivalents. |
Cash & Cash Equivalents includes any cash, investments in money market funds, short-term securities, and other assets less liabilities. Please see the Statement of Assets and Liabilities for additional information related to the fund’s cash position and other assets and liabilities.
Percentages are based on net assets as of December 31, 2018.
The portfolio is actively managed and current holdings may be different.
2
MFS Research International Portfolio
MANAGEMENT REVIEW
Summary of Results
For the twelve months ended December 31, 2018, Initial Class shares of the MFS Research International Portfolio (“fund”) provided a total return of –14.12%, while Service Class shares of the fund provided a total return of –14.32%. These compare with a return of –13.79% over the same period for the fund’s benchmark, the MSCI EAFE Index (net div).
Market Environment
During the reporting period, the US Federal Reserve raised interest rates by 100 basis points, bringing the total number of rate hikes to nine since the central bank began to normalize monetary policy in late 2015. Economic growth rates in the US, Eurozone and Japan remained above trend, despite a slowing in global growth, particularly toward the end of the period. Inflation remained contained, particularly outside the US. Late in the period, the European Central Bank halted its asset purchase program but issued forward guidance that it does not expect to raise interest rates at least until after the summer of 2019. The Bank of England (once) and the Bank of Canada (three times) each raised rates during the period. The European political backdrop became a bit more volatile, late in the period, spurred by concerns over cohesion in the Eurozone after the election of an anti-establishment, Eurosceptic coalition government in Italy and widespread protests over stagnant wage growth in France.
Bond yields rose in the US during most of the period, but remained low by historical standards and slipped from their highs, late in the period, as market volatility increased. Yields in many developed markets fell. Outside of emerging markets, where spreads and currencies came under pressure, credit spreads remained quite tight until the end of the period, when thinner liquidity, lower oil prices and concerns over high degrees of corporate leverage emerged. Growing concern over increasing global trade friction appeared to have weighed on business sentiment during the period’s second half, especially outside the US. Tighter financial conditions from rising US rates and a strong dollar, combined with trade uncertainty, helped expose structural weaknesses in several emerging markets in the second half of the period.
Volatility increased, at the end of the period, amid signs of slowing global economic growth and increasing trade tensions, which prompted a market setback shortly after US markets set record highs in September. It was the second such equity market decline during the reporting period. The correction came despite a third consecutive quarter of strong growth in US earnings per share. Strong earnings growth, combined with the market decline, brought US equity valuations down from elevated levels, earlier in the period, to multiples more in line with long-term averages. While the US economy held up better than most, global economic growth became less synchronized during the period, with Europe and China showing signs of a slowdown and some emerging markets coming under stress.
Detractors from Performance
Stock selection in theconsumer cyclicalssector held back performance relative to the MSCI EAFE Index. Within this sector, an overweight position in general merchandise retailer Sundrug (Japan) weighed on relative returns. Shares of Sundrug fell as the company reported weaker-than-expected operating profit in its drugstore segment, resulting from a decline in same-store sales and an increase in operating and overhead expenses.
Security selection in both thehealth careandconsumer staplessectors also hindered relative results. Within thehealth caresector, an overweight position in pharmaceutical company Bayer AG (Germany), and not owning shares of pharmaceutical firm Novartis (Switzerland), dampened relative performance. The stock price of Bayer depreciated after a court awarded damages to an individual who claimed to have contractedNon-Hodgkin’s Lymphoma cancer from glyphosate herbicide, which was discovered and branded as Roundup by Monsanto, whom Bayer acquired in 2018. The stock traded significantly lower after the news, as investors appeared to have been concerned that more lawsuits would be filed against Bayer. Within theconsumer staples sector, an overweight position in tobacco distributor British American Tobacco (United Kingdom) hindered relative returns. The share price of British American Tobacco reacted negatively to news that the US Federal Drug Administration was considering plans to ban the sale of menthol cigarettes, in addition to a ban on flavorede-cigarettes, citing concerns over nicotine addiction.
Stocks in other sectors that detracted from relative performance included overweight positions in building products supplier Toto (Japan), private banking services provider Julius Baer Group (Switzerland), industrial process technology manufacturer GEA Group (Germany), investment management and banking firm UBS (Switzerland), global banking group BNP Paribas (France) and banking and financial services firm Intesa Sanpaolo (Italy). The share price of Toto suffered from lower-than-expected operating profits fueled by weakness in the company’s domestic housing equipment business and subdued sales growth in China.
Contributors to Performance
Stock selection in thecapital goodssector boosted relative performance. Within this sector, overweight positions in global engineering company GKN (h) (United Kingdom), industrial gas supplier Linde (Germany) and parcel delivery services company Yamato Holdings Co. (Japan) contributed to relative results. The share price of GKN advanced after investment company Melrose Industries, which specializes in the acquisition and performance improvement of underperforming businesses, made a hostile offer to buy GKN.
3
MFS Research International Portfolio
Management Review – continued
Stock selection in both thefinancial servicesandtechnologysectors also aided relative returns. Within thefinancial servicessector, the fund’s position in risk management and human capital consulting services provider Aon (b), debit and credit transaction processing company Mastercard (b) and banking firm HDFC Bank (b) (India) helped relative performance. The share price of Aon benefited from solid earnings results driven by acceleration in organic growth and margin expansion, as well as solid free cash flow. Within thetechnologysector, holdings of semiconductor company Mellanox Technologies (b), and an overweight position in telecommunications equipment provider Ericsson (h) (Sweden), boosted relative returns. The share price of Mellanox Technologies appreciated following better-than-expected financial results, driven by strong demand for Ethernet products, which appeared to have helped overcome concerns about a slowdown in cloud computing. Additionally, management raised its future guidance, which further supported the stock.
Elsewhere, an overweight position in medical products and equipment manufacturer Terumo (Japan) bolstered relative performance after the company reported strong sales growth during the period.
The fund’s cash and/or cash equivalents position during the period was also a contributor to relative performance. Under normal market conditions, the fund strives to be fully invested and generally holds cash to buy new holdings and to provide liquidity. In a period when equity markets declined, as measured by the fund’s benchmark, holding cash helped performance versus the benchmark, which has no cash position.
Respectfully,
Portfolio Manager(s)
Jose Luis Garcia, Victoria Higley, Camille Humphries Lee, and Thomas Melendez
| (b) | Security is not a benchmark constituent. |
| (h) | Security was not held in the portfolio at period end. |
Note to Shareholders: Effective September 1, 2018, Camille Humphries Lee became a Portfolio Manager of the Fund. Effective March 31, 2019, Thomas Melendez will no longer be a Portfolio Manager of the Fund.
The views expressed in this report are those of the portfolio manager(s) only through the end of the period of the report as stated on the cover and do not necessarily reflect the views of MFS or any other person in the MFS organization. These views are subject to change at any time based on market or other conditions, and MFS disclaims any responsibility to update such views. These views may not be relied upon as investment advice or an indication of trading intent on behalf of any MFS portfolio. References to specific securities are not recommendations of such securities, and may not be representative of any MFS portfolio’s current or future investments.
4
MFS Research International Portfolio
PERFORMANCE SUMMARY THROUGH 12/31/18
The following chart illustrates the historical performance of the fund in comparison to its benchmark(s). Benchmarks are unmanaged and may not be invested in directly. Benchmark returns do not reflect any fees or expenses. The performance of other share classes will be greater than or less than that of the class depicted below. (See Notes to Performance Summary.)
Performance data shown represents past performance and is no guarantee of future results. Investment return and principal value fluctuate so your units, when sold, may be worth more or less than the original cost; current performance may be lower or higher than quoted. The performance shown does not reflect the deduction of taxes, if any, that a contract holder would pay on fund distributions or the redemption of contract units. The returns for the fund shown also do not reflect the deduction of expenses associated with variable products, such as mortality and expense risk charges, separate account charges, and sales charges imposed by the insurance company separate accounts. Such expenses would reduce the overall returns shown.
Growth of a Hypothetical $10,000 Investment
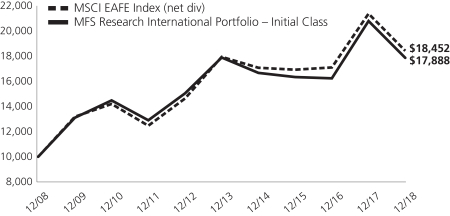
Total Returns through 12/31/18
Average annual total returns
| | | | | | | | | | | | |
| | | Share Class | | Class Inception Date | | 1-yr | | 5-yr | | 10-yr | | |
| | | Initial Class | | 5/06/98 | | (14.12)% | | (0.03)% | | 5.99% | | |
| | | Service Class | | 8/24/01 | | (14.32)% | | (0.28)% | | 5.72% | | |
| | | | |
Comparative benchmark(s) | | | | | | | | |
| | | MSCI EAFE Index (net div) (f) | | (13.79)% | | 0.53% | | 6.32% | | |
| (f) | Source: FactSet Research Systems Inc. |
Benchmark Definition(s)
MSCI EAFE (Europe, Australasia, Far East) Index (net div) – a market capitalization-weighted index that is designed to measure equity market performance in the developed markets, excluding the U.S. and Canada.
It is not possible to invest directly in an index.
Notes to Performance Summary
Average annual total return represents the average annual change in value for each share class for the periods presented.
Performance results reflect any applicable expense subsidies and waivers in effect during the periods shown. Without such subsidies and waivers the fund’s performance results would be less favorable. Please see the prospectus and financial statements for complete details. All results are historical and assume the reinvestment of any dividends and capital gains distributions.
Performance results do not include adjustments made for financial reporting purposes in accordance with U.S. generally accepted accounting principles and may differ from amounts reported in the financial highlights.
From time to time the fund may receive proceeds from litigation settlements, without which performance would be lower.
5
MFS Research International Portfolio
EXPENSE TABLE
Fund Expenses Borne by the Contract Holders during the Period,
July 1, 2018 through December 31, 2018
As a contract holder of the fund, you incur ongoing costs, including management fees; distribution and/or service(12b-1) fees; and other fund expenses. This example is intended to help you understand your ongoing costs (in dollars) of investing in the fund and to compare these costs with the ongoing costs of investing in other mutual funds.
The example is based on an investment of $1,000 invested at the beginning of the period and held for the entire period July 1, 2018 through December 31, 2018.
Actual Expenses
The first line for each share class in the following table provides information about actual account values and actual expenses. You may use the information in this line, together with the amount you invested, to estimate the expenses that you paid over the period. Simply divide your account value by $1,000 (for example, an $8,600 account value divided by $1,000 = 8.6), then multiply the result by the number in the first line under the heading entitled “Expenses Paid During Period” to estimate the expenses you paid on your account during this period.
Hypothetical Example for Comparison Purposes
The second line for each share class in the following table provides information about hypothetical account values and hypothetical expenses based on the fund’s actual expense ratio and an assumed rate of return of 5% per year before expenses, which is not the fund’s actual return. The hypothetical account values and expenses may not be used to estimate the actual ending account balance or expenses you paid for the period. You may use this information to compare the ongoing costs of investing in the fund and other funds. To do so, compare this 5% hypothetical example with the 5% hypothetical examples that appear in the shareholder reports of the other funds.
Please note that the expenses shown in the table are meant to highlight the fund’s ongoing costs only and do not take into account the fees and expenses imposed under the variable contracts through which your investment in the fund is made. Therefore, the second line for each share class in the table is useful in comparing ongoing costs associated with an investment in vehicles (such as the fund) which fund benefits under variable annuity and variable life insurance contracts and to qualified pension and retirement plans only, and will not help you determine the relative total costs of investing in the fund through variable annuity and variable life insurance contracts. If the fees and expenses imposed under the variable contracts were included, your costs would have been higher.
| | | | | | | | | | | | | | | | | | |
| Share Class | | | | Annualized
Expense Ratio | | | Beginning
Account Value
7/01/18 | | | Ending Account Value
12/31/18 | | | Expenses Paid
During Period (p)
7/01/18-12/31/18 | |
| Initial Class | | Actual | | | 0.96% | | | | $1,000.00 | | | | $873.09 | | | | $4.53 | |
| | Hypothetical (h) | | | 0.96% | | | | $1,000.00 | | | | $1,020.37 | | | | $4.89 | |
| Service Class | | Actual | | | 1.21% | | | | $1,000.00 | | | | $871.83 | | | | $5.71 | |
| | Hypothetical (h) | | | 1.21% | | | | $1,000.00 | | | | $1,019.11 | | | | $6.16 | |
| (h) | 5% class return per year before expenses. |
| (p) | “Expenses Paid During Period” are equal to each class’s annualized expense ratio, as shown above, multiplied by the average account value over the period, multiplied by 184/365 (to reflect theone-half year period). |
6
MFS Research International Portfolio
PORTFOLIO OF INVESTMENTS – 12/31/18
The Portfolio of Investments is a complete list of all securities owned by your fund. It is categorized by broad-based asset classes.
| | | | | | | | |
| | |
| Issuer | | Shares/Par | | | Value ($) | |
| COMMON STOCKS – 98.3% | | | | | |
| Airlines – 1.0% | | | | | | | | |
| Aena S.A. | | | 17,472 | | | $ | 2,717,517 | |
| Malaysia Airports Holdings Berhad | | | 527,500 | | | | 1,069,679 | |
| | | | | | | | |
| | | | | | $ | 3,787,196 | |
| | | | | | | | |
| Alcoholic Beverages – 0.4% | | | | | | | | |
| Ambev S.A., ADR | | | 357,495 | | | $ | 1,401,380 | |
| | | | | | | | |
| Apparel Manufacturers – 2.0% | | | | | | | | |
| Adidas AG | | | 8,723 | | | $ | 1,822,974 | |
| LVMH Moet Hennessy Louis Vuitton SE | | | 18,296 | | | | 5,412,553 | |
| | | | | | | | |
| | | | | | $ | 7,235,527 | |
| | | | | | | | |
| Automotive – 2.0% | | | | | | | | |
| Koito Manufacturing Co. Ltd. | | | 72,500 | | | $ | 3,698,415 | |
| USS Co. Ltd. | | | 229,900 | | | | 3,836,990 | |
| | | | | | | | |
| | | | | | $ | 7,535,405 | |
| | | | | | | | |
| Broadcasting – 0.5% | | | | | | | | |
| WPP PLC | | | 182,820 | | | $ | 1,972,767 | |
| | | | | | | | |
| Brokerage & Asset Managers – 1.0% | | | | | | | | |
| Euronext N.V. | | | 5,236 | | | $ | 301,757 | |
| TMX Group Ltd. | | | 63,344 | | | | 3,281,806 | |
| | | | | | | | |
| | | | | | $ | 3,583,563 | |
| | | | | | | | |
| Business Services – 2.0% | | | | | | | | |
| Cerved Information Solutions S.p.A. | | | 99,149 | | | $ | 812,808 | |
| Cognizant Technology Solutions Corp., “A” | | | 65,132 | | | | 4,134,579 | |
| Nomura Research Institute Ltd. | | | 65,000 | | | | 2,389,387 | |
| | | | | | | | |
| | | | | | $ | 7,336,774 | |
| | | | | | | | |
| Computer Software – 0.8% | | | | | | | | |
| Check Point Software Technologies Ltd. (a) | | | 27,494 | | | $ | 2,822,259 | |
| | | | | | | | |
| Computer Software – Systems – 2.2% | | | | | |
| Amadeus IT Group S.A. | | | 44,472 | | | $ | 3,100,028 | |
| EPAM Systems, Inc. (a) | | | 28,507 | | | | 3,307,097 | |
| Hitachi Ltd. | | | 71,900 | | | | 1,911,232 | |
| | | | | | | | |
| | | | | | $ | 8,318,357 | |
| | | | | | | | |
| Conglomerates – 0.5% | | | | | | | | |
| Melrose Industries PLC | | | 808,608 | | | $ | 1,688,723 | |
| | | | | | | | |
| Construction – 1.9% | | | | | | | | |
| Techtronic Industries Co. Ltd. | | | 639,000 | | | $ | 3,394,726 | |
| Toto Ltd. | | | 103,300 | | | | 3,550,900 | |
| | | | | | | | |
| | | | | | $ | 6,945,626 | |
| | | | | | | | |
| Consumer Products – 3.2% | | | | | | | | |
| Kao Corp. | | | 40,500 | | | $ | 2,985,899 | |
| L’Oréal | | | 17,795 | | | | 4,102,190 | |
| Reckitt Benckiser Group PLC | | | 62,532 | | | | 4,792,558 | |
| | | | | | | | |
| | | | | | $ | 11,880,647 | |
| | | | | | | | |
| Containers – 1.0% | | | | | | | | |
| Brambles Ltd. | | | 526,337 | | | $ | 3,762,863 | |
| | | | | | | | |
| | | | | | | | |
| | |
| Issuer | | Shares/Par | | | Value ($) | |
| COMMON STOCKS – continued | | | | | |
| Electrical Equipment – 2.7% | | | | | | | | |
| Legrand S.A. | | | 52,193 | | | $ | 2,948,146 | |
| Schneider Electric S.A. | | | 102,075 | | | | 6,984,397 | |
| | | | | | | | |
| | | | | | $ | 9,932,543 | |
| | | | | | | | |
| Electronics – 2.9% | | | | | | | | |
| Mellanox Technologies Ltd. (a) | | | 27,116 | | | $ | 2,504,976 | |
| NVIDIA Corp. | | | 4,409 | | | | 588,601 | |
| Samsung Electronics Co. Ltd. | | | 36,364 | | | | 1,258,219 | |
| Silicon Motion Technology Corp., ADR | | | 27,375 | | | | 944,437 | |
| Taiwan Semiconductor Manufacturing Co. Ltd. | | | 729,804 | | | | 5,354,160 | |
| | | | | | | | |
| | | | | | $ | 10,650,393 | |
| | | | | | | | |
| Energy – Independent – 1.6% | | | | | | | | |
| Cairn Energy PLC (a) | | | 772,587 | | | $ | 1,477,109 | |
| Caltex Australia Ltd. | | | 128,809 | | | | 2,311,714 | |
| Oil Search Ltd. | | | 398,183 | | | | 2,008,094 | |
| | | | | | | | |
| | | | | | $ | 5,796,917 | |
| | | | | | | | |
| Energy – Integrated – 3.3% | | | | | | | | |
| BP PLC | | | 927,184 | | | $ | 5,861,080 | |
| Eni S.p.A. | | | 214,604 | | | | 3,380,392 | |
| Galp Energia SGPS S.A., “B” | | | 198,891 | | | | 3,143,595 | |
| | | | | | | | |
| | | | | | $ | 12,385,067 | |
| | | | | | | | |
| Food & Beverages – 4.1% | | | | | | | | |
| Danone S.A. | | | 57,981 | | | $ | 4,086,215 | |
| Nestle S.A. | | | 133,982 | | | | 10,892,850 | |
| | | | | | | | |
| | | | | | $ | 14,979,065 | |
| | | | | | | | |
| Food & Drug Stores – 1.7% | | | | | | | | |
| Sundrug Co. Ltd. | | | 115,300 | | | $ | 3,429,657 | |
| Tesco PLC | | | 1,189,906 | | | | 2,883,159 | |
| | | | | | | | |
| | | | | | $ | 6,312,816 | |
| | | | | | | | |
| Gaming & Lodging – 0.5% | | | | | | | | |
| Paddy Power Betfair PLC | | | 22,067 | | | $ | 1,800,102 | |
| | | | | | | | |
| Insurance – 5.9% | | | | | | | | |
| AIA Group Ltd. | | | 816,400 | | | $ | 6,776,834 | |
| Aon PLC | | | 35,170 | | | | 5,112,311 | |
| Hiscox Ltd. | | | 179,486 | | | | 3,708,408 | |
| Swiss Re Ltd. | | | 27,303 | | | | 2,508,653 | |
| Zurich Insurance Group AG | | | 12,963 | | | | 3,873,210 | |
| | | | | | | | |
| | | | | | $ | 21,979,416 | |
| | | | | | | | |
| Internet – 1.4% | | | | | | | | |
| Baidu, Inc., ADR (a) | | | 4,527 | | | $ | 717,982 | |
| NAVER Corp. (a) | | | 21,986 | | | | 2,395,545 | |
| Scout24 AG | | | 42,724 | | | | 1,965,873 | |
| | | | | | | | |
| | | | | | $ | 5,079,400 | |
| | | | | | | | |
| Machinery & Tools – 4.9% | | | | | | | | |
| Daikin Industries Ltd. | | | 49,800 | | | $ | 5,240,509 | |
| GEA Group AG | | | 104,077 | | | | 2,683,039 | |
7
MFS Research International Portfolio
Portfolio of Investments – continued
| | | | | | | | |
| | |
| Issuer | | Shares/Par | | | Value ($) | |
| COMMON STOCKS – continued | | | | | | | | |
| Machinery & Tools – continued | | | | | | | | |
| Kubota Corp. | | | 314,600 | | | $ | 4,429,828 | |
| Ritchie Bros. Auctioneers, Inc. | | | 63,208 | | | | 2,067,733 | |
| Schindler Holding AG | | | 18,226 | | | | 3,621,000 | |
| | | | | | | | |
| | | | | | $ | 18,042,109 | |
| | | | | | | | |
| Major Banks – 5.5% | | | | | | | | |
| Bankia S.A. | | | 344,851 | | | $ | 1,011,489 | |
| Barclays PLC | | | 1,764,504 | | | | 3,385,250 | |
| BNP Paribas | | | 94,977 | | | | 4,295,664 | |
| Erste Group Bank AG | | | 50,438 | | | | 1,678,780 | |
| Mitsubishi UFJ Financial Group, Inc. | | | 819,200 | | | | 4,039,590 | |
| UBS AG | | | 485,575 | | | | 6,061,414 | |
| | | | | | | | |
| | | | | | $ | 20,472,187 | |
| | | | | | | | |
| Medical & Health Technology & Services – 0.5% | | | | | |
| Sonic Healthcare Ltd. | | | 130,299 | | | $ | 2,029,169 | |
| | | | | | | | |
| Medical Equipment – 2.9% | | | | | | | | |
| EssilorLuxottica | | | 42,439 | | | $ | 5,370,573 | |
| Terumo Corp. | | | 95,300 | | | | 5,353,899 | |
| | | | | | | | |
| | | | | | $ | 10,724,472 | |
| | | | | | | | |
| Metals & Mining – 1.2% | | | | | | | | |
| Rio Tinto Ltd. | | | 92,362 | | | $ | 4,391,127 | |
| | | | | | | | |
| Natural Gas – Distribution – 0.6% | | | | | | | | |
| China Resources Gas Group Ltd. | | | 526,000 | | | $ | 2,082,370 | |
| | | | | | | | |
| Natural Gas – Pipeline – 1.2% | | | | | | | | |
| APA Group | | | 283,087 | | | $ | 1,694,834 | |
| Enbridge, Inc. | | | 83,921 | | | | 2,607,010 | |
| | | | | | | | |
| | | | | | $ | 4,301,844 | |
| | | | | | | | |
| Network & Telecom – 0.8% | | | | | | | | |
| LM Ericsson Telephone Co., “B” | | | 357,093 | | | $ | 3,147,419 | |
| | | | | | | | |
| Other Banks & Diversified Financials – 7.7% | | | | | |
| Aeon Credit Service Co. Ltd. | | | 214,500 | | | $ | 3,853,228 | |
| AIB Group PLC | | | 775,371 | | | | 3,269,242 | |
| HDFC Bank Ltd. | | | 163,980 | | | | 4,983,404 | |
| Intesa Sanpaolo S.p.A. | | | 2,190,496 | | | | 4,854,742 | |
| Julius Baer Group Ltd. | | | 96,924 | | | | 3,463,461 | |
| Jyske Bank A.S. | | | 33,039 | | | | 1,194,202 | |
| KBC Groep N.V. | | | 63,938 | | | | 4,152,204 | |
| Mastercard, Inc., “A” | | | 13,308 | | | | 2,510,554 | |
| | | | | | | | |
| | | | | | $ | 28,281,037 | |
| | | | | | | | |
| Pharmaceuticals – 7.6% | | | | | | | | |
| Bayer AG | | | 81,104 | | | $ | 5,627,531 | |
| Novo Nordisk A.S., “B” | | | 149,504 | | | | 6,872,357 | |
| Roche Holding AG | | | 41,446 | | | | 10,248,528 | |
| Santen Pharmaceutical Co. Ltd. | | | 367,900 | | | | 5,265,006 | |
| | | | | | | | |
| | | | | | $ | 28,013,422 | |
| | | | | | | | |
| Printing & Publishing – 1.3% | | | | | | | | |
| RELX Group PLC | | | 235,744 | | | $ | 4,853,762 | |
| | | | | | | | |
| | | | | | | | |
| | |
| Issuer | | Shares/Par | | | Value ($) | |
| COMMON STOCKS – continued | | | | | | | | |
| Real Estate – 2.5% | | | | | | | | |
| Grand City Properties S.A. | | | 209,685 | | | $ | 4,552,671 | |
| LEG Immobilien AG | | | 45,446 | | | | 4,744,595 | |
| | | | | | | | |
| | | | | | $ | 9,297,266 | |
| | | | | | | | |
| Restaurants – 0.5% | | | | | | | | |
| Yum China Holdings, Inc. | | | 55,865 | | | $ | 1,873,153 | |
| | | | | | | | |
| Specialty Chemicals – 8.0% | | | | | |
| Akzo Nobel N.V. | | | 71,750 | | | $ | 5,787,411 | |
| Croda International PLC | | | 81,860 | | | | 4,888,270 | |
| Kansai Paint Co. Ltd. | | | 59,400 | | | | 1,140,013 | |
| Linde PLC | | | 51,651 | | | | 8,199,267 | |
| Nitto Denko Corp. | | | 38,000 | | | | 1,897,268 | |
| Sika AG | | | 29,900 | | | | 3,800,092 | |
| Symrise AG | | | 49,794 | | | | 3,679,819 | |
| | | | | | | | |
| | | | | | $ | 29,392,140 | |
| | | | | | | | |
| Specialty Stores – 0.9% | | | | | | | | |
| Dufry AG | | | 17,546 | | | $ | 1,666,408 | |
| Just Eat PLC (a) | | | 247,851 | | | | 1,853,765 | |
| | | | | | | | |
| | | | | | $ | 3,520,173 | |
| | | | | | | | |
| Telecommunications – Wireless – 3.4% | | | | | |
| Advanced Info Service PLC | | | 420,000 | | | $ | 2,225,123 | |
| KDDI Corp. | | | 210,600 | | | | 5,018,614 | |
| SoftBank Corp. | | | 61,200 | | | | 4,033,983 | |
| Tele2 AB, “B” | | | 110,996 | | | | 1,418,293 | |
| | | | | | | | |
| | | | | | $ | 12,696,013 | |
| | | | | | | | |
| Telephone Services – 0.5% | | | | | |
| Hellenic Telecommunications Organization S.A. | | | 166,252 | | | $ | 1,813,400 | |
| | | | | | | | |
| Tobacco – 2.2% | | | | | | | | |
| British American Tobacco PLC | | | 151,091 | | | $ | 4,814,514 | |
| Japan Tobacco, Inc. | | | 135,200 | | | | 3,207,608 | |
| | | | | | | | |
| | | | | | $ | 8,022,122 | |
| | | | | | | | |
| Trucking – 0.7% | | | | | | | | |
| Yamato Holdings Co. Ltd. | | | 89,100 | | | $ | 2,428,087 | |
| | | | | | | | |
| Utilities – Electric Power – 2.8% | | | | | |
| CLP Holdings Ltd. | | | 294,000 | | | $ | 3,322,776 | |
| E.ON AG | | | 302,094 | | | | 2,986,013 | |
| Iberdrola S.A. | | | 507,086 | | | | 4,077,413 | |
| | | | | | | | |
| | | | | | $ | 10,386,202 | |
| | | | | | | | |
Total Common Stocks
(Identified Cost, $372,115,399) | | | | | | $ | 362,954,280 | |
| | | | | | | | |
| |
| INVESTMENT COMPANIES (h) – 1.5% | | | | | |
| Money Market Funds – 1.5% | | | | | |
| MFS Institutional Money Market Portfolio, 2.4% (v) (Identified Cost, $5,381,437) | | | 5,381,595 | | | $ | 5,381,057 | |
| | | | | | | | |
OTHER ASSETS, LESS
LIABILITIES – 0.2% | | | | | | | 839,279 | |
| | | | | | | | |
| NET ASSETS – 100.0% | | | | | | $ | 369,174,616 | |
| | | | | | | | |
8
MFS Research International Portfolio
Portfolio of Investments – continued
| (a) | | Non-income producing security. |
| (h) | | An affiliated issuer, which may be considered one in which the fund owns 5% or more of the outstanding voting securities, or a company which is under common control. At period end, the aggregate values of the fund’s investments in affiliated issuers and in unaffiliated issuers were $5,381,057 and $362,954,280, respectively. |
| (v) | | Affiliated issuer that is available only to investment companies managed by MFS. The rate quoted for the MFS Institutional Money Market Portfolio is the annualizedseven-day yield of the fund at period end. |
The following abbreviations are used in this report and are defined:
| ADR | | American Depositary Receipt |
| PLC | | Public Limited Company |
See Notes to Financial Statements
9
MFS Research International Portfolio
FINANCIAL STATEMENTS | STATEMENT OF ASSETS AND LIABILITIES
This statement represents your fund’s balance sheet, which details the assets and liabilities comprising the total value of the fund.
| | | | |
At 12/31/18 | | | | |
| |
Assets | | | | |
Investments in unaffiliated issuers, at value (identified cost, $372,115,399) | | | $362,954,280 | |
Investments in affiliated issuers, at value (identified cost, $5,381,437) | | | 5,381,057 | |
Foreign currency, at value (identified cost, $2,955) | | | 2,958 | |
Receivables for | | | | |
Investments sold | | | 1,434,842 | |
Fund shares sold | | | 180,345 | |
Interest and dividends | | | 1,093,209 | |
Other assets | | | 2,586 | |
Total assets | | | $371,049,277 | |
| |
Liabilities | | | | |
Payables for | | | | |
Investments purchased | | | $1,632,897 | |
Fund shares reacquired | | | 72,054 | |
Payable to affiliates | | | | |
Investment adviser | | | 34,165 | |
Shareholder servicing costs | | | 112 | |
Distribution and/or service fees | | | 1,815 | |
Payable for independent Trustees’ compensation | | | 15 | |
Deferred country tax expense payable | | | 22,452 | |
Accrued expenses and other liabilities | | | 111,151 | |
Total liabilities | | | $1,874,661 | |
Net assets | | | $369,174,616 | |
| |
Net assets consist of | | | | |
Paid-in capital | | | $355,936,702 | |
Total distributable earnings (loss) | | | 13,237,914 | |
Net assets | | | $369,174,616 | |
Shares of beneficial interest outstanding | | | 26,291,245 | |
| | | | | | | | | | | | |
| | | |
| | | Net assets | | | Shares
outstanding | | | Net asset value
per share | |
Initial Class | | | $302,385,513 | | | | 21,486,954 | | | | $14.07 | |
Service Class | | | 66,789,103 | | | | 4,804,291 | | | | 13.90 | |
See Notes to Financial Statements
10
MFS Research International Portfolio
FINANCIAL STATEMENTS | STATEMENT OF OPERATIONS
This statement describes how much your fund earned in investment income and accrued in expenses. It also describes any gains and/or losses generated by fund operations.
| | | | |
Year ended 12/31/18 | | | | |
| |
Net investment income (loss) | | | | |
Income | | | | |
Dividends | | | $10,974,295 | |
Dividends from affiliated issuers | | | 73,635 | |
Income on securities loaned | | | 51,882 | |
Other | | | 2,964 | |
Foreign taxes withheld | | | (1,014,909 | ) |
Total investment income | | | $10,087,867 | |
Expenses | | | | |
Management fee | | | $3,662,429 | |
Distribution and/or service fees | | | 185,964 | |
Shareholder servicing costs | | | 13,830 | |
Administrative services fee | | | 67,824 | |
Independent Trustees’ compensation | | | 7,415 | |
Custodian fee | | | 101,456 | |
Shareholder communications | | | 28,146 | |
Audit and tax fees | | | 62,169 | |
Legal fees | | | 3,584 | |
Miscellaneous | | | 29,708 | |
Total expenses | | | $4,162,525 | |
Reduction of expenses by investment adviser | | | (41,516 | ) |
Net expenses | | | $4,121,009 | |
Net investment income (loss) | | | $5,966,858 | |
| |
Realized and unrealized gain (loss) | | | | |
Realized gain (loss) (identified cost basis) | | | | |
Unaffiliated issuers (net of $8,062 country tax) | | | $17,735,964 | |
Affiliated issuers | | | 893 | |
Foreign currency | | | (49,881 | ) |
Net realized gain (loss) | | | $17,686,976 | |
Change in unrealized appreciation or depreciation | | | | |
Unaffiliated issuers (net of $24,519 decrease in deferred country tax) | | | $(82,699,072 | ) |
Affiliated issuers | | | (380 | ) |
Translation of assets and liabilities in foreign currencies | | | (12,763 | ) |
Net unrealized gain (loss) | | | $(82,712,215 | ) |
Net realized and unrealized gain (loss) | | | $(65,025,239 | ) |
Change in net assets from operations | | | $(59,058,381 | ) |
See Notes to Financial Statements
11
MFS Research International Portfolio
FINANCIAL STATEMENTS | STATEMENTS OF CHANGES IN NET ASSETS
These statements describe the increases and/or decreases in net assets resulting from operations, any distributions, and any shareholder transactions.
| | | | | | | | |
| | | Year ended | |
| | | 12/31/18 | | | 12/31/17 | |
Change in net assets | | | | | | | | |
From operations | | | | | | | | |
Net investment income (loss) | | | $5,966,858 | | | | $5,853,114 | |
Net realized gain (loss) | | | 17,686,976 | | | | 26,063,324 | |
Net unrealized gain (loss) | | | (82,712,215 | ) | | | 71,473,238 | |
Change in net assets from operations | | | $(59,058,381 | ) | | | $103,389,676 | |
Total distributions to shareholders (a) | | | $(16,070,335 | ) | | | $(7,282,212 | ) |
Change in net assets from fund share transactions | | | $22,056,598 | | | | $(75,751,483 | ) |
Total change in net assets | | | $(53,072,118 | ) | | | $20,355,981 | |
Net assets | | | | | | | | |
At beginning of period | | | 422,246,734 | | | | 401,890,753 | |
At end of period (b) | | | $369,174,616 | | | | $422,246,734 | |
| (a) | Distributions from net investment income and from net realized gain are no longer required to be separately disclosed. See Note 2. For the year ended December 31, 2017, distributions from net investment income were $7,282,212. |
| (b) | Parenthetical disclosure of undistributed net investment income is no longer required. See Note 2. For the year ended December 31, 2017, end of period net assets included undistributed net investment income of $5,791,372. |
See Notes to Financial Statements
12
MFS Research International Portfolio
FINANCIAL STATEMENTS | FINANCIAL HIGHLIGHTS
The financial highlights table is intended to help you understand the fund’s financial performance for the past 5 years. Certain information reflects financial results for a single fund share. The total returns in the table represent the rate that an investor would have earned (or lost) on an investment in the fund share class (assuming reinvestment of all distributions) held for the entire period.
| | | | | | | | | | | | | | | | | | | | |
| Initial Class | | Year ended | |
| | | | | |
| | | 12/31/18 | | | 12/31/17 | | | 12/31/16 | | | 12/31/15 | | | 12/31/14 | |
| | | | | |
Net asset value, beginning of period | | | $17.05 | | | | $13.54 | | | | $13.85 | | | | $14.56 | | | | $16.09 | |
| | | | | |
| Income (loss) from investment operations | | | | | | | | | | | | | | | | | | | | |
Net investment income (loss) (d) | | | $0.25 | | | | $0.22 | | | | $0.25 | (c) | | | $0.24 | | | | $0.39 | |
Net realized and unrealized gain (loss) | | | (2.56 | ) | | | 3.59 | | | | (0.34 | ) | | | (0.52 | ) | | | (1.46 | ) |
Total from investment operations | | | $(2.31 | ) | | | $3.81 | | | | $(0.09 | ) | | | $(0.28 | ) | | | $(1.07 | ) |
| | | | | |
| Less distributions declared to shareholders | | | | | | | | | | | | | | | | | | | | |
From net investment income | | | $(0.25 | ) | | | $(0.30 | ) | | | $(0.22 | ) | | | $(0.30 | ) | | | $(0.30 | ) |
From net realized gain | | | (0.42 | ) | | | — | | | | — | | | | (0.13 | ) | | | (0.16 | ) |
Total distributions declared to shareholders | | | $(0.67 | ) | | | $(0.30 | ) | | | $(0.22 | ) | | | $(0.43 | ) | | | $(0.46 | ) |
Net asset value, end of period (x) | | | $14.07 | | | | $17.05 | | | | $13.54 | | | | $13.85 | | | | $14.56 | |
Total return (%) (k)(r)(s)(x) | | | (14.12 | ) | | | 28.29 | | | | (0.70 | )(c) | | | (1.96 | ) | | | (6.88 | ) |
| | | | | |
Ratios (%) (to average net assets)
and Supplemental data: | | | | | | | | | | | | | | | | | | | | |
Expenses before expense reductions (f) | | | 0.98 | | | | 1.00 | | | | 0.95 | (c) | | | 1.00 | | | | 1.00 | |
Expenses after expense reductions (f) | | | 0.97 | | | | 0.99 | | | | 0.94 | (c) | | | 1.00 | | | | 0.99 | |
Net investment income (loss) | | | 1.51 | | | | 1.44 | | | | 1.87 | (c) | | | 1.61 | | | | 2.49 | |
Portfolio turnover | | | 25 | | | | 27 | | | | 41 | | | | 38 | | | | 27 | |
Net assets at end of period (000 omitted) | | | $302,386 | | | | $341,613 | | | | $318,753 | | | | $305,502 | | | | $253,001 | |
| |
| Service Class | | Year ended | |
| | | | | |
| | | 12/31/18 | | | 12/31/17 | | | 12/31/16 | | | 12/31/15 | | | 12/31/14 | |
| | | | | |
Net asset value, beginning of period | | | $16.84 | | | | $13.38 | | | | $13.68 | | | | $14.39 | | | | $15.91 | |
| | | | | |
| Income (loss) from investment operations | | | | | | | | | | | | | | | | | | | | |
Net investment income (loss) (d) | | | $0.21 | | | | $0.19 | | | | $0.21 | (c) | | | $0.20 | | | | $0.36 | |
Net realized and unrealized gain (loss) | | | (2.53 | ) | | | 3.52 | | | | (0.33 | ) | | | (0.51 | ) | | | (1.47 | ) |
Total from investment operations | | | $(2.32 | ) | | | $3.71 | | | | $(0.12 | ) | | | $(0.31 | ) | | | $(1.11 | ) |
| | | | | |
| Less distributions declared to shareholders | | | | | | | | | | | | | | | | | | | | |
From net investment income | | | $(0.20 | ) | | | $(0.25 | ) | | | $(0.18 | ) | | | $(0.27 | ) | | | $(0.25 | ) |
From net realized gain | | | (0.42 | ) | | | — | | | | — | | | | (0.13 | ) | | | (0.16 | ) |
Total distributions declared to shareholders | | | $(0.62 | ) | | | $(0.25 | ) | | | $(0.18 | ) | | | $(0.40 | ) | | | $(0.41 | ) |
Net asset value, end of period (x) | | | $13.90 | | | | $16.84 | | | | $13.38 | | | | $13.68 | | | | $14.39 | |
Total return (%) (k)(r)(s)(x) | | | (14.32 | ) | | | 27.90 | | | | (0.91 | )(c) | | | (2.20 | ) | | | (7.16 | ) |
| | | | | |
Ratios (%) (to average net assets)
and Supplemental data: | | | | | | | | | | | | | | | | | | | | |
Expenses before expense reductions (f) | | | 1.23 | | | | 1.25 | | | | 1.20 | (c) | | | 1.25 | | | | 1.25 | |
Expenses after expense reductions (f) | | | 1.22 | | | | 1.24 | | | | 1.19 | (c) | | | 1.25 | | | | 1.24 | |
Net investment income (loss) | | | 1.27 | | | | 1.26 | | | | 1.58 | (c) | | | 1.36 | | | | 2.30 | |
Portfolio turnover | | | 25 | | | | 27 | | | | 41 | | | | 38 | | | | 27 | |
Net assets at end of period (000 omitted) | | | $66,789 | | | | $80,634 | | | | $83,138 | | | | $97,958 | | | | $74,383 | |
See Notes to Financial Statements
13
MFS Research International Portfolio
Financial Highlights – continued
| (c) | Amount reflects aone-time reimbursement of expenses by the custodian (or former custodian) without which net investment income and performance would be lower and expenses would be higher. |
| (d) | Per share data is based on average shares outstanding. |
| (f) | Ratios do not reflect reductions from fees paid indirectly, if applicable. |
| (k) | The total return does not reflect expenses that apply to separate accounts. Inclusion of these charges would reduce the total return figures for all periods shown. |
| (r) | Certain expenses have been reduced without which performance would have been lower. |
| (s) | From time to time the fund may receive proceeds from litigation settlements, without which performance would be lower. |
| (x) | The net asset values and total returns have been calculated on net assets which include adjustments made in accordance with U.S. generally accepted accounting principles required at period end for financial reporting purposes. |
See Notes to Financial Statements
14
MFS Research International Portfolio
NOTES TO FINANCIAL STATEMENTS
| (1) | | Business and Organization |
MFS Research International Portfolio (the fund) is a diversified series of MFS Variable Insurance Trust II (the trust). The trust is organized as a Massachusetts business trust and is registered under the Investment Company Act of 1940, as amended, as anopen-end management investment company. The shareholders of each series of the trust are separate accounts of insurance companies, which offer variable annuity and/or life insurance products, and qualified retirement and pension plans.
The fund is an investment company and accordingly follows the investment company accounting and reporting guidance of the Financial Accounting Standards Board (FASB) Accounting Standards Codification Topic 946 Financial Services – Investment Companies.
| (2) | | Significant Accounting Policies |
General– The preparation of financial statements in conformity with U.S. generally accepted accounting principles requires management to make estimates and assumptions that affect the reported amounts of assets and liabilities, and disclosure of contingent assets and liabilities at the date of the financial statements and the reported amounts of increases and decreases in net assets from operations during the reporting period. Actual results could differ from those estimates. In the preparation of these financial statements, management has evaluated subsequent events occurring after the date of the fund’s Statement of Assets and Liabilities through the date that the financial statements were issued. The fund invests in foreign securities. Investments in foreign securities are vulnerable to the effects of changes in the relative values of the local currency and the U.S. dollar and to the effects of changes in each country’s market, economic, industrial, political, regulatory, geopolitical, and other conditions.
In August 2018, the FASB issued Accounting Standards Update2018-13, Fair Value Measurement (Topic 820) – Disclosure Framework – Changes to the Disclosure Requirements for Fair Value Measurement (“ASU2018-13”) which introduces new fair value disclosure requirements as well as eliminates and modifies certain existing fair value disclosure requirements. ASU2018-13 would be effective for fiscal years beginning after December 15, 2019, and interim periods within those fiscal years; however, management has elected to early adopt ASU2018-13 effective with the current reporting period. The impact of the fund’s adoption was limited to changes in the fund’s financial statement disclosures regarding fair value, primarily those disclosures related to transfers between levels of the fair value hierarchy.
In August 2018, the Securities and Exchange Commission (SEC) released its Final Rule on Disclosure Update and Simplification (the “Final Rule”) which is intended to simplify an issuer’s disclosure compliance efforts by removing redundant or outdated disclosure requirements without significantly altering the mix of information provided to investors. Effective with the current reporting period, the fund adopted the Final Rule with the impacts being that the fund is no longer required to present the components of distributable earnings on the Statement of Assets and Liabilities or the sources of distributions to shareholders and the amount of undistributed net investment income on the Statements of Changes in Net Assets.
Balance Sheet Offsetting– The fund’s accounting policy with respect to balance sheet offsetting is that, absent an event of default by the counterparty or a termination of the agreement, the International Swaps and Derivatives Association (ISDA) Master Agreement, or similar agreement, does not result in an offset of reported amounts of financial assets and financial liabilities in the Statement of Assets and Liabilities across transactions between the fund and the applicable counterparty. The fund’s right to setoff may be restricted or prohibited by the bankruptcy or insolvency laws of the particular jurisdiction to which a specific master netting agreement counterparty is subject. Balance sheet offsetting disclosures, to the extent applicable to the fund, have been included in the fund’s Significant Accounting Policies note under the captions for each of the fund’sin-scope financial instruments and transactions.
Investment Valuations– Equity securities, including restricted equity securities, are generally valued at the last sale or official closing price on their primary market or exchange as provided by a third-party pricing service. Equity securities, for which there were no sales reported that day, are generally valued at the last quoted daily bid quotation on their primary market or exchange as provided by a third-party pricing service. Short-term instruments with a maturity at issuance of 60 days or less may be valued at amortized cost, which approximates market value.Open-end investment companies are generally valued at net asset value per share. Securities and other assets generally valued on the basis of information from a third-party pricing service may also be valued at a broker/dealer bid quotation. In determining values, third-party pricing services can utilize both transaction data and market information such as yield, quality, coupon rate, maturity, type of issue, trading characteristics, and other market data. The values of foreign securities and other assets and liabilities expressed in foreign currencies are converted to U.S. dollars using the mean of bid and asked prices for rates provided by a third-party pricing service.
The Board of Trustees has delegated primary responsibility for determining or causing to be determined the value of the fund’s investments (including any fair valuation) to the adviser pursuant to valuation policies and procedures approved by the Board. If the adviser determines that reliable market quotations are not readily available, investments are valued at fair value as determined in good faith by the adviser in accordance with such procedures under the oversight of the Board of Trustees. Under the fund’s valuation policies and procedures, market quotations are not considered to be readily available for most types of debt instruments
15
MFS Research International Portfolio
Notes to Financial Statements – continued
and floating rate loans and many types of derivatives. These investments are generally valued at fair value based on information from third-party pricing services. In addition, investments may be valued at fair value if the adviser determines that an investment’s value has been materially affected by events occurring after the close of the exchange or market on which the investment is principally traded (such as foreign exchange or market) and prior to the determination of the fund’s net asset value, or after the halting of trading of a specific security where trading does not resume prior to the close of the exchange or market on which the security is principally traded. Events that occur on a frequent basis after foreign markets close (such as developments in foreign markets and significant movements in the U.S. markets) and prior to the determination of the fund’s net asset value may be deemed to have a material effect on the value of securities traded in foreign markets. Accordingly, the fund’s foreign equity securities may often be valued at fair value. The adviser generally relies on third-party pricing services or other information (such as the correlation with price movements of similar securities in the same or other markets; the type, cost and investment characteristics of the security; the business and financial condition of the issuer; and trading and other market data) to assist in determining whether to fair value and at what value to fair value an investment. The value of an investment for purposes of calculating the fund’s net asset value can differ depending on the source and method used to determine value. When fair valuation is used, the value of an investment used to determine the fund’s net asset value may differ from quoted or published prices for the same investment. There can be no assurance that the fund could obtain the fair value assigned to an investment if it were to sell the investment at the same time at which the fund determines its net asset value per share.
Various inputs are used in determining the value of the fund’s assets or liabilities. These inputs are categorized into three broad levels. In certain cases, the inputs used to measure fair value may fall into different levels of the fair value hierarchy. In such cases, an investment’s level within the fair value hierarchy is based on the lowest level of input that is significant to the fair value measurement. The fund’s assessment of the significance of a particular input to the fair value measurement in its entirety requires judgment, and considers factors specific to the investment. Level 1 includes unadjusted quoted prices in active markets for identical assets or liabilities. Level 2 includes other significant observable market-based inputs (including quoted prices for similar securities, interest rates, prepayment speed, and credit risk). Level 3 includes unobservable inputs, which may include the adviser’s own assumptions in determining the fair value of investments. The following is a summary of the levels used as of December 31, 2018 in valuing the fund’s assets or liabilities:
| | | | | | | | | | | | | | | | |
| Financial Instruments | | Level 1 | | | Level 2 | | | Level 3 | | | Total | |
| Equity Securities: | | | | | | | | | | | | | | | | |
Japan | | | $— | | | | $67,710,115 | | | | $— | | | | $67,710,115 | |
United Kingdom | | | 46,570,490 | | | | — | | | | — | | | | 46,570,490 | |
Switzerland | | | — | | | | 46,135,618 | | | | — | | | | 46,135,618 | |
France | | | 33,501,493 | | | | — | | | | — | | | | 33,501,493 | |
Germany | | | 28,062,514 | | | | — | | | | — | | | | 28,062,514 | |
United States | | | 26,357,386 | | | | — | | | | — | | | | 26,357,386 | |
Hong Kong | | | 13,494,336 | | | | — | | | | — | | | | 13,494,336 | |
Australia | | | 11,806,675 | | | | — | | | | — | | | | 11,806,675 | |
Spain | | | 10,906,447 | | | | — | | | | — | | | | 10,906,447 | |
Other Countries | | | 55,043,307 | | | | 23,365,899 | | | | — | | | | 78,409,206 | |
| Mutual Funds | | | 5,381,057 | | | | — | | | | — | | | | 5,381,057 | |
| Total | | | $231,123,705 | | | | $137,211,632 | | | | $— | | | | $368,335,337 | |
For further information regarding security characteristics, see the Portfolio of Investments.
Foreign Currency Translation– Purchases and sales of foreign investments, income, and expenses are converted into U.S. dollars based upon currency exchange rates prevailing on the respective dates of such transactions or on the reporting date for foreign denominated receivables and payables. Gains and losses attributable to foreign currency exchange rates on sales of securities are recorded for financial statement purposes as net realized gains and losses on investments. Gains and losses attributable to foreign exchange rate movements on receivables, payables, income and expenses are recorded for financial statement purposes as foreign currency transaction gains and losses. That portion of both realized and unrealized gains and losses on investments that results from fluctuations in foreign currency exchange rates is not separately disclosed.
Security Loans– Under its Securities Lending Agency Agreement with the fund, State Street Bank and Trust Company, as lending agent, loans the securities of the fund to certain qualified institutions (the “Borrowers”) approved by the fund. Security loans can be terminated at the discretion of either the lending agent or the fund and the related securities must be returned within the earlier of the standard trade settlement period for such securities or within three business days. The loans are collateralized by cash and/or U.S. Treasury and federal agency obligations in an amount typically at least equal to the market value of the securities loaned. On loans collateralized by cash, the cash collateral is invested in a money market fund. The market value of the loaned securities is determined at the close of business of the fund and any additional required collateral is delivered to the fund on the next business day. The lending agent provides the fund with indemnification against Borrower default. In the event of Borrower default, the lending agent
16
MFS Research International Portfolio
Notes to Financial Statements – continued
will, for the benefit of the fund, either purchase securities identical to those loaned or, when such purchase is commercially impracticable, pay the fund the market value of the loaned securities. In return, the lending agent assumes the fund’s rights to the related collateral. If the collateral value is less than the cost to purchase identical securities, the lending agent is responsible for the shortfall, but only to the extent that such shortfall is not due to a decline in collateral value resulting from collateral reinvestment for which the fund bears the risk of loss. A portion of the income generated upon investment of the collateral is remitted to the Borrowers, and the remainder is allocated between the fund and the lending agent. On loans collateralized by U.S. Treasury and/or federal agency obligations, a fee is received from the Borrower, and is allocated between the fund and the lending agent. Income from securities lending is separately reported in the Statement of Operations. The dividend and interest income earned on the securities loaned is accounted for in the same manner as other dividend and interest income. At December 31, 2018, there were no securities on loan or collateral outstanding.
Indemnifications– Under the fund’s organizational documents, its officers and Trustees may be indemnified against certain liabilities and expenses arising out of the performance of their duties to the fund. Additionally, in the normal course of business, the fund enters into agreements with service providers that may contain indemnification clauses. The fund’s maximum exposure under these agreements is unknown as this would involve future claims that may be made against the fund that have not yet occurred.
Investment Transactions and Income– Investment transactions are recorded on the trade date. Dividends received in cash are recorded on theex-dividend date. Certain dividends from foreign securities will be recorded when the fund is informed of the dividend if such information is obtained subsequent to theex-dividend date. Dividend payments received in additional securities are recorded on theex-dividend date in an amount equal to the value of the security on such date.
The fund may receive proceeds from litigation settlements. Any proceeds received from litigation involving portfolio holdings are reflected in the Statement of Operations in realized gain/loss if the security has been disposed of by the fund or in unrealized gain/loss if the security is still held by the fund. Any other proceeds from litigation not related to portfolio holdings are reflected as other income in the Statement of Operations.
Tax Matters and Distributions– The fund intends to qualify as a regulated investment company, as defined under Subchapter M of the Internal Revenue Code, and to distribute all of its taxable income, including realized capital gains. As a result, no provision for federal income tax is required. The fund’s federal tax returns, when filed, will remain subject to examination by the Internal Revenue Service for a three year period. Management has analyzed the fund’s tax positions taken on federal and state tax returns for all open tax years and does not believe that there are any uncertain tax positions that require recognition of a tax liability. Foreign taxes, if any, have been accrued by the fund in the accompanying financial statements in accordance with the applicable foreign tax law. Foreign income taxes may be withheld by certain countries in which the fund invests. Additionally, capital gains realized by the fund on securities issued in or by certain foreign countries may be subject to capital gains tax imposed by those countries.
Distributions to shareholders are recorded on theex-dividend date. Income and capital gain distributions are determined in accordance with income tax regulations, which may differ from U.S. generally accepted accounting principles. Certain capital accounts in the financial statements are periodically adjusted for permanent differences in order to reflect their tax character. These adjustments have no impact on net assets or net asset value per share. Temporary differences which arise from recognizing certain items of income, expense, gain or loss in different periods for financial statement and tax purposes will reverse at some time in the future. Distributions in excess of net investment income or net realized gains are temporary overdistributions for financial statement purposes resulting from differences in the recognition or classification of income or distributions for financial statement and tax purposes.
Book/tax differences primarily relate to wash sale loss deferrals.
The tax character of distributions declared to shareholders for the last two fiscal years is as follows:
| | | | | | | | |
| | | Year ended
12/31/18 | | | Year ended
12/31/17 | |
| Ordinary income (including any short-term capital gains) | | | $10,715,230 | | | | $7,282,212 | |
| Long-term capital gains | | | 5,355,105 | | | | — | |
| Total distributions | | | $16,070,335 | | | | $7,282,212 | |
17
MFS Research International Portfolio
Notes to Financial Statements – continued
The federal tax cost and the tax basis components of distributable earnings were as follows:
| | | | |
| As of 12/31/18 | | | | |
| |
| Cost of investments | | | $378,146,938 | |
| Gross appreciation | | | 37,523,283 | |
| Gross depreciation | | | (47,334,884 | ) |
| Net unrealized appreciation (depreciation) | | | $(9,811,601 | ) |
| |
| Undistributed ordinary income | | | 5,843,260 | |
| Undistributed long-term capital gain | | | 17,244,963 | |
| Other temporary differences | | | (38,708 | ) |
Multiple Classes of Shares of Beneficial Interest– The fund offers multiple classes of shares, which differ in their respective distribution and/or service fees. The fund’s income, realized and unrealized gain (loss), and common expenses are allocated to shareholders based on the daily net assets of each class. Dividends are declared separately for each class. Differences in per share dividend rates are generally due to differences in separate class expenses. The fund’s distributions declared to shareholders as reported in the Statements of Changes in Net Assets are presented by class as follows:
| | | | | | | | | | | | | | | | |
| | | From net investment
income | | | From net realized
gain | |
| | | | |
| | | Year ended
12/31/18 | | | Year ended
12/31/17 | | | Year ended
12/31/18 | | | Year ended
12/31/17 | |
| Initial Class | | | $4,990,946 | | | | $6,031,816 | | | | $8,444,733 | | | | $— | |
| Service Class | | | 846,065 | | | | 1,250,396 | | | | 1,788,591 | | | | — | |
| Total | | | $5,837,011 | | | | $7,282,212 | | | | $10,233,324 | | | | $— | |
| (3) | | Transactions with Affiliates |
Investment Adviser– The fund has an investment advisory agreement with MFS to provide overall investment management and related administrative services and facilities to the fund. The management fee is computed daily and paid monthly at the following annual rates based on the fund’s average daily net assets:
| | | | |
| Up to $1 billion | | | 0.90% | |
| In excess of $1 billion and up to $2 billion | | | 0.80% | |
| In excess of $2 billion | | | 0.70% | |
MFS has agreed in writing to reduce its management fee by a specified amount if certain MFS mutual fund assets exceed thresholds agreed to by MFS and the fund’s Board of Trustees. For the year ended December 31, 2018, this management fee reduction amounted to $38,743, which is included in the reduction of total expenses in the Statement of Operations. The management fee incurred for the year ended December 31, 2018 was equivalent to an annual effective rate of 0.89% of the fund’s average daily net assets.
For the period from January 1, 2018 through July 31, 2018, the investment adviser had agreed in writing to pay a portion of the fund’s total annual operating expenses, excluding interest, taxes, extraordinary expenses, brokerage and transaction costs, andinvestment-related expenses, such that total annual operating expenses did not exceed 1.00% of average daily net assets for the Initial Class shares and 1.25% of average daily net assets for the Service Class shares. This written agreement terminated on July 31, 2018. For the period from January 1, 2018 through July 31, 2018, the fund’s actual operating expenses did not exceed the limit and therefore, the investment adviser did not pay any portion of the fund’s expenses related to this agreement. Effective August 1, 2018, the investment adviser has agreed in writing to pay a portion of the fund’s total annual operating expenses, excluding interest, taxes, extraordinary expenses, brokerage and transaction costs, and investment-related expenses, such that total annual operating expenses do not exceed 0.96% of average daily net assets for the Initial Class shares and 1.21% of average daily net assets for the Service Class shares. This written agreement will continue until modified by the fund’s Board of Trustees, but such agreement will continue at least until April 30, 2020. For the period from August 1, 2018 through December 31, 2018, this reduction amounted to $2,773, which is included in the reduction of total expenses in the Statement of Operations.
Distributor– MFS Fund Distributors, Inc. (MFD), a wholly-owned subsidiary of MFS, is the distributor of shares of the fund. The Trustees have adopted a distribution plan for the Service Class shares pursuant to Rule12b-1 under the Investment Company Act of 1940.
The fund’s distribution plan provides that the fund will pay MFD distribution and/or service fees equal to 0.25% per annum of its average daily net assets attributable to Service Class shares as partial consideration for services performed and expenses incurred by MFD and financial intermediaries (including participating insurance companies that invest in the fund to fund variable annuity and variable life insurance contracts, sponsors of qualified retirement and pension plans that invest in the fund, and affiliates of these
18
MFS Research International Portfolio
Notes to Financial Statements – continued
participating insurance companies and plan sponsors) in connection with the sale and distribution of the Service Class shares. MFD may subsequently pay all, or a portion, of the distribution and/or service fees to financial intermediaries.
Shareholder Servicing Agent– MFS Service Center, Inc. (MFSC), a wholly-owned subsidiary of MFS, receives a fee from the fund for its services as shareholder servicing agent. For the year ended December 31, 2018, the fee was $12,909, which equated to 0.0032% annually of the fund’s average daily net assets. MFSC also receives payment from the fund forout-of-pocket expenses paid by MFSC on behalf of the fund. For the year ended December 31, 2018, these costs amounted to $921.
Administrator– MFS provides certain financial, legal, shareholder communications, compliance, and other administrative services to the fund. Under an administrative services agreement, the fund reimburses MFS the costs incurred to provide these services. The fund is charged an annual fixed amount of $17,500 plus a fee based on average daily net assets. The administrative services fee incurred for the year ended December 31, 2018 was equivalent to an annual effective rate of 0.0167% of the fund’s average daily net assets.
Trustees’ and Officers’ Compensation– The fund pays compensation to independent Trustees in the form of a retainer, attendance fees, and additional compensation to Board and Committee chairpersons. The fund does not pay compensation directly to Trustees or officers of the fund who are also officers of the investment adviser, all of whom receive remuneration for their services to the fund from MFS. Certain officers and Trustees of the fund are officers or directors of MFS, MFD, and MFSC.
Other– This fund and certain other funds managed by MFS (the funds) have entered into a service agreement (the ISO Agreement) which provides for payment of fees solely by the funds to Tarantino LLC in return for the provision of services of an Independent Senior Officer (ISO) for the funds. Frank L. Tarantino serves as the ISO and is an officer of the funds and the sole member of Tarantino LLC. The funds can terminate the ISO Agreement with Tarantino LLC at any time under the terms of the ISO Agreement. For the year ended December 31, 2018, the fee paid by the fund under this agreement was $693 and is included in “Miscellaneous” expense in the Statement of Operations. MFS has agreed to bear all expenses associated with office space, other administrative support, and supplies provided to the ISO.
The fund invests in the MFS Institutional Money Market Portfolio which is managed by MFS and seeks current income consistent with preservation of capital and liquidity. This money market fund does not pay a management fee to MFS.
The fund is permitted to engage in purchase and sale transactions with funds and accounts for which MFS serves as investment adviser orsub-adviser (“cross-trades”) pursuant to a policy adopted by the Board of Trustees. This policy has been designed to ensure that cross-trades conducted by the fund comply with Rule17a-7 under the Investment Company Act of 1940. During the year ended December 31, 2018, the fund engaged in purchase and sale transactions pursuant to this policy, which amounted to $123,843 and $1,166,002, respectively. The sales transactions resulted in net realized gains (losses) of $355,029.
For the year ended December 31, 2018, purchases and sales of investments, other than short-term obligations, aggregated $106,693,726 and $99,439,474, respectively.
| (5) | | Shares of Beneficial Interest |
The fund’s Declaration of Trust permits the Trustees to issue an unlimited number of full and fractional shares of beneficial interest. Transactions in fund shares were as follows:
| | | | | | | | | | | | | | | | |
| | | Year ended 12/31/18 | | | Year ended 12/31/17 | |
| | | Shares | | | Amount | | | Shares | | | Amount | |
| Shares sold | | | | | | | | | | | | | | | | |
Initial Class | | | 2,518,504 | | | | $40,932,805 | | | | 996,797 | | | | $15,780,051 | |
Service Class | | | 915,577 | | | | 14,411,304 | | | | 667,310 | | | | 10,100,721 | |
| | | 3,434,081 | | | | $55,344,109 | | | | 1,664,107 | | | | $25,880,772 | |
| Shares issued to shareholders in reinvestment of distributions | | | | | | | | | | | | | | | | |
Initial Class | | | 816,759 | | | | $13,435,679 | | | | 383,216 | | | | $6,031,816 | |
Service Class | | | 161,933 | | | | 2,634,656 | | | | 80,308 | | | | 1,250,396 | |
| | | 978,692 | | | | $16,070,335 | | | | 463,524 | | | | $7,282,212 | |
| Shares reacquired | | | | | | | | | | | | | | | | |
Initial Class | | | (1,888,605 | ) | | | $(31,993,445 | ) | | | (4,873,959 | ) | | | $(75,287,115 | ) |
Service Class | | | (1,061,519 | ) | | | (17,364,401 | ) | | | (2,173,107 | ) | | | (33,627,352 | ) |
| | | (2,950,124 | ) | | | $(49,357,846 | ) | | | (7,047,066 | ) | | | $(108,914,467 | ) |
| Net change | | | | | | | | | | | | | | | | |
Initial Class | | | 1,446,658 | | | | $22,375,039 | | | | (3,493,946 | ) | | | $(53,475,248 | ) |
Service Class | | | 15,991 | | | | (318,441 | ) | | | (1,425,489 | ) | | | (22,276,235 | ) |
| | | 1,462,649 | | | | $22,056,598 | | | | (4,919,435 | ) | | | $(75,751,483 | ) |
19
MFS Research International Portfolio
Notes to Financial Statements – continued
The fund is one of several mutual funds in which certain MFS funds may invest. The MFS funds do not invest in the underlying funds for the purpose of exercising management or control. At the end of the period, the MFS Moderate Allocation Portfolio, the MFS Growth Allocation Portfolio, and the MFS Conservative Allocation Portfolio were the owners of record of approximately 25%, 8%, and 5% respectively, of the value of outstanding voting shares of the fund.
The fund and certain other funds managed by MFS participate in a $1.25 billion unsecured committed line of credit, subject to a $1 billion sublimit, provided by a syndication of banks under a credit agreement. Borrowings may be made for temporary financing needs. Interest is charged to each fund, based on its borrowings, generally at a rate equal to the higher of the Overnight Bank Funding rate or daily one month LIBOR plus an agreed upon spread. A commitment fee, based on the average daily, unused portion of the committed line of credit, is allocated among the participating funds. In addition, the fund and other funds managed by MFS have established unsecured uncommitted borrowing arrangements with certain banks for temporary financing needs. Interest is charged to each fund, based on its borrowings, at a rate equal to the Overnight Bank Funding rate plus an agreed upon spread. For the year ended December 31, 2018, the fund’s commitment fee and interest expense were $2,373 and $0, respectively, and are included in “Miscellaneous” expense in the Statement of Operations.
| (7) | | Investments in Affiliated Issuers |
An affiliated issuer may be considered one in which the fund owns 5% or more of the outstanding voting securities, or a company which is under common control. For the purposes of this report, the fund assumes the following to be affiliated issuers:
| | | | | | | | | | | | | | | | | | |
| Affiliated Issuers | | | | Beginning
Shares/Par
Amount | | | Acquisitions
Shares/Par
Amount | | | Dispositions
Shares/Par
Amount | | | Ending
Shares/Par
Amount | |
| | | | | |
| MFS Institutional Money Market Portfolio | | | | | 710,680 | | | | 61,141,961 | | | | (56,471,046 | ) | | | 5,381,595 | |
| | | | | |
| Affiliated Issuers | | Realized
Gain (Loss) | | Change in
Unrealized
Appreciation/
Depreciation | | | Capital Gain
Distributions | | | Dividend
Income | | | Ending
Value | |
| | | | | |
| MFS Institutional Money Market Portfolio | | $893 | | | $(380 | ) | | | $— | | | | $73,635 | | | | $5,381,057 | |
20
MFS Research International Portfolio
REPORT OF INDEPENDENT REGISTERED PUBLIC ACCOUNTING FIRM
To the Board of Trustees of MFS Variable Insurance Trust II and the Shareholders of MFS Research International Portfolio:
Opinion on the Financial Statements and Financial Highlights
We have audited the accompanying statement of assets and liabilities of MFS Research International Portfolio (the “Fund”), including the portfolio of investments, as of December 31, 2018, the related statement of operations for the year then ended, the statements of changes in net assets for each of the two years in the period then ended, the financial highlights for each of the five years in the period then ended, and the related notes. In our opinion, the financial statements and financial highlights present fairly, in all material respects, the financial position of the Fund as of December 31, 2018, and the results of its operations for the year then ended, the changes in its net assets for each of the two years in the period then ended, and the financial highlights for each of the five years in the period then ended, in conformity with accounting principles generally accepted in the United States of America.
Basis for Opinion
These financial statements and financial highlights are the responsibility of the Fund’s management. Our responsibility is to express an opinion on the Fund’s financial statements and financial highlights based on our audits. We are a public accounting firm registered with the Public Company Accounting Oversight Board (United States) (PCAOB) and are required to be independent with respect to the Fund in accordance with the U.S. federal securities laws and the applicable rules and regulations of the Securities and Exchange Commission and the PCAOB.
We conducted our audits in accordance with the standards of the PCAOB. Those standards require that we plan and perform the audit to obtain reasonable assurance about whether the financial statements and financial highlights are free of material misstatement, whether due to error or fraud. The Fund is not required to have, nor were we engaged to perform, an audit of its internal control over financial reporting. As part of our audits we are required to obtain an understanding of internal control over financial reporting but not for the purpose of expressing an opinion on the effectiveness of the Fund’s internal control over financial reporting. Accordingly, we express no such opinion.
Our audits included performing procedures to assess the risks of material misstatement of the financial statements and financial highlights, whether due to error or fraud, and performing procedures that respond to those risks. Such procedures included examining, on a test basis, evidence regarding the amounts and disclosures in the financial statements and financial highlights. Our audits also included evaluating the accounting principles used and significant estimates made by management, as well as evaluating the overall presentation of the financial statements and financial highlights. Our procedures included confirmation of securities owned as of December 31, 2018, by correspondence with the custodian and brokers; when replies were not received from brokers, we performed other auditing procedures. We believe that our audits provide a reasonable basis for our opinion.
DELOITTE & TOUCHE LLP
Boston, Massachusetts
February 15, 2019
We have served as the auditor of one or more of the MFS investment companies since 1924.
21
MFS Research International Portfolio
TRUSTEES AND OFFICERS – IDENTIFICATION AND BACKGROUND
The Trustees and Officers of the Trust, as of February 1, 2019, are listed below, together with their principal occupations during the past five years. (Their titles may have varied during that period.) The address of each Trustee and Officer is 111 Huntington Avenue, Boston, Massachusetts 02199-7618.
| | | | | | | | | | |
Name, Age | | Position(s)
Held with Fund | | Trustee/Officer
Since (h) | | Number of MFS Funds overseen by the Trustee | | Principal Occupations
During the Past Five Years | | Other Directorships During the Past Five Years (j) |
| INTERESTED TRUSTEES |
Robert J. Manning (k) (age 55) | | Trustee | | February 2004 | | 135 | | Massachusetts Financial Services Company, Executive Chairman (since January 2017); Director; Chairman of the Board; Chief Executive Officer (until 2015);Co-Chief Executive Officer(2015-2016) | | N/A |
| | | | | |
Robin A. Stelmach (k) (age 57) | | Trustee | | January 2014 | | 135 | | Massachusetts Financial Services Company, Vice Chair (since January 2017); Chief Operating Officer and Executive Vice President (until January 2017) | | N/A |
|
| INDEPENDENT TRUSTEES |
John P. Kavanaugh (age 64) | | Trustee and Chair of Trustees | | January 2009 | | 135 | | Private investor | | N/A |
| | | | | |
Steven E. Buller (age 67) | | Trustee | | February 2014 | | 135 | | Financial Accounting Standards Advisory Council, Chairman(2014-2015); Public Company Accounting Oversight Board, Standing Advisory Group, Member (until 2014); BlackRock, Inc. (investment management), Managing Director (until 2014), BlackRock Finco UK (investment management), Director (until 2014) | | N/A |
| | | | | |
John A. Caroselli (age 64) | | Trustee | | March 2017 | | 135 | | JC Global Advisors, LLC (management consulting), President (since 2015); First Capital Corporation (commercial finance), Executive Vice President (until 2015) | | N/A |
| | | | | |
Maureen R. Goldfarb (age 63) | | Trustee | | January 2009 | | 135 | | Private investor | | N/A |
| | | | | |
Michael Hegarty (age 74) | | Trustee | | December 2004 | | 135 | | Private investor | | Rouse Properties Inc., Director (until 2016); Capmark Financial Group Inc., Director (until 2015) |
| | | | | |
Peter D. Jones (age 63) | | Trustee | | January 2019 | | 135 | | Franklin Templeton Distributors, Inc. (investment management), President (until 2015); Franklin Templeton Institutional, LLC (investment management), Chairman (until 2015) | | N/A |
| | | | | |
James W. Kilman, Jr. (age 57) | | Trustee | | January 2019 | | 135 | | KielStrand Capital LLC (family office and merchant bank), Chief Executive Officer (since 2016); Morgan Stanley & Co. (financial services), Vice Chairman of Investment Banking,Co-Head of Diversified Financials Coverage – Financial Institutions Investment Banking Group (until 2016) | | alpha-En Corporation, Director (since 2016) |
22
MFS Research International Portfolio
Trustees and Officers – continued
| | | | | | | | | | |
Name, Age | | Position(s)
Held with Fund | | Trustee/Officer
Since (h) | | Number of MFS Funds overseen by the Trustee | | Principal Occupations
During the Past Five Years | | Other Directorships During the Past Five Years (j) |
Clarence Otis, Jr. (age 62) | | Trustee | | March 2017 | | 135 | | Darden Restaurants, Inc., Chief Executive Officer (until 2014) | | VF Corporation, Director; Verizon Communications, Inc., Director; The Travelers Companies, Director; Federal Reserve Bank of Atlanta, Director (until 2015) |
| | | | | |
Maryanne L. Roepke (age 62) | | Trustee | | May 2014 | | 135 | | American Century Investments (investment management), Senior Vice President and Chief Compliance Officer (until 2014) | | N/A |
| | | | | |
Laurie J. Thomsen
(age 61) | | Trustee | | March 2005 | | 135 | | Private investor | | The Travelers Companies, Director; Dycom Industries, Inc., Director (since 2015) |
| | | | | | | | |
Name, Age | | Position(s)
Held with Fund | | Trustee/Officer
Since (h) | | Number of MFS Funds for which the Person is an Officer | | Principal Occupations During the Past Five Years |
| OFFICERS | | | | | | |
Christopher R. Bohane (k)
(age 45) | | Assistant Secretary and Assistant Clerk | | July 2005 | | 135 | | Massachusetts Financial Services Company, Vice President and Assistant General Counsel |
| | | | |
Kino Clark (k) (age 50) | | Assistant Treasurer | | January 2012 | | 135 | | Massachusetts Financial Services Company, Vice President |
| | | | |
John W. Clark, Jr. (k) (age 51) | | Assistant Treasurer | | April 2017 | | 135 | | Massachusetts Financial Services Company, Vice President (since March 2017); Deutsche Bank (financial services), Department Head – Treasurer’s Office (until February 2017) |
| | | | |
Thomas H. Connors (k) (age 59) | | Assistant Secretary and Assistant Clerk | | September 2012 | | 135 | | Massachusetts Financial Services Company, Vice President and Senior Counsel |
| | | | |
Ethan D. Corey (k)
(age 55) | | Assistant
Secretary and Assistant Clerk | | July 2005 | | 135 | | Massachusetts Financial Services Company, Senior Vice President and Associate General Counsel |
| | | | |
David L. DiLorenzo (k)
(age 50) | | President | | July 2005 | | 135 | | Massachusetts Financial Services Company, Senior Vice President |
| | | | |
Heidi W. Hardin (k) (age 51) | | Secretary and Clerk | | April 2017 | | 135 | | Massachusetts Financial Services Company, Executive Vice President and General Counsel (since March 2017); Harris Associates (investment management), General Counsel (from September 2015 to January 2017); Janus Capital Management LLC (investment management), Senior Vice President and General Counsel (until September 2015) |
| | | | |
Brian E. Langenfeld (k) (age 45) | | Assistant
Secretary and Assistant Clerk | | June 2006 | | 135 | | Massachusetts Financial Services Company, Vice President and Senior Counsel |
| | | | |
Amanda S. Mooradian (k) (age 39) | | Assistant
Secretary and Assistant Clerk | | September 2018 | | 135 | | Massachusetts Financial Services Company, Assistant Vice President and Counsel |
| | | | |
Susan A. Pereira (k)
(age 48) | | Assistant
Secretary and Assistant Clerk | | July 2005 | | 135 | | Massachusetts Financial Services Company, Vice President and Senior Counsel |
| | | | |
Kasey L. Phillips (k) (age 48) | | Assistant Treasurer | | September 2012 | | 135 | | Massachusetts Financial Services Company, Vice President |
| | | | |
Matthew A. Stowe (k) (age 44) | | Assistant Secretary and Assistant Clerk | | October 2014 | | 135 | | Massachusetts Financial Services Company, Vice President and Assistant General Counsel |
23
MFS Research International Portfolio
Trustees and Officers – continued
| | | | | | | | |
Name, Age | | Position(s)
Held with Fund | | Trustee/Officer
Since (h) | | Number of MFS Funds for which the Person is an Officer | | Principal Occupations During the Past Five Years |
Frank L. Tarantino
(age 74) | | Independent
Senior Officer | | June 2004 | | 135 | | Tarantino LLC (provider of compliance services), Principal |
| | | | |
Richard S. Weitzel (k)
(age 48) | | Assistant Secretary and Assistant Clerk | | October 2007 | | 135 | | Massachusetts Financial Services Company, Senior Vice President and Associate General Counsel |
| | | | |
Martin J. Wolin (k) (age 51) | | Chief Compliance Officer | | July 2015 | | 135 | | Massachusetts Financial Services Company, Senior Vice President and Chief Compliance Officer (since July 2015); Mercer (financial service provider), Chief Risk and Compliance Officer, North America and Latin America (until June 2015) |
| | | | |
James O. Yost (k)
(age 58) | | Treasurer | | September 1990 | | 135 | | Massachusetts Financial Services Company, Senior Vice President |
| (h) | Date first appointed to serve as Trustee/officer of an MFS Fund. Each Trustee has served continuously since appointment unless indicated otherwise. For the period from December 15, 2004 until February 22, 2005, Mr. Manning served as Advisory Trustee. From January 2012 through December 2016, Messrs. DiLorenzo and Yost served as Treasurer and Deputy Treasurer of the Funds, respectively. |
| (j) | Directorships or trusteeships of companies required to report to the Securities and Exchange Commission (i.e., “public companies”). |
| (k) | “Interested person” of the Trust within the meaning of the Investment Company Act of 1940 (referred to as the 1940 Act), which is the principal federal law governing investment companies like the fund, as a result of a position with MFS. The address of MFS is 111 Huntington Avenue, Boston, Massachusetts 02199-7618. |
Each Trustee has been elected by shareholders and each Trustee and officer holds office until his or her successor is chosen and qualified or until his or her earlier death, resignation, retirement or removal. The Trust does not hold annual meetings for the purpose of electing Trustees, and Trustees are not elected for fixed terms. Under the terms of the Board’s retirement policy, an Independent Trustee shall retire at the end of the calendar year in which he or she reaches the earlier of 75 years of age or 15 years of service on the Board (or, in the case of any Independent Trustee who joined the Board prior to 2015, 20 years of service on the Board).
Messrs. Buller, Hegarty, Kilman and Otis and Ms. Roepke are members of the Trust’s Audit Committee.
Each of the Interested Trustees and certain Officers hold comparable officer positions with certain affiliates of MFS.
The Statement of Additional Information for a Fund includes further information about the Trustees and is available without charge upon request by calling1-800-225-2606.
| | |
Investment Adviser Massachusetts Financial Services Company 111 Huntington Avenue Boston, MA 02199-7618 | | Custodian State Street Bank and Trust Company 1 Lincoln Street Boston, MA 02111-2900 |
Distributor MFS Fund Distributors, Inc. 111 Huntington Avenue Boston, MA 02199-7618 | | Independent Registered Public Accounting Firm Deloitte & Touche LLP 200 Berkeley Street Boston, MA 02116 |
Portfolio Manager(s) Jose Luis Garcia Victoria Higley Camille Humphries Lee Thomas Melendez | | |
24
MFS Research International Portfolio
BOARD REVIEW OF INVESTMENT ADVISORY AGREEMENT
The Investment Company Act of 1940 requires that both the full Board of Trustees and a majority of thenon-interested (“independent”) Trustees, voting separately, annually approve the continuation of the Fund’s investment advisory agreement with MFS. The Trustees consider matters bearing on the Fund and its advisory arrangements at their meetings throughout the year, including a review of performance data at each regular meeting. In addition, the independent Trustees met several times over the course of three months beginning in May and ending in July, 2018 (“contract review meetings”) for the specific purpose of considering whether to approve the continuation of the investment advisory agreement for the Fund and the other investment companies that the Board oversees (the “MFS Funds”). The independent Trustees were assisted in their evaluation of the Fund’s investment advisory agreement by independent legal counsel, from whom they received separate legal advice and with whom they met separately from MFS during various contract review meetings. The independent Trustees were also assisted in this process by the MFS Funds’ Independent Senior Officer, a senior officer appointed by and reporting to the independent Trustees.
In connection with their deliberations regarding the continuation of the investment advisory agreement, the Trustees, including the independent Trustees, considered such information and factors as they believed, in light of the legal advice furnished to them and their own business judgment, to be relevant. The investment advisory agreement for the Fund was considered separately, although the Trustees also took into account the common interests of all MFS Funds in their review. As described below, the Trustees considered the nature, quality, and extent of the various investment advisory, administrative, and shareholder services performed by MFS under the existing investment advisory agreement and other arrangements with the Fund.
In connection with their contract review meetings, the Trustees received and relied upon materials that included, among other items: (i) information provided by Broadridge Financial Solutions, Inc. (“Broadridge”), an independent third party, on the investment performance of the Fund for various time periods ended December 31, 2017 and the investment performance of a group of funds with substantially similar investment classifications/objectives (the “Broadridge performance universe”), (ii) information provided by Broadridge on the Fund’s advisory fees and other expenses and the advisory fees and other expenses of comparable funds identified by Broadridge (the “Broadridge expense group”), (iii) information provided by MFS on the advisory fees of portfolios of other clients of MFS, including institutional separate accounts and other clients, (iv) information as to whether and to what extent applicable expense waivers, reimbursements or fee “breakpoints” are observed for the Fund, (v) information regarding MFS’ financial results and financial condition, including MFS’ and certain of its affiliates’ estimated profitability from services performed for the Fund and the MFS Funds as a whole, and compared to MFS’ institutional business, (vi) MFS’ views regarding the outlook for the mutual fund industry and the strategic business plans of MFS, (vii) descriptions of various functions performed by MFS for the Funds, such as compliance monitoring and portfolio trading practices, and (viii) information regarding the overall organization of MFS, including information about MFS’ senior management and other personnel providing investment advisory, administrative and other services to the Fund and the other MFS Funds. The comparative performance, fee and expense information prepared and provided by Broadridge was not independently verified and the independent Trustees did not independently verify any information provided to them by MFS.
The Trustees’ conclusion as to the continuation of the investment advisory agreement was based on a comprehensive consideration of all information provided to the Trustees and not the result of any single factor. Some of the factors that figured particularly in the Trustees’ deliberations are described below, although individual Trustees may have evaluated the information presented differently from one another, giving different weights to various factors. It is also important to recognize that the fee arrangements for the Fund and other MFS Funds are the result of years of review and discussion between the independent Trustees and MFS, that certain aspects of such arrangements may receive greater scrutiny in some years than in others, and that the Trustees’ conclusions may be based, in part, on their consideration of these same arrangements during the course of the year and in prior years.
Based on information provided by Broadridge and MFS, the Trustees reviewed the Fund’s total return investment performance as well as the Broadridge performance universe over various time periods. The Trustees placed particular emphasis on the total return performance of the Fund’s Initial Class shares in comparison to the performance of funds in its Broadridge performance universe over the three-year period ended December 31, 2017, which the Trustees believed was a long enough period to reflect differing market conditions. The total return performance of the Fund’s Initial Class shares was in the 4th quintile relative to the other funds in the universe for this three-year period (the 1st quintile being the best performers and the 5th quintile being the worst performers). The total return performance of the Fund’s Initial Class shares was in the 4th quintile for theone-year period and the 5th quintile for the five-year period ended December 31, 2017 relative to the Broadridge performance universe. Because of the passage of time, these performance results may differ from the performance results for more recent periods, including those shown elsewhere in this report.
The Trustees expressed concern to MFS about the substandard investment performance of the Fund and the Fund’s retail counterpart, MFS Research International Fund, which has substantially similar investment strategies and experienced substantially similar investment performance as the Fund. In the course of their deliberations, the Trustees took into account information provided by MFS in connection with the contract review meetings, as well as during investment review meetings conducted with portfolio management personnel during the course of the year as to MFS’ efforts to improve the performance of the Fund and the Fund’s
25
MFS Research International Portfolio
Board Review of Investment Advisory Agreement – continued
retail counterpart. In addition, the Trustees requested that they receive a separate update on the Fund’s retail counterpart at each of their regular meetings. After reviewing these and related factors, the Trustees concluded, within the context of their overall conclusions regarding the investment advisory agreement, that MFS’ responses and efforts and plans to improve investment performance were sufficient to support approval of the continuance of the investment advisory agreement for an additionalone-year period, but that they would continue to closely monitor the performance of the Fund’s retail counterpart.
In assessing the reasonableness of the Fund’s advisory fee, the Trustees considered, among other information, the Fund’s advisory fee and the total expense ratio of the Fund’s Initial Class shares as a percentage of average daily net assets and the advisory fee and total expense ratios of peer groups of funds based on information provided by Broadridge. The Trustees considered that MFS currently observes an expense limitation for the Fund, which may not be changed without the Trustees’ approval. The Trustees also considered that, according to the data provided by Broadridge (which takes into account any fee reductions or expense limitations that were in effect during the Fund’s last fiscal year), the Fund’s effective advisory fee rate was higher than the Broadridge expense group median and the Fund’s total expense ratio was approximately at the Broadridge expense group median. The Trustees also noted that MFS has agreed to further reduce such expense limitation for the Fund effective August 1, 2018, which may not be changed without the Trustees’ approval.
The Trustees also considered the advisory fees charged by MFS to any institutional separate accounts advised by MFS (“separate accounts”) and unaffiliated investment companies for which MFS serves as subadviser (“subadvised funds”) that have comparable investment strategies to the Fund, if any. In comparing these fees, the Trustees considered information provided by MFS as to the generally broader scope of services provided by MFS to the Fund, as well as the more extensive regulatory burdens imposed on MFS in managing the Fund, in comparison to separate accounts and subadvised funds. The Trustees also considered the higher demands placed on MFS’ investment personnel and trading infrastructure as a result of the daily cashin-flows andout-flows of the Fund in comparison to separate accounts.
The Trustees also considered whether the Fund may benefit from any economies of scale in the management of the Fund in the event of growth in assets of the Fund and/or growth in assets of the MFS Funds as a whole. They noted that the Fund’s advisory fee rate schedule is subject to contractual breakpoints that reduce the Fund’s advisory fee rate on average daily net assets over $1 billion and $2 billion. The Trustees also noted that MFS has agreed in writing to waive a portion of the management fees of certain MFS Funds, including the Fund, if the total combined assets of certain funds within the MFS Funds’ complex increase above agreed upon thresholds (the “group fee waiver”), enabling the Fund’s shareholders to share in the benefits from any economies of scale at the complex level. The group fee waiver is reviewed and renewed annually between the Board and MFS. The Trustees concluded that the breakpoints and the group fee waiver were sufficient to allow the Fund to benefit from economies of scale as its assets and overall complex assets grow.
The Trustees also considered information prepared by MFS relating to MFS’ costs and profits with respect to the Fund, the MFS Funds considered as a group, and other investment companies and accounts advised by MFS, as well as MFS’ methodologies used to determine and allocate its costs to the MFS Funds, the Fund and other accounts and products for purposes of estimating profitability.
After reviewing these and other factors described herein, the Trustees concluded, within the context of their overall conclusions regarding the investment advisory agreement, that the advisory fees charged to the Fund represent reasonable compensation in light of the services being provided by MFS to the Fund.
In addition, the Trustees considered MFS’ resources and related efforts to continue to retain, attract and motivate capable personnel to serve the Fund. The Trustees also considered current and developing conditions in the financial services industry, including the presence of large and well-capitalized companies which are spending, and appear to be prepared to continue to spend, substantial sums to engage personnel and to provide services to competing investment companies. In this regard, the Trustees also considered the financial resources of MFS and its ultimate parent, Sun Life Financial Inc. The Trustees also considered the advantages and possible disadvantages to the Fund of having an adviser that also serves other investment companies as well as other accounts.
The Trustees also considered the nature, quality, cost, and extent of administrative, transfer agency, and distribution services provided to the Fund by MFS and its affiliates under agreements and plans other than the investment advisory agreement, including any12b-1 fees the Fund pays to MFS Fund Distributors, Inc., an affiliate of MFS. The Trustees also considered the nature, extent and quality of certain other services MFS performs or arranges for on the Fund’s behalf, which may include securities lending programs, directed expense payment programs, class action recovery programs, and MFS’ interaction with third-party service providers, principally custodians andsub-custodians. The Trustees concluded that the variousnon-advisory services provided by MFS and its affiliates on behalf of the Fund were satisfactory.
26
MFS Research International Portfolio
Board Review of Investment Advisory Agreement – continued
The Trustees consideredso-called“fall-out benefits” to MFS such as reputational value derived from serving as investment manager to the MFS Funds. The Trustees also considered that, effective January 3, 2018, MFS had discontinued its historic practice of obtaining investment research from portfolio brokerage commissions paid by certain MFS Funds and would thereafter voluntarily reimburse a Fund, if applicable, for the costs of external research acquired through the use of the Fund’s portfolio brokerage commissions.
Based on their evaluation of factors that they deemed to be material, including those factors described above, the Board of Trustees, including the independent Trustees, concluded that the Fund’s investment advisory agreement with MFS should be continued for an additionalone-year period, commencing August 1, 2018.
27
MFS Research International Portfolio
PROXY VOTING POLICIES AND INFORMATION
MFS votes proxies on behalf of the fund pursuant to proxy voting policies and procedures that are available without charge, upon request, by calling 1-800-225-2606, by visitingmfs.com/proxyvoting, or by visiting the SEC’s Web site athttp://www.sec.gov.
Information regarding how the fund voted proxies relating to portfolio securities during the most recent twelve-month period ended June 30 is available by August 31 of each year without charge by visitingmfs.com/proxyvoting, or by visiting the SEC’s Web site athttp://www.sec.gov.
QUARTERLY PORTFOLIO DISCLOSURE
The fund files a complete schedule of portfolio holdings with the SEC for the first and third quarters of each fiscal year on Form N-Q. The fund’s Form N-Q is available on the SEC’s website athttp://www.sec.gov.A shareholder can obtain the portfolio holdings report for the first and third quarters of the fund’s fiscal year atmfs.com/vit2 by choosing the fund’s name and then selecting the “Resources” tab and clicking on “Prospectus and Reports”.
FURTHER INFORMATION
From time to time, MFS may post important information about the fund or the MFS funds on the MFS web site (mfs.com). This information is available athttps://www.mfs.com/en-us/what-we-do/announcements.htmlor atmfs.com/vit2 by choosing the fund’s name.
INFORMATION ABOUT FUND CONTRACTS AND LEGAL CLAIMS
The fund has entered into contractual arrangements with an investment adviser, administrator, distributor, shareholder servicing agent, 529 program manager (if applicable), and custodian who each provide services to the fund. Unless expressly stated otherwise, shareholders are not parties to, or intended beneficiaries of these contractual arrangements, and these contractual arrangements are not intended to create any shareholder right to enforce them against the service providers or to seek any remedy under them against the service providers, either directly or on behalf of the fund.
Under the Trust’s By-Laws and Declaration of Trust, any claims asserted against or on behalf of the MFS Funds, including claims against Trustees and Officers, must be brought in state and federal courts located within the Commonwealth of Massachusetts.
FEDERAL TAX INFORMATION (unaudited)
The following information is provided pursuant to provisions of the Internal Revenue Code.
The fund designates $5,891,000 as capital gain dividends paid during the fiscal year.
Income derived from foreign sources was $9,969,178. The fund intends to pass through foreign tax credits of $881,858 for the fiscal year.
28
rev. 3/16
| | | | |
| | | |
| FACTS | | WHAT DOES MFS DO WITH YOUR
PERSONAL INFORMATION? | |  |
| | |
| Why? | | Financial companies choose how they share your personal information. Federal law gives consumers the right to limit some but not all sharing. Federal law also requires us to tell you how we collect, share, and protect your personal information. Please read this notice carefully to understand what we do. |
| | |
| What? | | The types of personal information we collect and share depend on the product or service you have with us. This information can include: • Social Security number and account balances • Account transactions and transaction history • Checking account information and wire transfer instructions When you areno longer our customer, we continue to share your information as described in this notice. |
| | |
| How? | | All financial companies need to share customers’ personal information to run their everyday business. In the section below, we list the reasons financial companies can share their customers’ personal information; the reasons MFS chooses to share; and whether you can limit this sharing. |
| | | | |
Reasons we can share your
personal information | | Does MFS share? | | Can you limit this
sharing? |
For our everyday business purposes – such as to process your transactions, maintain your account(s), respond to court orders and legal investigations, or report to credit bureaus | | Yes | | No |
For our marketing purposes – to offer our products and services to you | | No | | We don’t share |
| For joint marketing with other financial companies | | No | | We don’t share |
For our affiliates’ everyday business purposes – information about your transactions and experiences | | No | | We don’t share |
For our affiliates’ everyday business purposes – information about your creditworthiness | | No | | We don’t share |
| For nonaffiliates to market to you | | No | | We don’t share |
| | |
| | |
| Questions? | | Call800-225-2606 or go tomfs.com. |
29
| | |
| Who we are |
| Who is providing this notice? | | MFS Funds, MFS Investment Management, MFS Institutional Advisors, Inc., and MFS Heritage Trust Company. |
| | |
| What we do |
| How does MFS protect my personal information? | | To protect your personal information from unauthorized access and use, we use security measures that comply with federal law. These measures include procedural, electronic, and physical safeguards for the protection of the personal information we collect about you. |
How does MFS
collect my personal information? | | We collect your personal information, for example, when you • open an account or provide account information • direct us to buy securities or direct us to sell your securities • make a wire transfer We also collect your personal information from others, such as credit bureaus, affiliates, or other companies. |
| Why can’t I limit all sharing? | | Federal law gives you the right to limit only • sharing for affiliates’ everyday business purposes – information about your creditworthiness • affiliates from using your information to market to you • sharing for nonaffiliates to market to you State laws and individual companies may give you additional rights to limit sharing. |
| | |
| Definitions |
| Affiliates | | Companies related by common ownership or control. They can be financial and nonfinancial companies. • MFS does not share personal information with affiliates, except for everyday business purposes as described on page one of this notice. |
| Nonaffiliates | | Companies not related by common ownership or control. They can be financial and nonfinancial companies. • MFS does not share with nonaffiliates so they can market to you. |
| Joint marketing | | A formal agreement between nonaffiliated financial companies that together market financial products or services to you. • MFS doesn’t jointly market. |
| | |
| Other important information |
| If you own an MFS product or receive an MFS service in the name of a third party such as a bank or broker-dealer, their privacy policy may apply to you instead of ours. |
30
Annual Report
December 31, 2018

MFS® Strategic Income Portfolio

MFS® Variable Insurance Trust II
Beginning on January 1, 2021, as permitted by regulations adopted by the U.S. Securities and Exchange Commission, the insurance company that offers your contract may determine that it will no longer send you paper copies of the fund’s annual and semiannual shareholder reports unless you specifically request paper copies from the insurance company or from your financial intermediary. Instead, the shareholder reports will be made available on a Web site (insurancefunds.mfs.com or other Web site of which you will be notified), and the insurance company will notify you by mail each time a report is posted and provide you with a Web site link to access the report. Instructions for requesting paper copies will be provided by your insurance company or financial intermediary.
If you already elected to receive shareholder reports by email, you will not be affected by this change and you need not take any action. If your insurance company or financial intermediary offers electronic delivery, you may elect to receive shareholder reports and other communications from the insurance company or financial intermediary by email by following the instructions provided by the insurance company or financial intermediary.
Beginning on January 1, 2019, you may elect to receive all future reports in paper free of charge from the insurance company or financial intermediary. You can inform the insurance company or financial intermediary that you wish to continue receiving paper copies of your shareholder reports by contacting your insurance company or financial intermediary. Your election to receive reports in paper will apply to all funds held in your account with your insurance company or financial intermediary.
SIS-ANN
MFS® Strategic Income Portfolio
CONTENTS
The report is prepared for the general information of contract owners. It is authorized for distribution to prospective investors only when preceded or accompanied by a current prospectus.
NOT FDIC INSURED• MAY LOSE VALUE• NO BANK OR CREDIT UNION GUARANTEE• NOT A DEPOSIT• NOT INSURED BY ANY FEDERAL GOVERNMENT AGENCY OR NCUA/NCUSIF
MFS Strategic Income Portfolio
LETTER FROM THE EXECUTIVE CHAIRMAN

Dear Contract Owners:
Higher interest rates, international trade friction, and geopolitical uncertainty surrounding issues such as Brexit have contributed to an uptick in market volatility in recent quarters — a departure from thelow-volatility environment that prevailed for much of the past several years. Against this more challenging backdrop, equity markets in the United States outperformed most international markets on a relative basis in 2018, though broad market returns were modestly negative on an absolute basis. Global economic growth has become less synchronized over the past few quarters, with Europe, China, and some emerging markets having shown signs of significantly slowing growth. While U.S. growth has remained above average, the pace of that growth slowed in the second half of 2018.
Slowing global growth and tighter financial conditions have clouded the outlook for U.S. monetary policy, with the chairman of the U.S. Federal Reserve acknowledging that policy rates are close to levels that the Fed deems neutral for the U.S. economy. This suggests that the predictable pattern of quarterly rate increases is behind us. At the same time, markets must contend with a shift from years of quantitative easing toward a cycle of quantitative tightening now that the European Central Bank has halted asset purchases. U.S. tax reforms adopted in late 2017 have been welcomed by equity markets while emerging market economies have recently had to contend with tighter financial conditions as a result of firmer U.S. interest rates and a stronger dollar. With the Republicans losing control of the U.S. House of Representatives, further meaningful U.S. fiscal stimulus appears less likely over the remainder of this presidential term. A partial U.S. government shutdown, beginning in late 2018, also added to political uncertainty. Globally, inflation remains largely subdued thanks in part to falling oil prices, but tight labor markets and moderate global demand have investors on the lookout for its potential reappearance. Increased U.S. protectionism is also a growing concern, as investors fear trade disputes could dampen business sentiment, leading to even slower global growth. While there has been progress on this front — a NAFTA replacement has been agreed upon between the U.S., Mexico, and Canada; the free trade pact with Korea has been updated; and a negotiating framework with the European Union has been agreed upon — tensions over trade with China remain quite high, though the two sides have recently returned to the negotiating table.
As a global investment manager with nearly a century of expertise, MFS® firmly believes active risk management offers downside mitigation and may help improve investment outcomes. We built our active investment platform with this belief in mind. Ourlong-term perspective influences nearly every aspect of our business, ensuring our investment decisions align with the investing time horizons of our clients.
Respectfully,

Robert J. Manning
Executive Chairman
MFS Investment Management
February 15, 2019
The opinions expressed in this letter are subject to change and may not be relied upon for investment advice. No forecasts can be guaranteed.
1
MFS Strategic Income Portfolio
PORTFOLIO COMPOSITION
Portfolio structure (i)
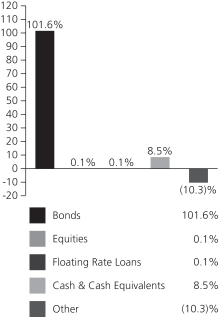
| | | | |
| Fixed income sectors (i) | | | | |
| Investment Grade Corporates | | | 29.4% | |
| U.S. Treasury Securities | | | 27.3% | |
| Commercial Mortgage-Backed Securities | | | 12.3% | |
| High Yield Corporates | | | 9.8% | |
| Collateralized Debt Obligations | | | 8.7% | |
| Emerging Markets Bonds | | | 6.6% | |
| Asset-Backed Securities | | | 5.0% | |
| Municipal Bonds | | | 0.7% | |
| Mortgage-Backed Securities | | | 0.6% | |
| Non-U.S. Government Bonds | | | 0.6% | |
| Residential Mortgage-Backed Securities | | | 0.3% | |
| U.S. Government Agencies | | | 0.3% | |
| Floating Rate Loans | | | 0.1% | |
| | | | |
| Composition including fixed income credit quality (a)(i) | |
| AAA | | | 11.3% | |
| AA | | | 4.0% | |
| A | | | 17.5% | |
| BBB | | | 22.9% | |
| BB | | | 9.8% | |
| B | | | 6.1% | |
| CCC | | | 1.2% | |
| CC | | | 0.3% | |
| C | | | 0.2% | |
| U.S. Government | | | 13.5% | |
| Federal Agencies | | | 0.9% | |
| Not Rated | | | 14.0% | |
| Non-Fixed Income | | | 0.1% | |
| Cash & Cash Equivalents | | | 8.5% | |
| Other | | | (10.3)% | |
| |
| Portfolio facts (i) | | | | |
| Average Duration (d) | | | 5.8 | |
| Average Effective Maturity (m) | | | 8.4 yrs. | |
| (a) | | For all securities other than those specifically described below, ratings are assigned to underlying securities utilizing ratings from Moody’s, Fitch, and Standard & Poor’s rating agencies and applying the following hierarchy: If all three agencies provide a rating, the middle rating (after dropping the highest and lowest ratings) is assigned; if two of the three agencies rate a security, the lower of the two is assigned. Ratings are shown in the S&P and Fitch scale (e.g., AAA). Securities rated BBB or higher are considered investment grade. All ratings are subject to change. U.S. Government includes securities issued by the U.S. Department of the Treasury. Federal Agencies includes rated and unrated U.S. Agency fixed-income securities, U.S. Agency mortgage-backed securities, and collateralized mortgage obligations of U.S. Agency mortgage-backed securities. Not Rated includes fixed income securities and fixed income derivatives, which have not been rated by any rating agency.Non-Fixed Income includes any equity securities (including convertible bonds and equity derivatives) and/or commodity-linked derivatives. The fund may or may not have held all of these instruments on this date. The fund is not rated by these agencies. |
| (d) | | Duration is a measure of how much a bond’s price is likely to fluctuate with general changes in interest rates, e.g., if rates rise 1.00%, a bond with a5-year duration is likely to lose about 5.00% of its value due to the interest rate move. |
| (i) | | For purposes of this presentation, the components include the value of securities, and reflect the impact of the equivalent exposure of derivative positions, if any. These amounts may be negative from time to time. Equivalent exposure is a calculated amount that translates the derivative position into a reasonable approximation of the amount of the underlying asset that the portfolio would have to hold at a given point in time to have the same price sensitivity that results from the portfolio’s ownership of the derivative contract. When dealing with derivatives, equivalent exposure is a more representative measure of the potential impact of a position on portfolio performance than value. The bond component will include any accrued interest amounts. |
2
MFS Strategic Income Portfolio
Portfolio Composition – continued
| (m) | | In determining each instrument’s effective maturity for purposes of calculating the fund’s dollar-weighted average effective maturity, MFS uses the instrument’s stated maturity or, if applicable, an earlier date on which MFS believes it is probable that a maturity-shortening device (such as a put,pre-refunding or prepayment) will cause the instrument to be repaid. Such an earlier date can be substantially shorter than the instrument’s stated maturity. |
Where the fund holds convertible bonds, they are treated as part of the equity portion of the portfolio.
The fund invests a portion of its assets in the MFS High Yield Pooled Portfolio. Percentages reflect exposure to the underlying holdings, including Cash & Cash Equivalents and Other, of the MFS High Yield Pooled Portfolio and not to the exposure from investing directly in the MFS High Yield Pooled Portfolio itself.
Cash & Cash Equivalents includes any cash, investments in money market funds, short-term securities, and other assets less liabilities. Please see the Statement of Assets and Liabilities for additional information related to the fund’s cash position and other assets and liabilities.
Other includes equivalent exposure from currency derivatives and/or any offsets to derivative positions and may be negative.
Percentages are based on net assets as of December 31, 2018.
The portfolio is actively managed and current holdings may be different.
3
MFS Strategic Income Portfolio
MANAGEMENT REVIEW
Summary of Results
For the twelve months ended December 31, 2018, Initial Class shares of the MFS Strategic Income Portfolio (“fund”) provided a total return of –1.99%, while Service Class shares of the fund provided a total return of –2.11%. These compare with a return of 0.01% over the same period for the fund’s benchmark, the Bloomberg Barclays U.S. Aggregate Bond Index.
Market Environment
During the reporting period, the US Federal Reserve raised interest rates by 100 basis points, bringing the total number of rate hikes to nine since the central bank began to normalize monetary policy in late 2015. Economic growth rates in the US, Eurozone and Japan remained above trend, despite a slowing in global growth, particularly toward the end of the period. Inflation remained contained, particularly outside the US. Late in the period, the European Central Bank halted its asset purchase program but issued forward guidance that it does not expect to raise interest rates at least until after the summer of 2019. The Bank of England (once) and the Bank of Canada (three times) each raised rates during the period. The European political backdrop became a bit more volatile, late in the period, spurred by concerns over cohesion in the eurozone after the election of an anti-establishment, Eurosceptic coalition government in Italy and widespread protests over stagnant wage growth in France.
Bond yields rose in the US during most of the period, but remained low by historical standards and slipped from their highs, late in the period, as market volatility increased. Yields in many developed markets fell. Outside of emerging markets, where spreads and currencies came under pressure, credit spreads remained quite tight until the end of the period, when thinner liquidity, lower oil prices and concerns over high degrees of corporate leverage emerged. Growing concern over increasing global trade friction appeared to have weighed on business sentiment during the period’s second half, especially outside the US. Tighter financial conditions from rising US rates and a strong dollar, combined with trade uncertainty, helped expose structural weaknesses in several emerging markets in the second half of the period.
Volatility increased, at the end of the period, amid signs of slowing global economic growth and increasing trade tensions, which prompted a market setback shortly after US markets set record highs in September. It was the second such equity market decline during the reporting period. The correction came despite a third consecutive quarter of strong growth in US earnings per share. Strong earnings growth, combined with the market decline, brought US equity valuations down from elevated levels, earlier in the period, to multiples more in line with long-term averages. While the US economy held up better than most, global economic growth became less synchronized during the period, with Europe and China showing signs of a slowdown and some emerging markets coming under stress.
Factors Affecting Performance
Relative to the Bloomberg Barclays U.S. Aggregate Bond Index, the fund’s greater exposure to theindustrialssector, particularly within “BB” and “B” rated (r) bonds,and a lesser exposure to thetreasurysector, detracted from performance. Additionally, the fund’sout-of-benchmark exposure to “B” rated securities within thesovereign sector, and security selection in both thecommercial mortgage-backed securities (CMBS) sector and in “AAA” rated bonds, further held back relative performance.
Conversely, the fund’sout-of-benchmark exposure to thecollateralized mortgage obligation (CMO) sector, and a greater exposure to “A” rated securities, contributed to relative performance. In addition, security selection in thegovernment-related agenciessector and in “BBB” rated bonds further benefited relative results.
Respectfully,
Portfolio Manager(s)
Neeraj Arora, Philipp Burgener, David Cole, Alexander Mackey, Joshua Marston, Robert Persons, and Michael Skatrud
| (r) | Bonds rated “BBB”, “Baa”, or higher are considered investment grade; bonds rated “BB”, “Ba”, or below are considerednon-investment grade. The source for bond quality ratings is Moody’s Investors Service, Standard & Poor’s and Fitch, Inc. and are applied using the following hierarchy: If all three agencies provide a rating, the middle rating (after dropping the highest and lowest ratings) is assigned; if two of the three agencies rate a security, the lower of the two is assigned. Ratings are shown in the S&P and Fitch scale (e.g., AAA). For securities which are not rated by any of the three agencies, the security is considered Not Rated. |
Note to Shareholders: Effective March 1, 2018, Michael Skatrud became a Portfolio Manager of the Fund. Effective June 1, 2018, Ward Brown and Matt Ryan are no longer Portfolio Managers of the Fund. Effective June 1, 2018, Neeraj Arora became a Portfolio Manager of the Fund. Effective September 1, 2018, William Adams is no longer a Portfolio Manager of the Fund.
The views expressed in this report are those of the portfolio manager(s) only through the end of the period of the report as stated on the cover and do not necessarily reflect the views of MFS or any other person in the MFS organization. These views are subject to change at any time based on market or other conditions, and MFS disclaims any responsibility to update such views. These views may not be relied upon as investment advice or an indication of trading intent on behalf of any MFS portfolio. References to specific securities are not recommendations of such securities, and may not be representative of any MFS portfolio’s current or future investments.
4
MFS Strategic Income Portfolio
PERFORMANCE SUMMARY THROUGH 12/31/18
The following chart illustrates the historical performance of the fund in comparison to its benchmark(s). Benchmarks are unmanaged and may not be invested in directly. Benchmark returns do not reflect any fees or expenses. The performance of other share classes will be greater than or less than that of the class depicted below. (See Notes to Performance Summary.)
Performance data shown represents past performance and is no guarantee of future results. Investment return and principal value fluctuate so your units, when sold, may be worth more or less than the original cost; current performance may be lower or higher than quoted. The performance shown does not reflect the deduction of taxes, if any, that a contract holder would pay on fund distributions or the redemption of contract units. The returns for the fund shown also do not reflect the deduction of expenses associated with variable products, such as mortality and expense risk charges, separate account charges, and sales charges imposed by the insurance company separate accounts. Such expenses would reduce the overall returns shown.
Growth of a Hypothetical $10,000 Investment
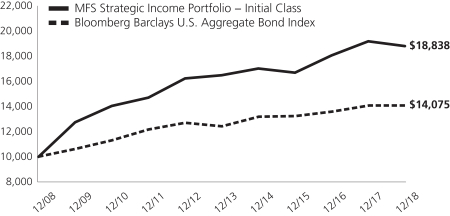
Total Returns through 12/31/18
Average annual total returns
| | | | | | | | | | | | |
| | | Share Class | | Class Inception Date | | 1-yr | | 5-yr | | 10-yr | | |
| | | Initial Class | | 5/06/98 | | (1.99)% | | 2.70% | | 6.54% | | |
| | | Service Class | | 8/24/01 | | (2.11)% | | 2.46% | | 6.28% | | |
| | | | |
Comparative benchmark(s) | | | | | | | | |
| | | Bloomberg Barclays U.S. Aggregate Bond Index (f) | | 0.01% | | 2.52% | | 3.48% | | |
| (f) | Source: FactSet Research Systems Inc. |
Benchmark Definition(s)
Bloomberg Barclays U.S. Aggregate Bond Index – a market capitalization-weighted index that measures the performance of the U.S. investment-grade, fixed rate bond market, with index components for government and corporate securities, mortgage pass-through securities, and asset-backed securities with at least one year to final maturity.
It is not possible to invest directly in an index.
Notes to Performance Summary
Average annual total return represents the average annual change in value for each share class for the periods presented.
Performance results reflect any applicable expense subsidies and waivers in effect during the periods shown. Without such subsidies and waivers the fund’s performance results would be less favorable. Please see the prospectus and financial statements for complete details. All results are historical and assume the reinvestment of any dividends and capital gains distributions.
Performance results do not include adjustments made for financial reporting purposes in accordance with U.S. generally accepted accounting principles and may differ from amounts reported in the financial highlights.
From time to time the fund may receive proceeds from litigation settlements, without which performance would be lower.
5
MFS Strategic Income Portfolio
EXPENSE TABLE
Fund Expenses Borne by the Contract Holders during the Period,
July 1, 2018 through December 31, 2018
As a contract holder of the fund, you incur ongoing costs, including management fees; distribution and/or service(12b-1) fees; and other fund expenses. This example is intended to help you understand your ongoing costs (in dollars) of investing in the fund and to compare these costs with the ongoing costs of investing in other mutual funds.
In addition to the fees and expenses which the fund bears directly, the fund indirectly bears a pro rata share of the fees and expenses of the underlying MFS Pooled Portfolio in which the fund invests. MFS Pooled Portfolios are mutual funds advised by MFS that do not pay management fees to MFS but do incur investment and operating costs. If these transactional and indirect costs were included, your costs would have been higher.
The example is based on an investment of $1,000 invested at the beginning of the period and held for the entire period July 1, 2018 through December 31, 2018.
Actual Expenses
The first line for each share class in the following table provides information about actual account values and actual expenses. You may use the information in this line, together with the amount you invested, to estimate the expenses that you paid over the period. Simply divide your account value by $1,000 (for example, an $8,600 account value divided by $1,000 = 8.6), then multiply the result by the number in the first line under the heading entitled “Expenses Paid During Period” to estimate the expenses you paid on your account during this period.
Hypothetical Example for Comparison Purposes
The second line for each share class in the following table provides information about hypothetical account values and hypothetical expenses based on the fund’s actual expense ratio and an assumed rate of return of 5% per year before expenses, which is not the fund’s actual return. The hypothetical account values and expenses may not be used to estimate the actual ending account balance or expenses you paid for the period. You may use this information to compare the ongoing costs of investing in the fund and other funds. To do so, compare this 5% hypothetical example with the 5% hypothetical examples that appear in the shareholder reports of the other funds.
Please note that the expenses shown in the table are meant to highlight the fund’s ongoing costs only and do not take into account the fees and expenses imposed under the variable contracts through which your investment in the fund is made. Therefore, the second line for each share class in the table is useful in comparing ongoing costs associated with an investment in vehicles (such as the fund) which fund benefits under variable annuity and variable life insurance contracts and to qualified pension and retirement plans only, and will not help you determine the relative total costs of investing in the fund through variable annuity and variable life insurance contracts. If the fees and expenses imposed under the variable contracts were included, your costs would have been higher.
| | | | | | | | | | | | | | | | | | |
| Share Class | | | | Annualized
Expense Ratio | | | Beginning
Account Value
7/01/18 | | | Ending
Account Value
12/31/18 | | | Expenses Paid
During Period (p)
7/01/18-12/31/18 | |
| Initial Class | | Actual | | | 0.80% | | | | $1,000.00 | | | | $1,005.67 | | | | $4.04 | |
| | Hypothetical (h) | | | 0.80% | | | | $1,000.00 | | | | $1,021.17 | | | | $4.08 | |
| Service Class | | Actual | | | 1.05% | | | | $1,000.00 | | | | $1,004.70 | | | | $5.31 | |
| | Hypothetical (h) | | | 1.05% | | | | $1,000.00 | | | | $1,019.91 | | | | $5.35 | |
| (h) | 5% class return per year before expenses. |
| (p) | “Expenses Paid During Period” are equal to each class’s annualized expense ratio, as shown above, multiplied by the average account value over the period, multiplied by 184/365 (to reflect theone-half year period). In addition to the fees and expenses which the fund bears directly, the fund indirectly bears a pro rata share of the fees and expenses of the underlying funds in which the fund invests. If these indirect costs were included, your costs would have been higher. |
6
MFS Strategic Income Portfolio
PORTFOLIO OF INVESTMENTS – 12/31/18
The Portfolio of Investments is a complete list of all securities owned by your fund. It is categorized by broad-based asset classes.
| | | | | | | | |
| | |
| Issuer | | Shares/Par | | | Value ($) | |
| BONDS – 77.3% | | | | | | | | |
| Asset-Backed & Securitized – 26.1% | | | | | | | | |
| A Voce CLO Ltd.,2014-1A, “BR”, FLR, 4.586% (LIBOR - 3mo. + 2.15%), 7/15/2026 (n) | | $ | 290,000 | | | $ | 284,006 | |
| Allegro CLO Ltd.,2014-1RA, “C”, FLR, 5.152% (LIBOR - 3mo. + 3%), 10/21/2028 (z) | | | 250,000 | | | | 235,159 | |
| ALM Loan Funding CLO,2015-16A, “BR2”, FLR, 4.336% (LIBOR - 3mo. + 1.9%), 7/15/2027 (n) | | | 260,000 | | | | 250,691 | |
| Arbor Realty CLO Ltd.,2018-A,“FL-1”, FLR, 3.605% (LIBOR - 1mo. + 1.15%), 6/15/2028 (z) | | | 260,000 | | | | 255,804 | |
| Babson CLO Ltd.,2013-IIA, “BR”, FLR, 3.719% (LIBOR - 3mo.+ 1.25%), 1/20/2028 (n) | | | 250,000 | | | | 241,462 | |
Bancorp Commercial Mortgage Trust2018-CRE4, “D”, FLR, 4.555%
(LIBOR - 1mo. + 2.1%), 9/15/2035 (z) | | | 200,000 | | | | 200,029 | |
Bancorp Commercial Mortgage Trust,2018-CR3, “D”, FLR, 5.155%
(LIBOR - 1mo. + 2.7%), 1/15/2033 (z) | | | 248,157 | | | | 246,143 | |
| Bayview Financial Revolving Mortgage Loan Trust, FLR, 4.105% (LIBOR - 1mo. + 1.6%), 12/28/2040 (z) | | | 152,924 | | | | 141,244 | |
BDS Ltd.,2018-FL2, “C”, FLR, 4.305%
(LIBOR - 1mo. + 1.85%), 8/15/2035 (z) | | | 200,000 | | | | 193,077 | |
| Benchmark Mortgage Trust,“2018-B1”, 3.666%, 1/15/2051 | | | 251,384 | | | | 251,676 | |
| Business Jet Securities LLC,2018-1, “C”, 7.748%, 2/15/2033 (z) | | | 91,719 | | | | 94,363 | |
| Chesapeake Funding II LLC,2017-2A, “C”, 3.01%, 5/15/2029 (n) | | | 215,000 | | | | 213,150 | |
| Citigroup Commercial Mortgage Trust,2017-C4, 3.471%, 10/12/2050 | | | 173,669 | | | | 171,366 | |
| Commercial Mortgage Pass-Through Certificates, “2017-BNK8”, “A3”, 3.229%, 11/15/2050 | | | 250,000 | | | | 243,009 | |
| Commercial Mortgage Pass-Through Certificates, “2018-BNK10”, “A5”, 3.688%, 2/15/2061 | | | 250,000 | | | | 248,760 | |
| Commercial Mortgage Trust,2015-PC1, “A5”, 3.902%, 7/10/2050 | | | 346,107 | | | | 353,109 | |
| Commercial Mortgage Trust,2017-CD4, “A4”, 3.514%, 5/10/2050 | | | 112,627 | | | | 111,859 | |
| Commercial Mortgage Trust, 2017-COR2, “A3”, 3.51%, 9/10/2050 | | | 250,000 | | | | 245,684 | |
| CPS Auto Trust,2016-D, “B”, 2.11%, 3/15/2021 (n) | | | 203,755 | | | | 203,157 | |
| Crest Ltd., CDO, 7%, (0.001% cash or 7% PIK) 1/28/2040 (a)(p) | | | 734,116 | | | | 88,094 | |
| Cutwater Ltd.,2015-IA, “BR”, FLR, 4.236% (LIBOR - 3mo. + 1.8%), 1/15/2029 (z) | | | 250,000 | | | | 249,209 | |
| | | | | | | | |
| | |
| Issuer | | Shares/Par | | | Value ($) | |
| BONDS – continued | | | | | | | | |
| Asset-Backed & Securitized – continued | |
| Drive Auto Receivables Trust,2017-1, “C”, 2.84%, 4/15/2022 | | $ | 98,000 | | | $ | 97,876 | |
| DT Auto Owner Trust,2017-2A, “C”, 3.03%, 1/17/2023 (n) | | | 215,000 | | | | 214,775 | |
| DT Auto Owner Trust,2018-2A, “C”, 3.67%, 3/15/2024 (n) | | | 82,000 | | | | 82,390 | |
| Exantas Capital Corp. CLO Ltd., 2018-RS06, “B”, FLR, 3.605% (LIBOR - 1mo. + 1.15%), 6/15/2035 (z) | | | 260,000 | | | | 254,768 | |
| Falcon Franchise Loan LLC, 8.047%, 1/05/2023 (i)(z) | | | 6,860 | | | | 272 | |
| Figueroa CLO Ltd.,2014-1A, “DR”, FLR, 5.686% (LIBOR - 3mo. + 3.25%), 1/15/2027 (z) | | | 250,000 | | | | 239,599 | |
| Flatiron CLO Ltd.,2015-1A, “CR”, FLR, 4.336% (LIBOR - 3mo. + 1.9%), 4/15/2027 (n) | | | 260,000 | | | | 250,625 | |
| GMF Floorplan Owner Revolving Trust,2017-2, “C”, 2.63%, 7/15/2022 (z) | | | 260,000 | | | | 257,257 | |
| GS Mortgage Securities Trust,2017-GS6, “A3”, 3.433%, 5/10/2050 | | | 177,406 | | | | 174,141 | |
| GS Mortgage Securities Trust,2017-GS7, “A4”, 3.43%, 8/10/2050 | | | 251,247 | | | | 245,476 | |
| Hunt CRE Ltd.,2018-FL2, “D”, FLR, 5.205% (LIBOR - 1mo. + 2.75%), 8/15/2028 (z) | | | 200,000 | | | | 198,338 | |
| Invitation Homes Trust, 2018-SFR1, “C”, FLR, 3.705% (LIBOR - 1mo. + 1.25%), 3/17/2037 (z) | | | 130,000 | | | | 128,555 | |
| JPMorgan Chase Commercial Mortgage Securities Corp., 3.454%, 9/15/2050 | | | 134,136 | | | | 132,245 | |
KKR Real Estate Financial Trust Inc Ltd.,2018-FL1, “D”, FLR, 4.852%
(LIBOR - 1mo. + 2.55%), 6/15/2036 (z) | | | 205,000 | | | | 204,995 | |
| Lehman Brothers Commercial Conduit Mortgage Trust, 0.954%, 2/18/2030 (i) | | | 5,957 | | | | 0 | |
| LoanCore Ltd., 2018-CRE1, “C”, FLR, 5.005% (LIBOR - 1mo. + 2.55%), 5/15/2028 (n) | | | 260,000 | | | | 255,032 | |
| Man GLG US CLO2018-2 Ltd.,2018-2A, “BR”, FLR, 5.101% (LIBOR - 3mo. + 2.45%), 10/15/2028 | | | 250,000 | | | | 245,002 | |
| Morgan Stanley Bank of America Merrill Lynch Trust,2017-C34, “A4”, 3.536%, 11/15/2052 | | | 250,000 | | | | 246,534 | |
| Morgan Stanley Capital I Trust,2017-H1, “A5”, 3.53%, 6/15/2050 | | | 187,518 | | | | 185,476 | |
| Navistar Financial Dealer Note Master Owner Trust II, Series2018-1, FLR, 4.056%(LIBOR - 1mo. + 1.55%), 9/25/2023 (z) | | | 269,000 | | | | 269,178 | |
| Neuberger Berman CLO Ltd.,2016-21A, “CR”, FLR, 4.069% (LIBOR - 3mo. + 1.6%), 4/20/2027 (n) | | | 250,000 | | | | 235,496 | |
7
MFS Strategic Income Portfolio
Portfolio of Investments – continued
| | | | | | | | |
| | |
| Issuer | | Shares/Par | | | Value ($) | |
| BONDS – continued | | | | | | | | |
| Asset-Backed & Securitized – continued | |
| NextGear Floorplan Master Owner Trust,2017-2A, “B”, 3.02%, 10/17/2022 (n) | | $ | 212,000 | | | $ | 210,837 | |
| NextGear Floorplan Master Owner Trust,2018-1A, “B”, 3.57%, 2/15/2023 (z) | | | 200,000 | | | | 200,159 | |
| Oaktree CLO Ltd.,2014-2A, “BR”, FLR, 5.019% (LIBOR - 3mo. + 2.55%), 10/20/2026 (n) | | | 300,000 | | | | 298,848 | |
| Parallel Ltd.,2015-1A, “DR”, FLR, 5.019% (LIBOR - 3mo. + 2.55%), 7/20/2027 (n) | | | 250,000 | | | | 235,469 | |
| Race Point CLO Ltd.,2013-8A, “CR”, FLR, 5.144% (LIBOR - 3mo. + 2.5%), 2/20/2030 (n) | | | 300,000 | | | | 289,565 | |
| Santander Drive Auto Receivables Trust,2017-2, “C”, 2.79%, 8/15/2022 | | | 214,000 | | | | 212,986 | |
| Sierra Receivables Funding Co. LLC,2015-1A, “A”, 2.4%, 3/22/2032 (n) | | | 32,718 | | | | 32,521 | |
| UBS Commercial Mortgage Trust2017-C6, “A5”, 3.579%, 12/15/2050 | | | 250,000 | | | | 247,565 | |
| UBS Commercial Mortgage Trust2017-C7, “A4”, 3.679%, 12/15/2050 | | | 250,000 | | | | 249,384 | |
| UBS Commercial Mortgage Trust2017-C8, “A4”, 3.983%, 2/15/2051 | | | 250,000 | | | | 254,923 | |
| UBS Commercial Mortgage Trust,2017-C1, “A4”, 3.544%, 11/15/2050 | | | 251,247 | | | | 248,880 | |
| Wells Fargo Commercial Mortgage Trust,2017-C42, “A5”, 3.589%, 12/15/2050 | | | 250,000 | | | | 248,445 | |
| Wells Fargo Commercial Mortgage Trust,2017-RB1, “A4”, 3.374%, 3/15/2050 | | | 280,000 | | | | 274,150 | |
| West CLO Ltd.,2014-1A, “CR”, FLR, 5.444% (LIBOR - 3mo. + 3%), 7/18/2026 (n) | | | 260,000 | | | | 252,480 | |
| | | | | | | | |
| | | | | | $ | 11,695,293 | |
| | | | | | | | |
| Automotive – 0.3% | | | | | | | | |
| General Motors Co., 4.2%, 10/01/2027 | | $ | 134,000 | | | $ | 120,844 | |
| | | | | | | | |
| Broadcasting – 0.3% | | | | | | | | |
| Time Warner, Inc., 3.8%, 2/15/2027 | | $ | 125,000 | | | $ | 117,351 | |
| | | | | | | | |
| Brokerage & Asset Managers – 1.3% | | | | | | | | |
| Charles Schwab Corp., 3.2%, 1/25/2028 | | $ | 228,000 | | | $ | 218,634 | |
| E*TRADE Financial Corp., 4.5%, 6/20/2028 | | | 292,000 | | | | 287,917 | |
| Raymond James Financial, Inc., 4.95%, 7/15/2046 | | | 75,000 | | | | 72,150 | |
| | | | | | | | |
| | | | | | $ | 578,701 | |
| | | | | | | | |
| Building – 0.7% | | | | | | | | |
| Martin Marietta Materials, Inc., 4.25%, 7/02/2024 | | $ | 215,000 | | | $ | 217,582 | |
| Martin Marietta Materials, Inc., 3.5%, 12/15/2027 | | | 115,000 | | | | 104,910 | |
| | | | | | | | |
| | | | | | $ | 322,492 | |
| | | | | | | | |
| Cable TV – 1.1% | | | | | | | | |
| Cox Communications, Inc., 3.5%, 8/15/2027 (n) | | $ | 200,000 | | | $ | 184,497 | |
| Time Warner Cable, Inc., 8.25%, 4/01/2019 | | | 150,000 | | | | 151,683 | |
| Time Warner Cable, Inc., 4.5%, 9/15/2042 | | | 183,000 | | | | 147,288 | |
| | | | | | | | |
| | | | | | $ | 483,468 | |
| | | | | | | | |
| | | | | | | | |
| | |
| Issuer | | Shares/Par | | | Value ($) | |
| BONDS – continued | | | | | | | | |
| Chemicals – 0.4% | | | | | | | | |
| Sasol Chemicals (USA) LLC, 5.875%, 3/27/2024 | | $ | 200,000 | | | $ | 199,565 | |
| | | | | | | | |
| Computer Software – 0.8% | | | | | | | | |
| Microsoft Corp., 3.125%, 11/03/2025 | | $ | 133,000 | | | $ | 131,606 | |
| Microsoft Corp., 4.25%, 2/06/2047 | | | 205,000 | | | | 215,516 | |
| | | | | | | | |
| | | | | | $ | 347,122 | |
| | | | | | | | |
| Computer Software – Systems – 0.6% | |
| Apple, Inc., 4.25%, 2/09/2047 | | $ | 250,000 | | | $ | 249,487 | |
| | | | | | | | |
| Conglomerates – 0.9% | | | | | | | | |
| United Technologies Corp., 4.125%, 11/16/2028 | | $ | 166,000 | | | $ | 164,832 | |
| United Technologies Corp., 4.05%, 5/04/2047 | | | 120,000 | | | | 106,640 | |
| Wabtec Corp., 4.7%, 9/15/2028 | | | 132,000 | | | | 123,871 | |
| | | | | | | | |
| | | | | | $ | 395,343 | |
| | | | | | | | |
| Consumer Products – 1.4% | | | | | | | | |
| Reckitt Benckiser Treasury Services PLC, 3.625%, 9/21/2023 (n) | | $ | 259,000 | | | $ | 260,652 | |
| Reckitt Benckiser Treasury Services PLC, 2.75%, 6/26/2024 (n) | | | 401,000 | | | | 378,963 | |
| | | | | | | | |
| | | | | | $ | 639,615 | |
| | | | | | | | |
| Consumer Services – 0.8% | | | | | | | | |
| Priceline Group, Inc., 3.55%, 3/15/2028 | | $ | 242,000 | | | $ | 226,698 | |
| Toll Road Investors Partnership II LP, Capital Appreciation, 0%, 2/15/2026 (n) | | | 46,000 | | | | 31,821 | |
| Toll Road Investors Partnership II LP, Capital Appreciation, 0%, 2/15/2029 (n) | | | 132,000 | | | | 75,723 | |
| Toll Road Investors Partnership II LP, Capital Appreciation, 0%, 2/15/2031 (n) | | | 46,000 | | | | 23,369 | |
| | | | | | | | |
| | | | | | $ | 357,611 | |
| | | | | | | | |
| Emerging Market Quasi-Sovereign – 2.1% | |
| Petrobras Global Finance B.V., 5.999%, 1/27/2028 | | $ | 117,000 | | | $ | 110,157 | |
| PT Indonesia Asahan Aluminium (Persero), 5.71%, 11/15/2023 (n) | | | 200,000 | | | | 203,508 | |
| PT Indonesia Asahan Aluminium (Persero), 6.53%, 11/15/2028 (n) | | | 200,000 | | | | 209,775 | |
| REC Ltd., 5.25%, 11/13/2023 (n) | | | 200,000 | | | | 200,548 | |
| Southern Gas Corridor CJSC, 6.875%, 3/24/2026 | | | 200,000 | | | | 216,008 | |
| | | | | | | | |
| | | | | | $ | 939,996 | |
| | | | | | | | |
| Emerging Market Sovereign – 2.6% | | | | | |
| Arab Republic of Egypt, 6.588%, 2/21/2028 (n) | | $ | 212,000 | | | $ | 189,010 | |
| Government of Ukraine, 7.75%, 9/01/2021 | | | 135,000 | | | | 126,900 | |
| Government of Ukraine, 9.75%, 11/01/2028 (n) | | | 200,000 | | | | 187,416 | |
| Republic of Argentina, 5.875%, 1/11/2028 | | | 95,000 | | | | 68,281 | |
| Republic of Philippines, 8%, 7/19/2031 | | PHP | 5,375,000 | | | | 110,044 | |
| Republic of Turkey, 7.375%, 2/05/2025 | | $ | 243,000 | | | | 250,363 | |
8
MFS Strategic Income Portfolio
Portfolio of Investments – continued
| | | | | | | | |
| | |
| Issuer | | Shares/Par | | | Value ($) | |
| BONDS – continued | | | | | | | | |
| Emerging Market Sovereign – continued | |
| Socialist Republic of Vietnam, 4.8%, 11/19/2024 | | $ | 231,000 | | | $ | 232,833 | |
| | | | | | | | |
| | | | | | $ | 1,164,847 | |
| | | | | | | | |
| Energy – Independent – 0.5% | | | | | | | | |
| Canadian Oil Sands Co., 7.75%, 5/15/2019 (n) | | $ | 126,000 | | | $ | 127,828 | |
| Canadian Oil Sands Co., 4.5%, 4/01/2022 (n) | | | 118,000 | | | | 118,430 | |
| | | | | | | | |
| | | | | | $ | 246,258 | |
| | | | | | | | |
| Energy – Integrated – 0.9% | | | | | | | | |
| Eni S.p.A., 4%, 9/12/2023 (n) | | $ | 200,000 | | | $ | 196,920 | |
| Shell International Finance B.V., 2.875%, 5/10/2026 | | | 225,000 | | | | 215,591 | |
| | | | | | | | |
| | | | | | $ | 412,511 | |
| | | | | | | | |
| Food & Beverages – 2.0% | | | | | | | | |
| Anheuser Busch InBev Worldwide, Inc., 4.439%, 10/06/2048 | | $ | 125,491 | | | $ | 108,517 | |
| Conagra Brands, Inc., 4.6%, 11/01/2025 | | | 282,000 | | | | 283,020 | |
| Constellation Brands, Inc., 4.4%, 11/15/2025 | | | 315,000 | | | | 315,766 | |
| General Mills, Inc., 4.55%, 4/17/2038 | | | 62,000 | | | | 57,586 | |
| Kraft Foods Group, Inc., 5%, 6/04/2042 | | | 62,000 | | | | 55,509 | |
| Wm. Wrigley Jr. Co., 3.375%, 10/21/2020 (n) | | | 81,000 | | | | 81,212 | |
| | | | | | | | |
| | | | | | $ | 901,610 | |
| | | | | | | | |
| Insurance – 0.9% | | | | | | | | |
| American International Group, Inc., 3.9%, 4/01/2026 | | $ | 294,000 | | | $ | 283,246 | |
| American International Group, Inc., 4.7%, 7/10/2035 | | | 59,000 | | | | 56,096 | |
| American International Group, Inc., 4.5%, 7/16/2044 | | | 53,000 | | | | 47,324 | |
| | | | | | | | |
| | | | | | $ | 386,666 | |
| | | | | | | | |
| Insurance – Health – 0.4% | | | | | | | | |
| UnitedHealth Group, Inc., 3.75%, 10/15/2047 | | $ | 220,000 | | | $ | 201,640 | |
| | | | | | | | |
| Insurance – Property & Casualty – 1.2% | |
| Allied World Assurance Co. Holdings Ltd., 4.35%, 10/29/2025 | | $ | 310,000 | | | $ | 305,739 | |
| Marsh & McLennan Cos., Inc., 4.2%, 3/01/2048 | | | 277,000 | | | | 251,943 | |
| | | | | | | | |
| | | | | | $ | 557,682 | |
| | | | | | | | |
| International Market Quasi-Sovereign – 0.6% | |
| Dexia Credit Local S.A., 2.25%, 2/18/2020 (n) | | $ | 270,000 | | | $ | 268,378 | |
| | | | | | | | |
| Machinery & Tools – 0.3% | |
| CNH Industrial Capital LLC, 3.85%, 11/15/2027 | | $ | 145,000 | | | $ | 131,963 | |
| | | | | | | | |
| Major Banks – 7.3% | | | | | | | | |
| Bank of America Corp., 2.151%, 11/09/2020 | | $ | 100,000 | | | $ | 98,187 | |
| Bank of America Corp., 4.125%, 1/22/2024 | | | 75,000 | | | | 76,017 | |
| Bank of America Corp., 3.248%, 10/21/2027 | | | 656,000 | | | | 606,634 | |
| Bank of America Corp., 4.271% to 7/23/2028, FLR (LIBOR - 3mo. + 1.31%) to 7/23/2029 | | | 136,000 | | | | 135,444 | |
| | | | | | | | |
| | |
| Issuer | | Shares/Par | | | Value ($) | |
| BONDS – continued | | | | | | | | |
| Major Banks – continued | | | | | | | | |
| Bank of New York Mellon Corp., 3.5%, 4/28/2023 | | $ | 329,000 | | | $ | 329,968 | |
| Credit Suisse Group AG, 3.869%, 1/12/2029 (n) | | | 250,000 | | | | 232,714 | |
| ING Bank N.V., 5.8%, 9/25/2023 (n) | | | 322,000 | | | | 336,317 | |
| JPMorgan Chase & Co., 3.125%, 1/23/2025 | | | 220,000 | | | | 209,685 | |
JPMorgan Chase & Co., 3.882% to 7/24/2037, FLR (LIBOR - 3mo. +
1.36%) to 7/24/2038 | | | 269,000 | | | | 245,087 | |
| Morgan Stanley, 3.7%, 10/23/2024 | | | 277,000 | | | | 272,378 | |
| Morgan Stanley, 3.625%, 1/20/2027 | | | 317,000 | | | | 301,438 | |
| UBS Group Funding (Switzerland) AG, 4.253%, 3/23/2028 (n) | | | 415,000 | | | | 409,426 | |
| | | | | | | | |
| | | | | | $ | 3,253,295 | |
| | | | | | | | |
| Medical & Health Technology & Services – 0.7% | | | | | |
| Becton, Dickinson and Co., 3.734%, 12/15/2024 | | $ | 318,000 | | | $ | 307,162 | |
| | | | | | | | |
| Medical Equipment – 0.7% | | | | | | | | |
| Abbott Laboratories, 4.75%, 11/30/2036 | | $ | 305,000 | | | $ | 318,470 | |
| | | | | | | | |
| Metals & Mining – 0.9% | | | | | | | | |
| Glencore Funding LLC, 4.125%, 5/30/2023 (n) | | $ | 164,000 | | | $ | 161,046 | |
| Glencore Funding LLC, 4%, 4/16/2025 (n) | | | 84,000 | | | | 79,078 | |
| Glencore Funding LLC, 3.875%, 10/27/2027 (n) | | | 167,000 | | | | 149,295 | |
| | | | | | | | |
| | | | | | $ | 389,419 | |
| | | | | | | | |
| Midstream – 0.7% | | | | | | | | |
| MPLX LP, 4%, 3/15/2028 | | $ | 315,000 | | | $ | 295,408 | |
| | | | | | | | |
| Mortgage-Backed – 0.6% | | | | | | | | |
| Fannie Mae, 5.5%, 3/01/2020 - 9/01/2034 | | $ | 12,712 | | | $ | 13,569 | |
| Fannie Mae, 6.5%, 4/01/2032 | | | 19,209 | | | | 21,238 | |
| Freddie Mac, 4.224%, 3/25/2020 | | | 234,148 | | | | 237,053 | |
| | | | | | | | |
| | | | | | $ | 271,860 | |
| | | | | | | | |
| Municipals – 0.7% | | | | | | | | |
| New Jersey Economic Development Authority State Pension Funding Rev., Capital Appreciation, “B”, AGM, 0%, 2/15/2023 | | $ | 350,000 | | | $ | 299,544 | |
| | | | | | | | |
| Network & Telecom – 0.6% | | | | | | | | |
| AT&T, Inc., 5.45%, 3/01/2047 | | $ | 286,000 | | | $ | 279,686 | |
| | | | | | | | |
| Other Banks & Diversified Financials – 0.7% | |
| Compass Bank, 2.875%, 6/29/2022 | | $ | 250,000 | | | $ | 239,544 | |
| JSC Kazkommertsbank, 5.5%, 12/21/2022 | | | 99,000 | | | | 97,018 | |
| | | | | | | | |
| | | | | | $ | 336,562 | |
| | | | | | | | |
| Pharmaceuticals – 0.4% | | | | | | | | |
| Actavis Funding SCS, 3.8%, 3/15/2025 | | $ | 179,000 | | | $ | 174,819 | |
| | | | | | | | |
| Supranational – 0.8% | | | | | | | | |
| Corporacion Andina de Fomento, 4.375%, 6/15/2022 | | $ | 340,000 | | | $ | 351,883 | |
| | | | | | | | |
9
MFS Strategic Income Portfolio
Portfolio of Investments – continued
| | | | | | | | |
| | |
| Issuer | | Shares/Par | | | Value ($) | |
| BONDS – continued | | | | | | | | |
| Telecommunications – Wireless – 1.0% | |
| American Tower Corp., REIT, 3.55%, 7/15/2027 | | $ | 358,000 | | | $ | 336,034 | |
| American Tower Corp., REIT, 3.6%, 1/15/2028 | | | 125,000 | | | | 116,861 | |
| | | | | | | | |
| | | | | | $ | 452,895 | |
| | | | | | | | |
| Tobacco – 0.8% | | | | | | | | |
| B.A.T. Capital Corp., 3.557%, 8/15/2027 | | $ | 384,000 | | | $ | 341,087 | |
| | | | | | | | |
| Transportation – Services – 0.6% | | | | | | | | |
| ERAC USA Finance LLC, 3.8%, 11/01/2025 (n) | | $ | 267,000 | | | $ | 261,877 | |
| | | | | | | | |
| U.S. Government Agencies and Equivalents – 0.2% | |
| Small Business Administration, 6.35%, 4/01/2021 | | $ | 1,741 | | | $ | 1,780 | |
| Small Business Administration, 4.77%, 4/01/2024 | | | 20,085 | | | | 20,666 | |
| Small Business Administration, 4.99%, 9/01/2024 | | | 15,439 | | | | 15,971 | |
| Small Business Administration, 4.86%, 1/01/2025 | | | 21,183 | | | | 21,838 | |
| Small Business Administration, 4.625%, 2/01/2025 | | | 27,571 | | | | 28,325 | |
| Small Business Administration, 5.11%, 8/01/2025 | | | 21,334 | | | | 22,054 | |
| | | | | | | | |
| | | | | | $ | 110,634 | |
| | | | | | | | |
| U.S. Treasury Obligations – 13.4% | |
| U.S. Treasury Bonds, 4.75%, 2/15/2037 | | $ | 54,000 | | | $ | 68,891 | |
| U.S. Treasury Bonds, 3.5%, 2/15/2039 | | | 326,000 | | | | 357,062 | |
| U.S. Treasury Bonds, 2.5%, 2/15/2045 (f) | | | 1,669,000 | | | | 1,515,371 | |
| U.S. Treasury Notes, 2.875%, 10/31/2020 | | | 529,000 | | | | 532,219 | |
| | | | | | | | |
| | |
| Issuer | | Shares/Par | | | Value ($) | |
| BONDS – continued | | | | | | | | |
| U.S. Treasury Obligations – continued | |
| U.S. Treasury Notes, 1.75%, 11/30/2021 | | $ | 1,110,000 | | | $ | 1,087,563 | |
| U.S. Treasury Notes, 1.75%, 2/28/2022 (f) | | | 2,478,000 | | | | 2,423,922 | |
| | | | | | | | |
| | | | | | $ | 5,985,028 | |
| | | | | | | | |
| Utilities – Electric Power – 1.0% | | | | | | | | |
| Enel Finance International N.V., 3.625%, 5/25/2027 (n) | | $ | 280,000 | | | $ | 247,137 | |
| Enel Finance International N.V., 4.875%, 6/14/2029 (n) | | | 200,000 | | | | 190,907 | |
| | | | | | | | |
| | | | | | $ | 438,044 | |
| | | | | | | | |
Total Bonds
(Identified Cost, $35,595,279) | | | $ | 34,586,116 | |
| | | | | | | | |
| | |
| COMMON STOCKS – 0.0% | | | | | | | | |
| Energy – Independent – 0.0% | | | | | | | | |
Frontera Energy Corp. (a)
(Identified Cost, $106,984) | | | 1,188 | | | $ | 11,573 | |
| | | | | | | | |
| |
| INVESTMENT COMPANIES (h) – 17.2% | | | | | |
| Bond Funds – 13.9% | | | | | | | | |
| MFS High Yield Pooled Portfolio (v) | | | 725,387 | | | $ | 6,231,072 | |
| | | | | | | | |
| Money Market Funds – 3.3% | | | | | | | | |
| MFS Institutional Money Market Portfolio, 2.4% (v) | | | 1,455,646 | | | $ | 1,455,501 | |
| | | | | | | | |
Total Investment Companies
(Identified Cost, $8,974,737) | | | $ | 7,686,573 | |
| | | | | | | | |
OTHER ASSETS, LESS
LIABILITIES – 5.5% | | | | | | | 2,440,503 | |
| | | | | | | | |
| NET ASSETS – 100.0% | | | | | | $ | 44,724,765 | |
| | | | | | | | |
| (a) | | Non-income producing security. |
| (f) | | All or a portion of the security has been segregated as collateral for open futures contracts and cleared swap agreements. |
| (h) | | An affiliated issuer, which may be considered one in which the fund owns 5% or more of the outstanding voting securities, or a company which is under common control. At period end, the aggregate values of the fund’s investments in affiliated issuers and in unaffiliated issuers were $7,686,573 and $34,597,689, respectively. |
| (i) | | Interest only security for which the fund receives interest on notional principal (Par amount). Par amount shown is the notional principal and does not reflect the cost of the security. |
| (n) | | Securities exempt from registration under Rule 144A of the Securities Act of 1933. These securities may be sold in the ordinary course of business in transactions exempt from registration, normally to qualified institutional buyers. At period end, the aggregate value of these securities was $8,356,351, representing 18.7% of net assets. |
| (p) | | Payment-in-kind (PIK) security for which interest income may be received in additional securities and/or cash. |
| (v) | | Affiliated issuer that is available only to investment companies managed by MFS. The rate quoted for the MFS Institutional Money Market Portfolio is the annualizedseven-day yield of the fund at period end. |
| (z) | | Restricted securities are not registered under the Securities Act of 1933 and are subject to legal restrictions on resale. These securities generally may be resold in transactions exempt from registration or to the public if the securities are subsequently registered. Disposal of these securities may involve time-consuming negotiations and prompt sale at an acceptable price may be difficult. The fund holds the following restricted securities: |
| | | | | | | | | | |
| Restricted Securities | | Acquisition
Date | | Cost | | | Value | |
| | | |
| Allegro CLO Ltd.,2014-1RA, “C”, FLR, 5.152% (LIBOR - 3mo. + 3%), 10/21/2028 | | 8/22/18 | | | $250,000 | | | | $235,159 | |
| | | |
| Arbor Realty CLO Ltd.,2018-A,“FL-1”, FLR, 3.605% (LIBOR - 1mo. + 1.15%), 6/15/2028 | | 5/23/18 | | | 260,000 | | | | 255,804 | |
| | | |
| Bancorp Commercial Mortgage Trust 2018-CRE4, “D”, FLR, 4.555% (LIBOR - 1mo. + 2.1%), 9/15/2035 | | 9/17/18 | | | 200,000 | | | | 200,029 | |
| | | |
| Bancorp Commercial Mortgage Trust,2018-CR3, “D”, FLR, 5.155% (LIBOR - 1mo. + 2.7%), 1/15/2033 | | 3/13/18 | | | 248,157 | | | | 246,143 | |
| | | |
| Bayview Financial Revolving Mortgage Loan Trust, FLR, 4.105% (LIBOR - 1mo. + 1.6%), 12/28/2040 | | 3/01/06 | | | 152,924 | | | | 141,244 | |
| | | |
| BDS Ltd.,2018-FL2, “C”, FLR, 4.305% (LIBOR - 1mo. + 1.85%), 8/15/2035 | | 7/25/18 | | | 200,000 | | | | 193,077 | |
10
MFS Strategic Income Portfolio
Portfolio of Investments – continued
| | | | | | | | | | |
| Restricted Securities - continued | | Acquisition
Date | | Cost | | | Value | |
| | | |
| Business Jet Securities LLC,2018-1, “C”, 7.748%, 2/15/2033 | | 2/21/18 | | | $91,718 | | | | $94,363 | |
| | | |
| Cutwater Ltd.,2015-IA, “BR”, FLR, 4.236% (LIBOR - 3mo. + 1.8%), 1/15/2029 | | 8/15/18 | | | 250,000 | | | | 249,209 | |
| | | |
| Exantas Capital Corp. CLO Ltd., 2018-RS06, “B”, FLR, 3.605% (LIBOR - 1mo. + 1.15%), 6/15/2035 | | 6/07/18 | | | 260,000 | | | | 254,768 | |
| | | |
| Falcon Franchise Loan LLC, 8.047%, 1/05/2023 | | 1/18/02 | | | 272 | | | | 272 | |
| | | |
| Figueroa CLO Ltd.,2014-1A, “DR”, FLR, 5.686% (LIBOR - 3mo. + 3.25%), 1/15/2027 | | 1/28/18 | | | 250,000 | | | | 239,599 | |
| | | |
| GMF Floorplan Owner Revolving Trust,2017-2, “C”, 2.63%, 7/15/2022 | | 8/15/17 | | | 259,955 | | | | 257,257 | |
| | | |
| Hunt CRE Ltd.,2018-FL2, “D”, FLR, 5.205% (LIBOR - 1mo. + 2.75%), 8/15/2028 | | 8/03/18 | | | 200,000 | | | | 198,338 | |
| | | |
| Invitation Homes Trust, 2018-SFR1, “C”, FLR, 3.705% (LIBOR - 1mo. + 1.25%), 3/17/2037 | | 1/26/18 | | | 130,000 | | | | 128,555 | |
| | | |
| KKR Real Estate Financial Trust Inc Ltd.,2018-FL1, “D”, FLR, 4.852% (LIBOR - 1mo. + 2.55%), 6/15/2036 | | 11/07/18 | | | 205,000 | | | | 204,995 | |
| | | |
Navistar Financial Dealer Note Master Owner Trust II, Series2018-1, FLR, 4.056%
(LIBOR - 1mo. + 1.55%), 9/25/2023 | | 9/17/18 | | | 269,000 | | | | 269,178 | |
| | | |
| NextGear Floorplan Master Owner Trust,2018-1A, “B”, 3.57%, 2/15/2023 | | 3/06/18 | | | 199,985 | | | | 200,159 | |
| | | |
| Total Restricted Securities | | | | | | | | | $3,368,149 | |
| | | |
| % of Net assets | | | | | | | | | 7.5% | |
The following abbreviations are used in this report and are defined:
| AGM | | Assured Guaranty Municipal |
| CDO | | Collateralized Debt Obligation |
| CJSC | | Closed Joint Stock Company |
| CLO | | Collateralized Loan Obligation |
| FLR | | Floating Rate. Interest rate resets periodically based on the parenthetically disclosed reference rate plus a spread (if any). Theperiod-end rate reported may not be the current rate. All reference rates are USD unless otherwise noted. |
| LIBOR | | London Interbank Offered Rate |
| PLC | | Public Limited Company |
| REIT | | Real Estate Investment Trust |
Abbreviations indicate amounts shown in currencies other than the U.S. dollar. All amounts are stated in U.S. dollars unless otherwise indicated. A list of abbreviations is shown below:
Derivative Contracts at 12/31/18
Forward Foreign Currency Exchange Contracts
| | | | | | | | | | | | | | | | | | | | |
| Currency Purchased | | Currency Sold | | Counterparty | | Settlement Date | | | Unrealized
Appreciation
(Depreciation) | |
| Asset Derivatives | | | | | | | | | | | | |
| TRY | | | 642,000 | | | | | USD | | 108,974 | | Deutsche Bank AG | | | 1/11/2019 | | | | $11,728 | |
| USD | | | 2,241 | | | | | EUR | | 1,918 | | Goldman Sachs International | | | 1/11/2019 | | | | 42 | |
| | | | | | | | | | | | | | | | | | | | |
| | | | | | | | | | | | | | | | | | | $11,770 | |
| | | | | | | | | | | | | | | | | | | | |
| Liability Derivatives | | | | | | | | | | | | |
| MXN | | | 21 | | | | | USD | | 1 | | Goldman Sachs International | | | 1/11/2019 | | | | $(0 | ) |
| USD | | | 465,388 | | | | | JPY | | 52,012,792 | | State Street Bank Corp. | | | 1/15/2019 | | | | (9,466 | ) |
| USD | | | 450,361 | | | | | JPY | | 51,000,000 | | Goldman Sachs International | | | 1/07/2019 | | | | (14,946 | ) |
| USD | | | 442,011 | | | | | JPY | | 50,005,450 | | Goldman Sachs International | | | 1/11/2019 | | | | (14,370 | ) |
| USD | | | 906,850 | | | | | JPY | | 101,600,000 | | Goldman Sachs International | | | 1/22/2019 | | | | (21,226 | ) |
| USD | | | 113,075 | | | | | PHP | | 6,006,000 | | JPMorgan Chase Bank N.A. | | | 2/19/2019 | | | | (647 | ) |
| | | | | | | | | | | | | | | | | | | | |
| | | | | | | | | | | | | | | | | | | $(60,655 | ) |
| | | | | | | | | | | | | | | | | | | | |
11
MFS Strategic Income Portfolio
Portfolio of Investments – continued
Futures Contracts
| | | | | | | | | | | | | | | | | | | | | | | | |
| Description | | Long/
Short | | | Currency | | | Contracts | | | Notional
Amount | | | Expiration
Date | | | Value/Unrealized
Appreciation
(Depreciation) | |
| Asset Derivatives | | | | | | | | | | | | | | | | | | | | | | | | |
| Interest Rate Futures | | | | | | | | | | | | | | | | | | | | | | | | |
| U.S. Treasury Bond 30 yr | | | Long | | | | USD | | | | 11 | | | | $1,606,000 | | | | March - 2019 | | | | $74,553 | |
| U.S. Treasury Note 2 yr | | | Long | | | | USD | | | | 31 | | | | 6,581,687 | | | | March - 2019 | | | | 42,922 | |
| U.S. Treasury Ultra Bond 30 yr | | | Long | | | | USD | | | | 11 | | | | 1,767,219 | | | | March - 2019 | | | | 92,858 | |
| | | | | | | | | | | | | | | | | | | | | | | | |
| | | | | | | | | | | | | | | | | | | | | | | $210,333 | |
| | | | | | | | | | | | | | | | | | | | | | | | |
| Liability Derivatives | | | | | | | | | | | | | | | | | | | | | | | | |
| Interest Rate Futures | | | | | | | | | | | | | | | | | | | | | | | | |
| U.S. Treasury Ultra Note 10 yr | | | Short | | | | USD | | | | 28 | | | | $3,642,187 | | | | March - 2019 | | | | $(117,133 | ) |
| | | | | | | | | | | | | | | | | | | | | | | | |
Cleared Swap Agreements
| | | | | | | | | | | | | | | | | | | | | | | | | | | | | | | | |
Maturity
Date | | Notional
Amount | | | | | Counterparty | | | Cash Flows
to Receive/
Frequency | | | Cash Flows
to Pay/
Frequency | | | Unrealized
Appreciation
(Depreciation) | | | Net Unamortized
Upfront Payments
(Receipts) | | | Value | |
| Liability Derivatives | | | | | | | | | | | | | | | | | | | | | | | | | | | |
| | | | | |
| Credit Default Swaps | | | | | | | | | | | | | | | | | | | | | |
| 12/20/23 | | USD | | | 690,000 | | | | | | centrally cleared | | | | (1) | | | | 5% / Quarterly | | | | $(6,583 | ) | | | $(8,575 | ) | | | $(15,158 | ) |
| | | | | | | | | | | | | | | | | | | | | | | | | | | | | | | | |
Uncleared Swap Agreements
| | | | | | | | | | | | | | | | | | | | | | | | | | | | | | | | |
Maturity
Date | | Notional
Amount | | | | | Counterparty | | | Cash Flows
to Receive/
Frequency | | | Cash Flows
to Pay/
Frequency | | | Unrealized
Appreciation
(Depreciation) | | | Net Unamortized
Upfront Payments
(Receipts) | | | Value | |
| Asset Derivatives | | | | | | | | | | | | | | | | | | | | | | | | | | | |
| | | | | |
| Credit Default Swaps | | | | | | | | | | | | | | | | | | | | | |
| 11/18/54 | | USD | | | 900,000 | | | | | | Morgan Stanley | | | | (2) | | | | 0.5% / Quarterly | | | | $(321 | ) | | | $17,527 | | | | $17,206 | |
| | | | | | | | | | | | | | | | | | | | | | | | | | | | | | | | |
| (1) | Fund, as protection buyer, to receive notional amount upon a defined credit event by a reference obligation specified in the Markit CDX North America High Yield Index. |
| (2) | Fund, as protection buyer, to receive notional amount upon a defined credit event by a reference obligation specified in the Markit CMBX AAA Index. |
At December 31, 2018, the fund had liquid securities with an aggregate value of $79,910 to cover any collateral or margin obligations for certain derivative contracts.
See Notes to Financial Statements
12
MFS Strategic Income Portfolio
FINANCIAL STATEMENTS | STATEMENT OF ASSETS AND LIABILITIES
This statement represents your fund’s balance sheet, which details the assets and liabilities comprising the total value of the fund.
| | | | |
At 12/31/18 | | | | |
| |
Assets | | | | |
Investments in unaffiliated issuers, at value (identified cost, $35,702,263) | | | $34,597,689 | |
Investments in affiliated issuers, at value (identified cost, $8,974,737) | | | 7,686,573 | |
Cash | | | 26,298 | |
Foreign currency, at value (identified cost, $2,278,319) | | | 2,322,740 | |
Receivables for | | | | |
Forward foreign currency exchange contracts | | | 11,770 | |
Net daily variation margin on open futures contracts | | | 2,936 | |
Investments sold | | | 21,497 | |
Interest | | | 278,867 | |
Uncleared swaps, at value (net unamortized premiums paid, $17,527) | | | 17,206 | |
Receivable from investment adviser | | | 7,273 | |
Other assets | | | 586 | |
Total assets | | | $44,973,435 | |
| |
Liabilities | | | | |
Payables for | | | | |
Net daily variation margin on open cleared swap agreements | | | $1,044 | |
Forward foreign currency exchange contracts | | | 60,655 | |
Due to broker for swap premium | | | 17,533 | |
Fund shares reacquired | | | 111,496 | |
Payable to affiliates | | | | |
Shareholder servicing costs | | | 103 | |
Distribution and/or service fees | | | 181 | |
Payable for independent Trustees’ compensation | | | 20 | |
Accrued expenses and other liabilities | | | 57,638 | |
Total liabilities | | | $248,670 | |
Net assets | | | $44,724,765 | |
| |
Net assets consist of | | | | |
Paid-in capital | | | $46,781,636 | |
Total distributable earnings (loss) | | | (2,056,871 | ) |
Net assets | | | $44,724,765 | |
Shares of beneficial interest outstanding | | | 4,835,638 | |
| | | | | | | | | | | | |
| | | |
| | | Net assets | | | Shares
outstanding | | | Net asset value
per share | |
Initial Class | | | $38,111,036 | | | | 4,115,651 | | | | $9.26 | |
Service Class | | | 6,613,729 | | | | 719,987 | | | | 9.19 | |
See Notes to Financial Statements
13
MFS Strategic Income Portfolio
FINANCIAL STATEMENTS | STATEMENT OF OPERATIONS
This statement describes how much your fund earned in investment income and accrued in expenses. It also describes any gains and/or losses generated by fund operations.
| | | | |
Year ended 12/31/18 | | | | |
| |
Net investment income (loss) | | | | |
Income | | | | |
Interest | | | $1,429,393 | |
Dividends from affiliated issuers | | | 542,494 | |
Other | | | 168 | |
Income on securities loaned | | | 2 | |
Foreign taxes withheld | | | (1,604 | ) |
Total investment income | | | $1,970,453 | |
Expenses | | | | |
Management fee | | | $326,563 | |
Distribution and/or service fees | | | 16,749 | |
Shareholder servicing costs | | | 11,504 | |
Administrative services fee | | | 17,500 | |
Independent Trustees’ compensation | | | 940 | |
Custodian fee | | | 10,493 | |
Shareholder communications | | | 12,070 | |
Audit and tax fees | | | 77,936 | |
Legal fees | | | 1,034 | |
Miscellaneous | | | 24,287 | |
Total expenses | | | $499,076 | |
Reduction of expenses by investment adviser | | | (108,499 | ) |
Net expenses | | | $390,577 | |
Net investment income (loss) | | | $1,579,876 | |
| |
Realized and unrealized gain (loss) | | | | |
Realized gain (loss) (identified cost basis) | | | | |
Unaffiliated issuers | | | $(545,136 | ) |
Affiliated issuers | | | (411,187 | ) |
Futures contracts | | | (49,036 | ) |
Swap agreements | | | 449 | |
Forward foreign currency exchange contracts | | | 838 | |
Foreign currency | | | (1,537 | ) |
Net realized gain (loss) | | | $(1,005,609 | ) |
Change in unrealized appreciation or depreciation | | | | |
Unaffiliated issuers | | | $(1,332,277 | ) |
Affiliated issuers | | | (305,791 | ) |
Futures contracts | | | 92,062 | |
Swap agreements | | | (6,904 | ) |
Forward foreign currency exchange contracts | | | (48,332 | ) |
Translation of assets and liabilities in foreign currencies | | | 44,437 | |
Net unrealized gain (loss) | | | $(1,556,805 | ) |
Net realized and unrealized gain (loss) | | | $(2,562,414 | ) |
Change in net assets from operations | | | $(982,538 | ) |
See Notes to Financial Statements
14
MFS Strategic Income Portfolio
FINANCIAL STATEMENTS | STATEMENTS OF CHANGES IN NET ASSETS
These statements describe the increases and/or decreases in net assets resulting from operations, any distributions, and any shareholder transactions.
| | | | | | | | |
| | | Year ended | |
| | | 12/31/18 | | | 12/31/17 | |
Change in net assets | | | | | | | | |
| | |
From operations | | | | | | | | |
Net investment income (loss) | | | $1,579,876 | | | | $1,730,642 | |
Net realized gain (loss) | | | (1,005,609 | ) | | | 620,201 | |
Net unrealized gain (loss) | | | (1,556,805 | ) | | | 746,622 | |
Change in net assets from operations | | | $(982,538 | ) | | | $3,097,465 | |
Total distributions to shareholders (a) | | | $(1,829,013 | ) | | | $(2,356,097 | ) |
Change in net assets from fund share transactions | | | $(2,160,371 | ) | | | $(4,011,928 | ) |
Total change in net assets | | | $(4,971,922 | ) | | | $(3,270,560 | ) |
| | |
Net assets | | | | | | | | |
At beginning of period | | | 49,696,687 | | | | 52,967,247 | |
At end of period (b) | | | $44,724,765 | | | | $49,696,687 | |
| (a) | Distributions from net investment income and from net realized gain are no longer required to be separately disclosed. See Note 2. For the year ended December 31, 2017, distributions from net investment income were $2,356,097. |
| (b) | Parenthetical disclosure of undistributed net investment income is no longer required. See Note 2. For the year ended December 31, 2017, end of period net assets included undistributed net investment income of $1,795,137. |
See Notes to Financial Statements
15
MFS Strategic Income Portfolio
FINANCIAL STATEMENTS | FINANCIAL HIGHLIGHTS
The financial highlights table is intended to help you understand the fund’s financial performance for the past 5 years. Certain information reflects financial results for a single fund share. The total returns in the table represent the rate that an investor would have earned (or lost) on an investment in the fund share class (assuming reinvestment of all distributions) held for the entire period.
| | | | | | | | | | | | | | | | | | | | |
| Initial Class | | Year ended | |
| | | | | |
| | | 12/31/18 | | | 12/31/17 | | | 12/31/16 | | | 12/31/15 | | | 12/31/14 | |
| | | | | |
Net asset value, beginning of period | | | $9.84 | | | | $9.71 | | | | $9.25 | | | | $10.01 | | | | $10.01 | |
| | | | | |
| Income (loss) from investment operations | | | | | | | | | | | | | | | | | | | | |
Net investment income (loss) (d) | | | $0.33 | | | | $0.34 | | | | $0.40 | (c) | | | $0.37 | | | | $0.41 | |
Net realized and unrealized gain (loss) | | | (0.52 | ) | | | 0.26 | | | | 0.37 | | | | (0.55 | ) | | | (0.08 | ) |
Total from investment operations | | | $(0.19 | ) | | | $0.60 | | | | $0.77 | | | | $(0.18 | ) | | | $0.33 | |
| | | | | |
| Less distributions declared to shareholders | | | | | | | | | | | | | | | | | | | | |
From net investment income | | | $(0.39 | ) | | | $(0.47 | ) | | | $(0.31 | ) | | | $(0.58 | ) | | | $(0.33 | ) |
Net asset value, end of period (x) | | | $9.26 | | | | $9.84 | | | | $9.71 | | | | $9.25 | | | | $10.01 | |
Total return (%) (k)(r)(s)(x) | | | (1.99 | ) | | | 6.24 | | | | 8.24 | (c) | | | (1.85 | ) | | | 3.27 | |
| | | | | |
Ratios (%) (to average net assets)
and Supplemental data: | | | | | | | | | | | | | | | | | | | | |
Expenses before expense reductions (f)(h) | | | 1.03 | | | | 1.02 | | | | 0.89 | (c) | | | 0.96 | | | | 0.94 | |
Expenses after expense reductions (f)(h) | | | 0.80 | | | | 0.80 | | | | 0.71 | (c) | | | 0.80 | | | | 0.80 | |
Net investment income (loss) | | | 3.42 | | | | 3.39 | | | | 4.09 | (c) | | | 3.74 | | | | 4.05 | |
Portfolio turnover | | | 59 | | | | 72 | | | | 21 | | | | 31 | | | | 21 | |
Net assets at end of period (000 omitted) | | | $38,111 | | | | $42,409 | | | | $44,191 | | | | $47,422 | | | | $59,824 | |
| |
| Service Class | | Year ended | |
| | | | | |
| | | 12/31/18 | | | 12/31/17 | | | 12/31/16 | | | 12/31/15 | | | 12/31/14 | |
| | | | | |
Net asset value, beginning of period | | | $9.75 | | | | $9.63 | | | | $9.17 | | | | $9.92 | | | | $9.93 | |
| | | | | |
| Income (loss) from investment operations | | | | | | | | | | | | | | | | | | | | |
Net investment income (loss) (d) | | | $0.30 | | | | $0.31 | | | | $0.37 | (c) | | | $0.34 | | | | $0.39 | |
Net realized and unrealized gain (loss) | | | (0.50 | ) | | | 0.25 | | | | 0.37 | | | | (0.54 | ) | | | (0.09 | ) |
Total from investment operations | | | $(0.20 | ) | | | $0.56 | | | | $0.74 | | | | $(0.20 | ) | | | $0.30 | |
| | | | | |
| Less distributions declared to shareholders | | | | | | | | | | | | | | | | | | | | |
From net investment income | | | $(0.36 | ) | | | $(0.44 | ) | | | $(0.28 | ) | | | $(0.55 | ) | | | $(0.31 | ) |
Net asset value, end of period (x) | | | $9.19 | | | | $9.75 | | | | $9.63 | | | | $9.17 | | | | $9.92 | |
Total return (%) (k)(r)(s)(x) | | | (2.11 | ) | | | 5.88 | | | | 8.00 | (c) | | | (2.06 | ) | | | 2.99 | |
| | | | | |
Ratios (%) (to average net assets)
and Supplemental data: | | | | | | | | | | | | | | | | | | | | |
Expenses before expense reductions (f)(h) | | | 1.28 | | | | 1.27 | | | | 1.14 | (c) | | | 1.21 | | | | 1.19 | |
Expenses after expense reductions (f)(h) | | | 1.05 | | | | 1.05 | | | | 0.97 | (c) | | | 1.05 | | | | 1.05 | |
Net investment income (loss) | | | 3.17 | | | | 3.16 | | | | 3.83 | (c) | | | 3.49 | | | | 3.80 | |
Portfolio turnover | | | 59 | | | | 72 | | | | 21 | | | | 31 | | | | 21 | |
Net assets at end of period (000 omitted) | | | $6,614 | | | | $7,287 | | | | $8,776 | | | | $9,548 | | | | $10,719 | |
See Notes to Financial Statements
16
MFS Strategic Income Portfolio
Financial Highlights – continued
| (c) | Amount reflects aone-time reimbursement of expenses by the custodian (or former custodian) without which net investment income and performance would be lower and expenses would be higher. |
| (d) | Per share data is based on average shares outstanding. |
| (f) | Ratios do not reflect reductions from fees paid indirectly, if applicable. |
| (h) | In addition to the fees and expenses which the fund bears directly, the fund indirectly bears a pro rata share of the fees and expenses of the underlying affiliated funds in which the fund invests. Accordingly, the expense ratio for the fund reflects only those fees and expenses borne directly by the fund. Because the underlying affiliated funds have varied expense and fee levels and the fund may own different proportions of the underlying affiliated funds at different times, the amount of fees and expenses incurred indirectly by the fund will vary. |
| (k) | The total return does not reflect expenses that apply to separate accounts. Inclusion of these charges would reduce the total return figures for all periods shown. |
| (r) | Certain expenses have been reduced without which performance would have been lower. |
| (s) | From time to time the fund may receive proceeds from litigation settlements, without which performance would be lower. |
| (x) | The net asset values and total returns have been calculated on net assets which include adjustments made in accordance with U.S. generally accepted accounting principles required at period end for financial reporting purposes. |
See Notes to Financial Statements
17
MFS Strategic Income Portfolio
NOTES TO FINANCIAL STATEMENTS
| (1) | | Business and Organization |
MFS Strategic Income Portfolio (the fund) is a diversified series of MFS Variable Insurance Trust II (the trust). The trust is organized as a Massachusetts business trust and is registered under the Investment Company Act of 1940, as amended, as anopen-end management investment company. The shareholders of each series of the trust are separate accounts of insurance companies, which offer variable annuity and/or life insurance products, and qualified retirement and pension plans.
The fund is an investment company and accordingly follows the investment company accounting and reporting guidance of the Financial Accounting Standards Board (FASB) Accounting Standards Codification Topic 946 Financial Services – Investment Companies.
| (2) | | Significant Accounting Policies |
General – The preparation of financial statements in conformity with U.S. generally accepted accounting principles requires management to make estimates and assumptions that affect the reported amounts of assets and liabilities, and disclosure of contingent assets and liabilities at the date of the financial statements and the reported amounts of increases and decreases in net assets from operations during the reporting period. Actual results could differ from those estimates. In the preparation of these financial statements, management has evaluated subsequent events occurring after the date of the fund’s Statement of Assets and Liabilities through the date that the financial statements were issued. The fund invests in the MFS High Yield Pooled Portfolio (“High Yield Pooled Portfolio”). MFS does not receive a management fee from the High Yield Pooled Portfolio. The High Yield Pooled Portfolio’s investment objective is to seek total return with an emphasis on high current income, but also considering capital appreciation. The accounting policies of the High Yield Pooled Portfolio are outlined in its shareholder report, which is available without charge by calling1-800-225-2606 and on the Securities and Exchange Commission (SEC) web site at http://www.sec.gov. The accounting policies detailed in the Significant Accounting Policies note cover both the fund and the High Yield Pooled Portfolio. For purposes of this policy disclosure, “fund” refers to both the fund and the High Yield Pooled Portfolio in which the fund invests. The High Yield Pooled Portfolio’s shareholder report is not covered by this report. The fund and the High Yield Pooled Portfolio invest in high-yield securities rated below investment grade. Investments in below investment grade quality securities can involve a substantially greater risk of default or can already be in default, and their values can decline significantly. Below investment grade quality securities tend to be more sensitive to adverse news about the issuer, or the market or economy in general, than higher quality debt instruments. The fund and the High Yield Pooled Portfolio invest in foreign securities. Investments in foreign securities are vulnerable to the effects of changes in the relative values of the local currency and the U.S. dollar and to the effects of changes in each country’s market, economic, industrial, political, regulatory, geopolitical, and other conditions.
In March 2017, the FASB issued Accounting Standards Update2017-08, Receivables – Nonrefundable Fees and Other Costs (Subtopic310-20) – Premium Amortization on Purchased Callable Debt Securities (“ASU2017-08”). For entities that hold callable debt securities at a premium, ASU2017-08 requires that the premium be amortized to the earliest call date. ASU2017-08 will be effective for fiscal years beginning after December 15, 2018, and interim periods within those fiscal years. Management has evaluated the potential impacts of ASU2017-08 and believes that adoption of ASU2017-08 will not have a material effect on the fund’s overall financial position or its overall results of operations.
In August 2018, the FASB issued Accounting Standards Update2018-13, Fair Value Measurement (Topic 820) – Disclosure Framework – Changes to the Disclosure Requirements for Fair Value Measurement (“ASU2018-13”) which introduces new fair value disclosure requirements as well as eliminates and modifies certain existing fair value disclosure requirements. ASU2018-13 would be effective for fiscal years beginning after December 15, 2019, and interim periods within those fiscal years; however, management has elected to early adopt ASU2018-13 effective with the current reporting period. The impact of the fund’s adoption was limited to changes in the fund’s financial statement disclosures regarding fair value, primarily those disclosures related to transfers between levels of the fair value hierarchy.
In August 2018, the Securities and Exchange Commission (SEC) released its Final Rule on Disclosure Update and Simplification (the “Final Rule”) which is intended to simplify an issuer’s disclosure compliance efforts by removing redundant or outdated disclosure requirements without significantly altering the mix of information provided to investors. Effective with the current reporting period, the fund adopted the Final Rule with the impacts being that the fund is no longer required to present the components of distributable earnings on the Statement of Assets and Liabilities or the sources of distributions to shareholders and the amount of undistributed net investment income on the Statements of Changes in Net Assets.
Balance Sheet Offsetting – The fund’s accounting policy with respect to balance sheet offsetting is that, absent an event of default by the counterparty or a termination of the agreement, the International Swaps and Derivatives Association (ISDA) Master Agreement, or similar agreement, does not result in an offset of reported amounts of financial assets and financial liabilities in the Statement of Assets and Liabilities across transactions between the fund and the applicable counterparty. The fund’s right to setoff may be restricted or prohibited by the bankruptcy or insolvency laws of the particular jurisdiction to which a specific master netting
18
MFS Strategic Income Portfolio
Notes to Financial Statements – continued
agreement counterparty is subject. Balance sheet offsetting disclosures, to the extent applicable to the fund, have been included in the fund’s Significant Accounting Policies note under the captions for each of the fund’sin-scope financial instruments and transactions.
Investment Valuations – The investments of the fund and the High Yield Pooled Portfolio are valued as described below.
Equity securities, including restricted equity securities, are generally valued at the last sale or official closing price on their primary market or exchange as provided by a third-party pricing service. Equity securities, for which there were no sales reported that day, are generally valued at the last quoted daily bid quotation on their primary market or exchange as provided by a third-party pricing service. Debt instruments and floating rate loans, including restricted debt instruments, are generally valued at an evaluated or composite bid as provided by a third-party pricing service. Short-term instruments with a maturity at issuance of 60 days or less may be valued at amortized cost, which approximates market value. Exchange-traded options are generally valued at the last sale or official closing price on their primary exchange as provided by a third-party pricing service. Exchange-traded options for which there were no sales reported that day are generally valued at the last daily bid quotation on their primary exchange as provided by athird-party pricing service. Options not traded on an exchange are generally valued at a broker/dealer bid quotation. Foreign currency options are generally valued at valuations provided by a third-party pricing service. Futures contracts are generally valued at last posted settlement price on their primary exchange as provided by a third-party pricing service. Futures contracts for which there were no trades that day for a particular position are generally valued at the closing bid quotation on their primary exchange as provided by a third-party pricing service. Forward foreign currency exchange contracts are generally valued at the mean of bid and asked prices for the time period interpolated from rates provided by a third-party pricing service for proximate time periods. Swap agreements are generally valued at valuations provided by a third-party pricing service, which for cleared swaps includes an evaluation of any trading activity at the clearinghouses.Open-end investment companies are generally valued at net asset value per share. Securities and other assets generally valued on the basis of information from a third-party pricing service may also be valued at a broker/dealer bid quotation. In determining values, third-party pricing services can utilize both transaction data and market information such as yield, quality, coupon rate, maturity, type of issue, trading characteristics, and other market data. The values of foreign securities and other assets and liabilities expressed in foreign currencies are converted to U.S. dollars using the mean of bid and asked prices for rates provided by a third-party pricing service.
The Board of Trustees has delegated primary responsibility for determining or causing to be determined the value of the fund’s investments (including any fair valuation) to the adviser pursuant to valuation policies and procedures approved by the Board. If the adviser determines that reliable market quotations are not readily available, investments are valued at fair value as determined in good faith by the adviser in accordance with such procedures under the oversight of the Board of Trustees. Under the fund’s valuation policies and procedures, market quotations are not considered to be readily available for most types of debt instruments and floating rate loans and many types of derivatives. These investments are generally valued at fair value based on information from third-party pricing services. In addition, investments may be valued at fair value if the adviser determines that an investment’s value has been materially affected by events occurring after the close of the exchange or market on which the investment is principally traded (such as foreign exchange or market) and prior to the determination of the fund’s net asset value, or after the halting of trading of a specific security where trading does not resume prior to the close of the exchange or market on which the security is principally traded. The adviser generally relies on third-party pricing services or other information (such as the correlation with price movements of similar securities in the same or other markets; the type, cost and investment characteristics of the security; the business and financial condition of the issuer; and trading and other market data) to assist in determining whether to fair value and at what value to fair value an investment. The value of an investment for purposes of calculating the fund’s net asset value can differ depending on the source and method used to determine value. When fair valuation is used, the value of an investment used to determine the fund’s net asset value may differ from quoted or published prices for the same investment. There can be no assurance that the fund could obtain the fair value assigned to an investment if it were to sell the investment at the same time at which the fund determines its net asset value per share.
Various inputs are used in determining the value of the fund’s assets or liabilities. These inputs are categorized into three broad levels. In certain cases, the inputs used to measure fair value may fall into different levels of the fair value hierarchy. In such cases, an investment’s level within the fair value hierarchy is based on the lowest level of input that is significant to the fair value measurement. The fund’s assessment of the significance of a particular input to the fair value measurement in its entirety requires judgment, and considers factors specific to the investment. Level 1 includes unadjusted quoted prices in active markets for identical assets or liabilities. Level 2 includes other significant observable market-based inputs (including quoted prices for similar securities, interest rates, prepayment speed, and credit risk). Level 3 includes unobservable inputs, which may include the adviser’s own
19
MFS Strategic Income Portfolio
Notes to Financial Statements – continued
assumptions in determining the fair value of investments. Other financial instruments are derivative instruments, such as futures contracts, forward foreign currency exchange contracts, and swap agreements. The following is a summary of the levels used as of December 31, 2018 in valuing the fund’s assets or liabilities:
| | | | | | | | | | | | | | | | |
| Financial Instruments | | Level 1 | | | Level 2 | | | Level 3 | | | Total | |
| Equity Securities | | | $11,573 | | | | $— | | | | $— | | | | $11,573 | |
| U.S. Treasury Bonds & U.S. Government Agency & Equivalents | | | — | | | | 6,095,662 | | | | — | | | | 6,095,662 | |
| Non-U.S. Sovereign Debt | | | — | | | | 2,725,104 | | | | — | | | | 2,725,104 | |
| Municipal Bonds | | | — | | | | 299,544 | | | | — | | | | 299,544 | |
| U.S. Corporate Bonds | | | — | | | | 9,318,976 | | | | — | | | | 9,318,976 | |
| Residential Mortgage-Backed Securities | | | — | | | | 400,414 | | | | — | | | | 400,414 | |
| Commercial Mortgage-Backed Securities | | | — | | | | 5,487,772 | | | | — | | | | 5,487,772 | |
| Asset-Backed Securities (including CDOs) | | | — | | | | 6,078,967 | | | | — | | | | 6,078,967 | |
| Foreign Bonds | | | — | | | | 4,179,677 | | | | — | | | | 4,179,677 | |
| Mutual Funds | | | 7,686,573 | | | | — | | | | — | | | | 7,686,573 | |
| Total | | | $7,698,146 | | | | $34,586,116 | | | | $— | | | | $42,284,262 | |
| | | | |
| Other Financial Instruments | | | | | | | | | | | | |
| Futures Contracts – Assets | | | $210,333 | | | | $— | | | | $— | | | | $210,333 | |
| Futures Contracts – Liabilities | | | (117,133 | ) | | | — | | | | — | | | | (117,133 | ) |
| Forward Foreign Currency Exchange Contracts – Assets | | | — | | | | 11,770 | | | | — | | | | 11,770 | |
| Forward Foreign Currency Exchange Contracts – Liabilities | | | — | | | | (60,655 | ) | | | — | | | | (60,655 | ) |
| Swap Agreements – Assets | | | — | | | | 17,206 | | | | — | | | | 17,206 | |
| Swap Agreements – Liabilities | | | — | | | | (15,158 | ) | | | — | | | | (15,158 | ) |
For further information regarding security characteristics, see the Portfolio of Investments. Please refer to the High Yield Pooled Portfolio’s shareholder report for further information regarding the levels used in valuing its assets or liabilities.
Foreign Currency Translation – Purchases and sales of foreign investments, income, and expenses are converted into U.S. dollars based upon currency exchange rates prevailing on the respective dates of such transactions or on the reporting date for foreign denominated receivables and payables. Gains and losses attributable to foreign currency exchange rates on sales of securities are recorded for financial statement purposes as net realized gains and losses on investments. Gains and losses attributable to foreign exchange rate movements on receivables, payables, income and expenses are recorded for financial statement purposes as foreign currency transaction gains and losses. That portion of both realized and unrealized gains and losses on investments that results from fluctuations in foreign currency exchange rates is not separately disclosed.
Derivatives– The fund uses derivatives primarily to increase or decrease exposure to a particular market or segment of the market, or security, to increase or decrease interest rate or currency exposure, or as alternatives to direct investments. Derivatives are used for hedging ornon-hedging purposes. While hedging can reduce or eliminate losses, it can also reduce or eliminate gains. When the fund uses derivatives as an investment to increase market exposure, or for hedging purposes, gains and losses from derivative instruments may be substantially greater than the derivative’s original cost.
The derivative instruments used by the fund during the period were purchased options, futures contracts, forward foreign currency exchange contracts, and swap agreements. Depending on the type of derivative, the fund may exit a derivative position by entering into an offsetting transaction with a counterparty or exchange, negotiating an agreement with the derivative counterparty, or novating the position to a third party. The fund may be unable to promptly close out a futures position in instances where the daily fluctuation in the price for that type of future exceeds the daily limit set by the exchange. The fund’s period end derivatives, as presented in the Portfolio of Investments and the associated Derivative Contract tables, generally are indicative of the volume of its derivative activity during the period.
The following table presents, by major type of derivative contract, the fair value, on a gross basis, of the asset and liability components of derivatives held by the fund at December 31, 2018 as reported in the Statement of Assets and Liabilities:
| | | | | | | | | | |
| | | | | Fair Value (a) | |
| Risk | | Derivative Contracts | | Asset Derivatives | | | Liability Derivatives | |
| Interest Rate | | Interest Rate Futures | | | $210,333 | | | | $(117,133 | ) |
| Foreign Exchange | | Forward Foreign Currency Exchange Contracts | | | 11,770 | | | | (60,655 | ) |
| Credit | | Credit Default Swaps | | | 17,206 | | | | (15,158 | ) |
| Total | | | | | $239,309 | | | | $(192,946 | ) |
| (a) | Values presented in this table for futures contracts and cleared swap agreements correspond to the values reported in the fund’s Portfolio of Investments. Only the current day net variation margin for futures contracts and cleared swap agreements is separately reported within the fund’s Statement of Assets and Liabilities. |
20
MFS Strategic Income Portfolio
Notes to Financial Statements – continued
The following table presents, by major type of derivative contract, the realized gain (loss) on derivatives held by the fund for the year ended December 31, 2018 as reported in the Statement of Operations:
| | | | | | | | | | | | | | | | |
| Risk | | Futures Contracts | | | Swap Agreements | | | Forward Foreign Currency
Exchange Contracts | | | Unaffiliated Issuers (Purchased Options) | |
| Interest Rate | | | $(49,036 | ) | | | $— | | | | $— | | | | $(27,848 | ) |
| Foreign Exchange | | | — | | | | — | | | | 838 | | | | — | |
| Credit | | | — | | | | 449 | | | | — | | | | — | |
| Total | | | $(49,036 | ) | | | $449 | | | | $838 | | | | $(27,848 | ) |
The following table presents, by major type of derivative contract, the change in unrealized appreciation or depreciation on derivatives held by the fund for the year ended December 31, 2018 as reported in the Statement of Operations:
| | | | | | | | | | | | |
| Risk | | Futures Contracts | | | Swap Agreements | | | Forward Foreign Currency
Exchange Contracts | |
| Interest Rate | | | $92,062 | | | | $— | | | | $— | |
| Foreign Exchange | | | — | | | | — | | | | (48,332 | ) |
| Credit | | | — | | | | (6,904 | ) | | | — | |
| Total | | | $92,062 | | | | $(6,904 | ) | | | $(48,332 | ) |
Derivative counterparty credit risk is managed through formal evaluation of the creditworthiness of all potential counterparties. On certain, but not all, uncleared derivatives, the fund attempts to reduce its exposure to counterparty credit risk whenever possible by entering into an ISDA Master Agreement on a bilateral basis. The ISDA Master Agreement gives each party to the agreement the right to terminate all transactions traded under such agreement if there is a specified deterioration in the credit quality of the other party. Upon an event of default or a termination of the ISDA Master Agreement, thenon-defaulting party has the right to close out all transactions traded under such agreement and to net amounts owed under each agreement to one net amount payable by one party to the other. This right to close out and net payments across all transactions traded under the ISDA Master Agreement could result in a reduction of the fund’s credit risk to such counterparty equal to any amounts payable by the fund under the applicable transactions, if any.
Collateral and margin requirements differ by type of derivative. For cleared derivatives (e.g., futures contracts, cleared swaps, and exchange-traded options), margin requirements are set by the clearing broker and the clearing house and collateral, in the form of cash or securities, is posted by the fund directly with the clearing broker. Collateral terms are counterparty agreement specific for uncleared derivatives (e.g., forward foreign currency exchange contracts, uncleared swap agreements, and uncleared options) and collateral, in the form of cash and securities, is held in segregated accounts with the fund’s custodian in connection with these agreements. For derivatives traded under an ISDA Master Agreement, which contains a collateral support annex, the collateral requirements are netted across all transactions traded under such counterparty-specific agreement and an amount is posted from one party to the other to collateralize such obligations. Cash that has been segregated or delivered to cover the fund’s collateral or margin obligations under derivative contracts, if any, will be reported separately in the Statement of Assets and Liabilities as restricted cash for uncleared derivatives and/or deposits with brokers for cleared derivatives. Securities pledged as collateral or margin for the same purpose, if any, are noted in the Portfolio of Investments. The fund may be required to make payments of interest on uncovered collateral or margin obligations with the broker. Any such payments are included in “Miscellaneous” expense in the Statement of Operations.
Purchased Options – The fund purchased put options for a premium. Purchased put options entitle the holder to buy and sell a specified number of shares or units of a particular security, currency or index at a specified price at a specified date or within a specified period of time. Purchasing put options may hedge against an anticipated decline in the value of portfolio securities or currency or decrease the fund’s exposure to an underlying instrument.
The premium paid is initially recorded as an investment in the Statement of Assets and Liabilities. That investment is subsequentlymarked-to-market daily with the difference between the premium paid and the market value of the purchased option being recorded as unrealized appreciation or depreciation. Premiums paid for purchased put options which have expired are treated as realized losses on investments in the Statement of Operations. Upon the exercise or closing of a purchased put option, the premium paid is offset against the proceeds on the sale of the underlying security or financial instrument in order to determine the realized gain or loss on investments.
21
MFS Strategic Income Portfolio
Notes to Financial Statements – continued
Whether or not the option is exercised, the fund’s maximum risk of loss from purchasing an option is the amount of premium paid. All option contracts involve credit risk if the counterparty to the option contract fails to perform. For uncleared options, this risk is mitigated in cases where there is an ISDA Master Agreement between the fund and the counterparty providing for netting as described above and, where applicable, by the posting of collateral by the counterparty to the fund to cover the fund’s exposure to the counterparty under such ISDA Master Agreement.
Futures Contracts – The fund entered into futures contracts which may be used to hedge against or obtain broad market exposure, interest rate exposure, currency exposure, or to manage duration. A futures contract represents a commitment for the future purchase or sale of an asset at a specified price on a specified date.
Upon entering into a futures contract, the fund is required to deposit with the broker, either in cash or securities, an initial margin in an amount equal to a specified percentage of the notional amount of the contract. Subsequent payments (variation margin) are made or received by the fund each day, depending on the daily fluctuations in the value of the contract, and are recorded for financial statement purposes as unrealized gain or loss by the fund until the contract is closed or expires at which point the gain or loss on futures contracts is realized.
The fund bears the risk of interest rates, exchange rates or securities prices moving unexpectedly, in which case, the fund may not achieve the anticipated benefits of the futures contracts and may realize a loss. While futures contracts may present less counterparty risk to the fund since the contracts are exchange traded and the exchange’s clearinghouse guarantees payments to the broker, there is still counterparty credit risk due to the insolvency of the broker. The fund’s maximum risk of loss due to counterparty credit risk is equal to the margin posted by the fund to the broker plus any gains or minus any losses on the outstanding futures contracts.
Forward Foreign Currency Exchange Contracts – The fund entered into forward foreign currency exchange contracts for the purchase or sale of a specific foreign currency at a fixed price on a future date. These contracts may be used to hedge the fund’s currency risk or fornon-hedging purposes. For hedging purposes, the fund may enter into contracts to deliver or receive foreign currency that the fund will receive from or use in its normal investment activities. The fund may also use contracts to hedge against declines in the value of foreign currency denominated securities due to unfavorable exchange rate movements. Fornon-hedging purposes, the fund may enter into contracts with the intent of changing the relative exposure of the fund’s portfolio of securities to different currencies to take advantage of anticipated exchange rate changes.
Forward foreign currency exchange contracts are adjusted by the daily exchange rate of the underlying currency and any unrealized gains or losses are recorded as a receivable or payable for forward foreign currency exchange contracts until the contract settlement date. On contract settlement date, any gain or loss on the contract is recorded as realized gains or losses on forward foreign currency exchange contracts.
Risks may arise upon entering into these contracts from unanticipated movements in the value of the contract and from the potential inability of counterparties to meet the terms of their contracts. Generally, the fund’s maximum risk due to counterparty credit risk is the unrealized gain on the contract due to the use of Continuous Linked Settlement, a multicurrency cash settlement system for the centralized settlement of foreign transactions. This risk is mitigated in cases where there is an ISDA Master Agreement between the fund and the counterparty providing for netting as described above and, where applicable, by the posting of collateral by the counterparty to the fund to cover the fund’s exposure to the counterparty under such ISDA Master Agreement.
Swap Agreements – During the period the fund entered into swap agreements. Swap agreements generally involve a periodic exchange of cash payments on a net basis, at specified intervals or upon the occurrence of specified events, between the fund and a counterparty. Certain swap agreements may be entered into as a bilateral contract (“uncleared swaps”) while others are required to be centrally cleared (“cleared swaps”). In a cleared swap transaction, the ultimate counterparty to the transaction is a clearinghouse (the “clearinghouse”). The contract is transferred and accepted by the clearinghouse immediately following execution of the swap contract with an executing broker. Thereafter, throughout the term of the cleared swap, the fund interfaces indirectly with the clearinghouse through a clearing broker and has counterparty risk to the clearing broker as well.
Amounts paid or received at the inception of uncleared swap agreements are presented parenthetically as premiums paid or received and reflected in the value of the uncleared swap in the Statement of Assets and Liabilities. Those premiums are amortized using the effective interest method over the term of the agreement as realized gain or loss on swap agreements in the Statement of Operations. The value of the uncleared swap agreements, which is adjusted daily and includes any related interest accruals to be paid or received by the fund, is recorded in the Statement of Assets and Liabilities as “Uncleared swaps, at value”. The daily change in the value of uncleared swaps, including any related interest accruals to be paid or received, is recorded as unrealized appreciation or depreciation on swap agreements in the Statement of Operations. For cleared swaps, the daily change in valuation is recorded as a receivable or payable for variation margin in the Statement of Assets and Liabilities and reflected in unrealized appreciation or depreciation on swap agreements in the Statement of Operations. The periodic exchange of net cash payments, at specified intervals or upon the occurrence of specified events as stipulated by the agreement, is recorded as realized gain or loss on swap agreements in the Statement of Operations. A liquidation payment received or made upon early termination is recorded as a realized gain or loss on swap agreements in the Statement of Operations.
22
MFS Strategic Income Portfolio
Notes to Financial Statements – continued
Risks related to swap agreements include the possible lack of a liquid market, unfavorable market and interest rate movements of the underlying instrument and the failure of the counterparty to perform under the terms of the agreements. The fund’s maximum risk of loss from counterparty credit risk is the discounted net value of the cash flows to be received from/paid to the counterparty over the contract’s remaining life, to the extent that the amount is positive. To address counterparty risk, uncleared swap agreements are limited to only highly-rated counterparties. Risk is further reduced by having an ISDA Master Agreement between the fund and the counterparty providing for netting as described above and, where applicable, by the posting of collateral by the counterparty to the fund to cover the fund’s exposure to the counterparty under such ISDA Master Agreement. The fund’s counterparty risk due to cleared swaps is mitigated by the fact that the clearinghouse is the true counterparty to the transaction and the regulatory requirement safeguards in the event of a clearing broker bankruptcy.
The fund entered into credit default swap agreements in order to manage its exposure to the market or certain sectors of the market, to reduce its credit risk exposure to defaults of corporate and sovereign issuers or to create exposure to corporate or sovereign issuers to which it is not otherwise exposed. In a credit default swap agreement, the protection buyer can make an upfront payment and will make a stream of payments to the protection seller based on a fixed percentage applied to the agreement notional amount in exchange for the right to receive a specified return upon the occurrence of a defined credit event on the reference obligation (which may be either a single security or a basket of securities issued by corporate or sovereign issuers) and, with respect to the cases where physical settlement applies, the delivery by the buyer to the seller of a defined deliverable obligation. Although agreement-specific, credit events generally consist of a combination of the following: bankruptcy, failure to pay, restructuring, obligation acceleration, obligation default, or repudiation/moratorium, each as defined in the 2003 ISDA Credit Derivatives Definitions as amended by the relevant agreement. Restructuring is generally not applicable when the reference obligation is issued by a North American corporation and obligation acceleration, obligation default, or repudiation/moratorium are generally only applicable when the reference obligation is issued by a sovereign entity or an entity in an emerging country. Upon determination of the final price for the deliverable obligation (or upon delivery of the deliverable obligation in the case of physical settlement), the difference between the value of the deliverable obligation and the swap agreement’s notional amount is recorded as realized gain or loss on swap agreements in the Statement of Operations.
Credit default swap agreements are considered to have credit-risk-related contingent features since they trigger payment by the protection seller to the protection buyer upon the occurrence of a defined credit event. The maximum amount of future, undiscounted payments that the fund, as protection seller, could be required to make is equal to the swap agreement’s notional amount. The protection seller’s payment obligation would be offset to the extent of the value of the agreement’s deliverable obligation. At December 31, 2018, the fund did not hold any credit default swap agreements at an unrealized loss where it is the protection seller. The fund’s maximum risk of loss from counterparty risk, either as the protection seller or as the protection buyer, is the fair value of the agreement.
Security Loans – Under its Securities Lending Agency Agreement with the fund, State Street Bank and Trust Company, as lending agent, loans the securities of the fund to certain qualified institutions (the “Borrowers”) approved by the fund. Security loans can be terminated at the discretion of either the lending agent or the fund and the related securities must be returned within the earlier of the standard trade settlement period for such securities or within three business days. The loans are collateralized by cash and/or U.S. Treasury and federal agency obligations in an amount typically at least equal to the market value of the securities loaned. On loans collateralized by cash, the cash collateral is invested in a money market fund. The market value of the loaned securities is determined at the close of business of the fund and any additional required collateral is delivered to the fund on the next business day. The lending agent provides the fund with indemnification against Borrower default. In the event of Borrower default, the lending agent will, for the benefit of the fund, either purchase securities identical to those loaned or, when such purchase is commercially impracticable, pay the fund the market value of the loaned securities. In return, the lending agent assumes the fund’s rights to the related collateral. If the collateral value is less than the cost to purchase identical securities, the lending agent is responsible for the shortfall, but only to the extent that such shortfall is not due to a decline in collateral value resulting from collateral reinvestment for which the fund bears the risk of loss. A portion of the income generated upon investment of the collateral is remitted to the Borrowers, and the remainder is allocated between the fund and the lending agent. On loans collateralized by U.S. Treasury and/or federal agency obligations, a fee is received from the Borrower, and is allocated between the fund and the lending agent. Income from securities lending is separately reported in the Statement of Operations. The dividend and interest income earned on the securities loaned is accounted for in the same manner as other dividend and interest income. At December 31, 2018, there were no securities on loan or collateral outstanding.
Loans and Other Direct Debt Instruments – The fund invests in loans and loan participations or other receivables. These investments may include standby financing commitments, including revolving credit facilities, which contractually obligate the fund to supply additional cash to the borrower on demand. The fund generally provides this financial support in order to preserve its existing investment or to obtain a more senior secured interest in the assets of the borrower. Loan participations involve a risk of insolvency of the lending bank or other financial intermediary.
23
MFS Strategic Income Portfolio
Notes to Financial Statements – continued
Indemnifications – Under the fund’s organizational documents, its officers and Trustees may be indemnified against certain liabilities and expenses arising out of the performance of their duties to the fund. Additionally, in the normal course of business, the fund enters into agreements with service providers that may contain indemnification clauses. The fund’s maximum exposure under these agreements is unknown as this would involve future claims that may be made against the fund that have not yet occurred.
Investment Transactions and Income– Investment transactions are recorded on the trade date. Interest income is recorded on the accrual basis. All premium and discount is amortized or accreted for financial statement purposes in accordance with U.S. generally accepted accounting principles. Dividends received in cash are recorded on theex-dividend date. Certain dividends from foreign securities will be recorded when the fund is informed of the dividend if such information is obtained subsequent to theex-dividend date. Dividend and interest payments received in additional securities are recorded on theex-dividend orex-interest date in an amount equal to the value of the security on such date.
The fund may receive proceeds from litigation settlements. Any proceeds received from litigation involving portfolio holdings are reflected in the Statement of Operations in realized gain/loss if the security has been disposed of by the fund or in unrealized gain/loss if the security is still held by the fund. Any other proceeds from litigation not related to portfolio holdings are reflected as other income in the Statement of Operations.
Tax Matters and Distributions– The fund intends to qualify as a regulated investment company, as defined under Subchapter M of the Internal Revenue Code, and to distribute all of its taxable income, including realized capital gains. As a result, no provision for federal income tax is required. The fund’s federal tax returns, when filed, will remain subject to examination by the Internal Revenue Service for a three year period. Management has analyzed the fund’s tax positions taken on federal and state tax returns for all open tax years and does not believe that there are any uncertain tax positions that require recognition of a tax liability. Foreign taxes, if any, have been accrued by the fund in the accompanying financial statements in accordance with the applicable foreign tax law. Foreign income taxes may be withheld by certain countries in which the fund invests. Additionally, capital gains realized by the fund on securities issued in or by certain foreign countries may be subject to capital gains tax imposed by those countries.
Distributions to shareholders are recorded on theex-dividend date. Income and capital gain distributions are determined in accordance with income tax regulations, which may differ from U.S. generally accepted accounting principles. Certain capital accounts in the financial statements are periodically adjusted for permanent differences in order to reflect their tax character. These adjustments have no impact on net assets or net asset value per share. Temporary differences which arise from recognizing certain items of income, expense, gain or loss in different periods for financial statement and tax purposes will reverse at some time in the future. Distributions in excess of net investment income or net realized gains are temporary overdistributions for financial statement purposes resulting from differences in the recognition or classification of income or distributions for financial statement and tax purposes.
Book/tax differences primarily relate to defaulted bonds, amortization and accretion of debt securities, and derivative transactions.
The tax character of distributions declared to shareholders for the last two fiscal years is as follows:
| | | | | | | | |
| | | Year ended
12/31/18 | | | Year ended
12/31/17 | |
| Ordinary income (including any short-term capital gains) | | | $1,829,013 | | | | $2,356,097 | |
The federal tax cost and the tax basis components of distributable earnings were as follows:
| | | | |
| As of 12/31/18 | | | | |
| |
| Cost of investments | | | $45,108,126 | |
| Gross appreciation | | | 145,738 | |
| Gross depreciation | | | (2,923,239 | ) |
| Net unrealized appreciation (depreciation) | | | $(2,777,501 | ) |
| |
| Undistributed ordinary income | | | 1,557,309 | |
| Capital loss carryforwards | | | (881,148 | ) |
| Other temporary differences | | | 44,469 | |
As of December 31, 2018, the fund had capital loss carryforwards available to offset future realized gains. These net capital losses may be carried forward indefinitely and their character is retained as short-term and/or long-term losses. Such losses are characterized as follows:
| | | | |
| Short-Term | | | $(330,666 | ) |
| Long-Term | | | (550,482 | ) |
| Total | | | $(881,148 | ) |
24
MFS Strategic Income Portfolio
Notes to Financial Statements – continued
Multiple Classes of Shares of Beneficial Interest– The fund offers multiple classes of shares, which differ in their respective distribution and/or service fees. The fund’s income, realized and unrealized gain (loss), and common expenses are allocated to shareholders based on the daily net assets of each class. Dividends are declared separately for each class. Differences in per share dividend rates are generally due to differences in separate class expenses. The fund’s distributions declared to shareholders as reported in the Statements of Changes in Net Assets are presented by class as follows:
| | | | | | | | |
| | | From net investment
income | |
| | |
| | | Year ended
12/31/18 | | | Year ended
12/31/17 | |
| Initial Class | | | $1,585,207 | | | | $1,994,249 | |
| Service Class | | | 243,806 | | | | 361,848 | |
| Total | | | $1,829,013 | | | | $2,356,097 | |
| (3) | | Transactions with Affiliates |
Investment Adviser– The fund has an investment advisory agreement with MFS to provide overall investment management and related administrative services and facilities to the fund. The management fee is computed daily and paid monthly at the following annual rates based on the fund’s average daily net assets:
| | | | |
| Up to $1 billion | | | 0.70% | |
| In excess of $1 billion | | | 0.65% | |
MFS has agreed in writing to reduce its management fee by a specified amount if certain MFS mutual fund assets exceed thresholds agreed to by MFS and the fund’s Board of Trustees. For the year ended December 31, 2018, this management fee reduction amounted to $4,443, which is included in the reduction of total expenses in the Statement of Operations. The management fee incurred for the year ended December 31, 2018 was equivalent to an annual effective rate of 0.69% of the fund’s average daily net assets.
The investment adviser has agreed in writing to pay a portion of the fund’s total annual operating expenses, excluding interest, taxes, extraordinary expenses, brokerage and transaction costs, and investment-related expenses (such as fees and expenses associated with investments in investment companies and other similar investment vehicles), such that total annual operating expenses do not exceed 0.80% of average daily net assets for the Initial Class shares and 1.05% of average daily net assets for the Service Class shares. This written agreement will continue until modified by the fund’s Board of Trustees, but such agreement will continue at least until April 30, 2020. For the year ended December 31, 2018, this reduction amounted to $104,056, which is included in the reduction of total expenses in the Statement of Operations.
Distributor– MFS Fund Distributors, Inc. (MFD), a wholly-owned subsidiary of MFS, is the distributor of shares of the fund. The Trustees have adopted a distribution plan for the Service Class shares pursuant to Rule12b-1 under the Investment Company Act of 1940.
The fund’s distribution plan provides that the fund will pay MFD distribution and/or service fees equal to 0.25% per annum of its average daily net assets attributable to Service Class shares as partial consideration for services performed and expenses incurred by MFD and financial intermediaries (including participating insurance companies that invest in the fund to fund variable annuity and variable life insurance contracts, sponsors of qualified retirement and pension plans that invest in the fund, and affiliates of these participating insurance companies and plan sponsors) in connection with the sale and distribution of the Service Class shares. MFD may subsequently pay all, or a portion, of the distribution and/or service fees to financial intermediaries.
Shareholder Servicing Agent– MFS Service Center, Inc. (MFSC), a wholly-owned subsidiary of MFS, receives a fee from the fund for its services as shareholder servicing agent. For the year ended December 31, 2018, the fee was $10,896, which equated to 0.0234% annually of the fund’s average daily net assets. MFSC also receives payment from the fund forout-of-pocket expenses paid by MFSC on behalf of the fund. For the year ended December 31, 2018, these costs amounted to $608.
Administrator– MFS provides certain financial, legal, shareholder communications, compliance, and other administrative services to the fund. Under an administrative services agreement, the fund reimburses MFS the costs incurred to provide these services. The fund is charged an annual fixed amount of $17,500 plus a fee based on average daily net assets. The administrative services fee incurred for the year ended December 31, 2018 was equivalent to an annual effective rate of 0.0375% of the fund’s average daily net assets.
Trustees’ and Officers’ Compensation– The fund pays compensation to independent Trustees in the form of a retainer, attendance fees, and additional compensation to Board and Committee chairpersons. The fund does not pay compensation directly to Trustees or officers of the fund who are also officers of the investment adviser, all of whom receive remuneration for their services to the fund from MFS. Certain officers and Trustees of the fund are officers or directors of MFS, MFD, and MFSC.
25
MFS Strategic Income Portfolio
Notes to Financial Statements – continued
Other– This fund and certain other funds managed by MFS (the funds) have entered into a service agreement (the ISO Agreement) which provides for payment of fees solely by the funds to Tarantino LLC in return for the provision of services of an Independent Senior Officer (ISO) for the funds. Frank L. Tarantino serves as the ISO and is an officer of the funds and the sole member of Tarantino LLC. The funds can terminate the ISO Agreement with Tarantino LLC at any time under the terms of the ISO Agreement. For the year ended December 31, 2018, the fee paid by the fund under this agreement was $80 and is included in “Miscellaneous” expense in the Statement of Operations. MFS has agreed to bear all expenses associated with office space, other administrative support, and supplies provided to the ISO.
The fund invests in the MFS Institutional Money Market Portfolio which is managed by MFS and seeks current income consistent with preservation of capital and liquidity. This money market fund does not pay a management fee to MFS.
The fund invests in the High Yield Pooled Portfolio, which is a mutual fund advised by MFS that does not pay management fees to MFS but does incur investment and operating costs. The fund invests in the High Yield Pooled Portfolio to gain exposure to high income debt instruments, rather than investing in high income debt instruments directly. The High Yield Pooled Portfolio does not pay a management fee to MFS or distribution and/or service fee to MFD.
For the year ended December 31, 2018, purchases and sales of investments, other than purchased option transactions andshort-term obligations, were as follows:
| | | | | | | | |
| | | Purchases | | | Sales | |
| U.S. Government securities | | | $5,140,932 | | | | $7,686,975 | |
| Non-U.S. Government securities | | | $21,673,782 | | | | $24,055,730 | |
| (5) | | Shares of Beneficial Interest |
The fund’s Declaration of Trust permits the Trustees to issue an unlimited number of full and fractional shares of beneficial interest. Transactions in fund shares were as follows:
| | | | | | | | | | | | | | | | |
| | | Year ended 12/31/18 | | | Year ended 12/31/17 | |
| | | | |
| | | Shares | | | Amount | | | Shares | | | Amount | |
| Shares sold | | | | | | | | | | | | | | | | |
Initial Class | | | 273,324 | | | | $2,588,388 | | | | 288,818 | | | | $2,862,544 | |
Service Class | �� | | 93,876 | | | | 876,047 | | | | 92,548 | | | | 906,325 | |
| | | 367,200 | | | | $3,464,435 | | | | 381,366 | | | | $3,768,869 | |
| | | | |
| Shares issued to shareholders in reinvestment of distributions | | | | | | | | | | | | | | | | |
Initial Class | | | 170,087 | | | | $1,585,207 | | | | 204,329 | | | | $1,994,249 | |
Service Class | | | 26,357 | | | | 243,806 | | | | 37,342 | | | | 361,848 | |
| | | 196,444 | | | | $1,829,013 | | | | 241,671 | | | | $2,356,097 | |
| | | | |
| Shares reacquired | | | | | | | | | | | | | | | | |
Initial Class | | | (639,667 | ) | | | $(6,059,623 | ) | | | (730,440 | ) | | | $(7,253,077 | ) |
Service Class | | | (147,390 | ) | | | (1,394,196 | ) | | | (293,752 | ) | | | (2,883,817 | ) |
| | | (787,057 | ) | | | $(7,453,819 | ) | | | (1,024,192 | ) | | | $(10,136,894 | ) |
| | | | |
| Net change | | | | | | | | | | | | | | | | |
Initial Class | | | (196,256 | ) | | | $(1,886,028 | ) | | | (237,293 | ) | | | $(2,396,284 | ) |
Service Class | | | (27,157 | ) | | | (274,343 | ) | | | (163,862 | ) | | | (1,615,644 | ) |
| | | (223,413 | ) | | | $(2,160,371 | ) | | | (401,155 | ) | | | $(4,011,928 | ) |
The fund and certain other funds managed by MFS participate in a $1.25 billion unsecured committed line of credit, subject to a $1 billion sublimit, provided by a syndication of banks under a credit agreement. Borrowings may be made for temporary financing needs. Interest is charged to each fund, based on its borrowings, generally at a rate equal to the higher of the Overnight Bank Funding rate or daily one month LIBOR plus an agreed upon spread. A commitment fee, based on the average daily, unused portion of the committed line of credit, is allocated among the participating funds. In addition, the fund and other funds managed by MFS have established unsecured uncommitted borrowing arrangements with certain banks for temporary financing needs. Interest is charged to each fund, based on its borrowings, at a rate equal to the Overnight Bank Funding rate plus an agreed upon spread. For the year ended December 31, 2018, the fund’s commitment fee and interest expense were $268 and $0, respectively, and are included in “Miscellaneous” expense in the Statement of Operations.
26
MFS Strategic Income Portfolio
Notes to Financial Statements – continued
| (7) | | Investments in Affiliated Issuers |
An affiliated issuer may be considered one in which the fund owns 5% or more of the outstanding voting securities, or a company which is under common control. For the purposes of this report, the fund assumes the following to be affiliated issuers:
| | | | | | | | | | | | | | | | | | | | |
| Affiliated Issuers | | | | | Beginning
Shares/Par
Amount | | | Acquisitions
Shares/Par
Amount | | | Dispositions
Shares/Par
Amount | | | Ending
Shares/Par
Amount | |
| | | | | |
| MFS High Yield Pooled Portfolio | | | | | | | 1,144,373 | | | | 111,173 | | | | (530,159 | ) | | | 725,387 | |
| | | | | |
| MFS Institutional Money Market Portfolio | | | | | | | 1,509,122 | | | | 19,948,296 | | | | (20,001,772 | ) | | | 1,455,646 | |
| | | | | |
| Affiliated Issuers | | Realized
Gain (Loss) | | | Change in
Unrealized
Appreciation/
Depreciation | | | Capital Gain
Distributions | | | Dividend
Income | | | Ending
Value | |
| | | | | |
| MFS High Yield Pooled Portfolio | | | $(410,613 | ) | | | $(305,809 | ) | | | $— | | | | $528,647 | | | | $6,231,072 | |
| | | | | |
| MFS Institutional Money Market Portfolio | | | (574 | ) | | | 18 | | | | — | | | | 13,847 | | | | 1,455,501 | |
| | | | | |
| | | $(411,187 | ) | | | $(305,791 | ) | | | $— | | | | $542,494 | | | | $7,686,573 | |
In May 2015, the Motors Liquidation Company Avoidance Action Trust (hereafter, “AAT”) served upon the fund a complaint in an adversary proceeding in the U.S. Bankruptcy Court for the Southern District of New York, captionedMotors Liquidation Company Avoidance Action Trust v. JPMorgan Chase Bank, N.A., et al. (No.09-00504 (REG)). The complaint, which was originally filed in 2009 but not served on the fund until 2015, names as defendants over 500 entities (including the fund) that held an interest in a $1.5 billion General Motors (GM) term loan in 2009, when GM filed for bankruptcy. The AAT alleges that the fund and the other term loan lenders were improperly treated as secured lenders with respect to the term loan shortly before and immediately after GM’s bankruptcy, receiving full principal and interest payments under the loan. The AAT alleges that the fund and other term loan lenders should have been treated as unsecured (or partially unsecured) creditors because the main lien securing the collateral was allegedly not perfected at the time of GM’s bankruptcy due to an erroneous filing in October 2008 that terminated the financing statement perfecting the lien. The AAT seeks to claw back payments made to the fund and the other term loan lenders after, and during the 90 days before, GM’s June 2009 bankruptcy petition. During that time period, the fund received term loan payments of approximately $190,000. The fund cannot predict the outcome of this proceeding. Among other things, it is unclear whether the AAT’s claims will succeed; what the fund would be entitled to as an unsecured (or partially unsecured) creditor, given the existence of other collateral not impacted by the erroneous October 2008 filing; whether third parties responsible for the erroneous October 2008 filing would bear some or all of any liability; and the degree to which the fund may be entitled to indemnification from a third party for any amount required to be disgorged. The fund has and will continue to incur legal expenses associated with the defense of this action and in related claims against third parties.
27
MFS Strategic Income Portfolio
REPORT OF INDEPENDENT REGISTERED PUBLIC ACCOUNTING FIRM
To the Board of Trustees of MFS Variable Insurance Trust II and the Shareholders of MFS Strategic Income Portfolio:
Opinion on the Financial Statements and Financial Highlights
We have audited the accompanying statement of assets and liabilities of MFS Strategic Income Portfolio (the “Fund”), including the portfolio of investments, as of December 31, 2018, the related statement of operations for the year then ended, the statements of changes in net assets for each of the two years in the period then ended, the financial highlights for each of the five years in the period then ended, and the related notes. In our opinion, the financial statements and financial highlights present fairly, in all material respects, the financial position of the Fund as of December 31, 2018, and the results of its operations for the year then ended, the changes in its net assets for each of the two years in the period then ended, and the financial highlights for each of the five years in the period then ended, in conformity with accounting principles generally accepted in the United States of America.
Basis for Opinion
These financial statements and financial highlights are the responsibility of the Fund’s management. Our responsibility is to express an opinion on the Fund’s financial statements and financial highlights based on our audits. We are a public accounting firm registered with the Public Company Accounting Oversight Board (United States) (PCAOB) and are required to be independent with respect to the Fund in accordance with the U.S. federal securities laws and the applicable rules and regulations of the Securities and Exchange Commission and the PCAOB.
We conducted our audits in accordance with the standards of the PCAOB. Those standards require that we plan and perform the audit to obtain reasonable assurance about whether the financial statements and financial highlights are free of material misstatement, whether due to error or fraud. The Fund is not required to have, nor were we engaged to perform, an audit of its internal control over financial reporting. As part of our audits we are required to obtain an understanding of internal control over financial reporting but not for the purpose of expressing an opinion on the effectiveness of the Fund’s internal control over financial reporting. Accordingly, we express no such opinion.
Our audits included performing procedures to assess the risks of material misstatement of the financial statements and financial highlights, whether due to error or fraud, and performing procedures that respond to those risks. Such procedures included examining, on a test basis, evidence regarding the amounts and disclosures in the financial statements and financial highlights. Our audits also included evaluating the accounting principles used and significant estimates made by management, as well as evaluating the overall presentation of the financial statements and financial highlights. Our procedures included confirmation of securities owned as of December 31, 2018, by correspondence with the custodian and brokers; when replies were not received from brokers, we performed other auditing procedures. We believe that our audits provide a reasonable basis for our opinion.
DELOITTE & TOUCHE LLP
Boston, Massachusetts
February 15, 2019
We have served as the auditor of one or more of the MFS investment companies since 1924.
28
MFS Strategic Income Portfolio
TRUSTEES AND OFFICERS – IDENTIFICATION AND BACKGROUND
The Trustees and Officers of the Trust, as of February 1, 2019, are listed below, together with their principal occupations during the past five years. (Their titles may have varied during that period.) The address of each Trustee and Officer is 111 Huntington Avenue, Boston, Massachusetts 02199-7618.
| | | | | | | | | | |
Name, Age | | Position(s)
Held with Fund | | Trustee/Officer
Since (h) | | Number of MFS Funds overseen by the Trustee | | Principal Occupations
During the Past Five Years | | Other Directorships During the Past Five Years (j) |
| INTERESTED TRUSTEES |
Robert J. Manning (k) (age 55) | | Trustee | | February 2004 | | 135 | | Massachusetts Financial Services Company, Executive Chairman (since January 2017); Director; Chairman of the Board; Chief Executive Officer (until 2015);Co-Chief Executive Officer(2015-2016) | | N/A |
| | | | | |
Robin A. Stelmach (k) (age 57) | | Trustee | | January 2014 | | 135 | | Massachusetts Financial Services Company, Vice Chair (since January 2017); Chief Operating Officer and Executive Vice President (until January 2017) | | N/A |
|
| INDEPENDENT TRUSTEES |
John P. Kavanaugh (age 64) | | Trustee and Chair of Trustees | | January 2009 | | 135 | | Private investor | | N/A |
| | | | | |
Steven E. Buller (age 67) | | Trustee | | February 2014 | | 135 | | Financial Accounting Standards Advisory Council, Chairman(2014-2015); Public Company Accounting Oversight Board, Standing Advisory Group, Member (until 2014); BlackRock, Inc. (investment management), Managing Director (until 2014), BlackRock Finco UK (investment management), Director (until 2014) | | N/A |
| | | | | |
John A. Caroselli (age 64) | | Trustee | | March 2017 | | 135 | | JC Global Advisors, LLC (management consulting), President (since 2015); First Capital Corporation (commercial finance), Executive Vice President (until 2015) | | N/A |
| | | | | |
Maureen R. Goldfarb (age 63) | | Trustee | | January 2009 | | 135 | | Private investor | | N/A |
| | | | | |
Michael Hegarty (age 74) | | Trustee | | December 2004 | | 135 | | Private investor | | Rouse Properties Inc., Director (until 2016); Capmark Financial Group Inc., Director (until 2015) |
| | | | | |
Peter D. Jones (age 63) | | Trustee | | January 2019 | | 135 | | Franklin Templeton Distributors, Inc. (investment management), President (until 2015); Franklin Templeton Institutional, LLC (investment management), Chairman (until 2015) | | N/A |
| | | | | |
James W. Kilman, Jr. (age 57) | | Trustee | | January 2019 | | 135 | | KielStrand Capital LLC (family office and merchant bank), Chief Executive Officer (since 2016); Morgan Stanley & Co. (financial services), Vice Chairman of Investment Banking,Co-Head of Diversified Financials Coverage – Financial Institutions Investment Banking Group (until 2016) | | alpha-En Corporation, Director (since 2016) |
29
MFS Strategic Income Portfolio
Trustees and Officers – continued
| | | | | | | | | | |
Name, Age | | Position(s)
Held with Fund | | Trustee/Officer
Since (h) | | Number of MFS Funds overseen by the Trustee | | Principal Occupations
During the Past Five Years | | Other Directorships During the Past Five Years (j) |
Clarence Otis, Jr. (age 62) | | Trustee | | March 2017 | | 135 | | Darden Restaurants, Inc., Chief Executive Officer (until 2014) | | VF Corporation, Director; Verizon Communications, Inc., Director; The Travelers Companies, Director; Federal Reserve Bank of Atlanta, Director (until 2015) |
| | | | | |
Maryanne L. Roepke (age 62) | | Trustee | | May 2014 | | 135 | | American Century Investments (investment management), Senior Vice President and Chief Compliance Officer (until 2014) | | N/A |
| | | | | |
Laurie J. Thomsen
(age 61) | | Trustee | | March 2005 | | 135 | | Private investor | | The Travelers Companies, Director; Dycom Industries, Inc., Director (since 2015) |
| | | | | | | | |
Name, Age | | Position(s)
Held with Fund | | Trustee/Officer
Since (h) | | Number of MFS Funds for which the Person is an Officer | | Principal Occupations During the Past Five Years |
| OFFICERS | | | | | | |
Christopher R. Bohane (k)
(age 45) | | Assistant Secretary and Assistant Clerk | | July 2005 | | 135 | | Massachusetts Financial Services Company, Vice President and Assistant General Counsel |
| | | | |
Kino Clark (k) (age 50) | | Assistant Treasurer | | January 2012 | | 135 | | Massachusetts Financial Services Company, Vice President |
| | | | |
John W. Clark, Jr. (k) (age 51) | | Assistant Treasurer | | April 2017 | | 135 | | Massachusetts Financial Services Company, Vice President (since March 2017); Deutsche Bank (financial services), Department Head – Treasurer’s Office (until February 2017) |
| | | | |
Thomas H. Connors (k) (age 59) | | Assistant Secretary and Assistant Clerk | | September 2012 | | 135 | | Massachusetts Financial Services Company, Vice President and Senior Counsel |
| | | | |
Ethan D. Corey (k)
(age 55) | | Assistant
Secretary and Assistant Clerk | | July 2005 | | 135 | | Massachusetts Financial Services Company, Senior Vice President and Associate General Counsel |
| | | | |
David L. DiLorenzo (k)
(age 50) | | President | | July 2005 | | 135 | | Massachusetts Financial Services Company, Senior Vice President |
| | | | |
Heidi W. Hardin (k) (age 51) | | Secretary and Clerk | | April 2017 | | 135 | | Massachusetts Financial Services Company, Executive Vice President and General Counsel (since March 2017); Harris Associates (investment management), General Counsel (from September 2015 to January 2017); Janus Capital Management LLC (investment management), Senior Vice President and General Counsel (until September 2015) |
| | | | |
Brian E. Langenfeld (k) (age 45) | | Assistant
Secretary and Assistant Clerk | | June 2006 | | 135 | | Massachusetts Financial Services Company, Vice President and Senior Counsel |
| | | | |
Amanda S. Mooradian (k) (age 39) | | Assistant
Secretary and Assistant Clerk | | September 2018 | | 135 | | Massachusetts Financial Services Company, Assistant Vice President and Counsel |
| | | | |
Susan A. Pereira (k)
(age 48) | | Assistant
Secretary and Assistant Clerk | | July 2005 | | 135 | | Massachusetts Financial Services Company, Vice President and Senior Counsel |
| | | | |
Kasey L. Phillips (k) (age 48) | | Assistant Treasurer | | September 2012 | | 135 | | Massachusetts Financial Services Company, Vice President |
| | | | |
Matthew A. Stowe (k) (age 44) | | Assistant Secretary and Assistant Clerk | | October 2014 | | 135 | | Massachusetts Financial Services Company, Vice President and Assistant General Counsel |
30
MFS Strategic Income Portfolio
Trustees and Officers – continued
| | | | | | | | |
Name, Age | | Position(s)
Held with Fund | | Trustee/Officer
Since (h) | | Number of MFS Funds for which the Person is an Officer | | Principal Occupations During the Past Five Years |
Frank L. Tarantino
(age 74) | | Independent
Senior Officer | | June 2004 | | 135 | | Tarantino LLC (provider of compliance services), Principal |
| | | | |
Richard S. Weitzel (k)
(age 48) | | Assistant Secretary and Assistant Clerk | | October 2007 | | 135 | | Massachusetts Financial Services Company, Senior Vice President and Associate General Counsel |
| | | | |
Martin J. Wolin (k) (age 51) | | Chief Compliance Officer | | July 2015 | | 135 | | Massachusetts Financial Services Company, Senior Vice President and Chief Compliance Officer (since July 2015); Mercer (financial service provider), Chief Risk and Compliance Officer, North America and Latin America (until June 2015) |
| | | | |
James O. Yost (k)
(age 58) | | Treasurer | | September 1990 | | 135 | | Massachusetts Financial Services Company, Senior Vice President |
| (h) | Date first appointed to serve as Trustee/officer of an MFS Fund. Each Trustee has served continuously since appointment unless indicated otherwise. For the period from December 15, 2004 until February 22, 2005, Mr. Manning served as Advisory Trustee. From January 2012 through December 2016, Messrs. DiLorenzo and Yost served as Treasurer and Deputy Treasurer of the Funds, respectively. |
| (j) | Directorships or trusteeships of companies required to report to the Securities and Exchange Commission (i.e., “public companies”). |
| (k) | “Interested person” of the Trust within the meaning of the Investment Company Act of 1940 (referred to as the 1940 Act), which is the principal federal law governing investment companies like the fund, as a result of a position with MFS. The address of MFS is 111 Huntington Avenue, Boston, Massachusetts 02199-7618. |
Each Trustee has been elected by shareholders and each Trustee and officer holds office until his or her successor is chosen and qualified or until his or her earlier death, resignation, retirement or removal. The Trust does not hold annual meetings for the purpose of electing Trustees, and Trustees are not elected for fixed terms. Under the terms of the Board’s retirement policy, an Independent Trustee shall retire at the end of the calendar year in which he or she reaches the earlier of 75 years of age or 15 years of service on the Board (or, in the case of any Independent Trustee who joined the Board prior to 2015, 20 years of service on the Board).
Messrs. Buller, Hegarty, Kilman and Otis and Ms. Roepke are members of the Trust’s Audit Committee.
Each of the Interested Trustees and certain Officers hold comparable officer positions with certain affiliates of MFS.
The Statement of Additional Information for a Fund includes further information about the Trustees and is available without charge upon request by calling1-800-225-2606.
| | |
Investment Adviser Massachusetts Financial Services Company 111 Huntington Avenue Boston, MA 02199-7618 | | Custodian State Street Bank and Trust Company 1 Lincoln Street Boston, MA 02111-2900 |
Distributor MFS Fund Distributors, Inc. 111 Huntington Avenue Boston, MA 02199-7618 | | Independent Registered Public Accounting Firm Deloitte & Touche LLP 200 Berkeley Street Boston, MA 02116 |
Portfolio Manager(s) Neeraj Arora Philipp Burgener David Cole Alexander Mackey Joshua Marston Robert Persons Michael Skatrud | | |
31
MFS Strategic Income Portfolio
BOARD REVIEW OF INVESTMENT ADVISORY AGREEMENT
The Investment Company Act of 1940 requires that both the full Board of Trustees and a majority of thenon-interested (“independent”) Trustees, voting separately, annually approve the continuation of the Fund’s investment advisory agreement with MFS. The Trustees consider matters bearing on the Fund and its advisory arrangements at their meetings throughout the year, including a review of performance data at each regular meeting. In addition, the independent Trustees met several times over the course of three months beginning in May and ending in July, 2018 (“contract review meetings”) for the specific purpose of considering whether to approve the continuation of the investment advisory agreement for the Fund and the other investment companies that the Board oversees (the “MFS Funds”). The independent Trustees were assisted in their evaluation of the Fund’s investment advisory agreement by independent legal counsel, from whom they received separate legal advice and with whom they met separately from MFS during various contract review meetings. The independent Trustees were also assisted in this process by the MFS Funds’ Independent Senior Officer, a senior officer appointed by and reporting to the independent Trustees.
In connection with their deliberations regarding the continuation of the investment advisory agreement, the Trustees, including the independent Trustees, considered such information and factors as they believed, in light of the legal advice furnished to them and their own business judgment, to be relevant. The investment advisory agreement for the Fund was considered separately, although the Trustees also took into account the common interests of all MFS Funds in their review. As described below, the Trustees considered the nature, quality, and extent of the various investment advisory, administrative, and shareholder services performed by MFS under the existing investment advisory agreement and other arrangements with the Fund.
In connection with their contract review meetings, the Trustees received and relied upon materials that included, among other items: (i) information provided by Broadridge Financial Solutions, Inc. (“Broadridge”), an independent third party, on the investment performance of the Fund for various time periods ended December 31, 2017 and the investment performance of a group of funds with substantially similar investment classifications/objectives (the “Broadridge performance universe”), (ii) information provided by Broadridge on the Fund’s advisory fees and other expenses and the advisory fees and other expenses of comparable funds identified by Broadridge (the “Broadridge expense group”), (iii) information provided by MFS on the advisory fees of portfolios of other clients of MFS, including institutional separate accounts and other clients, (iv) information as to whether and to what extent applicable expense waivers, reimbursements or fee “breakpoints” are observed for the Fund, (v) information regarding MFS’ financial results and financial condition, including MFS’ and certain of its affiliates’ estimated profitability from services performed for the Fund and the MFS Funds as a whole, and compared to MFS’ institutional business, (vi) MFS’ views regarding the outlook for the mutual fund industry and the strategic business plans of MFS, (vii) descriptions of various functions performed by MFS for the Funds, such as compliance monitoring and portfolio trading practices, and (viii) information regarding the overall organization of MFS, including information about MFS’ senior management and other personnel providing investment advisory, administrative and other services to the Fund and the other MFS Funds. The comparative performance, fee and expense information prepared and provided by Broadridge was not independently verified and the independent Trustees did not independently verify any information provided to them by MFS.
The Trustees’ conclusion as to the continuation of the investment advisory agreement was based on a comprehensive consideration of all information provided to the Trustees and not the result of any single factor. Some of the factors that figured particularly in the Trustees’ deliberations are described below, although individual Trustees may have evaluated the information presented differently from one another, giving different weights to various factors. It is also important to recognize that the fee arrangements for the Fund and other MFS Funds are the result of years of review and discussion between the independent Trustees and MFS, that certain aspects of such arrangements may receive greater scrutiny in some years than in others, and that the Trustees’ conclusions may be based, in part, on their consideration of these same arrangements during the course of the year and in prior years.
Based on information provided by Broadridge and MFS, the Trustees reviewed the Fund’s total return investment performance as well as the Broadridge performance universe over various time periods. The Trustees placed particular emphasis on the total return performance of the Fund’s Initial Class shares in comparison to the performance of funds in its Broadridge performance universe over the three-year period ended December 31, 2017, which the Trustees believed was a long enough period to reflect differing market conditions. The total return performance of the Fund’s Initial Class shares was in the 2nd quintile relative to the other funds in the universe for this three-year period (the 1st quintile being the best performers and the 5th quintile being the worst performers). The total return performance of the Fund’s Initial Class shares was in the 3rd quintile for theone-year period and the 2nd quintile for the five-year period ended December 31, 2017 relative to the Broadridge performance universe. Because of the passage of time, these performance results may differ from the performance results for more recent periods, including those shown elsewhere in this report.
In the course of their deliberations, the Trustees took into account information provided by MFS in connection with the contract review meetings, as well as during investment review meetings conducted with portfolio management personnel during the course of the year regarding the Fund’s performance. After reviewing these and related factors, the Trustees concluded, within the context of their overall conclusions regarding the investment advisory agreement, that they were satisfied with MFS’ responses and efforts relating to investment performance.
32
MFS Strategic Income Portfolio
Board Review of Investment Advisory Agreement – continued
In assessing the reasonableness of the Fund’s advisory fee, the Trustees considered, among other information, the Fund’s advisory fee and the total expense ratio of the Fund’s Initial Class shares as a percentage of average daily net assets and the advisory fee and total expense ratios of peer groups of funds based on information provided by Broadridge. The Trustees considered that MFS currently observes an expense limitation for the Fund, which may not be changed without the Trustees’ approval. The Trustees also considered that, according to the data provided by Broadridge (which takes into account any fee reductions or expense limitations that were in effect during the Fund’s last fiscal year), the Fund’s effective advisory fee rate was approximately at the Broadridge expense group median and the Fund’s total expense ratio was higher than the Broadridge expense group median.
The Trustees also considered the advisory fees charged by MFS to any institutional separate accounts advised by MFS (“separate accounts”) and unaffiliated investment companies for which MFS serves as subadviser (“subadvised funds”) that have comparable investment strategies to the Fund, if any. In comparing these fees, the Trustees considered information provided by MFS as to the generally broader scope of services provided by MFS to the Fund, as well as the more extensive regulatory burdens imposed on MFS in managing the Fund, in comparison to separate accounts and subadvised funds. The Trustees also considered the higher demands placed on MFS’ investment personnel and trading infrastructure as a result of the daily cashin-flows andout-flows of the Fund in comparison to separate accounts.
The Trustees also considered whether the Fund may benefit from any economies of scale in the management of the Fund in the event of growth in assets of the Fund and/or growth in assets of the MFS Funds as a whole. They noted that the Fund’s advisory fee rate schedule is subject to a contractual breakpoint that reduces the Fund’s advisory fee rate on average daily net assets over $1 billion. The Trustees also noted that MFS has agreed in writing to waive a portion of the management fees of certain MFS Funds, including the Fund, if the total combined assets of certain funds within the MFS Funds’ complex increase above agreed upon thresholds (the “group fee waiver”), enabling the Fund’s shareholders to share in the benefits from any economies of scale at the complex level. The group fee waiver is reviewed and renewed annually between the Board and MFS. The Trustees concluded that the breakpoint and the group fee waiver were sufficient to allow the Fund to benefit from economies of scale as its assets and overall complex assets grow.
The Trustees also considered information prepared by MFS relating to MFS’ costs and profits with respect to the Fund, the MFS Funds considered as a group, and other investment companies and accounts advised by MFS, as well as MFS’ methodologies used to determine and allocate its costs to the MFS Funds, the Fund and other accounts and products for purposes of estimating profitability.
After reviewing these and other factors described herein, the Trustees concluded, within the context of their overall conclusions regarding the investment advisory agreement, that the advisory fees charged to the Fund represent reasonable compensation in light of the services being provided by MFS to the Fund.
In addition, the Trustees considered MFS’ resources and related efforts to continue to retain, attract and motivate capable personnel to serve the Fund. The Trustees also considered current and developing conditions in the financial services industry, including the presence of large and well-capitalized companies which are spending, and appear to be prepared to continue to spend, substantial sums to engage personnel and to provide services to competing investment companies. In this regard, the Trustees also considered the financial resources of MFS and its ultimate parent, Sun Life Financial Inc. The Trustees also considered the advantages and possible disadvantages to the Fund of having an adviser that also serves other investment companies as well as other accounts.
The Trustees also considered the nature, quality, cost, and extent of administrative, transfer agency, and distribution services provided to the Fund by MFS and its affiliates under agreements and plans other than the investment advisory agreement, including any12b-1 fees the Fund pays to MFS Fund Distributors, Inc., an affiliate of MFS. The Trustees also considered the nature, extent and quality of certain other services MFS performs or arranges for on the Fund’s behalf, which may include securities lending programs, directed expense payment programs, class action recovery programs, and MFS’ interaction with third-party service providers, principally custodians andsub-custodians. The Trustees concluded that the variousnon-advisory services provided by MFS and its affiliates on behalf of the Fund were satisfactory.
The Trustees consideredso-called“fall-out benefits” to MFS such as reputational value derived from serving as investment manager to the MFS Funds. The Trustees also considered that, effective January 3, 2018, MFS had discontinued its historic practice of obtaining investment research from portfolio brokerage commissions paid by certain MFS Funds and would thereafter voluntarily reimburse a Fund, if applicable, for the costs of external research acquired through the use of the Fund’s portfolio brokerage commissions.
Based on their evaluation of factors that they deemed to be material, including those factors described above, the Board of Trustees, including the independent Trustees, concluded that the Fund’s investment advisory agreement with MFS should be continued for an additionalone-year period, commencing August 1, 2018.
33
MFS Strategic Income Portfolio
PROXY VOTING POLICIES AND INFORMATION
MFS votes proxies on behalf of the fund pursuant to proxy voting policies and procedures that are available without charge, upon request, by calling 1-800-225-2606, by visitingmfs.com/proxyvoting, or by visiting the SEC’s Web site athttp://www.sec.gov.
Information regarding how the fund voted proxies relating to portfolio securities during the most recent twelve-month period ended June 30 is available by August 31 of each year without charge by visitingmfs.com/proxyvoting, or by visiting the SEC’s Web site athttp://www.sec.gov.
QUARTERLY PORTFOLIO DISCLOSURE
The fund files a complete schedule of portfolio holdings with the SEC for the first and third quarters of each fiscal year on Form N-Q. The fund’s Form N-Q is available on the SEC’s website athttp://www.sec.gov.A shareholder can obtain the portfolio holdings report for the first and third quarters of the fund’s fiscal year atmfs.com/vit2 by choosing the fund’s name and then selecting the “Resources” tab and clicking on “Prospectus and Reports”.
FURTHER INFORMATION
From time to time, MFS may post important information about the fund or the MFS funds on the MFS web site (mfs.com). This information is available athttps://www.mfs.com/en-us/what-we-do/announcements.htmlor atmfs.com/vit2 by choosing the fund’s name.
INFORMATION ABOUT FUND CONTRACTS AND LEGAL CLAIMS
The fund has entered into contractual arrangements with an investment adviser, administrator, distributor, shareholder servicing agent, 529 program manager (if applicable), and custodian who each provide services to the fund. Unless expressly stated otherwise, shareholders are not parties to, or intended beneficiaries of these contractual arrangements, and these contractual arrangements are not intended to create any shareholder right to enforce them against the service providers or to seek any remedy under them against the service providers, either directly or on behalf of the fund.
Under the Trust’s By-Laws and Declaration of Trust, any claims asserted against or on behalf of the MFS Funds, including claims against Trustees and Officers, must be brought in state and federal courts located within the Commonwealth of Massachusetts.
34
rev. 3/16
| | | | |
| | | |
| FACTS | | WHAT DOES MFS DO WITH YOUR
PERSONAL INFORMATION? | |  |
| | |
| Why? | | Financial companies choose how they share your personal information. Federal law gives consumers the right to limit some but not all sharing. Federal law also requires us to tell you how we collect, share, and protect your personal information. Please read this notice carefully to understand what we do. |
| | |
| What? | | The types of personal information we collect and share depend on the product or service you have with us. This information can include: • Social Security number and account balances • Account transactions and transaction history • Checking account information and wire transfer instructions When you areno longer our customer, we continue to share your information as described in this notice. |
| | |
| How? | | All financial companies need to share customers’ personal information to run their everyday business. In the section below, we list the reasons financial companies can share their customers’ personal information; the reasons MFS chooses to share; and whether you can limit this sharing. |
| | | | |
Reasons we can share your
personal information | | Does MFS share? | | Can you limit this
sharing? |
For our everyday business purposes – such as to process your transactions, maintain your account(s), respond to court orders and legal investigations, or report to credit bureaus | | Yes | | No |
For our marketing purposes – to offer our products and services to you | | No | | We don’t share |
| For joint marketing with other financial companies | | No | | We don’t share |
For our affiliates’ everyday business purposes – information about your transactions and experiences | | No | | We don’t share |
For our affiliates’ everyday business purposes – information about your creditworthiness | | No | | We don’t share |
| For nonaffiliates to market to you | | No | | We don’t share |
| | |
| | |
| Questions? | | Call800-225-2606 or go tomfs.com. |
35
| | |
| Who we are |
| Who is providing this notice? | | MFS Funds, MFS Investment Management, MFS Institutional Advisors, Inc., and MFS Heritage Trust Company. |
| | |
| What we do |
| How does MFS protect my personal information? | | To protect your personal information from unauthorized access and use, we use security measures that comply with federal law. These measures include procedural, electronic, and physical safeguards for the protection of the personal information we collect about you. |
How does MFS
collect my personal information? | | We collect your personal information, for example, when you • open an account or provide account information • direct us to buy securities or direct us to sell your securities • make a wire transfer We also collect your personal information from others, such as credit bureaus, affiliates, or other companies. |
| Why can’t I limit all sharing? | | Federal law gives you the right to limit only • sharing for affiliates’ everyday business purposes – information about your creditworthiness • affiliates from using your information to market to you • sharing for nonaffiliates to market to you State laws and individual companies may give you additional rights to limit sharing. |
| | |
| Definitions |
| Affiliates | | Companies related by common ownership or control. They can be financial and nonfinancial companies. • MFS does not share personal information with affiliates, except for everyday business purposes as described on page one of this notice. |
| Nonaffiliates | | Companies not related by common ownership or control. They can be financial and nonfinancial companies. • MFS does not share with nonaffiliates so they can market to you. |
| Joint marketing | | A formal agreement between nonaffiliated financial companies that together market financial products or services to you. • MFS doesn’t jointly market. |
| | |
| Other important information |
| If you own an MFS product or receive an MFS service in the name of a third party such as a bank or broker-dealer, their privacy policy may apply to you instead of ours. |
36
Annual Report
December 31, 2018

MFS® Technology Portfolio

MFS® Variable Insurance Trust II
Beginning on January 1, 2021, as permitted by regulations adopted by the U.S. Securities and Exchange Commission, the insurance company that offers your contract may determine that it will no longer send you paper copies of the fund’s annual and semiannual shareholder reports unless you specifically request paper copies from the insurance company or from your financial intermediary. Instead, the shareholder reports will be made available on a Web site (insurancefunds.mfs.com or other Web site of which you will be notified), and the insurance company will notify you by mail each time a report is posted and provide you with a Web site link to access the report. Instructions for requesting paper copies will be provided by your insurance company or financial intermediary.
If you already elected to receive shareholder reports by email, you will not be affected by this change and you need not take any action. If your insurance company or financial intermediary offers electronic delivery, you may elect to receive shareholder reports and other communications from the insurance company or financial intermediary by email by following the instructions provided by the insurance company or financial intermediary.
Beginning on January 1, 2019, you may elect to receive all future reports in paper free of charge from the insurance company or financial intermediary. You can inform the insurance company or financial intermediary that you wish to continue receiving paper copies of your shareholder reports by contacting your insurance company or financial intermediary. Your election to receive reports in paper will apply to all funds held in your account with your insurance company or financial intermediary.
TKS-ANN
MFS® Technology Portfolio
CONTENTS
The report is prepared for the general information of contract owners. It is authorized for distribution to prospective investors only when preceded or accompanied by a current prospectus.
NOT FDIC INSURED• MAY LOSE VALUE• NO BANK OR CREDIT UNION GUARANTEE• NOT A DEPOSIT• NOT INSURED BY ANY FEDERAL GOVERNMENT AGENCY OR NCUA/NCUSIF
MFS Technology Portfolio
LETTER FROM THE EXECUTIVE CHAIRMAN

Dear Contract Owners:
Higher interest rates, international trade friction, and geopolitical uncertainty surrounding issues such as Brexit have contributed to an uptick in market volatility in recent quarters — a departure from thelow-volatility environment that prevailed for much of the past several years. Against this more challenging backdrop, equity markets in the United States outperformed most international markets on a relative basis in 2018, though broad market returns were modestly negative on an absolute basis. Global economic growth has become less synchronized over the past few quarters, with Europe, China, and some emerging markets having shown signs of significantly slowing growth. While U.S. growth has remained above average, the pace of that growth slowed in the second half of 2018.
Slowing global growth and tighter financial conditions have clouded the outlook for U.S. monetary policy, with the chairman of the U.S. Federal Reserve acknowledging that policy rates are close to levels that the Fed deems neutral for the U.S. economy. This suggests that the predictable pattern of quarterly rate increases is behind us. At the same time, markets must contend with a shift from years of quantitative easing toward a cycle of quantitative tightening now that the European Central Bank has halted asset purchases. U.S. tax reforms adopted in late 2017 have been welcomed by equity markets while emerging market economies have recently had to contend with tighter financial conditions as a result of firmer U.S. interest rates and a stronger dollar. With the Republicans losing control of the U.S. House of Representatives, further meaningful U.S. fiscal stimulus appears less likely over the remainder of this presidential term. A partial U.S. government shutdown, beginning in late 2018, also added to political uncertainty. Globally, inflation remains largely subdued thanks in part to falling oil prices, but tight labor markets and moderate global demand have investors on the lookout for its potential reappearance. Increased U.S. protectionism is also a growing concern, as investors fear trade disputes could dampen business sentiment, leading to even slower global growth. While there has been progress on this front — a NAFTA replacement has been agreed upon between the U.S., Mexico, and Canada; the free trade pact with Korea has been updated; and a negotiating framework with the European Union has been agreed upon — tensions over trade with China remain quite high, though the two sides have recently returned to the negotiating table.
As a global investment manager with nearly a century of expertise, MFS® firmly believes active risk management offers downside mitigation and may help improve investment outcomes. We built our active investment platform with this belief in mind. Ourlong-term perspective influences nearly every aspect of our business, ensuring our investment decisions align with the investing time horizons of our clients.
Respectfully,

Robert J. Manning
Executive Chairman
MFS Investment Management
February 15, 2019
The opinions expressed in this letter are subject to change and may not be relied upon for investment advice. No forecasts can be guaranteed.
1
MFS Technology Portfolio
PORTFOLIO COMPOSITION
Portfolio structure
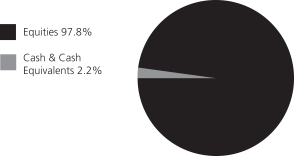
| | | | |
| Top ten holdings | | | | |
| Alphabet, Inc., “A” | | | 10.1% | |
| Amazon.com, Inc. | | | 6.9% | |
| Facebook, Inc., “A” | | | 6.1% | |
| Microsoft Corp. | | | 5.4% | |
| Visa, Inc., “A” | | | 4.6% | |
| Salesforce.com, Inc. | | | 4.5% | |
| Adobe Systems, Inc. | | | 4.1% | |
| Mastercard, Inc., “A” | | | 3.8% | |
| Microchip Technology, Inc. | | | 3.2% | |
| Apple, Inc. | | | 2.5% | |
| | | | |
| Top five industries | | | | |
| Business Services | | | 19.8% | |
| Internet | | | 19.5% | |
| Computer Software | | | 18.3% | |
| Other Banks & Diversified Financials | | | 8.4% | |
| Computer Software – Systems | | | 8.4% | |
Cash & Cash Equivalents includes any cash, investments in money market funds, short-term securities, and other assets less liabilities. Please see the Statement of Assets and Liabilities for additional information related to the fund’s cash position and other assets and liabilities.
Percentages are based on net assets as of December 31, 2018.
The portfolio is actively managed and current holdings may be different.
2
MFS Technology Portfolio
MANAGEMENT REVIEW
Summary of Results
For the twelve months ended December 31, 2018, Initial Class shares of the MFS Technology Portfolio (“fund”) provided a total return of 1.73%, while Service Class shares of the fund provided a total return of 1.52%. These compare with a return of –4.38% over the same period for the fund’s benchmark, the Standard & Poor’s 500 Stock Index, and a return of 2.88% for the fund’s other benchmark, the Standard & Poor’s North American Technology Sector Index.
Market Environment
During the reporting period, the US Federal Reserve raised interest rates by 100 basis points, bringing the total number of rate hikes to nine since the central bank began to normalize monetary policy in late 2015. Economic growth rates in the US, Eurozone and Japan remained above trend, despite a slowing in global growth, particularly toward the end of the period. Inflation remained contained, particularly outside the US. Late in the period, the European Central Bank halted its asset purchase program but issued forward guidance that it does not expect to raise interest rates at least until after the summer of 2019. The Bank of England (once) and the Bank of Canada (three times) each raised rates during the period. The European political backdrop became a bit more volatile, late in the period, spurred by concerns over cohesion in the eurozone after the election of an anti-establishment, Eurosceptic coalition government in Italy and widespread protests over stagnant wage growth in France.
Bond yields rose in the US during most of the period, but remained low by historical standards and slipped from their highs, late in the period, as market volatility increased. Yields in many developed markets fell. Outside of emerging markets, where spreads and currencies came under pressure, credit spreads remained quite tight until the end of the period, when thinner liquidity, lower oil prices and concerns over high degrees of corporate leverage emerged. Growing concern over increasing global trade friction appeared to have weighed on business sentiment during the period’s second half, especially outside the US. Tighter financial conditions from rising US rates and a strong dollar, combined with trade uncertainty, helped expose structural weaknesses in several emerging markets in the second half of the period.
Volatility increased, at the end of the period, amid signs of slowing global economic growth and increasing trade tensions, which prompted a market setback shortly after US markets set record highs in September. It was the second such equity market decline during the reporting period. The correction came despite a third consecutive quarter of strong growth in US earnings per share. Strong earnings growth, combined with the market decline, brought US equity valuations down from elevated levels, earlier in the period, to multiples more in line with long-term averages. While the US economy held up better than most, global economic growth became less synchronized during the period, with Europe and China showing signs of a slowdown and some emerging markets coming under stress.
Detractors from Performance
Stock selection in thebusiness services industry detracted from performance relative to the Standard & Poor’s North American Technology Sector Index. Here, the fund’s overweight position in information technology company DXC Technology held back relative returns. Shares of DXC Technology declined after the company missed, and lowered, revenue expectations, driven by execution challenges in its Digital business and foreign exchange headwinds.
The fund’s overweight allocation to theinternetindustry also hurt relative performance. Within this industry, the fund’s overweight position in social media giant Facebook detracted from relative returns as the company’s stock price trended downward onlower-than-expected revenues. Facebook expected further revenue deceleration as data privacy initiatives continued to put pressure on pricing growth. In addition, there appeared to have been negative investor sentiment following the Cambridge Analytica data privacy scandal, which further weighed on the stock’s price. The fund’s holdings of Chinese online and mobile retailer Alibaba Group Holding (b) (China) were also among its top relative detractors during the reporting period.
An underweight allocation to thespecialty storeindustry weakened relative performance. The fund’s holdings of internet retailer Amazon.com hurt relative results as the company’s share price declined over the reporting period. The firm announced it would be raising the minimum wage of all US workers to $15 an hour, a move that appeared to have fueled concerns among some investors about declining future profit margins. Additionally, the company reported mixed earnings results that saw greater-than-expected profit margins, primarily driven by Amazon Web Services, but lower-than-expected sales results as retail sales growth was limited.
Elsewhere, the fund’s overweight holdings of broadband communications and networking services provider Broadcom (h), information technology services provider Presidio and semiconductor manufacturer Microchip Technology dampened relative performance. An underweight position in software giant Microsoft, not owning shares of network equipment company Cisco Systems and the fund’s short position in IT management software and solutions provider CA Technologies (h), further held back relative returns.
3
MFS Technology Portfolio
Management Review – continued
Contributors to Performance
Stock selection within thecomputer softwareindustry was a primary contributor to relative performance. Within this industry, the fund’s overweight position in customer information software manager Salesforce.com, software company Adobe Systems, open source infrastructure and integration software provider MuleSoft (h) and communication and collaboration solutions provider RingCentral bolstered relative returns. Shares of RingCentral appreciated during the reporting period after the company reported strong financial results, well ahead of consensus, primarily due to an increase in software subscription revenues. The company also raised its full-year subscription revenue guidance figures towards the higher end of the range, which further benefited the stock.
A combination of security selection and an underweight allocation to thecomputer systemsindustry also aided relative performance. Here, the fund’s underweight position in poor-performing diversified technology products and services company International Business Machines (IBM) (h) contributed to relative returns. The stock price of IBM declined as the company reported earnings per share results that were below consensus estimates. The underperformance, relative to the forecast, was driven byweaker-than-expected growth in the company’s cognitive unit. Underweighting computer and personal electronics maker Apple also helped the fund’s relative returns as the company’s shares came under pressure following softer-than-anticipated iPhone demand, lower revenue from its Services segment and a potential new 10% tariff on iPhones, imposed by the US administration. The timing of the fund’s ownership in shares of security risk intelligence solutions provider Rapid7 further boosted relative performance.
Elsewhere, the fund’s underweight position in computer graphics processors maker NVIDIA (h) helped relative performance. The fund’s position in shares of internet video streaming services provider iQIYI (b)(h) (China), and an overweight position in internet TV show and movie subscription services provider Netflix, also benefited relative returns.
Respectfully,
Portfolio Manager(s)
Matthew Sabel
| (b) | Security is not a benchmark constituent. |
| (h) | Security was not held in the fund at period end. |
The views expressed in this report are those of the portfolio manager(s) only through the end of the period of the report as stated on the cover and do not necessarily reflect the views of MFS or any other person in the MFS organization. These views are subject to change at any time based on market or other conditions, and MFS disclaims any responsibility to update such views. These views may not be relied upon as investment advice or an indication of trading intent on behalf of any MFS portfolio. References to specific securities are not recommendations of such securities, and may not be representative of any MFS portfolio’s current or future investments.
4
MFS Technology Portfolio
PERFORMANCE SUMMARY THROUGH 12/31/18
The following chart illustrates the historical performance of the fund in comparison to its benchmark(s). Benchmarks are unmanaged and may not be invested in directly. Benchmark returns do not reflect any fees or expenses. The performance of other share classes will be greater than or less than that of the class depicted below. (See Notes to Performance Summary.)
Performance data shown represents past performance and is no guarantee of future results. Investment return and principal value fluctuate so your units, when sold, may be worth more or less than the original cost; current performance may be lower or higher than quoted. The performance shown does not reflect the deduction of taxes, if any, that a contract holder would pay on fund distributions or the redemption of contract units. The returns for the fund shown also do not reflect the deduction of expenses associated with variable products, such as mortality and expense risk charges, separate account charges, and sales charges imposed by the insurance company separate accounts. Such expenses would reduce the overall returns shown.
Growth of a Hypothetical $10,000 Investment

Total Returns through 12/31/18
Average annual total returns
| | | | | | | | | | | | |
| | | Share Class | | Class Inception Date | | 1-yr | | 5-yr | | 10-yr | | |
| | | Initial Class | | 6/16/00 | | 1.73% | | 13.51% | | 20.20% | | |
| | | Service Class | | 8/24/01 | | 1.52% | | 13.24% | | 19.90% | | |
| | | | |
| Comparative benchmark(s) | | | | | | | | |
| | | Standard & Poor’s 500 Stock Index (f) | | (4.38)% | | 8.49% | | 13.12% | | |
| | | Standard & Poor’s North American Technology Sector Index (f) | | 2.88% | | 15.32% | | 19.14% | | |
| (f) | Source: FactSet Research Systems Inc. |
Benchmark Definition(s)
Standard & Poor’s 500 Stock Index – a market capitalization-weighted index of 500 widely held equity securities, designed to measure broad U.S. equity performance.
Standard & Poor’s North American Technology Sector Index – a modified market capitalization-weighted index that measures the performance of selected technology stocks.
It is not possible to invest directly in an index.
Notes to Performance Summary
Average annual total return represents the average annual change in value for each share class for the periods presented.
Performance results reflect any applicable expense subsidies and waivers in effect during the periods shown. Without such subsidies and waivers the fund’s performance results would be less favorable. Please see the prospectus and financial statements for complete details. All results are historical and assume the reinvestment of any dividends and capital gains distributions.
Performance results do not include adjustments made for financial reporting purposes in accordance with U.S. generally accepted accounting principles and may differ from amounts reported in the financial highlights.
From time to time the fund may receive proceeds from litigation settlements, without which performance would be lower.
5
MFS Technology Portfolio
EXPENSE TABLE
Fund Expenses Borne by the Contract Holders during the Period,
July 1, 2018 through December 31, 2018
As a contract holder of the fund, you incur ongoing costs, including management fees; distribution and/or service(12b-1) fees; and other fund expenses. This example is intended to help you understand your ongoing costs (in dollars) of investing in the fund and to compare these costs with the ongoing costs of investing in other mutual funds.
The example is based on an investment of $1,000 invested at the beginning of the period and held for the entire period July 1, 2018 through December 31, 2018.
Actual Expenses
The first line for each share class in the following table provides information about actual account values and actual expenses. You may use the information in this line, together with the amount you invested, to estimate the expenses that you paid over the period. Simply divide your account value by $1,000 (for example, an $8,600 account value divided by $1,000 = 8.6), then multiply the result by the number in the first line under the heading entitled “Expenses Paid During Period” to estimate the expenses you paid on your account during this period.
Hypothetical Example for Comparison Purposes
The second line for each share class in the following table provides information about hypothetical account values and hypothetical expenses based on the fund’s actual expense ratio and an assumed rate of return of 5% per year before expenses, which is not the fund’s actual return. The hypothetical account values and expenses may not be used to estimate the actual ending account balance or expenses you paid for the period. You may use this information to compare the ongoing costs of investing in the fund and other funds. To do so, compare this 5% hypothetical example with the 5% hypothetical examples that appear in the shareholder reports of the other funds.
Please note that the expenses shown in the table are meant to highlight the fund’s ongoing costs only and do not take into account the fees and expenses imposed under the variable contracts through which your investment in the fund is made. Therefore, the second line for each share class in the table is useful in comparing ongoing costs associated with an investment in vehicles (such as the fund) which fund benefits under variable annuity and variable life insurance contracts and to qualified pension and retirement plans only, and will not help you determine the relative total costs of investing in the fund through variable annuity and variable life insurance contracts. If the fees and expenses imposed under the variable contracts were included, your costs would have been higher.
| | | | | | | | | | | | | | | | | | |
| Share Class | | | | Annualized
Expense Ratio | | | Beginning
Account Value
7/01/18 | | | Ending Account Value
12/31/18 | | | Expenses Paid
During Period (p)
7/01/18-12/31/18 | |
| Initial Class | | Actual | | | 0.99% | | | | $1,000.00 | | | | $872.13 | | | | $4.67 | |
| | Hypothetical (h) | | | 0.99% | | | | $1,000.00 | | | | $1,020.21 | | | | $5.04 | |
| Service Class | | Actual | | | 1.17% | | | | $1,000.00 | | | | $871.13 | | | | $5.52 | |
| | Hypothetical (h) | | | 1.17% | | | | $1,000.00 | | | | $1,019.31 | | | | $5.96 | |
| (h) | 5% class return per year before expenses. |
| (p) | “Expenses Paid During Period” are equal to each class’s annualized expense ratio, as shown above, multiplied by the average account value over the period, multiplied by 184/365 (to reflect theone-half year period). |
Notes to Expense Table
Expense ratios include 0.08% of investment related expenses from short sales (See Note 2 of the Notes to Financial Statements) that are outside of the expense limitation arrangement (See Note 3 of the Notes to Financial Statements).
6
MFS Technology Portfolio
PORTFOLIO OF INVESTMENTS – 12/31/18
The Portfolio of Investments is a complete list of all securities owned by your fund. It is categorized by broad-based asset classes.
| | | | | | | | |
| | |
| Issuer | | Shares/Par | | | Value ($) | |
| COMMON STOCKS – 97.8% | | | | | | | | |
| Aerospace – 3.0% | | | | | |
| CACI International, Inc., “A” (a) | | | 941 | | | $ | 135,532 | |
| FLIR Systems, Inc. | | | 9,644 | | | | 419,900 | |
| Harris Corp. | | | 4,726 | | | | 636,356 | |
| Northrop Grumman Corp. | | | 2,131 | | | | 521,882 | |
| | | | | | | | |
| | | | | | $ | 1,713,670 | |
| | | | | | | | |
| Biotechnology – 1.4% | | | | | |
| Bio-Techne Corp. | | | 3,461 | | | $ | 500,876 | |
| Illumina, Inc. (a) | | | 1,011 | | | | 303,229 | |
| | | | | | | | |
| | | | | | $ | 804,105 | |
| | | | | | | | |
| Broadcasting – 0.3% | | | | | |
| Netflix, Inc. (a) | | | 538 | | | $ | 144,001 | |
| | | | | | | | |
| Brokerage & Asset Managers – 1.0% | | | | | |
| NASDAQ, Inc. | | | 7,226 | | | $ | 589,425 | |
| | | | | | | | |
| Business Services – 19.8% | | | | | |
| Cognizant Technology Solutions Corp., “A” | | | 11,239 | | | $ | 713,452 | |
| Dropbox, Inc. (a) | | | 13,308 | | | | 271,882 | |
| DXC Technology Co. | | | 25,959 | | | | 1,380,240 | |
| Endava PLC, ADR (a) | | | 17,143 | | | | 415,546 | |
| EVO Payments, Inc., “A” (a) | | | 12,592 | | | | 310,645 | |
| Fidelity National Information Services, Inc. | | | 9,802 | | | | 1,005,195 | |
| First Data Corp. (a) | | | 17,828 | | | | 301,472 | |
| Fiserv, Inc. (a) | | | 15,327 | | | | 1,126,381 | |
| FleetCor Technologies, Inc. (a) | | | 3,228 | | | | 599,504 | |
| Global Payments, Inc. | | | 10,833 | | | | 1,117,207 | |
| Grand Canyon Education, Inc. (a) | | | 5,636 | | | | 541,845 | |
| PayPal Holdings, Inc. (a) | | | 16,001 | | | | 1,345,524 | |
| Total System Services, Inc. | | | 12,847 | | | | 1,044,333 | |
| TransUnion | | | 9,618 | | | | 546,302 | |
| Verisk Analytics, Inc., “A” (a) | | | 4,121 | | | | 449,354 | |
| | | | | | | | |
| | | | | | $ | 11,168,882 | |
| | | | | | | | |
| Computer Software – 18.3% | | | | | |
| 2U, Inc. (a) | | | 521 | | | $ | 25,904 | |
| Adobe Systems, Inc. (a) | | | 10,149 | | | | 2,296,110 | |
| Autodesk, Inc. (a) | | | 6,018 | | | | 773,975 | |
| Eventbrite, Inc. (a) | | | 10,801 | | | | 300,376 | |
| Microsoft Corp. | | | 30,193 | | | | 3,066,703 | |
| PTC, Inc. (a) | | | 6,163 | | | | 510,913 | |
| RingCentral, Inc. (a) | | | 5,048 | | | | 416,157 | |
| Salesforce.com, Inc. (a) | | | 18,705 | | | | 2,562,024 | |
| Zendesk, Inc. (a) | | | 6,028 | | | | 351,854 | |
| | | | | | | | |
| | | | | | $ | 10,304,016 | |
| | | | | | | | |
| Computer Software – Systems – 8.4% | | | | | |
| Apple, Inc. | | | 9,010 | | | $ | 1,421,237 | |
| Constellation Software, Inc. | | | 843 | | | | 539,602 | |
| EPAM Systems, Inc. (a) | | | 3,462 | | | | 401,627 | |
| HubSpot, Inc. (a) | | | 2,714 | | | | 341,231 | |
| New Relic, Inc. (a) | | | 3,788 | | | | 306,714 | |
| Pluralsight, Inc., “A” (a) | | | 13,510 | | | | 318,161 | |
| | | | | | | | |
| | |
| Issuer | | Shares/Par | | | Value ($) | |
| COMMON STOCKS – continued | | | | | | | | |
| Computer Software – Systems – continued | | | | | |
| Presidio, Inc. | | | 42,487 | | | $ | 554,455 | |
| Rapid7, Inc. (a) | | | 7,148 | | | | 222,732 | |
| ServiceNow, Inc. (a) | | | 3,421 | | | | 609,109 | |
| | | | | | | | |
| | | | | | $ | 4,714,868 | |
| | | | | | | | |
| Electrical Equipment – 2.4% | | | | | |
| Amphenol Corp., “A” | | | 7,577 | | | $ | 613,889 | |
| TE Connectivity Ltd. | | | 9,762 | | | | 738,300 | |
| | | | | | | | |
| | | | | | $ | 1,352,189 | |
| | | | | | | | |
| Electronics – 4.7% | | | | | |
| Applied Materials, Inc. | | | 23,332 | | | $ | 763,890 | |
| Microchip Technology, Inc. | | | 24,747 | | | | 1,779,804 | |
| Silicon Laboratories, Inc. (a) | | | 378 | | | | 29,790 | |
| VICOR Corp. (a) | | | 2,106 | | | | 79,586 | |
| | | | | | | | |
| | | | | | $ | 2,653,070 | |
| | | | | | | | |
| Internet – 19.5% | | | | | |
| Alibaba Group Holding Ltd., ADR (a) | | | 2,515 | | | $ | 344,731 | |
| Alphabet, Inc., “A” (a)(s) | | | 5,455 | | | | 5,700,257 | |
| Facebook, Inc., “A” (a) | | | 26,042 | | | | 3,413,846 | |
| Farfetch Ltd., “A” (a) | | | 12,781 | | | | 226,351 | |
| Godaddy, Inc. (a) | | | 10,724 | | | | 703,709 | |
| Spotify Technology S.A. (a) | | | 1,966 | | | | 223,141 | |
| Wix.com Ltd. (a) | | | 3,848 | | | | 347,628 | |
| | | | | | | | |
| | | | | | $ | 10,959,663 | |
| | | | | | | | |
| Leisure & Toys – 2.2% | | | | | |
| Activision Blizzard, Inc. | | | 10,348 | | | $ | 481,906 | |
| Electronic Arts, Inc. (a) | | | 9,387 | | | | 740,728 | |
| | | | | | | | |
| | | | | | $ | 1,222,634 | |
| | | | | | | | |
| Medical & Health Technology & Services – 0.4% | | | | | |
| Guardant Health, Inc. (a) | | | 6,615 | | | $ | 248,658 | |
| | | | | | | | |
| Medical Equipment – 0.2% | | | | | |
| Senseonics Holdings, Inc. (a)(l) | | | 39,215 | | | $ | 101,567 | |
| | | | | | | | |
| Other Banks & Diversified Financials – 8.4% | | | | | |
| Mastercard, Inc., “A” | | | 11,365 | | | $ | 2,144,007 | |
| Visa, Inc., “A” | | | 19,628 | | | | 2,589,719 | |
| | | | | | | | |
| | | | | | $ | 4,733,726 | |
| | | | | | | | |
| Printing & Publishing – 0.9% | | | | | |
| IHS Markit Ltd. (a) | | | 10,921 | | | $ | 523,880 | |
| | | | | | | | |
| Specialty Stores – 6.9% | | | | | |
| Amazon.com, Inc. (a)(s) | | | 2,582 | | | $ | 3,878,086 | |
| | | | | | | | |
Total Common Stocks
(Identified Cost, $49,815,611) | | | | | | $ | 55,112,440 | |
| | | | | | | | |
7
MFS Technology Portfolio
Portfolio of Investments – continued
| | | | | | | | |
| | |
| Issuer | | Shares/Par | | | Value ($) | |
| INVESTMENT COMPANIES (h) – 2.0% | | | | | |
| Money Market Funds – 2.0% | | | | | |
| MFS Institutional Money Market Portfolio, 2.4% (v) (Identified Cost, $1,116,606) | | | 1,116,717 | | | $ | 1,116,606 | |
| | | | | | | | |
|
| COLLATERAL FOR SECURITIES LOANED – 0.1% | |
| State Street Navigator Securities Lending Government Money Market Portfolio, 2.29% (j) (Identified Cost, $25,784) | | | 25,784 | | | $ | 25,784 | |
| | | | | | | | |
OTHER ASSETS, LESS
LIABILITIES – 0.1% | | | | | | | 72,741 | |
| | | | | | | | |
| NET ASSETS – 100.0% | | | | | | $ | 56,327,571 | |
| | | | | | | | |
| (a) | | Non-income producing security. |
| (h) | | An affiliated issuer, which may be considered one in which the fund owns 5% or more of the outstanding voting securities, or a company which is under common control. At period end, the aggregate values of the fund’s investments in affiliated issuers and in unaffiliated issuers were $1,116,606 and $55,138,224, respectively. |
| (j) | | The rate quoted is the annualizedseven-day yield of the fund at period end. |
| (l) | | A portion of this security is on loan. See Note 2 for additional information. |
| (s) | | Security or a portion of the security was pledged to cover collateral requirements for securities sold short. At December 31, 2018, the fund had no short sales outstanding. |
| (v) | | Affiliated issuer that is available only to investment companies managed by MFS. The rate quoted for the MFS Institutional Money Market Portfolio is the annualizedseven-day yield of the fund at period end. |
The following abbreviations are used in this report and are defined:
| ADR | | American Depositary Receipt |
| PLC | | Public Limited Company |
At December 31, 2018, the fund had cash collateral of $163,078 and other liquid securities with an aggregate value of $395,498 to cover any collateral or margin obligations for securities sold short. Restricted cash and/or deposits with brokers in the Statement of Assets and Liabilities are comprised of cash collateral.
See Notes to Financial Statements
8
MFS Technology Portfolio
FINANCIAL STATEMENTS | STATEMENT OF ASSETS AND LIABILITIES
This statement represents your fund’s balance sheet, which details the assets and liabilities comprising the total value of the fund.
| | | | |
At 12/31/18 | | | | |
| |
Assets | | | | |
Investments in unaffiliated issuers, at value, including $28,803 of securities on loan (identified cost, $49,841,395) | | | $55,138,224 | |
Investments in affiliated issuers, at value (identified cost, $1,116,606) | | | 1,116,606 | |
Deposits with brokers for | | | | |
Securities sold short | | | 163,078 | |
Receivables for | | | | |
Fund shares sold | | | 11,529 | |
Interest and dividends | | | 10,625 | |
Other assets | | | 1,090 | |
Total assets | | | $56,441,152 | |
| |
Liabilities | | | | |
Payables for | | | | |
Fund shares reacquired | | | $19,150 | |
Collateral for securities loaned, at value (c) | | | 25,784 | |
Payable to affiliates | | | | |
Investment adviser | | | 4,744 | |
Shareholder servicing costs | | | 19 | |
Distribution and/or service fees | | | 1,070 | |
Payable for independent Trustees’ compensation | | | 48 | |
Accrued expenses and other liabilities | | | 62,766 | |
Total liabilities | | | $113,581 | |
Net assets | | | $56,327,571 | |
| |
Net assets consist of | | | | |
Paid-in capital | | | $44,468,101 | |
Total distributable earnings (loss) | | | 11,859,470 | |
Net assets | | | $56,327,571 | |
Shares of beneficial interest outstanding | | | 3,371,511 | |
| | | | | | | | | | | | |
| | | |
| | | Net assets | | | Shares
outstanding | | | Net asset value
per share | |
Initial Class | | | $17,056,024 | | | | 983,359 | | | | $17.34 | |
Service Class | | | 39,271,547 | | | | 2,388,152 | | | | 16.44 | |
| (c) | Non-cash collateral is not included. |
See Notes to Financial Statements
9
MFS Technology Portfolio
FINANCIAL STATEMENTS | STATEMENT OF OPERATIONS
This statement describes how much your fund earned in investment income and accrued in expenses. It also describes any gains and/or losses generated by fund operations.
| | | | |
Year ended 12/31/18 | | | | |
| |
Net investment income (loss) | | | | |
Income | | | | |
Dividends | | | $1,064,862 | |
Dividends from affiliated issuers | | | 75,175 | |
Other | | | 71,501 | |
Income on securities loaned | | | 22,038 | |
Foreign taxes withheld | | | (1,722 | ) |
Total investment income | | | $1,231,854 | |
Expenses | | | | |
Management fee | | | $1,730,046 | |
Distribution and/or service fees | | | 511,483 | |
Shareholder servicing costs | | | 9,630 | |
Administrative services fee | | | 43,642 | |
Independent Trustees’ compensation | | | 7,189 | |
Custodian fee | | | 21,066 | |
Shareholder communications | | | 32,919 | |
Audit and tax fees | | | 56,070 | |
Legal fees | | | 2,596 | |
Dividend and interest expense on securities sold short | | | 167,250 | |
Miscellaneous | | | 26,825 | |
Total expenses | | | $2,608,716 | |
Reduction of expenses by investment adviser | | | (21,868 | ) |
Net expenses | | | $2,586,848 | |
Net investment income (loss) | | | $(1,354,994 | ) |
| |
Realized and unrealized gain (loss) | | | | |
Realized gain (loss) (identified cost basis) | | | | |
Unaffiliated issuers | | | $109,499,236 | |
Affiliated issuers | | | (69 | ) |
Securities sold short | | | (1,144,257 | ) |
Foreign currency | | | 17 | |
Net realized gain (loss) | | | $108,354,927 | |
Change in unrealized appreciation or depreciation | | | | |
Unaffiliated issuers | | | $(82,709,399 | ) |
Securities sold short | | | (11,654 | ) |
Net unrealized gain (loss) | | | $(82,721,053 | ) |
Net realized and unrealized gain (loss) | | | $25,633,874 | |
Change in net assets from operations | | | $24,278,880 | |
See Notes to Financial Statements
10
MFS Technology Portfolio
FINANCIAL STATEMENTS | STATEMENTS OF CHANGES IN NET ASSETS
These statements describe the increases and/or decreases in net assets resulting from operations, any distributions, and any shareholder transactions.
| | | | | | | | |
| | | Year ended | |
| | | 12/31/18 | | | 12/31/17 | |
Change in net assets | | | | | | | | |
| | |
From operations | | | | | | | | |
Net investment income (loss) | | | $(1,354,994 | ) | | | $(967,974 | ) |
Net realized gain (loss) | | | 108,354,927 | | | | 11,114,663 | |
Net unrealized gain (loss) | | | (82,721,053 | ) | | | 48,774,621 | |
Change in net assets from operations | | | $24,278,880 | | | | $58,921,310 | |
Total distributions to shareholders (a) | | | $(15,602,152 | ) | | | $(4,319,221 | ) |
Change in net assets from fund share transactions | | | $(183,617,707 | ) | | | $34,910,824 | |
Total change in net assets | | | $(174,940,979 | ) | | | $89,512,913 | |
| | |
Net assets | | | | | | | | |
At beginning of period | | | 231,268,550 | | | | 141,755,637 | |
At end of period | | | $56,327,571 | | | | $231,268,550 | |
| (a) | Distributions from net investment income and from net realized gain are no longer required to be separately disclosed. See Note 2. For the year ended December 31, 2017, distributions from net realized gain were $4,319,221. |
See Notes to Financial Statements
11
MFS Technology Portfolio
FINANCIAL STATEMENTS | FINANCIAL HIGHLIGHTS
The financial highlights table is intended to help you understand the fund’s financial performance for the past 5 years. Certain information reflects financial results for a single fund share. The total returns in the table represent the rate that an investor would have earned (or lost) on an investment in the fund share class (assuming reinvestment of all distributions) held for the entire period.
| | | | | | | | | | | | | | | | | | | | |
| Initial Class | | Year ended | |
| | | | | |
| | | 12/31/18 | | | 12/31/17 | | | 12/31/16 | | | 12/31/15 | | | 12/31/14 | |
| | | | | |
Net asset value, beginning of period | | | $17.96 | | | | $13.19 | | | | $12.45 | | | | $11.63 | | | | $10.71 | |
| | | | | |
| Income (loss) from investment operations | | | | | | | | | | | | | | | | | | | | |
Net investment income (loss) (d) | | | $(0.07 | ) | | | $(0.05 | ) | | | $(0.01 | )(c) | | | $(0.03 | ) | | | $(0.02 | ) |
Net realized and unrealized gain (loss) | | | 0.58 | | | | 5.16 | | | | 1.10 | | | | 1.22 | | | | 1.16 | |
Total from investment operations | | | $0.51 | | | | $5.11 | | | | $1.09 | | | | $1.19 | | | | $1.14 | |
| | | | | |
| Less distributions declared to shareholders | | | | | | | | | | | | | | | | | | | | |
From net realized gain | | | $(1.13 | ) | | | $(0.34 | ) | | | $(0.35 | ) | | | $(0.37 | ) | | | $(0.22 | ) |
Net asset value, end of period (x) | | | $17.34 | | | | $17.96 | | | | $13.19 | | | | $12.45 | | | | $11.63 | |
Total return (%) (k)(r)(s)(x) | | | 1.73 | | | | 39.00 | | | | 8.69 | (c) | | | 10.75 | | | | 10.71 | |
| | | | | |
Ratios (%) (to average net assets)
and Supplemental data: | | | | | | | | | | | | | | | | | | | | |
Expenses before expense reductions (f) | | | 0.94 | | | | 0.88 | | | | 0.85 | (c) | | | 0.91 | | | | 0.94 | |
Expenses after expense reductions (f) | | | 0.93 | | | | 0.88 | | | | 0.85 | (c) | | | 0.91 | | | | 0.93 | |
Net investment income (loss) | | | (0.38 | ) | | | (0.29 | ) | | | (0.10 | )(c) | | | (0.22 | ) | | | (0.20 | ) |
Portfolio turnover | | | 39 | | | | 31 | | | | 36 | | | | 45 | | | | 35 | |
Net assets at end of period (000 omitted) | | | $17,056 | | | | $27,659 | | | | $15,195 | | | | $15,588 | | | | $16,062 | |
| | | | | |
| Supplemental Ratios (%): | | | | | | | | | | | | | | | | | | | | |
Ratio of expenses to average net assets after expense reductions excluding short sale expenses (f) | | | 0.85 | | | | 0.85 | | | | 0.82 | (c) | | | 0.89 | | | | 0.91 | |
| |
| Service Class | | Year ended | |
| | | | | |
| | | 12/31/18 | | | 12/31/17 | | | 12/31/16 | | | 12/31/15 | | | 12/31/14 | |
| | | | | |
Net asset value, beginning of period | | | $17.11 | | | | $12.61 | | | | $11.95 | | | | $11.20 | | | | $10.35 | |
| | | | | |
| Income (loss) from investment operations | | | | | | | | | | | | | | | | | | | | |
Net investment income (loss) (d) | | | $(0.12 | ) | | | $(0.08 | ) | | | $(0.04 | )(c) | | | $(0.05 | ) | | | $(0.05 | ) |
Net realized and unrealized gain (loss) | | | 0.58 | | | | 4.92 | | | | 1.05 | | | | 1.17 | | | | 1.12 | |
Total from investment operations | | | $0.46 | | | | $4.84 | | | | $1.01 | | | | $1.12 | | | | $1.07 | |
| | | | | |
| Less distributions declared to shareholders | | | | | | | | | | | | | | | | | | | | |
From net realized gain | | | $(1.13 | ) | | | $(0.34 | ) | | | $(0.35 | ) | | | $(0.37 | ) | | | $(0.22 | ) |
Net asset value, end of period (x) | | | $16.44 | | | | $17.11 | | | | $12.61 | | | | $11.95 | | | | $11.20 | |
Total return (%) (k)(r)(s)(x) | | | 1.52 | | | | 38.65 | | | | 8.39 | (c) | | | 10.53 | | | | 10.40 | |
| | | | | |
Ratios (%) (to average net assets)
and Supplemental data: | | | | | | | | | | | | | | | | | | | | |
Expenses before expense reductions (f) | | | 1.16 | | | | 1.14 | | | | 1.10 | (c) | | | 1.16 | | | | 1.19 | |
Expenses after expense reductions (f) | | | 1.15 | | | | 1.13 | | | | 1.10 | (c) | | | 1.16 | | | | 1.18 | |
Net investment income (loss) | | | (0.61 | ) | | | (0.53 | ) | | | (0.35 | )(c) | | | (0.47 | ) | | | (0.45 | ) |
Portfolio turnover | | | 39 | | | | 31 | | | | 36 | | | | 45 | | | | 35 | |
Net assets at end of period (000 omitted) | | | $39,272 | | | | $203,610 | | | | $126,561 | | | | $106,002 | | | | $81,693 | |
| | | | | |
| Supplemental Ratios (%): | | | | | | | | | | | | | | | | | | | | |
Ratio of expenses to average net assets after expense reductions excluding short sale expenses (f) | | | 1.07 | | | | 1.10 | | | | 1.06 | (c) | | | 1.14 | | | | 1.16 | |
See Notes to Financial Statements
12
MFS Technology Portfolio
Financial Highlights – continued
| (c) | Amount reflects aone-time reimbursement of expenses by the custodian (or former custodian) without which net investment income and performance would be lower and expenses would be higher. |
| (d) | Per share data is based on average shares outstanding. |
| (f) | Ratios do not reflect reductions from fees paid indirectly, if applicable. |
| (k) | The total return does not reflect expenses that apply to separate accounts. Inclusion of these charges would reduce the total return figures for all periods shown. |
| (r) | Certain expenses have been reduced without which performance would have been lower. |
| (s) | From time to time the fund may receive proceeds from litigation settlements, without which performance would be lower. |
| (x) | The net asset values and total returns have been calculated on net assets which include adjustments made in accordance with U.S. generally accepted accounting principles required at period end for financial reporting purposes. |
See Notes to Financial Statements
13
MFS Technology Portfolio
NOTES TO FINANCIAL STATEMENTS
| (1) | | Business and Organization |
MFS Technology Portfolio (the fund) is anon-diversified series of MFS Variable Insurance Trust II (the trust). The trust is organized as a Massachusetts business trust and is registered under the Investment Company Act of 1940, as amended, as anopen-end management investment company. The shareholders of each series of the trust are separate accounts of insurance companies, which offer variable annuity and/or life insurance products, and qualified retirement and pension plans.
The fund is an investment company and accordingly follows the investment company accounting and reporting guidance of the Financial Accounting Standards Board (FASB) Accounting Standards Codification Topic 946 Financial Services – Investment Companies.
| (2) | | Significant Accounting Policies |
General– The preparation of financial statements in conformity with U.S. generally accepted accounting principles requires management to make estimates and assumptions that affect the reported amounts of assets and liabilities, and disclosure of contingent assets and liabilities at the date of the financial statements and the reported amounts of increases and decreases in net assets from operations during the reporting period. Actual results could differ from those estimates. In the preparation of these financial statements, management has evaluated subsequent events occurring after the date of the fund’s Statement of Assets and Liabilities through the date that the financial statements were issued. The fund invests primarily in securities of issuers in the technology industry. Issuers in a single industry can react similarly to market, currency, political, economic, regulatory, geopolitical, and other conditions. The value of stocks in the technology sector can be very volatile due to the rapid pace of product change, technological developments, and other factors.
In August 2018, the FASB issued Accounting Standards Update2018-13, Fair Value Measurement (Topic 820) – Disclosure Framework – Changes to the Disclosure Requirements for Fair Value Measurement (“ASU2018-13”) which introduces new fair value disclosure requirements as well as eliminates and modifies certain existing fair value disclosure requirements. ASU2018-13 would be effective for fiscal years beginning after December 15, 2019, and interim periods within those fiscal years; however, management has elected to early adopt ASU2018-13 effective with the current reporting period. The impact of the fund’s adoption was limited to changes in the fund’s financial statement disclosures regarding fair value, primarily those disclosures related to transfers between levels of the fair value hierarchy.
In August 2018, the Securities and Exchange Commission (SEC) released its Final Rule on Disclosure Update and Simplification (the “Final Rule”) which is intended to simplify an issuer’s disclosure compliance efforts by removing redundant or outdated disclosure requirements without significantly altering the mix of information provided to investors. Effective with the current reporting period, the fund adopted the Final Rule with the impacts being that the fund is no longer required to present the components of distributable earnings on the Statement of Assets and Liabilities or the sources of distributions to shareholders and the amount of undistributed net investment income on the Statements of Changes in Net Assets.
Balance Sheet Offsetting– The fund’s accounting policy with respect to balance sheet offsetting is that, absent an event of default by the counterparty or a termination of the agreement, the International Swaps and Derivatives Association (ISDA) Master Agreement, or similar agreement, does not result in an offset of reported amounts of financial assets and financial liabilities in the Statement of Assets and Liabilities across transactions between the fund and the applicable counterparty. The fund’s right to setoff may be restricted or prohibited by the bankruptcy or insolvency laws of the particular jurisdiction to which a specific master netting agreement counterparty is subject. Balance sheet offsetting disclosures, to the extent applicable to the fund, have been included in the fund’s Significant Accounting Policies note under the captions for each of the fund’sin-scope financial instruments and transactions.
Investment Valuations– Equity securities, including restricted equity securities and equity securities sold short, are generally valued at the last sale or official closing price on their primary market or exchange as provided by a third-party pricing service. Equity securities, for which there were no sales reported that day, are generally valued at the last quoted daily bid quotation on their primary market or exchange as provided by a third-party pricing service. Equity securities sold short, for which there were no sales reported for that day, are generally valued at the last quoted daily ask quotation on their primary market or exchange as provided by a third-party pricing service. Short-term instruments with a maturity at issuance of 60 days or less may be valued at amortized cost, which approximates market value.Open-end investment companies are generally valued at net asset value per share. Securities and other assets generally valued on the basis of information from a third-party pricing service may also be valued at a broker/dealer bid quotation. In determining values, third-party pricing services can utilize both transaction data and market information such as yield, quality, coupon rate, maturity, type of issue, trading characteristics, and other market data. The values of foreign securities and other assets and liabilities expressed in foreign currencies are converted to U.S. dollars using the mean of bid and asked prices for rates provided by a third-party pricing service.
The Board of Trustees has delegated primary responsibility for determining or causing to be determined the value of the fund’s investments (including any fair valuation) to the adviser pursuant to valuation policies and procedures approved by the Board. If the
14
MFS Technology Portfolio
Notes to Financial Statements – continued
adviser determines that reliable market quotations are not readily available, investments are valued at fair value as determined in good faith by the adviser in accordance with such procedures under the oversight of the Board of Trustees. Under the fund’s valuation policies and procedures, market quotations are not considered to be readily available for most types of debt instruments and floating rate loans and many types of derivatives. These investments are generally valued at fair value based on information from third-party pricing services. In addition, investments may be valued at fair value if the adviser determines that an investment’s value has been materially affected by events occurring after the close of the exchange or market on which the investment is principally traded (such as foreign exchange or market) and prior to the determination of the fund’s net asset value, or after the halting of trading of a specific security where trading does not resume prior to the close of the exchange or market on which the security is principally traded. Events that occur on a frequent basis after foreign markets close (such as developments in foreign markets and significant movements in the U.S. markets) and prior to the determination of the fund’s net asset value may be deemed to have a material effect on the value of securities traded in foreign markets. Accordingly, the fund’s foreign equity securities may often be valued at fair value. The adviser generally relies on third-party pricing services or other information (such as the correlation with price movements of similar securities in the same or other markets; the type, cost and investment characteristics of the security; the business and financial condition of the issuer; and trading and other market data) to assist in determining whether to fair value and at what value to fair value an investment. The value of an investment for purposes of calculating the fund’s net asset value can differ depending on the source and method used to determine value. When fair valuation is used, the value of an investment used to determine the fund’s net asset value may differ from quoted or published prices for the same investment. There can be no assurance that the fund could obtain the fair value assigned to an investment if it were to sell the investment at the same time at which the fund determines its net asset value per share.
Various inputs are used in determining the value of the fund’s assets or liabilities. These inputs are categorized into three broad levels. In certain cases, the inputs used to measure fair value may fall into different levels of the fair value hierarchy. In such cases, an investment’s level within the fair value hierarchy is based on the lowest level of input that is significant to the fair value measurement. The fund’s assessment of the significance of a particular input to the fair value measurement in its entirety requires judgment, and considers factors specific to the investment. Level 1 includes unadjusted quoted prices in active markets for identical assets or liabilities. Level 2 includes other significant observable market-based inputs (including quoted prices for similar securities, interest rates, prepayment speed, and credit risk). Level 3 includes unobservable inputs, which may include the adviser’s own assumptions in determining the fair value of investments. The following is a summary of the levels used as of December 31, 2018 in valuing the fund’s assets or liabilities:
| | | | | | | | | | | | | | | | |
| Financial Instruments | | Level 1 | | | Level 2 | | | Level 3 | | | Total | |
| Equity Securities | | | $55,112,440 | | | | $— | | | | $— | | | | $55,112,440 | |
| Mutual Funds | | | 1,142,390 | | | | — | | | | — | | | | 1,142,390 | |
| Total | | | $56,254,830 | | | | $— | | | | $— | | | | $56,254,830 | |
For further information regarding security characteristics, see the Portfolio of Investments.
Foreign Currency Translation– Purchases and sales of foreign investments, income, and expenses are converted into U.S. dollars based upon currency exchange rates prevailing on the respective dates of such transactions or on the reporting date for foreign denominated receivables and payables. Gains and losses attributable to foreign currency exchange rates on sales of securities are recorded for financial statement purposes as net realized gains and losses on investments. Gains and losses attributable to foreign exchange rate movements on receivables, payables, income and expenses are recorded for financial statement purposes as foreign currency transaction gains and losses. That portion of both realized and unrealized gains and losses on investments that results from fluctuations in foreign currency exchange rates is not separately disclosed.
Short Sales– The fund entered into short sales whereby it sells a security it does not own in anticipation of a decline in the value of that security. The fund will realize a gain if the security price decreases and a loss if the security price increases between the date of the short sale and the date on which the fund replaces the borrowed security. Losses from short sales can exceed the proceeds of the security sold; and they can also exceed the potential loss from an ordinary buy and sell transaction. The amount of any premium, dividends, or interest the fund may be required to pay in connection with a short sale will be recognized as a fund expense. During the year ended December 31, 2018, this expense amounted to $167,250. The fund segregates cash or marketable securities in an amount that, when combined with the amount of proceeds from the short sale deposited with the broker, at least equals the current market value of the security sold short. At December 31, 2018, the fund had no short sales outstanding.
Security Loans– Under its Securities Lending Agency Agreement with the fund, State Street Bank and Trust Company, as lending agent, loans the securities of the fund to certain qualified institutions (the “Borrowers”) approved by the fund. Security loans can be terminated at the discretion of either the lending agent or the fund and the related securities must be returned within the earlier of the standard trade settlement period for such securities or within three business days. The loans are collateralized by cash and/or U.S. Treasury and federal agency obligations in an amount typically at least equal to the market value of the securities loaned. On loans collateralized by cash, the cash collateral is invested in a money market fund. The market value of the loaned securities is determined
15
MFS Technology Portfolio
Notes to Financial Statements – continued
at the close of business of the fund and any additional required collateral is delivered to the fund on the next business day. The lending agent provides the fund with indemnification against Borrower default. In the event of Borrower default, the lending agent will, for the benefit of the fund, either purchase securities identical to those loaned or, when such purchase is commercially impracticable, pay the fund the market value of the loaned securities. In return, the lending agent assumes the fund’s rights to the related collateral. If the collateral value is less than the cost to purchase identical securities, the lending agent is responsible for the shortfall, but only to the extent that such shortfall is not due to a decline in collateral value resulting from collateral reinvestment for which the fund bears the risk of loss. At period end, the fund had investment securities on loan, all of which were classified as equity securities in the fund’s Portfolio of Investments, with a fair value of $28,803. The fair value of the fund’s investment securities on loan and a related liability of $25,784 for cash collateral received on securities loaned are both presented gross in the Statement of Assets and Liabilities. Additionally, these loans were collateralized by U.S. Treasury Obligations of $4,802 held by the lending agent. The collateral on securities loaned exceeded the value of securities on loan at period end. The liability for cash collateral for securities loaned is carried at fair value, which is categorized as level 2 within the fair value hierarchy. A portion of the income generated upon investment of the collateral is remitted to the Borrowers, and the remainder is allocated between the fund and the lending agent. On loans collateralized by U.S. Treasury and/or federal agency obligations, a fee is received from the Borrower, and is allocated between the fund and the lending agent. Income from securities lending is separately reported in the Statement of Operations. The dividend and interest income earned on the securities loaned is accounted for in the same manner as other dividend and interest income.
Indemnifications– Under the fund’s organizational documents, its officers and Trustees may be indemnified against certain liabilities and expenses arising out of the performance of their duties to the fund. Additionally, in the normal course of business, the fund enters into agreements with service providers that may contain indemnification clauses. The fund’s maximum exposure under these agreements is unknown as this would involve future claims that may be made against the fund that have not yet occurred.
Investment Transactions and Income – Investment transactions are recorded on the trade date. Interest income is recorded on the accrual basis. Dividends received in cash are recorded on theex-dividend date. Certain dividends from foreign securities will be recorded when the fund is informed of the dividend if such information is obtained subsequent to theex-dividend date. Dividend payments received in additional securities are recorded on theex-dividend date in an amount equal to the value of the security on such date.
The fund may receive proceeds from litigation settlements. Any proceeds received from litigation involving portfolio holdings are reflected in the Statement of Operations in realized gain/loss if the security has been disposed of by the fund or in unrealized gain/loss if the security is still held by the fund. Any other proceeds from litigation not related to portfolio holdings are reflected as other income in the Statement of Operations.
Tax Matters and Distributions– The fund intends to qualify as a regulated investment company, as defined under Subchapter M of the Internal Revenue Code, and to distribute all of its taxable income, including realized capital gains. As a result, no provision for federal income tax is required. The fund’s federal tax returns, when filed, will remain subject to examination by the Internal Revenue Service for a three year period. Management has analyzed the fund’s tax positions taken on federal and state tax returns for all open tax years and does not believe that there are any uncertain tax positions that require recognition of a tax liability. Foreign taxes, if any, have been accrued by the fund in the accompanying financial statements in accordance with the applicable foreign tax law. Foreign income taxes may be withheld by certain countries in which the fund invests. Additionally, capital gains realized by the fund on securities issued in or by certain foreign countries may be subject to capital gains tax imposed by those countries.
Distributions to shareholders are recorded on theex-dividend date. Income and capital gain distributions are determined in accordance with income tax regulations, which may differ from U.S. generally accepted accounting principles. Certain capital accounts in the financial statements are periodically adjusted for permanent differences in order to reflect their tax character. These adjustments have no impact on net assets or net asset value per share. Temporary differences which arise from recognizing certain items of income, expense, gain or loss in different periods for financial statement and tax purposes will reverse at some time in the future. Distributions in excess of net investment income or net realized gains are temporary overdistributions for financial statement purposes resulting from differences in the recognition or classification of income or distributions for financial statement and tax purposes.
Book/tax differences primarily relate to wash sale loss deferrals, straddle loss deferrals, and redemptionsin-kind.
The tax character of distributions declared to shareholders for the last two fiscal years is as follows:
| | | | | | | | |
| | | Year ended
12/31/18 | | | Year ended
12/31/17 | |
| Ordinary income (including any short-term capital gains) | | | $3,607,065 | | | | $829,123 | |
| Long-term capital gains | | | 11,995,087 | | | | 3,490,098 | |
| Total distributions | | | $15,602,152 | | | | $4,319,221 | |
16
MFS Technology Portfolio
Notes to Financial Statements – continued
The federal tax cost and the tax basis components of distributable earnings were as follows:
| | | | |
| As of 12/31/18 | | | | |
| |
| Cost of investments | | | $51,351,449 | |
| Gross appreciation | | | 9,480,563 | |
| Gross depreciation | | | (4,577,182 | ) |
| Net unrealized appreciation (depreciation) | | | $4,903,381 | |
| |
| Undistributed ordinary income | | | 96,810 | |
| Undistributed long-term capital gain | | | 6,859,279 | |
Multiple Classes of Shares of Beneficial Interest– The fund offers multiple classes of shares, which differ in their respective distribution and/or service fees. The fund’s income, realized and unrealized gain (loss), and common expenses are allocated to shareholders based on the daily net assets of each class. Dividends are declared separately for each class. Differences in per share dividend rates are generally due to differences in separate class expenses. The fund’s distributions declared to shareholders as reported in the Statements of Changes in Net Assets are presented by class as follows:
| | | | | | | | |
| | | From net realized
gain | |
| | |
| | | Year ended
12/31/18 | | | Year ended
12/31/17 | |
| Initial Class | | | $1,094,630 | | | | $498,246 | |
| Service Class | | | 14,507,522 | | | | 3,820,975 | |
| Total | | | $15,602,152 | | | | $4,319,221 | |
| (3) | | Transactions with Affiliates |
Investment Adviser– The fund has an investment advisory agreement with MFS to provide overall investment management and related administrative services and facilities to the fund. The management fee is computed daily and paid monthly at the following annual rates based on the fund’s average daily net assets:
| | | | |
| Up to $1 billion | | | 0.75% | |
| In excess of $1 billion | | | 0.70% | |
MFS has agreed in writing to reduce its management fee by a specified amount if certain MFS mutual fund assets exceed thresholds agreed to by MFS and the fund’s Board of Trustees. For the year ended December 31, 2018, this management fee reduction amounted to $21,868, which is included in the reduction of total expenses in the Statement of Operations. The management fee incurred for the year ended December 31, 2018 was equivalent to an annual effective rate of 0.74% of the fund’s average daily net assets.
The investment adviser has agreed in writing to pay a portion of the fund’s total annual operating expenses, excluding interest, taxes, extraordinary expenses, brokerage and transaction costs, and investment-related expenses (such as short sale dividend and interest expenses incurred in connection with the fund’s investment activity), such that total annual operating expenses do not exceed 1.00% of average daily net assets for the Initial Class shares and 1.25% of average daily net assets for the Service Class shares. This written agreement will continue until modified by the fund’s Board of Trustees, but such agreement will continue at least until April 30, 2020. For the year ended December 31, 2018, the fund’s actual operating expenses did not exceed the limit and therefore, the investment adviser did not pay any portion of the fund’s expenses related to this agreement.
Distributor– MFS Fund Distributors, Inc. (MFD), a wholly-owned subsidiary of MFS, is the distributor of shares of the fund. The Trustees have adopted a distribution plan for the Service Class shares pursuant to Rule12b-1 under the Investment Company Act of 1940.
The fund’s distribution plan provides that the fund will pay MFD distribution and/or service fees equal to 0.25% per annum of its average daily net assets attributable to Service Class shares as partial consideration for services performed and expenses incurred by MFD and financial intermediaries (including participating insurance companies that invest in the fund to fund variable annuity and variable life insurance contracts, sponsors of qualified retirement and pension plans that invest in the fund, and affiliates of these participating insurance companies and plan sponsors) in connection with the sale and distribution of the Service Class shares. MFD may subsequently pay all, or a portion, of the distribution and/or service fees to financial intermediaries.
Shareholder Servicing Agent– MFS Service Center, Inc. (MFSC), a wholly-owned subsidiary of MFS, receives a fee from the fund for its services as shareholder servicing agent. For the year ended December 31, 2018, the fee was $9,326, which equated to 0.0040% annually of the fund’s average daily net assets. MFSC also receives payment from the fund forout-of-pocket expenses paid by MFSC on behalf of the fund. For the year ended December 31, 2018, these costs amounted to $304.
17
MFS Technology Portfolio
Notes to Financial Statements – continued
Administrator– MFS provides certain financial, legal, shareholder communications, compliance, and other administrative services to the fund. Under an administrative services agreement, the fund reimburses MFS the costs incurred to provide these services. The fund is charged an annual fixed amount of $17,500 plus a fee based on average daily net assets. The administrative services fee incurred for the year ended December 31, 2018 was equivalent to an annual effective rate of 0.0189% of the fund’s average daily net assets.
Trustees’ and Officers’ Compensation– The fund pays compensation to independent Trustees in the form of a retainer, attendance fees, and additional compensation to Board and Committee chairpersons. The fund does not pay compensation directly to Trustees or officers of the fund who are also officers of the investment adviser, all of whom receive remuneration for their services to the fund from MFS. Certain officers and Trustees of the fund are officers or directors of MFS, MFD, and MFSC.
Other– This fund and certain other funds managed by MFS (the funds) have entered into a service agreement (the ISO Agreement) which provides for payment of fees solely by the funds to Tarantino LLC in return for the provision of services of an Independent Senior Officer (ISO) for the funds. Frank L. Tarantino serves as the ISO and is an officer of the funds and the sole member of Tarantino LLC. The funds can terminate the ISO Agreement with Tarantino LLC at any time under the terms of the ISO Agreement. For the year ended December 31, 2018, the fee paid by the fund under this agreement was $393 and is included in “Miscellaneous” expense in the Statement of Operations. MFS has agreed to bear all expenses associated with office space, other administrative support, and supplies provided to the ISO.
The fund invests in the MFS Institutional Money Market Portfolio which is managed by MFS and seeks current income consistent with preservation of capital and liquidity. This money market fund does not pay a management fee to MFS.
The fund is permitted to engage in purchase and sale transactions with funds and accounts for which MFS serves as investment adviser orsub-adviser (“cross-trades”) pursuant to a policy adopted by the Board of Trustees. This policy has been designed to ensure that cross-trades conducted by the fund comply with Rule17a-7 under the Investment Company Act of 1940. During the year ended December 31, 2018, the fund engaged in sale transactions pursuant to this policy, which amounted to $94,766. The sales transactions resulted in net realized gains (losses) of $(9,250).
Effective on or about January 3, 2018, the adviser has voluntarily undertaken to reimburse the fund from its own resources on a quarterly basis for the cost of investment research embedded in the cost of the fund’s securities trades. This agreement may be rescinded at any time. For the period on or about January 3, 2018 to December 31, 2018, this reimbursement amounted to $18,882, which is included in “Other” income in the Statement of Operations.
For the year ended December 31, 2018, purchases and sales of investments, other thanin-kind transactions, short sales, andshort-term obligations, aggregated $88,842,322 and $84,647,364, respectively.
| (5) | | Shares of Beneficial Interest |
The fund’s Declaration of Trust permits the Trustees to issue an unlimited number of full and fractional shares of beneficial interest. Transactions in fund shares were as follows:
| | | | | | | | | | | | | | | | |
| | | Year ended 12/31/18 | | | Year ended 12/31/17 | |
| | | | |
| | | Shares | | | Amount | | | Shares | | | Amount | |
| Shares sold | | | | | | | | | | | | | | | | |
Initial Class | | | 93,157 | | | | $1,884,589 | | | | 570,136 | | | | $9,085,607 | |
Service Class | | | 2,524,146 | | | | 48,418,535 | | | | 3,158,826 | | | | 49,001,289 | |
| | | 2,617,303 | | | | $50,303,124 | | | | 3,728,962 | | | | $58,086,896 | |
| Shares issued to shareholders in reinvestment of distributions | | | | | | | | | | | | | | | | |
Initial Class | | | 51,805 | | | | $1,094,630 | | | | 30,178 | | | | $498,246 | |
Service Class | | | 723,567 | | | | 14,507,522 | | | | 242,602 | | | | 3,820,974 | |
| | | 775,372 | | | | $15,602,152 | | | | 272,780 | | | | $4,319,220 | |
| Shares reacquired | | | | | | | | | | | | | | | | |
Initial Class | | | (701,868 | ) | | | $(14,582,305 | ) | | | (212,150 | ) | | | $(3,419,215 | ) |
Service Class | | | (12,758,134 | ) | | | (234,940,678 | ) | | | (1,538,347 | ) | | | (24,076,077 | ) |
| | | (13,460,002 | ) | | | $(249,522,983 | ) | | | (1,750,497 | ) | | | $(27,495,292 | ) |
| Net change | | | | | | | | | | | | | | | | |
Initial Class | | | (556,906 | ) | | | $(11,603,086 | ) | | | 388,164 | | | | $6,164,638 | |
Service Class | | | (9,510,421 | ) | | | (172,014,621 | ) | | | 1,863,081 | | | | 28,746,186 | |
| | | (10,067,327 | ) | | | $(183,617,707 | ) | | | 2,251,245 | | | | $34,910,824 | |
18
MFS Technology Portfolio
Notes to Financial Statements – continued
The fund and certain other funds managed by MFS participate in a $1.25 billion unsecured committed line of credit, subject to a $1 billion sublimit, provided by a syndication of banks under a credit agreement. Borrowings may be made for temporary financing needs. Interest is charged to each fund, based on its borrowings, generally at a rate equal to the higher of the Overnight Bank Funding rate or daily one month LIBOR plus an agreed upon spread. A commitment fee, based on the average daily, unused portion of the committed line of credit, is allocated among the participating funds. In addition, the fund and other funds managed by MFS have established unsecured uncommitted borrowing arrangements with certain banks for temporary financing needs. Interest is charged to each fund, based on its borrowings, at a rate equal to the Overnight Bank Funding rate plus an agreed upon spread. For the year ended December 31, 2018, the fund’s commitment fee and interest expense were $1,421 and $0, respectively, and are included in “Miscellaneous” expense in the Statement of Operations.
| (7) | | Investments in Affiliated Issuers |
An affiliated issuer may be considered one in which the fund owns 5% or more of the outstanding voting securities, or a company which is under common control. For the purposes of this report, the fund assumes the following to be affiliated issuers:
| | | | | | | | | | | | | | | | | | |
| Affiliated Issuers | | | | Beginning
Shares/Par
Amount | | | Acquisitions
Shares/Par
Amount | | | Dispositions
Shares/Par
Amount | | | Ending
Shares/Par
Amount | |
| | | | | |
| MFS Institutional Money Market Portfolio | | | | | 6,212,316 | | | | 62,564,407 | | | | (67,660,006 | ) | | | 1,116,717 | |
| | | | | |
| Affiliated Issuers | | Realized
Gain (Loss) | | Change in
Unrealized
Appreciation/
Depreciation | | | Capital Gain
Distributions | | | Dividend
Income | | | Ending
Value | |
| | | | | |
| MFS Institutional Money Market Portfolio | | $(69) | | | $— | | | | $— | | | | $75,175 | | | | $1,116,606 | |
On October 19, 2018, the fund recorded a redemptionin-kind of portfolio securities and cash that were valued at $208,690,175. The redeeming shareholder generally receives a pro rata share of the securities held by the fund. The distribution of such securities generated a realized gain of $93,775,946 for the fund, which is included in Net realized gain (loss) in the Statement of Operations. For tax purposes, no gains or losses were recognized.
19
MFS Technology Portfolio
REPORT OF INDEPENDENT REGISTERED PUBLIC ACCOUNTING FIRM
To the Board of Trustees of MFS Variable Insurance Trust II and the Shareholders of MFS Technology Portfolio:
Opinion on the Financial Statements and Financial Highlights
We have audited the accompanying statement of assets and liabilities of MFS Technology Portfolio (the “Fund”), including the portfolio of investments, as of December 31, 2018, the related statement of operations for the year then ended, the statements of changes in net assets for each of the two years in the period then ended, the financial highlights for each of the five years in the period then ended, and the related notes. In our opinion, the financial statements and financial highlights present fairly, in all material respects, the financial position of the Fund as of December 31, 2018, and the results of its operations for the year then ended, the changes in its net assets for each of the two years in the period then ended, and the financial highlights for each of the five years in the period then ended, in conformity with accounting principles generally accepted in the United States of America.
Basis for Opinion
These financial statements and financial highlights are the responsibility of the Fund’s management. Our responsibility is to express an opinion on the Fund’s financial statements and financial highlights based on our audits. We are a public accounting firm registered with the Public Company Accounting Oversight Board (United States) (PCAOB) and are required to be independent with respect to the Fund in accordance with the U.S. federal securities laws and the applicable rules and regulations of the Securities and Exchange Commission and the PCAOB.
We conducted our audits in accordance with the standards of the PCAOB. Those standards require that we plan and perform the audit to obtain reasonable assurance about whether the financial statements and financial highlights are free of material misstatement, whether due to error or fraud. The Fund is not required to have, nor were we engaged to perform, an audit of its internal control over financial reporting. As part of our audits we are required to obtain an understanding of internal control over financial reporting but not for the purpose of expressing an opinion on the effectiveness of the Fund’s internal control over financial reporting. Accordingly, we express no such opinion.
Our audits included performing procedures to assess the risks of material misstatement of the financial statements and financial highlights, whether due to error or fraud, and performing procedures that respond to those risks. Such procedures included examining, on a test basis, evidence regarding the amounts and disclosures in the financial statements and financial highlights. Our audits also included evaluating the accounting principles used and significant estimates made by management, as well as evaluating the overall presentation of the financial statements and financial highlights. Our procedures included confirmation of securities owned as of December 31, 2018, by correspondence with the custodian. We believe that our audits provide a reasonable basis for our opinion.
DELOITTE & TOUCHE LLP
Boston, Massachusetts
February 15, 2019
We have served as the auditor of one or more of the MFS investment companies since 1924.
20
MFS Technology Portfolio
TRUSTEES AND OFFICERS – IDENTIFICATION AND BACKGROUND
The Trustees and Officers of the Trust, as of February 1, 2019, are listed below, together with their principal occupations during the past five years. (Their titles may have varied during that period.) The address of each Trustee and Officer is 111 Huntington Avenue, Boston, Massachusetts 02199-7618.
| | | | | | | | | | |
Name, Age | | Position(s)
Held with Fund | | Trustee/Officer
Since (h) | | Number of MFS Funds overseen by the Trustee | | Principal Occupations
During the Past Five Years | | Other Directorships During the Past Five Years (j) |
| INTERESTED TRUSTEES |
Robert J. Manning (k) (age 55) | | Trustee | | February 2004 | | 135 | | Massachusetts Financial Services Company, Executive Chairman (since January 2017); Director; Chairman of the Board; Chief Executive Officer (until 2015);Co-Chief Executive Officer(2015-2016) | | N/A |
| | | | | |
Robin A. Stelmach (k) (age 57) | | Trustee | | January 2014 | | 135 | | Massachusetts Financial Services Company, Vice Chair (since January 2017); Chief Operating Officer and Executive Vice President (until January 2017) | | N/A |
|
| INDEPENDENT TRUSTEES |
John P. Kavanaugh (age 64) | | Trustee and Chair of Trustees | | January 2009 | | 135 | | Private investor | | N/A |
| | | | | |
Steven E. Buller (age 67) | | Trustee | | February 2014 | | 135 | | Financial Accounting Standards Advisory Council, Chairman(2014-2015); Public Company Accounting Oversight Board, Standing Advisory Group, Member (until 2014); BlackRock, Inc. (investment management), Managing Director (until 2014), BlackRock Finco UK (investment management), Director (until 2014) | | N/A |
| | | | | |
John A. Caroselli (age 64) | | Trustee | | March 2017 | | 135 | | JC Global Advisors, LLC (management consulting), President (since 2015); First Capital Corporation (commercial finance), Executive Vice President (until 2015) | | N/A |
| | | | | |
Maureen R. Goldfarb (age 63) | | Trustee | | January 2009 | | 135 | | Private investor | | N/A |
| | | | | |
Michael Hegarty (age 74) | | Trustee | | December 2004 | | 135 | | Private investor | | Rouse Properties Inc., Director (until 2016); Capmark Financial Group Inc., Director (until 2015) |
| | | | | |
Peter D. Jones (age 63) | | Trustee | | January 2019 | | 135 | | Franklin Templeton Distributors, Inc. (investment management), President (until 2015); Franklin Templeton Institutional, LLC (investment management), Chairman (until 2015) | | N/A |
| | | | | |
James W. Kilman, Jr. (age 57) | | Trustee | | January 2019 | | 135 | | KielStrand Capital LLC (family office and merchant bank), Chief Executive Officer (since 2016); Morgan Stanley & Co. (financial services), Vice Chairman of Investment Banking,Co-Head of Diversified Financials Coverage – Financial Institutions Investment Banking Group (until 2016) | | alpha-En Corporation, Director (since 2016) |
21
MFS Technology Portfolio
Trustees and Officers – continued
| | | | | | | | | | |
Name, Age | | Position(s)
Held with Fund | | Trustee/Officer
Since (h) | | Number of MFS Funds overseen by the Trustee | | Principal Occupations
During the Past Five Years | | Other Directorships During the Past Five Years (j) |
Clarence Otis, Jr. (age 62) | | Trustee | | March 2017 | | 135 | | Darden Restaurants, Inc., Chief Executive Officer (until 2014) | | VF Corporation, Director; Verizon Communications, Inc., Director; The Travelers Companies, Director; Federal Reserve Bank of Atlanta, Director (until 2015) |
| | | | | |
Maryanne L. Roepke (age 62) | | Trustee | | May 2014 | | 135 | | American Century Investments (investment management), Senior Vice President and Chief Compliance Officer (until 2014) | | N/A |
| | | | | |
Laurie J. Thomsen
(age 61) | | Trustee | | March 2005 | | 135 | | Private investor | | The Travelers Companies, Director; Dycom Industries, Inc., Director (since 2015) |
| | | | | | | | |
Name, Age | | Position(s)
Held with Fund | | Trustee/Officer
Since (h) | | Number of MFS Funds for which the Person is an Officer | | Principal Occupations During the Past Five Years |
| OFFICERS | | | | | | |
Christopher R. Bohane (k)
(age 45) | | Assistant Secretary and Assistant Clerk | | July 2005 | | 135 | | Massachusetts Financial Services Company, Vice President and Assistant General Counsel |
| | | | |
Kino Clark (k) (age 50) | | Assistant Treasurer | | January 2012 | | 135 | | Massachusetts Financial Services Company, Vice President |
| | | | |
John W. Clark, Jr. (k) (age 51) | | Assistant Treasurer | | April 2017 | | 135 | | Massachusetts Financial Services Company, Vice President (since March 2017); Deutsche Bank (financial services), Department Head – Treasurer’s Office (until February 2017) |
| | | | |
Thomas H. Connors (k) (age 59) | | Assistant Secretary and Assistant Clerk | | September 2012 | | 135 | | Massachusetts Financial Services Company, Vice President and Senior Counsel |
| | | | |
Ethan D. Corey (k)
(age 55) | | Assistant
Secretary and Assistant Clerk | | July 2005 | | 135 | | Massachusetts Financial Services Company, Senior Vice President and Associate General Counsel |
| | | | |
David L. DiLorenzo (k)
(age 50) | | President | | July 2005 | | 135 | | Massachusetts Financial Services Company, Senior Vice President |
| | | | |
Heidi W. Hardin (k) (age 51) | | Secretary and Clerk | | April 2017 | | 135 | | Massachusetts Financial Services Company, Executive Vice President and General Counsel (since March 2017); Harris Associates (investment management), General Counsel (from September 2015 to January 2017); Janus Capital Management LLC (investment management), Senior Vice President and General Counsel (until September 2015) |
| | | | |
Brian E. Langenfeld (k) (age 45) | | Assistant
Secretary and Assistant Clerk | | June 2006 | | 135 | | Massachusetts Financial Services Company, Vice President and Senior Counsel |
| | | | |
Amanda S. Mooradian (k) (age 39) | | Assistant
Secretary and Assistant Clerk | | September 2018 | | 135 | | Massachusetts Financial Services Company, Assistant Vice President and Counsel |
| | | | |
Susan A. Pereira (k)
(age 48) | | Assistant
Secretary and Assistant Clerk | | July 2005 | | 135 | | Massachusetts Financial Services Company, Vice President and Senior Counsel |
| | | | |
Kasey L. Phillips (k) (age 48) | | Assistant Treasurer | | September 2012 | | 135 | | Massachusetts Financial Services Company, Vice President |
| | | | |
Matthew A. Stowe (k) (age 44) | | Assistant Secretary and Assistant Clerk | | October 2014 | | 135 | | Massachusetts Financial Services Company, Vice President and Assistant General Counsel |
22
MFS Technology Portfolio
Trustees and Officers – continued
| | | | | | | | |
Name, Age | | Position(s)
Held with Fund | | Trustee/Officer
Since (h) | | Number of MFS Funds for which the Person is an Officer | | Principal Occupations During the Past Five Years |
Frank L. Tarantino
(age 74) | | Independent
Senior Officer | | June 2004 | | 135 | | Tarantino LLC (provider of compliance services), Principal |
| | | | |
Richard S. Weitzel (k)
(age 48) | | Assistant Secretary and Assistant Clerk | | October 2007 | | 135 | | Massachusetts Financial Services Company, Senior Vice President and Associate General Counsel |
| | | | |
Martin J. Wolin (k) (age 51) | | Chief Compliance Officer | | July 2015 | | 135 | | Massachusetts Financial Services Company, Senior Vice President and Chief Compliance Officer (since July 2015); Mercer (financial service provider), Chief Risk and Compliance Officer, North America and Latin America (until June 2015) |
| | | | |
James O. Yost (k)
(age 58) | | Treasurer | | September 1990 | | 135 | | Massachusetts Financial Services Company, Senior Vice President |
| (h) | Date first appointed to serve as Trustee/officer of an MFS Fund. Each Trustee has served continuously since appointment unless indicated otherwise. For the period from December 15, 2004 until February 22, 2005, Mr. Manning served as Advisory Trustee. From January 2012 through December 2016, Messrs. DiLorenzo and Yost served as Treasurer and Deputy Treasurer of the Funds, respectively. |
| (j) | Directorships or trusteeships of companies required to report to the Securities and Exchange Commission (i.e., “public companies”). |
| (k) | “Interested person” of the Trust within the meaning of the Investment Company Act of 1940 (referred to as the 1940 Act), which is the principal federal law governing investment companies like the fund, as a result of a position with MFS. The address of MFS is 111 Huntington Avenue, Boston, Massachusetts 02199-7618. |
Each Trustee has been elected by shareholders and each Trustee and officer holds office until his or her successor is chosen and qualified or until his or her earlier death, resignation, retirement or removal. The Trust does not hold annual meetings for the purpose of electing Trustees, and Trustees are not elected for fixed terms. Under the terms of the Board’s retirement policy, an Independent Trustee shall retire at the end of the calendar year in which he or she reaches the earlier of 75 years of age or 15 years of service on the Board (or, in the case of any Independent Trustee who joined the Board prior to 2015, 20 years of service on the Board).
Messrs. Buller, Hegarty, Kilman and Otis and Ms. Roepke are members of the Trust’s Audit Committee.
Each of the Interested Trustees and certain Officers hold comparable officer positions with certain affiliates of MFS.
The Statement of Additional Information for a Fund includes further information about the Trustees and is available without charge upon request by calling1-800-225-2606.
| | |
Investment Adviser Massachusetts Financial Services Company 111 Huntington Avenue Boston, MA 02199-7618 | | Custodian State Street Bank and Trust Company 1 Lincoln Street Boston, MA 02111-2900 |
| |
Distributor MFS Fund Distributors, Inc. 111 Huntington Avenue Boston, MA 02199-7618 | | Independent Registered Public Accounting Firm Deloitte & Touche LLP 200 Berkeley Street Boston, MA 02116 |
| |
Portfolio Manager(s) Matthew Sabel | | |
23
MFS Technology Portfolio
BOARD REVIEW OF INVESTMENT ADVISORY AGREEMENT
The Investment Company Act of 1940 requires that both the full Board of Trustees and a majority of thenon-interested (“independent”) Trustees, voting separately, annually approve the continuation of the Fund’s investment advisory agreement with MFS. The Trustees consider matters bearing on the Fund and its advisory arrangements at their meetings throughout the year, including a review of performance data at each regular meeting. In addition, the independent Trustees met several times over the course of three months beginning in May and ending in July, 2018 (“contract review meetings”) for the specific purpose of considering whether to approve the continuation of the investment advisory agreement for the Fund and the other investment companies that the Board oversees (the “MFS Funds”). The independent Trustees were assisted in their evaluation of the Fund’s investment advisory agreement by independent legal counsel, from whom they received separate legal advice and with whom they met separately from MFS during various contract review meetings. The independent Trustees were also assisted in this process by the MFS Funds’ Independent Senior Officer, a senior officer appointed by and reporting to the independent Trustees.
In connection with their deliberations regarding the continuation of the investment advisory agreement, the Trustees, including the independent Trustees, considered such information and factors as they believed, in light of the legal advice furnished to them and their own business judgment, to be relevant. The investment advisory agreement for the Fund was considered separately, although the Trustees also took into account the common interests of all MFS Funds in their review. As described below, the Trustees considered the nature, quality, and extent of the various investment advisory, administrative, and shareholder services performed by MFS under the existing investment advisory agreement and other arrangements with the Fund.
In connection with their contract review meetings, the Trustees received and relied upon materials that included, among other items: (i) information provided by Broadridge Financial Solutions, Inc. (“Broadridge”), an independent third party, on the investment performance of the Fund for various time periods ended December 31, 2017 and the investment performance of a group of funds with substantially similar investment classifications/objectives (the “Broadridge performance universe”), (ii) information provided by Broadridge on the Fund’s advisory fees and other expenses and the advisory fees and other expenses of comparable funds identified by Broadridge (the “Broadridge expense group”), (iii) information provided by MFS on the advisory fees of portfolios of other clients of MFS, including institutional separate accounts and other clients, (iv) information as to whether and to what extent applicable expense waivers, reimbursements or fee “breakpoints” are observed for the Fund, (v) information regarding MFS’ financial results and financial condition, including MFS’ and certain of its affiliates’ estimated profitability from services performed for the Fund and the MFS Funds as a whole, and compared to MFS’ institutional business, (vi) MFS’ views regarding the outlook for the mutual fund industry and the strategic business plans of MFS, (vii) descriptions of various functions performed by MFS for the Funds, such as compliance monitoring and portfolio trading practices, and (viii) information regarding the overall organization of MFS, including information about MFS’ senior management and other personnel providing investment advisory, administrative and other services to the Fund and the other MFS Funds. The comparative performance, fee and expense information prepared and provided by Broadridge was not independently verified and the independent Trustees did not independently verify any information provided to them by MFS.
The Trustees’ conclusion as to the continuation of the investment advisory agreement was based on a comprehensive consideration of all information provided to the Trustees and not the result of any single factor. Some of the factors that figured particularly in the Trustees’ deliberations are described below, although individual Trustees may have evaluated the information presented differently from one another, giving different weights to various factors. It is also important to recognize that the fee arrangements for the Fund and other MFS Funds are the result of years of review and discussion between the independent Trustees and MFS, that certain aspects of such arrangements may receive greater scrutiny in some years than in others, and that the Trustees’ conclusions may be based, in part, on their consideration of these same arrangements during the course of the year and in prior years.
Based on information provided by Broadridge and MFS, the Trustees reviewed the Fund’s total return investment performance as well as the Broadridge performance universe over various time periods. The Trustees placed particular emphasis on the total return performance of the Fund’s Initial Class shares in comparison to the performance of funds in its Broadridge performance universe over the three-year period ended December 31, 2017, which the Trustees believed was a long enough period to reflect differing market conditions. The total return performance of the Fund’s Initial Class shares was in the 2nd quintile relative to the other funds in the universe for this three-year period (the 1st quintile being the best performers and the 5th quintile being the worst performers). The total return performance of the Fund’s Initial Class shares was in the 2nd quintile for theone-year period and the 3rd quintile for the five-year period ended December 31, 2017 relative to the Broadridge performance universe. Because of the passage of time, these performance results may differ from the performance results for more recent periods, including those shown elsewhere in this report.
In the course of their deliberations, the Trustees took into account information provided by MFS in connection with the contract review meetings, as well as during investment review meetings conducted with portfolio management personnel during the course of the year regarding the Fund’s performance. After reviewing these and related factors, the Trustees concluded, within the context of their overall conclusions regarding the investment advisory agreement, that they were satisfied with MFS’ responses and efforts relating to investment performance.
24
MFS Technology Portfolio
Board Review of Investment Advisory Agreement – continued
In assessing the reasonableness of the Fund’s advisory fee, the Trustees considered, among other information, the Fund’s advisory fee and the total expense ratio of the Fund’s Initial Class shares as a percentage of average daily net assets and the advisory fee and total expense ratios of peer groups of funds based on information provided by Broadridge. The Trustees considered that MFS currently observes an expense limitation for the Fund, which may not be changed without the Trustees’ approval. The Trustees also considered that, according to the data provided by Broadridge (which takes into account any fee reductions or expense limitations that were in effect during the Fund’s last fiscal year), the Fund’s effective advisory fee rate and total expense ratio were each approximately at the Broadridge expense group median.
The Trustees also considered the advisory fees charged by MFS to any institutional separate accounts advised by MFS (“separate accounts”) and unaffiliated investment companies for which MFS serves as subadviser (“subadvised funds”) that have comparable investment strategies to the Fund, if any. In comparing these fees, the Trustees considered information provided by MFS as to the generally broader scope of services provided by MFS to the Fund, as well as the more extensive regulatory burdens imposed on MFS in managing the Fund, in comparison to separate accounts and subadvised funds. The Trustees also considered the higher demands placed on MFS’ investment personnel and trading infrastructure as a result of the daily cashin-flows andout-flows of the Fund in comparison to separate accounts.
The Trustees also considered whether the Fund may benefit from any economies of scale in the management of the Fund in the event of growth in assets of the Fund and/or growth in assets of the MFS Funds as a whole. They noted that the Fund’s advisory fee rate schedule is subject to a contractual breakpoint that reduces the Fund’s advisory fee rate on average daily net assets over $1 billion. The Trustees also noted that MFS has agreed in writing to waive a portion of the management fees of certain MFS Funds, including the Fund, if the total combined assets of certain funds within the MFS Funds’ complex increase above agreed upon thresholds (the “group fee waiver”), enabling the Fund’s shareholders to share in the benefits from any economies of scale at the complex level. The group fee waiver is reviewed and renewed annually between the Board and MFS. The Trustees concluded that the breakpoint and the group fee waiver were sufficient to allow the Fund to benefit from economies of scale as its assets and overall complex assets grow.
The Trustees also considered information prepared by MFS relating to MFS’ costs and profits with respect to the Fund, the MFS Funds considered as a group, and other investment companies and accounts advised by MFS, as well as MFS’ methodologies used to determine and allocate its costs to the MFS Funds, the Fund and other accounts and products for purposes of estimating profitability.
After reviewing these and other factors described herein, the Trustees concluded, within the context of their overall conclusions regarding the investment advisory agreement, that the advisory fees charged to the Fund represent reasonable compensation in light of the services being provided by MFS to the Fund.
In addition, the Trustees considered MFS’ resources and related efforts to continue to retain, attract and motivate capable personnel to serve the Fund. The Trustees also considered current and developing conditions in the financial services industry, including the presence of large and well-capitalized companies which are spending, and appear to be prepared to continue to spend, substantial sums to engage personnel and to provide services to competing investment companies. In this regard, the Trustees also considered the financial resources of MFS and its ultimate parent, Sun Life Financial Inc. The Trustees also considered the advantages and possible disadvantages to the Fund of having an adviser that also serves other investment companies as well as other accounts.
The Trustees also considered the nature, quality, cost, and extent of administrative, transfer agency, and distribution services provided to the Fund by MFS and its affiliates under agreements and plans other than the investment advisory agreement, including any12b-1 fees the Fund pays to MFS Fund Distributors, Inc., an affiliate of MFS. The Trustees also considered the nature, extent and quality of certain other services MFS performs or arranges for on the Fund’s behalf, which may include securities lending programs, directed expense payment programs, class action recovery programs, and MFS’ interaction with third-party service providers, principally custodians andsub-custodians. The Trustees concluded that the variousnon-advisory services provided by MFS and its affiliates on behalf of the Fund were satisfactory.
The Trustees consideredso-called“fall-out benefits” to MFS such as reputational value derived from serving as investment manager to the MFS Funds. The Trustees also considered that, effective January 3, 2018, MFS had discontinued its historic practice of obtaining investment research from portfolio brokerage commissions paid by certain MFS Funds and would thereafter voluntarily reimburse a Fund, if applicable, for the costs of external research acquired through the use of the Fund’s portfolio brokerage commissions.
Based on their evaluation of factors that they deemed to be material, including those factors described above, the Board of Trustees, including the independent Trustees, concluded that the Fund’s investment advisory agreement with MFS should be continued for an additionalone-year period, commencing August 1, 2018.
25
MFS Technology Portfolio
PROXY VOTING POLICIES AND INFORMATION
MFS votes proxies on behalf of the fund pursuant to proxy voting policies and procedures that are available without charge, upon request, by calling 1-800-225-2606, by visitingmfs.com/proxyvoting, or by visiting the SEC’s Web site athttp://www.sec.gov.
Information regarding how the fund voted proxies relating to portfolio securities during the most recent twelve-month period ended June 30 is available by August 31 of each year without charge by visitingmfs.com/proxyvoting, or by visiting the SEC’s Web site athttp://www.sec.gov.
QUARTERLY PORTFOLIO DISCLOSURE
The fund files a complete schedule of portfolio holdings with the SEC for the first and third quarters of each fiscal year on Form N-Q. The fund’s Form N-Q is available on the SEC’s website athttp://www.sec.gov.A shareholder can obtain the portfolio holdings report for the first and third quarters of the fund’s fiscal year atmfs.com/vit2 by choosing the fund’s name and then selecting the “Resources” tab and clicking on “Prospectus and Reports”.
FURTHER INFORMATION
From time to time, MFS may post important information about the fund or the MFS funds on the MFS web site (mfs.com). This information is available athttps://www.mfs.com/en-us/what-we-do/announcements.htmlor atmfs.com/vit2 by choosing the fund’s name.
INFORMATION ABOUT FUND CONTRACTS AND LEGAL CLAIMS
The fund has entered into contractual arrangements with an investment adviser, administrator, distributor, shareholder servicing agent, 529 program manager (if applicable), and custodian who each provide services to the fund. Unless expressly stated otherwise, shareholders are not parties to, or intended beneficiaries of these contractual arrangements, and these contractual arrangements are not intended to create any shareholder right to enforce them against the service providers or to seek any remedy under them against the service providers, either directly or on behalf of the fund.
Under the Trust’s By-Laws and Declaration of Trust, any claims asserted against or on behalf of the MFS Funds, including claims against Trustees and Officers, must be brought in state and federal courts located within the Commonwealth of Massachusetts.
FEDERAL TAX INFORMATION (unaudited)
The following information is provided pursuant to provisions of the Internal Revenue Code.
The fund designates $13,195,000 as capital gain dividends paid during the fiscal year.
For corporate shareholders, 48.96% of the ordinary income dividends paid during the fiscal year qualify for the corporate dividends received deduction.
26
rev. 3/16
| | | | |
| FACTS | | WHAT DOES MFS DO WITH YOUR
PERSONAL INFORMATION? | |  |
| | |
| Why? | | Financial companies choose how they share your personal information. Federal law gives consumers the right to limit some but not all sharing. Federal law also requires us to tell you how we collect, share, and protect your personal information. Please read this notice carefully to understand what we do. |
| | |
| What? | | The types of personal information we collect and share depend on the product or service you have with us. This information can include: • Social Security number and account balances • Account transactions and transaction history • Checking account information and wire transfer instructions When you areno longer our customer, we continue to share your information as described in this notice. |
| | |
| How? | | All financial companies need to share customers’ personal information to run their everyday business. In the section below, we list the reasons financial companies can share their customers’ personal information; the reasons MFS chooses to share; and whether you can limit this sharing. |
| | | | |
Reasons we can share your
personal information | | Does MFS share? | | Can you limit this
sharing? |
For our everyday business purposes – such as to process your transactions, maintain your account(s), respond to court orders and legal investigations, or report to credit bureaus | | Yes | | No |
For our marketing purposes – to offer our products and services to you | | No | | We don’t share |
| For joint marketing with other financial companies | | No | | We don’t share |
For our affiliates’ everyday business purposes – information about your transactions and experiences | | No | | We don’t share |
For our affiliates’ everyday business purposes – information about your creditworthiness | | No | | We don’t share |
| For nonaffiliates to market to you | | No | | We don’t share |
| | |
| Questions? | | Call800-225-2606 or go tomfs.com. |
27
| | |
| Who we are |
| Who is providing this notice? | | MFS Funds, MFS Investment Management, MFS Institutional Advisors, Inc., and MFS Heritage Trust Company. |
| | |
| What we do |
| How does MFS protect my personal information? | | To protect your personal information from unauthorized access and use, we use security measures that comply with federal law. These measures include procedural, electronic, and physical safeguards for the protection of the personal information we collect about you. |
How does MFS
collect my personal information? | | We collect your personal information, for example, when you • open an account or provide account information • direct us to buy securities or direct us to sell your securities • make a wire transfer We also collect your personal information from others, such as credit bureaus, affiliates, or other companies. |
| Why can’t I limit all sharing? | | Federal law gives you the right to limit only • sharing for affiliates’ everyday business purposes – information about your creditworthiness • affiliates from using your information to market to you • sharing for nonaffiliates to market to you State laws and individual companies may give you additional rights to limit sharing. |
| | |
| Definitions |
| Affiliates | | Companies related by common ownership or control. They can be financial and nonfinancial companies. • MFS does not share personal information with affiliates, except for everyday business purposes as described on page one of this notice. |
| Nonaffiliates | | Companies not related by common ownership or control. They can be financial and nonfinancial companies. • MFS does not share with nonaffiliates so they can market to you. |
| Joint marketing | | A formal agreement between nonaffiliated financial companies that together market financial products or services to you. • MFS doesn’t jointly market. |
| | |
| Other important information |
| If you own an MFS product or receive an MFS service in the name of a third party such as a bank or broker-dealer, their privacy policy may apply to you instead of ours. |
28
Annual Report
December 31, 2018

MFS® U.S. Government Money Market Portfolio

MFS® Variable Insurance Trust II
Beginning on January 1, 2021, as permitted by regulations adopted by the U.S. Securities and Exchange Commission, the insurance company that offers your contract may determine that it will no longer send you paper copies of the fund’s annual and semiannual shareholder reports unless you specifically request paper copies from the insurance company or from your financial intermediary. Instead, the shareholder reports will be made available on a Web site (insurancefunds.mfs.com or other Web site of which you will be notified), and the insurance company will notify you by mail each time a report is posted and provide you with a Web site link to access the report. Instructions for requesting paper copies will be provided by your insurance company or financial intermediary.
If you already elected to receive shareholder reports by email, you will not be affected by this change and you need not take any action. If your insurance company or financial intermediary offers electronic delivery, you may elect to receive shareholder reports and other communications from the insurance company or financial intermediary by email by following the instructions provided by the insurance company or financial intermediary.
Beginning on January 1, 2019, you may elect to receive all future reports in paper free of charge from the insurance company or financial intermediary. You can inform the insurance company or financial intermediary that you wish to continue receiving paper copies of your shareholder reports by contacting your insurance company or financial intermediary. Your election to receive reports in paper will apply to all funds held in your account with your insurance company or financial intermediary.
MKS-ANN
MFS® U.S. Government Money Market Portfolio
CONTENTS
The report is prepared for the general information of contract owners. It is authorized for distribution to prospective investors only when preceded or accompanied by a current prospectus.
NOT FDIC INSURED• MAY LOSE VALUE• NO BANK OR CREDIT UNION GUARANTEE• NOT A DEPOSIT• NOT INSURED BY ANY FEDERAL GOVERNMENT AGENCY OR NCUA/NCUSIF
MFS U.S. Government Money Market Portfolio
LETTER FROM THE EXECUTIVE CHAIRMAN

Dear Contract Owners:
Higher interest rates, international trade friction, and geopolitical uncertainty surrounding issues such as Brexit have contributed to an uptick in market volatility in recent quarters — a departure from thelow-volatility environment that prevailed for much of the past several years. Against this more challenging backdrop, equity markets in the United States outperformed most international markets on a relative basis in 2018, though broad market returns were modestly negative on an absolute basis. Global economic growth has become less synchronized over the past few quarters, with Europe, China, and some emerging markets having shown signs of significantly slowing growth. While U.S. growth has remained above average, the pace of that growth slowed in the second half of 2018.
Slowing global growth and tighter financial conditions have clouded the outlook for U.S. monetary policy, with the chairman of the U.S. Federal Reserve acknowledging that policy rates are close to levels that the Fed deems neutral for the U.S. economy. This suggests that the predictable pattern of quarterly rate increases is behind us. At the same time, markets must contend with a shift from years of quantitative easing toward a cycle of quantitative tightening now that the European Central Bank has halted asset purchases. U.S. tax reforms adopted in late 2017 have been welcomed by equity markets while emerging market economies have recently had to contend with tighter financial conditions as a result of firmer U.S. interest rates and a stronger dollar. With the Republicans losing control of the U.S. House of Representatives, further meaningful U.S. fiscal stimulus appears less likely over the remainder of this presidential term. A partial U.S. government shutdown, beginning in late 2018, also added to political uncertainty. Globally, inflation remains largely subdued thanks in part to falling oil prices, but tight labor markets and moderate global demand have investors on the lookout for its potential reappearance. Increased U.S. protectionism is also a growing concern, as investors fear trade disputes could dampen business sentiment, leading to even slower global growth. While there has been progress on this front — a NAFTA replacement has been agreed upon between the U.S., Mexico, and Canada; the free trade pact with Korea has been updated; and a negotiating framework with the European Union has been agreed upon — tensions over trade with China remain quite high, though the two sides have recently returned to the negotiating table.
As a global investment manager with nearly a century of expertise, MFS® firmly believes active risk management offers downside mitigation and may help improve investment outcomes. We built our active investment platform with this belief in mind. Ourlong-term perspective influences nearly every aspect of our business, ensuring our investment decisions align with the investing time horizons of our clients.
Respectfully,

Robert J. Manning
Executive Chairman
MFS Investment Management
February 15, 2019
The opinions expressed in this letter are subject to change and may not be relied upon for investment advice. No forecasts can be guaranteed.
1
MFS U.S. Government Money Market Portfolio
PORTFOLIO COMPOSITION
Portfolio structure (u)
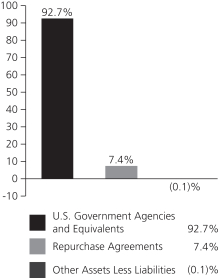
| | | | |
| Composition including fixed income credit quality (a)(u) | |
| A-1+ | | | 11.2% | |
| A-1 | | | 88.9% | |
| Other Assets Less Liabilities | | | (0.1)% | |
| | | | |
| Maturity breakdown (u) | | | | |
| 0 - 7 days | | | 29.0% | |
| 8 - 29 days | | | 59.5% | |
| 30 - 59 days | | | 10.5% | |
| 60 - 89 days | | | 1.1% | |
| Other Assets Less Liabilities | �� | | (0.1)% | |
| (a) | Ratings are assigned to portfolio securities utilizing ratings from Moody’s, Fitch, and Standard & Poor’s rating agencies and applying the following hierarchy: If all three agencies provide a rating, the middle rating (after dropping the highest and lowest ratings) is assigned; if two of the three agencies rate a security, the lower of the two is assigned. Ratings are shown in the S&P scale. All ratings are subject to change. The fund is not rated by these agencies. |
| (u) | For purposes of this presentation, accrued interest, where applicable, is included. |
Percentages are based on net assets as of December 31, 2018.
The portfolio is actively managed and current holdings may be different.
2
MFS U.S. Government Money Market Portfolio
PERFORMANCE SUMMARY THROUGH 12/31/18
Total returns as well as the current 7-day yield have been provided for the applicable time periods. Performance results reflect the percentage change in net asset value, including the reinvestment of any dividends and capital gains distributions. (See Notes to Performance Summary.) An investment in the portfolio is not insured or guaranteed by the Federal Deposit Insurance Corporation or any other government agency. Although the fund seeks to preserve the value of your investment at $1.00 per unit, it is possible to lose money by investing in the fund.
Performance data shown represents past performance and is no guarantee of future results. Investment return and principal value fluctuate so your units, when sold, may be worth more or less than the original cost; current performance may be lower or higher than quoted. The performance shown does not reflect the deduction of taxes, if any, that a contract holder would pay on fund distributions or the redemption of contract units. The returns for the fund shown also do not reflect the deduction of expenses associated with variable products, such as mortality and expense risk charges, separate account charges, and sales charges imposed by the insurance company separate accounts. Such expenses would reduce the overall returns shown.
| | | | | | | | | | |
| | | Share Class | | Inception | | 1-Year Total Return | | Current 7-day yield | | |
| | | Initial Class | | 7/19/85 | | 1.26% | | 1.77% | | |
| | | Service Class | | 8/24/01 | | 1.26% | | 1.77% | | |
Notes to Performance Summary
Yields quoted are based on the latest seven days ended as of December 31, 2018, with dividends annualized. The yield quotations more closely reflect the current earnings of the fund than the total return quotations.
Performance results reflect any applicable expense subsidies, waivers and adjustments in effect during the periods shown. Without such subsidies and waivers the fund’s performance results would be less favorable. Please see the prospectus and financial statements for complete details. All results are historical and assume the reinvestment of any dividends and capital gain distributions.
3
MFS U.S. Government Money Market Portfolio
EXPENSE TABLE
Fund Expenses Borne by the Contract Holders during the Period,
July 1, 2018 through December 31, 2018
As a contract holder of the fund, you incur ongoing costs, including management fees; distribution and/or service (12b-1) fees; and other fund expenses. This example is intended to help you understand your ongoing costs (in dollars) of investing in the fund and to compare these costs with the ongoing costs of investing in other mutual funds.
The example is based on an investment of $1,000 invested at the beginning of the period and held for the entire period July 1, 2018 through December 31, 2018.
Actual Expenses
The first line for each share class in the following table provides information about actual account values and actual expenses. You may use the information in this line, together with the amount you invested, to estimate the expenses that you paid over the period. Simply divide your account value by $1,000 (for example, an $8,600 account value divided by $1,000 = 8.6), then multiply the result by the number in the first line under the heading entitled “Expenses Paid During Period” to estimate the expenses you paid on your account during this period.
Hypothetical Example for Comparison Purposes
The second line for each share class in the following table provides information about hypothetical account values and hypothetical expenses based on the fund’s actual expense ratio and an assumed rate of return of 5% per year before expenses, which is not the fund’s actual return. The hypothetical account values and expenses may not be used to estimate the actual ending account balance or expenses you paid for the period. You may use this information to compare the ongoing costs of investing in the fund and other funds. To do so, compare this 5% hypothetical example with the 5% hypothetical examples that appear in the shareholder reports of the other funds.
Please note that the expenses shown in the table are meant to highlight the fund’s ongoing costs only and do not take into account the fees and expenses imposed under the variable contracts through which your investment in the fund is made. Therefore, the second line for each share class in the table is useful in comparing ongoing costs associated with an investment in vehicles (such as the fund) which fund benefits under variable annuity and variable life insurance contracts and to qualified pension and retirement plans only, and will not help you determine the relative total costs of investing in the fund through variable annuity and variable life insurance contracts. If the fees and expenses imposed under the variable contracts were included, your costs would have been higher.
| | | | | | | | | | | | | | | | | | |
| Share Class | | | | Annualized
Expense Ratio | | | Beginning
Account Value
7/01/18 | | | Ending
Account Value
12/31/18 | | | Expenses Paid
During Period (p)
7/01/18-12/31/18 | |
| Initial Class | | Actual | | | 0.55% | | | | $1,000.00 | | | | $1,007.67 | | | | $2.78 | |
| | Hypothetical (h) | | | 0.55% | | | | $1,000.00 | | | | $1,022.43 | | | | $2.80 | |
| Service Class | | Actual | | | 0.55% | | | | $1,000.00 | | | | $1,007.67 | | | | $2.78 | |
| | Hypothetical (h) | | | 0.55% | | | | $1,000.00 | | | | $1,022.43 | | | | $2.80 | |
| (h) | 5% class return per year before expenses. |
| (p) | “Expenses Paid During Period” are equal to each class’s annualized expense ratio, as shown above, multiplied by the average account value over the period, multiplied by 184/365 (to reflect theone-half year period). |
4
MFS U.S. Government Money Market Portfolio
PORTFOLIO OF INVESTMENTS – 12/31/18
The Portfolio of Investments is a complete list of all securities owned by your fund. It is categorized by broad-based asset classes.
| | | | | | | | |
| | |
| Issuer | | Shares/Par | | | Value ($) | |
U.S. GOVERNMENT AGENCIES AND
EQUIVALENTS (y) – 92.7% | |
| Fannie Mae, 2.248%, due 1/04/2019 | | $ | 3,100,000 | | | $ | 3,099,429 | |
| Fannie Mae, 2.264%, due 1/04/2019 | | | 4,100,000 | | | | 4,099,240 | |
| Fannie Mae, 2.278%, due 1/09/2019 | | | 11,600,000 | | | | 11,594,226 | |
| Fannie Mae, 2.285%, due 1/09/2019 | | | 100,000 | | | | 99,950 | |
| Fannie Mae, 2.326%, due 1/09/2019 | | | 100,000 | | | | 99,949 | |
| Fannie Mae, 2.288%, due 1/14/2019 | | | 600,000 | | | | 599,512 | |
| Fannie Mae, 2.257%, due 1/15/2019 | | | 22,500,000 | | | | 22,480,575 | |
| Fannie Mae, 2.314%, due 1/16/2019 | | | 8,300,000 | | | | 8,292,150 | |
| Fannie Mae, 2.329%, due 1/28/2019 | | | 100,000 | | | | 99,828 | |
| Fannie Mae, 2.355%, due 1/30/2019 | | | 9,100,000 | | | | 9,083,066 | |
| Federal Farm Credit Bank, 2.29%, due 1/03/2019 | | | 100,000 | | | | 99,988 | |
| Federal Farm Credit Bank, 2.331%, due 1/18/2019 | | | 8,000,000 | | | | 7,991,349 | |
| Federal Farm Credit Bank, 2.332%, due 1/22/2019 | | | 9,500,000 | | | | 9,487,310 | |
| Federal Farm Credit Bank, 2.332%, due 1/23/2019 | | | 9,900,000 | | | | 9,886,145 | |
| Federal Farm Credit Bank, 2.379%, due 1/24/2019 | | | 11,800,000 | | | | 11,782,359 | |
| Federal Farm Credit Bank, 2.354%, due 1/31/2019 | | | 11,600,000 | | | | 11,577,670 | |
| Federal Farm Credit Bank, 2.401%, due 2/06/2019 | | | 4,300,000 | | | | 4,289,852 | |
| Federal Farm Credit Bank, 2.437%, due 3/04/2019 | | | 3,250,000 | | | | 3,236,623 | |
| Federal Home Loan Bank, 2.129%, due 1/02/2019 | | | 1,662,000 | | | | 1,661,903 | |
| Federal Home Loan Bank, 2.309%, due 1/07/2019 | | | 2,900,000 | | | | 2,898,903 | |
| Federal Home Loan Bank, 2.28%, due 1/08/2019 | | | 7,800,000 | | | | 7,796,603 | |
| Federal Home Loan Bank, 2.308%, due 1/08/2019 | | | 9,500,000 | | | | 9,495,807 | |
| Federal Home Loan Bank, 2.309%, due 1/08/2019 | | | 10,900,000 | | | | 10,895,189 | |
| Federal Home Loan Bank, 2.313%, due 1/10/2019 | | | 3,000,000 | | | | 2,998,294 | |
| Federal Home Loan Bank, 2.38%, due 1/24/2019 | | | 11,700,000 | | | | 11,682,508 | |
| Federal Home Loan Bank, 2.39%, due 1/25/2019 | | | 11,000,000 | | | | 10,982,767 | |
| Freddie Mac, 2.239%, due 1/08/2019 | | | 7,500,000 | | | | 7,496,792 | |
| Freddie Mac, 2.281%, due 1/18/2019 | | | 11,800,000 | | | | 11,787,518 | |
| | | | | | | | |
| | |
| Issuer | | Shares/Par | | | Value ($) | |
U.S. GOVERNMENT AGENCIES AND
EQUIVALENTS (y) – continued | |
| Freddie Mac, 2.301%, due 1/18/2019 | | $ | 8,700,000 | | | $ | 8,690,715 | |
| Freddie Mac, 2.302%, due 1/22/2019 | | | 2,100,000 | | | | 2,097,231 | |
| Freddie Mac, 2.311%, due 1/25/2019 | | | 9,000,000 | | | | 8,986,380 | |
| Freddie Mac, 2.311%, due 1/28/2019 | | | 4,300,000 | | | | 4,292,679 | |
| Freddie Mac, 2.311%, due 1/29/2019 | | | 10,800,000 | | | | 10,780,932 | |
| Freddie Mac, 2.362%, due 2/20/2019 | | | 100,000 | | | | 99,678 | |
| Freddie Mac, 2.383%, due 2/20/2019 | | | 4,600,000 | | | | 4,585,050 | |
| U.S. Treasury Bill, 2.341%, due 1/02/2019 | | | 7,700,000 | | | | 7,699,507 | |
| U.S. Treasury Bill, 1.785%, due 1/03/2019 | | | 7,000,000 | | | | 6,999,327 | |
| U.S. Treasury Bill, 2.324%, due 1/24/2019 | | | 7,800,000 | | | | 7,788,613 | |
| U.S. Treasury Bill, 2.396%, due 2/05/2019 | | | 100,000 | | | | 99,771 | |
| U.S. Treasury Bill, 2.349%, due 2/07/2019 | | | 2,000,000 | | | | 1,995,260 | |
| U.S. Treasury Bill, 2.386%, due 2/12/2019 | | | 100,000 | | | | 99,726 | |
| U.S. Treasury Bill, 2.374%, due 2/21/2019 | | | 7,700,000 | | | | 7,674,584 | |
| | | | | | | | |
Total U.S. Government Agencies and
Equivalents, at Amortized Cost and Value | | | $ | 267,484,958 | |
| | | | | | | | |
|
| REPURCHASE AGREEMENTS – 7.4% | |
| JPMorgan Chase & Co. Repurchase Agreement, 2.84%, dated 12/31/2018, due 1/02/2019, total to be received $18,440,909 (secured by U.S. Treasury and Federal Agency obligations valued at $18,809,749 in a jointly traded account) | | $ | 18,438,000 | | | $ | 18,438,000 | |
| Merrill Lynch, Pierce, Fenner & Smith, Inc. Repurchase Agreement, 2.94%, dated 12/31/2018, due 1/02/2019, total to be received $2,842,464 (secured by U.S. Treasury and Federal Agency obligations valued at $2,900,838 in a jointly traded account) | | | 2,842,000 | | | | 2,842,000 | |
| | | | | | | | |
Total Repurchase Agreements, at
Cost and Value | | | $ | 21,280,000 | |
| | | | | | | | |
OTHER ASSETS, LESS
LIABILITIES – (0.1)% | | | | (305,590 | ) |
| | | | | | | | |
| NET ASSETS – 100.0% | | | | | | $ | 288,459,368 | |
| | | | | | | | |
| (y) | | The rate shown represents an annualized yield at time of purchase. |
See Notes to Financial Statements
5
MFS U.S. Government Money Market Portfolio
FINANCIAL STATEMENTS | STATEMENT OF ASSETS AND LIABILITIES
This statement represents your fund’s balance sheet, which details the assets and liabilities comprising the total value of the fund.
| | | | |
At 12/31/18 | | | | |
Assets | | | | |
Investments in unaffiliated issuers, at cost and value | | | $288,764,958 | |
Cash | | | 933 | |
Receivables for | | | | |
Fund shares sold | | | 326,472 | |
Interest | | | 1,687 | |
Other assets | | | 2,259 | |
Total assets | | | $289,096,309 | |
Liabilities | | | | |
Payables for | | | | |
Fund shares reacquired | | | $561,094 | |
Payable to affiliates | | | | |
Investment adviser | | | 15,949 | |
Shareholder servicing costs | | | 57 | |
Payable for independent Trustees’ compensation | | | 18 | |
Accrued expenses and other liabilities | | | 59,823 | |
Total liabilities | | | $636,941 | |
Net assets | | | $288,459,368 | |
Net assets consist of | | | | |
Paid-in capital | | | $288,459,368 | |
Net assets | | | $288,459,368 | |
Shares of beneficial interest outstanding | | | 288,679,414 | |
| | | | | | | | | | | | |
| | | Net assets | | | Shares
outstanding | | | Net asset value
per share | |
Initial Class | | | $160,303,796 | | | | 160,425,488 | | | | $1.00 | |
Service Class | | | 128,155,572 | | | | 128,253,926 | | | | 1.00 | |
See Notes to Financial Statements
6
MFS U.S. Government Money Market Portfolio
FINANCIAL STATEMENTS | STATEMENT OF OPERATIONS
This statement describes how much your fund earned in investment income and accrued in expenses. It also describes any gains and/or losses generated by fund operations.
| | | | |
Year ended 12/31/18 | | | | |
Net investment income (loss) | | | | |
Income | | | | |
Interest | | | $5,276,559 | |
Other | | | 64 | |
Total investment income | | | $5,276,623 | |
Expenses | | | | |
Management fee | | | $1,468,565 | |
Distribution and/or service fees | | | 346,219 | |
Shareholder servicing costs | | | 6,250 | |
Administrative services fee | | | 51,796 | |
Independent Trustees’ compensation | | | 7,212 | |
Custodian fee | | | 15,509 | |
Shareholder communications | | | 23,657 | |
Audit and tax fees | | | 36,077 | |
Legal fees | | | 2,453 | |
Miscellaneous | | | 33,528 | |
Total expenses | | | $1,991,266 | |
Reduction of expenses by investment adviser and distributor | | | (374,193 | ) |
Net expenses | | | $1,617,073 | |
Net investment income (loss) | | | $3,659,550 | |
Change in net assets from operations | | | $3,659,550 | |
See Notes to Financial Statements
7
MFS U.S. Government Money Market Portfolio
FINANCIAL STATEMENTS | STATEMENTS OF CHANGES IN NET ASSETS
These statements describe the increases and/or decreases in net assets resulting from operations, any distributions, and any shareholder transactions.
| | | | | | | | |
| | | Year ended | |
| | | 12/31/18 | | | 12/31/17 | |
Change in net assets | | | | | | | | |
| | |
From operations | | | | | | | | |
Net investment income (loss) | | | $3,659,550 | | | | $938,474 | |
Net realized gain (loss) | | | — | | | | 13 | |
Change in net assets from operations | | | $3,659,550 | | | | $938,487 | |
Total distributions to shareholders (a) | | | $(3,659,550 | ) | | | $(938,722 | ) |
Change in net assets from fund share transactions | | | $(26,075,131 | ) | | | $(47,858,372 | ) |
Total change in net assets | | | $(26,075,131 | ) | | | $(47,858,607 | ) |
| | |
Net assets | | | | | | | | |
At beginning of period | | | 314,534,499 | | | | 362,393,106 | |
At end of period | | | $288,459,368 | | | | $314,534,499 | |
| (a) | Distributions from net investment income and from net realized gain are no longer required to be separately disclosed. See Note 2. For the year ended December 31, 2017, distributions from net investment income were $938,722. |
See Notes to Financial Statements
8
MFS U.S. Government Money Market Portfolio
FINANCIAL STATEMENTS | FINANCIAL HIGHLIGHTS
The financial highlights table is intended to help you understand the fund’s financial performance for the past 5 years. Certain information reflects financial results for a single fund share. The total returns in the table represent the rate that an investor would have earned (or lost) on an investment in the fund share class (assuming reinvestment of all distributions) held for the entire period.
| | | | | | | | | | | | | | | | | | | | |
| Initial Class | | Year ended | |
| | | 12/31/18 | | | 12/31/17 | | | 12/31/16 | | | 12/31/15 | | | 12/31/14 | |
Net asset value, beginning of period | | | $1.00 | | | | $1.00 | | | | $1.00 | | | | $1.00 | | | | $1.00 | |
| Income (loss) from investment operations | | | | | | | | | | | | | | | | | | | | |
Net investment income (loss) (d) | | | $0.01 | | | | $0.00 | (w) | | | $0.00 | (c)(w) | | | $0.00 | | | | $0.00 | |
Net realized and unrealized gain (loss) | | | — | | | | 0.00 | (w) | | | 0.00 | (w) | | | 0.00 | (w) | | | 0.00 | (w) |
Total from investment operations | | | $0.01 | | | | $0.00 | (w) | | | $0.00 | (w) | | | $0.00 | (w) | | | $0.00 | (w) |
| Less distributions declared to shareholders | | | | | | | | | | | | | | | | | | | | |
From net investment income | | | $(0.01 | ) | | | $(0.00 | )(w) | | | $(0.00 | )(w) | | | $— | | | | $— | |
Net asset value, end of period | | | $1.00 | | | | $1.00 | | | | $1.00 | | | | $1.00 | | | | $1.00 | |
Total return (%) (k)(r) | | | 1.26 | | | | 0.30 | | | | 0.01 | (c) | | | 0.00 | | | | 0.00 | |
Ratios (%) (to average net assets)
and Supplemental data: | | | | | |
Expenses before expense reductions (f) | | | 0.56 | | | | 0.56 | | | | 0.53 | (c) | | | 0.57 | | | | 0.55 | |
Expenses after expense reductions (f) | | | 0.55 | | | | 0.54 | | | | 0.30 | (c) | | | 0.13 | | | | 0.10 | |
Net investment income (loss) | | | 1.25 | | | | 0.29 | | | | 0.01 | (c) | | | 0.00 | | | | 0.00 | |
Net assets at end of period (000 omitted) | | | $160,304 | | | | $168,107 | | | | $179,458 | | | | $190,761 | | | | $214,019 | |
| |
| Service Class | | Year ended | |
| | | 12/31/18 | | | 12/31/17 | | | 12/31/16 | | | 12/31/15 | | | 12/31/14 | |
Net asset value, beginning of period | | | $1.00 | | | | $1.00 | | | | $1.00 | | | | $1.00 | | | | $1.00 | |
| Income (loss) from investment operations | | | | | | | | | | | | | | | | | | | | |
Net investment income (loss) (d) | | | $0.01 | | | | $0.00 | (w) | | | $0.00 | (c)(w) | | | $0.00 | | | | $0.00 | |
Net realized and unrealized gain (loss) | | | — | | | | 0.00 | (w) | | | 0.00 | (w) | | | 0.00 | (w) | | | 0.00 | (w) |
Total from investment operations | | | $0.01 | | | | $0.00 | (w) | | | $0.00 | (w) | | | $0.00 | (w) | | | $0.00 | (w) |
| Less distributions declared to shareholders | | | | | | | | | | | | | | | | | | | | |
From net investment income | | | $(0.01 | ) | | | $(0.00 | )(w) | | | $(0.00 | )(w) | | | $— | | | | $— | |
Net asset value, end of period | | | $1.00 | | | | $1.00 | | | | $1.00 | | | | $1.00 | | | | $1.00 | |
Total return (%) (k)(r) | | | 1.26 | | | | 0.29 | | | | 0.01 | (c) | | | 0.00 | | | | 0.00 | |
Ratios (%) (to average net assets)
and Supplemental data: | | | | | |
Expenses before expense reductions (f) | | | 0.81 | | | | 0.81 | | | | 0.79 | (c) | | | 0.82 | | | | 0.80 | |
Expenses after expense reductions (f) | | | 0.55 | | | | 0.55 | | | | 0.30 | (c) | | | 0.13 | | | | 0.10 | |
Net investment income (loss) | | | 1.24 | | | | 0.27 | | | | 0.01 | (c) | | | 0.00 | | | | 0.00 | |
Net assets at end of period (000 omitted) | | | $128,156 | | | | $146,428 | | | | $182,935 | | | | $182,097 | | | | $205,550 | |
| (c) | | Amount reflects aone-time reimbursement of expenses by the custodian (or former custodian) without which net investment income and performance would be lower and expenses would be higher. |
| (d) | | Per share data is based on average shares outstanding. |
| (f) | | Ratios do not reflect reductions from fees paid indirectly, if applicable. |
| (k) | | The total return does not reflect expenses that apply to separate accounts. Inclusion of these charges would reduce the total return figures for all periods shown. |
| (r) | | Certain expenses have been reduced without which performance would have been lower. |
| (w) | | Per share amount was less than $0.01. |
See Notes to Financial Statements
9
MFS U.S. Government Money Market Portfolio
NOTES TO FINANCIAL STATEMENTS
| (1) | | Business and Organization |
MFS U.S. Government Money Market Portfolio (the fund) is a diversified series of MFS Variable Insurance Trust II (the trust). The trust is organized as a Massachusetts business trust and is registered under the Investment Company Act of 1940, as amended, as anopen-end management investment company. The shareholders of each series of the trust are separate accounts of insurance companies, which offer variable annuity and/or life insurance products, and qualified retirement and pension plans.
The fund is an investment company and accordingly follows the investment company accounting and reporting guidance of the Financial Accounting Standards Board (FASB) Accounting Standards Codification Topic 946 Financial Services – Investment Companies.
| (2) | | Significant Accounting Policies |
General – The preparation of financial statements in conformity with U.S. generally accepted accounting principles requires management to make estimates and assumptions that affect the reported amounts of assets and liabilities, and disclosure of contingent assets and liabilities at the date of the financial statements and the reported amounts of increases and decreases in net assets from operations during the reporting period. Actual results could differ from those estimates. In the preparation of these financial statements, management has evaluated subsequent events occurring after the date of the fund’s Statement of Assets and Liabilities through the date that the financial statements were issued.
In August 2018, the FASB issued Accounting Standards Update2018-13, Fair Value Measurement (Topic 820) – Disclosure Framework – Changes to the Disclosure Requirements for Fair Value Measurement (“ASU2018-13”) which introduces new fair value disclosure requirements as well as eliminates and modifies certain existing fair value disclosure requirements.ASU 2018-13 would be effective for fiscal years beginning after December 15, 2019, and interim periods within those fiscal years; however, management has elected to early adopt ASU2018-13 effective with the current reporting period. The impact of the fund’s adoption was limited to changes in the fund’s financial statement disclosures regarding fair value, primarily those disclosures related to transfers between levels of the fair value hierarchy.
In August 2018, the Securities and Exchange Commission (SEC) released its Final Rule on Disclosure Update and Simplification (the “Final Rule”) which is intended to simplify an issuer’s disclosure compliance efforts by removing redundant or outdated disclosure requirements without significantly altering the mix of information provided to investors. Effective with the current reporting period, the fund adopted the Final Rule with the impacts being that the fund is no longer required to present the components of distributable earnings on the Statement of Assets and Liabilities or the sources of distributions to shareholders and the amount of undistributed net investment income on the Statements of Changes in Net Assets.
Balance Sheet Offsetting – The fund’s accounting policy with respect to balance sheet offsetting is that, absent an event of default by the counterparty or a termination of the agreement, the International Swaps and Derivatives Association (ISDA) Master Agreement, or similar agreement, does not result in an offset of reported amounts of financial assets and financial liabilities in the Statement of Assets and Liabilities across transactions between the fund and the applicable counterparty. The fund’s right to setoff may be restricted or prohibited by the bankruptcy or insolvency laws of the particular jurisdiction to which a specific master netting agreement counterparty is subject. Balance sheet offsetting disclosures, to the extent applicable to the fund, have been included in the fund’s Significant Accounting Policies note under the captions for each of the fund’sin-scope financial instruments and transactions.
Investment Valuations – Pursuant to procedures approved by the Board of Trustees, investments held by the fund are generally valued at amortized cost, which approximates market value. Amortized cost involves valuing an instrument at its cost as adjusted for amortization of premium or accretion of discount rather than its current market value. The amortized cost value of an instrument can be different from the market value of an instrument.
Various inputs are used in determining the value of the fund’s assets or liabilities. These inputs are categorized into three broad levels. In certain cases, the inputs used to measure fair value may fall into different levels of the fair value hierarchy. In such cases, an investment’s level within the fair value hierarchy is based on the lowest level of input that is significant to the fair value measurement. The fund’s assessment of the significance of a particular input to the fair value measurement in its entirety requires judgment, and considers factors specific to the investment. Level 1 includes unadjusted quoted prices in active markets for identical assets or liabilities. Level 2 includes other significant observable market-based inputs (including quoted prices for similar securities, interest rates, prepayment speed, and credit risk). Level 3 includes unobservable inputs, which may include the adviser’s own assumptions in determining the fair value of investments. The following is a summary of the levels used as of December 31, 2018 in valuing the fund’s assets or liabilities:
| | | | | | | | | | | | | | | | |
| Financial Instruments | | Level 1 | | | Level 2 | | | Level 3 | | | Total | |
| Short-Term Securities | | | $— | | | | $288,764,958 | | | | $— | | | | $288,764,958 | |
For further information regarding security characteristics, see the Portfolio of Investments.
10
MFS U.S. Government Money Market Portfolio
Notes to Financial Statements – continued
Repurchase Agreements – The fund enters into repurchase agreements under the terms of Master Repurchase Agreements with approved counterparties. Each repurchase agreement is recorded at cost. The fund requires that the securities collateral in a repurchase transaction be transferred to a custodian. The fund monitors, on a daily basis, the value of the collateral to ensure that its value, including accrued interest, is greater than amounts owed to the fund under each such repurchase agreement. Upon an event of default under a Master Repurchase Agreement, thenon-defaulting party may close out all transactions traded under such agreement and net amounts owed under each transaction to one net amount payable by one party to the other. Absent an event of default, the Master Repurchase Agreement does not result in an offset of reported amounts of assets and liabilities in the Statement of Assets and Liabilities across transactions between the fund and the applicable counterparty. The fund and other funds managed by MFS may utilize a joint trading account for the purpose of entering into one or more repurchase agreements. At December 31, 2018, the fund had investments in repurchase agreements with a gross value of $21,280,000 included in investments in unaffiliated issuers in the Statement of Assets and Liabilities. The value of the related collateral exceeded the value of the repurchase agreements at period end.
Indemnifications – Under the fund’s organizational documents, its officers and Trustees may be indemnified against certain liabilities and expenses arising out of the performance of their duties to the fund. Additionally, in the normal course of business, the fund enters into agreements with service providers that may contain indemnification clauses. The fund’s maximum exposure under these agreements is unknown as this would involve future claims that may be made against the fund that have not yet occurred.
Investment Transactions and Income – Investment transactions are recorded on the trade date. Interest income is recorded on the accrual basis. All premium and discount is amortized or accreted for financial statement purposes in accordance with U.S. generally accepted accounting principles.
Tax Matters and Distributions – The fund intends to qualify as a regulated investment company, as defined under Subchapter M of the Internal Revenue Code, and to distribute all of its taxable income, including realized capital gains. As a result, no provision for federal income tax is required. The fund’s federal tax returns, when filed, will remain subject to examination by the Internal Revenue Service for a three year period. Management has analyzed the fund’s tax positions taken on federal and state tax returns for all open tax years and does not believe that there are any uncertain tax positions that require recognition of a tax liability.
Distributions to shareholders are recorded on theex-dividend date. Income and capital gain distributions are determined in accordance with income tax regulations, which may differ from U.S. generally accepted accounting principles. Certain capital accounts in the financial statements are periodically adjusted for permanent differences in order to reflect their tax character. These adjustments have no impact on net assets or net asset value per share. Temporary differences which arise from recognizing certain items of income, expense, gain or loss in different periods for financial statement and tax purposes will reverse at some time in the future. Distributions in excess of net investment income or net realized gains are temporary overdistributions for financial statement purposes resulting from differences in the recognition or classification of income or distributions for financial statement and tax purposes.
During the year ended December 31, 2018, there were no significant adjustments due to differences between book and tax accounting.
The tax character of distributions declared to shareholders for the last two fiscal years is as follows:
| | | | | | | | |
| | | Year ended
12/31/18 | | | Year ended
12/31/17 | |
| Ordinary income (including any short-term capital gains) | | | $3,659,550 | | | | $938,722 | |
The federal tax cost and the tax basis components of distributable earnings were as follows:
| | | | |
| As of 12/31/18 | | | | |
| Cost of investments | | | $288,764,958 | |
Multiple Classes of Shares of Beneficial Interest – The fund offers multiple classes of shares, which differ in their respective distribution and/or service fees. The fund’s income and common expenses are allocated to shareholders based on the value of settled shares outstanding of each class. The fund’s realized and unrealized gain (loss) are allocated to shareholders based on the daily net
11
MFS U.S. Government Money Market Portfolio
Notes to Financial Statements – continued
assets of each class. Dividends are declared separately for each class. Differences in per share dividend rates are generally due to differences in separate class expenses. The fund’s distributions declared to shareholders as reported in the Statements of Changes in Net Assets are presented by class as follows:
| | | | | | | | |
| | | From net investment
income | |
| | |
| | | Year ended
12/31/18 | | | Year ended
12/31/17 | |
| Initial Class | | | $1,937,963 | | | | $495,709 | |
| Service Class | | | 1,721,587 | | | | 443,013 | |
| Total | | | $3,659,550 | | | | $938,722 | |
| (3) | | Transactions with Affiliates |
Investment Adviser– The fund has an investment advisory agreement with MFS to provide overall investment management and related administrative services and facilities to the fund. The management fee is computed daily and paid monthly at the following annual rates based on the fund’s average daily net assets:
| | | | |
| Up to $500 million | | | 0.50% | |
| In excess of $500 million | | | 0.45% | |
MFS has agreed in writing to reduce its management fee by a specified amount if certain MFS mutual fund assets exceed thresholds agreed to by MFS and the fund’s Board of Trustees. For the year ended December 31, 2018, this management fee reduction amounted to $27,974, which is included in the reduction of total expenses in the Statement of Operations. The management fee incurred for the year ended December 31, 2018 was equivalent to an annual effective rate of 0.49% of the fund’s average daily net assets.
The investment adviser has agreed in writing to pay a portion of the fund’s total annual operating expenses, excluding interest, taxes, extraordinary expenses, brokerage and transaction costs, and investment-related expenses, such that total annual operating expenses do not exceed 0.57% of average daily net assets for each of the Initial Class and Service Class shares. This written agreement will continue until modified by the fund’s Board of Trustees, but such agreement will continue at least until April 30, 2020. For the year ended December 31, 2018, the fund’s actual operating expenses did not exceed the limits described above and therefore, the investment adviser did not pay any portion of the fund’s expenses related to these agreements.
Distributor– MFS Fund Distributors, Inc. (MFD), a wholly-owned subsidiary of MFS, is the distributor of shares of the fund. The Trustees have adopted a distribution plan for the Service Class shares pursuant to Rule12b-1 under the Investment Company Act of 1940.
The fund’s distribution plan provides that the fund will pay MFD distribution and/or service fees equal to 0.25% per annum of its average daily net assets attributable to Service Class shares as partial consideration for services performed and expenses incurred by MFD and financial intermediaries (including participating insurance companies that invest in the fund to fund variable annuity and variable life insurance contracts, sponsors of qualified retirement and pension plans that invest in the fund, and affiliates of these participating insurance companies and plan sponsors) in connection with the sale and distribution of the Service Class shares. MFD may subsequently pay all, or a portion, of the distribution and/or service fees to financial intermediaries. MFD has agreed in writing to waive the entire 0.25% distribution and/or service fee. This written agreement will continue until modified by the fund’s Board of Trustees, but such agreement will continue at least until April 30, 2020. For the year ended December 31, 2018, this waiver amounted to $346,219, which is included in the reduction of total expenses in the Statement of Operations. The distribution and/or service fees incurred for the year ended December 31, 2018 were equivalent to an annual effective rate of 0.00% of the average daily net assets attributable to Service Class shares.
Shareholder Servicing Agent– MFS Service Center, Inc. (MFSC), a wholly-owned subsidiary of MFS, receives a fee from the fund for its services as shareholder servicing agent. For the year ended December 31, 2018, the fee was $5,852, which equated to 0.0020% annually of the fund’s average daily net assets. MFSC also receives payment from the fund forout-of-pocket expenses paid by MFSC on behalf of the fund. For the year ended December 31, 2018, these costs amounted to $398.
Administrator– MFS provides certain financial, legal, shareholder communications, compliance, and other administrative services to the fund. Under an administrative services agreement, the fund reimburses MFS the costs incurred to provide these services. The fund is charged an annual fixed amount of $17,500 plus a fee based on average daily net assets. The administrative services fee incurred for the year ended December 31, 2018 was equivalent to an annual effective rate of 0.0176% of the fund’s average daily net assets.
Trustees’ and Officers’ Compensation– The fund pays compensation to independent Trustees in the form of a retainer, attendance fees, and additional compensation to Board and Committee chairpersons. The fund does not pay compensation directly
12
MFS U.S. Government Money Market Portfolio
Notes to Financial Statements – continued
to Trustees or officers of the fund who are also officers of the investment adviser, all of whom receive remuneration for their services to the fund from MFS. Certain officers and Trustees of the fund are officers or directors of MFS, MFD, and MFSC.
Other– This fund and certain other funds managed by MFS (the funds) have entered into a service agreement (the ISO Agreement) which provides for payment of fees solely by the funds to Tarantino LLC in return for the provision of services of an Independent Senior Officer (ISO) for the funds. Frank L. Tarantino serves as the ISO and is an officer of the funds and the sole member of Tarantino LLC. The funds can terminate the ISO Agreement with Tarantino LLC at any time under the terms of the ISO Agreement. For the year ended December 31, 2018, the fee paid by the fund under this agreement was $498 and is included in “Miscellaneous” expense in the Statement of Operations. MFS has agreed to bear all expenses associated with office space, other administrative support, and supplies provided to the ISO.
| (4) | | Shares of Beneficial Interest |
The fund’s Declaration of Trust permits the Trustees to issue an unlimited number of full and fractional shares of beneficial interest. The number of shares sold, reinvested and reacquired corresponds to the net proceeds from the sale of shares, reinvestment of distributions and cost of shares reacquired, respectively, since shares are sold and reacquired at $1.00 per share. Transactions in fund shares were as follows:
| | | | | | | | |
| | | Year ended
12/31/18 | | | Year ended
12/31/17 | |
| Shares sold | | | | | | | | |
Initial Class | | | 40,333,024 | | | | 35,332,001 | |
Service Class | | | 35,513,369 | | | | 50,562,527 | |
| | | 75,846,393 | | | | 85,894,528 | |
| | |
| Shares issued to shareholders in reinvestment of distributions | | | | | | | | |
Initial Class | | | 1,937,963 | | | | 495,709 | |
Service Class | | | 1,721,587 | | | | 443,013 | |
| | | 3,659,550 | | | | 938,722 | |
| | |
| Shares reacquired | | | | | | | | |
Initial Class | | | (50,062,009 | ) | | | (47,177,273 | ) |
Service Class | | | (55,519,065 | ) | | | (87,514,349 | ) |
| | | (105,581,074 | ) | | | (134,691,622 | ) |
| | |
| Net change | | | | | | | | |
Initial Class | | | (7,791,022 | ) | | | (11,349,563 | ) |
Service Class | | | (18,284,109 | ) | | | (36,508,809 | ) |
| | | (26,075,131 | ) | | | (47,858,372 | ) |
The fund and certain other funds managed by MFS participate in a $1.25 billion unsecured committed line of credit, subject to a $1 billion sublimit, provided by a syndication of banks under a credit agreement. Borrowings may be made for temporary financing needs. Interest is charged to each fund, based on its borrowings, generally at a rate equal to the higher of the Overnight Bank Funding rate or daily one month LIBOR plus an agreed upon spread. A commitment fee, based on the average daily, unused portion of the committed line of credit, is allocated among the participating funds. In addition, the fund and other funds managed by MFS have established unsecured uncommitted borrowing arrangements with certain banks for temporary financing needs. Interest is charged to each fund, based on its borrowings, at a rate equal to the Overnight Bank Funding rate plus an agreed upon spread. For the year ended December 31, 2018, the fund’s commitment fee and interest expense were $1,697 and $0, respectively, and are included in “Miscellaneous” expense in the Statement of Operations.
13
MFS U.S. Government Money Market Portfolio
REPORT OF INDEPENDENT REGISTERED PUBLIC ACCOUNTING FIRM
To the Board of Trustees of MFS Variable Insurance Trust II and the Shareholders of
MFS U.S. Government Money Market Portfolio:
Opinion on the Financial Statements and Financial Highlights
We have audited the accompanying statement of assets and liabilities of MFS U.S. Government Money Market Portfolio (the “Fund”), including the portfolio of investments, as of December 31, 2018, the related statement of operations for the year then ended, the statements of changes in net assets for each of the two years in the period then ended, the financial highlights for each of the five years in the period then ended, and the related notes. In our opinion, the financial statements and financial highlights present fairly, in all material respects, the financial position of the Fund as of December 31, 2018, and the results of its operations for the year then ended, the changes in its net assets for each of the two years in the period then ended, and the financial highlights for each of the five years in the period then ended, in conformity with accounting principles generally accepted in the United States of America.
Basis for Opinion
These financial statements and financial highlights are the responsibility of the Fund’s management. Our responsibility is to express an opinion on the Fund’s financial statements and financial highlights based on our audits. We are a public accounting firm registered with the Public Company Accounting Oversight Board (United States) (PCAOB) and are required to be independent with respect to the Fund in accordance with the U.S. federal securities laws and the applicable rules and regulations of the Securities and Exchange Commission and the PCAOB.
We conducted our audits in accordance with the standards of the PCAOB. Those standards require that we plan and perform the audit to obtain reasonable assurance about whether the financial statements and financial highlights are free of material misstatement, whether due to error or fraud. The Fund is not required to have, nor were we engaged to perform, an audit of its internal control over financial reporting. As part of our audits we are required to obtain an understanding of internal control over financial reporting but not for the purpose of expressing an opinion on the effectiveness of the Fund’s internal control over financial reporting. Accordingly, we express no such opinion.
Our audits included performing procedures to assess the risks of material misstatement of the financial statements and financial highlights, whether due to error or fraud, and performing procedures that respond to those risks. Such procedures included examining, on a test basis, evidence regarding the amounts and disclosures in the financial statements and financial highlights. Our audits also included evaluating the accounting principles used and significant estimates made by management, as well as evaluating the overall presentation of the financial statements and financial highlights. Our procedures included confirmation of securities owned as of December 31, 2018, by correspondence with the custodian. We believe that our audits provide a reasonable basis for our opinion.
DELOITTE & TOUCHE LLP
Boston, Massachusetts
February 15, 2019
We have served as the auditor of one or more of the MFS investment companies since 1924.
14
MFS U.S. Government Money Market Portfolio
TRUSTEES AND OFFICERS – IDENTIFICATION AND BACKGROUND
The Trustees and Officers of the Trust, as of February 1, 2019, are listed below, together with their principal occupations during the past five years. (Their titles may have varied during that period.) The address of each Trustee and Officer is 111 Huntington Avenue, Boston, Massachusetts 02199-7618.
| | | | | | | | | | |
Name, Age | | Position(s)
Held with Fund | | Trustee/Officer
Since (h) | | Number of MFS Funds overseen by the Trustee | | Principal Occupations
During the Past Five Years | | Other Directorships During the Past Five Years (j) |
| INTERESTED TRUSTEES |
Robert J. Manning (k) (age 55) | | Trustee | | February 2004 | | 135 | | Massachusetts Financial Services Company, Executive Chairman (since January 2017); Director; Chairman of the Board; Chief Executive Officer (until 2015);Co-Chief Executive Officer(2015-2016) | | N/A |
| | | | | |
Robin A. Stelmach (k) (age 57) | | Trustee | | January 2014 | | 135 | | Massachusetts Financial Services Company, Vice Chair (since January 2017); Chief Operating Officer and Executive Vice President (until January 2017) | | N/A |
|
| INDEPENDENT TRUSTEES |
John P. Kavanaugh (age 64) | | Trustee and Chair of Trustees | | January 2009 | | 135 | | Private investor | | N/A |
| | | | | |
Steven E. Buller (age 67) | | Trustee | | February 2014 | | 135 | | Financial Accounting Standards Advisory Council, Chairman(2014-2015); Public Company Accounting Oversight Board, Standing Advisory Group, Member (until 2014); BlackRock, Inc. (investment management), Managing Director (until 2014), BlackRock Finco UK (investment management), Director (until 2014) | | N/A |
| | | | | |
John A. Caroselli (age 64) | | Trustee | | March 2017 | | 135 | | JC Global Advisors, LLC (management consulting), President (since 2015); First Capital Corporation (commercial finance), Executive Vice President (until 2015) | | N/A |
| | | | | |
Maureen R. Goldfarb (age 63) | | Trustee | | January 2009 | | 135 | | Private investor | | N/A |
| | | | | |
Michael Hegarty (age 74) | | Trustee | | December 2004 | | 135 | | Private investor | | Rouse Properties Inc., Director (until 2016); Capmark Financial Group Inc., Director (until 2015) |
| | | | | |
Peter D. Jones (age 63) | | Trustee | | January 2019 | | 135 | | Franklin Templeton Distributors, Inc. (investment management), President (until 2015); Franklin Templeton Institutional, LLC (investment management), Chairman (until 2015) | | N/A |
| | | | | |
James W. Kilman, Jr. (age 57) | | Trustee | | January 2019 | | 135 | | KielStrand Capital LLC (family office and merchant bank), Chief Executive Officer (since 2016); Morgan Stanley & Co. (financial services), Vice Chairman of Investment Banking,Co-Head of Diversified Financials Coverage – Financial Institutions Investment Banking Group (until 2016) | | alpha-En Corporation, Director (since 2016) |
15
MFS U.S. Government Money Market Portfolio
Trustees and Officers – continued
| | | | | | | | | | |
Name, Age | | Position(s)
Held with Fund | | Trustee/Officer
Since (h) | | Number of MFS Funds overseen by the Trustee | | Principal Occupations
During the Past Five Years | | Other Directorships During the Past Five Years (j) |
Clarence Otis, Jr. (age 62) | | Trustee | | March 2017 | | 135 | | Darden Restaurants, Inc., Chief Executive Officer (until 2014) | | VF Corporation, Director; Verizon Communications, Inc., Director; The Travelers Companies, Director; Federal Reserve Bank of Atlanta, Director (until 2015) |
| | | | | |
Maryanne L. Roepke (age 62) | | Trustee | | May 2014 | | 135 | | American Century Investments (investment management), Senior Vice President and Chief Compliance Officer (until 2014) | | N/A |
| | | | | |
Laurie J. Thomsen
(age 61) | | Trustee | | March 2005 | | 135 | | Private investor | | The Travelers Companies, Director; Dycom Industries, Inc., Director (since 2015) |
| | | | | | | | |
Name, Age | | Position(s)
Held with Fund | | Trustee/Officer
Since (h) | | Number of MFS Funds for which the Person is an Officer | | Principal Occupations During the Past Five Years |
| OFFICERS | | | | | | |
Christopher R. Bohane (k)
(age 45) | | Assistant Secretary and Assistant Clerk | | July 2005 | | 135 | | Massachusetts Financial Services Company, Vice President and Assistant General Counsel |
| | | | |
Kino Clark (k) (age 50) | | Assistant Treasurer | | January 2012 | | 135 | | Massachusetts Financial Services Company, Vice President |
| | | | |
John W. Clark, Jr. (k) (age 51) | | Assistant Treasurer | | April 2017 | | 135 | | Massachusetts Financial Services Company, Vice President (since March 2017); Deutsche Bank (financial services), Department Head – Treasurer’s Office (until February 2017) |
| | | | |
Thomas H. Connors (k) (age 59) | | Assistant Secretary and Assistant Clerk | | September 2012 | | 135 | | Massachusetts Financial Services Company, Vice President and Senior Counsel |
| | | | |
Ethan D. Corey (k)
(age 55) | | Assistant
Secretary and Assistant Clerk | | July 2005 | | 135 | | Massachusetts Financial Services Company, Senior Vice President and Associate General Counsel |
| | | | |
David L. DiLorenzo (k)
(age 50) | | President | | July 2005 | | 135 | | Massachusetts Financial Services Company, Senior Vice President |
| | | | |
Heidi W. Hardin (k) (age 51) | | Secretary and Clerk | | April 2017 | | 135 | | Massachusetts Financial Services Company, Executive Vice President and General Counsel (since March 2017); Harris Associates (investment management), General Counsel (from September 2015 to January 2017); Janus Capital Management LLC (investment management), Senior Vice President and General Counsel (until September 2015) |
| | | | |
Brian E. Langenfeld (k) (age 45) | | Assistant
Secretary and Assistant Clerk | | June 2006 | | 135 | | Massachusetts Financial Services Company, Vice President and Senior Counsel |
| | | | |
Amanda S. Mooradian (k) (age 39) | | Assistant
Secretary and Assistant Clerk | | September 2018 | | 135 | | Massachusetts Financial Services Company, Assistant Vice President and Counsel |
| | | | |
Susan A. Pereira (k)
(age 48) | | Assistant
Secretary and Assistant Clerk | | July 2005 | | 135 | | Massachusetts Financial Services Company, Vice President and Senior Counsel |
| | | | |
Kasey L. Phillips (k) (age 48) | | Assistant Treasurer | | September 2012 | | 135 | | Massachusetts Financial Services Company, Vice President |
| | | | |
Matthew A. Stowe (k) (age 44) | | Assistant Secretary and Assistant Clerk | | October 2014 | | 135 | | Massachusetts Financial Services Company, Vice President and Assistant General Counsel |
16
MFS U.S. Government Money Market Portfolio
Trustees and Officers – continued
| | | | | | | | |
Name, Age | | Position(s)
Held with Fund | | Trustee/Officer
Since (h) | | Number of MFS Funds for which the Person is an Officer | | Principal Occupations During the Past Five Years |
Frank L. Tarantino
(age 74) | | Independent
Senior Officer | | June 2004 | | 135 | | Tarantino LLC (provider of compliance services), Principal |
| | | | |
Richard S. Weitzel (k)
(age 48) | | Assistant Secretary and Assistant Clerk | | October 2007 | | 135 | | Massachusetts Financial Services Company, Senior Vice President and Associate General Counsel |
| | | | |
Martin J. Wolin (k) (age 51) | | Chief Compliance Officer | | July 2015 | | 135 | | Massachusetts Financial Services Company, Senior Vice President and Chief Compliance Officer (since July 2015); Mercer (financial service provider), Chief Risk and Compliance Officer, North America and Latin America (until June 2015) |
| | | | |
James O. Yost (k)
(age 58) | | Treasurer | | September 1990 | | 135 | | Massachusetts Financial Services Company, Senior Vice President |
| (h) | Date first appointed to serve as Trustee/officer of an MFS Fund. Each Trustee has served continuously since appointment unless indicated otherwise. For the period from December 15, 2004 until February 22, 2005, Mr. Manning served as Advisory Trustee. From January 2012 through December 2016, Messrs. DiLorenzo and Yost served as Treasurer and Deputy Treasurer of the Funds, respectively. |
| (j) | Directorships or trusteeships of companies required to report to the Securities and Exchange Commission (i.e., “public companies”). |
| (k) | “Interested person” of the Trust within the meaning of the Investment Company Act of 1940 (referred to as the 1940 Act), which is the principal federal law governing investment companies like the fund, as a result of a position with MFS. The address of MFS is 111 Huntington Avenue, Boston, Massachusetts 02199-7618. |
Each Trustee has been elected by shareholders and each Trustee and officer holds office until his or her successor is chosen and qualified or until his or her earlier death, resignation, retirement or removal. The Trust does not hold annual meetings for the purpose of electing Trustees, and Trustees are not elected for fixed terms. Under the terms of the Board’s retirement policy, an Independent Trustee shall retire at the end of the calendar year in which he or she reaches the earlier of 75 years of age or 15 years of service on the Board (or, in the case of any Independent Trustee who joined the Board prior to 2015, 20 years of service on the Board).
Messrs. Buller, Hegarty, Kilman and Otis and Ms. Roepke are members of the Trust’s Audit Committee.
Each of the Interested Trustees and certain Officers hold comparable officer positions with certain affiliates of MFS.
The Statement of Additional Information for a Fund includes further information about the Trustees and is available without charge upon request by calling1-800-225-2606.
| | |
Investment Adviser Massachusetts Financial Services Company 111 Huntington Avenue Boston, MA 02199-7618 | | Custodian State Street Bank and Trust Company 1 Lincoln Street Boston, MA 02111-2900 |
| |
Distributor MFS Fund Distributors, Inc. 111 Huntington Avenue Boston, MA 02199-7618 | | Independent Registered Public Accounting Firm Deloitte & Touche LLP 200 Berkeley Street Boston, MA 02116 |
| |
Portfolio Manager(s) Ed O’Dette | | |
17
MFS U.S. Government Money Market Portfolio
BOARD REVIEW OF INVESTMENT ADVISORY AGREEMENT
The Investment Company Act of 1940 requires that both the full Board of Trustees and a majority of thenon-interested (“independent”) Trustees, voting separately, annually approve the continuation of the Fund’s investment advisory agreement with MFS. The Trustees consider matters bearing on the Fund and its advisory arrangements at their meetings throughout the year, including a review of performance data at each regular meeting. In addition, the independent Trustees met several times over the course of three months beginning in May and ending in July, 2018 (“contract review meetings”) for the specific purpose of considering whether to approve the continuation of the investment advisory agreement for the Fund and the other investment companies that the Board oversees (the “MFS Funds”). The independent Trustees were assisted in their evaluation of the Fund’s investment advisory agreement by independent legal counsel, from whom they received separate legal advice and with whom they met separately from MFS during various contract review meetings. The independent Trustees were also assisted in this process by the MFS Funds’ Independent Senior Officer, a senior officer appointed by and reporting to the independent Trustees.
In connection with their deliberations regarding the continuation of the investment advisory agreement, the Trustees, including the independent Trustees, considered such information and factors as they believed, in light of the legal advice furnished to them and their own business judgment, to be relevant. The investment advisory agreement for the Fund was considered separately, although the Trustees also took into account the common interests of all MFS Funds in their review. As described below, the Trustees considered the nature, quality, and extent of the various investment advisory, administrative, and shareholder services performed by MFS under the existing investment advisory agreement and other arrangements with the Fund.
In connection with their contract review meetings, the Trustees received and relied upon materials that included, among other items: (i) information provided by Broadridge Financial Solutions, Inc. (“Broadridge”), an independent third party, on the investment performance of the Fund for various time periods ended December 31, 2017 and the investment performance of a group of funds with substantially similar investment classifications/objectives (the “Broadridge performance universe”), (ii) information provided by Broadridge on the Fund’s advisory fees and other expenses and the advisory fees and other expenses of comparable funds identified by Broadridge (the “Broadridge expense group”), (iii) information provided by MFS on the advisory fees of portfolios of other clients of MFS, including institutional separate accounts and other clients, (iv) information as to whether and to what extent applicable expense waivers, reimbursements or fee “breakpoints” are observed for the Fund, (v) information regarding MFS’ financial results and financial condition, including MFS’ and certain of its affiliates’ estimated profitability from services performed for the Fund and the MFS Funds as a whole, and compared to MFS’ institutional business, (vi) MFS’ views regarding the outlook for the mutual fund industry and the strategic business plans of MFS, (vii) descriptions of various functions performed by MFS for the Funds, such as compliance monitoring and portfolio trading practices, and (viii) information regarding the overall organization of MFS, including information about MFS’ senior management and other personnel providing investment advisory, administrative and other services to the Fund and the other MFS Funds. The comparative performance, fee and expense information prepared and provided by Broadridge was not independently verified and the independent Trustees did not independently verify any information provided to them by MFS.
The Trustees’ conclusion as to the continuation of the investment advisory agreement was based on a comprehensive consideration of all information provided to the Trustees and not the result of any single factor. Some of the factors that figured particularly in the Trustees’ deliberations are described below, although individual Trustees may have evaluated the information presented differently from one another, giving different weights to various factors. It is also important to recognize that the fee arrangements for the Fund and other MFS Funds are the result of years of review and discussion between the independent Trustees and MFS, that certain aspects of such arrangements may receive greater scrutiny in some years than in others, and that the Trustees’ conclusions may be based, in part, on their consideration of these same arrangements during the course of the year and in prior years.
Based on information provided by Broadridge and MFS, the Trustees reviewed the Fund’s total return investment performance as well as the Broadridge performance universe over various time periods. The Trustees placed particular emphasis on the total return performance of the Fund’s Initial Class shares in comparison to the performance of funds in its Broadridge performance universe over the three-year period ended December 31, 2017, which the Trustees believed was a long enough period to reflect differing market conditions. The total return performance of the Fund’s Initial Class shares was in the 4th quintile relative to the other funds in the universe for this three-year period (the 1st quintile being the best performers and the 5th quintile being the worst performers). The total return performance of the Fund’s Initial Class shares was in the 4th quintile for each of theone- and five-year periods ended December 31, 2017 relative to the Broadridge performance universe. Because of the passage of time, these performance results may differ from the performance results for more recent periods, including those shown elsewhere in this report.
In the course of their deliberations, the Trustees took into account information provided by MFS in connection with the contract review meetings, as well as during investment review meetings conducted with portfolio management personnel during the course of the year regarding the Fund’s performance. In addition, the Trustees noted the market conditions affecting all money market funds, in particular the low interest rate environment during portions of theone-, three- and five-year periods, and MFS’ voluntary
18
MFS U.S. Government Money Market Portfolio
Board Review of Investment Advisory Agreement – continued
waiver of all or a portion of its fees to ensure that the Fund avoided a negative yield during those periods. After reviewing these and related factors, the Trustees concluded, within the context of their overall conclusions regarding the investment advisory agreement, that they were satisfied with MFS’ responses and efforts relating to investment performance.
In assessing the reasonableness of the Fund’s advisory fee, the Trustees considered, among other information, the Fund’s advisory fee and the total expense ratio of the Fund’s Initial Class shares as a percentage of average daily net assets and the advisory fee and total expense ratios of peer groups of funds based on information provided by Broadridge. The Trustees considered that MFS currently observes an expense limitation for the Fund, which may not be changed without the Trustees’ approval. The Trustees also considered that, according to the data provided by Broadridge (which takes into account any fee reductions or expense limitations that were in effect during the Fund’s last fiscal year), the Fund’s effective advisory fee rate and total expense ratio were each higher than the Broadridge expense group median.
The Trustees also considered the advisory fees charged by MFS to any institutional separate accounts advised by MFS (“separate accounts”) and unaffiliated investment companies for which MFS serves as subadviser (“subadvised funds”) that have comparable investment strategies to the Fund, if any. In comparing these fees, the Trustees considered information provided by MFS as to the generally broader scope of services provided by MFS to the Fund, as well as the more extensive regulatory burdens imposed on MFS in managing the Fund, in comparison to separate accounts and subadvised funds. The Trustees also considered the higher demands placed on MFS’ investment personnel and trading infrastructure as a result of the daily cashin-flows andout-flows of the Fund in comparison to separate accounts.
The Trustees also considered whether the Fund may benefit from any economies of scale in the management of the Fund in the event of growth in assets of the Fund and/or growth in assets of the MFS Funds as a whole. They noted that the Fund’s advisory fee rate schedule is subject to a contractual breakpoint that reduces the Fund’s advisory fee rate on average daily net assets over $500 million. The Trustees also noted that MFS has agreed in writing to waive a portion of the management fees of certain MFS Funds, including the Fund, if the total combined assets of certain funds within the MFS Funds’ complex increase above agreed upon thresholds (the “group fee waiver”), enabling the Fund’s shareholders to share in the benefits from any economies of scale at the complex level. The group fee waiver is reviewed and renewed annually between the Board and MFS. The Trustees concluded that the breakpoint and the group fee waiver were sufficient to allow the Fund to benefit from economies of scale as its assets and overall complex assets grow.
The Trustees also considered information prepared by MFS relating to MFS’ costs and profits with respect to the Fund, the MFS Funds considered as a group, and other investment companies and accounts advised by MFS, as well as MFS’ methodologies used to determine and allocate its costs to the MFS Funds, the Fund and other accounts and products for purposes of estimating profitability.
After reviewing these and other factors described herein, the Trustees concluded, within the context of their overall conclusions regarding the investment advisory agreement, that the advisory fees charged to the Fund represent reasonable compensation in light of the services being provided by MFS to the Fund.
In addition, the Trustees considered MFS’ resources and related efforts to continue to retain, attract and motivate capable personnel to serve the Fund. The Trustees also considered current and developing conditions in the financial services industry, including the presence of large and well-capitalized companies which are spending, and appear to be prepared to continue to spend, substantial sums to engage personnel and to provide services to competing investment companies. In this regard, the Trustees also considered the financial resources of MFS and its ultimate parent, Sun Life Financial Inc. The Trustees also considered the advantages and possible disadvantages to the Fund of having an adviser that also serves other investment companies as well as other accounts.
The Trustees also considered the nature, quality, cost, and extent of administrative, transfer agency, and distribution services provided to the Fund by MFS and its affiliates under agreements and plans other than the investment advisory agreement, including any12b-1 fees the Fund pays to MFS Fund Distributors, Inc., an affiliate of MFS. The Trustees also considered the nature, extent and quality of certain other services MFS performs or arranges for on the Fund’s behalf, which may include securities lending programs, directed expense payment programs, class action recovery programs, and MFS’ interaction with third-party service providers, principally custodians andsub-custodians. The Trustees concluded that the variousnon-advisory services provided by MFS and its affiliates on behalf of the Fund were satisfactory.
The Trustees consideredso-called“fall-out benefits” to MFS such as reputational value derived from serving as investment manager to the MFS Funds. The Trustees also considered that, effective January 3, 2018, MFS had discontinued its historic practice of obtaining investment research from portfolio brokerage commissions paid by certain MFS Funds and would thereafter voluntarily reimburse a Fund, if applicable, for the costs of external research acquired through the use of the Fund’s portfolio brokerage commissions.
Based on their evaluation of factors that they deemed to be material, including those factors described above, the Board of Trustees, including the independent Trustees, concluded that the Fund’s investment advisory agreement with MFS should be continued for an additionalone-year period, commencing August 1, 2018.
19
MFS U.S. Government Money Market Portfolio
PROXY VOTING POLICIES AND INFORMATION
MFS votes proxies on behalf of the fund pursuant to proxy voting policies and procedures that are available without charge, upon request, by calling 1-800-225-2606, by visitingmfs.com/proxyvoting, or by visiting the SEC’s Web site athttp://www.sec.gov.
Information regarding how the fund voted proxies relating to portfolio securities during the most recent twelve-month period ended June 30 is available by August 31 of each year without charge by visitingmfs.com/proxyvoting, or by visiting the SEC’s Web site athttp://www.sec.gov.
QUARTERLY PORTFOLIO DISCLOSURE
The fund files a complete schedule of portfolio holdings with the SEC for the first and third quarters of each fiscal year on Form N-Q. The fund’s Form N-Q is available on the SEC’s website athttp://www.sec.gov.A shareholder can obtain the portfolio holdings report for the first and third quarters of the fund’s fiscal year atmfs.com/vit2 by choosing the fund’s name and then selecting the “Resources” tab and clicking on “Prospectus and Reports”.
FURTHER INFORMATION
From time to time, MFS may post important information about the fund or the MFS funds on the MFS web site (mfs.com). This information is available athttps://www.mfs.com/en-us/what-we-do/announcements.htmlor atmfs.com/vit2 by choosing the fund’s name.
INFORMATION ABOUT FUND CONTRACTS AND LEGAL CLAIMS
The fund has entered into contractual arrangements with an investment adviser, administrator, distributor, shareholder servicing agent, 529 program manager (if applicable), and custodian who each provide services to the fund. Unless expressly stated otherwise, shareholders are not parties to, or intended beneficiaries of these contractual arrangements, and these contractual arrangements are not intended to create any shareholder right to enforce them against the service providers or to seek any remedy under them against the service providers, either directly or on behalf of the fund.
Under the Trust’s By-Laws and Declaration of Trust, any claims asserted against or on behalf of the MFS Funds, including claims against Trustees and Officers, must be brought in state and federal courts located within the Commonwealth of Massachusetts.
20
rev. 3/16
| | | | |
| | | |
| FACTS | | WHAT DOES MFS DO WITH YOUR
PERSONAL INFORMATION? | |  |
| | |
| Why? | | Financial companies choose how they share your personal information. Federal law gives consumers the right to limit some but not all sharing. Federal law also requires us to tell you how we collect, share, and protect your personal information. Please read this notice carefully to understand what we do. |
| | |
| What? | | The types of personal information we collect and share depend on the product or service you have with us. This information can include: • Social Security number and account balances • Account transactions and transaction history • Checking account information and wire transfer instructions When you areno longer our customer, we continue to share your information as described in this notice. |
| | |
| How? | | All financial companies need to share customers’ personal information to run their everyday business. In the section below, we list the reasons financial companies can share their customers’ personal information; the reasons MFS chooses to share; and whether you can limit this sharing. |
| | | | |
Reasons we can share your
personal information | | Does MFS share? | | Can you limit this
sharing? |
For our everyday business purposes – such as to process your transactions, maintain your account(s), respond to court orders and legal investigations, or report to credit bureaus | | Yes | | No |
For our marketing purposes – to offer our products and services to you | | No | | We don’t share |
| For joint marketing with other financial companies | | No | | We don’t share |
For our affiliates’ everyday business purposes – information about your transactions and experiences | | No | | We don’t share |
For our affiliates’ everyday business purposes – information about your creditworthiness | | No | | We don’t share |
| For nonaffiliates to market to you | | No | | We don’t share |
| | |
| | |
| Questions? | | Call800-225-2606 or go tomfs.com. |
21
| | |
| Who we are |
| Who is providing this notice? | | MFS Funds, MFS Investment Management, MFS Institutional Advisors, Inc., and MFS Heritage Trust Company. |
| | |
| What we do |
| How does MFS protect my personal information? | | To protect your personal information from unauthorized access and use, we use security measures that comply with federal law. These measures include procedural, electronic, and physical safeguards for the protection of the personal information we collect about you. |
How does MFS
collect my personal information? | | We collect your personal information, for example, when you • open an account or provide account information • direct us to buy securities or direct us to sell your securities • make a wire transfer We also collect your personal information from others, such as credit bureaus, affiliates, or other companies. |
| Why can’t I limit all sharing? | | Federal law gives you the right to limit only • sharing for affiliates’ everyday business purposes – information about your creditworthiness • affiliates from using your information to market to you • sharing for nonaffiliates to market to you State laws and individual companies may give you additional rights to limit sharing. |
| | |
| Definitions |
| Affiliates | | Companies related by common ownership or control. They can be financial and nonfinancial companies. • MFS does not share personal information with affiliates, except for everyday business purposes as described on page one of this notice. |
| Nonaffiliates | | Companies not related by common ownership or control. They can be financial and nonfinancial companies. • MFS does not share with nonaffiliates so they can market to you. |
| Joint marketing | | A formal agreement between nonaffiliated financial companies that together market financial products or services to you. • MFS doesn’t jointly market. |
| | |
| Other important information |
| If you own an MFS product or receive an MFS service in the name of a third party such as a bank or broker-dealer, their privacy policy may apply to you instead of ours. |
22
The Registrant has adopted a Code of Ethics (the “Code”) pursuant to Section 406 of the Sarbanes-Oxley Act and as defined in FormN-CSR that applies to the Registrant’s principal executive officer and principal financial and accounting officer. During the period covered by this report, the Registrant has not amended any provision in the Code that relates to an element of the Code’s definition enumerated in paragraph (b) of Item 2 of this FormN-CSR. During the period covered by this report, the Registrant did not grant a waiver, including an implicit waiver, from any provision of the Code.
A copy of the Code is filed as an exhibit to this FormN-CSR.
| ITEM 3. | AUDIT COMMITTEE FINANCIAL EXPERT. |
Messrs. Steven E. Buller, Clarence Otis, Jr., Michael Hegarty, and James W. Kilman, Jr., and Ms. Maryanne L. Roepke, members of the Audit Committee, have been determined by the Board of Trustees in their reasonable business judgment to meet the definition of “audit committee financial expert” as such term is defined in FormN-CSR. In addition, Messrs. Buller, Otis, Hegarty, and Kilman and Ms. Roepke are “independent” members of the Audit Committee (as such term has been defined by the Securities and Exchange Commission in regulations implementing Section 407 of the Sarbanes-Oxley Act of 2002). The Securities and Exchange Commission has stated that the designation of a person as an audit committee financial expert pursuant to this Item 3 on the FormN-CSR does not impose on such a person any duties, obligations or liability that are greater than the duties, obligations or liability imposed on such person as a member of the Audit Committee and the Board of Trustees in the absence of such designation or identification.
| ITEM 4. | PRINCIPAL ACCOUNTANT FEES AND SERVICES. |
Items 4(a) through 4(d) and 4(g):
The Board of Trustees has appointed Deloitte & Touche LLP (“Deloitte”) to serve as independent accountants to the Registrant (hereinafter the “Registrant” or the “Fund”). The tables below set forth the audit fees billed to the Fund as well as fees fornon-audit services provided to the Fund and/or to the Fund’s investment adviser, Massachusetts Financial Services Company (“MFS”), and to various entities either controlling, controlled by, or under common control with MFS that provide ongoing services to the Fund (“MFS Related Entities”).
For the fiscal years ended December 31, 2018 and 2018, audit fees billed to the Fund by Deloitte were as follows:
| | | | | | | | |
| | | Audit Fees | |
| | | 2018 | | | 2017 | |
Fees billed by Deloitte: | | | | | | | | |
MFS Blended Research Core Equity Portfolio | | | 44,678 | | | | 43,682 | |
MFS Core Equity Portfolio | | | 46,788 | | | | 45,746 | |
MFS Corporate Bond Portfolio | | | 65,324 | | | | 63,883 | |
MFS Emerging Markets Equity Portfolio | | | 47,086 | | | | 46,038 | |
MFS Global Governments Portfolio | | | 63,002 | | | | 61,611 | |
MFS Global Growth Portfolio | | | 57,514 | | | | 56,241 | |
MFS Global Research Portfolio | | | 45,585 | | | | 44,569 | |
MFS Global Tactical Allocation Portfolio | | | 63,039 | | | | 61,648 | |
MFS Government Securities Portfolio | | | 53,538 | | | | 52,351 | |
MFS High Yield Portfolio | | | 69,544 | | | | 68,013 | |
MFS International Growth Portfolio | | | 47,086 | | | | 46,038 | |
MFS International Value Portfolio | | | 47,991 | | | | 46,923 | |
MFS Massachusetts Investors Growth Stock Portfolio | | | 46,684 | | | | 45,645 | |
MFS Research International Portfolio | | | 44,678 | | | | 43,682 | |
MFS Strategic Income Portfolio | | | 69,272 | | | | 67,746 | |
MFS Technology Portfolio | | | 44,781 | | | | 43,783 | |
MFS U.S. Government Money Market Portfolio | | | 27,595 | | | | 26,967 | |
| | | | | | | | |
Total | | | 884,185 | | | | 864,566 | |
For the fiscal years ended December 31, 2018 and 2017, fees billed by Deloitte for audit-related, tax and other services provided to each Fund and for audit-related, tax and other services provided to MFS and MFS Related Entities were as follows:
| | | | | | | | | | | | | | | | | | | | | | | | |
| | | Audit-Related Fees1 | | | Tax Fees2 | | | All Other Fees3 | |
| | 2018 | | | 2017 | | | 2018 | | | 2017 | | | 2018 | | | 2017 | |
Fees billed by Deloitte: | | | | | | | | | | | | | | | | | | | | | | | | |
To MFS Blended Research Core Equity Portfolio | | | 2,400 | | | | 2,400 | | | | 4,989 | | | | 4,882 | | | | 0 | | | | 0 | |
To MFS Core Equity Portfolio | | | 2,400 | | | | 2,400 | | | | 4,989 | | | | 4,882 | | | | 0 | | | | 0 | |
To MFS Corporate Bond Portfolio | | | 2,400 | | | | 2,400 | | | | 4,989 | | | | 4,882 | | | | 0 | | | | 0 | |
To MFS Emerging Markets Equity Portfolio | | | 2,400 | | | | 2,400 | | | | 4,989 | | | | 4,882 | | | | 0 | | | | 0 | |
To MFS Global Governments Portfolio | | | 2,400 | | | | 2,400 | | | | 4,989 | | | | 4,882 | | | | 0 | | | | 0 | |
To MFS Global Growth Portfolio | | | 2,400 | | | | 2,400 | | | | 4,989 | | | | 4,882 | | | | 0 | | | | 0 | |
To MFS Global Research Portfolio | | | 2,400 | | | | 2,400 | | | | 4,989 | | | | 4,882 | | | | 0 | | | | 0 | |
To MFS Global Tactical Allocation Portfolio | | | 2,400 | | | | 2,400 | | | | 4,989 | | | | 4,882 | | | | 0 | | | | 0 | |
To MFS Government Securities Portfolio | | | 2,400 | | | | 2,400 | | | | 4,989 | | | | 4,882 | | | | 0 | | | | 0 | |
To MFS High Yield Portfolio | | | 2,400 | | | | 2,400 | | | | 4,989 | | | | 4,882 | | | | 0 | | | | 0 | |
To MFS International Growth Portfolio | | | 2,400 | | | | 2,400 | | | | 4,989 | | | | 4,882 | | | | 0 | | | | 0 | |
To MFS International Value Portfolio | | | 2,400 | | | | 2,400 | | | | 4,989 | | | | 4,882 | | | | 0 | | | | 0 | |
To MFS Massachusetts Investors Growth Stock Portfolio | | | 2,400 | | | | 2,400 | | | | 4,989 | | | | 4,882 | | | | 0 | | | | 0 | |
To MFS Research International Portfolio | | | 2,400 | | | | 2,400 | | | | 4,989 | | | | 4,882 | | | | 0 | | | | 0 | |
To MFS Strategic Income Portfolio | | | 2,400 | | | | 2,400 | | | | 4,989 | | | | 4,882 | | | | 0 | | | | 0 | |
To MFS Technology Portfolio | | | 2,400 | | | | 2,400 | | | | 4,989 | | | | 4,882 | | | | 0 | | | | 0 | |
To MFS U.S. Government Money Market Portfolio | | | 2,400 | | | | 2,400 | | | | 4,989 | | | | 4,882 | | | | 0 | | | | 0 | |
Total fees billed by Deloitte To above Funds: | | | 40,800 | | | | 40,800 | | | | 84,813 | | | | 82,994 | | | | 0 | | | | 0 | |
| | | | | | | | | | | | | | | | | | | | | | | | |
| | | Audit-Related Fees1 | | | Tax Fees2 | | | All Other Fees3 | |
| | 2018 | | | 2017 | | | 2018 | | | 2017 | | | 2018 | | | 2017 | |
Fees billed by Deloitte: | | | | | | | | | | | | | | | | | | | | | | | | |
To MFS and MFS Related Entities of MFS Blended Research Core Equity Portfolio* | | | 0 | | | | 0 | | | | 0 | | | | 0 | | | | 5,390 | | | | 5,390 | |
To MFS and MFS Related Entities of MFS Core Equity Portfolio* | | | 0 | | | | 0 | | | | 0 | | | | 0 | | | | 5,390 | | | | 5,390 | |
To MFS and MFS Related Entities of MFS Corporate Bond Portfolio* | | | 0 | | | | 0 | | | | 0 | | | | 0 | | | | 5,390 | | | | 5,390 | |
To MFS and MFS Related Entities of MFS Emerging Markets Equity Portfolio* | | | 0 | | | | 0 | | | | 0 | | | | 0 | | | | 5,390 | | | | 5,390 | |
To MFS and MFS Related Entities of MFS Global Governments Portfolio* | | | 0 | | | | 0 | | | | 0 | | | | 0 | | | | 5,390 | | | | 5,390 | |
To MFS and MFS Related Entities of MFS Global Growth Portfolio* | | | 0 | | | | 0 | | | | 0 | | | | 0 | | | | 5,390 | | | | 5,390 | |
To MFS and MFS Related Entities of MFS Global Research Portfolio* | | | 0 | | | | 0 | | | | 0 | | | | 0 | | | | 5,390 | | | | 5,390 | |
To MFS and MFS Related Entities of MFS Global Tactical Allocation Portfolio* | | | 0 | | | | 0 | | | | 0 | | | | 0 | | | | 5,390 | | | | 5,390 | |
To MFS and MFS Related Entities of MFS Government Securities Portfolio* | | | 0 | | | | 0 | | | | 0 | | | | 0 | | | | 5,390 | | | | 5,390 | |
To MFS and MFS Related Entities of MFS High Yield Portfolio* | | | 0 | | | | 0 | | | | 0 | | | | 0 | | | | 5,390 | | | | 5,390 | |
To MFS and MFS Related Entities of MFS International Growth Portfolio* | | | 0 | | | | 0 | | | | 0 | | | | 0 | | | | 5,390 | | | | 5,390 | |
To MFS and MFS Related Entities of MFS International Value Portfolio* | | | 0 | | | | 0 | | | | 0 | | | | 0 | | | | 5,390 | | | | 5,390 | |
To MFS and MFS Related Entities of MFS Massachusetts Investors Growth Stock Portfolio* | | | 0 | | | | 0 | | | | 0 | | | | 0 | | | | 5,390 | | | | 5,390 | |
To MFS and MFS Related Entities of MFS Research International Portfolio* | | | 0 | | | | 0 | | | | 0 | | | | 0 | | | | 5,390 | | | | 5,390 | |
To MFS and MFS Related Entities of MFS Strategic Income Portfolio* | | | 0 | | | | 0 | | | | 0 | | | | 0 | | | | 5,390 | | | | 5,390 | |
To MFS and MFS Related Entities of MFS Technology Portfolio* | | | 0 | | | | 0 | | | | 0 | | | | 0 | | | | 5,390 | | | | 5,390 | |
To MFS and MFS Related Entities of MFS U.S. Government Money Market Portfolio * | | | 0 | | | | 0 | | | | 0 | | | | 0 | | | | 5,390 | | | | 5,390 | |
| | | | | | | | |
| | | Aggregate fees for non-audit services: | |
| | 2018 | | | 2017 | |
Fees billed by Deloitte: | | | | | | | | |
To MFS Blended Research Core Equity Portfolio, MFS and MFS Related Entities# | | | 12,779 | | | | 811,908 | |
To MFS Core Equity Portfolio, MFS and MFS Related Entities# | | | 12,779 | | | | 811,908 | |
To MFS Corporate Bond Portfolio, MFS and MFS Related Entities# | | | 12,779 | | | | 811,908 | |
To MFS Emerging Markets Equity Portfolio, MFS and MFS Related Entities# | | | 12,779 | | | | 811,908 | |
To MFS Global Governments Portfolio, MFS and MFS Related Entities# | | | 12,779 | | | | 811,908 | |
To MFS Global Growth Portfolio MFS and MFS Related Entities# | | | 12,779 | | | | 811,908 | |
To MFS Global Research Portfolio, MFS and MFS Related Entities# | | | 12,779 | | | | 811,908 | |
To MFS Global Tactical Allocation Portfolio, MFS and MFS Related Entities# | | | 12,779 | | | | 811,908 | |
To MFS Government Securities Portfolio, MFS and MFS Related Entities# | | | 12,779 | | | | 811,908 | |
To MFS High Yield Portfolio, MFS and MFS Related Entities# | | | 12,779 | | | | 811,908 | |
To MFS International Growth Portfolio, MFS and MFS Related Entities# | | | 12,779 | | | | 811,908 | |
To MFS International Value Portfolio, MFS and MFS Related Entities# | | | 12,779 | | | | 811,908 | |
To MFS Massachusetts Investors Growth Stock Portfolio, MFS and MFS Related Entities# | | | 12,779 | | | | 811,908 | |
To MFS Research International Portfolio, MFS and MFS Related Entities# | | | 12,779 | | | | 811,908 | |
To MFS Strategic Income Portfolio, MFS and MFS Related Entities# | | | 12,779 | | | | 811,908 | |
To MFS Technology Portfolio, MFS and MFS Related Entities# | | | 12,779 | | | | 811,908 | |
To MFS U.S. Government Money Market Portfolio, MFS and MFS Related Entities# | | | 12,779 | | | | 811,908 | |
| * | This amount reflects the fees billed to MFS and MFS Related Entities fornon-audit services relating directly to the operations and financial reporting of the Fund (portions of which services also related to the operations and financial reporting of other funds within the MFS Funds complex). |
| # | This amount reflects the aggregate fees billed by Deloitte fornon-audit services rendered to the Fund and fornon-audit services rendered to MFS and the MFS Related Entities. |
| 1 | The fees included under “Audit-Related Fees” are fees related to assurance and related services that are reasonably related to the performance of the audit or review of financial statements, but not reported under “Audit Fees,” including accounting consultations, agreed-upon procedure reports, attestation reports, comfort letters and internal control reviews. |
| 2 | The fees included under “Tax Fees” are fees associated with tax compliance, tax advice and tax planning, including services relating to the filing or amendment of federal, state or local income tax returns, regulated investment company qualification reviews and tax distribution and analysis. |
| 3 | The fees included under “All Other Fees” are fees for products and services provided by Deloitte other than those reported under “Audit Fees,” “Audit-Related Fees” and “Tax Fees”. |
Item 4(e)(1):
Set forth below are the policies and procedures established by the Audit Committee of the Board of Trustees relating to thepre-approval of audit andnon-audit related services:
To the extent required by applicable law,pre-approval by the Audit Committee of the Board is needed for all audit and permissiblenon-audit services rendered to the Fund and all permissiblenon-audit services rendered to MFS or MFS Related Entities if the services relate directly to the operations and financial reporting of the Registrant.Pre-approval is currently on anengagement-by-engagement basis. In the eventpre-approval of such services is necessary between regular meetings of the Audit Committee and it is not practical to wait to seekpre-approval at the next regular meeting of the Audit Committee,pre-approval of such services may be referred to the Chair of the Audit Committee for approval; provided that the Chair may notpre-approve any individual engagement for such services exceeding $50,000 or multiple engagements for such services in the aggregate exceeding $100,000 between such regular meetings of the Audit Committee. Any engagementpre-approved by the Chair between regular meetings of the Audit Committee shall be presented for ratification by the entire Audit Committee at its next regularly scheduled meeting.
Item 4(e)(2):
None, or 0%, of the services relating to the Audit-Related Fees, Tax Fees and All Other Fees paid by the Fund and MFS and MFS Related Entities relating directly to the operations and financial reporting of the Registrant disclosed above were approved by the audit committee pursuant to paragraphs (c)(7)(i)(C) of Rule2-01 of RegulationS-X (which permits audit committee approval after the start of the engagement with respect to services other than audit, review or attest services, if certain conditions are satisfied).
Item 4(f):
Not applicable.
Item 4(h):
The Registrant’s Audit Committee has considered whether the provision by a Registrant’s independent registered public accounting firm ofnon-audit services to MFS and MFS Related Entities that were notpre-approved by the Committee (because such services were provided prior to the effectiveness of SEC rules requiringpre-approval or because such services did not relate directly to the operations and financial reporting of the Registrant) was compatible with maintaining the independence of the independent registered public accounting firm as the Registrant’s principal auditors.
| ITEM 5. | AUDIT COMMITTEE OF LISTED REGISTRANTS. |
Not applicable to the Registrant.
| ITEM 6. | SCHEDULE OF INVESTMENTS |
A schedule of investments of each series of the Registrant is included as part of the report to shareholders of such series under Item 1 of this FormN-CSR.
| ITEM 7. | DISCLOSURE OF PROXY VOTING POLICIES AND PROCEDURES FORCLOSED-END MANAGEMENT INVESTMENT COMPANIES. |
Not applicable to the Registrant.
| ITEM 8. | PORTFOLIO MANAGERS OFCLOSED-END MANAGEMENT INVESTMENT COMPANIES. |
Not applicable to the Registrant.
| ITEM 9. | PURCHASES OF EQUITY SECURITIES BYCLOSED-END MANAGEMENT INVESTMENT COMPANY AND AFFILIATED PURCHASERS. |
Not applicable to the Registrant.
| ITEM 10. | SUBMISSION OF MATTERS TO A VOTE OF SECURITY HOLDERS. |
There were no material changes to the procedures by which shareholders may send recommendations to the Board for nominees to the Registrant’s Board since the Registrant last provided disclosure as to such procedures in response to the requirements of Item 407 (c)(2)(iv) of RegulationS-K or this Item.
| ITEM 11. | CONTROLS AND PROCEDURES. |
| (a) | Based upon their evaluation of the effectiveness of the registrant’s disclosure controls and procedures (as defined in Rule30a-3(c) under the Investment Company Act of 1940 (the “Act”)) as conducted within 90 days of the filing date of this report on FormN-CSR, the registrant’s principal financial officer and principal executive officer have concluded that those disclosure controls and procedures provide reasonable assurance that the material information required to be disclosed by the registrant on this report is recorded, processed, summarized and reported within the time periods specified in the Securities and Exchange Commission’s rules and forms. |
| (b) | There were no changes in the registrant’s internal controls over financial reporting (as defined in Rule30a-3(d) under the Act) that occurred during the second fiscal quarter of the period covered by the report that have materially affected, or are reasonably likely to materially affect, the registrant’s internal control over financial reporting. |
| ITEM 12. | DISCLOSURE OF SECURITIES LENDING ACTIVITIES FORCLOSED-END MANAGEMENT INVESTMENT COMPANIES. |
Not applicable to the Registrant.
| (a) (1) | Any code of ethics, or amendment thereto, that is the subject of the disclosure required by Item 2, to the extent that the registrant intends to satisfy the Item 2 requirements through filing of an exhibit: Attached hereto asEX-99.COE. |
| | (2) | A separate certification for each principal executive officer and principal financial officer of the registrant as required by Rule30a-2(a) under the Act (17 CFR270.30a-2): Attached hereto asEX-99.302CERT. |
| | (3) | Any written solicitation to purchase securities under Rule23c-1 under the Act (17 CFR270.23c-1) sent or given during the period covered by the report by or on behalf of the registrant to 10 or more persons. Not applicable. |
| | (4) | Change in the registrant’s independent public accountant. Not applicable. |
| (b) | If the report is filed under Section 13(a) or 15(d) of the Exchange Act, provide the certifications required by Rule30a-2(b) under the Act (17 CFR270.30a-2(b)), Rule13a-14(b) or Rule15d-14(b) under the Exchange Act (17 CFR240.13a-14(b) or240.15d-14(b)) and Section 1350 of Chapter 63 of Title 18 of the United States Code (18 U.S.C. 1350) as an exhibit. A certification furnished pursuant to this paragraph will not be deemed “filed” for the purposes of Section 18 of the Exchange Act (15 U.S.C. 78r), or otherwise subject to the liability of that section. Such certification will not be deemed to be incorporated by reference into any filing under the Securities Act of 1933 or the Exchange Act, except to the extent that the registrant specifically incorporates it by reference. Attached hereto asEX-99.906CERT. |
Notice
A copy of the Amended and Restated Declaration of Trust, as amended, of the Registrant is on file with the Secretary of State of The Commonwealth of Massachusetts and notice is hereby given that this instrument is executed on behalf of the Registrant by an officer of the Registrant as an officer and not individually and the obligations of or arising out of this instrument are not binding upon any of the Trustees or shareholders individually, but are binding only upon the assets and property of the respective constituent series of the Registrant.
SIGNATURES
Pursuant to the requirements of the Securities Exchange Act of 1934 and the Investment Company Act of 1940, the registrant has duly caused this report to be signed on its behalf by the undersigned, thereunto duly authorized.
(Registrant) MFS VARIABLE INSURANCE TRUST II
| | |
| By (Signature and Title)* | | DAVID L. DILORENZO |
| | David L. DiLorenzo, President |
Date: February 15, 2019
Pursuant to the requirements of the Securities Exchange Act of 1934 and the Investment Company Act of 1940, this report has been signed below by the following persons on behalf of the registrant and in the capacities and on the dates indicated.
| | |
| By (Signature and Title)* | | DAVID L. DILORENZO |
| | David L. DiLorenzo, President (Principal Executive Officer) |
Date: February 15, 2019
| | |
| By (Signature and Title)* | | JAMES O. YOST |
| | James O. Yost, Treasurer (Principal Financial Officer and Accounting Officer) |
Date: February 15, 2019
| * | Print name and title of each signing officer under his or her signature. |